unclassified nea/csni/r(2013)4 - oecd
TRANSCRIPT
Unclassified NEA/CSNI/R(2013)4 Organisation de Coopération et de Développement Économiques Organisation for Economic Co-operation and Development 03-Jul-2013 ________________________________________________________________________________________________________ English text only NUCLEAR ENERGY AGENCY COMMITTEE ON THE SAFETY OF NUCLEAR INSTALLATIONS
ICDE Project Report: Collection and Analysis of Common-Cause Failures of Control Rod Drive Assemblies
JT03342693
Complete document available on OLIS in its original format This document and any map included herein are without prejudice to the status of or sovereignty over any territory, to the delimitation of international frontiers and boundaries and to the name of any territory, city or area.
NE
A/C
SNI/R
(2013)4 U
nclassified
English text o
NEA/CSNI/R(2013)4
2
ORGANISATION FOR ECONOMIC CO-OPERATION AND DEVELOPMENT
The OECD is a unique forum where the governments of 34 democracies work together to address the economic, social and environmental challenges of globalisation. The OECD is also at the forefront of efforts to understand and to help governments respond to new developments and concerns, such as corporate governance, the information economy and the challenges of an ageing population. The Organisation provides a setting where governments can compare policy experiences, seek answers to common problems, identify good practice and work to co-ordinate domestic and international policies.
The OECD member countries are: Australia, Austria, Belgium, Canada, Chile, the Czech Republic, Denmark, Estonia, Finland, France, Germany, Greece, Hungary, Iceland, Ireland, Israel, Italy, Japan, Luxembourg, Mexico, the Netherlands, New Zealand, Norway, Poland, Portugal, the Republic of Korea, the Slovak Republic, Slovenia, Spain, Sweden, Switzerland, Turkey, the United Kingdom and the United States. The European Commission takes part in the work of the OECD.
OECD Publishing disseminates widely the results of the Organisation’s statistics gathering and research on economic, social and environmental issues, as well as the conventions, guidelines and standards agreed by its members.
This work is published on the responsibility of the OECD Secretary-General. The opinions expressed and arguments employed herein do not necessarily reflect the official
views of the Organisation or of the governments of its member countries.
NUCLEAR ENERGY AGENCY
The OECD Nuclear Energy Agency (NEA) was established on 1 February 1958. Current NEA membership consists of 31 countries: Australia, Austria, Belgium, Canada, the Czech Republic, Denmark, Finland, France, Germany, Greece, Hungary, Iceland, Ireland, Italy, Japan, Luxembourg, Mexico, the Netherlands, Norway, Poland, Portugal, the Republic of Korea, the Russian Federation, the Slovak Republic, Slovenia, Spain, Sweden, Switzerland, Turkey, the United Kingdom and the United States. The European Commission also takes part in the work of the Agency.
The mission of the NEA is:
– to assist its member countries in maintaining and further developing, through international co-operation, the scientific, technological and legal bases required for a safe, environmentally friendly and economical use of nuclear energy for peaceful purposes, as well as
– to provide authoritative assessments and to forge common understandings on key issues, as input to government decisions on nuclear energy policy and to broader OECD policy analyses in areas such as energy and sustainable development.
Specific areas of competence of the NEA include the safety and regulation of nuclear activities, radioactive waste management, radiological protection, nuclear science, economic and technical analyses of the nuclear fuel cycle, nuclear law and liability, and public information.
The NEA Data Bank provides nuclear data and computer program services for participating countries. In these and related tasks, the NEA works in close collaboration with the International Atomic Energy Agency in Vienna, with which it has a Co-operation Agreement, as well as with other international organisations in the nuclear field.
This document and any map included herein are without prejudice to the status of or sovereignty over any territory, to the delimitation of international frontiers and boundaries and to the name of any territory, city or area.
Corrigenda to OECD publications may be found online at: www.oecd.org/publishing/corrigenda. © OECD 2013
You can copy, download or print OECD content for your own use, and you can include excerpts from OECD publications, databases and multimedia products in your own documents, presentations, blogs, websites and teaching materials, provided that suitable acknowledgment of the OECD as source and copyright owner is given. All requests for public or commercial use and translation rights should be submitted to [email protected]. Requests for permission to photocopy portions of this material for public or commercial use shall be addressed directly to the Copyright Clearance Center (CCC) at [email protected] or the Centre français d'exploitation du droit de copie (CFC) [email protected].
NEA/CSNI/R(2013)4
3
COMMITTEE ON THE SAFETY OF NUCLEAR INSTALLATIONS
Within the OECD framework, the NEA Committee on the Safety of Nuclear Installations (CSNI) is an international committee made of senior scientists and engineers, with broad responsibilities for safety technology and research programmes, as well as representatives from regulatory authorities. It was set up in 1973 to develop and co-ordinate the activities of the NEA concerning the technical aspects of the design, construction and operation of nuclear installations insofar as they affect the safety of such installations.
The committee’s purpose is to foster international co-operation in nuclear safety amongst the NEA member countries. The CSNI’s main tasks are to exchange technical information and to promote collaboration between research, development, engineering and regulatory organisations; to review operating experience and the state of knowledge on selected topics of nuclear safety technology and safety assessment; to initiate and conduct programmes to overcome discrepancies, develop improvements and research consensus on technical issues; and to promote the co-ordination of work that serves to maintain competence in nuclear safety matters, including the establishment of joint undertakings.
The clear priority of the committee is on the safety of nuclear installations and the design and construction of new reactors and installations. For advanced reactor designs the committee provides a forum for improving safety related knowledge and a vehicle for joint research.
In implementing its programme, the CSNI establishes co-operate mechanisms with the NEA’s Committee on Nuclear Regulatory Activities (CNRA) which is responsible for the programme of the Agency concerning the regulation, licensing and inspection of nuclear installations with regard to safety. It also co-operates with the other NEA’s Standing Committees as well as with key international organisations (e.g., the IAEA) on matters of common interest.

NEA/CSNI/R(2013)4
4
NEA/CSNI/R(2013)4
5
PREFACE
Common-cause failure (CCF) events can significantly impact the availability of safety systems of nuclear power plants. For this reason, the International Common-Cause Failure Data Exchange (ICDE) Project was initiated by several countries in 1994. In 1997, CSNI formally approved the carrying out of this project within the OECD NEA framework; since then the project has successfully operated over five consecutive terms (the current term being 2011-2014).
The purpose of the ICDE Project is to allow multiple countries to collaborate and exchange common-cause failure (CCF) data to enhance the quality of risk analyses that include CCF modelling. Because CCF events are typically rare events, most countries do not experience enough CCF events to perform meaningful analyses. Data combined from several countries, however, yields sufficient data for more rigorous analyses.
The objectives of the ICDE Project are to:
1) Collect and analyse Common-Cause Failure (CCF) events over the long term so as to better understand such events, their causes, and their prevention;
2) Generate qualitative insights into the root causes of CCF events which can then be used to derive approaches or mechanisms for their prevention or for mitigating their consequences;
3) Establish a mechanism for the efficient feedback of experience gained in connection with CCF phenomena, including the development of defenses against their occurrence, such as indicators for risk based inspections;
4) Generate quantitative insights and record event attributes to facilitate quantification of CCF frequencies in member countries; and
5) Use the ICDE data to estimate CCF parameters.
The qualitative insights gained from the analysis of CCF events are made available by reports that are distributed without restrictions. It is not the aim of those reports to provide direct access to the CCF raw data recorded in the ICDE database. The confidentiality of the data is a prerequisite of operating the project. The ICDE database is accessible only to those members of the ICDE Project Working Group who have actually contributed data to the databank.
Database requirements are specified by the members of the ICDE Project working group and are fixed in guidelines. Each member with access to the ICDE database is free to use the collected data. It is assumed that the data will be used by the members in the context of PSA/PRA reviews and application.
The ICDE project has produced the following reports, which can be accessed through the OECD/NEA web site:
NEA/CSNI/R(2013)4
6
• Collection and analysis of common-cause failure of centrifugal pumps [NEA/CSNI/R(99)2], September 1999.
• Collection and analysis of common-cause failure of emergency diesel generators [NEA/CSNI/R(2000)20], May 2000.
• Collection and analysis of common-cause failure of motor-operated valves [NEA/CSNI/R(2001)10], February 2001.
• Collection and analysis of common-cause failure of safety valves and relief valves [NEA/CSNI/R(2002)19]. Published October 2002.
• Collection and analysis of common-cause failure of check valves [NEA/CSNI/R(2003)15], February 2003.
• Collection and analysis of common-cause failure of batteries [NEA/CSNI/R(2003)19], September 2003.
• ICDE General Coding Guidelines [NEA/CSNI/R(2004)4], January 2004.
• Proceedings of ICDE Workshop on the qualitative and quantitative use of ICDE Data [NEA/CSNI/R(2001)8, November 2002.
• Collection and analysis of common-cause failure of switching devices and circuit breakers [NEA/CSNI/R(2008)01], October 2007.
• Collection and analysis of common-cause failure of level measurement components [NEA/CSNI/R(2008)8, July 2008.

NEA/CSNI/R(2013)4
7
ACKNOWLEDGMENTS
The following people have significantly contributed to the preparation of this report by their personal effort: Francois Ducamp (IRSN), Dale Rasmuson (USNRC), Thomas Wierman (INL), Wolfgang Werner (SAC), and Jeffery Wood (USNRC).
In addition, the ICDE Working Group and the people with whom they liaise in all participating countries are recognized as important contributors to the success of this study. Axel Breest has been the administrative NEA officer and contributed to finalising the report.

NEA/CSNI/R(2013)4
8
NEA/CSNI/R(2013)4
9
TABLE OF CONTENTS
PREFACE ................................................................................................................................................... 5
ACKNOWLEDGMENTS .......................................................................................................................... 7
EXECUTIVE SUMMARY ...................................................................................................................... 13
ACRONYMS ............................................................................................................................................. 15
1 INTRODUCTION ....................................................................................................................... 21
2 COMPONENT DESCRIPTION ................................................................................................ 23
2.1 Overview of the CRDA Component ................................................................................ 23 2.2 Component Boundaries .................................................................................................... 24 2.3 Event Boundary ................................................................................................................ 25
3 OVERVIEW OF DATABASE CONTENT............................................................................... 27
3.1 Overview .......................................................................................................................... 27 3.2 Failure Modes ................................................................................................................... 27 3.3 Root Causes ...................................................................................................................... 29 3.4 Coupling Factors .............................................................................................................. 30 3.5 Detection Method ............................................................................................................. 33 3.6 Corrective Actions ............................................................................................................ 35 3.7 Timing Factor ................................................................................................................... 36 3.8 Shared Cause Factor ......................................................................................................... 36 3.9 CRDA Insertion Systems Analysis ................................................................................... 37 3.10 Component Types ............................................................................................................. 38 3.11 Observed Population......................................................................................................... 39 3.12 Exposed Components ....................................................................................................... 40 3.13 Affected Components ....................................................................................................... 42 3.14 Additional Insights from the Data .................................................................................... 47
4 ENGINEERING ASPECTS OF THE COLLECTED EVENTS ............................................ 49
4.1 Assessment Basis .............................................................................................................. 49 4.2 Failure Symptoms ............................................................................................................. 49 4.3 Failure Cause Categories .................................................................................................. 49 4.4 Assessment Matrix ........................................................................................................... 50 4.5 Evaluation ......................................................................................................................... 50
4.5.1 Failure Cause Categories ...................................................................................... 51 4.5.2 Failure Symptom Categories ................................................................................ 51 4.5.3 Human Error Involvement .................................................................................... 51 4.5.4 Technical Fault Aspects ........................................................................................ 52 4.5.5 Complete CCFs..................................................................................................... 52
5 SUMMARY AND CONCLUSIONS .......................................................................................... 55
NEA/CSNI/R(2013)4
10
6 REFERENCES ............................................................................................................................ 57
APPENDIX A – OVERVIEW OF THE ICDE PROJECT ................................................................... 59
A.1 Background ....................................................................................................................... 59 A.2 Scope of the ICDE Project................................................................................................ 59 A.3 Data Collection Status ...................................................................................................... 59 A.4 ICDE Coding Format and Coding Guidelines .................................................................. 60 A.5 Protection of Proprietary Rights ....................................................................................... 60
APPENDIX B – DEFINITION OF COMMON-CAUSE EVENTS ..................................................... 61
APPENDIX C – SUMMARY OF CONTROL ROD DRIVE ASSEMBLY CODING GUIDELINES63
C.1 Coding Rules and Exceptions for Control Rod Drive Assemblies ................................... 63 C.2 Functional Failure Modes ................................................................................................. 63
C.2.1 Gravity Insertion Systems (PWR, Magnox and AGR) ........................................ 63 C.2.2 Non-Gravity Insertion Systems (BWR) ............................................................... 64
NEA/CSNI/R(2013)4
11
FIGURES
Figure 1 Component boundaries ................................................................................................................. 24 Figure 2 Distribution of CRDA event failure modes .................................................................................. 28 Figure 3 Distribution of CRDA event root causes ...................................................................................... 30 Figure 4 Distribution of CRDA event coupling factors .............................................................................. 33 Figure 5 Distribution of CRDA event detection methods .......................................................................... 34 Figure 6 Distribution of CRDA event corrective actions ........................................................................... 36 Figure 7 Insertion system categories and reactor types .............................................................................. 38 Figure 8 Distribution of observed population size...................................................................................... 40 Figure 9 Distribution of exposed population size ....................................................................................... 42 Figure 10 Distribution of the number of affected components in the observed population ....................... 44 Figure 11 Distribution of the number of events versus the percentage of affected CRDAs in the observed
populations of CRDAs .............................................................................................................. 45 Figure 12 Distribution of the number of events versus the number of complete failures of CRDAs with
failure modes which inhibit directly the scram function .......................................................... 46
TABLES
Table 1 CRDA events by reactor type ........................................................................................................ 27 Table 2 CRDA events failure modes .......................................................................................................... 28 Table 3 Distribution of CRDA root causes ................................................................................................. 30 Table 4 Distribution of CRDA event coupling factors ............................................................................... 32 Table 5 Distribution of CRDA event detection methods ............................................................................ 34 Table 6 Distribution of CRDA event corrective actions ............................................................................. 35 Table 7 Distribution of CRDA event timing factors ................................................................................... 36 Table 8 Distribution of CRDA event shared cause factor .......................................................................... 37 Table 9 Subsystem distribution for CRDA events...................................................................................... 38 Table 10 Distribution of component types for CRDA events .................................................................... 39 Table 11 Distribution of observed population size for CRDA events ........................................................ 39 Table 12 Distribution of exposed population size for CRDA events ......................................................... 41 Table 13 Distribution of the affected components in the CRDA events .................................................... 43 Table 14 Distribution of events versus the number of complete failures of CRDAs in an event ............... 46 Table 15 Root cause by coupling factor ..................................................................................................... 47 Table 16 Root Cause by failure mode ........................................................................................................ 48 Table 17 Failure mode by coupling factor .................................................................................................. 48 Table 18 CRDA Assessment Matrix .......................................................................................................... 50 Table 19 Failure cause categories by Corrective actions ............................................................................ 52

NEA/CSNI/R(2013)4
12
NEA/CSNI/R(2013)4
13
EXECUTIVE SUMMARY
This report documents a study performed on a set of common-cause failure (CCF) events of Control Rod Drive Assemblies (CRDA). The events were derived from the International CCF Data Exchange (ICDE) database. The ICDE database contains 169 events.
These events were examined by tabulating the data and observing trends. Once trends were identified, individual events were reviewed for insights.
The data span a period from 1980 through 2003. The data are not necessarily complete for each country through this period. This information includes root cause, coupling factor, observed population (OP) size, corrective action, the degree of failure, affected subsystem, and detection method.
This study begins with an overview of the entire data set (Section 3). Charts and tables are provided exhibiting the event count for each of these event parameters. This section forms the basis for the CRDA study.
Section 4 contains some engineering aspects of the collected events. This section presents a qualitative assessment of the collected data; events are analysed with respect to failure symptoms and failure cause categories through use of an assessment matrix.
Section 5 presents a summary and conclusions.
The overall set of the ICDE CRDA events provided a baseline set of parameters, which were then grouped based on various event characteristics. The similarities and differences between these groupings provide insights.
The most susceptible failure mode for control rod drive assemblies is ‘Failure to completely Insert - Gravity Insertion System’.
The most likely root cause is ‘state of other component’ (44 percent). This is consistent with CRDA architecture which implies a high interaction between control rods and fuel assemblies. Fuel assemblies can be deformed by irradiation, thermal, mechanical and hydraulic loading and jam control rods. Another important root cause is ‘design, manufacture or construction inadequacy’; it accounts for 25 percent of CCF events.
The dominant corrective action is ‘design modifications’ (58 percent). The major parts of the components which are modified are fuel assemblies, axial seals of drive shaft and anti-rotation screws.

NEA/CSNI/R(2013)4
14
NEA/CSNI/R(2013)4
15
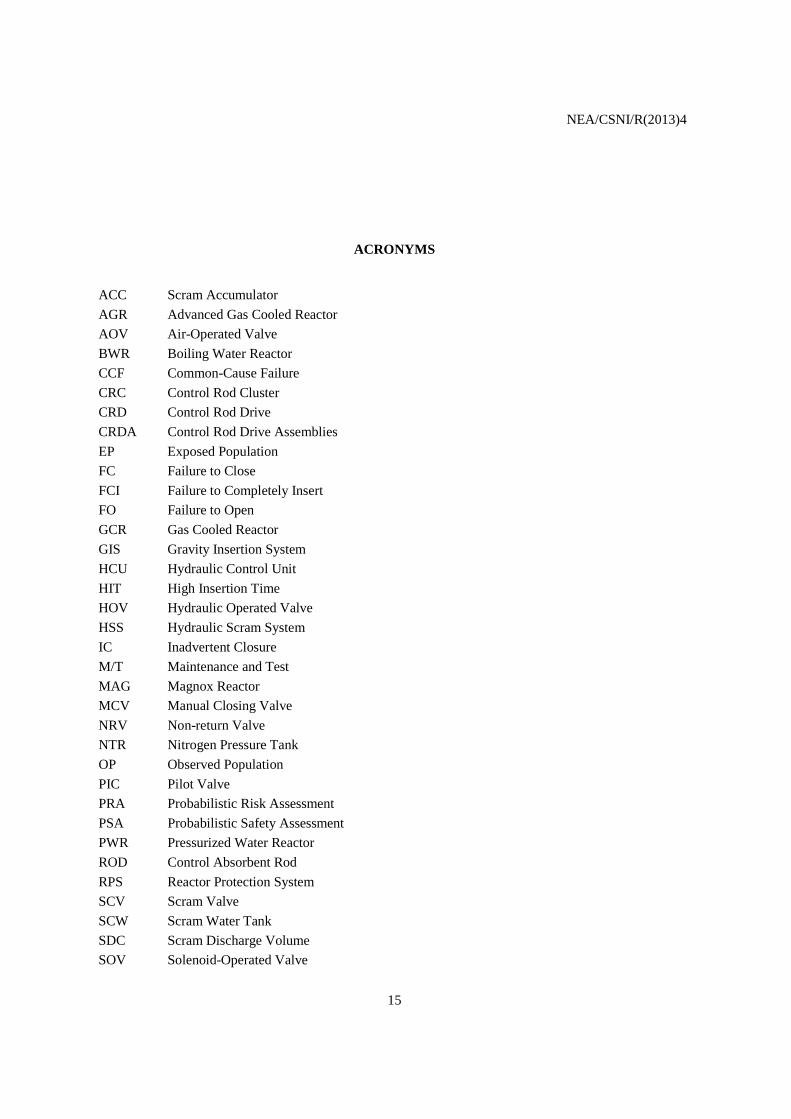
ACRONYMS
ACC Scram Accumulator
AGR Advanced Gas Cooled Reactor
AOV Air-Operated Valve
BWR Boiling Water Reactor
CCF Common-Cause Failure
CRC Control Rod Cluster
CRD Control Rod Drive
CRDA Control Rod Drive Assemblies
EP Exposed Population
FC Failure to Close
FCI Failure to Completely Insert
FO Failure to Open
GCR Gas Cooled Reactor
GIS Gravity Insertion System
HCU Hydraulic Control Unit
HIT High Insertion Time
HOV Hydraulic Operated Valve
HSS Hydraulic Scram System
IC Inadvertent Closure
M/T Maintenance and Test
MAG Magnox Reactor
MCV Manual Closing Valve
NRV Non-return Valve
NTR Nitrogen Pressure Tank
OP Observed Population
PIC
PRA
Pilot Valve
Probabilistic Risk Assessment
PSA Probabilistic Safety Assessment
PWR Pressurized Water Reactor
ROD Control Absorbent Rod
RPS Reactor Protection System
SCV Scram Valve
SCW Scram Water Tank
SDC Scram Discharge Volume
SOV Solenoid-Operated Valve

NEA/CSNI/R(2013)4
16

NEA/CSNI/R(2013)4
17
ORGANISATIONS
AECB Atomic Energy Control Board (Canada)
CNSC Canadian Nuclear Safety Commission (Canada)
CSN Consejo de Seguridad Nuclear (Spain)
CSNI Committee on the Safety of Nuclear Installations
GRS Gesellschaft für Anlagen- und Reaktorsicherheit (Germany)
ENSI Eidgenössisches Nuklearsicherheitsinspektorat / Swiss Federal Nuclear Safety Inspectorate (Switzerland)
IRSN Institut de Radioprotection et de Sûreté Nucléaire (France)
JNES Japan Nuclear Energy Safety Organisation (Japan)
KAERI Korea Atomic Energy Research Institute (Republic of Korea)
NEA Nuclear Energy Agency
NRC Nuclear Regulatory Commission (USA)
OECD Organisation for Economic Co-operation and Development
ONR Office for Nuclear Regulation (UK)
SKI Sweden Nuclear Inspectorate (Sweden), see SSM
SSM Swedish Radiation Safety Authority
STUK Finnish Centre for Radiation and Nuclear Safety (Finland)

NEA/CSNI/R(2013)4
18
NEA/CSNI/R(2013)4
19
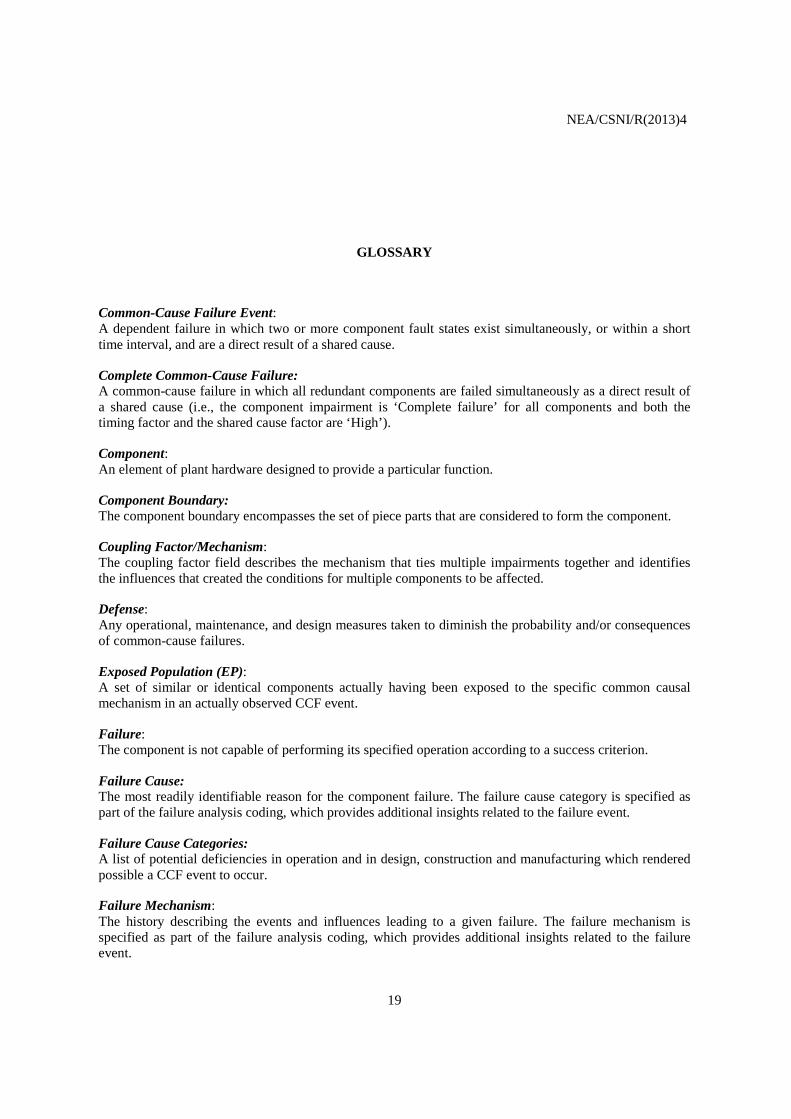
GLOSSARY
Common-Cause Failure Event: A dependent failure in which two or more component fault states exist simultaneously, or within a short time interval, and are a direct result of a shared cause.
Complete Common-Cause Failure: A common-cause failure in which all redundant components are failed simultaneously as a direct result of a shared cause (i.e., the component impairment is ‘Complete failure’ for all components and both the timing factor and the shared cause factor are ‘High’).
Component: An element of plant hardware designed to provide a particular function.
Component Boundary: The component boundary encompasses the set of piece parts that are considered to form the component.
Coupling Factor/Mechanism: The coupling factor field describes the mechanism that ties multiple impairments together and identifies the influences that created the conditions for multiple components to be affected.
Defense: Any operational, maintenance, and design measures taken to diminish the probability and/or consequences of common-cause failures.
Exposed Population (EP): A set of similar or identical components actually having been exposed to the specific common causal mechanism in an actually observed CCF event.
Failure: The component is not capable of performing its specified operation according to a success criterion.
Failure Cause: The most readily identifiable reason for the component failure. The failure cause category is specified as part of the failure analysis coding, which provides additional insights related to the failure event.
Failure Cause Categories: A list of potential deficiencies in operation and in design, construction and manufacturing which rendered possible a CCF event to occur.
Failure Mechanism: The history describing the events and influences leading to a given failure. The failure mechanism is specified as part of the failure analysis coding, which provides additional insights related to the failure event.
NEA/CSNI/R(2013)4
20
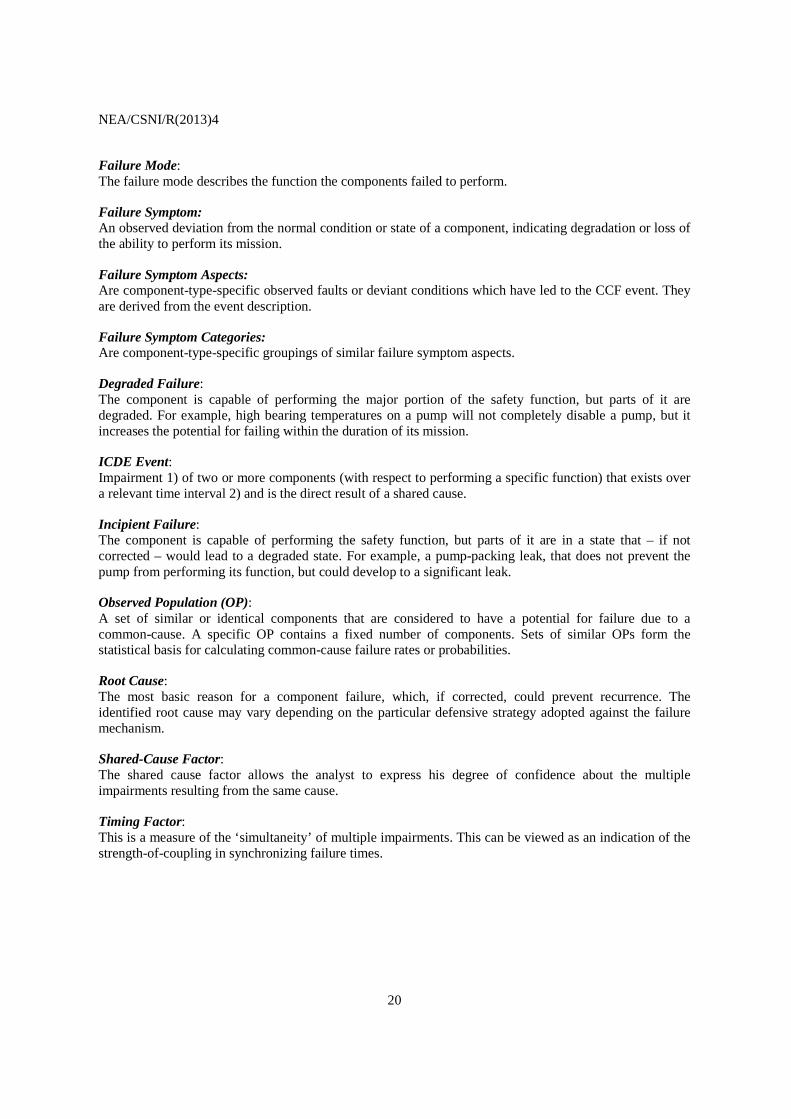
Failure Mode: The failure mode describes the function the components failed to perform.
Failure Symptom: An observed deviation from the normal condition or state of a component, indicating degradation or loss of the ability to perform its mission.
Failure Symptom Aspects: Are component-type-specific observed faults or deviant conditions which have led to the CCF event. They are derived from the event description.
Failure Symptom Categories: Are component-type-specific groupings of similar failure symptom aspects.
Degraded Failure: The component is capable of performing the major portion of the safety function, but parts of it are degraded. For example, high bearing temperatures on a pump will not completely disable a pump, but it increases the potential for failing within the duration of its mission.
ICDE Event: Impairment 1) of two or more components (with respect to performing a specific function) that exists over a relevant time interval 2) and is the direct result of a shared cause.
Incipient Failure: The component is capable of performing the safety function, but parts of it are in a state that – if not corrected – would lead to a degraded state. For example, a pump-packing leak, that does not prevent the pump from performing its function, but could develop to a significant leak.
Observed Population (OP): A set of similar or identical components that are considered to have a potential for failure due to a common-cause. A specific OP contains a fixed number of components. Sets of similar OPs form the statistical basis for calculating common-cause failure rates or probabilities.
Root Cause: The most basic reason for a component failure, which, if corrected, could prevent recurrence. The identified root cause may vary depending on the particular defensive strategy adopted against the failure mechanism.
Shared-Cause Factor: The shared cause factor allows the analyst to express his degree of confidence about the multiple impairments resulting from the same cause.
Timing Factor: This is a measure of the ‘simultaneity’ of multiple impairments. This can be viewed as an indication of the strength-of-coupling in synchronizing failure times.
NEA/CSNI/R(2013)4
21
1 INTRODUCTION
This report presents an overview of the exchange of CCF data of CRDAs among several countries. The objectives of this report are:
• To describe the data profile in the CRDA database;
• To develop qualitative insights in the nature of the reported events, expressed by root causes, coupling factors, and corrective actions; and
• To develop the failure mechanisms and phenomena involved in the events, their relationship to the root causes, and possibilities for improvement.
Section 2 presents a description of the control rod drive assembly. An overview of the contents of the CRDA database and summary statistics are presented in Section 3. Section 4 contains some high level engineering insights about the CRDA CCF events. These insights are based on cause symptoms and failure causes. Section 5 provides a summary and conclusions. References are found in Section 6.
The ICDE Project was organized to exchange CCF data among countries. A brief description of the project, its objectives, and the participating countries, is given in Appendix A. Appendix B presents the definition of common-cause failures and the ICDE event definitions. Appendix C provides a summary of the CRDA coding guidelines.

NEA/CSNI/R(2013)4
22
NEA/CSNI/R(2013)4
23
2 COMPONENT DESCRIPTION
2.1 Overview of the CRDA Component
The purpose of the CRDA is to control the core reactivity when the reactor is in normal operating conditions and during rapid transients, and to provide sufficient additional negative reactivity for emergency operating conditions. The consequences related to the failure of the CRDA system depends on the initiator, plant state before scram and the needed effectiveness of the control rod population which is expressed by the minimal number of control rod clusters required at the position in the core cross section where the control rod clusters failed to insert.
Generally, for PWR, control rods are cylindrical rods located inside control rod channels in various locations in the fuel element assembly, in place of fuel rods. A cluster of control rods fastened to a spider may have as few as five or as many as twenty absorbent rods. One control rod drive package is attached to each cluster of control rods. A typical BWR control rod is a cross-shaped blade with four sections. Each section consists of a stainless steel blade sheath that surrounds a row of absorber tubes. The cross-shaped control blade is inserted into the core in between four fuel assemblies. One control rod drive package is attached to each BWR control rod.
The control rod clusters enter the reactor pressure vessel through the top head or through the bottom head depending on the insertion type – gravitational insertion or hydraulic insertion:
• In the case of a gravitational insertion, the control rod clusters enter the reactor pressure vessel through the top head and drop into the core by gravity during a scram. The control rod drives are mechanical and can be positioned continuously or move in a series of discrete steps.
• In the case of a hydraulic insertion, the control rod clusters enter the reactor pressure vessel through the bottom head. The rods withdraw in the downward direction and so have a completely powered scram stroke against the force of gravity. The control rod drives are hydraulic or mechanical.
All the control rod clusters may be of the same type, or there may be two types with different types of absorbent rods:
• black control rod clusters consisting of only absorbent rods; and
• grey control rod clusters, less absorbent than the black rods since some of the absorbent control rods are replaced by stainless-steel rods.
In addition, there may be two different functional sets of control rod clusters:
• the shutdown set, made up of black control rod clusters only; and
• the control set, made up of both black and grey control rod clusters.
NEA/CSNI/R(2013)4
24
Basically, the shutdown set is used to scram the reactor whereas the control set allows the control of nuclear power in operational states.
2.2 Component Boundaries
The CRDA system studied consists of two parts: all the control rod clusters (CRCs, themselves constituted by control absorbent rods (RODs)) and their drive mechanisms (CRD).
• The local contactors and protective devices (e.g., overload protection) are counted as part of the CRDA.
• The control circuits after RPS end relays are considered as part of the CRDA.
• Clutch coil control is outside of the component boundary.
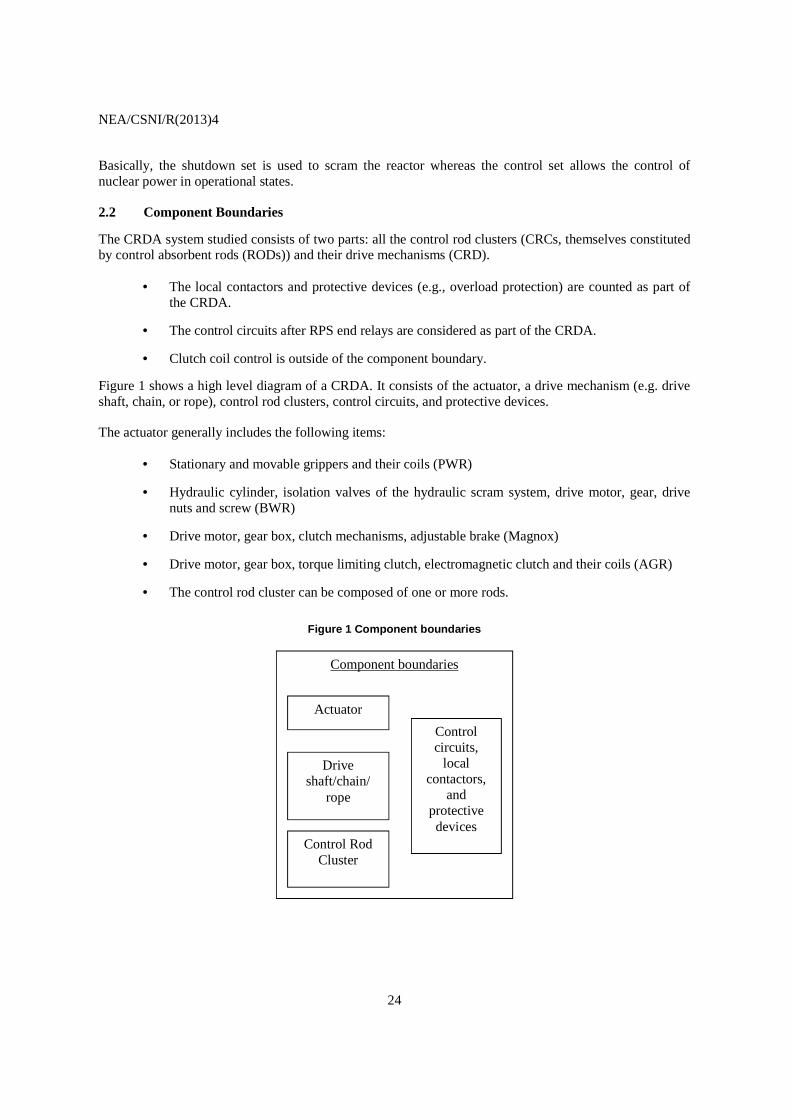
Figure 1 shows a high level diagram of a CRDA. It consists of the actuator, a drive mechanism (e.g. drive shaft, chain, or rope), control rod clusters, control circuits, and protective devices.
The actuator generally includes the following items:
• Stationary and movable grippers and their coils (PWR)
• Hydraulic cylinder, isolation valves of the hydraulic scram system, drive motor, gear, drive nuts and screw (BWR)
• Drive motor, gear box, clutch mechanisms, adjustable brake (Magnox)
• Drive motor, gear box, torque limiting clutch, electromagnetic clutch and their coils (AGR)
• The control rod cluster can be composed of one or more rods.
Figure 1 Component boundaries
Component boundaries
Actuator
Control Rod Cluster
Drive shaft/chain/
rope
Control circuits,
local contactors,
and protective devices
NEA/CSNI/R(2013)4
25
2.3 Event Boundary
The CRDA system has two separate and distinct missions: safety and operational missions.
The safety mission of the CRDA system is to insert a substantial quantity of absorbent material into the reactor core, by allowing it to drop under the effect of gravity (PWR, Magnox and AGR) or driving the rods into the reactor vessel under hydraulic pressure (BWR) when there is an automatic or manual reactor shutdown signal, in order to terminate the nuclear reaction and make the reactor sub-critical.
The operational mission of the CRDA system is to ensure an acceptable distribution of power in the reactor core during the operational state. This data collection effort is concentrated on the safety mission. Nevertheless, most of the CRDA components are involved in both safety and operational missions. The failures that affected the operational mission, but also could be related to failure mechanisms which can affect the safety mission, were collected.
Failure of the component CRDA to fulfil its safety mission involves non-insertion or delayed insertion of one control rod cluster into the reactor core.

NEA/CSNI/R(2013)4
26
NEA/CSNI/R(2013)4
27
3 OVERVIEW OF DATABASE CONTENT
3.1 Overview
The event data for the control rod drive assembly event collection includes the observed population of all CRDAs and the optionally covered components of the systems or system parts providing the hydraulic driving force in the BWRs. The number of control rods depends on the type of reactor and the design. It ranges from 48 to 205.
The period of data exchange covered a period from 5 months to 21 years. The recommended screening time window for the CCFs in reactor scram is the time cycle defined by the refuelling outages and/or overhaul outages.
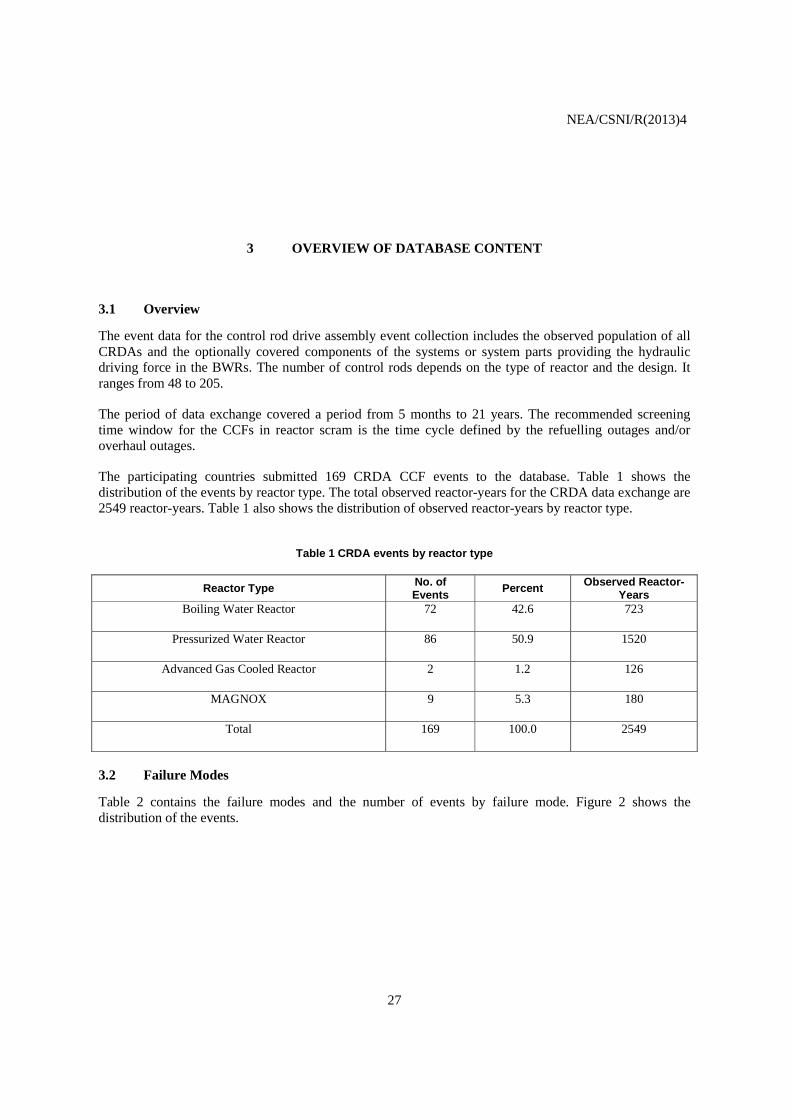
The participating countries submitted 169 CRDA CCF events to the database. Table 1 shows the distribution of the events by reactor type. The total observed reactor-years for the CRDA data exchange are 2549 reactor-years. Table 1 also shows the distribution of observed reactor-years by reactor type.
Table 1 CRDA events by reactor type
Reactor Type No. of Events
Percent Observed Reactor-Years
Boiling Water Reactor 72 42.6 723
Pressurized Water Reactor 86 50.9 1520
Advanced Gas Cooled Reactor 2 1.2 126
MAGNOX 9 5.3 180
Total 169 100.0 2549
3.2 Failure Modes
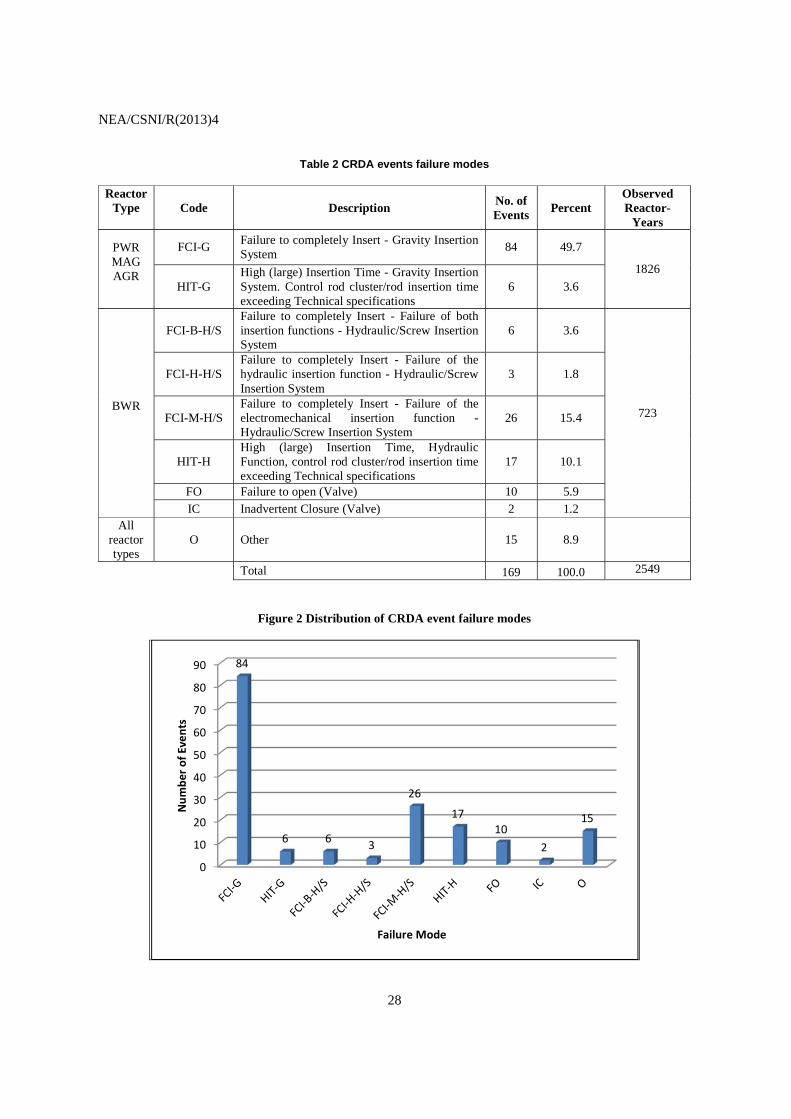
Table 2 contains the failure modes and the number of events by failure mode. Figure 2 shows the distribution of the events.
NEA/CSNI/R(2013)4
28
Table 2 CRDA events failure modes
Reactor Type Code Description
No. of Events
Percent Observed Reactor-
Years
PWR MAG AGR
FCI-G Failure to completely Insert - Gravity Insertion System
84 49.7
1826
HIT-G High (large) Insertion Time - Gravity Insertion System. Control rod cluster/rod insertion time exceeding Technical specifications
6 3.6
BWR
FCI-B-H/S Failure to completely Insert - Failure of both insertion functions - Hydraulic/Screw Insertion System
6 3.6
723
FCI-H-H/S Failure to completely Insert - Failure of the hydraulic insertion function - Hydraulic/Screw Insertion System
3 1.8
FCI-M-H/S Failure to completely Insert - Failure of the electromechanical insertion function - Hydraulic/Screw Insertion System
26 15.4
HIT-H High (large) Insertion Time, Hydraulic Function, control rod cluster/rod insertion time exceeding Technical specifications
17 10.1
FO Failure to open (Valve) 10 5.9 IC Inadvertent Closure (Valve) 2 1.2
All reactor types
O Other 15 8.9
Total 169 100.0 2549
Figure 2 Distribution of CRDA event failure modes
0
10
20
30
40
50
60
70
80
90 84
6 6 3
26
1710
2
15
Num
ber o
f Eve
nts
Failure Mode
NEA/CSNI/R(2013)4
29
Approximately 50 percent of the events were associated with the FCI-G failure mode, which is associated with PWRs, AGRs, and Magnox reactors. The failures FCI-M-H/S and FO, associated with BWRs, account for approximately 16 percent and 15 percent of the events, respectively. The failure modes associated with gravity insertion systems were observed in more than 50 percent of the events; however, the observed reactor-years for reactors with gravity insertion systems account for approximately 72 percent of the total observed reactor-years in this data exchange.
3.3 Root Causes
The general coding guidelines [1] define root cause as follows. The cause field identifies the most basic reason for the component’s failure. Most failure reports address an immediate cause and an underlying cause. For this project, the appropriate code is the one representing the common-cause, or if all levels of causes are common-cause, the most readily identifiable cause. The following coding was suggested:
C – State of other components. The cause of the state of the component under consideration is due to state of another component.
D – Design, manufacture or construction inadequacy. This category encompasses actions and decisions taken during design, manufacture, or installation of components, both before and after the plant is operational. Included in the design process are the equipment and system specification, material specification, and initial construction that would not be considered a maintenance function. This category also includes design modifications.
A – Abnormal environmental stress. This represents causes related to a harsh environment that is not within component design specifications. Specific mechanisms include chemical reactions, electromagnetic interference, fire/smoke, impact loads, moisture, radiation, abnormally high or low temperature, vibration load, and severe natural events.
H – Human actions. This represents causes related to errors of omission or commission on the part of plant staff or contractor staff. This category includes accidental actions, and failure to follow procedures for construction, modification, operation, maintenance, calibration, and testing. This category also includes deficient training.
M – Maintenance. All maintenance not captured by H – human actions or P – procedure inadequacy.
I – Internal to component or piece part. This deals with malfunctioning of internal parts to the component. Internal causes result from phenomena such as normal wear or other intrinsic failure mechanisms. It includes the influence of the environment on the component. Specific mechanisms include corrosion/erosion, internal contamination, fatigue, and wear out/end of life.
P – Procedure inadequacy. Refers to ambiguity, incompleteness, or error in procedures, for operation and maintenance of equipment. This includes inadequacy in construction, modification, administrative, operational, maintenance, test and calibration procedures. This can also include the administrative control procedures, such as change control.
O – Other. The cause of event is known, but does not fit in one of the other categories.
U – Unknown. This category is used when the cause of the component state cannot be identified.
NEA/CSNI/R(2013)4
30
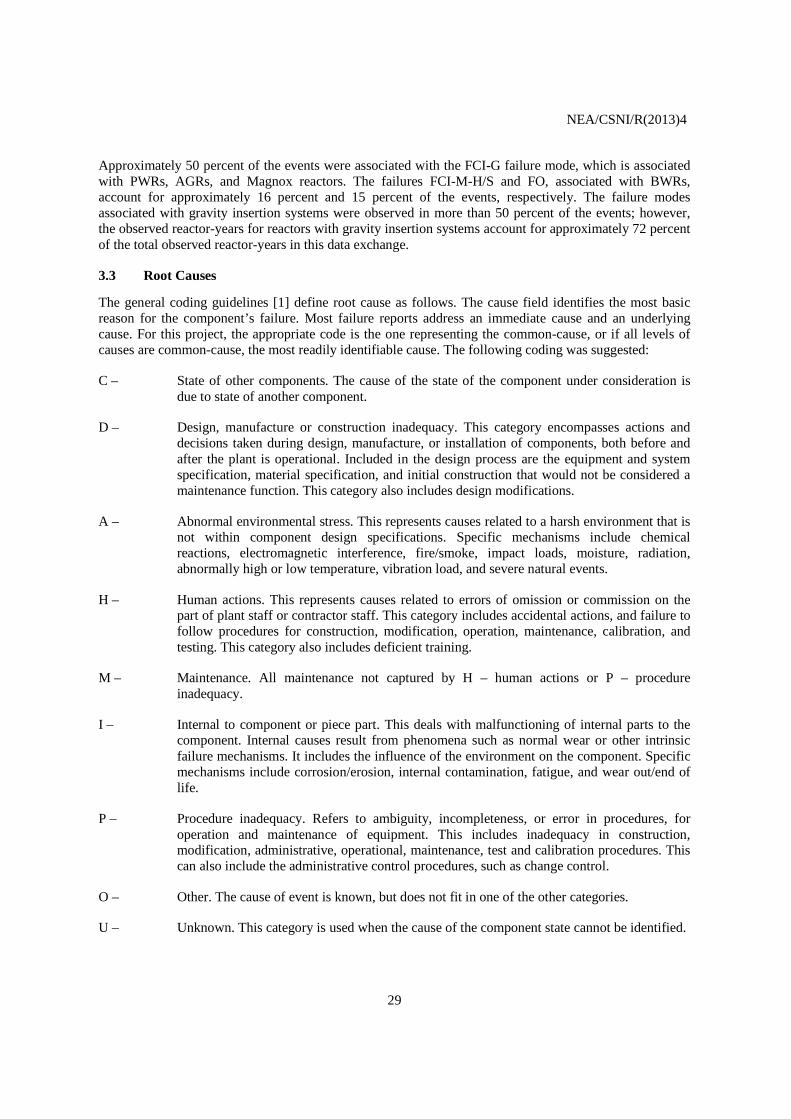
Table 3 and Figure 3 show the distribution of the events by root causes. The dominant root causes for all CCF events are C ‘State of other components’, D ‘Design, manufacture or construction inadequacy’, and I ‘Internal to Component.’ They account for 44 percent (C), 25 percent (D), and 15 percent (I) of the failure events, respectively. For those events with root causes related to the state of other components, this often refers to the fuel assembly or the reactor core. The failures are linked to deformations due to irradiation, thermal, mechanical and hydraulic loading, and their mutual interaction.
Table 3 Distribution of CRDA root causes
Code Description No. of Events
Percent
A Abnormal environmental stress 1 0.6 C State of other component(s) 75 44.4
D Design, manufacture or construction inadequacy 42 24.9 H Human actions, plant staff 6 3.6 I Internal to component, piece part 25 14.9
M Maintenance 3 1.8 P Procedure inadequacy 13 7.7 O Other 4 2.4 U Unknown 0 0.0
Total 169
100.0
Figure 3 Distribution of CRDA event root causes
3.4 Coupling Factors
The general coding guidelines [1] define coupling factor as follows. The coupling factor field describes the mechanism that ties multiple impairments together and identifies the influences that created the conditions
0
10
20
30
40
50
60
70
80
A C D H I M P O
1
75
42
6
25
3
13
4
Num
ber o
f Eve
nts
Root Cause
NEA/CSNI/R(2013)4
31
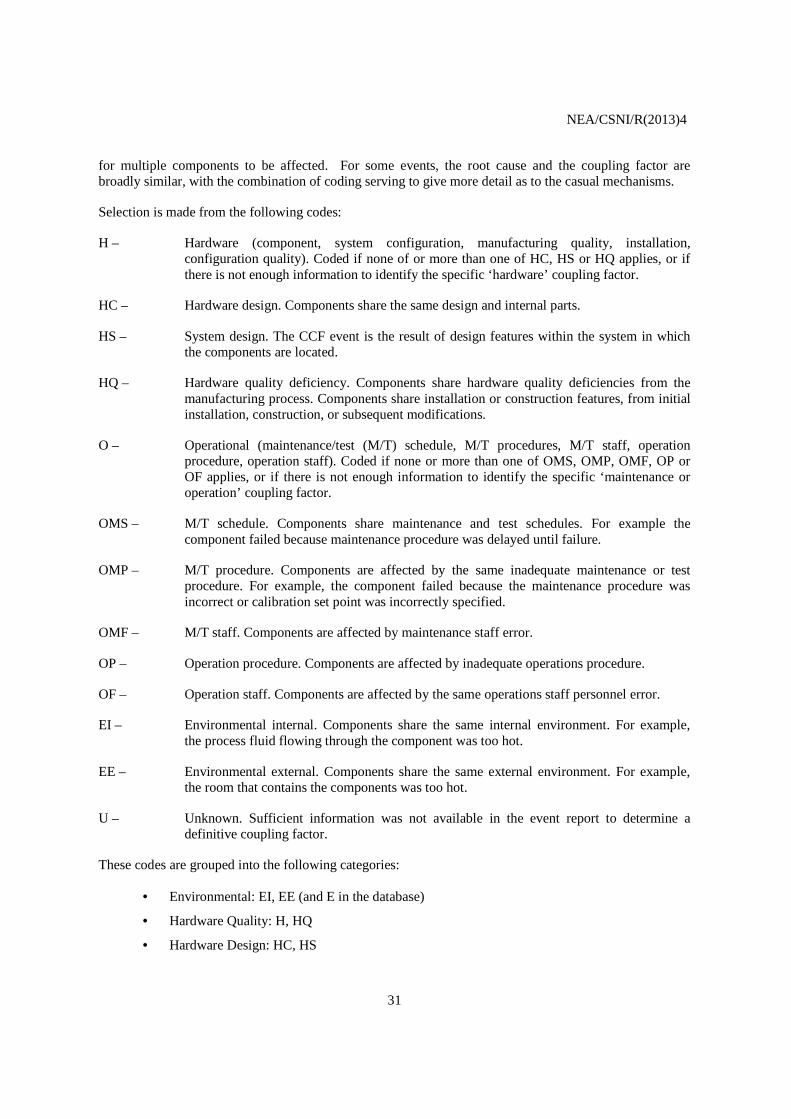
for multiple components to be affected. For some events, the root cause and the coupling factor are broadly similar, with the combination of coding serving to give more detail as to the casual mechanisms.
Selection is made from the following codes:
H – Hardware (component, system configuration, manufacturing quality, installation, configuration quality). Coded if none of or more than one of HC, HS or HQ applies, or if there is not enough information to identify the specific ‘hardware’ coupling factor.
HC – Hardware design. Components share the same design and internal parts.
HS – System design. The CCF event is the result of design features within the system in which the components are located.
HQ – Hardware quality deficiency. Components share hardware quality deficiencies from the manufacturing process. Components share installation or construction features, from initial installation, construction, or subsequent modifications.
O – Operational (maintenance/test (M/T) schedule, M/T procedures, M/T staff, operation procedure, operation staff). Coded if none or more than one of OMS, OMP, OMF, OP or OF applies, or if there is not enough information to identify the specific ‘maintenance or operation’ coupling factor.
OMS – M/T schedule. Components share maintenance and test schedules. For example the component failed because maintenance procedure was delayed until failure.
OMP – M/T procedure. Components are affected by the same inadequate maintenance or test procedure. For example, the component failed because the maintenance procedure was incorrect or calibration set point was incorrectly specified.
OMF – M/T staff. Components are affected by maintenance staff error.
OP – Operation procedure. Components are affected by inadequate operations procedure.
OF – Operation staff. Components are affected by the same operations staff personnel error.
EI – Environmental internal. Components share the same internal environment. For example, the process fluid flowing through the component was too hot.
EE – Environmental external. Components share the same external environment. For example, the room that contains the components was too hot.
U – Unknown. Sufficient information was not available in the event report to determine a definitive coupling factor.
These codes are grouped into the following categories:
• Environmental: EI, EE (and E in the database)
• Hardware Quality: H, HQ
• Hardware Design: HC, HS
NEA/CSNI/R(2013)4
32
• Operations: O, OF, OP
• Maintenance: OMF, OMP, OMS
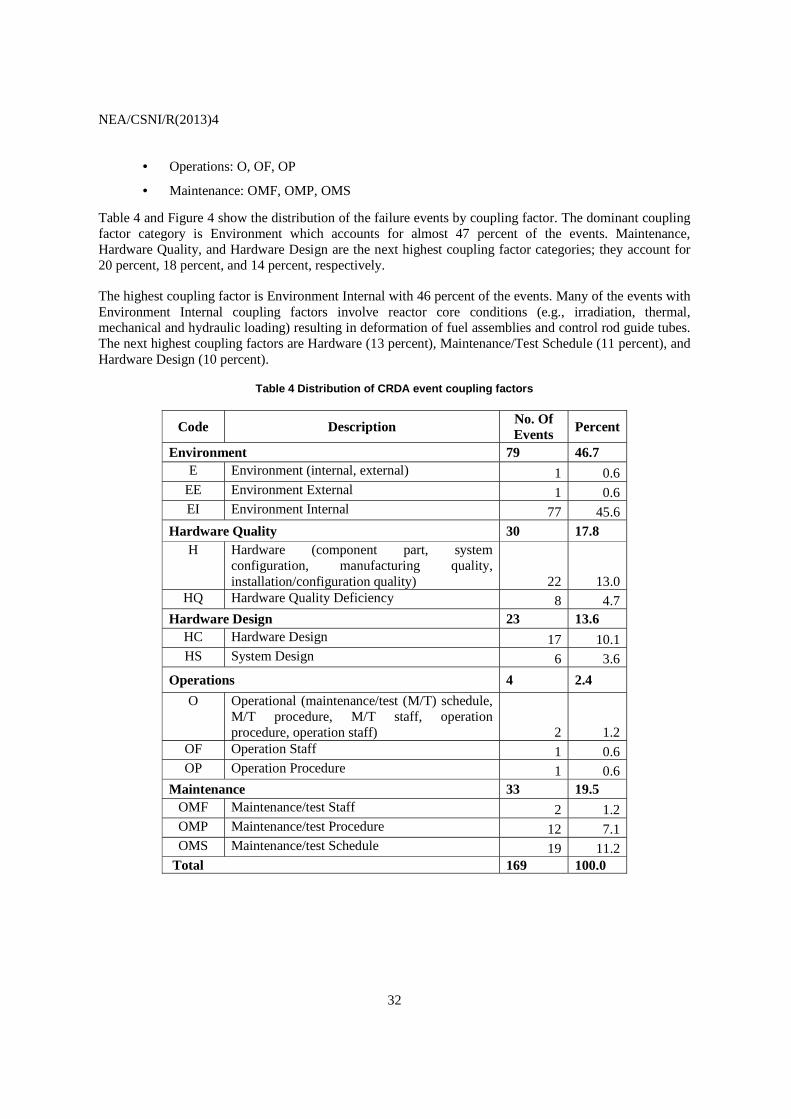
Table 4 and Figure 4 show the distribution of the failure events by coupling factor. The dominant coupling factor category is Environment which accounts for almost 47 percent of the events. Maintenance, Hardware Quality, and Hardware Design are the next highest coupling factor categories; they account for 20 percent, 18 percent, and 14 percent, respectively.
The highest coupling factor is Environment Internal with 46 percent of the events. Many of the events with Environment Internal coupling factors involve reactor core conditions (e.g., irradiation, thermal, mechanical and hydraulic loading) resulting in deformation of fuel assemblies and control rod guide tubes. The next highest coupling factors are Hardware (13 percent), Maintenance/Test Schedule (11 percent), and Hardware Design (10 percent).
Table 4 Distribution of CRDA event coupling factors
Code Description No. Of Events Percent
Environment 79 46.7 E Environment (internal, external) 1 0.6
EE Environment External 1 0.6 EI Environment Internal 77 45.6
Hardware Quality 30 17.8 H Hardware (component part, system
configuration, manufacturing quality, installation/configuration quality) 22 13.0
HQ Hardware Quality Deficiency 8 4.7 Hardware Design 23 13.6
HC Hardware Design 17 10.1 HS System Design 6 3.6
Operations 4 2.4
O Operational (maintenance/test (M/T) schedule, M/T procedure, M/T staff, operation procedure, operation staff) 2 1.2
OF Operation Staff 1 0.6 OP Operation Procedure 1 0.6
Maintenance 33 19.5 OMF Maintenance/test Staff 2 1.2 OMP Maintenance/test Procedure 12 7.1 OMS Maintenance/test Schedule 19 11.2
Total 169 100.0
NEA/CSNI/R(2013)4
33
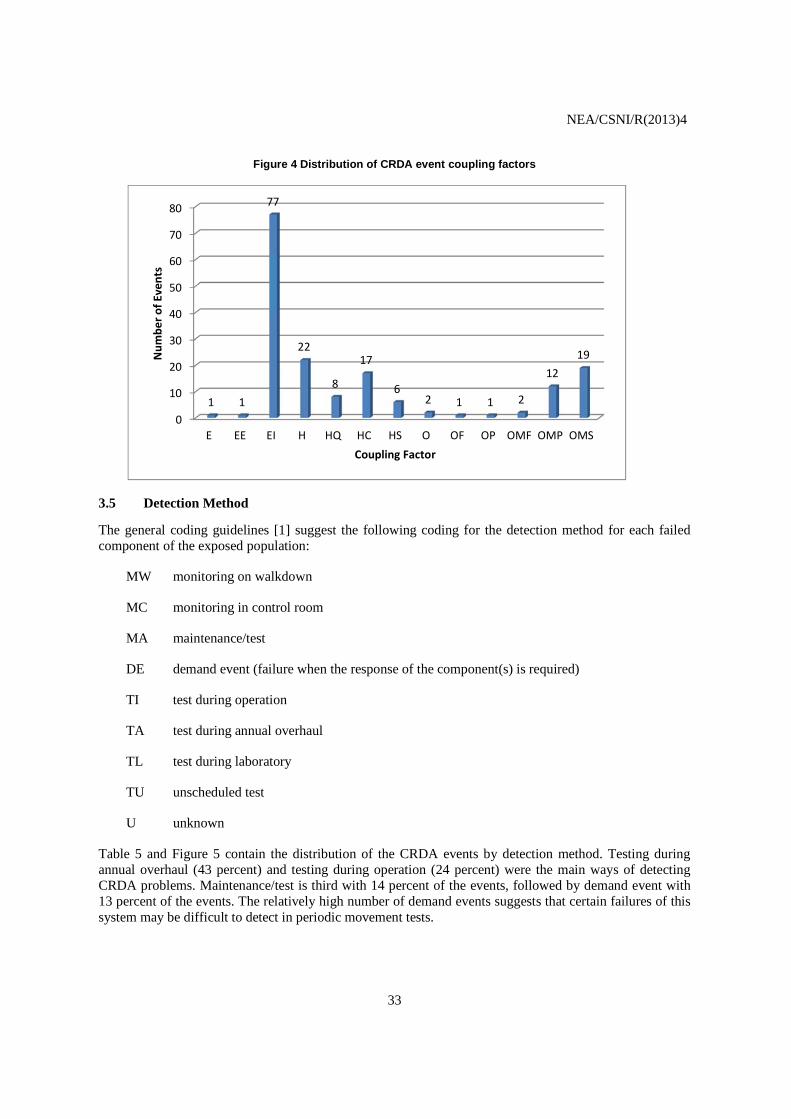
Figure 4 Distribution of CRDA event coupling factors
3.5 Detection Method
The general coding guidelines [1] suggest the following coding for the detection method for each failed component of the exposed population:
MW monitoring on walkdown
MC monitoring in control room
MA maintenance/test
DE demand event (failure when the response of the component(s) is required)
TI test during operation
TA test during annual overhaul
TL test during laboratory
TU unscheduled test
U unknown
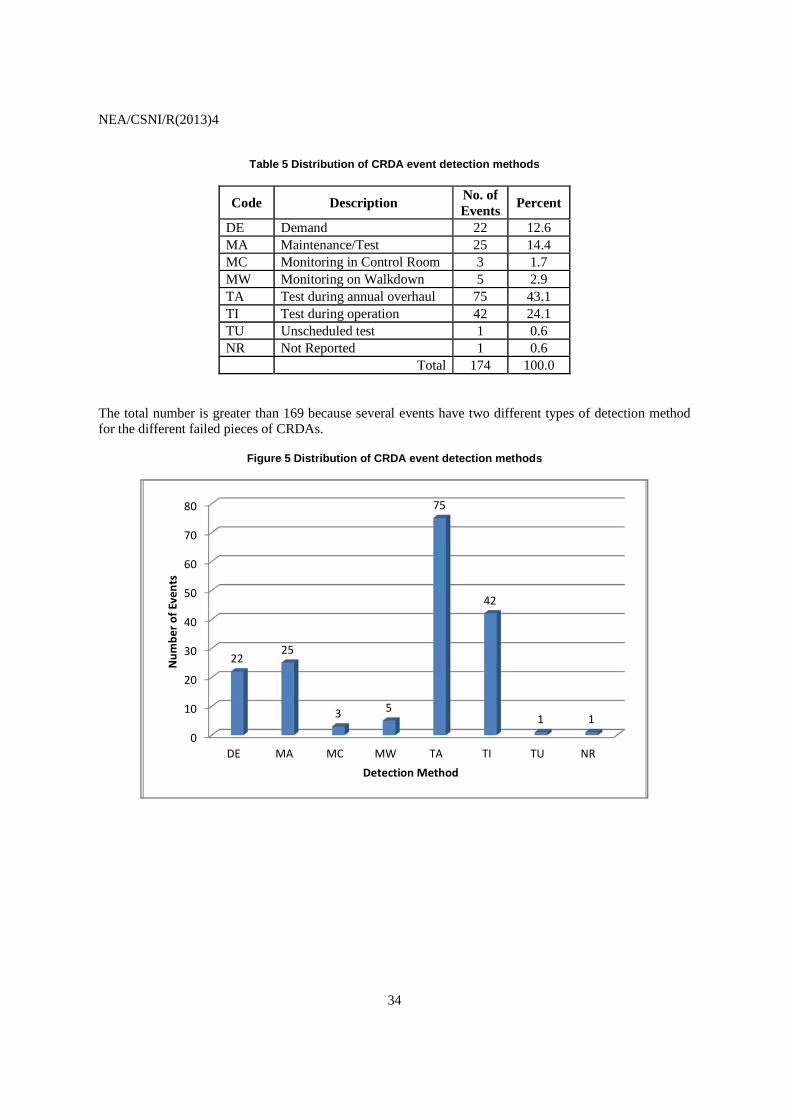
Table 5 and Figure 5 contain the distribution of the CRDA events by detection method. Testing during annual overhaul (43 percent) and testing during operation (24 percent) were the main ways of detecting CRDA problems. Maintenance/test is third with 14 percent of the events, followed by demand event with 13 percent of the events. The relatively high number of demand events suggests that certain failures of this system may be difficult to detect in periodic movement tests.
0
10
20
30
40
50
60
70
80
E EE EI H HQ HC HS O OF OP OMF OMP OMS
1 1
77
22
8
17
62 1 1 2
1219N
umbe
r of E
vent
s
Coupling Factor
NEA/CSNI/R(2013)4
34
Table 5 Distribution of CRDA event detection methods
Code Description No. of Events
Percent
DE Demand 22 12.6 MA Maintenance/Test 25 14.4 MC Monitoring in Control Room 3 1.7 MW Monitoring on Walkdown 5 2.9 TA Test during annual overhaul 75 43.1 TI Test during operation 42 24.1 TU Unscheduled test 1 0.6 NR Not Reported 1 0.6 Total 174 100.0
The total number is greater than 169 because several events have two different types of detection method for the different failed pieces of CRDAs.
Figure 5 Distribution of CRDA event detection methods
0
10
20
30
40
50
60
70
80
DE MA MC MW TA TI TU NR
2225
3 5
75
42
1 1
Num
ber o
f Eve
nts
Detection Method
NEA/CSNI/R(2013)4
35
3.6 Corrective Actions
The ICDE general coding guidelines [1] define corrective action as follows. The corrective actions field describes the actions taken by the licensee to prevent the CCF event from reoccurring. The defense mechanism selection is based on an assessment of the root cause and/or coupling factor between impairments.
Selection is made from the following codes:
A – General administrative/procedure controls
B – Specific maintenance/operation practices
C – Design modifications
D – Diversity. This includes diversity in equipment, types of equipment, procedures, equipment functions, manufacturers, suppliers, personnel, etc.
E – Functional/spatial separation. Modification of the equipment barrier (functional and/or physical interconnections). Physical restriction, barrier, or separation
F – Test and maintenance policies. Maintenance program modification. The modification includes item such as staggered testing and maintenance/ operation staff diversity
G – Fixing component
O – Other. The corrective action is not included in the classification scheme
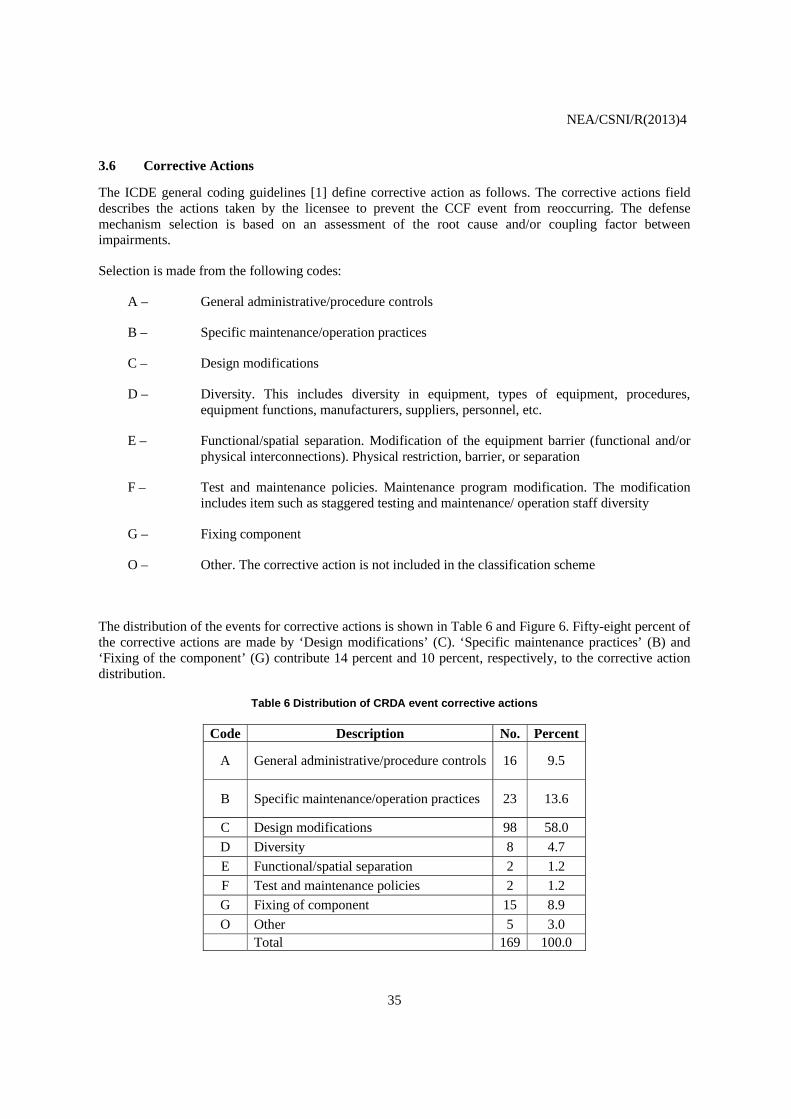
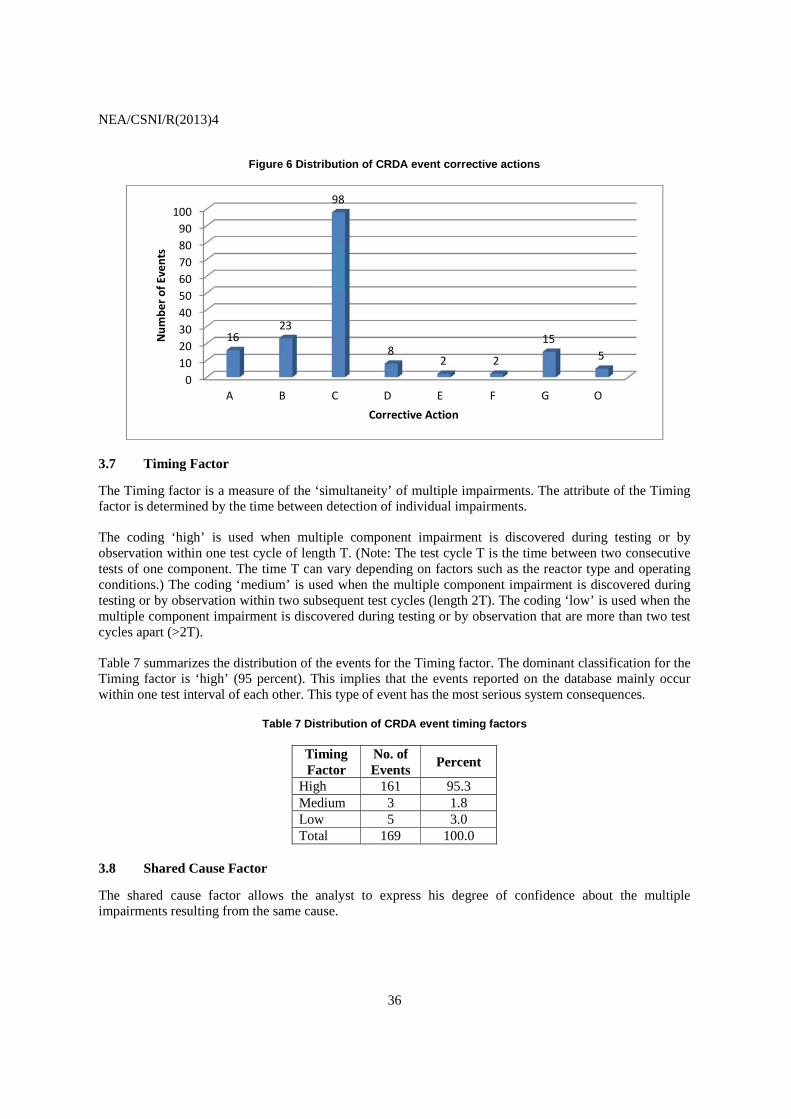
The distribution of the events for corrective actions is shown in Table 6 and Figure 6. Fifty-eight percent of the corrective actions are made by ‘Design modifications’ (C). ‘Specific maintenance practices’ (B) and ‘Fixing of the component’ (G) contribute 14 percent and 10 percent, respectively, to the corrective action distribution.
Table 6 Distribution of CRDA event corrective actions
Code Description No. Percent
A General administrative/procedure controls 16 9.5
B Specific maintenance/operation practices 23 13.6
C Design modifications 98 58.0
D Diversity 8 4.7
E Functional/spatial separation 2 1.2
F Test and maintenance policies 2 1.2
G Fixing of component 15 8.9
O Other 5 3.0 Total 169 100.0
NEA/CSNI/R(2013)4
36
Figure 6 Distribution of CRDA event corrective actions
3.7 Timing Factor
The Timing factor is a measure of the ‘simultaneity’ of multiple impairments. The attribute of the Timing factor is determined by the time between detection of individual impairments.
The coding ‘high’ is used when multiple component impairment is discovered during testing or by observation within one test cycle of length T. (Note: The test cycle T is the time between two consecutive tests of one component. The time T can vary depending on factors such as the reactor type and operating conditions.) The coding ‘medium’ is used when the multiple component impairment is discovered during testing or by observation within two subsequent test cycles (length 2T). The coding ‘low’ is used when the multiple component impairment is discovered during testing or by observation that are more than two test cycles apart (>2T).
Table 7 summarizes the distribution of the events for the Timing factor. The dominant classification for the Timing factor is ‘high’ (95 percent). This implies that the events reported on the database mainly occur within one test interval of each other. This type of event has the most serious system consequences.
Table 7 Distribution of CRDA event timing factors
Timing Factor
No. of Events
Percent
High 161 95.3 Medium 3 1.8 Low 5 3.0 Total 169 100.0
3.8 Shared Cause Factor
The shared cause factor allows the analyst to express his degree of confidence about the multiple impairments resulting from the same cause.
0102030405060708090
100
A B C D E F G O
1623
98
82 2
155
Num
ber o
f Eve
nts
Corrective Action
NEA/CSNI/R(2013)4
37
The coding ‘High’ is used when the analyst is confident that multiple impairments are due to the same root cause. Typically, the failure/degradation mechanism, piece-parts affected and corrective action(s) would also be the same for each of the multiple components.
The coding ‘Medium’ is used when the event description does not directly indicate that multiple impairments resulted from the same cause, involving the same failure mechanism, or affected the same piece-parts, but there is strong evidence that the underlying root cause of the multiple impairments is the same.
The coding ‘low’ is used when the event description indicates that multiple impairments resulted from different causes, involved different failure mechanisms, or affected different piece-parts, but there is still some evidence that the underlying root cause of the multiple impairments is the same.
Table 8 summarizes the distribution of the CRDA events by shared cause factor. The dominant classification for the shared cause factor is ‘High’, accounting for 95 percent of the events. ‘Medium’ accounts for the remaining 5 percent of the events. None of the events had a ‘Low’ shared cause factor.
Table 8 Distribution of CRDA event shared cause factor
Shared Cause Factor
No. of Events
Percent
High 160 94.7 Medium 9 5.3 Low 0 0.0 Total 169 100.0
3.9 CRDA Insertion Systems Analysis
Each type of reactor has its own CRDA insertion system. These systems can be very different and can have distinctive failure modes. Therefore, it might be interesting to analyse the CCF events separately for the different insertion systems. Two families of insertion systems have been identified among the reactor technologies captured by the ICDE database:
NEA/CSNI/R(2013)4
38
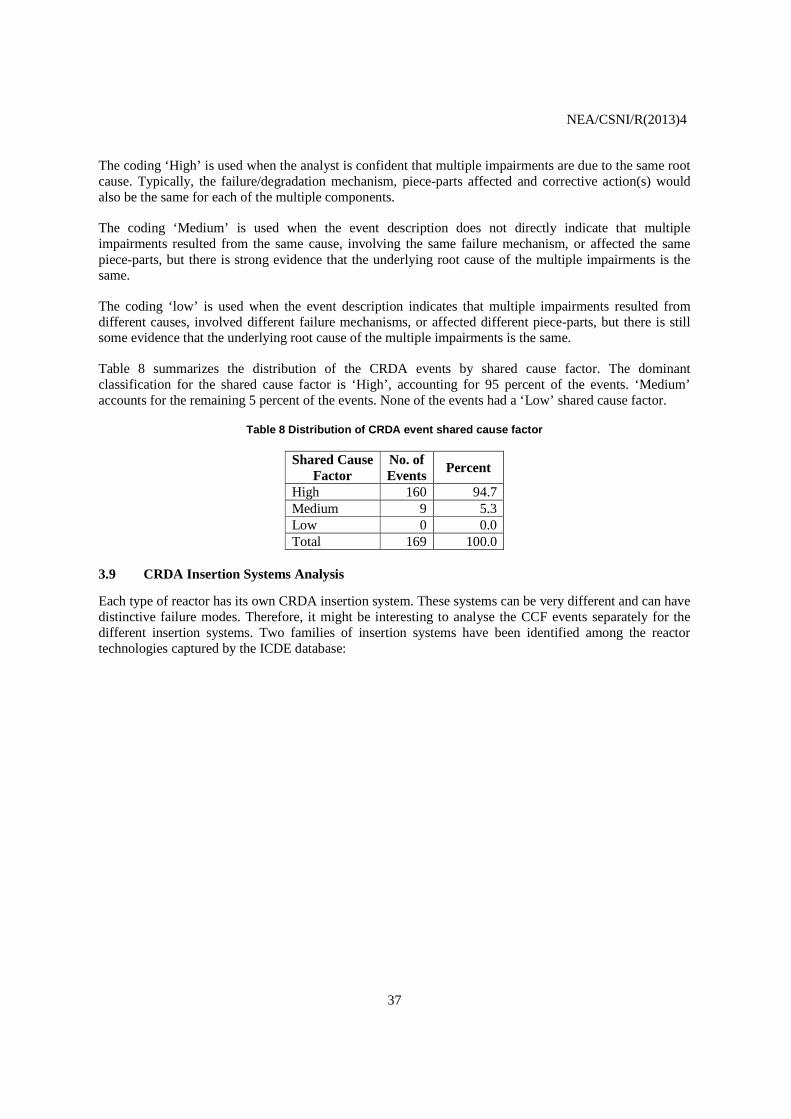
Figure 7 Insertion system categories and reactor types
Gravity insertion systems are systems which insert the control rods through the top head of the reactor core. They use the gravity force to insert the control rods. Non-gravity insertion systems are systems which insert the control rods through the bottom head of the reactor core. They use a hydraulic or mechanic force to insert the control rods.
Table 9 Subsystem distribution for CRDA events
Code System No. of Events Percent
Observed Reactor-
Years GIS Gravity Insertion System (PWR, AGR, MAGNOX) 97 57.4 1826 H/S Non-Gravity Insertion System (BWR) 72 42.6 723 Total 169 100.0 2549
Table 9 shows that 57 percent of CCF events occurred on gravity insertion systems and 43 percent of events occurred on non-gravity insertion systems. While 57 percent of the events were associated with gravity insertion systems, the observed reactor-years for reactors with gravity insertion systems account for approximately 72 percent of the total observed reactor-years in this data exchange.
3.10 Component Types
Table 10 summarizes the component types in the CRDA events that are affected by the CCF events. The majority of the events are coded as ‘General CRDA Component’ with 161 events (95 percent).
CRDA Systems
Gravity Insertion systems
PWR Control rods in clusters
Non-Gravity Insertion systems
AGR, MAGNOX Chain connected control rod
BWR Hydraulic insertion both for scram and operational function
BWR Hydraulic insertion for fast scram Motor-driven screw for operational function
NEA/CSNI/R(2013)4
39
Table 10 Distribution of component types for CRDA events
Code Component No. of Events Percent
ACC Scram Accumulator 3 1.8 CRDA General CRDA Component 161 95.3 NRV Non-return Valve 2 1.2 PIC Pilot Valve 0 0.0 SCV Scram Valve 3 1.8 Total 169 100.0
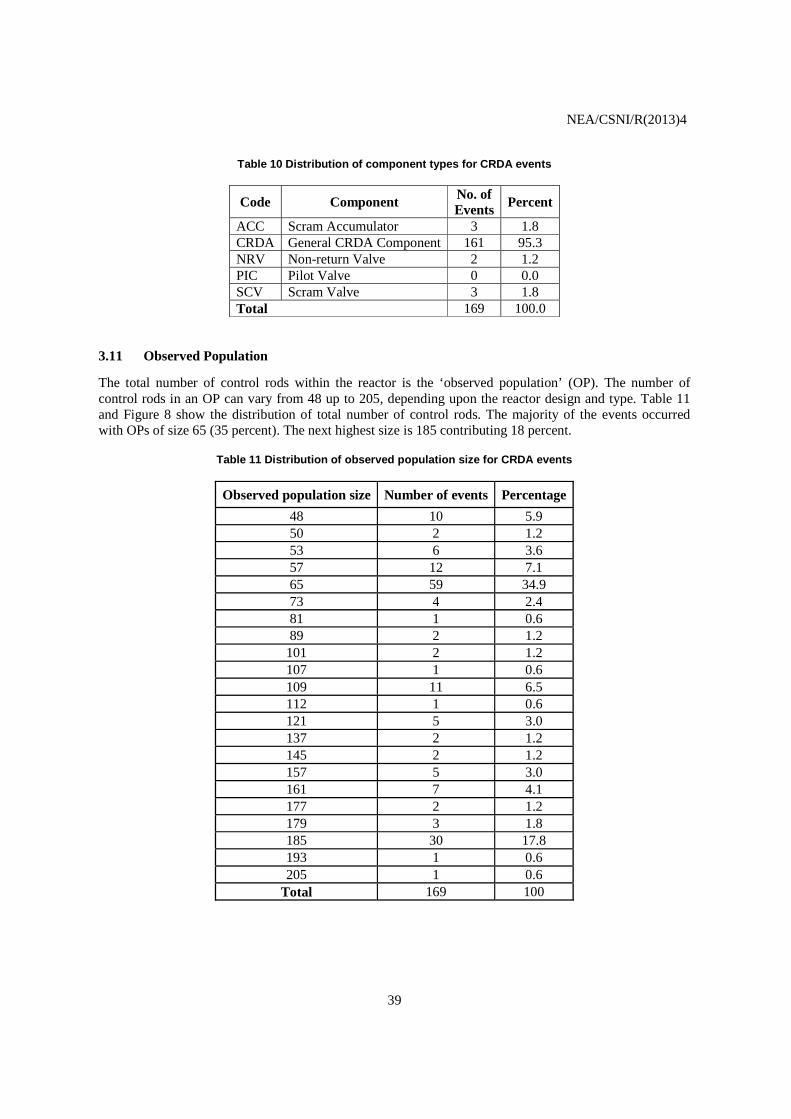
3.11 Observed Population
The total number of control rods within the reactor is the ‘observed population’ (OP). The number of control rods in an OP can vary from 48 up to 205, depending upon the reactor design and type. Table 11 and Figure 8 show the distribution of total number of control rods. The majority of the events occurred with OPs of size 65 (35 percent). The next highest size is 185 contributing 18 percent.
Table 11 Distribution of observed population size for CRDA events
Observed population size Number of events Percentage
48 10 5.9 50 2 1.2 53 6 3.6 57 12 7.1 65 59 34.9 73 4 2.4 81 1 0.6 89 2 1.2
101 2 1.2 107 1 0.6 109 11 6.5 112 1 0.6 121 5 3.0 137 2 1.2 145 2 1.2 157 5 3.0 161 7 4.1 177 2 1.2 179 3 1.8 185 30 17.8 193 1 0.6 205 1 0.6
Total 169 100
NEA/CSNI/R(2013)4
40
Figure 8 Distribution of observed population size
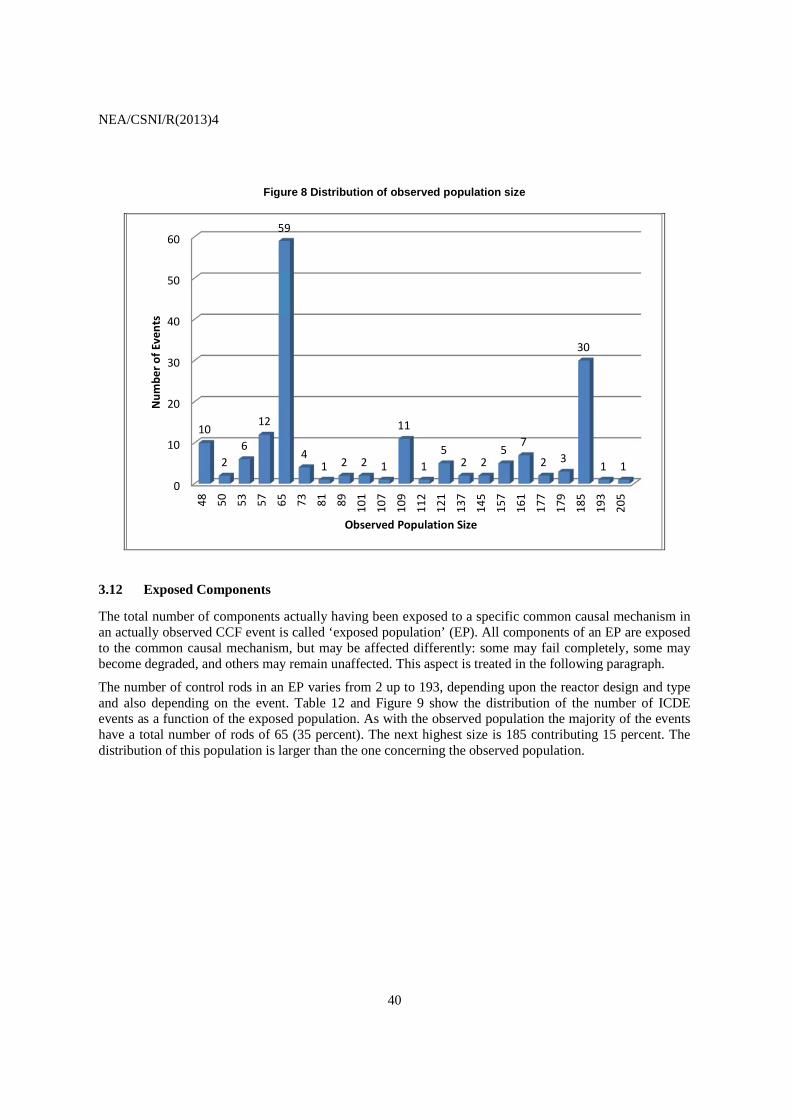
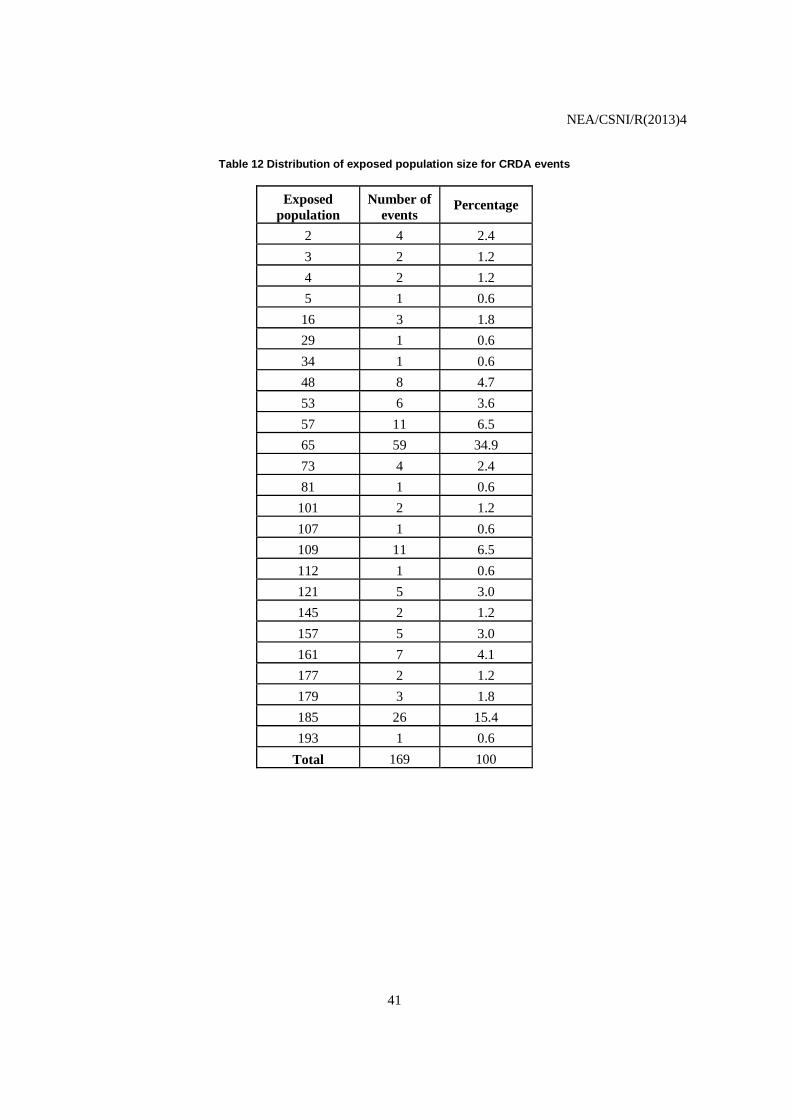
3.12 Exposed Components
The total number of components actually having been exposed to a specific common causal mechanism in an actually observed CCF event is called ‘exposed population’ (EP). All components of an EP are exposed to the common causal mechanism, but may be affected differently: some may fail completely, some may become degraded, and others may remain unaffected. This aspect is treated in the following paragraph.
The number of control rods in an EP varies from 2 up to 193, depending upon the reactor design and type and also depending on the event. Table 12 and Figure 9 show the distribution of the number of ICDE events as a function of the exposed population. As with the observed population the majority of the events have a total number of rods of 65 (35 percent). The next highest size is 185 contributing 15 percent. The distribution of this population is larger than the one concerning the observed population.
0
10
20
30
40
50
60
48 50 53 57 65 73 81 89 101
107
109
112
121
137
145
157
161
177
179
185
193
205
10
26
12
59
41 2 2 1
11
15
2 25
7
2 3
30
1 1
Num
ber o
f Eve
nts
Observed Population Size
NEA/CSNI/R(2013)4
41
Table 12 Distribution of exposed population size for CRDA events
Exposed population
Number of events
Percentage
2 4 2.4
3 2 1.2
4 2 1.2
5 1 0.6
16 3 1.8
29 1 0.6
34 1 0.6
48 8 4.7
53 6 3.6
57 11 6.5
65 59 34.9
73 4 2.4
81 1 0.6
101 2 1.2
107 1 0.6
109 11 6.5
112 1 0.6
121 5 3.0
145 2 1.2
157 5 3.0
161 7 4.1
177 2 1.2
179 3 1.8
185 26 15.4
193 1 0.6
Total 169 100
NEA/CSNI/R(2013)4
42
Figure 9 Distribution of exposed population size
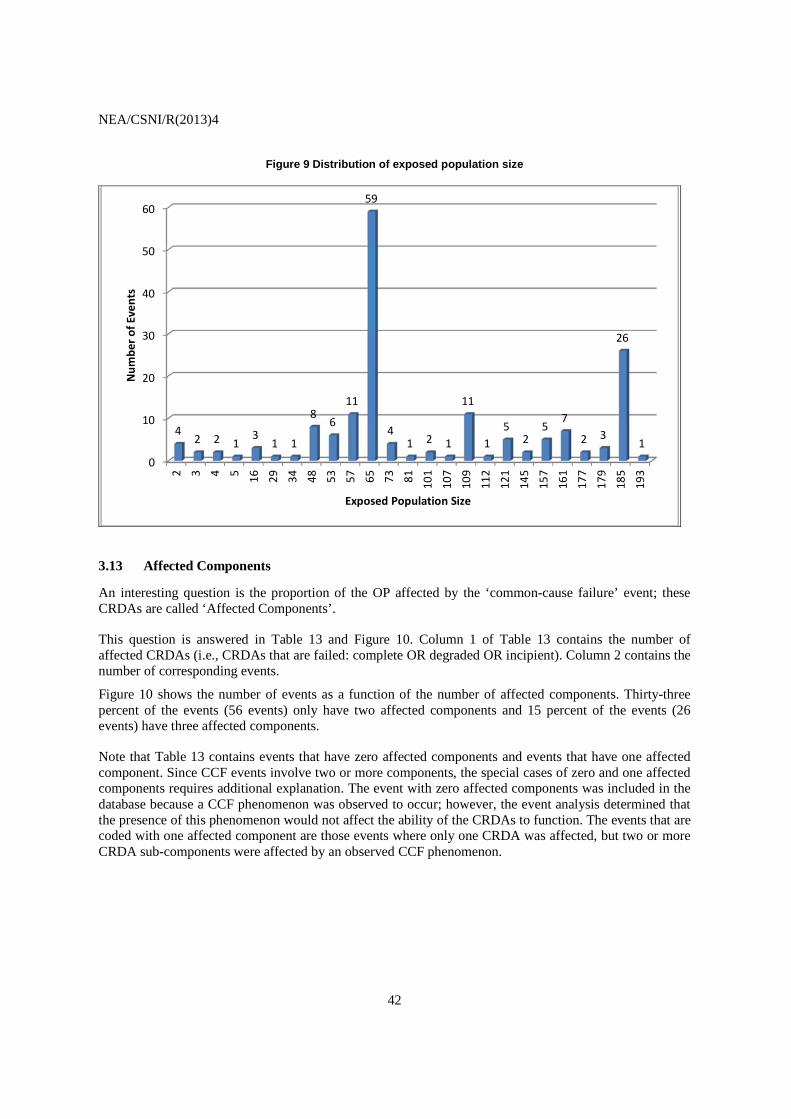
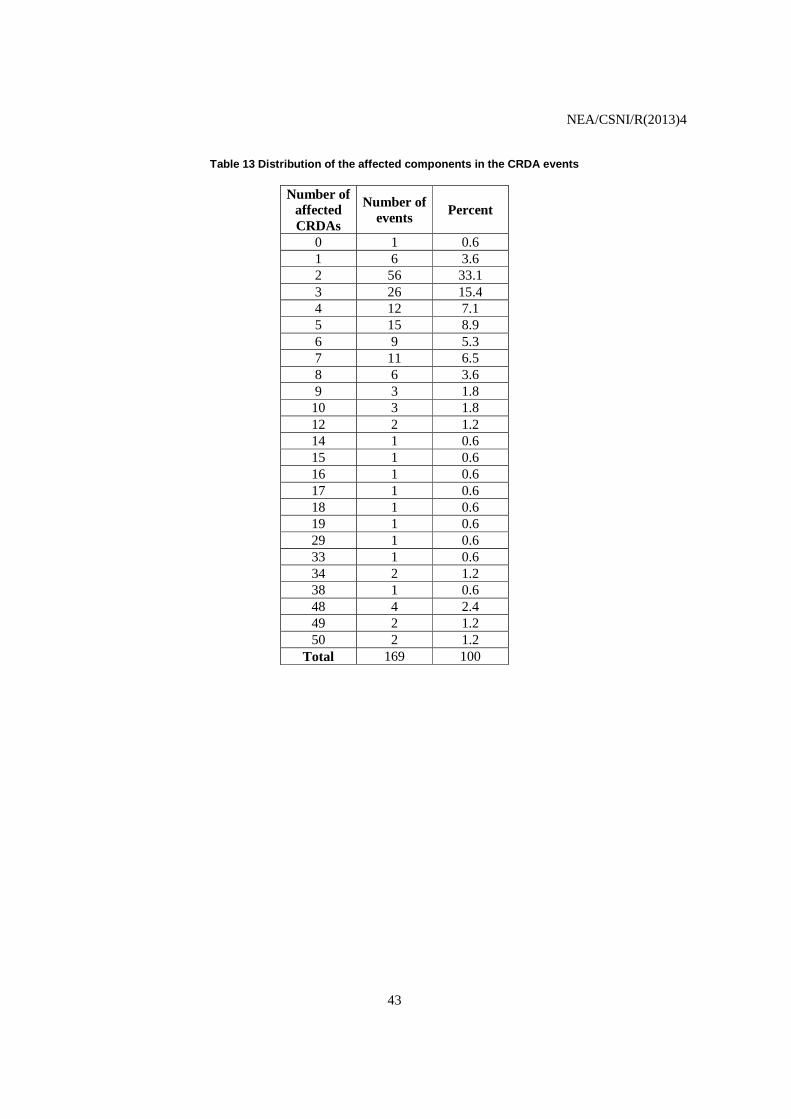
3.13 Affected Components
An interesting question is the proportion of the OP affected by the ‘common-cause failure’ event; these CRDAs are called ‘Affected Components’.
This question is answered in Table 13 and Figure 10. Column 1 of Table 13 contains the number of affected CRDAs (i.e., CRDAs that are failed: complete OR degraded OR incipient). Column 2 contains the number of corresponding events.
Figure 10 shows the number of events as a function of the number of affected components. Thirty-three percent of the events (56 events) only have two affected components and 15 percent of the events (26 events) have three affected components.
Note that Table 13 contains events that have zero affected components and events that have one affected component. Since CCF events involve two or more components, the special cases of zero and one affected components requires additional explanation. The event with zero affected components was included in the database because a CCF phenomenon was observed to occur; however, the event analysis determined that the presence of this phenomenon would not affect the ability of the CRDAs to function. The events that are coded with one affected component are those events where only one CRDA was affected, but two or more CRDA sub-components were affected by an observed CCF phenomenon.
0
10
20
30
40
50
60
2 3 4 5 16 29 34 48 53 57 65 73 81 101
107
109
112
121
145
157
161
177
179
185
193
42 2 1
31 1
86
11
59
41 2 1
11
15
25
7
2 3
26
1
Num
ber o
f Eve
nts
Exposed Population Size
NEA/CSNI/R(2013)4
43
Table 13 Distribution of the affected components in the CRDA events
Number of affected CRDAs
Number of events
Percent
0 1 0.6 1 6 3.6 2 56 33.1 3 26 15.4 4 12 7.1 5 15 8.9 6 9 5.3 7 11 6.5 8 6 3.6 9 3 1.8 10 3 1.8 12 2 1.2 14 1 0.6 15 1 0.6 16 1 0.6 17 1 0.6 18 1 0.6 19 1 0.6 29 1 0.6 33 1 0.6 34 2 1.2 38 1 0.6 48 4 2.4 49 2 1.2 50 2 1.2
Total 169 100
NEA/CSNI/R(2013)4
44
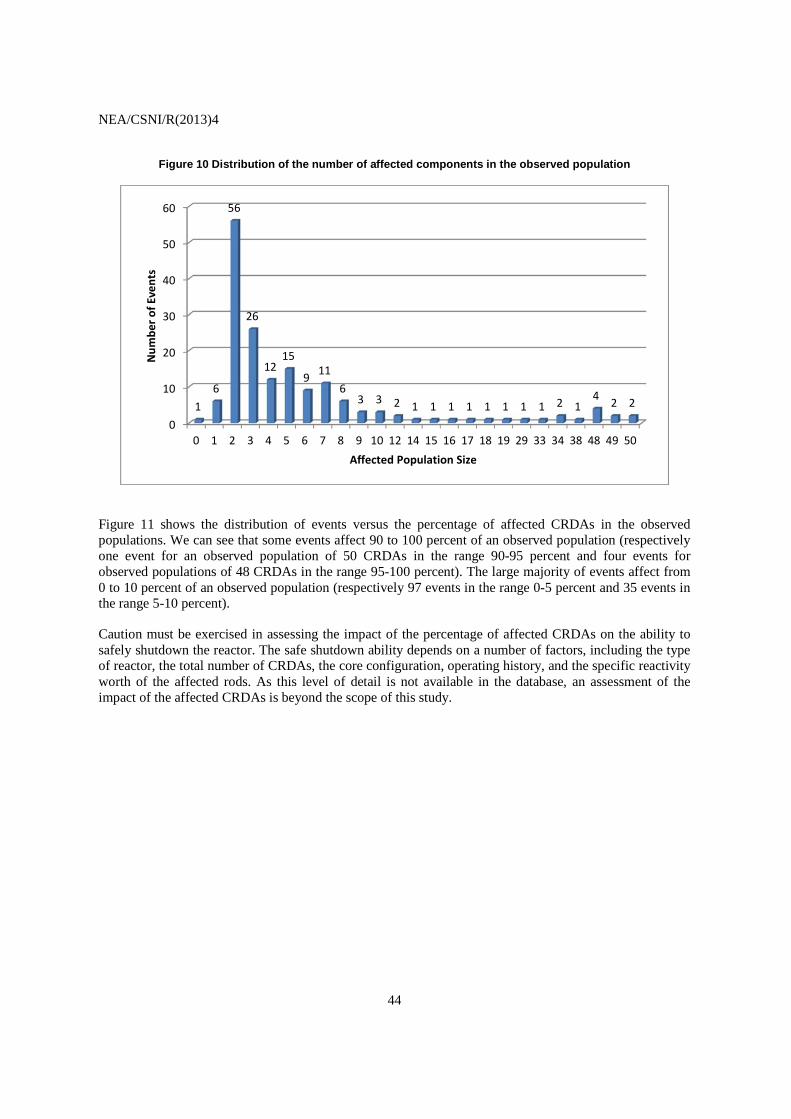
Figure 10 Distribution of the number of affected components in the observed population
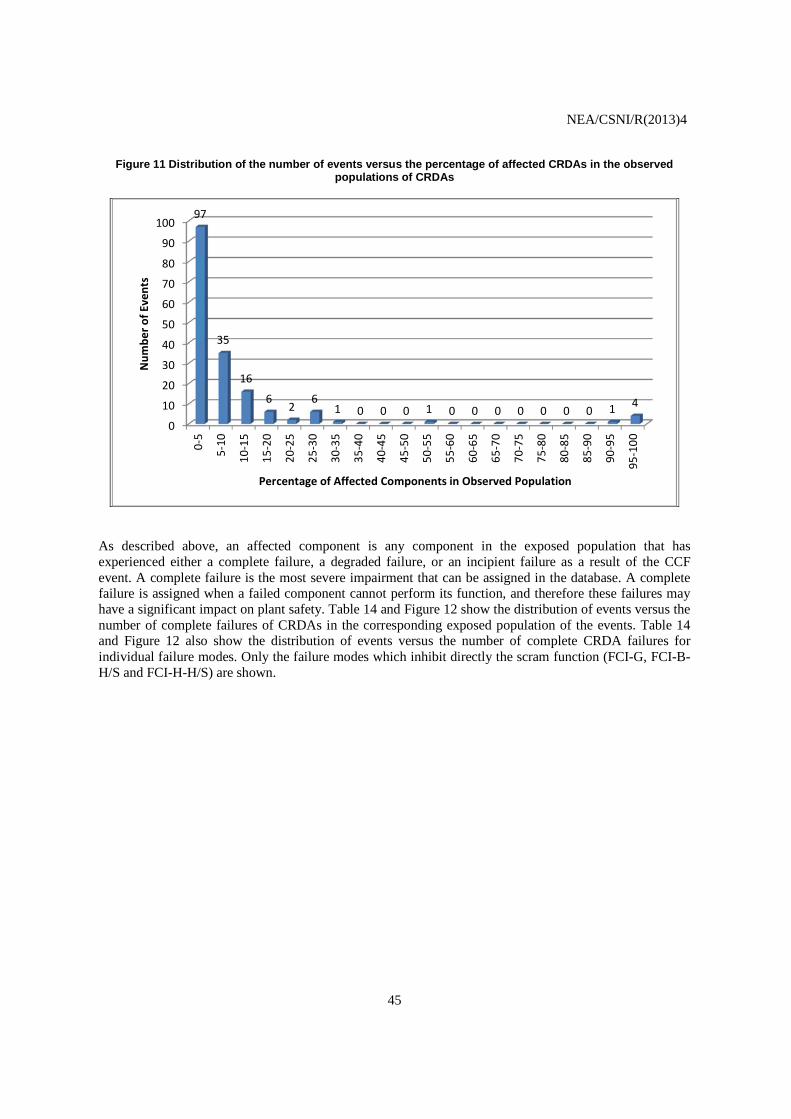
Figure 11 shows the distribution of events versus the percentage of affected CRDAs in the observed populations. We can see that some events affect 90 to 100 percent of an observed population (respectively one event for an observed population of 50 CRDAs in the range 90-95 percent and four events for observed populations of 48 CRDAs in the range 95-100 percent). The large majority of events affect from 0 to 10 percent of an observed population (respectively 97 events in the range 0-5 percent and 35 events in the range 5-10 percent).
Caution must be exercised in assessing the impact of the percentage of affected CRDAs on the ability to safely shutdown the reactor. The safe shutdown ability depends on a number of factors, including the type of reactor, the total number of CRDAs, the core configuration, operating history, and the specific reactivity worth of the affected rods. As this level of detail is not available in the database, an assessment of the impact of the affected CRDAs is beyond the scope of this study.
0
10
20
30
40
50
60
0 1 2 3 4 5 6 7 8 9 10 12 14 15 16 17 18 19 29 33 34 38 48 49 50
16
56
26
1215
9 116
3 3 2 1 1 1 1 1 1 1 1 2 14 2 2
Num
ber o
f Eve
nts
Affected Population Size
NEA/CSNI/R(2013)4
45
Figure 11 Distribution of the number of events versus the percentage of affected CRDAs in the observed populations of CRDAs
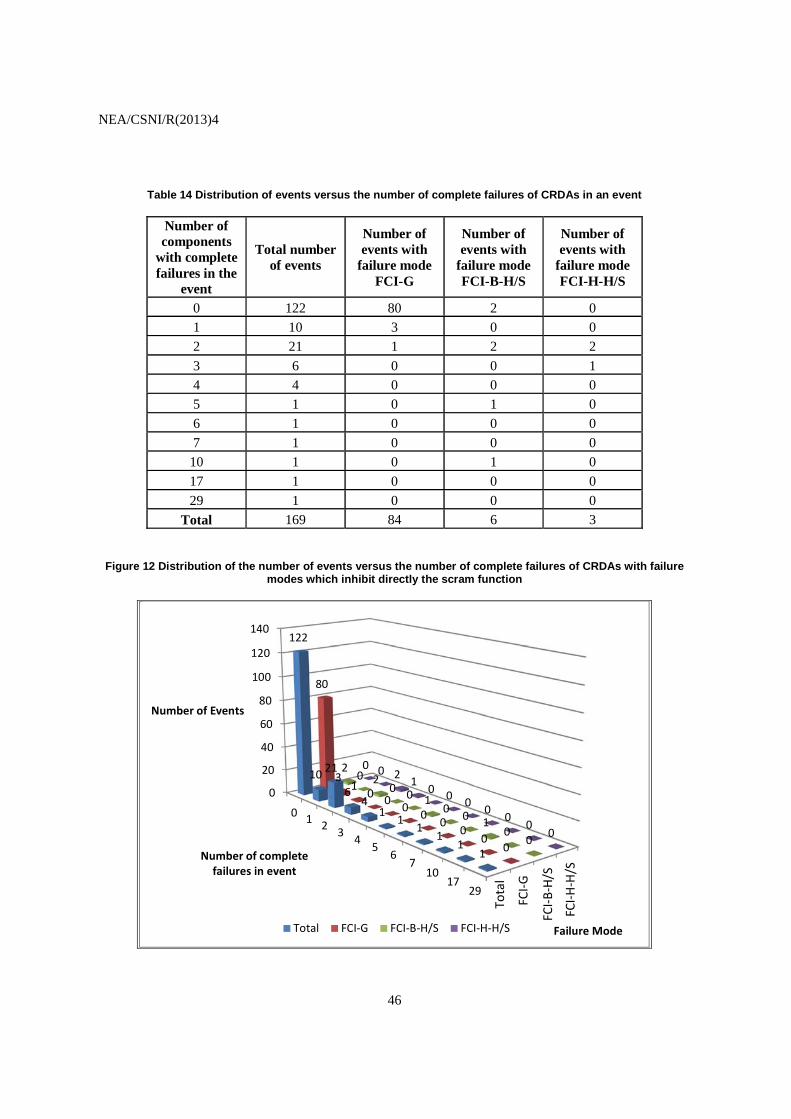
As described above, an affected component is any component in the exposed population that has experienced either a complete failure, a degraded failure, or an incipient failure as a result of the CCF event. A complete failure is the most severe impairment that can be assigned in the database. A complete failure is assigned when a failed component cannot perform its function, and therefore these failures may have a significant impact on plant safety. Table 14 and Figure 12 show the distribution of events versus the number of complete failures of CRDAs in the corresponding exposed population of the events. Table 14 and Figure 12 also show the distribution of events versus the number of complete CRDA failures for individual failure modes. Only the failure modes which inhibit directly the scram function (FCI-G, FCI-B-H/S and FCI-H-H/S) are shown.
0
10
20
30
40
50
60
70
80
90
100
0-5
5-10
10-1
5
15-2
0
20-2
5
25-3
0
30-3
5
35-4
0
40-4
5
45-5
0
50-5
5
55-6
0
60-6
5
65-7
0
70-7
5
75-8
0
80-8
5
85-9
0
90-9
5
95-1
00
97
35
16
62
61 0 0 0 1 0 0 0 0 0 0 0 1 4
Num
ber o
f Eve
nts
Percentage of Affected Components in Observed Population
NEA/CSNI/R(2013)4
46
Table 14 Distribution of events versus the number of complete failures of CRDAs in an event
Number of components
with complete failures in the
event
Total number of events
Number of events with
failure mode FCI-G
Number of events with
failure mode FCI-B-H/S
Number of events with
failure mode FCI-H-H/S
0 122 80 2 0 1 10 3 0 0 2 21 1 2 2
3 6 0 0 1 4 4 0 0 0 5 1 0 1 0
6 1 0 0 0
7 1 0 0 0 10 1 0 1 0
17 1 0 0 0
29 1 0 0 0
Total 169 84 6 3
Figure 12 Distribution of the number of events versus the number of complete failures of CRDAs with failure modes which inhibit directly the scram function
0
20
40
60
80
100
120
140
0 1 2 3 4 5 67
1017
29
122
10 21
64
1 1 11
11
80
31 0 0 0 0 0
00
0
20 2
0 0 10 0 1
00
0 0 2 1 0 0 0 0 0 00
Failure Mode
Number of Events
Number of complete failures in event
Total FCI-G FCI-B-H/S FCI-H-H/S
Tota
l
FCI-G
FCI-B
-H/S
FCI-H
-H/S
NEA/CSNI/R(2013)4
47
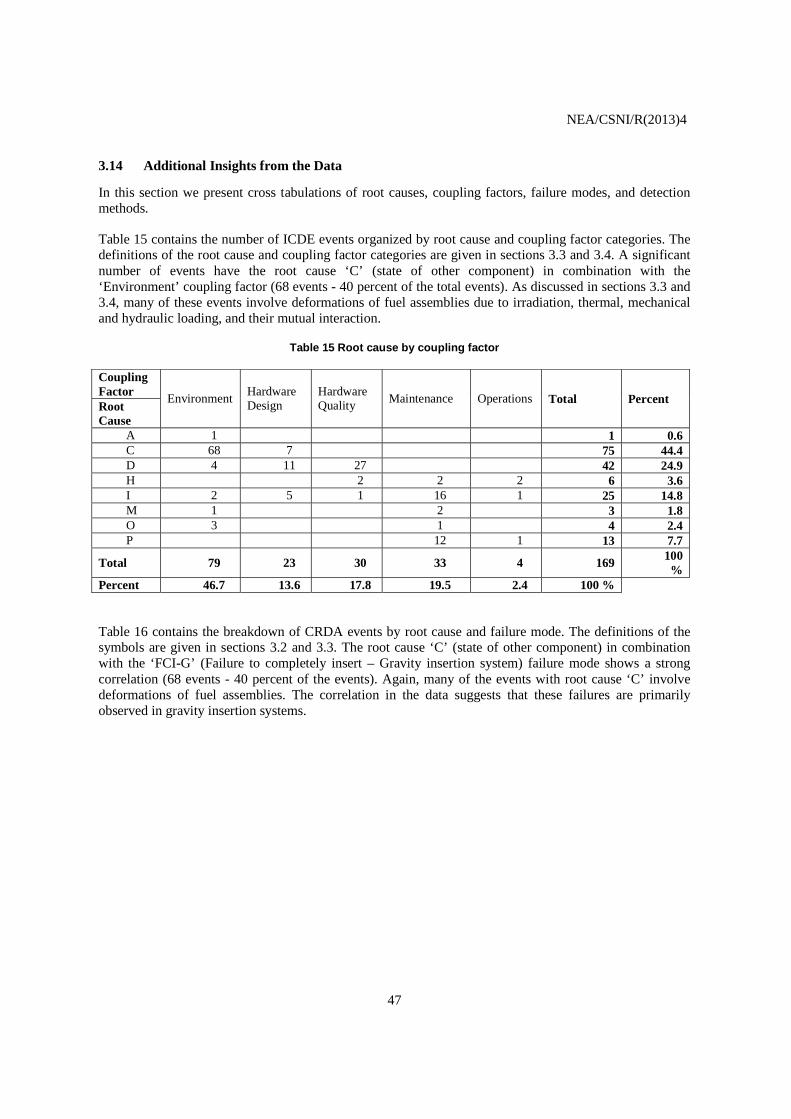
3.14 Additional Insights from the Data
In this section we present cross tabulations of root causes, coupling factors, failure modes, and detection methods.
Table 15 contains the number of ICDE events organized by root cause and coupling factor categories. The definitions of the root cause and coupling factor categories are given in sections 3.3 and 3.4. A significant number of events have the root cause ‘C’ (state of other component) in combination with the ‘Environment’ coupling factor (68 events - 40 percent of the total events). As discussed in sections 3.3 and 3.4, many of these events involve deformations of fuel assemblies due to irradiation, thermal, mechanical and hydraulic loading, and their mutual interaction.
Table 15 Root cause by coupling factor
Coupling Factor
Environment Hardware Design
Hardware Quality
Maintenance Operations Total Percent Root Cause
A 1 1 0.6 C 68 7 75 44.4 D 4 11 27 42 24.9 H 2 2 2 6 3.6 I 2 5 1 16 1 25 14.8 M 1 2 3 1.8 O 3 1 4 2.4 P 12 1 13 7.7
Total 79 23 30 33 4 169 100 %
Percent 46.7 13.6 17.8 19.5 2.4 100 %
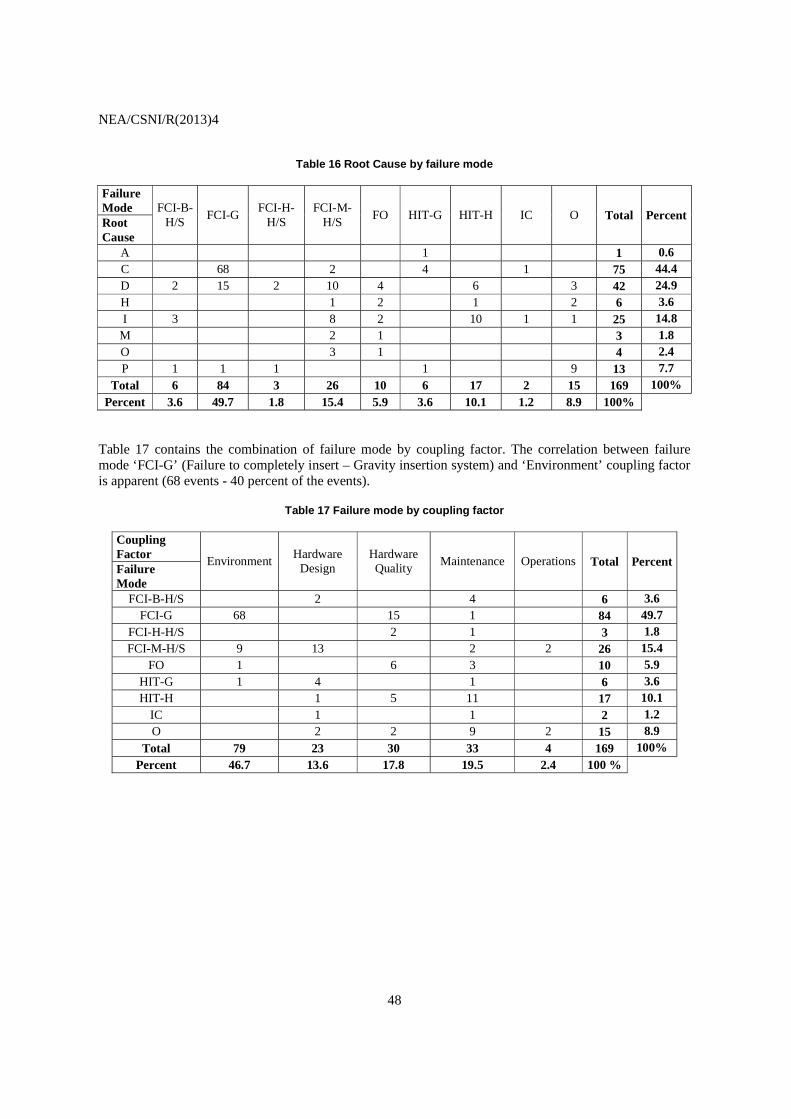
Table 16 contains the breakdown of CRDA events by root cause and failure mode. The definitions of the symbols are given in sections 3.2 and 3.3. The root cause ‘C’ (state of other component) in combination with the ‘FCI-G’ (Failure to completely insert – Gravity insertion system) failure mode shows a strong correlation (68 events - 40 percent of the events). Again, many of the events with root cause ‘C’ involve deformations of fuel assemblies. The correlation in the data suggests that these failures are primarily observed in gravity insertion systems.
NEA/CSNI/R(2013)4
48
Table 16 Root Cause by failure mode
Failure Mode FCI-B-
H/S FCI-G
FCI-H-H/S
FCI-M-H/S
FO HIT-G HIT-H IC O Total Percent Root Cause
A 1 1 0.6 C 68 2 4 1 75 44.4 D 2 15 2 10 4 6 3 42 24.9 H 1 2 1 2 6 3.6 I 3 8 2 10 1 1 25 14.8
M 2 1 3 1.8 O 3 1 4 2.4 P 1 1 1 1 9 13 7.7
Total 6 84 3 26 10 6 17 2 15 169 100% Percent 3.6 49.7 1.8 15.4 5.9 3.6 10.1 1.2 8.9 100%
Table 17 contains the combination of failure mode by coupling factor. The correlation between failure mode ‘FCI-G’ (Failure to completely insert – Gravity insertion system) and ‘Environment’ coupling factor is apparent (68 events - 40 percent of the events).
Table 17 Failure mode by coupling factor
Coupling Factor
Environment Hardware
Design Hardware Quality
Maintenance Operations Total Percent Failure Mode
FCI-B-H/S 2 4 6 3.6 FCI-G 68 15 1 84 49.7
FCI-H-H/S 2 1 3 1.8 FCI-M-H/S 9 13 2 2 26 15.4
FO 1 6 3 10 5.9 HIT-G 1 4 1 6 3.6 HIT-H 1 5 11 17 10.1
IC 1 1 2 1.2 O 2 2 9 2 15 8.9
Total 79 23 30 33 4 169 100% Percent 46.7 13.6 17.8 19.5 2.4 100 %
NEA/CSNI/R(2013)4
49
4 ENGINEERING ASPECTS OF THE COLLECTED EVENTS
This section contains an engineering review of the CRDA events.
4.1 Assessment Basis
In the following sections, the 169 events are analysed with respect to failure symptoms and failure causes. Appropriate failure symptom categories and failure cause categories are derived from the event descriptions. Engineering judgement is applied to bin the events by failure symptom and failure cause categories. For the identification of failure causes, root causes are combined with coupling factors, because by definition it is the coupling factor that identifies the mechanism that ties multiple failures together and influences the conditions for multiple components to be affected. The root cause does not provide by itself the information required for identifying common-cause failure categories.
Finally, the mapping of failure symptom categories onto failure cause categories is shown by the assessment matrix ‘Relationship of Failure Symptoms and Failure Cause Categories’ (Table 18). This matrix provides the basis for deriving insights and conclusions.
4.2 Failure Symptoms
Failure categories are derived from the event descriptions. The following failure symptom categories were identified as being important to the analysis:
CRDA-FS1 –
CRDA-FS2 –
CRDA-FS3 –
CRDA-FS4–
Degraded / disabled / misadjusted control systems
Moveability problems due to deformation of core internals / fuel assemblies
Degraded / disabled components
Other
These categories are not strictly independent. The assignment of one event to a category is based on the judgment of the engineer.
4.3 Failure Cause Categories
Two principal categories of failure causes are introduced: deficiencies in operation and deficiencies in design, construction and manufacturing. The deficiencies in operations comprise all ICDE events that involve human errors:
O1 – Deficient procedures for maintenance and/or testing
O2 – Insufficient attention to aging of piece parts
NEA/CSNI/R(2013)4
50
O3 – Operator performance error during maintenance/test activities
The deficiencies in design, construction, and manufacturing comprise hardware design:
D – Deficiency in design of hardware
C/M – Deficiency in construction or manufacturing of hardware
D-MOD – Deficient design modifications
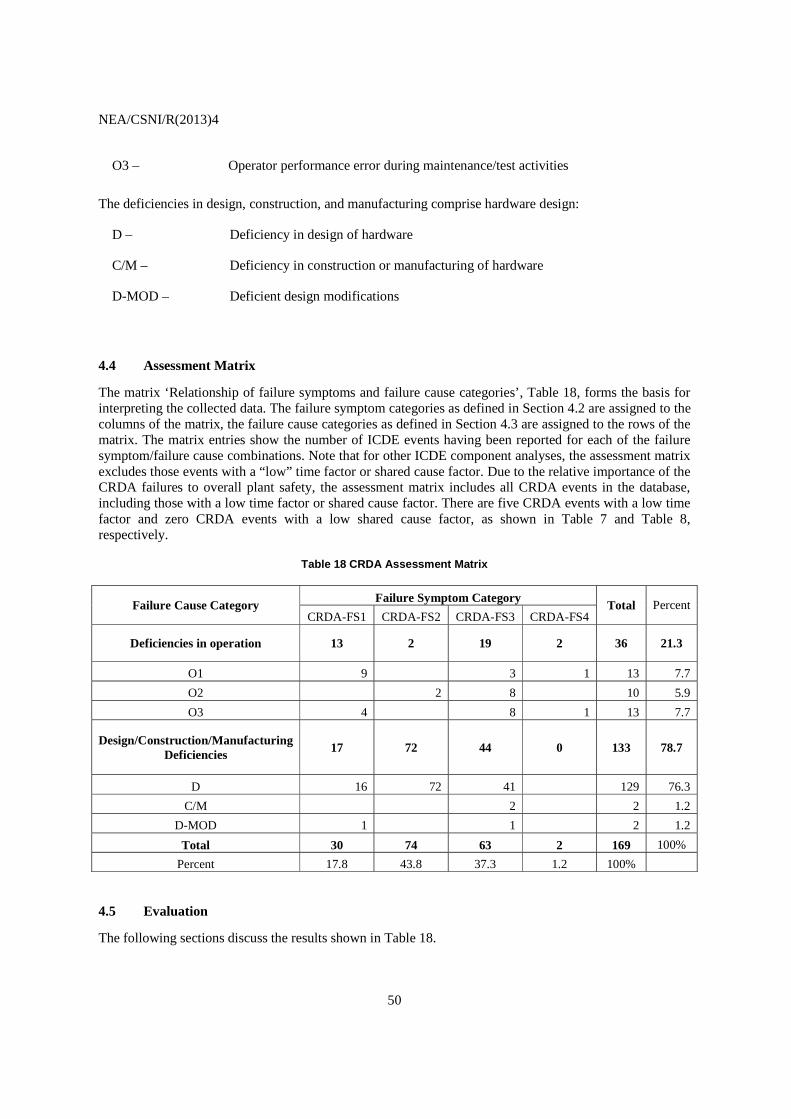
4.4 Assessment Matrix
The matrix ‘Relationship of failure symptoms and failure cause categories’, Table 18, forms the basis for interpreting the collected data. The failure symptom categories as defined in Section 4.2 are assigned to the columns of the matrix, the failure cause categories as defined in Section 4.3 are assigned to the rows of the matrix. The matrix entries show the number of ICDE events having been reported for each of the failure symptom/failure cause combinations. Note that for other ICDE component analyses, the assessment matrix excludes those events with a “low” time factor or shared cause factor. Due to the relative importance of the CRDA failures to overall plant safety, the assessment matrix includes all CRDA events in the database, including those with a low time factor or shared cause factor. There are five CRDA events with a low time factor and zero CRDA events with a low shared cause factor, as shown in Table 7 and Table 8, respectively.
Table 18 CRDA Assessment Matrix
Failure Cause Category Failure Symptom Category
Total Percent CRDA-FS1 CRDA-FS2 CRDA-FS3 CRDA-FS4
Deficiencies in operation 13 2 19 2 36 21.3
O1 9
3 1 13 7.7
O2 2 8 10 5.9
O3 4 8 1 13 7.7
Design/Construction/Manufacturing Deficiencies
17 72 44 0 133 78.7
D 16 72 41
129 76.3
C/M
2
2 1.2
D-MOD 1 1 2 1.2
Total 30 74 63 2 169 100%
Percent 17.8 43.8 37.3 1.2 100%
4.5 Evaluation
The following sections discuss the results shown in Table 18.
NEA/CSNI/R(2013)4
51
4.5.1 Failure Cause Categories
Deficiencies in operation are the cause of 21 percent of the common-cause failures, with nearly equal shares due to the three cause categories related to human performance: O1, ‘Deficient procedures for maintenance and/or testing’, O2, ‘Insufficient attention to aging of piece parts’ and O3, ‘Operator performance error during maintenance/ test activities’.
About 79 percent of failure causes are ‘Design, construction, manufacturing deficiencies’, mainly due to category D, ‘Deficiency in design of hardware’. In general, this category concerns deficiencies in the design of the fuel assemblies of the core.
4.5.2 Failure Symptom Categories
The failure events are distributed amongst the failure symptom categories as:
CRDA-FS1 – 18 percent of events have the failure symptom: ‘Degraded / disabled / misadjusted control systems’. The major part of the problems is caused by deficiencies in hardware design of the CRDA. The remaining ones are caused by operator performance error during maintenance/ test activities.
CRDA-FS2 – ‘Moveability problems due to deformation of core internals / fuel assemblies’ is the dominant failure symptom category, accounting for 44 percent of the events. Most of the moveability problems are caused by ‘deficiency in design of hardware’. In most cases the design deficiency involves deformation of the core and fuel assemblies.
CRDA-FS3 –
CRDA-FS4 –
Approximately 37 percent of events have the failure symptom: ‘Degraded / disabled components’. The highest contributions come from ‘Deficiency in design of hardware’.
1.2 percent of the events involve the failure symptom category: ‘Other’. The failure symptom aspects of these events involved confusion by the operators and failure to correctly confirm the control rod positions. Both of these events were caused by ‘deficiencies in operation’.
4.5.3 Human Error Involvement
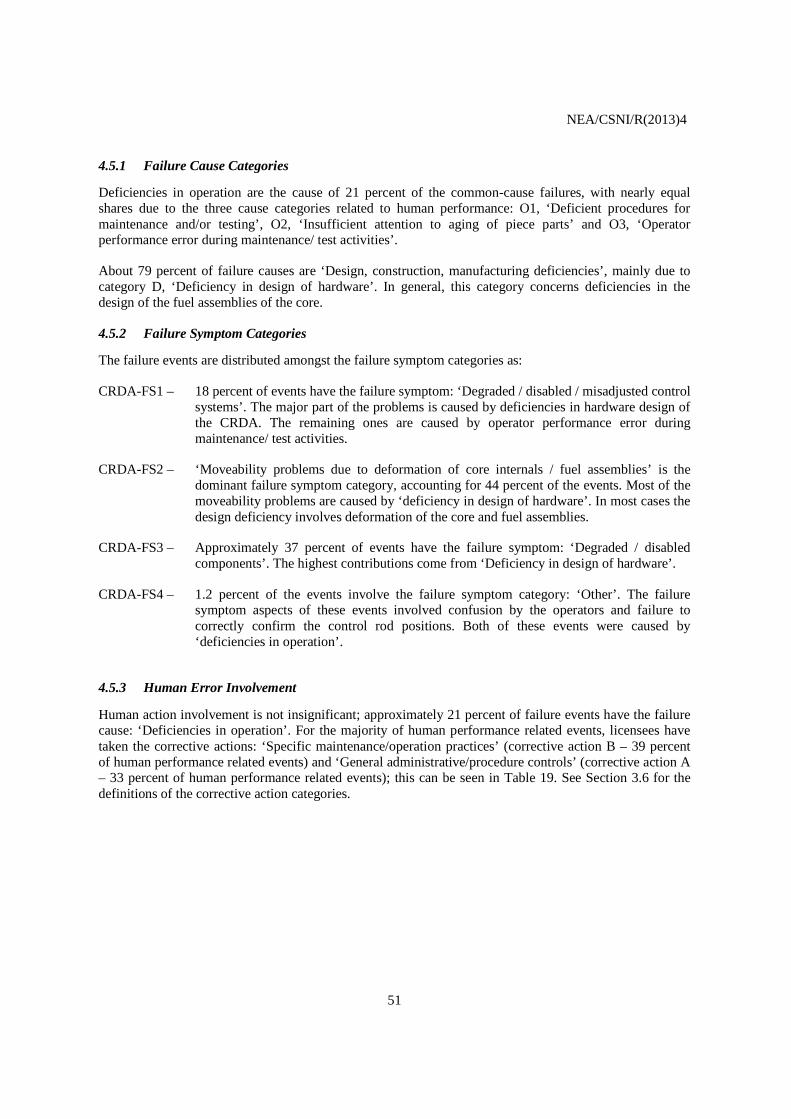
Human action involvement is not insignificant; approximately 21 percent of failure events have the failure cause: ‘Deficiencies in operation’. For the majority of human performance related events, licensees have taken the corrective actions: ‘Specific maintenance/operation practices’ (corrective action B – 39 percent of human performance related events) and ‘General administrative/procedure controls’ (corrective action A – 33 percent of human performance related events); this can be seen in Table 19. See Section 3.6 for the definitions of the corrective action categories.
NEA/CSNI/R(2013)4
52
Table 19 Failure cause categories by Corrective actions
Failure Cause Category Corrective Actions
Total A B C D E F G O
Deficiencies in Operation
12 14 1 1 1 2 5 0 36
O1 9 3
1 13
O2
8
1 1 10
O3 3 3 1
2 4 13
Design/Construction/ Manufacturing
Deficiencies 4 9 97 7 1 0 10 5 133
D 4 8 96 6 1
10 4 129 C/M
1
1 2
D-MOD
1 1 2
Total 16 23 98 8 2 2 15 5 169 Percent 9.5 13.6 58.0 4.7 1.2 1.2 8.9 3.0 100%
The data appears to suggest that most of the human performance related events are addressed by the licensees making changes to their practices and procedures.
4.5.4 Technical Fault Aspects
From Table 18, we can see that in 44 percent of the failure events, ‘Moveability problems due to deformation of core internals / fuel assemblies’ (CRDA-FS2) have been observed; most of these are caused by ‘Deficiency in design of hardware’ (D). Generally, the component which caused the failure is the core or fuel assemblies (deformation due to irradiation, thermal, mechanical and hydraulic loading, and their mutual interaction).
In 37 percent of the failure events the failure symptom category was ‘Degraded / disabled components’ (CRDA-FS3). The main failure cause of this is ‘Deficiency in design of hardware’ (D).
In 18 percent of the failure events, ‘Degraded / disabled / misadjusted control systems’ (CRDA-FS1) was the failure symptom category. ‘Deficiency in design of hardware’ (D) was the dominant failure cause in this failure symptom category. Many of these events involved motor-driven screw systems that failed when the drive exceeded the high torque trip set point. These issues were corrected with design modifications.
Approximately 5 percent of the failure events involve the failure symptom category ‘Degraded / disabled / misadjusted control systems’ (CRDA-FS1) and are caused by ‘Deficient procedures for maintenance and/or testing’ (O1). Most of these events involved improper handling of hydraulic control systems during routine tests and inspections that resulted in control rods drifting out of the core. These issues were corrected by making changes to work procedures.
4.5.5 Complete CCFs
A ‘complete CCF event’ is defined as a dependent failure of all components of an exposed population where the fault state of each of its components is ‘complete failure to perform its function’ and where these fault states exist simultaneously and are the direct result of a shared cause [1].
NEA/CSNI/R(2013)4
53
The analysis of the 169 events of the database reveals that there are two complete CCF events for CRDAs. These events did not affect the scram function of the CRDAs, but they affected other CRDA safety functions. For these events the exposed populations associated with these safety functions were only a portion of the total observed populations of CRDAs for the respective plants. However, the entire exposed population associated with the safety function was completely failed. One of these events involved a backup insertion system containing 29 CRDAs. The total observed population at the plant is 57 CRDAs. All 29 CRDAs associated with the backup insertion function were failed in the event. The other complete CCF event involved 4 CRDAs that were exposed to a CCF mechanism due to a procedure inadequacy. The total observed population for this plant is 48 CRDAs. The event involved a procedure to position 4 CRDAs. All 4 CRDAs were in the wrong position and considered completely failed. There are 4 events in the ICDE database in which the entire observed populations of CRDAs at the plants were affected by the CCF mechanism. However, these events did not involve complete failures of all CRDAs. For 3 of these events, all the CRDAs experienced incipient failures. For the fourth event, only 1 CRDA failed completely, and the remaining CRDAs experienced incipient failures.

NEA/CSNI/R(2013)4
54
NEA/CSNI/R(2013)4
55
5 SUMMARY AND CONCLUSIONS
Organizations from Canada, Finland, France, Germany, Spain, Sweden, United Kingdom and the United States contributed CCF data of Control Rod Drive Assemblies to this data exchange. 169 ICDE events were reported from Nuclear Power Plants in these countries.
These reported ICDE events were reviewed in Sections 3 and 4 of this report with respect to degree of failure, failure causes, failure symptoms and failure mechanism. Two complete CCF events were recorded.
The most frequently occurring failure mode of control rod drive assemblies was ‘Failure to completely insert for gravity insertion systems (FCI-G)’ with 50 percent of the events.
One failure symptom category was identified as dominant in the data: ‘Moveability problems due to deformation of core internals / fuel assemblies’. Most of the moveability problems are caused by ‘deficiency in design of hardware’, and these design deficiencies involve deformations of the core and fuel assemblies.
Deficiencies in operation contributed to 21 percent of the failure causes. Each of the failure cause categories ‘Deficient procedures for maintenance and/or testing’ (13 events), ‘Insufficient attention to aging of piece parts’ (10 events) and ‘Operator performance error during maintenance/test activities’ (13 events) has a significant contribution to the total deficiencies in operation.
Design, construction and manufacturing deficiencies contributed to 79 percent of the failures causes, mainly due to failure cause category ‘Deficiency in design of hardware’. Most of these failures were caused by core or fuel assembly deformations due to irradiation, thermal, mechanical and hydraulic loading, and their mutual interaction.
Design modification related corrective actions have been taken by the utilities in consequence of 58 percent of the ICDE events; this is in correlation with the large number of failures which are caused by design deficiencies in either the CRDA or other components that affect the operation of the CRDA.
One additional conclusion is that some CCF events may be qualified as ‘generic’ for a specific plant series or CRDA design. That is, the same CCF mechanism has been observed in events occurring at plants with similar CRDA designs. Two examples of this are revealed in the database:
1) Many of the events coded with root cause category C ‘State of other components’ involve CRDAs that failed to completely insert due to fuel assemblies that may have deformed due to creep induced by irradiation, thermal, mechanical and hydraulic loading, and their mutual interaction. There are 69 events in the database that match this description. These events occurred at a series of similar plants.
2) A number of events in the database involve degradation of a sub-component found in hydraulic-driven CRDA designs. Degradation of the seating material used in some SCRAM solenoid pilot valves has been found to slow the actuation of the valves and ultimately result
NEA/CSNI/R(2013)4
56
in high rod insertion times. This failure mechanism appears in 26 ICDE events. The events occurred at plants with similar CRDA designs during the 1980s and early 1990s.
These problems have been addressed by licensees by communicating operating experience and/or in using a generic modification of the CRDAs or other components. These events highlight the importance of having a reliable design for the CRDA component, its sub-components, and those components that interface or interact with the CRDAs. These events also demonstrate that CCF phenomena can appear across a series of plants with similar CRDA designs. Communication of operating experience with CCF phenomena is important to ensure that plants can implement the appropriate defences and controls to prevent significant impacts on plant safety.
NEA/CSNI/R(2013)4
57
REFERENCES
1. International Common-Cause Failure Data Exchange ICDE General Coding Guidelines ICDE CG00, CSNI Tech Note publication NEA/CSNI/R(2004)4. Rev. 2, October 2005.
2. Coding Guidelines for Reactor Protection System: Control Rod Drive Assemblies ICDE CG09

NEA/CSNI/R(2013)4
58
NEA/CSNI/R(2013)4
59
APPENDIX A – OVERVIEW OF THE ICDE PROJECT
Appendix A contains information regarding the ICDE project.
A.1 Background
Common-cause failure (CCF) events can significantly impact the availability of safety systems of nuclear power plants. In recognition of this, CCF data are systematically being collected and analyzed in several countries. A serious obstacle to the use of national qualitative and quantitative data collections by other countries is that the criteria and interpretations applied in the collection and analysis of events and data differ among the various countries. A further impediment is that descriptions of reported events and their root causes and coupling factors, which are important to the assessment of the events, are usually written in the native language of the countries where the events were observed.
To overcome these obstacles, the preparation for the international common-cause data exchange (ICDE) project was initiated in August of 1994. Since April 1998 the OECD/NEA has formally operated the project, following which the Project was successfully operated over five consecutive terms from 1998 to 2011. The current phase started in 2011 and is due to run until 2014. Member countries under the current Agreement of OECD/NEA and the organizations representing them in the project are: Canada (CNSC), Finland (STUK), France (IRSN), Germany (GRS), Japan (NUPEC), Korea (KAERI), Spain (CSN), Sweden (SKI), Switzerland (HSK), United Kingdom (NII), and United States (NRC).
More information about the ICDE project can be found at OECD/NEA´s web site: http://www.nea.fr/html/jointproj/icde.html. Additional information can also be found at the web site http://www.eskonsult.se/ICDE/.
A.2 Scope of the ICDE Project
The ICDE Project aims to include all possible events of interest, comprising complete, partial, and incipient CCF events, called ‘ICDE events’ in this report. The project covers the key components of the main safety systems, including centrifugal pumps, diesel generators, motor operated valves, power operated relief valves, safety relief valves, check valves, batteries, reactor protection system (RPS), circuit breakers and level measurement.
A.3 Data Collection Status
Data are collected in an MS.NET based database implemented and maintained at ES-Konsult, Sweden, the appointed ICDE Operating Agent. The database is regularly updated. It is operated by the Operating Agent following the decisions of the ICDE Steering Group.
NEA/CSNI/R(2013)4
60
A.4 ICDE Coding Format and Coding Guidelines
Data collection guidelines have been developed during the project and are continually revised. They describe the methods and documentation requirements necessary for the development of the ICDE databases and reports. The format for data collection is described in the general coding guidelines and in the component specific guidelines. Component specific guidelines are developed for all analysed component types as the ICDE plans evolve [2].
A.5 Protection of Proprietary Rights
Procedures for protecting confidential information have been developed and are documented in the Terms and Conditions of the ICDE project. The co-ordinators in the participating countries are responsible for maintaining proprietary rights. The data collected in the database are password protected and are only available to ICDE participants who have provided data.
NEA/CSNI/R(2013)4
61
APPENDIX B – DEFINITION OF COMMON-CAUSE EVENTS
In the modelling of common-cause failures in systems consisting of several redundant components, two kinds of events are distinguished:
• Unavailability of a specific set of components of the system, due to a common dependency, for example on a support function. If such dependencies are known, they can be explicitly modelled in a PSA.
• Unavailability of a specific set of components of the system due to shared causes that are not explicitly represented in the system logic model. Such events are also called ‘residual’ CCFs. They are incorporated in PSA analyses by parametric models.
There is no rigid borderline between the two types of CCF events. There are examples in the PSA literature of CCF events that are explicitly modelled in one PSA and are treated as residual CCF events in other PSAs (for example, CCF of auxiliary feed water pumps due to steam binding, resulting from leaking check valves).
Several definitions of CCF events can be found in the literature, for example, in NUREG/CR-6268, Revision 1 ‘Common-Cause Failure Data Collection and Analysis System: Event Data Collection, Classification, and Coding:’
Common-Cause Failure Event: A dependent failure in which two or more component fault states exist simultaneously, or within a short time interval, and are a direct result of a shared cause.
A CCF event consists of component failures that meet four criteria: (1) two or more individual components fail, are degraded (including failures during demand or in-service testing), or have deficiencies that would result in component failures if a demand signal had been received, (2) components fail within a selected period of time such that success of the probabilistic risk assessment (PRA) mission would be uncertain, (3) components fail because of a single shared cause and coupling mechanism, and (4) components fail within the established component boundary.
In the context of the data collection part of the ICDE project, focus will be on CCF events with total as well as partial component failures that exist over a relevant time interval1. To aid in this effort the following attributes are chosen for the component fault states, also called impairments or degradations:
• Complete failure of the component to perform its function
• Degraded ability of the component to perform its function
• Incipient failure of the component
1 Relevant time interval: two pertinent inspection periods (for the particular impairment) or, if unknown, a scheduled outage period.
NEA/CSNI/R(2013)4
62
• Default: component is working according to specification
Complete CCF events are of particular interest. A ‘complete CCF event’ is defined as a dependent failure of all components of an exposed population where the fault state of each of its components is ‘complete failure to perform its function’ and where these fault states exist simultaneously and are the direct result of a shared cause. Thus, in the ICDE project, we are interested in collecting complete CCF events as well as partial CCF events. The ICDE data analysts may add interesting events that fall outside the ICDE event definition but are examples of recurrent - eventually non random - failures.
With growing understanding of CCF events, the relative share of events that can only be modelled as ‘residual’ CCF events is expected to decrease.
NEA/CSNI/R(2013)4
63
APPENDIX C – SUMMARY OF CONTROL ROD DRIVE ASSEMBLY CODING GUIDELINES
C.1 Coding Rules and Exceptions for Control Rod Drive Assemblies
The following summarize the coding rules and exceptions for the CRDAs:
1. In general, the definition of the ICDE event given in section 2 of the General ICDE Coding Guidelines Revision 4 applies.
2. Plant state at the event detection should be described in event description because it can have a substantial bearing for the significance of the failure in scram systems. The failure cases observed in post-maintenance tests in overhaul outage or in subsequent start-up tests may not be relevant for the power operation state.
3. All actual failures will be included (in either ICDE or independent event coding), even if the event report considers them to be ‘invalid’.
4. Some reports discuss only one actual failure, and do not consider that the same cause will affect other CRDAs, but the licensee replaces the failed equipment on all CRDAs concerned as a precautionary measure. This type of event will be coded as an ICDE event, with an incipient failure value for the components that did not actually fail.
5. The length of the impairment vector could be equal to the size of the exposed population; however, in view of the high number of CRDAs, only the information on the impairment status of each failed component should be coded using the usual ICDE codes (C, D, and I).
6. Administrative in-operability that does not cause the control rods to fail to function will not be included as failures. An example is a surveillance test not performed within the required time frame.
7. In-operability due to human error or erroneous calibration/set up will be included (in either ICDE or independent event coding).
8. In-operability due to seismic criteria violations will not be included.
C.2 Functional Failure Modes
C.2.1 Gravity Insertion Systems (PWR, Magnox and AGR)
Failure of the system to fulfil its safety mission involves non-insertion or delayed insertion of one control rod cluster/rod into the reactor core. The two failure modes considered are:
• Failure to completely insert (FCI-G)
• High (large) control rod cluster/rod insertion time exceeding Technical Specifications (HIT-G)
NEA/CSNI/R(2013)4
64
For gravity insertion systems the data can be collected for the main components, using the specifications of components, component types and corresponding failure modes as summarized in the following table:
Table C-1 PWR components and failure modes
System Part Component Component type Failures Modes
CRDA (Gravity)
ROD: Absorbent Rod General (all designs) FCI-G, HIT-G
CRC: Control Rod Cluster General (PWR) FCI-G, HIT-G
CRD: Control Rod Drive General (all designs) FCI-G, HIT-G
C.2.2 Non-Gravity Insertion Systems (BWR)
The considered failure modes for the CRDAs of BWR are the same two as those described for gravity insertion systems (FCI and HIT). In particular, for BWRs with dual-function drives the failure modes related to insertion are decomposed as following:
• Failure of the hydraulic insertion function (FCI-H, HIT-H),
• Failure of the electromechanical insertion function (FCI-M, HIT-M),
• Failure of both insertion functions (FCI -B, HIT-B)
The data can be collected separately for the rod component (ROD) and drive component (CRD), or optionally the CRDA (ROD+CRD) can be handled as one functional component (a usual practice in PSA modelling). In the latter option the event description should tell the failure location for qualitative analysis aims.
The data collection for BWRs can be extended to comprehensively cover the hydraulic part of the scram system, i.e. hydraulic driving force supply. In this part the data can be collected for the main components, using the specifications of components, component types and corresponding failure modes as summarized in the following table B-1.
• Failure modes for the valves are:
• FO Failure to open
• FC Failure to close
• IC Inadvertent closure
Due to the differences in the configuration and internal redundancy of hydraulic scram system the consequences of component failures and multiple failures may need to be specifically described with respect to rod insertion function. Depending on the case this information can be provided in the separate system description notebook, in OP definition field G1 or in event interpretation field C7.
In the case of a design such as Nordic BWR where the hydraulic scram system is a separate system (HSS) constituted of redundant, largely independent trains, the data can be collected in train-wise manner, i.e. a HSS train can be considered as one functional component (a usual practice in PSA modelling). The functional failure mode applicable to HSS train is ‘failure to supply hydraulic driving force’. This practice is recommended because not many CCF events have affected the HSS in Nordic BWRs. The closer
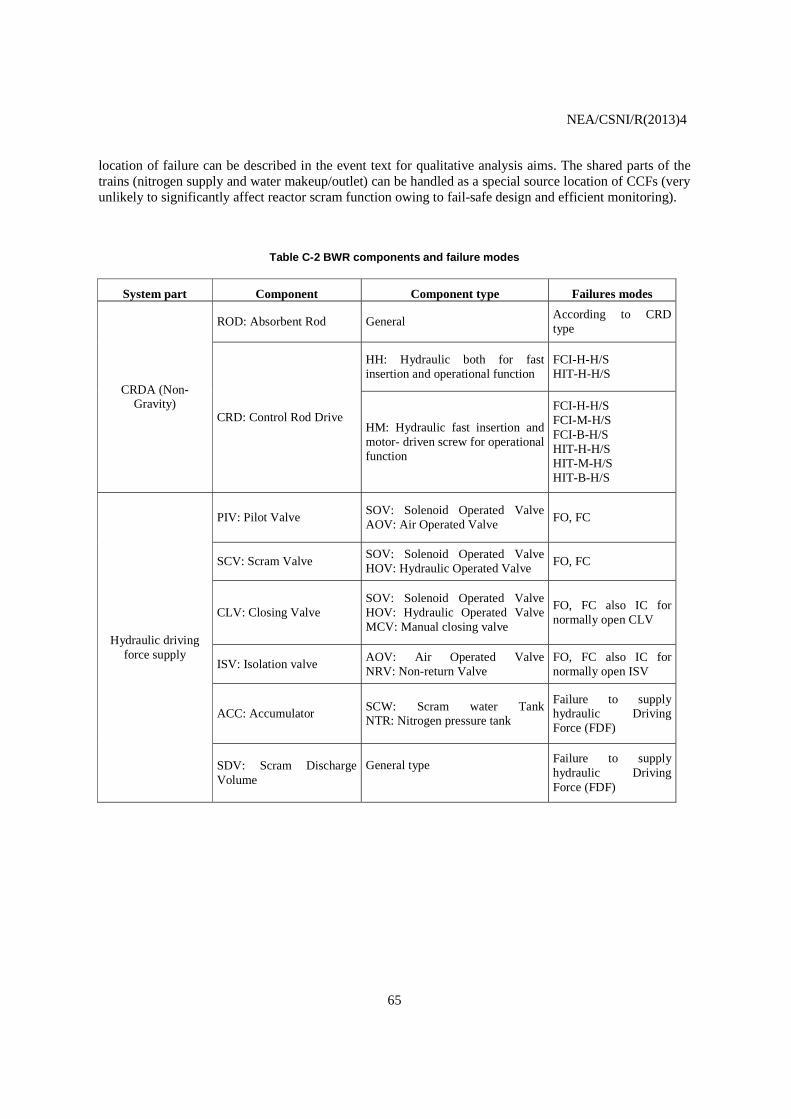
NEA/CSNI/R(2013)4
65
location of failure can be described in the event text for qualitative analysis aims. The shared parts of the trains (nitrogen supply and water makeup/outlet) can be handled as a special source location of CCFs (very unlikely to significantly affect reactor scram function owing to fail-safe design and efficient monitoring).
Table C-2 BWR components and failure modes
System part Component Component type Failures modes
CRDA (Non-Gravity)
ROD: Absorbent Rod General According to CRD type
CRD: Control Rod Drive
HH: Hydraulic both for fast insertion and operational function
FCI-H-H/S HIT-H-H/S
HM: Hydraulic fast insertion and motor- driven screw for operational function
FCI-H-H/S FCI-M-H/S FCI-B-H/S HIT-H-H/S HIT-M-H/S HIT-B-H/S
Hydraulic driving force supply
PIV: Pilot Valve SOV: Solenoid Operated Valve AOV: Air Operated Valve
FO, FC
SCV: Scram Valve SOV: Solenoid Operated Valve HOV: Hydraulic Operated Valve
FO, FC
CLV: Closing Valve SOV: Solenoid Operated Valve HOV: Hydraulic Operated Valve MCV: Manual closing valve
FO, FC also IC for normally open CLV
ISV: Isolation valve AOV: Air Operated Valve NRV: Non-return Valve
FO, FC also IC for normally open ISV
ACC: Accumulator SCW: Scram water Tank NTR: Nitrogen pressure tank
Failure to supply hydraulic Driving Force (FDF)
SDV: Scram Discharge Volume
General type Failure to supply
hydraulic Driving Force (FDF)