tu1864 gastroesophageal reflux disease and overall and cause-specific mortality -a prospective study...
TRANSCRIPT
Middle East Journal of Digestive Diseases/ Vol.6/ No.2/ April 2014
Gastroesophageal Reflux Disease and overall and Cause-specific Mortality: A Prospective Study of 50000 Individuals
ABSTRACT
BACKGROUND
Only a few studies in Western countries have investigated the association between gastroesophageal reflux disease (GERD) and mortality at the general population level and they have shown mixed results. This study investigated the association between GERD symptoms and overall and cause-specific mor-tality in a large prospective population-based study in Golestan Province, Iran.
METHODS
Baseline data on frequency, onset time, and patient-perceived severity of GERD symptoms were available for 50001 participants in the Golestan Cohort Study (GCS). We identified 3107 deaths (including 1146 circulatory and 470 cancer-related) with an average follow-up of 6.4 years and calculated hazard ratios (HR) and 95% confidence intervals (CI) adjusted for multiple potential confounders.
RESULTS
Severe daily symptoms (defined as symptoms interfering with daily work or causing nighttime awakenings on a daily bases, reported by 4.3% of partici-pants) were associated with cancer mortality (HR 1.48, 95% CI: 1.04-2.05). This increase was too small to noticeably affect overall mortality. Mortality was not associated with onset time or frequency of GERD and was not in-creased with mild to moderate symptoms.
CONCLUSION
We have observed an association with GERD and increased cancer mortal-ity in a small group of individuals that had severe symptoms. Most patients with mild to moderate GERD can be re-assured that their symptoms are not associated with increased mortality.
KEYWORDS Cardiovascular disease; Esophageal cancer; Gastroesophageal reflux disease; Mortality
1. Institute for Transitional Epidemiology and the Tisch Cancer Institute, Mount Sinai School of Medicine, New York, United States
2. Digestive Oncology Research Center, Digestive Disease Research Institute, Tehran University of Medical Sciences, Tehran, Iran
3. International Agency for Research on Cancer, Lyon, France
4. Golestan Research Center of Gastroen-terology and Hepatology, Golestan Uni-versity of Medical Sciences, Gorgan, Iran
5. Division of Cancer Epidemiology and Genetics, National Cancer Institute, National Institutes of Health, Bethesda, United States
6. Departments of Oncology and Public Health and Primary Care, University of Cambridge, Cambridge, United Kingdom
7. Department of Public Health Analy-sis, School of Community Health and Policy, Morgan State University, Balti-more, United States
Farhad Islami1,2, Akram Pourshams2*, Siavosh Nasseri-Moghaddam2, Hooman Khademi2,3, Hossein Poutschi2, Masoud Khoshnia4, Alireza Norouzi4, Taghi Amiriani4, Amir Ali Sohrabpour2, Ali Aliasgari2, Elham Jafari2,
Shahryar Semnani4, Christian C. Abnet5, Paul D. Pharaoh6, Paul Brennan3, Farin Kamangar7,2, Sanford M. Dawsey5, Paolo Boffetta1, Reza Malekzadeh2
INTRODUCTION
Gastroesophageal reflux disease (GERD) symptoms, including heartburn and regurgitation, are among the most common gastrointes-tinal (GI) symptoms in Europe and the United States, with prevalence
65
* Corresponding Author:Akram Pourshams, MD, MPH Digestive Oncology Research Center, Digestive Disease Research Institute, Shariati Hospital, Tehran University of Medical Science, 14117 Tehran, IranTel: + 98 21 82415140 Fax:+ 98 21 8241 5400 Email: [email protected] Received: 02 Feb. 2014Accepted: 23 Mar. 2014
Please cite this paper as:Islami F, Pourshams A, Nasseri-Moghaddam S, Khademi H, Poutschi H, Khoshnia M, Norouzi AR, Amiriani T, Sohrabpour AA, Aliasgari A, Jafari E, Semnani S, Abnet CC, Pharaoh PD, Brennan P, Kamangar F, Dawsey SM, Boffetta P, Malekzadeh R. Gastro-esophageal Reflux Disease and Overall and Cause-specific Mortality: A Prospective Study of 50000 Individuals. Middle East J Dig Dis 2014;6:65-80.
Original Article

Middle East Journal of Digestive Diseases/ Vol.6/ No.2/ April 2014
rates of 10%–25% in population-based studies.1-5 In 2009, GERD was the most common physician diagnosis for GI disorders in outpatient clinic visits in the United States and responsible for 8.9 million physician visits.6 Reports from many other popula-tions have shown a high prevalence of GERD or an increase in the prevalence in recent years.7-11 Some of those with GERD symptoms may develop Barrett’s esophagus, which can lead to esophageal adenocarcinoma (EAC); however, a recent multi-center follow-up study of individuals with Barrett’s esophagus have shown that the risk of this transfor-mation is small (<0.5% per year).12
Only a few prospective studies have investi-gated the association between GERD and mortal-ity in the general population and they have shown mixed results. A study from the United Kingdom (UK) showed a slight (1.16-fold) increase in mor-tality associated with GERD in individuals without esophagitis or Barrett’s esophagus, and only part of this association was attributed to esophageal can-cer (EC).13 Another study from the UK reported an increase in mortality only in the year following the diagnosis of GERD.14 In a third study from UK, there was a significant increase in mortality among omeprazole users in the first year, but the rates fell to or below population estimated rates by the fourth year. When only those with hiatal hernia or GERD were considered, there was no association.15 Final-ly, a study from the United States showed no as-sociation between daily GERD symptoms and mor-tality, and there were inverse associations between weekly and less than weekly symptoms and mortal-ity.16 There has been no published population-based study from non-Western countries on the associa-tion between GERD and overall mortality.
The prevalence of GERD in population-based studies from Iran, a middle-income country in West Asia, is high and comparable to those in Western countries.17,18 GERD is reported as the most com-mon outpatient diagnosis in Iran19 where the inci-dence of the disease seems to be increasing.20 We aim to investigate the association of baseline data on frequency, the time of the first episode, and pa-tient-perceived severity of GERD symptoms with
overall and cause-specific mortality in the Golestan Cohort Study (GCS), a prospective cohort study of over 50000 residents of Golestan Province in northeastern Iran. As the majority of the studies on GERD symptoms and EC are hospital-based stud-ies, the results of this study can provide additional information about this association at the general population level, with lower risk of bias related to selection of participants in hospital-based studies. EC has a very poor prognosis in this population,21 so EC mortality is a good surrogate for the inci-dence of this cancer in Golestan. Also, results of this study can provide information about whether or not GERD symptoms are associated with causes of death other than EC, and if the symptoms are noticeably associated with overall mortality at the population level.
MATERIALS AND METHODSStudy population
The design of the GCS has been described else-where.22 Briefly, the GCS is a prospective popula-tion-based cohort of 40–75 year old individuals, pri-marily designed to investigate risk factors of upper GI cancers in eastern parts of Golestan Province. The primary goal was to recruit 50000 healthy individu-als, with equal numbers of men and women, 20% from urban areas and 80% of Turkmen ethnicity. Urban inhabitants in the specified age range were selected randomly from Gonbad, the main urban area in eastern Golestan by systematic clustering based on the household number. In rural areas, all residents of 326 villages in the study catchment area in the specified age range were invited to par-ticipate. A total of 50045 adults with no history of upper GI cancers were enrolled between 2004 and 2008. The participation rate was about 70% for women and 50% for men in urban areas and 84% for women and 70% for men in rural areas.
The study protocol conforms to the ethical guidelines of the 1975 Declaration of Helsinki (6th revision, 2008). The conduct of GCS was approved by the Institutional Review Boards of the Digestive Disease Research Institue of Tehran University of Medical Sciences, the US National Cancer Insti-
66 GERD and Mortality

Middle East Journal of Digestive Diseases/ Vol.6/ No.2/ April 2014
67Islami et al.
tute, and the International Agency for Research on Cancer.
Exposure measurement At baseline, trained nurses and physicians con-
ducted face-to-face interviews using structured questionnaires to collect data on a large number of variables. Weight and height were measured by trained research staff. Body mass index (BMI) was calculated by dividing weight (kg) by the squared value of height (m).
Only trained physicians collected data on GERD and past medical history (including history of hy-pertension, diabetes mellitus, and heart disease) and measured blood pressure. They asked the study participants about the history of regurgitation and heartburn. Those with either symptom were con-sidered as having GERD. The frequency of GERD symptoms was recorded as never; occasional or only associated with certain foods or drinks; 1–3 times/month; once a week; 2–6 times/week; or dai-ly. We re-categorized the frequency for this analy-sis as never, <weekly, weekly (combination of 2–6 times/week and once a week), and daily. The first episode of GERD was recorded as within the last year, 1–5 years, 6–10 years, or >10 years before the interview. We also asked about the severity of symptoms, which were categorized as: “mild”, the study participant did not feel the symptoms unless actively paid attention to; “moderate”, the study participant felt the symptoms without active atten-tion but they did not interfere with daily work or nighttime sleep; or “severe”, symptoms interfering with daily work or causing nighttime awakenings.
The frequency and severity of GERD symptoms were asked separately for the past year and for one year prior to the interview. As the reported frequen-cies and severities for these two periods were simi-lar (Supplementary Table 1) and we had another variable on the starting time of the symptoms, we combined the data and considered the most frequent and the most severe GERD symptoms in either of the two periods as the usual frequency and severity of symptoms, respectively, in that participant.
Systolic and diastolic blood pressures were ob-
tained twice from each arm in the sitting position. Participants were considered to be hypertensive if they used anti-hypertensive medication or fulfilled standard criteria (average systolic blood pressure ≥140 mm Hg or average diastolic blood pressure above ≥90 mm Hg).23 Diabetes mellitus was self-reported based on the following question ‘Have you ever been diagnosed by a doctor as having diabetes mellitus?’ Participants were also asked ‘Have you ever been diagnosed by a doctor as having angina, infarction, or heart failure?’ We considered those who gave a positive response to this question as participants with heart disease as a combined en-tity, because we expected that a substantial propor-tion of patients with heart disease in the study area, particularly in the rural areas, would not be able to distinguish different types of heart disease. Individ-uals who used alcohol, cigarettes, water-pipe, nass (a mixture of tobacco, lime, and ash), or opium at least once a week for a period of 6 months or more were considered as users of the respective sub-stance. In accord with our earlier publications,24 we calculated a composite score for wealth by apply-ing multiple correspondence analysis to appliance ownership data (including personal car, motorbike, black and white TV, color TV, refrigerator, freezer, vacuum cleaner, and washing machine), and these scores were categorized in quintiles.
Follow-up of the cohort Details of the follow-up process are reported
elsewhere.22,25 Briefly, all participants in the GCS were actively followed through annual telephone calls by local health workers in their communities and through a review of monthly provincial death registration reports. When the death of a cohort participant was reported, copies of all available and relevant medical documents for those partici-pants were collected from hospitals and pathology laboratories in Golestan and neighboring provinces and a validated verbal autopsy questionnaire was completed through an interview of the closest rela-tive of the deceased.25 This questionnaire showed high accuracy (all measures of accuracy >81%) and reliability (kappa statistics >0.75), particularly for

Middle East Journal of Digestive Diseases/ Vol.6/ No.2/ April 2014
major causes of death.25 All collected documents have been reviewed by at least two expert physi-cians to determine the cause of death. The success rate of the follow-up for annually contacting the participants in the GCS has been ~ 99%, and loss to follow-up was negligible. This analysis was based on follow-up data through December 17, 2012.
In this report, circulatory mortality referred to death from ischemic heart disease, cerebrovascular event, and any other cardiovascular disorder. EC in-cluded all histological subtypes. Data on histologi-cal subtypes were not available for this analysis, but esophageal squamous cell carcinoma (ESCC) constituted approximately 90% of EC in this popu-lation.26 External causes of death included death be-cause of motor vehicle crashes, other unintentional injury, or suicide.
Statistical analysis Less than 0.1% of the cohort participants had
missing values in all GERD variables. These partic-ipants were excluded from the current analyses. The number of individuals with missing values in indi-vidual GERD variables was also small (<0.7% for
each of the variables; Table 1), so those participants were excluded from the analyses of the respective variable. Numbers and percentages were calculated and presented for categorical variables, as well as means and standard deviations for continuous vari-ables. Cox proportional hazards regression models were used throughout this study to estimate hazard ratios (HRs) and corresponding 95% confidence intervals (CIs) for the association of the frequency (<weekly, weekly, or daily), onset time (<1, 1–5, 6–10, or >10 years before the interview), and sever-ity (mild, moderate, or severe as defined above) of GERD symptoms with overall and cause-specific mortality. In order to reduce the effect of selection bias introduced by the inclusion of patients with GERD symptoms due to complications or treat-ment of symptoms of undiagnosed life-threatening conditions (including cancer) that led to death soon after recruitment in the study, we conducted a sen-sitivity analysis by excluding deaths that occurred in the first 2 years of follow-up. Also, in order to investigate the association between the most fre-quent GERD symptoms and mortality, we repeated our analysis after exclusion of those with ≤weekly
Supplementary Table 1: Frequency and severity of gastroesophageal reflux disease (GERD) symptoms in the last year before the interview and earlier.
FrequencyLast year
Before last year
Never <Weekly Weekly Daily Total
Never 19560 (79.94) 737 (4.09) 123 (3.80) 301 (7.08) 20721 (41.46)
<Weekly 3139 (12.83) 16595 (92.09) 193 (5.96) 284 (6.68) 20211 (40.44)
Weekly 798 (3.26) 360 (2.00) 2555 (78.96) 105 (2.47) 3818 (7.64)
Daily 972 (3.97) 328 (1.82) 365 (11.28) 3560 (83.76) 5225 (10.46)
Total 24469 (100) 18020 (100) 3236 (100) 4250 (100) 49975 (100)
SeverityLast year
Before last year
Never Mild Moderate Severe Total
Never 19558 (79.88) 164 (4.50) 774 (4.38) 232 (5.59) 20728 (41.49)
Mild 1199 (4.89) 3086 (84.64) 342 (1.93) 55 (1.33) 4682 (9.36)
Moderate 3005 (12.27) 357 (9.79) 15837 (89.45) 388 (9.35) 19587 (39.18)
Severe 725 (2.96) 39 (1.07) 751 (4.24) 3473 (83.73) 4988 (9.98)
Total 24487 (100) 3646 (100) 17704 (100) 4148 (100) 49985 (100) The weighted kappa statistic for the agreement between the two time periods was 0.75 for frequency and 0.76 for severity of GERD symptoms. The severity of symptoms here is defined as: mild, the study participant did not feel the symptoms unless they actively paid attention; moderate, the study participant felt the symptoms without active attention, but they did not interfere with daily work; severe, symptoms interfering with daily work or causing nighttime awakenings.
68 GERD and Mortality
Middle East Journal of Digestive Diseases/ Vol.6/ No.2/ April 2014
69
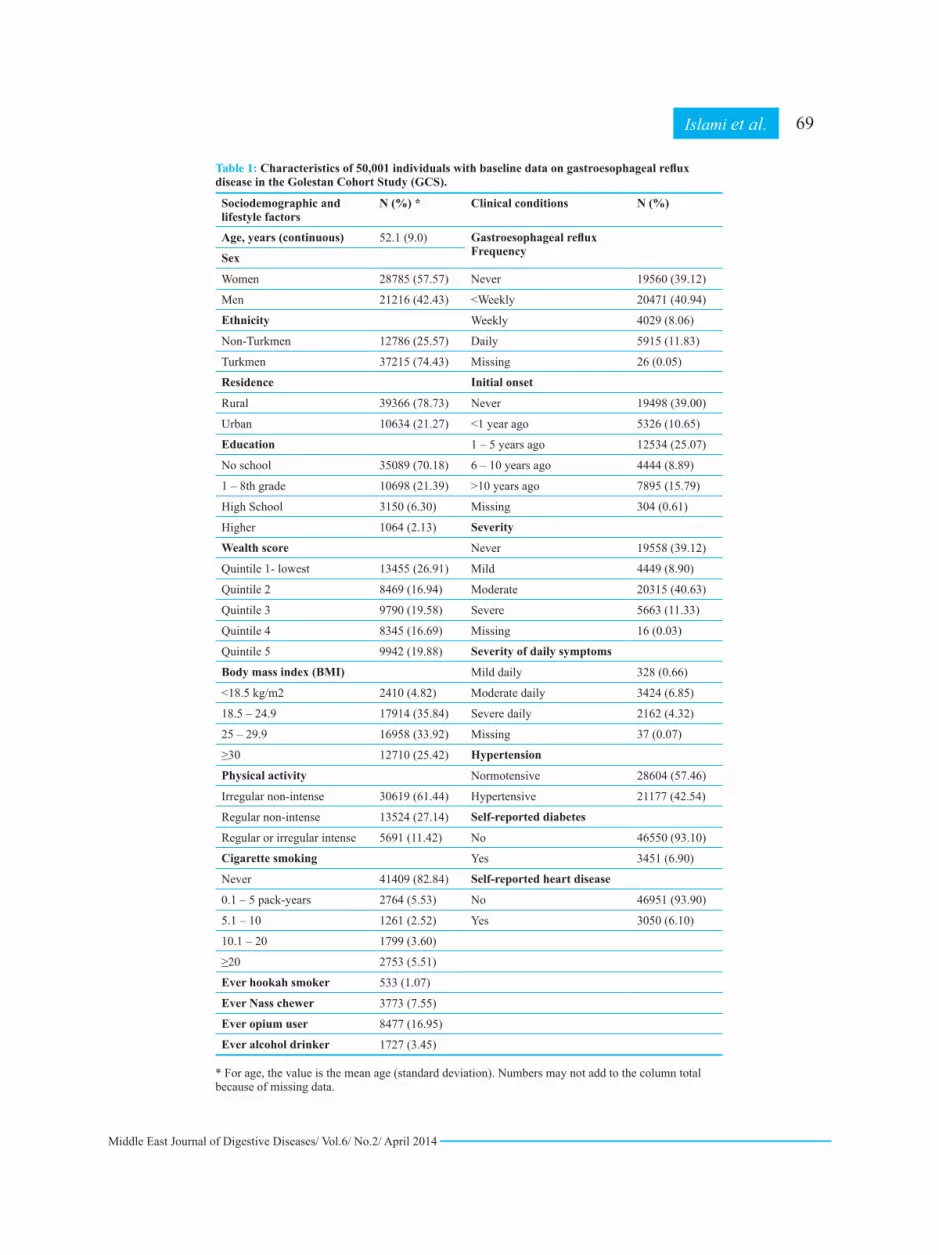
Table 1: Characteristics of 50,001 individuals with baseline data on gastroesophageal reflux disease in the Golestan Cohort Study (GCS).
Sociodemographic and lifestyle factors
N (%) * Clinical conditions N (%)
Age, years (continuous) 52.1 (9.0) Gastroesophageal refluxFrequencySex
Women 28785 (57.57) Never 19560 (39.12)
Men 21216 (42.43) <Weekly 20471 (40.94)
Ethnicity Weekly 4029 (8.06)
Non-Turkmen 12786 (25.57) Daily 5915 (11.83)
Turkmen 37215 (74.43) Missing 26 (0.05)
Residence Initial onset
Rural 39366 (78.73) Never 19498 (39.00)
Urban 10634 (21.27) <1 year ago 5326 (10.65)
Education 1 – 5 years ago 12534 (25.07)
No school 35089 (70.18) 6 – 10 years ago 4444 (8.89)
1 – 8th grade 10698 (21.39) >10 years ago 7895 (15.79)
High School 3150 (6.30) Missing 304 (0.61)
Higher 1064 (2.13) Severity
Wealth score Never 19558 (39.12)
Quintile 1- lowest 13455 (26.91) Mild 4449 (8.90)
Quintile 2 8469 (16.94) Moderate 20315 (40.63)
Quintile 3 9790 (19.58) Severe 5663 (11.33)
Quintile 4 8345 (16.69) Missing 16 (0.03)
Quintile 5 9942 (19.88) Severity of daily symptoms
Body mass index (BMI) Mild daily 328 (0.66)
<18.5 kg/m2 2410 (4.82) Moderate daily 3424 (6.85)
18.5 – 24.9 17914 (35.84) Severe daily 2162 (4.32)
25 – 29.9 16958 (33.92) Missing 37 (0.07)
≥30 12710 (25.42) Hypertension
Physical activity Normotensive 28604 (57.46)
Irregular non-intense 30619 (61.44) Hypertensive 21177 (42.54)
Regular non-intense 13524 (27.14) Self-reported diabetes
Regular or irregular intense 5691 (11.42) No 46550 (93.10)
Cigarette smoking Yes 3451 (6.90)
Never 41409 (82.84) Self-reported heart disease
0.1 – 5 pack-years 2764 (5.53) No 46951 (93.90)
5.1 – 10 1261 (2.52) Yes 3050 (6.10)
10.1 – 20 1799 (3.60)
≥20 2753 (5.51)
Ever hookah smoker 533 (1.07)
Ever Nass chewer 3773 (7.55)
Ever opium user 8477 (16.95)
Ever alcohol drinker 1727 (3.45) * For age, the value is the mean age (standard deviation). Numbers may not add to the column total because of missing data.
Islami et al.

Middle East Journal of Digestive Diseases/ Vol.6/ No.2/ April 2014
symptoms. As an additional analysis, we examined the association between self-reported heart disease and severity of GERD symptoms using logistic re-gression models, in which self-reported heart dis-ease was the outcome.
P-values for trend were obtained from the same models by assigning consecutive numbers to cat-egories within each categorical variable. All statis-tical analyses were performed using Stata statisti-cal software version 11 (Stata Corporation, College Station, Texas, USA). All reported P-values were two-sided and P<0.05 was considered to be statisti-cally significant.
RESULTSBaseline characteristics
Data on GERD were available for 50001 indi-viduals. Baseline characteristics of this group are shown in Table 1. Mean age was 52.1 ± 9.0 years. Approximately 58% of participants were women, 26% were of non-Turkmen ethnic groups, and 79% resided in rural areas. The majority of participants had no formal education (70%), were overweight (59% with BMI ≥25 kg/m2), and never smoked cig-arettes (83%). Alcohol drinking was an uncommon practice (ever use<4%). Approximately 8% and 12% of participants had weekly and daily GERD symptoms, respectively. Approximately 16% of participants reported GERD symptoms with the first episode happening >10 years before the inter-view. Also, 11% and 4% of participants reported their symptoms as severe (any frequency) and se-vere daily, respectively. Approximately 43% of participants were hypertensive, 7% reported a his-tory of diabetes and 6% reported a history of heart disease.
Gastroesophageal reflux disease (GERD) and overall mortality
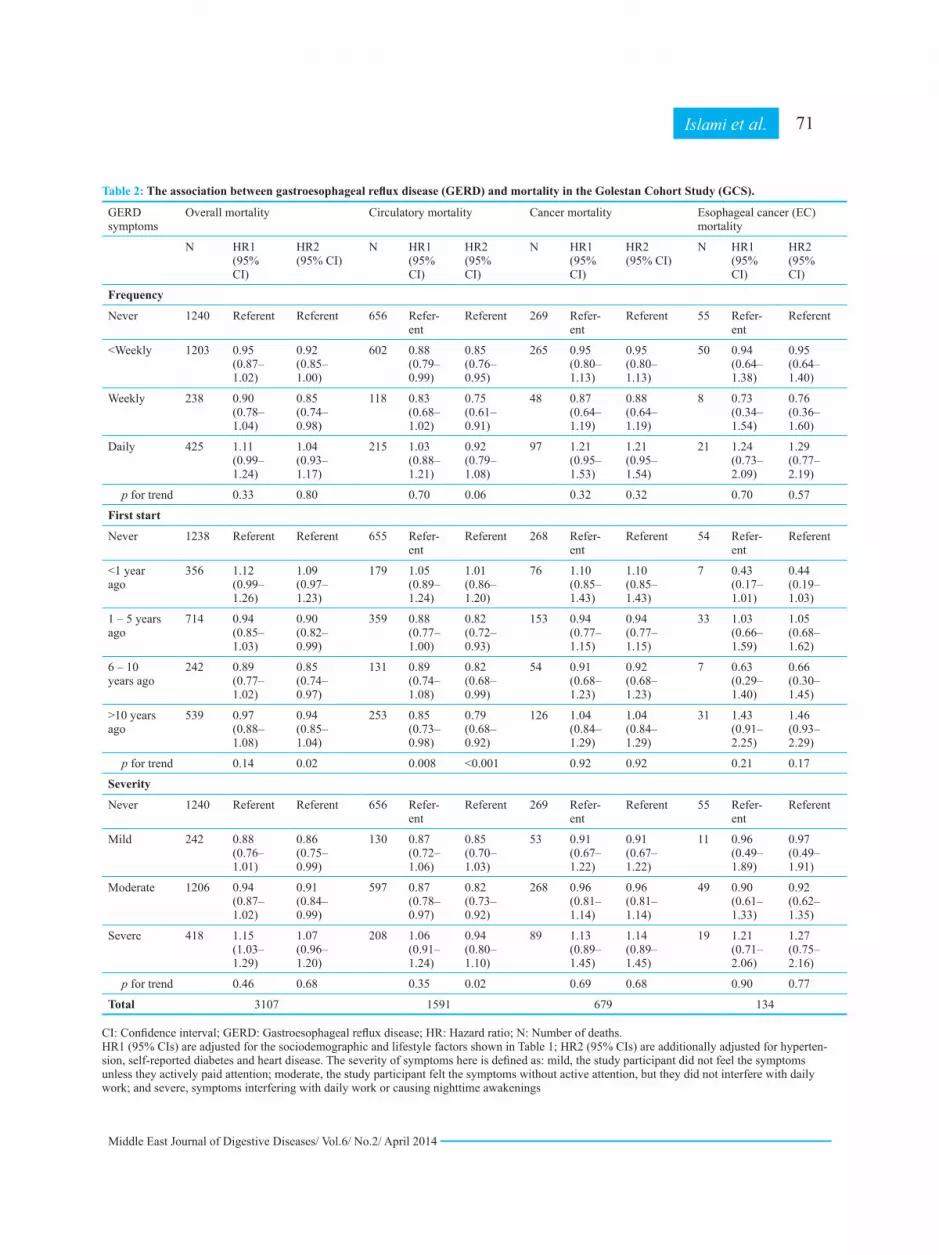
During 313,281 person-years of follow-up (me-dian follow-up of 6.4 years), 3107 deaths occurred in the cohort (Table 2). There were borderline as-sociations between daily symptoms and symptoms starting <1 year ago and overall mortality. Severe
GERD was associated with a modest increase in overall mortality (HR 1.15, 95% CI 1.03–1.29). Af-ter adjustments for hypertension and self-reported diabetes and heart disease, all above positive as-sociations attenuated and became statistically non-significant. The attenuation in risk here and in other similar situations afterwards was mainly related to adjustment for heart disease (data not shown). On the other hand, weekly symptoms, symptoms that started 1–10 years before the interview, and mild and moderate symptoms were associated with a lower mortality. The results after exclusion of the first 2 years of follow-up were similar to overall re-sults (Table 3).
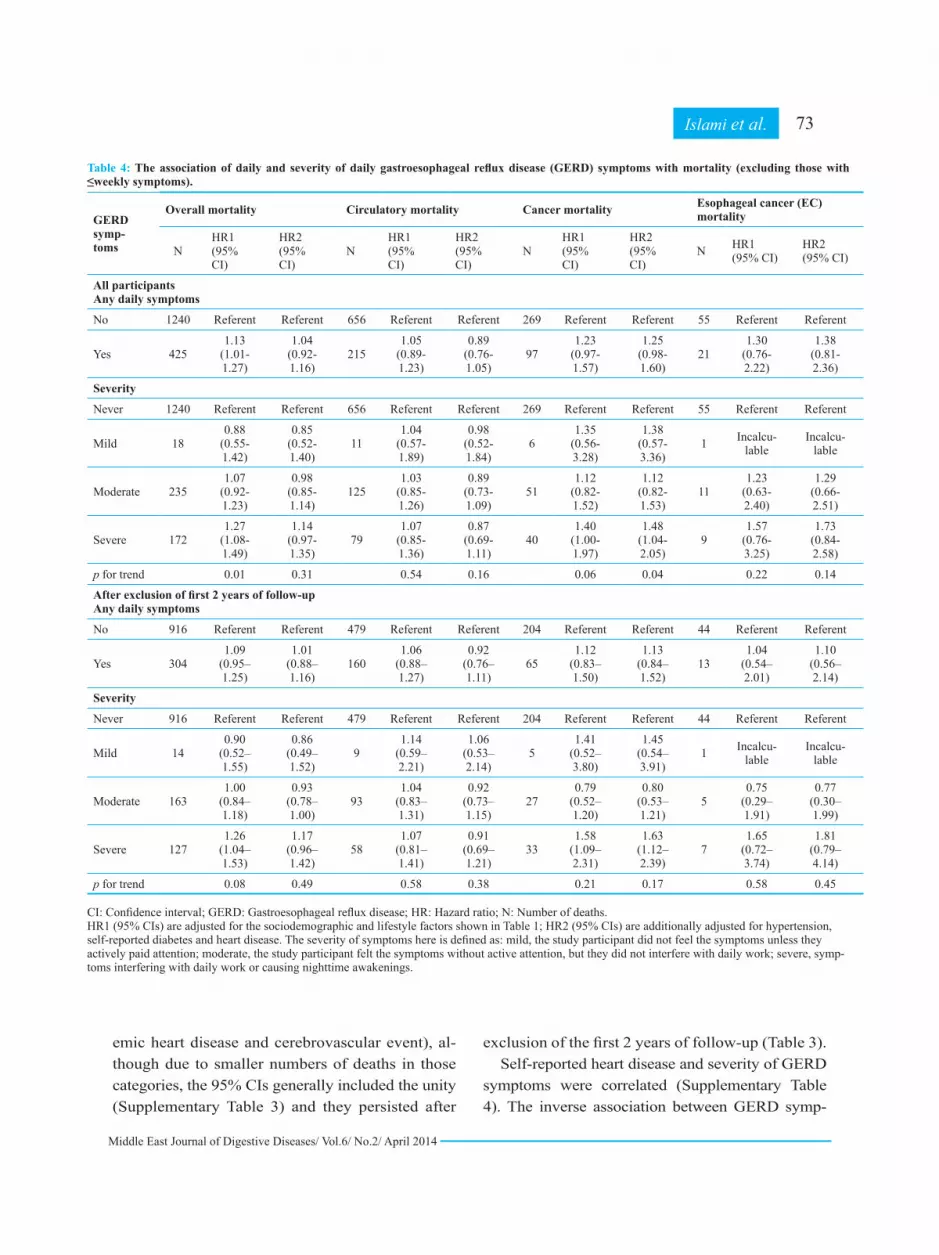
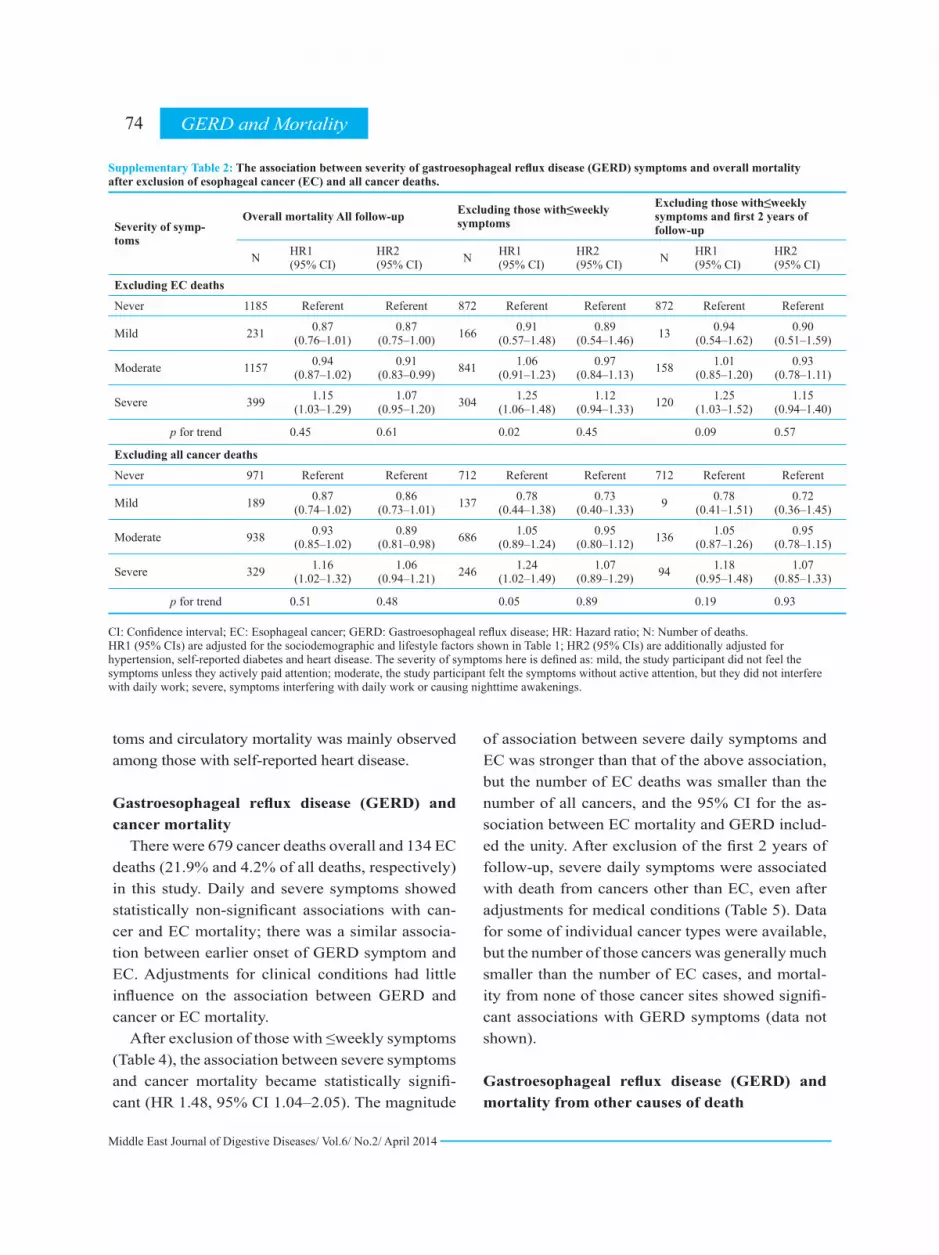
After exclusion of those with ≤weekly symptoms (Table 4), the magnitude of associations between severe symptoms and overall mortality slightly increased (HR 1.27, 95% CI 1.08–1.49), but it at-tenuated after adjustment for hypertension, self-reported diabetes and heart disease (HR 1.14, 95% CI 0.97–1.35). Severe GERD was associated with overall mortality after exclusion of EC and over-all cancer deaths from the analysis (Supplementary Table 2), but there was no statistically significant association after adjustment for history of medical conditions.
The severity of symptoms here is defined as: mild, the study participant did not feel the symp-toms unless they actively paid attention; moderate, the study participant felt the symptoms without ac-tive attention, but they did not interfere with daily work; severe, symptoms interfering with daily work or causing nighttime awakenings.
Gastroesophageal reflux disease (GERD) and circulatory mortality
There were 1591 circulatory deaths (51.2% of all deaths) in this study (Table 2). Frequency of symptoms less than weekly, moderate symptoms, and longer duration of the time period between the onset of GERD symptoms and baseline interview were associated with a lower risk of circulatory mortality. These inverse associations were similar in major categories of circulatory diseases (isch-
70 GERD and Mortality
Middle East Journal of Digestive Diseases/ Vol.6/ No.2/ April 2014
Table 2: The association between gastroesophageal reflux disease (GERD) and mortality in the Golestan Cohort Study (GCS).
GERD symptoms
Overall mortality Circulatory mortality Cancer mortality Esophageal cancer (EC) mortality
N HR1 (95% CI)
HR2 (95% CI)
N HR1 (95% CI)
HR2(95% CI)
N HR1 (95% CI)
HR2 (95% CI)
N HR1 (95% CI)
HR2 (95% CI)
Frequency
Never 1240 Referent Referent 656 Refer-ent
Referent 269 Refer-ent
Referent 55 Refer-ent
Referent
<Weekly 1203 0.95 (0.87–1.02)
0.92 (0.85–1.00)
602 0.88 (0.79–0.99)
0.85 (0.76–0.95)
265 0.95 (0.80–1.13)
0.95 (0.80–1.13)
50 0.94 (0.64–1.38)
0.95 (0.64–1.40)
Weekly 238 0.90 (0.78–1.04)
0.85 (0.74–0.98)
118 0.83 (0.68–1.02)
0.75 (0.61–0.91)
48 0.87 (0.64–1.19)
0.88 (0.64–1.19)
8 0.73 (0.34–1.54)
0.76 (0.36–1.60)
Daily 425 1.11 (0.99–1.24)
1.04 (0.93–1.17)
215 1.03 (0.88–1.21)
0.92 (0.79–1.08)
97 1.21 (0.95–1.53)
1.21 (0.95–1.54)
21 1.24 (0.73–2.09)
1.29 (0.77–2.19)
p for trend 0.33 0.80 0.70 0.06 0.32 0.32 0.70 0.57
First start
Never 1238 Referent Referent 655 Refer-ent
Referent 268 Refer-ent
Referent 54 Refer-ent
Referent
<1 year ago
356 1.12 (0.99–1.26)
1.09 (0.97–1.23)
179 1.05 (0.89–1.24)
1.01 (0.86–1.20)
76 1.10 (0.85–1.43)
1.10 (0.85–1.43)
7 0.43 (0.17–1.01)
0.44 (0.19–1.03)
1 – 5 years ago
714 0.94 (0.85–1.03)
0.90 (0.82–0.99)
359 0.88 (0.77–1.00)
0.82 (0.72–0.93)
153 0.94 (0.77–1.15)
0.94 (0.77–1.15)
33 1.03 (0.66–1.59)
1.05 (0.68–1.62)
6 – 10 years ago
242 0.89 (0.77–1.02)
0.85 (0.74–0.97)
131 0.89 (0.74–1.08)
0.82 (0.68–0.99)
54 0.91 (0.68–1.23)
0.92 (0.68–1.23)
7 0.63 (0.29–1.40)
0.66 (0.30–1.45)
>10 years ago
539 0.97 (0.88–1.08)
0.94 (0.85–1.04)
253 0.85 (0.73–0.98)
0.79 (0.68–0.92)
126 1.04 (0.84–1.29)
1.04 (0.84–1.29)
31 1.43 (0.91–2.25)
1.46 (0.93–2.29)
p for trend 0.14 0.02 0.008 <0.001 0.92 0.92 0.21 0.17
Severity
Never 1240 Referent Referent 656 Refer-ent
Referent 269 Refer-ent
Referent 55 Refer-ent
Referent
Mild 242 0.88 (0.76–1.01)
0.86 (0.75–0.99)
130 0.87 (0.72–1.06)
0.85 (0.70–1.03)
53 0.91 (0.67–1.22)
0.91 (0.67–1.22)
11 0.96 (0.49–1.89)
0.97 (0.49–1.91)
Moderate 1206 0.94 (0.87–1.02)
0.91 (0.84–0.99)
597 0.87 (0.78–0.97)
0.82 (0.73–0.92)
268 0.96 (0.81–1.14)
0.96 (0.81–1.14)
49 0.90 (0.61–1.33)
0.92 (0.62–1.35)
Severe 418 1.15 (1.03–1.29)
1.07 (0.96–1.20)
208 1.06 (0.91–1.24)
0.94 (0.80–1.10)
89 1.13 (0.89–1.45)
1.14 (0.89–1.45)
19 1.21 (0.71–2.06)
1.27 (0.75–2.16)
p for trend 0.46 0.68 0.35 0.02 0.69 0.68 0.90 0.77
Total 3107 1591 679 134 CI: Confidence interval; GERD: Gastroesophageal reflux disease; HR: Hazard ratio; N: Number of deaths. HR1 (95% CIs) are adjusted for the sociodemographic and lifestyle factors shown in Table 1; HR2 (95% CIs) are additionally adjusted for hyperten-sion, self-reported diabetes and heart disease. The severity of symptoms here is defined as: mild, the study participant did not feel the symptoms unless they actively paid attention; moderate, the study participant felt the symptoms without active attention, but they did not interfere with daily work; and severe, symptoms interfering with daily work or causing nighttime awakenings
71Islami et al.

Middle East Journal of Digestive Diseases/ Vol.6/ No.2/ April 2014
Table 3: The association between gastroesophageal reflux disease (GERD) and mortality after exclusion of deaths in the first two years of follow-up in the Golestan Cohort Study (GCS).
GERD symp-toms
Overall mortality Circulatory mortality Cancer mortality Esophageal cancer (EC) mortality
N HR1 (95% CI)
HR2 (95% CI)
N HR1 (95% CI)
HR2 (95% CI)
N HR1 (95% CI)
HR2 (95% CI)
N HR1 (95% CI)
HR2 (95% CI)
Frequency
Never 916 Referent Referent 479 Referent Referent 204 Referent Referent 44 Referent Referent
<Weekly 888 0.93(0.85–1.02)
0.92 (0.84–1.01)
432 0.85 (0.74–0.97)
0.83 (0.73–0.95)
201 0.93 (0.76–1.14)
0.93 (0.76–1.14)
35 0.81 (0.52–1.27)
0.84 (0.53–1.32)
Weekly 175 0.89 (0.76–1.05)
0.84 (0.71–0.99)
90 0.85 (0.68–1.07)
0.76 (0.61–0.96)
31 0.74 (0.51–1.09)
0.75 (0.51–1.09)
7 0.79 (0.35–1.77)
0.83 (0.37–1.87)
Daily 304 1.08 (0.94–1.23)
1.00 (0.88–1.15)
160 1.05 (0.87–1.26)
0.92 (0.77–1.11)
65 1.08 (0.81–1.45)
1.09 (0.81–1.45)
13 0.96 (0.50–1.84)
1.01 (0.52–1.94)
p for trend
0.73 0.45 0.87 0.12 0.90 0.93 0.69 0.83
First start
Never 915 Referent Referent 478 Referent Referent 204 Referent Referent 44 Referent Referent
<1 year ago
240 1.01 (0.88–1.17)
1.00 (0.87–1.16)
122 0.97 (0.79–1.19)
0.95 (0.78–1.17)
46 0.87 (0.62–1.21)
0.87 (0.63–1.22)
4 0.27 (0.08–0.86)
0.28 (0.09–0.89)
1 – 5 years ago
525 0.93 (0.83–1.03)
0.90 (0.80–1.00)
257 0.85 (0.73–0.99)
0.80 (0.69–0.94)
118 0.95 (0.75–1.20)
0.95 (0.76–1.21)
23 0.88 (0.53–1.46)
0.91 (0.54–1.52)
6 – 10 years ago
181 0.89 (0.76–1.05)
0.85 (0.72–1.00)
95 0.87 (0.70–1.09)
0.79 (0.63–0.99)
40 0.88 (0.63–1.25)
0.89 (0.64–1.27)
6 0.66 (0.28–1.56)
0.70 (0.30–1.65)
>10 years ago
408 0.97 (0.86–1.09)
0.95 (0.84–1.07)
197 0.87 (0.73–1.03)
0.83 (0.70–0.98)
92 0.98 (0.76–1.27)
0.99 (0.77–1.28)
21 1.17 (0.69–1.99)
1.22 (0.72–2.08)
p for trend
0.26 0.09 0.04 0.004 0.70 0.77 0.69 0.57
Severity
Never 916 Referent Referent 479 Referent Referent 204 Referent Referent 44 Referent Referent
Mild 173 0.84 (0.71–0.99)
0.84 (0.71–0.99)
94 0.85 (0.68–1.06)
0.84 (0.67–1.05)
36 0.79 (0.55–1.13)
0.80 (0.56–1.15)
7 0.71 (0.30–1.66)
0.72 (0.31–1.70)
Moder-ate
874 0.91 (0.83–1.00)
0.89 (0.81–0.98)
430 0.84 (0.74–0.96)
0.80 (0.70–0.92)
188 0.88 (0.72–1.08)
0.88 (0.72–1.08)
33 0.76 (0.48–1.20)
0.79 (0.50–1.25)
Severe 319 1.17 (1.03–1.33)
1.11 (0.97–1.27)
158 1.07 (0.89–1.29)
0.97 (0.81–1.17)
73 1.22 (0.93–1.61)
1.23 (0.94–1.62)
15 1.20 (0.66–2.18)
1.28 (0.70–2.33)
p for trend
0.61 0.74 0.34 0.05 0.77 0.76 0.77 0.95
Total 2283 1161 501 99
CI: Confidence interval; GERD: Gastroesophageal reflux disease; HR: Hazard ratio; N: Number of deaths. HR1 (95% CIs) are adjusted for the sociodemographic and lifestyle factors shown in Table 1; HR2 (95% CIs) are additionally adjusted for hypertension, self-reported diabetes and heart disease. The severity of symptoms here is defined as: mild, the study participant did not feel the symptoms unless they actively paid attention; moderate, the study participant felt the symptoms without active attention, but they did not interfere with daily work; severe, symptoms interfering with daily work or causing nighttime awakenings.
72 GERD and Mortality
Middle East Journal of Digestive Diseases/ Vol.6/ No.2/ April 2014
emic heart disease and cerebrovascular event), al-though due to smaller numbers of deaths in those categories, the 95% CIs generally included the unity (Supplementary Table 3) and they persisted after
exclusion of the first 2 years of follow-up (Table 3).Self-reported heart disease and severity of GERD
symptoms were correlated (Supplementary Table 4). The inverse association between GERD symp-
73Islami et al.
Table 4: The association of daily and severity of daily gastroesophageal reflux disease (GERD) symptoms with mortality (excluding those with ≤weekly symptoms).
GERD symp-toms
Overall mortality Circulatory mortality Cancer mortality Esophageal cancer (EC) mortality
NHR1 (95% CI)
HR2 (95% CI)
NHR1 (95% CI)
HR2 (95% CI)
NHR1 (95% CI)
HR2 (95% CI)
N HR1 (95% CI)
HR2 (95% CI)
All participants Any daily symptoms
No 1240 Referent Referent 656 Referent Referent 269 Referent Referent 55 Referent Referent
Yes 4251.13
(1.01-1.27)
1.04 (0.92-1.16)
2151.05
(0.89-1.23)
0.89 (0.76-1.05)
971.23
(0.97-1.57)
1.25 (0.98-1.60)
211.30
(0.76-2.22)
1.38 (0.81-2.36)
Severity
Never 1240 Referent Referent 656 Referent Referent 269 Referent Referent 55 Referent Referent
Mild 180.88
(0.55-1.42)
0.85 (0.52-1.40)
111.04
(0.57-1.89)
0.98 (0.52-1.84)
61.35
(0.56-3.28)
1.38 (0.57-3.36)
1 Incalcu-lable
Incalcu-lable
Moderate 2351.07
(0.92-1.23)
0.98 (0.85-1.14)
1251.03
(0.85-1.26)
0.89 (0.73-1.09)
511.12
(0.82-1.52)
1.12 (0.82-1.53)
111.23
(0.63-2.40)
1.29 (0.66-2.51)
Severe 1721.27
(1.08-1.49)
1.14 (0.97-1.35)
791.07
(0.85-1.36)
0.87 (0.69-1.11)
401.40
(1.00-1.97)
1.48 (1.04-2.05)
91.57
(0.76-3.25)
1.73 (0.84-2.58)
p for trend 0.01 0.31 0.54 0.16 0.06 0.04 0.22 0.14
After exclusion of first 2 years of follow-up Any daily symptoms
No 916 Referent Referent 479 Referent Referent 204 Referent Referent 44 Referent Referent
Yes 3041.09
(0.95–1.25)
1.01 (0.88–1.16)
1601.06
(0.88–1.27)
0.92 (0.76–1.11)
651.12
(0.83–1.50)
1.13 (0.84–1.52)
131.04
(0.54–2.01)
1.10 (0.56–2.14)
Severity
Never 916 Referent Referent 479 Referent Referent 204 Referent Referent 44 Referent Referent
Mild 140.90
(0.52–1.55)
0.86 (0.49–1.52)
91.14
(0.59–2.21)
1.06 (0.53–2.14)
51.41
(0.52–3.80)
1.45 (0.54–3.91)
1 Incalcu-lable
Incalcu-lable
Moderate 1631.00
(0.84–1.18)
0.93 (0.78–1.00)
931.04
(0.83–1.31)
0.92 (0.73–1.15)
270.79
(0.52–1.20)
0.80 (0.53–1.21)
50.75
(0.29–1.91)
0.77 (0.30–1.99)
Severe 1271.26
(1.04–1.53)
1.17 (0.96–1.42)
581.07
(0.81–1.41)
0.91 (0.69–1.21)
331.58
(1.09–2.31)
1.63 (1.12–2.39)
71.65
(0.72–3.74)
1.81 (0.79–4.14)
p for trend 0.08 0.49 0.58 0.38 0.21 0.17 0.58 0.45 CI: Confidence interval; GERD: Gastroesophageal reflux disease; HR: Hazard ratio; N: Number of deaths. HR1 (95% CIs) are adjusted for the sociodemographic and lifestyle factors shown in Table 1; HR2 (95% CIs) are additionally adjusted for hypertension, self-reported diabetes and heart disease. The severity of symptoms here is defined as: mild, the study participant did not feel the symptoms unless they actively paid attention; moderate, the study participant felt the symptoms without active attention, but they did not interfere with daily work; severe, symp-toms interfering with daily work or causing nighttime awakenings.
Middle East Journal of Digestive Diseases/ Vol.6/ No.2/ April 2014
toms and circulatory mortality was mainly observed among those with self-reported heart disease.
Gastroesophageal reflux disease (GERD) and cancer mortality
There were 679 cancer deaths overall and 134 EC deaths (21.9% and 4.2% of all deaths, respectively) in this study. Daily and severe symptoms showed statistically non-significant associations with can-cer and EC mortality; there was a similar associa-tion between earlier onset of GERD symptom and EC. Adjustments for clinical conditions had little influence on the association between GERD and cancer or EC mortality.
After exclusion of those with ≤weekly symptoms (Table 4), the association between severe symptoms and cancer mortality became statistically signifi-cant (HR 1.48, 95% CI 1.04–2.05). The magnitude
of association between severe daily symptoms and EC was stronger than that of the above association, but the number of EC deaths was smaller than the number of all cancers, and the 95% CI for the as-sociation between EC mortality and GERD includ-ed the unity. After exclusion of the first 2 years of follow-up, severe daily symptoms were associated with death from cancers other than EC, even after adjustments for medical conditions (Table 5). Data for some of individual cancer types were available, but the number of those cancers was generally much smaller than the number of EC cases, and mortal-ity from none of those cancer sites showed signifi-cant associations with GERD symptoms (data not shown).
Gastroesophageal reflux disease (GERD) and mortality from other causes of death
74 GERD and Mortality
Supplementary Table 2: The association between severity of gastroesophageal reflux disease (GERD) symptoms and overall mortality after exclusion of esophageal cancer (EC) and all cancer deaths.
Excluding those with≤weekly symptoms and first 2 years of follow-up
Excluding those with≤weekly symptomsOverall mortality All follow-up
Severity of symp-toms
HR2 (95% CI)
HR1 (95% CI)NHR2
(95% CI)HR1 (95% CI)NHR2
(95% CI)HR1 (95% CI)N
Excluding EC deaths
ReferentReferent872ReferentReferent872ReferentReferent1185Never
0.90 (0.51–1.59)
0.94 (0.54–1.62)130.89
(0.54–1.46)0.91
(0.57–1.48)1660.87 (0.75–1.00)
0.87 (0.76–1.01)231Mild
0.93 (0.78–1.11)
1.01(0.85–1.20)1580.97
(0.84–1.13)1.06
(0.91–1.23)8410.91 (0.83–0.99)
0.94 (0.87–1.02)1157Moderate
1.15 (0.94–1.40)
1.25(1.03–1.52)1201.12
(0.94–1.33)1.25
(1.06–1.48)3041.07 (0.95–1.20)
1.15 (1.03–1.29)399Severe
0.570.090.450.020.610.45p for trend
Excluding all cancer deaths
ReferentReferent712ReferentReferent712ReferentReferent971Never
0.72 (0.36–1.45)
0.78(0.41–1.51)90.73
(0.40–1.33)0.78
(0.44–1.38)1370.86 (0.73–1.01)
0.87 (0.74–1.02)189Mild
0.95 (0.78–1.15)
1.05(0.87–1.26)1360.95
(0.80–1.12)1.05
(0.89–1.24)6860.89 (0.81–0.98)
0.93 (0.85–1.02)938Moderate
1.07 (0.85–1.33)
1.18 (0.95–1.48)941.07
(0.89–1.29)1.24
(1.02–1.49)2461.06 (0.94–1.21)
1.16 (1.02–1.32)329Severe
0.930.190.890.050.480.51p for trend CI: Confidence interval; EC: Esophageal cancer; GERD: Gastroesophageal reflux disease; HR: Hazard ratio; N: Number of deaths. HR1 (95% CIs) are adjusted for the sociodemographic and lifestyle factors shown in Table 1; HR2 (95% CIs) are additionally adjusted for hypertension, self-reported diabetes and heart disease. The severity of symptoms here is defined as: mild, the study participant did not feel the symptoms unless they actively paid attention; moderate, the study participant felt the symptoms without active attention, but they did not interfere with daily work; severe, symptoms interfering with daily work or causing nighttime awakenings.

Middle East Journal of Digestive Diseases/ Vol.6/ No.2/ April 2014
The association between daily GERD and other causes of mortality are shown in Table 6. The HRs for some of the associations, including for respi-ratory, infectious, genitourinary, and neurologic deaths were slightly above or below unity, but these were based on modest numbers of death and none reached statistical significance after exclusion of the first two years of follow-up.
DISCUSSIONWe found an association between severe symptoms
defined as symptoms that interfered with daily work or caused nighttime awakenings, and occurred on a daily basis (reported by 4.3% of participants) to over-all cancer and EC mortality. This association persisted even after exclusion of the first two years of follow-up and adjustments for hypertension, self-reported diabe-tes and heart disease. There was also a slight increase in overall mortality associated with severe GERD, but
the association disappeared after adjustments for the above medical conditions. On the other hand, non-daily and mild to moderate GERD symptoms was as-sociated with a slight reduction in risk of death from circulatory disorders. Overall mortality was not asso-ciated with onset time or frequency of GERD and was not increased with mild to moderate symptoms.
Gastroesophageal reflux disease (GERD) symp-toms and cancer and overall mortality
The results of our study suggested an association between severe daily GERD and EC. Although the as-sociation was not statistically significant, it was prob-ably due to a modest number of EC cases with severe daily symptoms. The association between GERD and EC deaths reported in this and Solaymani-Dodaran et al.13 studies seemed to be mechanistically plausible and was supported by several other studies.27 In our study, severe daily symptoms were also associated
Supplementary Table 3: The association between gastroesophageal reflux disease (GERD) and death from categories of circulatory diseases after exclusion of deaths in the first two years of follow-up.
Cerebrovascular eventOther cardiovascular disordersIschemic heart diseaseAll circulatory disor-
dersGERD symptomsHR (95% CI)NHR (95% CI)NHR (95% CI)NHR (95% CI)N
Frequency
Referent40Referent156Referent283Referent479Never
0.67 (0.41–1.08)290.86 (0.68–1.08)1440.87 (0.73–1.03)2590.85 (0.74–0.97)432<Weekly
0.94 (0.45–1.96)91.01 (0.69–1.46)360.75 (0.55–1.03)450.85 (0.68–1.07)90Weekly
1.13 (0.63–2.05)160.99 (0.71–1.37)511.06 (0.84–1.35)931.05 (0.87–1.26)160Daily
0.770.910.790.87p for trend
First start
Referent40Referent156Referent282Referent478Never
0.51 (0.21–1.20)61.01 (0.72–1.43)431.01 (0.78–1.32)730.97 (0.79–1.19)122<1 year ago
0.62 (0.35–1.10)170.81 (0.62–1.06)810.91 (0.75–1.11)1590.85 (0.73–0.99)2571 – 5 years ago
1.07 (0.53–2.14)101.07 (0.75–1.53)380.73 (0.53–1.00)470.87 (0.70–1.09)956 – 10 years ago
1.07 (0.62–1.85)200.85 (0.63–1.14)650.85 (0.68–1.07)1120.87 (0.73–1.03)197>10 years ago
0.830.280.050.04p for trend
Severity
Referent40Referent156Referent283Referent479Never
0.34 (0.10–1.09)30.86 (0.57–1.28)310.91 (0.69–1.21)600.85 (0.68–1.06)94Mild
0.90 (0.58–1.40)400.82 (0.65–1.04)1390.85 (0.71–1.01)2510.84 (0.74–0.96)430Moderate
0.79 (0.40–1.54)111.24 (0.91–1.67)611.02 (0.80–1.31)861.07 (0.89–1.29)158Severe
0.550.970.310.34p for trend
943876801161Total
75Islami et al.

Middle East Journal of Digestive Diseases/ Vol.6/ No.2/ April 2014
with death from cancers other than EC after exclusion of the first two years of follow-up. As the numbers of individual cancers in our study were modest, these as-sociations necessitate further investigation.
A study by Solaymani-Dodaran et al. was the only other study that has reported an association between GERD and increased mortality beyond one year of follow-up, suggested a modest increase in the risk,
with HRs of 1.16 in individuals with GERD but with-out esophagitis or Barrett’s esophagus, 1.16 in indi-viduals with esophagitis, and 1.37 in individuals with Barrett’s esophagus.13 Similar to our study, the asso-ciations were attenuated after adjustment for history of ischemic heart disease: the HR (95% CI) for the first group (GERD without histological change) was 1.09 (0.95–1.26) after the adjustment.13 This indicated
Supplementary Table 4: The association between severity of gastroesophageal reflux disease (GERD) symptoms and self-reported heart disease and between severity of GERD symptoms and circulatory mortality by self-reported heart disease status.
Among those without self-reported heart disease
Circulatory mortalityAssociation between self-reported heart disease and severity of reflux
Severity of symptoms Among those with self-reported heart disease
OR (95% CI)NOR (95% CI)NOR (95% CI)N
Referent532Referent124Referent875Never
0.90 (0.73-1.11)1070.64 (0.41–1.01)231.16 (1.00–1.35)241Mild
0.82 (0.72-0.93)4420.81 (0.64–1.03)1551.45 (1.33–1.59)1354Moderate
1.03 (0.86-1.24)1530.72 (0.52–0.99)552.36 (2.10–2.64)580Severe
0.090.04<0.001p for trend CI: Confidence interval; GERD: Gastroesophageal reflux disease; HR: Hazard ratio; N: Number of deaths; OR: Odds ratio. ORs and HRs (95% CIs) are adjusted for the sociodemographic and lifestyle factors shown in Table 1. Odds ratios (95% CIs) for the association between self-reported heart disease and reflux severity was calculated using logistic regression models in which self-reported heart disease was the dependent variable.
Table 5: The association between onset time and severity of daily GERD symptoms and cancer mortality after exclusion of cases of esopha-geal cancer mortality
Excluding those with ≤weekly symptoms and first 2 years of follow-up
Excluding those with ≤weekly symptoms
Cancer mortalityAll follow-up
Severity of symptomsHR2
(95% CI)HR1
(95% CI)NHR2(95% CI)
HR1 (95% CI)NHR2
(95% CI)HR1
(95% CI)N
Excluding EC deaths
ReferentReferent872ReferentReferent872ReferentReferent1185Never
1.84 (0.68–4.99)
1.78 (0.65–4.82)131.71
(0.70–4.19)1.67
(0.69–4.08)1660.91 (0.65–1.26)
0.90 (0.64–1.25)231Mild
0.81 (0.51–1.28)
0.81 (0.51–1.29)1581.08
(0.76–1.54)1.09
(0.77–1.54)8410.96 (0.79–1.17)
0.98 (0.81–1.18)1157Moderate
1.61 (1.05–2.47)
1.58 (1.03–2.42)1201.40
(0.95–2.06)1.37
(0.93–2.01)3041.13 (0.85–1.48)
1.12 (0.85–1.48)399Severe
0.230.240.120.140.740.68p for trend CI: confidence interval; GERD, gastroesophageal reflux disease; HR, hazard ratio; N, number of deaths. HR1 (95% CIs) are adjusted for the sociodemographic and lifestyle factors shown in Table 1; HR2 (95% CIs) are additionally adjusted for hy-pertension and self-reported diabetes and heart disease. The severity of symptoms here was defined as: mild, the study participant did not feel the symptoms unless they actively paid attention; moderate, the study participant felt the symptoms without active attention, but they did not interfere with daily work; severe, symptoms interfering with daily work or causing nighttime awakenings.
76 GERD and Mortality

Middle East Journal of Digestive Diseases/ Vol.6/ No.2/ April 2014
that a major part of the observed associations were unlikely to be causal and might be explained by other medical conditions. The effect of other chronic diseas-es appeared to be similar across different populations because the observed association in this Iranian popu-lation and in the UK population13 were very similar. These results also indicated that the increased risk of EC or overall cancer associated with GERD was too small to noticeably affect overall mortality.
Inverse association between gastroesophageal re-flux disease (GERD) symptoms and circulatory mortality
Another study also reported an inverse association between weekly and less than weekly GERD and mor-tality in the United States.16 As circulatory diseases are the major causes of death in the United States,28 it is likely that this inverse association was mainly related to circulatory diseases, consistent with our finding. The reason for this inverse association is unclear. However, it may not be causal. The positive association between GERD symptoms and self-reported heart disease sug-gest that people with known heart disease may be at higher risk of GERD due to treatment of heart disease, or individuals with GERD may refer to physicians more
frequently, and because of this any heart disease is more likely to be diagnosed. This may also explain the stron-ger inverse association between GERD symptoms and circulatory mortality among those with known heart disease; those with undiagnosed heart disease may be more likely to present with more severe complications. Nevertheless, we do not have the data to examine this hypothesis appropriately.
Clinical implications of the results The association between GERD and cancer mortal-
ity in this study was modest and observed only among those with severe symptoms. This has shown that the majority of individuals with GERD can also be reassured that mild or moderate GERD per se is not associated with an increased risk of death. This may reduce the extent of potential anxiety associated with the symptoms and may improve the patients’ quality of life. Many individuals with GERD may be exposed to information about the association between GERD and some serious conditions, such as EAC. This may induce stress and anxiety in those individuals, as they may think that the ultimate outcome of GERD will be life-threatening. Thus individuals may repeatedly seek medical care; on the other hand, in some cases it
Table 6: The association between severe daily GERD symptoms and other causes of mortality
Excluding first 2 years of follow-up and those with ≤weekly symptoms
All follow-up excluding those with ≤weekly symptomsN
TotalCause of deathHR2 (95% CI)HR1 (95% CI)NHR2 (95% CI)HR1 (95% CI)N
1.38 (0.76–2.49)1.32 (0.73–2.37)581.16 (0.69–1.96)1.13 (0.68–1.90)78160Respiratory
1.14 (0.51–2.53)1.11 (0.50–2.47)331.22 (0.62–2.38)1.22 (0.63–2.39)4787Digestive
0.70 (0.27–1.80)0.73 (0.29–1.85)300.58 (0.25–1.37)0.62 (0.27–1.44)3983Infectious
1.44 (0.68–3.02)1.53 (0.73–3.19)341.88 (1.00–3.53)2.09 (1.13–3.87)4679Genitourinary
0.79 (0.26–2.38)1.13 (0.39–3.32)180.67 (0.27–1.70)0.93 (0.38–2.29)2750Endocrine
3.25 (0.83–12.77)2.90 (0.75–11.27)112.31 (0.65–8.27)2.11 (0.59–7.52)1334Neurologic
0.96 (0.50–1.83)0.96 (0.50–1.82)691.12 (0.69–1.82)1.14 (0.70–1.85)107194External
0.96 (0.49–1.89)0.96 (0.49–1.87)531.45 (0.81–2.58)1.44 (0.82–2.55)63136Unknown
Incalculable *Incalculable *6Incalculable *Incalculable *814Other CI: confidence interval; GERD, gastroesophageal reflux disease; HR, hazard ratio; N, number of deaths. The causes of death in this table do not include cancer or circulatory deaths. All HRs (95% CIs) are the risk of mortality associated with severe GERD symptoms (vs. no symptoms). Results for mild and moderate symptoms are not shown here. HR1 (95% CIs) are adjusted for the sociodemographic and lifestyle factors shown in Table 1; HR2 (95% CIs) are additionally adjusted for hypertension and self-reported diabetes and heart disease. The severity of symptoms here was defined as: mild, the study partici-pant did not feel the symptoms unless they actively paid attention; moderate, the study participant felt the symptoms without active attention, but they did not interfere with daily work; severe, symptoms interfering with daily work or causing nighttime awakenings. * None of those who died in this category had daily severe GERD.
77Islami et al.
Middle East Journal of Digestive Diseases/ Vol.6/ No.2/ April 2014
may cause patients to avoid seeking appropriate medi-cal care because of their fear.29 Furthermore, as GERD may be associated with stress,30-32 any anxiety associ-ated with GERD may exacerbate the symptoms. The results of this population-based study further support the results of hospital-based studies reporting a low risk of EAC in individuals with GERD, even in those with Barrett’s esophagus.12
Generalization of the results of this study to other populations
Golestan Province has one of the highest incidence rates for EC worldwide, with age-standardized rates (ASRs) of 70.7 (men) and 42.6 (women) per 100,000 person-years in the eastern parts of the province.33 Al-though the incidence of EAC in Golestan seems to be increasing,34 ESCC is still much more common than EAC in Golestan,26 whereas in the United States and several European countries, EAC now considerably out-numbers ESCC.35,36 As EAC is the major fatal disease with a known association to GERD, one may argue that the results of this study may not be generalizable to the Western countries. However, although the incidence of EAC has increased in Western countries, EC overall and EAC are relatively rare cancers in those populations. For example, the ASRs for incidence (per 100,000 person-years) of EC overall in more developed countries (as de-fined by the United Nations: all regions of Europe plus Northern America, Australia/New Zealand and Japan) in 2008 have been reported as 6.5 in men and 1.2 in wom-en, which was a small part of total cancer incidence rates in those regions (300.1 in men and 225.5 in women).37 The ASR per 100,000 person-years for EAC incidence in 2009 was estimated as 2.7 in the United States (5.3 for men and 0.9 for women)38 and 1.9 in Golestan Province (3.0 for men and 0.8 for women).34 This information sug-gests that there is only a modest difference in the inci-dence of EAC cases in Golestan and Western countries, supporting the generalizability of our results to those populations in this regard. The similarity of the results of this and the Solaymani-Dodaran et al.13 studies may further support this notion.
Strength and limitation of the study
Some major strengths of this study are the large
sample size and the relatively high number of out-comes of interest, which has enabled us to investigate the associations by cause-specific mortality; collec-tion of detailed information on GERD; and adjust-ment of the results for multiple potential confounding factors. On the other hand, we did not have data on morphologic or histological status of the esophageal lining of the study participants, so we were not able to examine the associations by these factors. The natural history of GERD-related lesions may be best studied in hospital-based follow-up studies of patients with confirmed lesions. In some populations, however, some individuals may not be included in the studies that require diagnostic interventions, such as upper GI endoscopy, as a result of their limited access to clinical care or their concerns about the procedure (selection bias). Therefore, it can be informative to also exam-ine the association between GERD and mortality in large-scale population studies with minimal risk of the above bias.
The history of diabetes and heart disease was based on self-reports, but similar to many other large popu-lation-based studies, this was the only source for gath-ering such information. It was logistically impossible to do diagnostic workups for those diseases in this study. However, as adjustments for diabetes and heart disease based on known, self-reported cases of these conditions did not change the associations between GERD and EC or overall cancer, which were positive findings of this study. We do not expect that diabe-tes and heart disease are major confounding factors for these associations. Therefore, identifying undiag-nosed cases of these medical conditions and including them in the analyses is unlikely to change the results substantially.
The results of this study suggest that cancer mortal-ity may causally be associated with GERD, but any association between GERD and other causes of mor-tality may not be causal and is explainable by other chronic diseases, notably heart disease. The major-ity of those with GERD can be reassured that mild or moderate GERD per se are not associated with in-creased risk of death. This may reduce the extent of potential anxiety associated with the symptoms.
Grant support. The Golestan Cohort Study was
78 GERD and Mortality

Middle East Journal of Digestive Diseases/ Vol.6/ No.2/ April 2014
supported by Tehran University of Medical Sciences (grant No: 81/15), Cancer Research UK (grant No: C20/A5860), the Intramural Research Program of the US National Cancer Institute, and through various collaborative research agreements with the Interna-tional Agency for Research on Cancer. The funding sources had no role in the design, conduct, statistical analysis and interpretation of results, or writing of the manuscript.
CONFLICT OF INTEREST The authors declare no conflict of interest related to this work.
REFERENCES1. Ronkainen J, Aro P, Storskrubb T, Johansson SE, Lind
T, Bolling-Sternevald E, et al. High prevalence of gas-troesophageal reflux symptoms and esophagitis with or without symptoms in the general adult Swedish popula-tion: a Kalixanda study report. Scand J Gastroenterol 2005;40:275-85.
2. Zagari RM, Fuccio L, Wallander MA, ohansson S, Fiocca R, Casanova S,et al. Gastro-oesophageal reflux symptoms, oesophagitis and Barrett’s oesophagus in the general popu-lation: the Loiano-Monghidoro study. Gut 2008;57:1354-9.
3. Lofdahl HE, Lane A, Lu Y, Harvey RF, Blazeby JM, Lager-gren J, et al. Increased population prevalence of reflux and obesity in the United Kingdom compared with Sweden: a potential explanation for the difference in incidence of esophageal adenocarcinoma. Eur J Gastroenterol Hepatol 2011;23:128-32.
4. Sobieraj DM, Coleman SM, Coleman CI. US prevalence of upper gastrointestinal symptoms: a systematic literature review. Am J Manag Care 2011;17:e449-58.
5. Ness-Jensen E, Lindam A, Lagergren J, Hveem K. Chang-es in prevalence, incidence and spontaneous loss of gastro-oesophageal reflux symptoms: a prospective population-based cohort study, the HUNT study. Gut 2012;61:1390-7.
6. Peery AF, Dellon ES, Lund J, Crockett SD, McGowan CE, Bulsiewicz WJ,et al. Burden of gastrointestinal dis-ease in the United States: 2012 update. Gastroenterology 2012;143:1179-87.
7. Chiocca JC, Olmos JA, Salis GB, Chiocca JC, Olmos JA, Salis GB, Soifer LO, Higa R, Marcolongo M; et al. Preva-lence, clinical spectrum and atypical symptoms of gastro-oesophageal reflux in Argentina: a nationwide population-based study. Aliment Pharmacol Ther 2005;22:331-42.
8. Moraes-Filho JP, Chinzon D, Eisig JN, Hashimoto CL, Zaterka S. Prevalence of heartburn and gastroesophageal reflux disease in the urban Brazilian population. Arq Gas-troenterol 2005;42:122-7.
9. Ben Chaabane N, El Jeridi N, Ben Salem K, Hellara O, Loghmari H, Melki W, et al. Prevalence of gastroesophage-al reflux in a Tunisian primary care population determined by patient interview. Dis Esophagus 2012;25:4-9.
10. Bor S, Mandiracioglu A, Kitapcioglu G, Caymaz-Bor C, Gilbert RJ. Gastroesophageal reflux disease in a low-in-come region in Turkey. Am J Gastroenterol 2005;100:759-65.
11. Goh KL. Gastroesophageal reflux disease in Asia: A his-torical perspective and present challenges. J Gastroenterol Hepatol 2011;26 Suppl 1:2-10.
12. Wani S, Falk G, Hall M, Gaddam S, Wang A, Gupta N, et al. Patients with nondysplastic Barrett’s esophagus have low risks for developing dysplasia or esophageal adenocar-cinoma. Clin Gastroenterol Hepatol 2011;9:220-7.
13. Solaymani-Dodaran M, Logan RF, West J, Card T. Mortal-ity associated with Barrett’s esophagus and gastroesopha-geal reflux disease diagnoses-a population-based cohort study. Am J Gastroenterol 2005;100:2616-21.
14. Ruigomez A, Garcia Rodriguez LA, Wallander MA, Jo-hansson S, Graffner H, Dent J. et al. Natural history of gastro-oesophageal reflux disease diagnosed in general practice. Aliment Pharmacol Ther 2004;20:751-60.
15. Bateman DN, Colin-Jones D, Hartz S, Langman M, Logan RF, Mant J , et al. Mortality study of 18 000 patients treated with omeprazole. Gut 2003;52:942-6.
16. Talley NJ, Locke GR 3rd, McNally M, Schleck CD, Zins-meister AR, Melton LJ 3rd. Impact of gastroesophageal reflux on survival in the community. Am J Gastroenterol 2008;103:12-9.
17. Nouraie M, Radmard AR, Zaer-Rezaii H, Razjouyan H, Nasseri-Moghaddam S, Malekzadeh R, et al. Hy-giene could affect GERD prevalence independently: a population-based study in Tehran. Am J Gastroenterol 2007;102:1353-60.
18. Fazel M, Keshteli AH, Jahangiri P, Daneshpajouhnejad P, Adibi P. Gastroesophageal Reflux Disease in Iran: SEPAH-AN Systematic Review No. 2. Int J Prev Med 2012;3:S10-7.
19. Ganji A, Malekzadeh F, Safavi M, Nasseri Moghaddam S, Nouraie M, Merat S, et al. Digestive and liver disease statistics in Iran. Middle East J Digest Dis 2009;1:56-62.
20. Sepanlou SG, Khademi H, Abdollahzadeh N, Noori F, Malekzadeh F, Malekzadeh R. Time trends of gastro-esophageal reflux disease (GERD) and peptic ulcer disease (PUD) in Iran. Middle East J Digest Dis 2010;2:78-83.
21. Aghcheli K, Marjani HA, Nasrollahzadeh D, Islami F, Shakeri R, Sotoudeh M, et al. Prognostic factors for esoph-ageal squamous cell carcinoma--a population-based study in Golestan Province, Iran, a high incidence area. PLoS One 2011;6:e22152.
22. Pourshams A, Khademi H, Malekshah AF, Nouraei M, Sadjadi AR, Jafari E, et al. Cohort Profile: The Golestan Cohort Study--a prospective study of oesophageal cancer in northern Iran. Int J Epidemiol 2010;39:52-9.
79Islami et al.
Middle East Journal of Digestive Diseases/ Vol.6/ No.2/ April 2014
23. Chobanian AV, Bakris GL, Black HR, Cushman WC, Green LA, Izzo JL Jr, et al. Seventh report of the Joint National Committee on Prevention, Detection, Evalua-tion, and Treatment of High Blood Pressure. Hypertension 2003;42:1206-52.
24. Islami F, Kamangar F, Nasrollahzadeh D, Aghcheli K, So-toudeh M, Abedi-Ardekani B, et al. Socio-economic status and oesophageal cancer: results from a population-based case-control study in a high-risk area. Int J Epidemiol 2009;38:978-88.
25. Khademi H, Etemadi A, Kamangar F, Nouraie M, Shakeri R, Abaie B, et al. Verbal autopsy: reliability and validity estimates for causes of death in the Golestan Cohort Study in Iran. PLoS One 2010;5:e11183.
26. Islami F, Kamangar F, Aghcheli K, Fahimi S, Semnani S, Taghavi N, et al. Epidemiologic features of upper gastro-intestinal tract cancers in Northeastern Iran. Br J Cancer 2004;90:1402-6.
27. Rubenstein JH,Taylor JB. Meta-analysis: the association of oesophageal adenocarcinoma with symptoms of gastro-oe-sophageal reflux. Aliment Pharmacol Ther 2010;32:1222-7.
28. Hoyert DL, Xu J. Deaths: Preliminary Data for 2011. Na-tional Vital Statistics Reports 2012;61:40-2.
29. Hungin AP, Hill C, Raghunath A. Systematic review: fre-quency and reasons for consultation for gastro-oesophageal reflux disease and dyspepsia. Aliment Pharmacol Ther 2009;30:331-42.
30. Mizyed I, Fass SS, Fass R. Review article: gastro-oesopha-geal reflux disease and psychological comorbidity. Aliment Pharmacol Ther 2009;29:351-8.
31. Sharma A, Van Oudenhove L, Paine P, Gregory L, Aziz Q. et al. Anxiety increases acid-induced esophageal hyperal-gesia. Psychosom Med 2010;72:802-9.
32. Matsuki N, Fujita T, Watanabe N, Sugahara A, Watanabe A, Ishida T,et al. Lifestyle factors associated with gastro-esophageal reflux disease in the Japanese population. J Gastroenterol 2013;48:340-9.
33. Roshandel G, Sadjadi A, Aarabi M, Keshtkar A, Sedaghat SM, Nouraie SM,et al. Cancer incidence in Golestan Province: report of an ongoing population-based cancer registry in Iran between 2004 and 2008. Arch Iran Med 2012;15:196-200.
34. Ghasemi-Kebria F, Roshandel G, Semnani S, Shakeri R, Khoshnia M, Naeimi-Tabiei M, et al. Marked Increase in the Incidence Rate of Esophageal Adenocarcinoma in a High-risk Area for Esophageal Cancer. Arch Iran Med 2013;16:320-3.
35. Trivers KF, Sabatino SA, Stewart SL. Trends in esophageal cancer incidence by histology, United States, 1998-2003. Int J Cancer 2008;123:1422-8.
36. Steevens J, Botterweck AA, Dirx MJ, van den Brandt PA, Schouten LJ. Trends in incidence of oesophageal and stom-ach cancer subtypes in Europe. Eur J Gastroenterol Hepa-tol 2010;22:669-78.
37. Jemal A, Bray F, Center MM, Ferlay J, Ward E, For-man D , et al. Global cancer statistics. CA Cancer J Clin 2011;61:69-90.
38. Hur C, Miller M, Kong CY, Dowling EC, Nattinger KJ, Dunn M, et al. Trends in esophageal adenocarcinoma inci-dence and mortality. Cancer 2013;119:1149-58.
80 GERD and Mortality