trust performance report
TRANSCRIPT
Trust Performance
ReportException Summary
M2 – May 2021
M2 reporting
Indicator Comments Authoriser
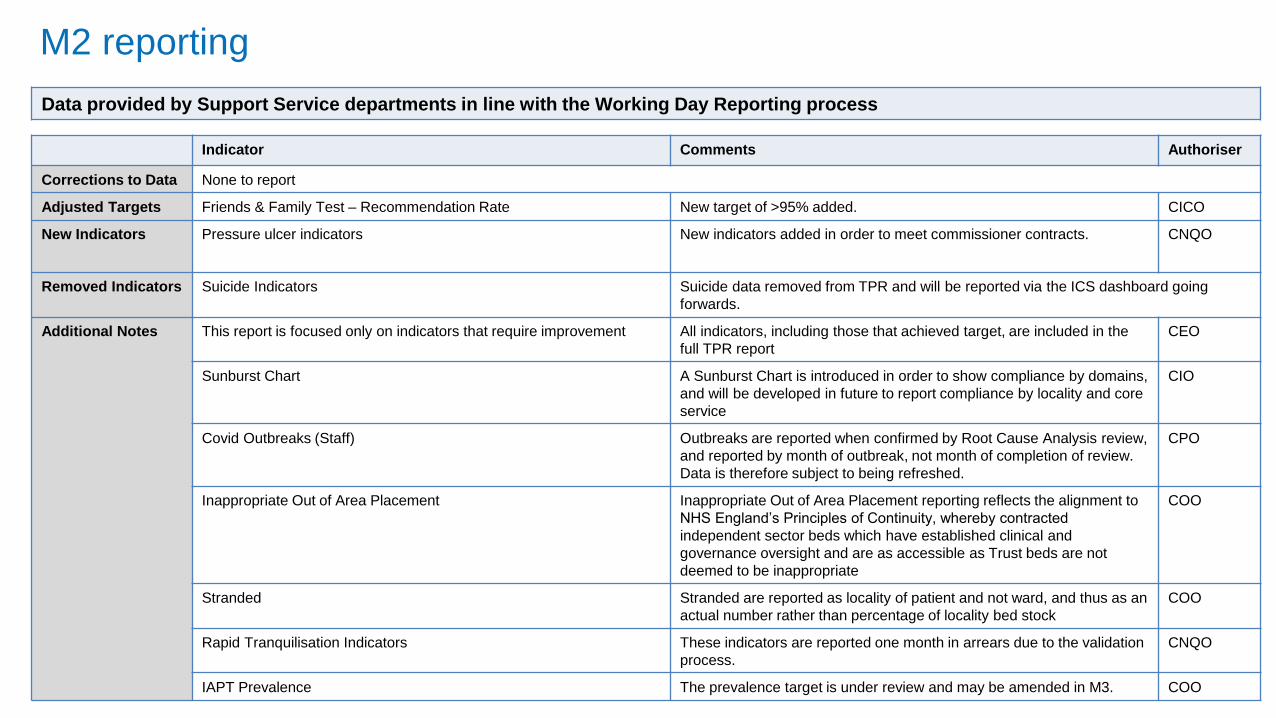
Corrections to Data None to report
Adjusted Targets Friends & Family Test – Recommendation Rate New target of >95% added. CICO
New Indicators Pressure ulcer indicators New indicators added in order to meet commissioner contracts. CNQO
Removed Indicators Suicide Indicators Suicide data removed from TPR and will be reported via the ICS dashboard going
forwards.
Additional Notes This report is focused only on indicators that require improvement All indicators, including those that achieved target, are included in the
full TPR report
CEO
Sunburst Chart A Sunburst Chart is introduced in order to show compliance by domains,
and will be developed in future to report compliance by locality and core
service
CIO
Covid Outbreaks (Staff) Outbreaks are reported when confirmed by Root Cause Analysis review,
and reported by month of outbreak, not month of completion of review.
Data is therefore subject to being refreshed.
CPO
Inappropriate Out of Area Placement Inappropriate Out of Area Placement reporting reflects the alignment to
NHS England’s Principles of Continuity, whereby contracted
independent sector beds which have established clinical and
governance oversight and are as accessible as Trust beds are not
deemed to be inappropriate
COO
Stranded Stranded are reported as locality of patient and not ward, and thus as an
actual number rather than percentage of locality bed stock
COO
Rapid Tranquilisation Indicators These indicators are reported one month in arrears due to the validation
process.
CNQO
IAPT Prevalence The prevalence target is under review and may be amended in M3. COO
Data provided by Support Service departments in line with the Working Day Reporting process
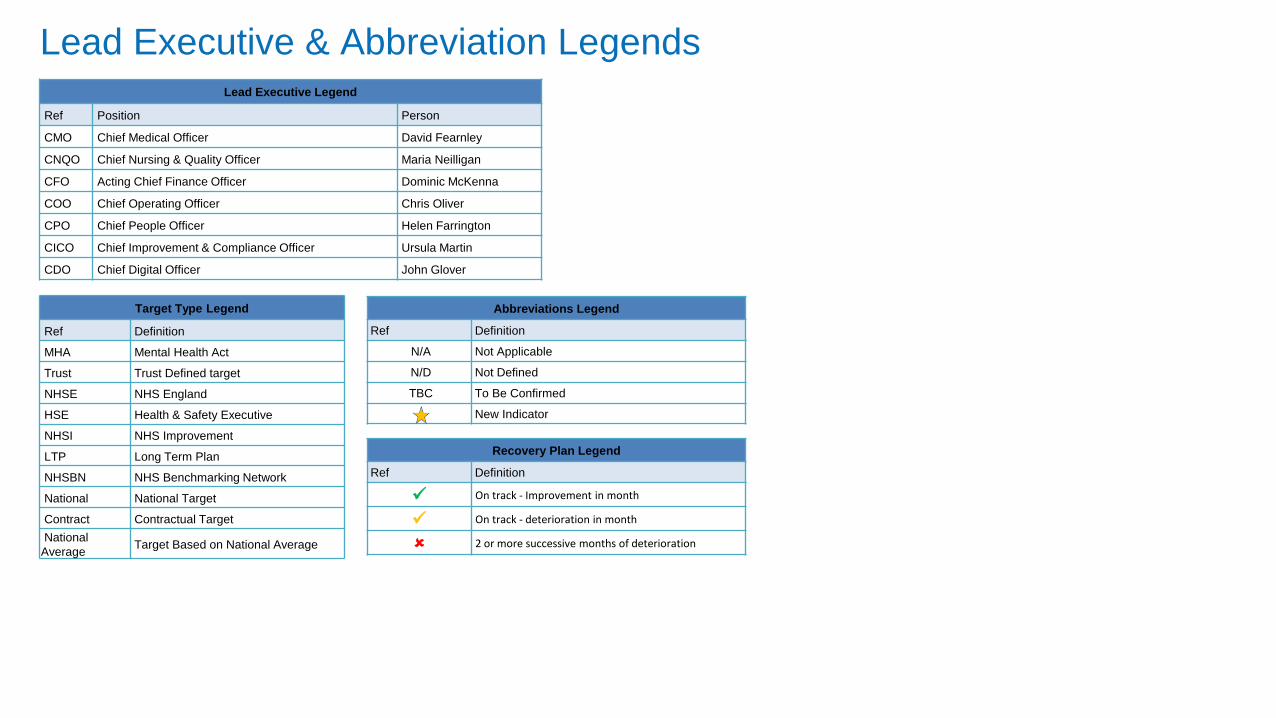
Lead Executive & Abbreviation LegendsLead Executive Legend
Ref Position Person
CMO Chief Medical Officer David Fearnley
CNQO Chief Nursing & Quality Officer Maria Neilligan
CFO Acting Chief Finance Officer Dominic McKenna
COO Chief Operating Officer Chris Oliver
CPO Chief People Officer Helen Farrington
CICO Chief Improvement & Compliance Officer Ursula Martin
CDO Chief Digital Officer John Glover
Target Type Legend
Ref Definition
MHA Mental Health Act
Trust Trust Defined target
NHSE NHS England
HSE Health & Safety Executive
NHSI NHS Improvement
LTP Long Term Plan
NHSBN NHS Benchmarking Network
National National Target
Contract Contractual Target
National
AverageTarget Based on National Average
Abbreviations Legend
Ref Definition
N/A Not Applicable
N/D Not Defined
TBC To Be Confirmed
New Indicator
Recovery Plan Legend
Ref Definition
On track - Improvement in month
On track - deterioration in month
2 or more successive months of deterioration
CQC Standards
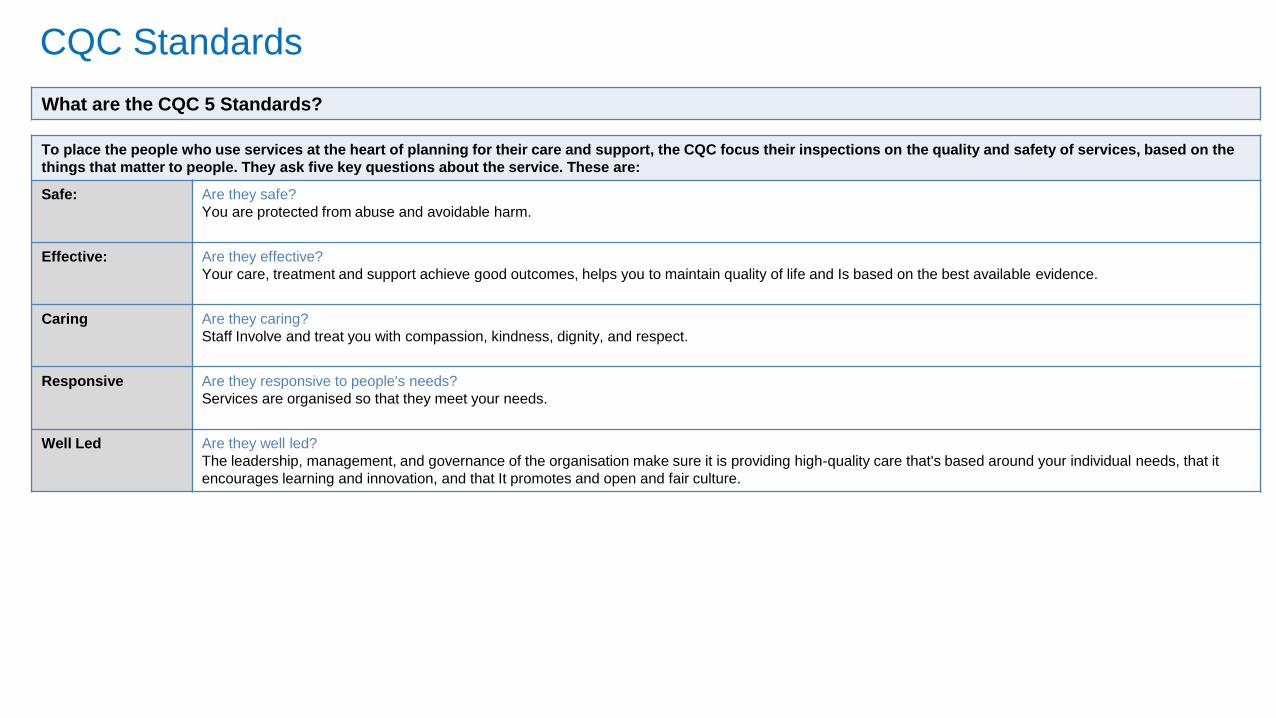
To place the people who use services at the heart of planning for their care and support, the CQC focus their inspections on the quality and safety of services, based on the
things that matter to people. They ask five key questions about the service. These are:
Safe: Are they safe?
You are protected from abuse and avoidable harm.
Effective: Are they effective?
Your care, treatment and support achieve good outcomes, helps you to maintain quality of life and Is based on the best available evidence.
Caring Are they caring?
Staff Involve and treat you with compassion, kindness, dignity, and respect.
Responsive Are they responsive to people's needs?
Services are organised so that they meet your needs.
Well Led Are they well led?
The leadership, management, and governance of the organisation make sure it is providing high-quality care that's based around your individual needs, that it
encourages learning and innovation, and that It promotes and open and fair culture.
What are the CQC 5 Standards?
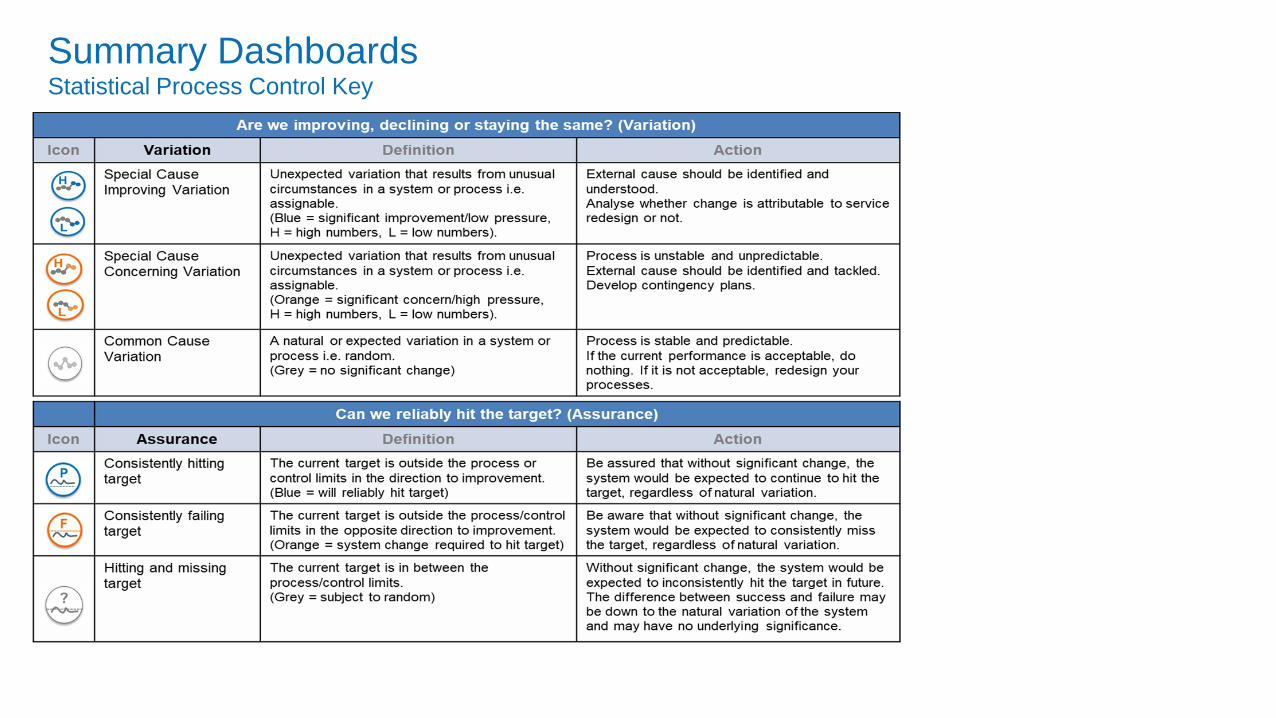
Summary DashboardsStatistical Process Control Key
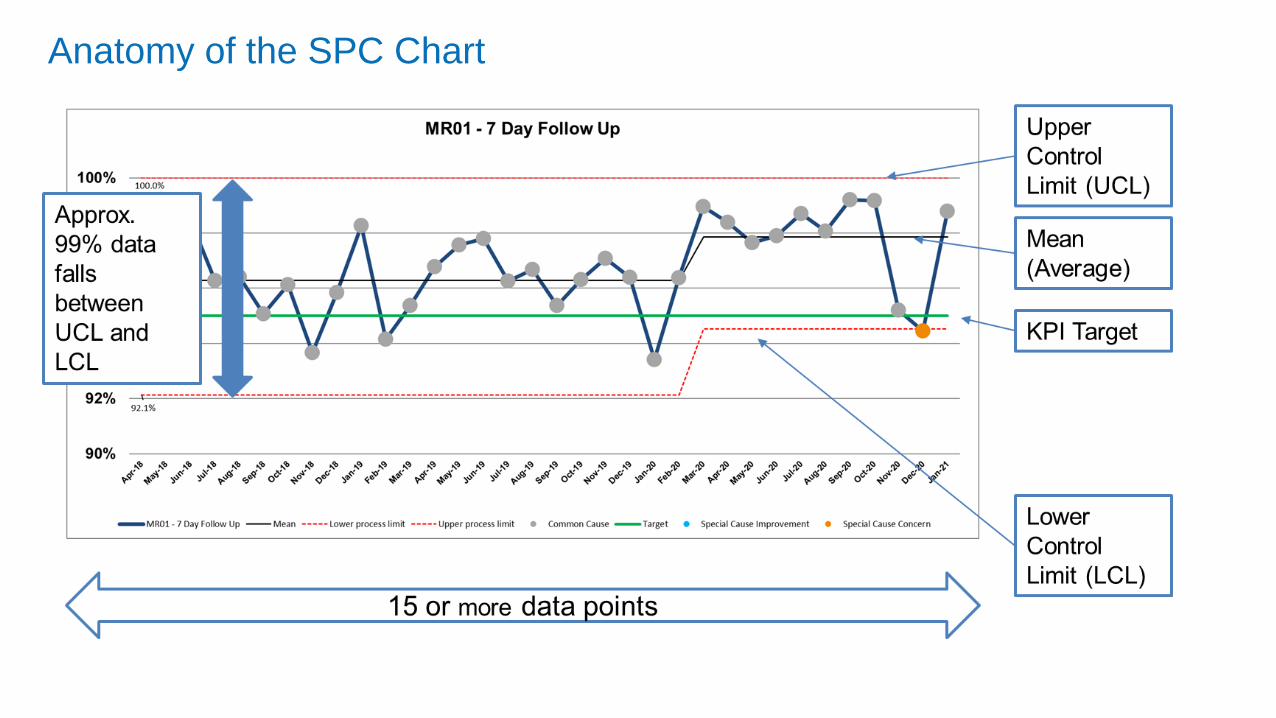
Anatomy of the SPC Chart
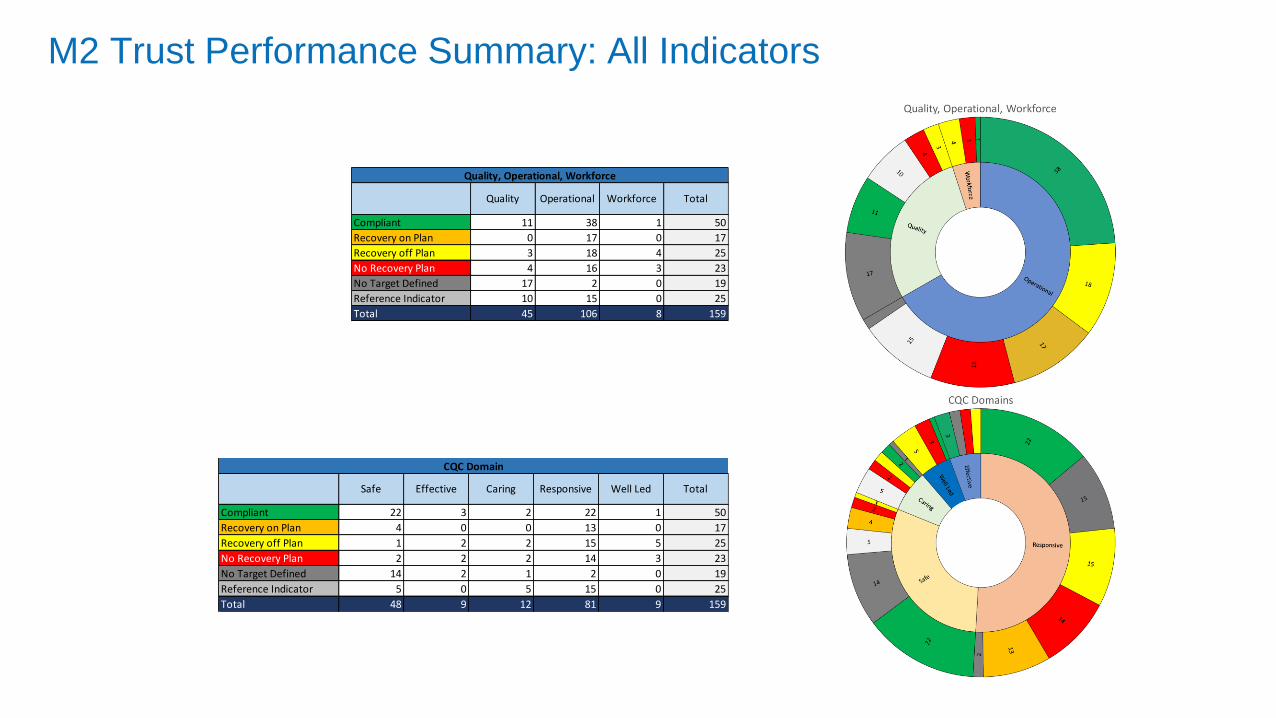
M2 Trust Performance Summary: All Indicators
Compliant 22 3 2 22 1 50
Recovery on Plan 4 0 0 13 0 17
Recovery off Plan 1 2 2 15 5 25
No Recovery Plan 2 2 2 14 3 23
No Target Defined 14 2 1 2 0 19
Reference Indicator 5 0 5 15 0 25
Total 48 9 12 81 9 159
Total
CQC Domain
EffectiveSafe Caring Responsive Well Led
Compliant 11 38 1 50
Recovery on Plan 0 17 0 17
Recovery off Plan 3 18 4 25
No Recovery Plan 4 16 3 23
No Target Defined 17 2 0 19
Reference Indicator 10 15 0 25
Total 45 106 8 159
Quality, Operational, Workforce
Operational Quality Total Workforce
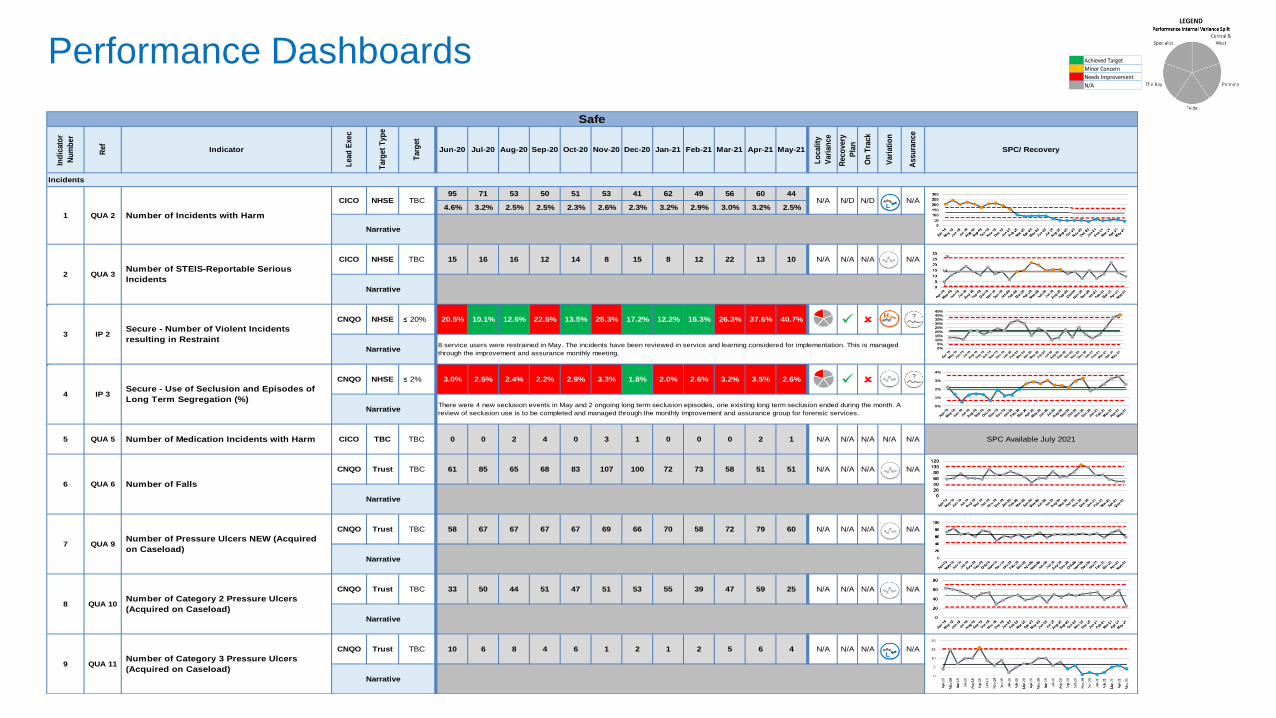
Performance Dashboards Achieved Target
Minor Concern
Needs Improvement
N/A
95 71 53 50 51 53 41 62 49 56 60 44
4.6% 3.2% 2.5% 2.5% 2.3% 2.6% 2.3% 3.2% 2.9% 3.0% 3.2% 2.5%
CICO NHSE 15 16 16 12 14 8 15 8 12 22 13 10 N/A N/A N/A N/A
CNQO NHSE ≤ 20% 20.5% 10.1% 12.6% 22.5% 13.5% 25.3% 17.2% 12.2% 16.3% 26.3% 37.6% 40.7%
CNQO NHSE ≤ 2% 3.0% 2.5% 2.4% 2.2% 2.9% 3.3% 1.8% 2.0% 2.6% 3.2% 3.5% 2.6%
CICO TBC 0 0 2 4 0 3 1 0 0 0 2 1 N/A N/A N/A N/A N/A SPC Available July 2021
CNQO Trust 61 85 65 68 83 107 100 72 73 58 51 51 N/A N/A N/A N/A
CNQO Trust 58 67 67 67 67 69 66 70 58 72 79 60 N/A N/A N/A N/A
CNQO Trust 33 50 44 51 47 51 53 55 39 47 59 25 N/A N/A N/A N/A
CNQO Trust 10 6 8 4 6 1 2 1 2 5 6 4 N/A N/A N/A N/A
Number of Medication Incidents with Harm TBC
Apr-21 May-21Jul-20 Aug-20
Narrative8 service users were restrained in May. The incidents have been reviewed in service and learning considered for implementation. This is managed
through the improvement and assurance monthly meeting.
4 IP 3Secure - Use of Seclusion and Episodes of
Long Term Segregation (%)
NarrativeThere were 4 new seclusion events in May and 2 ongoing long term seclusion episodes, one existing long term seclusion ended during the month. A
review of seclusion use is to be completed and managed through the monthly improvement and assurance group for forensic services.
N/D N/D N/A
1 QUA 2 Number of Incidents with Harm
CICO NHSE TBC
Narrative
Safe
Ind
icato
r
Nu
mb
er
Ref
Indicator
Lead
Exec
Targ
et
Typ
e
Targ
et
Jun-20
Lo
cali
ty
Vari
an
ce
Reco
very
Pla
n
On
Tra
ck
Vari
ati
on
Assu
ran
ce
SPC/ Recovery Jan-21 Feb-21 Mar-21
Narrative
Sep-20 Oct-20 Nov-20 Dec-20
Incidents
2 QUA 3Number of STEIS-Reportable Serious
Incidents
TBC
N/A
3 IP 2Secure - Number of Violent Incidents
resulting in Restraint
5 QUA 5
6 QUA 6 Number of Falls
TBC
Narrative
7 QUA 9Number of Pressure Ulcers NEW (Acquired
on Caseload)
TBC
Narrative
9 QUA 11Number of Category 3 Pressure Ulcers
(Acquired on Caseload)
TBC
Narrative
8 QUA 10Number of Category 2 Pressure Ulcers
(Acquired on Caseload)
TBC
Narrative
0%5%
10%15%20%25%30%35%40%45%
0%
1%
2%
3%
4%
Performance Dashboards Achieved Target
Minor Concern
Needs Improvement
N/A
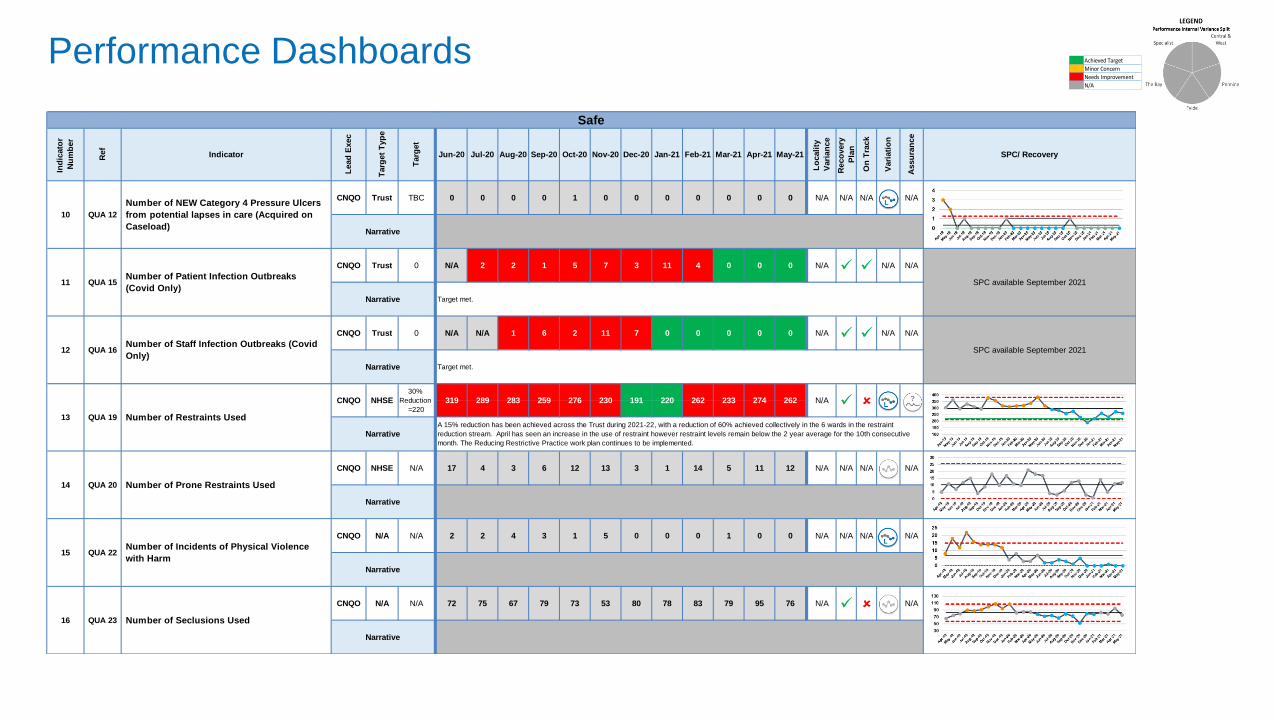
CNQO Trust 0 0 0 0 1 0 0 0 0 0 0 0 N/A N/A N/A N/A
CNQO Trust N/A 2 2 1 5 7 3 11 4 0 0 0 N/A N/A N/A
CNQO Trust N/A N/A 1 6 2 11 7 0 0 0 0 0 N/A N/A N/A
CNQO NHSE 17 4 3 6 12 13 3 1 14 5 11 12 N/A N/A N/A N/A
CNQO N/A 2 2 4 3 1 5 0 0 0 1 0 0 N/A N/A N/A N/A
CNQO N/A 72 75 67 79 73 53 80 78 83 79 95 76 N/A N/A
SPC available September 2021
Narrative Target met.
Ind
icato
r
Nu
mb
er
Ref
Indicator
Lead
Exec
Targ
et
Typ
e
Targ
et
Jun-20 Jul-20 Aug-20 Sep-20 Oct-20 Nov-20 Dec-20 Jan-21 Feb-21 Mar-21 Apr-21 May-21
Assu
ran
ce
SPC/ Recovery
11 QUA 15Number of Patient Infection Outbreaks
(Covid Only)
0
Safe
NHSE30%
Reduction
=220
10 QUA 12
Number of NEW Category 4 Pressure Ulcers
from potential lapses in care (Acquired on
Caseload)
TBC
Narrative
Lo
cali
ty
Vari
an
ce
Reco
very
Pla
n
On
Tra
ck
Vari
ati
on
12 QUA 16Number of Staff Infection Outbreaks (Covid
Only)
0
SPC available September 2021
Narrative Target met.
NarrativeA 15% reduction has been achieved across the Trust during 2021-22, with a reduction of 60% achieved collectively in the 6 wards in the restraint
reduction stream. April has seen an increase in the use of restraint however restraint levels remain below the 2 year average for the 10th consecutive
month. The Reducing Restrictive Practice work plan continues to be implemented.
14 QUA 20 Number of Prone Restraints Used
N/A
Narrative
N/A 191 220276 230
13 QUA 19 Number of Restraints Used
CNQO
15 QUA 22Number of Incidents of Physical Violence
with Harm
N/A
Narrative
262 233 274 262319 289 283 259
16 QUA 23 Number of Seclusions Used
N/A
Narrative
Performance Dashboards Achieved Target
Minor Concern
Needs Improvement
N/A
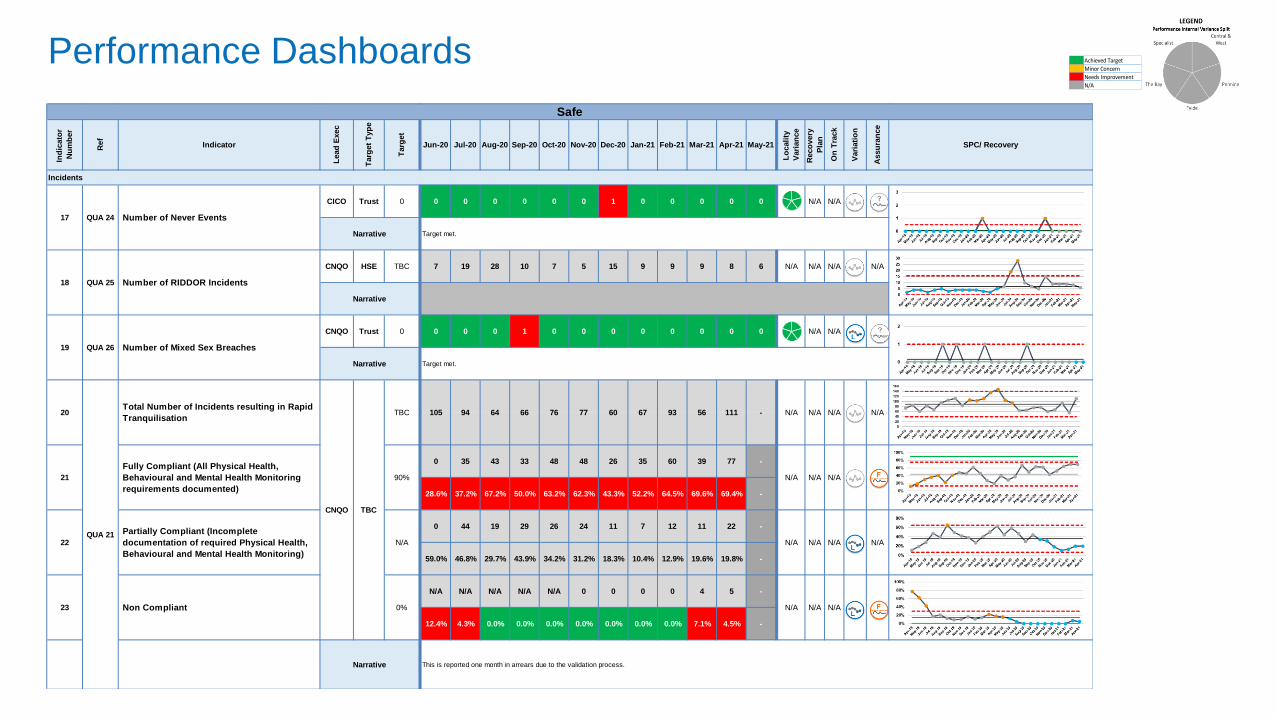
CICO Trust 0 0 0 0 0 0 1 0 0 0 0 0 N/A N/A
CNQO HSE 7 19 28 10 7 5 15 9 9 9 8 6 N/A N/A N/A N/A
CNQO Trust 0 0 0 1 0 0 0 0 0 0 0 0 N/A N/A
0 35 43 33 48 48 26 35 60 39 77 -
28.6% 37.2% 67.2% 50.0% 63.2% 62.3% 43.3% 52.2% 64.5% 69.6% 69.4% -
0 44 19 29 26 24 11 7 12 11 22 -
59.0% 46.8% 29.7% 43.9% 34.2% 31.2% 18.3% 10.4% 12.9% 19.6% 19.8% -
N/A N/A N/A N/A N/A 0 0 0 0 4 5 -
12.4% 4.3% 0.0% 0.0% 0.0% 0.0% 0.0% 0.0% 0.0% 7.1% 4.5% -
76 7720
QUA 21
Total Number of Incidents resulting in Rapid
Tranquilisation
CNQO TBC
TBC
N/A N/A N/A N/A
21
Fully Compliant (All Physical Health,
Behavioural and Mental Health Monitoring
requirements documented)
90% N/A N/A N/A
N/A N/A N/A N/A60 67 93 56 111 -105 94 64 66
Aug-20 Sep-20 Oct-20 Nov-20 Dec-20
Safe
Mar-21 Apr-21 May-21
Incidents
17 QUA 24 Number of Never Events
0
Narrative Target met.
Narrative This is reported one month in arrears due to the validation process.
23 Non Compliant 0% N/A N/A N/A
22
Ind
icato
r
Nu
mb
er
Ref
Indicator
Lead
Exec
Targ
et
Typ
e
Targ
et
Jun-20
TBC
Narrative
Lo
cali
ty
Vari
an
ce
Reco
very
Pla
n
On
Tra
ck
Vari
ati
on
Assu
ran
ce
SPC/ Recovery Jan-21 Feb-21Jul-20
Target met.
19 QUA 26 Number of Mixed Sex Breaches
0
Narrative
18 QUA 25 Number of RIDDOR Incidents
Partially Compliant (Incomplete
documentation of required Physical Health,
Behavioural and Mental Health Monitoring)
N/A
Performance Dashboards Achieved Target
Minor Concern
Needs Improvement
N/A
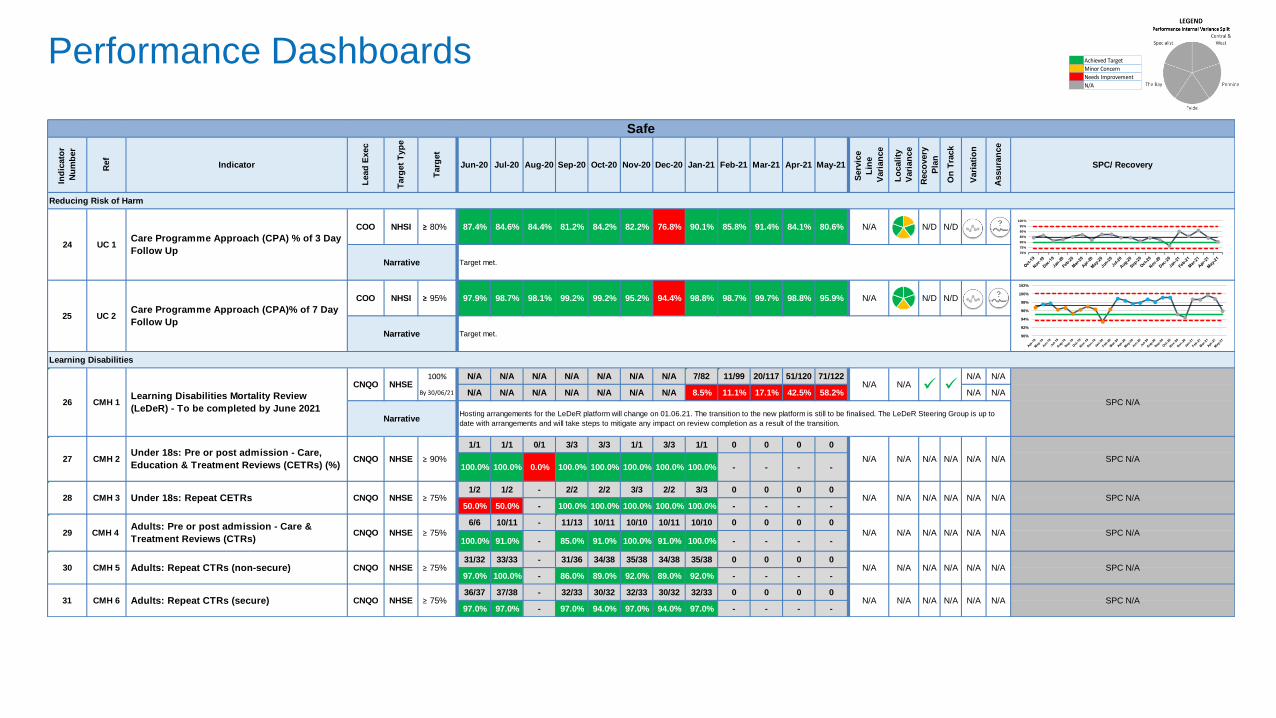
COO NHSI ≥ 80% 87.4% 84.6% 84.4% 81.2% 84.2% 82.2% 76.8% 90.1% 85.8% 91.4% 84.1% 80.6% N/A N/D N/D
COO NHSI ≥ 95% 97.9% 98.7% 98.1% 99.2% 99.2% 95.2% 94.4% 98.8% 98.7% 99.7% 98.8% 95.9% N/A N/D N/D
N/A N/A N/A N/A N/A N/A N/A 7/82 11/99 20/117 51/120 71/122 N/A N/A
N/A N/A N/A N/A N/A N/A N/A 8.5% 11.1% 17.1% 42.5% 58.2% N/A N/A
1/1 1/1 0/1 3/3 3/3 1/1 3/3 1/1 0 0 0 0
100.0% 100.0% 0.0% 100.0% 100.0% 100.0% 100.0% 100.0% - - - -
1/2 1/2 - 2/2 2/2 3/3 2/2 3/3 0 0 0 0
50.0% 50.0% - 100.0% 100.0% 100.0% 100.0% 100.0% - - - -
6/6 10/11 - 11/13 10/11 10/10 10/11 10/10 0 0 0 0
100.0% 91.0% - 85.0% 91.0% 100.0% 91.0% 100.0% - - - -
31/32 33/33 - 31/36 34/38 35/38 34/38 35/38 0 0 0 0
97.0% 100.0% - 86.0% 89.0% 92.0% 89.0% 92.0% - - - -
36/37 37/38 - 32/33 30/32 32/33 30/32 32/33 0 0 0 0
97.0% 97.0% - 97.0% 94.0% 97.0% 94.0% 97.0% - - - -
Safe
Ind
icato
r
Nu
mb
er
Ref
Indicator
Lead
Exec
Targ
et
Typ
e
Targ
et
Jun-20 Jul-20 May-21
Serv
ice
Lin
e
Vari
an
ce
Lo
cali
ty
Vari
an
ce
Aug-20 Sep-20 Oct-20 Nov-20 Dec-20 Jan-21
NHSE ≥ 75%
24 UC 1Care Programme Approach (CPA) % of 3 Day
Follow Up
Target met.
Reco
very
Pla
n
On
Tra
ck
Vari
ati
on
Assu
ran
ce
SPC/ Recovery
Reducing Risk of Harm
Feb-21 Mar-21 Apr-21
Narrative Target met.
25 UC 2Care Programme Approach (CPA)% of 7 Day
Follow Up
Narrative
26 CMH 1Learning Disabilities Mortality Review
(LeDeR) - To be completed by June 2021
CNQO NHSE100%
N/A N/A
SPC N/A
29 CMH 4 Adults: Pre or post admission - Care &
Treatment Reviews (CTRs)CNQO
By 30/06/21
NarrativeHosting arrangements for the LeDeR platform will change on 01.06.21. The transition to the new platform is still to be finalised. The LeDeR Steering Group is up to
date with arrangements and will take steps to mitigate any impact on review completion as a result of the transition.
28 CMH 3 Under 18s: Repeat CETRs CNQO NHSE ≥ 75%
Learning Disabilities
27 CMH 2Under 18s: Pre or post admission - Care,
Education & Treatment Reviews (CETRs) (%)CNQO NHSE ≥ 90% N/A N/A N/A N/A N/A N/A SPC N/A
SPC N/A
30 CMH 5 Adults: Repeat CTRs (non-secure) CNQO NHSE ≥ 75% N/A N/A N/A N/A N/A N/A SPC N/A
31 CMH 6 Adults: Repeat CTRs (secure) CNQO NHSE ≥ 75% N/A N/A N/A N/A N/A N/A
N/A N/A N/A N/A N/A N/A
SPC N/A
N/A N/A N/A N/A N/A N/A SPC N/A
90%
92%
94%
96%
98%
100%
102%
Jan-00 Jan-00 Jan-00 Jan-00 Jan-00 Jan-00
70%
75%
80%
85%
90%
95%
100%
Performance Dashboards Achieved Target
Minor Concern
Needs Improvement
N/A
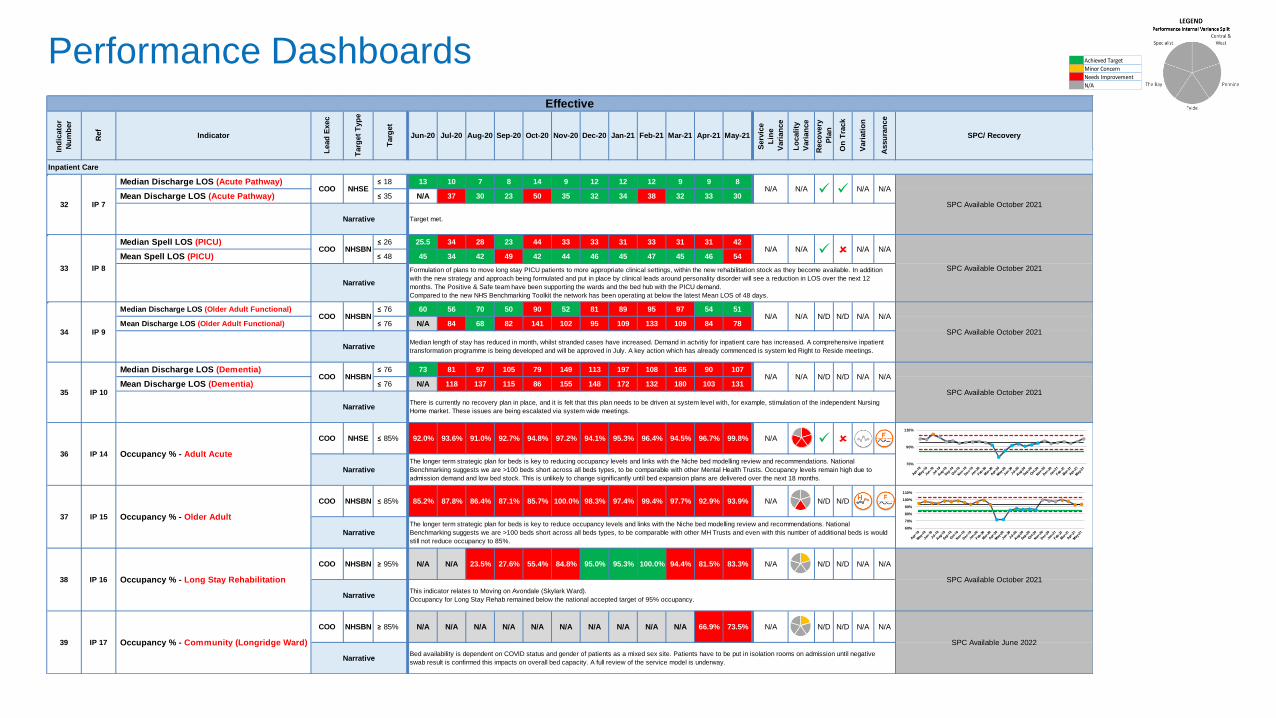
Median Discharge LOS (Acute Pathway) ≤ 18 13 10 7 8 14 9 12 12 12 9 9 8
Mean Discharge LOS (Acute Pathway) ≤ 35 N/A 37 30 23 50 35 32 34 38 32 33 30
Median Spell LOS (PICU) ≤ 26 25.5 34 28 23 44 33 33 31 33 31 31 42
Mean Spell LOS (PICU) ≤ 48 45 34 42 49 42 44 46 45 47 45 46 54
Median Discharge LOS (Older Adult Functional) ≤ 76 60 56 70 50 90 52 81 89 95 97 54 51
Mean Discharge LOS (Older Adult Functional) ≤ 76 N/A 84 68 82 141 102 95 109 133 109 84 78
Median Discharge LOS (Dementia) ≤ 76 73 81 97 105 79 149 113 197 108 165 90 107
Mean Discharge LOS (Dementia) ≤ 76 N/A 118 137 115 86 155 148 172 132 180 103 131
COO NHSE ≤ 85% 92.0% 93.6% 91.0% 92.7% 94.8% 97.2% 94.1% 95.3% 96.4% 94.5% 96.7% 99.8% N/A
COO NHSBN ≤ 85% 85.2% 87.8% 86.4% 87.1% 85.7% 100.0% 98.3% 97.4% 99.4% 97.7% 92.9% 93.9% N/A N/D N/D
COO NHSBN ≥ 95% N/A N/A 23.5% 27.6% 55.4% 84.8% 95.0% 95.3% 100.0% 94.4% 81.5% 83.3% N/A N/D N/D N/A N/A
COO NHSBN ≥ 85% N/A N/A N/A N/A N/A N/A N/A N/A N/A N/A 66.9% 73.5% N/A N/D N/D N/A N/A
N/A N/A
SPC Available October 2021
NarrativeThere is currently no recovery plan in place, and it is felt that this plan needs to be driven at system level with, for example, stimulation of the independent Nursing
Home market. These issues are being escalated via system wide meetings.
Narrative
Formulation of plans to move long stay PICU patients to more appropriate clinical settings, within the new rehabilitation stock as they become available. In addition
with the new strategy and approach being formulated and put in place by clinical leads around personality disorder will see a reduction in LOS over the next 12
months. The Positive & Safe team have been supporting the wards and the bed hub with the PICU demand.
Compared to the new NHS Benchmarking Toolkit the network has been operating at below the latest Mean LOS of 48 days.
34 IP 9
COO NHSBN N/A N/A N/D N/D N/A N/A
SPC Available October 2021
NarrativeMedian length of stay has reduced in month, whilst stranded cases have increased. Demand in actvitiy for inpatient care has increased. A comprehensive inpatient
transformation programme is being developed and will be approved in July. A key action which has already commenced is system led Right to Reside meetings.
Inpatient Care
32 IP 7
COO NHSE N/A N/A N/A N/A
SPC Available October 2021
Narrative Target met.
33 IP 8
COO NHSBN N/A N/A
N/D
N/A N/A
SPC Available October 2021
35 IP 10
COO NHSBN N/A N/A N/D
36 IP 14 Occupancy % - Adult Acute
39 IP 17 Occupancy % - Community (Longridge Ward)
Effective
NarrativeThe longer term strategic plan for beds is key to reducing occupancy levels and links with the Niche bed modelling review and recommendations. National
Benchmarking suggests we are >100 beds short across all beds types, to be comparable with other Mental Health Trusts. Occupancy levels remain high due to
admission demand and low bed stock. This is unlikely to change significantly until bed expansion plans are delivered over the next 18 months.
37 IP 15 Occupancy % - Older Adult
NarrativeThe longer term strategic plan for beds is key to reduce occupancy levels and links with the Niche bed modelling review and recommendations. National
Benchmarking suggests we are >100 beds short across all beds types, to be comparable with other MH Trusts and even with this number of additional beds is would
still not reduce occupancy to 85%.
SPC Available October 2021
This indicator relates to Moving on Avondale (Skylark Ward).
Occupancy for Long Stay Rehab remained below the national accepted target of 95% occupancy.
SPC Available June 2022
NarrativeBed availability is dependent on COVID status and gender of patients as a mixed sex site. Patients have to be put in isolation rooms on admission until negative
swab result is confirmed this impacts on overall bed capacity. A full review of the service model is underway.
38 IP 16 Occupancy % - Long Stay Rehabilitation
Narrative
Ind
icato
r
Nu
mb
er
Ref
Indicator
Lead
Exec
Targ
et
Typ
e
Targ
et
Jun-20 Jul-20 Aug-20 Sep-20 Oct-20 Nov-20 Dec-20 Jan-21 Feb-21 Mar-21 Apr-21 May-21
Serv
ice
Lin
e
Vari
an
ce
Lo
cali
ty
Vari
an
ce
Reco
very
Pla
n
On
Tra
ck
Vari
ati
on
Assu
ran
ce
SPC/ Recovery
70%
90%
110%
60%
70%
80%
90%
100%
110%
Performance Dashboards Achieved Target
Minor Concern
Needs Improvement
N/A
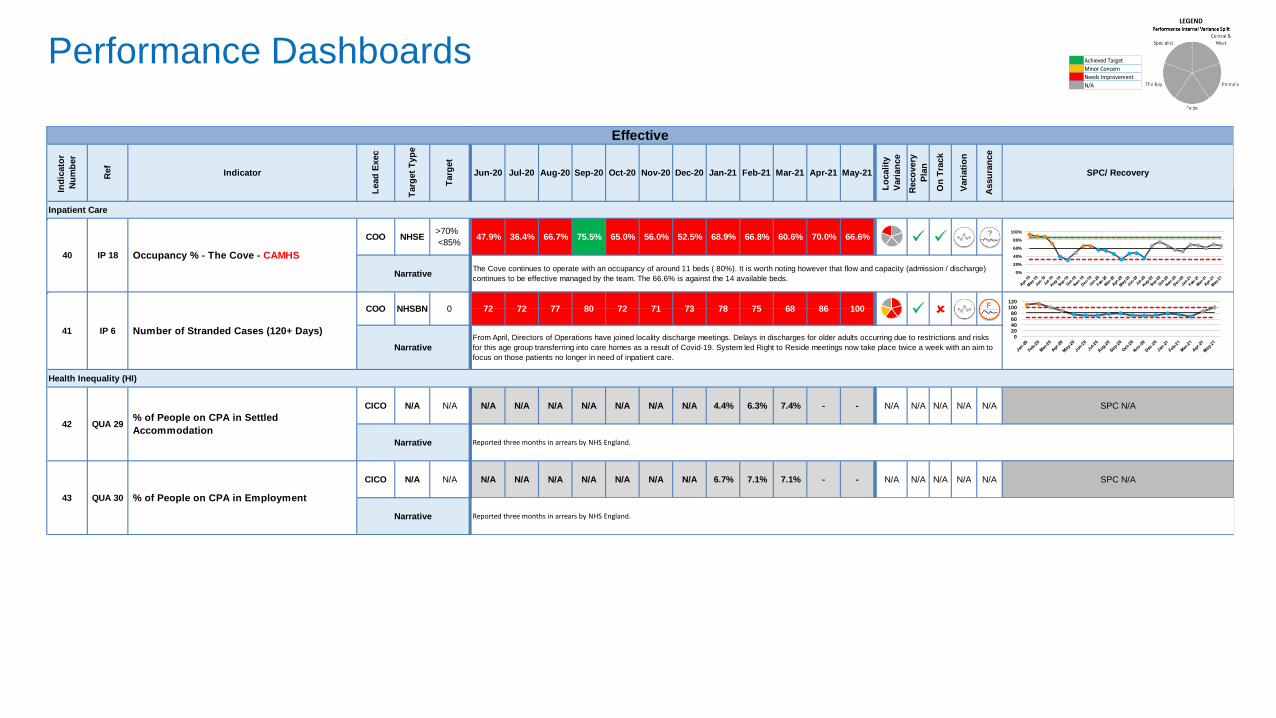
COO NHSE 47.9% 36.4% 66.7% 75.5% 65.0% 56.0% 52.5% 68.9% 66.8% 60.6% 70.0% 66.6%
CICO N/A N/A N/A N/A N/A N/A N/A N/A 4.4% 6.3% 7.4% - - N/A N/A N/A N/A N/A SPC N/A
CICO N/A N/A N/A N/A N/A N/A N/A N/A 6.7% 7.1% 7.1% - - N/A N/A N/A N/A N/A SPC N/A
Ind
icato
r
Nu
mb
er
Ref
Indicator
Lead
Exec
Targ
et
Typ
e
Targ
et
Jun-20 Jul-20 Aug-20 Sep-20 Oct-20 Nov-20 Dec-20 Jan-21 Feb-21 Mar-21 Apr-21 May-21
Lo
cali
ty
Vari
an
ce
Reco
very
Pla
n
On
Tra
ck
Vari
ati
on
Assu
ran
ce
SPC/ Recovery
NarrativeThe Cove continues to operate with an occupancy of around 11 beds ( 80%). It is worth noting however that flow and capacity (admission / discharge)
continues to be effective managed by the team. The 66.6% is against the 14 available beds.
NarrativeFrom April, Directors of Operations have joined locality discharge meetings. Delays in discharges for older adults occurring due to restrictions and risks
for this age group transferring into care homes as a result of Covid-19. System led Right to Reside meetings now take place twice a week with an aim to
focus on those patients no longer in need of inpatient care.
IP 18 Occupancy % - The Cove - CAMHS
>70%
<85%
41 IP 6 Number of Stranded Cases (120+ Days)
COO NHSBN 0 72 72 77 80 72 71 73 78 75 68 86 100
Health Inequality (HI)
42 QUA 29% of People on CPA in Settled
Accommodation
N/A
Narrative Reported three months in arrears by NHS England.
43 QUA 30 % of People on CPA in Employment
N/A
40
Narrative Reported three months in arrears by NHS England.
Effective
Inpatient Care
020406080
100120
0%
20%
40%
60%
80%
100%
Performance Dashboards Achieved Target
Minor Concern
Needs Improvement
N/A
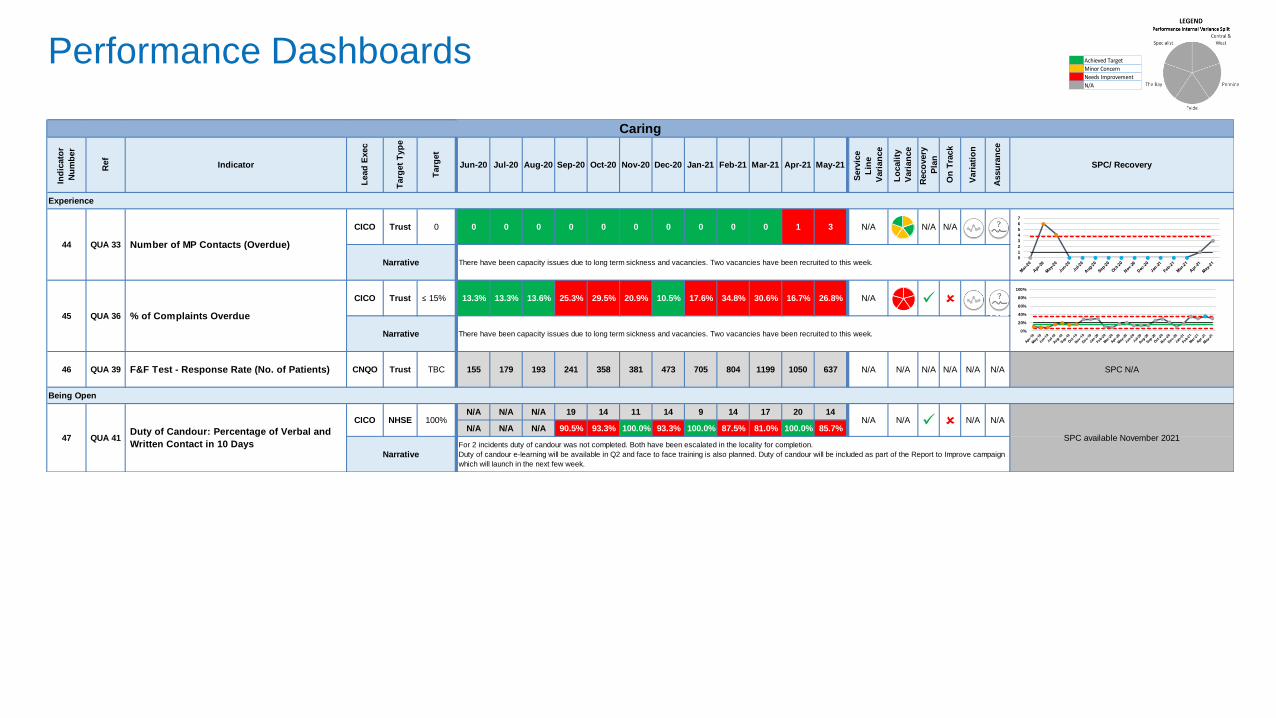
CICO Trust 0 0 0 0 0 0 0 0 0 0 1 3 N/A N/A N/A
CICO Trust ≤ 15% 13.3% 13.3% 13.6% 25.3% 29.5% 20.9% 10.5% 17.6% 34.8% 30.6% 16.7% 26.8% N/A
CNQO Trust 155 179 193 241 358 381 473 705 804 1199 1050 637 N/A N/A N/A N/A N/A N/A SPC N/A
N/A N/A N/A 19 14 11 14 9 14 17 20 14
N/A N/A N/A 90.5% 93.3% 100.0% 93.3% 100.0% 87.5% 81.0% 100.0% 85.7%
44 QUA 33 Number of MP Contacts (Overdue)
0
Narrative There have been capacity issues due to long term sickness and vacancies. Two vacancies have been recruited to this week.
45 QUA 36 % of Complaints Overdue
Narrative There have been capacity issues due to long term sickness and vacancies. Two vacancies have been recruited to this week.
QUA 39 F&F Test - Response Rate (No. of Patients) TBC46
N/A N/A
SPC available November 2021
NarrativeFor 2 incidents duty of candour was not completed. Both have been escalated in the locality for completion.
Duty of candour e-learning will be available in Q2 and face to face training is also planned. Duty of candour will be included as part of the Report to Improve campaign
which will launch in the next few week.
47 QUA 41Duty of Candour: Percentage of Verbal and
Written Contact in 10 Days
CICO NHSE 100% N/A N/A
Being Open
Caring
Assu
ran
ce
SPC/ Recovery
Experience
Ind
icato
r
Nu
mb
er
Ref
Indicator
Lead
Exec
Targ
et
Typ
e
Targ
et
Jun-20 Jul-20 Aug-20 Sep-20 Oct-20 Nov-20 Dec-20 Jan-21 Feb-21 Mar-21 Apr-21 May-21
Serv
ice
Lin
e
Vari
an
ce
Lo
cali
ty
Vari
an
ce
Reco
very
Pla
n
On
Tra
ck
Vari
ati
on
0
1
2
3
4
5
6
7
0%
20%
40%
60%
80%
100%
Performance Dashboards Achieved Target
Minor Concern
Needs Improvement
N/A
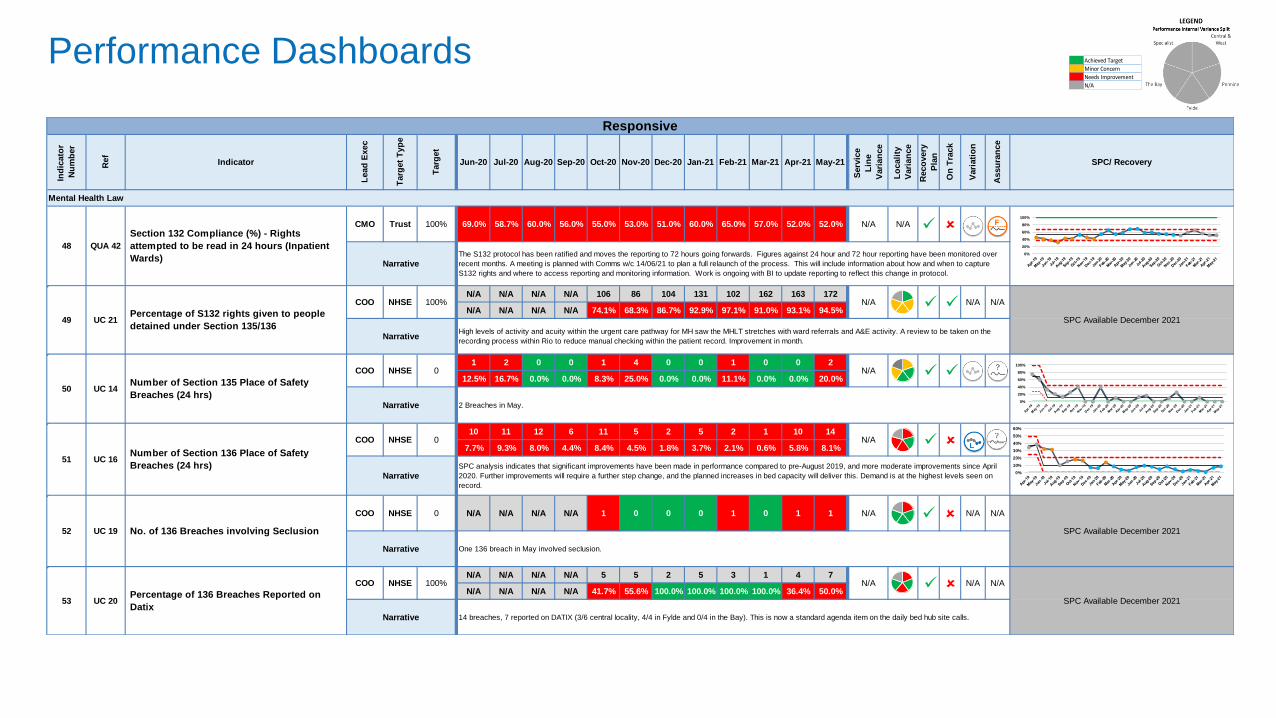
CMO Trust 69.0% 58.7% 60.0% 56.0% 55.0% 53.0% 51.0% 60.0% 65.0% 57.0% 52.0% 52.0% N/A N/A
N/A N/A N/A N/A 106 86 104 131 102 162 163 172
N/A N/A N/A N/A 74.1% 68.3% 86.7% 92.9% 97.1% 91.0% 93.1% 94.5%
1 2 0 0 1 4 0 0 1 0 0 2
12.5% 16.7% 0.0% 0.0% 8.3% 25.0% 0.0% 0.0% 11.1% 0.0% 0.0% 20.0%
10 11 12 6 11 5 2 5 2 1 10 14
7.7% 9.3% 8.0% 4.4% 8.4% 4.5% 1.8% 3.7% 2.1% 0.6% 5.8% 8.1%
COO NHSE N/A N/A N/A N/A 1 0 0 0 1 0 1 1 N/A N/A N/A
N/A N/A N/A N/A 5 5 2 5 3 1 4 7
N/A N/A N/A N/A 41.7% 55.6% 100.0% 100.0% 100.0% 100.0% 36.4% 50.0%
May-21
Serv
ice
Lin
e
Vari
an
ce
Lo
cali
ty
Vari
an
ce
Reco
very
Pla
n
On
Tra
ck
Vari
ati
on
Assu
ran
ce
SPC/ Recovery
Ind
icato
r
Nu
mb
er
Ref
Indicator
Lead
Exec
Targ
et
Typ
e
Targ
et
Jun-20 Jul-20 Aug-20 Sep-20 Oct-20 Nov-20 Dec-20 Jan-21 Feb-21 Mar-21 Apr-21
Mental Health Law
48 QUA 42
Section 132 Compliance (%) - Rights
attempted to be read in 24 hours (Inpatient
Wards)
100%
NarrativeThe S132 protocol has been ratified and moves the reporting to 72 hours going forwards. Figures against 24 hour and 72 hour reporting have been monitored over
recent months. A meeting is planned with Comms w/c 14/06/21 to plan a full relaunch of the process. This will include information about how and when to capture
S132 rights and where to access reporting and monitoring information. Work is ongoing with BI to update reporting to reflect this change in protocol.
Responsive
50 UC 14Number of Section 135 Place of Safety
Breaches (24 hrs)
COO NHSE 0 N/A
Narrative 2 Breaches in May.
NarrativeSPC analysis indicates that significant improvements have been made in performance compared to pre-August 2019, and more moderate improvements since April
2020. Further improvements will require a further step change, and the planned increases in bed capacity will deliver this. Demand is at the highest levels seen on
record.
51 UC 16Number of Section 136 Place of Safety
Breaches (24 hrs)
COO NHSE 0 N/A
53 UC 20Percentage of 136 Breaches Reported on
Datix
COO NHSE 100% N/A
52 UC 19 No. of 136 Breaches involving Seclusion
0
SPC Available December 2021
Narrative One 136 breach in May involved seclusion.
COO NHSE 100% N/A N/A N/A
SPC Available December 2021
N/A N/A
SPC Available December 2021
NarrativeHigh levels of activity and acuity within the urgent care pathway for MH saw the MHLT stretches with ward referrals and A&E activity. A review to be taken on the
recording process within Rio to reduce manual checking within the patient record. Improvement in month.
Narrative 14 breaches, 7 reported on DATIX (3/6 central locality, 4/4 in Fylde and 0/4 in the Bay). This is now a standard agenda item on the daily bed hub site calls.
49 UC 21Percentage of S132 rights given to people
detained under Section 135/136
0%
20%
40%
60%
80%
100%
0%
20%
40%
60%
80%
100%
0%
10%
20%
30%
40%
50%
60%
Performance Dashboards Achieved Target
Minor Concern
Needs Improvement
N/A
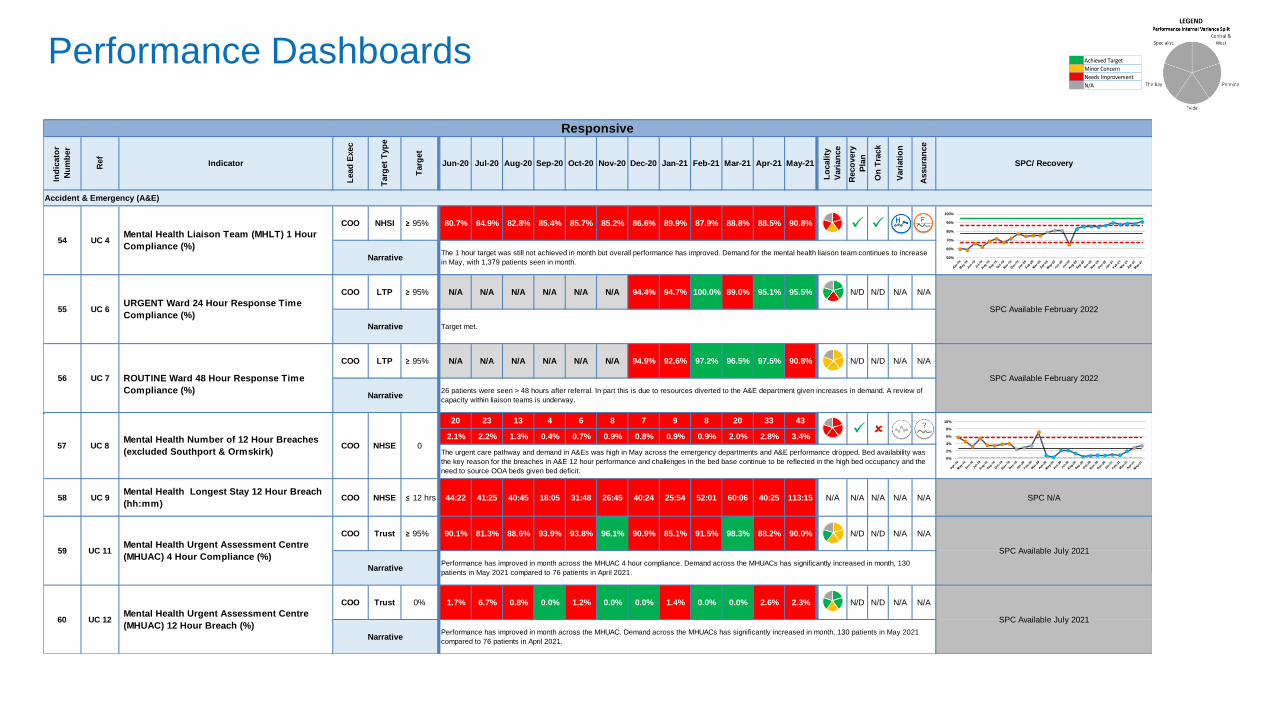
COO NHSI ≥ 95% 80.7% 64.9% 82.8% 85.4% 85.7% 85.2% 86.6% 89.9% 87.9% 88.8% 88.5% 90.8%
COO LTP ≥ 95% N/A N/A N/A N/A N/A N/A 94.4% 94.7% 100.0% 89.0% 95.1% 95.5% N/D N/D N/A N/A
COO LTP ≥ 95% N/A N/A N/A N/A N/A N/A 94.9% 92.6% 97.2% 96.5% 97.5% 90.8% N/D N/D N/A N/A
20 23 13 4 6 8 7 9 8 20 33 43
2.1% 2.2% 1.3% 0.4% 0.7% 0.9% 0.8% 0.9% 0.9% 2.0% 2.8% 3.4%
58 UC 9Mental Health Longest Stay 12 Hour Breach
(hh:mm)COO NHSE ≤ 12 hrs 44:22 41:25 40:45 18:05 31:48 26:45 40:24 25:54 52:01 60:06 40:25 113:15 N/A N/A N/A N/A N/A SPC N/A
COO Trust ≥ 95% 90.1% 81.3% 88.6% 93.9% 93.8% 96.1% 90.9% 85.1% 91.5% 98.3% 88.2% 90.0% N/D N/D N/A N/A
COO Trust 1.7% 6.7% 0.8% 0.0% 1.2% 0.0% 0.0% 1.4% 0.0% 0.0% 2.6% 2.3% N/D N/D N/A N/A
Vari
ati
on
Assu
ran
ce
SPC/ Recovery
57 UC 8Mental Health Number of 12 Hour Breaches
(excluded Southport & Ormskirk)
Responsive
Ind
icato
r
Nu
mb
er
Ref
Indicator
Lead
Exec
Targ
et
Typ
e
Targ
et
Jun-20 Jul-20 Aug-20 Sep-20 Oct-20 Nov-20 Dec-20 Jan-21 Feb-21 Mar-21 Apr-21 May-21
Lo
cali
ty
Vari
an
ce
Reco
very
Pla
n
On
Tra
ck
54 UC 4Mental Health Liaison Team (MHLT) 1 Hour
Compliance (%)
NarrativeThe 1 hour target was still not achieved in month but overall performance has improved. Demand for the mental health liaison team continues to increase
in May, with 1,379 patients seen in month.
COO NHSE 0
Narrative Target met.
56 UC 7 ROUTINE Ward 48 Hour Response Time
Compliance (%)
SPC Available February 2022
Narrative26 patients were seen > 48 hours after referral. In part this is due to resources diverted to the A&E department given increases in demand. A review of
capacity within liaison teams is underway.
55 UC 6URGENT Ward 24 Hour Response Time
Compliance (%)SPC Available February 2022
The urgent care pathway and demand in A&Es was high in May across the emergency departments and A&E performance dropped. Bed availability was
the key reason for the breaches in A&E 12 hour performance and challenges in the bed base continue to be reflected in the high bed occupancy and the
need to source OOA beds given bed deficit.
59 UC 11Mental Health Urgent Assessment Centre
(MHUAC) 4 Hour Compliance (%)SPC Available July 2021
NarrativePerformance has improved in month across the MHUAC 4 hour compliance. Demand across the MHUACs has significantly increased in month, 130
patients in May 2021 compared to 76 patients in April 2021.
NarrativePerformance has improved in month across the MHUAC. Demand across the MHUACs has significantly increased in month, 130 patients in May 2021
compared to 76 patients in April 2021.
Accident & Emergency (A&E)
60 UC 12Mental Health Urgent Assessment Centre
(MHUAC) 12 Hour Breach (%)
0%
SPC Available July 2021
50%
60%
70%
80%
90%
100%
0%
2%
4%
6%
8%
10%
Performance Dashboards Achieved Target
Minor Concern
Needs Improvement
N/A
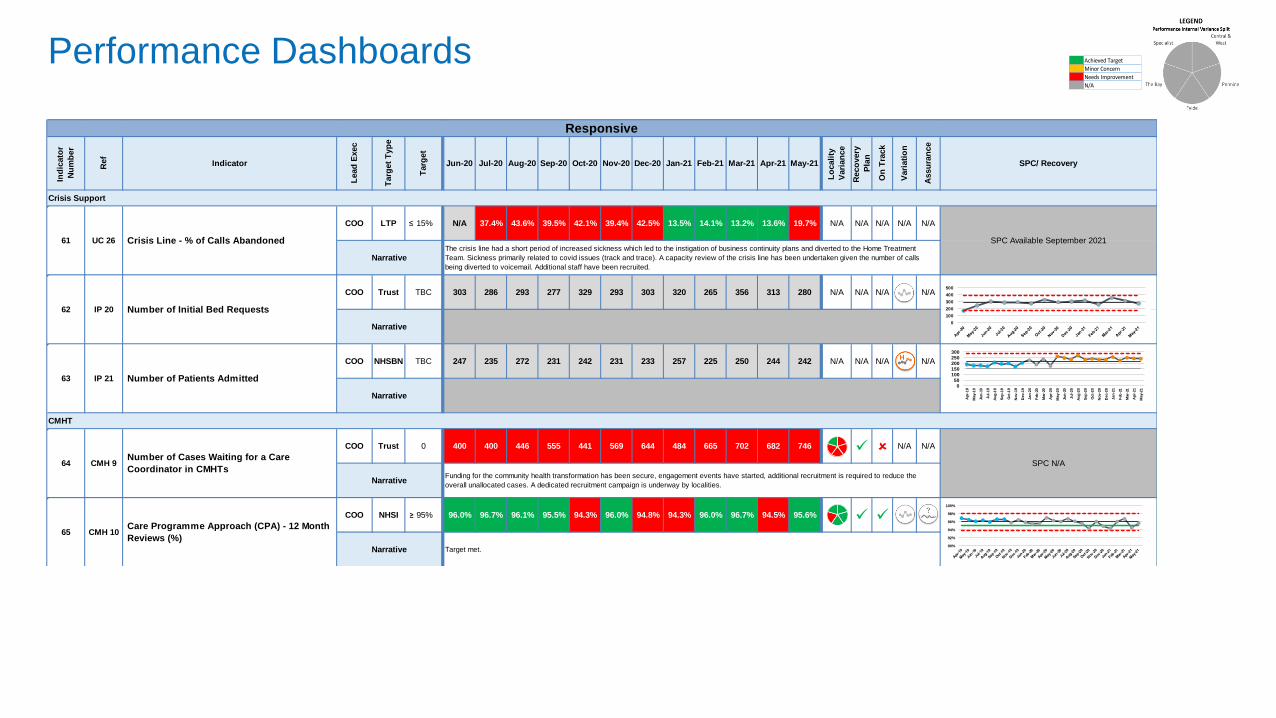
COO LTP ≤ 15% N/A 37.4% 43.6% 39.5% 42.1% 39.4% 42.5% 13.5% 14.1% 13.2% 13.6% 19.7%
N/D
N/A N/A N/A N/A N/A
COO Trust 303 286 293 277 329 293 303 320 265 356 313 280 N/A N/A N/A N/A
COO NHSBN 247 235 272 231 242 231 233 257 225 250 244 242 N/A N/A N/A N/A
COO Trust 400 400 446 555 441 569 644 484 665 702 682 746
N/A N/A N/A
COO NHSI ≥ 95% 96.0% 96.7% 96.1% 95.5% 94.3% 96.0% 94.8% 94.3% 96.0% 96.7% 94.5% 95.6%
CMHT
64 CMH 9Number of Cases Waiting for a Care
Coordinator in CMHTs
0
Narrative
65 CMH 10Care Programme Approach (CPA) - 12 Month
Reviews (%)
Narrative
SPC N/A
Funding for the community health transformation has been secure, engagement events have started, additional recruitment is required to reduce the
overall unallocated cases. A dedicated recruitment campaign is underway by localities.
Target met.
Narrative
62 IP 20 Number of Initial Bed Requests
TBC
63 IP 21 Number of Patients Admitted
TBC
Narrative
61 UC 26 Crisis Line - % of Calls Abandoned SPC Available September 2021
NarrativeThe crisis line had a short period of increased sickness which led to the instigation of business continuity plans and diverted to the Home Treatment
Team. Sickness primarily related to covid issues (track and trace). A capacity review of the crisis line has been undertaken given the number of calls
being diverted to voicemail. Additional staff have been recruited.
Responsive
Ind
icato
r
Nu
mb
er
Ref
Indicator
Lead
Exec
Targ
et
Typ
e
Targ
et
Jun-20 Jul-20 Aug-20 Sep-20 Oct-20 Nov-20 Dec-20 Jan-21 Feb-21 Mar-21 Apr-21 May-21
Lo
cali
ty
Vari
an
ce
Reco
very
Pla
n
On
Tra
ck
Vari
ati
on
Assu
ran
ce
SPC/ Recovery
Crisis Support
0
100
200
300
400
500
050
100150200250300
Apr-
19
May-1
9
Jun
-19
Jul-
19
Aug
-19
Sep
-19
Oct-
19
Nov-1
9
Dec-1
9
Jan-2
0
Feb
-20
Mar-
20
Apr-
20
May-2
0
Jun
-20
Jul-
20
Aug
-20
Sep
-20
Oct-
20
Nov-2
0
Dec-2
0
Jan-2
1
Feb
-21
Mar-
21
Apr-
21
May-2
1
90%
92%
94%
96%
98%
100%
Performance Dashboards Achieved Target
Minor Concern
Needs Improvement
N/A
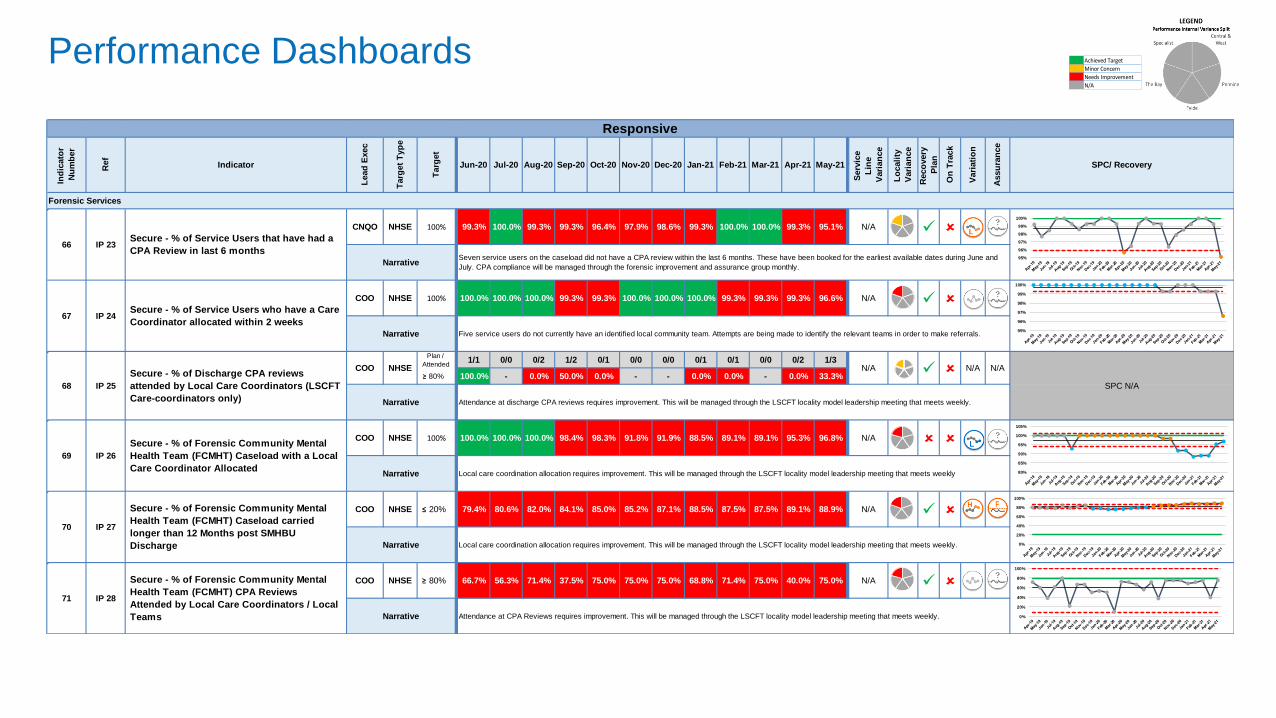
CNQO NHSE 99.3% 100.0% 99.3% 99.3% 96.4% 97.9% 98.6% 99.3% 100.0% 100.0% 99.3% 95.1% N/A
COO NHSE 100.0% 100.0% 100.0% 99.3% 99.3% 100.0% 100.0% 100.0% 99.3% 99.3% 99.3% 96.6% N/A
1/1 0/0 0/2 1/2 0/1 0/0 0/0 0/1 0/1 0/0 0/2 1/3
≥ 80% 100.0% - 0.0% 50.0% 0.0% - - 0.0% 0.0% - 0.0% 33.3%
N/A
COO NHSE 100.0% 100.0% 100.0% 98.4% 98.3% 91.8% 91.9% 88.5% 89.1% 89.1% 95.3% 96.8% N/A
COO NHSE ≤ 20% 79.4% 80.6% 82.0% 84.1% 85.0% 85.2% 87.1% 88.5% 87.5% 87.5% 89.1% 88.9% N/A
COO NHSE ≥ 80% 66.7% 56.3% 71.4% 37.5% 75.0% 75.0% 75.0% 68.8% 71.4% 75.0% 40.0% 75.0% N/A
Responsive
Ind
icato
r
Nu
mb
er
Ref
Indicator
Lead
Exec
Targ
et
Typ
e
Targ
et
Jun-20 Jul-20 Aug-20 Sep-20 Oct-20 Nov-20 Dec-20 Jan-21 Feb-21 Mar-21 Apr-21 May-21
Serv
ice
Lin
e
Vari
an
ce
Lo
cali
ty
Vari
an
ce
Reco
very
Pla
n
On
Tra
ck
Vari
ati
on
Assu
ran
ce
SPC/ Recovery
Narrative Attendance at discharge CPA reviews requires improvement. This will be managed through the LSCFT locality model leadership meeting that meets weekly.
66 IP 23Secure - % of Service Users that have had a
CPA Review in last 6 months
100%
NarrativeSeven service users on the caseload did not have a CPA review within the last 6 months. These have been booked for the earliest available dates during June and
July. CPA compliance will be managed through the forensic improvement and assurance group monthly.
67 IP 24Secure - % of Service Users who have a Care
Coordinator allocated within 2 weeks
100%
Narrative Five service users do not currently have an identified local community team. Attempts are being made to identify the relevant teams in order to make referrals.
69 IP 26
Secure - % of Forensic Community Mental
Health Team (FCMHT) Caseload with a Local
Care Coordinator Allocated
100%
Narrative Local care coordination allocation requires improvement. This will be managed through the LSCFT locality model leadership meeting that meets weekly
68 IP 25
Secure - % of Discharge CPA reviews
attended by Local Care Coordinators (LSCFT
Care-coordinators only)
COO NHSE
Plan /
AttendedN/A N/A N/A
SPC N/A
Narrative Local care coordination allocation requires improvement. This will be managed through the LSCFT locality model leadership meeting that meets weekly.
71 IP 28
Secure - % of Forensic Community Mental
Health Team (FCMHT) CPA Reviews
Attended by Local Care Coordinators / Local
Teams Narrative Attendance at CPA Reviews requires improvement. This will be managed through the LSCFT locality model leadership meeting that meets weekly.
Forensic Services
70 IP 27
Secure - % of Forensic Community Mental
Health Team (FCMHT) Caseload carried
longer than 12 Months post SMHBU
Discharge
95%
96%
97%
98%
99%
100%
95%
96%
97%
98%
99%
100%
80%
85%
90%
95%
100%
105%
0%
20%
40%
60%
80%
100%
0%
20%
40%
60%
80%
100%
Performance Dashboards Achieved Target
Minor Concern
Needs Improvement
N/A
IAPT
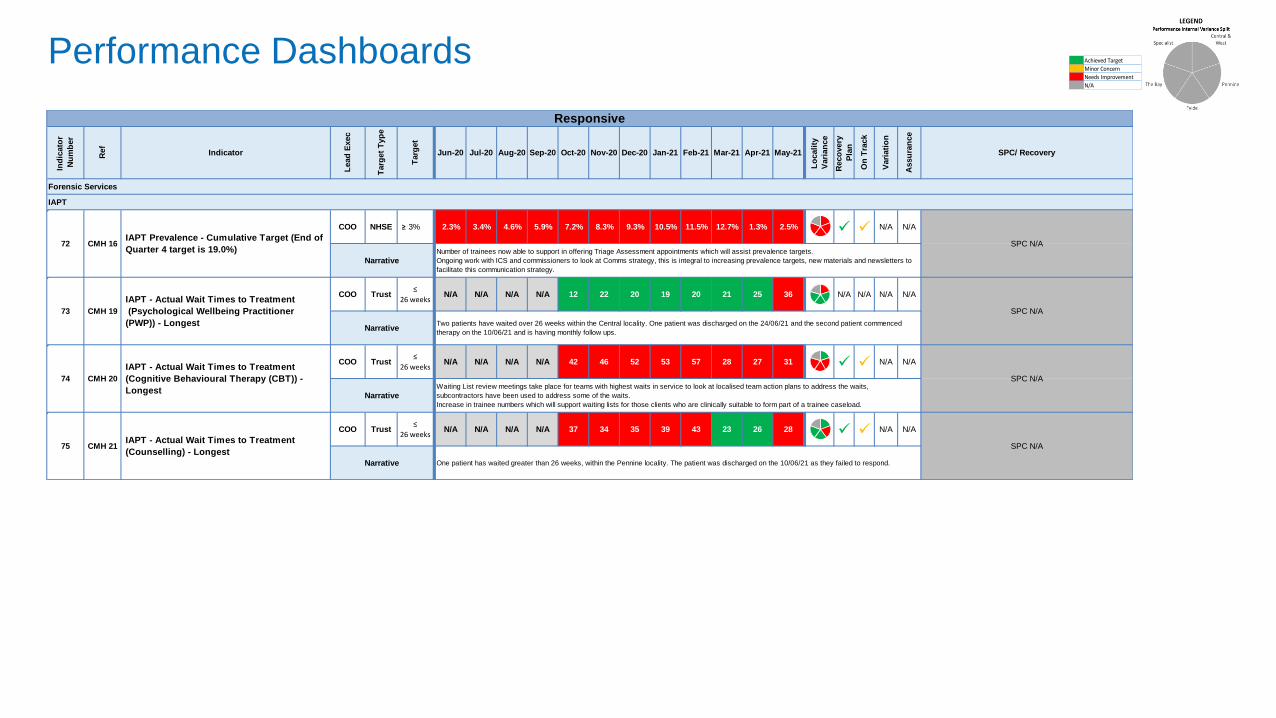
COO NHSE ≥ 3% 2.3% 3.4% 4.6% 5.9% 7.2% 8.3% 9.3% 10.5% 11.5% 12.7% 1.3% 2.5% N/A N/A
COO Trust N/A N/A N/A N/A 12 22 20 19 20 21 25 36 N/A N/A N/A N/A
COO Trust N/A N/A N/A N/A 42 46 52 53 57 28 27 31 N/A N/A
COO Trust N/A N/A N/A N/A 37 34 35 39 43 23 26 28 N/A N/A
Jan-21 Feb-21 Mar-21 Apr-21 May-21
Lo
cali
ty
Vari
an
ce
Reco
very
Pla
n
On
Tra
ck
Vari
ati
on
Assu
ran
ce
SPC/ Recovery
Forensic Services
Nov-20 Dec-20
≤
26 weeks
Targ
et
Jun-20 Jul-20 Aug-20 Sep-20 Oct-20
CMH 21IAPT - Actual Wait Times to Treatment
(Counselling) - Longest
SPC N/A
Responsive
Ind
icato
r
Nu
mb
er
Ref
Indicator
Lead
Exec
Targ
et
Typ
e
72 CMH 16IAPT Prevalence - Cumulative Target (End of
Quarter 4 target is 19.0%)SPC N/A
NarrativeNumber of trainees now able to support in offering Triage Assessment appointments which will assist prevalence targets.
Ongoing work with ICS and commissioners to look at Comms strategy, this is integral to increasing prevalence targets, new materials and newsletters to
facilitate this communication strategy.
NarrativeTwo patients have waited over 26 weeks within the Central locality. One patient was discharged on the 24/06/21 and the second patient commenced
therapy on the 10/06/21 and is having monthly follow ups.
74 CMH 20
IAPT - Actual Wait Times to Treatment
(Cognitive Behavioural Therapy (CBT)) -
Longest
≤
26 weeks
SPC N/A
NarrativeWaiting List review meetings take place for teams with highest waits in service to look at localised team action plans to address the waits,
subcontractors have been used to address some of the waits.
Increase in trainee numbers which will support waiting lists for those clients who are clinically suitable to form part of a trainee caseload.
SPC N/A
Narrative One patient has waited greater than 26 weeks, within the Pennine locality. The patient was discharged on the 10/06/21 as they failed to respond.
75
73 CMH 19
IAPT - Actual Wait Times to Treatment
(Psychological Wellbeing Practitioner
(PWP)) - Longest
≤
26 weeks
Performance Dashboards Achieved Target
Minor Concern
Needs Improvement
N/A
CAMHS
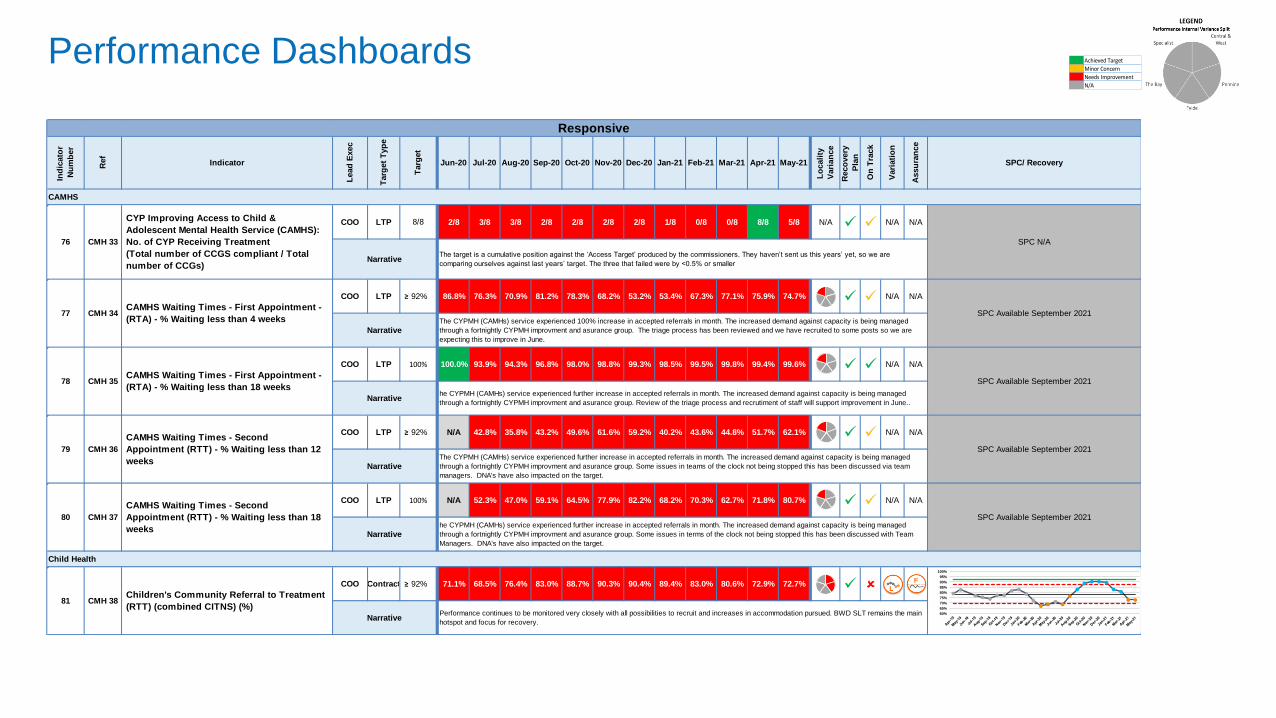
COO LTP 2/8 3/8 3/8 2/8 2/8 2/8 2/8 1/8 0/8 0/8 8/8 5/8 N/A N/A N/A
COO LTP ≥ 92% 86.8% 76.3% 70.9% 81.2% 78.3% 68.2% 53.2% 53.4% 67.3% 77.1% 75.9% 74.7% N/A N/A
COO LTP 100.0% 93.9% 94.3% 96.8% 98.0% 98.8% 99.3% 98.5% 99.5% 99.8% 99.4% 99.6% N/A N/A
COO LTP ≥ 92% N/A 42.8% 35.8% 43.2% 49.6% 61.6% 59.2% 40.2% 43.6% 44.8% 51.7% 62.1% N/A N/A
COO LTP N/A 52.3% 47.0% 59.1% 64.5% 77.9% 82.2% 68.2% 70.3% 62.7% 71.8% 80.7% N/A N/A
COO Contract ≥ 92% 71.1% 68.5% 76.4% 83.0% 88.7% 90.3% 90.4% 89.4% 83.0% 80.6% 72.9% 72.7%
Lo
cali
ty
Vari
an
ce
Reco
very
Pla
n
On
Tra
ck
Vari
ati
on
Assu
ran
ce
SPC/ Recovery
Responsive
Ind
icato
r
Nu
mb
er
Ref
Indicator
Lead
Exec
Targ
et
Typ
e
Targ
et
Jun-20 Jul-20 Aug-20 Sep-20 Oct-20 Nov-20 Dec-20 Jan-21 Feb-21 Mar-21 Apr-21 May-21
80 CMH 37
CAMHS Waiting Times - Second
Appointment (RTT) - % Waiting less than 18
weeks
SPC Available September 2021
SPC Available September 2021
Narrative
81 CMH 38Children's Community Referral to Treatment
(RTT) (combined CITNS) (%)
Narrative
NarrativeThe CYPMH (CAMHs) service experienced further increase in accepted referrals in month. The increased demand against capacity is being managed
through a fortnightly CYPMH improvment and asurance group. Some issues in teams of the clock not being stopped this has been discussed via team
managers. DNA's have also impacted on the target.
100%
76 CMH 33
CYP Improving Access to Child &
Adolescent Mental Health Service (CAMHS):
No. of CYP Receiving Treatment
(Total number of CCGS compliant / Total
number of CCGs)
8/8
79 CMH 36
CAMHS Waiting Times - Second
Appointment (RTT) - % Waiting less than 12
weeks
NarrativeThe target is a cumulative position against the ‘Access Target’ produced by the commissioners. They haven’t sent us this years’ yet, so we are
comparing ourselves against last years’ target. The three that failed were by <0.5% or smaller
77 CMH 34CAMHS Waiting Times - First Appointment -
(RTA) - % Waiting less than 4 weeksSPC Available September 2021
NarrativeThe CYPMH (CAMHs) service experienced 100% increase in accepted referrals in month. The increased demand against capacity is being managed
through a fortnightly CYPMH improvment and asurance group. The triage process has been reviewed and we have recruited to some posts so we are
expecting this to improve in June.
78 CMH 35CAMHS Waiting Times - First Appointment -
(RTA) - % Waiting less than 18 weeks
100%
SPC Available September 2021
Narrativehe CYPMH (CAMHs) service experienced further increase in accepted referrals in month. The increased demand against capacity is being managed
through a fortnightly CYPMH improvment and asurance group. Review of the triage process and recrutiment of staff will support improvement in June..
he CYPMH (CAMHs) service experienced further increase in accepted referrals in month. The increased demand against capacity is being managed
through a fortnightly CYPMH improvment and asurance group. Some issues in terms of the clock not being stopped this has been discussed with Team
Managers. DNA's have also impacted on the target.
Performance continues to be monitored very closely with all possibilities to recruit and increases in accommodation pursued. BWD SLT remains the main
hotspot and focus for recovery.
Child Health
SPC N/A
60%
65%
70%
75%
80%
85%
90%
95%
100%
Performance Dashboards Achieved Target
Minor Concern
Needs Improvement
N/A
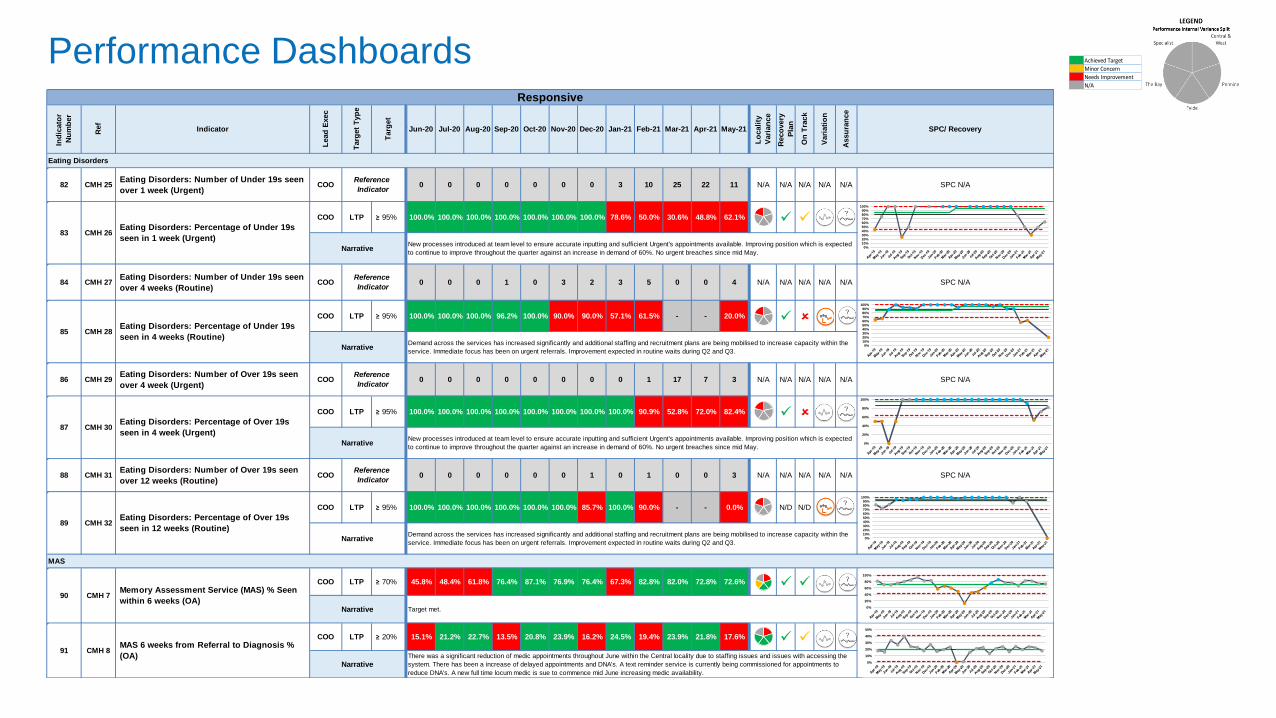
82 CMH 25Eating Disorders: Number of Under 19s seen
over 1 week (Urgent)COO 0 0 0 0 0 0 0 3 10 25 22 11 N/A N/A N/A N/A N/A SPC N/A
COO LTP ≥ 95% 100.0% 100.0% 100.0% 100.0% 100.0% 100.0% 100.0% 78.6% 50.0% 30.6% 48.8% 62.1%
84 CMH 27Eating Disorders: Number of Under 19s seen
over 4 weeks (Routine)COO 0 0 0 1 0 3 2 3 5 0 0 4 N/A N/A N/A N/A N/A SPC N/A
COO LTP ≥ 95% 100.0% 100.0% 100.0% 96.2% 100.0% 90.0% 90.0% 57.1% 61.5% - - 20.0%
86 CMH 29Eating Disorders: Number of Over 19s seen
over 4 week (Urgent)COO 0 0 0 0 0 0 0 0 1 17 7 3 N/A N/A N/A N/A N/A SPC N/A
COO LTP ≥ 95% 100.0% 100.0% 100.0% 100.0% 100.0% 100.0% 100.0% 100.0% 90.9% 52.8% 72.0% 82.4%
88 CMH 31Eating Disorders: Number of Over 19s seen
over 12 weeks (Routine)COO 0 0 0 0 0 0 1 0 1 0 0 3 N/A N/A N/A N/A N/A SPC N/A
COO LTP ≥ 95% 100.0% 100.0% 100.0% 100.0% 100.0% 100.0% 85.7% 100.0% 90.0% - - 0.0% N/D N/D
COO LTP ≥ 70% 45.8% 48.4% 61.8% 76.4% 87.1% 76.9% 76.4% 67.3% 82.8% 82.0% 72.8% 72.6%
COO LTP ≥ 20% 15.1% 21.2% 22.7% 13.5% 20.8% 23.9% 16.2% 24.5% 19.4% 23.9% 21.8% 17.6%
Jan-21 Feb-21Jun-20 Jul-20 Aug-20 Sep-20 Oct-20 Nov-20 Dec-20
Reference
Indicator
Reference
Indicator
Eating Disorders
83
NarrativeNew processes introduced at team level to ensure accurate inputting and sufficient Urgent's appointments available. Improving position which is expected
to continue to improve throughout the quarter against an increase in demand of 60%. No urgent breaches since mid May.
Mar-21 Apr-21 May-21
Lo
cali
ty
Vari
an
ce
Reco
very
Pla
n
CMH 26Eating Disorders: Percentage of Under 19s
seen in 1 week (Urgent)
Reference
Indicator
89 CMH 32Eating Disorders: Percentage of Over 19s
seen in 12 weeks (Routine)
87 CMH 30Eating Disorders: Percentage of Over 19s
seen in 4 week (Urgent)
Reference
Indicator
85 CMH 28Eating Disorders: Percentage of Under 19s
seen in 4 weeks (Routine)
NarrativeDemand across the services has increased significantly and additional staffing and recruitment plans are being mobilised to increase capacity within the
service. Immediate focus has been on urgent referrals. Improvement expected in routine waits during Q2 and Q3.
NarrativeNew processes introduced at team level to ensure accurate inputting and sufficient Urgent's appointments available. Improving position which is expected
to continue to improve throughout the quarter against an increase in demand of 60%. No urgent breaches since mid May.
Demand across the services has increased significantly and additional staffing and recruitment plans are being mobilised to increase capacity within the
service. Immediate focus has been on urgent referrals. Improvement expected in routine waits during Q2 and Q3.
90 CMH 7Memory Assessment Service (MAS) % Seen
within 6 weeks (OA)Narrative Target met.
Narrative
MAS
Ind
icato
r
Nu
mb
er
Ref
Indicator
Lead
Exec
Targ
et
Typ
e
Targ
et
On
Tra
ck
Vari
ati
on
Assu
ran
ce
SPC/ Recovery
91 CMH 8MAS 6 weeks from Referral to Diagnosis %
(OA)Narrative
There was a significant reduction of medic appointments throughout June within the Central locality due to staffing issues and issues with accessing the
system. There has been a increase of delayed appointments and DNA's. A text reminder service is currently being commissioned for appointments to
reduce DNA's. A new full time locum medic is sue to commence mid June increasing medic availability.
Responsive
0%
10%
20%
30%
40%
50%
60%
70%
80%
90%
100%
0%
10%
20%
30%
40%
50%
60%
70%
80%
90%
100%
0%
20%
40%
60%
80%
100%
0%
10%
20%
30%
40%
50%
60%
70%
80%
90%
100%
0%
20%
40%
60%
80%
100%
0%
10%
20%
30%
40%
50%
Performance Dashboards Achieved Target
Minor Concern
Needs Improvement
N/A
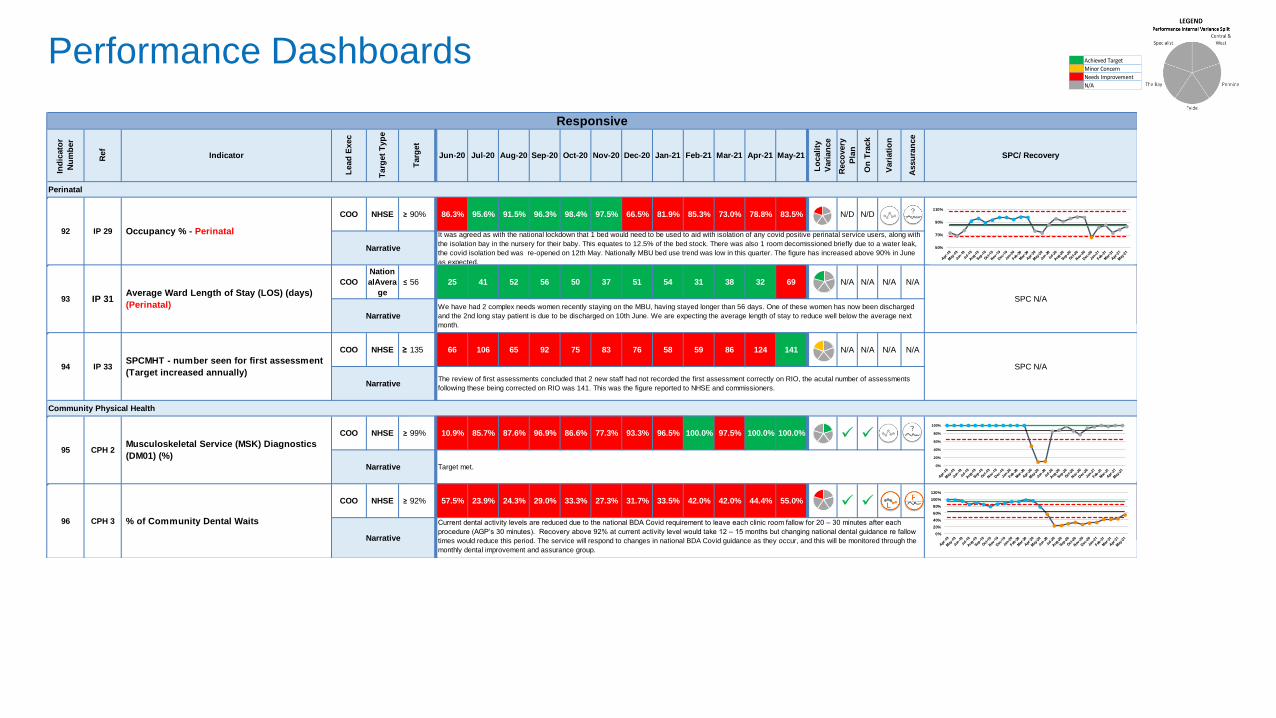
COO NHSE ≥ 90% 86.3% 95.6% 91.5% 96.3% 98.4% 97.5% 66.5% 81.9% 85.3% 73.0% 78.8% 83.5% N/D N/D
COO
Nation
alAvera
ge
≤ 56 25 41 52 56 50 37 51 54 31 38 32 69 N/A N/A N/A N/A
COO NHSE ≥ 135 66 106 65 92 75 83 76 58 59 86 124 141 N/A N/A N/A N/A
N/A
COO NHSE ≥ 99% 10.9% 85.7% 87.6% 96.9% 86.6% 77.3% 93.3% 96.5% 100.0% 97.5% 100.0% 100.0%
COO NHSE ≥ 92% 57.5% 23.9% 24.3% 29.0% 33.3% 27.3% 31.7% 33.5% 42.0% 42.0% 44.4% 55.0%
Perinatal
Responsive
Ind
icato
r
Nu
mb
er
Ref
Indicator
Lead
Exec
Targ
et
Typ
e
Targ
et
Jun-20 Jul-20 Aug-20 Sep-20 Oct-20 Nov-20 Dec-20 Jan-21 Feb-21 Mar-21 Apr-21 May-21
Lo
cali
ty
Vari
an
ce
Reco
very
Pla
n
94 IP 33
On
Tra
ck
Vari
ati
on
Assu
ran
ce
SPC/ Recovery
IP 29 Occupancy % - Perinatal
Narrative
It was agreed as with the national lockdown that 1 bed would need to be used to aid with isolation of any covid positive perinatal service users, along with
the isolation bay in the nursery for their baby. This equates to 12.5% of the bed stock. There was also 1 room decomissioned briefly due to a water leak,
the covid isolation bed was re-opened on 12th May. Nationally MBU bed use trend was low in this quarter. The figure has increased above 90% in June
as expected.
SPCMHT - number seen for first assessment
(Target increased annually)
92
NarrativeThe review of first assessments concluded that 2 new staff had not recorded the first assessment correctly on RIO, the acutal number of assessments
following these being corrected on RIO was 141. This was the figure reported to NHSE and commissioners.
We have had 2 complex needs women recently staying on the MBU, having stayed longer than 56 days. One of these women has now been discharged
and the 2nd long stay patient is due to be discharged on 10th June. We are expecting the average length of stay to reduce well below the average next
month.
93 IP 31Average Ward Length of Stay (LOS) (days)
(Perinatal) SPC N/A
Narrative
Narrative
Current dental activity levels are reduced due to the national BDA Covid requirement to leave each clinic room fallow for 20 – 30 minutes after each
procedure (AGP’s 30 minutes). Recovery above 92% at current activity level would take 12 – 15 months but changing national dental guidance re fallow
times would reduce this period. The service will respond to changes in national BDA Covid guidance as they occur, and this will be monitored through the
monthly dental improvement and assurance group.
Community Physical Health
Narrative Target met.
95 CPH 2Musculoskeletal Service (MSK) Diagnostics
(DM01) (%)
96 CPH 3 % of Community Dental Waits
SPC N/A
50%
70%
90%
110%
0%
20%
40%
60%
80%
100%
0%
20%
40%
60%
80%
100%
120%
Performance Dashboards Achieved Target
Minor Concern
Needs Improvement
N/A
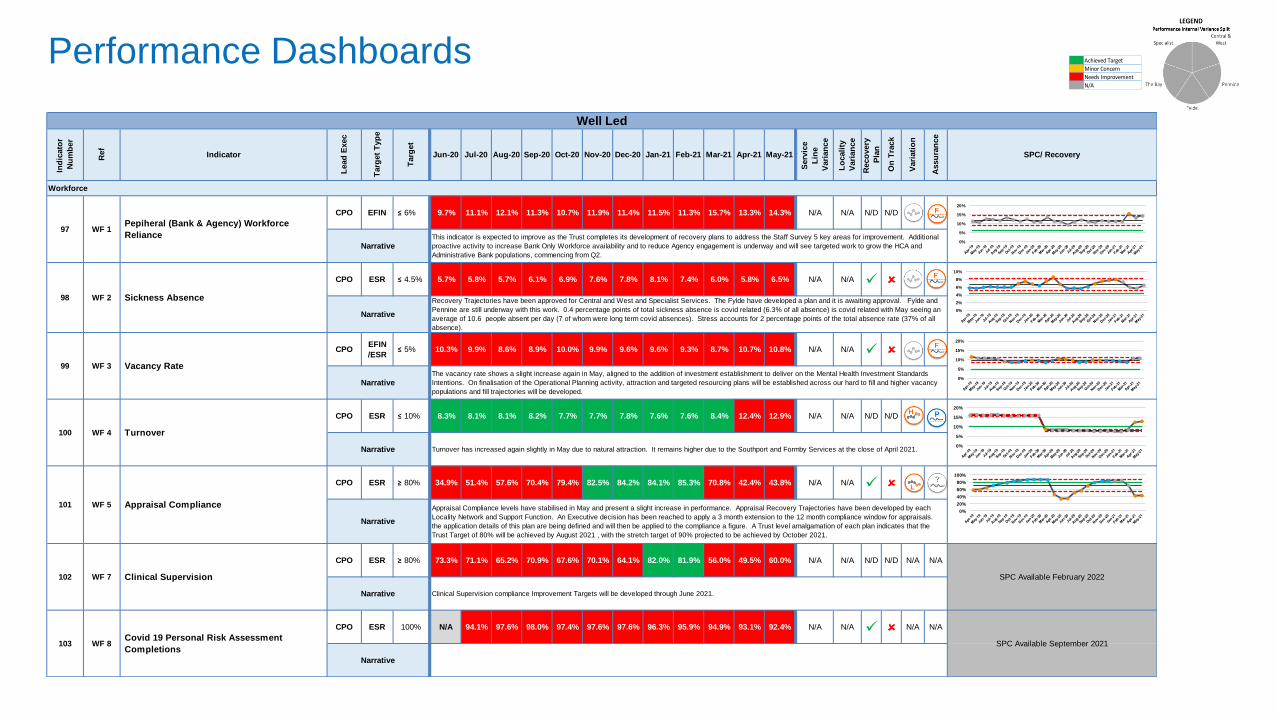
CPO EFIN ≤ 6% 9.7% 11.1% 12.1% 11.3% 10.7% 11.9% 11.4% 11.5% 11.3% 15.7% 13.3% 14.3% N/A N/A N/D N/D
CPO ESR ≤ 4.5% 5.7% 5.8% 5.7% 6.1% 6.9% 7.6% 7.8% 8.1% 7.4% 6.0% 5.8% 6.5% N/A N/A
CPOEFIN
/ESR≤ 5% 10.3% 9.9% 8.6% 8.9% 10.0% 9.9% 9.6% 9.6% 9.3% 8.7% 10.7% 10.8% N/A N/A
CPO ESR ≤ 10% 8.3% 8.1% 8.1% 8.2% 7.7% 7.7% 7.8% 7.6% 7.6% 8.4% 12.4% 12.9% N/A N/A N/D N/D
CPO ESR ≥ 80% 34.9% 51.4% 57.6% 70.4% 79.4% 82.5% 84.2% 84.1% 85.3% 70.8% 42.4% 43.8% N/A N/A
CPO ESR ≥ 80% 73.3% 71.1% 65.2% 70.9% 67.6% 70.1% 64.1% 82.0% 81.9% 56.0% 49.5% 60.0% N/A N/A N/D N/D N/A N/A
CPO ESR N/A 94.1% 97.6% 98.0% 97.4% 97.6% 97.6% 96.3% 95.9% 94.9% 93.1% 92.4% N/A N/A N/A N/A
97 WF 1Pepiheral (Bank & Agency) Workforce
Reliance
98 WF 2 Sickness Absence
Narrative
This indicator is expected to improve as the Trust completes its development of recovery plans to address the Staff Survey 5 key areas for improvement. Additional
proactive activity to increase Bank Only Workforce availability and to reduce Agency engagement is underway and will see targeted work to grow the HCA and
Administrative Bank populations, commencing from Q2.
Well Led
Narrative
Ind
icato
r
Nu
mb
er
Ref
Indicator
Lead
Exec
Targ
et
Typ
e
Targ
et
Jun-20 Jul-20 Aug-20
102 WF 7 Clinical Supervision
Narrative
Workforce
103 WF 8Covid 19 Personal Risk Assessment
Completions
100%
Narrative
Recovery Trajectories have been approved for Central and West and Specialist Services. The Fylde have developed a plan and it is awaiting approval. Fylde and
Pennine are still underway with this work. 0.4 percentage points of total sickness absence is covid related (6.3% of all absence) is covid related with May seeing an
average of 10.6 people absent per day (7 of whom were long term covid absences). Stress accounts for 2 percentage points of the total absence rate (37% of all
absence).
99 WF 3 Vacancy Rate
NarrativeThe vacancy rate shows a slight increase again in May, aligned to the addition of investment establishment to deliver on the Mental Health Investment Standards
Intentions. On finalisation of the Operational Planning activity, attraction and targeted resourcing plans will be established across our hard to fill and higher vacancy
populations and fill trajectories will be developed.
100 WF 4 Turnover
Narrative Turnover has increased again slightly in May due to natural attraction. It remains higher due to the Southport and Formby Services at the close of April 2021.
Appraisal Compliance levels have stabilised in May and present a slight increase in performance. Appraisal Recovery Trajectories have been developed by each
Locality Network and Support Function. An Executive decision has been reached to apply a 3 month extension to the 12 month compliance window for appraisals.
the application details of this plan are being defined and will then be applied to the compliance a figure. A Trust level amalgamation of each plan indicates that the
Trust Target of 80% will be achieved by August 2021 , with the stretch target of 90% projected to be achieved by October 2021.
101 WF 5 Appraisal Compliance
Narrative
SPC Available February 2022
Clinical Supervision compliance Improvement Targets will be developed through June 2021.
SPC Available September 2021
Sep-20 Oct-20 Nov-20 Dec-20 Jan-21 Feb-21 Mar-21 Apr-21 May-21
Serv
ice
Lin
e
Vari
an
ce
Lo
cali
ty
Vari
an
ce
Reco
very
Pla
n
On
Tra
ck
Vari
ati
on
Assu
ran
ce
SPC/ Recovery
0%
5%
10%
15%
20%
0%
2%
4%
6%
8%
10%
0%
5%
10%
15%
20%
0%
5%
10%
15%
20%
0%
20%
40%
60%
80%
100%
Performance Dashboards Achieved Target
Minor Concern
Needs Improvement
N/A
The below NHSI indicator is reported 3 months in arrears
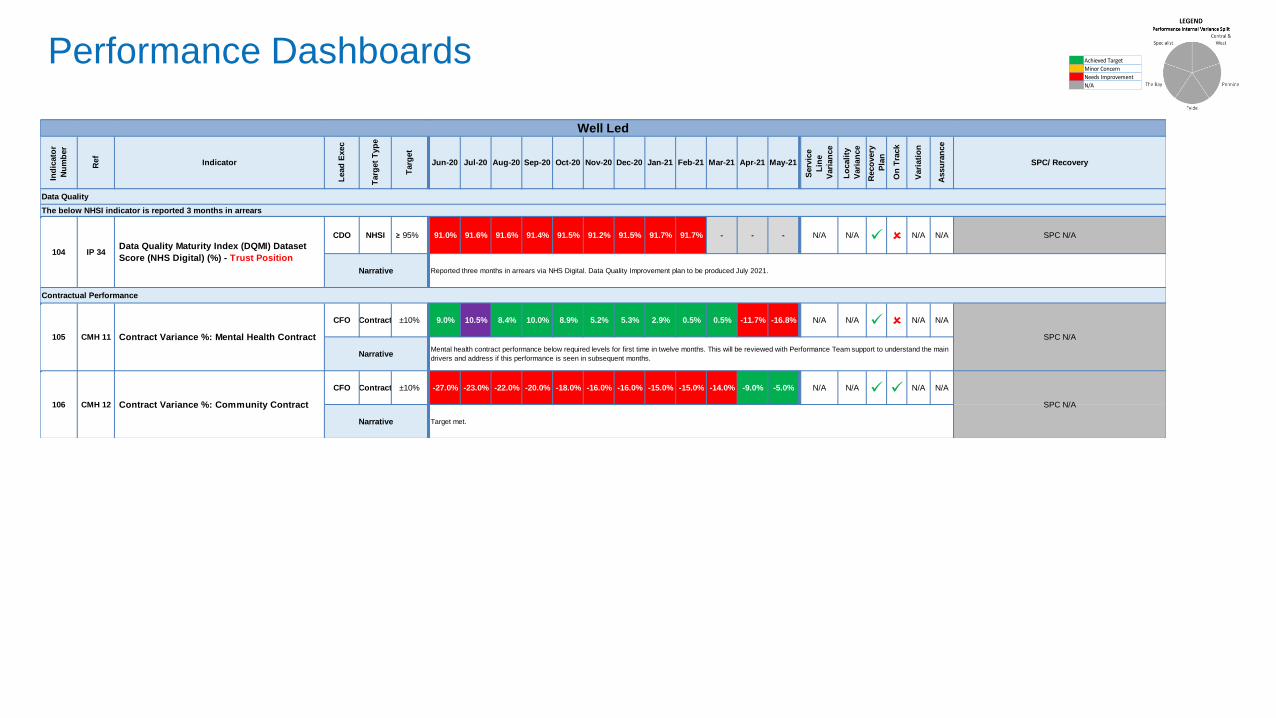
CDO NHSI ≥ 95% 91.0% 91.6% 91.6% 91.4% 91.5% 91.2% 91.5% 91.7% 91.7% - - - N/A N/A N/A N/A SPC N/A
CFO Contract 9.0% 10.5% 8.4% 10.0% 8.9% 5.2% 5.3% 2.9% 0.5% 0.5% -11.7% -16.8% N/A N/A N/A N/A
CFO Contract -27.0% -23.0% -22.0% -20.0% -18.0% -16.0% -16.0% -15.0% -15.0% -14.0% -9.0% -5.0% N/A N/A N/A N/A
104 IP 34Data Quality Maturity Index (DQMI) Dataset
Score (NHS Digital) (%) - Trust Position
Narrative Reported three months in arrears via NHS Digital. Data Quality Improvement plan to be produced July 2021.
Data Quality
105 CMH 11 Contract Variance %: Mental Health Contract
±10%
SPC N/A
NarrativeMental health contract performance below required levels for first time in twelve months. This will be reviewed with Performance Team support to understand the main
drivers and address if this performance is seen in subsequent months.
106 CMH 12 Contract Variance %: Community Contract
±10%
SPC N/A
Narrative Target met.
Contractual Performance
Well Led
Ind
icato
r
Nu
mb
er
Ref
Indicator
Lead
Exec
Targ
et
Typ
e
Targ
et
Jun-20 Jul-20 Aug-20 Sep-20 Oct-20 Nov-20 Dec-20 Jan-21 Feb-21 Mar-21 Apr-21 May-21
Serv
ice
Lin
e
Vari
an
ce
Lo
cali
ty
Vari
an
ce
Reco
very
Pla
n
On
Tra
ck
Vari
ati
on
Assu
ran
ce
SPC/ Recovery