treatment of steam assisted gravity drainage praoduced water
TRANSCRIPT

Treatment of steam assisted gravity drainage praoduced water using polymeric membranes
by
Javad Hajinasiri
A thesis submitted in partial fulfillment of the requirements for the degree of
Master of Science
Department of Mechanical Engineering University of Alberta
© Javad Hajinasiri, 2015
Abstract
Steam assisted gravity drainage (SAGD) method is the main oil extraction method in
Alberta that produces a huge volume of waste water. This thesis is focused on investi-
gating the viability of membrane processes, as emerging water treatment technologies,
for treatment of SAGD produced water. Three different types of membranes including
ultrafiltration (UF), nanofiltration (NF), and reverse osmosis (RO) were first used in a
cross-flow filtering process with the intent to remove silica, salt, and dissolved organic
matter (DOM) from warm lime softener (WLS) inlet water. All Experiments were
conducted at the same initial permeate flux and feed flow rate to rationalize fouling
behavior of membranes by their different hydrophilicity, zeta potential and roughness.
The result showed that membranes with higher hydrophilicity and more negatively
charged surfaces have lower tendency to fouling. Both RO and tight NF membranes
showed higher total dissolved solid (TDS) and total organic carbon (TOC) rejections
(<86%) in comparison with UF (<20% and <50% TDS and TOC rejections, respec-
tively). NF with loose membrane removed <70% of salt and DOM. Applied trans-
membrane pressures to obtain 20 GFD initial water flux for RO, tight NF, loose NF
and UF were 120, 80, 40 and 30 psig, respectively. Since in membrane processes the
applied pressure is directly related to energy consumption, NF with tight membranes
was found to be a promising candidate for treatment of WLS inlet water which re-
moved as high amount of salt and DOM as RO but consumed less energy than RO.
Hence, a tight NF membrane is suggested for further experimental investigations. In
the second part, the performance of a tight NF membrane (NF90) for inorganic con-
taminants polishing and DOM removal from a model SAGD boiler feed water (BFW)
was investigated thoroughly. A model BFW, prepared by diluting SAGD boiler blow-
down (BBD) water obtained from a SAGD plant in northern Alberta. Experiments
were conducted at a temperature of 50◦C and at pH values of 10.5 (the typical BFW
pH used in operating plants) and 8.5. Feed pH reduced to 8.5 to investigate the effect of
ii

pH reduction, and subsequently precipitation of silica and DOM and deposition on the
membrane surface on the flux decline. Decreasing the pH from raw water pH (10.5) to
8.5 decreased the water flux reasonably and increasing the pH back to 10.5 recovered
the water flux. It is proposed in this study that a pH pulsation technique can be used to
reduce the membrane fouling and recover the water flux. Throughout the study, fouled
membranes, feed produced water and permeate were characterized to characterize the
deposited materials on the membrane which were responsible for fouling. The pres-
ence of both organics (primarily carbon and oxygen) and inorganics (mainly silicon,
calcium and iron) in the fouling deposits was confirmed by surface characterization
techniques. Characterization of feed and permeate feed and permeate showed that the
organic matter that passed through the membrane was mainly hydrophilic compounds.
A suitably designed crossflow NF process is demonstrated be a superior alternative
technique to current SAGD produced water treatment methods, especially in terms of
producing higher quality water by consuming lower amount of chemicals and energy.
Keywords: Oil sands, SAGD, Membrane processes, Produced water treatment, Re-
verse osmosis, Nanofiltration, Ultrafiltration
iii
Preface
In this study cross-flow filtration of SAGD produced water was conducted by ap-
plying UF, NF, and RO membranes to remove salt, silica and DOM. The highlights
are (i) applying membrane processes for treatment of oil sands SAGD produced water
for the first time, (ii) providing principles of membrane fouling by SAGD produced
water, (iii) indicating outstanding role of pH as a pulsation technique to reduce mem-
brane fouling and recover the water flux, (iv) Characterizing organic and inorganic
materials primarily responsible for membrane fouling and performance decline, and
(v) suggesting practical process schemes for SAGD produced water treatment.
Chapter 2 is a submitted paper to the Desalination and Water Treatment journal,
and chapter 3 is a published paper in Separation and Purification Technology journal
(141, 2015, 339353, doi:10.1016/j.seppur.2014.12.011). I am co-author in both papers.
iv

Aknowledgement
I am using this opportunity to express my gratitude to everyone who supported me
during doing my masters.
I would like to thank the postdoctrol fellow of our group Dr. Mohtda Sadrzadeh
specifically for his perfect support and remarkable comments.
A special thanks to my supervisors Dr. Brian Fleck and Dr. Subir Bhattacharjee
that provided me convenient situation during my research.
I also express my warm thanks to Stephanie Ostrander and her family who are just
like family to me.
I would like to express the deepest appreciation to my family for their love, kind-
ness and support.
Finally, I need to appreciate my coleagues’ company and help, and also Natural
Sciences and Engineering Research Council of Canada (NSERC), and also Suncor,
Statoil, Kemira and Conoco philips companies’ for support.
v
Contents
1 INTRODUCTION 11.1 BACKGROUND AND OVERVIEW . . . . . . . . . . . . . . . . . . 11.2 Emerging technologies for SAGD produced water treatmen . . . . . . 6
1.2.1 Adsorption . . . . . . . . . . . . . . . . . . . . . . . . . . . 61.2.2 Biological treatment . . . . . . . . . . . . . . . . . . . . . . 71.2.3 Chemical oxidation . . . . . . . . . . . . . . . . . . . . . . . 81.2.4 Membrane filtration . . . . . . . . . . . . . . . . . . . . . . 9
1.3 Membranes for oil sands produced water treatment: Literature survey 191.4 Thesis Objectives . . . . . . . . . . . . . . . . . . . . . . . . . . . . 211.5 Organization of the thesis . . . . . . . . . . . . . . . . . . . . . . . . 22
2 Treatment of an in situ oil sands produced... 272.1 INTRODUCTION . . . . . . . . . . . . . . . . . . . . . . . . . . . 272.2 Material and methods . . . . . . . . . . . . . . . . . . . . . . . . . . 31
2.2.1 Feed water . . . . . . . . . . . . . . . . . . . . . . . . . . . 312.2.2 Membranes . . . . . . . . . . . . . . . . . . . . . . . . . . . 322.2.3 Cross flow membrane filtration setup . . . . . . . . . . . . . 342.2.4 Experimental methodology . . . . . . . . . . . . . . . . . . . 352.2.5 Characterization techniques . . . . . . . . . . . . . . . . . . 35
2.3 Results and Discussion . . . . . . . . . . . . . . . . . . . . . . . . . 372.3.1 Continuous operation at fixed pH . . . . . . . . . . . . . . . 392.3.2 Membrane operation with varying pH . . . . . . . . . . . . . 422.3.3 Suitable membrane for WLS inlet filtration . . . . . . . . . . 452.3.4 Rejection of organic matter . . . . . . . . . . . . . . . . . . . 462.3.5 Rejection of inorganics . . . . . . . . . . . . . . . . . . . . . 482.3.6 Results of surface analyses . . . . . . . . . . . . . . . . . . . 49
2.4 Conclusion . . . . . . . . . . . . . . . . . . . . . . . . . . . . . . . 51
vi

3 Nanofiltration of oil sands boiler feed water... 623.1 INTRODUCTION . . . . . . . . . . . . . . . . . . . . . . . . . . . 623.2 Materials and methods . . . . . . . . . . . . . . . . . . . . . . . . . 68
3.2.1 Water sample and reagents . . . . . . . . . . . . . . . . . . . 683.2.2 Membrane . . . . . . . . . . . . . . . . . . . . . . . . . . . 683.2.3 Crossflow membrane filtration setup . . . . . . . . . . . . . . 693.2.4 Experimental methodology . . . . . . . . . . . . . . . . . . . 703.2.5 Characterization techniques . . . . . . . . . . . . . . . . . . 71
3.3 Results and Discussion . . . . . . . . . . . . . . . . . . . . . . . . . 733.3.1 Water flux and TDS and TOC rejections of NF90 membrane . 753.3.2 Rejection of organics . . . . . . . . . . . . . . . . . . . . . . 813.3.3 Rejection of inorganics . . . . . . . . . . . . . . . . . . . . . 823.3.4 Fouling characterization . . . . . . . . . . . . . . . . . . . . 83
3.4 Conclusion . . . . . . . . . . . . . . . . . . . . . . . . . . . . . . . 87
4 CONCLUSIONS AND POSSIBLE FUTURE DIRECTIONS 1044.1 Summary and Conclusions . . . . . . . . . . . . . . . . . . . . . . . 1044.2 Possible Future Directions . . . . . . . . . . . . . . . . . . . . . . . 109
Bibliography 110
vii
List of Tables
2.1 Properties of WLS inlet water . . . . . . . . . . . . . . . . . . . . . 322.2 Properties of applied polymeric membranes (Data are taken from mem-
brane manufacture manual otherwise referred) . . . . . . . . . . . . . 332.3 Variation of pH with time in conducted experiments . . . . . . . . . . 352.4 Inorgnaic rejection for UF, NF90 and BW30 membranes . . . . . . . 48
3.1 Typical SAGD OTSG BFW Specifications . . . . . . . . . . . . . . . 633.2 Overview of earlier studies on oilfield produced water using NF and
RO membranes . . . . . . . . . . . . . . . . . . . . . . . . . . . . . 653.3 Properties of BBD water diluted to model BFW . . . . . . . . . . . . 683.4 Variation of pH with time in conducted experiments . . . . . . . . . . 703.5 Fluorescence peak intensities of fluorophores in SAGD BFW (data re-
lated to signature of organic acid fractions was taken from Thakurta etal. [1]) . . . . . . . . . . . . . . . . . . . . . . . . . . . . . . . . . . 81
3.6 Inorganic rejection by NF90 membrane obtained by ICP−OES . . . . 833.7 XPS surface elemental analysis (atomic%) . . . . . . . . . . . . . . . 85
viii
List of Figures
1.1 Schematic representation of the basic operating principle of a SAGDoperation [2] . . . . . . . . . . . . . . . . . . . . . . . . . . . . . . . 24
1.2 Main steps in SAGD surface treatment operation, indicating the stepsof oil-water separation, and conventional de-oiled water treatment [2] 25
1.3 PA TFC membrane, different layers and chemical structure of activelayer (taken form technical report of the Dow Chemical Company,Form No.609-02004-504) . . . . . . . . . . . . . . . . . . . . . . . . 26
2.1 Schematic view of cross flow filtration setup . . . . . . . . . . . . . . 532.2 Water flux decline during cross flow filtration of WLS inlet water by
NF270, ESNA . . . . . . . . . . . . . . . . . . . . . . . . . . . . . 542.3 TOC and TDS rejection during cross flow filtration of WLS inlet water
by NF270, ESNA and ESPA membranes at constant pH=9 . . . . . . 552.4 Water flux decline during cross flow filtration of WLS inlet water by
UF, NF90 and BW30 membranes at various pH values (9-7-10) . . . 562.5 TOC and TDS rejection during cross flow filtration of WLS inlet water
by UF, NF90 and BW30 membranes at various pH values (9-7-10) . . 572.6 Excitation-emission matrices (EEMs) of WLS inlet water and perme-
ates at pH=9. Excitation at 5 nm intervals from 200 to 500 nm andemission data collected at an interval of 10 nm. All permeate samplesand WLS inlet feed were diluted using DI water to a TOC level of 15 5mg/L to avoid inner filtration (quenching) effects on fluorescence anal-ysis. Dilution time was 10:1 for UF permeate, 5:1 for NF270 perme-ate, 2:1 for NF90, ESNA, ESPA, BW30 permeates and 20:1 for WLSinlet water. The color scale representing the fluorescence intensity islogarithmic in all parts of these images. . . . . . . . . . . . . . . . . 58
2.7 FESEM image of fouled membranes by WLS inlet water at 5 k mani-fication . . . . . . . . . . . . . . . . . . . . . . . . . . . . . . . . . 59
ix

2.8 Different morphologies of foulants observed by FESEM with corre-sponding EDX results . . . . . . . . . . . . . . . . . . . . . . . . . . 60
2.9 ATR-FTIR spectra of applied membranes before and after WLS inletfiltration . . . . . . . . . . . . . . . . . . . . . . . . . . . . . . . . . 61
3.1 Process flow diagram of a typical SAGD-based in situ bitumen extrac-tion water treatment plant . . . . . . . . . . . . . . . . . . . . . . . . 89
3.2 Schematic view of crossflow filtration setup . . . . . . . . . . . . . . 903.3 Water flux and rejection for model BFW filtration using loose NF
(NF270), tight NF (NF90) and RO (BW30) membranes at pH=10.5 . 913.4 Water flux and rejection for model BFW filtration using NF90 mem-
brane at pH=10.5 . . . . . . . . . . . . . . . . . . . . . . . . . . . . 923.5 Water flux and rejection for model BFW filtration using NF90 mem-
brane at pH=8.5 . . . . . . . . . . . . . . . . . . . . . . . . . . . . . 933.6 Water flux and rejection for model BFW filtration using NF90 mem-
brane at pH=10.5-8.5 . . . . . . . . . . . . . . . . . . . . . . . . . . 943.7 Water flux and rejection for model BFW filtration using NF90 mem-
brane at pH=10.5-8.5-10.5 . . . . . . . . . . . . . . . . . . . . . . . 953.8 FEEMs of model BFW at pH=8.5, permeate at pH=8.5 and permeate
at pH increased to 10.5. Excitation at 5 nm intervals from 200 to 500nm and emission data collected at an interval of 10 nm. Permeate hasthe effective TOC of 9 and the feed was diluted to the TOC of 12 mg/L.The color scale representing the fluorescence intensity is logarithmicin all parts of the gure with the range varying from 0.1 (blue) to 500 (red) 96
3.9 FEEMs of model BFW and permeate at pH=8.5. Excitation at 5 nmintervals from 200 to 500 nm and emission data collected at an intervalof 10 nm. Permeate has the effective TOC of 9 and the feed was dilutedto the TOC of 12 mg/L. The color scale representing the fluorescenceintensity is logarithmic in all parts of the gure with the range varyingfrom 0.1 (blue) to 500 (red) . . . . . . . . . . . . . . . . . . . . . . . 97
3.10 ATR-FTIR spectra of NF90 membrane before and after filtration . . . 983.11 FESEM-EDX of (a) original membrane, (b) used membrane at pH=10.5,
(c) used membrane at pH=8.5 and (c) used membrane at pH=8.5 then10.5 . . . . . . . . . . . . . . . . . . . . . . . . . . . . . . . . . . . 99
3.12 FESEM-EDX of beads, small crystals and large crystals deposited onthe membrane surface fouled at pH=8.5 . . . . . . . . . . . . . . . . 100
x

3.13 XPS survey spectra of NF90 membrane before and after filtration . . . 1013.14 High resolution XPS spectra of NF90 membrane before and after fil-
tration . . . . . . . . . . . . . . . . . . . . . . . . . . . . . . . . . . 1023.15 Detailed XPS deconvoluted C 1s, O 1s and N 1s scans of NF90 mem-
brane before (a, b, c) and after filtration at pH=8.5 (d, e, f) . . . . . . 103
xi
Nomenclature
Abbreviations
SAGD Steam Gravity Drainage
BBD Boiler Blow-Down
WLS Warm Lime Softener
TOC Total Organic Carbon
TDS Total Dissolved Solid
IX Ion Exchanger
OTSGs Once Through Steam Generator
DOM Dissolved Organic Matter
UF Ultrafiltration
NF Nanofiltration
RO Reverse Osmosis
OSPW Oil Sands Process Affected Water
TFC Thin Film Composite Membrane
FEEMs Fluorescence Excitation Emission Matrix spectroscopy
EDX Energy Dispersive X-ray
ICP-OES Inductively Coupled Plasma-Optical Emission Spectrometry
PA Polyamide
xii
PES Polyethersulfone
PSf Polysulfone
MWCO Molecular Weight Cut-Off
PEG Polyethylene Glycol
ATR-FTIR Attenuated Total Reflectance-Fourier Transform Infrared
MCT Mercury-Cadmium-Tellurium
CSS Cyclic Steam Stimulation
BFW Boiler Feed Water
FWKO Free Water First Separated
ISF Induced Static Flotation
WAC Weak-Acid Cation exchanger
CCD Charged Coupled Device
XPS X-ray Photoelectron Spectroscopy
BE Binding Energy
HPoA Hydrophobic Acid
HPiA Hydrophilic Acid
HPiB Hydrophilic Base
HPoN Hydrophobic Neutral
HPiN Hydrophilic Neutral
HPoB Hydrophobic Base
FESEM Field Emission Scanning Electron Microscopy
CP Concentration Polarization
xiii
TMOP Trans-Membrane Osmotic Pressure
SDI Silt Density Index
ED Electrodialysis
MBR Membrane Bioreacotr
MEUF Micellar Enganced UF
SDI Silt Density Index
Symbols
R Selectivity
C Concentration
A Phenomenological coefficient
dX/dx Driving force
D Diffusion coefficient
J Flux
Lp Permeability coefficient
P Pressure
Rm Hydrodynamic resistance
π Osmotic pressure
Subscripts
f Feed
p Permeate
m Membrane
c Cake
xiv
Chapter 1
INTRODUCTION
1.1 BACKGROUND AND OVERVIEW
Water covers about 75% of our planet’s surface. Astronaut Edgar Mitchell illustrates
our planet by this Sentence: “Suddenly, from behind the rim of the moon, there
emerges a sparkling blue and white jewel, a light delicate sky-blue. It takes more
than a moment to fully realize this is Earth”. However there is an invisible problem in
this blue jewel: lots of the water on the planet is polluted [3] which is mainly caused
by disposed wastewater from various industries. Waste water is the water that is con-
taminated after usage and may also include surface water, storm water or ground water
carrying industrial, residential or commercial wastes. The current rate of population
increase, enhances demands on finite water resources which pushes the limits that our
environment can sustain [4]. Hence water management is becoming crucial consider-
ing environmental aspects and the risk of depletion of fresh water for common usages.
Another compelling reason to pay heed to water treatment is the strong relationship
between water and energy, known as water-energy nexus, which implies water need
for energy generation and energy need for water production or water treatment. Most
of energy based companies (mainly oil and gas) need water to have production and
survive. One of the most important industries which relies more than anything to wa-
ter resources to produce oil, called oil sands, are located in Alberta, Canada. The main
1

focus in this study is to suggest a new technique for treatment of oil sands produced
water to decrease energy consumption, operational cost and environmental damage.
Alberta’s bitumen extraction is conducted either by open pit mining or in-situ ther-
mal assisted techniques, based on the depth of the reservoir [5]. Almost 80% of Al-
berta’s oil sands reservoirs exist at depths more than 200m which urges applying in-situ
thermal assisted techniques. Hence, the future of oil sands industry lies in in-situ ex-
tractions techniques. However, in-situ processes rely on water much more than open-
pit mining since in these processes steam plays a major role for bitumen extractions.
As a matter of fact, water consumption for extraction of oil sands will most likely be-
come a limiting factor for the growth of this industry. A water act came into effect
since 1999 in Alberta which boasted the efforts to reduce fresh water use. In addition
to the risk of depletion of surface water, there are concerns related to the environ-
mental consequences of water disposal and groundwater contamination during deep
well injection [6]. Under endless pressure to recycle as much water as possible, oil
sands companies are continuously modifying their current water treatment processes
and eagerly seeking novel technologies to avoid disadvantages of conventional tech-
niques [7]. The most well-known in-situ process is SAGD which is currently the most
widely practiced one for bitumen extraction from oil sands in Alberta, Canada due to
its lower cost and higher efficiency.
In SAGD process, as shown in Figure 1.1, hot steam is injected underground into
the horizontal wells that are drilled in oil sands reservoir to decrease the viscosity
of bitumen, and make it flow by gravity. Heated oil and cooled steam are collected
in production well that is drilled parallel to and beneath the steam well. Then the
mixture gets pumped out to the ground where in steam chambers, steam condensates
and bitumen flows down along the periphery of chambers and a mixture of bitumen,
clay, and water is produced. At the next step by using oil skimmers, the water is
deoiled. This water is treated by a train of WLS and ion exchange (IX) resins to
2

remove silica and divalent ions and acquire a reasonable quality to be re-used in steam
generator.
A schematic view of a typical SAGD water treatment plant is shown in Figure 1.1.
In the conventional process, organic diluents are added to the Bitumen/water mixture
(produced fluid) to reduce the viscosity of bitumen. The diluted bitumen and the water
are first separated using a series of gravity and flotation vessels to remove the bitumen,
followed by gravity skim tanks and induced static flotation (ISF) to separate residual oil
from the produced water. Walnut shell filters are also used to bring the free oil content
in the produced water below 20 mg/L. The de-oiled produced water mixes with fresh
water and recycled BBD water to make the inlet stream for WLS. This stream called
WLS inlet water is at pH 9∼10 and its silica, TOC and total dissolved solid (TDS)
concentration is in the range of 50∼100, 300∼500 and 1500∼2000 mg/L, respectively.
Softening is a process primarily to remove calcium and magnesium hardness by
chemicals. However silica, alkalinity and other constituents are also removed during
softening. In warm lime softening lime (Ca(OH)2), soda ash (Na2CO3) and sodium
hydroxide are added to water to convert soluble calcium and magnesium hardness
to insoluble calcium carbonate and magnesium hydroxide by the following reactions
[8, 9]:
1. Removal of carbonate hardness by lime:
Ca(HCO3)2 + Ca(OH)2 ⇒ 2CaCO3 ↓ +2H2O (1.1)
Mg(HCO3)2 + Ca(OH)2 ⇒ CaCO3 ↓ +MgCO3 + 2H2O (1.2)
MgCO3 + Ca(OH)2 ⇒ CaCO3 ↓ +Mg(OH)2 ↓ (1.3)
Ca(HCO3)2 + 2NaOH + Ca2+ ⇒ 2CaCO3 ↓ +2H2O + 2Na+ (1.4)
3
2. Removal of calcium non-carbonate hardness by soda ash:
CaS O4 + Na2CO3 ⇒ CaCO3 ↓ +Na2S O4 (1.5)
CaCl2 + Na2CO3 ⇒ CaCO3 ↓ +2NaCl (1.6)
3. Removal of magnesium non-carbonate hardness by lime and soda ash:
MgCl2 + Ca(OH)2 ⇒ Mg(OH)2 ↓ +CaCl2 (1.7)
CaCl2 + Na2CO3 ⇒ CaCO3 ↓ +2NaCl (1.8)
MgS O4 + Ca(OH)2 ⇒ Mg(OH)2 ↓ +CaS O4 (1.9)
CaS O4 + Na2CO3 ⇒ CaCO3 ↓ +Na2S O4 (1.10)
During lime softening silica content is reduced significantly. This is due to the attach-
ment of silica on the surface of the precipitated magnesium ions. At high pH values
calcium-magnesium silicates are formed and precipitated.
About 90% of silica is leached out by warm lime and a filter is used to remove the
residual sludge. In order to remove dissolved divalent ions like Ca2+ and Mg2+ a weak
acid cation exchange is applied.
The weak acid cation exchanger is used for dealkalization of water by using WAC
resins (e.g. carboxylic type acids) by the general formula of R-COOH. WAC resins
remove all the alkalinity in hydroxyl, sulfate, carbonates, and bicarbonates as well as
their relevant separate ions as follows [8, 10]:
1. Removal of carbonate hardness by WAC resin:
2RCOOH + Ca(HCO3)2 ⇒ (RCOO)2Ca + 2CO2 + 2H2O (1.11)
4

2. Removal of divalent ions by WAC resin:
2RCOOH + M2+ ⇒ (RCOO)2Ca + 2H+ (1.12)
H+ + HCO3− ⇒ H2O + CO2 (1.13)
2H+ + CO2−3 ⇒ H2O + CO2 (1.14)
3. Removal of calcium and lead sulfate by WAC resin
RCOOH + NaOH ⇒ RCOONa + H2O (1.15)
2RCOONa + CaS O4 ⇒ (RCOO)2Ca + Na2S O4 (1.16)
2RCOONa + PbS O4 ⇒ (RCOO)2Pb + Na2S O4 (1.17)
The treated water by these three stages is almost free of divalent ions and contains
small amount of silica (5∼10 mg/L). This water is called BFW and used as feed in
the steam generators. Since TDS of treated water is high, a special type of boilers
known as once through steam generators (OTSGs) is used. A portion of the BBD
is recycled back to the WLS and the rest is sent to disposal. Taking a closer look
to Figure 1.2, it is found that current industrial water treatment configuration can not
reduce the amount of DOM in WLS inlet water. TDS concentration even increased due
to applying resins in cation exchanger. The high levels of DOM in this water causes
numerous operational problems like fouling of pipelines and equipment and clogging
of injection wells [1, 11, 12]. High TDS of water results in more blow-down volumes
in OTSG and subsequently recycling more low quality water back to the process [1].
Hence, replacing the current scheme with a process which can separate almost all silica
and divalent ions and reject more than 90% of DOM and TDS will considerably reduce
the capital and operating costs due to the reduction of size and number of required
5
evaporators [7].
1.2 Emerging technologies for SAGD produced water treatmen
The potential technologies for oilfield produced water treatment are classified into five
main groups [11, 13, 14]:
(i) Physical treatment such as adsorption, media filtration (sand, gravel, walnut
shell), evaporation, distillation, air floatation and hydrocyclones
(ii) Chemical treatment such as precipitation, chemical oxidation (by chlorine, hy-
drogen peroxide, ozone and permanganate) and electrochemical process
(iii) Biological treatment such as activated sludge, anaerobic reactors, aerated la-
goons and wetlands
(iv) Membrane filtration such as microfiltration (MF), UF, NF, RO and electrodial-
ysis (ED) using both polymeric (mainly cellulose acetate, CA, PA, and polysulfone,
PSf) and inorganic membranes (zeolite, ceramic and metal) Hybrid processes such as
membrane bioreactor (MBR), micellar enhanced UF (MEUF), coagulation/MF, acti-
vated carbon/membrane, activated carbon/oxidation and oxidation/flocculation/mem-
branes
Allen [5] accomplished a comprehensive study on the emerging technologies ap-
plied for oilfield produced water treatment. He introduced adsorption (by adsorbents
such as activated carbon, zeolites, clays, resins and synthetic polymers) [15–19], oxi-
dation (chemical, photocatalytic and sonochemical) [12, 19–28], biological treatment
[22, 29–37] and membrane processes [37–43] as the state-of-the-art technologies in
Canadas oil sands industry.
1.2.1 Adsorption
Adsorption process is used for removal of a broad range of pollutants in oilfield pro-
duced water, mainly DOM, oil and grease and heavy metals [5]. Low adsorption ca-
6
pacity for most of adsorbents and the environmental issues and costs associated with
disposal, cleaning and regeneration of spent adsorbing media are the principle short-
comings of adsorption process [11].
1.2.2 Biological treatment
Biological treatment is a process which uses microbes to remove contaminants, par-
ticularly organic matter, microbes to remove organic material from waste water [44].
Since microorganisms are sensitive to the salinity of SAGD produced water and also
toxic chemical, applying this method to treat the produced water in oil industry is
challenging [5]. Although some methods like fixed growth and activated sludge are
suggested to partially solve the problem, still the performance is not good because
of the toxic environment of the water [45]. For oil sands produced water treatment,
biological treatment is most probably feasible for removing naphthenic acids and am-
monia [5].
Treatment wetlands can also be classified as biological treatment methods. In gen-
eral, there are two types of wetlands. The first type is surface flow designs. This
category of wetland is based on open flow of water through layers of sand, and special
kinds of plants like reed [5]. The second type is subsurface wetland in which water
flows through deeper layers of gravel, and roots of plants, where some biological and
microbiological reactions happen. In this process water can flow through the layers
either vertically or horizontally, and the needed area is smaller than the area needed
for surface flow category [46]. In treatment wetlands, pollutants are removed either
through physical processes like sedimentation, or chemical and biochemical processes
like microbial degradation and photo-oxidation. Fouling of wetlands is a problem that
should be considered, and pretreatment might be needed [5]. Cold weather also can
affect the performance of water treatment by wetland since the cold can slow down
the plants growth, decrease the activity rate of microorganisms, and cause in lack of
7
oxygen that can disturb removing some kind of compounds [47]. Meanwhile, more
studies are needed to optimize the cost of constructing, and the size of wetlands since
they need a vast area [5].
1.2.3 Chemical oxidation
In this process pollutant materials get degraded through some radical or ionic reactions
by an oxidant molecule that can do both electron accepting and electron donating.
Chlorine (Cl2), ozone (O3), hydrogen peroxide (H2O2), and permanganate (MnO−4 ).
Produced radicals from ozonation or hydrogen peroxide are not usually enough to keep
the required level of degradation in wastewater that is a complex environment, and it
may be needed to add uv light, metal salt, electric current, ultrasound, or a combination
of them. There are two combinations of the above elements called sonochemical and
phtocatalytic that have had good performance [5].
In sonochemical oxidation, ultrasound is used to form and collapse some mi-
crobubbles in the wastewater. When microbubbles collapse, make some cavities. The
temperature, and the pressure of the collapsed cavities is so high, that can cause the
particles around it like organic molecules to break apart or degrade [48]. This method
is used as a pre-treatment method, and has its own limitations like consuming too
much energy, and difficulty of breaking big particles. It is also an expensive process
compared to other processes [5].
Photocatalytic oxidation, benefits from producing radicals by exiting the valence
electrons of a catalyst that usually is a semiconductor like titanium dioxide to oxidize
pollutants. The process does not work very effectively in the high concentration of
chloride. In addition the optimum pH for removing of TOC by this process is about
2 [49]. The other limitation of this process is that having dissolved salt in the water
decreases the rate of producing radicals. Also presence of radical scavengers decreases
the rate of reaction [5].
8

1.2.4 Membrane filtration
Nowadays membranes are used in a vast number of applications, and the number of
Applications is still growing [50]. Oil industry has been fabricating and studying mem-
branes for last 20 years because of their capability to remove oil, solid particles and
other contaminants from water [5]. The advantages of applying membranes in com-
parison with other methods are their lower consumption of energy and operational
cost. [51–53].
1.2.4.1 Governing equations
The main part of any membrane process is the membrane, and it can be defined as a
barrier that is permeable to some components while it does not allow other components
to pass. Because of this ability of membrane, it can separate unwanted components
from the feed and purify it. Two parameters can determine how a membrane performs;
selectivity and permeate flow. Selectivity refers to the ability of membrane to reject
the undesired components, and pass the desired components. Selectivity also can be
expressed as ability of keeping the solute on the feed side, and is calculated by the
following equation:
R =c f−cp
c f(1.18)
Where cf and cp are concentration of solute in feed and permeate, respectively. The
maximum of R is 100% which means all the solute has remained on the feed side of
the membrane, and the minimum of R is 0 that means all the solute has passed through
the membrane to the permeate side. The other parameter of membranes’ performance
is flux of desired material (water) through the membrane.
Components move through membranes by a driving force that can be physical like
pressure or chemical like concentration. Usually transportation rate of components
9

across any membrane is a linear function of driving force. Flux (J) can be written as a
function of driving fore by
J = −AdXdx
(1.19)
Where J is the flux, A is a coefficient called phenomenological coefficient, and
(dX/dx) is the driving force and can be defined as the slope of X’s diagram (X can be
pressure, temperature, or concentration) when the distance is increasing along x axis
perpendicular to the surface of the membrane. When J is mass flux, X is concentration,
A is defined as diffusion coefficient (D), and for J as the volume flux, X is pressure, A is
called the hydrodynamic permeability coefficient of the membrane (LP) and equation
1.19 turns into Darcy’s law. In pressure driven membrane operations, the pure water
flux through a membrane is directly proportional to the applied hydrostatic pressure as
follows:
J =M PηRm
(1.20)
Where Rm is the hydrodynamic resistance of the membrane and 1/η Rm is the hy-
drodynamic impermeably coefficient over length (LP/dx). The hydrodynamic resis-
tance is a membrane constant and does not depend on the feed composition or the
applied pressure. It can be measured by conducting a pure water flux experiments
on the membranes. During the filtration of electrolyte solution using denser structure
membranes, electrolyte concentration profile develops on the membrane surface due
to the rejection of ions. Such boundary layer of higher concentration, called concen-
tration polarization (CP) layer, generates a diffusive back flow of ions toward the bulk
and develops a steady concentration profile at equilibrium. Hence, the driving force for
permeate flux at the equilibrium condition decreases and is defined by the difference
between the applied pressure (M P) and the trans-membrane osmotic pressure (TMOP,
10
M π). Thus the permeate flux for salt rejecting membranes is described as:
J =M P− M πηRm
(1.21)
As the solutes in the polarized layer are suspended in liquid state, it is considered
that there is no pressure drop across the polarized layer. The TMOP, is M π = πm − πp,
where πm and πp are osmotic pressure at membrane surface and permeate, respectively.
Equation 1.21 confirms that for salt rejecting membranes like tight NF and RO
the transmembrane pressure must overcome the TMOP to force water through a dense
membrane. Hence the applied pressure and subsequently energy consumption increase
as the density of a membrane increases.
When silica particle and organic matter (any fouling material) present in the feed,
they start depositing instantaneously on membrane surface, and their concentration
increases on the membrane surface. In this case the permeate flux is represented by
the following resistance-in-series model:
J =M P− M πη(Rm + Rc)
(1.22)
This equation is the modified Darcy’s equation. M πm in this equation is the en-
hanced TMOP because of fouling material, Rc is the total cake resistance including
the hydrodynamic resistance of the packed bed and electroviscous resistance due to
the presence of charged particles in electrolyte solution. This equation confirms that
presence of foulants in the feed water has another deteriorating effect on the water flux.
As the concentration of contaminants in feed water increases, denser and thicker cake
layer will form on the membrane which increases Rc in equation 1.5 and decreases the
flux. Meanwhile, presence of fouling material in the concentration polarization layer
was proven to increase the TMOP which itself decreases the flux again [54].
11

1.2.4.2 Classification of membranes
Membranes can be categorized from different aspects. From the thickness aspect to
thin and thick, form the structure aspect to homogeneous and heterogeneous, from the
mechanism of material transfer to active and passive, from the type of membrane to
natural and synthetic, and so on. The clearest way to classify membranes is to distinct
membranes to biological and synthetic. Most of industrial membranes are synthesized
membranes which are classified to symmetric and asymmetric membranes from the
morphology aspects. The application of every membrane depends on its morphology
since it determines the mechanism of separation in the membrane. Symmetric mem-
branes have the same density across the thickness of the membrane, while asymmetric
membranes have a denser layer at the top which is called skin layer. This skin layer
improves both the selectivity and permeability of the membrane significantly. The top
layer is the most resistant layer against mass transfer.
Composite membrane is a type of asymmetric membrane that has two different
layers as top layer and support layer. In composite membranes, the type of top and
support polymeric materials might be different and can be optimized independently.
Most of the commercially available polymeric membranes applied for water treatment
are thin film composite membranes (TFC) and comprise three layers: (i) a polyester
support web (ii) a microporous polysulfone (PSf) or polyethersulfone (PES) inter layer
and (iii) an ultrathin aromatic polyamide (PA) active layer. As indicated in Figure 1.3,
the active layer is as thin as about 0.2 µm. The average roughness, hydrophilicity,
zeta potential and density or molecular weight cut-off (MWCO) of this active PA layer
governs the permeation properties of the membrane. The PA active layer is gener-
ally formed by interfacial in-situ polymerization of amines (e.g. m-phenylenediamine,
MPD) and acyl chlorides (e.g. trimesoyl chloride, TMC) on a microporous support.
Interfacial polymerization reaction can be controlled to synthesize thin film UF, NF
and RO membranes. It must be noted that, the choice of the monomeric units deter-
12

mines the properties of the PAs. The commercially available PAs are produced by a
limited number of monomers such as MPD and TMC. PAs are classified into three
main categories of aliphatic, semiaromatic, and fully aromatic. Aromatic PAs, Figure
1.3, are considered to be high performance polymers due to their superior thermal and
mechanical properties, which makes them suitable for membrane fabrication. All com-
mercial TFC PA membranes applied in the present work has almost the same geometry
and chemical structure as shown in Figure 1.3.
1.2.4.3 Liquid-based pressure-driven membrane process
The most well known and widely practiced membrane processes are liquid-based
pressure-driven processes which are categorized as microfiltration (MF), UF, NF and
Ro based on the porosity of their applied membranes. The pore size of membrane in
these processes changes as follows:
MF > UF > NF > RO
The applied pressure (energy consumption) changes in exactly opposite trend, so
that RO is the most energy intensive and MF is the less energy intensive.
(i) Microfiltration
The average pore size of MF membrane varies from 0.05 to 10 µm , so this process
seems to be appropriate for separating particles from emulsions and suspensions. Os-
motic pressure in microfiltration process is negligible due to the large size of particles,
and the applied pressure is not higher than 2 bar. From the morphology aspects MF
membranes can be divided into symmetric membranes with 10-150 µm thickness and
asymmetric membranes with the skin layer thickness about 1 µm. The coefficient A
in equation 1.19 for MF is a function of pore radius, dynamic viscosity, and the shape
factor of pores. Ceramic MF membranes are also more common in this category due
to their thermal and chemical stability.
MF has been commercialized for separation of particles larger than 0.1 µm in liquid
13
phase.
(ii) Ultrafiltration
The average pore size of a UF membrane is somewhere between 0.05 µm and 1
nm. Osmotic pressure in this process is very low that can be neglected. This process
can be used to separate colloids and macromolecules from aqueous solutions. Applied
pressure in UF process is between 1 to 10 bar, and the applied membranes are just
asymmetric. The thickness of skin layer is in the range of 0.1-1.0 µm, and separation
mechanism is molecular sieve. The hydrodynamic resistance of UF membranes is
higher than MF membranes, due to their dense asymmetric structure. Similar to MF,
the coefficient A in equation 1.19 depends on the structural and shape factors of the
membranes.
In addition to the main task of separation, UF membranes can be used as the sub-
layer NF and RO membranes.
(iii) Nanofiltration and reverse osmosis
NF and RO are used to separate solutes with low molecular weight such as glucose,
lactose, salt, and micropollutants from water. Unlike MF and UF, in NF and RO,
osmotic pressure is not negligible and can reach 1-25 bar. Like UF membranes, all the
membranes in these two classes are asymmetric with the separating layer thickness 0.1
- 1.0 µm. Separation mechanism in these methods is based on difference in solubility
and also diffusivity of the components in the membrane.
Since smaller solutes are getting separated by NF and RO than MF and UF, mem-
branes in these classes are denser and their hydrodynamic resistance is much higher.
Being more hydrodynamically resistant, NF and RO membranes need higher pressure
in comparison with UF to get the same flux. The applied pressure in NF and RO should
be able to compensate the high osmotic pressure. For NF and RO osmosis, A in equa-
tion 1.19 is called phenomenological coefficient, and is a function of solubility and the
diffusivity of components in membrane.
14
The applied pressures for NF and RO are in the ranges of 10 - 20 bar and 20-100
bar respectively. Both of these ranges are obviously higher than the pressure range
applied in UF. While in MF and UF, pore size is the most significant parameter in
the separation properties of the membranes, in NF and RO membranes material of the
membrane and its chemical properties play the major role. It means that the affinity
of membranes’ material should be high for the solvent (for example hydrophilic when
the solvent is water) and low for the solute.
Although NF and RO membranes are similar from many aspects, the structural
network of NF is more open. As a result retention of monovalent salts like Cl− and
Na+ is lower for these membranes, however there is a high retention of divalent ions
like Ca2+ and CO2−2 , microsolutes or micropollutants, and also other components with
low molecular weight like sugars and dyes. When high rejection of NaCl in highly
desired, RO overcomes NF, whereas divalent ions and microsolutes must be retained,
NF is preferred due to production of more product (high recovery) and less energy
consumption as compared to RO.
1.2.4.4 Memebrane characterization methods
Membranes can be utilized for various applications based on their properties includ-
ing hydrophilicity, MWCO, roughness, morphology or structure, and surface poten-
tial. For instance, for separation of DOM and salt from SAGD produced water more
hydrophilic, denser, smoother membranes with more negatively charged surface are
needed. Meanwhile, the membrane should be TFC membrane to increase both flux
and rejection at the same time.
SAGD produced water mainly contains negatively charged silica and DOM. Hence,
more negatively charged membranes are desired to increase the electrostatic repulsion
between membrane and SAGD water constituent. In addition, our previous studies [1]
revealed that DOM in SAGD water are hydrophobic matter. Hence in order to avoid
15

hydrophobic interactions between membrane and organic matter, more hydrophilic
membranes are selected. Lowering the roughness of the membrane always decreases
the chance of valley blocking and cake formation on the membrane surface. In order to
have a higher quality water product, denser membranes tight NF and RO membranes
are needed. For measuring each of these characteristic, a standard characterization
instrument is used which are discussed in this section.
(i) Scanning Electron Microscopy (SEM)
Scanning electron microscopy method is a convenient method to provide images
from structure of the membranes. The highest resolution that can be achieved is about
5 nm or 0.005 µm. In this method, the membrane is hit by a thin electron beam with
the kinetic energy of 1-25 KV. The electrons that hit the membrane are called primary
electrons, and have a high level of energy. The reflected electrons by the surface of the
membrane have lower level of energy than primary electrons and are called secondary
electrons. In reality the secondary electrons are not reflected by the membrane, but they
are electrons that have been released by the atoms of membrane’s surface, and build
the SEM image of the membrane. Usually depending on the membranes material and
the intensity of electron beam, the beam can leave a burning effect on the membrane.
To avoid the burning effect, samples are coated by a conductive material like gold,
chrome or graphite.
Scanning electron microscopy can provide very high quality images of cross sec-
tion and surface of the membrane. Employing this method, pore size distribution and
surface porosity can be studied. Surface SEM images of fouled membranes provides
valuable information about the morphology of deposited materials on the membrane
surface. When equipped with energy-dispersive X-ray spectroscopy (EDX) elemental
analysis of fouling materials becomes possible.
(ii) Atomic Force Microscopy(AFM)
Atomic force microscopy is a method to find the roughness of membrane. In this
16

method surface scanning is prefromed by a probe that has a tip, which its diameter
is smaller than 10 Å and applies a constant force while scanning. While the tip is
scanning the surface, van der Waals-London interaction happens between the atoms at
the end of the tip and the atoms at the surface of the membrane. The created forces can
be detected by the probe. Scanning can be done on a line, or a profile of the surface,
and since the tip is so small, scanning can be performed by applying very small forces.
No pretreatment on the sample is needed for AFM scanning, and the scanning can be
performed in air. AFM method is capable to spot location of the pores, and can give
very useful information about the roughness of the scanned line on the sample.
(iii) Zeta potential measurement
Most of the solid surfaces have electrostatic charges, so they carry an electrical
potential at the surface. In cases the liquid contains a certain concentration of ions
like an electrolyte or an impure liquid, counterions of the solid surface that exist in
the liquid are attracted to the surface. As a result concentration of counterions near
the surface becomes higher, but it decreases by moving toward the bulk where it has
bulk concentration. This layer of counterions is called double layer. Right next to
the surface of the solid, a thin layer of ions exist that are attracted to the surface so
strongly that can not be detached. This layer is usually called stern layer, and its
thickness is about several angstroms. Measuring the electrical potential right at the
interface of solid-liquid is difficult, however electrical potential can be measured at the
shear plane (where velocity of the moving liquid on the surface is zero), and is called
streaming potential (ζ). Electrical potential at the interface of solid and liquid can be
approximated by streaming potential. [55].
Zeta potential is a very important property in membranes that can determine the
energy of interaction between components and the membrane, so it is very critical
in studying fouling behaviour of the membrane. Most of the commercially available
membranes are negatively charged over a wide range of pH (the iso electric, IEP, for
17

most of them is higher than 4). The surface charge of these membranes is inherited
from their functional groups. Commercial membranes are PAs which contain car-
boxylic (R-COO−) and amine (R-NH3+) ionizable functional groups. These groups
are responsible for development of surface charge [50,56–58]. The equilibrium disso-
ciation reactions of these groups are as follows [56]:
R −COOH � R −COO− + H+ (1.23)
R − NH+3 � R − NH2 + H+ (1.24)
According to these reactions, the surface charge is dependent on degree of ioniza-
tion, and obviously the pH of the solution [56]. At high pH values, H+ in reaction 1.23
reacts with OH- and reaction progress to right. Higher R-COO− on the surface makes
the membrane negatively charged. In contrast, at low pH values reaction 1.24 moves
backward and the resulting membrane becomes positively charged. Hence, in order to
have more negatively charged membranes, it is recommended to operate at higher pH
values.
(vi) Contact angle measurement
Contact angle is a measurable property of a surface that shows hydrophobicity or
hyrophilicity . Contact angle can be measured by dropping a liquid (usually water for
measuring the hydrophilicity) on the surface. The droplet makes an angle with the
surface at the edge of drop where three phases of liquid (water), solid (the surface),
and gas (usually air) meet. Depending on the interfacial tension between the surface
and water drop, the angle can vary. Bigger contact angles mean that the surface is
more hydrophobic and smaller contact angles represent a more hydrophilic surface.
Hydrophilic material have low interfacial tension with water, while the interfacial ten-
sion of hydrophobic material is high [59]. For water treatment applications when water
must pass through the membrane, as in the present work, more hydrophilic membranes
18
(smaller contact angles) are desired.
1.3 Membranes for oil sands produced water treatment: Literature survey
Membrane processes have been broadly used for treatment of industrial produced wa-
ter due to their advantages over traditional processes primarily lower operating costs
and energy consumption. Most of earlier studies were focused on the use of looser
membranes, MF and UF, oily wastewater treatment [60–69]. For removal of mono-
valent and divalent ions, silica and organic matter from produced water, as in the cur-
rent study, tighter NF and RO membranes must be used. Although, NF and RO are
widely applied in wastewater treatment, there are a few records in literature for their
application in treatment of oilfield produced water. This is probably due to the high
susceptibility of membranes to fouling by high TDS and TOC oilfield produced wa-
ter. Meanwhile, oilfield produced waters are mostly at high temperature and pH and
cannot be directly subjected to membranes. In some applications, these streams must
be cooled or pH tuned solely to accommodate a membrane separation process, after
which the processed fluid will be readjusted back to initial condition [67–69]. This
temperature and pH adjustment causes waste of a considerable amount of energy and
chemicals which is obviously tried to be avoided by industries. Applying hydrophilic
membranes with outstanding antifouling properties, at their operating threshold with
respect to pH and temperature, will certainly facilitate practice of membrane processes
in the oilfield produced water treatment. According to our research in peer reviewed
journals the following results are obtained:
1. Oil sands produced water treatment by NF and RO was already studied [38, 39,
43]. Peng et al. [39] and Kim et al. [38] worked on oil sands process affected water
(OSPW) associated with the surface mining and extraction of bitumen. Many of earlier
studies conclude that the DOM in mining OSPW consists primarily of naphthenic acid-
like compounds [19, 70–72]. Mehrotra and Banerjee [43] applied RO for treatment of
19
produced water generated by an in situ oil sands process called steam flooding. The na-
ture of in situ processes DOM is hypothesized to be different from the mining OSPW.
Guha Thakurta et al. [64] demonstrated that DOM in SAGD produced water are more
representative of humic acids than naphthenic acids. Every DOM has specific physic-
ochemical properties, such as charge and molecular conformation, which controls the
rate of fouling and subsequently performance of membrane process [73]. Meanwhile,
the interaction of DOM functional groups with solution chemistry, e.g. monovalent
and divalent concentrations, pH and presence of silica, induces different effects on
properties of DOM macromolecules and thus the structure and hydraulic resistance
of fouling layer [74–77]. Hence, performance of membrane processes changes vastly
based on the type and concentration of organic matter and produced water chemistry.
2. Based on our search in literature, membrane processes have not been tested for
SAGD produced water treatment.
3. pH is proven to be one of the most influential factors on DOM fouling through
changing their surface charge [78–80]. Effect of pH on performance of NF and RO
in oilfield produced water treatment was investigated by researchers [43, 67, 68, 81].
Dyke Bartels [67] showed that, DOM rejection increased by increasing pH up to a
critical value, then remained constant. The amount of this critical value was different
for different water sources. Mehrotra and Banerjee [43] observed exactly opposite
behavior. When they adjusted produced water pH from 7-8 to 4, its colour turned deep
black and the permeate TOC content decreased more than 90%. Mehrotra and Banerjee
[43] attributed this to the precipitation of inorganic carbonates and bicarbonates on
the membranes surface at lower pH and subsequently enhancing the permselective
properties of membranes. Tao et al. [68] increased their feed pH from 7.8-8.0 to 10.6-
11 to prevent oil precipitation on the membrane surface by reaching to beyond its
solubility limit. Doran et al. [81] suggested an approach for increasing the boron
removal by increasing the pH of the RO feed water to ionize the boron. Effect of
20
pH on TDS removal was not accounted in earlier studies
4. The only inorganic membrane used for desalination of oilfield produced water
treatment was bentonite clay NF membrane. Liangxiong et al. [82] suggested the tested
clay membrane was not suitable for purification of high TDS waters with just 10-35%
rejection for Ca2+ and Mg2+ and 6-26% rejection for Na.
5. In most studies NF and RO resulted in similar TOC and TDS rejections [68, 81,
83, 84], however, Dyke and Bartels [67] and Mondal et al. [85] reported higher TOC
rejection and Mehrotra and Banerjee [43] and Xu et al. [86] observed higher TDS
rejection.
6. Nanofiltration (NF) and RO of oilfield produced water was already tested at
higher temperature near to the operating threshold of applied polymeric membranes
[67, 68, 81].
7. Indispensable role of silica in coupled silica-organic fouling, particularly by
changing pH, was not taken into account.
1.4 Thesis Objectives
The main objectives of this thesis are
• To investigate the capability of commercial UF, NF, and RO membranes to re-
move salt and DOM from SAGD produced water, and choose the best membrane
according to their performance (water quality and energy consumption).
• To test the performance of the selected membrane for salt and DOM removing
and polishing calcium, magnesium, and silicon from SAGD BFW, and character-
izing product water and fouled membrane to find the major responsible material
for fouling.
• Outstanding role of feed pH on reduction of fouling and recovery of water flux.
21

In this work, effects of pore size, roughness, zeta potential, and hydrophilicity of
the membranes on TDS and TOC rejection, and flux decline is studied by setting the
same feed flow rate and initial permeate flux for all the membranes.
1.5 Organization of the thesis
In chapter 1 (Introduction) a general overview of in-situ oil extraction methods and
conventional produced waste water treatment methods are given. Then emerging wa-
ter treatment methods are discussed, and a summary of pressure-driven liquid-based
membrane processes along with their governing equations is provided. After that com-
mon characterization methods in membrane field are introduced. At the end, a litera-
ture review on previous works on oil field produced water treatment and the objective
of this study is presented.
In chapter 2, three different kinds of commercial membranes including one UF
membrane (thin film UF from GE) and three NF membranes (NF270 and NF90 from
Filmtec and ESNA from Hydranautics), two RO membranes (BW30 from Filmtec and
ESPA from Hydranautics) are used to treat WLS inlet water through cross-flow filtra-
tion. NF270, ESNA and ESPA membranes were tested at the pH of raw feed, while UF,
NF90 and BW30 were tested at dynamic pH (9-7-10) to investigate the effect of pH on
their performance. It was shown that NF90 had a rejection of salt and DOM as high as
RO by consuming less energy. Tests under dynamic pH showed the determinant role
of pH in flux recovery and fouling reduction. The dominant mechanism of fouling was
studied by characterizing fouled membranes, feed and permeates. According to the
results NF90 showed a better performance (high water quality and reasonable energy
efficiency) and is recommended for further study.
In chapter 3, due to better performance of NF90, further tests were conducted on
it to study the performance of the membrane at different pH and the effect of dynamic
pH at flux recovery and selectivity of the membrane. Although at both NF90 showed
22

the same rejection of TOC, silica and divalent cations, TDS rejection was higher at pH
8.5. On the other side decreasing pH left a negative effect on permeation flux. Surface
characterization of membranes was accomplished after the tests to study the nature
of deposited material on the membranes surface at different pH and the effect of pH
pulsation of flux recovery.
In the last chapter, a summary and the main outcome of the thesis are provided .
Some research works are also suggested as the continuation of this thesis to make the
outcomes more practical for oil sands industry.
23
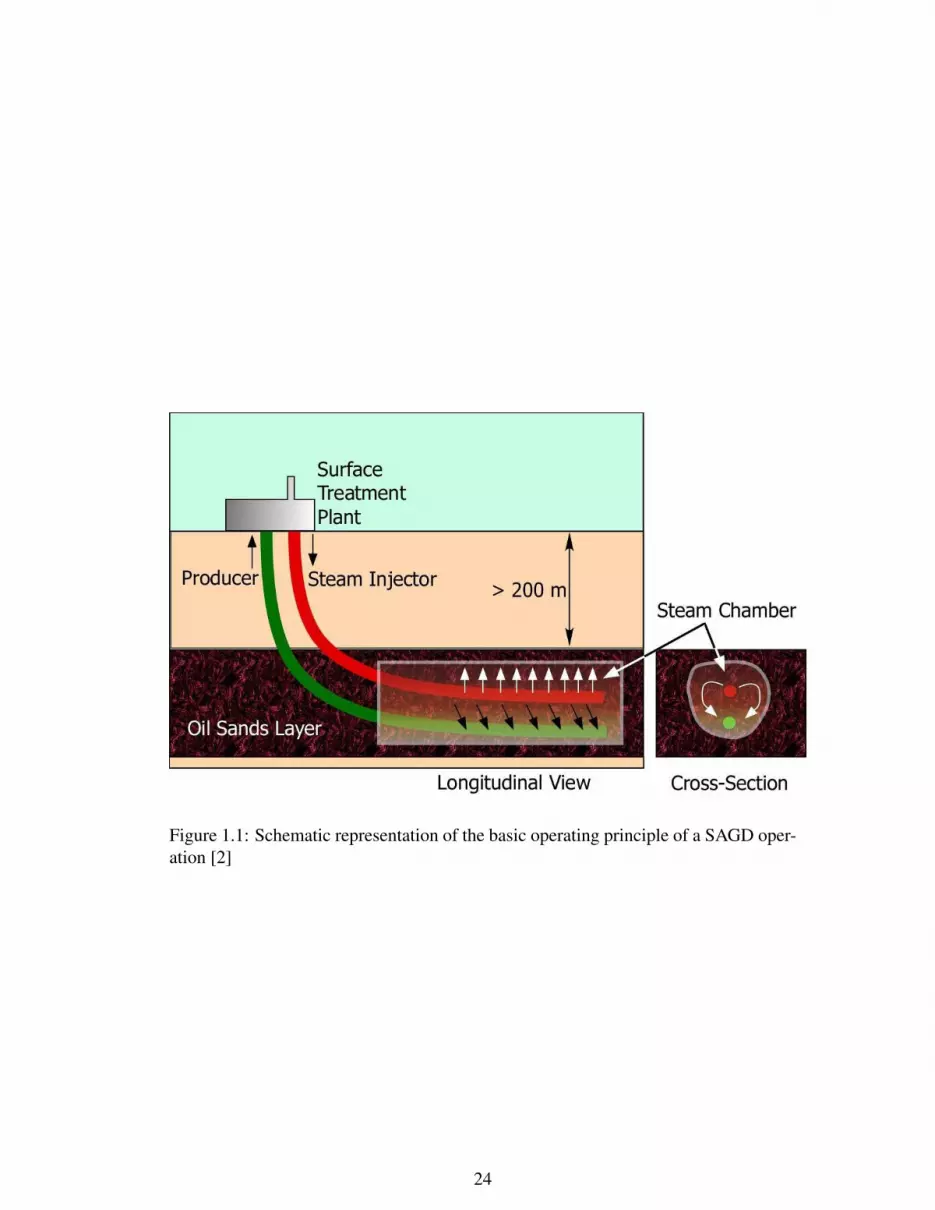
Figure 1.1: Schematic representation of the basic operating principle of a SAGD oper-ation [2]
24

Figure 1.2: Main steps in SAGD surface treatment operation, indicating the steps ofoil-water separation, and conventional de-oiled water treatment [2]
25
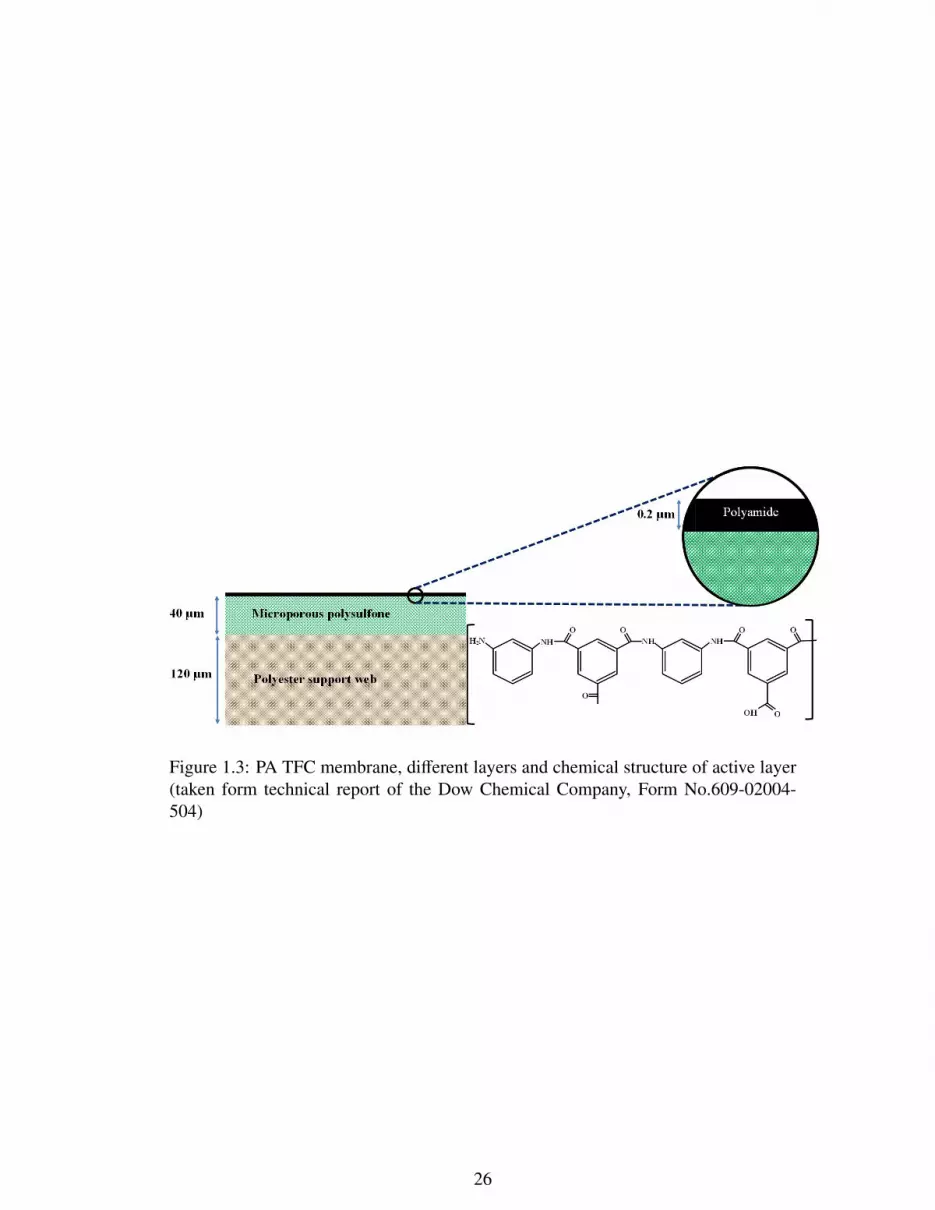
Figure 1.3: PA TFC membrane, different layers and chemical structure of active layer(taken form technical report of the Dow Chemical Company, Form No.609-02004-504)
26

Chapter 2
Treatment of an in situ oil sands produced water by
polymeric membranes
2.1 INTRODUCTION
SAGD is a thermally enhanced heavy oil recovery method which is widely practiced
for bitumen extraction from oil sands in Alberta, Canada. In this process, steam is
injected through a horizontal well into the bitumen-containing formation to decrease
the viscosity of the bitumen and effect its extraction. An emulsion of steam condensate
and heated bitumen flows down along the periphery of the steam chamber to the pro-
duction well which is located below the injection well. This emulsion is then pumped
to the surface where the bitumen and water are separated and the water is treated for
reuse as boiler feed water.
In a typical SAGD surface treatment plant, the produced emulsion is first sent
through a series of gravity separation vessels to remove the gases, and separate the
bitumen and water. The produced water is then deoiled utilizing oil skimmers, as well
as induced gas flotation devices. Finally, the water passes through an oil removal filter
to remove traces of free oil and grease from the water. In the conventional SAGD-
based in situ bitumen extraction surface treatment plant, the de-oiled produced water
mixes with make-up water and recycled BBD water to make the inlet stream for a
27

WLS. This stream, called WLS inlet water, is at pH 9∼10 and its silica, TOC and TDS
concentration is in the range of 50∼100, 300∼500 and 1500∼2000 mg/L, respectively.
About 90% of silica is removed by warm lime softening and a filter is used to remove
the residual particles. In order to further remove dissolved divalent ions like Ca2+ and
Mg2+ a weak acid cation exchanger (IX) is applied. The treated water is used as feed in
the steam generators. The steam generators, known as OTSGs, can tolerate relatively
high amounts of TDS and TOC in the boiler feed. However, OTSGs typically produce
only a low quality steam (75-80%), resulting in a large volume of BBD. A portion of
the BBD is recycled back to the WLS and the rest is sent to disposal.
The economics of a SAGD process depends on the energy consumed for steam
generation as well as for produced water deoiling and treatment and blowdown dis-
posal [6]. BBD water management is becoming crucial to the in-situ oil sands industry
which is continuously seeking novel technologies and improved water management
strategies [7].
Current WLS-IX water treatment configuration cannot reduce the amount of DOM
in WLS inlet water and the boiler feed water. TDS concentration even increases in
the boiler feed due to applying resins in cation exchanger. The high levels of DOM
and TDS in the OTSG feed water cause numerous operational problems like fouling
of pipelines and equipment and clogging of injection wells [1, 87, 88]. To reduce
the injection water volume, evaporators are sometimes used as a downstream BBD
recovery process. Evaporators have also been used to desalinate produced water to
make high-quality boiler feed water, but energy use is high. High TDS and DOM of
boiler feed water results in more blowdown volumes and necessitates recycling more
low quality BBD water back to the process [1]. In light of the above, it may be of
interest to compare the WLS-IX scheme with an alternative membrane-based process
which can separate almost all silica and divalent ions and reject more than 90% of
DOM and TDS in a single step operation [7].
28

Among emerging technologies applied for oilfield produced water treatment [5],
membrane separation processes have been found to be appropriate candidates due to
their distinct advantages over traditional processes mainly lower operating expenses
and lower energy consumption. Microfiltration and UF membranes were shown to be
ineffective for separation of silica, DOM and salt from produced water [51, 52, 89].
However, tighter UF membranes were reported to remove up to ∼60% of organic mat-
ter and silica depending on the characteristics of feed water constituents and oper-
ating condition (pH and ionic strength) and consume relatively low amounts of en-
ergy [51,90,91]. NF and RO are widely used for separation of organic matter, salt and
silica from water and wastewater. However, there are few records in the peer-reviewed
literature for their application in desalination and organic removal of oil sands pro-
duced water [38, 39, 43]. This is mainly due to their high susceptibility to fouling by
high TDS and TOC of such water.
Fouling is the principal obstacle in developing a sustainable and energy efficient
membrane process. It significantly reduces membrane performance and their lifetime
and subsequently increases operation and maintenance costs [92]. Peng et al. [39] and
Kim et al. [38] studied membrane fouling by OSPW associated with the surface extrac-
tion of bitumen which primarily contains naphthenic acid-like DOM [19,23,34,70,72].
Kawaguchi et al. [93] showed that naphthenic acids also predominated in all SAGD
process water samples (>74% of the organic acids) while traces of fatty acids (orig-
inated from the groundwater, used as makeup water and became concentrated in the
water treatment process) were also found. They indicated that the fingerprints of the
DOM of the water samples from the SAGD operation varied as the process water
treatment progressed. Petersen and Grade [94] divided organic species in the SAGD
produced water samples into three primary groups: saturated aliphatics (n-alkane and
cycloalkane), aromatics (benzenes and polyaromatic rings), and polar compounds (al-
cohols, ketones, phenols, etc.) , all indicative of presence of naphthenic acids as the
29
main DOM in SAGD produced water. However, Guha Thakurta et al. [1] demon-
strated that DOM in SAGD produced water are significantly different form OSPW
DOM and more representative of humic acids than naphthenic acids. It must be noted
that every DOM has specific charge and molecular conformation which controls the
rate of fouling and subsequently performance of membrane process [95]. Also, the
interaction of DOM functional groups with ions and silica at various pH induces dif-
ferent properties on DOM and thus the structure and hydraulic resistance of fouling
layer [75, 77, 92, 96–99]. Hence, performance of membrane processes changes vastly
based on the type and concentration of DOM and water chemistry. Based on our search
in literature, membranes have not been tested for SAGD produced water treatment.
The aim of this study is to investigate the performance of commercial UF, NF and
RO membranes for desalination and DOM removal from industrial SAGD produced
water. Effects of hydrophilicity, zeta potential, roughness and pore size of membranes
on flux decline and TOC and TDS rejection were investigated by doing experiments at
the same initial permeate flux and feed flow rate. It was found that more hydrophilic
and negatively charged membranes with the lower average roughness were less prone
to fouling, regardless of membrane pore size. RO membranes and denser NF mem-
branes removed more than 86% of TOC and TDS. For these membranes TDS rejection
remained constant or enhanced slightly as fouling progressed while TOC rejection in-
creased over time due to the pore and valley blocking by DOM and silica. Loose NF
membrane rejected more than 70% of TOC and TDS which makes their application
reasonable if very high quality water is not demanded. The UF membrane removed
less than 50% of salt, silica and DOM. This makes UF impractical as a single step
technique for WLS inlet water treatment.
pH is proven to be the most influential factor on DOM fouling through changing
both DOM and membrane surface charge [67,68,79–81,99–101]. In the present work,
decreasing feed pH from 9 to 7 increased TDS rejection for salt rejecting NF and RO
30

membranes but decreased that for UF membrane. TOC rejection slightly decreased
for NF and RO by decreasing pH while it increased for UF membrane. Generally,
effect of pH alteration on flux and rejection was found to be more influential for denser
membranes with high salt rejecting properties. Impulsive change of pH is suggested
as an important mitigation technique to reduce the membrane fouling and recover the
water flux. FEEMs results showed that the majority of the DOM that remained in the
RO and tight NF permeates were hydrophilic matter. For loose NF and UF membranes,
all types of DOM found in the feed were also found in the permeate. EDX analysis
of the fouled membranes indicated presence of silica, iron and calcium in the foulant
material. Membrane process was realized to be a superior alternative technique to
current SAGD produced water treatment methods, especially in terms of producing
higher quality water by consuming less chemicals and energy.
2.2 Material and methods
2.2.1 Feed water
SAGD WLS inlet water is provided as feed water from a SAGD water treatment plant
located in the Athabasca oil sands region of Alberta, Canada. Samples were collected
in sealed containers and kept in a nitrogen blanket until they were opened for treatment.
pH, conductivity and TOC of samples were first measured (Table2.1).
Concentration of the dissolved silica and other inorganic ions, as presented in Ta-
ble2.1, are measured by ICP-OES. Chloride concentration was measured by automated
colourimetry using SSMA 4500 CL-E method. TDS was measured through SM 2540-
C protocol. The data presented in Table2.1 indicates that WLS inlet water contains
high concentration of DOM, TDS, and dissolved silica.
31

Table 2.1: Properties of WLS inlet waterElements Units Feed waterpH − 9Conductivity µS/cm 1680TDS mg/L 1200TOC mg/L 420Disolved Silicon(Si) mg/L 89Sodium (Na+) mg/L 350Cloride (Cl−) mg/L 170Calcium (Ca2+) mg/L 1.9Magnesium (Mg2+) mg/L 0.59Iron (total Fe) mg/L 0.39Boron (B) mg/L 19
2.2.2 Membranes
Membrane filtration experiments were conducted using six types of polymeric mem-
brane, (i) Three NF membranes (NF270 and NF90 from Filmtec and ESNA from Hy-
dranautics), two RO membranes (BW30 from Filmtec and ESPA from Hydranautics)
and one UF membrane (thin film UF from GE). All these membranes are thin film
composite membranes consist of three layers: a thin film as an active layer, an in-
termediate microporous layer and a mesoporous polyester fabric support [85]. The
very thin PA active layer determines the membrane separation properties and fouling
behavior of DOM and inorganic materials.
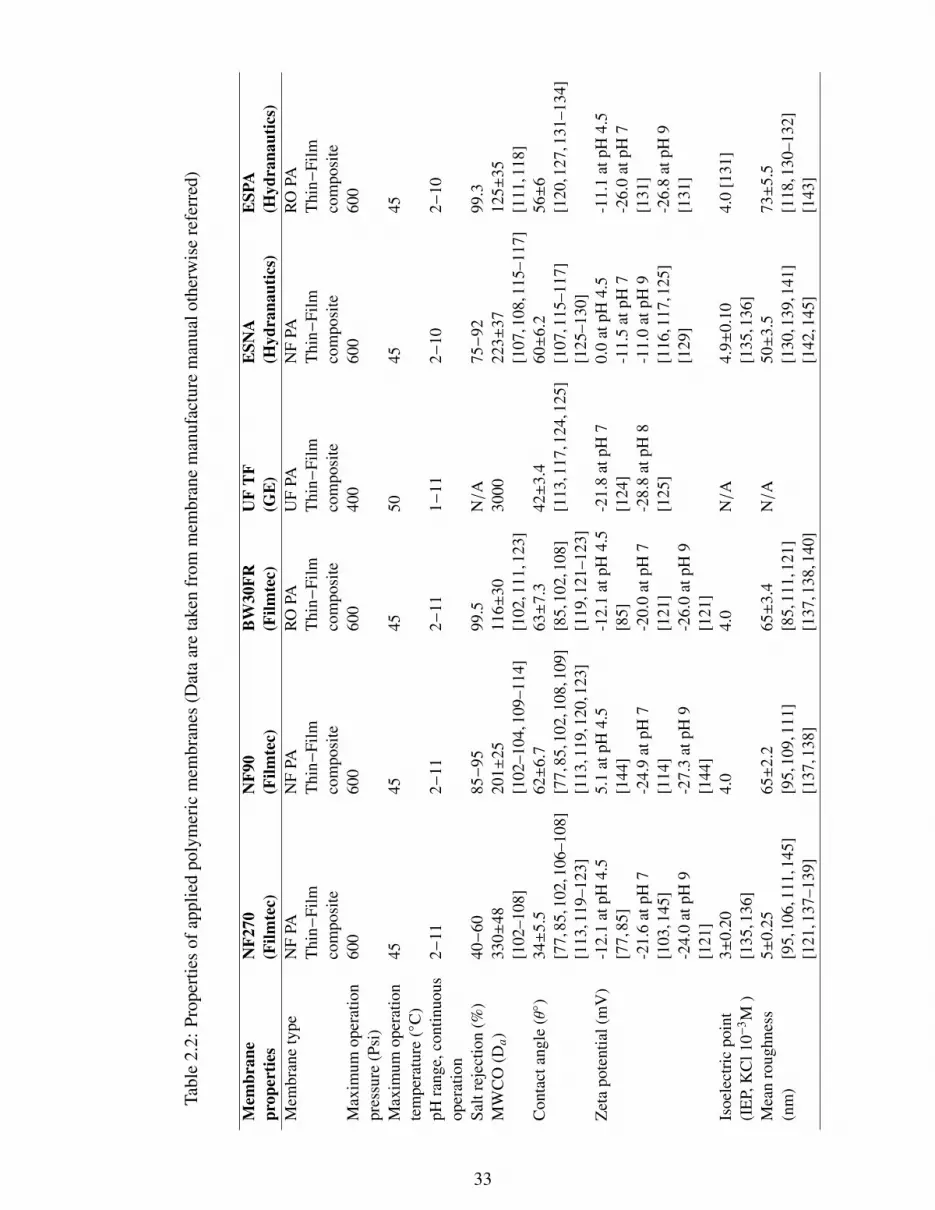
The properties of applied membranes are collected from manufacturers’ manual
and literature and listed in Table2.2 [77, 85, 95, 102–144].
[102–108]
32
Tabl
e2.
2:Pr
oper
ties
ofap
plie
dpo
lym
eric
mem
bran
es(D
ata
are
take
nfr
omm
embr
ane
man
ufac
ture
man
ualo
ther
wis
ere
ferr
ed)
Mem
bran
eN
F270
NF9
0B
W30
FRU
FT
FE
SNA
ESP
Apr
oper
ties
(Film
tec)
(Film
tec)
(Film
tec)
(GE
)(H
ydra
naut
ics)
(Hyd
rana
utic
s)M
embr
ane
type
NF
PAN
FPA
RO
PAU
FPA
NF
PAR
OPA
Thi
n−Fi
lmT
hin−
Film
Thi
n−Fi
lmT
hin−
Film
Thi
n−Fi
lmT
hin−
Film
com
posi
teco
mpo
site
com
posi
teco
mpo
site
com
posi
teco
mpo
site
Max
imum
oper
atio
n60
060
060
040
060
060
0pr
essu
re(P
si)
Max
imum
oper
atio
n45
4545
5045
45te
mpe
ratu
re(◦
C)
pHra
nge,
cont
inuo
us2−
112−
112−
111−
112−
102−
10op
erat
ion
Salt
reje
ctio
n(%
)40−
6085−
9599
.5N/A
75−
9299
.3M
WC
O(D
a)33
0±48
201±
2511
6±30
3000
223±
3712
5±35
[102
–108
][1
02–1
04,1
09–1
14]
[102
,111
,123
][1
07,1
08,1
15–1
17]
[111
,118
]C
onta
ctan
gle
(θ◦)
34±
5.5
62±
6.7
63±
7.3
42±
3.4
60±
6.2
56±
6[7
7,85
,102
,106
–108
][7
7,85
,102
,108
,109
][8
5,10
2,10
8][1
13,1
17,1
24,1
25]
[107
,115
–117
][1
20,1
27,1
31–1
34]
[113
,119
–123
][1
13,1
19,1
20,1
23]
[119
,121
–123
][1
25–1
30]
Zet
apo
tent
ial(
mV
)-1
2.1
atpH
4.5
5.1
atpH
4.5
-12.
1at
pH4.
5-2
1.8
atpH
70.
0at
pH4.
5-1
1.1
atpH
4.5
[77,
85]
[144
][8
5][1
24]
-11.
5at
pH7
-26.
0at
pH7
-21.
6at
pH7
-24.
9at
pH7
-20.
0at
pH7
-28.
8at
pH8
-11.
0at
pH9
[131
][1
03,1
45]
[114
][1
21]
[125
][1
16,1
17,1
25]
-26.
8at
pH9
-24.
0at
pH9
-27.
3at
pH9
-26.
0at
pH9
[129
][1
31]
[121
][1
44]
[121
]Is
oele
ctri
cpo
int
3±0.
204.
04.
0N/A
4.9±
0.10
4.0
[131
](I
EP,
KC
l10−
3 M)
[135
,136
][1
35,1
36]
Mea
nro
ughn
ess
5±0.
2565±
2.2
65±
3.4
N/A
50±
3.5
73±
5.5
(nm
)[9
5,10
6,11
1,14
5][9
5,10
9,11
1][8
5,11
1,12
1][1
30,1
39,1
41]
[118
,130
–132
][1
21,1
37–1
39]
[137
,138
][1
37,1
38,1
40]
[142
,145
][1
43]
33

As can be seen, all membrane can withstand feed temperature and pH as high as
45 ◦C and 10, respectively. Main characteristics which govern permeation properties of
membranes are membrane MWCO, surface charge and hydrophilicity and roughness.
MWCO is described as the molecular weight for which 90% of the solute, usually
polyethylene glycol (PEG) is retained by the membrane [146]. The higher the MWCO
the larger the pore size of membrane. Membranes having higher MWCO, e.g. UF in
Table 2.2, are more susceptible to fouling than denser membranes due to the higher
permeation drag.
By retaining a constant permeation drag for all membranes by conducting ex-
periments at constant initial permeation flux, fouling intensity can be compared to
other surface properties like surface charge, hydrophilicity and roughness. The surface
charge and hydrophilicity of a membrane are quantified by measuring the zeta potential
and contact angle. More negatively charged and hydrophilic membranes are proven to
be less prone to fouling by hydrophobic organic and negatively charged inorganic ma-
terials. Membrane surface roughness also plays a major role in fouling until the cake
layer grows enough to make the initial surface roughness less significant. Rougher
surfaces favor the entrapment of foulants in zones by the reverse flow due to the eddy
occurring behind the peaks. Clogging of valleys on the surface of salt rejecting NF and
RO membranes results in significant loss of permeate flux [147].
2.2.3 Cross flow membrane filtration setup
Schematic view of cross flow membrane filtration setup is shown in Figure 2.1 The
setup consists of a stainless steel feed tank, membrane cell, a constant flow diaphragm
pump of maximum capacity 6.8 LPM (1.8 GPM) from Hydra-Cell, a chiller/heater
(Isotemp 3013, Fisher Scientific) to keep the feed temperature at 50 ◦C, a bypass valve
and a back pressure regulator to control applied pressure and cross flow velocities
(Swagelok). A digital weighing balance (Mettler Toledo) was used to measure the per-
34

meate flow rate and the data were directly collected into a computer using LabVIEW
(National Instruments) data acquisition software.
2.2.4 Experimental methodology
Six experiments were conducted to find the effect of pH and membrane properties on
water flux, TOC and TDS rejection and deposition of organic and inorganic matter on
the membrane surface (Table 2.3).
Table 2.3: Variation of pH with time in conducted experimentsTime
Membrane 1−2 3−4 5−6UF-TF (GE) pH=9 pH=7 pH=10NF90 (Filmtec) pH=9 pH=7 pH=10BW30 (Filmtec) pH=9 pH=7 pH=10NF270 (Filmtec) pH=9 pH=9 pH=9ESPA (Hydranautics) pH=9 pH=9 pH=9ESNA (Hydranautics) pH=9 pH=9 pH=9
Constant pH (raw WLS inlet water pH=9) experiments were conducted on NF270,
ESNA and ESPA and dynamic pH experiments (9-7-10) were carried out on UF-TF,
NF90 and BW30 membranes. Membrane samples were stored in de-ionized water for
24 hr in order to remove preservatives. Before each experiment, membrane compaction
was performed with de-ionized water at the pressure range of 800-1400 kPa, depending
on the type of membrane.
2.2.5 Characterization techniques
2.2.5.1 Fluorescence excitation emission matrix spectroscopy (FEEMs)
The fluorescence excitation-emission matrix spectroscopy (FEEM) detects fingerprint
of the soluble and insoluble organic matter. This detection was obtained over a wave-
length range of 200 to 500 nm with 5 and 10 nm intervals for excitation and emission
35
wavelengths, respectively. The WLS inlet samples were diluted using DI water to a
TOC level of around 15 mg/L to avoid inner filtration (quenching) effects on fluores-
cence analysis. For all experiments fluorescence analysis was performed on feed and
permeate samples at pH 9.
2.2.5.2 Total organic carbon (TOC)
TOC detects the concentration of all organic carbon atoms covalently bonded in the
organic molecules of sample of water. It is a parameter for monitoring the amount of
DOM and evaluation the efficiency of treatment process. A typical analysis for TOC is
calculated based on total carbon (TC) and inorganic carbon (IC) measurements (TC-
IC=TOC). TOC in the present work was measured using a TOC analyzer (Shimadzu,
model TOC-V; detection range 3-25,000 mg/L). All samples were filtered with 0.22
µm MF membranes (Cellulose Acetate, Millipore, USA) to remove the suspended
solids before TOC analysis.
2.2.5.3 Inductively coupled plasma-optical emission spectroscopy (ICP-OES)
Emission spectroscopy using ICP is a rapid, sensitive and convenient method for the
determination of metal ions in aqueous solutions. Concentration of dissolved silica
and other inorganics presented in Table 2.2 was measured by ICP-AES instrument
(Agilent 735 ICP-OES) using EPA 200.7 method. In this method the water sample
is nebulized and the resulting aerosol is transported into inductively coupled argon
plasma generated by radio frequency power. The high temperature (6000-10000 K)
of the plasma leads to almost complete dissociation of molecules and efficient atom-
ization and ionization in the sample. Emission spectra are produced when the excited
atoms and ions return to lower energy states. The spectra are dispersed by high resolu-
tion echelle polychromator and the intensities of the lines are monitored by a charged
coupled device (CCD). In OES, the power of the radiation emitted by a constituent
36

after excitation is directly proportional to its concentration.
2.2.5.4 Field emission scanning electron microscope- energy dispersive X-ray (FESEM-
EDX)
Field emission scanning electron microscope (FESEM) provides images of sample sur-
face to analyze surface morphology. Prior to the analysis, the membranes were coated
with a thin film of chromium. Surface images of the membranes were obtained by
using JEOL 6301F model of FESEM. All membranes were imaged at a magnification
of 20,000 times. Field emission scanning electron microscope provides qualitative in-
formation on deposition of foulants on the membrane. Semi-quantitative elemental
analysis was done via a PGT IMIX EDX system with 135 eV resolution.
2.2.5.5 Attenuated total reflectance-fourier transform infrared (ATR-FTIR) spectroscopy
ATR-FTIR spectroscopy provides information on the type of functional groups present
to the depths less than 1 µm. All membranes before and after WLS inlet filtration were
examined using ATR-FTIR microscope (Thermo Nicolet Nexus 670 FTIR, USA). This
instrument is equipped with a mercury-cadmium-tellurium (MCT) detector and has a
resolution of 4 cm−1. A total of 512 scans were averaged for each spectral measure-
ment. The internal reflection element was a zinc selenide (ZnSe) ATR plate with an
aperture angle of 45◦. All membrane samples were scanned over the range of 600-
4000 cm−1.
2.3 Results and Discussion
Measuring the permeation flux of desired materials and removal of undesired mat-
ter is the most common way for evaluating the performance of membranes. Foul-
ing tendency of the applied membranes and fouling potential of the treated water are
37

generally measured by finding the rate of water flux decline over time. Fouling de-
teriorates the performance of membranes by decreasing the permeation flux and the
quality of membranes, and consequently shortens membrane life [73]. Membrane
fouling is influenced by a great number of parameters including hydrodynamics (feed
flow rate, permeation drag and feed channel dimension), solution chemistry (salt and
divalent ion concentrations, presence of sparingly soluble solids and pH), and sur-
face properties of membrane (hydrophilicity/ hydrophobicity, zeta potential, surface
roughness and pore size). Regardless of feed water properties and membrane module
hydrodynamics, membrane manufacturers are continuously seeking to develop more
antifouling membranes with modifying their surface properties. In the present work,
effects of hydrophilicity, surface charge and roughness of various types of polymeric
membranes on the water flux and TOC and TDS rejection during UF, NF and RO of
industrial SAGD produced water were investigated. Experiments were conducted at
constant feed flow rate and permeation flux on a same industrial feed (WLS inlet wa-
ter) to minimize the effect of feed chemistry and hydrodynamics. Despite the many
modification and fouling preventive strategies, membrane fouling is inevitable. Online
reduction of membrane fouling by physical techniques like vibration, ultrasound, vor-
tex generation and flow and pressure pulsation have been widely studied [148–153]
Another technique for mitigating fouling during operation is impulsive change of en-
vironmental conditions such as pH, ionic strength, light, temperature and electric and
magnetic fields, especially in presence of stimuli responsive membranes [154]. In this
study, effect of pH on water flux recovery and TOC and TDS rejection, during cross
flow filtration of SAGD produced water was investigated. Since, the performance of
membrane process is proven to be influenced by the characteristics of feed water and
interaction of its constituents with the membrane under specific operating condition,
feed, permeate and fouled membranes are characterized in detail.
38

2.3.1 Continuous operation at fixed pH
Water flux and TOC and TDS rejection of NF270, ESNA and ESPA membranes at
50 ◦C and a constant pH=9.0 is shown in Figure 2.2. It must be noted that the initial
water flux of 20 GFD was obtained at different pressures of 40, 80 and 120 psi for
NF270, ESNA and ESPA membranes, respectively. As can be observed in Figure 2.2,
water flux declined due to the combined fouling of silica, organic matter and divalent
ions present in the WLS inlet water. According to Table 2.1, the concentration of silica
and divalent ions in the WLS inlet water (∼90 mg/L) is almost 5 times lower than
the concentration of organic matter (420 mg/L). Hence, DOM fouling is expected to
be the principal mechanism in the present work. Initial adsorption of DOM on the
membrane surface decreases permeate flux due to DOM gel formation, pore blocking,
and induced hydrophobic properties.
Flux decline due to pore blocking and pore constriction was found to be more
severe with membranes having a larger pore size (UF and loose NF membranes). For
salt rejecting NF and RO membranes, plugging of hot spots by DOM was found to
be critical for the sharp initial flux decline [121, 147, 155–157]. Hot spots are the
valleys on the membrane surface with the minimum thickness and the maximum local
water flux. Rapid clogging of these hot spots lead to substantial loss of permeate flux
[147]. It is also proven that the hydrophobicity of hydrophilic membranes increases
after fouling by particularly hydrophobic organic matter [121, 158, 159]. Increasing
hydrophobicity generally leads to more susceptibility to fouling due to the hydrophobic
interactions between the membrane surface and the hydrophobic materials [121].
In this study, the major organic matter in the WLS inlet water are hydrophobic
acids (mainly humic type [1]) and all applied membranes are hydrophilic based on
contact angle values in Table2.1. Hence, membranes’ surface will definitely become
hydrophobic after fouling.
The bar chart in Figure 2.2 shows that the initial flux decline for NF270 is lower
39

than two other membranes. At constant initial permeate flux, feed flow rate and feed
solution chemistry (pH and ionic strength), rate of flux decline is strongly dependent
on surface properties of membranes. According to data presented in Table 2.2, NF270
is a very smooth membrane with stronger hydrophilic properties than ESNA and ESPA
membranes as indicated by their surface roughness and contact angle values. In addi-
tion, surface of NF270 membrane is more negatively charged than ESNA membrane.
Earlier studies found that more negative zeta potential and hydrophilicity of the mem-
brane surface leads to less fouling by organic matter due to the higher electrostatic
repulsion and lower hydrophobic interaction between the foulant and the membrane
surface [121, 155, 160]. ESNA membrane showed less initial decline than ESPA in
spite of being less negatively charged. The rougher surface of ESPA membrane results
in enhanced deposition of silica particles onto the membrane surface and, hence, more
severe fouling [161, 162]. As a matter of fact the role of colloidal fouling becomes
governing in combined organic/colloidal fouling of rougher membranes. Meanwhile,
higher salt rejection of the ESPA membrane during fouling experiment resulted in a
more severe osmotic pressure build-up near the membrane surface and hence a greater
flux decline [54, 163].
It is worth noting that all these membranes were tested at same permeation flux (20
GFD) which is hypothesized to be around their limiting flux according to the moderate
flux decline (7-10% after 6 hr experiment). Higher initial permeation flux could result
in more severe flux decline. Tu et al. [121] observed 50% and 30% water flux decline
after 6 hr filtration of humic acid and silica by NF270 membrane at initial permeate
flux of 50 GFD. They attributed higher flux decline in NF270 membrane compared to
BW30, despite having lower surface roughness and higher negative zeta potential and
hydrophilicity, to the governing effect of initial permeation flux.
Membrane fouling in earlier studies is considered as two successive stages where
foulant-membrane and foulant-foulant interactions are governing deposition of ma-
40

terial at first and second stages, respectively [144, 155]. Very low values of initial
permeate flux decline, in NF270, ESPA and ESNA membranes, implies that foulant-
membrane interaction is minimized either by favorable surface properties of applied
membranes and hydrodynamics of experiments. In the case of good interaction be-
tween foulant and membrane, foulants (mainly DOM in the present work) adsorb on
the membrane surface and decrease permeate flux sharply due to pore blocking, in-
duced hydrophobic properties and lowered permeation drag [96, 121, 161, 164–167].
Figure 2.3 shows variation of TOC and TDS rejection with time using NF270,
ESPA and ESNA membranes. As can be observed, for all of these membrane TOC
rejection increased with time which is an evident of hydrophobic interaction in the
second stage of fouling. According to literature, adsorption of organic matter on the
membrane surface makes the membrane more hydrophobic [96, 121, 158, 166, 168].
This intensifies deposition of organic matter on each other due to hydrophobic foulant-
foulant interaction. As a result, TOC rejection increases. For more hydrophilic NF270
membrane, rate of increase in TOC rejection is greater. This result can be explained
by the findings of Cho et al. [159] and Tu et al. [121]. They both observed more severe
induced hydrophobicity for the more hydrophilic membrane after fouling by organic
matter.
TDS rejection remained constant for more salt rejecting membranes, ESPA and
ESNA (>90% rejection), whereas decreased for looser NF270 membrane. Accord-
ing to literature, for salt rejecting membranes both flux and salt rejection decline as
fouling progresses due to the cake enhanced concentration polarization [54,169–171].
As foulants (silica and organic matter) deposit on the membrane surface, the salt con-
centration at the membrane surface significantly increases because back diffusion of
salt away from the membrane surface is hindered by the foulant cake layer [163].
The increased salt concentration at the membrane surface increases the driving force
for salt transport through the membrane. This results in a significant passage of salt
41
to the permeate steam and consequently decrease the TDS rejection. However, in
this study, TDS rejection increased slightly for denser membranes which confirms the
dominance of organic fouling in WLS inlet water filtration. Plugging of hot spots by
organic matter resulted in formation of denser screening layer against transport of salt
as demonstrated in literature [121, 147, 155–157].
For NF270 membrane, however, TDS rejection decreased which seems to be a
paradox to less fouling potential of this membrane as discussed before. Lee et al. [163]
showed that, there is not necessarily a direct relationship between rate of flux decline
(fouling severity) and rejection decrease. They observed a much greater salt rejection
drop for the NF membrane compared to the RO despite having similar flux decline
trend. They attributed this to different mechanisms governing salt rejection by NF and
RO. The predominant mechanism of salt rejection for RO membranes is size exclusion,
while for NF membranes both size and charge (Donnan) exclusion are critical. Hence,
salt concentration increase on the membrane surface due to cake formation has a more
significant effect on reduction of membrane charge exclusion.
2.3.2 Membrane operation with varying pH
Dynamic pH experiments were conducted on UF, NF90 and BW30 membranes. The
transmembrane pressure was adjusted on 30, 80 and 120 psig to acquire the same initial
permeation flux of 20 GFD. pH of WLS inlet feed decreased from 9 (raw WLS inlet
feed pH) to 7 after 120 min, then increased to 10 after 240 min. Variation of water
flux with time and pH is shown in Figure 2.4. Decreasing pH from 9 to 7 declined
water flux sharply for all membranes. Flux increased by increasing the pH from 7 to
10. Sharp decline was found to be more severe in the salt rejecting NF90 and BW30
membranes. Flux recovery became more evident for the denser BW30 membrane. The
FESEM images, as will be shown later, demonstrated re-dissolving of fouled material
on the NF and RO membranes by increasing pH, which resulted in reversible fouling
42
and flux recovery. By increasing the pH from 7 to 10, the flux increased to even more
value than the initial flux at raw WLS inlet water pH. Decreasing the pH increases
the rate of coprecipitation of organic matter and silica which causes a sharp decline
especially for denser membranes [1, 171]. This is attributed to the quick change of
foulant/foulant and foulant/membrane interactions by pH alteration.
The permeate flux under various pH values is affected by the properties of both
membrane and solution. The surface charges of DOM were shown to become more
negative with increasing pH and vice versa [79, 80, 92, 99–101]. The higher nega-
tive charge results in formation of more porous cake layer due to the inter-foulant
repulsion, and consequently higher permeation flux. Silica and DOM are the major
constituents in WLS inlet water. Surface charge of silica particles is negative charged
at pH values more than their isoelectric point (pH>3), the magnitude of which in-
creases with increasing pH and increasing salt concentration [172, 173]. In the case
of DOM, protonation of functional groups (mainly COOH) at lower pH decreases the
charge and ultimately electrostatic repulsion [79, 80, 92, 99–101]. Also, pH affects
the macromolecular conformation of DOM, so that smaller configuration is formed
at lower pH values [92, 96, 174]. This causes formation of a more compact foul-
ing layer and subsequently, a flux decline. In addition to foulant/foulant interaction,
foulant/membrane interaction strongly affects membrane performance at various pHs.
Generally, the zeta potential of the membranes, particularly PA membranes contain-
ing carboxylic (R-COO−) and amine (R-NH+3 ) ionizable functional groups, become
more negative as pH increases [56, 160, 175, 176]. Altogether, both inter-particle and
particle-membrane repulsions prevent the particles from depositing, and lead to forma-
tion of thinner fouling layer. Hence, higher permeation fluxes were observed at higher
pH values [92, 96, 97, 109, 177–179].
At raw pH the minimum and maximum initial flux decline was observed for UF
and NF90 membranes, respectively (bar chart in Figure 2.4). Based on the data pre-
43

sented in Table 2.2, the UF membrane is more hydrophilic and negatively charged
than both BW30 and NF90 membranes. This resulted in less flux decline at a constant
permeation flux. Taking a closer look into Table2.2, it is found that BW30 and NF90
membranes have almost the same surface properties (see roughness, contact angle and
zeta potential values) and are predicted to show the same fouling behavior. A slightly
higher fouling of NF90 membrane can be attributed to a minor pore blocking by DOM
with molecular weight less than 250 Da. Our previous study showed that almost 40%
of the DOM in the BBD have molecular weight less than 500 Da [1]. This increases
the chance of pore blocking by DOM in membranes having MWCO in the range of
100-300 Da (see Table 2.2). At pH 7, exactly opposite behavior compared to pH 9 was
observed. At lower pH, when coprecipitation of silica and organic matter happens,
size of the deposited materials increase which makes pore blocking more severe in UF
membrane. FESEM images of fouled membranes showed presence of particles with
100 nm diameter as will be discussed later.
Figure 2.5 shows the effect of step change in pH on TDS and TOC rejection during
filtration by UF, NF90 and BW30 membranes. As can be seen, for tighter BW30 and
NF90 membranes, higher TDS rejection was obtained at pH 7. 1000 ppm WLS inlet
feed TDS was reduced to 60-63 ppm at pH 9, 30 ppm at pH 7 and around 96 ppm at
pH 10 by both BW30 and NF90 membranes. Precipitation of silica nanoparticles and
also coprecipitation of organic compounds by adsorption on the surface of the silica
nanoparticles at lower pH resulted in formation of closely packed cake layer. The
cake filtration increased the TDS rejection almost five unit. For UF membrane, pH
reduction decreased the TDS rejection which was found to be irreversible by increasing
the pH up to 10. This interesting result confirms irreversible pore blocking of loose UF
membrane at lower pH values. By UF treatment, permeate TDS reduced to 580 ppm
at pH 9, 690 ppm at pH 7 and 750 ppm at pH 10.
Effect of pH on TOC rejection was almost insignificant particularly for salt reject-
44

ing membranes. At pH 9, TOC rejection increased over time due to cake filtration,
then decreased very slightly by decreasing the pH to 7. Cake filtration at lower pH was
predicted to increase the TOC rejection similar to TDS rejection. However, the slight
decrease might be due to the precipitation of very small MWCO hydrophilic DOM
which could pass through both cake layer and the membrane. According to Figure 2.5,
both NF90 and BW30 membranes were able to reject 90-93% of the DOM. This minor
change in TOC rejection is attributed to the larger size of organic matter as compared
to the dissolved solids, mainly Na+ and Cl− monovalent ions. DOM/membrane inter-
action at higher pH and DOM/cake layer interaction at lower pH had the same effect
on the removal of DOM. In the case of UF membrane, deposition of precipitated DOM
on the walls of membrane’s pores, made the pores narrower which improved screen-
ing performance. It must be noted that, pore constriction of UF membrane could not
screen salts due to their smaller size than DOM, and TDS rejection even decreased
drastically owing to less electrostatic repulsion of fouled membrane.
2.3.3 Suitable membrane for WLS inlet filtration
In order to select a suitable membrane for WLS inlet filtration, the trade-off relation-
ship between energy consumption and product quality was considered. It is always
favorable to minimize energy consumption and improve the quality of water based on
environmental standards and/or technical constraints. In pressure-driven membrane
processes energy consumption is directly related to the applied trans-membrane pres-
sure. Hence, UF and loose NF membranes are less energy intensive than tight NF and
RO. The applied pressure for UF and NF270 membranes was 30 and 40 psig, respec-
tively. Based on Figures 2.3 and 2.5, TOC and TDS rejections increased considerably
from about 50% and 30% for UF to more than 70% for NF270 just by applying 10 psig
more pressure. Therefore, when very high quality water is not required NF270 can be
selected as an excellent energy efficient membrane.
45
ESNA and NF90 were found to give 20 GFD water flux at the same trans-membrane
pressure of 80 psig. However, TOC and TDS rejection of NF90 was slightly better than
ESNA (Figures 2.3 and 2.5). TDS rejections for NF90 and ESNA were 93% and 91%,
respectively. The initial TOC rejection for NF90 membrane was also 4% higher than
ESNA (90% compared to 86%). In fact, the water produced by NF90 membrane had
the same quality as RO, BW30 and ESPA which operated at 120 psig. Hence, NF90
membrane is suggested as the best candidate since it provided reasonable product qual-
ity and is found to be more energy efficient than RO.
2.3.4 Rejection of organic matter
DOM is a heterogeneous mixture of aromatic and aliphatic organic compounds con-
taining oxygen, nitrogen, and sulfur functional groups (e.g., carboxyl, amine and
thiol) [180]. FEEMs is a reliable and inexpensive method which can provide valu-
able information about the nature of the dissolved organics. This method has been
used in our prior investigations of SAGD water characterization [1]. The FEEMs tech-
niques works based on excitation of electrons to a higher energy level by absorption
of light energy, and then releasing energy as light as they drop to a lower energy level.
Aromatic organic compounds, like humic acids, which absorb and re-emit light are
called fluorophores. The excitation/emission (Ex/Em) wavelength ranges for peaks as-
sociated with pure organic compounds are obtained by researchers and can be used as
scales to identify types of organic matter in a mixture. In our previous work FEEMs
output is correlated to DOM classification by a resin-fractionation technique for this
SAGD produced water stream [1].
Figure 2.6 shows the FEEMs results related to signatures of DOM in WLS in-
let feed and permeates of applied polymeric membranes at pH 9. The fluorescence
response for WLS inlet feed was observed over a wide range of wavelengths, with
dominant peak at Ex/Em wavelength range of 220-350/350-450. This wide range of
46
wavelengths demonstrates that various types of organic compounds exist in WLS inlet
feed. The fluorescence peaks of DOM are generally noticed due to the presence of
high aromaticity as well as hydroxyl (mainly in carboxylic acid), and amine (mainly
in PA polymer and/or amino acid organic matter) groups in the organic fluorophores.
The fluorescence intensity of any uorophore can be reduced by the interfering effects
of other molecules present in a mixture of uorophores.
According to Figure 2.6, WLS feed water contains wide range of organic mat-
ter including hydrophilic acid (HPiA), hydrophilic base (HPiB), hydrophilic neutral
(HPiN), hydrophobic acid (HPoA), hydrophobic base (HPoB) and hydrophobic neutral
(HPoN) based on the classified results of our previous studies. This variety still exist
in the permeate stream of NF270 and UF membranes. This means that UF and looser
NF membranes could not totally remove any organic matter and all types of organics
passed through the membranes. In the case of RO and tight NF membranes, the main
organic in the permeate stream were hydrophilic compounds (HPiN, HPiA and HPiB).
This means that hydrophobic acidi organic matter in the WLS inlet water, like humic
acid, was almost completely removed by these membranes. Since TOC rejection for
NF and RO membranes increased with time (Figures 2.3 and 2.5) it is found that the
hydrophilic matter traced by FEEMs was mainly passed through the membranes at the
early stage of filtration. At the initial stage of filtration, the hydrophilic parts of DOM
in WLS inlet water were in direct contact with the surface of hydrophilic membranes.
This facilitated their transfer to the permeate side. Hydrophobic organics are suggested
to be the main materials responsible for membrane fouling [96, 97, 101, 181]. FEEMs
results confirms that hydrophobic signature of organic matter in the WLS inlet water
were mostly deposited on the membrane surface and made the fouling more severe
especially at the second stage of filtration when hydrophobic interaction of organic
matter becomes important. Figure 2.6 demonstrates that tight NF and RO membranes
are the favorable options for removing DOM from WLS inlet water.
47
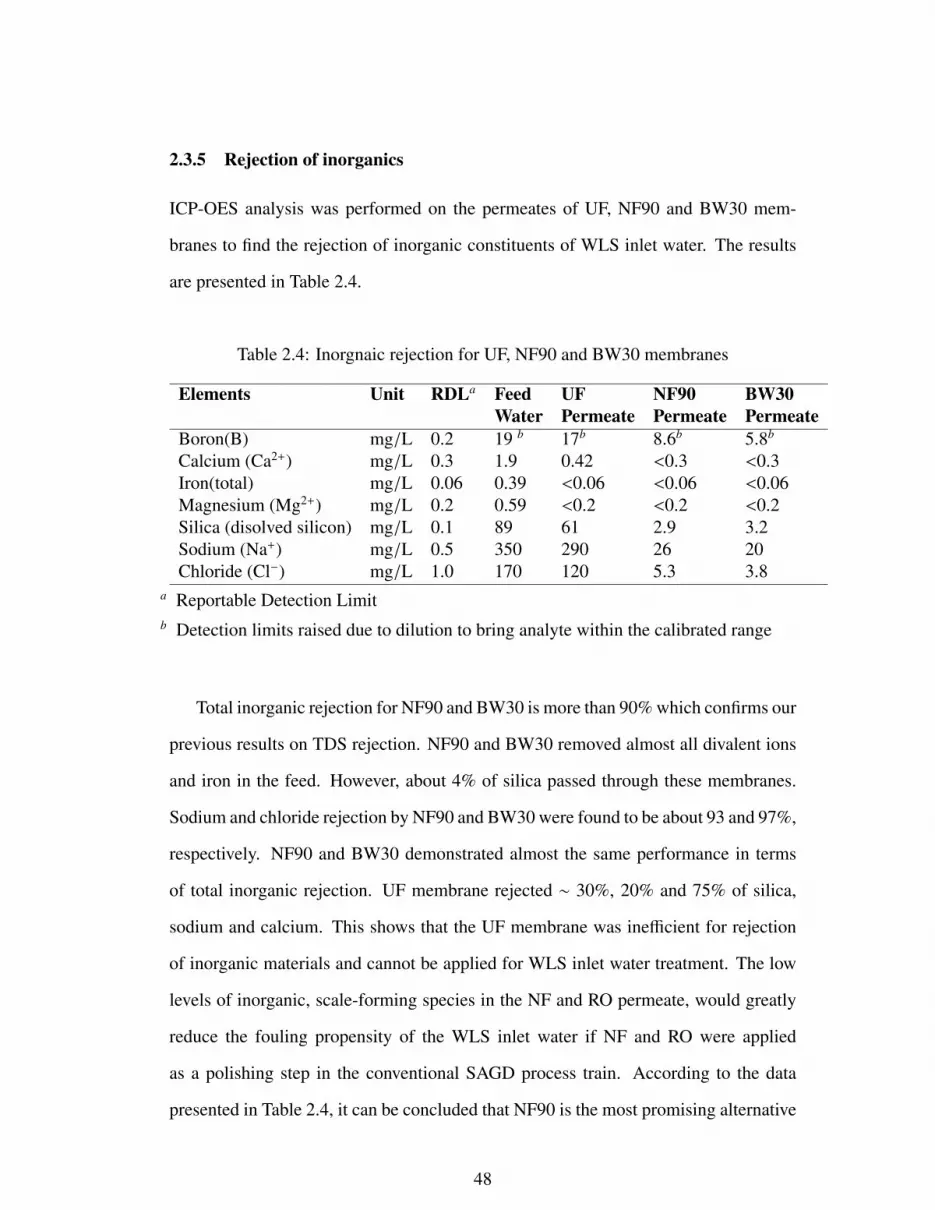
2.3.5 Rejection of inorganics
ICP-OES analysis was performed on the permeates of UF, NF90 and BW30 mem-
branes to find the rejection of inorganic constituents of WLS inlet water. The results
are presented in Table 2.4.
Table 2.4: Inorgnaic rejection for UF, NF90 and BW30 membranes
Elements Unit RDLa Feed UF NF90 BW30Water Permeate Permeate Permeate
Boron(B) mg/L 0.2 19 b 17b 8.6b 5.8b
Calcium (Ca2+) mg/L 0.3 1.9 0.42 <0.3 <0.3Iron(total) mg/L 0.06 0.39 <0.06 <0.06 <0.06Magnesium (Mg2+) mg/L 0.2 0.59 <0.2 <0.2 <0.2Silica (disolved silicon) mg/L 0.1 89 61 2.9 3.2Sodium (Na+) mg/L 0.5 350 290 26 20Chloride (Cl−) mg/L 1.0 170 120 5.3 3.8
a Reportable Detection Limitb Detection limits raised due to dilution to bring analyte within the calibrated range
Total inorganic rejection for NF90 and BW30 is more than 90% which confirms our
previous results on TDS rejection. NF90 and BW30 removed almost all divalent ions
and iron in the feed. However, about 4% of silica passed through these membranes.
Sodium and chloride rejection by NF90 and BW30 were found to be about 93 and 97%,
respectively. NF90 and BW30 demonstrated almost the same performance in terms
of total inorganic rejection. UF membrane rejected ∼ 30%, 20% and 75% of silica,
sodium and calcium. This shows that the UF membrane was inefficient for rejection
of inorganic materials and cannot be applied for WLS inlet water treatment. The low
levels of inorganic, scale-forming species in the NF and RO permeate, would greatly
reduce the fouling propensity of the WLS inlet water if NF and RO were applied
as a polishing step in the conventional SAGD process train. According to the data
presented in Table 2.4, it can be concluded that NF90 is the most promising alternative
48

for removing inorganic material from WLS inlet water considering both membrane
performance and energy consumption.
2.3.6 Results of surface analyses
Fouled membranes were characterized by FESEM-EDX and ATR-FTIR to find the ele-
ments deposited on the membrane surface. Furthermore, analysis of fouled membranes
helps to find the fouling intensity at different pH values. Precipitation of more foulants
on the membrane surface at lower pH and re-dissolving of deposits by increasing the
pH can be simply observed by FESEM images.
2.3.6.1 Field emission scanning electron microscope- energy dispersive X-ray (FESEM-
EDX)
The morphology of deposited materials on the membrane surface has been qualita-
tively detected by FESEM analysis. Figure 2.7 shows the FESEM image of fouled
membranes with magnification of 5,000. As can be seen, more organic and inor-
ganic materials were deposited on the membranes which experienced lower pH val-
ues, e.g. UF membrane. In the case of NF90 and BW30, increasing pH back to 10,
re-dissolved foulants. For these membranes surface of membranes is not fully covered
by the foulants and morphology of the virgin membrane is noticeable. This confirms
the substantial effect of pH on flux recovery in salt rejecting NF and RO membranes.
NF270, ESNA and ESPA membranes are indicated to be fouled similarly. How-
ever, the morphologies of fouled materials are different in these membranes. It must
be noted that these 20× 20 µ m FESEM images are not representative of the whole
effective membrane surface area (140 cm2). For instance, NF270 membrane is mostly
covered by a black material which is assumed to be mainly pure organic matter. In the
case of ESNA and ESPA a mixture of organic and inorganic materials are deposited
on the membrane which is identifiable by the spongy structure of cake layer. Since
49

the same feed is filtered in all experiments and subsequently, the same materials are
deposited on all membranes, it was found that fouling layer was not homogenously
covered throughout the membrane surface. Hence, the morphology of deposited foul-
ing layer is different form one point to another point. However, FESEM images give a
pretty good idea about the intensity of fouling using different types of membranes.
The morphologies of the adsorbed materials on the membrane surface are more
noticeable in Figure 2.8 by higher magnification images. As can be seen, deposited
mass on the membrane are mainly in the form of particles which was detected by EDX
analysis to be silica particles. Crystal shapes on the membrane surface are found to
be iron and calcium crystals. Sponge shapes contain sulfur, organic matter and silica.
Silica in the sponge shapes confirms coprecipitation of silica and organic matter on
the membranes especially at lower pH values. The size of particles is about 100 nm.
This result demonstrates adsorption of organic matter on the surface of silica particles,
therefore enhanced diameter of these particles.
2.3.6.2 ATR-FTIR result
All samples were scanned from 500 to 4000 cm−1 wavelength and the FTIR peaks of
virgin and fouled membranes are shown in Figure 2.9. This figure shows that the peak
heights related to the fouled membrane are reduced after filtration. Membranes pre-
pared by Filmtec (NF270, NF90 and BW30) and GE (UF) clearly show different peaks
from Hydranautics ones (ESNA and ESPA). This shows that the type of PA thin film
in these membranes is different. All these membranes show ATR-FTIR spectra peaks
at range of 600 to 1500 cm−1 that indicate the presence of the polysulfone interlayer.
Peaks at 1650 and 1541 cm−1 indicate amide I and amide II for all membrane. All
Filmtec membranes are made from m-phenylene diamine, a primary amine. Though
WLS inlet filtration leads to a decrease in PA and polysulfone associated peak heights
no new peaks are detected. The absence of peaks representing organic foulants is most
50
likely due to the fact that the peaks associated with polysulfone and PA swamp any
small peaks that represent adsorbed organic species.
2.4 Conclusion
WLS inlet water from SAGD process was treated with cross-flow UF, NF and RO
processes. All experiments were conducted at constant feed temperature (50 ◦C) and
various pH values. It was found that more hydrophilic membranes with more negative
surface charge and less roughness were less prone to fouling regardless of their pore
size. RO and tight NF removed more than 86% of TDS and TOC. TOC rejection in-
creased significantly over time due to clogging of hot spots by DOM and silica. UF
was found out to be not suitable for SAGD produced water treatment due to its low
performance in rejecting silica and DOM. However, NF with loose membranes was
found to be a reasonable choice when very high purification of water is not necessary.
This membrane removed more than 70% of TDS and TOC. NF with tight NF mem-
branes (NF90 and ESNA) was found to be a promising method because of producing
high water quality comparable to RO and consuming less energy than RO. Flux, TOC
rejection and TDS rejection were found to be strongly affected by changing the pH.
Acidification of WLS inlet water during operation (pH change from 9-7), decreased the
flux suddenly and increased TDS rejection for tight NF and RO membranes. However,
TOC rejection decreased slightly by decreasing the feed pH. UF membrane showed
exactly opposite behavior due to the different fouling mechanism governing the trans-
port of salt and DOM in loose membranes. Increasing pH from 7.0 to 10.0 increased
water flux about 40% immediately which demonstrated the critical role of pH on foul-
ing reduction. Re-dissolving of fouling deposits by increasing pH was observed by
doing surface characterization of fouled membranes using FESEM-EDX. ATR-FTIR
and FESEM-EDX techniques provided valuable information about the constituents in
WLS inlet water, which were deposited on the membrane. EDX indicated presence of
51

silica, iron and calcium in fouling deposits. FEEMs showed that the major organics
that passed through the membrane were hydrophilic compounds.
This study shows the feasibility of performing membrane processes at a high pH
on WLS inlet water. The results can be interpreted to provide a possible process con-
figuration for SAGD PW treatment. NF processe can be seen as an alternative to the
current WLS-IX process configuration, completely replacing the conventional treat-
ment process, and providing reliable removal of TDS, silica, divalent ions and TOC
from the produced water.
52

Figure 2.1: Schematic view of cross flow filtration setup
53

Figure 2.2: Water flux decline during cross flow filtration of WLS inlet water byNF270, ESNA
54

Figure 2.3: TOC and TDS rejection during cross flow filtration of WLS inlet water byNF270, ESNA and ESPA membranes at constant pH=9
55
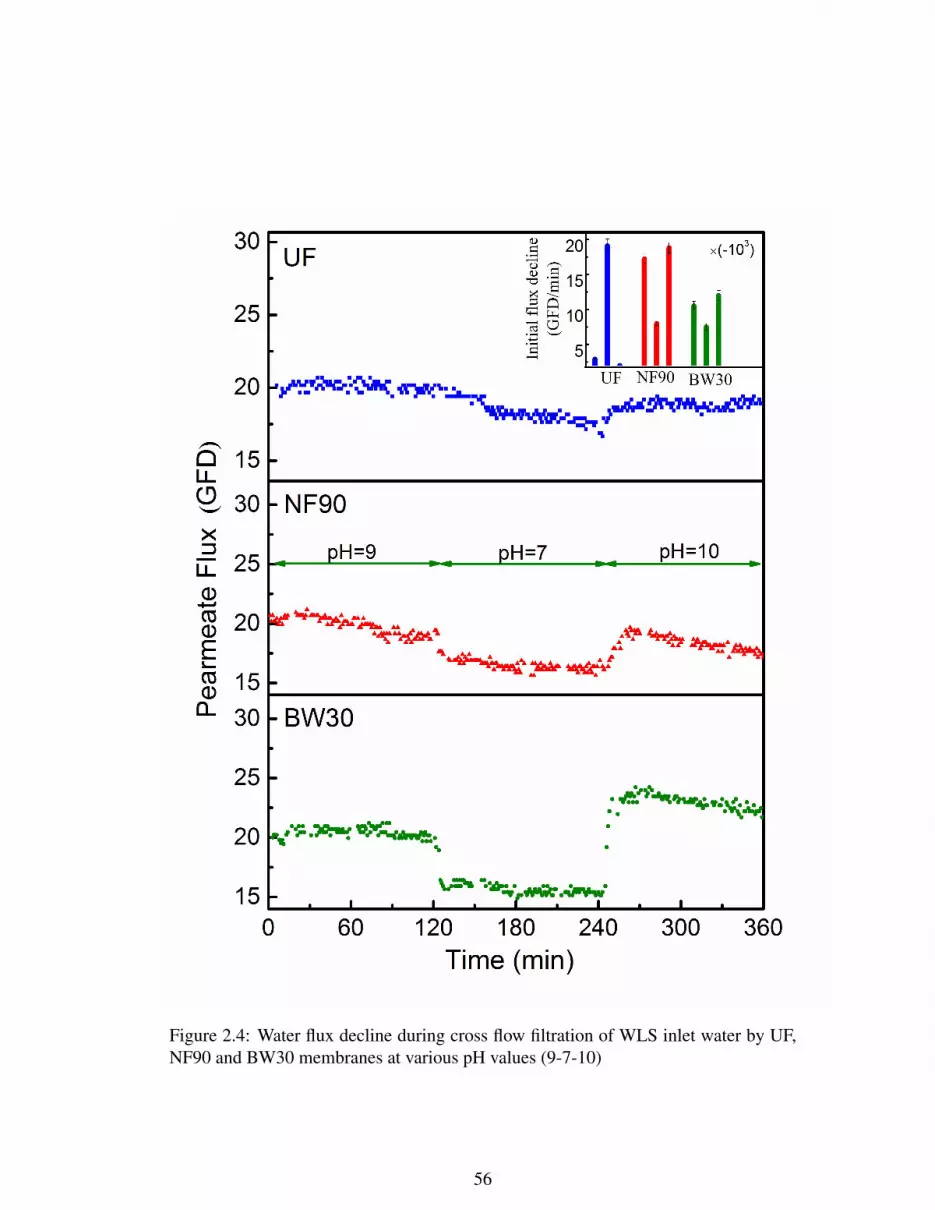
Figure 2.4: Water flux decline during cross flow filtration of WLS inlet water by UF,NF90 and BW30 membranes at various pH values (9-7-10)
56

Figure 2.5: TOC and TDS rejection during cross flow filtration of WLS inlet water byUF, NF90 and BW30 membranes at various pH values (9-7-10)
57

Figu
re2.
6:E
xcita
tion-
emis
sion
mat
rice
s(E
EM
s)of
WL
Sin
letw
ater
and
perm
eate
sat
pH=
9.E
xcita
tion
at5
nmin
terv
als
from
200
to50
0nm
and
emis
sion
data
colle
cted
atan
inte
rval
of10
nm.A
llpe
rmea
tesa
mpl
esan
dW
LS
inle
tfee
dw
ere
dilu
ted
usin
gD
Iwat
erto
aTO
Cle
velo
f15
5m
g/L
toav
oid
inne
rfiltr
atio
n(q
uenc
hing
)eff
ects
onflu
ores
cenc
ean
alys
is.D
ilutio
ntim
ew
as10
:1fo
rUF
perm
eate
,5:
1fo
rNF2
70pe
rmea
te,2
:1fo
rNF9
0,E
SNA
,ESP
A,B
W30
perm
eate
san
d20
:1fo
rWL
Sin
letw
ater
.The
colo
rsca
lere
pres
entin
gth
eflu
ores
cenc
ein
tens
ityis
loga
rith
mic
inal
lpar
tsof
thes
eim
ages
.
58
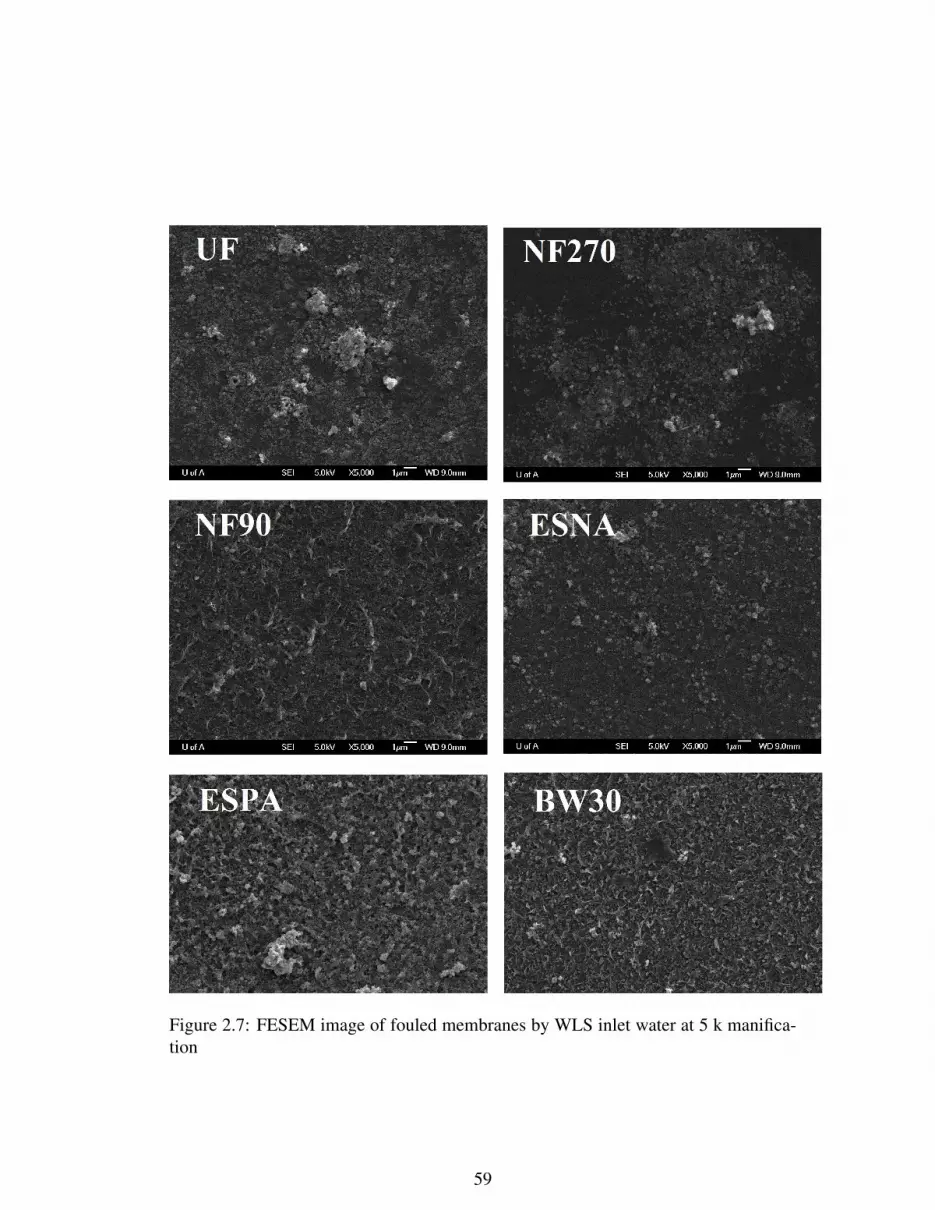
Figure 2.7: FESEM image of fouled membranes by WLS inlet water at 5 k manifica-tion
59
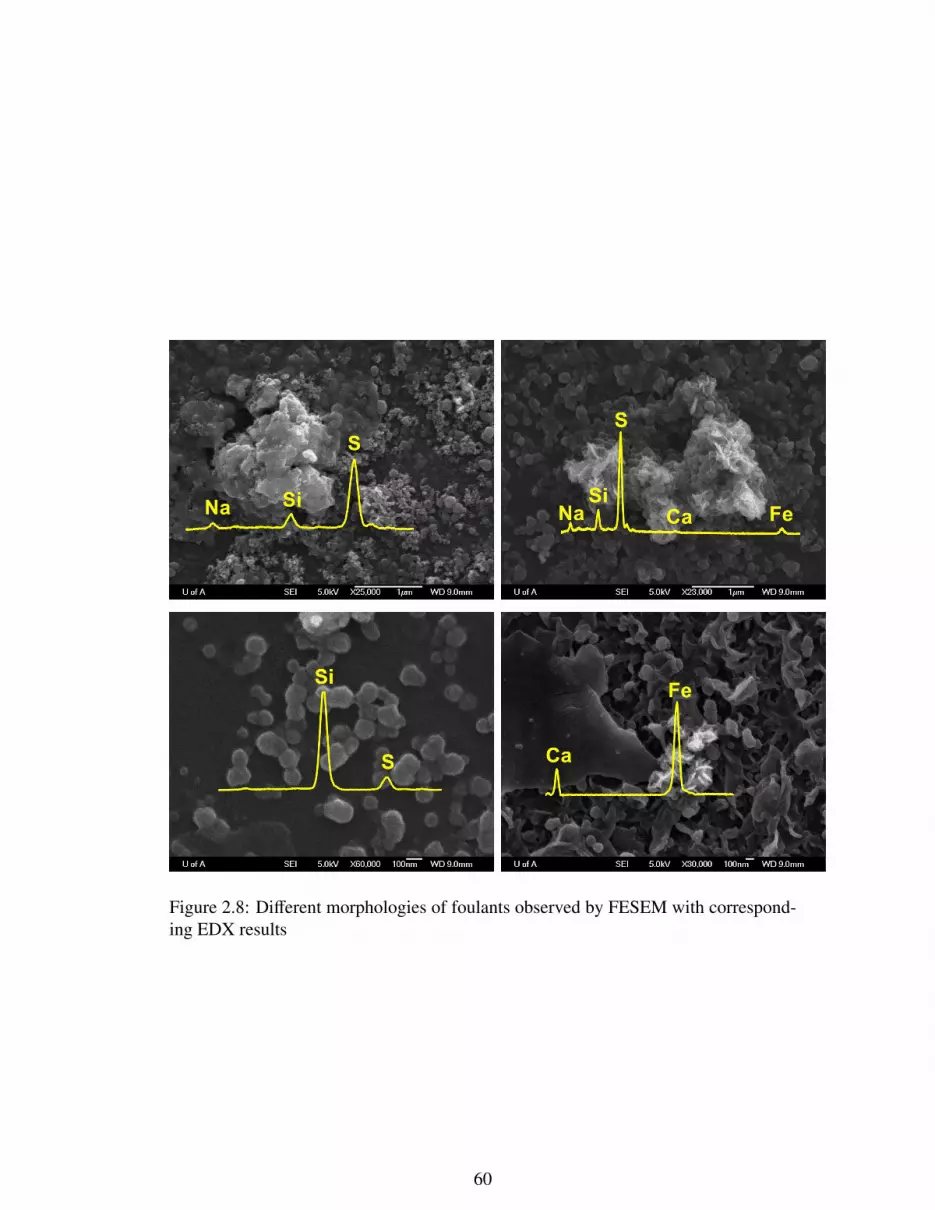
Figure 2.8: Different morphologies of foulants observed by FESEM with correspond-ing EDX results
60
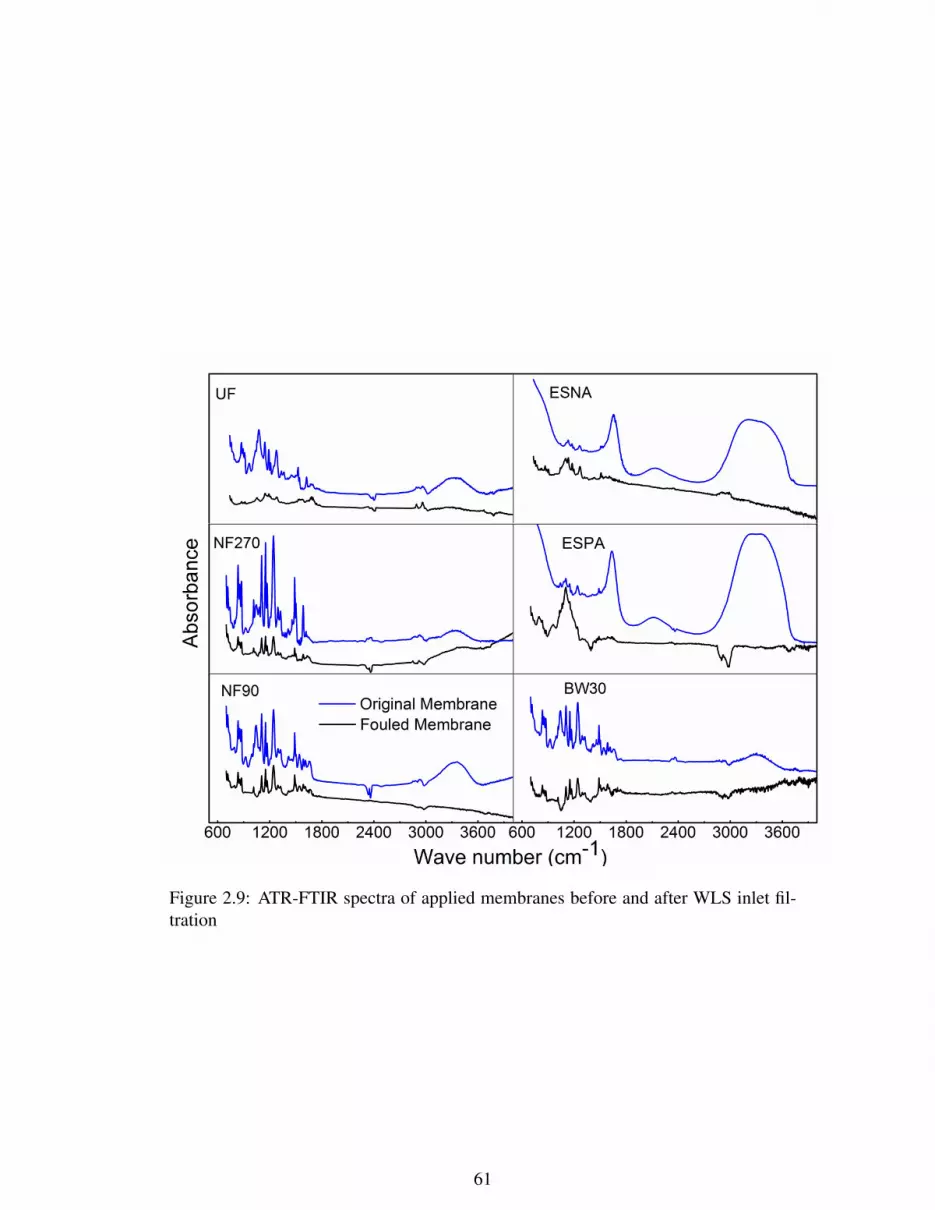
Figure 2.9: ATR-FTIR spectra of applied membranes before and after WLS inlet fil-tration
61
Chapter 3
Nanofiltration of oil sands boiler feed water: effect of
pH on water flux and organic and dissolved solid
rejection
3.1 INTRODUCTION
Thermally enhanced oil recovery methods such as SAGD and cyclic steam stimulation
(CSS) are widely practiced for bitumen extraction from oil sands in Alberta, Canada.
In this process, steam is injected underground, which condenses to heat up the bitumen,
thereby reducing its viscosity. The bitumen and condensed water are pumped out to
the surface where the bitumen and water are separated and the water is treated for reuse
as BFW.
A typical conventional SAGD water treatment plant is shown in Figure 3.1. In the
conventional diluted SAGD process, organic diluents are added to the produced fluids
to reduce the viscosity of bitumen. The diluted bitumen and the produced water are
first separated using a series of gravity and flotation vessels, namely, the free water
knock out (FWKO) vessel to remove the bitumen, followed by gravity skim tanks and
ISF to separate residual oil from the produced water, and walnut shell filters to bring
the free oil content in the produced water below 20 mg/L. The produced water is then
treated in a WLS to remove silica, following which, the suspended solids are removed
62

in after-filters, and the residual multivalent cations likes Ca2+ and Mg2+ are removed
using weak−acid cation exchanger (WAC). The treated water is then used as BFW in
OTSGs. A portion of the blowdown from the OTSGs is typically recycled to the WLS
or the BFW tank; the remainder is sent to disposal. It is important to note that the
entire water treatment process train operates at a water temperature of between 80 ◦C
and 90 ◦C, a challenging temperature for polymeric membranes.
No treatment is provided for TDS removal or for the removal of DOM in the con-
ventional process. OTSGs are therefore used in conventional SAGD applications as
they are able to operate with BFW containing higher levels of TDS and Ca/Mg/Si than
conventional drum boilers. To compensate for the use of lower quality BFW, steam
quality in SAGD OTSGs has historically been limited to 80% to provide sufficient wa-
ter volume to cool the inner surface of the tubes in the radiant section, and to prevent
super−saturation and formation of inorganic scales. OTSGs BFW specifications vary
somewhat between in situ operators, based on the manufacturers recommendations and
by specific operating experience in the field. Typical SAGD BFW specifications are
summarized in Table 3.1. It should be noted that an alternative process configuration
using evaporators for desalination in conjunction with drum boilers has been employed
in some SAGD installation [7].
Table 3.1: Typical SAGD OTSG BFW SpecificationsParameter Units SpecificationDissolved and/or Particulate Hardness mg/L as CaCO3 <0.5pH − − − 9.8−10.5Silica mg/L as SiO2 <75Free Oxygen µg/L as O2 <7Conductiviy mS <12Bitumen in Water (hexane extraction) mg/L <0.5Turbidity NTU <7.5Iron µg/L as Fe <250
Deviations from these BFW specifications have resulted in heat exchanger fouling
63

and boiler tube failures in the field [1,87,88], and significant research efforts are under-
way to understand the mechanisms of fouling. Analysis of deposits from failed tubes
has found high levels of organic carbon in addition to Ca/Mg/Si. It is not clear whether
the high levels of carbon are due to deposition and coking of free and emulsified oil, or
whether they are due to temperature−related precipitation of dissolved organic mate-
rial. In order to prevent tube failures, and to allow operation at higher steam qualities,
NF was investigated as a polishing technology to further reduce the concentrations of
Ca, Mg, and Si in the BFW, and to remove dissolved organic matter.
Membrane separation processes have been widely applied in produced water treat-
ment due to their distinct advantages over traditional processes, primarily lower oper-
ating expenses and energy consumption. Numerous previous investigators have con-
sidered the use of loose membranes, MF and UF, for oil removal from oily produced
water [51, 60–62, 182, 183]. For separation of silica, dissolved organic matter (DOM)
and salt from produced water, tighter NF and RO membranes are required. Although,
NF and RO are widely applied in water and wastewater treatment, there are a few
records in peer−reviewed literature for their application in desalination and organic
removal of oilfield produced water.
A brief overview of published efforts on oilfield produced water treatment using
NF and RO membranes is summarized in Table 3.2.
64
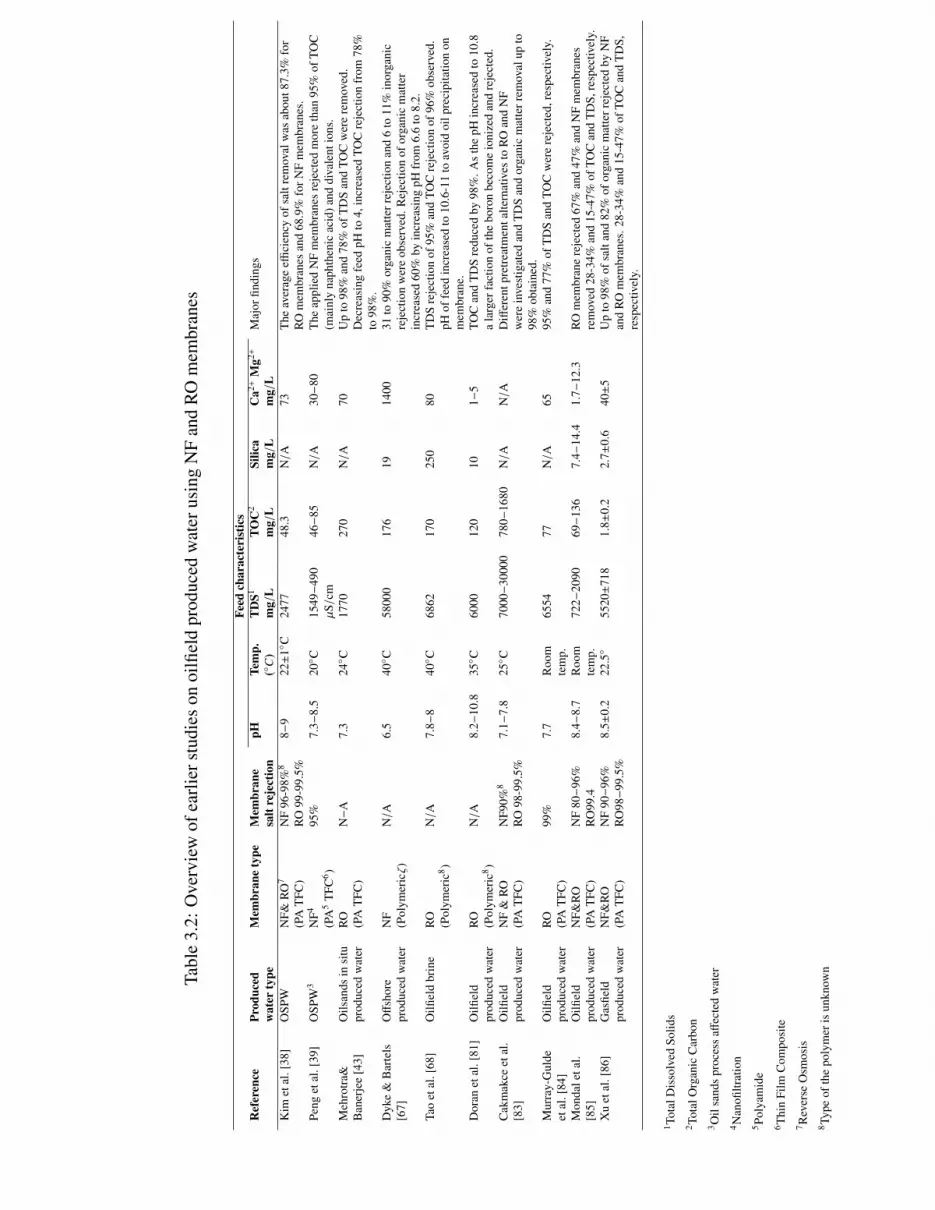
Tabl
e3.
2:O
verv
iew
ofea
rlie
rstu
dies
onoi
lfiel
dpr
oduc
edw
ater
usin
gN
Fan
dR
Om
embr
anes
Feed
char
acte
rist
ics
Ref
eren
cePr
oduc
edM
embr
ane
type
Mem
bran
epH
Tem
p.T
DS1
TOC
2Si
lica
Ca2+
Mg2+
Maj
orfin
ding
sw
ater
type
salt
reje
ctio
n(◦
C)
mg/
Lm
g/L
mg/
Lm
g/L
Kim
etal
.[38
]O
SPW
NF&
RO
7N
F96
-98%
88−
922±
1◦C
2477
48.3
N/A
73T
heav
erag
eeffi
cien
cyof
salt
rem
oval
was
abou
t87.
3%fo
r(P
AT
FC)
RO
99-9
9.5%
RO
mem
bran
esan
d68
.9%
forN
Fm
embr
anes
.Pe
nget
al.[
39]
OSP
W3
NF4
95%
7.3−
8.5
20◦C
1549−
490
46−
85N/A
30−
80T
heap
plie
dN
Fm
embr
anes
reje
cted
mor
eth
an95
%of
TOC
(PA
5T
FC6 )
µS/
cm(m
ainl
yna
phth
enic
acid
)and
diva
lent
ions
.M
ehro
tra&
Oils
ands
insi
tuR
ON−
A7.
324◦C
1770
270
N/A
70U
pto
98%
and
78%
ofT
DS
and
TOC
wer
ere
mov
ed.
Ban
erje
e[4
3]pr
oduc
edw
ater
(PA
TFC
)D
ecre
asin
gfe
edpH
to4,
incr
ease
dTO
Cre
ject
ion
from
78%
to98
%.
Dyk
e&
Bar
tels
Off
shor
eN
FN/A
6.5
40◦C
5800
017
619
1400
31to
90%
orga
nic
mat
terr
ejec
tion
and
6to
11%
inor
gani
c[6
7]pr
oduc
edw
ater
(Pol
ymer
icζ)
reje
ctio
nw
ere
obse
rved
.Rej
ectio
nof
orga
nic
mat
ter
incr
ease
d60
%by
incr
easi
ngpH
from
6.6
to8.
2.Ta
oet
al.[
68]
Oilfi
eld
brin
eR
ON/A
7.8−
840◦C
6862
170
250
80T
DS
reje
ctio
nof
95%
and
TOC
reje
ctio
nof
96%
obse
rved
.(P
olym
eric
8 )pH
offe
edin
crea
sed
to10
.6-1
1to
avoi
doi
lpre
cipi
tatio
non
mem
bran
e.D
oran
etal
.[81
]O
ilfiel
dR
ON/A
8.2−
10.8
35◦C
6000
120
101−
5TO
Can
dT
DS
redu
ced
by98
%.A
sth
epH
incr
ease
dto
10.8
prod
uced
wat
er(P
olym
eric
8 )a
larg
erfa
ctio
nof
the
boro
nbe
com
eio
nize
dan
dre
ject
ed.
Cak
mak
ceet
al.
Oilfi
eld
NF
&R
ON
F90%
87.
1−7.
825◦C
7000−
3000
078
0−16
80N/A
N/A
Diff
eren
tpre
trea
tmen
talte
rnat
ives
toR
Oan
dN
F[8
3]pr
oduc
edw
ater
(PA
TFC
)R
O98
-99.
5%w
ere
inve
stig
ated
and
TD
San
dor
gani
cm
atte
rrem
oval
upto
98%
obta
ined
.M
urra
y-G
ulde
Oilfi
eld
RO
99%
7.7
Roo
m65
5477
N/A
6595
%an
d77
%of
TD
San
dTO
Cw
ere
reje
cted
,res
pect
ivel
y.et
al.[
84]
prod
uced
wat
er(P
AT
FC)
tem
p.M
onda
leta
l.O
ilfiel
dN
F&R
ON
F80−
96%
8.4−
8.7
Roo
m72
2−20
9069−
136
7.4−
14.4
1.7−
12.3
RO
mem
bran
ere
ject
ed67
%an
d47
%an
dN
Fm
embr
anes
[85]
prod
uced
wat
er(P
AT
FC)
RO
99.4
tem
p.re
mov
ed28
-34%
and
15-4
7%of
TOC
and
TD
S,re
spec
tivel
y.X
uet
al.[
86]
Gas
field
NF&
RO
NF
90−
96%
8.5±
0.2
22.5◦
5520±
718
1.8±
0.2
2.7±
0.6
40±
5U
pto
98%
ofsa
ltan
d82
%of
orga
nic
mat
terr
ejec
ted
byN
Fpr
oduc
edw
ater
(PA
TFC
)R
O98−
99.5
%an
dR
Om
embr
anes
.28-
34%
and
15-4
7%of
TOC
and
TD
S,re
spec
tivel
y.
1 Tota
lDis
solv
edSo
lids
2 Tota
lOrg
anic
Car
bon
3 Oil
sand
spr
oces
saff
ecte
dw
ater
4 Nan
ofiltr
atio
n5 Po
lyam
ide
6 Thi
nFi
lmC
ompo
site
7 Rev
erse
Osm
osis
8 Type
ofth
epo
lym
eris
unkn
own

Although several studies have been published on the use of NF and RO for treat-
ment of OSPW associated with the surface mining and extraction of bitumen [38, 39],
no published studies were found on the use of NF membrane processes for SAGD
produced water treatment. Produced water from in situ oil sands operations is higher
in dissolved organic carbon than OSPW [38, 39, 43], and the nature of the dissolved
organics have been shown to be different [1], suggesting that organic fouling may be
more severe in SAGD applications.
Every DOM has specific physicochemical properties, such as charge and molecular
conformation, which controls the rate of fouling and subsequently performance of
membrane process [95]. Meanwhile, the interaction of DOM functional groups with
solution chemistry, e.g. monovalent and divalent concentrations, pH and presence of
silica, induces different effects on properties of DOM macromolecules and thus the
structure and hydraulic resistance of fouling layer [77, 92, 96, 97]. Many of earlier
studies indicated that the DOM in mining OSPW consists primarily of naphthenic
acid−like compounds [19, 23, 25, 71]. However, DOM in SAGD produced water was
demonstrated to be more representative of humic acids than naphthenic acids [1] which
is predicted to result in significant change in membrane performance.
The performance of membranes is proven to be significantly affected by the feed
pH through changing DOM surface charge [79, 80, 99–101]. Dyke and Bartels [67]
showed that, DOM rejection may increase or remain constant by increasing the pH,
depending on the type of utilized produced water. In some waters they observed DOM
reduction by decreasing the pH from their original value. However, Mehrotra and
Banerjee [43] showed that by decreasing the feed pH from 8 to 4, the permeate TOC
content decreased more than 90%. They attributed this to the precipitation of inorganic
carbonates and bicarbonates on the membranes surface at lower pH and subsequently
enhancing the permselective properties of membranes. Tao et al. [68] increased their
feed pH form 8.0 to 11 to prevent oil precipitation on the membrane surface by reach-
66

ing to beyond its solubility limit. Doran et al. [81] suggested an approach for increas-
ing the boron removal by increasing the pH of the RO feed water to ionize the boron.
These findings suggest that the effect of pH on membrane fouling (flux decline) and
rejection of organic and inorganic materials is entirely related to the characteristics of
treated water.
A closer look to Table 3.2 reveals interesting differences for TOC and TDS re-
jection values. In some studies NF and RO resulted in similar TOC and TDS re-
jections [68, 81, 83], while higher TOC rejection than TDS or vice versa, were also
observed [43, 67, 84–86]. This is attributed to different molecular weights and physic-
ochemical properties of organic matter as well as different types and concentrations of
monovalent and divalent ions in various produced waters.
In the present work, the performance of a commercial NF membrane for Ca/Mg/Si
polishing and DOM removal from a model SAGD BFW was tested. A tight NF mem-
brane was chosen in preference to a loose NF and a RO membrane as it offered sig-
nificantly higher removal of organic matter and salt than loose NF as well as less en-
ergy consumption than RO. Crossflow NF experiments were conducted using a model
BFW, prepared by diluting SAGD BBD water obtained from an operating conventional
SAGD plant in northern Alberta. Tests were performed at a temperature of 50 ◦C and
at pH values of 10.5 and 8.5. pH 10.5 corresponds to the typical BFW pH used in
operating plants. pH 8.5 was tested to investigate the effect of pH reduction on mem-
brane performance; pH reduction from 10.5 to 8.5 has been shown to increase UF
membrane fouling when treating SAGD blowdown streams [171]. Based on a para-
metric study, it is proposed here that a pH pulsation technique can be used to reduce
the membrane fouling and recover the water flux. A suitably designed crossflow NF
process is demonstrated be a superior alternative technique to current SAGD produced
water treatment methods, especially in terms of producing higher quality water by
consuming lower amount of chemicals and energy.
67

3.2 Materials and methods
3.2.1 Water sample and reagents
A model SAGD BFW was prepared by dilution of BBD water from a SAGD water
treatment plant located in the Athabasca oil sands region of Alberta, Canada. The
samples were collected hot, shipped in sealed containers, and kept in a nitrogen blan-
ket until they were opened for treatment [171]. BBD water was diluted five−fold to
acquire the properties of BFW (Table 3.3). Concentrations of dissolved silica and other
inorganics were measured by inductively coupled plasma−optical emission spectrom-
etry (ICP−OES). 1 M HCl and NaOH (Sigma Aldrich) were used to adjust the model
BFW pH.
Table 3.3: Properties of BBD water diluted to model BFWParameters BBD water Model BFWpH 12.0 10.5TOC (mg/L) 2450 500TDS (mg/L) 10500 1800Conductivity(mS/cm) 17.8 3.5Na+(mg/L) 4280 880Cl−(mg/L) 2700 510Mg2+(mg/L) 0.37 0.18Ca2+(mg/L) 3.30 0.66Iron, total FE( mg/L) 2.12 0.48SiO2, Disolved(mg/L) 92 21
3.2.2 Membrane
NF was performed with a FilmTec NF90 membrane, which is a thin film composite
membrane comprises three layers: (i) a polyester support web (ii) a microporous PSf
inter layer and (iii) an ultrathin aromatic PA active layer. The average roughness of
NF90 membrane is in the range of 60−70 nm [109, 184, 185] and its zeta potential
from streaming potential measurement is −18 mV within the pH range of 7 to 10 in
68
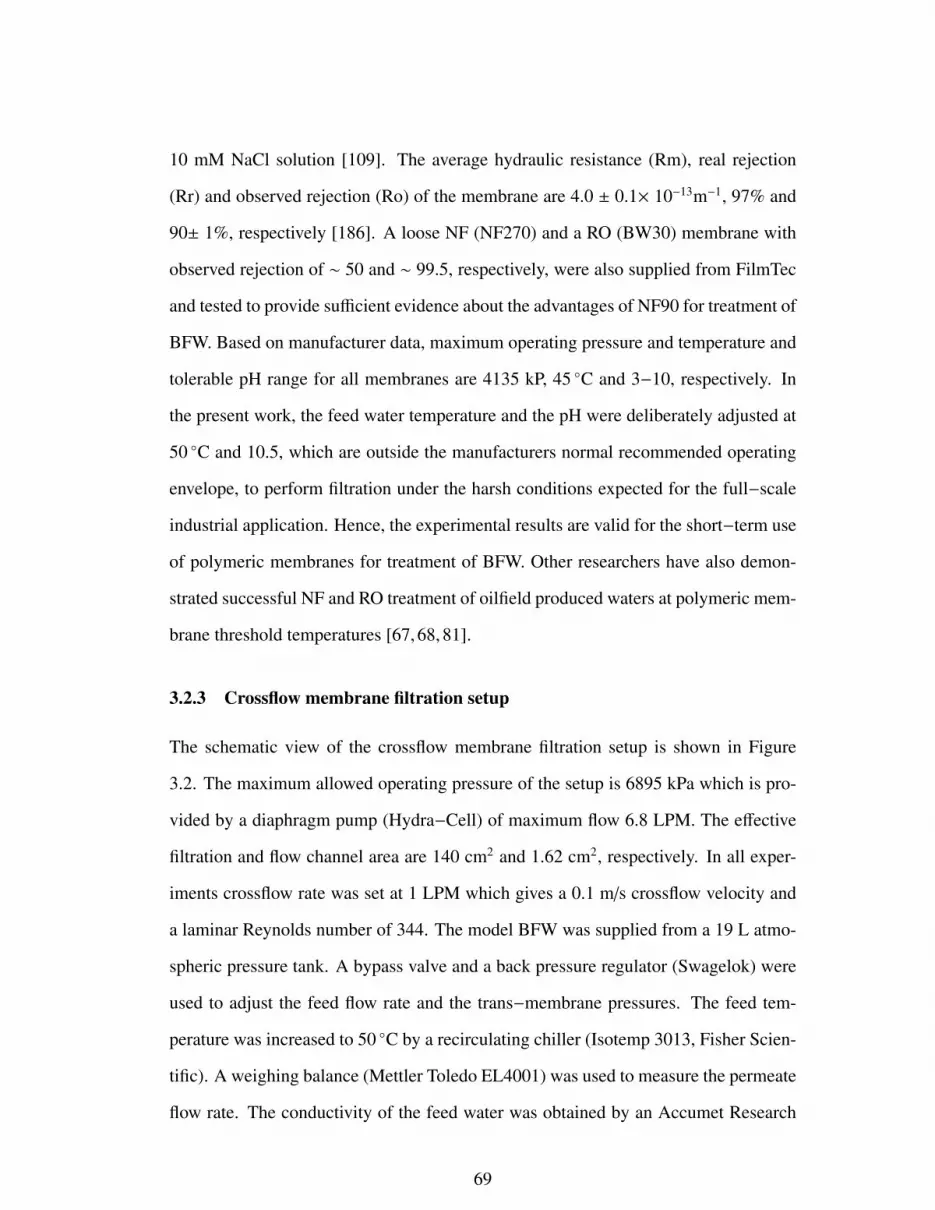
10 mM NaCl solution [109]. The average hydraulic resistance (Rm), real rejection
(Rr) and observed rejection (Ro) of the membrane are 4.0 ± 0.1× 10⁻¹³m−1, 97% and
90± 1%, respectively [186]. A loose NF (NF270) and a RO (BW30) membrane with
observed rejection of ∼ 50 and ∼ 99.5, respectively, were also supplied from FilmTec
and tested to provide sufficient evidence about the advantages of NF90 for treatment of
BFW. Based on manufacturer data, maximum operating pressure and temperature and
tolerable pH range for all membranes are 4135 kP, 45 ◦C and 3−10, respectively. In
the present work, the feed water temperature and the pH were deliberately adjusted at
50 ◦C and 10.5, which are outside the manufacturers normal recommended operating
envelope, to perform filtration under the harsh conditions expected for the full−scale
industrial application. Hence, the experimental results are valid for the short−term use
of polymeric membranes for treatment of BFW. Other researchers have also demon-
strated successful NF and RO treatment of oilfield produced waters at polymeric mem-
brane threshold temperatures [67, 68, 81].
3.2.3 Crossflow membrane filtration setup
The schematic view of the crossflow membrane filtration setup is shown in Figure
3.2. The maximum allowed operating pressure of the setup is 6895 kPa which is pro-
vided by a diaphragm pump (Hydra−Cell) of maximum flow 6.8 LPM. The effective
filtration and flow channel area are 140 cm2 and 1.62 cm2, respectively. In all exper-
iments crossflow rate was set at 1 LPM which gives a 0.1 m/s crossflow velocity and
a laminar Reynolds number of 344. The model BFW was supplied from a 19 L atmo-
spheric pressure tank. A bypass valve and a back pressure regulator (Swagelok) were
used to adjust the feed flow rate and the trans−membrane pressures. The feed tem-
perature was increased to 50 ◦C by a recirculating chiller (Isotemp 3013, Fisher Scien-
tific). A weighing balance (Mettler Toledo EL4001) was used to measure the permeate
flow rate. The conductivity of the feed water was obtained by an Accumet Research
69

(AR60) conductivity meter. The pH and conductivity of the permeate were measured
by a Mettler Toledo (SevenMulti S47) pH and conductivity meter. All measurements
were directly collected into a computer using LabVIEW (National Instruments) data
acquisition software [186].
3.2.4 Experimental methodology
Four experiments were conducted using NF90 membrane to find the effect of pH on
water flux, TOC and TDS rejection and deposition of organic and inorganic matter on
the membrane surface (Table 3.4).
Table 3.4: Variation of pH with time in conducted experimentsExperiment time(hr)1 2 3 4 5 6
Run1 10.5 10.5 10.5 10.5 10.5 10.52 8.5 8.5 8.5 8.5 8.5 8.53 8.5 8.5 8.5 8.5 10.5 10.54 10.5 10.5 8.5 8.5 10.5 10.5
Two extra experiments were also conducted similar to run 1 (Table 3.4) using NF270
loose NF and BW30 RO membranes to compare their performances with NF90. Dur-
ing each 6 hr experiment, temperature, feed flow rate and permeate flux were main-
tained at 50 ◦C, 1.6× 10⁻⁵ m3/s and 1.8× 10⁻⁵ /m2s, respectively. The trans-membrane
pressure was adjusted on 350, 550 and 825 kPa for NF270, NF90 and BW30, respec-
tively, to acquire constant initial permeate flux of 1.8× 10⁻⁵ m3/m2s. All membrane
samples were soaked in de−ionized water for 24 hr prior to use. Before each exper-
iment the membranes were compacted with de−ionized water at 1400 kPa until the
permeate flux stabilized.
70
3.2.5 Characterization techniques
3.2.5.1 Total organic carbon (TOC) analysis
TOC is the amount of carbon bound in organic compounds present in the water and is
used as an indicator of DOM in the present work. It was measured using a combustion−type
TOC analyzer (Shimadzu, model TOC−V; detection range 325,000 mg/L). Since or-
ganics in the SAGD produced water are mainly water soluble [1], the unfiltered model
BFW was analyzed by the TOC analyzer.
3.2.5.2 Inductively coupled plasma-optical emission spectroscopy (ICP-OES)
Emission spectroscopy using ICP is a rapid, sensitive and convenient method for the
determination of metal ions in aqueous solutions. The concentrations of dissolved
silica and other inorganics presented in Table 3.3 were measured by an ICP−OES in-
strument (Agilent 735 ICP−OES) using EPA method 200.7. In this method the water
sample is nebulized and the resulting aerosol is transported into inductively coupled ar-
gon plasma generated by radio frequency power. The high temperature (6000−10000
K) of the plasma leads to almost complete dissociation of molecules and efficient atom-
ization and ionization in the sample. Emission spectra are produced when the excited
atoms and ions return to lower energy states. The spectra are dispersed by a high reso-
lution echelle polychromator and the intensities of the lines are monitored by a CCD.
In OES, the power of the radiation emitted by a constituent after excitation is directly
proportional to its concentration.
3.2.5.3 Fluorescence excitation emission matrix spectroscopy (FEEMs)
Fluorescence excitation emission matrix (FEEM) spectroscopy has been shown in pre-
vious studies to be a useful tool for the classification of various dissolved organic
fractions in present in SAGD produced water [1]. A wavelength range of 200 to 500
71

nm with 5 and 10 nm intervals for excitation and emission wavelengths, respectively
was used in this research. The FEEM of de−ionized water was subtracted from the
FEEM of the samples to remove most of the Raman peaks. The model BFW samples
were diluted using DI water to a TOC level of around 12 mg/L to avoid inner ltration
(quenching) effects on the fluorescence analysis. The pH values of feed and permeate
were similar in all experiments which removes the pH induced effects on fluorescence
for comparing feed and permeate FEEM results. For membrane feed samples adjusted
to pH=8.5, the permeate pH was increased to 10.5 prior to FEEM analysis to find the
effect of pH on FEEM results.
3.2.5.4 Attenuated total reflectance-Fourier transform infrared (ATR-FTIR) spec-
troscopy
ATR−FTIR spectroscopy provides information on the type of functional groups present
to the depths less than 1 µ m. NF90 membranes before and after WLS inlet filtra-
tion were examined using ATR−FTIR microscope (Thermo Nicolet Nexus 670 FTIR,
USA). This instrument is equipped with a mercurycadmiumtellurium (MCT) detector
and has a resolution of 4cm-1. A total of 512 scans were averaged for each spectral
measurement. The internal reflection element was a zinc selenide (ZnSe) ATR plate
with an aperture angle of 45. All membrane samples were scanned over the range of
600 − 4000 cm-1.
3.2.5.5 Field emission scanning electron microscope- energy dispersive X-ray (FESEM-
EDX)
The membranes were sputter coated with a thin film of chromium. Surface images
of the membranes were obtained using JEOL 6301F FESEM. All membranes were
imaged at a magnification of 20,000 times. FESEM provides qualitative information
on the deposition of foulants on the membrane. Semi−quantitative elemental analysis
72

was done via a PGT IMIX EDX system with 135 eV resolution.
3.2.5.6 X-ray photoelectron spectroscopy (XPS)
XPS is a surface sensitive technique widely used for analyzing elemental composition
(except for H and He). Chemical binding information for the top 1−10 nm of the sur-
face can be provided by XPS. Original and used membranes analyzed using a Kratos
AXIS ULTRA spectrometer equipped with a monochromatic Al Ka X−ray source. In
the present work the source was run at a power of 210 W (14 mA, 15 kV) and a hybrid
lens with a spot size of 700 µm × 400 µm. Survey spectra were collected with a pass
energy of 160 eV, step size of 0.4 eV, and sweep time of 100 s in the range of 01100 eV.
High resolution spectra (collected with pass energy of 20 eV, step size of 0.1 eV, and
sweep time of 200 s) were measured in the appropriate binding energy (BE) ranges as
determined from the survey scan for the Na 1s, Ca 2p, Fe 2p, Si 2p, O 1s, N 1s, C 1s,
S 2p and Cl 2p core lines. The number of scans varied from 10 to 25 to obtain good
signal/noise ratios. High resolution spectra were analyzed with the aid of the CasaXPS
software.
3.3 Results and Discussion
When salt and DOM need to be removed from water, as in the present work, NF and
RO are applied. NF and RO are pressure−driven processes where the transmembrane
pressure must overcome the osmotic pressure of the feed water to force water through
a dense membrane. Generating this pressure requires certain amount of energy which
is directly related to the density of the membrane. Generally, for denser membranes
rejection will be increased but so will the required pressure and thus the energy de-
mand [187]. Hence, the type of the applied membrane for a specific application is
typically identified by a trade−off relationship between energy consumption and prod-
uct quality. Lower energy consumption is always favored and the product quality is
73
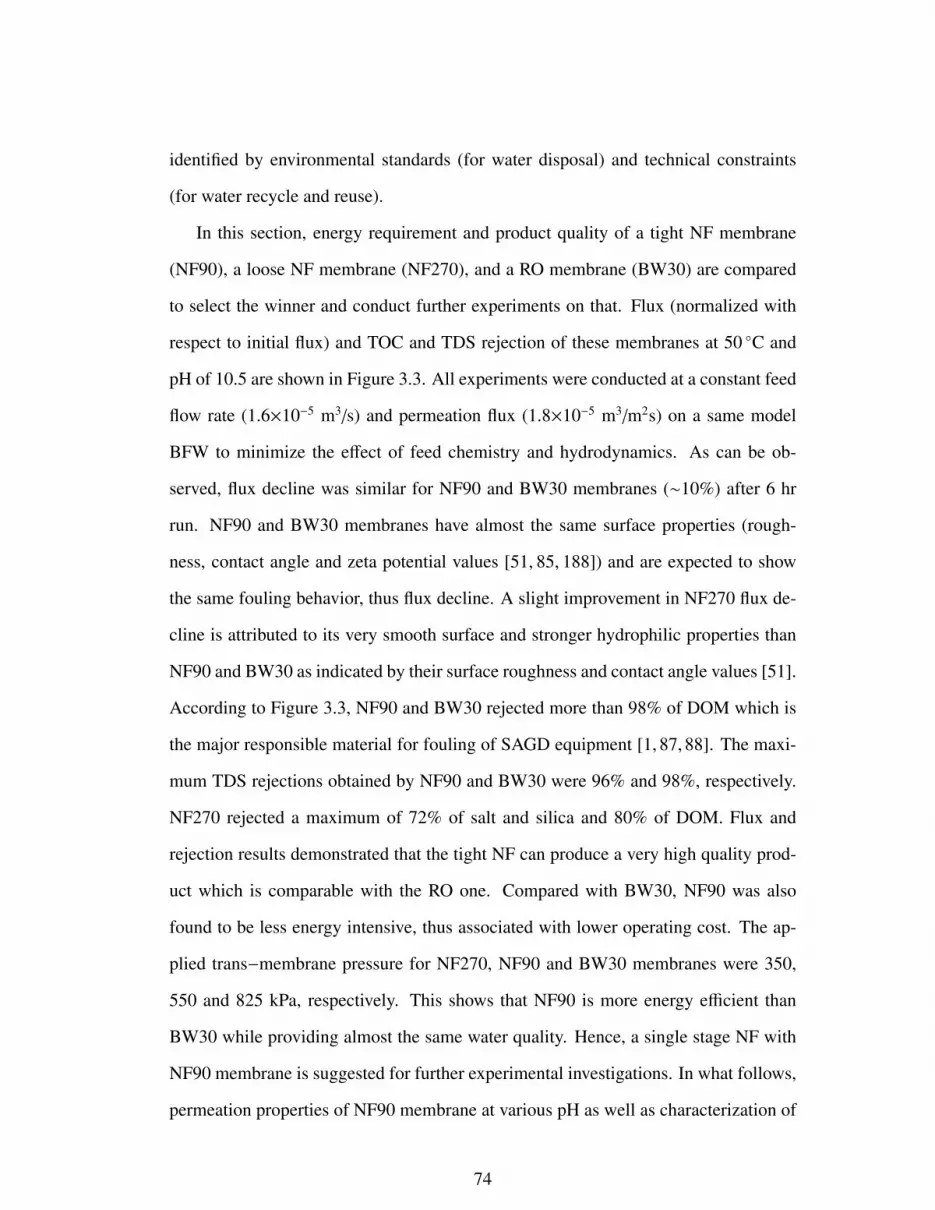
identified by environmental standards (for water disposal) and technical constraints
(for water recycle and reuse).
In this section, energy requirement and product quality of a tight NF membrane
(NF90), a loose NF membrane (NF270), and a RO membrane (BW30) are compared
to select the winner and conduct further experiments on that. Flux (normalized with
respect to initial flux) and TOC and TDS rejection of these membranes at 50 ◦C and
pH of 10.5 are shown in Figure 3.3. All experiments were conducted at a constant feed
flow rate (1.6×10⁻⁵ m3/s) and permeation flux (1.8×10⁻⁵ m3/m2s) on a same model
BFW to minimize the effect of feed chemistry and hydrodynamics. As can be ob-
served, flux decline was similar for NF90 and BW30 membranes (∼10%) after 6 hr
run. NF90 and BW30 membranes have almost the same surface properties (rough-
ness, contact angle and zeta potential values [51, 85, 188]) and are expected to show
the same fouling behavior, thus flux decline. A slight improvement in NF270 flux de-
cline is attributed to its very smooth surface and stronger hydrophilic properties than
NF90 and BW30 as indicated by their surface roughness and contact angle values [51].
According to Figure 3.3, NF90 and BW30 rejected more than 98% of DOM which is
the major responsible material for fouling of SAGD equipment [1, 87, 88]. The maxi-
mum TDS rejections obtained by NF90 and BW30 were 96% and 98%, respectively.
NF270 rejected a maximum of 72% of salt and silica and 80% of DOM. Flux and
rejection results demonstrated that the tight NF can produce a very high quality prod-
uct which is comparable with the RO one. Compared with BW30, NF90 was also
found to be less energy intensive, thus associated with lower operating cost. The ap-
plied trans−membrane pressure for NF270, NF90 and BW30 membranes were 350,
550 and 825 kPa, respectively. This shows that NF90 is more energy efficient than
BW30 while providing almost the same water quality. Hence, a single stage NF with
NF90 membrane is suggested for further experimental investigations. In what follows,
permeation properties of NF90 membrane at various pH as well as characterization of
74
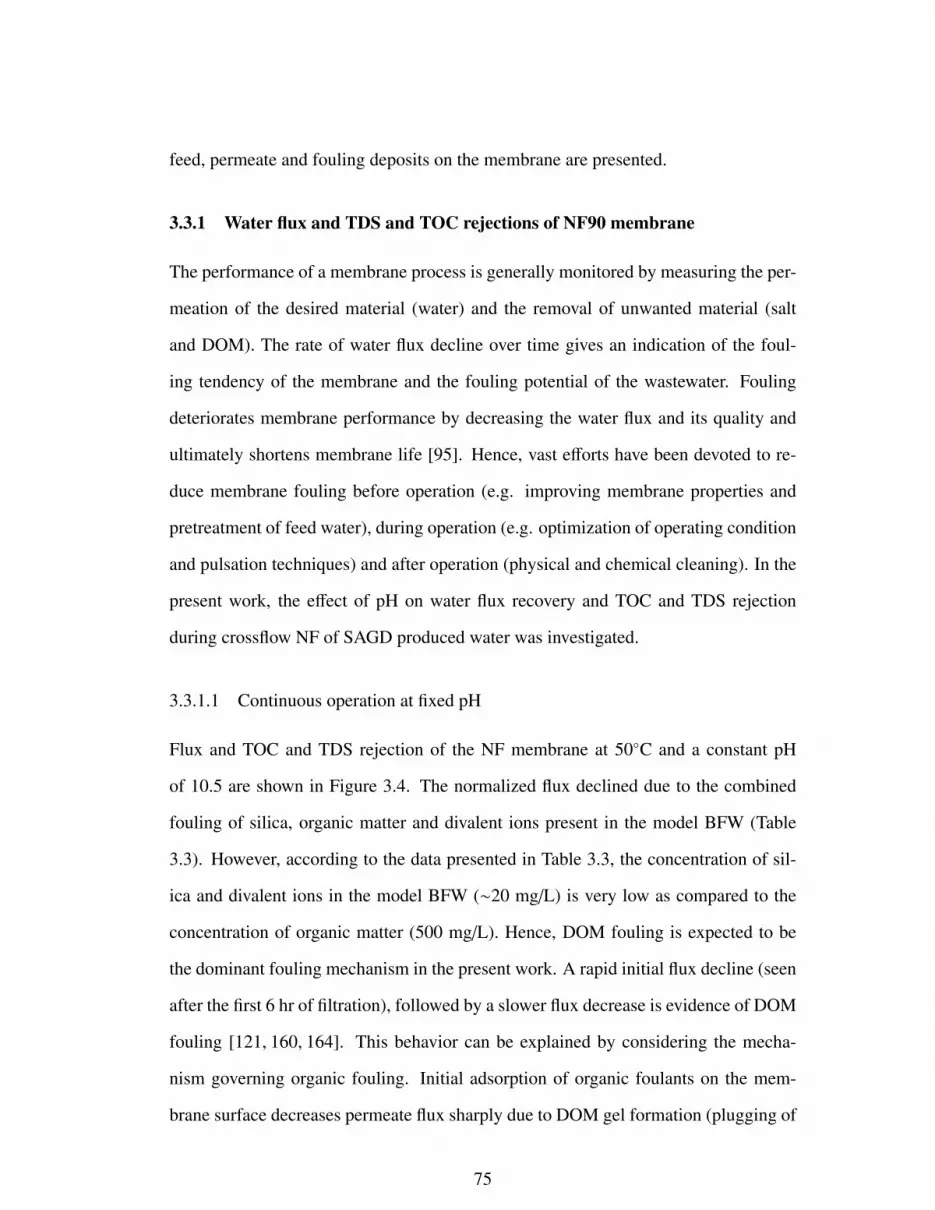
feed, permeate and fouling deposits on the membrane are presented.
3.3.1 Water flux and TDS and TOC rejections of NF90 membrane
The performance of a membrane process is generally monitored by measuring the per-
meation of the desired material (water) and the removal of unwanted material (salt
and DOM). The rate of water flux decline over time gives an indication of the foul-
ing tendency of the membrane and the fouling potential of the wastewater. Fouling
deteriorates membrane performance by decreasing the water flux and its quality and
ultimately shortens membrane life [95]. Hence, vast efforts have been devoted to re-
duce membrane fouling before operation (e.g. improving membrane properties and
pretreatment of feed water), during operation (e.g. optimization of operating condition
and pulsation techniques) and after operation (physical and chemical cleaning). In the
present work, the effect of pH on water flux recovery and TOC and TDS rejection
during crossflow NF of SAGD produced water was investigated.
3.3.1.1 Continuous operation at fixed pH
Flux and TOC and TDS rejection of the NF membrane at 50◦C and a constant pH
of 10.5 are shown in Figure 3.4. The normalized flux declined due to the combined
fouling of silica, organic matter and divalent ions present in the model BFW (Table
3.3). However, according to the data presented in Table 3.3, the concentration of sil-
ica and divalent ions in the model BFW (∼20 mg/L) is very low as compared to the
concentration of organic matter (500 mg/L). Hence, DOM fouling is expected to be
the dominant fouling mechanism in the present work. A rapid initial flux decline (seen
after the first 6 hr of filtration), followed by a slower flux decrease is evidence of DOM
fouling [121, 160, 164]. This behavior can be explained by considering the mecha-
nism governing organic fouling. Initial adsorption of organic foulants on the mem-
brane surface decreases permeate flux sharply due to DOM gel formation (plugging of
75

hot spots), pore blocking and constriction as well as induced hydrophobic properties.
Slower flux decline, in the next fouling stage, is attributed to the compaction and thick-
ening of the fouling layer, which induces an additional resistance as well as a reduction
of permeation drag as permeation flux decreases [161, 164, 165, 167].
A study by Nghiem and Hawkes [144] showed that a sharp flux decline due to
pore blocking and pore constriction would be more severe with membranes having
a larger pore size. For salt rejecting NF and RO membranes, plugging of hot spots
by organic matter has been found to be the key reason for the rapid initial flux decline
[121,147,155–157]. Hot spots are the valleys on the membrane surface with the lowest
thickness and highest water flux. Rapid clogging of valleys results in significant loss of
permeate flux [147]. The membrane used in the present study (NF90), with the average
roughness of 60−70 nm [109, 184, 185] and MWCO of 150−250 Da [103, 110], is
certainly susceptible to valley blocking by particles larger than 60 nm as well as pore
blocking by DOM with molecular weight less than 250 Da. As will be discussed later
in this paper, FESEM images found the presence of particles with 100 nm diameter
on the fouled membrane. Furthermore, our previous study showed that approximately
40% of the organic fraction in the BBD had molecular weight less than 500 Da [1]
which increases the possibility of pore blocking by DOM.
Increasing hydrophobicity of membrane generally leads to more vulnerability to
fouling due to hydrophobic interactions between the membrane surface and the hy-
drophobic foulants [121].The variation of the hydrophilic/hydrophobic properties of a
membrane during filtration depends on the hydrophilic/hydrophobic properties of both
the virgin (unfouled) membrane and the feed water constituents [114, 121]. Violleau
et al. [158] observed that their initially hydrophilic PA membrane became more hy-
drophobic after the sorption of organic foulants. Cho et al. [159] showed that organic
fouling decreased the hydrophobicity of hydrophobic membranes whereas increased
the hydrophobicity of hydrophilic membranes, regardless of type of organic foulants.
76
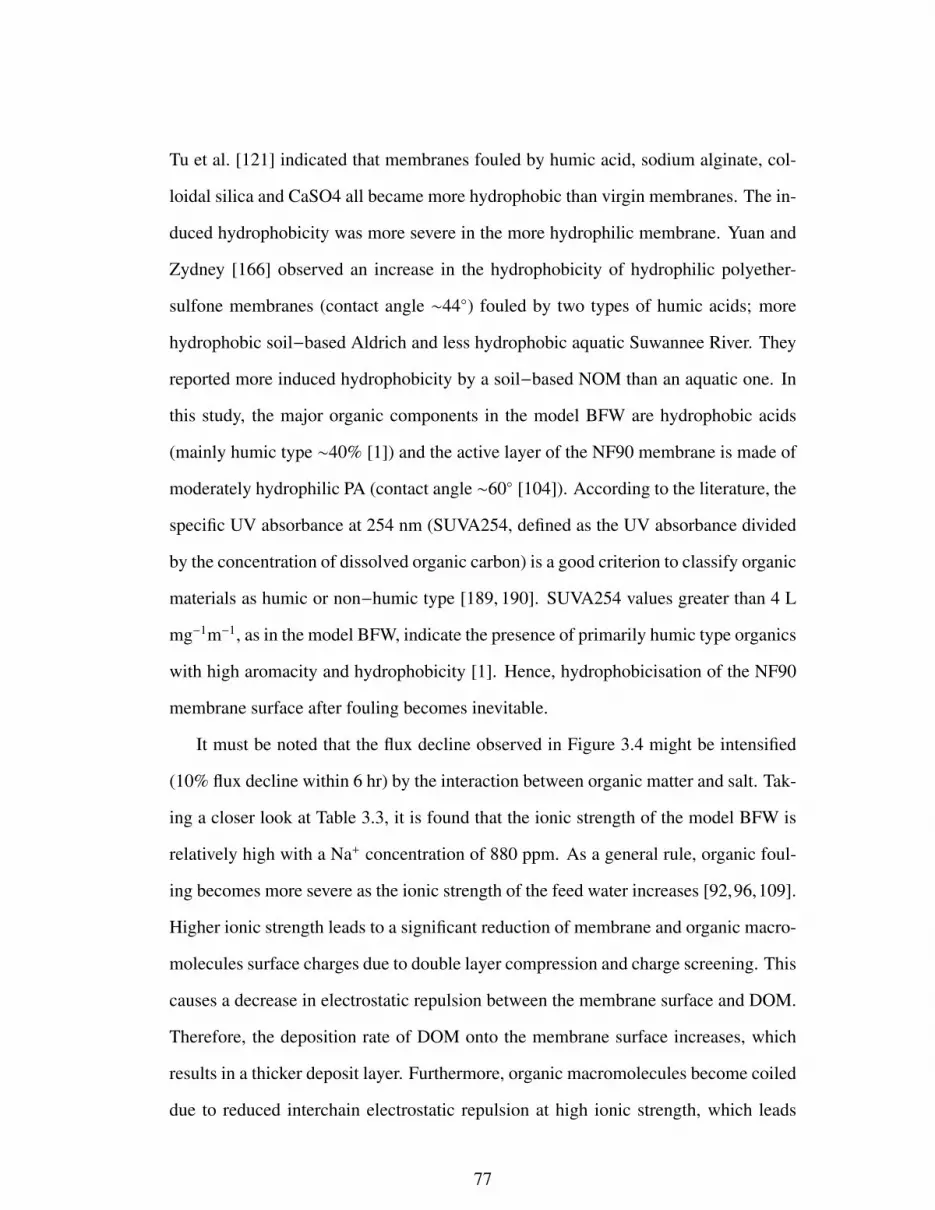
Tu et al. [121] indicated that membranes fouled by humic acid, sodium alginate, col-
loidal silica and CaSO4 all became more hydrophobic than virgin membranes. The in-
duced hydrophobicity was more severe in the more hydrophilic membrane. Yuan and
Zydney [166] observed an increase in the hydrophobicity of hydrophilic polyether-
sulfone membranes (contact angle ∼44◦) fouled by two types of humic acids; more
hydrophobic soil−based Aldrich and less hydrophobic aquatic Suwannee River. They
reported more induced hydrophobicity by a soil−based NOM than an aquatic one. In
this study, the major organic components in the model BFW are hydrophobic acids
(mainly humic type ∼40% [1]) and the active layer of the NF90 membrane is made of
moderately hydrophilic PA (contact angle ∼60◦ [104]). According to the literature, the
specific UV absorbance at 254 nm (SUVA254, defined as the UV absorbance divided
by the concentration of dissolved organic carbon) is a good criterion to classify organic
materials as humic or non−humic type [189, 190]. SUVA254 values greater than 4 L
mg−1m−1, as in the model BFW, indicate the presence of primarily humic type organics
with high aromacity and hydrophobicity [1]. Hence, hydrophobicisation of the NF90
membrane surface after fouling becomes inevitable.
It must be noted that the flux decline observed in Figure 3.4 might be intensified
(10% flux decline within 6 hr) by the interaction between organic matter and salt. Tak-
ing a closer look at Table 3.3, it is found that the ionic strength of the model BFW is
relatively high with a Na+ concentration of 880 ppm. As a general rule, organic foul-
ing becomes more severe as the ionic strength of the feed water increases [92,96,109].
Higher ionic strength leads to a significant reduction of membrane and organic macro-
molecules surface charges due to double layer compression and charge screening. This
causes a decrease in electrostatic repulsion between the membrane surface and DOM.
Therefore, the deposition rate of DOM onto the membrane surface increases, which
results in a thicker deposit layer. Furthermore, organic macromolecules become coiled
due to reduced interchain electrostatic repulsion at high ionic strength, which leads
77
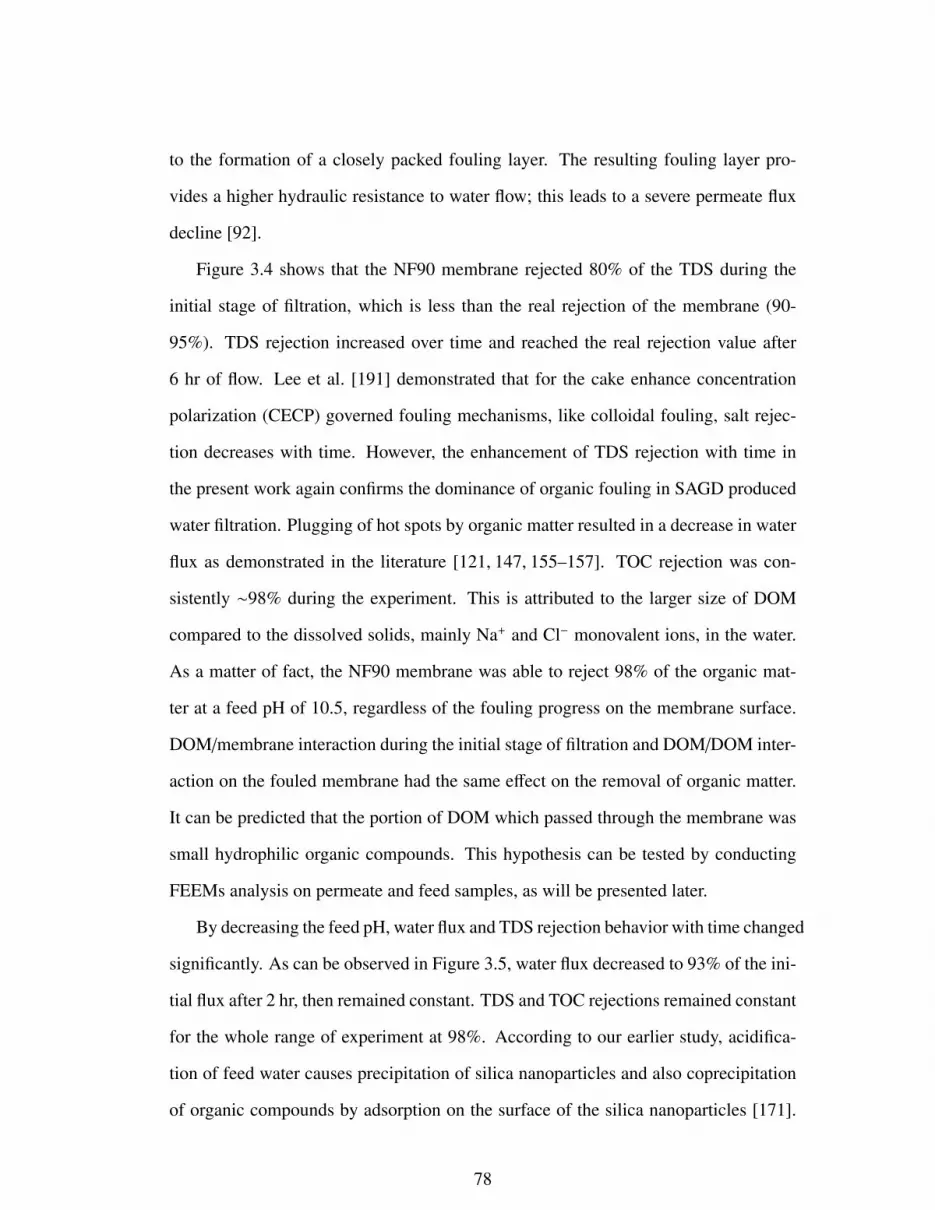
to the formation of a closely packed fouling layer. The resulting fouling layer pro-
vides a higher hydraulic resistance to water flow; this leads to a severe permeate flux
decline [92].
Figure 3.4 shows that the NF90 membrane rejected 80% of the TDS during the
initial stage of filtration, which is less than the real rejection of the membrane (90-
95%). TDS rejection increased over time and reached the real rejection value after
6 hr of flow. Lee et al. [191] demonstrated that for the cake enhance concentration
polarization (CECP) governed fouling mechanisms, like colloidal fouling, salt rejec-
tion decreases with time. However, the enhancement of TDS rejection with time in
the present work again confirms the dominance of organic fouling in SAGD produced
water filtration. Plugging of hot spots by organic matter resulted in a decrease in water
flux as demonstrated in the literature [121, 147, 155–157]. TOC rejection was con-
sistently ∼98% during the experiment. This is attributed to the larger size of DOM
compared to the dissolved solids, mainly Na+ and Cl− monovalent ions, in the water.
As a matter of fact, the NF90 membrane was able to reject 98% of the organic mat-
ter at a feed pH of 10.5, regardless of the fouling progress on the membrane surface.
DOM/membrane interaction during the initial stage of filtration and DOM/DOM inter-
action on the fouled membrane had the same effect on the removal of organic matter.
It can be predicted that the portion of DOM which passed through the membrane was
small hydrophilic organic compounds. This hypothesis can be tested by conducting
FEEMs analysis on permeate and feed samples, as will be presented later.
By decreasing the feed pH, water flux and TDS rejection behavior with time changed
significantly. As can be observed in Figure 3.5, water flux decreased to 93% of the ini-
tial flux after 2 hr, then remained constant. TDS and TOC rejections remained constant
for the whole range of experiment at 98%. According to our earlier study, acidifica-
tion of feed water causes precipitation of silica nanoparticles and also coprecipitation
of organic compounds by adsorption on the surface of the silica nanoparticles [171].
78
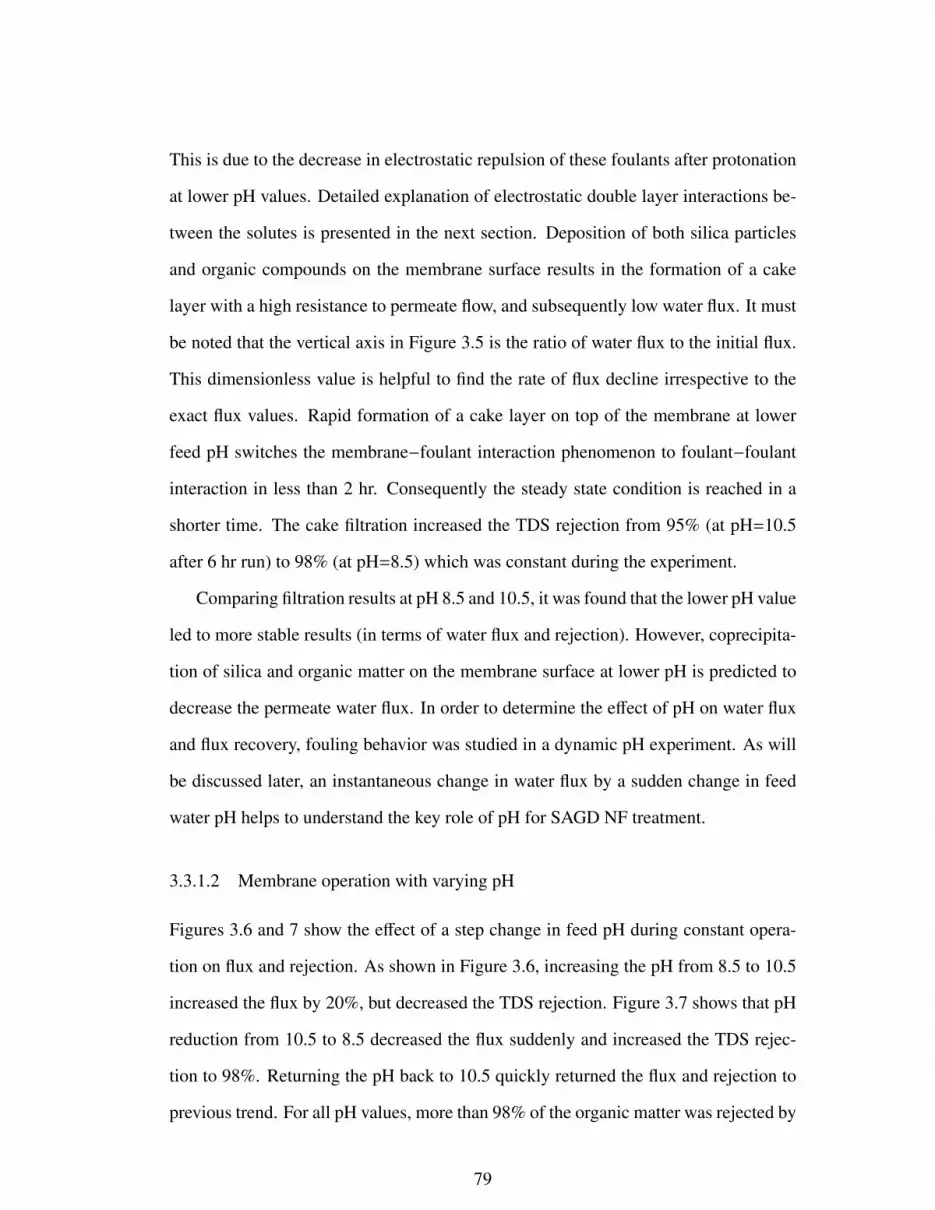
This is due to the decrease in electrostatic repulsion of these foulants after protonation
at lower pH values. Detailed explanation of electrostatic double layer interactions be-
tween the solutes is presented in the next section. Deposition of both silica particles
and organic compounds on the membrane surface results in the formation of a cake
layer with a high resistance to permeate flow, and subsequently low water flux. It must
be noted that the vertical axis in Figure 3.5 is the ratio of water flux to the initial flux.
This dimensionless value is helpful to find the rate of flux decline irrespective to the
exact flux values. Rapid formation of a cake layer on top of the membrane at lower
feed pH switches the membrane−foulant interaction phenomenon to foulant−foulant
interaction in less than 2 hr. Consequently the steady state condition is reached in a
shorter time. The cake filtration increased the TDS rejection from 95% (at pH=10.5
after 6 hr run) to 98% (at pH=8.5) which was constant during the experiment.
Comparing filtration results at pH 8.5 and 10.5, it was found that the lower pH value
led to more stable results (in terms of water flux and rejection). However, coprecipita-
tion of silica and organic matter on the membrane surface at lower pH is predicted to
decrease the permeate water flux. In order to determine the effect of pH on water flux
and flux recovery, fouling behavior was studied in a dynamic pH experiment. As will
be discussed later, an instantaneous change in water flux by a sudden change in feed
water pH helps to understand the key role of pH for SAGD NF treatment.
3.3.1.2 Membrane operation with varying pH
Figures 3.6 and 7 show the effect of a step change in feed pH during constant opera-
tion on flux and rejection. As shown in Figure 3.6, increasing the pH from 8.5 to 10.5
increased the flux by 20%, but decreased the TDS rejection. Figure 3.7 shows that pH
reduction from 10.5 to 8.5 decreased the flux suddenly and increased the TDS rejec-
tion to 98%. Returning the pH back to 10.5 quickly returned the flux and rejection to
previous trend. For all pH values, more than 98% of the organic matter was rejected by
79
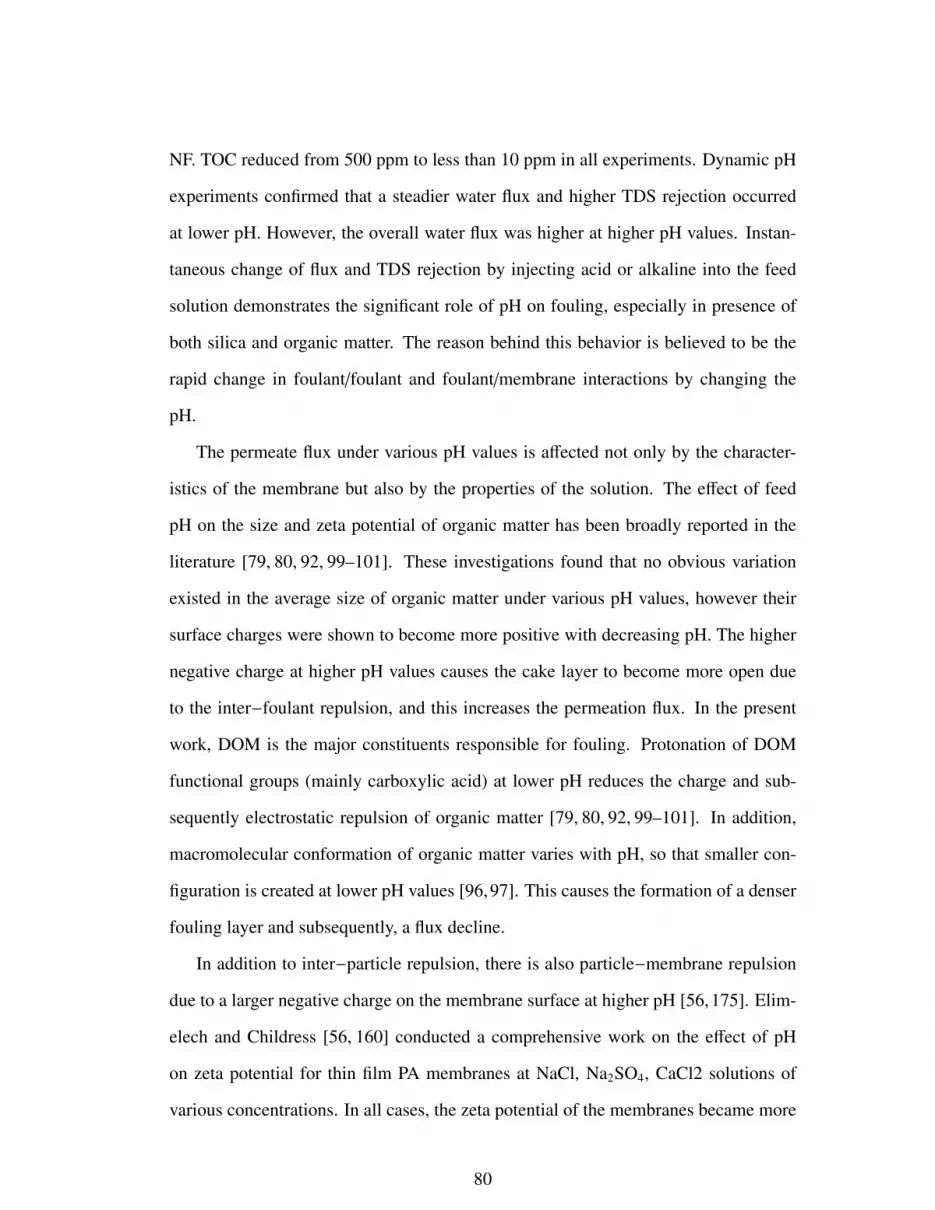
NF. TOC reduced from 500 ppm to less than 10 ppm in all experiments. Dynamic pH
experiments confirmed that a steadier water flux and higher TDS rejection occurred
at lower pH. However, the overall water flux was higher at higher pH values. Instan-
taneous change of flux and TDS rejection by injecting acid or alkaline into the feed
solution demonstrates the significant role of pH on fouling, especially in presence of
both silica and organic matter. The reason behind this behavior is believed to be the
rapid change in foulant/foulant and foulant/membrane interactions by changing the
pH.
The permeate flux under various pH values is affected not only by the character-
istics of the membrane but also by the properties of the solution. The effect of feed
pH on the size and zeta potential of organic matter has been broadly reported in the
literature [79, 80, 92, 99–101]. These investigations found that no obvious variation
existed in the average size of organic matter under various pH values, however their
surface charges were shown to become more positive with decreasing pH. The higher
negative charge at higher pH values causes the cake layer to become more open due
to the inter−foulant repulsion, and this increases the permeation flux. In the present
work, DOM is the major constituents responsible for fouling. Protonation of DOM
functional groups (mainly carboxylic acid) at lower pH reduces the charge and sub-
sequently electrostatic repulsion of organic matter [79, 80, 92, 99–101]. In addition,
macromolecular conformation of organic matter varies with pH, so that smaller con-
figuration is created at lower pH values [96,97]. This causes the formation of a denser
fouling layer and subsequently, a flux decline.
In addition to inter−particle repulsion, there is also particle−membrane repulsion
due to a larger negative charge on the membrane surface at higher pH [56,175]. Elim-
elech and Childress [56, 160] conducted a comprehensive work on the effect of pH
on zeta potential for thin film PA membranes at NaCl, Na2SO4, CaCl2 solutions of
various concentrations. In all cases, the zeta potential of the membranes became more
80
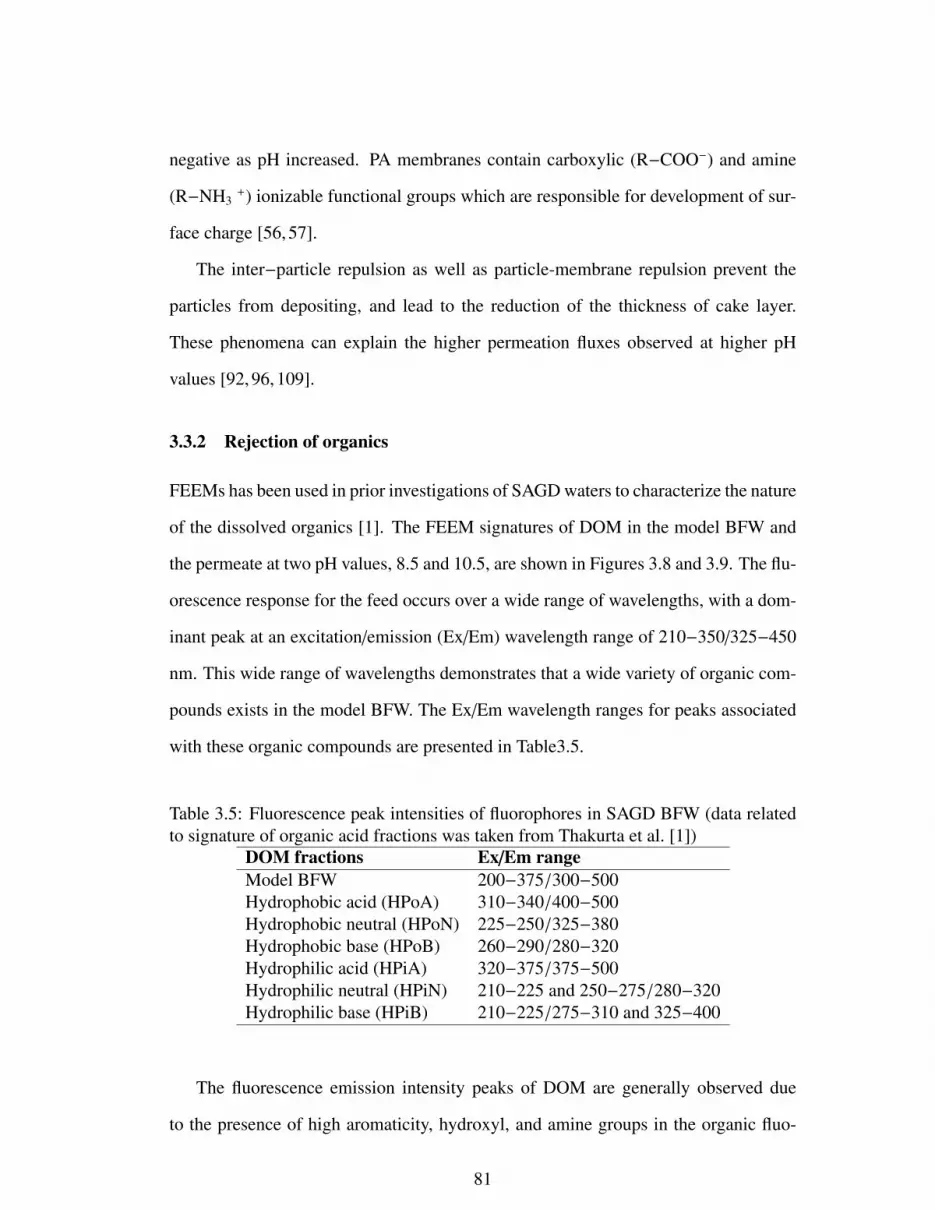
negative as pH increased. PA membranes contain carboxylic (R−COO−) and amine
(R−NH3+) ionizable functional groups which are responsible for development of sur-
face charge [56, 57].
The inter−particle repulsion as well as particle-membrane repulsion prevent the
particles from depositing, and lead to the reduction of the thickness of cake layer.
These phenomena can explain the higher permeation fluxes observed at higher pH
values [92, 96, 109].
3.3.2 Rejection of organics
FEEMs has been used in prior investigations of SAGD waters to characterize the nature
of the dissolved organics [1]. The FEEM signatures of DOM in the model BFW and
the permeate at two pH values, 8.5 and 10.5, are shown in Figures 3.8 and 3.9. The flu-
orescence response for the feed occurs over a wide range of wavelengths, with a dom-
inant peak at an excitation/emission (Ex/Em) wavelength range of 210−350/325−450
nm. This wide range of wavelengths demonstrates that a wide variety of organic com-
pounds exists in the model BFW. The Ex/Em wavelength ranges for peaks associated
with these organic compounds are presented in Table3.5.
Table 3.5: Fluorescence peak intensities of fluorophores in SAGD BFW (data relatedto signature of organic acid fractions was taken from Thakurta et al. [1])
DOM fractions Ex/Em rangeModel BFW 200−375/300−500Hydrophobic acid (HPoA) 310−340/400−500Hydrophobic neutral (HPoN) 225−250/325−380Hydrophobic base (HPoB) 260−290/280−320Hydrophilic acid (HPiA) 320−375/375−500Hydrophilic neutral (HPiN) 210−225 and 250−275/280−320Hydrophilic base (HPiB) 210−225/275−310 and 325−400
The fluorescence emission intensity peaks of DOM are generally observed due
to the presence of high aromaticity, hydroxyl, and amine groups in the organic fluo-
81

rophores. The fluorescence intensity of any fluorophore can also be reduced by the
interfering effects of other molecules present in a system containing a mixture of flu-
orophores. In the present work, in presence of high concentration of HPoA, HPiA,
HPiB and HPoN, the fluorescence intensity of HPiN and HPoB fractions are quenched
in the feed fluorescence EEM, especially at pH=10.5.
The FEEMs contour maps for the membrane permeates show that some signatures
have been totally removed after NF. As can be seen, the major organic compounds in
the permeate were hydrophilic compounds (HPiN, HPiA and HPiB). Lower molecular
weight hydrophilic DOM could easily pass through the membrane, especially at the
initial stage of filtration (see time 30 min in Figures 3.4 to 3.7 ). It is worth noting that
all the FEEMs were obtained for identical TOC of 9−12 mg/L. Hence, the fluorescence
intensity in the feed compared to the permeate was not a simple concentration effect.
It must be noted that the NF90 membrane rejected 98% of organic matter in the
model BFW; from 500 mg/L to around 10 mg/L. Since hydrophilic matter makes up
almost 45% of model BFW [1], more than 95% of these organic compounds were also
rejected and deposited on the membrane surface. This observation suggests that all
types of organic compounds in the model BFW were responsible for the fouling of the
NF membranes.
3.3.3 Rejection of inorganics
Rejection of inorganic materials from model BFW was measured by ICP−OES analy-
sis and the results are presented in Table 3.6.
Greater than 99% rejection was seen for divalent ions such as Fe2+, Ca2+ and Mg2+.
98% rejection was observed for the dissolved silica. These low levels of inorganic,
scale−forming species in the NF permeate, would greatly reduce the fouling propensity
of the BFW if NF was applied as a polishing step in the conventional SAGD process
82
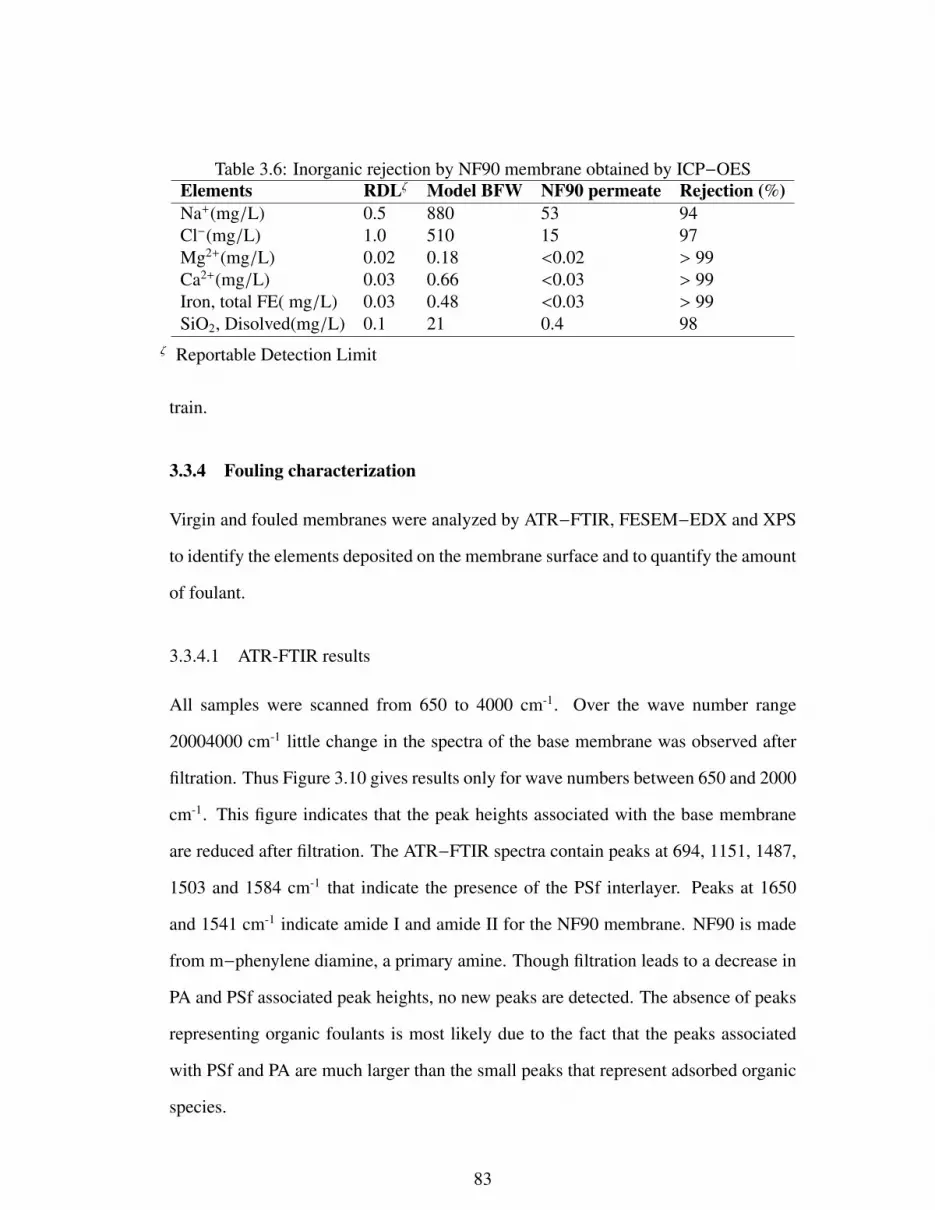
Table 3.6: Inorganic rejection by NF90 membrane obtained by ICP−OESElements RDLζ Model BFW NF90 permeate Rejection (%)Na+(mg/L) 0.5 880 53 94Cl−(mg/L) 1.0 510 15 97Mg2+(mg/L) 0.02 0.18 <0.02 > 99Ca2+(mg/L) 0.03 0.66 <0.03 > 99Iron, total FE( mg/L) 0.03 0.48 <0.03 > 99SiO2, Disolved(mg/L) 0.1 21 0.4 98
ζ Reportable Detection Limit
train.
3.3.4 Fouling characterization
Virgin and fouled membranes were analyzed by ATR−FTIR, FESEM−EDX and XPS
to identify the elements deposited on the membrane surface and to quantify the amount
of foulant.
3.3.4.1 ATR-FTIR results
All samples were scanned from 650 to 4000 cm-1. Over the wave number range
20004000 cm-1 little change in the spectra of the base membrane was observed after
filtration. Thus Figure 3.10 gives results only for wave numbers between 650 and 2000
cm-1. This figure indicates that the peak heights associated with the base membrane
are reduced after filtration. The ATR−FTIR spectra contain peaks at 694, 1151, 1487,
1503 and 1584 cm-1 that indicate the presence of the PSf interlayer. Peaks at 1650
and 1541 cm-1 indicate amide I and amide II for the NF90 membrane. NF90 is made
from m−phenylene diamine, a primary amine. Though filtration leads to a decrease in
PA and PSf associated peak heights, no new peaks are detected. The absence of peaks
representing organic foulants is most likely due to the fact that the peaks associated
with PSf and PA are much larger than the small peaks that represent adsorbed organic
species.
83
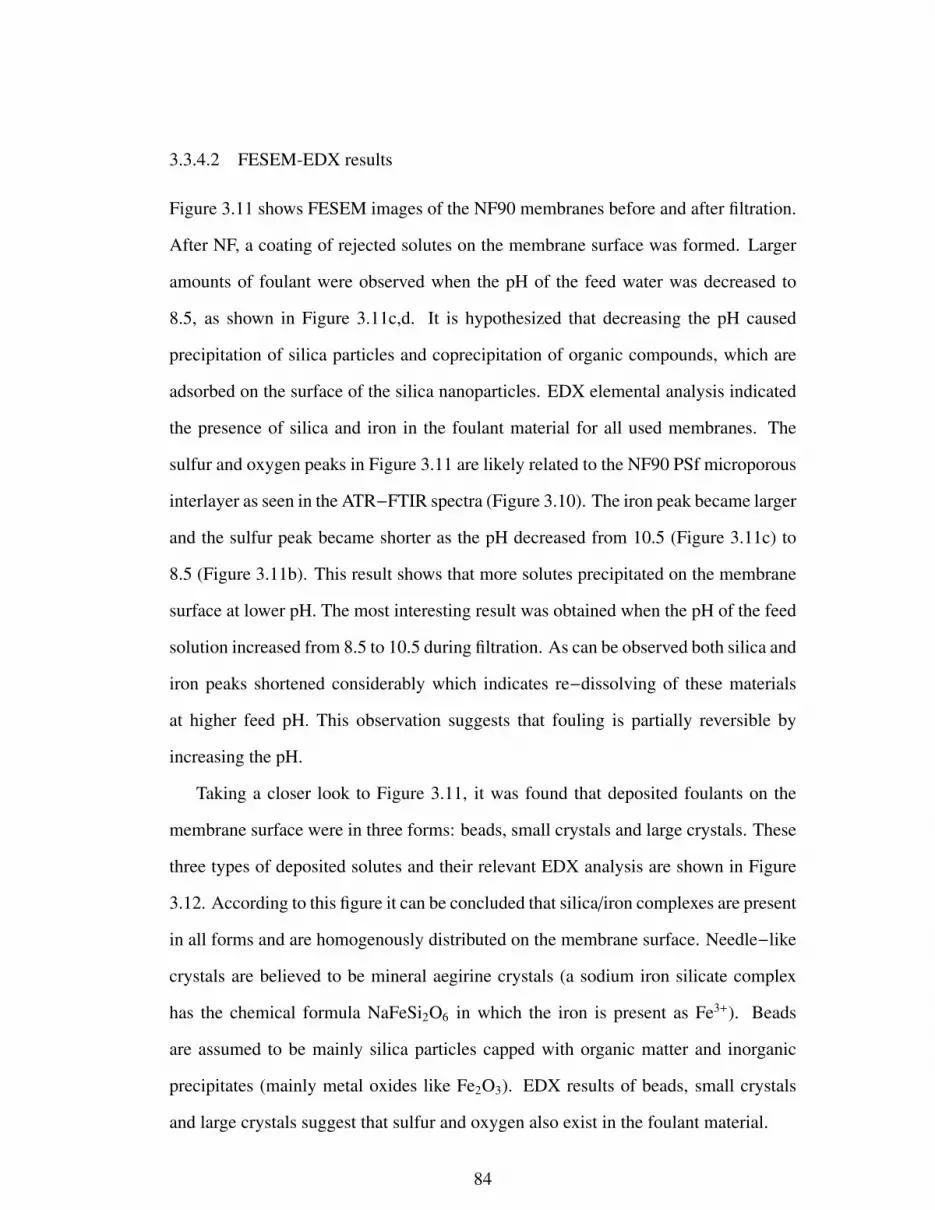
3.3.4.2 FESEM-EDX results
Figure 3.11 shows FESEM images of the NF90 membranes before and after filtration.
After NF, a coating of rejected solutes on the membrane surface was formed. Larger
amounts of foulant were observed when the pH of the feed water was decreased to
8.5, as shown in Figure 3.11c,d. It is hypothesized that decreasing the pH caused
precipitation of silica particles and coprecipitation of organic compounds, which are
adsorbed on the surface of the silica nanoparticles. EDX elemental analysis indicated
the presence of silica and iron in the foulant material for all used membranes. The
sulfur and oxygen peaks in Figure 3.11 are likely related to the NF90 PSf microporous
interlayer as seen in the ATR−FTIR spectra (Figure 3.10). The iron peak became larger
and the sulfur peak became shorter as the pH decreased from 10.5 (Figure 3.11c) to
8.5 (Figure 3.11b). This result shows that more solutes precipitated on the membrane
surface at lower pH. The most interesting result was obtained when the pH of the feed
solution increased from 8.5 to 10.5 during filtration. As can be observed both silica and
iron peaks shortened considerably which indicates re−dissolving of these materials
at higher feed pH. This observation suggests that fouling is partially reversible by
increasing the pH.
Taking a closer look to Figure 3.11, it was found that deposited foulants on the
membrane surface were in three forms: beads, small crystals and large crystals. These
three types of deposited solutes and their relevant EDX analysis are shown in Figure
3.12. According to this figure it can be concluded that silica/iron complexes are present
in all forms and are homogenously distributed on the membrane surface. Needle−like
crystals are believed to be mineral aegirine crystals (a sodium iron silicate complex
has the chemical formula NaFeSi2O6 in which the iron is present as Fe3+). Beads
are assumed to be mainly silica particles capped with organic matter and inorganic
precipitates (mainly metal oxides like Fe2O3). EDX results of beads, small crystals
and large crystals suggest that sulfur and oxygen also exist in the foulant material.
84
3.3.4.3 XPS results
XPS spectra for original and used membranes are shown in Figure 3.13. The original
membrane shows peaks corresponding to elements present in the PA thin film: C 1s,
N 1s and O 1s. Filtration of model BFW led to a change in the peak heights for C,
N and O. The C and O peaks increased in height while the peak for N decreased.
Inorganic deposition (Fe, Si, Ca) was also observed on the used membranes. Further
peaks corresponding to Na and O appeared as NaKLL and OKLL, representing Auger
emission.
Table 3.7 gives elemental compositions for the original and used membranes. The
NF90 membrane is a fully aromatic PA composite membrane [192].
Table 3.7: XPS surface elemental analysis (atomic%)
Membrane C O N C:O:N ratio S Na Ca Fe Si ClOriginal 74.25 12.97 11.78 6.30:1.10:1.00 0.36 0.29 0.00 0.00 0.00 0.35membraneNF at 70.09 20.36 2.83 24.76:7.19:1.00 1.22 2.13 0.53 1.18 1.96 0.10pH=8.5NF at 68.27 18.57 7.76 8.79:2.39:1.00 0.30 1.97 0.49 0.80 1.62 0.22pH= 10.5NF at 65.09 23.20 4.26 15.27:5.44:1.00 0.88 1.26 0.51 1.70 1.87 0.13pH= 8.5-10.5
The theoretical O/N ratio is expected to be 1.0 when the PA layer is fully cross−linked.
Table 3.7 indicates that the applied NF90 membrane in this study has an O/N ratio of
1.1 which is similar to that of a pure PA. A slight excess of oxygen with respect to
the corresponding theoretical ratio for PA indicates a low content of impurities on the
surface of this membrane. The surface of the NF90 membrane contains S, Na and
Cl (<0.5%) in addition to the elements characteristic of the PA. This indicates that
solvents and washing agents were not completely eliminated during the process of
manufacturing the membrane [193].
85
Filtration led to a change in the C:O:N ratio. The amount of C increased signif-
icantly, indicating adsorption of organic foulants. Table 3.7 indicates that the great-
est increases in the ratios of C/N and O/N occurred for filtration at pH=8.5. Higher
amounts of inorganic matter were deposited on the membrane surface at pH=8.5.
High resolution XPS spectra give more information about the organic and inorganic
components and bonds on the membrane surface. Based on Figure 3.14, it can be
concluded that:
1. Na on the original membrane is NaCl remained after washing by manufacturer.
However Na added after filtration is possibly related to either remnants of the feed
water that have evaporated and left NaCl behind or Na2O precipitates.
2. Ca, Fe and Si on the membrane surface correspond to oxides of these elements.
3. The position of the BE for SiO2 is 101 eV. This BE is around 103 eV for pure
SiO2. The BE obtained in the present work could be related to a sodium iron silicate
complex, e.g. NaFeSi2O−6 called mineral aegirine.
4. Sulfate on the original membrane is related to sulfuric acid which is usually
used for post−treatment of membranes. Kulkarni et al. [194] indicated that sulfuric
acid may be used to hydrophilize PA thin film composite membranes. By carefully
controlling the hydrophilization conditions, the permeate flux may be increased and
fouling decreased without loss in the rejection behavior of the membrane. Used mem-
branes showed sulfide spectra instead of sulfate which may correspond to metal and
salt sulfides like FeS and Na2S.
The multi−region spectra of C 1s, O 1s, and N 1s for both membranes are shown
in Figure 3.15. According to this figure, all spectra related to membrane chemical
bonds were weakened. Aromatic/aliphatic bonds in the used membrane increased as
compared to the original membrane (Figure 3.15 a, d). This may show the high aro-
macity of the organics in the model BFW. Carboxylic bonds also intensified in used
membranes (Figure 3.15 b, e). A small peak related to Si−OH was observed in O
86

1s spectrum. Figures 3.15 c and f show the presence of amino acids in the deposited
matter on the membrane surface.
3.4 Conclusion
Model SAGD BFW was treated with a crossflow NF process. First, a tight NF mem-
brane was selected in preference to a loose NF and a RO membrane based on its su-
perior rejection properties and energy efficiency. Then, experiments were conducted
on this membrane at constant feed temperature (50 ◦C) and two pH values (10.5 and
8.5). The NF membrane rejected up to 98% of salt, DOM and silica, and >99% of
divalent ions. TOC rejection was ∼98% regardless of the pH. At higher pH (10.5),
the initial TDS rejection was about 80% and increased up to 96% after a 6 hr run.
However, at lower pH (8.5), TDS rejection was steady at 98% during the entire ex-
periment. The higher TDS rejection at pH 8.5 was attributed to the formation of a
cake−layer formed from the co−precipitation of silica and organic matter on the mem-
brane. A step−change in pH from 8.5 to 10.5 increased the water flux by almost 20%
immediately. Surface characterization of the fouled membranes using ATR−FTIR,
FESEM−EDX and XPS analyses provided valuable information about the constituents
in the model BFW, which were deposited on the membrane. EDX indicated the pres-
ence of silica and iron in fouling deposits. XPS showed the presence of inorgan-
ics (mainly metal oxides) and organics (having carboxylic and amino acid functional
groups) on the membrane surface. FEEMs showed that hydrophilic compounds made
up the major fraction of the organics that passed through the membrane. This study
shows the feasibility of performing NF at a high pH as a polishing step in the con-
ventional SAGD water treatment process train for the production of a higher−quality
BFW. The results can be interpreted to provide two possible process configurations for
SAGD produced water treatment and BBD recycle. First, the NF process can be seen
as an alternative to the current WLS−WAC process configuration, completely replac-
87

ing the conventional treatment process, and providing reliable removal of TDS, silica,
divalent ions and TOC from the produced water. Although more studies are needed to
clearly indicate whether such a process will be economically viable, and what is the
maximum recovery achievable from such a plant, the process seems to be technically
feasible. Second, the BBD and makeup water can be combined and treated through
a separate NF system, yielding a stream containing low silica, TDS, DOM, and di-
valent ions that can be mixed with a conventionally (WLS−WAC) treated BFW. This
prevents the risks associated with mixing the BBD and makeup water with the entire
produced water stream before the WLS in the current conventional process configura-
tion, but rather conditioning the recycle and makeup streams from the produced water
in a segregated manner.
88

Figure 3.1: Process flow diagram of a typical SAGD-based in situ bitumen extractionwater treatment plant
89
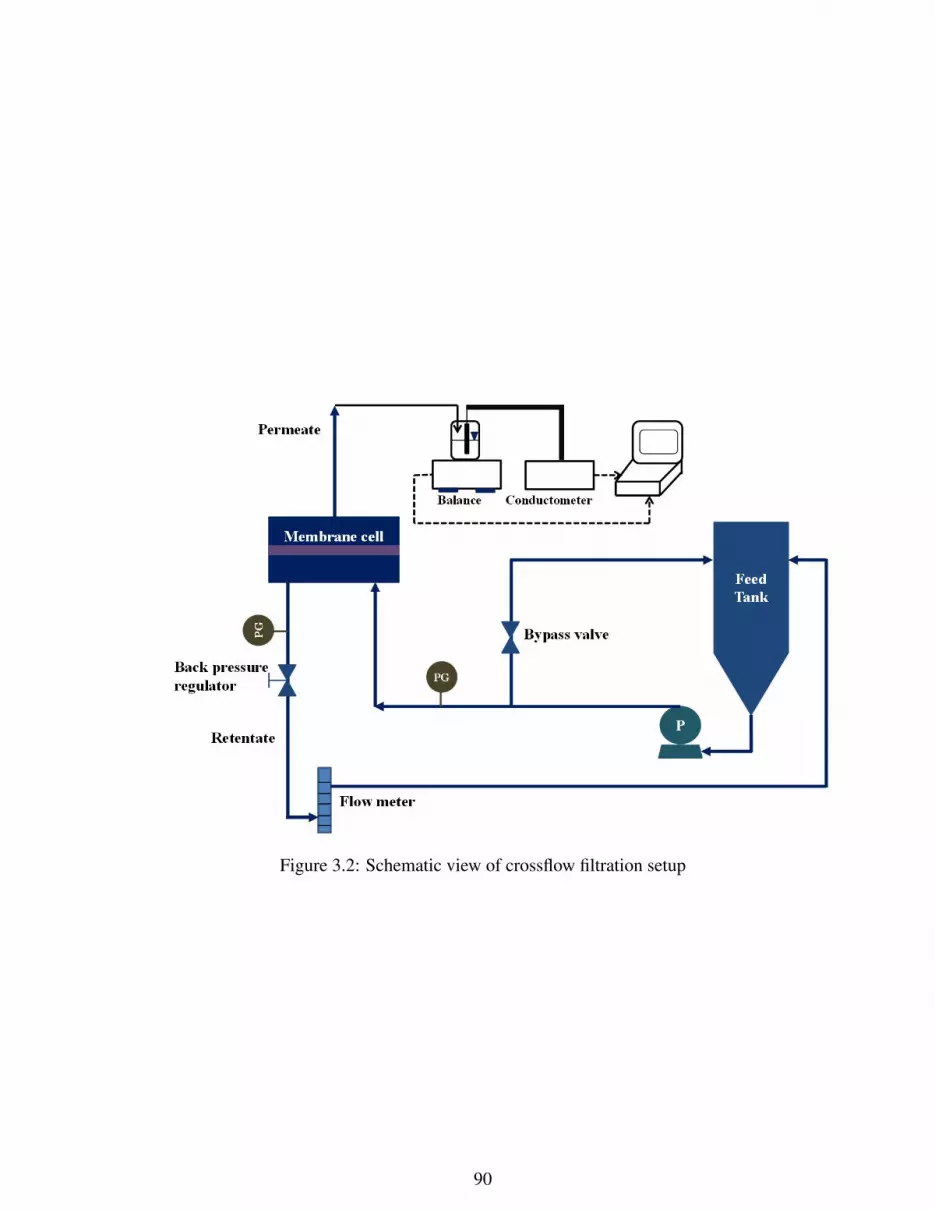
Figure 3.2: Schematic view of crossflow filtration setup
90

Figure 3.3: Water flux and rejection for model BFW filtration using loose NF (NF270),tight NF (NF90) and RO (BW30) membranes at pH=10.5
91
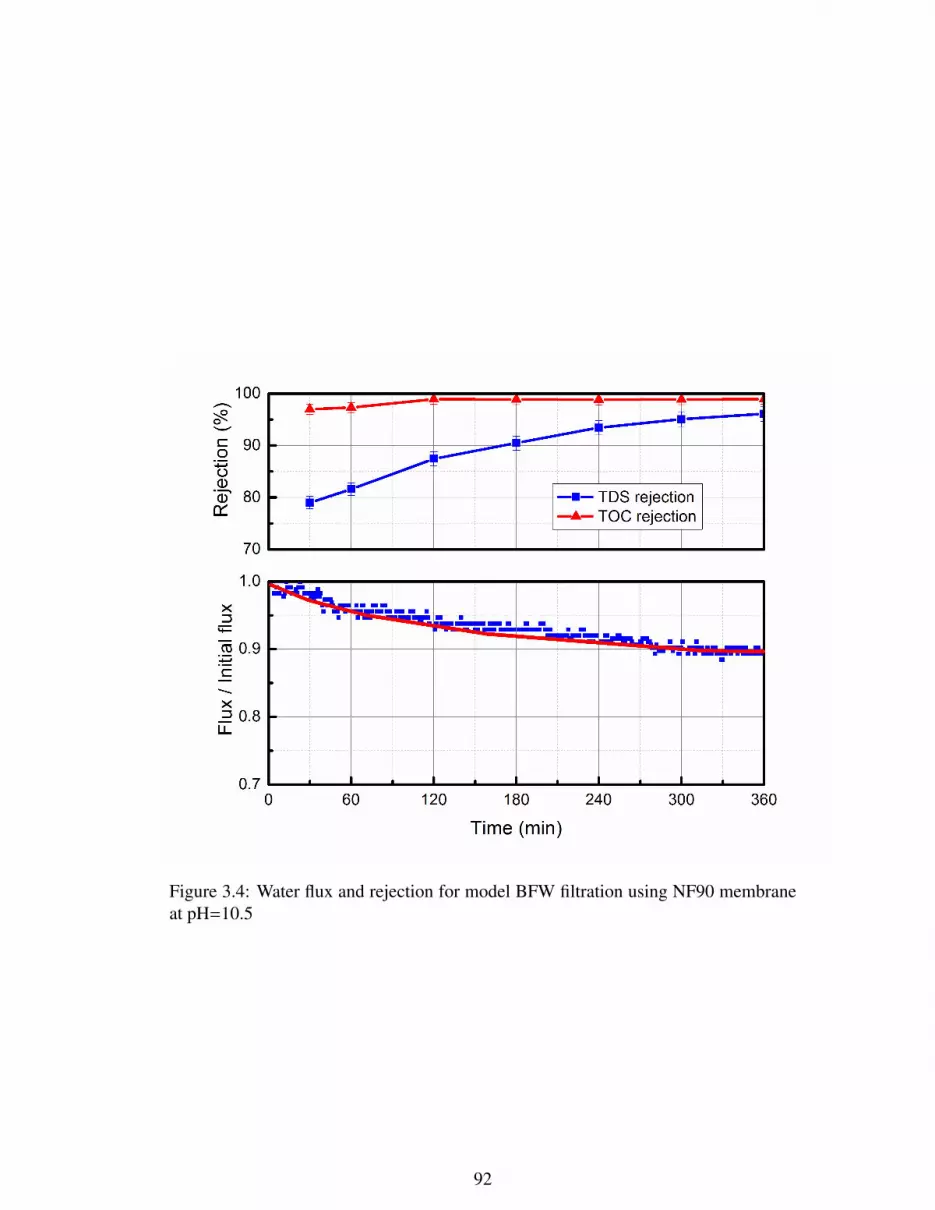
Figure 3.4: Water flux and rejection for model BFW filtration using NF90 membraneat pH=10.5
92

Figure 3.5: Water flux and rejection for model BFW filtration using NF90 membraneat pH=8.5
93

Figure 3.6: Water flux and rejection for model BFW filtration using NF90 membraneat pH=10.5-8.5
94

Figure 3.7: Water flux and rejection for model BFW filtration using NF90 membraneat pH=10.5-8.5-10.5
95

Figure 3.8: FEEMs of model BFW at pH=8.5, permeate at pH=8.5 and permeate atpH increased to 10.5. Excitation at 5 nm intervals from 200 to 500 nm and emissiondata collected at an interval of 10 nm. Permeate has the effective TOC of 9 and thefeed was diluted to the TOC of 12 mg/L. The color scale representing the fluorescenceintensity is logarithmic in all parts of the gure with the range varying from 0.1 (blue)to 500 (red)
96

Figure 3.9: FEEMs of model BFW and permeate at pH=8.5. Excitation at 5 nm inter-vals from 200 to 500 nm and emission data collected at an interval of 10 nm. Permeatehas the effective TOC of 9 and the feed was diluted to the TOC of 12 mg/L. The colorscale representing the fluorescence intensity is logarithmic in all parts of the gure withthe range varying from 0.1 (blue) to 500 (red)
97

Figure 3.10: ATR-FTIR spectra of NF90 membrane before and after filtration
98

Figure 3.11: FESEM-EDX of (a) original membrane, (b) used membrane at pH=10.5,(c) used membrane at pH=8.5 and (c) used membrane at pH=8.5 then 10.5
99
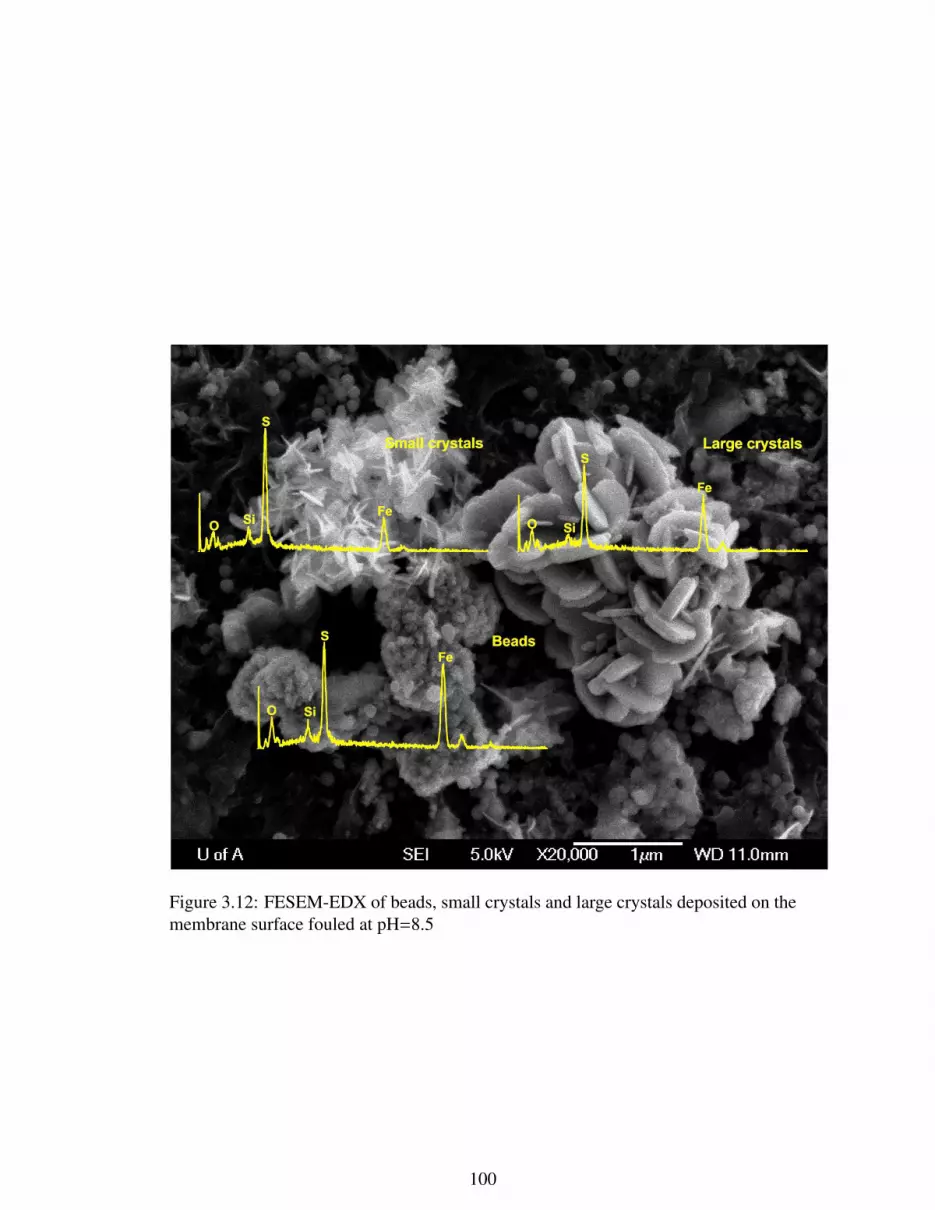
Figure 3.12: FESEM-EDX of beads, small crystals and large crystals deposited on themembrane surface fouled at pH=8.5
100

Figure 3.13: XPS survey spectra of NF90 membrane before and after filtration
101
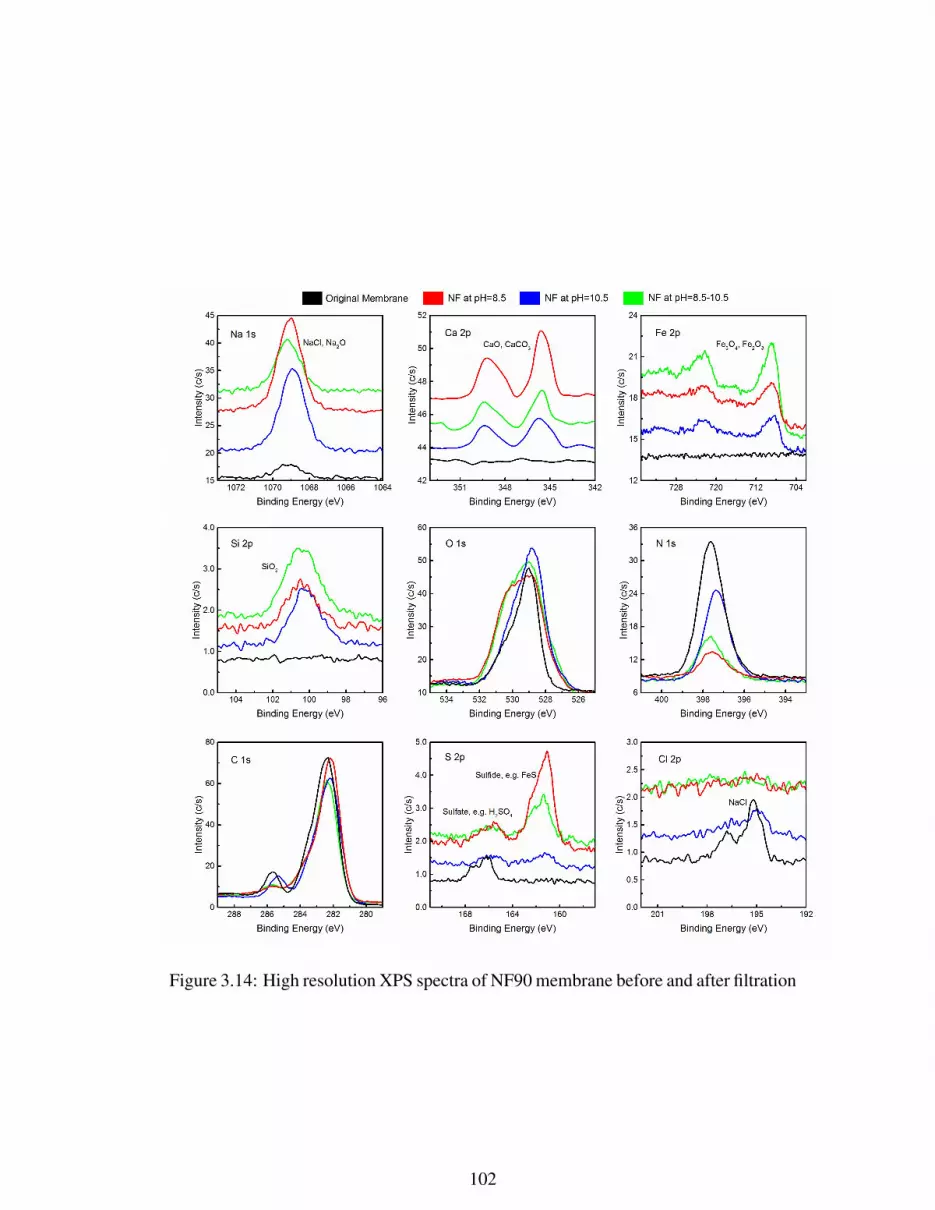
Figure 3.14: High resolution XPS spectra of NF90 membrane before and after filtration
102

Figure 3.15: Detailed XPS deconvoluted C 1s, O 1s and N 1s scans of NF90 membranebefore (a, b, c) and after filtration at pH=8.5 (d, e, f)
103
Chapter 4
CONCLUSIONS AND POSSIBLE FUTURE
DIRECTIONS
4.1 Summary and Conclusions
In the first part of this thesis six types of polymeric thin film composite membranes
including three NF membranes (NF270, NF290, and ESNA), two RO membranes
(BW30 and ESPA) and one UF membrane were tested to remove DOM and TDS from
SAGD WLS inlet water provided from a SAGD water treatment plant in Athabasca
oil sands region of Alberta, Canada. Temperature of the feed was maintained at 50◦C
to have as much similar condition as real industrial produced water. The pressure for
each membrane was set appropriately to get a constant initial permeation flux of 20
GFD. Constant initial permeation flux allowed us to rationalize different fouling be-
haviour of membranes by their different morphological and surface (hydrophilicity,
roughness and zeta potential). The water flux of 20 GFD was reached at 30, 40, 80,
80, 120 and 120 psig trans-membrane pressure for UF, NF270, ESNA, NF90, ESPA
and BW30 membranes. Performance of the membranes was invesitgated by measur-
ing water permeation flux and TOC and TDS rejections, In order to further analyze the
type of organic and inorganic materials in the permeate water, FEEMs and ICP-OES
analyses were conducted. In addition, qualitative and quantitative analyses of fouling

layer deposited on the surface of each membrane was performed by A FESEM-EDX.
Experiments for NF270, ESNA and ESPA were conducted at constant pH of the raw
feed (pH=9), and pH for UF-TF, NF90 and BW30 was dynamic (9-7-10) to observe
how water flux recovery and TDS and TOC rejections are affected by pH.
It was found that NF270 had a lower initial flux decline than ESPA and ESNA that
was attributed to its smoother, more hydrophilic and more negatively charged surface
in comparison with the two other membranes. These surface properties led to less
fouling of membranes mainly by organic matter. Although ESNA membrane’s surface
was less negatively charged than ESPA, its initial flux decline was less than ESPA
membrane which was attributed to its smoother surface.
TOC rejection for NF270, ESPA and ESNA increased by time which was justified
by the hydrophobic interaction between organic material and the cake layer after foul-
ing. The increase in TOC rejection was higher for NF270 due to its more originally
hydrophilic surface. Unlike TOC, TDS rejection did not change too significantly for
ESPA and ESNA, but decreased for NF270 because of cake enhanced concentration
polarization. A slight increase in TDS rejection that happened for ESPA and ESNA
confirmed that organic material in WLS inlet water were the major responsible ma-
terial for fouling, since organic materials plugged membranes’ hot spots and slowed
down the transportation of salt.
For the pH varying experiments on UF, NF90 and BW30, pH of the feed which
was 9 for raw feed decreased to 7 after 120 min , then increased to 10 at t=240 min.
By decreasing pH from 9 to 7, flux decreased sharply for all three membranes. The
reduction was more severe for salt rejecting NF90 and BW30 membranes. According
to the FESEM images fouled material on the NF and RO membranes re-dissolved
by increasing pH which resulted in flux recovery. The most significant flux recovery
belonged to BW30 membrane which is denser, and the flux became even higher than
the initial flux.
105

Increasing pH increased flux by two mechanisms: first by redissolving the fouled
organic matter and second by changing the surface zeta potential of foulants and mak-
ing them more negatively charged. The second one enhances membrane/foulant and
foulant/floulant electrostatic repulsion, thus decrease fouling. Although TDS rejection
increased with decreasing pH from 9 to 7 for NF90 and BW30 membranes due to for-
mation of a compact cake-layer, it decreased for UF membrane which was irreversible
by increasing pH. Decreasing pH increased TOC rejection for UF membrane because
of pore constriction, but it slightly decreased TOC rejection for salt rejecting NF90
and BW30 by passage of small MWCO hydrophilic DOM.
According to the FEEMs results both hydrophobic and hydrophilic organic matter
passed through NF270 and UF membranes, while for RO and NF90 almost all of
the hydrophobic DOM deposited on the surface of the membranes. By deposition of
hydrophobic DOM on the RO and NF90 membranes’ surface, fouling became more
severe at the initial stage of filtration because of hydrophobic interaction of organic
matter with the cake-layer.
ICP-OES result showed that almost all divalent ions and iron were removed by
NF90 and BW30, however they allowed 4% of silica to pass through. Salt rejecting
NF90 and BW30 membranes also removed 93% and 97% of sodium and chloride
respectively. 30%, 20% and 75% of Silica, sodium and calcium were removed by
UF membrane respectively. According to the result, UF membrane is not capable of
removing inogranic material, so it is not a good choice to filter WLS inlet water.
By considering the trade-Off relationship between energy consumption and product
quality, the suitable membrane for WLS inlet water treatment was found to be NF90.
It is worth nothing that although the applied pressure for NF270 membrane was only
10 psig more than that for UF, its TOC and TDS rejection were 20% and 40% more
than UF. It mans that when a very high water quality is not needed for recycling to
boilers NF270 is an outstanding candidate.
106

Flux decline was almost the same for NF90 and BW30 due to their similar surface
properties. NF90 produced a high quality water close to the quality of RO (BW30) wa-
ter by applying lower pressure (550 vs 825 KPa) which means less energy consump-
tion. Since NF90 showed a better perforance in comparison with other membranes for
treatment of WLS inlet water, it was selected for further studies in the second part of
this thesis. A more detailed study was conducted on treatment of a model BFW which
was prepared by diluting SAGD BBD water provided by a SAGD plant in northern Al-
berta. Four experiments were conducted by maintaining temperature, feed flow rate,
and initial permeation flux at 50◦C, 1.6×10⁻⁵m3/s and 1.8×10⁻⁵m3/m2s and two pH
values (8.5 and 10.5).
Since in BFW concentration of DOM (mostly hydrophobic acids) is much higher
than silica and divalent ions (500mg/L vs ∼ 20 mg/L), the dominant fouling mech-
anism was expected to be DOM fouling. The sharp decline in flux at the beginning
occured because of gel formation, pore blocking, and induced hydrophobic properties.
Flux decline slowed down as filtration progressed due to the formation of more com-
pact and thicker fouling layer which increased membrane resistance and consequently
decreased permeation drag. High concentration of ions also intensified fouling by
reducing charge of the membrane and macromolecules surface through double layer
compression and charge screening that decreasesed electrostatic repulsion between
membrane and DOM.
During the tests at constant pH 10.5, TOC rejection remained almost constant at
about 98% , while TDS rejection increased from 80% to 95% within 6 hours run. This
proved that the fouling of NF90 membrane was governed by plugging of hot spots by
organic matter instead of cake enhance concentration polarization. Consistent TOC
rejection at 98% attributed to the larger size of DOM compared to the dissolved solids
in the water. In fact, NF90 rejected 98% of the DOM at a feed pH of 10.5, regardless
of the fouling progress. At pH 8.5, permeation flux decreased about 7% at the first
107

two hours and then remained constant. TOC and TDS rejections remained constant at
98% for the whole experiment time. TDS rejection increased by decreasing pH to 8.5
because of co-precipitation of silica and organic matter on the surface of membrane and
cake filtration. Increasing pH from 8.5 to 10.5 during the third experiment, improved
water flux about 20% instantly. In experiment 4, first decreasing the pH from 10.5
to 8.5 decreased the water flux, then returning the pH back to 10.5 quickly returned
the flux and rejection to previous trend. This behavior was attributed the rapid change
in foulant/foulant and foulant/membrane interactions by changing the pH. The TDS
rejection behavior was exactly opposite to water flux. It was increased by decreasing
the pH but desecrated by increasing the pH, however the response to pH was very
fast like water flux. Instantaneous change of flux and TDS rejection by injecting acid
or alkaline into the feed water demonstrated the outstanding role of pH on fouling,
especially in presence of both silica and organic matter.
EDX analysis of the fouling material on the surface of the membrane demonstrated
that fouling layer contained silica and iron. According to XPS result inorganic mate-
rial (mostly metal oxides) and organics (with carboxylic and amino acid as functional
groups) were found in the deposited layer on the surface of membrane. FEEMs result
showed that most of the materials that passed through the membrane were hydrophilic
macromolecules. This study showed that NF90 has a high potential to be used as
polishing step in SAGD produced water treatment to increase the quality of BFW.
The results of both studies can be interpreted to provide three possible ways to
use NF90 membrane in SAGD produced water treatmen. Firstly membrane process
can be used as a complete alternative for WLS-WAC process to remove TOC, TDS,
divalent ions and silica. Secondly NF process can be used to purify the combination
of BBD and make up water to decrease silica, DOM, TDS and divalent ions. The
product can be get mixed with the product of conventional treating methods. Thirdly,
membrane process can be used for purification of the output of current water treatment
108

processes which is the input of boiler (BFW). This helps to reduce fouling of steam
generator’s pipes and shut-down frequency of SAGD plant. Meanwhile, the conven-
tional processes reduce the amount of silica and divalent ions to an acceptable range
for membrane treatment. Applying conventional processes as pre-treatment prevents
scaling of membranes and consequently increases the life time of membranes.
4.2 Possible Future Directions
In order to use NF and RO for treatment of certain waste water the fouling poten-
tial of that water must be measured first. Accommodating very harsh water into the
membrane process may reduce the lifetime of membrane and is not practical in real
application. A common way of finding the wastewater fouling potential is to measure
its silt density index (SDI). The SDI is evaluated by measuring the rate of plugging
of a 0.45 µm membrane at a constant trans-membrane pressure of 206.8 kPa (30 psi).
The SDI provides the average water flux decline (%) per minute through the filter over
a period of time such as 15 minutes. Typically, the SDI must be less than 5 to be
suitable for a RO system. Hence, the future direction for this study could be providing
more practical process and material suggestions for industry to use membranes. The
following themes could be focused:
1. Selecting three major streams of SAGD produced water treatment plant, namely
BBD, WLS inlet and BFW and measuring their SDI.
2. Performing a single stage NF or RO process for the waters having SDI less
than 5 and suggesting the best membrane considering both product quality and energy
efficiency.
3. For SDI >5 add make-up water to reduce it to less than 5 and find the volume
of fresh water needed for membrane treatment. Use three SDI values 2, 3 and 5 (by
adding various amount of fresh water) and find the fouling behaviour of membranes
and suggest the best feed properties which may lead to a longer operation and less cost.
109

4. For SDI >5, conduct pre-treatment techniques like oxidation, adsorption and
loose UF and MF membranes to reduce their SDI to the acceptable range and suggest
the best hybrid process.
5. Using novel membrane process like forward osmosis (FO) for water treatment.
The objective is to reduce energy consumption (FO is operated without applying pres-
sure) and fouling of membranes by using FO process.
6. Performing simulation with common software (e.g. ROSA from Filmtec) and
suggest the best process configuration (single or double stages) to have the maximum
recovery (<80%) of water by using the selected membrane in previous stages.
110
Bibliography
[1] Subhayan Guha Thakurta, Abhijit Maiti, David J. Pernitsky, and Subir Bhat-
tacharjee. Dissolved organic matter in steam assisted gravity drainage boiler
blow-down water. Energy & Fuels, 27(7):3883–3890, June 2013.
[2] S. Bhattacharjee. Oil sands: A bridge between conventional petroleum and a
sustainable energy future , in: S. Basu (Ed.), Towards Sustainable Clean En-
ergy. New York, 2011.
[3] Peggy J. Parks. Water pollution / by Peggy J. Parks. Farmington Hills, MI :
KidHaven Press ; Detroit : Thomson/Gale, c2007, 2007.
[4] C. A. Brebbia and Paul C. Anagnostopoulos. Water pollution V : mod-
elling, measuring, and prediction / editors, C.A. Brebbia, P. Anagnostopoulos.
Southampton, UK ; Boston : WIT Press, c1999., 1999.
[5] E. W. Allen. Process water treatment in Canada’s oil sands industry: II. A
review of emerging technologies. Journal of Environmental Engineering and
Science, 7(5):499–524, 2008.
[6] Rich Hill. Thermal in situ water conservation study, AI-EES and Jacobs Con-
sultancy, Technical Report. Technical report, AI-EES and Jacobs Consultancy,
2012.
[7] W F Heins. Technical advancements in SAGD evaporative produced water treat-
ment. Journal of Canadian Petroleum Technology, 48(11):27–32, 2009.
111

[8] R. Singh. Hybrid Membrane Systems for Water Purification: Technology, Sys-
tems Design and Operations. Elsevier Science, 2006.
[9] I. A. Al-Anezi I. S. Al-Mutaz. Silica removal during lime softening in water
treatment plant. In International Conf. on Water Resources & Arid Environment
(2004), 2004.
[10] D. K. Pingale. Role of weak acid cation resin in water treatment. CHEMICAL
WEEKLY -BOMBAY-, 50:201–208, 2005.
[11] E. T. Igunnu and G. Z. Chen. Produced water treatment technologies. Interna-
tional Journal of Low-Carbon Technologies, 0:1–21, July 2012.
[12] PrzemysÅaw Drzewicz, Atefeh Afzal, Mohamed Gamal El-Din, and
Jonathan W Martin. Degradation of a model naphthenic acid, cyclohexanoic
acid, by vacuum UV (172 nm) and UV (254 nm)/H2O2. The Journal of Physi-
cal Chemistry. Ahemistry. A, 114(45):12067–12074, November 2010.
[13] Ahmadun Fakhrul-Razi, Alireza Pendashteh, Luqman Chuah Abdullah, Dayang
Radiah Awang Biak, Sayed Siavash Madaeni, and Zurina Zainal Abidin. Re-
view of technologies for oil and gas produced water treatment. Journal of haz-
ardous materials, 170(2-3):530–51, October 2009.
[14] B R Hansen and S R H Davies. Review of potential technologies for the removal
of dissolved components from produced water. Chemical Engineering Research
and Design, 72(A2):176–188, 1994.
[15] Christina C Small, Ania C Ulrich, and Zaher Hashisho. Adsorption of acid
extractable oil sands tailings organics onto raw and activated oil sands coke.
Journal of Environmental Engineering, 138:833–840, 2012.
112
[16] Christina C. Small, Zaher Hashisho, and Ania C. Ulrich. Preparation and char-
acterization of activated carbon from oil sands coke. Fuel, 92(1):69–76, Febru-
ary 2012.
[17] Warren Zubot, Michael D MacKinnon, Pamela Chelme-Ayala, Daniel W Smith,
and Mohamed Gamal El-Din. Petroleum coke adsorption as a water manage-
ment option for oil sands process-affected water. The Science of the Total Envi-
ronment, 427-428:364–372, June 2012.
[18] W F Mcternan, W E Blanton, G D Boardman, B T Nolan, and D J Kocornik.
Polymer flotation and activated carbon adsorption treatment for in situ tar sand
process water. Environmental Progress, 5(3):154–158, 1986.
[19] Mohamed Gamal El-Din, Hongjing Fu, Nan Wang, Pamela Chelme-Ayala,
Leonidas Perez-Estrada, PrzemysÅaw Drzewicz, Jonathan W Martin, Warren
Zubot, and Daniel W Smith. Naphthenic acids speciation and removal during
petroleum-coke adsorption and ozonation of oil sands process-affected water.
The Science of the Total Environment, 409(23):5119–5125, November 2011.
[20] PrzemysÅaw Drzewicz, Leonidas Perez-Estrada, Alla Alpatova, Jonathan W
Martin, and Mohamed Gamal El-Din. Impact of peroxydisulfate in the presence
of zero valent iron on the oxidation of cyclohexanoic acid and naphthenic acids
from oil sands process-affected water. Environmental science & technology,
46(16):8984–8991, August 2012.
[21] Yuhe He, Steve B Wiseman, Xiaowei Zhang, Markus Hecker, Paul D Jones,
Mohamed Gamal El-Din, Jonathan W Martin, and John P Giesy. Ozonation
attenuates the steroidogenic disruptive effects of sediment free oil sands process
water in the H295R cell line. Chemosphere, 80(5):578–84, July 2010.
113
[22] Jonathan W Martin, Thaer Barri, Xiumei Han, Phillip M Fedorak, Mo-
hamed Gamal El-Din, Leonidas Perez, Angela C Scott, and Jason Tiange Jiang.
Ozonation of oil sands process-affected water accelerates microbial bioreme-
diation. Environmental Science & Technology, 44(21):8350–8356, November
2010.
[23] Angela C Scott, Warren Zubot, Michael D MacKinnon, Daniel W Smith, and
Phillip M Fedorak. Ozonation of oil sands process water removes naphthenic
acids and toxicity. Chemosphere, 71(1):156–60, March 2008.
[24] Atefeh Afzal, PrzemysÅaw Drzewicz, Leonidas A Perez-Estrada, Yuan Chen,
Jonathan W Martin, and Mohamed Gamal El-Din. Effect of molecular struc-
ture on the relative reactivity of naphthenic acids in the UV/H2O2 advanced
oxidation process. Environmental Science & Technology, 46(19):10727–10734,
October 2012.
[25] Leonidas A Perez-Estrada, Xiumei Han, PrzemysÅaw Drzewicz, Mohamed
Gamal El-Din, Phillip M Fedorak, and Jonathan W Martin. Structure-reactivity
of naphthenic acids in the ozonation process. Environmental Science & Tech-
nology, 45(17):7431–7437, September 2011.
[26] Zhixiong Cha, Cheng Fang Lin, Chia Jung Cheng, and P K Andy Hong. Re-
moval of oil and oil sheen from produced water by pressure-assisted ozonation
and sand filtration. Chemosphere, 78(5):583–90, January 2010.
[27] J C Anderson, S B Wiseman, N Wang, A Moustafa, L Perez-Estrada, M Gamal
El-Din, J W Martin, K Liber, and J P Giesy. Effectiveness of ozonation treatment
in eliminating toxicity of oil sands process-affected water to chironomus dilutus.
Environmental Science & Technology, 46(1):486–93, January 2012.
114

[28] Erick Garcia-Garcia, Jun Qing Ge, Ayoola Oladiran, Benjamin Montgomery,
Mohamed Gamal El-Din, Leonidas C Perez-Estrada, James L Stafford,
Jonathan W Martin, and Miodrag Belosevic. Ozone treatment ameliorates oil
sands process water toxicity to the mammalian immune system. Water research,
45(18):5849–5857, November 2011.
[29] Xiumei Han, Angela C Scott, Phillip M Fedorak, Mahmoud Bataineh, and
Jonathan W Martin. Influence of molecular structure on the biodegradability of
naphthenic acids. Environmental science& technology, 42(4):1290–5, February
2008.
[30] Geelsu Hwang, Tao Dong, Md Sahinoor Islam, Zhiya Sheng, Leonidas A Perez-
Estrada, Yang Liu, and Mohamed Gamal El-Din. The impacts of ozonation on
oil sands process-affected water biodegradability and biofilm formation charac-
teristics in bioreactors. Bioresource technology, 130:269–77, February 2013.
[31] Hamed Mahdavi, Ania C Ulrich, and Yang Liu. Metal removal from oil sands
tailings pond water by indigenous micro-alga. Chemosphere, 89(3):350–4,
September 2012.
[32] Hamed Mahdavi, Yang Liu, and Ania C Ulrich. Partitioning and bioaccumula-
tion of metals from oil sands process affected water in indigenous Parachlorella
kessleri. Chemosphere, 90(6):1893–9, February 2013.
[33] Tara J Penner and Julia M Foght. Mature fine tailings from oil sands processing
harbour diverse methanogenic communities. Cannadian Journal of Microbiol-
ogy, 56:459–470, 2010.
[34] E. Quagraine, H. Peterson, and J. Headley. In situ bioremediation of naph-
thenic acids contaminated tailing pond waters in the Athabasca oil sands re-
gionDemonstrated field studies and plausible options: A review. Journal of
115

Environmental Science and Health, Part A: Toxic/Hazardous Substances & En-
vironmental Engineering, 40(3):685–722, January 2005.
[35] Angela C Scott, Michael D MacKinnon, and Phillip M Fedorak. Naphthenic
acids in athabasca oil sands tailings waters are less biodegradable than commer-
cial naphthenic acids. Environmental science & technology, 39(21):8388–94,
November 2005.
[36] Benjamin E Smith, C Anthony Lewis, Simon T Belt, Corinne Whitby, and
Steven J Rowland. Effects of alkyl chain branching on the biotransformation
of naphthenic acids. Environmental Science & Technology, 42(24):9323–9328,
December 2008.
[37] Navdeep S Toor, Eric D Franz, Phillip M Fedorak, Michael D MacKinnon, and
Karsten Liber. Degradation and aquatic toxicity of naphthenic acids in oil sands
process-affected waters using simulated wetlands. Chemosphere, 90(2):449–58,
January 2013.
[38] Eun-Sik Sik Kim, Yang Liu, and Mohamed Gamal El-Din. The effects of pre-
treatment on nanofiltration and reverse osmosis membrane filtration for desali-
nation of oil sands process-affected water. Separation and Purification Technol-
ogy, 81(3):418–428, October 2011.
[39] H. Peng, K. Volchek, M. MacKinnon, W.P. Wong, and C.E. Brown. Applica-
tion on to nanofiltration to water management options for oil sands operation.
Desalination, 170:137–150, 2004.
[40] Eun Sik Kim, Yang Liu, and Mohamed Gamal El-Din. Evaluation of membrane
fouling for in-line filtration of oil sands process-affected water: the effects of
pretreatment conditions. Environmental Science & Technology, 46(5):2877–
2884, March 2012.
116

[41] Eun Sik Kim, Yang Liu, and Mohamed Gamal El-Din. An in-situ integrated
system of carbon nanotubes nanocomposite membrane for oil sands process-
affected water treatment. Journal of Membrane Science, 429:418–427, February
2013.
[42] Paul Swenson, Brenden Tanchuk, Elia Bastida, Weizhu An, and Steven M.
Kuznicki. Water desalination and de-oiling with natural zeolite membranes
Potential application for purification of SAGD process water. Desalination,
286:442–446, February 2012.
[43] A. Banerjee A.K. Mehrotra. Evaluation of reverse osmosis for the treatment
of oil sands produced water. Water Pollution Research Journal of Canada,
21:141–152, 1986.
[44] Rafael Mujeriego and Takashi Asano. The role of advanced treatment in
wastewater reclamation and reuse. volume 40, pages 1 – 9, Milan, Italy, 1999.
Public health;Wastewater reuse;.
[45] R. Abdul-Rahman, H. Tsuno, and N. Zainol. Nitrogen nutrient removals from
wastewater and river water. volume 45, pages 197 – 204, 2002. Sequencing
batch reactors (SBT);.
[46] A. Wood. Constructed wetlands in water pollution control: Fundamentals to
their understanding. Water Science and Technology,, 32:21–29, 1995.
[47] A.G. Werker, J.M. Dougherty, J.L. McHenry, and W.A. Van Loon. Review:
Treatment variability for wetland wastewater treatment design in cold climates.
Ecological Engineering, 19:1–11, 2002.
[48] Rana Kidak and Nilsun H. Ince. Ultrasonic destruction of phenol and substituted
phenols: A review of current research. Ultrasonics Sonochemistry, 13:195 –
199, 2006.
117
[49] Detlef Bahnemann. Photocatalytic water treatment: Solar energy applications.
Solar Energy, 77:445 – 459, 2004.
[50] Marcel Mulder. Basic principles of membrane technology. Kluwer Academic,
Dordrecht, 2nd edition, 1997.
[51] T Bilstad, E Espedal, and Espedal E Bilstad T. Membrane separation of pro-
duced water. Water Science and Technology, 34(9):239–246, 1996.
[52] J C Campos, R M H Borges, A M Oliveira Filho, R Nobrega, G L Sant’Anna,
and J Sant’Anna. Oilfield wastewater treatment by combined microfiltration
and biological processes. Water Research, 36(1):95–104, January 2002.
[53] Jing Zhong, Xiaojuan Sun, and Cheli Wang. Treatment of oily wastewater pro-
duced from refinery processes using flocculation and ceramic membrane filtra-
tion. Separation and Purification Technology, 32(1-3):93–98, July 2003.
[54] Eric M. V. Hoek, Albert S. Kim, and Menachem Elimelech. Influence of cross-
flow membrane filter geometry and shear rate on colloidal fouling in reverse
osmosis and nanofiltration separations. Environmental Engineering Science,
19(6):357–372, November 2002.
[55] E. Kissa. Dispersions: Characterization, Testing, and Measurement. Taylor &
Francis, 1999.
[56] Menachem Elimelech, William H Chen, and John J Waypa. Measuring the
zeta (electrokinetic) potential of reverse osmosis membranes by a streaming
potential analyzer. Desalination, 95:269–286, 1994.
[57] H Jacobasch and J Schurz. Characterization of polymer surfaces by means of
electrokinetic measurements. Progress in Colloid & Polymer Science, 77:40–
48, 1988.
118
[58] H.J. Jacobasch, G. Baubock, and J. Schurz. Problems and results of zeta-
potential measurements on fibers. Colloid and Polymer Science, 263:3–24,
1985.
[59] Stanley Hartland. Surface and interfacial tension [electronic resource] : mea-
surement, theory, and applications. New York ; Basel : Marcel Dekker, c2004.,
2004.
[60] A Zaidi, K Simms, and S Kak. The use of micro/ultrafiltration for the removal
of oil and suspended solids from oilfield brines. Water Science and Technology,
25(10):163–176, 1992.
[61] I W Cumming, R G Holdich, and I D Smith. The rejection of oil using an asym-
metric metal microfilter to separate an oil in water dispersion. Water Research,
33(17):3587–3594, December 1999.
[62] Elham Gorouhi, Mohtada Sadrzadeh, and Toraj Mohammadi. Microfiltration of
oily wastewater using PP hydrophobic membrane. Desalination, 200(1-3):319–
321, November 2006.
[63] T Leiknes and M J Semmens. Membrane filtration for preferential removal of
emulsified oil from water. Water Science & Technology, 41(10-11):101–108,
2000.
[64] T C Arnot, R W Field, and A B Koltuniewicz. Cross-flow and dead-end mi-
crofiltration of oily-water emulsions Part II . Mechanisms and modelling of flux
decline. Journal of Membrane Science, 169:1–15, 2000.
[65] D Bhattacharyya, A B Jumawan, R B Grieves, and L R Harris. Ultrafiltration
characteristics of oil-detergent-water systems: Membrane fouling mechanisms.
Separation Science and Technology, 14(6):529–549, August 1979.
119

[66] Soobok Lee, Yves Aurelle, and Henry Roques. Concentration polarization,
membrane fouling and cleaning in ultrafiltration of soluble oil. Journal of Mem-
brane Science, 19(1):23–38, 1984.
[67] Charles A. Dyke and Craig R. Bartels. Removal of organics from offshore
produced waters using nanofiltration membrane technology. Environmental
Progress, 9(3):183–186, August 1990.
[68] F T Tao, S Curtice, R D Hobbs, J L Sides, J D Wieser, C A Dyke, D Tuohey,
and P F Pilger. Reverse osmosis process successfully converts oil field brine
into freshwater. The Oil and Gas Journal, 38:88–91, 1993.
[69] Glenn F Doran, Kimberly L Williams, Joseph A Drago, Sunny S Huang, and
Lawrence Y C Leong. Pilot study results to convert oil field produced water to
drinking water or reuse quality. In SPE Annaual Technical Conference and Ex-
hibition, pages 403–417, New Orleans, 1998. Society of Petroleum Engineers,
Inc.
[70] M D MacKinnon and H Boerger. Description of two treatment methods for
detoxifying oil sands tailings pond water. Water Pollution Research Journal of
Canada, 21(4):496–512, 1986.
[71] Jacob Masliyah, Zhiang Joe Zhou, Zhenghe Xu, Jan Czarnecki, and Hassan
Hamza. Understanding water-based bitumen extraction from Athabasca oil
sands. The Canadian Journal of Chemical Engineering, 82:628–654, 2004.
[72] Joyce S Clemente and Phillip M Fedorak. A review of the occurrence, analyses,
toxicity, and biodegradation of naphthenic acids. Chemosphere, 60(5):585–600,
July 2005.
120

[73] Qilin Li and Menachem Elimelech. Organic fouling and chemical cleaning
of nanofiltration membranes: measurements and mechanisms. Environmental
science & technology, 38(17):4683–93, September 2004.
[74] Qilin Li and Menachem Elimelech. Synergistic effects in combined fouling of a
loose nanofiltration membrane by colloidal materials and natural organic matter.
Journal of Membrane Science, 278(1-2):72–82, July 2006.
[75] Elizabeth Arkhangelsky, Filicia Wicaksana, Chuyang Tang, Abdulrahman a
Al-Rabiah, Saeed M Al-Zahrani, and Rong Wang. Combined organic-
inorganic fouling of forward osmosis hollow fiber membranes. Water Research,
46(19):6329–38, December 2012.
[76] Christopher Bellona, Jorg E Drewes, Pei Xu, and Gary Amy. Factors affecting
the rejection of organic solutes during NF/RO treatment–a literature review.
Water research, 38(12):2795–809, July 2004.
[77] Christopher Bellona, Melissa Marts, and Jeorg E. Drewes. The effect of organic
membrane fouling on the properties and rejection characteristics of nanofiltra-
tion membranes. Separation and Purification Technology, 74(1):44–54, July
2010.
[78] By Anne Braghetta, Francis A Digiano, and William P Ball. Nanofiltration of
natural organic matter: pH and ionic strength effects. Journal of Environmental
Engineering, 123:628–641, 1997.
[79] Kimberly L. Jones and Charles R. OMelia. Protein and humic acid adsorption
onto hydrophilic membrane surfaces: effects of pH and ionic strength. Journal
of Membrane Science, 165(1):31–46, January 2000.
[80] MaÅgorzata Kabsch-Korbutowicz, Katarzyna Majewska-Nowak, and Tomasz
Winnicki. Analysis of membrane fouling in the treatment of water solutions
121
containing humic acids and mineral salts. Desalination, 126(1-3):179–185,
November 1999.
[81] G.F. Doran, K.L. Williams, J.A. Drago, S.S. Huang, and L.Y.C. Leong. Pilot
study results to convert oil field produced water to drinking water or reuse qual-
ity, in: SPE Annaual Technical Conference and Exhibition. Society of Petroleum
Engineers, Inc., pages 403–417, 1998.
[82] Li Liangxiong, T.M. M Whitworth, and Robert Lee. Separation of inorganic
solutes from oil-field produced water using a compacted bentonite membrane.
Journal of Membrane Science, 217(1-2):215–225, June 2003.
[83] Mehmet Cakmakce, Necati Kayaalp, and Ismail Koyuncu. Desalination of pro-
duced water from oil production fields by membrane processes. Desalination,
222(1-3):176–186, March 2008.
[84] Cynthia Murray-Gulde, John E Heatley, Tanju Karanfil, John H Rodgers, and
James E Myers. Performance of a hybrid reverse osmosis-constructed wet-
land treatment system for brackish oil field produced water. Water Research,
37(3):705–13, February 2003.
[85] S. Mondal and S. Ranil Wickramasinghe. Produced water treatment by
nanofiltration and reverse osmosis membranes. Journal of Membrane Science,
322(1):162–170, September 2008.
[86] Pei Xu, Jorg E. Drewes, and Dean Heil. Beneficial use of co-produced water
through membrane treatment: technical-economic assessment. Desalination,
225(1-3):139–155, May 2008.
[87] David W Jennings and Arif Shaikh. Heat-exchanger deposition in an inverted
steam-assisted Gravity drainage operation . Part 1 . inorganic and organic anal-
yses of deposit samples. Energy & Fuels, 21(1):176–184, 2007.
122
[88] Sanyi Wang, Eric Axcell, Ron Bosch, and Virgil Little. Effects of chemical
application on antifouling in steam-assisted gravity drainage operations. Energy
& Fuels, 19(4):1425–1429, July 2005.
[89] J Zhong, X Sun, and C Wang. Treatment of oily wastewater produced from re-
finery processes using flocculation and ceramic membrane filtration. Separation
and Purification Technology, 32(1-3):93–98, 2003.
[90] Andrea Iris Schafer. Natural organics removal using membranes. Phd thesis,
The University of New South Wales, 1999.
[91] S M Santos and M R Weisner. Ultrafiltration of water generated in oil and gas
production. Water Environment, 69:1120–1127, 1997.
[92] Seungkwan Hong and Menachem Elimelech. Chemical and physical aspects of
natural organic matter (NOM) fouling of nanofiltration membranes. Journal of
Membrane Science, 132(2):159–181, September 1997.
[93] Hideo Kawaguchi, Zhengguo Li, Yoshihiro Masuda, Kozo Sato, and Hiroyuki
Nakagawa. Dissolved organic compounds in reused process water for steam-
assisted gravity drainage oil sands extraction. Water research, 46(17):5566–74,
November 2012.
[94] Matthew a. Petersen and Hans Grade. Analysis of Steam Assisted Gravity
Drainage Produced Water using Two-Dimensional Gas Chromatography with
Time-of-Flight Mass Spectrometry. Industrial & Engineering Chemistry Re-
search, 50(21):12217–12224, November 2011.
[95] QL Li and M Elimelech. Organic fouling and chemical cleaning of nanofil-
tration membranes: Measurements and mechanisms. ENVIRONMENTAL SCI-
ENCE & TECHNOLOGY, 38:4683 – 4693, 2004.
123
[96] By Anne Braghetta, Francis A Digiano, and William P Ball. NOM accumulation
at NF membrane surface: Imact of chemistry and shear. Journal of Environmen-
tal Engineering, 124:1087–1098, 1998.
[97] C Jucker and M M Clark. Adsorption of aqautic humic substances on hydropho-
bic ultrafiltration membranes. Journal of Membrane Science, 97:37–52, 1994.
[98] Cecilia M. C. Law, Xiao-Yan Li, and Qilin Li. The combined colloid-organic
fouling on nanofiltration membrane for wastewater treatment and reuse. Sepa-
ration Science and Technology, 45(7):935–940, April 2010.
[99] Zhi Wang, Yuanyuan Zhao, Jixiao Wang, and Shichang Wang. Studies on
nanofiltration membrane fouling in the treatment of water solutions containing
humic acids. Desalination, 178(1-3):171–178, July 2005.
[100] Wei Yuan and Andrew L. Zydney. Effects of solution environment on humic
acid fouling during microfiltration. Desalination, 122(1):63–76, May 1999.
[101] A I Schafer, A G Fane, and T D Waite. Nanofiltration of natural organic matter:
Removal, fouling and the influence of multivalent ions. Desalination, 118:109–
122, 1998.
[102] H Dach. Comparison des operations de nanofiltration et d osmose inverse pour
le dessalement selectif des eaux saumatres: De l echelle du laboratoire au pilote
industriel. PhD thesis, UNIVERSIT DANGERS, 2008.
[103] Mara Jose Lopez-Munoz, Arcadio Sotto, Jesus M. Arsuaga, and Bart Van der
Bruggen. Influence of membrane, solute and solution properties on the reten-
tion of phenolic compounds in aqueous solution by nanofiltration membranes.
Separation and Purification Technology, 66(1):194–201, April 2009.
124
[104] A R S Teixeira, J L C Santos, and J G Crespo. Sustainable membrane-based pro-
cess for valorisation of cork boiling wastewaters. Separation and Purification
Technology, 66(1):35–44, April 2009.
[105] Yi-Li Lin, Pen-Chi Chiang, and E-E Chang. Removal of small trihalomethane
precursors from aqueous solution by nanofiltration. Journal of Hazardous Ma-
terials, 146:20–29, 2007.
[106] Anna M Comerton, Robert C Andrews, David M Bagley, and Chunyan Hao.
The rejection of endocrine disrupting and pharmaceutically active compounds
by NF and RO membranes as a function of compound and water matrix proper-
ties. Journal of Membrane Science, 313:323–335, 2008.
[107] K V Plakas, A J Karabelas, T Wintgens, and T Melin. A study of selected
herbicides retention by nanofiltration membranesThe role of organic fouling.
Journal of Membrane Science, 284:291–300, November 2006.
[108] Ebrahim Negaresh, Alice Antony, Mojgan Bassandeh, Desmond E Richardson,
and Greg Leslie. Selective separation of contaminants from paper mill effluent
using nanofiltration. Chemical Engineering Research and Design, 90:576–583,
April 2012.
[109] C Bellona and J E Drewes. The role of membrane surface charge and solute
physico-chemical properties in the rejection of organic acids by NF membranes.
Journal of Membrane Science, 249(1-2):227–234, 2005.
[110] H.M. Krieg, S.J. Modise, K. Keizer, and H.W.J.P. Neomagus. Salt rejection in
nanofiltration for single and binary salt mixtures in view of sulphate removal.
Desalination, 171(2):205–215, January 2005.
[111] A Alturki, N Tadkaew, J.a. McDonald, S J Khan, W E Price, and L D Nghiem.
Combining MBR and NF/RO membrane filtration for the removal of trace or-
125

ganics in indirect potable water reuse applications. Journal of Membrane Sci-
ence, 365:206–215, December 2010.
[112] A Somrani, A H Hamzaoui, and M Pontie. Study on lithium separation from
salt lake brines by nanofiltration (NF) and low pressure reverse osmosis (LPRO).
Desalination, 317:184–192, May 2013.
[113] Y Wang and C Y Tang. Protein fouling of nanofiltration, reverse osmosis, and
ultrafiltration membranesThe role of hydrodynamic conditions, solution chem-
istry, and membrane properties. Journal of Membrane Science, 376:275–282,
July 2011.
[114] Pei Xu, Jorg E. Drewes, Tae-Uk Kim, Christopher Bellona, and Gary Amy. Ef-
fect of membrane fouling on transport of organic contaminants in NF/RO mem-
brane applications. Journal of Membrane Science, 279(1-2):165–175, August
2006.
[115] Dipankar Nanda, Kuo-Lun Tung, Chi-Chung Hsiung, Ching-Jung Chuang,
Ruoh-Chyu Ruaan, Yan-Che Chiang, Chih-Shen Chen, and Tien-Hwa Wu. Ef-
fect of solution chemistry on water softening using charged nanofiltration mem-
branes. Desalination, 234:344–353, December 2008.
[116] K Kimura, G Amy, J E Drewes, T Heberer, T U Kim, and Y Watanabe. Rejec-
tion of organic micropollutants (disinfection by-products, endocrine disrupting
compounds, and pharmaceutically active compounds) by NF/RO membranes.
Journal of Membrane Science, 227:113–121, December 2003.
[117] Chalor Jarusutthirak, Gary Amyb, and Jean-philippe Crou. Fouling character-
istics of wastewater effluent organic matter ( EfOM ) isolates on NF and UF
membranes. Desalination, 145:247–255, 2002.
126
[118] W Peng, I Escobar, and D White. Effects of water chemistries and properties of
membrane on the performance and foulinga model development study. Journal
of Membrane Science, 238:33–46, July 2004.
[119] M. Pontie, H. Dach, J. Leparc, M. Hafsi, and A Lhassani. Novel approach
combining physico-chemical characterizations and mass transfer modelling of
nanofiltration and low pressure reverse osmosis membranes for brackish water
desalination intensification. Desalination, 221(1-3):174–191, March 2008.
[120] A Subramani and E Hoek. Direct observation of initial microbial deposition
onto reverse osmosis and nanofiltration membranes. Journal of Membrane Sci-
ence, 319:111–125, July 2008.
[121] Kha L. Tu, Allan R. Chivas, and Long D. Nghiem. Effects of membrane foul-
ing and scaling on boron rejection by nanofiltration and reverse osmosis mem-
branes. Desalination, 279(1-3):269–277, September 2011.
[122] H Kelewou, A Lhassani, M Merzouki, P Drogui, and B Sellamuthu. Salts re-
tention by nanofiltration membranes: Physicochemical and hydrodynamic ap-
proaches and modeling. Desalination, 277:106–112, August 2011.
[123] K Boussu, Y Zhang, J Cocquyt, P Van der Meeren, A Volodin, C Van Hae-
sendonck, J A Martens, and B Van der Bruggen. Characterization of polymeric
nanofiltration membranes for systematic analysis of membrane performance.
Journal of Membrane Science, 278(1-2):418–427, July 2006.
[124] J J Lee. Removal of microcystin-LR from drinking water using adsorption and
membrane processes, PhD Thesis. Phd thesis, PhD Thesis, Ohio State Univer-
sity, 2009.
127

[125] Yeomin Yoon, Paul Westerhoff, Jaekyung Yoon, and Shane A Snyder. Removal
of 17B estradiol and fluoranthene by nanofiltration and ultrafiltration. Journal
of Environmental Engineering, 130:1460–1467, 2004.
[126] X Ren, C Zhao, S Du, T Wang, Z Luan, J Wang, and D Hou. Fabrication
of asymmetric poly (m-phenylene isophthalamide) nanofiltration membrane for
chromium(VI) removal. Journal of Environmental Sciences, 22(9):1335–1341,
2010.
[127] David Norberg, Seungkwan Hong, James Taylor, and Yu Zhao. Surface char-
acterization and performance evaluation of commercial fouling resistant low-
pressure RO membranes. Desalination, 202:45–52, 2007.
[128] P Xu and J E Drewes. Viability of nanofiltration and ultra-low pressure reverse
osmosis membranes for multi-beneficial use of methane produced water. Sepa-
ration and Purification Technology, 52:67–76, November 2006.
[129] Yongki Shim, Hong-Joo Lee, Sangyoup Lee, Seung-Hyeon Moon, and Jaeweon
Cho. Effects of natural organic matter and ionic species on membrane surface
charge. Environmental science technology, 36:3864–3871, 2002.
[130] O C Nieto. Quantitative characterization of physico-chemical properties of the
active layers of reverse osmosis and nanofiltration membranes, and their rela-
tion to membrane performance. PhD thesis, PhD Thesis, University of Illinois
at urbana-champaign, 2010.
[131] K P Ishida, R Bold, and D W Phipps Jr. Identification and evaluation of unique
chemicals for optimum membrane compatibility and improved cleaning efi-
ciency. Technical Report April, Orange County Water District, Final Report,
Orange County Water District, Fountain Valley, CA, 2005.
128

[132] Roy Bernstein, Sofia Belfer, and Viatcheslav Freger. Bacterial attachment to
RO membranes surface-modified by concentration-polarization-enhanced graft
polymerization. Environmental science & technology, 45:5973–5980, July
2011.
[133] F Fadhillah, S M J Zaidi, Z Khan, M M Khaled, F Rahman, and P T Hammond.
Development of polyelectrolyte multilayer thin film composite membrane for
water desalination application. Desalination, 318:19–24, June 2013.
[134] Chuyang Y Tang, Young-Nam Kwon, and James O Leckie. Effect of membrane
chemistry and coating layer on physiochemical properties of thin film composite
polyamide RO and NF membranes. Desalination, 242:168–182, June 2009.
[135] M Hesampoura, J Tanninen, S Reinikainen, S Platt, and M Nystrom. Nanofiltra-
tion of single and mixed salt solutions: Analysis of results using principal com-
ponent analysis (PCA). chemical engineering research and design, 88:1569–
1579, 2010.
[136] J. Tanninen, M Manttari, and M Nystrom. Effect of salt mixture concentration
on fractionation with NF membranes. Journal of Membrane Science, 283:57–
64, 2006.
[137] Andrea J C Semiao and Andrea I Schafer. Removal of adsorbing estrogenic mi-
cropollutants by nanofiltration membranes. Part AExperimental evidence. Jour-
nal of Membrane Science, 431:244–256, March 2013.
[138] A Simon, L Nghiem, P Le-Clech, S J Khan, and J E Drewes. Effects of
membrane degradation on the removal of pharmaceutically active compounds
(PhACs) by NF/RO filtration processes. Journal of Membrane Science, 340:16–
25, September 2009.
129

[139] Laia Llenas, Xavier Martınez-Llado, Andriy Yaroshchuk, Miquel Rovira, and
Joan de Pablo. Nanofiltration as pretreatment for scale prevention in seawater
reverse osmosis desalination. Desalination and Water Treatment, 36(1-3):310–
318, December 2011.
[140] S Alzahrani, A Mohammad, N Hilal, P Abdullah, and O Jaafar. Identification
of foulants, fouling mechanisms and cleaning efficiency for NF and RO treat-
ment of produced water. Separation and Purification Technology, 118:324–341,
October 2013.
[141] N Park, B Kwon, I S Kim, and J Cho. Biofouling potential of various NF
membranes with respect to bacteria and their soluble microbial products (SMP):
characterizations, ux decline, and transport parameters. Journal of Membrane
Science, 258:43–54, 2005.
[142] Yi Mo, J Chen, W Xue, and X Huang. Chemical cleaning of nanofiltration
membrane filtrating the effluent from a membrane bioreactor. Separation and
Purification Technology, 75:407–414, November 2010.
[143] V G J Rodgers and R E Sparks. Effect of transmembrane pressure pulsing on
concentration polarization. Journal of Membrane Science, 68(1-2):149–168,
April 1992.
[144] Long D. Nghiem and Simon Hawkes. Effects of membrane fouling on the
nanofiltration of trace organic contaminants. Desalination, 236(1-3):273–281,
January 2009.
[145] Role of Weak Acid Cation Resin in Water Treatment.
[146] Darrell A Patterson, Lay Yen Lau, Chayaporn Roengpithya, Emma J. Gibbins,
and Andrew G. Livingston. Membrane selectivity in the organic solvent nanofil-
tration of trialkylamine bases. Desalination, 218:248–256, January 2008.
130
[147] Eric M Vrijenhoek, Seungkwan Hong, and Menachem Elimelech. Influence of
membrane surface properties on initial rate of colloidal fouling of reverse osmo-
sis and nanofiltration membranes. Journal of Membrane Science, 188(1):115–
128, 2001.
[148] B B Gupta, P Blanpain, and M Y Jaffrm. Permeate flux enhancement by pres-
sure and flow pulsations in microfiltration with mineral membranes. Journal of
Membrane Science, 70:257–266, 1992.
[149] K Abel. Influence of oscillatory flows on protein ultrafiltration. Journal of
Membrane Science, 133(1):39–55, September 1997.
[150] N D Nikolov, V Mavrov, and J D Nikolova. Ultrafiltration in a tubular mem-
brane under simultaneous action of pulsating pressures in permeate and feed
solution. Journal of Membrane Science, 83:167–172, 1993.
[151] R J Wakeman and C J Williams. Additional techniques to improve microfiltra-
tion. Separation and Purification Technology, 26(1):3–18, January 2002.
[152] O Gundogdu, M A Koenders, R J Wakeman, and P Wu. Permeation through a
bed on a vibrating medium: theory and experimental results. Chemical Engi-
neering Science, 58(9):1703–1713, May 2003.
[153] S Muthukumaran, S Kentish, M Ashokkumar, and G Stevens. Mechanisms for
the ultrasonic enhancement of dairy whey ultrafiltration. Journal of Membrane
Science, 258(1-2):106–114, August 2005.
[154] Marcos R Guilherme, Gilsinei M Campese, Eduardo Radovanovic, Adley F Ru-
bira, Elias B Tambourgi, and Edvani C Muniz. Thermo-responsive sandwiched-
like membranes of IPN-PNIPAAm/PAAm hydrogels. Journal of Membrane
Science, 275(1-2):187–194, April 2006.
131
[155] Chuyang Y. Tang, Young-Nam Kwon, and James O. Leckie. Fouling of reverse
osmosis and nanofiltration membranes by humic acidEffects of solution com-
position and hydrodynamic conditions. Journal of Membrane Science, 290(1-
2):86–94, March 2007.
[156] Chuyang Y Tang, Young-Nam Kwon, and James O Leckie. Characterization of
humic acid fouled reverse osmosis and nanofiltration membranes by transmis-
sion electron microscopy and streaming potential measurements. Environmental
Science & Technology, 41(3):942–949, February 2007.
[157] Yi-Ning Wang and Chuyang Y Tang. Nanofiltration membrane fouling by
oppositely charged macromolecules: investigation on flux behavior, foulant
mass deposition, and solute rejection. Environmental Science & Technology,
45(20):8941–7, October 2011.
[158] D Violleau, H Essis-tome, H Habarou, J P Croud, and M Pontid. Fouling studies
of a polyamide nanofiltration membrane by selected natural organic matter : an
analytical approach. Desalination, 173:223–238, 2005.
[159] Jaeweon Cho, Gary Amy, and John Pellegrino. Membrane filtration of natural
organic matter: comparison of flux decline, NOM rejection, and foulants during
filtration with three UF membranes. Desalination, 127(3):283–298, February
2000.
[160] A E Childress and M Elimelech. Effect of solution chemistry on the surface
charge of polymeric reverse osmosis and nanofiltration membranes. Journal of
Membrane Science, 119(2):253–268, 1996.
[161] R D Cohen and R F Probstein. Colloidal fouling of reverse osmosis membranes.
Journal of Colloid and Interface Science, 114(1):194–207, 1986.
132

[162] Menachem Elimelech, Xiaohua Zhu, Amy E. Childress, and Seungkwan Hong.
Role of membrane surface morphology in colloidal fouling of cellulose acetate
and composite aromatic polyamide reverse osmosis membranes. Journal of
Membrane Science, 127(1):101–109, 1997.
[163] Sangyoup Lee, Jaeweon Cho, and Menachem Elimelech. Influence of colloidal
fouling and feed water recovery on salt rejection of RO and NF membranes.
Desalination, 160:1–12, 2004.
[164] Long D. Nghiem and Poppy J. Coleman. NF/RO filtration of the hydropho-
bic ionogenic compound triclosan: Transport mechanisms and the influence of
membrane fouling. Separation and Purification Technology, 62(3):709–716,
September 2008.
[165] Arza Seidel and Menachem Elimelech. Coupling between chemical and phys-
ical interactions in natural organic matter ( NOM ) fouling of nanofiltration
membranes : implications for fouling control. Journal of Membrane Science,
203:245–255, 2002.
[166] W E I Yuan and Andrew L Zydney. Humic acid fouling during ultrafiltration.
Environmental Science & Technology, 34(23):5043–5050, 2000.
[167] Lianfa Song and Menachem Elimelech. Particle deposition onto a permeable
surface in laminar flow. Journal of Colloid and Interface Science, 173:165–
180, 1995.
[168] C Combe, E Molis, P Lucas, R Riley, and M M Clark. The effect of CA mem-
brane properties on adsorptive fouling by humic acid. Journal of Membrane
Science, 154(1):73–87, March 1999.
133

[169] E. M V Hoek and M. Elimelech. Cake-enhanced concentration polarization : A
new fouling mechanism for salt-rejecting membranes. Environmental Science
and Technology, 37(24):5581–5588, 2003.
[170] Moshe Herzberg, Seoktae Kang, and Menachem Elimelech. Role of extracel-
lular polymeric substances (EPS) in biofouling of reverse osmosis membranes.
Environmental Science & Technology, 43(12):4393–4398, June 2009.
[171] Abhijit Maiti, Mohtada Sadrezadeh, Subhayan Guha Thakurta, David J. Pernit-
sky, Subir Bhattacharjee, and Mohtada Sadrzadeh. Characterization of boiler
blowdown water from steam-assisted gravity drainage and silicaorganic copre-
cipitation during acidification and ultrafiltration. Energy & Fuels, 26(9):5604–
5612, September 2012.
[172] Hasan Guleryuz, Ingeborg Kaus, Claudine Filiatre, Tor Grande, and Mari-Ann
Einarsrud. Deposition of silica thin films formed by solgel method. Journal of
Sol-Gel Science and Technology, 54(2):249–257, March 2010.
[173] K Rezwan, a R Studart, J Voros, and L J Gauckler. Change of zeta poten-
tial of biocompatible colloidal oxide particles upon adsorption of bovine serum
albumin and lysozyme. The Journal of Physical Chemistry. B, 109(30):14469–
14474, August 2005.
[174] Margarida Ribau Teixeira and Maria Jo Rosa. pH adjustment for seasonal con-
trol of UF fouling by natural waters. Desalination, 151:165–175, 2002.
[175] Douglas B Burns and Andrew L Zydney. Buffer effects on the zeta potential
of ultrafiltration membranes. Journal of Membrane Science, 172(September
1999):39–48, 2000.
134

[176] Menachem Elimelech and Amy E. Childress. Zeta potential of reverse osmosis
membranes: Implications for membrane performance. Technical Report De-
cember, University of California, Los Angeles, 1996.
[177] D Elzo, I Huisman, E Middelink, and V Gekas. Charge effects on inorganic
membrane performance in a cross-flow microfiltration process. Colloids and
Surfaces A: Physicochemical and Engineering Aspects, 138:145–159, 1998.
[178] F.L. Hua, Y.F. Tsang, Y.J. Wang, S.Y. Chan, H. Chua, and S.N. Sin. Perfor-
mance study of ceramic microfiltration membrane for oily wastewater treat-
ment. Chemical Engineering Journal, 128(2-3):169–175, April 2007.
[179] Alberto Lobo, Angel Cambiella, Jose Manuel Benito, Carmen Pazos, and Jose
Coca. Ultrafiltration of oil-in-water emulsions with ceramic membranes: In-
fluence of pH and crossflow velocity. Journal of Membrane Science, 278(1-
2):328–334, July 2006.
[180] Wen Chen, Paul Westerhoff, Jerry A Leenheer, and Karl Booksh. Fluorescence
excitation-emission matrix regional integration to quantify spectra for dissolved
organic matter. Environmental Science & Technology, 37(24):5701–5710, De-
cember 2003.
[181] Y Bessiere, B Jefferson, E Goslan, and P Bacchin. Effect of hydrophilic/hy-
drophobic fractions of natural organic matter on irreversible fouling of mem-
branes. Desalination, 249(1):182–187, November 2009.
[182] B A Farnand and T A Krug. Oil removal from oilfield produced water by cross
flow ultrafiltration. Journal of Canadian Petroleum Technology, 28(6):18–24,
2000.
[183] Ron S Faibish and Yoram Cohen. Fouling and rejection behavior of ceramic and
polymer-modified ceramic membranes for ultrafiltration of oil-in-water emul-
135
sions and microemulsions. Colloids and Surfaces A: Physicochemical and En-
gineering Aspects, 191(1-2):27–40, October 2001.
[184] Q Li and M Elimelech. Natural organic matter fouling and chemical cleaning
of nanofiltration membranes. Water Science and Technology: Water Supply,
4(5-6):245–251, 2004.
[185] T Rizwan and S Bhattacharjee. Initial deposition of colloidal particles on a
rough nanofiltration membrane. Canadian Journal of Chemical Engineering,
85(5):570–579, 2007.
[186] Md. Abdullah-Al Mamun. Colloidal fouling of salt rejecting nanofiltration
membranes: Transient electrokinetic model and experimental study. Msc thesis,
University of Alberta, 2012.
[187] Nicole C Mueller, Bart van der Bruggen, Volkmar Keuter, Patricia Luis, Thomas
Melin, Wouter Pronk, Robert Reisewitz, David Rickerby, Gilbert M Rios, Wilco
Wennekes, and Bernd Nowack. Nanofiltration and nanostructured membranes–
should they be considered nanotechnology or not? Journal of Hazardous Ma-
terials, 211-212:275–280, April 2012.
[188] L D Nghiem and S Hawkes. Effects of membrane fouling on the nanofiltration
of pharmaceutically active compounds (PhACs): Mechanisms and role of mem-
brane pore size. Separation and Purifcation Technology, 57:176–184, 2007.
[189] James L Weishaar, George R Aiken, Brian a Bergamaschi, Miranda S Fram,
Roger Fujii, and Kenneth Mopper. Evaluation of specific ultraviolet absorbance
as an indicator of the chemical composition and reactivity of dissolved or-
ganic carbon. Environmental Science & Technology, 37(20):4702–4708, Oc-
tober 2003.
136

[190] Hiroshi Yamamura, Kenji Okimoto, Katsuki Kimura, and Yoshimasa Watan-
abe. Influence of calcium on the evolution of irreversible fouling in micro-
filtration/ultrafiltration membranes. Journal of Water Supply: Research and
TechnologyAQUA, 56(67):425–434, 2007.
[191] Sangyoup Lee, Jaeweon Cho, and Menachem Elimelech. Combined influence
of natural organic matter (NOM) and colloidal particles on nanofiltration mem-
brane fouling. Journal of Membrane Science, 262(1-2):27–41, October 2005.
[192] C Tang, Y Kwon, and J Leckie. Probing the nano- and micro-scales of re-
verse osmosis membranesA comprehensive characterization of physiochemical
properties of uncoated and coated membranes by XPS, TEM, ATR-FTIR, and
streaming potential measurements. Journal of Membrane Science, 287(1):146–
156, January 2007.
[193] M J Ariza, J Benavente, E Rodrıguez-Castellon, and L Palacio. Effect of hy-
dration of polyamide membranes on the surface electrokinetic parameters: sur-
face characterization by x-ray photoelectronic spectroscopy and atomic force
microscopy. Journal of Colloid and Interface Science, 247(1):149–58, March
2002.
[194] Ashish Kulkarni, Debabrata Mukherjee, and William N. Gill. Flux enhancement
by hydrophilization of thin film composite reverse osmosis membranes. Journal
of Membrane Science, 114(1):39–50, May 1996.
137