translational chickpea genomics consortium to accelerate
TRANSCRIPT
plants
Article
Translational Chickpea Genomics Consortium to AccelerateGenetic Gains in Chickpea (Cicer arietinum L.)
Ramesh Palakurthi 1, Veera Jayalakshmi 2, Yogesh Kumar 3, Pawan Kulwal 4 , Mohammad Yasin 5,Nandkumar Surendra Kute 4, Chinchole Laxuman 6, Sharanabasappa Yeri 6 , Anilkumar Vemula 1,Abhishek Rathore 1 , Srinivasan Samineni 1 , Khela Ram Soren 3 , Biswajit Mondal 3, Girish Prasad Dixit 3,Chellapilla Bharadwaj 7, Sushil K. Chaturvedi 3,8, Pooran M. Gaur 1 , Manish Roorkiwal 1 ,Mahendar Thudi 1,9,* , Narendra P. Singh 3,* and Rajeev K. Varshney 1,10,*
�����������������
Citation: Palakurthi, R.; Jayalakshmi,
V.; Kumar, Y.; Kulwal, P.; Yasin, M.;
Kute, N.S.; Laxuman, C.; Yeri, S.;
Vemula, A.; Rathore, A.; et al.
Translational Chickpea Genomics
Consortium to Accelerate Genetic
Gains in Chickpea (Cicer arietinum L.).
Plants 2021, 10, 2583. https://
doi.org/10.3390/plants10122583
Academic Editors: Umesh K. Reddy,
Suhas Shinde, Padma Nimmakayala
and Purushothaman Natarajan
Received: 2 September 2021
Accepted: 30 October 2021
Published: 25 November 2021
Publisher’s Note: MDPI stays neutral
with regard to jurisdictional claims in
published maps and institutional affil-
iations.
Copyright: © 2021 by the authors.
Licensee MDPI, Basel, Switzerland.
This article is an open access article
distributed under the terms and
conditions of the Creative Commons
Attribution (CC BY) license (https://
creativecommons.org/licenses/by/
4.0/).
1 International Crops Research Institute for the Semi-Arid Tropics (ICRISAT), Patancheru 502324, India;[email protected] (R.P.); [email protected] (A.V.); [email protected] (A.R.);[email protected] (S.S.); [email protected] (P.M.G.); [email protected] (M.R.)
2 Regional Agricultural Research Station (RARS), Acharya N.G. Ranga Agricultural University (ANGRAU),Nandyal 518501, India; [email protected]
3 ICAR-Indian Institute of Pulses Research (IIPR), Kanpur 208024, India; [email protected] (Y.K.);[email protected] (K.R.S.); [email protected] (B.M.); [email protected] (G.P.D.);[email protected] (S.K.C.)
4 Department Agricultural Botany, Mahatma Phule Krishi Vidyapeeth (MPKV), Rahuri 413722, India;[email protected] (P.K.); [email protected] (N.S.K.)
5 RAK College of Agriculture (RAKCA), Rajmata Vijayaraje Scindia Krishi Vishwa Vidyalaya (RVSKVV),Sehore 466001, India; [email protected]
6 Agricultural Research Station (ARS), University of Agricultural Sciences (UAS), Raichur 584104, India;[email protected] (C.L.); [email protected] (S.Y.)
7 Division of Genetics, ICAR-Indian Agricultural Research Institute (IARI), Delhi 110012, India;[email protected]
8 College of Agriculture, Rani Lakshmi Bai Central Agricultural University, Jhansi 284003, India9 Department of Agricultural Biotechnology and Molecular Biology, Dr. Rajendra Prasad Central Agricultural
University (RPCAU), Pusa 848125, India10 State Agricultural Biotechnology Centre, Centre for Crop and Food Innovation, Food Futures Institute,
Murdoch University, Murdoch, WA 6150, Australia* Correspondence: [email protected] (M.T.); [email protected] (N.P.S.);
[email protected] (R.K.V.)
Abstract: The Translational Chickpea Genomics Consortium (TCGC) was set up to increase theproduction and productivity of chickpea (Cicer arietinum L.). It represents research institutes fromsix major chickpea growing states (Madhya Pradesh, Maharashtra, Andhra Pradesh, Telangana,Karnataka and Uttar Pradesh) of India. The TCGC team has been engaged in deploying moderngenomics approaches in breeding and popularizing improved varieties in farmers’ fields across thestates. Using marker-assisted backcrossing, introgression lines with enhanced drought toleranceand fusarium wilt resistance have been developed in the genetic background of 10 elite varieties ofchickpea. Multi-location evaluation of 100 improved lines (70 desi and 30 kabuli) during 2016–2017and 2018–2019 enabled the identification of top performing desi and kabuli lines. In total, 909 FarmerParticipatory Varietal Selection trials were conducted in 158 villages in 16 districts of the five states,during 2017–2018, 2018–2019, and 2019–2020, involving 16 improved varieties. New molecularbreeding lines developed in different genetic backgrounds are potential candidates for national trialsunder the ICAR-All India Coordinated Research Project on Chickpea. The comprehensive efforts ofTCGC resulted in the development and adoption of high-yielding varieties that will increase chickpeaproductivity and the profitability of chickpea growing farmers.
Keywords: chickpea; marker assisted backcross; farmer participatory varietal selection; multi-location trials; drought; Fusarium wilt
Plants 2021, 10, 2583. https://doi.org/10.3390/plants10122583 https://www.mdpi.com/journal/plants
Plants 2021, 10, 2583 2 of 13
1. Introduction
Chickpea (Cicer arietinum L.; 2x = 2n = 16) is an important food legume crop cultivatedon 13.72 M ha with a total production of 14.25 M t [1]. Although India is the largest producerof chickpea, it imports large quantities from Australia (83.5%), USA (3.8%), Myanmar(3.5%), Tanzania (3.3%), and Sudan (2.1%) to meet local demand (http://agricoop.nic.in/sites/default/files/Pulses%20profie_Mar%2C%202019_0.pdf; Last accessed on 25 July2021). In terms of production in India, Madhya Pradesh ranks first, contributing 33.99%of the area and 40.92% of production, followed by Maharashtra, Rajasthan, Karnataka,Andhra Pradesh and Uttar Pradesh (http://dpd.gov.in/Annual%20Report%202017-18.pdf;Last accessed on 25 July 2021). Limited genetic diversity coupled with climate changeduring recent years has increased the frequency and severity of biotic and abiotic stressesand emerging diseases that are serious threats to chickpea production [2–4]. In order toachieve the crop’s actual yield potential, it is essential to enhance its genetic diversity andresistance/tolerance to biotic and abiotic stresses in the varieties grown by farmers.
Modern breeding technologies have proven useful in developing superior varietiesin crops such as maize, rice, wheat, barley and soybean [5]. This was not the case inchickpea until recently, primarily due to limited information on genes and the ability todeploy genomics tools. In recent years, the tremendous progress made in developingnovel genomic tools in chickpea, such as the draft genome sequence [6], several millionsof SNP markers from whole genome sequence information on germplasm lines [7–9] andcost-effective genotyping platforms including low- to high-density SNP arrays [10,11].Likewise, QTLs and markers associated with abiotic stresses like drought [12–15], heat [16]and salinity [17], and biotic stresses like fusarium wilt (FW) [18,19] and Ascochyta blight(AB) [18,20] are available for chickpea improvement. These have facilitated marker-assistedselection/introgression in chickpea breeding programs. Marker-assisted backcrossing(MABC) approach has been successfully deployed to develop superior varieties in thecrop [21].
Once the chickpea genome sequence was available, the Department of Agriculture &Farmers Welfare (DA & FW) encouraged a consortium approach to translate this knowledgeto enhance chickpea improvement through funding support. As a result, the TranslationalChickpea Genomics Consortium (TCGC) was established in 2016, comprising six researchinstitutions/agricultural universities from six major chickpea growing states of India:International Crops Research Institute for the Semi-Arid Tropics (ICRISAT), Hyderabad,Telangana; Regional Agricultural Research Station (RARS), Nandyal, Andhra Pradesh;Agricultural Research Station (ARS), Kalaburagi, University of Agricultural Sciences (UAS),Raichur, Karnataka; RAK College of Agriculture (RAKCA), Rajmata Vijayaraje ScindiaKrishi Vishwa Vidyalaya (RVSKVV), Sehore, Madhya Pradesh; Mahatma Phule KrishiVidyapeeth (MPKV), Rahuri, Maharashtra; and Indian Institute of Pulses Research (ICAR-IIPR), Kanpur, Uttar Pradesh. These research institutions are very well catering needsof the almost 80% of the chickpea area in India. The consortium’s major focus has beenon deploying genomics information for chickpea improvement, developing/identifyingimproved varieties and enhancing the adoption of superior lines in farmers’ fields. Duringthe past five years, TCGC has made significant progress that has involved: (a) deploymentof genomics-assisted breeding in 10 chickpea varieties for drought tolerance and fusariumwilt resistance; (b) evaluation of 100 improved elite breeding lines (70 desi and 30 kabuli)for their performance in multi-location trials and (c) demonstration of improved cropvarieties in 909 farmers’ fields across 158 villages spanning 16 districts in the states ofAndhra Pradesh, Karnataka, Madhya Pradesh, Maharashtra and Uttar Pradesh. Thispaper reports on the significant achievements of the TCGC that can guide future chickpeaimprovement programs and lead to the development and popularization of improvedvarieties in important regions where the crop is grown in India.
Plants 2021, 10, 2583 3 of 13
2. Materials and Methods2.1. Marker-Assisted Backcrossing for Drought Tolerance and Fusarium wilt Resistance
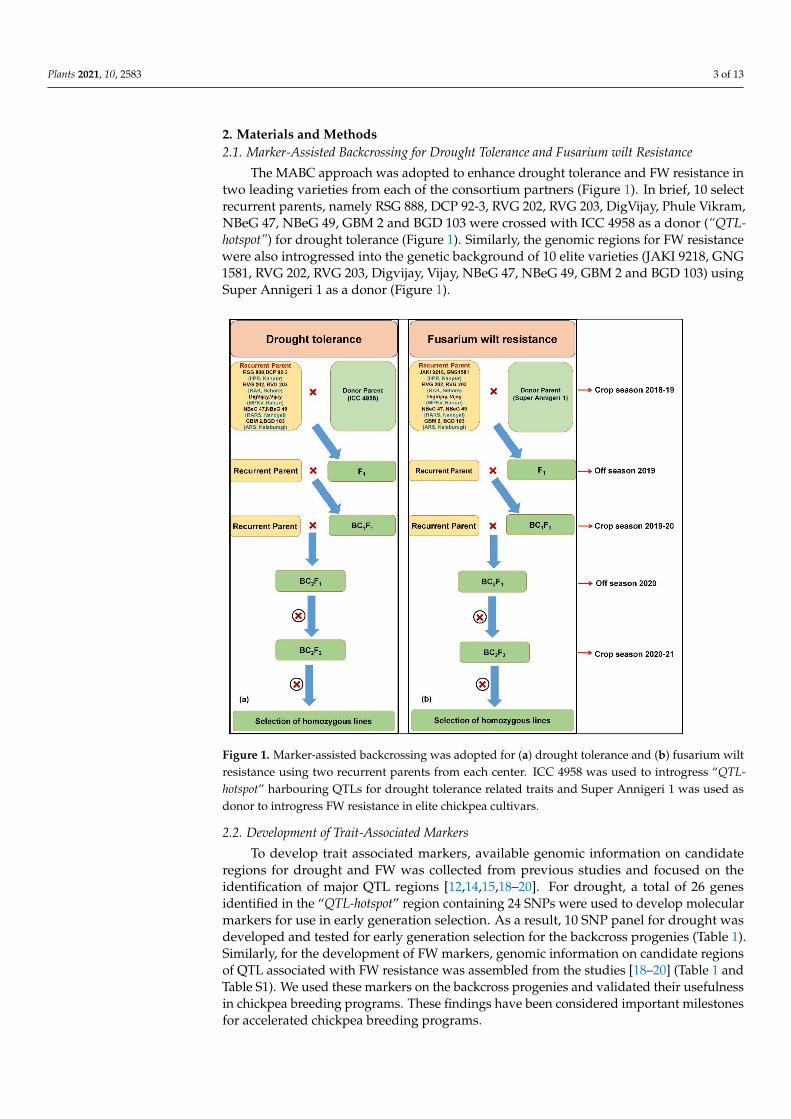
The MABC approach was adopted to enhance drought tolerance and FW resistance intwo leading varieties from each of the consortium partners (Figure 1). In brief, 10 selectrecurrent parents, namely RSG 888, DCP 92-3, RVG 202, RVG 203, DigVijay, Phule Vikram,NBeG 47, NBeG 49, GBM 2 and BGD 103 were crossed with ICC 4958 as a donor (“QTL-hotspot”) for drought tolerance (Figure 1). Similarly, the genomic regions for FW resistancewere also introgressed into the genetic background of 10 elite varieties (JAKI 9218, GNG1581, RVG 202, RVG 203, Digvijay, Vijay, NBeG 47, NBeG 49, GBM 2 and BGD 103) usingSuper Annigeri 1 as a donor (Figure 1).
Figure 1. Marker-assisted backcrossing was adopted for (a) drought tolerance and (b) fusarium wiltresistance using two recurrent parents from each center. ICC 4958 was used to introgress “QTL-hotspot” harbouring QTLs for drought tolerance related traits and Super Annigeri 1 was used asdonor to introgress FW resistance in elite chickpea cultivars.
2.2. Development of Trait-Associated Markers
To develop trait associated markers, available genomic information on candidateregions for drought and FW was collected from previous studies and focused on theidentification of major QTL regions [12,14,15,18–20]. For drought, a total of 26 genesidentified in the “QTL-hotspot” region containing 24 SNPs were used to develop molecularmarkers for use in early generation selection. As a result, 10 SNP panel for drought wasdeveloped and tested for early generation selection for the backcross progenies (Table 1).Similarly, for the development of FW markers, genomic information on candidate regionsof QTL associated with FW resistance was assembled from the studies [18–20] (Table 1 andTable S1). We used these markers on the backcross progenies and validated their usefulnessin chickpea breeding programs. These findings have been considered important milestonesfor accelerated chickpea breeding programs.
Plants 2021, 10, 2583 4 of 13
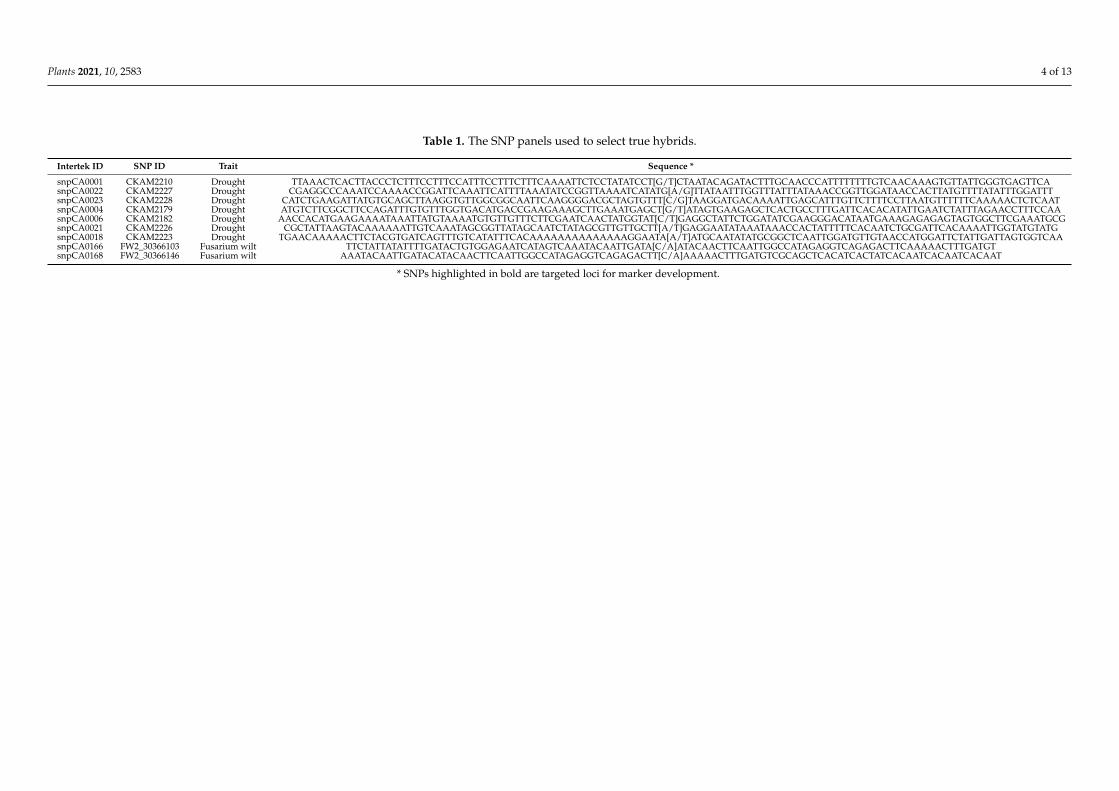
Table 1. The SNP panels used to select true hybrids.
Intertek ID SNP ID Trait Sequence *
snpCA0001 CKAM2210 Drought TTAAACTCACTTACCCTCTTTCCTTTCCATTTCCTTTCTTTCAAAATTCTCCTATATCCT[G/T]CTAATACAGATACTTTGCAACCCATTTTTTTTGTCAACAAAGTGTTATTGGGTGAGTTCAsnpCA0022 CKAM2227 Drought CGAGGCCCAAATCCAAAACCGGATTCAAATTCATTTTAAATATCCGGTTAAAATCATATG[A/G]TTATAATTTGGTTTATTTATAAACCGGTTGGATAACCACTTATGTTTTATATTTGGATTTsnpCA0023 CKAM2228 Drought CATCTGAAGATTATGTGCAGCTTAAGGTGTTGGCGGCAATTCAAGGGGACGCTAGTGTTT[C/G]TAAGGATGACAAAATTGAGCATTTGTTCTTTTCCTTAATGTTTTTTCAAAAACTCTCAATsnpCA0004 CKAM2179 Drought ATGTCTTCGGCTTCCAGATTTGTGTTTGGTGACATGACCGAAGAAAGCTTGAAATGAGCT[G/T]ATAGTGAAGAGCTCACTGCCTTTGATTCACACATATTGAATCTATTTAGAACCTTTCCAAsnpCA0006 CKAM2182 Drought AACCACATGAAGAAAATAAATTATGTAAAATGTGTTGTTTCTTCGAATCAACTATGGTAT[C/T]GAGGCTATTCTGGATATCGAAGGGACATAATGAAAGAGAGAGTAGTGGCTTCGAAATGCGsnpCA0021 CKAM2226 Drought CGCTATTAAGTACAAAAAATTGTCAAATAGCGGTTATAGCAATCTATAGCGTTGTTGCTT[A/T]GAGGAATATAAATAAACCACTATTTTTCACAATCTGCGATTCACAAAATTGGTATGTATGsnpCA0018 CKAM2223 Drought TGAACAAAAACTTCTACGTGATCAGTTTGTCATATTTCACAAAAAAAAAAAAAAGGAATA[A/T]ATGCAATATATGCGGCTCAATTGGATGTTGTAACCATGGATTCTATTGATTAGTGGTCAAsnpCA0166 FW2_30366103 Fusarium wilt TTCTATTATATTTTGATACTGTGGAGAATCATAGTCAAATACAATTGATA[C/A]ATACAACTTCAATTGGCCATAGAGGTCAGAGACTTCAAAAACTTTGATGTsnpCA0168 FW2_30366146 Fusarium wilt AAATACAATTGATACATACAACTTCAATTGGCCATAGAGGTCAGAGACTT[C/A]AAAAACTTTGATGTCGCAGCTCACATCACTATCACAATCACAATCACAAT
* SNPs highlighted in bold are targeted loci for marker development.
Plants 2021, 10, 2583 5 of 13
2.3. Multi-Location Trials for Promising Chickpea Lines
To identify the best performing lines across locations, 70 desi and 30 kabuli lines(including molecular breeding lines) were evaluated for their yield performance (kg/ha)during 2016–2017 and 2018–2019. Based on the availability of seed, multi-location trialswere conducted in three locations (Jabalpur, Nandyal and Sehore) during 2016–2017 andin five locations (Nandyal, Kalaburagi, Sehore, Rahuri and Kanpur) during 2018–2019.However, kabuli lines were not evaluated in Sehore and Kanpur locations during 2018–2019 owing to limited seed availability. Desi and kabuli lines were evaluated in an alphalattice design with 14 entries per block. A spacing of 30 cm × 10 cm (intra-row) and 4 m(inter-row) was adopted to evaluate desi lines and a spacing of 45 cm × 10 cm (intra-row) and 4 m (inter-row) was adopted for kabuli lines. Combined analysis of variance(ANOVA) was carried out using SAS mixed procedure [22] to test the significance ofmain and interaction effects of environments and genotypes, considering environment,genotype, replication and block as random effects. Individual environmental varianceswere modelled into combined analysis with REPEATED statement using REML (RestrictedMaximum Likelihood) method. Best Linear Unbiased Predictors (BLUPs) were calculatedfrom the combined analysis. To identify the best test environment and superior genotypewith high yield and stable performance across locations, GGE (genotype (G) + (genotype(G) × environment (E) interaction), a biplot analysis was done with the mean grain yielddata obtained from multi-location trials. Using SREG (Site regression), GGE biplots [23]were performed for significant interaction effects of district and variety (FPSV trials) andenvironment and genotype (desi and kabuli multi-environment trials) to draw conclusionson genotype and environment evaluations.
2.4. Varietal Adoption through Farmer Participatory Varietal Selection (FPVS) Trials
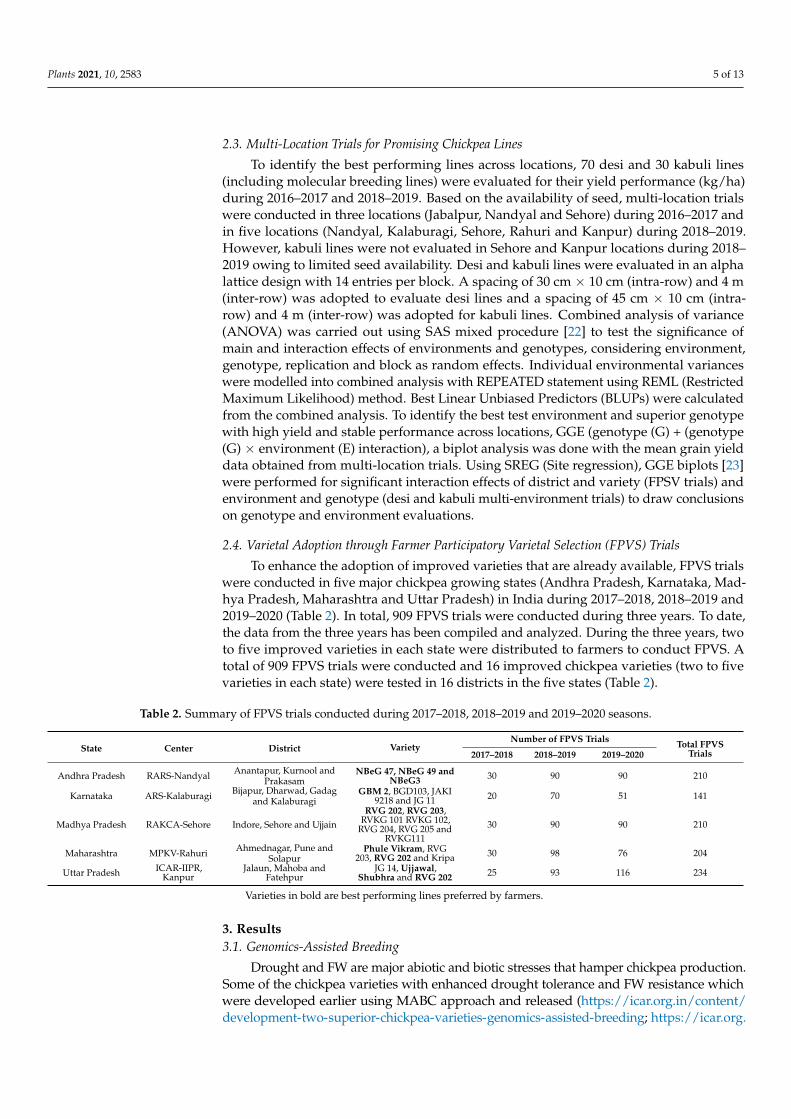
To enhance the adoption of improved varieties that are already available, FPVS trialswere conducted in five major chickpea growing states (Andhra Pradesh, Karnataka, Mad-hya Pradesh, Maharashtra and Uttar Pradesh) in India during 2017–2018, 2018–2019 and2019–2020 (Table 2). In total, 909 FPVS trials were conducted during three years. To date,the data from the three years has been compiled and analyzed. During the three years, twoto five improved varieties in each state were distributed to farmers to conduct FPVS. Atotal of 909 FPVS trials were conducted and 16 improved chickpea varieties (two to fivevarieties in each state) were tested in 16 districts in the five states (Table 2).
Table 2. Summary of FPVS trials conducted during 2017–2018, 2018–2019 and 2019–2020 seasons.
State Center District VarietyNumber of FPVS Trials Total FPVS
Trials2017–2018 2018–2019 2019–2020
Andhra Pradesh RARS-Nandyal Anantapur, Kurnool andPrakasam
NBeG 47, NBeG 49 andNBeG3 30 90 90 210
Karnataka ARS-Kalaburagi Bijapur, Dharwad, Gadagand Kalaburagi
GBM 2, BGD103, JAKI9218 and JG 11 20 70 51 141
Madhya Pradesh RAKCA-Sehore Indore, Sehore and UjjainRVG 202, RVG 203,
RVKG 101 RVKG 102,RVG 204, RVG 205 and
RVKG11130 90 90 210
Maharashtra MPKV-Rahuri Ahmednagar, Pune andSolapur
Phule Vikram, RVG203, RVG 202 and Kripa 30 98 76 204
Uttar Pradesh ICAR-IIPR,Kanpur
Jalaun, Mahoba andFatehpur
JG 14, Ujjawal,Shubhra and RVG 202 25 93 116 234
Varieties in bold are best performing lines preferred by farmers.
3. Results3.1. Genomics-Assisted Breeding
Drought and FW are major abiotic and biotic stresses that hamper chickpea production.Some of the chickpea varieties with enhanced drought tolerance and FW resistance whichwere developed earlier using MABC approach and released (https://icar.org.in/content/development-two-superior-chickpea-varieties-genomics-assisted-breeding; https://icar.org.
Plants 2021, 10, 2583 6 of 13
in/content/development-two-superior-chickpea-varieties-genomics-assisted-breeding;last accessed on 25 July 2021) [24–27] are already in the seed chain and have startedpaying dividends.
F1s were harvested at each center by crossing chosen recipient parents with ICC4958 as a donor (“QTL-hotspot”) for drought tolerance and with Super Annigeri 1 as adonor for FW resistance during 2018–2019. True hybrids were confirmed using 10 SNPpanel and two allele specific markers for the respective traits (Table 1 and Table S1 inSupplementary Materials). Subsequently, BC1F1 were obtained by crossing true F1s totheir respective recurrent parents during 2019–2020. At all centers, heterozygous plantswere used for subsequent backcrossing with respective recurrent parents, and BC2F1 seedswere harvested during the off season 2020. After foreground selection, positive BC2F1plants were selfed to generate BC2F2 seeds during crop season 2020–2021 (Table S2). Theback cross progenies after background selection needs further evaluation for their yieldperformance under drought.
3.2. Mean Performance and Stability of Elite Breeding Lines for Grain Yield inMulti-Location Trials
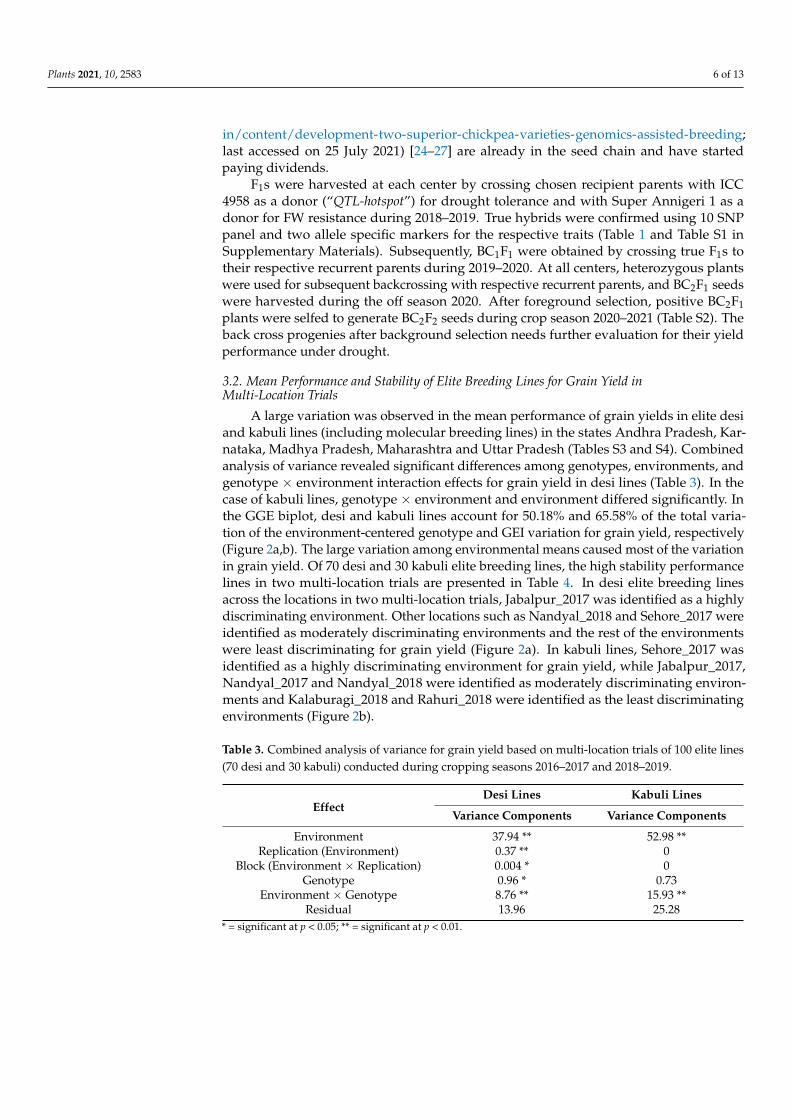
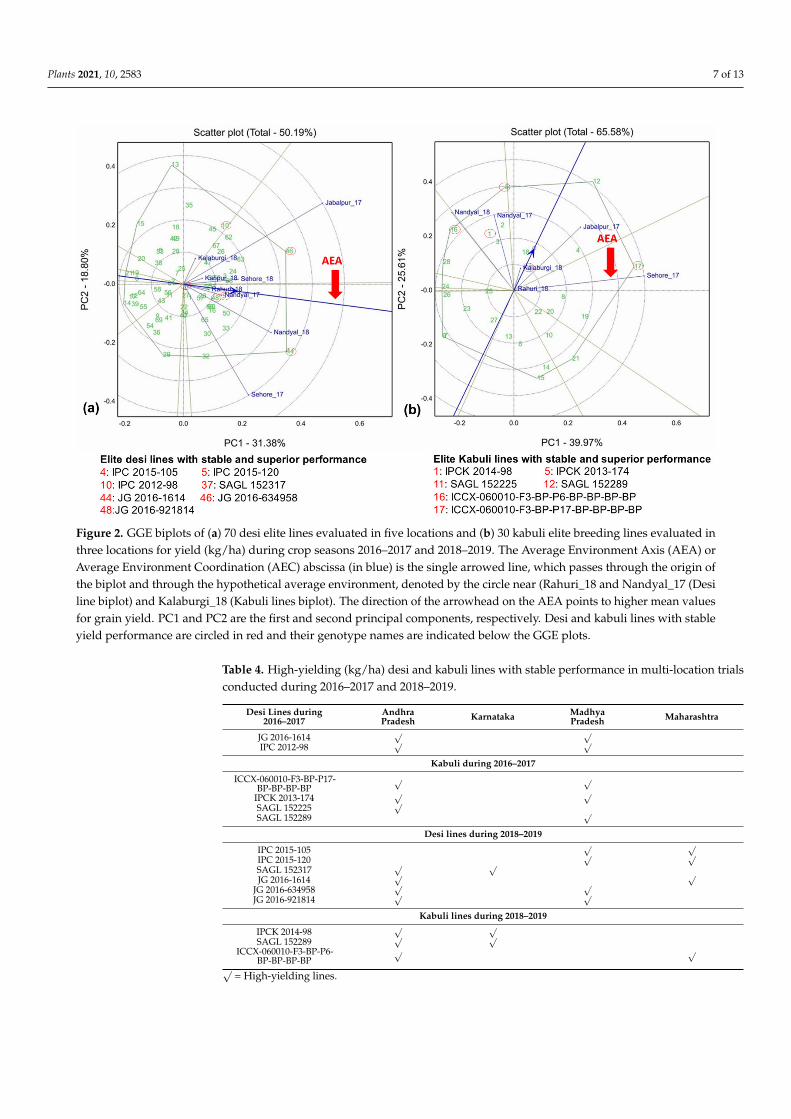
A large variation was observed in the mean performance of grain yields in elite desiand kabuli lines (including molecular breeding lines) in the states Andhra Pradesh, Kar-nataka, Madhya Pradesh, Maharashtra and Uttar Pradesh (Tables S3 and S4). Combinedanalysis of variance revealed significant differences among genotypes, environments, andgenotype × environment interaction effects for grain yield in desi lines (Table 3). In thecase of kabuli lines, genotype × environment and environment differed significantly. Inthe GGE biplot, desi and kabuli lines account for 50.18% and 65.58% of the total varia-tion of the environment-centered genotype and GEI variation for grain yield, respectively(Figure 2a,b). The large variation among environmental means caused most of the variationin grain yield. Of 70 desi and 30 kabuli elite breeding lines, the high stability performancelines in two multi-location trials are presented in Table 4. In desi elite breeding linesacross the locations in two multi-location trials, Jabalpur_2017 was identified as a highlydiscriminating environment. Other locations such as Nandyal_2018 and Sehore_2017 wereidentified as moderately discriminating environments and the rest of the environmentswere least discriminating for grain yield (Figure 2a). In kabuli lines, Sehore_2017 wasidentified as a highly discriminating environment for grain yield, while Jabalpur_2017,Nandyal_2017 and Nandyal_2018 were identified as moderately discriminating environ-ments and Kalaburagi_2018 and Rahuri_2018 were identified as the least discriminatingenvironments (Figure 2b).
Table 3. Combined analysis of variance for grain yield based on multi-location trials of 100 elite lines(70 desi and 30 kabuli) conducted during cropping seasons 2016–2017 and 2018–2019.
EffectDesi Lines Kabuli Lines
Variance Components Variance Components
Environment 37.94 ** 52.98 **Replication (Environment) 0.37 ** 0
Block (Environment × Replication) 0.004 * 0Genotype 0.96 * 0.73
Environment × Genotype 8.76 ** 15.93 **Residual 13.96 25.28
* = significant at p < 0.05; ** = significant at p < 0.01.
Plants 2021, 10, 2583 7 of 13
Figure 2. GGE biplots of (a) 70 desi elite lines evaluated in five locations and (b) 30 kabuli elite breeding lines evaluated inthree locations for yield (kg/ha) during crop seasons 2016–2017 and 2018–2019. The Average Environment Axis (AEA) orAverage Environment Coordination (AEC) abscissa (in blue) is the single arrowed line, which passes through the origin ofthe biplot and through the hypothetical average environment, denoted by the circle near (Rahuri_18 and Nandyal_17 (Desiline biplot) and Kalaburgi_18 (Kabuli lines biplot). The direction of the arrowhead on the AEA points to higher mean valuesfor grain yield. PC1 and PC2 are the first and second principal components, respectively. Desi and kabuli lines with stableyield performance are circled in red and their genotype names are indicated below the GGE plots.
Table 4. High-yielding (kg/ha) desi and kabuli lines with stable performance in multi-location trialsconducted during 2016–2017 and 2018–2019.
Desi Lines during2016–2017
AndhraPradesh Karnataka Madhya
Pradesh Maharashtra
JG 2016-1614√ √
IPC 2012-98√ √
Kabuli during 2016–2017
ICCX-060010-F3-BP-P17-BP-BP-BP-BP
√ √
IPCK 2013-174√ √
SAGL 152225√
SAGL 152289√
Desi lines during 2018–2019
IPC 2015-105√ √
IPC 2015-120√ √
SAGL 152317√ √
JG 2016-1614√ √
JG 2016-634958√ √
JG 2016-921814√ √
Kabuli lines during 2018–2019
IPCK 2014-98√ √
SAGL 152289√ √
ICCX-060010-F3-BP-P6-BP-BP-BP-BP
√ √
√= High-yielding lines.
Plants 2021, 10, 2583 8 of 13
3.3. Promising Desi Lines for Grain Yield Identified through Multi-Location Trials
Desi lines Phule G 0919-4-8 at Nandyal and SAGL 152210 at Sehore revealed yieldadvantage (6.02% and 24.15%) over the local checks across the years (Table S2). PhuleG 0914-8-14 at Rahuri and IPC 2008-11 at Kanpur recorded significant yield advantage(6.42% and 7.63%) compared to the local checks (Table S2). Importantly, JG 2016-634958at Jabalpur and SAGL 152278 at Kalaburagi demonstrated yield advantage (73.44% and109.48%) over the local checks. Across the locations and over the years, desi line JG 2016-1614 was identified as a superior line with high grain yield and high stability and a 2.6%yield advantage over the check (Table S3).
3.4. Promising Kabuli Lines for Grain Yield Identified through Multi-Location Trials
Kabuli lines IPCK 2013-152 at Nandyal exhibited a yield advantage (111%) over thelocal check across the years (Table S3). SAGL 152220 at Kalaburagi, ICCX-060010-F3-BP-P17-BP-BP-BP-BP at Sehore, IPCK 2012-129 at Rahuri and SAGL 152289 at Jabalpur alsorecorded higher grain yield and yield advantage (141.29%, 21.43%, 33.25% and 116.04%,respectively) over the local checks (Table S3). A total of 30 kabuli elite breeding lines andthree lines (ICCX-060010-F3-BP-P6-BP-BP-BP-BP, IPCK 2013-174 and SAGL 152289) havebeen identified as superior with higher grain yield and high stability and a 12.11–11.11%yield advantage over the national check (Vihar) across the locations and over the years(Table S4).
3.5. Enhancing Varietal Adoption through FPVS Trials
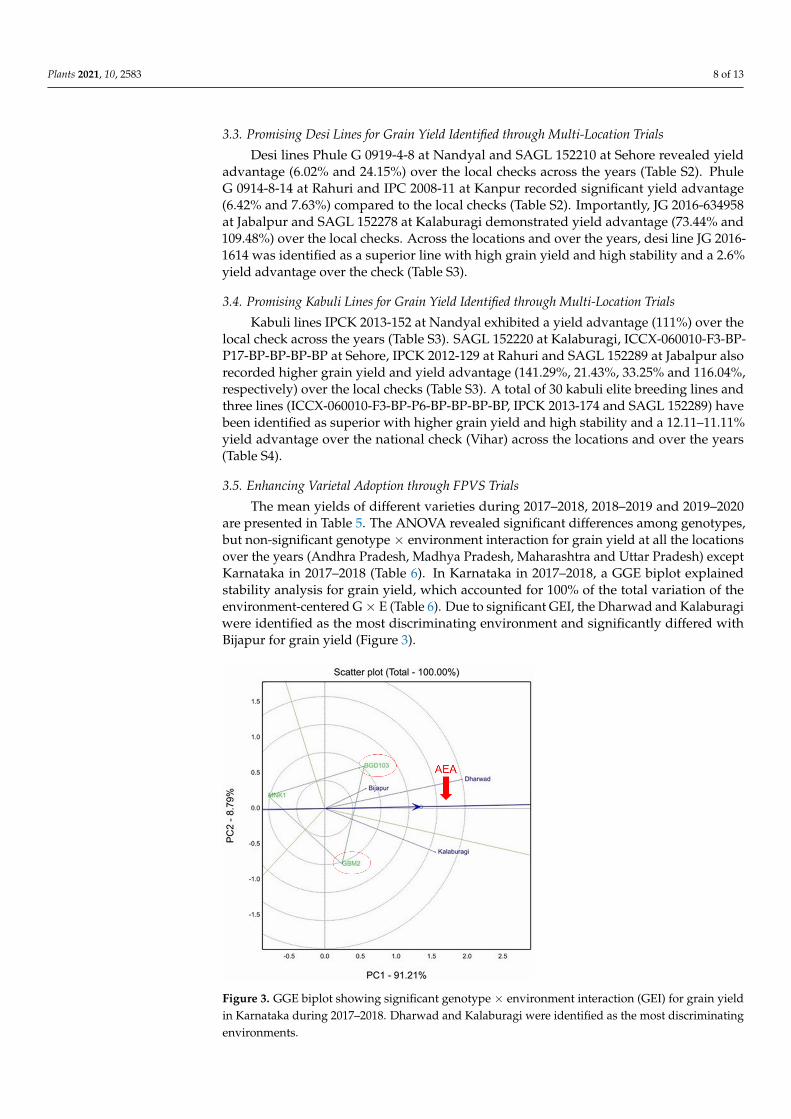
The mean yields of different varieties during 2017–2018, 2018–2019 and 2019–2020are presented in Table 5. The ANOVA revealed significant differences among genotypes,but non-significant genotype × environment interaction for grain yield at all the locationsover the years (Andhra Pradesh, Madhya Pradesh, Maharashtra and Uttar Pradesh) exceptKarnataka in 2017–2018 (Table 6). In Karnataka in 2017–2018, a GGE biplot explainedstability analysis for grain yield, which accounted for 100% of the total variation of theenvironment-centered G× E (Table 6). Due to significant GEI, the Dharwad and Kalaburagiwere identified as the most discriminating environment and significantly differed withBijapur for grain yield (Figure 3).
Figure 3. GGE biplot showing significant genotype × environment interaction (GEI) for grain yieldin Karnataka during 2017–2018. Dharwad and Kalaburagi were identified as the most discriminatingenvironments.
Plants 2021, 10, 2583 9 of 13
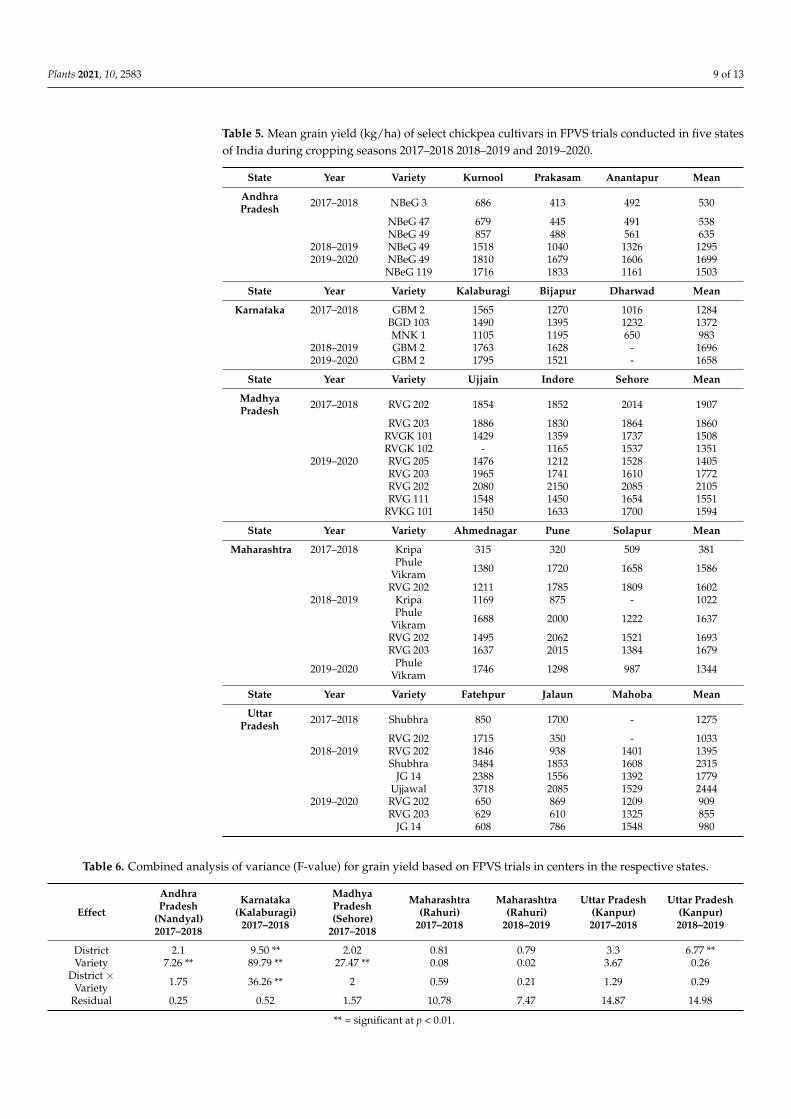
Table 5. Mean grain yield (kg/ha) of select chickpea cultivars in FPVS trials conducted in five statesof India during cropping seasons 2017–2018 2018–2019 and 2019–2020.
State Year Variety Kurnool Prakasam Anantapur Mean
AndhraPradesh 2017–2018 NBeG 3 686 413 492 530
NBeG 47 679 445 491 538NBeG 49 857 488 561 635
2018–2019 NBeG 49 1518 1040 1326 12952019–2020 NBeG 49 1810 1679 1606 1699
NBeG 119 1716 1833 1161 1503
State Year Variety Kalaburagi Bijapur Dharwad Mean
Karnataka 2017–2018 GBM 2 1565 1270 1016 1284BGD 103 1490 1395 1232 1372MNK 1 1105 1195 650 983
2018–2019 GBM 2 1763 1628 - 16962019–2020 GBM 2 1795 1521 - 1658
State Year Variety Ujjain Indore Sehore Mean
MadhyaPradesh 2017–2018 RVG 202 1854 1852 2014 1907
RVG 203 1886 1830 1864 1860RVGK 101 1429 1359 1737 1508RVGK 102 - 1165 1537 1351
2019–2020 RVG 205 1476 1212 1528 1405RVG 203 1965 1741 1610 1772RVG 202 2080 2150 2085 2105RVG 111 1548 1450 1654 1551
RVKG 101 1450 1633 1700 1594
State Year Variety Ahmednagar Pune Solapur Mean
Maharashtra 2017–2018 Kripa 315 320 509 381Phule
Vikram 1380 1720 1658 1586
RVG 202 1211 1785 1809 16022018–2019 Kripa 1169 875 - 1022
PhuleVikram 1688 2000 1222 1637
RVG 202 1495 2062 1521 1693RVG 203 1637 2015 1384 1679
2019–2020 PhuleVikram 1746 1298 987 1344
State Year Variety Fatehpur Jalaun Mahoba Mean
UttarPradesh 2017–2018 Shubhra 850 1700 - 1275
RVG 202 1715 350 - 10332018–2019 RVG 202 1846 938 1401 1395
Shubhra 3484 1853 1608 2315JG 14 2388 1556 1392 1779
Ujjawal 3718 2085 1529 24442019–2020 RVG 202 650 869 1209 909
RVG 203 629 610 1325 855JG 14 608 786 1548 980
Table 6. Combined analysis of variance (F-value) for grain yield based on FPVS trials in centers in the respective states.
Effect
AndhraPradesh
(Nandyal)2017–2018
Karnataka(Kalaburagi)
2017–2018
MadhyaPradesh(Sehore)
2017–2018
Maharashtra(Rahuri)
2017–2018
Maharashtra(Rahuri)
2018–2019
Uttar Pradesh(Kanpur)2017–2018
Uttar Pradesh(Kanpur)2018–2019
District 2.1 9.50 ** 2.02 0.81 0.79 3.3 6.77 **Variety 7.26 ** 89.79 ** 27.47 ** 0.08 0.02 3.67 0.26
District ×Variety 1.75 36.26 ** 2 0.59 0.21 1.29 0.29
Residual 0.25 0.52 1.57 10.78 7.47 14.87 14.98
** = significant at p < 0.01.
Plants 2021, 10, 2583 10 of 13
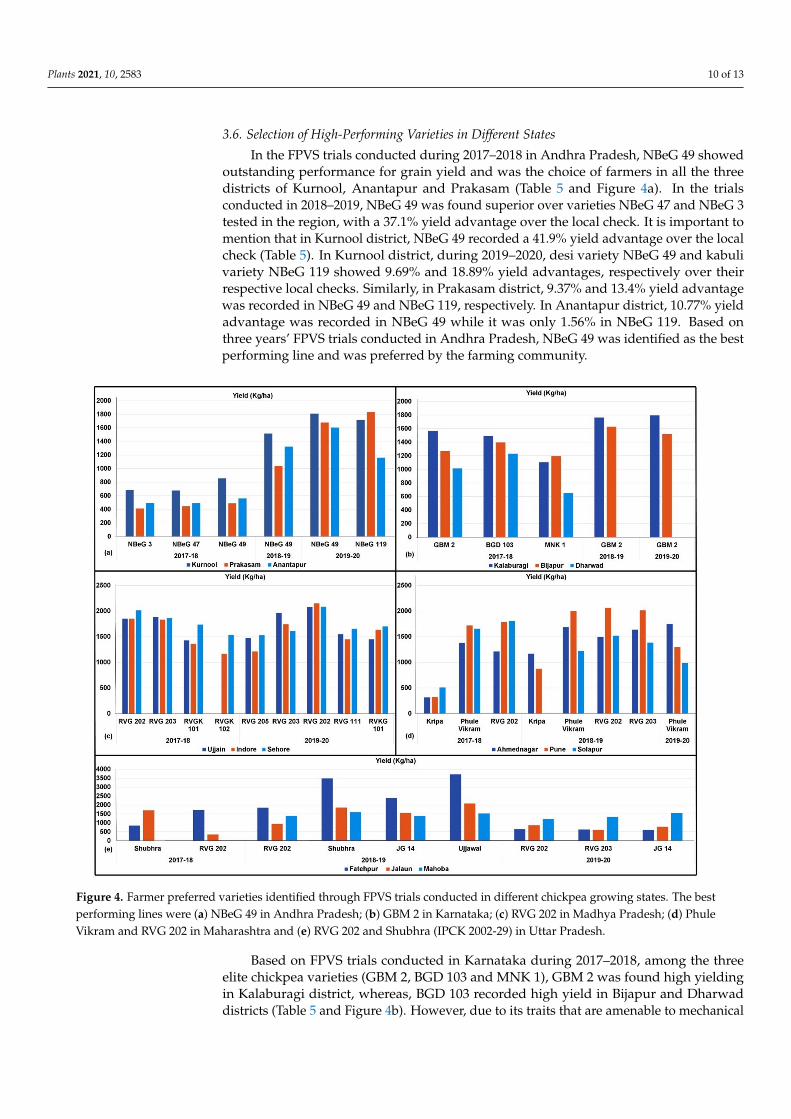
3.6. Selection of High-Performing Varieties in Different States
In the FPVS trials conducted during 2017–2018 in Andhra Pradesh, NBeG 49 showedoutstanding performance for grain yield and was the choice of farmers in all the threedistricts of Kurnool, Anantapur and Prakasam (Table 5 and Figure 4a). In the trialsconducted in 2018–2019, NBeG 49 was found superior over varieties NBeG 47 and NBeG 3tested in the region, with a 37.1% yield advantage over the local check. It is important tomention that in Kurnool district, NBeG 49 recorded a 41.9% yield advantage over the localcheck (Table 5). In Kurnool district, during 2019–2020, desi variety NBeG 49 and kabulivariety NBeG 119 showed 9.69% and 18.89% yield advantages, respectively over theirrespective local checks. Similarly, in Prakasam district, 9.37% and 13.4% yield advantagewas recorded in NBeG 49 and NBeG 119, respectively. In Anantapur district, 10.77% yieldadvantage was recorded in NBeG 49 while it was only 1.56% in NBeG 119. Based onthree years’ FPVS trials conducted in Andhra Pradesh, NBeG 49 was identified as the bestperforming line and was preferred by the farming community.
Figure 4. Farmer preferred varieties identified through FPVS trials conducted in different chickpea growing states. The bestperforming lines were (a) NBeG 49 in Andhra Pradesh; (b) GBM 2 in Karnataka; (c) RVG 202 in Madhya Pradesh; (d) PhuleVikram and RVG 202 in Maharashtra and (e) RVG 202 and Shubhra (IPCK 2002-29) in Uttar Pradesh.
Based on FPVS trials conducted in Karnataka during 2017–2018, among the threeelite chickpea varieties (GBM 2, BGD 103 and MNK 1), GBM 2 was found high yieldingin Kalaburagi district, whereas, BGD 103 recorded high yield in Bijapur and Dharwaddistricts (Table 5 and Figure 4b). However, due to its traits that are amenable to mechanical
Plants 2021, 10, 2583 11 of 13
harvesting, farmers from all the three districts preferred GBM 2 in 2018–2019 and 2019–2020(Table 5 and Figure 4b).
Based on FPVS trials conducted in Madhya Pradesh during 2017–2018, RVG 202 wasidentified as high yielding in Indore and Sehore districts, whereas, RVG 203 was highyielding in Ujjain district (Table 5 and Figure 4c). During 2018–2019, farmers ranked theperformance of different varieties. RVG 202 demonstrated superior performance in all threedistricts. No yield data was provided during 2018–2019 trials. In 2019–2020, FPVS trialswere conducted with RVG 205, RVG 202, RVG 203, RVG 111 and RVKG 101. Of these, RVG202 exhibited the highest grain yield of 2105 kg/ha followed by RVG 203 (1772 kg/ha) inthree districts (Table 5). In Madhya Pradesh, RVG 202 followed by RVG 203 were identifiedas the best performing lines.
In Maharashtra, Phule Vikram was found high yielding in Ahmednagar district,whereas RVG 202 was identified as high yielding in Pune and Solapur districts in the2017–2018 FPVS trials (Table 5 and Figure 4d). Similarly, during 2018–2019, Phule Vikramin Ahmednagar and RVG 202 in Pune and Solapur districts were identified as high-yieldingvarieties (Table 5 and Figure 4d). In the demonstrations in 2019–2020, the yield of PhuleVikram varied widely in all the three districts. For instance, in Ahmednagar district, itrecorded the highest grain yield of 1746 kg/ha (Table 5) while yields recorded in Pune andSholapur districts were 1278 kg/ha and 987 kg/ha yield, respectively (Table 5). Overall,Phule Vikram was widely preferred by farmers in Maharashtra. Under this study, PhuleVikram reached farmers of Pune and Solapur districts. Overall, the farmers expressedsatisfaction about the varieties and showed preference for it. The productivity in Solapurdistrict was less as compared to Ahmednagar and Pune districts due to the scarcity ornonavailability of water for irrigation during the crop seasons.
In Uttar Pradesh, during the 2017–2018 FPVS trials, variety RVG 202 showed highestgrain yield in Fatehpur district and variety Shubhra was found higher yielding in Jalaundistrict (Table 5 and Figure 4e). While Shubhra and Ujjawal gave higher yields comparedto RVG 202 in Fatehpur and Jalaun districts in 2018–2019 trials (Table 5 and Figure 4e),Shubhra recorded the highest yield in Mahoba district. In the 2019–2020 FPVS trials, RVG202 recorded the highest grain yield in Fatehpur and Jalaun districts (Table 5) while JG14 recorded highest grain yield of 1548 kg/ha (Table 5) in Mahoba district. RVG 202 waspreferred as the best performing line by farmers in the state.
4. Conclusions
The TCGC has been involved in the development of traits for drought and FW associ-ated markers and conduct of FPVS trials to enable improved varieties to reach farmers. Ithas successfully developed trait (biotic and abiotic stress)-associated molecular markersand is currently working on developing drought tolerance and FW resistance throughthe MABC approach. Multi-location and FPVS trials were used to identify high grainyield and highly stable varieties on station and in farmers’ fields. Among the desi elitebreeding lines, Phule G 0919-4-8 at Nandyal, SAGL 152210 at Sehore, JG 2016-634958 atJabalpur, SAGL 152278 at Kalaburagi, PhuleG 0914-8-14 at Rahuri and IPC 2008-11 atKanpur revealed a high yield advantage over the local checks. Across all the locationsand over the years, JG 2016-1614 was identified as a superior line with high grain yieldand high stability. Likewise, kabuli elite breeding lines IPCK 2013-152 at Nandyal, SAGL152220 at Kalaburagi, ICCX-060010-F3-BP-P17-BP-BP-BP-BP at Sehore, IPCK 2012-129 atRahuri and SAGL 152289 at Jabalpur recorded the highest grain yields over the local checks.Across locations and over the years, ICCX-060010-F3-BP-P6-BP-BP-BP-BP followed byIPCK 2013-174 and SAGL 152289 were identified as superior lines with high grain yieldand high stability. In short, NBeG 49 and GBM 2 were identified as the best performinglines preferred by farmers in Andhra Pradesh and Karnataka. RVG 202 followed by RVG203 were the choice of farmers in Madhya Pradesh while Phule Vikram and RVG 202 wereidentified as the best performing lines in Maharashtra. In Uttar Pradesh, RVG 202 and
Plants 2021, 10, 2583 12 of 13
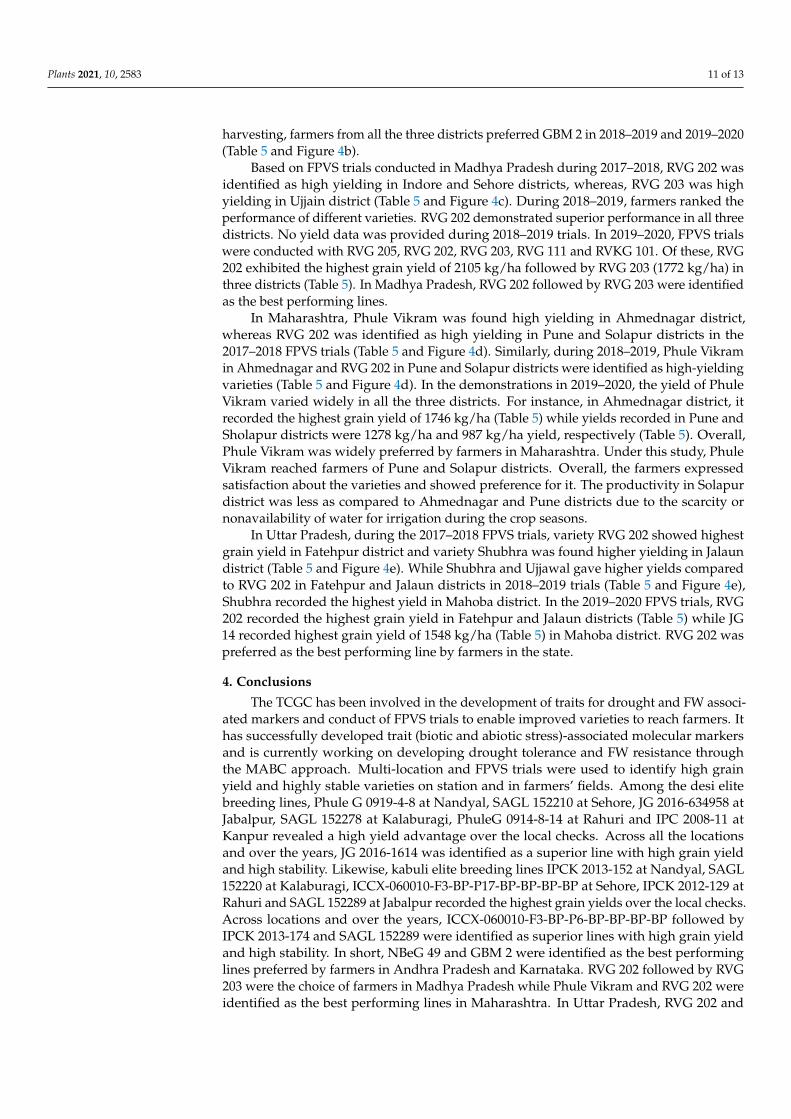
Shubhra (IPCK 2002-29) were preferred by the farmers as best performing desi and kabulilines, respectively.
The advanced drought tolerance and FW resistance backcross lines will be evaluatedfor grain yield for varietal release. The top performing lines and new molecular breedinglines developed in different genetic backgrounds can be further evaluated for their perfor-mance at the national level in AICRP trials on chickpea for release as improved varieties.The development of these high-yielding chickpea varieties and enhancing their adoptionwill increase the productivity and profitability of smallholder farmers.
Supplementary Materials: The following are available online at https://www.mdpi.com/article/10.3390/plants10122583/s1, Table S1: Details of allele specific markers for Fusarium wilt; Table S2:Details of marker-assisted backcrossing to improve elite lines for drought tolerance and resistanceto fusarium wilt, Table S3: Mean performance of 70 elite desi lines evaluated in different locationsduring 2016–2017 and 2018–2019, Table S4: Mean performance of 30 elite kabuli lines evaluated indifferent locations during 2016–2017 and 2018–2019.
Author Contributions: Conceptualization R.K.V., N.P.S., MT.; Methodology: R.P., V.J., Y.K., P.K.,M.Y., N.S.K., C.L., S.Y., S.S., K.R.S., B.M., G.P.D., C.B., S.K.C., P.M.G., M.R.; formal analysis: R.P.,A.R., A.V.; data curation: A.R., A.V.; writing—original draft preparation: R.P., M.T.; writing—reviewand editing: M.T., R.K.V., M.R.;: R.K.V., MT., N.P.S.; project administration: R.K.V., N.P.S., M.T.;funding acquisition: R.K.V., N.P.S.; All authors have read and agreed to the published version of themanuscript.
Funding: This research was funded by the Department of Agriculture & Farmers Welfare (DA & FW;Grant ID: F.NO CPS 18-5/2017 NFSM), Ministry of Agriculture and Farmers Welfare, Government ofIndia and partially funded by the Bill & Melinda Gates Foundation (BMGF; Grant ID: OPP1114827).This work was undertaken as part of the CGIAR Research Program on Grain Legumes and DrylandCereals (CRP-GLDC).
Institutional Review Board Statement: Not applicable.
Informed Consent Statement: Not applicable.
Data Availability Statement: Not applicable.
Acknowledgments: The technical support rendered by Praveen Kumar Manchikatla is greatlyappreciated.
Conflicts of Interest: The authors declare no conflict of interest.
References1. FAOSTAT. 2020. Available online: http://www.fao.org/faostat/en/#data/QC (accessed on 25 March 2021).2. Sharma, M.; Ghosh, R.; Pande, S. Dry root rot (Rhizoctonia bataticola (Taub.) Butler): An emerging disease of chickpea—Where do
we stand. Arch. Phytopathol. Plant Prot. 2015, 48, 797–812. [CrossRef]3. Kadiyala, M.D.M.; Kumara, C.D.; Nedumaran, S.D.; Shyam, M.; Gumma, M.K. Agronomic management options for sustaining
chickpea yield under climate change scenario. J. Agrometeorol. 2016, 18, 41–47.4. Khaliq, A.; Alam, S.; Khan, I.U.; Khan, D.; Naz, S.; Zhang, Y.; Shah, A.A. Integrated control of dry root rot of chickpea caused by
Rhizoctonia bataticola under the natural field condition. Biotechnol. Rep. 2020, 25, e00423. [CrossRef]5. Thudi, M.; Palakurthi, R.; Schnable, J.C.; Chitikineni, A.; Dreisigacker, S.; Mace, E.; Srivastava, R.K.; Satyavathi, C.T.; Odeny,
D.; Tiwari, V.K.; et al. Genomic resources in plant breeding for sustainable agriculture. J. Plant Physiol. 2020, 153351. [CrossRef][PubMed]
6. Varshney, R.K.; Song, C.; Saxena, R.K.; Azam, S.; Yu, S.; Sharpe, A.G.; Cannon, S.; Baek, J.; Rosen, B.D.; Tar’an, B.; et al. Draftgenome sequence of chickpea (Cicer arietinum) provides a resource for trait improvement. Nat. Biotechnol. 2013, 31, 240–246.[CrossRef] [PubMed]
7. Thudi, M.; Chitikineni, A.; Liu, X.; He, W.; Roorkiwal, M.; Yang, W.; Jian, J.; Doddamani, D.; Gaur, P.M.; Rathore, A. Recentbreeding programs enhanced genetic diversity in both desi and kabuli varieties of chickpea (Cicer arietinum L.). Sci. Rep. 2016, 6,38636. [CrossRef]
8. Thudi, M.; Khan, A.W.; Kumar, V.; Gaur, P.M.; Katta, K.; Garg, V.; Roorkiwal, M.; Samineni, S.; Varshney, R.K. Whole genomere-sequencing reveals genome-wide variations among parental lines of 16 mapping populations in chickpea (Cicer arietinum L.).BMC Plant Biol. 2016, 16, 10. [CrossRef]
Plants 2021, 10, 2583 13 of 13
9. Varshney, R.K.; Thudi, M.; Roorkiwal, M.; He, W.; Upadhyaya, H.D.; Yang, W.; Bajaj, P.; Cubry, P.; Rathore, A.; Jian, J.; et al.Resequencing of 429 chickpea accessions from 45 countries provides insights into genome diversity, domestication and agronomictraits. Nat. Genet. 2019, 51, 857–864. [CrossRef]
10. Roorkiwal, M.; Sawargaonkar, S.L.; Chitikineni, A.; Thudi, M.; Saxena, R.K.; Upadhyaya, H.D.; Vales, M.I.; Riera-Lizarazu, O.;Varshney, R.K. Single nucleotide polymorphism genotyping for breeding and genetics applications in chickpea and pigeonpeausing the BeadXpress platform. Plant Genome 2013, 6, plantgenome2013.05.0017. [CrossRef]
11. Roorkiwal, M.; Jain, A.; Kale, S.M.; Doddamani, D.; Chitikineni, A.; Thudi, M.; Varshney, R.K. Development and evaluationof high-density Axiom® Cicer SNP Array for high-resolution genetic mapping and breeding applications in chickpea. PlantBiotechnol. J. 2018, 16, 890–901. [CrossRef]
12. Varshney, R.K.; Thudi, M.; Nayak, S.N.; Gaur, P.M.; Kashiwagi, J.; Krishnamurthy, L.; Jaganathan, D.; Koppolu, J.; Bohra, A.;Tripathi, S.; et al. Genetic dissection of drought tolerance in chickpea (Cicer arietinum L.). Theor. Appl. Genet. 2014, 127, 445–462.[CrossRef]
13. Thudi, M.; Upadhyaya, H.D.; Rathore, A.; Gaur, P.M.; Krishnamurthy, L.; Roorkiwal, M.; Nayak, S.N.; Chaturvedi, S.K.; Basu, P.S.;Gangarao, N.V.P.R.; et al. Genetic dissection of drought and heat tolerance in chickpea through genome-wide and candidategene-based association mapping approaches. PLoS ONE 2014, 9, e96758.
14. Jaganathan, D.; Thudi, M.; Kale, S.; Azam, S.; Roorkiwal, R.; Gaur, P.M.; Kishor, P.K.; Nguyen, H.; Sutton, T.; Varshney, R.K.Genotyping-by-sequencing based intra-specific genetic map refines a “QTL-hotspot” region for drought tolerance in chickpea.Mol. Genet. 2015, 290, 559–571. [CrossRef]
15. Kale, S.M.; Jaganathan, D.; Ruperao, P.; Chen, C.; Punna, R.; Kudapa, H.; Thudi, M.; Roorkiwal, M.; Katta, M.A.; Doddamani, D.;et al. Prioritization of candidate genes in “QTL-hotspot” region for drought tolerance in chickpea (Cicer arietinum L.). Sci. Rep.2015, 5, 15296. [CrossRef]
16. Soren, K.R.; Madugula, P.; Kumar, N.; Barmukh, R.; Sengar, M.S.; Bharadwaj, C.; Sharma, P.C.; Singh, S.; Bhandari, A.; Singh, J.;et al. Genetic dissection and identification of candidate genes for salinity tolerance using Axiom® CicerSNP Array in chickpea.Int. J. Mol. Sci. 2020, 21, 5058. [CrossRef] [PubMed]
17. Sabbavarapu, M.M.; Sharma, M.; Chamarthi, S.K.; Swapna, N.; Rathore, A.; Thudi, M.; Gaur, P.M.; Pande, S.; Singh, S.; Kaur, L.;et al. Molecular mapping of QTLs for resistance to fusarium wilt (race 1) and ascochyta blight in chickpea (Cicer arietinum L.).Euphytica 2013, 193, 121–133. [CrossRef]
18. Garg, T.; Mallikarjuna, B.P.; Thudi, M.; Samineni, S.; Singh, S.; Sandhu, J.S.; Kaur, L.; Singh, I.; Sirari, A.; Basandrai, A.K.Identification of QTLs for resistance to fusarium wilt and ascochyta blight in a recombinant inbred population of chickpea (Cicerarietinum L.). Euphytica 2018, 214, 45. [CrossRef]
19. Jha, U.C.; Nayyar, H.; Palakurthi, R.; Jha, R.; Valluri, V.; Bajaj, P.; Chitikineni, A.; Singh, N.P.; Varshney, R.K.; Thudi, M. MajorQTLs and potential candidate genes for heat stress tolerance identified in chickpea (Cicer arietinum L.). Front. Plant Sci. 2021, 12,655103. [CrossRef] [PubMed]
20. Deokar, A.; Sagi, M.; Tar’an, B. Genome-wide SNP discovery for development of high-density genetic map and QTL mapping ofascochyta blight resistance in chickpea (Cicer arietinum L.). Theor. Appl. Genet. 2019, 132, 1861–1872. [CrossRef] [PubMed]
21. Roorkiwal, M.; Bharadwaj, C.; Barmukh, R.; Dixit, G.P.; Thudi, M.; Gaur, P.M.; Chaturvedi, S.K.; Fikre, A.; Hamwieh, A.; Kumar, S.;et al. Integrating genomics for chickpea improvement: Achievements and opportunities. Theor. Appl. Genet. 2020, 13, 1703–1720.[CrossRef]
22. SAS Institute Inc. SAS/STAT®15.1 User’s Guide; SAS Institute Inc.: Cary, NC, USA, 2008.23. Yan, W.; Tinker, N.A. Biplot analysis of multi-environment trial data: Principles and applications. Can. J. Plant Sci. 2006, 86,
623–645. [CrossRef]24. Varshney, R.K.; Mohan, S.M.; Gaur, P.M.; Chamarthi, S.K.; Singh, V.K.; Srinivasan, S.; Swapna, N.; Sharma, M.; Pande, S.; Singh, S.;
et al. Marker-assisted backcrossing to introgress resistance to fusarium wilt race 1 and ascochyta blight in C 214, an elite cultivarof chickpea. Plant Genome 2014, 7, plantgenome2013.10.0035. [CrossRef]
25. Pratap, A.; Chaturvedi, S.K.; Tomar, R.; Rajan, N.; Malviya, N.; Thudi, M.; Saabale, P.R.; Prajapati, U.; Varshney, R.K.; Singh, N.P.Marker-assisted introgression of resistance to fusarium wilt race 2 in Pusa 256, an elite cultivar of desi chickpea. Mol. Genet.Genom. 2017, 292, 1237–1245. [CrossRef] [PubMed]
26. Bharadwaj, C.; Tripathi, S.; Soren, K.R.; Thudi, M.; Singh, R.K.; Sheoran, S.; Roorkiwal, M.; Patil, B.S.; Chitikineni, A.; Palakurthi,R.; et al. Introgression of “QTL-hotspot” region enhances drought tolerance and grain yield in three elite chickpea cultivars. PlantGenome 2021, 20076. [CrossRef] [PubMed]
27. Mannur, D.M.; Babbar, A.; Thudi, M.; Sabbavarapu, M.M.; Roorkiwal, M.; Sharanabasappa, B.Y.; Bansal, V.P.; Jayalakshmi, S.K.;Yadav, S.S.; Rathore, A.; et al. Super Annigeri 1 and improved JG 74: Two fusarium wilt-resistant introgression lines developedusing marker-assisted backcrossing approach in chickpea (Cicer arietinum L.). Mol. Breed. 2019, 39, 2. [CrossRef] [PubMed]