transition and growth: what was taught and what happened
TRANSCRIPT
7
ECONOMIC ANNALS, Volume LIV, No. 183 / October – December 2009.UDC: 3.33 ISSN: 0013-3264
* Faculty of Economics, University of Belgrade. The paper is a part of a broader project supported by the Serbian Ministry of Science.
JEL CLASSIFICATION: C52, O57, P27, P30, P51
ABSTRACT: The paper demonstrates why the transition process is taking more time than predicted and why many countries are still far away from the projected goal: a developed market economy. Analysing the causes and re-examining the endogenous character of the transition progress, the authors conclude that the majority of reforms were implemented at a pace conditional on the initial, pre-transition conditions. The results obtained show a significant impact on the economic and institutional heritage of a country, which lasts much longer than was predicted on the eve of the reform process: initial conditions strongly and significantly affect the speed of transition throughout the entire observed period (1989-2007). They also affect the performance of a country: in the first years the transition progress may affect growth
in a positive way, but later it becomes insignificant. This can explain some growth peculiarities previously remarked when transition countries were analysed by means of long-run growth models. Using Barro and Levine-Renelt models the authors show that despite somewhat better results for the second decade of transition many peculiar patterns remain, which could temporarily block poorer transition economies in their attempts to catch up and cause unnecessary losses since transition policies were not properly adjusted to the initial conditions.
KEY WORDS: Transition economies, transition progress, initial conditions, transition recession, growth, economic performance, comparative economics
Božidar Cerović and DOI:10.2298/EKA0983007C Aleksandra Nojković*
TRANSITION AND GROWTH: WHAT WAS TAUGHT AND WHAT HAPPENED
Scientific PaPerS
8
Economic Annals, Volume LIV, No. 183 / October – December 2009.
1. INTRODUCTION
From the very beginning of the transition process there existed the puzzling question of how and when transition economies may be regarded suitable to join the world of the developed market economies. For the European transition economies the question was particularly interesting since the majority of them were counting on accession to the European Union. The question was also important for the non-European economies since their aim was to catch up with the world’s developed economies in order to perform at a higher level and to provide their populations with a higher and desired standard of living.
The architects of transition were persuasive and confident that the process would not take much time, while the results would be satisfactory on a broad scale and in the relatively short run. They had introduced a certain set of measures and policies that if carried out accurately would lead those economies into the system of good and effective performance in a relatively short period. Recalling these opinions we have to point out the seminal analytical papers on the issue, like the two presented by de Melo et al. (1996, 1997), which conclude that countries which carry out their reforms faster perform better in terms of their GDP per capita level, and that proper policies can overpass some deficiencies in the starting positions of those countries, particularly if there is a strong commitment regarding new policies and if there is a decisive policy to implement them persistently (which in turn and unsurprisingly happens just among those countries which are faster in reform promotion). These papers together with some other findings (Sachs, 1996) seemed to provide important arguments in favour of the idea that the speed of transition matters and that the reforms should be implemented as fast as possible, to be rewarded by higher growth rates and faster recovery from transition recession.
However, further studies showed that the issue of velocity in carrying out reforms is not that straightforward. A number of authors, including some who have agreed with de Melo1 and others who expressed some doubts about the conclusions presented2, have found that the speed of transition and the quality of new institutions cannot be separated from the inherited conditions. Moreover speed of reforms, transition progress and performance of a transition economy appear to be largely dependent on initial conditions in the country in question, as well as on institution building. This finding is not a new idea: it is commonly known
1 Like: Krueger and Ciolko (1998), Heybey and Murrell (1999), Havrylyshyn and Rooden (2000) 2 Like: Popov (2000), Stiglitz (2001), Ellerman (2003); an author of this paper also took part see:
Cerovic (2000).
Transition and Growth: What Was Taught and what Happened
9
that on a spoiled piece of land the harvest will not be abundant – unless a certain amount of investment is spent on cultivation.
The debate on whether the speed of the transition progress – depending on the willingness of policy makers to follow projected policies – is crucial for economic performance, or whether the speed of reforms should be seen as an endogenous variable depending on inherited, pre-reform initial conditions, has attracted the attention of the authors of this paper. Also provoking were some analytical results that have been pointing out how transition economies perform in an unexpected way concerning traditional growth models. In this paper we try to examine some of these findings and to examine the questions of what determines the transition progress, what the transition progress could add to the growth of certain transition economies, and how transition economies behave regarding established growth models. The last question is of particular interest as it establishes the field where it should be possible to find answers to transition countries’ catch-up problems.
The plan of the paper is as follows. Firstly, we shall try to examine the current state of art regarding the transition progress. The analysis will show why transition is not as easy and speedy process as was predicted on the eve of transition. We shall also examine what forces command the process and what is the influence of the initial conditions, or to what extent we may understand the transition process as an endogenous phenomenon. In these two sections we shall rely mainly on our previous paper (Cerovic & Nojokovic, 2008) in order to make our further arguments clear. Secondly, we shall investigate what role the speed and/or progress of reforms play concerning economic growth and output level of an economy in transition and how much (and for how long) it can affect the growth of a transition country. Finally, we shall examine how transition economies behave in comparison with the standard long-term models of growth, if there are some specific features and what consequences these results might have on the catching-up process of those economies.
2. MEASURING TRANSITION PROGRESS
There are several well developed criteria for measuring transition progress – starting from World Bank’s Composite Liberalisation Index to the European Bank’s (EBRD) nine indicators, which have become particularly popular in past years thanks to their systematic publication and presentation. Referring to the latter ones we can observe that the range of EBRD indicators goes from 1 for no change to 4+ (or 4.33) for ‘as if ’ a developed market economy. Thus, the point that has
10
Economic Annals, Volume LIV, No. 183 / October – December 2009.
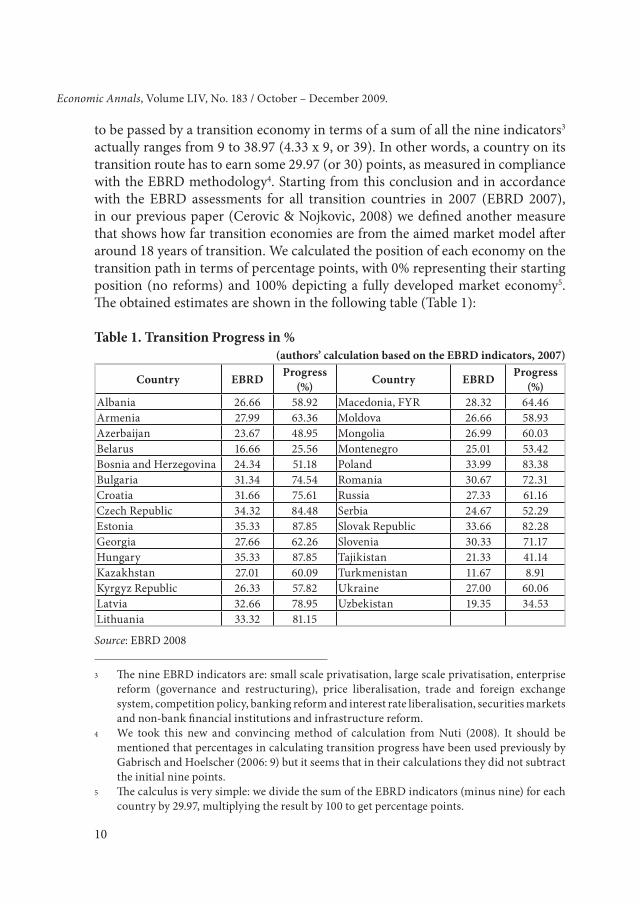
to be passed by a transition economy in terms of a sum of all the nine indicators3 actually ranges from 9 to 38.97 (4.33 x 9, or 39). In other words, a country on its transition route has to earn some 29.97 (or 30) points, as measured in compliance with the EBRD methodology4. Starting from this conclusion and in accordance with the EBRD assessments for all transition countries in 2007 (EBRD 2007), in our previous paper (Cerovic & Nojkovic, 2008) we defined another measure that shows how far transition economies are from the aimed market model after around 18 years of transition. We calculated the position of each economy on the transition path in terms of percentage points, with 0% representing their starting position (no reforms) and 100% depicting a fully developed market economy5. The obtained estimates are shown in the following table (Table 1):
Table 1. Transition Progress in % (authors’ calculation based on the EBRD indicators, 2007)
Country EBRD Progress (%) Country EBRD Progress
(%)Albania 26.66 58.92 Macedonia, FYR 28.32 64.46Armenia 27.99 63.36 Moldova 26.66 58.93Azerbaijan 23.67 48.95 Mongolia 26.99 60.03Belarus 16.66 25.56 Montenegro 25.01 53.42Bosnia and Herzegovina 24.34 51.18 Poland 33.99 83.38Bulgaria 31.34 74.54 Romania 30.67 72.31Croatia 31.66 75.61 Russia 27.33 61.16Czech Republic 34.32 84.48 Serbia 24.67 52.29 Estonia 35.33 87.85 Slovak Republic 33.66 82.28Georgia 27.66 62.26 Slovenia 30.33 71.17Hungary 35.33 87.85 Tajikistan 21.33 41.14Kazakhstan 27.01 60.09 Turkmenistan 11.67 8.91Kyrgyz Republic 26.33 57.82 Ukraine 27.00 60.06Latvia 32.66 78.95 Uzbekistan 19.35 34.53Lithuania 33.32 81.15
Source: EBRD 2008
3 The nine EBRD indicators are: small scale privatisation, large scale privatisation, enterprise reform (governance and restructuring), price liberalisation, trade and foreign exchange system, competition policy, banking reform and interest rate liberalisation, securities markets and non-bank financial institutions and infrastructure reform.
4 We took this new and convincing method of calculation from Nuti (2008). It should be mentioned that percentages in calculating transition progress have been used previously by Gabrisch and Hoelscher (2006: 9) but it seems that in their calculations they did not subtract the initial nine points.
5 The calculus is very simple: we divide the sum of the EBRD indicators (minus nine) for each country by 29.97, multiplying the result by 100 to get percentage points.
Transition and Growth: What Was Taught and what Happened
11
It can easily be seen that, according to the EBRD methodology, only eight countries (28% of the 29 observed) have accomplished reforms of 75% or more of the intended developed market economy structure. Among them only two countries are close to the 90% threshold (Estonia and Hungary) and one of them has just overstepped the 75% line (Croatia). Thirteen countries are in the range 55%-75% in accomplishing reforms, ten of which are in the range 55%-65%. There are eight countries below 55%6.
However, the most important result is that the figures presented portray the outcome of the transition process and its modest results nearly two decades after recommended transition policies were declared. At that time we were told that the time horizon for full reform was close (‘jump over a chasm in one leap’) including some apparently cautious durability forecasts of not more than approximately ten years.7 After 18 years (some leap which lasts that long!) it appears that the transition process is much more demanding, that it depends on many different and not yet fully recognised factors, and definitely is not merely a matter of strong or weak willingness and commitment among policy makers in transition countries.
It is obvious that expectations about the speed of reforms have not been confirmed and it is most plausible that some other forces – neglected at the beginning of transition – play an important role. This brings us again to the issue of endogeneity of the transition progress and to the role of initial conditions, inherited level of development, and institutional capacity in conducting reforms.
3. TRANSITION PROGRESS AS AN ENDOGENOUS vARIABlE
The endogenous character of the transition progress basically refers to inherited initial conditions within a country. There are several groups of these pre-transition conditions among which two groups dominate: (a) level of development in terms of the GDP per capita together with macroeconomic conditions, or rather distortions, and (b) the inherited level of institutional capacity, including experience in governance of a market oriented economy or at least in conducting
6 The relative progress of the countries is not that transparent if we calculate it directly from the EBRD indicators since the EBRD indicators present a more optimistic picture of reform success: a country with, say, 20 EBRD points, looks as if it has already passed the half way point to a market economy, whereas in reality it has passed a bit more than a third of that route (this difference is due to the fact that the EBRD indicators donate nine points before any change is taken).
7 Fischer and Gelb (1991); one may also recall Dornbusch’s allegoric ‘seven days’ (1991).
12
Economic Annals, Volume LIV, No. 183 / October – December 2009.
some deeper reforms within the preceding economic system. Since the data are usually lacking it is relatively difficult to fully assess initial conditions although some attempts have been made8.
Having this in mind, we have examined the impact of the following variables on transition progress (TPROG, in terms of percentage points as explained above): (i) value (in US$) of the GDP per capita in 1989 expressed by purchasing power parity (GDP1989), (ii) dummy variable stating whether a country had deeper market oriented reforms during communism or not (MREF), (iii) number of years of communist rule in an economy (INST1), (iv) black market premium in exchange rate compared with the official one in 1990, that is on the eve of transition (INST5), which is used as a proxy for various macroeconomic distortions.9
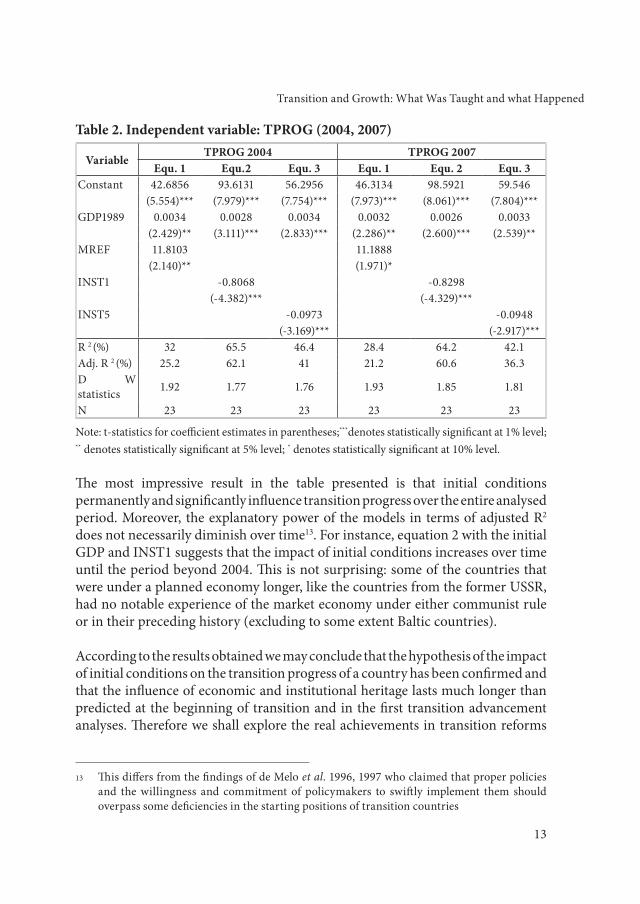
In the paper we refer to (Cerovic & Nojkovic, 2008), we have tested a set of regression equations in order to estimate for how long and how much initial conditions influence reforms. We tested several models for the years 1998, 2001, 2004 and 200710. In all the models the results obtained were similar. Here we shall reproduce the results for 2004 and 2007 only11. These results for 23 transition economies are presented in Table 2.12
8 As to initial conditions, already in seminal papers of de Melo et al. one can find a set of indicators for macroeconomic inherited surroundings and even for some institutional variables. Later there were attempts in collecting additional data (e.g. Campos, 1999; Moers, 1999; Fischer and Sahay, 2004; Roland, 2007; etc).
9 Due to a chronic lack of data for transition economies we used for variables (i), (iii) and (iv) the results published in de Melo et al. (1997) and for variable (ii) we put a dummy stating that former Yugoslav countries, Hungary and Poland had some experience with market oriented reforms (represented by the value 1 and 0 for the others).
10 We have estimated a set of additional equations for the same period that includes some other variables describing various initial conditions as publicised in both papers of de Melo et al. In doing so we have discovered that many of them influence transition progress for a long period. However, we use the models from Table 2 since the variables used in those equations better represent something of the institutional heritage than the others.
11 Other results have been presented in our paper already quoted (Cerovic & Nojkovic, 2008) 12 We could not find all necessary data for Bosnia & Herzegovina, Mongolia, Montenegro,
Serbia, Tajikistan and Turkmenistan that appear in Table 1.
Transition and Growth: What Was Taught and what Happened
13
Table 2. Independent variable: TPROG (2004, 2007)
VariableTPROG 2004 TPROG 2007
Equ. 1 Equ.2 Equ. 3 Equ. 1 Equ. 2 Equ. 3Constant 42.6856 93.6131 56.2956 46.3134 98.5921 59.546
(5.554)*** (7.979)*** (7.754)*** (7.973)*** (8.061)*** (7.804)***GDP1989 0.0034 0.0028 0.0034 0.0032 0.0026 0.0033
(2.429)** (3.111)*** (2.833)*** (2.286)** (2.600)*** (2.539)**MREF 11.8103 11.1888
(2.140)** (1.971)*INST1 -0.8068 -0.8298
(-4.382)*** (-4.329)***INST5 -0.0973 -0.0948
(-3.169)*** (-2.917)***R 2 (%) 32 65.5 46.4 28.4 64.2 42.1Adj. R 2 (%) 25.2 62.1 41 21.2 60.6 36.3D W statistics 1.92 1.77 1.76 1.93 1.85 1.81
N 23 23 23 23 23 23
Note: t-statistics for coefficient estimates in parentheses;***denotes statistically significant at 1% level; ** denotes statistically significant at 5% level; * denotes statistically significant at 10% level.
The most impressive result in the table presented is that initial conditions permanently and significantly influence transition progress over the entire analysed period. Moreover, the explanatory power of the models in terms of adjusted R2 does not necessarily diminish over time13. For instance, equation 2 with the initial GDP and INST1 suggests that the impact of initial conditions increases over time until the period beyond 2004. This is not surprising: some of the countries that were under a planned economy longer, like the countries from the former USSR, had no notable experience of the market economy under either communist rule or in their preceding history (excluding to some extent Baltic countries).
According to the results obtained we may conclude that the hypothesis of the impact of initial conditions on the transition progress of a country has been confirmed and that the influence of economic and institutional heritage lasts much longer than predicted at the beginning of transition and in the first transition advancement analyses. Therefore we shall explore the real achievements in transition reforms
13 This differs from the findings of de Melo et al. 1996, 1997 who claimed that proper policies and the willingness and commitment of policymakers to swiftly implement them should overpass some deficiencies in the starting positions of transition countries
14
Economic Annals, Volume LIV, No. 183 / October – December 2009.
implementation among countries in transition and whether they could advance better.
4. TRANSITION PROGRESS AND GROWTH
In this section we shall deal with our principal question: what relationship between transition and growth might be expected? The architects of the transition process have presented a set of measures and policies stating that if these policies were carried out accurately they should lead economies in transition into a system of effective performance in a relatively short period. As mentioned in the introductory notes, there are a number of papers arguing a firm relationship of proper transition policies and their fast implementation with GDP per capita levels achieved during transition. However, a good number of contributors on the issue drew attention to the role of inherited conditions and their effect on transition progress. This should necessarily influence our further study: if the speed of reforms depends on inherited conditions and is endogenous there are fewer possibilities for policy makers to choose the speed of reforms on their own. Moreover, if the speed of reforms matters regarding growth and is determined to a considerable extent by initial conditions then the growth itself should depend on initial conditions.
Although in the previous section we have confirmed the arguments concerning inherited conditions and their influence on transition advancement, we shall firstly estimate an almost conventional model for transition economies that takes GDP level achieved as being dependant on initial conditions and reform progress. We put GDP per capita for the years 1998, 2001, 2004 and 2007 to be the dependent variable whereas independent variables are: (a) GDP per capita from 1989 (GDP1989), (b) transition progress (TPROG) measured by percentage points (as in Table 1) squared (squared in order to capture U shaped transition growth), (c) a dummy– whether a country had deeper market oriented reforms or not (MREF, as explained in footnote 9) and (d) average rate of inflation from 1994 (INF average; EBRD 2008 data) to avoid the first and unstable years of the transition process. Taking a set of 25 transition economies with available data we have obtained the following results14:
14 We put back Tajikistan and Turkmenistan into the observed set since their necessary data were available.
Transition and Growth: What Was Taught and what Happened
15
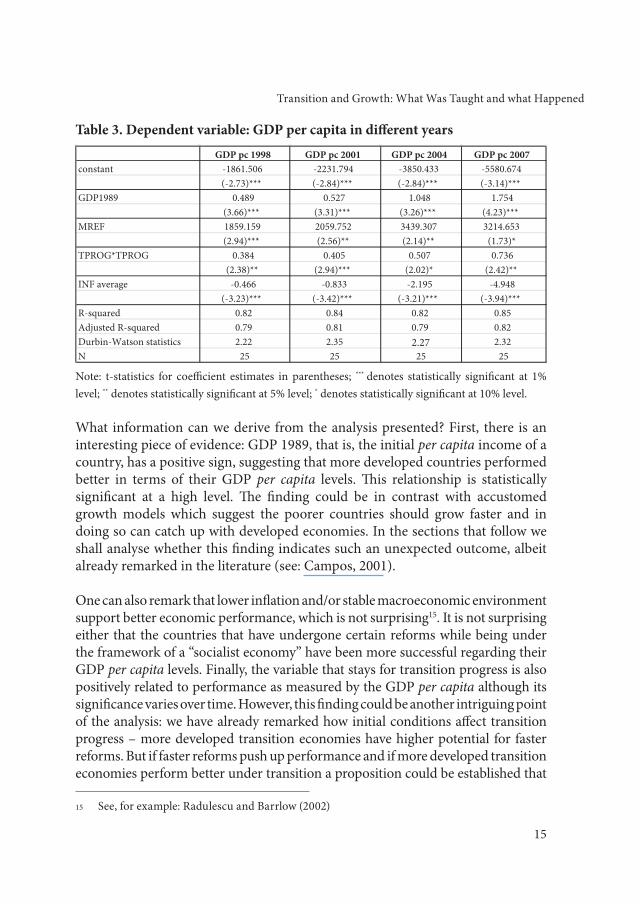
Table 3. Dependent variable: GDP per capita in different years
Note: t-statistics for coefficient estimates in parentheses; *** denotes statistically significant at 1% level; ** denotes statistically significant at 5% level; * denotes statistically significant at 10% level.
What information can we derive from the analysis presented? First, there is an interesting piece of evidence: GDP 1989, that is, the initial per capita income of a country, has a positive sign, suggesting that more developed countries performed better in terms of their GDP per capita levels. This relationship is statistically significant at a high level. The finding could be in contrast with accustomed growth models which suggest the poorer countries should grow faster and in doing so can catch up with developed economies. In the sections that follow we shall analyse whether this finding indicates such an unexpected outcome, albeit already remarked in the literature (see: Campos, 2001).
One can also remark that lower inflation and/or stable macroeconomic environment support better economic performance, which is not surprising15. It is not surprising either that the countries that have undergone certain reforms while being under the framework of a “socialist economy” have been more successful regarding their GDP per capita levels. Finally, the variable that stays for transition progress is also positively related to performance as measured by the GDP per capita although its significance varies over time. However, this finding could be another intriguing point of the analysis: we have already remarked how initial conditions affect transition progress – more developed transition economies have higher potential for faster reforms. But if faster reforms push up performance and if more developed transition economies perform better under transition a proposition could be established that
15 See, for example: Radulescu and Barrlow (2002)
16
Economic Annals, Volume LIV, No. 183 / October – December 2009.
only these more developed economies can successfully pass the transition process and advance faster or at least at lower costs in terms of GDP losses.
In this respect we can report another interesting result. When attempting to estimate a somewhat different specification where instead of the variable MREF we used a variable that brings up the number of years that an economy had spent under a previous (socialist/communist) economic system (INST1)16 we have found some important specificities. The effect of INST1 on GDP per capita is (expectedly) negative and significant, while the variable TPROG*TPROG appear to be positive with GDP per capita level, but insignificant! This is due to the multicollinearity problem since we have included in the model two variables – TPROG*TPROG and INST1 – that are quite strongly correlated17. In other words, the relationship between explanatory variables is stronger than the relationship between TPROG*TPROG and GDP per capita. However, this econometric aspect brings us again to the issue of initial conditions, suggesting that initial conditions dominate in explaining both phenomena – GDP level and transition progress.
However, the results presented in Table 3 cannot tell us directly what the effects on growth were during transition: we have only learned that countries with higher initial GDP-s per capita will remain with higher GDP-s per capita during and/or after transition process. On the other hand transition economies (due to restructuring or disorganisation and/or other reasons) have to pass a specific type of recession, called transition recession, which makes their GDP curve acquire a U shaped form. From the above models we cannot directly obtain evidence about this effect and its length.
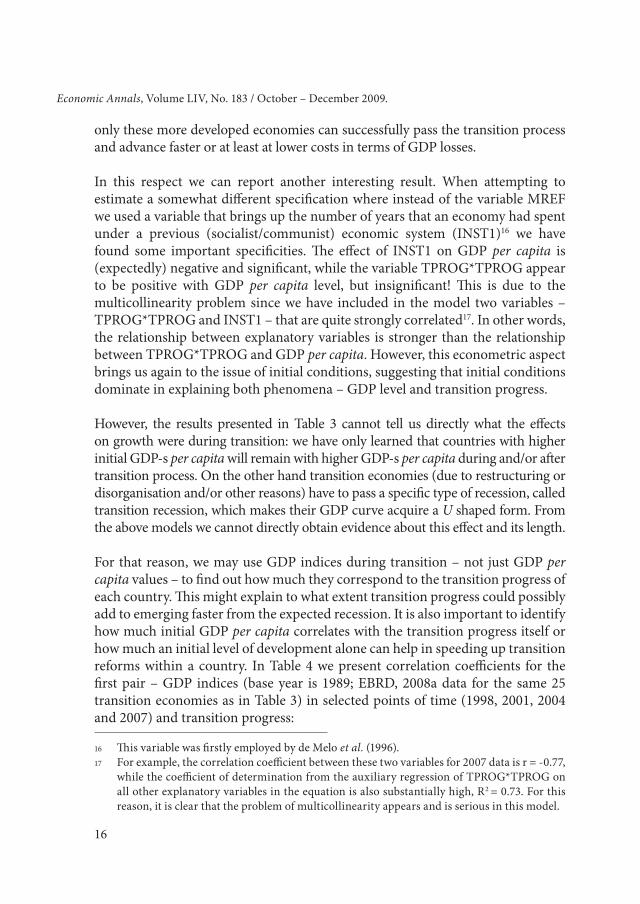
For that reason, we may use GDP indices during transition – not just GDP per capita values – to find out how much they correspond to the transition progress of each country. This might explain to what extent transition progress could possibly add to emerging faster from the expected recession. It is also important to identify how much initial GDP per capita correlates with the transition progress itself or how much an initial level of development alone can help in speeding up transition reforms within a country. In Table 4 we present correlation coefficients for the first pair – GDP indices (base year is 1989; EBRD, 2008a data for the same 25 transition economies as in Table 3) in selected points of time (1998, 2001, 2004 and 2007) and transition progress:
16 This variable was firstly employed by de Melo et al. (1996). 17 For example, the correlation coefficient between these two variables for 2007 data is r = -0.77,
while the coefficient of determination from the auxiliary regression of TPROG*TPROG on all other explanatory variables in the equation is also substantially high, R2 = 0.73. For this reason, it is clear that the problem of multicollinearity appears and is serious in this model.
Transition and Growth: What Was Taught and what Happened
17
Table 4. Correlation between GDP indices (1989=100) and TPROG in different years
We found that only in (or until) the year 1998 was there a certain and significant (1%) positive correlation between transition progress and achieved GDP among 25 analysed transition economies. However, in later years this relationship became insignificant and began to disappear. Moreover, in the last year of our analysis (2007) an unexpected result emerged – transition progress remained insignificant when related to GDP indices but the sign of the coefficient is negative, or in other words, if it was significant more transition reforms would prevent faster growth and/or recovery from transition recession.
However, this undoubtedly peculiar result from the standpoint of those advocating speedy reforms as a course to faster and more efficient growth is not that surprising. Some countries, as explained above, did not have sufficient capacity for recommended reforms and their fast implementation, due to their inherited development level. This is very evident from the following correlation coefficients between initial GDP per capita values and transition progress:
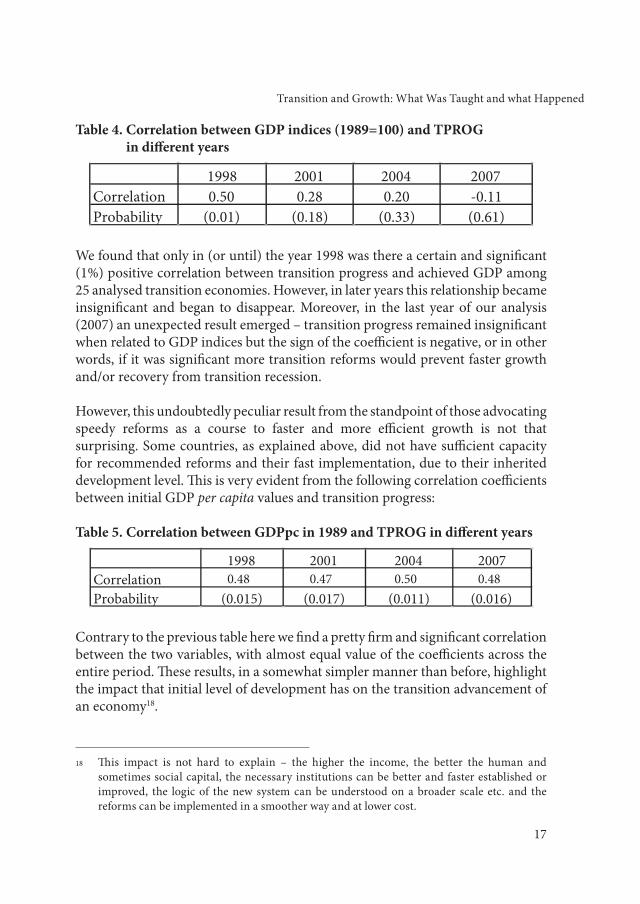
Table 5. Correlation between GDPpc in 1989 and TPROG in different years
Contrary to the previous table here we find a pretty firm and significant correlation between the two variables, with almost equal value of the coefficients across the entire period. These results, in a somewhat simpler manner than before, highlight the impact that initial level of development has on the transition advancement of an economy18.
18 This impact is not hard to explain – the higher the income, the better the human and sometimes social capital, the necessary institutions can be better and faster established or improved, the logic of the new system can be understood on a broader scale etc. and the reforms can be implemented in a smoother way and at lower cost.
18
Economic Annals, Volume LIV, No. 183 / October – December 2009.
Again, the two conclusions are very much opposed to the initial ideas. According to de Melo et al. (1996, 1997) as well as some other contributions (Sachs, 1996; Fischer et al. 1996), the speed of reforms should improve performance and growth while the impact of initial conditions diminishes over time. According to our results this statement was incorrect; moreover, the effects are quite different. Although the transition progress can add something to growth in the first years of transition later its impact becomes irrelevant, whereas initial and inherited conditions constrain reforms as well as the level of output over all of the observed period.
In our view, even the effects of transition progress on growth in the first years of transition (which we have identified for 1998)19 could be understood in an alternative and more appropriate way. Basically, the transition from the early to late nineties was characterised by the fact that more developed countries i.e. countries with better potential for reforms, advanced faster in terms of GDP. This could be easily explained by taking into consideration a simple truth: in these economies all other factors of economic growth were better; higher income induced higher savings, human capital was of better quality, institutional environment and general attitude toward the new system was positive, easing in that way the reforms, and, in turn, attracting investors (while investments could be more effective than in other transition economies) etc. Looking backwards it seems that this was exactly what happened, particularly in Central Europe: Poland, Slovenia, Slovakia, Hungary and the Czech Republic are among those initially more developed countries, whose transition recession was shorter and performance better, while they had some market experience either through their own earlier reforms or because they had spent less time under a central planning regime20.
5. TRANSITION PROGRESS AND GROWTH: POSSIBIlITIES AND ACHIEvEMENTS
Following the results of the analysis presented we may conclude that the transition process seems to provoke an unexpected and somewhat peculiar pattern of growth: although proposed as a general policy for enhancing efficiency and better performance it has favoured primarily the more developed countries. However,
19 The impact of transition reforms on growth in the first phase (first several years) of transition followed by the diminishing influence in further phases/years have been remarked in a number of papers; see e.g. Fidrmuc (2003); Falcetti et al. (2005).
20 Nevertheless, even these countries have passed a longer and deeper recession than the one predicted by transition policy advisors (see: Tridico, 2006: 15-16).
Transition and Growth: What Was Taught and what Happened
19
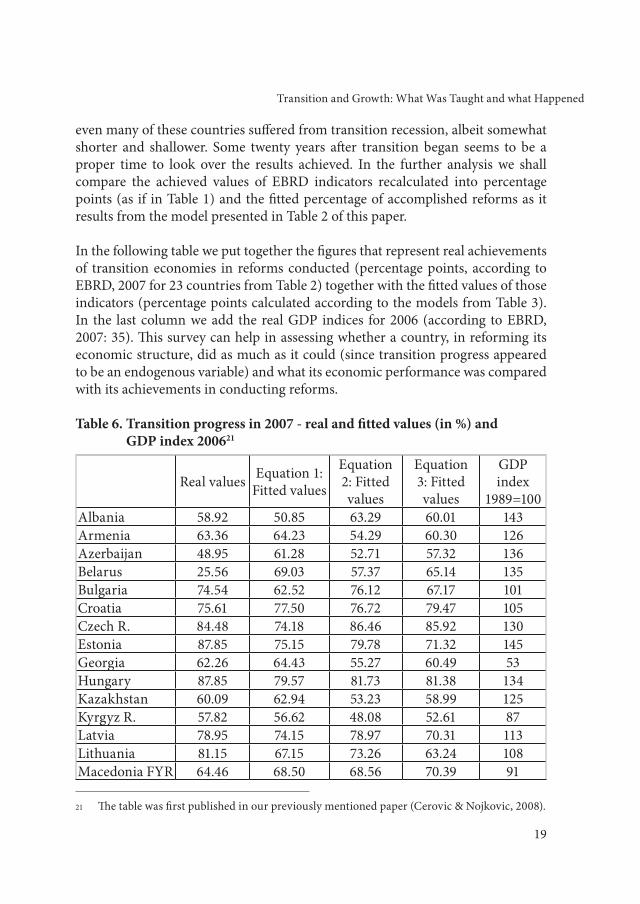
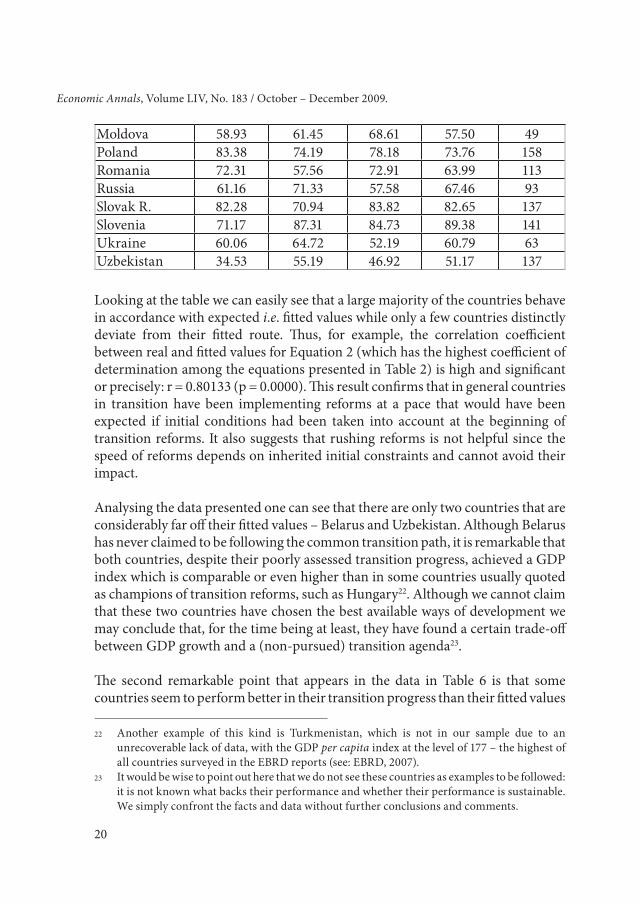
even many of these countries suffered from transition recession, albeit somewhat shorter and shallower. Some twenty years after transition began seems to be a proper time to look over the results achieved. In the further analysis we shall compare the achieved values of EBRD indicators recalculated into percentage points (as if in Table 1) and the fitted percentage of accomplished reforms as it results from the model presented in Table 2 of this paper.
In the following table we put together the figures that represent real achievements of transition economies in reforms conducted (percentage points, according to EBRD, 2007 for 23 countries from Table 2) together with the fitted values of those indicators (percentage points calculated according to the models from Table 3). In the last column we add the real GDP indices for 2006 (according to EBRD, 2007: 35). This survey can help in assessing whether a country, in reforming its economic structure, did as much as it could (since transition progress appeared to be an endogenous variable) and what its economic performance was compared with its achievements in conducting reforms.
Table 6. Transition progress in 2007 - real and fitted values (in %) and GDP index 200621
Real values Equation 1: Fitted values
Equation 2: Fitted values
Equation 3: Fitted values
GDP index
1989=100Albania 58.92 50.85 63.29 60.01 143Armenia 63.36 64.23 54.29 60.30 126Azerbaijan 48.95 61.28 52.71 57.32 136Belarus 25.56 69.03 57.37 65.14 135Bulgaria 74.54 62.52 76.12 67.17 101Croatia 75.61 77.50 76.72 79.47 105Czech R. 84.48 74.18 86.46 85.92 130Estonia 87.85 75.15 79.78 71.32 145Georgia 62.26 64.43 55.27 60.49 53Hungary 87.85 79.57 81.73 81.38 134Kazakhstan 60.09 62.94 53.23 58.99 125Kyrgyz R. 57.82 56.62 48.08 52.61 87Latvia 78.95 74.15 78.97 70.31 113Lithuania 81.15 67.15 73.26 63.24 108Macedonia FYR 64.46 68.50 68.56 70.39 91
21 The table was first published in our previously mentioned paper (Cerovic & Nojkovic, 2008).
20
Economic Annals, Volume LIV, No. 183 / October – December 2009.
Moldova 58.93 61.45 68.61 57.50 49Poland 83.38 74.19 78.18 73.76 158Romania 72.31 57.56 72.91 63.99 113Russia 61.16 71.33 57.58 67.46 93Slovak R. 82.28 70.94 83.82 82.65 137Slovenia 71.17 87.31 84.73 89.38 141Ukraine 60.06 64.72 52.19 60.79 63Uzbekistan 34.53 55.19 46.92 51.17 137
Looking at the table we can easily see that a large majority of the countries behave in accordance with expected i.e. fitted values while only a few countries distinctly deviate from their fitted route. Thus, for example, the correlation coefficient between real and fitted values for Equation 2 (which has the highest coefficient of determination among the equations presented in Table 2) is high and significant or precisely: r = 0.80133 (p = 0.0000). This result confirms that in general countries in transition have been implementing reforms at a pace that would have been expected if initial conditions had been taken into account at the beginning of transition reforms. It also suggests that rushing reforms is not helpful since the speed of reforms depends on inherited initial constraints and cannot avoid their impact.
Analysing the data presented one can see that there are only two countries that are considerably far off their fitted values – Belarus and Uzbekistan. Although Belarus has never claimed to be following the common transition path, it is remarkable that both countries, despite their poorly assessed transition progress, achieved a GDP index which is comparable or even higher than in some countries usually quoted as champions of transition reforms, such as Hungary22. Although we cannot claim that these two countries have chosen the best available ways of development we may conclude that, for the time being at least, they have found a certain trade-off between GDP growth and a (non-pursued) transition agenda23.
The second remarkable point that appears in the data in Table 6 is that some countries seem to perform better in their transition progress than their fitted values
22 Another example of this kind is Turkmenistan, which is not in our sample due to an unrecoverable lack of data, with the GDP per capita index at the level of 177 – the highest of all countries surveyed in the EBRD reports (see: EBRD, 2007).
23 It would be wise to point out here that we do not see these countries as examples to be followed: it is not known what backs their performance and whether their performance is sustainable. We simply confront the facts and data without further conclusions and comments.
Transition and Growth: What Was Taught and what Happened
21
would suggest. According to the data presented there are countries that almost systematically show a noticeably higher transition progress than the calculated (fitted) one, e.g. Estonia, Hungary, Lithuania, with Poland in first place. These countries have high EBRD assessments for achievements in transition; these high values of EBRD indicators go together with high GDP indices in Poland, Estonia and Hungary24, which, however, is true to a much lesser extent for Lithuania. On the other hand there are countries – like Slovenia known for its gradual and partially original approach to transition policies – that are systematically below the fitted values but nevertheless very convincing by the GDP index achieved. What might be the reason for this divergence?
Traditionally and following de Melo et al. one might assert that the policy set up in a country could be an explanation for some of these discrepancies. If the actual transition progress of a country is above the corresponding fitted value, we may think of this policy as a particularly good one, and the contrary if the result of a country stays below the related fitted value. However, we may also assume that the EBRD assessments – which stay behind our percentage figures – have possibly been overestimated in some cases and for the countries that are above their fitted values, and underestimated in the case of countries that stay below their fitted values for transition progress. Moreover, we can question whether the value of the EBRD indicators is particularly high for those countries that follow recommended transition policies more strictly, and too low for those that exhibit a certain degree of originality – but this could be left for another discussion.
From another perspective we may conclude that according to the figures presented – and as already stated – the transition process is still in progress and is not close to its end. Although at the beginning there was the idea of a close horizon that would designate the accomplishment of reforms, we have seen that after almost two decades many countries remain very much behind the projected goal. The point is that this misjudged period has direct consequences on performance: if the transition process were fast the corresponding transition recession and the corresponding U shaped GDP growth curve should be short and shallow. Since this is not true the transition recession including the subsequent recovery might last much longer and induce considerably higher costs than expected.
24 Ironically enough, two countries from this group – Estonia and Hungary – have recently experienced significant trouble: Estonia was in recession through 2008 with double digit inflation and with an external debt of around 115% of the GDP (v. Eesti Pank, 2008) and Hungary was badly stricken by the recent crisis and has been subject to a $25 billion rescue package delivered by the IMF, EU and World Bank, and is still facing serious problems.
22
Economic Annals, Volume LIV, No. 183 / October – December 2009.
Indeed, looking at the countries’ performance we can easily see that only ten countries in 2007, that is, after 18 years of transition efforts, have passed the limit of 130 in their GDP indices (base year: 1989), or have a real GDP growth of 30% or more over the observed period. Surprisingly enough, among these countries there are only three that have been assessed as frontrunners in the transition progress (Poland, Estonia and Hungary) and are above the fitted values for transition progress. The other three countries (Albania, Czech Republic and Slovakia) are – more or less – at their fitted figures. The remaining four countries are those that are lagging behind the fitted values but are not of the same kind – here we find Slovenia, an EU member and among the most successful transition economies according to the GDP index, although with a lower assessment for transition progress in comparison with the fitted values, but also the three former USSR republics – Azerbaijan, Belarus and Uzbekistan, which are on a low level of transition progress as well as below their fitted values for reform achievements (the reason for which differs across these countries). All the other countries are below the 130 line and among them six are still under the 100 level or, after 18 years, still under impact of transition recession25. Among those remaining countries there are only two that could be assessed as lagging behind their fitted transition progress and whose poor performance could be ascribed to ineffective government policies26.
According to the outcome presented it would be challenging to analyse the effects of the recent and/or ongoing crisis within transition economies. However, it seems that the remedies for the new blow that is currently hitting transition economies are considerably different as compared to those applied during the transition period in overcoming transition recession27.
25 It should be remarked that due to lack of data we did not present the figures for all transition economies, but if we had the picture would be even more disturbing. Thus for example, the western Balkans countries still exhibit poor performance although the reason might sometimes differ from those discussed in our paper (on data for these countries see, e.g. Bartlett (2009: 24-28).
26 Among this group of countries we find Russia, a country that has somewhat deteriorated according to the EBRD indicators for transition progress after the year 2000, but was simultaneously performing better in terms of GDP growth.
27 In this respect we agree with Nuti (2009: 20) who points out that policies applied in the current crisis like “monetary easing and low interest rates, fiscal subsidies and expansion, large scale state intervention” are all “diametrically opposite to the draconian hyper-liberal policies that contributed so much to aggravate the transition recession and the other costs of transition in the 1990s”.
Transition and Growth: What Was Taught and what Happened
23
6. TRANSITION AND GROWTH PECUlIARITIES IN THE lONG RUN
Summarising our previous results we have concluded that in the first period of transition there appears a certain relationship between transition progress and growth: transition progress seems to stimulate growth but is itself an endogenous variable that depends on initial conditions including the achieved level of GDP in the pre-transition period. Moreover, it was shown that the initial GDP level dominates in this relationship, which means that initial GDP is more correlated with transition progress than transition progress can be seen as a specific factor of growth.
This can additionally explain why transition economies exhibit peculiar behaviour when confronted with traditional long run growth models: the more developed economies perform better and grow faster. As mentioned above this peculiar outcome (together with some others that will be commented on below) has been presented by Campos (2001), but only for the first decade of transition. Since we have demonstrated that the transition process is still ongoing and is not approaching its end in most of the countries – at least not in the way it was designed – it is important to analyse whether transition economies show observed peculiarities in the current phase: that is, at the end of the second decade of transition.
Following Campos, we have explored two specifications: the one presented by Barro (1991) and the one put forward by Levin and Renelt (1992). The Barro model suggests that real GDP growth is a function of the initial level of per capita income, the level of human capital (measured by gross primary and secondary school enrolment rate) and the share of government consumption in GDP. In this specification initial income and government consumption are expected to have a negative effect on growth while human capital should have a positive impact. The Levin and Renelt specification suggests that initial level of per capita income, rate of population growth, level of human capital, and share of investments in GDP are key determinants of growth of an economy. Specifically, investments and human capital are expected to be positively related to growth, while initial income and population growth are expected to be negatively related to growth.
When Campos (2001) used Barro and Levine-Renelt models to examine the growth pattern in 24 transition economies covering the period from 1989 to 1998 he got several surprising results. Among the variables that have been identified as the long-run determinants of growth, only a few were statistically significant in the sample of transition economies. The signs for initial income per capita, population growth, government consumption and secondary education were opposite to
24
Economic Annals, Volume LIV, No. 183 / October – December 2009.
what one might expect, and not statistically significant. It was only the coefficient on basic education that showed an expected positive sign and was statistically significant. The coefficient on investments became statistically significant at the 10% level only when the baseline model was augmented by including the CIS dummy variable for the countries from the former USSR, which had a negative sign – as expected – and was statistically significant. Compared with the result obtained by traditional growth accounting, it is found that the Levine-Renelt and Barro approach performs poorly in a transition context. According to Campos (2001), econometric and data problems seem much less severe than the structural difference remaining after almost a decade of transition (i.e. when he presented his paper).
Concerned by these findings we have re-estimated the two specifications, using cross-sectional data of 25 transition economies and covering the whole period of transition – from 1989 to 2007, as well as the second transition decade – from 1999 to 2007. In Table 7 we demonstrate estimation results obtained together with the results found by Campos (2001) both for transition and non-transition economies.
Table 7. Barro and Levine-Renelt specifications – estimation results: Dependent variable: average annual GDP growth rate
Transition and Growth: What Was Taught and what Happened
25
Note: t-statistics for coefficient estimates in parentheses; *** denotes statistically significant at 1% level, ** denotes statistically significant at 5% level, * denotes statistically significant at 10% level.
In the table below we specify data definitions and sources used in the estimated models.
The two re-estimated specifications confirm the results of Campos (2001) even when the observed period has been extended to the entire transition era of almost twenty years28. Barro and Levine-Renelt coefficients are all insignificant. There are only a few minor changes in signs that are sometimes in accordance with the expected ones (secondary education and government consumption in Barro’s model).
28 There is another interesting result for both specifications: although the explanatory power of the models (adjusted R2) is relatively high for the two periods when observed separately, for the entire period it becomes weak and almost negligible. This indicates that the two phases of transition have been substantially different and gives us a new task for further research.
26
Economic Annals, Volume LIV, No. 183 / October – December 2009.
However, in the second period 1999-2007, according to our calculations presented in Table 7 there is some new evidence. These changes are fewer in Barro specifications and our results in estimating that model could be summarised as follows:
• Thelackofstatisticallysignificantcoefficientsisstillevident;• Thesignsofinitialincomeper capita and basic education are opposite to what
we should expect (although primary education remains significant) while the CIS dummy became insignificant and has obtained a negative sign;
• Secondary education does have an expected, positive sign but remainsstatistically insignificant;
• Government consumption has an expected, negative sign and becomessignificant in comparison with the preceding decade.
In estimating Levine-Renelt specifications we may note somewhat more expected adjustments. Basically, our findings indicate the following:
• Initial income per capita has an expected negative sign and is statisticallysignificant (contrary to the preceding period);
• Investmentshaveanexpectedsignandbecamemoresignificantincomparisonwith the preceding decade;
• Secondaryeducationremains statistically insignificantbutwithanexpectedsign;
• Thesign for thepopulationgrowthcoefficient remainsopposite towhatweshould expect and is not significant29;
• TheCISdummyremainssignificant,but–surprisingly–withapositivesign(meaning that CIS countries experienced larger output increases than the ones in Central European economies in the second decade of transition, despite their lower assessments for transition progress).
According to the results commented on we may conclude that transition economies still remain structurally different from other market economies at comparable levels of per capita income after almost two decades of transition efforts. This provides new evidence regarding the transition path that every transition economy has to travel: it appears much longer than predicted, which is in accordance with
29 This strange result is probably connected with the general climate of a transition economy: if there is some growth and better performance the standard of living is better and population growth higher. However, in many transition economies population growth was halted due to deterioration of living conditions, and even a high mortality rate has been related to certain transition policies like mass privatisation (see: Stuckler et al. 2009)
Transition and Growth: What Was Taught and what Happened
27
the data presented in our Table 1. On the other hand we may conclude that over time and in comparison with the results obtained for non-transition countries, the Barro and Levin-Renelt approach in particular starts to perform slightly better in later years of the transition process, or perhaps in the years when transition economies have managed somehow to adjust to the new economic environment and new economic settings (whatever their contents might be).
6. CONClUSIONS
Re-calculating the EBRD assessments for transition progress into percentage points we have shown that the transition process is still an ongoing process in a vast majority of transition economies and is far from its projected end. This is in sharp contrast with predictions and expectations of the duration of transition at the beginning of this process.
Moreover, this prolonged course of action is perfectly explicable when transition progress is seen as an endogenous variable that depends on initial conditions of a transition economy. According to the analysis conducted the hypothesis concerning the impact of initial conditions on the transition progress has been confirmed. The obtained results show that the influence of a country’s economic and institutional heritage lasts much longer than was envisaged at the beginning of transition and in the first transition advancement analyses.
A prolonged transition produces direct effects on growth: if the transition process had to be fast the corresponding transition recession and the corresponding U shaped GDP growth curve should be short and shallow; since this was not the case transition recession including subsequent recovery lasted much longer and induced higher costs than expected.
It was shown that in the first years of transition the progress achieved in reforming a country’s economic structure could play a certain role regarding that country’s performance. This is not necessarily due to the impact of reforms alone, since more favourable initial conditions positively affect both reforms and performance – the latter one via known factors of growth. Nevertheless, in the longer run this effect fades out and currently there is no significant relationship between performance and transition progress (even if it could influence growth it would make an unfavourable impact since the correlation coefficient between the two series has a negative sign).
28
Economic Annals, Volume LIV, No. 183 / October – December 2009.
From a different perspective the initial impact of the transition progress in the first years of transition could be understood as a peculiar and unexpected outcome from the standpoint of traditional long-term growth models. Since a faster transition progress depends on a higher initial level of development and a country’s other favourable initial conditions this will favour better-developed countries to attain higher GDP growth rates.
The analysis of the two long-term growth models has confirmed the above proposition: it was shown that in the first years of transition one may encounter peculiar results. In general, the more developed countries perform better, which in turn, obstructs catch-up attempts of the poorer countries. In the second decade of transition the models do not exhibit all the peculiarities observed during an earlier transition phase but still do not behave in an expected way (although results may slightly diverge depending on the model specification observed).
Nevertheless, this peculiar growth pattern and the corresponding sequence of events could explain why a forced, uniform and quick transition – primarily in the countries that do not have necessary prerequisites for fast reforms concerning their initial conditions – may harm the growth abilities of these countries. Since poorer initial conditions do not support fast and radical changes towards the model of a developed market economy it follows that some countries could perform better under less aggressive institutional adjustments and with persistent but slower institution building and restructuring.
This brings us to our final point: reforms were inevitable but their effects, speed and sequencing should have been studied more carefully prior to implementation. In brief, the reform process under transition would have been more successful if it had been adjusted to the initial conditions of each country. Since this was not the case we might conclude that many transition economies have faced unnecessarily big losses in terms of growth and suffered a substantial delay in the catch-up process.
ACKNOWlEDGEMENTS
We are grateful to D. M. Nuti, Y. Kalyuzhnova, P. Filipic and M. Uvalic for helpful comments on some earlier drafts of this paper. We are also thankful to the participants at the 8th International Conference “Challenges of Europe” held in Bol, Croatia (May 2009) and the 7th AISSEC Conference held in Perugia, Italy (June
Transition and Growth: What Was Taught and what Happened
29
2009) for their useful remarks on some parts of this paper which we presented during these events.
Barro, R. (1991) “Economic Growth in a Cross Section of Countries”, Quarterly Journal of Economics, Vol. 106, no. 2 (May), pp. 407-443
Bartlett, W. (2009) “Economic development in the European super-periphery: Evidence from the Western Balkans”, Economic Annals, Vol. LIV, no. 181, pp. 21-44.
Campos, N. F. (1999) “Context is Everything: Measuring Institutional Change in Transition Economies”, World Bank Working Paper, No. 2269
Campos, N. F. (2001) “Will the Future Be Better Tomorrow? The Growth Prospects of Transition Economies Revisited” Journal of Comparative Economics, Vol. 29, pp. 663-676.
Cerović, B. (2000) “Privrede u tranziciji: desetogodišnje iskustvo privatizacije”, in: Vlasnička transformacija preduzeća i banaka: jugoslovenska i međunarodna iskustva i perspektive, NDEJ, Beograd, str. 9-35
Cerović, B. and A. Nojković (2008) “Measuring Transition Progress: Endogeneity and Initial Conditions”, u: Memaj, F. and Kächelein, H (eds.), Economic and Social Challenges and Problems, Vol. 1, Fakulteti i ekonomise, Tiranë, 2008, pp. 113-128
Cerović, B. and A. Nojković (2008a) “Usporavanje reformi u Srbiji: trošak neiskorišćenih mogućnosti”, in: Zec, M. and Cerović, B. (eds.), Kuda ide Srbija – ostvarenja i dometi reformi, Ekonomski fakultet Beograd
De Melo, M., C. Denizer, and A. Gelb (1996) “From Plan to Market: Patterns of Transition” Policy Research Working Paper no. 1564, The World Bank, Policy Research Department
De Melo, M., C. Denizer, A. Gelb, and S. Tenev (1997) “Circumstance and Choice: The Role of Initial Conditions and Polices in Transition Economies.” Policy Research Working Paper no. 1866, The World Bank, Policy Research Department
Dornbusch, R. (1991) “Strategies and Priorities in Reform”, in: Marer, P. and Zecchini, S. (eds.), The Transition to a Market Economy, OECD, Paris, pp. 169-183
EBRD (2007) Transition Report, London, EBRD
EBRD (2008) web page: http://www.ebrd.com/country/sector/econo/stats/index.htm
REfERENCES
30
Economic Annals, Volume LIV, No. 183 / October – December 2009.
EBRD (2008a) Transition Report, London, EBRD
Eesti Pank (2008), Bank of Estonia, Autumn Forecast, web page: http://www.eestipank.info/pub/en/dokumendid/publikatsioonid/seeriad/ylevaade/_2008_02/_3_208.pdf
Ellerman, D. (2003) “On the Russian Privatization Debate”, Challenge – The Magazine of Economic Affairs, May-June, pp. 6-28
Falcetti, E., T. Lysenko, and P. Sanfey (2005), “Reforms and growth in transition: re-examining the evidence”, EBRD, Working Paper no. 90.
Fidrmuc, J. (2003), “Economic reform, democracy and growth during post-communist transition”, European Journal of Political Economy, Vol. 19, pp. 583-604.
Fischer, S. and A. Gelb (1991) “The Process of Socialist Economic Transformation”, The Journal of Economic Perspectives, Vol. 5, No. 4, pp. 91-105
Fischer, S., R. Sahay, R, C. A. Vegh (1996) “Stabilization and Growth in Transition Economies: The Early Experience”, The Journal of Economic Perspectives, Vol. 10, No. 2 (Spring), pp. 45-66
Fischer, S. and R. Sahay (2004) “Transition Economies: The Role of Institutions and Initial Conditions”, IMF, Festschrift in Honor of Guillermo A. Calvo, April, 15-16, 2004, mimeo
Gabrisch, H. and J. Hölscher (2006) “The Success and Failures of Economic Transition – The European Perspective“, Palgrave Macmillan, Basingstoke – New York
Havrylishyn, O. and R. van Rooden (2000) Institutions matter in transition, but so do policies, IMF Working Paper, WP/00/70
Heybey, B. and P. Murrell (1999) “The Relationship between Economic Growth and the Speed of Liberalization During Transition”, Journal of Policy Reform, Vol. 3, No. 2, pp. 121-137
Krueger, G. and M. Ciolko (1998) “A Note on Initial Conditions and Liberalization during Transition”, Journal of Comparative Economics, Vol. 26, 4, December, pp. 718-734.
Levine, R. and D. Renelt (1992) “A Sensitivity Analysis of Cross-Country Growth Regressions”, American Economic Review, Vol. 82, September, pp. 942-963.
Moers, L. A. M. (1999) “How Important are Institutions for Growth in Transition Economies?”, Tinbergen Institute Discussion Papers, No. 99-004/2
Nuti, D. M. (2008) “Alternative targets, paths and speed in post-socialist transition”, EACES Conference, Moscow, mimeo
Transition and Growth: What Was Taught and what Happened
31
Nuti, D. M. (2009) “The impact of the global crisis on transition economies”, Economic Annals, Vol. LIV, no. 181, pp. 7-20.
Popov, V. (2000) “Shock Therapy versus Gradualism: The End of the Debate (Explaining the Magnitude of Transformational Recession)”, Comparative Economic Studies, 42, 1, pp. 1-57
Radulescu R. and D. Barlow (2002), “The relationship between policies and growth in transition countries”, Economics of Transition, Vol. 10, no. 3, pp. 719-745.
Roland, G. (2007) Keynote address “Civil Society and Institutional Change: The Great Transition” at the seventh international conference Enterprise in Transition, Bol, Croatia, May 2007.
Sachs, J. D. (1996) “The Transition at Mid Decade”, American. Economic Review, Papers & Proceedings 86, 2 May, pp. 128 –133
Stiglitz J. E. (2001) “Quis custodiet ipsos custodes? Corporate Governance Failures in the Transition”, in J. E. Stiglitz and P-A. Muet (eds.) Governance, Equity and Global Markets: The Annual Bank Conference on Development Economics – Europe, New York, Oxford University Press, pp. 22-54
Stuckler, D., L. King, M. McKee (2009) “Mass privatisation and the post-communist mortality crisis: A cross-national analysis”, The Lancet, Vol. 373, Issue 9661, pp. 399 - 407, 31 Jan. web page: http://www.thelancet.com/journals/lancet/article/PIIS0140-6736(09)60005-2/fulltext
Tridico, P. (2006) Institutional Change and Human Development in Transition Economies, Working Paper no. 59, Università degli Studi, Roma Tre