what has finite element analysis taught us about diabetic foot disease and its management? a...
TRANSCRIPT

What Has Finite Element Analysis Taught Us aboutDiabetic Foot Disease and Its Management? A SystematicReviewScott Telfer1,2*, Ahmet Erdemir3, James Woodburn1, Peter R. Cavanagh2
1 Institute for Applied Health Research, Glasgow Caledonian University, Glasgow, United Kingdom, 2 Department of Orthopaedics and Sports Medicine, University of
Washington, Seattle, Washington, United States of America, 3 Computational Biomodeling (CoBi) Core, Department of Biomedical Engineering, Cleveland Clinic,
Cleveland, Ohio, United States of America
Abstract
Background: Over the past two decades finite element (FE) analysis has become a popular tool for researchers seeking tosimulate the biomechanics of the healthy and diabetic foot. The primary aims of these simulations have been to improveour understanding of the foot’s complicated mechanical loading in health and disease and to inform interventions designedto prevent plantar ulceration, a major complication of diabetes. This article provides a systematic review and summary ofthe findings from FE analysis-based computational simulations of the diabetic foot.
Methods: A systematic literature search was carried out and 31 relevant articles were identified covering three primarythemes: methodological aspects relevant to modelling the diabetic foot; investigations of the pathomechanics of thediabetic foot; and simulation-based design of interventions to reduce ulceration risk.
Results: Methodological studies illustrated appropriate use of FE analysis for simulation of foot mechanics, incorporatingnonlinear tissue mechanics, contact and rigid body movements. FE studies of pathomechanics have provided estimates ofinternal soft tissue stresses, and suggest that such stresses may often be considerably larger than those measured at theplantar surface and are proportionally greater in the diabetic foot compared to controls. FE analysis allowed evaluation ofinsole performance and development of new insole designs, footwear and corrective surgery to effectively provideintervention strategies. The technique also presents the opportunity to simulate the effect of changes associated with thediabetic foot on non-mechanical factors such as blood supply to local tissues.
Discussion: While significant advancement in diabetic foot research has been made possible by the use of FE analysis,translational utility of this powerful tool for routine clinical care at the patient level requires adoption of cost-effective (bothin terms of labour and computation) and reliable approaches with clear clinical validity for decision making.
Citation: Telfer S, Erdemir A, Woodburn J, Cavanagh PR (2014) What Has Finite Element Analysis Taught Us about Diabetic Foot Disease and Its Management? ASystematic Review. PLoS ONE 9(10): e109994. doi:10.1371/journal.pone.0109994
Editor: Amit Gefen, Tel Aviv University, Israel
Received May 12, 2014; Accepted September 12, 2014; Published October 7, 2014
Copyright: � 2014 Telfer et al. This is an open-access article distributed under the terms of the Creative Commons Attribution License, which permitsunrestricted use, distribution, and reproduction in any medium, provided the original author and source are credited.
Data Availability: The authors confirm that all data underlying the findings are fully available without restriction. All relevant data are within the paper.
Funding: ST is funded through the People Programme (Marie Curie Actions) of the European Union’s Seventh Framework Programme (FP7 2007–2013) underREA Grant Agreement No. PIOF-GA-2012-329133. The funders had no role in study design, data collection and analysis, decision to publish, or preparation of themanuscript.
Competing Interests: The authors have read the journal’s policy and have the following competing interests: Peter Cavanagh has equity in DIApedia LLC.Ahmet Erdemir has equity in Innodof LLC. This does not alter the authors’ adherence to PLOS ONE policies on sharing data and materials.
* Email: [email protected]
Introduction
Ulceration occurring at the plantar surface of the foot in people
with diabetes remains common, debilitating, difficult to treat, and
costly [1–3]. In the absence of ischemia, neuropathy and the
subsequent loss of protective sensation have been shown to be the
main risk factors for the development of a first ulcer [4]. This,
combined with repeated stresses on areas around bony promi-
nences where protective tissues have been displaced [5] or have
had their mechanical properties altered by the disease [6], is
thought to be a key mechanism for ulcer development [7].
The complexity of the foot – both in terms of anatomy and
function – and the difficulty in performing in vivo measurements
over the full range of physiological stresses and strains that occur
during functional loading have led researchers to seek ways of
replicating its behaviour via computer-based simulations. For the
diabetic foot, perhaps the most popular of these techniques is finite
element (FE) analysis (also known as the finite element method), a
form of simulation that allows the numerical solution of differential
equations to predict the deformation field [8]. In practical terms,
and as it relates to foot biomechanics, FE analysis allows us to find
answers to complicated physical problems such as determining the
response of the foot and the individual tissues that make up its
anatomy to applied non-uniform loading.
FE analysis has proven to be a powerful tool for a number of
engineering applications, and has been utilised by researchers
PLOS ONE | www.plosone.org 1 October 2014 | Volume 9 | Issue 10 | e109994

carrying out a wide range of biomechanical investigations [9,10].
An FE model produced for a biomechanical investigation consists
of virtual representations of individual anatomical structures
including, for example, bones and various soft tissues. These
structures are each sub-divided into a large number of discrete but
connected elements. While the overall geometry of each part may
be complex, the geometry of the individual elements which
together approximate its shape is not. Because of this, if the
material properties of the element represents are known, the effects
of applying a load, be it mechanical, thermal or other, to the
individual element can be easily determined. By translating these
effects to the surrounding elements, the effects on the larger more
complex model can be calculated. Through this approach,
numerous variables can be studied, such as contact pressures,
internal stresses and strains, and energy transfers. In addition, it is
possible to include non-biological components - for example an
implant, an orthoses, or footwear - in the model, and thus simulate
their effects and performance.
A fundamental advantage of the FE analysis approach for foot
and footwear mechanics is its capacity to conduct parametric
studies, which can help provide insights into foot function as a
result of tissue behaviour, or can allow virtual prototyping, i.e. by
varying the material properties or geometry of an insole. For
researchers studying the biomechanics of the diabetic foot, the
ability to generate these types of highly controlled results without
the need for difficult and costly in vivo or cadaveric experiments
makes FE analysis highly appealing.
This review of the literature is intended to provide a systematic
overview of research that has used FE analysis to improve our
understanding of the pathomechanics of the diabetic foot and to
inform its management. Methodological considerations of the
approach are addressed and insights gained are summarised.
Methods
1. Search strategyPUBMED and Web of Science databases were searched for
relevant peer reviewed articles using the keywords ‘‘diabetic’’,
‘‘foot’’, ‘‘finite element’’ and related synonyms on November 25th,
2013. A representative search strategy is provided in Appendix S1.
There were no limitations on publication dates but only English
language articles were eligible for inclusion. Reference lists were
examined for additional, relevant articles.
2. Study selectionThis review considered original research studies that utilised FE
models of the foot or part of the foot to simulate function, tissue
behaviour, or structural deformities associated with the diabetic
foot disease. In addition, studies using FE analysis to study
footwear, insoles, or surgical interventions intended to reduce
ulceration risk in people with diabetes were eligible for inclusion.
Abstracts were screened and relevant articles selected for full text
review. Full text papers were then reviewed to determine if they
met the inclusion criteria. Screening and reviewing of articles was
carried out by a single researcher (ST). For cases where it was
unclear if the article met the inclusion criteria, a second researcher
(AE) assessed the full text and the decision on whether or not to
include the article was resolved by discussion between the review
authors.
Results
Fifty unique articles were identified from the literature search
and of these, 31 met the eligibility criteria for inclusion (Figure 1).
Articles were divided into three thematic groups: 1) studies on the
methodological aspects of FE analysis of the diabetic foot; 2)
investigations of the pathomechanics of the diabetic foot and; 3)
the design of interventions intended to reduce ulceration risk. The
included articles are summarised by group in Tables 1–3
respectively. In addition to discussing methodological aspects of
modelling the diabetic foot, this article also presents a brief
overview of the typical processes used to develop a model of the
diabetic foot (or part of the foot) based on the reviewed literature.
1. Methodological aspects of FE investigations of thediabetic foot
FE analysis is potentially complex with a large number of
decisions required within the process of developing a model. This
section gives a brief overview this process and the examples of the
choices made by researchers when producing simulations of the
foot. This is intended as a generic workflow, similar to those used
in other FE-based biomechanical studies, and it should be noted
that the specific order and implementation of the events described
may vary depending on the software used and other factors.
1.1 Geometry definition. The first stage of model develop-
ment is to define the geometry of its constituent parts. Both 2D
and 3D models have been included in this review, and these vary
by their level of detail and personalisation. Two-dimensional
models of the diabetic foot, generally representing a cross-section
of the anatomy in the sagittal [11] or coronal plane [12], have the
advantage of being faster to define and solve than 3D models,
however, they cannot adequately represent any out of plane
deformations of the tissue. For geometrically personalised 2D
models, researchers have derived anatomical information on the
structure of the foot from X-rays [13], computed tomography [14]
and magnetic resonance imaging [15]. For accurate 3D represen-
tations of intrinsic anatomy, these have generally been recon-
structed from the latter two imaging techniques by image
segmentation as shown in Figure 2a [16,17]. This can be a time
and labour expensive step, although it may be automated to
varying degrees depending on the accuracy required. Surface
scanning or digitising of dissected parts of anatomy from cadavers
after dissection has also been utilized [18]. If muscle forces or
ligaments are to be included in the model, insertion and ‘‘via
points’’ need to be defined from the imaging data and/or from
standard anatomical references [17].
Deciding which anatomical structures to include in the foot
model is an important question that needs to be addressed during
the development process. Several groups have taken the approach
of producing highly detailed models which attempt to include a
large number of components including individual bones, liga-
ments, muscles, etc [18–20]. While this approach provides a more
realistic representation of the foot, and hypothetically should
produce more accurate results, the complexity of the model makes
it time intensive both in terms of development and solution times,
which in our experience can take several days, limiting their
clinical utility.
For this reason, simplified models that do not represent the full
anatomy but are intended to provide useful estimates in shorter
timeframes have also been of interest to researchers [21,22]. Actis
et al. [14] carried out a range of simulations on a 2D model of the
sagittal plane of the foot through the 2nd and 3rd ray to assess the
effects of removing anatomy such as the plantar fascia and flexor
tendon from their model. Results showed that modelling the
phalanges of the toes as a single bone caused negligible changes to
the model results, but that the inclusion of bones, cartilage, plantar
fascia, flexor tendon and encapsulated soft tissue was necessary to
provide accurate contact pressures at push off. Petre et al. [23]
Finite Element Simulations of the Diabetic Foot
PLOS ONE | www.plosone.org 2 October 2014 | Volume 9 | Issue 10 | e109994

used an inverse FE model of the forefoot to study the effect of
including different layers of plantar tissue - skin, fat pad and
muscle - on the results. They found that representing all plantar
tissue as a combined part with uniform material properties was
adequate for predicting contact pressures; however internal
stresses between layers could not be accurately predicted in this
manner.
A further option, which has been reported in several of the
studies included in this review, is the use of geometrically
simplified models [21,24–26]. These models utilise basic geometric
shapes to represent the foot anatomy, for example a simple semi-
circle to represent the plantar surface of the calcaneus in contact
with the fat pad in the coronal plane [24]. While it is unclear if
such models are able to provide accurate absolute patient-specific
estimates values for model variables, this approach has the
advantage of being quick to construct and solve, and can provide
general insights into biomechanical characteristics [21] and FE
simulation methodology [26].
1.2 Meshing. The foot model then requires its individual
components to be meshed, i.e. divided into discrete elements
joined by nodes to allow it to be analysed (Figure 2b). Depending
on the element geometry used and the complexity of the part, this
process may be automated or may require significant user input. A
range of element geometry was used in the studies included in this
review including triangular [27] or quadrilateral [28] elements for
2D models and for 3D shell parts where only the surface is meshed
[26], and tetrahedral [29] or hexahedral [30] elements for solid
3D parts. Within these basic shape groups, a number of additional
options relating to the behaviour of the element can be assigned
depending on the situation being modelled, for example reduced
integration which can reduce run times at the expense of accuracy,
or hybrid elements which are intended to model incompressible
materials such as plantar soft tissue. Tadepalli et al. [26] tested a
variety of elements for their suitability to model soft tissue
behaviour (nonlinearly elastic, nearly incompressible or fully
incompressible) in conjunction with footwear components and
found that hybrid linear tetrahedral elements performed poorly
when shear forces were applied, potentially limiting their
suitability for studies on the foot. Hybrid linear hexahedral and
quadratic tetrahedral elements reduced this problem, the latter at
the expense of increasing the overall run time of the model and
requiring the incompressibility restraint to be relaxed.
The density of the mesh (i.e. the number of elements making up
the part) is an important factor if the model is to produce valid
results. Using a converged mesh where the density is such that
potential artefacts in the simulation results are minimised should
give more accurate results. However the trade-off can be an
exponential increase in the computational memory required and
the time taken to solve the model. The approach adopted in many
of the studies in this review is to perform a convergence analysis,
i.e. to find a suitable mesh density by refining the discretisation
until changes in the output metrics fall below a pre-defined
acceptable level, suggesting that the density is sufficient to simulate
the problem [11,31,32].
1.3 Material properties. The next stage is for material
properties to be defined for the various components of the model
which, for the studies in this review, these are primarily related to
mechanical behaviour. Properties can be drawn from existing
Figure 1. Flow of studies. From the initial 68 citations identified, 37 were excluded after removal of duplicates, initial screening of abstracts andreview of full texts.doi:10.1371/journal.pone.0109994.g001
Finite Element Simulations of the Diabetic Foot
PLOS ONE | www.plosone.org 3 October 2014 | Volume 9 | Issue 10 | e109994

literature [18] and in some cases combined with personalised data
from in vitro or in vivo tests [14]. Additionally, to reduce
complexity and increase model speed, some components may be
defined as mechanically rigid, meaning that in the simulation they
do not deform under load, for example Gu et al. [33] chose to
model the ground in this way.
The plantar soft tissues of the foot in particular have been
shown to have non-linear viscoelastic behaviour that may be
highly variable between individuals [6,12,23]. A number of
researchers, particularly in earlier studies, chose to define the
plantar soft tissues in their models as having linear behaviour
[13,21]. However, all articles published since 2008 have used a
non-linear material definition, generally Ogden hyperelastic, for
plantar soft tissue. This compares to 43% of studies published
prior to 2008 that used a non-linear formulation (see Tables 1–3).
Other researchers have added additional hydrostatic constraints
on the plantar tissues to allow the effect of tissue stiffening on
arterial flow to be assessed [34].
Rather than defining the individual layers of skin, muscle, fat
pad etc., many researchers have chosen to collapse these together
as lumped models and to define the bulk properties of this
combined encapsulated plantar tissue [19]. As described previ-
ously, this approach can provide accurate estimates of contact
pressures, however it does not allow the interfaces between or
stresses on individual layers to be studied [23].
1.4 Interactions, boundary conditions and loading. Once
the geometry of the parts have been defined it is necessary to
characterise how they interact with one another. Models with more
than one component are assembled and the parts positioned relative
to each other as required (Figure 2c). Contact surfaces or tied
interfaces between different tissues, connector definitions at joints
etc., may be used depending on the model. To allow realistic
simulation of the foot interfacing with an insole for example, the
contact behaviour between the surfaces need to be defined, usually
in form of friction coefficients. Researchers have used friction
coefficients between the plantar surface and ground ranging from
0.3 [26] to 0.6 [18]. Application of concentrated or distributed loads
to the model, in combination with boundary conditions to constrain
the movement of parts in certain directions, allow the simulation of
simplified or lifelike scenarios to deform the foot. In previous studies
Table 1. Studies on the methodological aspects of modeling the diabetic foot.
Article Model Validation Key finding(s)
2D/3D
Anatomy/Components(ground/floor alsomodelled unlessotherwise stated) Simulation
Petreet al., 2013
3D Metatarsals, phalanges,muscle (NL), fat pad,(NL), skin (NL)
Inverse models todetermine materialproperties offorefoot softtissue. ModelA: bulkencapsulatedsoft tissue;model B: layersof soft tissue
Percentage errorin fit of optimisedmaterial propertiescompared to MRIand plantar pressuremeasurements = 5.1%.MSA = Y.
The internal stressesand deformationspredicted by the modelare affected by theinclusion of multiplelayers of soft tissue.Small changes inmaterial coefficientscan have large effectson tissue strain
Tadepalliet al., 2011
3D Geometric representationof calcaneus, heel pad(NL) and insole.
Compressiveand combinedcompressive/shearloading
No validationexperiment includedin protocol.MSA = Y
Run times and resultvariations for differentelement types andloading conditionsproduced
Actis etal., 2006
2D 2 cross-sectional planesthrough the 2nd and 3rd raysof the foot includingrelevant foot bones,cartilage, encapsulated softtissue (NL) flexor tendonand plantar fascia, shoewith total contact insole
Six models ofdifferent complexityrun to assesseffect onpredictionat push-off
Correlation (r), bias(b) and dispersion(SD) of pressureprofiles on areasaround 2nd and 3rd
met heads.Meanr = 0.885;minr = 0.7;meanb = 16.6;maxb = 38.1;meanSD = 56.6;maxSD = 150.9.MSA = Y
For accurate simulationsof push off (barefootand shod) FE modelsrequire rearfoot,forefoot and toesegments separated bycartilage, flexortendon, plantar fasciaand soft tissue withNL properties.
Yarnitzkyet al., 2006
2D Heel and 1st metatarsalplantar soft tissue (L) usingFE analysis and combinedwith higher order analyticalmodel of rearfoot, forefootand hallux.
Real timeanalysis duringgait.
Compared withresults frompublished dataand phantomfoot with siliconrepresenting softtissue. Meandiff = 10%; maxdiff = 17%. MSA = NR
Proof of conceptprototype ofreal-time FE analysissystem
L: linear; NL: non-linear; MSA: mesh sensitivity analysis; NR: not reported.doi:10.1371/journal.pone.0109994.t001
Finite Element Simulations of the Diabetic Foot
PLOS ONE | www.plosone.org 4 October 2014 | Volume 9 | Issue 10 | e109994

researchers have chosen to apply loading directly to the dorsal
surface of the model [31] or in the form of force vectors attached to
insertion points on bones that are intended to mimic the forces and
action of selected muscles related to the simulation, attempting to
drive the model in a more realistic manner [29].
1.5 Analysis. The complexity and computational demands of
simulating the foot throughout stance phase has meant that the
majority of studies attempting to simulate the diabetic foot have
used a quasi-static modelling approach, where the simulation is
solved for a particular instance of stance phase (often the time of
peak forefoot loading [31]) or repeated the simulation at several
instances throughout stance phase [20]. A further commonly
reported approach is to simulate the foot during balanced standing
[11]. In each case the foot has to be orientated close to the analysis
position prior to loading being applied. Attempts have been made
to produce a real-time model suitable for clinical monitoring of the
diabetic foot [21] using a hierarchical model which combined an
analytical 2D three segment model of the foot (essentially hindfoot,
forefoot and hallux) with 2D sagittal FE models of the plantar pad
under the heel and distal metatarsal head.
FE models can generate a large amount of detailed information,
and interpreting these data such that simple, clinically relevant
metrics can be provided is important. In the articles included in
this review, data was often provided visually as colour contour
maps (as in Figure 2d) and simple magnitude-based variables such
as Von Mises stresses [11], surface pressures [35] or shear forces
[36] within anatomical regions of interest. Primary output
measures used by the reviewed studies are listed in Tables 1–3.
2. Investigating the pathomechanics of the diabetic footIn the studies included in this review, the effect of diabetes on
the foot was primarily simulated by increasing the stiffness or
reducing the thickness of the plantar soft tissues (see Table 2). A
number of experimental studies have found differences in these
variables when comparing patients with diabetes to healthy
controls [6,37]. However, it is worth noting that Erdemir et al.
[12] when using an inverse FE model to determine heel pad tissue
properties, found no statistical difference in tissue behaviour
between the groups but high variability in the results.
Stresses on the plantar surface of the foot remain highly relevant
in assessments of the diabetic foot and ulceration risk. Several FE
studies have demonstrated increases in peak plantar pressures
associated with stiffening and thinning of plantar tissues in both
2D [11,27] and 3D [13,19,20,33,38] models of varying complex-
ity. In addition to investigating surface stresses, FE simulations
suggest that the internal stresses on plantar tissues may be several
times larger [16] and increase at a greater rate with tissue stiffening
[11,20]. These studies included those that modelled the plantar
soft tissues both as 2D bulk tissue [11,16] and as 3D individual
layers [20]. The bulk tissue models tended to predict larger
increases in peak internal stresses for similar levels of stiffening,
possibly reflecting the difficulties in accurately estimating these
variables using a combined model [23]. In terms of location, peak
internal stresses were predicted near the metatarsophalangeal
joints [11], near the bony prominences of each metatarsal head
[16], and under the 3rd and 4th metatarsal heads midway between
the bone and plantar surface [20]. It should be emphasised
however that the single-subject nature of the models, along with
the abovementioned issues in modelling the tissue layers, means
that caution should be applied if attempting to extrapolate these
findings to the general or patient population.
FE analysis also allows plantar shear stresses to be estimated.
This is a variable that can be difficult to measure experimentally
but which has been suggested as a mechanism for plantar
ulceration [39], however there is currently no prospective evidence
to support this. Both Thomas et al. [13] and Cheung et al. [19]
have found that when comparing control simulations to simula-
tions of the diabetic foot with increased soft tissue stiffness and
reduced thickness of plantar soft tissue, shear stresses could
increase by .50% when compared to a control simulation during
push off and balanced standing.
FE models can also be used in an inverse manner to determine
the material properties of an individual’s soft tissue using a
combination of imaging and force data. Erdemir et al. [12] used
an inverse FE technique using data from an ultrasound indenter
Figure 2. Development process for FE model of the foot. (A):Geometry of part constructed from CT slices of foot; (B): parts meshedinto elements; (C): parts combined and interactions between themdefined; (D): results of analysis, von Mises stresses (left) and plantarcontact pressures (right).doi:10.1371/journal.pone.0109994.g002
Finite Element Simulations of the Diabetic Foot
PLOS ONE | www.plosone.org 5 October 2014 | Volume 9 | Issue 10 | e109994

Table 2. Investigations of the pathomechanics of the diabetic foot.
Paper Model Validation Key finding(s)
2D/3D
Anatomy/Components(ground/floor alsomodelled unlessotherwise stated) Simulation
Mithraratne Ket al., 2012
3D Foot bones,muscles, softtissues (NL),arteries
Baseline and 3levels of tissuestiffening. Heelstrike, mid-stanceand toe-offmodelled.
As reportedin Fernandezet al. (2012)
Increasing softtissue stiffnessby a factor of 2reduces bloodflow to theaffected regionby 28%
Fernandez et al.,2012
3D Foot bones,muscles, softtissues (NL),nerves
Baseline and 3levels of tissuestiffening. Heelstrike, mid-stanceand toe-offmodelled.
Peak plantarpressures (PP) andcontact areas (CA).PP mean diff = 7.7%;max diff = 10.1%; CAmean diff = 8.8%; CAmax diff = 14.3%.MSA = Y
Internal tissuestress up to 1.6times greater thanplantar surfacestresses. Increasingtissue stiffness bya factor of 2.5increased plantarpressures by30–40%
Chenet al., 2010
3D Bone, cartilage,ligaments(inc. plantar fascia),encapsulated softtissue (NL).Selected muscleforces applied
Balancedstanding
Peak plantarpressures. Meandiff (based on 3sites) = 14.1%; Maxdiff = 29.2%(more sites tested butnot reported).MSA = Y
Internal stressescan be up to3 times greaterthan thosemeasured on theplantar surface
Gu et al.,2010
3D Rearfoot bones,fat pad (NL)and skin (NL)
a) Inverse FE modelused to determineskin propertiesb) 4 levels of skinstiffness modelledduring heel strike
Peak pressureduring heel strike.MeanDiff = 6.3%.MSA = Y
Increasing skinstiffness by afactor of 3 leadsto an increase inpeak heel plantarpressure of 14.2%
Agicet al., 2008
2D Cross-sectionalplane through the1st ray of the footincluding relevantfoot bones, cartilage,ligaments (NL),skin (NL) andencapsulated softtissue (NL)
Balancedstanding
No validationexperimentincluded in protocol.MSR = NR
Increased softtissue stiffnessleads to increasedpressure under theforefoot andrearfoot
Erdemiret al., 2006
2D (a) 2D simplegeometry of heelpad and indentor;and (b) 2D coronal planeslice through calcaneusand heel pad (NL)
(a) Inverse model todetermine materialproperties viaultrasound indenter.(b) Tissue stiffnessand thickness variedwhile standing,walking and runningloads are applied toheel
a) Predicted vsmeasured force onindenter. Mean RMSerror for peak = 2.3%.b) Peak pressure andcontact area underheel: mean diff: 3.1%;mean diff 13.9%.Max diff = NR.MSA = NR
Tissue propertiesof diabetic heelsimilar to age andBMI matchedcontrols. InverseFE model todetermine materialpropertiesvalidated. Variation inindividual tissueproperties is such thatsubstantial errors whenusing generic properties
Cheunget al., 2005a
3D All bones(phalanges fused)cartilage, all majorligaments andencapsulated softtissue (NL)
Stiffness of softtissue varied byfactors of 2, 3 and 5during balancedstanding
Peak pressuresbeneath heel and allmetatarsal headsduring barefootstanding. Meandiff = 42.1%; maxdiff 68.8%.MSA = Notreported.
Increasing tissuestiffness by 500%results in increasedplantar pressures of 35%at forefoot and up to80% increases in shearstresses Changes inbone stresses alsoreported
Finite Element Simulations of the Diabetic Foot
PLOS ONE | www.plosone.org 6 October 2014 | Volume 9 | Issue 10 | e109994

instrumented to also measure force and found that the mechanical
properties of the heel pad in patients with diabetes were not
statistically different from healthy controls although they reported
considerable variability in the data. Beyond studies focusing
directly on the foot tissues, FE models can be used to study other
aspects of the diabetic foot pathomechanics. Mithrarante et al.
[34] represented the vascular system in their 3D FE model of the
foot and looked at the effect of increasing tissue stiffness to levels
producing physiologically feasible hydrostatic pressures on this
system to simulate the effects of diabetes. They found that by
doubling the tissue stiffness, a reduction in blood supply of 28%
was seen in affected areas.
3. Interventions to reduce ulceration riskThe majority of studies included in this review which
investigated interventions intended to reduce ulceration risk
considered some form of insole or footwear (see Table 3). A wide
range of clinically used materials have been tested in FE
simulations of insoles [15,17,24,30,31,35,40–42] and footwear
[43]. Generally the elasticity of the footwear material was found to
be the most influential factor in terms of pressure relief.
FE analysis has also been utilised to explore the effects of
environmental influences on the performance of the insole
material. Shariatmadari et al. [25] used a 2D coronal plane
model of the heel to assess the pressure relieving performance of
commonly used insole materials from 10–40uC. By modelling the
known effects of temperature on material elasticity properties, the
study showed that the changes in material performance within
these temperatures had a considerable effect on the ability of these
commonly prescribed insole materials to reduce peak plantar
pressures, with performance being the worst at 10uC.
Using both 2D [15,28] and 3D [17,35] models it has been
predicted that custom contoured insoles provide the greatest
reductions in plantar surface pressures when compared to flat
insoles made from pressure relieving materials. The inclusion of an
arch support to an insole design was also found to be beneficial in
terms of redistributing plantar pressures away from at-risk areas
such as below the metatarsal heads [17]. In addition, Dai et al.
[36] developed a model and insole that included a layer of material
representing a sock. Using properties derived from experimental
measures of different sock materials they predicted that, compared
to barefoot, the use of socks can result in a reduction in plantar
shear stresses of .80%.
Several studies have been conducted into pressure relieving plug
modifications for insoles or footwear. These have looked at
modifications at the forefoot [22,40] and heel [33]. Erdemir et al.
[40] demonstrated that significant reductions in peak pressures
under the metatarsal head could be achieved using this strategy. In
addition, the simulations showed that locating the plug via the
peak of the pressure distribution was more effective in terms of
reducing peak pressures compared to locating it directly under the
metatarsal head. Actis et al. [22] expanded upon this work by
using a 2D model of the full foot (cross section of the second ray) to
test the effects of smaller (,4 mm) plugs inserted into an area of a
total contact insole under the metatarsal head. They found that
while the small plugs did reduce peak plantar pressures, the
magnitude of the reduction both found numerically and experi-
mentally was lower than those reported by Erdemir et al. [40].
Table 2. Cont.
Paper Model Validation Key finding(s)
2D/3D
Anatomy/Components(ground/floor alsomodelled unlessotherwise stated) Simulation
Thomaset al., 2004
3D Foot bones(fused in medio-lateralplane into two arches),cartilage, majorligaments andencapsulated plantarsoft tissue (L).Selected muscleforces applied
Different soft tissuestiffness and thicknesssimulating healthy anddiabetic conditionsduring pushoff phase.
No validationexperimentincluded inprotocol.MSA = NR
For simulations of the diabetic softtissue, plantar normal and shearstresses increased by up to52.3%and 53.6% respectively. Stressgradient ratios also increased inthe diabetic simulations
Gefen2003
2D 5 cross-sectionalslices modelledcorresponding tofoot rays. Includesfoot bones, cartilagemajor relevantligaments, heel(NL) and metatarsalpads (NL)
Increasing stiffnessof soft tissues tosimulate changesassociated withdiabetes (5 levels)during balancedstanding.
No validationexperimentincluded inprotocol.MSA = Y
With tissue stiffening,contact forces at1st and 2nd met headincreased by up to 50%;internal tissue stressesincreased by up to 307%
Jacobet al., 1999
3D Foot bones(fused in medio-lateralplane into two arches),cartilage, majorligaments andencapsulated plantarsoft tissue (L).Selected muscleforces applied
Healthy and diabeticfoot models tested(diabetic foot withdifferent soft tissueproperties). Heelstrike, mid-stanceand push off
Peak plantarpressures at 9locations for bothconditions. Meandiff = 11.9%; maxdiff = 37.1%.MSA = NR
Elevated plantar stressesfound in for the diabeticcondition compared tothe control
L: linear; NL: non-linear; MSA: mesh sensitivity analysis; NR: not reported.doi:10.1371/journal.pone.0109994.t002
Finite Element Simulations of the Diabetic Foot
PLOS ONE | www.plosone.org 7 October 2014 | Volume 9 | Issue 10 | e109994

Table 3. Investigations of interventions intended to reduce ulceration risk.
Article Model Validation Key finding(s)
2D/3D
Anatomy/Components(ground/floor alsomodelled unlessotherwise stated) Simulation
Isvilanondaet al., 2012
3D Foot bones,cartilage, fat volumes(NL) and encapsulatedsoft tissue (skin and muscle,NL), tendons and ligaments.Selected muscle forces applied
Model modifiedto produce clawedhallux deformity. 2corrective surgicaltechniques thensimulated
Validated toranges reportedin literature.MSA = Y
Multiplescenarios maylead to clawedhalluxdeformity,with differentsurgicaltechniquesidentified asmoreappropriate incertain scenarios
Chen et al.,2012
3D Bone, cartilage,ligaments(inc. plantar fascia),encapsulated softtissue (NL). Selectedmuscle forces applied
Gastroc-Soleusforce varied from100% (baseline) to60% in 10% stepsat instance offorefoot peakloading
Peak plantarpressures at metheads and toes.Mean diff = 13.6%;max diff = 38.5%.MSA = As reportedin Chenet al. (2010)
Pressuredistributionchanges at theforefoot causedby changingG–S force arenon-systematic.
Luo et al.,2011
2D Calcaneus (rigid),skin (NL), heelpad (NL) andinsole designs
Barefoot, flatinsole, flat insolewith two designsof heel cutout,and customcountered insolesunder 25% bodyweight loading(approximatingbalanced standing).Insole stiffnessalso varied bythree levels
Mean plantarpressure at theheel reportedto be consistentbetween FE andexperiment but noabsolute valuesgiven. MSA = Y
Customcountered insolesprovidedgreatest reductions instress, strainand strainenergy density.Internalstresses nearthe calcaneuswere up to 10times greaterthan plantarsurface stresses
Gu et al.,2011
3D Foot bones,cartilage, plantarfascia, encapsulatedsoft tissue (NL),midsole, insoleand heel plug
Thickness anddiameter of heelplug varied atinstance of heelstrike.
Peak plantarpressure at heel.Diff = 8.1%MSA = Y
Mediumhardness plug95% of the sizeof the calcaneuswas found toprovide mostpressure relief.
Shariatmadariet al., 2010
2D Geometric simplificationof the calcaneus,encapsulated softtissue (NL), midsole(NL), and insolematerial (NL)
Barefoot and twoinsole materialconditions.Prescribeddisplacement tocalcaneus applied
No validationexperimentincluded inprotocol.MSR = NR
Temperaturecan have aneffect on insolematerialpropertieswhich in turnaffects theresulting footstresses
Shariatmadariet al., 2009
2D Geometric simplificationof the calcaneus,encapsulated softtissue (L) and insolematerial
Barefoot and twoinsole materialconditions.Prescribeddisplacement tocalcaneus applied
No validationexperimentincluded inprotocol.MSR = NR
Peak stressoccurred at thecentral portionof the heel andgreater strainswere seen in theinsole material
Finite Element Simulations of the Diabetic Foot
PLOS ONE | www.plosone.org 8 October 2014 | Volume 9 | Issue 10 | e109994
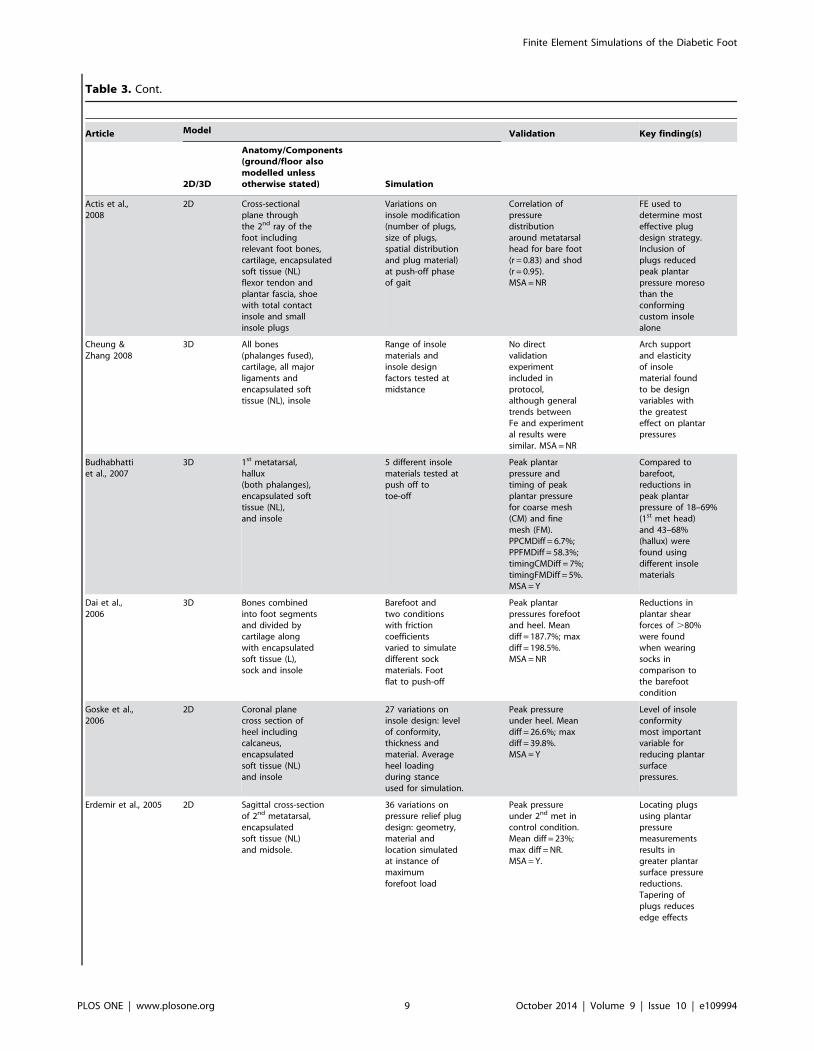
Table 3. Cont.
Article Model Validation Key finding(s)
2D/3D
Anatomy/Components(ground/floor alsomodelled unlessotherwise stated) Simulation
Actis et al.,2008
2D Cross-sectionalplane throughthe 2nd ray of thefoot includingrelevant foot bones,cartilage, encapsulatedsoft tissue (NL)flexor tendon andplantar fascia, shoewith total contactinsole and smallinsole plugs
Variations oninsole modification(number of plugs,size of plugs,spatial distributionand plug material)at push-off phaseof gait
Correlation ofpressuredistributionaround metatarsalhead for bare foot(r = 0.83) and shod(r = 0.95).MSA = NR
FE used todetermine mosteffective plugdesign strategy.Inclusion ofplugs reducedpeak plantarpressure moresothan theconformingcustom insolealone
Cheung &Zhang 2008
3D All bones(phalanges fused),cartilage, all majorligaments andencapsulated softtissue (NL), insole
Range of insolematerials andinsole designfactors tested atmidstance
No directvalidationexperimentincluded inprotocol,although generaltrends betweenFe and experimental results weresimilar. MSA = NR
Arch supportand elasticityof insolematerial foundto be designvariables withthe greatesteffect on plantarpressures
Budhabhattiet al., 2007
3D 1st metatarsal,hallux(both phalanges),encapsulated softtissue (NL),and insole
5 different insolematerials tested atpush off totoe-off
Peak plantarpressure andtiming of peakplantar pressurefor coarse mesh(CM) and finemesh (FM).PPCMDiff = 6.7%;PPFMDiff = 58.3%;timingCMDiff = 7%;timingFMDiff = 5%.MSA = Y
Compared tobarefoot,reductions inpeak plantarpressure of 18–69%(1st met head)and 43–68%(hallux) werefound usingdifferent insolematerials
Dai et al.,2006
3D Bones combinedinto foot segmentsand divided bycartilage alongwith encapsulatedsoft tissue (L),sock and insole
Barefoot andtwo conditionswith frictioncoefficientsvaried to simulatedifferent sockmaterials. Footflat to push-off
Peak plantarpressures forefootand heel. Meandiff = 187.7%; maxdiff = 198.5%.MSA = NR
Reductions inplantar shearforces of .80%were foundwhen wearingsocks incomparison tothe barefootcondition
Goske et al.,2006
2D Coronal planecross section ofheel includingcalcaneus,encapsulatedsoft tissue (NL)and insole
27 variations oninsole design: levelof conformity,thickness andmaterial. Averageheel loadingduring stanceused for simulation.
Peak pressureunder heel. Meandiff = 26.6%; maxdiff = 39.8%.MSA = Y
Level of insoleconformitymost importantvariable forreducing plantarsurfacepressures.
Erdemir et al., 2005 2D Sagittal cross-sectionof 2nd metatarsal,encapsulatedsoft tissue (NL)and midsole.
36 variations onpressure relief plugdesign: geometry,material andlocation simulatedat instance ofmaximumforefoot load
Peak pressureunder 2nd met incontrol condition.Mean diff = 23%;max diff = NR.MSA = Y.
Locating plugsusing plantarpressuremeasurementsresults ingreater plantarsurface pressurereductions.Tapering ofplugs reducesedge effects
Finite Element Simulations of the Diabetic Foot
PLOS ONE | www.plosone.org 9 October 2014 | Volume 9 | Issue 10 | e109994

Gu et al. [33] looked at similar interventions at the heel and
found that a medium hardness plug $10 mm thick with a
diameter 95% of that of the calcaneus was the most effective at
reducing plantar pressures. All three studies looking at this type of
modification identified the risk of edge effects, where pressure
concentrations are seen at the interface between the cut-out or
plug and the stiffer material of the insole, and suggested strategies
for reducing these.
In addition to footwear based interventions, FE analysis has also
been utilised to investigate surgical techniques used to treat at risk
individuals at risk for plantar ulceration. Isvilanonda et al. [18]
used their model to examine clawed hallux deformity. They found
several configurations by which the deformity could occur and the
Table 3. Cont.
Article Model Validation Key finding(s)
2D/3D
Anatomy/Components(ground/floor alsomodelled unlessotherwise stated) Simulation
Cheung &Zhang., 2005
3D Foot bones(phalanges fused)cartilage, all majorligaments andencapsulated softtissue (L). Flat andcustom insoles.
Flat and custominsoles withdifferent materialproperties duringbalanced standing
Peak plantarpressures atheel and forefoot.Mean diff = 100.4%;max diff = 131.4%.MSA = NR
Reductions inpeak plantarpressures of40.7% and31.6% found atforefoot andheel respectivelywhen using softcustom insolecompared to flatrigid.
Barani et al.,2005
3D Insole (NL) Four insolematerials testedwith loadingapplied at pointscorresponding tohallux, four siteson forefootand heel
No validationexperimentincluded inprotocol.MSA = NR
Silicone gelmaterialprovidedmaximumreductions instressconcentrationsand improveduniformity ofstressdistributions
Lewis 2003 2D Rocker shoe design Two variationson materialconfiguration foroutsole tested.Vertical pointloads approximatingstatic standingapplied
No validationexperimentincluded inprotocol.MSA = NR
Differentmaterialconfigurationscaused localvariations at thefoot soleinterfacealthough meanand peak resultswere similar.
Chen et al.,2003
3D Foot bones modelledas lateral andmedial column,phalanges merged.Encapsulated softtissue (L) andmajor ligamentsincluded. Flatand custom insoles.
Flat insole andtwo total contactinsoles of differentmaterial layercompositionsduring midstance
No validationexperimentincluded inprotocol.MSA = NR
Reduction inpeak and meannormal plantarsurface stressesup to 56.8%using totalcontact insolescompared to flatfor all regionsexcludingmidfoot andhallux
Lemmonet al., 1997
2D Sagittal crossectionof 2nd metatarsal,encapsulated softtissue (NL), insole(NL) and midsole (NL).
Differentthickness ofinsole and plantartissues simulatedat instance ofmaximum forefootload
Peak plantarpressure beneath2nd met head.Mean diff (12conditions) = 6.4%,max = 13.2%.MSR = Y
Insoles reducedplantar pressureby maximum of29% and weremost effect forreduced tissuethickness
L: linear; NL: non-linear; MSA: mesh sensitivity analysis; NR: not reported.doi:10.1371/journal.pone.0109994.t003
Finite Element Simulations of the Diabetic Foot
PLOS ONE | www.plosone.org 10 October 2014 | Volume 9 | Issue 10 | e109994

results from simulating surgical intervention suggested that certain
surgeries may be more effective for reducing plantar pressures
depending on the muscular imbalance that led to the deformity.
The use of tendo-achillies lengthening to reduce ulceration risk in
diabetic patients with equinus has also been investigated by FE
analysis [29]. The authors found that the effect of reducing
gastrocnemius-soleus force on plantar pressures to be inconsistent
and no systematic effect was determined.
Discussion
By utilising FE analysis, researchers have been able to provide a
number of insights into the diabetic foot and its interventions,
which would not be possible through in vivo or in vitroexperimentation. The finding that the internal stresses in the
plantar tissues can be considerably greater in the diabetic foot is
potentially highly relevant to ulcer development, since the internal
formation of some deep ulcers has been recognised clinically [44].
The results presented by these FE models provide a feasible
mechanism for the development of this type of ulcer, and also
potentially a modifiable biomechanical treatment target. Efforts to
incorporate different components into the models such as the
vascular system, which may also provide a contributory mecha-
nism for ulcer development in diabetes, demonstrate the versatility
of the technique and suggest interesting avenues for future work.
It is important to note that FE analysis provides a predictive
platform where novel insole designs, potentially individualised for
a patient’s anatomy, can be virtually tested before prescription.
Despite different approaches to modelling the foot and levels of
complexity, studies looking at different types of insole interventions
suggested that custom contoured devices were the most effective of
the designs studied at providing pressure relief. This agrees with
the preponderance of evidence from studies using in-shoe plantar
pressure measurement systems and is in line with current
recommendations that a custom, pressure relieving insole should
be prescribed for at-risk patients [4]. A recent randomised
controlled trial comparing standard custom contoured insoles to
those which incorporated plantar pressure measurements as well
as shape into their prescription process found the shape and
pressure devices to be more effective at preventing ulcer
recurrence [45]. This may be supported by results from FE
simulations showing that the locating pressure relieving plugs using
the location of peak pressures produced greater reductions than
those located based on the anatomical location of the metatarsal
head alone [40]. The findings by Shariatmadari et al. [25] that
temperature can affect the pressure relieving performance of insole
materials also raises questions about insole performance in
different seasons/climates and whether this should be taken into
account when prescribing the devices.
The complexity of foot anatomy and function necessitates that a
wide range of assumptions and simplifications are made in model
development, and different opinions exist as to how complex a foot
model needs to be in order to be clinically useful. The findings
from this review do suggest that 2D models, when built carefully in
relevance to the question that needs to be addressed, may be able
to provide useful results [22,28,31], however further work and
evaluation in patient populations is required to understand their
general utility. The results do indicate that, given the variability in
tissue properties in both diabetic and healthy plantar tissue, an
important part of producing clinically useful patient-specific FE
simulations may involve accounting for these variations in material
behaviour within the model. A range of approaches for collecting
and analysing this type of data have been suggested [12,46].
Simulating the diabetic foot by increasing the stiffness or
reducing the thickness of plantar tissues may be another valid
approach. However further biomechanical alterations in the
diabetic foot, for example, increased joint stiffness [47] have yet
to be incorporated into FE models and may be a further avenue
for research.
Presently, the generation of an anatomically detailed 3D model
of a foot from imaging data is a time and labour intensive process
and is not feasible for individual patients. Approaches using
template models that can be parametrically scaled to match the
foot anatomy of different individuals based on simpler measure-
ments have been suggested [48]. This may be a more feasible
approach but it remains to be fully realised.
The development of an FE model of the foot requires
considerable simplification of complex anatomy and mechanics.
The elements used, the definition of interactions, and the
representation of material behaviour are only some of the
decisions that need to be made where there may not be a single
‘‘correct’’ answer with sound justifications. Some of the studies
included in this review reported only a modest amount of
information regarding limitations and validation making replica-
tion of the work difficult. Detailed reporting guidelines by Erdemir
et al. [49] have recently been published to complement existing
recommendations [50] and if these were to be adopted by
researchers in the field, it would help to better standardise the
information provided in publications. Where possible, making
models openly available may also help to advance the approach.
To ensure confidence in the results, confirmation of simulation
results against experimentally derived data should be a key part of
any FE study. In the studies included in this review, the majority
compared peak plantar pressures from the model to those collected
experimentally at one or more sites, however in many cases no
clear evaluation protocol was included in the modelling and
simulation approach. In addition, comparisons between surface
pressures from FE models to experimentally collected data can be
confounded by differences in the measurement resolution of the
methods, particularly in the case of in-shoe measurements where
the resolution can be relatively poor in comparison to the model.
Several studies compared their results to those reported in the
literature as validation. In the authors’ opinion, whenever possible
this approach should only be used as a secondary validation
measure. We recommend that the method chosen to validate the
model should be defined a priori and, if possible, should not rely
on a single variable. Reporting model comparisons with a number
of different variables may provide greater confidence in the
predictive value of the model for those variables it is not possible to
measure directly. Ideally the primary researchers should be
blinded to at least some of the validation results during the model
development process.
In addition to the methodological issues identified above, there
are a number of more general barriers to the increased use of FE
analysis for investigations related to the diabetic foot. FE foot
models, particularly those in 3D, can be demanding to build and
run with simulation times that can last many hours or even days
depending on the complexity of the model. To improve the clinical
utility of FE analysis both model development and simulation
times may need to be significantly reduced, and some model
simplification or reduction procedures have been suggested which
have yet to be evaluated for their clinical validity. Intensive
training is required to reach a suitable level of expertise to be able
to develop models and interpret their results. Finally, high-end
solvers for FE analysis remain expensive, although in recent years
a number of open source FE and supporting programs have been
developed, potentially allowing greater access to the technology
Finite Element Simulations of the Diabetic Foot
PLOS ONE | www.plosone.org 11 October 2014 | Volume 9 | Issue 10 | e109994

(for example, see FEBio, http://www.febio.org/ and Calculix,
http://www.calculix.de/).
Conclusion
The application of FE analysis to study the biomechanics of the
diabetic foot has resulted in a number of insights regarding its
pathomechanics and has aided the design of interventions.
However, considerable progress will be required before the
technique can be utilised outside of the research domain to
inform clinical management of diabetic foot disease at the level of
the individual patient.
Supporting Information
Appendix S1 Search strategy.(DOCX)
Checklist S1 PRISMA checklist.(DOCX)
Author Contributions
Conceived and designed the experiments: ST AE JW PC. Performed the
experiments: ST AE. Analyzed the data: ST AE. Contributed reagents/
materials/analysis tools: ST AE JW PC. Contributed to the writing of the
manuscript: ST AE JW PC.
References
1. Boulton AJM (2008) The diabetic foot: grand overview, epidemiology andpathogenesis. Diabetes Metab Res Rev 24 Suppl 1: S3–6.
2. Prompers L, Huijberts M, Apelqvist J, Jude E, Piaggesi A, et al. (2007) High
prevalence of ischaemia, infection and serious comorbidity in patients withdiabetic foot disease in Europe. Baseline results from the Eurodiale study.
Diabetologia 50: 18–25.
3. Prompers L, Huijberts M, Schaper N, Apelqvist J, Bakker K, et al. (2008)Resource utilisation and costs associated with the treatment of diabetic foot
ulcers. Prospective data from the Eurodiale Study. Diabetologia 51: 1826–34.
4. Cavanagh PR, Bus SA (2012) Off-loading the diabetic foot for ulcer preventionand healing. J Am Podiatr Med Assoc 100: 360–8.
5. Bus SA, Maas M, Cavanagh PR, Michels RPJ, Levi M (2004) Plantar fat-pad
displacement in neuropathic diabetic patients with toe deformity: a magneticresonance imaging study. Diabetes Care 27: 2376–81.
6. Pai S, Ledoux WR (2010) The compressive mechanical properties of diabetic
and non-diabetic plantar soft tissue. J Biomech 43: 1754–60.
7. Crawford F, Inkster M, Kleijnen J, Fahey T (2007) Predicting foot ulcers inpatients with diabetes: a systematic review and meta-analysis. QJM 100: 65–86.
8. Buchanan G (1994) Schaum’s outline of finite element analysis. New York:
McGraw-Hill. New York.
9. Jones AC, Wilcox RK (2008) Finite element analysis of the spine: towards aframework of verification, validation and sensitivity analysis. Med Eng Phys 30:
1287–304.
10. Stops A, Wilcox R, Jin Z (2012) Computational modelling of the natural hip: a
review of finite element and multibody simulations. Comput Methods BiomechBiomed Eng 15: 963–79.
11. Gefen A (2003) Plantar soft tissue loading under the medial metatarsals in the
standing diabetic foot. Med Eng Phys 25: 491–9.
12. Erdemir A, Viveiros ML, Ulbrecht JS, Cavanagh PR (2006) An inverse finite-element model of heel-pad indentation. J Biomech 39: 1279–86.
13. Thomas VJ, Patil KM, Radhakrishnan S (2004) Three-dimensional stress
analysis for the mechanics of plantar ulcers in diabetic neuropathy. Med BiolEng Comput 42: 230–5.
14. Actis RL, Ventura LB, Smith KE, Commean PK, Lott DJ, et al. (2006)
Numerical simulation of the plantar pressure distribution in the diabetic footduring the push-off stance. Med Biol Eng Comput 44: 653–63.
15. Goske S, Erdemir A, Petre M, Budhabhatti S, Cavanagh PR (2006) Reduction
of plantar heel pressures: Insole design using finite element analysis. J Biomech39: 2363–70.
16. Chen W-M, Lee T, Lee PV-S, Lee JW, Lee S-J (2010) Effects of internal stress
concentrations in plantar soft-tissue–A preliminary three-dimensional finiteelement analysis. Med Eng Phys 32: 324–31.
17. Cheung JT-M, Zhang M (2005) A 3-dimensional finite element model of the
human foot and ankle for insole design. Arch Phys Med Rehabil 86: 353–8.
18. Isvilanonda V, Dengler E, Iaquinto JM, Sangeorzan BJ, Ledoux WR (2012)Finite element analysis of the foot: model validation and comparison between
two common treatments of the clawed hallux deformity. Clin Biomech (Bristol,
Avon) 27: 837–44.
19. Cheung JT-M, Zhang M, Leung AK-L, Fan Y-B (2005) Three-dimensional
finite element analysis of the foot during standing–a material sensitivity study.
J Biomech 38: 1045–54.
20. Fernandez JW, Ul Haque MZ, Hunter PJ, Mithraratne K (2012) Mechanics ofthe foot Part 1: a continuum framework for evaluating soft tissue stiffening in the
pathologic foot. Int J Numer Method Biomed Eng 28: 1056–70.
21. Yarnitzky G, Yizhar Z, Gefen A (2006) Real-time subject-specific monitoring ofinternal deformations and stresses in the soft tissues of the foot: a new approach
in gait analysis. J Biomech 39: 2673–89.
22. Actis RL, Ventura LB, Lott DJ, Smith KE, Commean PK, et al. (2008) Multi-plug insole design to reduce peak plantar pressure on the diabetic foot during
walking. Med Biol Eng Comput 46: 363–71.
23. Petre M, Erdemir A, Panoskaltsis VP, Spirka TA, Cavanagh PR (2013)Optimization of nonlinear hyperelastic coefficients for foot tissues using a
magnetic resonance imaging deformation experiment. J Biomech Eng 135:
61001–12.
24. Shariatmadari M (2009) Finite Element Analysis into the Foot - Footwear
Interaction Using EVA Footwear Foams. In 13th Int Conf Biomed Eng 1–3:
1627–1630.
25. Shariatmadari M, English R, Rothwell G (2010) Finite Element Study into the
Effect of Footwear Temperature on the Forces Transmitted to the Foot duringQuasi-Static Compression Loading. In IOP Conf Ser: Mater Sci Eng 10:
012126.
26. Tadepalli SC, Erdemir A, Cavanagh PR (2011) Comparison of hexahedral andtetrahedral elements in finite element analysis of the foot and footwear.
J Biomech 44: 2337–43.
27. Agic A, Nikolic V, Mijovic B, Reischl U (2008) Biomechanical model of the
diabetic foot. Coll Antropol 32: 881–6.
28. Luo G, Houston VL, Garbarini MA, Beattie AC, Thongpop C (2011) Finiteelement analysis of heel pad with insoles. J Biomech 2011, 44: 1559–65.
29. Chen W-M, Park J, Park S-B, Shim VP-W, Lee T (2012) Role of gastrocnemius-soleus muscle in forefoot force transmission at heel rise - A 3D finite element
analysis. J Biomech 45: 1783–9.
30. Budhabhatti SP, Erdemir A, Petre M, Sferra J, Donley B, et al. (2007) Finiteelement modeling of the first ray of the foot: a tool for the design of interventions.
J Biomech Eng 129: 750–6.
31. Lemmon D, Shiang TY, Hashmi A, Ulbrecht JS, Cavanagh PR (1997) Theeffect of insoles in therapeutic footwear–a finite element approach. J Biomech
30: 615–20.
32. Gu YD, Li JS, Lake MJ, Zeng YJ, Ren XJ, et al. (2011) Image-based midsole
insert design and the material effects on heel plantar pressure distribution duringsimulated walking loads. Comput. Methods Biomech Biomed Eng 14: 747–53.
33. Gu Y, Li J, Ren X, Lake MJ, Zeng Y (2010) Heel skin stiffness effect on the hind
foot biomechanics during heel strike. Skin Res Technol 16: 291–6.
34. Mithraratne K, Ho H, Hunter PJ, Fernandez JW (2012) Mechanics of the foot
Part 2: A coupled solid-fluid model to investigate blood transport in the
pathologic foot. Int J Numer Method Biomed Eng 28: 1071–81.
35. Chen W-P, Ju C-W, Tang F-T (2003) Effects of total contact insoles on the
plantar stress redistribution: a finite element analysis. Clin Biomech (Bristol,Avon) 18: S17–24.
36. Dai X-Q, Li Y, Zhang M, Cheung JT-M (2006) Effect of sock on biomechanical
responses of foot during walking. Clin Biomech (Bristol, Avon) 21: 314–21.
37. Klaesner JW, Hastings MK, Zou D, Lewis C, Mueller MJ (2002) Plantar tissue
stiffness in patients with diabetes mellitus and peripheral neuropathy. Arch PhysMed Rehabil 83: 1796–1801.
38. Jacob S, Patil MK (1999) Stress analysis in three-dimensional foot models of
normal and diabetic neuropathy. Front Med Biol Eng 9: 211–27.
39. Yavuz M, Erdemir A, Botek G, Hirschman GB, Bardsley L, et al. (2007) Peak
plantar pressure and shear locations: relevance to diabetic patients. DiabetesCare 30: 2643–5.
40. Erdemir A, Saucerman JJ, Lemmon D, Loppnow B, Turso B, et al. (2005) Local
plantar pressure relief in therapeutic footwear: design guidelines from finiteelement models. J Biomech 38: 1798–806.
41. Barani Z, Haghpanahi M, Katoozian H (2005) Three dimensional stress analysisof diabetic insole: a finite element approach. Technol Health Care 13: 185–92.
42. Cheung JT-M, Zhang M (2008) Parametric design of pressure-relieving foot
orthosis using statistics-based finite element method. Med Eng Phys 30: 269–77.
43. Lewis G (2003) Finite element analysis of a model of a therapeutic shoe: effect of
material selection for the outsole. Biomed Mater Eng 13: 75–81.
44. Schaper NC (2004) Diabetic foot ulcer classification system for research
purposes: a progress report on criteria for including patients in research studies.
Diabetes Metab Res Rev 20 Suppl 1: S90–5.
45. Ulbrecht JS, Hurley T, Mauger DT, Cavanagh PR (2014) Prevention of
recurrent foot ulcers with plantar pressure-based in-shoe orthoses: the CareFULprevention multicenter randomized controlled trial. Diabetes Care 37: 1982–9.
46. Telfer S, Woodburn J, Turner DE (2013) Measurement of functional heel pad
behaviour in-shoe during gait using orthotic embedded ultrasonography. GaitPosture 39: 328–32.
47. Williams DSB, Brunt D, Tanenberg RJ (2007) Diabetic neuropathy is related tojoint stiffness during late stance phase. J Appl Biomech 23: 251–60.
Finite Element Simulations of the Diabetic Foot
PLOS ONE | www.plosone.org 12 October 2014 | Volume 9 | Issue 10 | e109994

48. Oosterwaal M, Telfer S, Torholm S, Carbes S, van Rhijn LW, et al. (2011)
Generation of subject-specific, dynamic, multisegment ankle and foot models to
improve orthotic design: a feasibility study. BMC Musculoskelet Disord 12: 256.
49. Erdemir A, Guess TM, Halloran J, Tadepalli SC, Morrison TM (2012)
Considerations for reporting finite element analysis studies in biomechanics.J Biomech 45: 625–33.
50. Viceconti M, Olsen S, Nolte L-P, Burton K (2005) Extracting clinically relevant
data from finite element simulations. Clin Biomech (Bristol, Avon) 20: 451–4.
Finite Element Simulations of the Diabetic Foot
PLOS ONE | www.plosone.org 13 October 2014 | Volume 9 | Issue 10 | e109994