transit strategy report - moving forward
TRANSCRIPT
Moving Forward Transit Strategy Report
Moving Forward –Transit Strategy Report
i
Table of Contents 1. Introduction ........................................................................................................................ 1-1
Objectives ........................................................................................................................... 1-1
Approach ............................................................................................................................ 1-2
2. Background ........................................................................................................................ 2-1
Existing Transit Network .................................................................................................... 2-1
Travel Trends and Challenges .......................................................................................... 2-2
Planning Context ............................................................................................................. 2-10
Transit Objectives ........................................................................................................... 2-15
3. Transit Network Planning .................................................................................................. 3-1
Network Scenarios ............................................................................................................ 3-1
Service Hour Targets ......................................................................................................... 3-9
Bus Requirements .......................................................................................................... 3-10
GRT Route Hierarchy ...................................................................................................... 3-12
Service Levels ................................................................................................................. 3-13
New Services and Infrastructure ................................................................................... 3-14
Implementation Phasing ................................................................................................ 3-18
Network Performance .................................................................................................... 3-20
4. Transit Priority Measures .................................................................................................. 4-1
Guidelines for Implementing Transit Priority Measures.................................................. 4-2
Ongoing and Future Transit Priority Projects ................................................................... 4-3
5. New Service Delivery Models ............................................................................................ 5-1
Dynamic and Flexible Transit Options for Grand River Transit ....................................... 5-2
Dynamic and Flexible Transit in Other Municipalities ..................................................... 5-3
Future Service Delivery Models ........................................................................................ 5-4
6. Costs ................................................................................................................................... 6-1
Capital Costs ...................................................................................................................... 6-1
Operating Costs and Fare Revenue ................................................................................. 6-2
7. Transit Needs Beyond 2041 ............................................................................................. 7-1
Moving Forward –Transit Strategy Report
ii
Table of Exhibits Exhibit 2.1: Map of Existing GRT Routes and GO Transit Service ............................................ 2-3
Exhibit 2.2: Map of Existing GRT Routes and GO Transit Service (Cambridge) ...................... 2-4
Exhibit 2.3: Map of Existing GRT Routes and GO Transit Service (Kitchener) ........................ 2-5
Exhibit 2.4: Map of Existing GRT Routes and GO Transit Service (Waterloo) ......................... 2-6
Exhibit 2.5: Changes in GRT Revenue Service Hours and Ridership, 2007–2018 ............... 2-8
Exhibit 2.6: Changing Mode Shares for Short (2 to 5 kilometres) Trips ................................. 2-9
Exhibit 2.7: GRT Business Plan Service Hours, Ridership, and Bus Purchases,
2017–2021 ............................................................................................................................. 2-13
Exhibit 2.8: ION Stage 2 LRT Route (as of May 2018) .......................................................... 2-14
Exhibit 2.9: Population and Employment Forecasts for the Region of Waterloo ................. 2-15
Exhibit 3.1: 2041 GRT Transit Network – Scenario 1 and Scenario 2 .................................... 3-3
Exhibit 3.2: 2041 GRT Transit Network – Recommended Scenario ....................................... 3-5
Exhibit 3.3: 2041 GRT Transit Network – Recommended Scenario (Cambridge) ................. 3-6
Exhibit 3.4: 2041 GRT Transit Network – Recommended Scenario (Kitchener) ................... 3-7
Exhibit 3.5: 2041 GRT Transit Network – Recommended Scenario (Waterloo) .................... 3-8
Exhibit 3.6: Future Bus Revenue Service Hours Required by 2041 ....................................... 3-9
Exhibit 3.7: Steps to Calculate 2041 GRT Service Hour Requirements .............................. 3-10
Exhibit 3.8: Steps to Calculate 2041 GRT Bus Fleet Requirements .................................... 3-11
Exhibit 3.9: GRT Service Growth Vehicle Purchases, 2018–2041 ...................................... 3-12
Exhibit 3.10: GRT Route Headways and Required Buses by Year, PM Peak Period,
2021–2041 ............................................................................................................................. 3-14
Exhibit 3.11: Proposed 2041 Regional Express Bus Network .............................................. 3-17
Exhibit 4.1: Transit Priority Measure Selection Framework ..................................................... 4-2
Exhibit 5.1: New Mobility Paradigm for Inter-Modal Users ....................................................... 5-4
Exhibit 6.1: Transit Capital Growth Costs by Category and Term ............................................ 6-2
Exhibit 6.2: Transit Operating Costs by Category and Year ...................................................... 6-3
Moving Forward –Transit Strategy Report
iii
Table of Exhibits continued Exhibit 7.1: Map of Rapid Transit and Rail Corridors for Protection Beyond 2041 ................ 7-3
Exhibit 7.2: Map of Transit Corridors for Protection Beyond 2041 (Cambridge).................... 7-4
Exhibit 7.3: Map of Transit Corridors for Protection Beyond 2041 (Kitchener) ..................... 7-5
Exhibit 7.4: Map of Transit Corridors for Protection Beyond 2041 (Waterloo) ....................... 7-6
1-1
1. Introduction The Region of Waterloo is currently updating its Transportation Master Plan (TMP), a process
that will identify transportation infrastructure needs to the year 2041. This 2018 TMP builds
upon the 2010 Regional Transportation Master Plan (RTMP), which described changes to
the Region’s transportation system up to the year 2031, and presents a plan for roads,
public transit, and active transportation that will support the Region as it grows. As with the
2010 RTMP, transit is a major component of this 2018 TMP.
Objectives
This report focuses on changes to the public transit network and related infrastructure in the
Region of Waterloo, with an emphasis on higher-order transit (GRT iXpress, ION, and GO
Transit). This report also considers the impact of land use intensification within the Region
on transit services, such as those in the Central Transit Corridor.
Moving Forward –Transit Strategy Report
1-2
Specific goals and objectives of this report include:
Reviewing and refining the 2031 higher-order transit network proposed in the 2010
RTMP;
Developing an updated transit network for the horizon year of 2041, including a
phased plan for the implementation of required changes;
Assessing the impacts, benefits, and feasibility of the proposed higher-order transit
network;
Developing a toolbox of transit priority measures and a methodology for applying these
measures to corridors and locations in the Region;
Proposing ways for the Region to use alternative transit delivery models and new
mobility options to provide service to areas that pose a challenge to conventional
transit;
Developing cost estimates for the recommended transit network; and
Identifying corridors to be protected for transit service or improvements beyond the
2041 horizon year.
Approach
The development of this transit strategy begins by identifying current and historical travel
trends within the Region, in addition to assessing the existing transit network and service for
shortcomings or gaps. Considering these findings, a transit mode share target is identified
for the plan’s horizon year of 2041. To reach this target, committed and proposed changes
identified from a number of sources are applied to the existing network to propose a future
year transit system; these sources include the 2010 RTMP, the Grand River Transit (GRT)
Business Plan 2017-2021, and the Metrolinx 2041 Regional Transportation Plan. If any
gaps still exist, additional projects are identified to provide the service needed to achieve
transit mode share targets. Further network improvements, including transit priority
measures and new service delivery models, are also added to the network to improve route
performance and provide service to new areas, respectively. These changes are then
phased, identifying horizon years over which each set of changes should be implemented,
and both capital and operating costs are calculated.
2-1
2. Background
Existing Transit Network
Grand River Transit (GRT) provides public transit service throughout the Region of Waterloo,
specifically to the cities of Kitchener, Waterloo, and Cambridge, as well as the Townships.
GRT operates both express and conventional bus routes, as well as community and specialty
transit services using smaller vehicles. As of January 2018, GRT operated 70 routes, five of
which are branded as iXpress routes designed to provide high-frequency corridor service.
In 2019, Stage 1 of ION rapid transit will open in Kitchener and Waterloo, replacing the
existing 200 iXpress route. This consists of 19 kilometres of Light Rail Transit (LRT),
travelling between Conestoga Mall in Waterloo and Fairview Park Mall in Kitchener, paired
with 17 kilometres of adapted Bus Rapid Transit (aBRT), travelling between Fairview Park
Mall and Ainslie Street Terminal in Cambridge. There will be a total of 36 stops along the
entire ION corridor.
Moving Forward –Transit Strategy Report
2-2
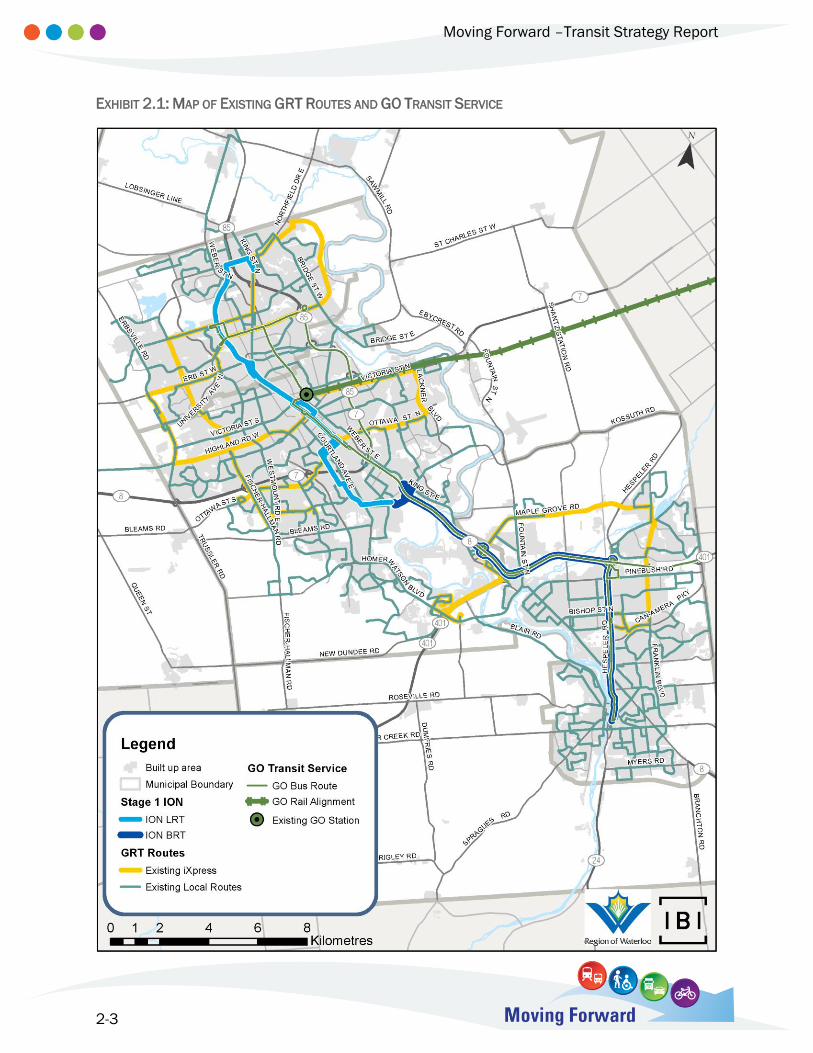
In addition to GRT services, the Region of Waterloo is also served by GO Transit. Weekday
peak commuter rail service is provided between Kitchener GO Station, located in downtown
Kitchener, and Toronto’s Union Station. This service was recently expanded to run five trains
to Union Station in the morning peak period and five trains to Kitchener in the evening peak
period. GO bus routes also serve Kitchener, Cambridge, and Waterloo seven days per week,
providing connections to destinations across the GTA.
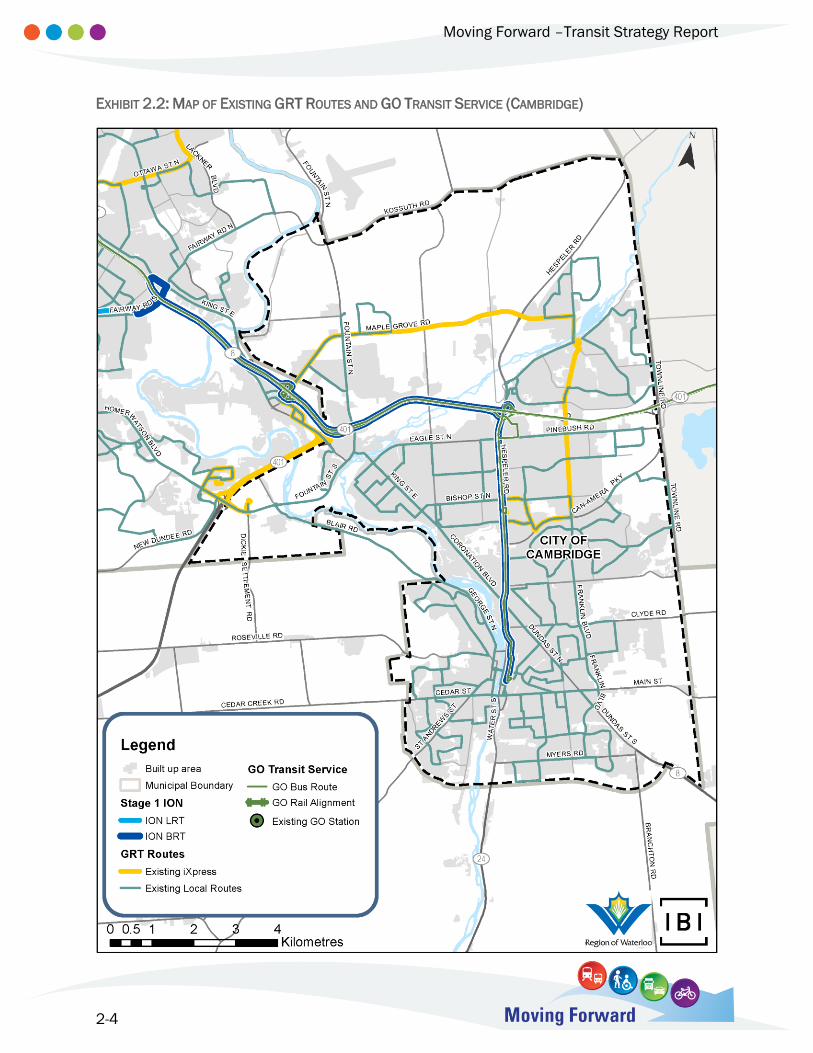
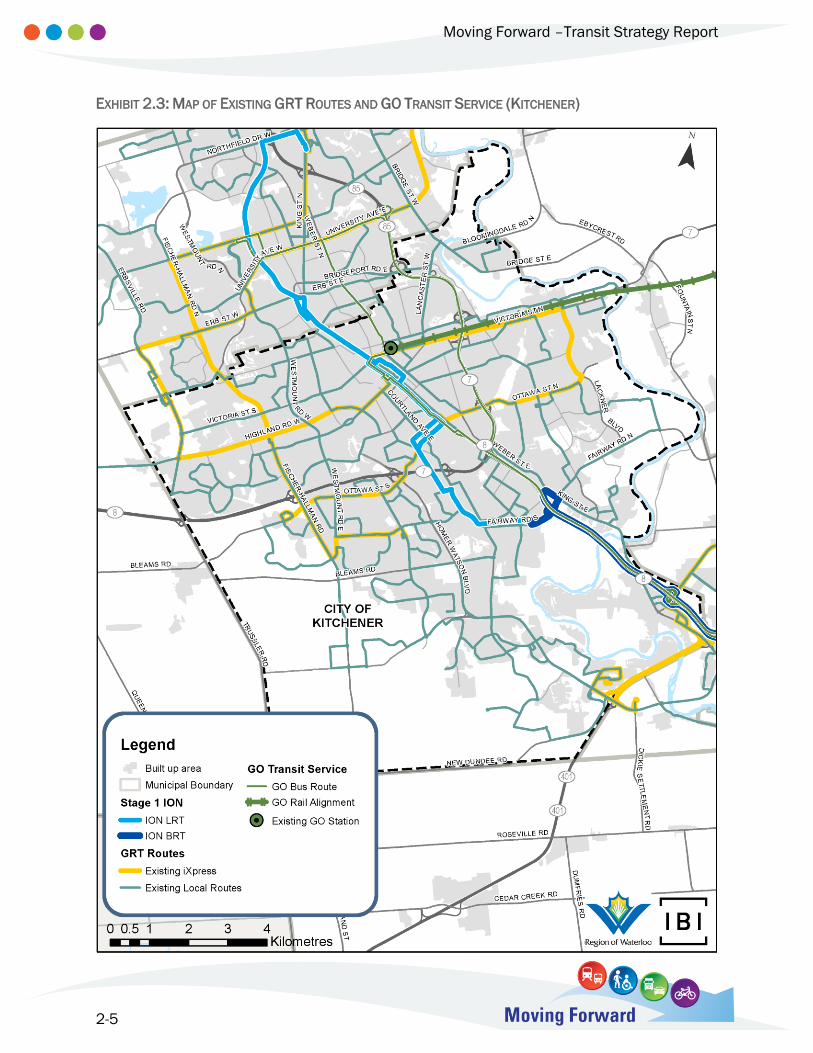
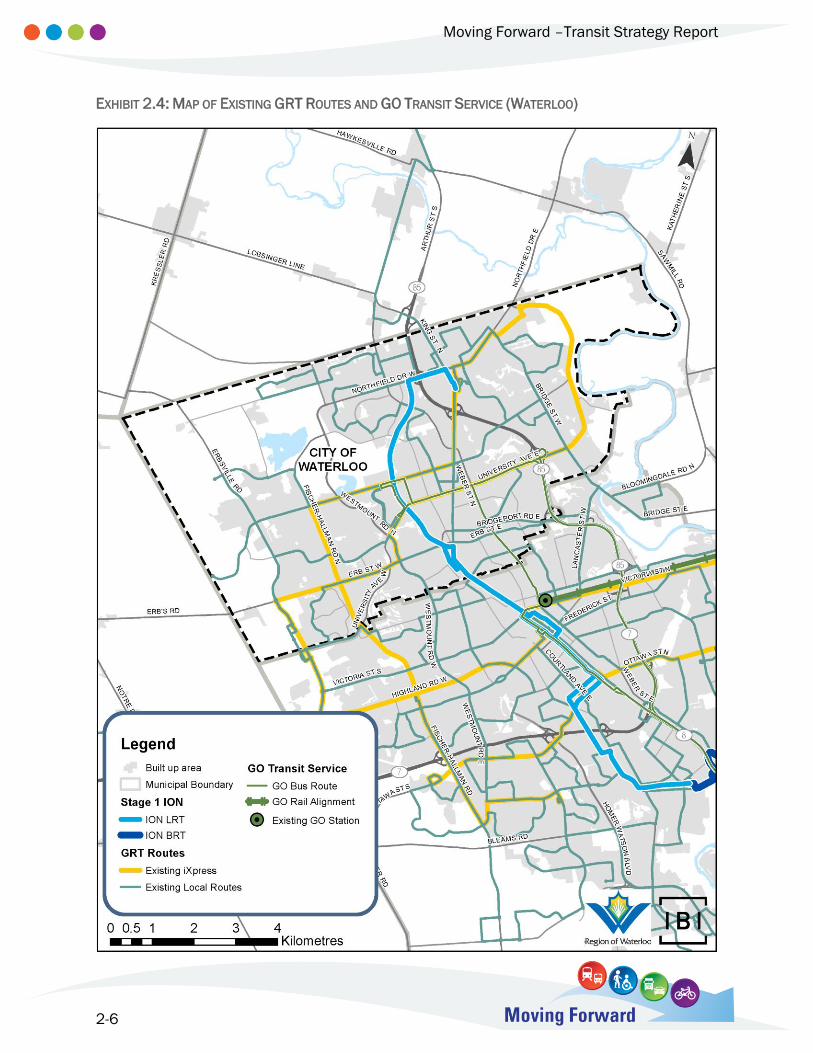
The Existing GRT and GO networks in Waterloo Region, Cambridge, Kitchener, and Waterloo
are presented in Exhibit 2.1, Exhibit 2.2, Exhibit 2.3, and Exhibit 2.4.
Travel Trends and Challenges
Since the completion of the 2010 RTMP, a number of travel trends and challenges have
been identified which provide information about how the transit network is being used and
highlight ways in which transit can be improved.
Inter-Regional Travel is Growing
Over 1 million trips begin in the Region of Waterloo every day, the majority of which (94%)
also end within the Region. However, the number of Waterloo-based trips ending in Guelph,
Toronto, Hamilton, Brantford, and other local regions and municipalities has been steadily
growing. Between 2006 and 2016, the proportion of trips ending outside the Region has
grown from under 5% to 6%, an increase of 15,000 daily trips.
The importance of this trend is twofold; first, it suggests that the market for inter-regional
travel is growing, so emphasis should be placed on providing new and improved inter-
regional transit services to draw travellers away from auto use for these trips. Second, this
trend highlights the importance of local transit (to serve the majority of Regional trips) and
improved connections between local and inter-regional transit, which can serve all travellers
in the Region.
Post-Secondary Students Make Up a Large Share of Transit Ridership
A major traveller group within the Region is post-secondary students, including those
attending the University of Waterloo, Wilfrid Laurier University, and Conestoga College.
Based on results from the Ministry of Transportation’s 2012 Post Secondary School Travel
Survey, post-secondary students have a comparatively low auto mode share (29%), while
they are frequent users of active modes (36%) and transit (35%). This high transit usage can
be attributed in part to the introduction of a universal bus pass for University of Waterloo
and Wilfrid Laurier University students – this pass is funded through mandatory student fees
and allows unlimited travel on the GRT system. Conestoga College plans to implement the
universal bus pass in 2019.
Moving Forward –Transit Strategy Report
2-3
EXHIBIT 2.1: MAP OF EXISTING GRT ROUTES AND GO TRANSIT SERVICE
Moving Forward –Transit Strategy Report
2-4
EXHIBIT 2.2: MAP OF EXISTING GRT ROUTES AND GO TRANSIT SERVICE (CAMBRIDGE)
Moving Forward –Transit Strategy Report
2-5
EXHIBIT 2.3: MAP OF EXISTING GRT ROUTES AND GO TRANSIT SERVICE (KITCHENER)
Moving Forward –Transit Strategy Report
2-6
EXHIBIT 2.4: MAP OF EXISTING GRT ROUTES AND GO TRANSIT SERVICE (WATERLOO)
Moving Forward –Transit Strategy Report
2-7
While ridership among post-secondary students is already high, it may be worthwhile to
further increase the attractiveness of transit for this group. The benefits of increasing transit
ridership among students include potentially establishing long-term transit use habits for
these individuals and growing sustainable transportation use in the Region.
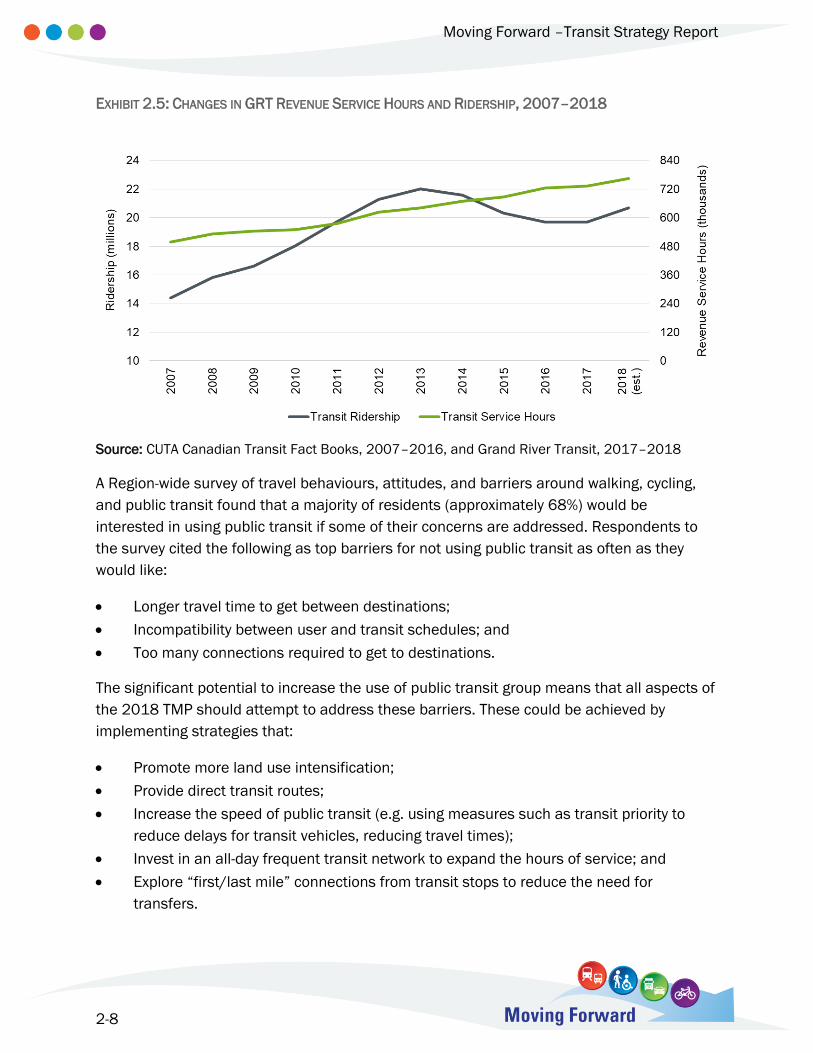
Ridership Trends Highlight Growth Challenges
Since 2007, the number of annual transit service hours provided by GRT has steadily grown
from 500,000 to over 750,000. This increase in service was initially matched with annual
ridership growth, peaking at nearly 22 million riders in 2013. Although annual ridership
proceeded to decline between 2013 and 2016, as shown in Exhibit 2.5, this trend recently
reversed and ridership has grown throughout 2018. The trend of declining ridership was
observed across North American transit agencies, and was the result of a number of factors
including low gasoline prices and the emergence of new Transportation Network Companies
(TNCs)1, increasing auto use, increases in active transportation, and changes in teleworking
habits (reducing trip rates). In Waterloo Region, additional factors included:
Transit detours due to ION LRT construction;
School boards providing yellow bus transportation instead of GRT school routes;
Fare increases; and
Localized service reductions in 2013 and 2014.
In addition to historical changes in GRT ridership and service hours, it is important to
consider how transit is being used relative to other travel modes in the Region. As of 2016,
approximately 85% of work trips started by Waterloo residents were made using private
automobiles, while only 4% of these trips used transit. This suggests that more can be done
to make transit an attractive alternative to car travel for workers, such as providing more
frequent service when it is needed to reach employment destinations. Similarly, only 2% of
discretionary trips (shopping, appointments, etc.) used transit, suggesting that changes are
required to better connect travellers with non-work destinations.
1 TNCs represents the generic term used to refer to service providers of new forms for mobility where
passengers are matched with drivers using software applications accessible through mobile phones or
computers. Examples of TMCs include Uber & Lyft. TNCs are specifically referred to as Auxiliary Taxis within the
Region of Waterloo.
Moving Forward –Transit Strategy Report
2-8
EXHIBIT 2.5: CHANGES IN GRT REVENUE SERVICE HOURS AND RIDERSHIP, 2007–2018
Source: CUTA Canadian Transit Fact Books, 2007–2016, and Grand River Transit, 2017–2018
A Region-wide survey of travel behaviours, attitudes, and barriers around walking, cycling,
and public transit found that a majority of residents (approximately 68%) would be
interested in using public transit if some of their concerns are addressed. Respondents to
the survey cited the following as top barriers for not using public transit as often as they
would like:
Longer travel time to get between destinations;
Incompatibility between user and transit schedules; and
Too many connections required to get to destinations.
The significant potential to increase the use of public transit group means that all aspects of
the 2018 TMP should attempt to address these barriers. These could be achieved by
implementing strategies that:
Promote more land use intensification;
Provide direct transit routes;
Increase the speed of public transit (e.g. using measures such as transit priority to
reduce delays for transit vehicles, reducing travel times);
Invest in an all-day frequent transit network to expand the hours of service; and
Explore “first/last mile” connections from transit stops to reduce the need for
transfers.
Moving Forward –Transit Strategy Report
2-9
Transit Ridership is Peaked and Tied to Trip Length
Transit use also varies significantly by time-of-day and based on the length of trip being
taken. Average weekday transit ridership is currently peaked, which reflects peak
commuting times and student travel during morning and afternoon peak periods in the
Region. Most transit trips begin between 6 a.m. and 9 a.m. (morning peak) or 1 p.m. and 4
p.m. (afternoon peak), with a smaller subset of trips beginning around 5 p.m. Transit
ridership is generally low outside of these hours, however this may change as GRT expands
off-peak service.
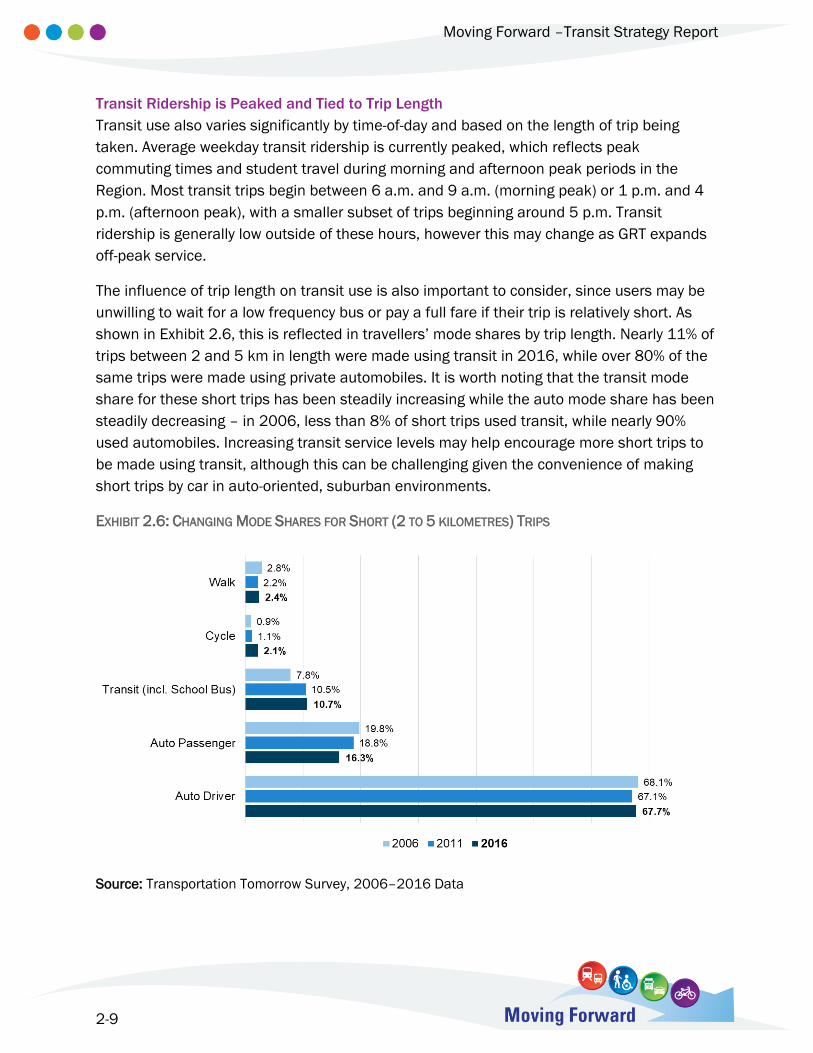
The influence of trip length on transit use is also important to consider, since users may be
unwilling to wait for a low frequency bus or pay a full fare if their trip is relatively short. As
shown in Exhibit 2.6, this is reflected in travellers’ mode shares by trip length. Nearly 11% of
trips between 2 and 5 km in length were made using transit in 2016, while over 80% of the
same trips were made using private automobiles. It is worth noting that the transit mode
share for these short trips has been steadily increasing while the auto mode share has been
steadily decreasing – in 2006, less than 8% of short trips used transit, while nearly 90%
used automobiles. Increasing transit service levels may help encourage more short trips to
be made using transit, although this can be challenging given the convenience of making
short trips by car in auto-oriented, suburban environments.
EXHIBIT 2.6: CHANGING MODE SHARES FOR SHORT (2 TO 5 KILOMETRES) TRIPS
Source: Transportation Tomorrow Survey, 2006–2016 Data
Moving Forward –Transit Strategy Report
2-10
Planning Context
The 2018 TMP has been prepared with consideration given to a number of previous and
current studies and plans. Many of these plans describe existing commitments for transit
improvements, outline approved budgets and spending, and describe higher-level planning
contexts within which the 2018 TMP has been developed. Specifically, plans and projects
that have impacted the transit strategy include:
Region of Waterloo Rapid Transit Environmental Assessment;
2010 Regional Transportation Master Plan;
Regional Municipality of Waterloo 2018 Program Budget;
GRT Business Plan 2017–2021;
2018 Region of Waterloo Ten Year Capital Budget and Forecast;
Stage 2 ION: Kitchener to Cambridge; and
Other regional and provincial plans.
Region of Waterloo Rapid Transit Environmental Assessment
The ION Environmental Assessment, an essential step in the process of designing and
implementing the ION rapid transit system, was completed in 2009. This document outlines
the changes that will be required to upgrade the existing 200 iXpress bus service between
Waterloo, Kitchener, and Cambridge to a higher-quality rapid transit service. This includes
the selection of specific route segments and rapid transit technologies for this transit
corridor, as well as the impact and mitigation measures required for the rapid transit
system.
Stage 1 of ION consists of a 19 kilometre Light Rail Transit (LRT) system between Conestoga
Mall in Waterloo and Fairview Park Mall in Kitchener, and a 17 kilometre adapted Bus Rapid
Transit (BRT) system operating between Fairview Park Mall and Ainslie Street Terminal in
Cambridge. As part of this plan, future protections are in place for Stage 2 – an LRT
extension to Ainslie Street Terminal, allowing for end-to-end LRT service between Waterloo
and Cambridge. The Stage 1 ION routes are shown in Exhibit 2.1 (page 2-3), and the Stage 2
ION LRT route between Kitchener and Cambridge is shown in more detail in Exhibit 2.8
(page 2-14).
Moving Forward –Transit Strategy Report
2-11
2010 Waterloo Regional Transportation Master Plan
The 2010 RTMP was developed to achieve four goals; optimize the transportation system,
promote transportation choice, foster a strong economy, and support sustainable
development. With respect to the transit network, objectives of the plan included:
Investing in integrated public transit services to manage demand on key corridors;
Adding connections and linkages within the existing system to minimize the need for
more infrastructure;
Improving the way transit priority and other components of the transportation network
work together to reduce delays;
Encouraging and preserving opportunities for rapid transit, where appropriate; and
Continuing to support innovative approaches to expand the existing transit system.
To meet these goals and objectives, the 2010 RTMP focused on a transit-oriented plan with
strategic road improvements, developed through the use of transit mode share targets. For
the plan’s horizon year of 2031, a p.m. peak hour transit mode share target of 14.8% was
set. This meant that 14.8% of all trips taken within the Region of Waterloo would use a form
of public transit, representing a shift away from private automobile use. In addition, specific
screenline transit mode share targets were set for the 2031 p.m. peak hour, ranging
between 10% and 45% in Kitchener, Cambridge, and Waterloo.
To reach these target mode shares, the following transit projects were proposed in the 2010
RTMP to be part of the 2031 transit network:
Completing Stage 1 of ION, consisting of LRT, from Conestoga Mall to Fairview Park
Mall and adapted BRT from Fairview Park Mall to Ainslie Street Terminal, by 2016;
Growing the iXpress network throughout Waterloo, Kitchener, and Cambridge, which
included improving service frequency and adding more routes by 2021;
Developing new local routes within Waterloo, Kitchener, and Cambridge, as well as
routes to serve surrounding townships;
Improving levels of service for local routes, as well as school/university routes; and
Adding transit priority measures to intersections and corridors in the form of transit
lanes, transit signal priority, and queue jump lanes.
Beyond the 2010 RTMP’s horizon year of 2031, it was noted that local transit capacity
between Kitchener and Cambridge could be improved by extending the ION LRT into
Cambridge (replacing the adapted BRT service between Fairview Park Mall and Ainslie Street
Terminal).
Moving Forward –Transit Strategy Report
2-12
The capital and operating costs associated with service growth in the 2010 RTMP were
assessed. For the first 10 years of the plan (2012–2021), transit capital costs were
expected to be $285 M, while operating costs were expected to be about $630 M (net of
fare revenue). Over the latter 10 years of the plan (2022–2031), transit capital and
operating costs were expected to increase to $385 M and $1,050 M, respectively.
GRT Business Plan 2017–2021
The GRT Business Plan outlines transit service changes and improvements to be
implemented over the five year period between 2017 and 2021. These changes were
developed to meet interim transit ridership targets outlined in the 2010 RTMP, in addition to
supporting the following six “New Directions” initiatives outlined by GRT:
Seamless connections to ION;
New express routes running on key corridors;
More frequent service on busy routes;
More direct routes supporting a grid network;
Fast and convenient electronic fare payment; and
More comfortable rides, stops and stations.
The changes described in the GRT Business Plan would all be made when ION service starts.
With this central transit corridor in place, the Business Plan calls for the integration of
existing routes and services with ION, including better transfers as well as integrated fares
and stations. Local and iXpress route frequencies will be improved during peak periods and
midday. Routes will be adjusted to support a grid network, and new routes and route
extensions will be added to serve new growth areas and Townships over this five year plan.
This plan also calls for transitioning routes away from the Charles Terminal, which will be
phased out after 2021. Transfer opportunities would instead be provided at other Downtown
Kitchener ION stations or the forthcoming Central Station multimodal hub.
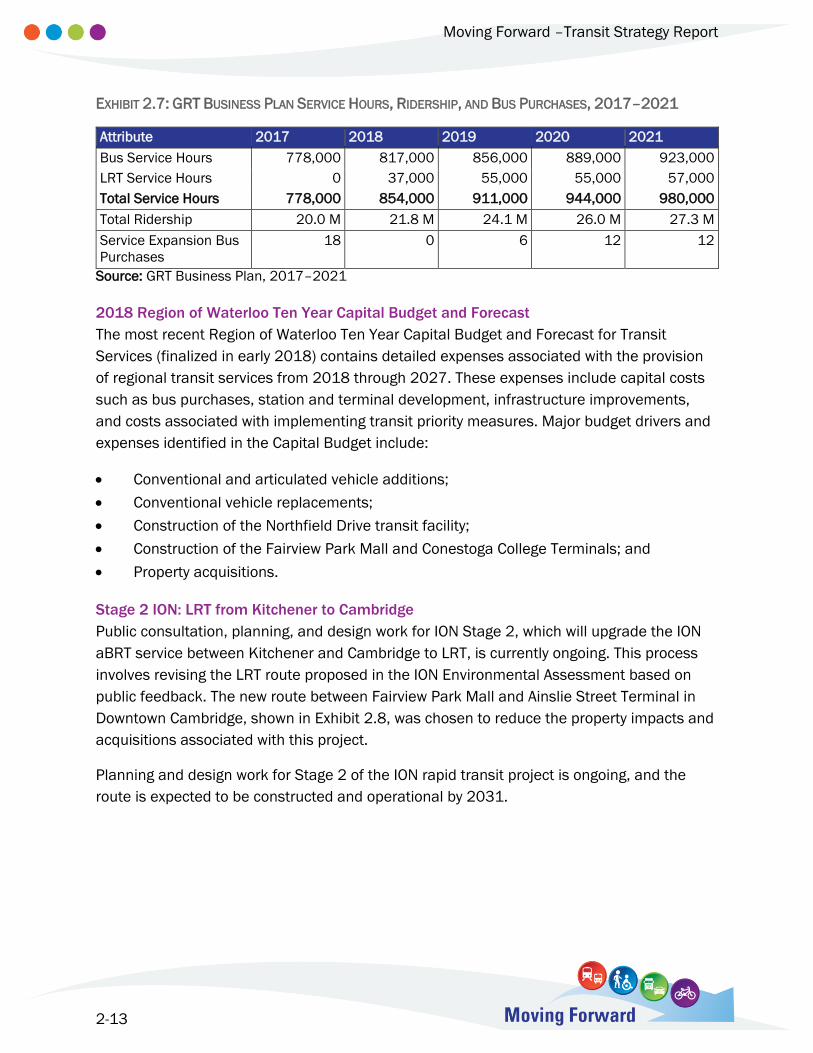
Transit ridership goals for the 2018 TMP were based on deferring the 2021 ridership target
of 28 million (set in the 2010 RTMP) to 2023. This reduces the 2021 system ridership
target to 27.3 million, a level that can be reached by expanding GRT service by 35,000
hours annually, or 4.2%. A schedule of these service changes, in addition to bus purchases
and ridership forecasts, between 2017 and 2021 is shown in Exhibit 2.7.
Moving Forward –Transit Strategy Report
2-13
EXHIBIT 2.7: GRT BUSINESS PLAN SERVICE HOURS, RIDERSHIP, AND BUS PURCHASES, 2017–2021
Attribute 2017 2018 2019 2020 2021
Bus Service Hours 778,000 817,000 856,000 889,000 923,000
LRT Service Hours 0 37,000 55,000 55,000 57,000
Total Service Hours 778,000 854,000 911,000 944,000 980,000
Total Ridership 20.0 M 21.8 M 24.1 M 26.0 M 27.3 M
Service Expansion Bus
Purchases
18 0 6 12 12
Source: GRT Business Plan, 2017–2021
2018 Region of Waterloo Ten Year Capital Budget and Forecast
The most recent Region of Waterloo Ten Year Capital Budget and Forecast for Transit
Services (finalized in early 2018) contains detailed expenses associated with the provision
of regional transit services from 2018 through 2027. These expenses include capital costs
such as bus purchases, station and terminal development, infrastructure improvements,
and costs associated with implementing transit priority measures. Major budget drivers and
expenses identified in the Capital Budget include:
Conventional and articulated vehicle additions;
Conventional vehicle replacements;
Construction of the Northfield Drive transit facility;
Construction of the Fairview Park Mall and Conestoga College Terminals; and
Property acquisitions.
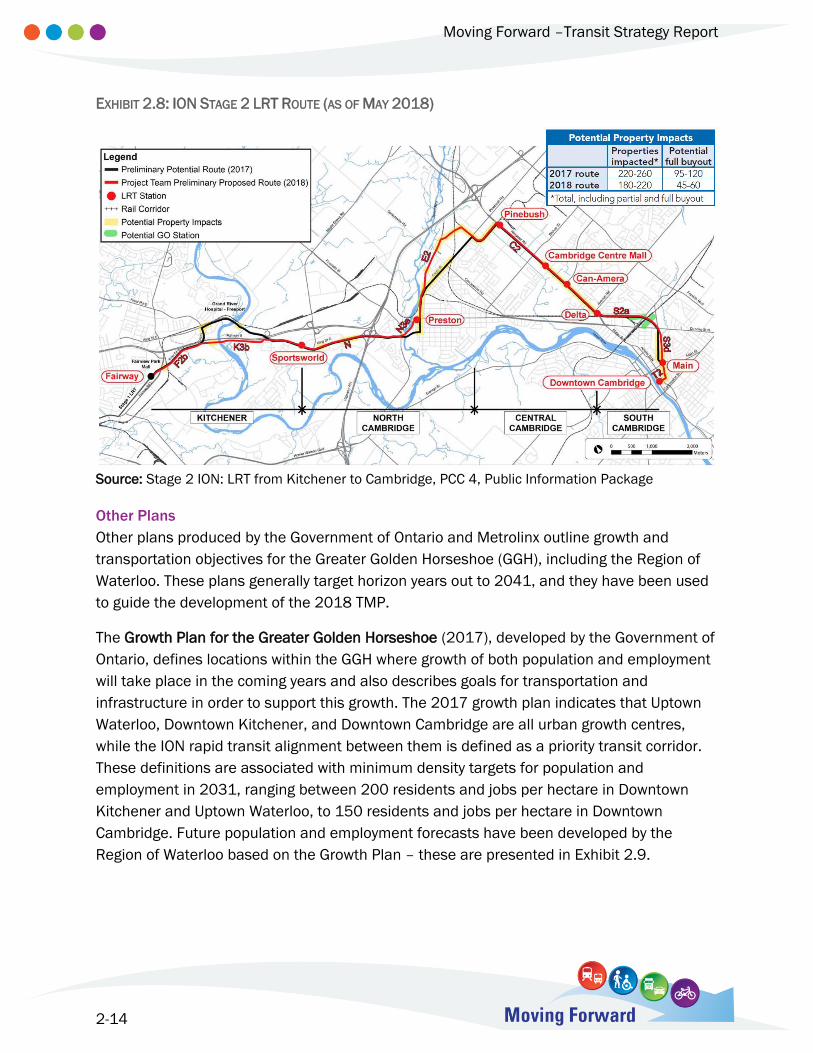
Stage 2 ION: LRT from Kitchener to Cambridge
Public consultation, planning, and design work for ION Stage 2, which will upgrade the ION
aBRT service between Kitchener and Cambridge to LRT, is currently ongoing. This process
involves revising the LRT route proposed in the ION Environmental Assessment based on
public feedback. The new route between Fairview Park Mall and Ainslie Street Terminal in
Downtown Cambridge, shown in Exhibit 2.8, was chosen to reduce the property impacts and
acquisitions associated with this project.
Planning and design work for Stage 2 of the ION rapid transit project is ongoing, and the
route is expected to be constructed and operational by 2031.
Moving Forward –Transit Strategy Report
2-14
EXHIBIT 2.8: ION STAGE 2 LRT ROUTE (AS OF MAY 2018)
Source: Stage 2 ION: LRT from Kitchener to Cambridge, PCC 4, Public Information Package
Other Plans
Other plans produced by the Government of Ontario and Metrolinx outline growth and
transportation objectives for the Greater Golden Horseshoe (GGH), including the Region of
Waterloo. These plans generally target horizon years out to 2041, and they have been used
to guide the development of the 2018 TMP.
The Growth Plan for the Greater Golden Horseshoe (2017), developed by the Government of
Ontario, defines locations within the GGH where growth of both population and employment
will take place in the coming years and also describes goals for transportation and
infrastructure in order to support this growth. The 2017 growth plan indicates that Uptown
Waterloo, Downtown Kitchener, and Downtown Cambridge are all urban growth centres,
while the ION rapid transit alignment between them is defined as a priority transit corridor.
These definitions are associated with minimum density targets for population and
employment in 2031, ranging between 200 residents and jobs per hectare in Downtown
Kitchener and Uptown Waterloo, to 150 residents and jobs per hectare in Downtown
Cambridge. Future population and employment forecasts have been developed by the
Region of Waterloo based on the Growth Plan – these are presented in Exhibit 2.9.
Moving Forward –Transit Strategy Report
2-15
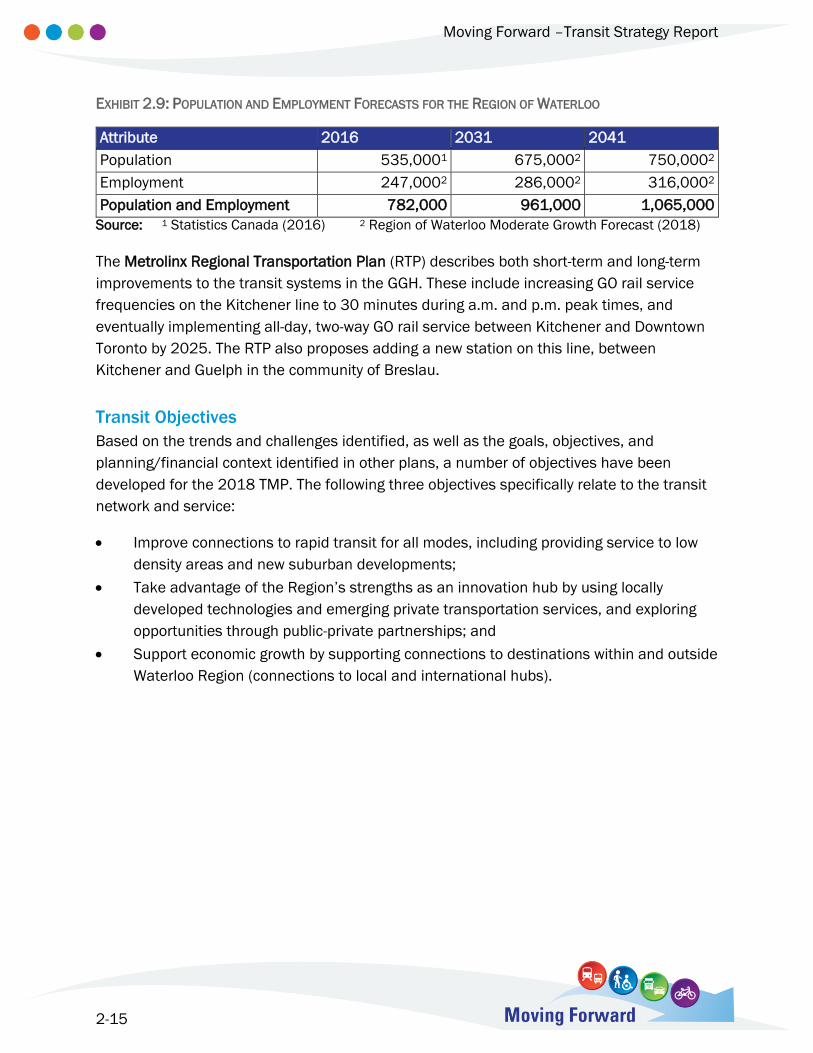
EXHIBIT 2.9: POPULATION AND EMPLOYMENT FORECASTS FOR THE REGION OF WATERLOO
Attribute 2016 2031 2041
Population 535,0001 675,0002 750,0002
Employment 247,0002 286,0002 316,0002
Population and Employment 782,000 961,000 1,065,000
Source: 1 Statistics Canada (2016) 2 Region of Waterloo Moderate Growth Forecast (2018)
The Metrolinx Regional Transportation Plan (RTP) describes both short-term and long-term
improvements to the transit systems in the GGH. These include increasing GO rail service
frequencies on the Kitchener line to 30 minutes during a.m. and p.m. peak times, and
eventually implementing all-day, two-way GO rail service between Kitchener and Downtown
Toronto by 2025. The RTP also proposes adding a new station on this line, between
Kitchener and Guelph in the community of Breslau.
Transit Objectives
Based on the trends and challenges identified, as well as the goals, objectives, and
planning/financial context identified in other plans, a number of objectives have been
developed for the 2018 TMP. The following three objectives specifically relate to the transit
network and service:
Improve connections to rapid transit for all modes, including providing service to low
density areas and new suburban developments;
Take advantage of the Region’s strengths as an innovation hub by using locally
developed technologies and emerging private transportation services, and exploring
opportunities through public-private partnerships; and
Support economic growth by supporting connections to destinations within and outside
Waterloo Region (connections to local and international hubs).
3-1
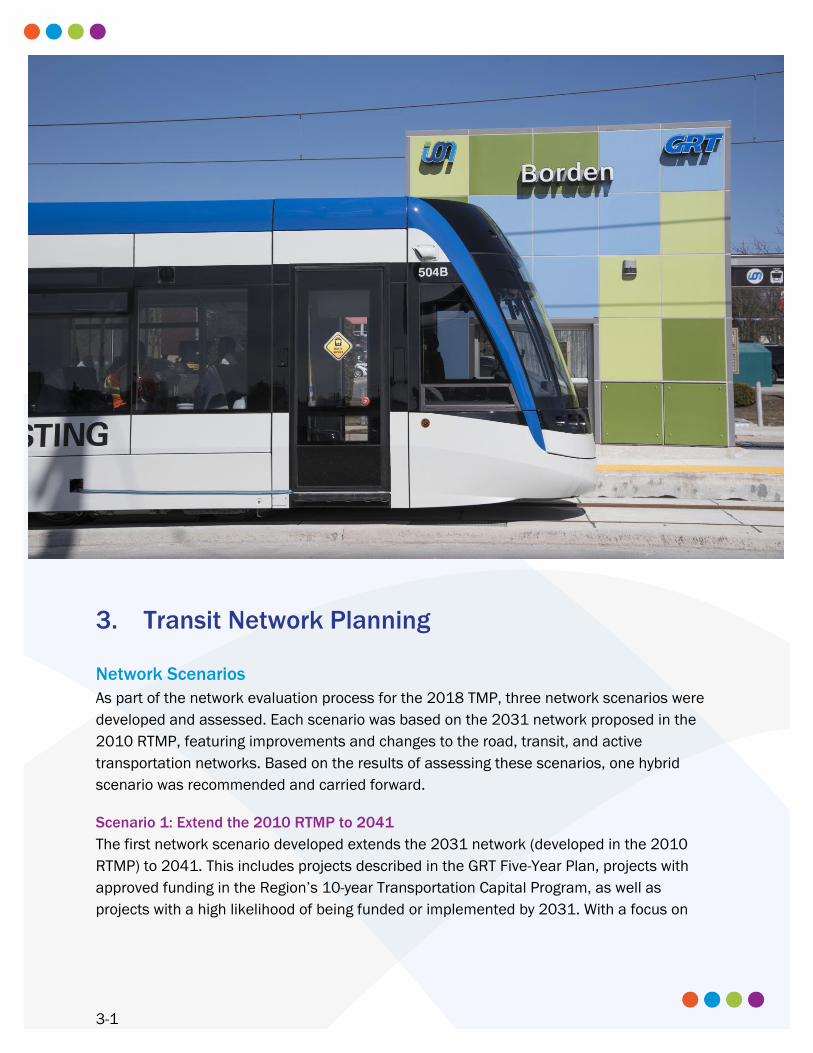
3. Transit Network Planning
Network Scenarios
As part of the network evaluation process for the 2018 TMP, three network scenarios were
developed and assessed. Each scenario was based on the 2031 network proposed in the
2010 RTMP, featuring improvements and changes to the road, transit, and active
transportation networks. Based on the results of assessing these scenarios, one hybrid
scenario was recommended and carried forward.
Scenario 1: Extend the 2010 RTMP to 2041
The first network scenario developed extends the 2031 network (developed in the 2010
RTMP) to 2041. This includes projects described in the GRT Five-Year Plan, projects with
approved funding in the Region’s 10-year Transportation Capital Program, as well as
projects with a high likelihood of being funded or implemented by 2031. With a focus on
Moving Forward –Transit Strategy Report
3-2
transit, this means that investment in express and rapid transit (ION) service will be
aggressive through 2041.
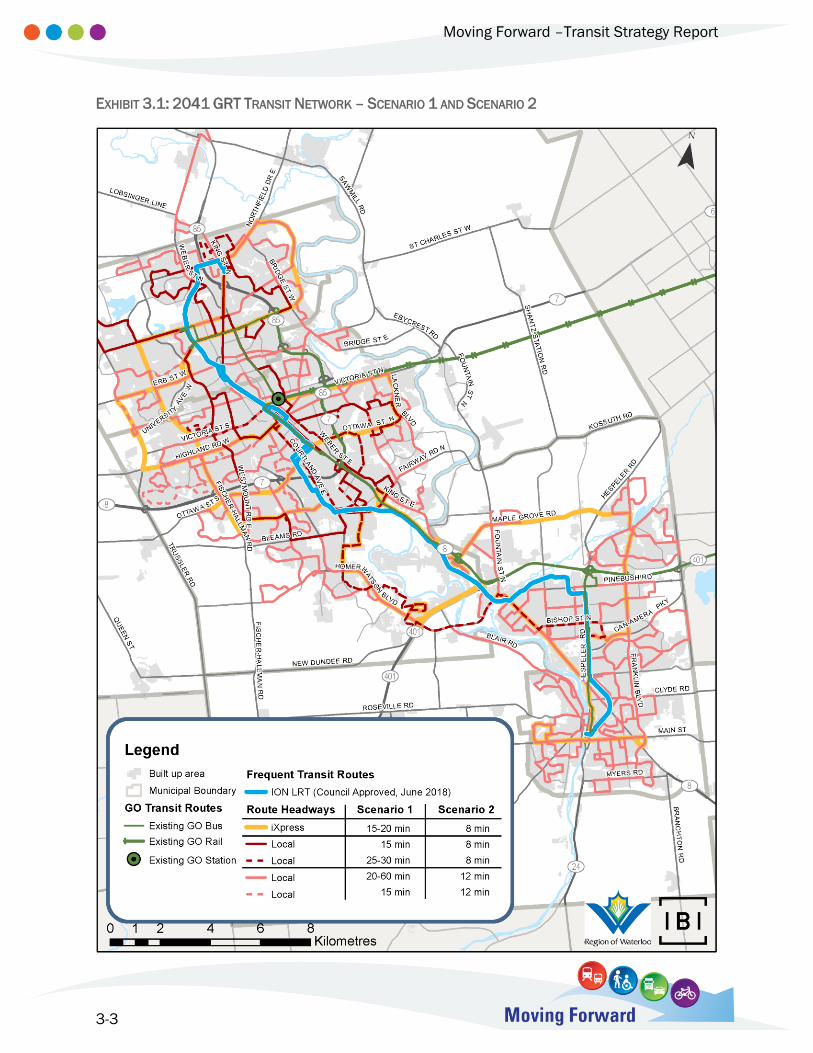
A map of the potential future GRT network for Scenario 1 is presented in Exhibit 3.1.
Scenario 2: More Investment in Transit and Active Transportation
The second network scenario is based on increased investments in the transit network,
transit service, and active transportation above and beyond the recommendations of the
2010 RTMP. Transit changes that would be made to accomplish this goal include:
Developing an all-day high-frequency transit network;
Providing more frequent off-peak transit service;
Improving transit access to low-density areas; and
Protecting corridors for future rail service and ION Stage 3 routes.
Scenario 2 would specifically upgrade all route headways to 12 minutes and further upgrade
headways on high-frequency local routes and iXpress routes to 8 minutes. This would reduce
headways on frequent routes (local or iXpress) by up to 7 minutes, reduce headways on
regular local routes by up to 22 minutes, and reduce headways on custom routes (providing
specialty or township service) by up to 48 minutes. The GRT network for Scenario 2 is also
presented in Exhibit 3.1, where improved headways for different route classes are shown.
Scenario 3: New Mobility
The third scenario features new mobility options, reducing emphasis on conventional
transportation modes. These new options include car sharing, high-occupancy vehicles, on-
demand public transit services, and connected and autonomous vehicles (CAVs). While this
scenario was not explicitly evaluated, risks and opportunities from these new technologies
were identified, and trends in new mobility were explored to determine how best to meet the
Region’s goals. More details about this scenario and the impacts of new mobility are
provided in the Transportation Network Assessment Report and the New Mobility Report.
Moving Forward –Transit Strategy Report
3-3
EXHIBIT 3.1: 2041 GRT TRANSIT NETWORK – SCENARIO 1 AND SCENARIO 2
Moving Forward –Transit Strategy Report
3-4
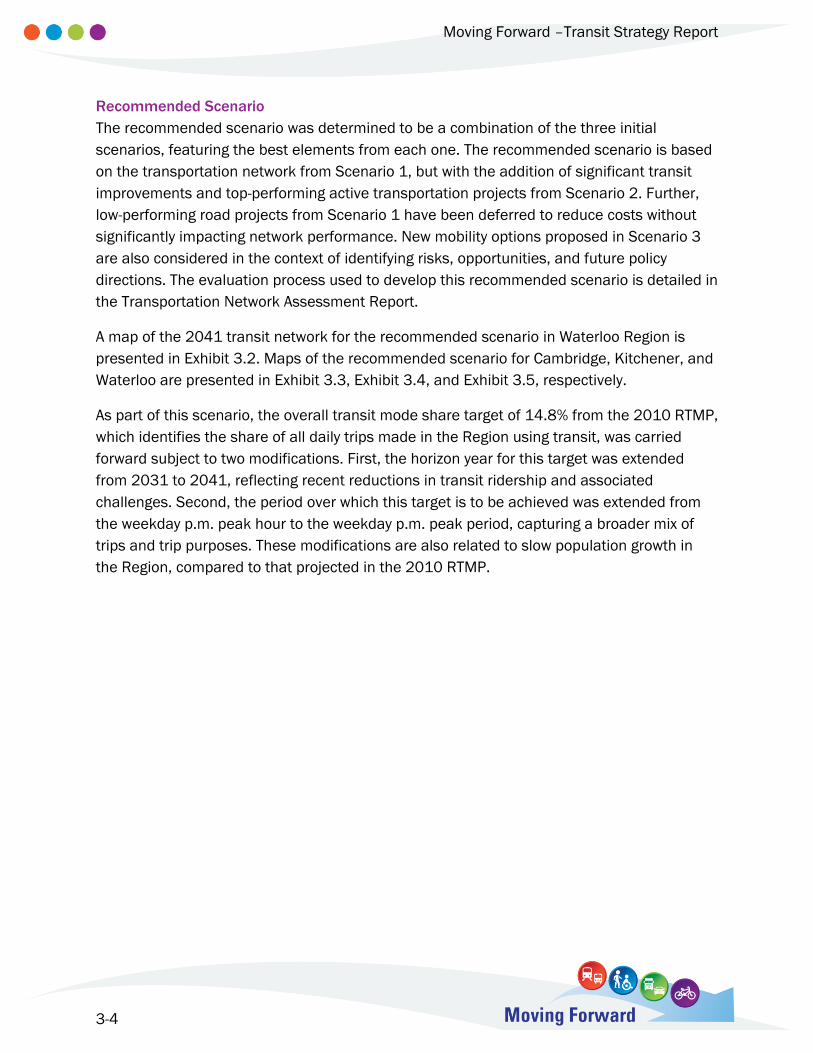
Recommended Scenario
The recommended scenario was determined to be a combination of the three initial
scenarios, featuring the best elements from each one. The recommended scenario is based
on the transportation network from Scenario 1, but with the addition of significant transit
improvements and top-performing active transportation projects from Scenario 2. Further,
low-performing road projects from Scenario 1 have been deferred to reduce costs without
significantly impacting network performance. New mobility options proposed in Scenario 3
are also considered in the context of identifying risks, opportunities, and future policy
directions. The evaluation process used to develop this recommended scenario is detailed in
the Transportation Network Assessment Report.
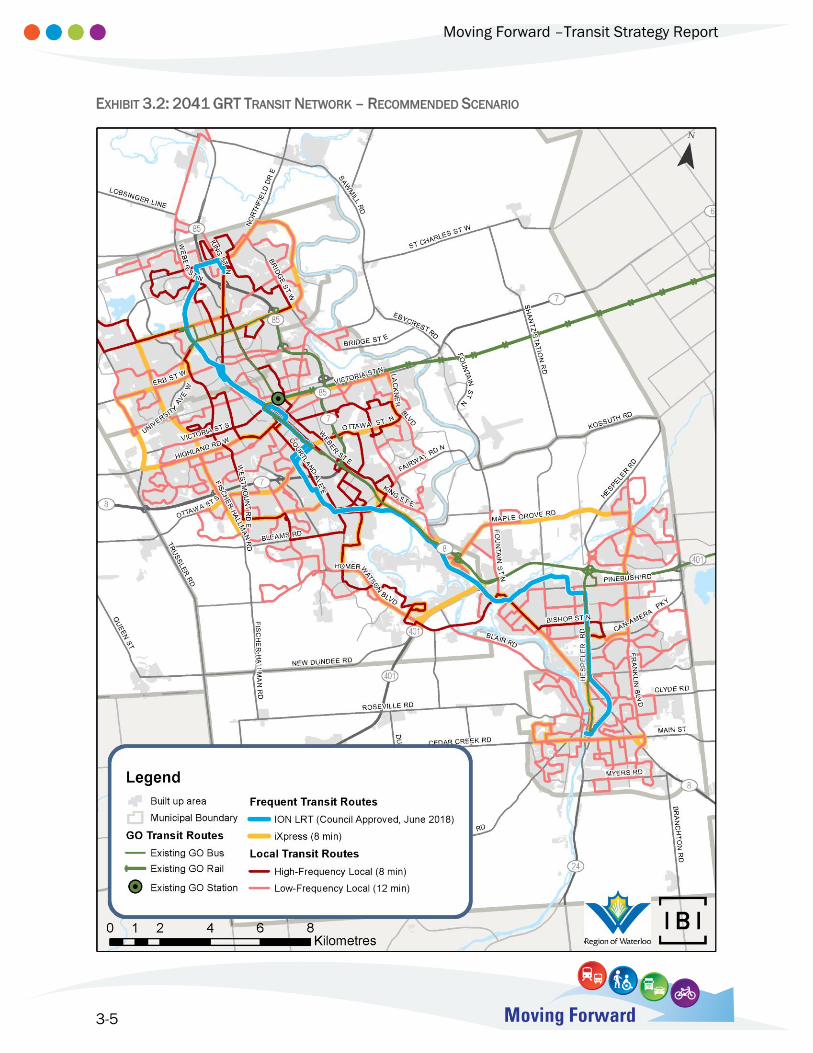
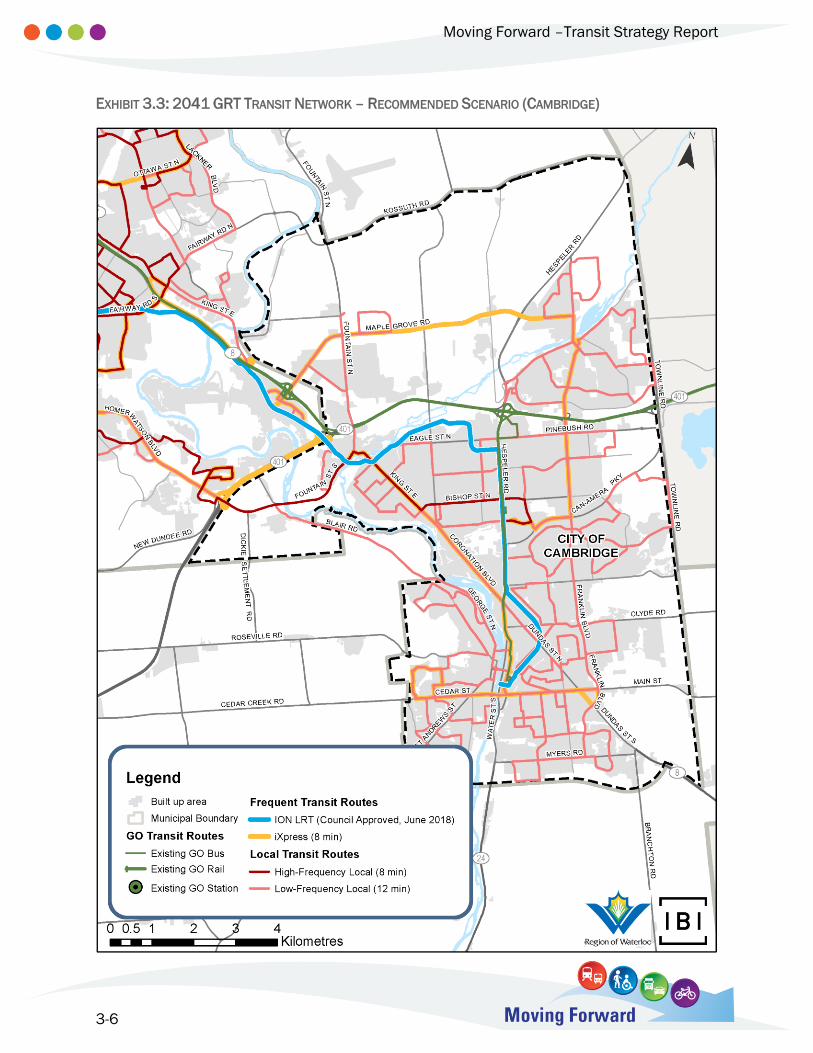
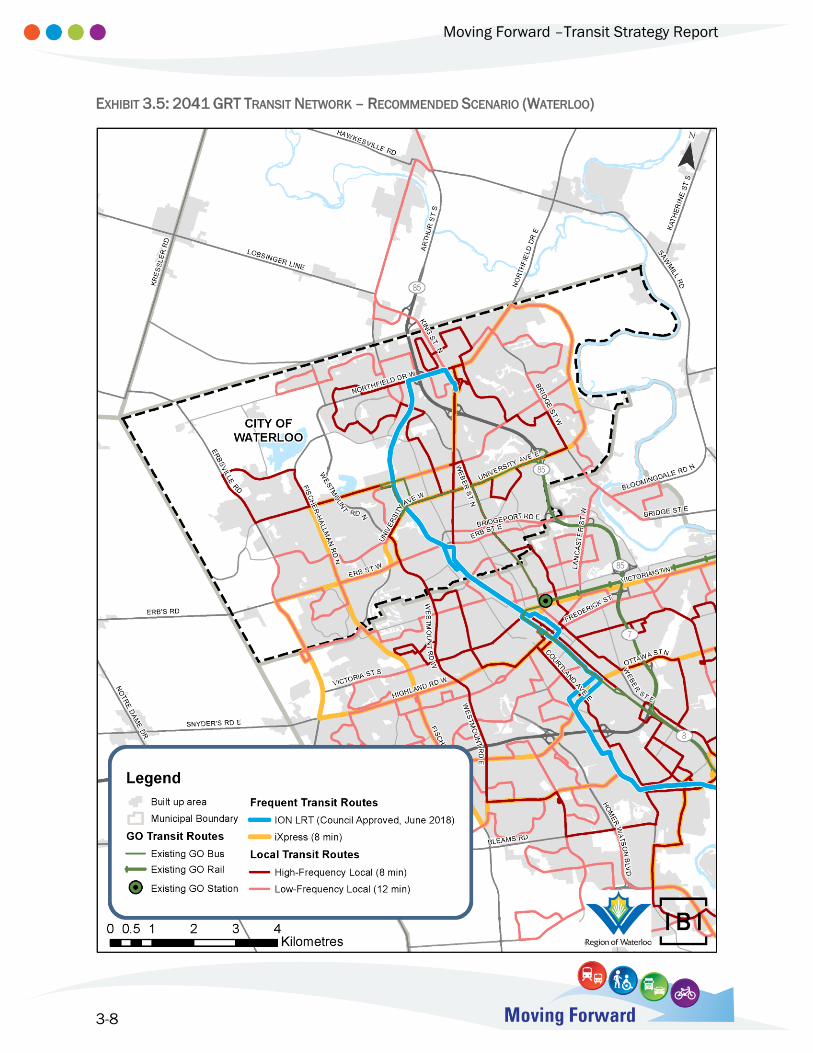
A map of the 2041 transit network for the recommended scenario in Waterloo Region is
presented in Exhibit 3.2. Maps of the recommended scenario for Cambridge, Kitchener, and
Waterloo are presented in Exhibit 3.3, Exhibit 3.4, and Exhibit 3.5, respectively.
As part of this scenario, the overall transit mode share target of 14.8% from the 2010 RTMP,
which identifies the share of all daily trips made in the Region using transit, was carried
forward subject to two modifications. First, the horizon year for this target was extended
from 2031 to 2041, reflecting recent reductions in transit ridership and associated
challenges. Second, the period over which this target is to be achieved was extended from
the weekday p.m. peak hour to the weekday p.m. peak period, capturing a broader mix of
trips and trip purposes. These modifications are also related to slow population growth in
the Region, compared to that projected in the 2010 RTMP.
Moving Forward –Transit Strategy Report
3-5
EXHIBIT 3.2: 2041 GRT TRANSIT NETWORK – RECOMMENDED SCENARIO
Moving Forward –Transit Strategy Report
3-6
EXHIBIT 3.3: 2041 GRT TRANSIT NETWORK – RECOMMENDED SCENARIO (CAMBRIDGE)
Moving Forward –Transit Strategy Report
3-7
EXHIBIT 3.4: 2041 GRT TRANSIT NETWORK – RECOMMENDED SCENARIO (KITCHENER)
Moving Forward –Transit Strategy Report
3-8
EXHIBIT 3.5: 2041 GRT TRANSIT NETWORK – RECOMMENDED SCENARIO (WATERLOO)
Moving Forward –Transit Strategy Report
3-9
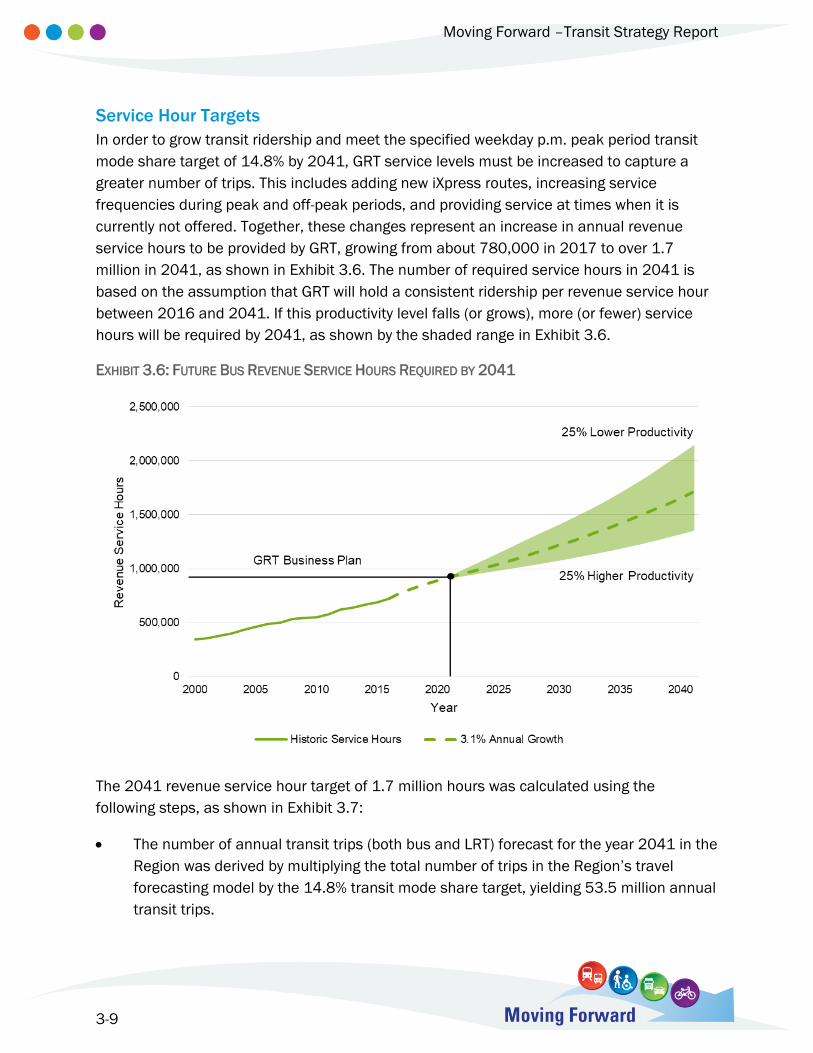
Service Hour Targets
In order to grow transit ridership and meet the specified weekday p.m. peak period transit
mode share target of 14.8% by 2041, GRT service levels must be increased to capture a
greater number of trips. This includes adding new iXpress routes, increasing service
frequencies during peak and off-peak periods, and providing service at times when it is
currently not offered. Together, these changes represent an increase in annual revenue
service hours to be provided by GRT, growing from about 780,000 in 2017 to over 1.7
million in 2041, as shown in Exhibit 3.6. The number of required service hours in 2041 is
based on the assumption that GRT will hold a consistent ridership per revenue service hour
between 2016 and 2041. If this productivity level falls (or grows), more (or fewer) service
hours will be required by 2041, as shown by the shaded range in Exhibit 3.6.
EXHIBIT 3.6: FUTURE BUS REVENUE SERVICE HOURS REQUIRED BY 2041
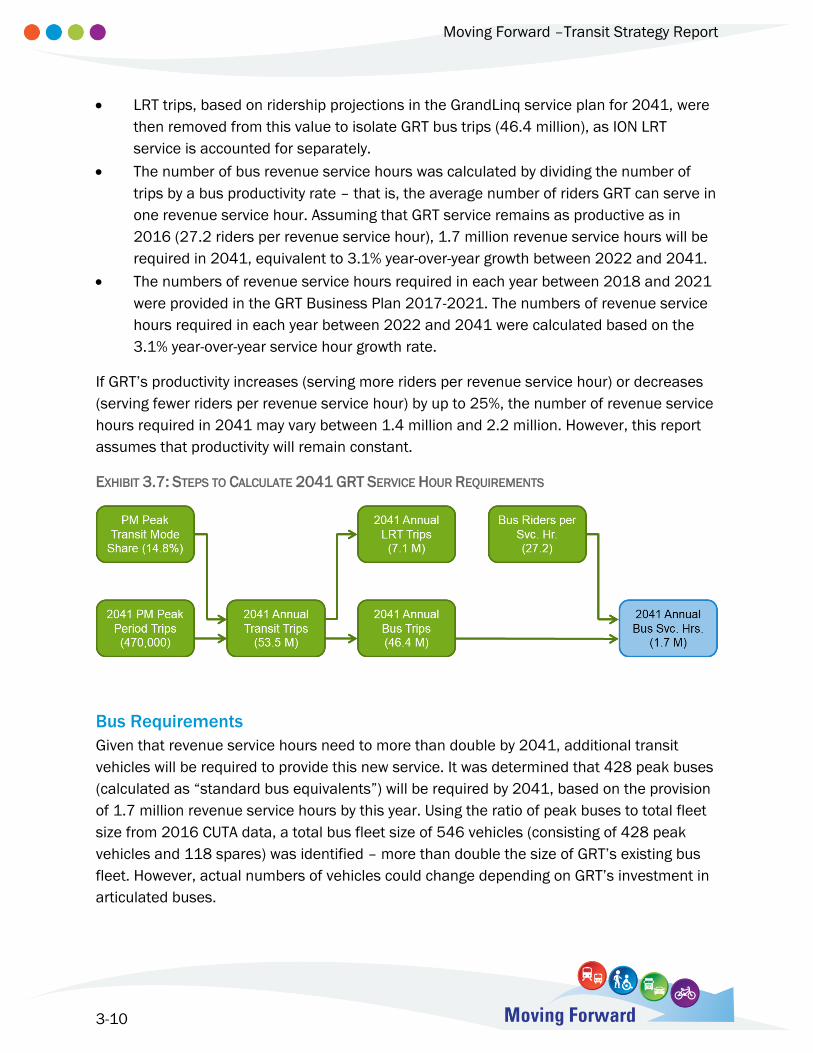
The 2041 revenue service hour target of 1.7 million hours was calculated using the
following steps, as shown in Exhibit 3.7:
The number of annual transit trips (both bus and LRT) forecast for the year 2041 in the
Region was derived by multiplying the total number of trips in the Region’s travel
forecasting model by the 14.8% transit mode share target, yielding 53.5 million annual
transit trips.
Moving Forward –Transit Strategy Report
3-10
LRT trips, based on ridership projections in the GrandLinq service plan for 2041, were
then removed from this value to isolate GRT bus trips (46.4 million), as ION LRT
service is accounted for separately.
The number of bus revenue service hours was calculated by dividing the number of
trips by a bus productivity rate – that is, the average number of riders GRT can serve in
one revenue service hour. Assuming that GRT service remains as productive as in
2016 (27.2 riders per revenue service hour), 1.7 million revenue service hours will be
required in 2041, equivalent to 3.1% year-over-year growth between 2022 and 2041.
The numbers of revenue service hours required in each year between 2018 and 2021
were provided in the GRT Business Plan 2017-2021. The numbers of revenue service
hours required in each year between 2022 and 2041 were calculated based on the
3.1% year-over-year service hour growth rate.
If GRT’s productivity increases (serving more riders per revenue service hour) or decreases
(serving fewer riders per revenue service hour) by up to 25%, the number of revenue service
hours required in 2041 may vary between 1.4 million and 2.2 million. However, this report
assumes that productivity will remain constant.
EXHIBIT 3.7: STEPS TO CALCULATE 2041 GRT SERVICE HOUR REQUIREMENTS
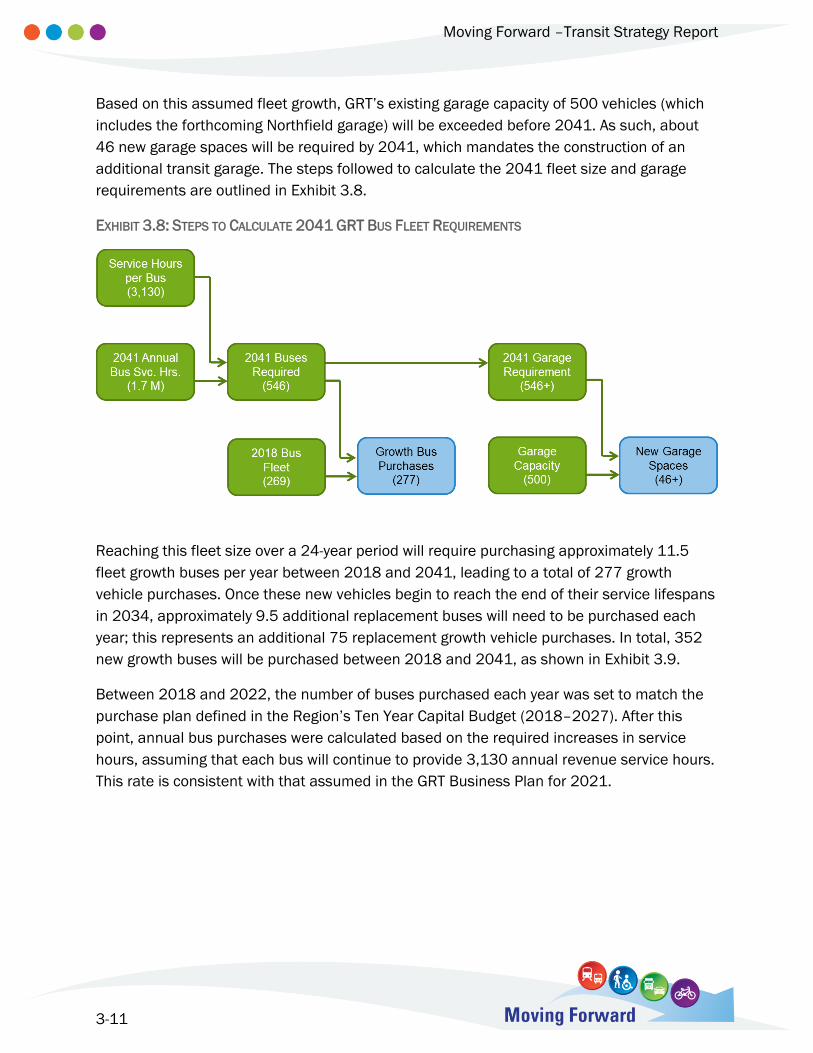
Bus Requirements
Given that revenue service hours need to more than double by 2041, additional transit
vehicles will be required to provide this new service. It was determined that 428 peak buses
(calculated as “standard bus equivalents”) will be required by 2041, based on the provision
of 1.7 million revenue service hours by this year. Using the ratio of peak buses to total fleet
size from 2016 CUTA data, a total bus fleet size of 546 vehicles (consisting of 428 peak
vehicles and 118 spares) was identified – more than double the size of GRT’s existing bus
fleet. However, actual numbers of vehicles could change depending on GRT’s investment in
articulated buses.
Moving Forward –Transit Strategy Report
3-11
Based on this assumed fleet growth, GRT’s existing garage capacity of 500 vehicles (which
includes the forthcoming Northfield garage) will be exceeded before 2041. As such, about
46 new garage spaces will be required by 2041, which mandates the construction of an
additional transit garage. The steps followed to calculate the 2041 fleet size and garage
requirements are outlined in Exhibit 3.8.
EXHIBIT 3.8: STEPS TO CALCULATE 2041 GRT BUS FLEET REQUIREMENTS
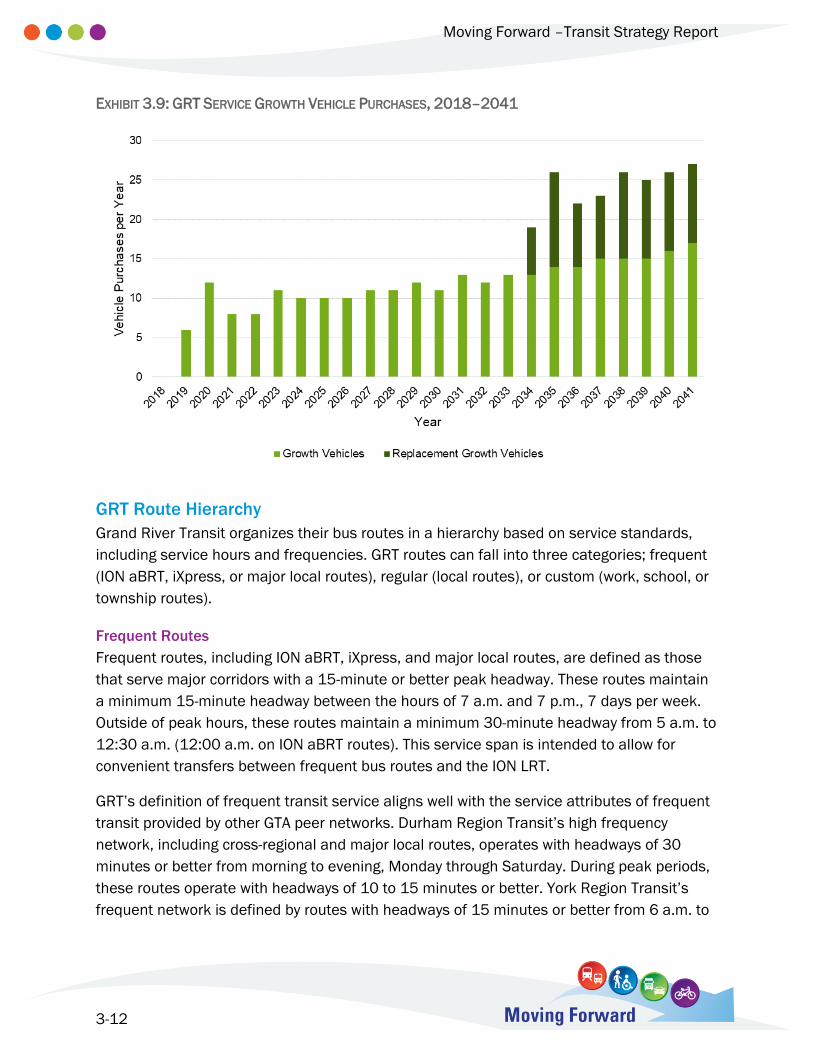
Reaching this fleet size over a 24-year period will require purchasing approximately 11.5
fleet growth buses per year between 2018 and 2041, leading to a total of 277 growth
vehicle purchases. Once these new vehicles begin to reach the end of their service lifespans
in 2034, approximately 9.5 additional replacement buses will need to be purchased each
year; this represents an additional 75 replacement growth vehicle purchases. In total, 352
new growth buses will be purchased between 2018 and 2041, as shown in Exhibit 3.9.
Between 2018 and 2022, the number of buses purchased each year was set to match the
purchase plan defined in the Region’s Ten Year Capital Budget (2018–2027). After this
point, annual bus purchases were calculated based on the required increases in service
hours, assuming that each bus will continue to provide 3,130 annual revenue service hours.
This rate is consistent with that assumed in the GRT Business Plan for 2021.
Moving Forward –Transit Strategy Report
3-12
EXHIBIT 3.9: GRT SERVICE GROWTH VEHICLE PURCHASES, 2018–2041
GRT Route Hierarchy
Grand River Transit organizes their bus routes in a hierarchy based on service standards,
including service hours and frequencies. GRT routes can fall into three categories; frequent
(ION aBRT, iXpress, or major local routes), regular (local routes), or custom (work, school, or
township routes).
Frequent Routes
Frequent routes, including ION aBRT, iXpress, and major local routes, are defined as those
that serve major corridors with a 15-minute or better peak headway. These routes maintain
a minimum 15-minute headway between the hours of 7 a.m. and 7 p.m., 7 days per week.
Outside of peak hours, these routes maintain a minimum 30-minute headway from 5 a.m. to
12:30 a.m. (12:00 a.m. on ION aBRT routes). This service span is intended to allow for
convenient transfers between frequent bus routes and the ION LRT.
GRT’s definition of frequent transit service aligns well with the service attributes of frequent
transit provided by other GTA peer networks. Durham Region Transit’s high frequency
network, including cross-regional and major local routes, operates with headways of 30
minutes or better from morning to evening, Monday through Saturday. During peak periods,
these routes operate with headways of 10 to 15 minutes or better. York Region Transit’s
frequent network is defined by routes with headways of 15 minutes or better from 6 a.m. to
Moving Forward –Transit Strategy Report
3-13
10 p.m., on every weekday, weekend, and holiday. This includes the VIVA network, which
operates some routes on 7 to 8 minute headways.
Regular Routes
Regular routes consist entirely of lower-frequency local routes, and are defined as those that
prioritize access and service coverage for communities by providing 30-minute or better
headways throughout the day. These routes operate between the hours of 6 a.m. and 10
p.m. from Monday to Saturday, and Sunday service may be flexibly added if warranted by
demand. All regular routes connect to the frequent transit network.
Custom Routes
Custom routes include those serving industrial work areas, schools, and townships within
Waterloo Region (Elmira, Wilmot, Breslau, and Ayr), and those providing alternative service.
Service levels on these routes vary based on the target market, but most operate with 30-
mintue or better service during morning and afternoon peak hours (6 a.m. to 9 a.m. and 2
p.m. to 6 p.m., respectively) from Monday to Friday. Other routes within this category include
alternative transit services, such as BusPLUS routes, that operate using smaller vehicles
and are characterized by flexible, demand-responsive routings.
Service Levels
Based on the GRT route hierarchy, service levels for GRT bus routes have been calculated
for horizon years between 2021 and 2041, inclusive. These service levels have been
calculated to fit within the total number of service hours defined in Exhibit 3.7 while using
the number of peak buses defined in Exhibit 3.8. For these horizon years, three route
classes have been re-grouped as follows:
iXpress routes are separated from high-frequency local routes, and will have the same
or better headways as these local routes;
High-Frequency Local routes consist of key local routes that are operating at high
frequencies, but are not a part of the iXpress network; and
Low-Frequency Local routes consist of regular and custom routes, which provide
service to lower-demand areas and townships. These routes are expected to operate
at the same headways during peak periods.
By 2021, GRT’s iXpress routes will be able to operate at 10-minute headways during peak
periods, while high-frequency local routes will be able to operate at 15-minute headways.
Low-frequency local routes will operate at 30-minute headways. Over the following 20 years,
these service frequencies will steadily increase. iXpress headways will decrease to 8
minutes by 2036, remaining at this level through 2041. Headways on high-frequency local
Moving Forward –Transit Strategy Report
3-14
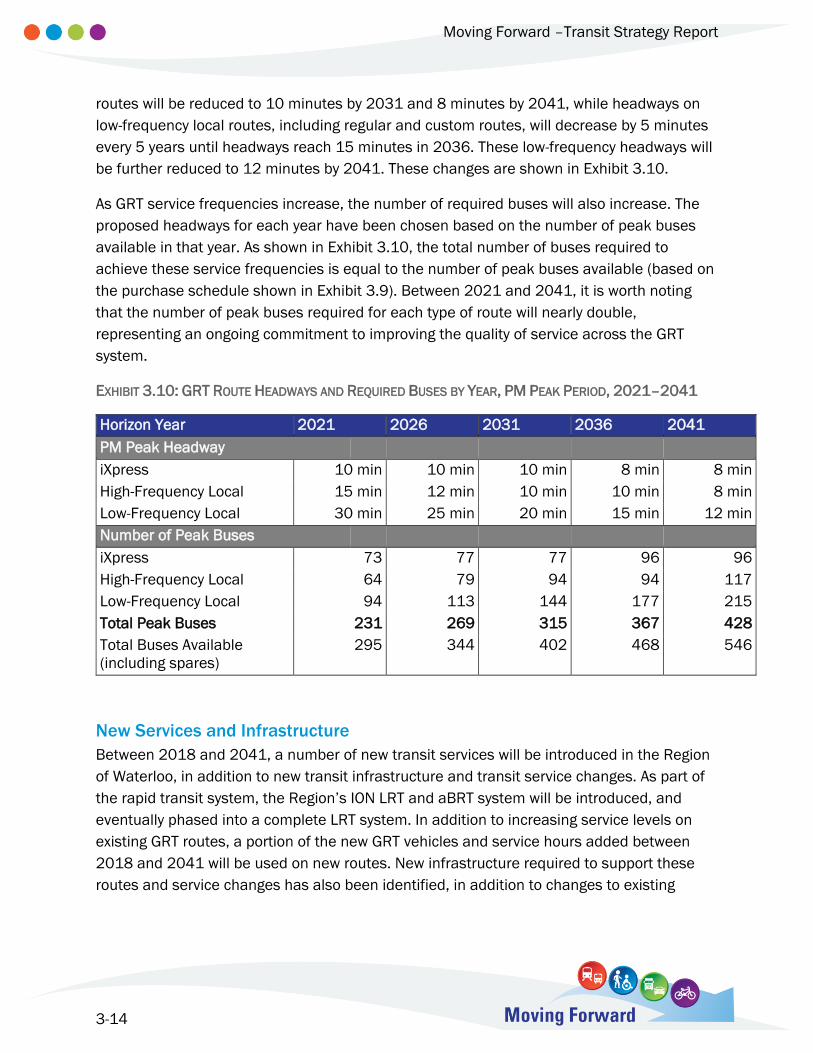
routes will be reduced to 10 minutes by 2031 and 8 minutes by 2041, while headways on
low-frequency local routes, including regular and custom routes, will decrease by 5 minutes
every 5 years until headways reach 15 minutes in 2036. These low-frequency headways will
be further reduced to 12 minutes by 2041. These changes are shown in Exhibit 3.10.
As GRT service frequencies increase, the number of required buses will also increase. The
proposed headways for each year have been chosen based on the number of peak buses
available in that year. As shown in Exhibit 3.10, the total number of buses required to
achieve these service frequencies is equal to the number of peak buses available (based on
the purchase schedule shown in Exhibit 3.9). Between 2021 and 2041, it is worth noting
that the number of peak buses required for each type of route will nearly double,
representing an ongoing commitment to improving the quality of service across the GRT
system.
EXHIBIT 3.10: GRT ROUTE HEADWAYS AND REQUIRED BUSES BY YEAR, PM PEAK PERIOD, 2021–2041
Horizon Year 2021 2026 2031 2036 2041
PM Peak Headway
iXpress 10 min 10 min 10 min 8 min 8 min
High-Frequency Local 15 min 12 min 10 min 10 min 8 min
Low-Frequency Local 30 min 25 min 20 min 15 min 12 min
Number of Peak Buses
iXpress 73 77 77 96 96
High-Frequency Local 64 79 94 94 117
Low-Frequency Local 94 113 144 177 215
Total Peak Buses 231 269 315 367 428
Total Buses Available
(including spares)
295 344 402 468 546
New Services and Infrastructure
Between 2018 and 2041, a number of new transit services will be introduced in the Region
of Waterloo, in addition to new transit infrastructure and transit service changes. As part of
the rapid transit system, the Region’s ION LRT and aBRT system will be introduced, and
eventually phased into a complete LRT system. In addition to increasing service levels on
existing GRT routes, a portion of the new GRT vehicles and service hours added between
2018 and 2041 will be used on new routes. New infrastructure required to support these
routes and service changes has also been identified, in addition to changes to existing
Moving Forward –Transit Strategy Report
3-15
infrastructure. Finally, new GO services and infrastructure, relating to both rail and bus
services, have been identified.
ION Rapid Transit
One of the largest changes to transit in Waterloo Region will be the completion of the ION
rapid transit corridor, connecting Waterloo, Kitchener, and Cambridge. This corridor will start
as ION Stage 1, consisting of a LRT system between Waterloo and Kitchener paired with an
aBRT system between Kitchener and Cambridge. Operations will begin on the ION system
within the planning horizon years of the 2018 TMP, and eventually the aBRT section
between Fairview Park Mall (Kitchener) and Ainslie Street Terminal (Cambridge) will be
upgraded to LRT service as part of ION Stage 2.
GRT iXpress Routes
Between 2018 and 2041, a number of new iXpress routes will be introduced and one
iXpress route will be reassigned. With the introduction of the ION LRT, the 200 iXpress route
will be shortened and re-branded as ION aBRT, running between Fairview Park Mall in
Kitchener and Ainslie Street Terminal in Cambridge. New iXpress routes will then be
introduced progressively to provide high-frequency service to new areas of the Region. In
addition to these new routes, existing iXpress routes such as 201 will be modified to better
connect with the ION LRT, serve new terminals, and avoid service duplication.
GRT Local Routes
Changes to local GRT routes can be broadly grouped in two categories: changes to existing
routes, and new routes introduced to new service areas.
Existing routes will generally be adjusted to form a more grid-like network while increasing
service frequencies, allowing travellers to reach more destinations with one or fewer
transfers while avoiding circuitous routes. Major routes will also be realigned to better
integrate with the ION system, providing travellers with improved transfer opportunities.
Route schedules will be adapted to reduce wait times.
The second set of changes involves introducing new routes to new service areas. This will be
done in response to new developments and passenger demand.
Passenger Facilities
A number of changes are planned for passenger facilities in Kitchener, Cambridge, and
Waterloo, including the development of new stations and the retirement of some existing
facilities. With the changes noted and the addition of two new stations, the Region of
Waterloo’s transportation network should be well equipped to support future GRT and
regional services.
Moving Forward –Transit Strategy Report
3-16
By 2021, routes will be diverted away from using the Charles Terminal in Kitchener as the
major passenger transfer point. Instead, other Downtown ION stations in Kitchener will be
used as the transfer points for passengers. A new Central Station multimodal hub is being
developed at the corner of King and Victoria Streets to replace the Charles Terminal. This
facility will serve as a station for GRT, GO bus, and intercity bus services. In addition, the
Kitchener GO station will be relocated adjacent to the Central Station hub, providing short
and convenient transfers between GO rail, ION LRT, and other bus services.
The removal of the Charles Terminal also has implications on other GRT facilities. Facilities
formerly located at the Charles Terminal, such as driver lunch rooms, washrooms, and other
layover amenities, will have to be added at route-end stations. Confirmed sites for these
facilities include Sunrise Centre, Conestoga Mall ION station, and Fairway ION station. Block
Line ION station, Conestoga College, and Stanley Park Mall are all potential locations for
additional facilities.
Finally, new passenger facilities have been proposed for the University of Waterloo and
Conestoga College. The University of Waterloo Station will be developed into a transit plaza,
featuring a bus-only roadway connecting Phillip Street and Ring Road. It will feature ION LRT
platforms in addition to bus bays for use by GRT, GO Transit, and inter-city vehicles. Shelters
for passengers and real-time GRT departure information will also be provided. A facility at
Conestoga College (which is currently under construction) will provide better connections for
routes terminating there, including two iXpress routes and multiple local routes. A facility in
this part of the Region would also serve any new routes covering southwest Kitchener, an
area that is expected to develop and grow over the coming years.
Other GRT Infrastructure
With the addition of the Northfield garage, (scheduled to be completed in 2021), GRT will be
able to accommodate 500 standard bus equivalents (SBEs) across all of its garages.
However, the 2018 TMP plans for the GRT bus fleet to exceed 540 SBEs by 2041. This will
require the construction of another new transit garage, ideally with a capacity of 250 SBEs
to accommodate larger articulated buses and fleet growth beyond 2041. This garage should
be operational by 2036 – potentially sooner depending on GRT’s need to accommodate
additional articulated buses – in order to ensure fleet growth can proceed as planned.
GO Rail and Bus Service
Changes to GO service and infrastructure between 2018 and 2041 will primarily target the
Kitchener line. Metrolinx plans to increase the service frequency on this line to two trains per
hour (30 minute headways) during peak periods, and eventually provide all-day, two-way
service between Kitchener and Toronto’s Union Station. A new GO station on this line is also
planned for the community of Breslau, which would be located approximately 7 km east of
Moving Forward –Transit Strategy Report
3-17
Kitchener GO and 3 km north of the Region of Waterloo International Airport. Finally, a
portion of the Kitchener line (between Mount Pleasant and Union stations) is set to be
electrified, improving service and reducing the environmental impact of GO train movements
along this corridor.
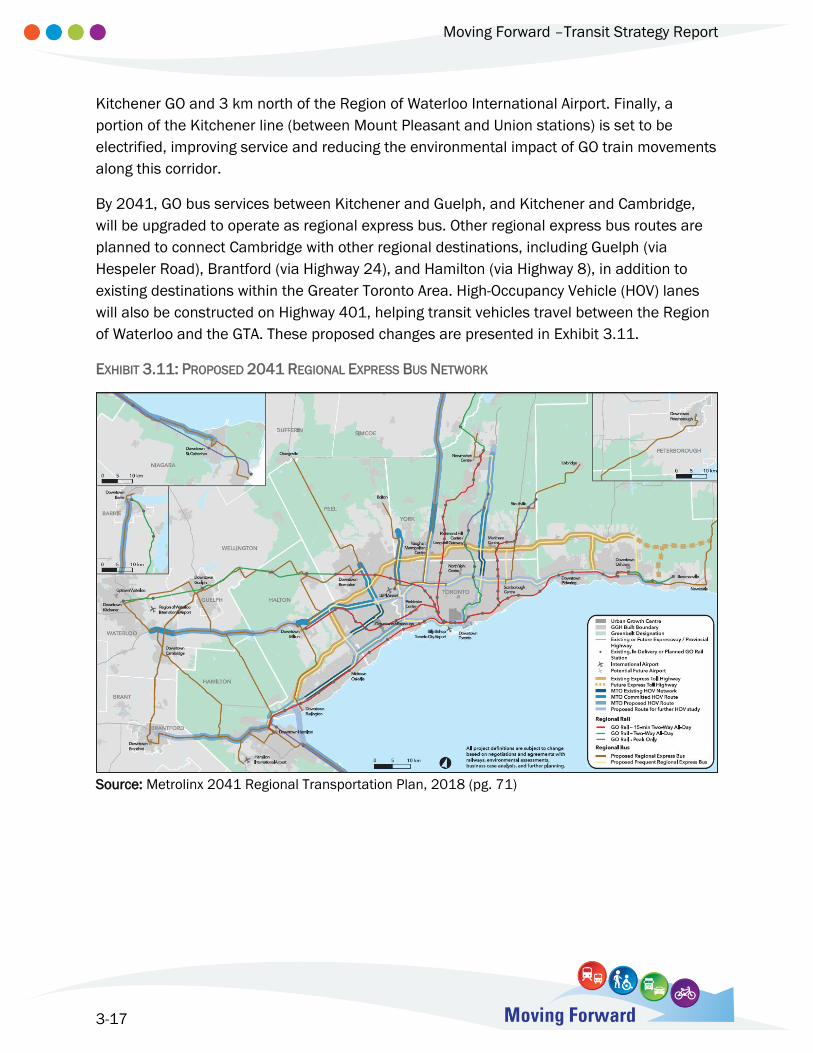
By 2041, GO bus services between Kitchener and Guelph, and Kitchener and Cambridge,
will be upgraded to operate as regional express bus. Other regional express bus routes are
planned to connect Cambridge with other regional destinations, including Guelph (via
Hespeler Road), Brantford (via Highway 24), and Hamilton (via Highway 8), in addition to
existing destinations within the Greater Toronto Area. High-Occupancy Vehicle (HOV) lanes
will also be constructed on Highway 401, helping transit vehicles travel between the Region
of Waterloo and the GTA. These proposed changes are presented in Exhibit 3.11.
EXHIBIT 3.11: PROPOSED 2041 REGIONAL EXPRESS BUS NETWORK
Source: Metrolinx 2041 Regional Transportation Plan, 2018 (pg. 71)
Moving Forward –Transit Strategy Report
3-18
Implementation Phasing
The transit changes and improvements for the Region of Waterloo will be implemented in
three phases over the horizon of the 2018 TMP. Short term changes will be implemented
between 2018 and 2021, medium term changes will be implemented between 2022 and
2031, and long term changes will be implemented between 2032 and 2041:
Short Term (2018–2021): ION rapid transit opens, new iXpress routes are introduced,
iXpress and local GRT routes are realigned to complement ION service, all GRT route
frequencies improve (iXpress now 10 minutes, local now 15-30 minutes), Northfield
transit garage opens.
Medium Term (2022–2031): ION LRT Stage 2 opens, new iXpress routes are
introduced as needed, local GRT route frequencies improve (now 10-20 minutes).
Long Term (2032–2041): New iXpress routes are introduced as needed, all GRT route
frequencies improve (iXpress now 8 minutes, local now 8-12 minutes), additional
transit garage opens.
Short Term (2018–2021)
Transit changes in the short term are primarily guided by the 2017–2021 GRT Business
Plan, which describes the introduction of new routes, changes to existing routes, and capital
expenses (e.g. bus purchases) necessary to support these changes. Additionally, Stage 1 of
the ION rapid transit system will be implemented early within this time frame, providing a
central rapid transit corridor in the Region.
In 2019, Stage 1 of the ION rapid transit system will open, consisting of ION LRT from
Conestoga Mall in Waterloo to Fairview Park Mall in Kitchener. This will complement the
adapted BRT (ION Bus) that currently operates from Fairview Park Mall to Ainslie Street
Terminal in Cambridge. By 2021, the ION Bus will be extended to the South Cambridge
Shopping Centre at Main and Dundas. These service introductions will take place at the
same time as a number of changes to iXpress routes in the Region:
200 iXpress will be replaced with ION LRT and Bus, featuring new vehicles;
201 iXpress will be extended to Conestoga College, replacing Route 116 College
express; and
206 iXpress (Coronation) will be introduced, travelling between Fairview Park Mall and
Southwood Drive (Cambridge) via Ainslie Street Terminal.
Changes to local GRT routes during this time period will mainly involve restructuring and
realigning individual routes, forming a grid network and providing better integration with the
ION rapid transit corridor. Other changes include extending local service to new growth areas
Moving Forward –Transit Strategy Report
3-19
and the Townships, transitioning routes from using the Charles Terminal to other Downtown
Kitchener ION stations, and constructing the Northfield transit garage.
By the end of this term, GRT iXpress and high-frequency local routes will operate on 10- and
15-minute headways during peak periods, respectively, while low-frequency local routes
(regular and community) will operate on 30-minute headways during peak periods. During
these periods, about 60% of the GRT peak bus fleet will operate on high-frequency iXpress
and local routes, while the remaining 40% will operate on low-frequency routes.
Medium Term (2022–2031)
Transit changes in the medium term include improvements to the rapid transit and iXpress
networks in Cambridge and improvements to GO rail service on the Kitchener line. Changes
to ION and iXpress routes in this term include:
ION Bus will be replaced by Stage 2 ION LRT by the end of this term;
ION Bus would then travel between Ainslie Street Terminal and the South Cambridge
Shopping Centre; and
206 iXpress would travel between Ainslie Street Terminal and Southwood Drive.
Other GRT transit changes within this time period include service improvements to high
frequency, local, and community routes. By the end of this term, GRT iXpress and high-
frequency local routes will operate on 10-minute headways during peak periods. Low-
frequency GRT local routes (regular and community) will operate on 20-minute headways
during peak periods. During these periods, about 55% of the GRT peak bus fleet will operate
on high-frequency iXpress and local routes, while the remaining 45% will operate on low-
frequency routes.
In the medium term, GO rail upgrades will be made along the Kitchener line, including the
construction of a new station at Breslau, between the existing Kitchener and Guelph
stations. Service levels will be increased to every 30 minutes during peak times, and all-day,
two-way service will be added between Kitchener and Union stations. Further, a portion of
the GO Kitchener corridor between Mount Pleasant and Union stations will be electrified
during this time frame.
Long Term (2032–2041)
Long-term changes to transit in the Region of Waterloo include and complement
improvements originally proposed in the 2010 RTMP, the 2018 Metrolinx RTP, and other
planning documents. It will be important to begin planning for Stage 3 of ION rapid transit, to
be implemented beyond 2041. ION Stage 3 will complement the ION LRT by providing east-
west rapid transit corridors in the Region.
Moving Forward –Transit Strategy Report
3-20
GRT changes to be implemented between 2032 and 2041 again include service
improvements to high frequency, local, and community routes, as well as the construction of
a new transit garage to accommodate the growing bus fleet. By the end of this term, GRT
iXpress and high-frequency local routes will operate on 8-minute headways during peak
periods, while low-frequency local routes (regular and community) will operate on 12-minute
headways during peak periods. During these periods, about 50% of the GRT peak bus fleet
will operate on high-frequency iXpress and local routes and 50% will operate on low-
frequency routes.
Changes to inter-regional service in this time period primarily consist of new regional express
GO bus routes connecting Kitchener and Cambridge with Brantford, Hamilton, and Guelph.
Network Performance
To identify Region-wide benefits of implementing the recommended scenario for the 2018
TMP, the Region’s travel forecasting model was used to estimate trips in the 2041 weekday
p.m. peak period. This model uses population and employment forecasts (based on the
Region’s moderate growth forecast) as input, simulating trips in the Region over the three-
hour peak period on a variety of modes. Based on the results from the travel forecasting
model, the following five impacts and performance statements related to the recommended
transit network were identified.
The 2018 TMP transit strategy has been developed to provide enough service to meet the
2041 14.8% transit mode share targets for all Regional trips made in the p.m. peak period.
This includes trips to and from work and school, as well as discretionary trips for shopping,
appointments, and more that use ION rapid transit, GRT iXpress, and GRT local services.
This transit strategy also provides enough service to meet the interim 2031 transit mode
share target of 9.7%.
Most of the growth in transit trips between 2016 and 2041 is forecast to come from the
introduction of ION LRT. Approximately 5.2% of all p.m. peak period travel in the Region is
expected to use ION by 2041, representing nearly 24,000 trips using the LRT. In
comparison, the share of trips using local and iXpress GRT buses is expected to increase
from 4.9% in 2016 to 9.6% in 2041.
Transit trip growth is expected to greatly outpace auto trip growth between 2031 and 2041,
primarily due to the large increase in transit service levels across the Region. Auto p.m. peak
period trips are forecast to grow by 11,800 within the period between 2031 and 2041. In
comparison, p.m. peak period transit trips are forecast to grow by 27,500 between 2031
and 2041, signifying an important shift towards transit use.
Moving Forward –Transit Strategy Report
3-21
Meeting service hour targets will require increasing transit service hours and transit vehicle-
kilometres of travel (VKT). Most transit VKT growth will occur in the p.m. peak period due to
new and higher-frequency service on the local GRT network. This change is expected to grow
VKT by 2.4 times from 11,500 km (in 2016) to 31,500 km (in 2041) in the three-hour p.m.
peak period. Similarly, VKT on the iXpress network is expected to triple over the same time
period, growing from 1,800 km to 5,400 km in the three-hour p.m. peak period.
New and improved transit service reduces the number of new auto-based trips. If the
Region’s transit mode share were to remain unchanged between 2016 and 2041, there
would be an additional 54,550 auto driving trips made in single occupant vehicles in the
p.m. peak period by the year 2041. Introducing ION rapid transit, increasing service on the
iXpress and local bus networks, improving transit coverage, and adding active transportation
facilities throughout the Region of Waterloo will all contribute to shifting these auto trips to
more sustainable modes (i.e. transit, walking, and/or cycling).
4-1
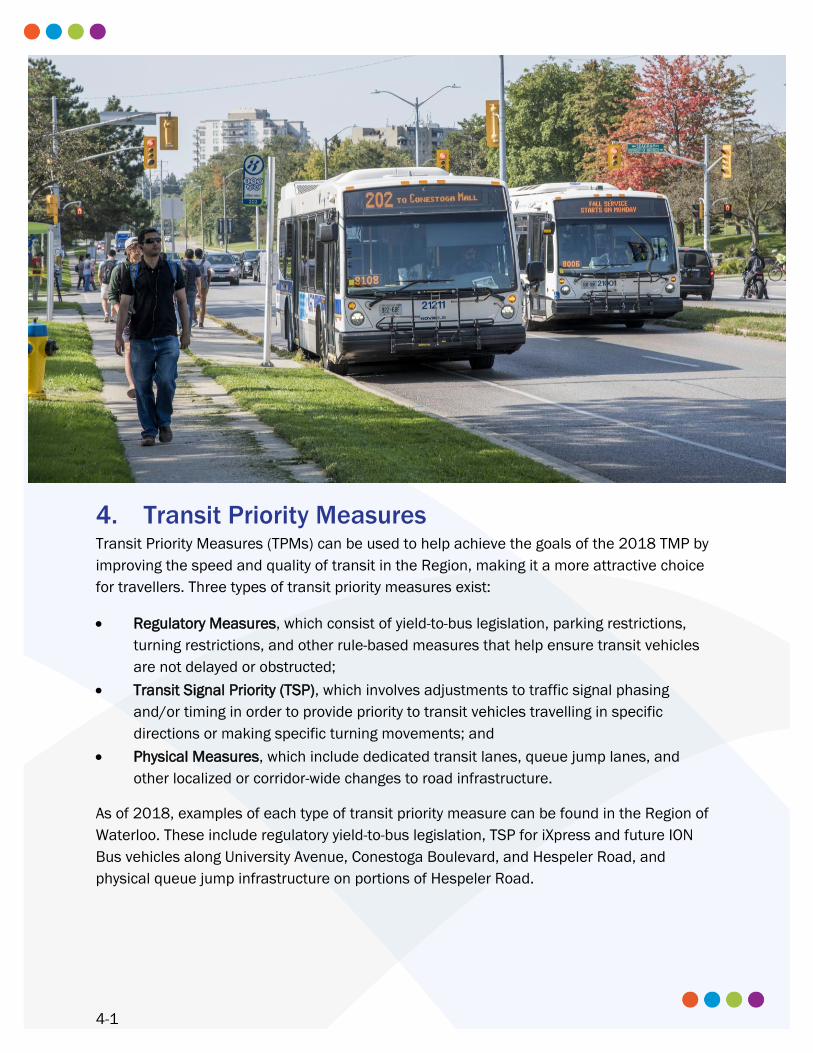
4. Transit Priority Measures Transit Priority Measures (TPMs) can be used to help achieve the goals of the 2018 TMP by
improving the speed and quality of transit in the Region, making it a more attractive choice
for travellers. Three types of transit priority measures exist:
Regulatory Measures, which consist of yield-to-bus legislation, parking restrictions,
turning restrictions, and other rule-based measures that help ensure transit vehicles
are not delayed or obstructed;
Transit Signal Priority (TSP), which involves adjustments to traffic signal phasing
and/or timing in order to provide priority to transit vehicles travelling in specific
directions or making specific turning movements; and
Physical Measures, which include dedicated transit lanes, queue jump lanes, and
other localized or corridor-wide changes to road infrastructure.
As of 2018, examples of each type of transit priority measure can be found in the Region of
Waterloo. These include regulatory yield-to-bus legislation, TSP for iXpress and future ION
Bus vehicles along University Avenue, Conestoga Boulevard, and Hespeler Road, and
physical queue jump infrastructure on portions of Hespeler Road.
Moving Forward –Transit Strategy Report
4-2
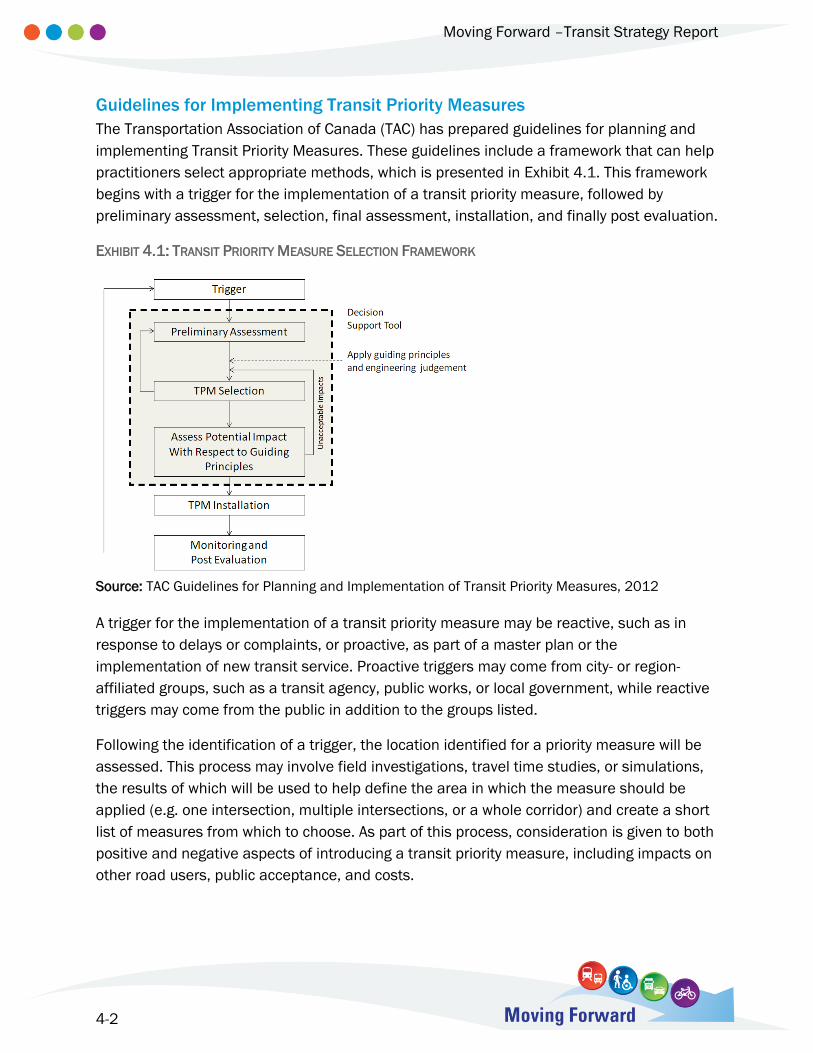
Guidelines for Implementing Transit Priority Measures
The Transportation Association of Canada (TAC) has prepared guidelines for planning and
implementing Transit Priority Measures. These guidelines include a framework that can help
practitioners select appropriate methods, which is presented in Exhibit 4.1. This framework
begins with a trigger for the implementation of a transit priority measure, followed by
preliminary assessment, selection, final assessment, installation, and finally post evaluation.
EXHIBIT 4.1: TRANSIT PRIORITY MEASURE SELECTION FRAMEWORK
Source: TAC Guidelines for Planning and Implementation of Transit Priority Measures, 2012
A trigger for the implementation of a transit priority measure may be reactive, such as in
response to delays or complaints, or proactive, as part of a master plan or the
implementation of new transit service. Proactive triggers may come from city- or region-
affiliated groups, such as a transit agency, public works, or local government, while reactive
triggers may come from the public in addition to the groups listed.
Following the identification of a trigger, the location identified for a priority measure will be
assessed. This process may involve field investigations, travel time studies, or simulations,
the results of which will be used to help define the area in which the measure should be
applied (e.g. one intersection, multiple intersections, or a whole corridor) and create a short
list of measures from which to choose. As part of this process, consideration is given to both
positive and negative aspects of introducing a transit priority measure, including impacts on
other road users, public acceptance, and costs.
Moving Forward –Transit Strategy Report
4-3
Based on the scale of the problem, as well as the costs and benefits associated with each
shortlisted transit priority measure, a TPM is chosen to address the trigger. The selected
measure is then subjected to a more detailed analysis – if any serious negative impacts are
discovered, a different measure is selected. Once the measure is approved, it is
implemented, which may involve something as minor as implementing signal priority, or as
major as constructing a new transit lane. Regardless of the scale of the measure, it will be
monitored to ensure that the desired improvements are taking place.
In the Region of Waterloo, it is recommended that the implementation of transit priority
measures be proactively examined for corridors with high-frequency service. This includes
local high-frequency routes, but specific attention should be given to iXpress and ION bus
routes, as well as transit corridors that lead to or from transit facilities. Other intersections or
corridors that lead to reduce route performance due to congestion should be considered for
transit priority measures on a reactive basis.
Ongoing and Future Transit Priority Projects
Over the short- and medium-terms, a number of transit priority projects have been
proactively planned within the Region of Waterloo. Some of the projects that will be
completed during this time frame include:
Constructing queue jumps near Preston along Shantz Hill Road, Fountain Street South,
and King Street;
Constructing queue jumps along Victoria Street (eastbound at Lawrence Avenue) and
Hespeler Road (southbound at the Delta Bridge); and
Constructing bus bypass lanes along the shoulders of Highway 401 (MTO project).
As noted, future proactive transit priority projects should focus on corridors used by ION Bus,
iXpress, and high-frequency local transit routes. Recommended projects include the
construction of bus lanes and the implementation of TSP along Fischer-Hallman Road
(between Columbia Street West and Highway 7/8) and the development of one or more
major east-west routes into transit corridors using TSP and other measures as part of ION
Stage 3 rapid transit corridor (described in Section 7).
Funding for transit priority, including both reactive and proactive projects, should be
provided as a fixed, recurring annual amount. Given that some measures, such as
implementing transit signal priority, are relatively inexpensive ($5,000+ per signal), while
measures involving construction such as queue jumps, bus lanes, or road widening can cost
far more, it is recommended that $500,000 per year be allocated to transit priority. This
way, funding will be available for larger projects as needed, and multiple small projects may
be completed each year.
5-1
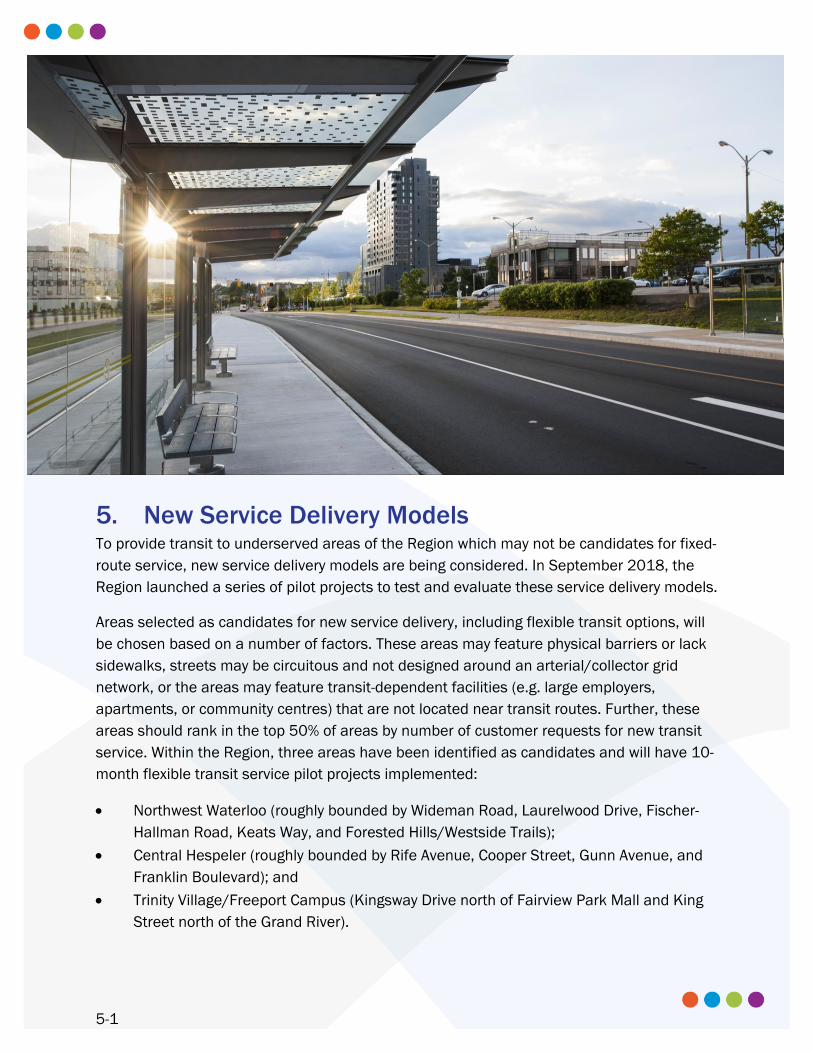
5. New Service Delivery Models To provide transit to underserved areas of the Region which may not be candidates for fixed-
route service, new service delivery models are being considered. In September 2018, the
Region launched a series of pilot projects to test and evaluate these service delivery models.
Areas selected as candidates for new service delivery, including flexible transit options, will
be chosen based on a number of factors. These areas may feature physical barriers or lack
sidewalks, streets may be circuitous and not designed around an arterial/collector grid
network, or the areas may feature transit-dependent facilities (e.g. large employers,
apartments, or community centres) that are not located near transit routes. Further, these
areas should rank in the top 50% of areas by number of customer requests for new transit
service. Within the Region, three areas have been identified as candidates and will have 10-
month flexible transit service pilot projects implemented:
Northwest Waterloo (roughly bounded by Wideman Road, Laurelwood Drive, Fischer-
Hallman Road, Keats Way, and Forested Hills/Westside Trails);
Central Hespeler (roughly bounded by Rife Avenue, Cooper Street, Gunn Avenue, and
Franklin Boulevard); and
Trinity Village/Freeport Campus (Kingsway Drive north of Fairview Park Mall and King
Street north of the Grand River).
Moving Forward –Transit Strategy Report
5-2
The GRT Business Plan highlights three options for providing service to these areas, which
are described in the following sections. Additionally, flexible transit services provided in
other GTHA municipalities are described, and future options for alternative transit services
are explored.
Dynamic and Flexible Transit Options for Grand River Transit
Ridesharing
In the Region of Waterloo, a ridesharing pilot project is planned for Northwest Waterloo and
would be operated by RideCo. This service provider previously operated a ridesharing pilot in
the Town of Milton, allowed travellers to book, pay for, and track their rides using software
applications accessible through smartphones, personal computers, or kiosks. In Milton, five-
seat passenger vans were used as ridesharing vehicles, which picked up passengers at
communal stops and brought them to the GO station for a flat fare. For a slightly higher fare,
riders could choose to be picked up at any location within the service area. The results of
this pilot are described later in this section.
The ridesharing pilot operated by RideCo is expected to work similarly in Northwest Waterloo
– passengers would request and pay for rides using software applications, and the service
would employ shared-ride sedans and passenger vans. The main differences are that users
of the service would only be picked up at communal stops, they would be charged a
standard GRT fare, and they would be brought to pre-selected GRT transfer points to
continue their trips on conventional transit.
Subsidized Taxi Service
A subsidized taxi service pilot is planned for Central Hespeler in Cambridge, and would be
operated by Golden Triangle Taxi. Users of this taxi service would book their outbound and
return trips in advance by calling GRT customer service, where they would select from a set
of pre-scheduled pickup times. Taxis would then provide door-to-door trips, taking
passengers from their home or other origin to a chosen destination, including GRT transfer
points. Based on the passenger’s route and time, they may share their trip with others
travelling between nearby origins or destinations. A standard GRT fare would apply for the
use of this service.
Community Buses
The third new service delivery pilot in the Region is planned for Trinity Village/Freeport
Campus, using community buses operated by Voyageur Transportation. Community bus
service in the Region would be booked using the same method as subsidized taxi service –
passengers would call GRT customer service in advance to book their trips – however,
Moving Forward –Transit Strategy Report
5-3
passengers would be required to get themselves to a nearby communal stop. At scheduled
times, vehicles would pick up passengers at each stop and bring them to a GRT transfer
point, or vice-versa. The routes taken by these vehicles would be dynamic and determined
by when and where riders in the area requested to be picked up or dropped off. Again, a
standard GRT fare would apply for the use of this service.
Dynamic and Flexible Transit in Other Municipalities
The economics of providing flexible transit are changing, and with near real-time ride hailing
and dispatching, ridesharing services are becoming a more feasible option for connecting
transportation supply and demand. In the municipalities of Milton and Innisfil, on-demand
transit options have been tested with promising results.
In Milton, Metrolinx and Milton Transit partnered with RideCo to pilot a flexible transit
service, providing first-and-last mile access to the GO station and local transit routes for one
year. Riders were able to book rides using a software application accessible through their
smartphones or computers, choosing from a variety of ride times and two types of service;
communal or doorstep. With communal service, riders were picked up or dropped off at one
of 240 stop locations in the city for a flat fare, while doorstep service charged a slightly
higher fare to pick up or drop off passengers at their home. After six months of operation,
RideCo was serving over 80 passengers per day. Metrolinx also noted that 45% of GO rail
riders switched from driving to using RideCo to access the Milton GO station. While RideCo’s
pilot ended in 2016, Metrolinx is moving forward with additional, similar pilot projects to
leverage and further test this evolving technology.
More recently, the Town of Innisfil partnered with Uber to provide transit service to its
residents, who were otherwise reliant on private automobiles and regional GO services.
Much like RideCo’s service in Milton, residents can request trips through smartphones or
computers, and trips to or from specific destinations are provided at flat fares between $3
and $5. These destinations include Innisfil Recreational Complex/Town Hall, Innisfil Heights
Employment Area, and local GO bus and train stops and stations. The main differences with
Uber’s service are that transit users can request rides on-demand, 24 hours a day, and
door-to-door service is provided for all trips (trips to destinations without a flat fare are
discounted by $5 from standard Uber rates). This partnership has saved Innisfil the costs of
purchasing, operating, and maintaining a traditional bus fleet while providing customized
service for the Town’s residents.
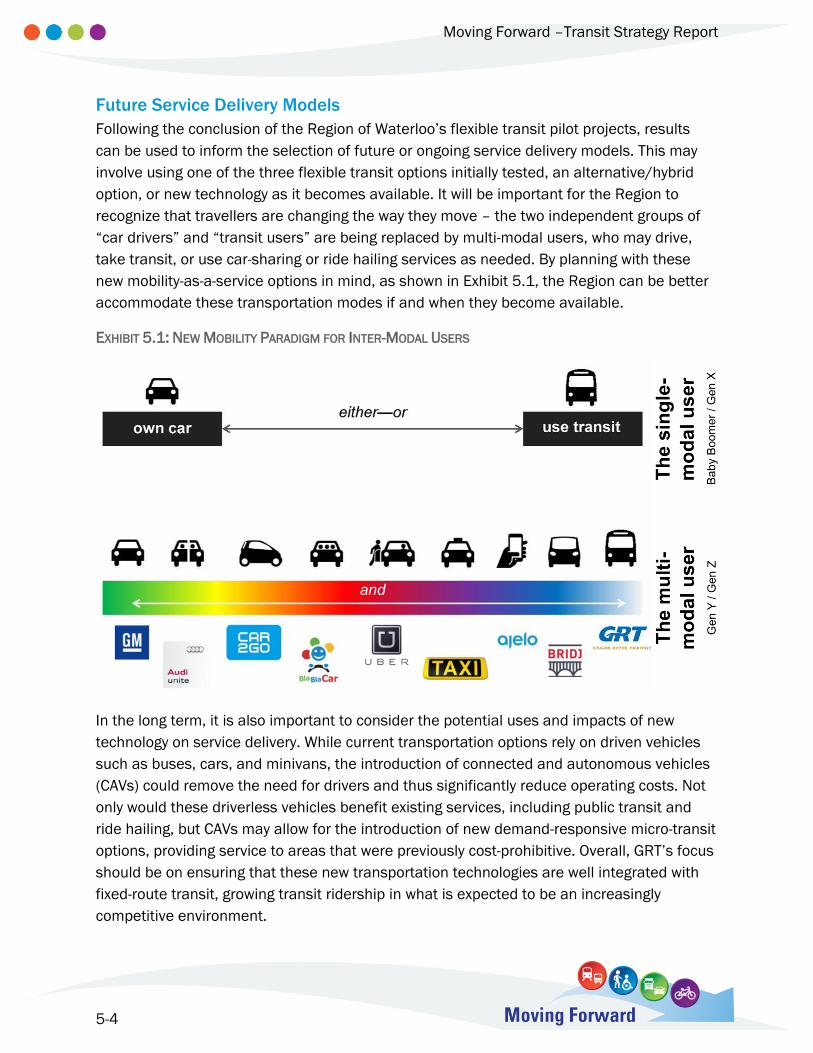
Moving Forward –Transit Strategy Report
5-4
Future Service Delivery Models
Following the conclusion of the Region of Waterloo’s flexible transit pilot projects, results
can be used to inform the selection of future or ongoing service delivery models. This may
involve using one of the three flexible transit options initially tested, an alternative/hybrid
option, or new technology as it becomes available. It will be important for the Region to
recognize that travellers are changing the way they move – the two independent groups of
“car drivers” and “transit users” are being replaced by multi-modal users, who may drive,
take transit, or use car-sharing or ride hailing services as needed. By planning with these
new mobility-as-a-service options in mind, as shown in Exhibit 5.1, the Region can be better
accommodate these transportation modes if and when they become available.
EXHIBIT 5.1: NEW MOBILITY PARADIGM FOR INTER-MODAL USERS
In the long term, it is also important to consider the potential uses and impacts of new
technology on service delivery. While current transportation options rely on driven vehicles
such as buses, cars, and minivans, the introduction of connected and autonomous vehicles
(CAVs) could remove the need for drivers and thus significantly reduce operating costs. Not
only would these driverless vehicles benefit existing services, including public transit and
ride hailing, but CAVs may allow for the introduction of new demand-responsive micro-transit
options, providing service to areas that were previously cost-prohibitive. Overall, GRT’s focus
should be on ensuring that these new transportation technologies are well integrated with
fixed-route transit, growing transit ridership in what is expected to be an increasingly
competitive environment.
6-1
6. Costs Capital and operating costs, as well as new fare revenues, have been estimated for the
implementation of the required transit network changes and improvements. These costs are
detailed for the three terms (short, medium, and long) of the 2018 TMP. All costs in this
section are expressed in 2018 dollars.
Capital Costs
Capital costs were calculated for the proposed transit network in the 2018 TMP based on
four main expenses: new vehicles (buses), new transit garages, transit priority measures,
and ancillary costs. It is important to note that these expenses only relate to system growth
– that is, costs associated with providing and maintaining new or improved services, as
opposed to costs associated with maintaining current service.
Between 2018 and 2041, 352 buses would need to be purchased to deliver necessary
service levels on GRT’s iXpress and local routes. It is assumed that each vehicle would cost
$628,500, leading to a total growth cost of $220 million divided between the three terms of
this plan as shown in Exhibit 6.1. More than half of these bus purchases would take place in
the last 10 years of this plan, as this term includes the replacement of retiring growth
vehicles purchased earlier in this plan.
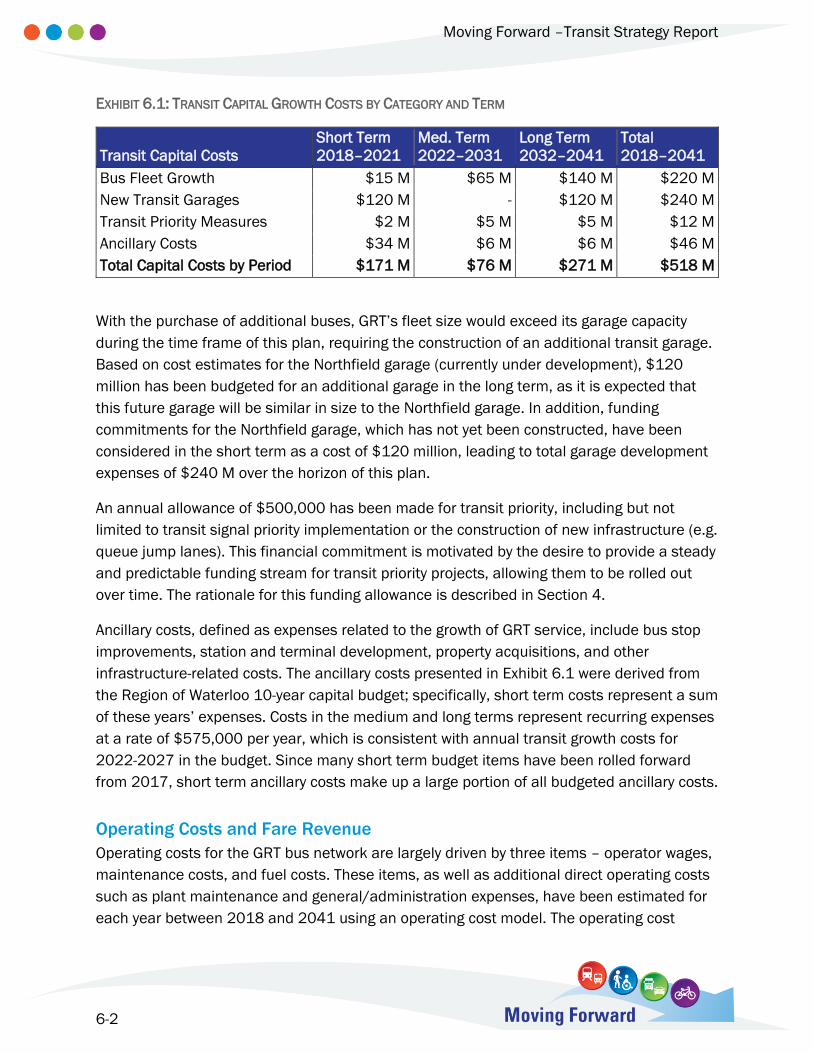
Moving Forward –Transit Strategy Report
6-2
EXHIBIT 6.1: TRANSIT CAPITAL GROWTH COSTS BY CATEGORY AND TERM
Transit Capital Costs
Short Term
2018–2021
Med. Term
2022–2031
Long Term
2032–2041
Total
2018–2041
Bus Fleet Growth $15 M $65 M $140 M $220 M
New Transit Garages $120 M - $120 M $240 M
Transit Priority Measures $2 M $5 M $5 M $12 M
Ancillary Costs $34 M $6 M $6 M $46 M
Total Capital Costs by Period $171 M $76 M $271 M $518 M
With the purchase of additional buses, GRT’s fleet size would exceed its garage capacity
during the time frame of this plan, requiring the construction of an additional transit garage.
Based on cost estimates for the Northfield garage (currently under development), $120
million has been budgeted for an additional garage in the long term, as it is expected that
this future garage will be similar in size to the Northfield garage. In addition, funding
commitments for the Northfield garage, which has not yet been constructed, have been
considered in the short term as a cost of $120 million, leading to total garage development
expenses of $240 M over the horizon of this plan.
An annual allowance of $500,000 has been made for transit priority, including but not
limited to transit signal priority implementation or the construction of new infrastructure (e.g.
queue jump lanes). This financial commitment is motivated by the desire to provide a steady
and predictable funding stream for transit priority projects, allowing them to be rolled out
over time. The rationale for this funding allowance is described in Section 4.
Ancillary costs, defined as expenses related to the growth of GRT service, include bus stop
improvements, station and terminal development, property acquisitions, and other
infrastructure-related costs. The ancillary costs presented in Exhibit 6.1 were derived from
the Region of Waterloo 10-year capital budget; specifically, short term costs represent a sum
of these years’ expenses. Costs in the medium and long terms represent recurring expenses
at a rate of $575,000 per year, which is consistent with annual transit growth costs for
2022-2027 in the budget. Since many short term budget items have been rolled forward
from 2017, short term ancillary costs make up a large portion of all budgeted ancillary costs.
Operating Costs and Fare Revenue
Operating costs for the GRT bus network are largely driven by three items – operator wages,
maintenance costs, and fuel costs. These items, as well as additional direct operating costs
such as plant maintenance and general/administration expenses, have been estimated for
each year between 2018 and 2041 using an operating cost model. The operating cost
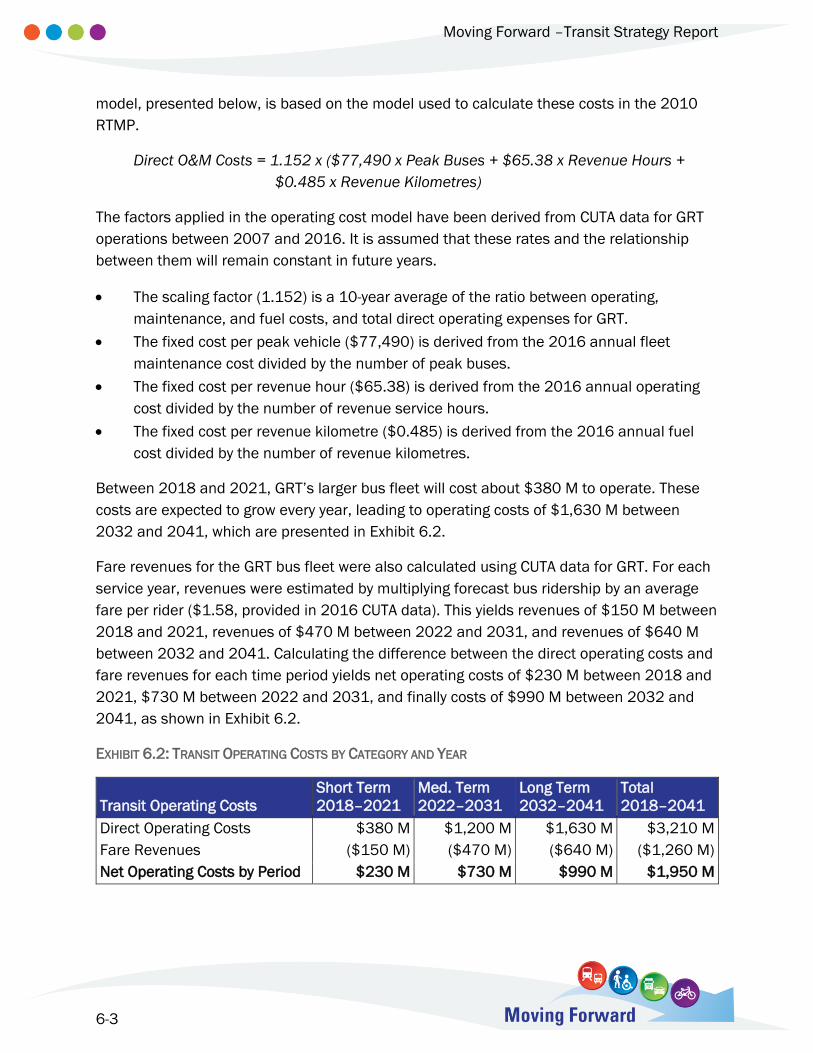
Moving Forward –Transit Strategy Report
6-3
model, presented below, is based on the model used to calculate these costs in the 2010
RTMP.
Direct O&M Costs = 1.152 x ($77,490 x Peak Buses + $65.38 x Revenue Hours +
$0.485 x Revenue Kilometres)
The factors applied in the operating cost model have been derived from CUTA data for GRT
operations between 2007 and 2016. It is assumed that these rates and the relationship
between them will remain constant in future years.
The scaling factor (1.152) is a 10-year average of the ratio between operating,
maintenance, and fuel costs, and total direct operating expenses for GRT.
The fixed cost per peak vehicle ($77,490) is derived from the 2016 annual fleet
maintenance cost divided by the number of peak buses.
The fixed cost per revenue hour ($65.38) is derived from the 2016 annual operating
cost divided by the number of revenue service hours.
The fixed cost per revenue kilometre ($0.485) is derived from the 2016 annual fuel
cost divided by the number of revenue kilometres.
Between 2018 and 2021, GRT’s larger bus fleet will cost about $380 M to operate. These
costs are expected to grow every year, leading to operating costs of $1,630 M between
2032 and 2041, which are presented in Exhibit 6.2.
Fare revenues for the GRT bus fleet were also calculated using CUTA data for GRT. For each
service year, revenues were estimated by multiplying forecast bus ridership by an average
fare per rider ($1.58, provided in 2016 CUTA data). This yields revenues of $150 M between
2018 and 2021, revenues of $470 M between 2022 and 2031, and revenues of $640 M
between 2032 and 2041. Calculating the difference between the direct operating costs and
fare revenues for each time period yields net operating costs of $230 M between 2018 and
2021, $730 M between 2022 and 2031, and finally costs of $990 M between 2032 and
2041, as shown in Exhibit 6.2.
EXHIBIT 6.2: TRANSIT OPERATING COSTS BY CATEGORY AND YEAR
Transit Operating Costs
Short Term
2018–2021
Med. Term
2022–2031
Long Term
2032–2041
Total
2018–2041
Direct Operating Costs $380 M $1,200 M $1,630 M $3,210 M
Fare Revenues ($150 M) ($470 M) ($640 M) ($1,260 M)
Net Operating Costs by Period $230 M $730 M $990 M $1,950 M
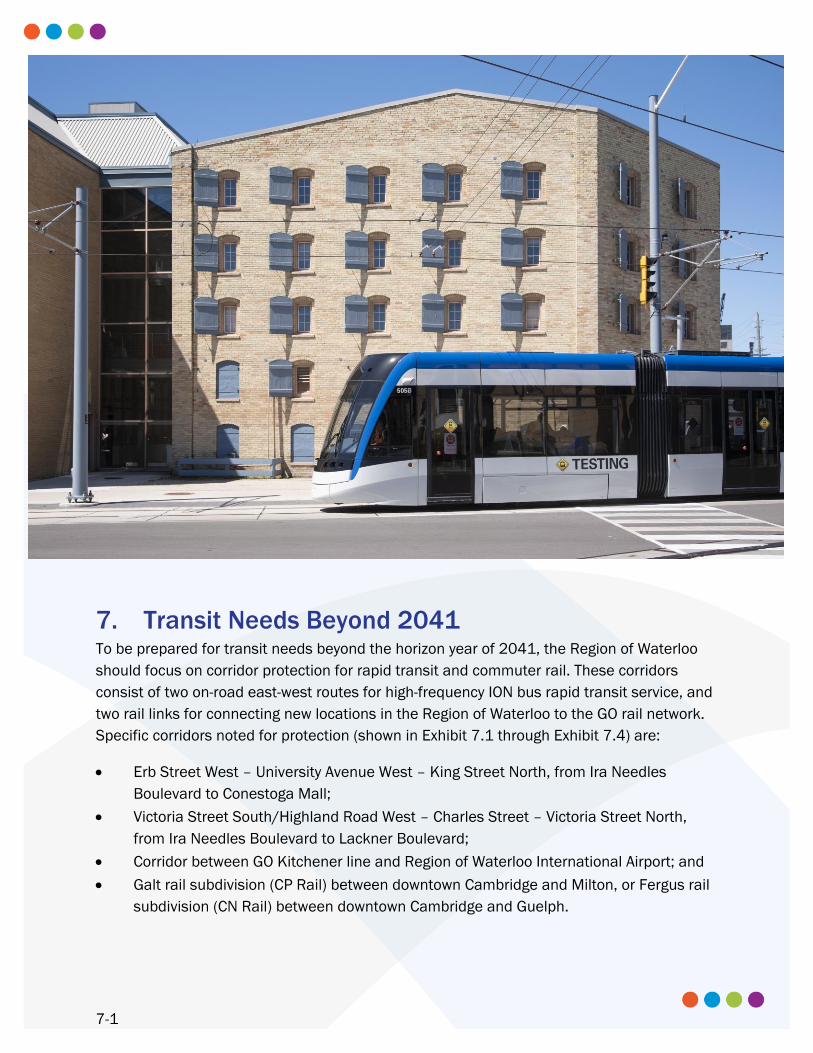
7-1
7. Transit Needs Beyond 2041 To be prepared for transit needs beyond the horizon year of 2041, the Region of Waterloo
should focus on corridor protection for rapid transit and commuter rail. These corridors
consist of two on-road east-west routes for high-frequency ION bus rapid transit service, and
two rail links for connecting new locations in the Region of Waterloo to the GO rail network.
Specific corridors noted for protection (shown in Exhibit 7.1 through Exhibit 7.4) are:
Erb Street West – University Avenue West – King Street North, from Ira Needles
Boulevard to Conestoga Mall;
Victoria Street South/Highland Road West – Charles Street – Victoria Street North,
from Ira Needles Boulevard to Lackner Boulevard;
Corridor between GO Kitchener line and Region of Waterloo International Airport; and
Galt rail subdivision (CP Rail) between downtown Cambridge and Milton, or Fergus rail
subdivision (CN Rail) between downtown Cambridge and Guelph.
Moving Forward –Transit Strategy Report
7-2
The Erb-University-King corridor could accommodate ION Stage 3 service in the form of bus
rapid transit. This corridor extends west and northeast from the University of Waterloo ION
LRT station, providing a high-frequency east-west rapid transit service through Waterloo.
Similarly, the Victoria/Highland-Charles-Victoria corridor could also accommodate ION Stage
3 rapid transit service. This corridor extends west and east from the forthcoming Central
Station multimodal hub, providing a high-frequency east-west rapid transit service through
Kitchener.
A corridor between the GO Kitchener rail line and Region of Waterloo International Airport
(YKF) could be protected for the development of a new rail spur, branching off from the
Kitchener GO line near the forthcoming Breslau station. This spur would serve a number of
purposes; locally, it would provide better access between downtown Kitchener and the
airport, and regionally it could support the integration of the Waterloo Airport with Toronto
Pearson International Airport. This corridor could also integrate the Waterloo Airport with
future high-speed rail service along the Toronto-London corridor. Exhibit 7.1 shows a
conceptual alignment in Waterloo Region, but further study is needed to establish the
benefits, challenges, and specific alignment of this rail spur. Exhibit 7.2, Exhibit 7.3, and
Exhibit 7.4 show the alignment and other potential corridors in Cambridge, Kitchener, and
Waterloo, respectively.
Two rail corridors leading to downtown Cambridge are also recommended to be protected
for future service. These are the Fergus subdivision, running between the Kitchener GO line
west of Guelph and downtown Cambridge, and the Galt subdivision, running between the
Milton GO line west of Milton and downtown Cambridge. Both corridors have previously been
studied for GO service, and as such both should be protected. Along these two corridors,
there are a number of potential station sites that should also be protected for potential
future development. These include two locations along the Galt subdivision (both in south
Cambridge/Galt) and three locations along the Fergus subdivision (one each in Galt,
Preston, and Hespeler).
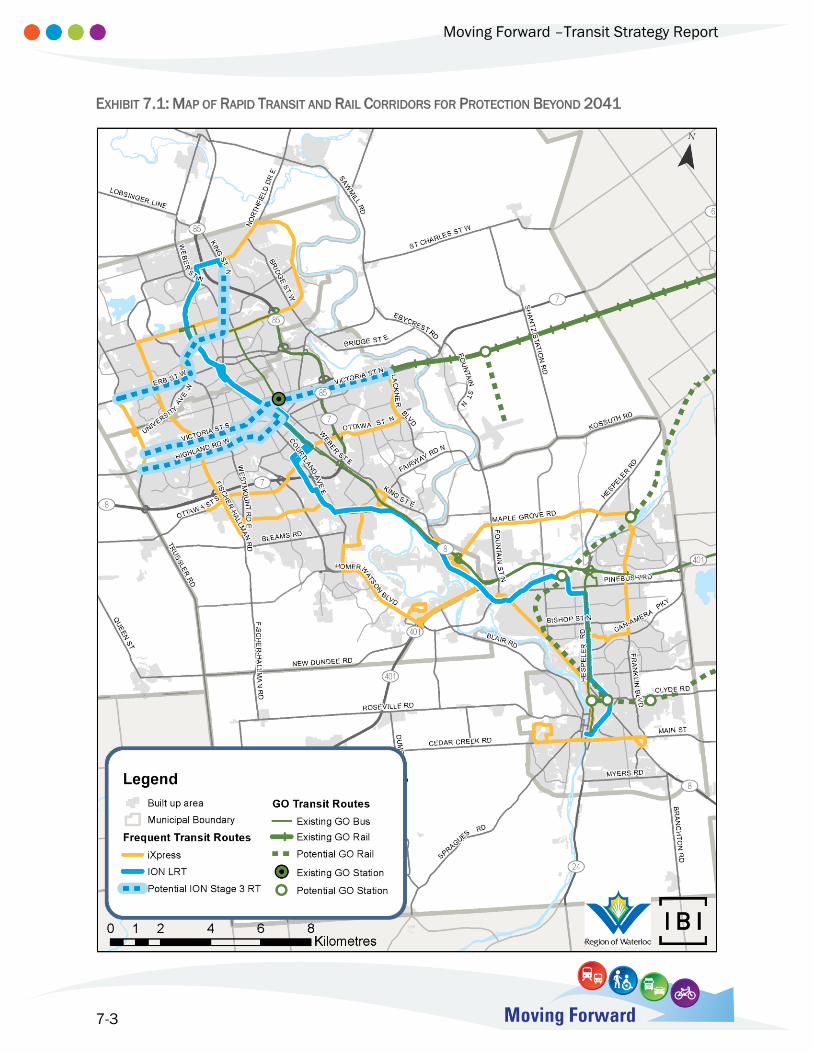
Moving Forward –Transit Strategy Report
7-3
EXHIBIT 7.1: MAP OF RAPID TRANSIT AND RAIL CORRIDORS FOR PROTECTION BEYOND 2041
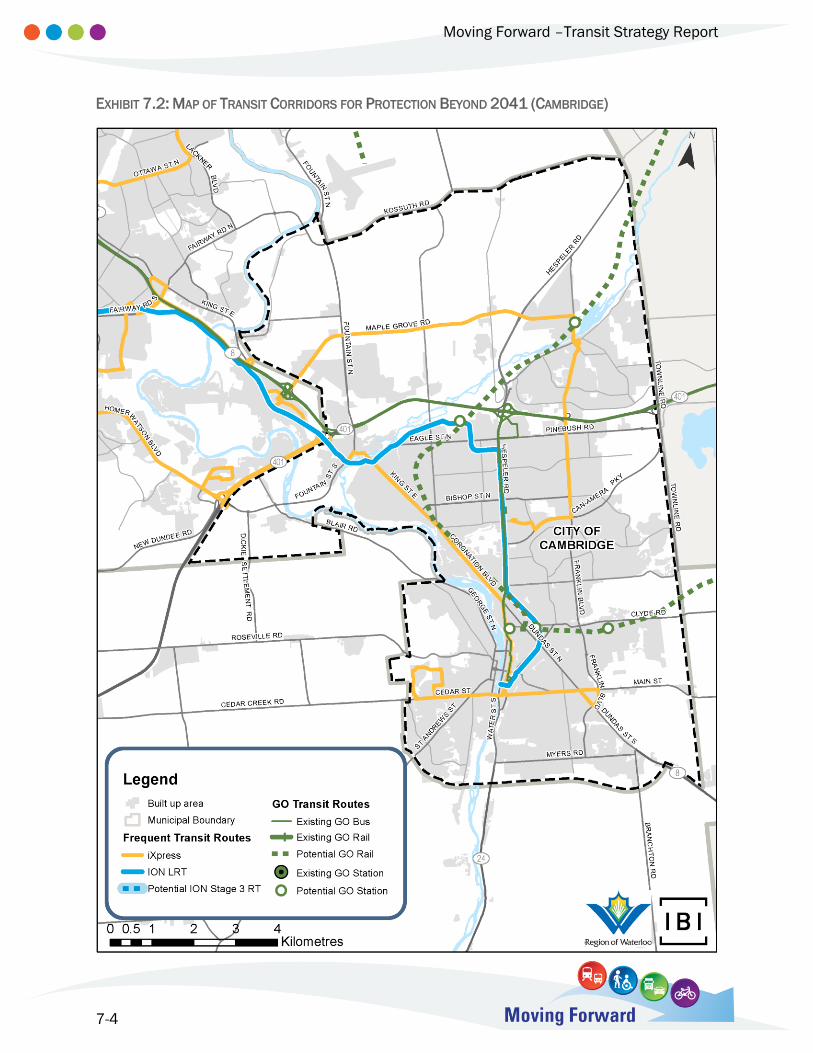
Moving Forward –Transit Strategy Report
7-4
EXHIBIT 7.2: MAP OF TRANSIT CORRIDORS FOR PROTECTION BEYOND 2041 (CAMBRIDGE)
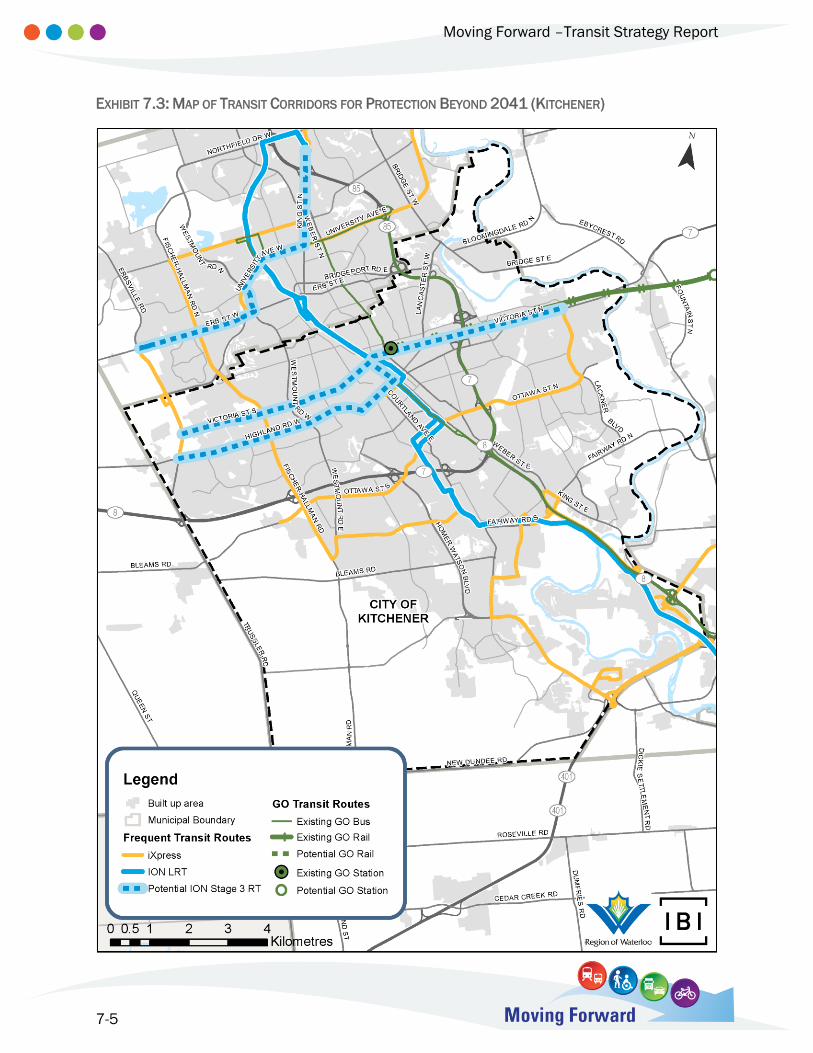
Moving Forward –Transit Strategy Report
7-5
EXHIBIT 7.3: MAP OF TRANSIT CORRIDORS FOR PROTECTION BEYOND 2041 (KITCHENER)
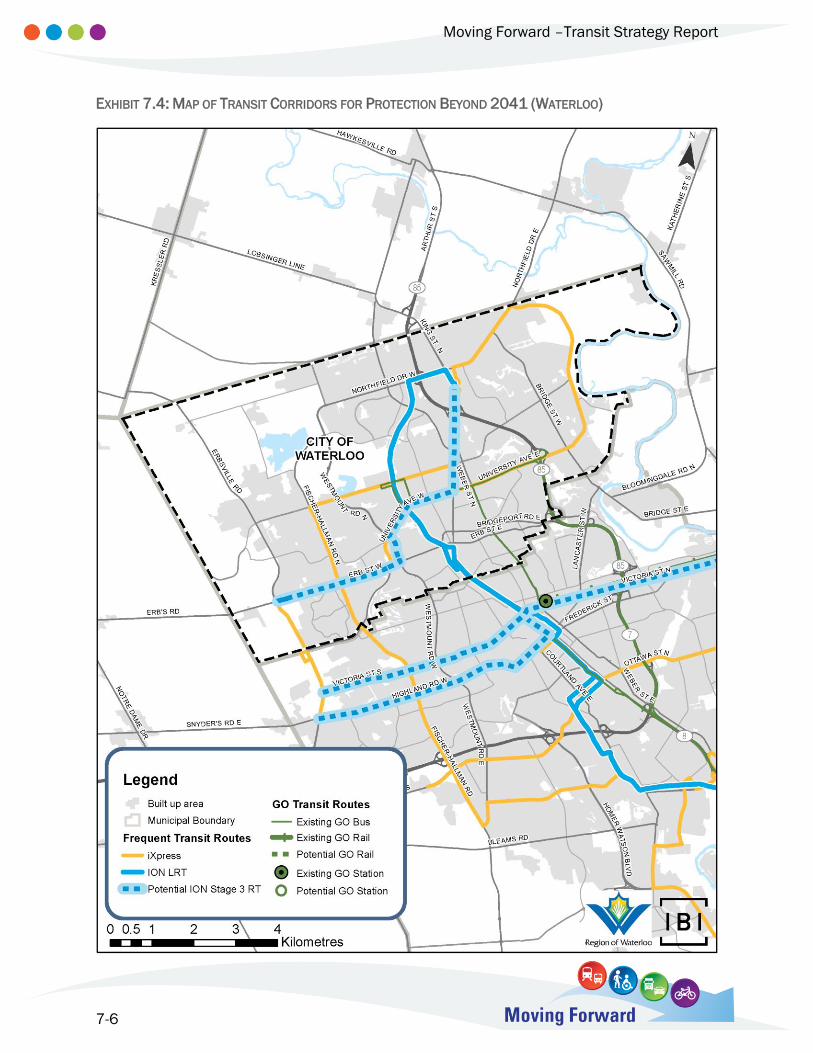
Moving Forward –Transit Strategy Report
7-6
EXHIBIT 7.4: MAP OF TRANSIT CORRIDORS FOR PROTECTION BEYOND 2041 (WATERLOO)