transient pulses of primary production generated by undulatory processes in the western sector of...
TRANSCRIPT
Journal of Marine Systems 87 (2011) 25–36
Contents lists available at ScienceDirect
Journal of Marine Systems
j ourna l homepage: www.e lsev ie r.com/ locate / jmarsys
Transient pulses of primary production generated by undulatory processes in thewestern sector of the Strait of Gibraltar
A. Bartual a,b,⁎, D. Macías c,e, A. Gutierrez-Rodriguez d, C.M. García b,e, F. Echevarría b,e
a Centro Andaluz de Ciencia y Tecnología Marinas (CACYTMAR), 11510, Puerto Real, Cádiz, Spainb Departamento de Biología, Universidad de Cádiz, 11510, Puerto Real, Cádiz, Spainc Departamento de Ecología y Gestión Costera, Instituto de Ciencias Marinas de Andalucía, CSIC, 11510, Puerto Real, Cádiz, Spaind Integrative Oceanography Division, Institution of Oceanography, La Jolla, CA, USAe Unidad Asociada de Oceanografía Interdisciplinar, UCA-CSIC, Cádiz, Spain
⁎ Corresponding author. Tel.: +34 956016753.E-mail address: [email protected] (A. Bartual).
0924-7963/$ – see front matter © 2011 Elsevier B.V. Aldoi:10.1016/j.jmarsys.2011.02.021
a b s t r a c t
a r t i c l e i n f oArticle history:Received 22 October 2010Received in revised form 14 February 2011Accepted 25 February 2011Available online 7 March 2011
Keywords:Fast repetition fluorometryInternal boresSpainStrait of GibraltarTidal effectsPrimary production
Physical processes forced by tidal dynamics, such as bores and internal waves, have a high influence onbiological patterns in the main channel of the Strait of Gibraltar. To analyse this connection in the case ofphotosynthetic processes, a set of high resolution profiles of physical (temperature, salinity, and light) andchemical (nutrients and chlorophyll) variables was acquired during a tidal cycle, together with highresolution profiles of physiological parameters (photosynthetic efficiency Fv/Fm and functional cross sectionof photosystem II, σPSII) quantified by in situ fast repetition rate (FRR) fluorometry. Vertical profiles ofvariable fluorescence revealed two different chlorophyll maxima that had been previously described in theneighborhood of the Strait; Atlantic Maximum (AM) and DeepMaximum (DM). AMwas present in the photiczone throughout the whole sampling period and the phytoplankton community associated to this maximumwas responsible of the main production in the site until the arrival of the internal bore. DM only appearedafter high water at 44 m depth, at the lower end of the photic zone and was associated to the AtlanticMediterranean Interface (AMI). Phytoplankton associated to this maximum showed very low productivityvalues. FRR profiles revealed that the arrival of the internal bore happened concomitant with the appearanceof a unique, deep and broad chlorophyll maximum associated to a water mass with different physico-chemical and optical characteristics. This maximum ascended quickly to the surface waters in the order of afew minutes. The internal bore's passage becomes a mechanism that supplies phytoplankton to the incomingAtlantic water and a transient increase of primary production in the site was then detected. In addition, FRRderived primary production profiles revealed a significant daily variability.
l rights reserved.
© 2011 Elsevier B.V. All rights reserved.
1. Introduction
The Strait of Gibraltar constitutes the only connection between theMediterranean Sea and the Atlantic Ocean. Thewater exchange betweenthese two basins occurs following a two-layer, inverse-estuarinecirculation scheme, with a mixture of Surface Atlantic Water (SAW)andNorthAtlantic CentralWater (NACW) entering theMediterranean atsurface and denser deepMediterraneanwater outflowing to the Atlantic(MOW). The Camarinal Sill is located in the western sector of the Straitand it is only 300 mdeep in the central sectionwhen compared to depthsof about 900 m in the eastern side of the main channel of the Strait.
The interaction of this sharp topography with tidal forcinggenerates intense undulatory processes as internal bores (Armi andFarmer, 1985) or internal waves (Alonso del Rosario et al., 2003;Bruno et al., 2002). These physical processes produce intense mixingof the different water masses located at the western sector of the
Strait: SAW, NACW and MOW (Gascard and Richez, 1985). At thesame time, physical processes dependent on tidal amplitude controlthe amount of the less abundant NACW being able to overpass the Sill(Gascard and Richez, 1985; Macías et al., 2006). The elucidation of thistidal-dependent sequence of events in the Strait of Gibraltar has beenthe aim of many researchers during decades (Armi and Farmer, 1985;La Violette and Arnone, 1988; García-Lafuente et al., 2000; García-Lafuente and Vargas, 2003; Alonso del Rosario et al., 2003; Bruno et al.,2002; Vázquez et al., 2009) with less literature dedicated to itsbiological implications (e.g. Echevarria et al., 2002; Gómez et al., 2004;Macías et al., 2006; 2009). The values of environmental variables suchas light, CO2, temperature or nutrient concentration are determinedby these physical processes, and consequently, undulatory processesoutline to a great extent the environment experimented byphytoplankton for a given water mass and time in the Strait area,thus affecting its growth and productivity rates (e.g. Cullen et al.,2002). Classical incubation methods as 14C uptake (Steeman-Nielsen,1952) or oxygen evolution (Bryan et al., 1976) have already been usedto obtain primary production estimates in the Strait (Macías et al.,
26 A. Bartual et al. / Journal of Marine Systems 87 (2011) 25–36
2009). Both methods require incubation of water column discretesamples for a period of time (30, 60 or 120 min) and at differentirradiances. The characteristics of light source and the so-called bottleeffect can produce significant effects on the actual light field of these insitu experiences (Grande et al., 1989) creating artificial conditions.The non-synoptic and scattered nature of the sampling process,together with the time required for the incubations, leads to limitedspatial and temporal estimations of primary production. In addition,estimation of integrated productivity based on incubation necessarilyuses extrapolated data of Pmax or chlorophyll a in the water column.The complexity and extreme dynamism of the Strait constitutes alimitation for the use of these methods to study the interactions ofhydrodynamics with primary producers in this area. In addition, thereis an inherent temporal and spatial variability of primary productionin the Atlantic that has already been observed by other authors (seeMarañón and Holligan, 1999). Fluorescence based measurements ofphotosynthesis allow a sampling frequency comparable with thatutilized to register physically relevant parameters as vertical eddydiffusivity or high frequency variations in irradiance (Kolber andFalkowski, 1993). Among the commercially available fluorescencebased methods, Fast Repetition Rate (FRR) fluorometry is a non-invasive active fluorescence technique that overcomes some of theaforementioned limitations, since it provides highly spatially andtemporally resolved estimates of photosynthetic related parametersas the functional light absorption by photosystem II (σPSII) and theefficiency of photochemistry (Fv/Fm), critical parameters for bio-optical determination of phytoplankton productivity (Raateoja et al.,2004; Suggett et al., 2004). Much research effort has been devoted toexamine the ability of fast repetition rate fluorometry (FRRF,hereafter) to provide in situ estimation of primary productivity(Suggett et al., 2001, 2003; Moore et al., 2003; Raateoja et al., 2004;Smith et al., 2004; Suggett et al., 2009) and recent results have shownthat it can be a useful tool to derive high spatial and temporalresolution primary production estimates in highly dynamic systems(Moore et al., 2003; Estévez-Blanco et al., 2006). Nevertheless,variations in community structure (Suggett et al., 2009) and inphotochemical parameters other than those measured by the FRRF(e.g. number of functional PSII reaction centres, nPSII) used forprimary production proxy calculations should be taken into account inorder to reconcile fluorescence-based and O2 evolution or C uptakederived estimates of primary production (Suggett et al., 2006).
Although never before fluorometric quantification of primaryproduction had been done in the Strait of Gibraltar by FRR techniques,it had been previously found that the highest values of CTD-fluorescence values in the Strait coincided with the presence ofAtlantic–Mediterranean mixed waters (Macías et al., 2008) and withevidences of undulatory disturbances (Macías et al., 2006). However,the amount of chlorophyll derived from fluorescence measurementswithin the Atlantic jet could not be explained solely by in situphytoplankton growth. This growth would be an expected conse-quence of nutrient injection caused by the interfacial mixingassociated to the undulatory processes over the Sill, but the flowand subsequent dilution is so rapid that it should not be observed inthe channel. We had hypothesized in previous works that suchincrease in fluorescence could be due to an intermittent flow ofbiomass-enriched water of coastal origin to the Mediterranean sector(Macías et al., 2007, 2008, 2010; Vázquez et al., 2009). In the presentwork, we have used the FRRF technique advantages to follow thevertical and temporal variation of phytoplankton distribution,physiological state and a proxy for primary production during atidal cycle in a fixed station placed in the western entrance of theStrait. We have shown the indirect effects that internal bores cause onphotosynthetic performance and primary production associated tothe different maxima present in the water column, and that lead tolarge variations in a short time-scale. This is an attempt to providenew information to test the hypothesis explained above, coupling the
scale of physical processes with the analysis of phytoplanktonphysiology and its estimated productivity.
2. Methods
2.1. Sampling conditions
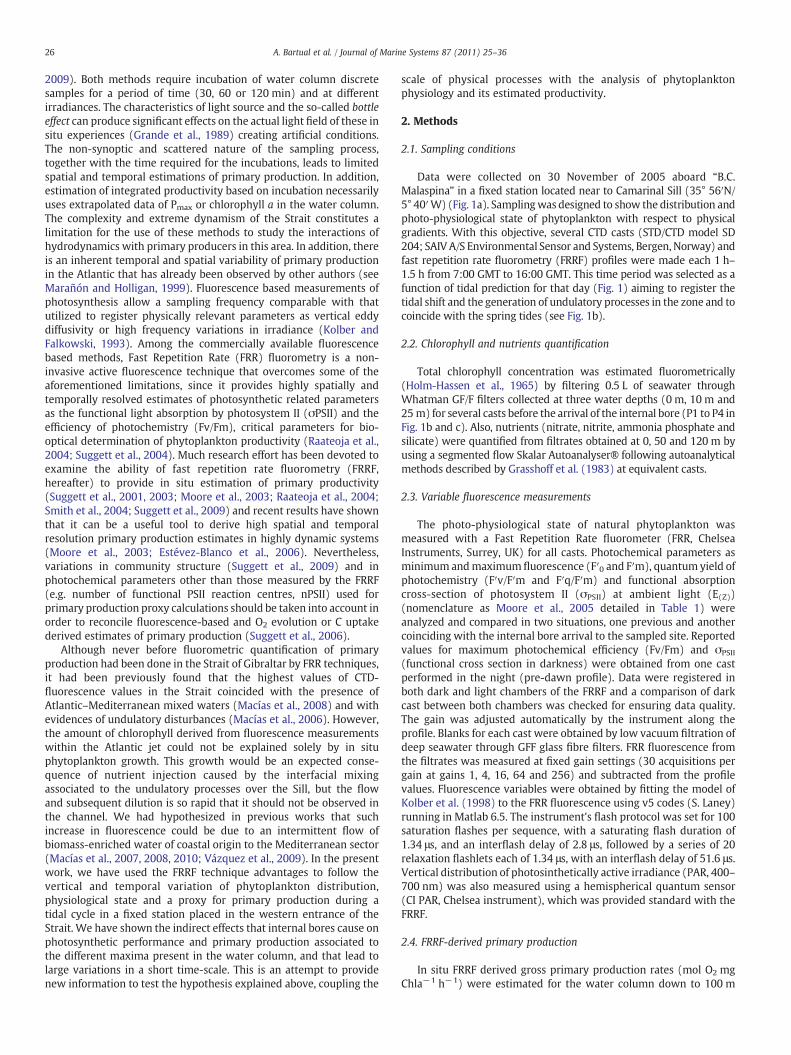
Data were collected on 30 November of 2005 aboard “B.C.Malaspina” in a fixed station located near to Camarinal Sill (35° 56′N/5° 40′W) (Fig. 1a). Samplingwas designed to show the distribution andphoto-physiological state of phytoplankton with respect to physicalgradients. With this objective, several CTD casts (STD/CTD model SD204; SAIV A/S Environmental Sensor and Systems, Bergen, Norway) andfast repetition rate fluorometry (FRRF) profiles were made each 1 h–1.5 h from 7:00 GMT to 16:00 GMT. This time period was selected as afunction of tidal prediction for that day (Fig. 1) aiming to register thetidal shift and the generation of undulatory processes in the zone and tocoincide with the spring tides (see Fig. 1b).
2.2. Chlorophyll and nutrients quantification
Total chlorophyll concentration was estimated fluorometrically(Holm-Hassen et al., 1965) by filtering 0.5 L of seawater throughWhatman GF/F filters collected at three water depths (0 m, 10 m and25m) for several casts before the arrival of the internal bore (P1 to P4 inFig. 1b and c). Also, nutrients (nitrate, nitrite, ammonia phosphate andsilicate) were quantified from filtrates obtained at 0, 50 and 120 m byusing a segmented flow Skalar Autoanalyser® following autoanalyticalmethods described by Grasshoff et al. (1983) at equivalent casts.
2.3. Variable fluorescence measurements
The photo-physiological state of natural phytoplankton wasmeasured with a Fast Repetition Rate fluorometer (FRR, ChelseaInstruments, Surrey, UK) for all casts. Photochemical parameters asminimum andmaximum fluorescence (F′0 and F′m), quantum yield ofphotochemistry (F′v/F′m and F′q/F′m) and functional absorptioncross-section of photosystem II (σPSII) at ambient light (E(Z))(nomenclature as Moore et al., 2005 detailed in Table 1) wereanalyzed and compared in two situations, one previous and anothercoinciding with the internal bore arrival to the sampled site. Reportedvalues for maximum photochemical efficiency (Fv/Fm) and σPSII
(functional cross section in darkness) were obtained from one castperformed in the night (pre-dawn profile). Data were registered inboth dark and light chambers of the FRRF and a comparison of darkcast between both chambers was checked for ensuring data quality.The gain was adjusted automatically by the instrument along theprofile. Blanks for each cast were obtained by low vacuum filtration ofdeep seawater through GFF glass fibre filters. FRR fluorescence fromthe filtrates was measured at fixed gain settings (30 acquisitions pergain at gains 1, 4, 16, 64 and 256) and subtracted from the profilevalues. Fluorescence variables were obtained by fitting the model ofKolber et al. (1998) to the FRR fluorescence using v5 codes (S. Laney)running in Matlab 6.5. The instrument's flash protocol was set for 100saturation flashes per sequence, with a saturating flash duration of1.34 μs, and an interflash delay of 2.8 μs, followed by a series of 20relaxation flashlets each of 1.34 μs, with an interflash delay of 51.6 μs.Vertical distribution of photosinthetically active irradiance (PAR, 400–700 nm) was also measured using a hemispherical quantum sensor(CI PAR, Chelsea instrument), which was provided standard with theFRRF.
2.4. FRRF-derived primary production
In situ FRRF derived gross primary production rates (mol O2 mgChla−1 h−1) were estimated for the water column down to 100 m
300300
200
600600
900
800
42' 48' 36' 24' 12'
48'
54'
36oN
6oW
6'
12'
18'
S
Morocco
300300
200
600600
900
800
300300
200
600600
900
800
Spain
Morocco
-2
-1,5
-1
-0,5
0
0,5
1
1,5
2
0
0,2
0,4
0,6
0,8
1
1,2
1,4
0:00 2:47 5:33 8:20 11:07 13:53 16:40 19:27 22:13
Cu
rren
t ve
loci
ty (
m s
-1)
Tid
al h
eig
ht
in T
arif
a (m
)Time (h)
20/11
/05
21/11
/05
23/11
/05
25/11
/05
27/11
/05
28/11
/05
30/11
/05
2/12/0
5
4/12/0
5
6/12/0
5
7/12/0
5
9/12/0
5
Date
Tid
al h
eig
ht
in T
arif
a (m
)
a
c
b1.6
1.4
1.2
1
0.8
0.6
0.4
0.2
0
P1
P2
P3
P4P5
P6
P7
Fig. 1. a) Position of fixed station at the western entrance of the Strait of Gibraltar (▲). b) Fortnightly tidal prediction for the sampling site. Square indicates sampling period.c) Detailed current velocity prediction 45 m over the sampling site (___) and tidal height in Tarifa (----) during sampling period. Black symbols correspond to the FRRF cast times. Bolddark line indicates an outflowing current velocity of 1 m s−1.
27A. Bartual et al. / Journal of Marine Systems 87 (2011) 25–36
according to the following equation (Suggett et al., 2003; Estévez-Blanco et al., 2006)
PO2 frrf zð Þ = 2:43 10−5 × E zð Þ × Φp zð Þ × achlPSII zð Þ
Table 1Notation used through the text for FRRF parameters.
Parameter Definition Units
F0, Fm Minimal and maximal fluoresce yields measuredin the dark
Arbitrary units
F′0, F′, F′m Minimal, steady state and maximal fluorescenceyields measured under ambient irradiance
Arbitrary units
Fv Variable fluoresce (= Fm−F0) Arbitrary unitsFv/Fm Maximum quantum yield of photochemistry DimensionlessF′q Change in fluorescence yield measured
under ambient light (= F′m−F′)Arbitrary units
F′q/F′m Quantum yield of photochemistry measuredunder ambient light
Dimensionless
σPSII Functional absorption cross-section ofPhotosystem II in dark
Ǻ2 quanta−1
σ′PSII Functional absorption cross-section ofPhotosystem II in ambient light
Ǻ2 quanta−1
qN Non-photochemical quenching (= 1−(s′PSII /sPSII)) DimensionlessqP Photochemical quenching (= F′q/F′m×(F′v/F′m)−1) Dimensionless
Where the optical cross section of PSII achlPSII(z)=σ′PSII(z)×nPSII canbe obtained by in situmeasurements of σ′PSII (z) at ambient light (E(z))in the dark chamber of FRRF to minimize the noise of environmentallight (Smith et al., 2004) and nPSII (number of functional PSII centres)has been calculated by assuming to be 0.002 mol RCII(mol Chla)−1
(Kolber and Falkowski, 1993) for diatom assemblages or 0.003 mol RCII(mol Chla)−1 for cyanobacterial assemblages (Falkowski and Kolber,1995). The maximum quantum yield (Φp(z)=mol O2 mol photons−1)was obtained from FRRF in situ measurements at each depth with thefollowing equation (Gorbunov et al., 2000, 2001; Suggett et al., 2003):
Φp zð Þ = 1= k × σPSII′ = σPSII zð Þ × F′q= F′m� �
= F′v= F′m� �� �
zð Þ
where 1/k is the ratio of PSII electron transport for O2 evolution, with atheoretical maximum value of 0.25 mol O2 mol electrons−1, σ′PSII/σPSII
(z) is related to non photochemical quenching (qN) in the antennaeand the quotient [(F′q/F′m)/(F′v/F′m)] is related to photochemicalquenching, qp (Suggett et al., 2003, 2006).
We assumed a photosynthetic quotient of 1.4 mol O2 evolved(molCO2 incorporated)−1 wewere able to calculate the FRRF derived carbonincorporation rates (mg C m−3 h−1) continuously in thewater column.Integrated primary production in the water column (mg C m−2 h−1)was calculated as the sum of primary production data at each depth(0.25 m) down to 100 m. To calculate the contribution of the differentidentified chlorophyll maximum to the total value of PP for each profile,
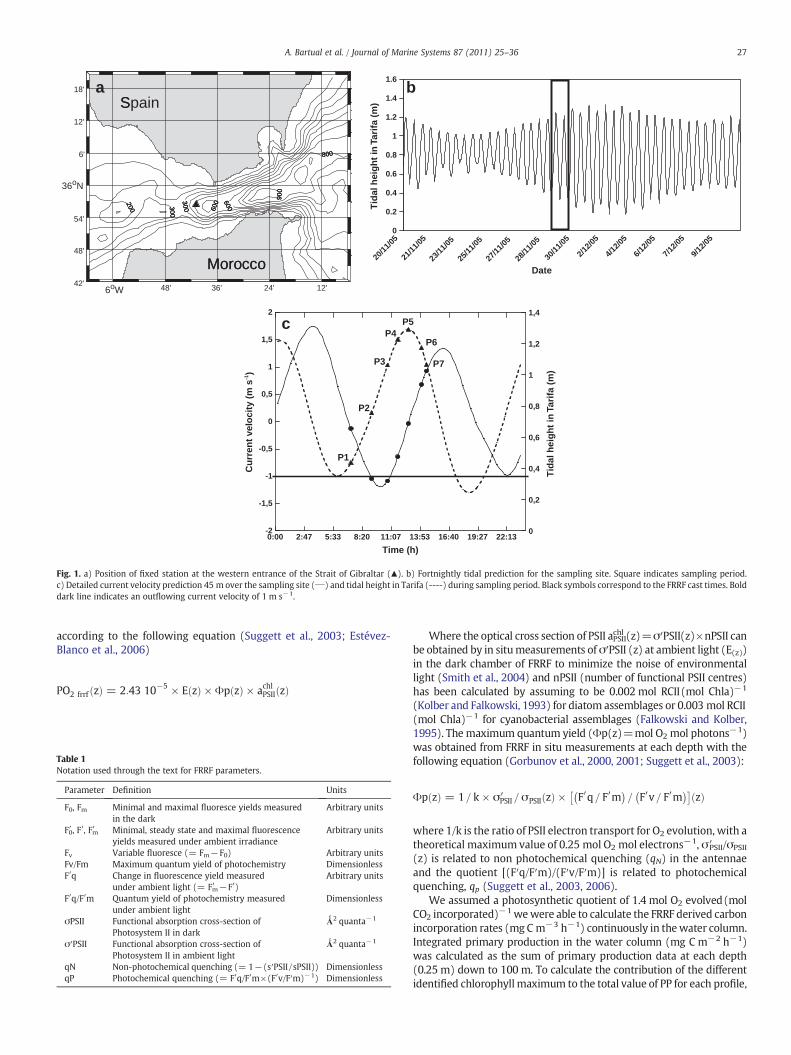
Fig. 2. Upper panel: T–S diagrams for different samplings period. Sampling time related to the high water in Tarifa (HW). Correspondence with FRRF profiles in indicated between brackets Lower panel: Percentage of abundance of NorthAtlantic Central Water in the water column during the sampling period. SAW: Surface Atlantic Water; MOW: Mediterranean Outflowing Water; NACW: North Atlantic Central Water.
28A.Bartual
etal./
Journalof
Marine
Systems87
(2011)25
–36
29A. Bartual et al. / Journal of Marine Systems 87 (2011) 25–36
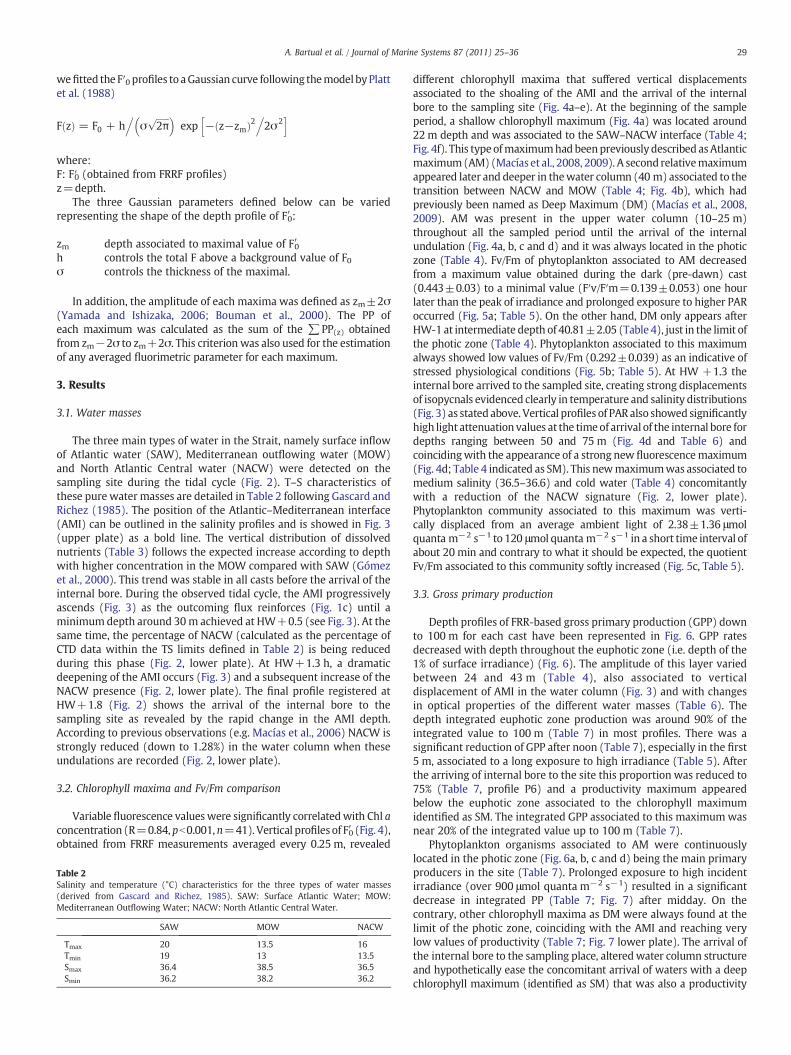
wefitted the F′0 profiles to aGaussian curve following themodel byPlattet al. (1988)
F zð Þ = F0 + h.
σffiffiffiffiffiffi2π
p� �exp − z−zmð Þ2
.2σ2
h i
where:F: F′0 (obtained from FRRF profiles)z=depth.
The three Gaussian parameters defined below can be variedrepresenting the shape of the depth profile of F′0:
zm depth associated to maximal value of F′0h controls the total F above a background value of F0σ controls the thickness of the maximal.
In addition, the amplitude of each maxima was defined as zm±2σ(Yamada and Ishizaka, 2006; Bouman et al., 2000). The PP ofeach maximum was calculated as the sum of the ∑PP(z) obtainedfrom zm−2σ to zm+2σ. This criterion was also used for the estimationof any averaged fluorimetric parameter for each maximum.
3. Results
3.1. Water masses
The three main types of water in the Strait, namely surface inflowof Atlantic water (SAW), Mediterranean outflowing water (MOW)and North Atlantic Central water (NACW) were detected on thesampling site during the tidal cycle (Fig. 2). T–S characteristics ofthese pure water masses are detailed in Table 2 following Gascard andRichez (1985). The position of the Atlantic–Mediterranean interface(AMI) can be outlined in the salinity profiles and is showed in Fig. 3(upper plate) as a bold line. The vertical distribution of dissolvednutrients (Table 3) follows the expected increase according to depthwith higher concentration in the MOW compared with SAW (Gómezet al., 2000). This trend was stable in all casts before the arrival of theinternal bore. During the observed tidal cycle, the AMI progressivelyascends (Fig. 3) as the outcoming flux reinforces (Fig. 1c) until aminimumdepth around 30m achieved at HW+0.5 (see Fig. 3). At thesame time, the percentage of NACW (calculated as the percentage ofCTD data within the TS limits defined in Table 2) is being reducedduring this phase (Fig. 2, lower plate). At HW+1.3 h, a dramaticdeepening of the AMI occurs (Fig. 3) and a subsequent increase of theNACW presence (Fig. 2, lower plate). The final profile registered atHW+1.8 (Fig. 2) shows the arrival of the internal bore to thesampling site as revealed by the rapid change in the AMI depth.According to previous observations (e.g. Macías et al., 2006) NACW isstrongly reduced (down to 1.28%) in the water column when theseundulations are recorded (Fig. 2, lower plate).
3.2. Chlorophyll maxima and Fv/Fm comparison
Variable fluorescence valueswere significantly correlatedwith Chl aconcentration (R=0.84, pb0.001,n=41). Vertical profiles of F′0 (Fig. 4),obtained from FRRF measurements averaged every 0.25 m, revealed
Table 2Salinity and temperature (°C) characteristics for the three types of water masses(derived from Gascard and Richez, 1985). SAW: Surface Atlantic Water; MOW:Mediterranean Outflowing Water; NACW: North Atlantic Central Water.
SAW MOW NACW
Tmax 20 13.5 16Tmin 19 13 13.5Smax 36.4 38.5 36.5Smin 36.2 38.2 36.2
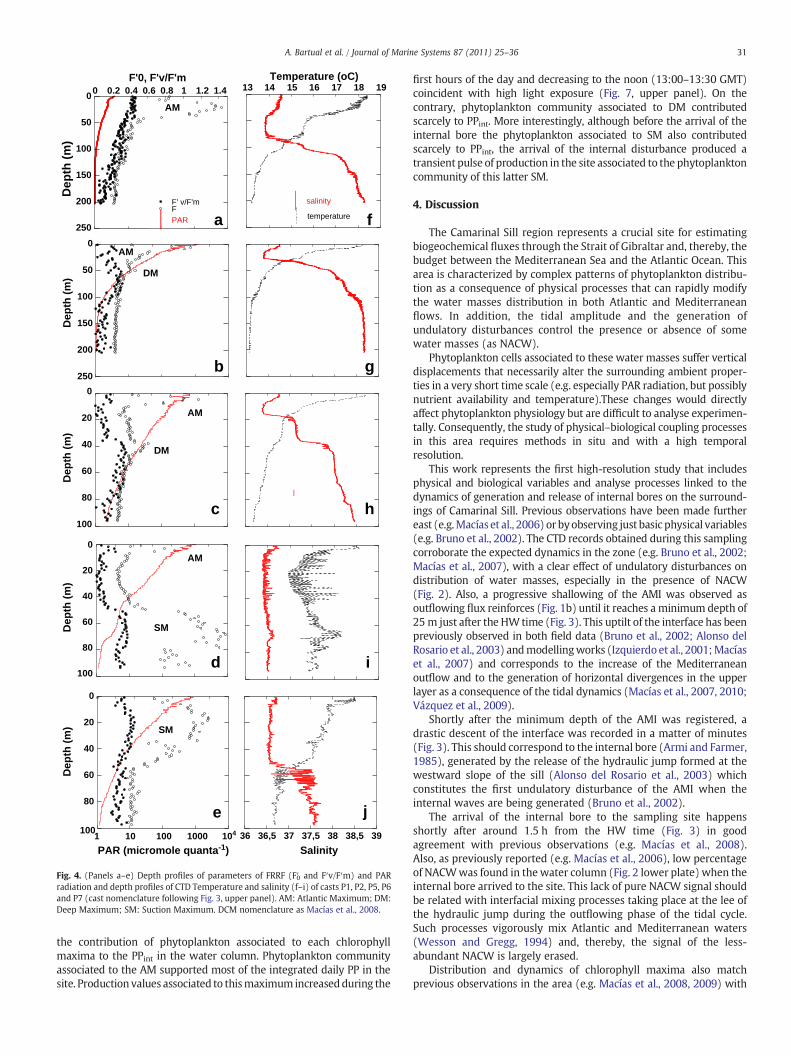
different chlorophyll maxima that suffered vertical displacementsassociated to the shoaling of the AMI and the arrival of the internalbore to the sampling site (Fig. 4a–e). At the beginning of the sampleperiod, a shallow chlorophyll maximum (Fig. 4a) was located around22m depth and was associated to the SAW–NACW interface (Table 4;Fig. 4f). This typeofmaximumhadbeenpreviously described asAtlanticmaximum(AM) (Macías et al., 2008, 2009). A second relativemaximumappeared later and deeper in thewater column (40 m) associated to thetransition between NACW and MOW (Table 4; Fig. 4b), which hadpreviously been named as Deep Maximum (DM) (Macías et al., 2008,2009). AM was present in the upper water column (10–25 m)throughout all the sampled period until the arrival of the internalundulation (Fig. 4a, b, c and d) and it was always located in the photiczone (Table 4). Fv/Fm of phytoplankton associated to AM decreasedfrom a maximum value obtained during the dark (pre-dawn) cast(0.443±0.03) to a minimal value (F′v/F′m=0.139±0.053) one hourlater than the peak of irradiance and prolonged exposure to higher PARoccurred (Fig. 5a; Table 5). On the other hand, DM only appears afterHW-1 at intermediate depth of 40.81±2.05 (Table 4), just in the limit ofthe photic zone (Table 4). Phytoplankton associated to this maximumalways showed low values of Fv/Fm (0.292±0.039) as an indicative ofstressed physiological conditions (Fig. 5b; Table 5). At HW +1.3 theinternal bore arrived to the sampled site, creating strong displacementsof isopycnals evidenced clearly in temperature and salinity distributions(Fig. 3) as stated above. Vertical profiles of PAR also showed significantlyhigh light attenuation values at the timeof arrival of the internal bore fordepths ranging between 50 and 75 m (Fig. 4d and Table 6) andcoincidingwith the appearance of a strong new fluorescencemaximum(Fig. 4d; Table 4 indicated as SM). This newmaximumwas associated tomedium salinity (36.5–36.6) and cold water (Table 4) concomitantlywith a reduction of the NACW signature (Fig. 2, lower plate).Phytoplankton community associated to this maximum was verti-cally displaced from an average ambient light of 2.38±1.36 μmolquanta m−2 s−1 to 120 μmol quanta m−2 s−1 in a short time interval ofabout 20 min and contrary to what it should be expected, the quotientFv/Fm associated to this community softly increased (Fig. 5c, Table 5).
3.3. Gross primary production
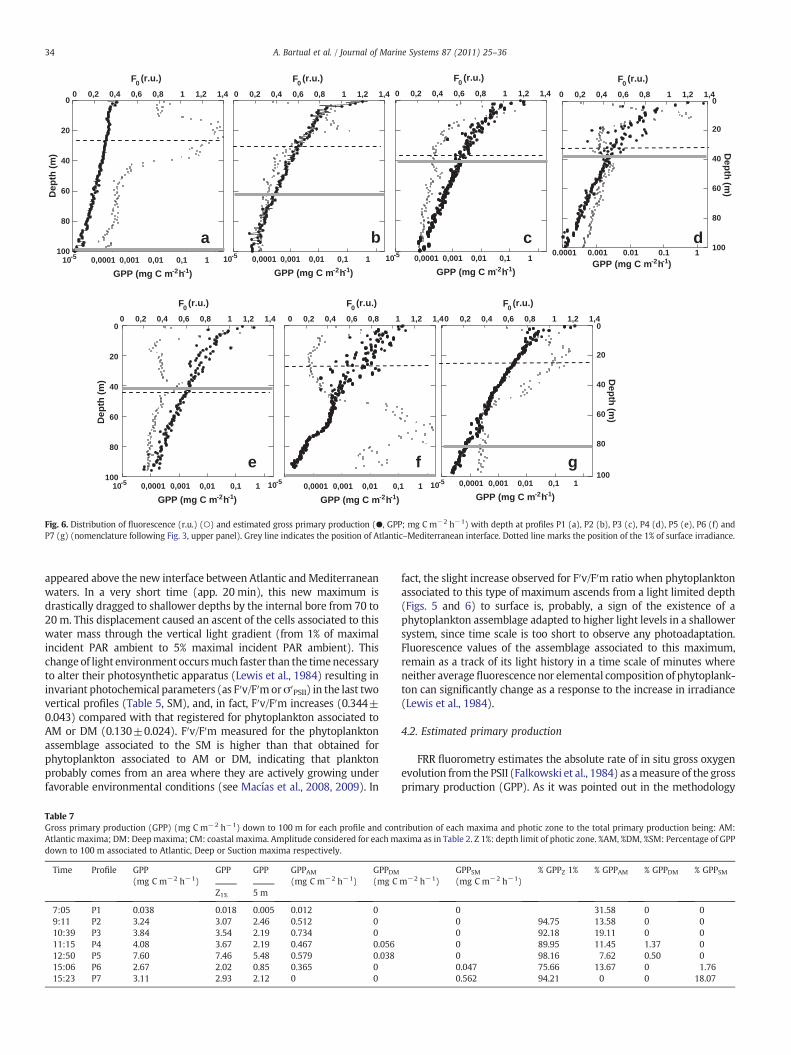
Depth profiles of FRR-based gross primary production (GPP) downto 100 m for each cast have been represented in Fig. 6. GPP ratesdecreased with depth throughout the euphotic zone (i.e. depth of the1% of surface irradiance) (Fig. 6). The amplitude of this layer variedbetween 24 and 43 m (Table 4), also associated to verticaldisplacement of AMI in the water column (Fig. 3) and with changesin optical properties of the different water masses (Table 6). Thedepth integrated euphotic zone production was around 90% of theintegrated value to 100 m (Table 7) in most profiles. There was asignificant reduction of GPP after noon (Table 7), especially in the first5 m, associated to a long exposure to high irradiance (Table 5). Afterthe arriving of internal bore to the site this proportion was reduced to75% (Table 7, profile P6) and a productivity maximum appearedbelow the euphotic zone associated to the chlorophyll maximumidentified as SM. The integrated GPP associated to this maximumwasnear 20% of the integrated value up to 100 m (Table 7).
Phytoplankton organisms associated to AM were continuouslylocated in the photic zone (Fig. 6a, b, c and d) being the main primaryproducers in the site (Table 7). Prolonged exposure to high incidentirradiance (over 900 μmol quanta m−2 s−1) resulted in a significantdecrease in integrated PP (Table 7; Fig. 7) after midday. On thecontrary, other chlorophyll maxima as DM were always found at thelimit of the photic zone, coinciding with the AMI and reaching verylow values of productivity (Table 7; Fig. 7 lower plate). The arrival ofthe internal bore to the sampling place, alteredwater column structureand hypothetically ease the concomitant arrival of waters with a deepchlorophyll maximum (identified as SM) that was also a productivity
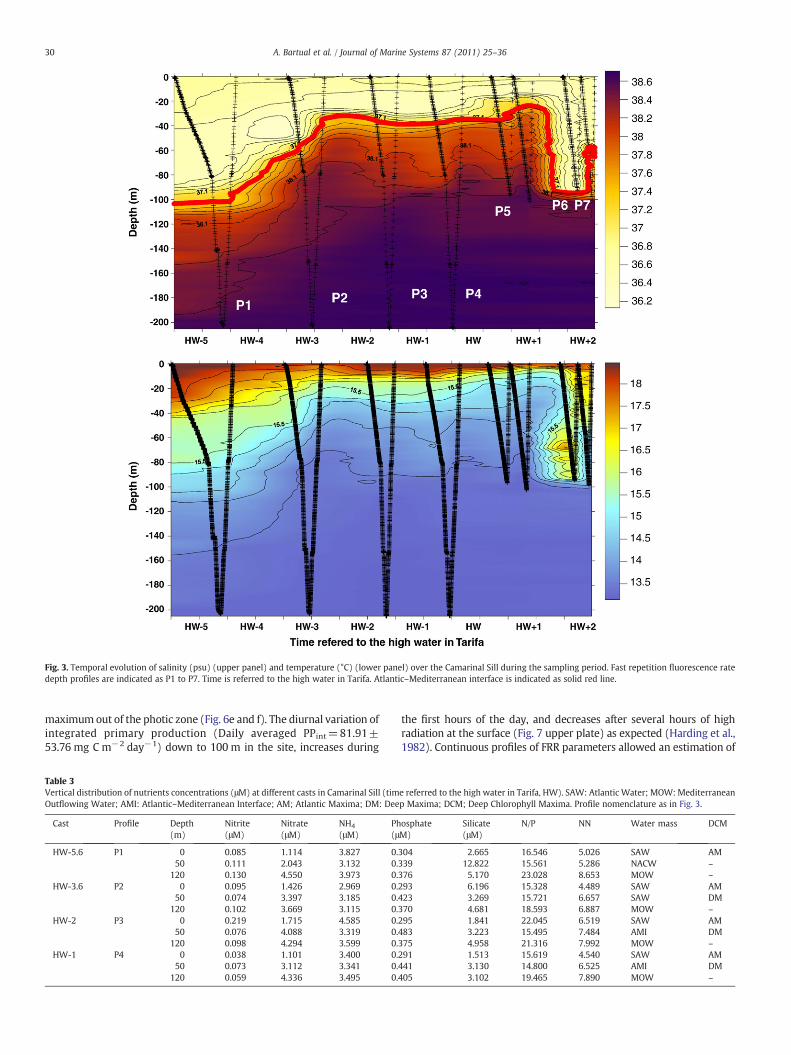
Fig. 3. Temporal evolution of salinity (psu) (upper panel) and temperature (°C) (lower panel) over the Camarinal Sill during the sampling period. Fast repetition fluorescence ratedepth profiles are indicated as P1 to P7. Time is referred to the high water in Tarifa. Atlantic–Mediterranean interface is indicated as solid red line.
30 A. Bartual et al. / Journal of Marine Systems 87 (2011) 25–36
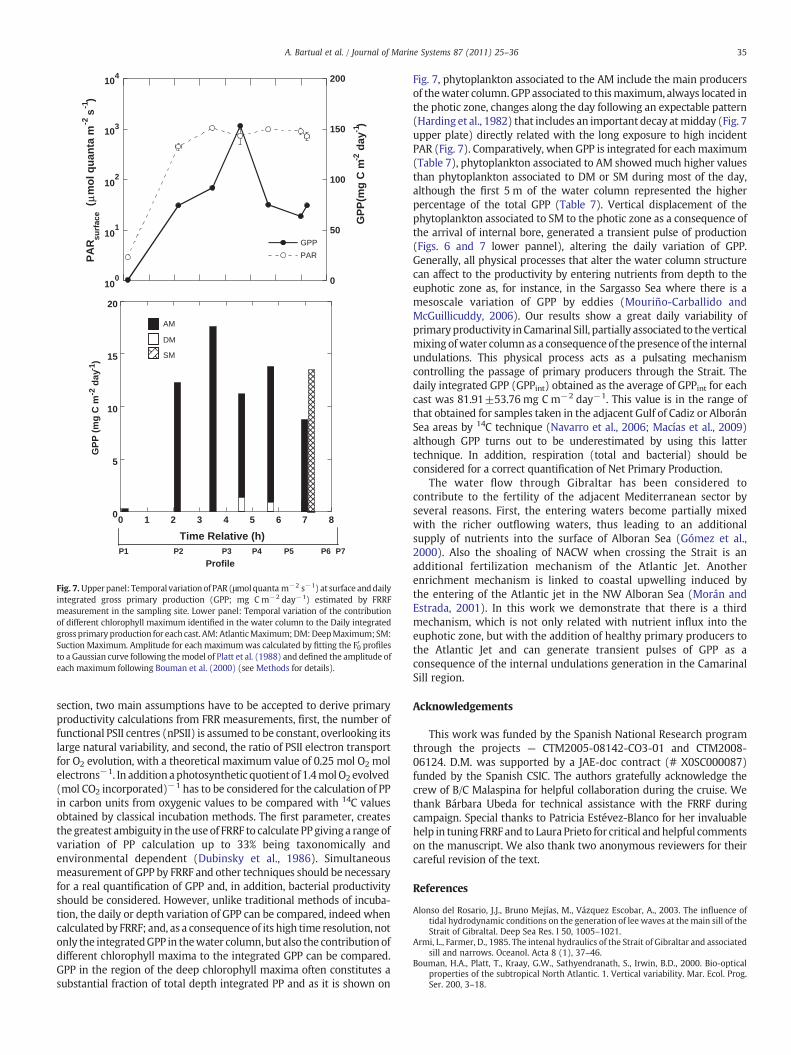
maximumout of the photic zone (Fig. 6e and f). The diurnal variation ofintegrated primary production (Daily averaged PPint=81.91±53.76 mg C m−2 day−1) down to 100 m in the site, increases during
Table 3Vertical distribution of nutrients concentrations (μM) at different casts in Camarinal Sill (timOutflowing Water; AMI: Atlantic–Mediterranean Interface; AM; Atlantic Maxima; DM: Dee
Cast Profile Depth(m)
Nitrite(μM)
Nitrate(μM)
NH4
(μM)Ph(μ
HW-5.6 P1 0 0.085 1.114 3.827 0.50 0.111 2.043 3.132 0.
120 0.130 4.550 3.973 0.HW-3.6 P2 0 0.095 1.426 2.969 0.
50 0.074 3.397 3.185 0.120 0.102 3.669 3.115 0.
HW-2 P3 0 0.219 1.715 4.585 0.50 0.076 4.088 3.319 0.
120 0.098 4.294 3.599 0.HW-1 P4 0 0.038 1.101 3.400 0.
50 0.073 3.112 3.341 0.120 0.059 4.336 3.495 0.
the first hours of the day, and decreases after several hours of highradiation at the surface (Fig. 7 upper plate) as expected (Harding et al.,1982). Continuous profiles of FRR parameters allowed an estimation of
e referred to the high water in Tarifa, HW). SAW: Atlantic Water; MOW:Mediterraneanp Maxima; DCM; Deep Chlorophyll Maxima. Profile nomenclature as in Fig. 3.
osphateM)
Silicate(μM)
N/P NN Water mass DCM
304 2.665 16.546 5.026 SAW AM339 12.822 15.561 5.286 NACW –
376 5.170 23.028 8.653 MOW –
293 6.196 15.328 4.489 SAW AM423 3.269 15.721 6.657 SAW DM370 4.681 18.593 6.887 MOW –
295 1.841 22.045 6.519 SAW AM483 3.223 15.495 7.484 AMI DM375 4.958 21.316 7.992 MOW –
291 1.513 15.619 4.540 SAW AM441 3.130 14.800 6.525 AMI DM405 3.102 19.465 7.890 MOW –
13 14 15 16 17 18 19
temperature
salinity
Temperature (oC)
0
50
100
150
200
250
Dep
th (
m)
0
20
40
60
80
100
Dep
th (
m)
0
20
40
60
80
100
Dep
th (
m)
36 36,5 37 37,5 38 38,5 39
Salinity 1 10 100 1000 104
0
20
40
60
80
100
PAR (micromole quanta-1)
Dep
th (
m)
0 0.2 0.4 0.6 0.8 1 1.2 1.40
50
100
150
200
250
F' v/F'mFPAR
F'0, F'v/F'mD
epth
(m
)
AM
a
b g
f
AM
DM
AM
AM
DM
c
d
h
i
je
SM
SM
Fig. 4. (Panels a–e) Depth profiles of parameters of FRRF (F′0 and F′v/F′m) and PARradiation and depth profiles of CTD Temperature and salinity (f–i) of casts P1, P2, P5, P6and P7 (cast nomenclature following Fig. 3, upper panel). AM: Atlantic Maximum; DM:Deep Maximum; SM: Suction Maximum. DCM nomenclature as Macías et al., 2008.
31A. Bartual et al. / Journal of Marine Systems 87 (2011) 25–36
the contribution of phytoplankton associated to each chlorophyllmaxima to the PPint in the water column. Phytoplankton communityassociated to the AM supported most of the integrated daily PP in thesite. Production values associated to thismaximum increasedduring the
first hours of the day and decreasing to the noon (13:00–13:30 GMT)coincident with high light exposure (Fig. 7, upper panel). On thecontrary, phytoplankton community associated to DM contributedscarcely to PPint. More interestingly, although before the arrival of theinternal bore the phytoplankton associated to SM also contributedscarcely to PPint, the arrival of the internal disturbance produced atransient pulse of production in the site associated to the phytoplanktoncommunity of this latter SM.
4. Discussion
The Camarinal Sill region represents a crucial site for estimatingbiogeochemical fluxes through the Strait of Gibraltar and, thereby, thebudget between the Mediterranean Sea and the Atlantic Ocean. Thisarea is characterized by complex patterns of phytoplankton distribu-tion as a consequence of physical processes that can rapidly modifythe water masses distribution in both Atlantic and Mediterraneanflows. In addition, the tidal amplitude and the generation ofundulatory disturbances control the presence or absence of somewater masses (as NACW).
Phytoplankton cells associated to these water masses suffer verticaldisplacements that necessarily alter the surrounding ambient proper-ties in a very short time scale (e.g. especially PAR radiation, but possiblynutrient availability and temperature).These changes would directlyaffect phytoplankton physiology but are difficult to analyse experimen-tally. Consequently, the study of physical–biological coupling processesin this area requires methods in situ and with a high temporalresolution.
This work represents the first high-resolution study that includesphysical and biological variables and analyse processes linked to thedynamics of generation and release of internal bores on the surround-ings of Camarinal Sill. Previous observations have been made furthereast (e.g.Macías et al., 2006) or byobserving just basic physical variables(e.g. Bruno et al., 2002). The CTD records obtained during this samplingcorroborate the expected dynamics in the zone (e.g. Bruno et al., 2002;Macías et al., 2007), with a clear effect of undulatory disturbances ondistribution of water masses, especially in the presence of NACW(Fig. 2). Also, a progressive shallowing of the AMI was observed asoutflowing flux reinforces (Fig. 1b) until it reaches a minimum depth of25 m just after the HW time (Fig. 3). This uptilt of the interface has beenpreviously observed in both field data (Bruno et al., 2002; Alonso delRosario et al., 2003) andmodellingworks (Izquierdo et al., 2001;Macíaset al., 2007) and corresponds to the increase of the Mediterraneanoutflow and to the generation of horizontal divergences in the upperlayer as a consequence of the tidal dynamics (Macías et al., 2007, 2010;Vázquez et al., 2009).
Shortly after the minimum depth of the AMI was registered, adrastic descent of the interface was recorded in a matter of minutes(Fig. 3). This should correspond to the internal bore (Armi and Farmer,1985), generated by the release of the hydraulic jump formed at thewestward slope of the sill (Alonso del Rosario et al., 2003) whichconstitutes the first undulatory disturbance of the AMI when theinternal waves are being generated (Bruno et al., 2002).
The arrival of the internal bore to the sampling site happensshortly after around 1.5 h from the HW time (Fig. 3) in goodagreement with previous observations (e.g. Macías et al., 2008).Also, as previously reported (e.g. Macías et al., 2006), low percentageof NACWwas found in thewater column (Fig. 2 lower plate) when theinternal bore arrived to the site. This lack of pure NACW signal shouldbe related with interfacial mixing processes taking place at the lee ofthe hydraulic jump during the outflowing phase of the tidal cycle.Such processes vigorously mix Atlantic and Mediterranean waters(Wesson and Gregg, 1994) and, thereby, the signal of the less-abundant NACW is largely erased.
Distribution and dynamics of chlorophyll maxima also matchprevious observations in the area (e.g. Macías et al., 2008, 2009) with
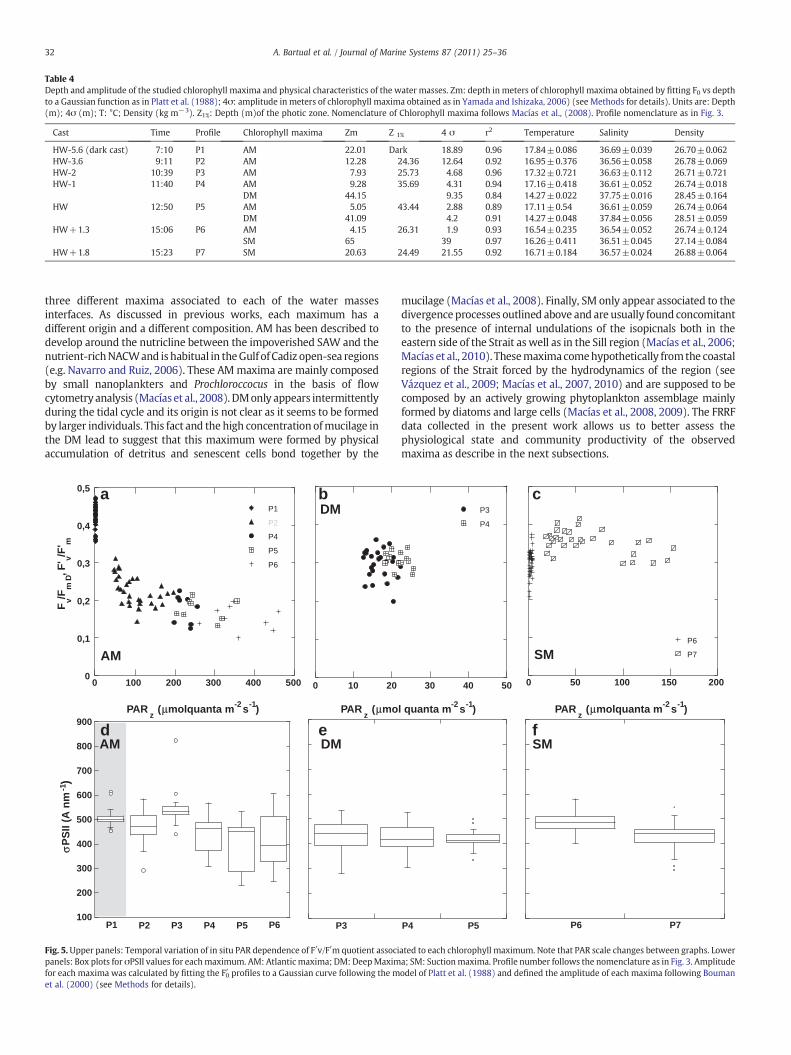
Table 4Depth and amplitude of the studied chlorophyll maxima and physical characteristics of the water masses. Zm: depth in meters of chlorophyll maxima obtained by fitting F0 vs depthto a Gaussian function as in Platt et al. (1988); 4σ: amplitude in meters of chlorophyll maxima obtained as in Yamada and Ishizaka, 2006) (see Methods for details). Units are: Depth(m); 4σ (m); T: °C; Density (kg m−3). Z1%: Depth (m)of the photic zone. Nomenclature of Chlorophyll maxima follows Macías et al., (2008). Profile nomenclature as in Fig. 3.
Cast Time Profile Chlorophyll maxima Zm Z 1% 4 σ r2 Temperature Salinity Density
HW-5.6 (dark cast) 7:10 P1 AM 22.01 Dark 18.89 0.96 17.84±0.086 36.69±0.039 26.70±0.062HW-3.6 9:11 P2 AM 12.28 24.36 12.64 0.92 16.95±0.376 36.56±0.058 26.78±0.069HW-2 10:39 P3 AM 7.93 25.73 4.68 0.96 17.32±0.721 36.63±0.112 26.71±0.721HW-1 11:40 P4 AM 9.28 35.69 4.31 0.94 17.16±0.418 36.61±0.052 26.74±0.018
DM 44.15 9.35 0.84 14.27±0.022 37.75±0.016 28.45±0.164HW 12:50 P5 AM 5.05 43.44 2.88 0.89 17.11±0.54 36.61±0.059 26.74±0.064
DM 41.09 4.2 0.91 14.27±0.048 37.84±0.056 28.51±0.059HW+1.3 15:06 P6 AM 4.15 26.31 1.9 0.93 16.54±0.235 36.54±0.052 26.74±0.124
SM 65 39 0.97 16.26±0.411 36.51±0.045 27.14±0.084HW+1.8 15:23 P7 SM 20.63 24.49 21.55 0.92 16.71±0.184 36.57±0.024 26.88±0.064
32 A. Bartual et al. / Journal of Marine Systems 87 (2011) 25–36
three different maxima associated to each of the water massesinterfaces. As discussed in previous works, each maximum has adifferent origin and a different composition. AM has been described todevelop around the nutricline between the impoverished SAW and thenutrient-richNACWand ishabitual in theGulf of Cadiz open-sea regions(e.g. Navarro and Ruiz, 2006). These AMmaxima are mainly composedby small nanoplankters and Prochloroccocus in the basis of flowcytometry analysis (Macías et al., 2008). DMonly appears intermittentlyduring the tidal cycle and its origin is not clear as it seems to be formedby larger individuals. This fact and the high concentration ofmucilage inthe DM lead to suggest that this maximum were formed by physicalaccumulation of detritus and senescent cells bond together by the
0
0,1
0,2
0,3
0,4
0,5 a b
0 100 200 300 400 500
P1
P2
P4
P5
P6
Fv/F
mD, F
' v/F' m
PAR z
(μmolquanta m-2 s-1) PAR z
(μmo
AM
0 10 20
DM
100
200
300
400
500
600
700
800
900
P1 P2 P3 P4 P5 P6
σP
SII
(A n
m-1)
AM
P3
DMd e
Fig. 5.Upper panels: Temporal variation of in situ PAR dependence of F′v/F′mquotient associpanels: Box plots for σPSII values for eachmaximum. AM: Atlantic maxima; DM: DeepMaximfor each maxima was calculated by fitting the F′0 profiles to a Gaussian curve following the met al. (2000) (see Methods for details).
mucilage (Macías et al., 2008). Finally, SM only appear associated to thedivergenceprocesses outlined above and are usually found concomitantto the presence of internal undulations of the isopicnals both in theeastern side of the Strait as well as in the Sill region (Macías et al., 2006;Macías et al., 2010). Thesemaximacomehypothetically fromthe coastalregions of the Strait forced by the hydrodynamics of the region (seeVázquez et al., 2009; Macías et al., 2007, 2010) and are supposed to becomposed by an actively growing phytoplankton assemblage mainlyformed by diatoms and large cells (Macías et al., 2008, 2009). The FRRFdata collected in the present work allows us to better assess thephysiological state and community productivity of the observedmaxima as describe in the next subsections.
c
l quanta m-2 s-1) PAR z
(μmolquanta m-2 s-1)
30 40 50
P3
P4
0 50 100 150 200
P6
P7SM
P4 P5 P7P6
SMf
ated to each chlorophyll maximum. Note that PAR scale changes between graphs. Lowera; SM: Suctionmaxima. Profile number follows the nomenclature as in Fig. 3. Amplitudeodel of Platt et al. (1988) and defined the amplitude of each maxima following Bouman
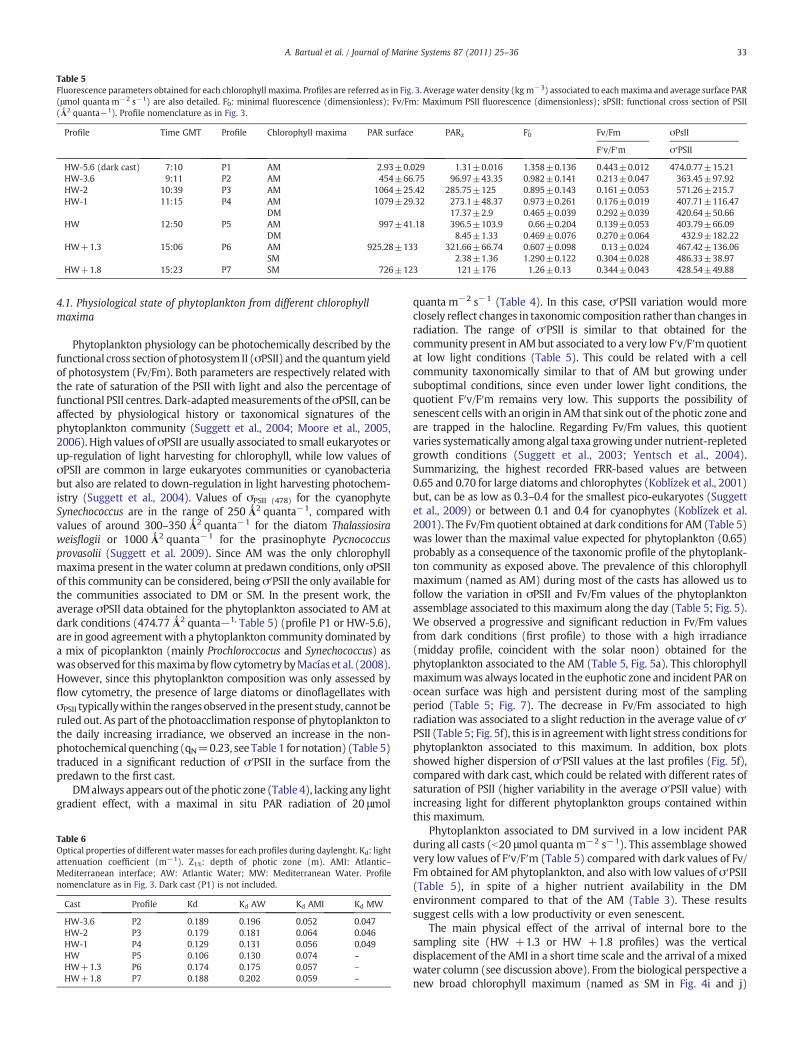
Table 5Fluorescence parameters obtained for each chlorophyll maxima. Profiles are referred as in Fig. 3. Averagewater density (kg m−3) associated to eachmaxima and average surface PAR(μmol quanta m−2 s−1) are also detailed. F′0: minimal fluorescence (dimensionless); Fv/Fm: Maximum PSII fluorescence (dimensionless); sPSII: functional cross section of PSII(Ǻ2 quanta−1). Profile nomenclature as in Fig. 3.
Profile Time GMT Profile Chlorophyll maxima PAR surface PARz F′0 Fv/Fm σPsII
F′v/F′m σ′PSII
HW-5.6 (dark cast) 7:10 P1 AM 2.93±0.029 1.31±0.016 1.358±0.136 0.443±0.012 474.0.77±15.21HW-3.6 9:11 P2 AM 454±66.75 96.97±43.35 0.982±0.141 0.213±0.047 363.45±97.92HW-2 10:39 P3 AM 1064±25.42 285.75±125 0.895±0.143 0.161±0.053 571.26±215.7HW-1 11:15 P4 AM 1079±29.32 273.1±48.37 0.973±0.261 0.176±0.019 407.71±116.47
DM 17.37±2.9 0.465±0.039 0.292±0.039 420.64±50.66HW 12:50 P5 AM 997±41.18 396.5±103.9 0.66±0.204 0.139±0.053 403.79±66.09
DM 8.45±1.33 0.469±0.076 0.270±0.064 432.9±182.22HW+1.3 15:06 P6 AM 925.28±133 321.66±66.74 0.607±0.098 0.13±0.024 467.42±136.06
SM 2.38±1.36 1.290±0.122 0.304±0.028 486.33±38.97HW+1.8 15:23 P7 SM 726±123 121±176 1.26±0.13 0.344±0.043 428.54±49.88
33A. Bartual et al. / Journal of Marine Systems 87 (2011) 25–36
4.1. Physiological state of phytoplankton from different chlorophyllmaxima
Phytoplankton physiology can be photochemically described by thefunctional cross section of photosystem II (σPSII) and the quantumyieldof photosystem (Fv/Fm). Both parameters are respectively related withthe rate of saturation of the PSII with light and also the percentage offunctional PSII centres. Dark-adaptedmeasurements of theσPSII, can beaffected by physiological history or taxonomical signatures of thephytoplankton community (Suggett et al., 2004; Moore et al., 2005,2006). High values of σPSII are usually associated to small eukaryotes orup-regulation of light harvesting for chlorophyll, while low values ofσPSII are common in large eukaryotes communities or cyanobacteriabut also are related to down-regulation in light harvesting photochem-istry (Suggett et al., 2004). Values of σPSII (478) for the cyanophyteSynechococcus are in the range of 250Ǻ2 quanta−1, compared withvalues of around 300–350 Ǻ2 quanta−1 for the diatom Thalassiosiraweisflogii or 1000 Ǻ2 quanta−1 for the prasinophyte Pycnococcusprovasolii (Suggett et al. 2009). Since AM was the only chlorophyllmaxima present in the water column at predawn conditions, only σPSIIof this community can be considered, being σ′PSII the only available forthe communities associated to DM or SM. In the present work, theaverage σPSII data obtained for the phytoplankton associated to AM atdark conditions (474.77Ǻ2 quanta−1, Table 5) (profile P1 or HW-5.6),are in good agreementwith a phytoplankton community dominated bya mix of picoplankton (mainly Prochloroccocus and Synechococcus) aswasobserved for thismaximabyflowcytometrybyMacías et al. (2008).However, since this phytoplankton composition was only assessed byflow cytometry, the presence of large diatoms or dinoflagellates withσPSII typicallywithin the ranges observed in thepresent study, cannotberuled out. As part of the photoacclimation response of phytoplankton tothe daily increasing irradiance, we observed an increase in the non-photochemical quenching (qN=0.23, see Table 1 for notation) (Table 5)traduced in a significant reduction of σ′PSII in the surface from thepredawn to the first cast.
DMalways appears out of thephotic zone (Table 4), lacking any lightgradient effect, with a maximal in situ PAR radiation of 20 μmol
Table 6Optical properties of different water masses for each profiles during daylenght. Kd: lightattenuation coefficient (m−1). Z1%: depth of photic zone (m). AMI: Atlantic–Mediterranean interface; AW: Atlantic Water; MW: Mediterranean Water. Profilenomenclature as in Fig. 3. Dark cast (P1) is not included.
Cast Profile Kd Kd AW Kd AMI Kd MW
HW-3.6 P2 0.189 0.196 0.052 0.047HW-2 P3 0.179 0.181 0.064 0.046HW-1 P4 0.129 0.131 0.056 0.049HW P5 0.106 0.130 0.074 –
HW+1.3 P6 0.174 0.175 0.057 –
HW+1.8 P7 0.188 0.202 0.059 –
quanta m−2 s−1 (Table 4). In this case, σ′PSII variation would moreclosely reflect changes in taxonomic composition rather than changes inradiation. The range of σ′PSII is similar to that obtained for thecommunity present in AMbut associated to a very low F′v/F′mquotientat low light conditions (Table 5). This could be related with a cellcommunity taxonomically similar to that of AM but growing undersuboptimal conditions, since even under lower light conditions, thequotient F′v/F′m remains very low. This supports the possibility ofsenescent cells with an origin in AM that sink out of the photic zone andare trapped in the halocline. Regarding Fv/Fm values, this quotientvaries systematically among algal taxa growing under nutrient-repletedgrowth conditions (Suggett et al., 2003; Yentsch et al., 2004).Summarizing, the highest recorded FRR-based values are between0.65 and 0.70 for large diatoms and chlorophytes (Koblízek et al., 2001)but, can be as low as 0.3–0.4 for the smallest pico-eukaryotes (Suggettet al., 2009) or between 0.1 and 0.4 for cyanophytes (Koblízek et al.2001). The Fv/Fmquotient obtained at dark conditions for AM (Table 5)was lower than the maximal value expected for phytoplankton (0.65)probably as a consequence of the taxonomic profile of the phytoplank-ton community as exposed above. The prevalence of this chlorophyllmaximum (named as AM) during most of the casts has allowed us tofollow the variation in σPSII and Fv/Fm values of the phytoplanktonassemblage associated to this maximum along the day (Table 5; Fig. 5).We observed a progressive and significant reduction in Fv/Fm valuesfrom dark conditions (first profile) to those with a high irradiance(midday profile, coincident with the solar noon) obtained for thephytoplankton associated to the AM (Table 5, Fig. 5a). This chlorophyllmaximumwas always located in the euphotic zone and incident PAR onocean surface was high and persistent during most of the samplingperiod (Table 5; Fig. 7). The decrease in Fv/Fm associated to highradiation was associated to a slight reduction in the average value of σ′PSII (Table 5; Fig. 5f), this is in agreementwith light stress conditions forphytoplankton associated to this maximum. In addition, box plotsshowed higher dispersion of σ′PSII values at the last profiles (Fig. 5f),compared with dark cast, which could be related with different rates ofsaturation of PSII (higher variability in the average σ′PSII value) withincreasing light for different phytoplankton groups contained withinthis maximum.
Phytoplankton associated to DM survived in a low incident PARduring all casts (b20 μmol quanta m−2 s−1). This assemblage showedvery low values of F′v/F′m (Table 5) compared with dark values of Fv/Fm obtained for AM phytoplankton, and also with low values of σ′PSII(Table 5), in spite of a higher nutrient availability in the DMenvironment compared to that of the AM (Table 3). These resultssuggest cells with a low productivity or even senescent.
The main physical effect of the arrival of internal bore to thesampling site (HW +1.3 or HW +1.8 profiles) was the verticaldisplacement of the AMI in a short time scale and the arrival of a mixedwater column (see discussion above). From the biological perspective anew broad chlorophyll maximum (named as SM in Fig. 4i and j)
0.0001 0.001 0.01 0.1 1
Dep
th (m
)
0 0,2 0,4 0,6 0,8 1 1,2 1,4
10-5 0,0001 0,001 0,01 0,1 1
0
20
40
60
80
100
F0 (r.u.)
0 0,2 0,4 0,6 0,8 1 1,2 1,4
F0 (r.u.)
0 0,2 0,4 0,6 0,8 1 1,2 1,4
F0 (r.u.)
0 0,2 0,4 0,6 0,8 1 1,2 1,4
F0 (r.u.)
0 0,2 0,4 0,6 0,8 1 1,2 1,4
F0 (r.u.)
0 0,2 0,4 0,6 0,8 1 1,2 1,4
F0 (r.u.)
0 0,2 0,4 0,6 0,8 1 1,2 1,4
F0 (r.u.)
GPP (mg C m-2h-1)
10-5 0,0001 0,001 0,01 0,1 1
GPP (mg C m-2h-1)
10-5 0,0001 0,001 0,01 0,1 1
GPP (mg C m-2h-1)GPP (mg C m-2h-1)
Dep
th (
m)
0
20
40
60
80
100
Dep
th (
m)
a b dc
gfe
0
20
40
60
80
100
Dep
th (m
)
0
20
40
60
80
10010-5 0,0001 0,001 0,01 0,1 1
GPP (mg C m-2h-1)
10-50,0001 0,001 0,01 0,1 1
GPP (mg C m-2h-1)
0,0001 0,001 0,01 0,1 1
GPP (mg C m-2h-1)10-5
Fig. 6. Distribution of fluorescence (r.u.) (○) and estimated gross primary production (●, GPP; mg C m−2 h−1) with depth at profiles P1 (a), P2 (b), P3 (c), P4 (d), P5 (e), P6 (f) andP7 (g) (nomenclature following Fig. 3, upper panel). Grey line indicates the position of Atlantic–Mediterranean interface. Dotted line marks the position of the 1% of surface irradiance.
34 A. Bartual et al. / Journal of Marine Systems 87 (2011) 25–36
appeared above the new interface between Atlantic andMediterraneanwaters. In a very short time (app. 20 min), this new maximum isdrastically dragged to shallower depths by the internal bore from 70 to20 m. This displacement caused an ascent of the cells associated to thiswater mass through the vertical light gradient (from 1% of maximalincident PAR ambient to 5% maximal incident PAR ambient). Thischange of light environment occursmuch faster than the timenecessaryto alter their photosynthetic apparatus (Lewis et al., 1984) resulting ininvariant photochemical parameters (as F′v/F′morσ′PSII) in the last twovertical profiles (Table 5, SM), and, in fact, F′v/F′m increases (0.344±0.043) compared with that registered for phytoplankton associated toAM or DM (0.130±0.024). F′v/F′m measured for the phytoplanktonassemblage associated to the SM is higher than that obtained forphytoplankton associated to AM or DM, indicating that planktonprobably comes from an area where they are actively growing underfavorable environmental conditions (see Macías et al., 2008, 2009). In
Table 7Gross primary production (GPP) (mg C m−2 h−1) down to 100 m for each profile and conAtlantic maxima; DM: Deepmaxima; CM: coastal maxima. Amplitude considered for each mdown to 100 m associated to Atlantic, Deep or Suction maxima respectively.
Time Profile GPP(mg C m−2 h−1)
GPP GPP GPPAM(mg C m−2 h−1)
GPPDM(mg C
Z1% 5 m
7:05 P1 0.038 0.018 0.005 0.012 09:11 P2 3.24 3.07 2.46 0.512 010:39 P3 3.84 3.54 2.19 0.734 011:15 P4 4.08 3.67 2.19 0.467 0.05612:50 P5 7.60 7.46 5.48 0.579 0.03815:06 P6 2.67 2.02 0.85 0.365 015:23 P7 3.11 2.93 2.12 0 0
fact, the slight increase observed for F′v/F′m ratio when phytoplanktonassociated to this type of maximum ascends from a light limited depth(Figs. 5 and 6) to surface is, probably, a sign of the existence of aphytoplankton assemblage adapted to higher light levels in a shallowersystem, since time scale is too short to observe any photoadaptation.Fluorescence values of the assemblage associated to this maximum,remain as a track of its light history in a time scale of minutes whereneither average fluorescence nor elemental composition of phytoplank-ton can significantly change as a response to the increase in irradiance(Lewis et al., 1984).
4.2. Estimated primary production
FRR fluorometry estimates the absolute rate of in situ gross oxygenevolution from the PSII (Falkowski et al., 1984) as ameasure of the grossprimary production (GPP). As it was pointed out in the methodology
tribution of each maxima and photic zone to the total primary production being: AM:axima as in Table 2. Z 1%: depth limit of photic zone. %AM, %DM, %SM: Percentage of GPP
m−2 h−1)GPPSM(mg C m−2 h−1)
% GPPZ 1% % GPPAM % GPPDM % GPPSM
0 31.58 0 00 94.75 13.58 0 00 92.18 19.11 0 00 89.95 11.45 1.37 00 98.16 7.62 0.50 00.047 75.66 13.67 0 1.760.562 94.21 0 0 18.07
100
101
102
103
104
0
50
100
150
200
PAR
GPP
PA
R su
rfac
e (
μmo
l qu
anta
m-2
s-1
)
GP
P(m
g C
m-2
day
-1 )
0
5
10
15
20
0 1 2 3 4 5 6 7 8
AM
DM
SM
GP
P (
mg
C m
-2 d
ay-1
)
Time Relative (h)P1 P2 P3 P4 P5 P6 P7
Profile
Fig. 7.Upperpanel: Temporal variationof PAR (μmolquanta m−2 s−1) at surface anddailyintegrated gross primary production (GPP; mg C m−2 day−1) estimated by FRRFmeasurement in the sampling site. Lower panel: Temporal variation of the contributionof different chlorophyll maximum identified in the water column to the Daily integratedgrossprimary production for each cast. AM:AtlanticMaximum;DM:DeepMaximum;SM:Suction Maximum. Amplitude for each maximumwas calculated by fitting the F′0 profilesto a Gaussian curve following themodel of Platt et al. (1988) and defined the amplitude ofeach maximum following Bouman et al. (2000) (see Methods for details).
35A. Bartual et al. / Journal of Marine Systems 87 (2011) 25–36
section, two main assumptions have to be accepted to derive primaryproductivity calculations from FRR measurements, first, the number offunctional PSII centres (nPSII) is assumed to be constant, overlooking itslarge natural variability, and second, the ratio of PSII electron transportfor O2 evolution, with a theoretical maximum value of 0.25 mol O2 molelectrons−1. In addition aphotosynthetic quotientof 1.4molO2 evolved(mol CO2 incorporated)−1 has to be considered for the calculation of PPin carbon units from oxygenic values to be compared with 14C valuesobtained by classical incubation methods. The first parameter, createsthe greatest ambiguity in theuseof FRRF to calculate PP giving a range ofvariation of PP calculation up to 33% being taxonomically andenvironmental dependent (Dubinsky et al., 1986). Simultaneousmeasurement of GPP by FRRF and other techniques should be necessaryfor a real quantification of GPP and, in addition, bacterial productivityshould be considered. However, unlike traditional methods of incuba-tion, the daily or depth variation of GPP can be compared, indeed whencalculated by FRRF; and, as a consequenceof its high time resolution, notonly the integratedGPP in thewater column, but also the contributionofdifferent chlorophyll maxima to the integrated GPP can be compared.GPP in the region of the deep chlorophyll maxima often constitutes asubstantial fraction of total depth integrated PP and as it is shown on
Fig. 7, phytoplankton associated to the AM include the main producersof thewater column.GPP associated to thismaximum, always located inthe photic zone, changes along the day following an expectable pattern(Harding et al., 1982) that includes an important decay atmidday (Fig. 7upper plate) directly related with the long exposure to high incidentPAR (Fig. 7). Comparatively, when GPP is integrated for each maximum(Table 7), phytoplankton associated to AM showedmuch higher valuesthan phytoplankton associated to DM or SM during most of the day,although the first 5 m of the water column represented the higherpercentage of the total GPP (Table 7). Vertical displacement of thephytoplankton associated to SM to the photic zone as a consequence ofthe arrival of internal bore, generated a transient pulse of production(Figs. 6 and 7 lower pannel), altering the daily variation of GPP.Generally, all physical processes that alter the water column structurecan affect to the productivity by entering nutrients from depth to theeuphotic zone as, for instance, in the Sargasso Sea where there is amesoscale variation of GPP by eddies (Mouriño-Carballido andMcGuillicuddy, 2006). Our results show a great daily variability ofprimaryproductivity inCamarinal Sill, partially associated to the verticalmixing ofwater columnas a consequence of the presence of the internalundulations. This physical process acts as a pulsating mechanismcontrolling the passage of primary producers through the Strait. Thedaily integrated GPP (GPPint) obtained as the average of GPPint for eachcast was 81.91±53.76 mg C m−2 day−1. This value is in the range ofthat obtained for samples taken in the adjacent Gulf of Cadiz or AlboránSea areas by 14C technique (Navarro et al., 2006; Macías et al., 2009)although GPP turns out to be underestimated by using this lattertechnique. In addition, respiration (total and bacterial) should beconsidered for a correct quantification of Net Primary Production.
The water flow through Gibraltar has been considered tocontribute to the fertility of the adjacent Mediterranean sector byseveral reasons. First, the entering waters become partially mixedwith the richer outflowing waters, thus leading to an additionalsupply of nutrients into the surface of Alboran Sea (Gómez et al.,2000). Also the shoaling of NACW when crossing the Strait is anadditional fertilization mechanism of the Atlantic Jet. Anotherenrichment mechanism is linked to coastal upwelling induced bythe entering of the Atlantic jet in the NW Alboran Sea (Morán andEstrada, 2001). In this work we demonstrate that there is a thirdmechanism, which is not only related with nutrient influx into theeuphotic zone, but with the addition of healthy primary producers tothe Atlantic Jet and can generate transient pulses of GPP as aconsequence of the internal undulations generation in the CamarinalSill region.
Acknowledgements
This work was funded by the Spanish National Research programthrough the projects — CTM2005-08142-CO3-01 and CTM2008-06124. D.M. was supported by a JAE-doc contract (# X0SC000087)funded by the Spanish CSIC. The authors gratefully acknowledge thecrew of B/C Malaspina for helpful collaboration during the cruise. Wethank Bárbara Ubeda for technical assistance with the FRRF duringcampaign. Special thanks to Patricia Estévez-Blanco for her invaluablehelp in tuning FRRF and to LauraPrieto for critical andhelpful commentson the manuscript. We also thank two anonymous reviewers for theircareful revision of the text.
References
Alonso del Rosario, J.J., Bruno Mejías, M., Vázquez Escobar, A., 2003. The influence oftidal hydrodynamic conditions on the generation of lee waves at themain sill of theStrait of Gibraltal. Deep Sea Res. I 50, 1005–1021.
Armi, L., Farmer, D., 1985. The intenal hydraulics of the Strait of Gibraltar and associatedsill and narrows. Oceanol. Acta 8 (1), 37–46.
Bouman, H.A., Platt, T., Kraay, G.W., Sathyendranath, S., Irwin, B.D., 2000. Bio-opticalproperties of the subtropical North Atlantic. 1. Vertical variability. Mar. Ecol. Prog.Ser. 200, 3–18.
36 A. Bartual et al. / Journal of Marine Systems 87 (2011) 25–36
Bruno, M., Alonso, J.J., Cózar, A., Vidal, J., Ruiz-Cañavate, A., Echevarría, F., Ruiz, J., 2002.Thye boiling water phenomena at Camarinal Sill, the strait of Gibraltar. Deep SeaRes. II 46, 4097–4113.
Bryan, J.R., Riley, J.P., William, P.J., 1976. A winkler procedure for making measurementsof oxygen concentration for productivity and related studies. J. Exp. Mar. Biol. Ecol.21, 191–197.
Cullen, J.J., Franks, P.J.S., Karl, D.M., Longhurst, A., 2002. Physical influences on marineecosystem dynamics. In: Robinson, A.R., McCarthy, J.J., Rothschild, B.J. (Eds.), The Sea:Biological–Physical Interactions in the Ocean. JohnWiley and Sons, pp. 297–335.
Dubinsky, Z., Falkowski, P.G., Wyman, K., 1986. Light harvesting and utilization byphytoplankton. Plant Cell Physiol. 27 (7), 1335–1349.
Echevarria, F., García-Lafuente, J., Bruno, M., Gorsky, G., Goutx, M., González, N., García,C.M., Gómez, F., Vargas, J.M., Picheral, M., Striby, L., Varela, M., Alonso, J.J., Reul, A.,Cózar, A., Prieto, L., Sarhan, T., Plaza, F., Jiménez-Gómez, F., 2002. Physical–biological coupling in the Strait of Gibraltar. Deep-Sea Res. II 49 (19), 4115–4130.
Estévez-Blanco, P., Cermeño, P., Espiñeira, M., Fernández, E., 2006. Phytoplanktonphotosynthetic efficiency and primary production rates estimated from FastRepetition Rate Fluorometry (FRRF) at coastal embayments affected by upwelling(Rías Baixas; NW of Spain). J. Plank. Res. 28 (12), 1153–1165.
Falkowski, P.G., Dubinsky, Z., Muscatine, L., Porter, J.W., 1984. Light and thebioenergetics of a symbiotic coral. Bioscience 34, 705–709.
Falkowski, P.G., Kolber, Z.S., 1995. Variations in chlorophyll fluorescence yields inphytoplankton in the world oceans. Austr. J. Plant Physiol. 22, 341–355.
García-Lafuente, J., Vargas, J.M., 2003. Recent observations of the exchange flowsthrough the Strait of Gibraltar and their fluctuations at different time scales. RecentRes. Dev. Geophys. 5, 73–84.
García-Lafuente, J., Vargas, J.M., Plaza, F., Sarhan, T., 2000. Tide at the Eastern section ofthe Strait of Gibraltar. J. Geophys. Res. 105 (C6), 14197–14213.
Gascard, J.C., Richez, C., 1985. Water masses and circulation in the western Alboran Seaand in the Straits of Gibraltar. Progr. Oceanogr. 15, 157–216.
Gómez, F., Echevarría, F., García, C.M., Prieto, L., Ruíz, J., Reul, A., Jiménez-Gómez, F.,Varela, M., 2000. Microplankton distribution in the Strait of Gibraltar: couplingbetween organism and hydrodinamics structures. J. Plankton Res. 22 (4), 603–617.
Gómez, F., Gorsky, G., García-Górriz, E., Picheral, M., 2004. Control of the phytoplanktondistribution in the Strait of Gibraltar by wind and fortnightly tides. Est. Coast. ShelfSci. 59, 485–497.
Gorbunov, M.Y., Falkowski, P.G., Kolber, Z.S., 2000. Measurements of photosyntheticparameters in benthic organisms in situ using a SCUBA-based fast repetition rateFluorometer. Limnol. Oceanogr. 45, 242–245.
Gorbunov, M.Y., Kolber, Z.S., Lesser, M.P., Falkowski, P.G., 2001. Photosynthesis andphotoprotection in symbiotic corals. Limnol. Oceanogr. 46, 75–85.
Grande, K.D., Williams, P.J., le, B., Marra, J., Purdie, D.A., Heinemann, K., Eppley, R.W.,Bender, M.L., 1989. Primary production in the North Pacific gyre: a comparison ofrates determined by the 14C, O2 concentration and 18O methods. Deep-Sea Res. 36,1621–1634.
Grasshoff, K., Ehrhardt, M., Kremling, K., 1983. Methods of seawater analysis. Verlag Chemie Weinheim, New York.
Harding Jr., L.W., Prézelin, B.B., Sweeney, B.M., Cox, J.L., 1982. Diel oscillations of thephotosynthesis-irradiance (P–I) relationship in natural assemblages of phyto-plankton. Mar. Biol. 61, 91–105.
Holm-Hassen, O., Lorenzen, C.J., Homes, R.W., Strickland, J.D.H., 1965. Fluorometricdetermination of chlorophyll. J. Conseil Int.'Exploration Mer 187, 9–18.
Izquierdo, A., Tejedor, L., Sein, D.V., Backhaus, J.O., Brandt, P., Rubino, A., Kagan, B.A.,2001. Control variability and internal bore evolution in the Strait of Gibraltar: a 2-Dtwo layer model study. Est. Coast. Shelf Sci. 53, 637–651.
Koblízek, M., Kaftan, D., Nedbal, L., 2001. On the relationship between the non-photochemical quenching of the chlorophyll fluorescence and the Photosystem IIlight harvesting efficiency. A repetitive flash fluorescence induction study. Photos.Res. 68, 141–145.
Kolber, Z.S., Falkowski, P.G., 1993. Use of active fluorescence to estimate phytoplanktonphotosynthesis in situ. Limnol. Oceanogr. 38, 1646–1665.
Kolber, Z.S., Prásil, O., Falkowski, P.G., 1998. Measurements of variable chlorophyllfluorescence using fast repetition rate techniques: defining methodology andexperimental protocols. Biochim. Biophys. Acta 1367, 88–106.
La Violette, P.E., Arnone, R.A., 1988. A tide-generated internal waveform in the westernapproaches to the Strait of Gibraltar. J. Geophys. Res. 93 (C12), 15653–15667.
Lewis, M.R., Cullen, J.J., Platt, T., 1984. Relationships between vertical mixing andphotoadaptationofphytoplankton: similarity criteria.Mar. Ecol. Prog. Ser. 15, 141–149.
Macías, D., García, C.M., Echevarría, F., Vázquez-Escobar, A., Bruno, M., 2006. Tidalinduced variability of mixing processes on Camarinal Sill (Strait of Gibraltar). Apulsating event. J. Mar. Syst. 60, 177–192.
Macías, D., Martin, A.P., García Lafuente, J., García, C.M., Yool, A., Bruno, M., Vázquez, A.,Izquierdo, A., Sein, D., Echevarría, F., 2007. Mixing and biogeochemical effects inducedby tides on the Atlantic–Mediterranean flow in the Strait of Gibraltar. An analysisthrough a physical–biological coupled model. Prog. Oceanogr. 74, 252–272.
Macías, D., Lubian, L.M., Echevarría, F., Huertas, E., García, C.M., 2008. Chlorophyllmaxima and water mass interfaces: tidally induced dynamics in the Strait ofGibraltar. Deep Sea Res. I 55, 832–846.
Macías, D., Navarro, G., Bartual, A., Echevarría, F., Huertas, I.E., 2009. Primary production inthe Strait of Gibraltar: carbon fixation rates in relation to hydrodynamic andphytoplankton dynamics. Estuar. Coast. Shelf Sci. 83 (2), 197–210.
Macías, D., Somavilla, R., González-Gordillo, J.I., Echevarría, F., 2010. Physical control ofzooplancton distribution at the Strait of Gibraltar during an episode of internalwave generation. Mar. Ecol. Prog. Ser. 408, 79–95.
Marañón, E., Holligan, P., 1999. Photosynthetic parameters of phytoplankton from 50°Nto 50°S in the Atlantic Ocean. Mar. Ecol. Prog. Ser. 176, 191–203.
Moore, C.M., Suggett, D.J., Holligan, P.M., Sharples, J., Lucas, M.I., Rippeth, T.P., Fisher, N.R.,Simpson, J.H., Hydes, D., 2003. Physical controls on phytoplankton physiology andproduction at a shelf sea front: an FRRF-based field study. Mar. Ecol. Prog. Ser. 259,29–45.
Moore, C.M., Lucas, M.I., Sanders, R., Davidson, R., 2005. Basinscale variability ofphytoplankton bio-optical characteristics in relation to bloom state and communitystructure in the Northeast Atlantic. Deep Sea Res. I 52, 401–419.
Moore, C.M., Suggett, D.J., Hickman, A.E., Kim, Y.N., et al., 2006. Phytoplanktonphotoacclimation and photoadaptation in response to environmental gradients in ashelf sea. Limnol. Oceanogr. 51, 936–949.
Morán, X.A., Estrada, M., 2001. Short-term variability of photosynthetic parameters andparticulate and disolved primary production in the Alboran Sea (SW Mediterra-nean). Mar. Ecol. Prog. Ser. 212, 53–67.
Mouriño-Carballido, B., McGuillicuddy, D.J., 2006. Mesoscale variability in themetabolicbalance of the Sargasso Sea. Limnol. Oceanogr. 51 (6), 2675–2689.
Navarro, G., Ruiz, J., 2006. Spatial and temporal variability of phytoplankton in the Gulfof Cádiz through remote sensing images. Deep Sea Res. II 53, 1241–1260.
Navarro, G., Ruiz, J., Huertas, I.E., García, C.M., Criado-Aldeanueva, F., Echevarría, F.,2006. Basin-scale structures governing the position of the subsurface chlorophyllmaximum in the gulf of Cádiz. Deep-Sea Res. II 53, 1261–1281.
Platt, T., Sathyendranath, S., Caverhill, C.M., Lewis, M.R., 1988. Ocea primary productionand available light: further algorithms for remote sensing. Deep-Sea Res. 35 (6),855–879.
Raateoja, M., Seppälä, J., Ylöstalo, P., 2004. Fast repetition rate fluorometry is notapplicable to studies of filamentous cyanobacteria from the Baltic Sea. Limnol.Oceanogr. 49, 1006–1012.
Smith, T.J., Pemberton, K.J., Aiken, J., Geider, R.J., 2004. A methodology to determineprimary production and phytoplankton photosynthetic parameters from FastRepetition Rate Fluorometry. J. Plank. Res. 26, 1337–1350.
Steeman-Nielsen, E., 1952. The use of radiactive carbon (C14) for measuring organicproduction in the sea. J. Cons. Int. Explor. Mer. 117–140.
Suggett, D., MacIntyre, H.L., Geider, R.J., 2004. Evaluation of biophysical and opticaldeterminations of light absorption by photosystem II in phytoplankton. Limnol.Oceangr. Methods 2, 316–332.
Suggett, D., Kraay, G., Holligan, P.M., Davey, M., Aiken, J., Geider, R.J., 2001. Assessmentof photosynthesis in a spring cyanobacterial bloom using a fast repetition ratefluorometer. Limnol. Oceangr. 46, 802–810.
Suggett, D.J., Oxborough, K., Baker, N.R., MacIntyre, H.L., Kana, T.M., Geider, R.J., 2003.Fast repetition rate and pulse amplitude modulation chlorophyll a fluorescencemeasurements for assessment of photosynthetic electron transport in marinephytoplankton. Eur. J. Phycol. 38, 371–384.
Suggett, D.J., Moore, C.M., Marañón, E., Omachi, C., Varela, R.A., Aiken, J., Holligan, P.M.,2006. Photosynthetic electron turnover in the tropical and subtropical AtlanticOcean. Deep Sea Res. II 53, 1573–1592.
Suggett, D.J., Moore, C.M., Hickman, A.E., Geider, R.J., 2009. Interpretation of fastrepetition rate (FRR) fluorescence: signatures of phytoplankton communitystructure versus physiological state. Mar. Ecol. Prog. Ser. 376, 1–19.
Vázquez, A., Flecha, S., Bruno, M., Macías, D., Navarro, G., 2009. Internal waves andshort-scale distribution patterns of chlorophyll in the Strait of Gibraltar andAlborán Sea. Geophys. Res. Lett. 36. doi:10.1029/2009GL040959.
Wesson, J.C., Gregg, M.C., 1994. Mixing at Camarinal Sill in the Strait of Gibraltar.J. Geophys. Res. 99 (C5), 9847–9878.
Yamada, K., Ishizaka, J., 2006. Estimation of interdecanal change of spring bloom timing,in the case of Japan Sea. Geophys. Res. Lett. 33, 1–4.
Yentsch, C.S., Yentsch, C.M., Phynney, D.A., Lapointe, B.E., Yentsch, F.W., 2004. Theodyssey of new production. J. Exp. Mar. Biol. Ecol. 300, 15–30.