transcriptional response to glucose starvation and functional analysis of a glucose transporter of...
TRANSCRIPT
www.elsevier.com/locate/yfgbi
Fungal Genetics and Biology 41 (2004) 1104–1119
Transcriptional response to glucose starvation and functionalanalysis of a glucose transporter of Neurospora crassa
Xin Xiea, Heather H. Wilkinsona, Alejandro Correab, Zachary A. Lewisb,Deborah Bell-Pedersenb, Daniel J. Ebbolea,*
a Program for the Biology of Filamentous Fungi, Department of Plant Pathology and Microbiology, Texas A & M University,
College Station, TX 77843, United Statesb Program for the Biology of Filamentous Fungi, Department of Biology, Texas A & M University, College Station, TX 77843, United States
Received 6 July 2004; accepted 27 August 2004
Abstract
The response to glucose availability in Neurospora crassa was characterized by measuring transcript levels of 1335 genes repre-sented on a cDNA microarray. We found that 19% of the 1335 genes were regulated at least twofold in response to glucose depri-vation. Several sugar transporter homologs were found to be regulated by glucose. Functional analysis of one of these, hgt-1,indicates that it encodes a high-affinity glucose transporter. Comparing N. crassa profiling data with the published diauxic shift datafrom Saccharomyces cerevisiae revealed that the two fungi share similar, but not identical, transcriptional response patterns. Reg-ulation of transcript levels measured by microarray analysis is consistent with previous measurements of central metabolism enzymeactivities for N. crassa. Transcripts of genes for ethanol fermentation and the tricarboxylic acid cycle are abundant in glucose-richmedium, consistent with N. crassa carrying out a high rate of both fermentation and respiration simultaneously.� 2004 Elsevier Inc. All rights reserved.
Index Descriptors: Sugar transport; Glycolysis; Gluconeogenesis; TCA cycle; Ethanol; Microarray
1. Introduction
Glucose regulation of gene expression and metabo-lism has been extensively studied in Saccharomyces cere-
visiae but is less well characterized in filamentous fungi.Neurospora crassa flourishes as a pioneer species, rapidlycolonizing plant material following fires. Given thisniche difference with respect to S. cerevisiae and typicalsoil saprophytes, N. crassa, might employ unique strat-egies for carbon assimilation and glucose regulation ofgene expression. Furthermore, glucose regulation ofdevelopmental processes may be more complex in anorganism with multicellular development, such as N.
1087-1845/$ - see front matter � 2004 Elsevier Inc. All rights reserved.
doi:10.1016/j.fgb.2004.08.009
* Corresponding author. Fax: +1 979 845 6483.E-mail address: [email protected] (D.J. Ebbole).
crassa (Springer, 1993). In N. crassa, glucose starvationinduces asexual sporulation (conidiation), and mutationof a putative glucose sensor, RCO-3, leads to conidia-tion in glucose-rich liquid cultures (Madi et al., 1997).This is a phenotype observed for adenylate cyclase(cr-1) and G-alpha subunit (gna-3) mutants (Iveyet al., 2002; Kays et al., 2000) and is consistent with arole for glucose sensing in regulation of cAMP levels.Glucose limitation also promotes sexual development(Ricci et al., 1991), although a molecular basis for thiseffect is unknown. Transcriptional profiling of N. crassa
genes in response to glucose starvation may identifypotential regulators of these developmental processes.
In S. cerevisiae, there are two major strategies forATP generation from glucose. Glucose utilizationthrough the TCA cycle and respiration proceeds at alow rate with a high yield of ATP, whereas ethanolic
X. Xie et al. / Fungal Genetics and Biology 41 (2004) 1104–1119 1105
fermentation operates at a higher rate but with lowerATP production. S. cerevisiae is capable of anaerobicfermentation and, when glucose is abundant, it preferen-tially carries out fermentation and represses the TCA cy-cle/respiration to a relatively low level. Since N. crassa isan obligate aerobe, the strategy for regulating fluxthrough fermentation vs the TCA cycle may differ fromS. cerevisiae. Recent studies indicate that filamentousfungi, such as Trichoderma reesei (Chambergo et al.,2002) and Aspergillus nidulans (Kelly et al., 1990; Loc-kington et al., 1997), exploit glucose primarily throughrespiration with very low levels of fermentation. In con-trast, N. crassa has been reported to ferment glucose toethanol at an appreciable rate in aerobic culture, andethanol accumulation is proportional to the initial glu-cose concentration (Colvin et al., 1973). Microarrayanalysis represents an important step in evaluatingwhether N. crassa will provide a useful model systemto explore bioethanol production in a filamentous fun-gus that has evolved to efficiently exploit lignocellulosicplant substrates.
Two glucose transport systems have been character-ized inN. crassa, a constitutive low-affinity transport sys-tem and a glucose-repressible high-affinity transportsystem (Scarborough, 1970; Schneider and Wiley, 1971).Thirty-three hexose transporter homologs have beenidentified in the N. crassa genome sequence, representingone of the largest multigene families (Galagan et al.,2003). Phylogenetic analyses indicate that the relation-ship between S. cerevisiae and N. crassa hexose trans-porter paralogs is poor and no clear orthologs forcomparison of gene expression are present (Galaganet al., 2003). Since homologywill not define function (sub-strate or affinity) it is necessary to define the role of eachtranporter by mutational analysis. Toward this end, wehave characterized one such transporter (NCU10021)identified as glucose-regulated by microarray analysis.
2. Materials and methods
2.1. Strains and growth conditions
Strain 74OR23-1A (FGSC 2489) was obtained fromthe Fungal Genetics Stock Center (http://www.fgsc.net/). Conidia from 6-day-old 50 ml agar cul-tures were collected with sterile water by filtrationthrough Miracloth (Calbiochem). Conidia were countedusing a haemocytometer (Hausser Scientific) and inocu-lated at 106 conidia/ml into 50 ml liquid minimal med-ium (Davis and De Serres, 1970) containing 2%peptone and 2% glucose. Cultures were grown for 17–18 h on a rotary shaker (200 rpm) at 34 �C with constantillumination. The mycelium was harvested by vacuumfiltration on sterile Whatman filter paper and dividedinto halves with a sterile razor blade. The halves of each
harvested culture were inoculated in parallel into 50 mlfresh 2% glucose-supplemented minimal medium (glu-cose repression) or without glucose (glucose starvation).Parallel cultures supplemented with 2% peptone wereprepared for Northern blot experiments. The inoculatedflasks were incubated at 34 �C for 2 h with shaking(200 rpm). Cultures were harvested by filtration and fro-zen in liquid nitrogen prior to RNA extraction. Inocula-tion or harvesting conditions, as well as subtle variationin any parameter in independent cultures, might affectgene expression independently of glucose concentration.To reduce the variation arising within an individualgrowth experiment for microarray analysis, five inde-pendent cultures were grown and combined for mRNAextraction.
2.2. Nucleic acid isolation, hybridization, and sequencing
Genomic DNA isolation, RNA extraction, andNorthern blot hybridization were performed as de-scribed (Madi et al., 1997). mRNA was isolated from to-tal RNA using the polyATtract mRNA isolation systemIV kit (Promega). DNA probes for glucose transporterhomologs NCU10021 (cDNA SP1A4) and NCU06358(cDNA NP4E6), and phosphoenoylpyruvate carboxy-kinase NCU09873 (cDNA NM5C3), were obtainedfrom the corresponding sequence-verified EST clonesby PCR. Probes for actin and grg-1 were amplified fromgenomic DNA using gene-specific primers (Bailey andEbbole, 1998). Hybridization with an rDNA probewas used as a loading control for Northern blots.Sequencing of cDNA clones was performed using thePrism dideoxy sequencing kit (Applied Biosystem) withT3 and T7 primers.
2.3. Microarray construction and hybridization
The cDNA microarrays used were produced as de-scribed previously (Lewis et al., 2002). Briefly, EST li-braries representing different stages of the N. crassa lifecycle (germinated conidia, mycelia, and perithecia) wereprovided by the Neurospora genome project at the Uni-versity ofNewMexico (Nelson et al., 1997). EST sequencecontigs were assembled from the N. crassa ESTs usingSTACKPACK software (Electric Genetics Pty). ESTsfrom 1764 contigs were chosen to construct the micro-array. To define the number of unique genes, BLASTanalysis of the EST sequences against the N. crassa gen-ome sequence (Galagan et al., 2003) was performed.
The two-channel (Cy3 and Cy5) labeling system,which allows simultaneous comparison of gene expres-sion patterns between two samples (DeRisi et al.,1997), was used. mRNA (300 ng) derived from glu-cose-containing and glucose-starved cultures was reversetranscribed and hybridized to the microarray followingthe two step protocol from 3DNA Submicro EX
1106 X. Xie et al. / Fungal Genetics and Biology 41 (2004) 1104–1119
Expression Array Detection Kit (Genisphere). Briefly,the oligonucleotide used to prime the first strand cDNAsynthesis of the RNA samples contains a universal se-quence that will hybridize to the dendrimer. In the firststep, the cDNA was hybridized to the DNA probesspotted on the microarray. In the second step, the den-drimer that is conjugated to approximately 200 fluores-cent dye molecules (cy3 or cy5) was hybridized to thebound cDNA. Images were obtained using an Affyma-trix 426 Array Scanner (Affymatrix). To adjust forphotobleaching of the fluorescent dyes, the scanner laserpower, and photo-multiplier tube settings were adjustedto balance the signals in the two channels. The images ofeach channel were analyzed using ScanAlyze (http://rana.lbl.gov/EisenSoftware.html) to obtain raw signalintensities for each spot (Lewis et al., 2002).
2.4. Expression data analysis
Eight data points per gene (duplicate spots on each offour independent arrays) were taken. We used a two-sample experimental design including dye-swap repli-cates. Two of the four replicates involved cDNA fromcells grown in glucose-rich medium labeled with Cy3,and cDNA from cells starved for glucose labeled withCy5. To assess dye bias effects, two additional replicateexperiments were performed in which the fluorescentdyes were switched in the labeling process (dye swap).The data files for these microarray experiments are avail-able at (http://plpa2linux.tamu.edu/Microarray.html).Prior to characterization using the three statistical pack-ages described below, the background value for eachspot was subtracted from the raw intensity value.
Genespring 6.0 (Silicon Genetics) was used to visuallyinspect the data and to generate the average normalizedexpression values. The per spot and per chip intensitydependent (Lowess) normalization was used with the de-fault settings. Student�s t tests were performed to deter-mine if the mean normalized expression values weresignificantly different from 1.0. These t tests were calcu-lated with the Benjamini and Hochberg false discoveryrate multiple testing correction and the correspondingp values are reported in Tables 1–5. Since measurementswith higher control strengths tend to be more precisethan those with lower control strength, the cross-gene er-ror model in GeneSpring calculates a cutoff controlintensity value for reliable data. This calculation is basedon plotting the standard deviation of the normalized val-ues against control intensity values and selecting the con-trol value at which the curve becomes level. Duplicateexperiments were analyzed and reproducibility of repli-cate arrays was assessed using an experiment tree analy-sis in which the correlation coefficient of each gene acrossthe set of experiments was quantified to build a tree.
MARAN, an analysis of variance (ANOVA) basedmicroarray analysis approach (Engelen et al., 2003),
was also used to analyze the data. The advantage ofusing this web-based tool includes the ability to assessthe contribution of a variety of factors (dye, array,arrayXdye, gene, and expression) to the variation inthe entire dataset. Furthermore, the residuals from theANOVA model are appropriate for discerning the sub-set of genes with significantly changed expression.Briefly, the background subtracted raw intensity valueswere log transformed and normalized using the Lowessnormalization procedure available with the package.Next, the normalized data were analyzed using the AN-OVA model and filtered based on the normal error dis-tributions assumption option with a preferred alphasignificance value cutoff of p = 0.05. The highly conser-vative Bonferroni correction for multiple testing is auto-matically applied with this filtering step.
Statistical analysis of microarrays (SAM) was alsoused to identify differentially expressed genes (Tusheret al., 2001) (http://www-stat.stanford.edu/~tibs/SAM/).SAM identifies genes that exhibit significant differencesin expression based on gene specific t tests. For eachgene, changes in expression are scored relative to thestandard deviation of repeated measurements for thatgene. Genes with scores greater than a user definedthreshold are potentially significant. To reduce the num-ber of genes deemed significant by chance alone, SAMuses permutation to estimate the false discovery rate.Random datasets are generated from random samplingof the data available for all replicates of a gene underboth experimental conditions. Due to the random sam-pling these new datasets represent an outcome whereeach gene is not differentially expressed. Instead ofassigning a p value using a standard t test, differentiallyexpressed genes are identified by comparing the rankingof the observed values for genes to the expected valuesgenerated in the permutation analysis. The majoradvantage of SAM is that permutation compensatesfor the relatively low numbers of replicates in micro-array experiments, and the approach does not requirea correction for multiple comparisons. The Lowess nor-malized dataset generated by MARAN was downloadedand transferred to an Excel file with the SAM macroadd-on applied. Since the MARAN normalization gavevalues for both the control and the treatment, we usedthe paired data test with the row average imputer for1000 permutations.
2.5. Sugar uptake experiments
Sugar transport assays were performed as describedpreviously (Allen et al., 1989). Strains were cultured asdescribed above to obtain glucose repressed and dere-pressed cells. The sugar transport experiments were ini-tiated by adding DD-[U-14C]glucose (Amersham LifeScience) to 125 ml flasks containing 10 ml minimal saltswith either 0.25, or 40 mM glucose. A 10 ll aliquot of
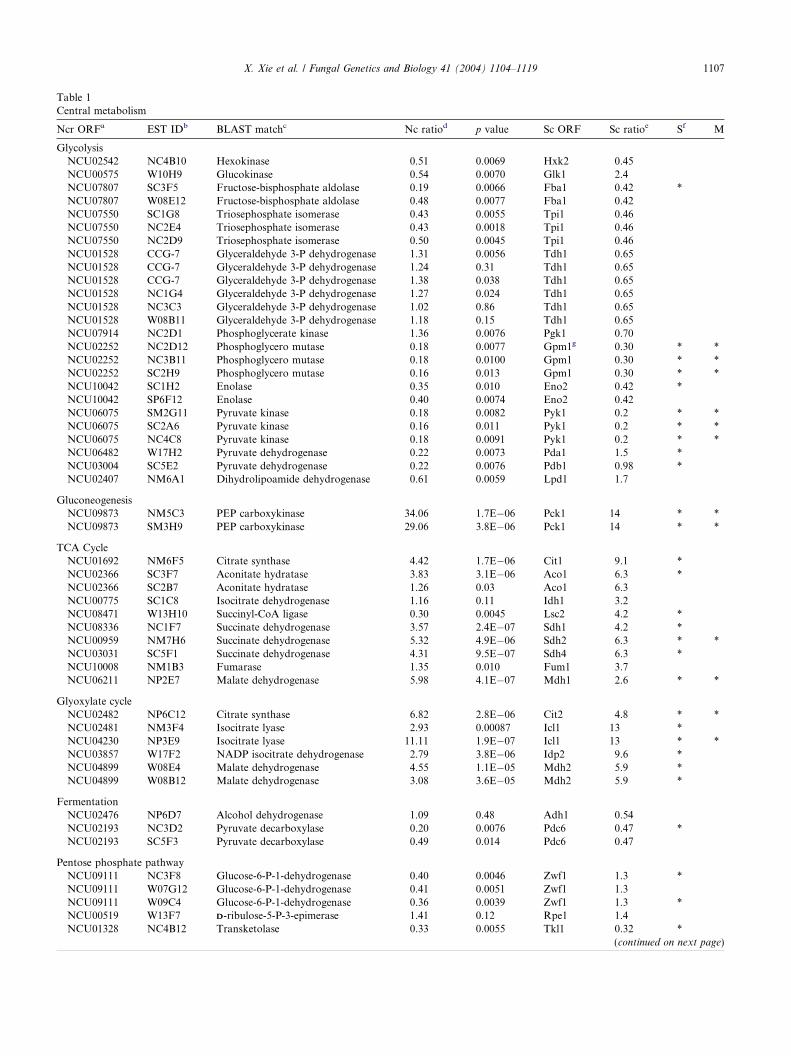
Table 1Central metabolism
Ncr ORFa EST IDb BLAST matchc Nc ratiod p value Sc ORF Sc ratioe Sf M
GlycolysisNCU02542 NC4B10 Hexokinase 0.51 0.0069 Hxk2 0.45NCU00575 W10H9 Glucokinase 0.54 0.0070 Glk1 2.4NCU07807 SC3F5 Fructose-bisphosphate aldolase 0.19 0.0066 Fba1 0.42 *NCU07807 W08E12 Fructose-bisphosphate aldolase 0.48 0.0077 Fba1 0.42NCU07550 SC1G8 Triosephosphate isomerase 0.43 0.0055 Tpi1 0.46NCU07550 NC2E4 Triosephosphate isomerase 0.43 0.0018 Tpi1 0.46NCU07550 NC2D9 Triosephosphate isomerase 0.50 0.0045 Tpi1 0.46NCU01528 CCG-7 Glyceraldehyde 3-P dehydrogenase 1.31 0.0056 Tdh1 0.65NCU01528 CCG-7 Glyceraldehyde 3-P dehydrogenase 1.24 0.31 Tdh1 0.65NCU01528 CCG-7 Glyceraldehyde 3-P dehydrogenase 1.38 0.038 Tdh1 0.65NCU01528 NC1G4 Glyceraldehyde 3-P dehydrogenase 1.27 0.024 Tdh1 0.65NCU01528 NC3C3 Glyceraldehyde 3-P dehydrogenase 1.02 0.86 Tdh1 0.65NCU01528 W08B11 Glyceraldehyde 3-P dehydrogenase 1.18 0.15 Tdh1 0.65NCU07914 NC2D1 Phosphoglycerate kinase 1.36 0.0076 Pgk1 0.70NCU02252 NC2D12 Phosphoglycero mutase 0.18 0.0077 Gpm1g 0.30 * *NCU02252 NC3B11 Phosphoglycero mutase 0.18 0.0100 Gpm1 0.30 * *NCU02252 SC2H9 Phosphoglycero mutase 0.16 0.013 Gpm1 0.30 * *NCU10042 SC1H2 Enolase 0.35 0.010 Eno2 0.42 *NCU10042 SP6F12 Enolase 0.40 0.0074 Eno2 0.42NCU06075 SM2G11 Pyruvate kinase 0.18 0.0082 Pyk1 0.2 * *NCU06075 SC2A6 Pyruvate kinase 0.16 0.011 Pyk1 0.2 * *NCU06075 NC4C8 Pyruvate kinase 0.18 0.0091 Pyk1 0.2 * *NCU06482 W17H2 Pyruvate dehydrogenase 0.22 0.0073 Pda1 1.5 *NCU03004 SC5E2 Pyruvate dehydrogenase 0.22 0.0076 Pdb1 0.98 *NCU02407 NM6A1 Dihydrolipoamide dehydrogenase 0.61 0.0059 Lpd1 1.7
GluconeogenesisNCU09873 NM5C3 PEP carboxykinase 34.06 1.7E�06 Pck1 14 * *NCU09873 SM3H9 PEP carboxykinase 29.06 3.8E�06 Pck1 14 * *
TCA CycleNCU01692 NM6F5 Citrate synthase 4.42 1.7E�06 Cit1 9.1 *NCU02366 SC3F7 Aconitate hydratase 3.83 3.1E�06 Aco1 6.3 *NCU02366 SC2B7 Aconitate hydratase 1.26 0.03 Aco1 6.3NCU00775 SC1C8 Isocitrate dehydrogenase 1.16 0.11 Idh1 3.2NCU08471 W13H10 Succinyl-CoA ligase 0.30 0.0045 Lsc2 4.2 *NCU08336 NC1F7 Succinate dehydrogenase 3.57 2.4E�07 Sdh1 4.2 *NCU00959 NM7H6 Succinate dehydrogenase 5.32 4.9E�06 Sdh2 6.3 * *NCU03031 SC5F1 Succinate dehydrogenase 4.31 9.5E�07 Sdh4 6.3 *NCU10008 NM1B3 Fumarase 1.35 0.010 Fum1 3.7NCU06211 NP2E7 Malate dehydrogenase 5.98 4.1E�07 Mdh1 2.6 * *
Glyoxylate cycleNCU02482 NP6C12 Citrate synthase 6.82 2.8E�06 Cit2 4.8 * *NCU02481 NM3F4 Isocitrate lyase 2.93 0.00087 Icl1 13 *NCU04230 NP3E9 Isocitrate lyase 11.11 1.9E�07 Icl1 13 * *NCU03857 W17F2 NADP isocitrate dehydrogenase 2.79 3.8E�06 Idp2 9.6 *NCU04899 W08E4 Malate dehydrogenase 4.55 1.1E�05 Mdh2 5.9 *NCU04899 W08B12 Malate dehydrogenase 3.08 3.6E�05 Mdh2 5.9 *
FermentationNCU02476 NP6D7 Alcohol dehydrogenase 1.09 0.48 Adh1 0.54NCU02193 NC3D2 Pyruvate decarboxylase 0.20 0.0076 Pdc6 0.47 *NCU02193 SC5F3 Pyruvate decarboxylase 0.49 0.014 Pdc6 0.47
Pentose phosphate pathwayNCU09111 NC3F8 Glucose-6-P-1-dehydrogenase 0.40 0.0046 Zwf1 1.3 *NCU09111 W07G12 Glucose-6-P-1-dehydrogenase 0.41 0.0051 Zwf1 1.3NCU09111 W09C4 Glucose-6-P-1-dehydrogenase 0.36 0.0039 Zwf1 1.3 *NCU00519 W13F7 DD-ribulose-5-P-3-epimerase 1.41 0.12 Rpe1 1.4NCU01328 NC4B12 Transketolase 0.33 0.0055 Tkl1 0.32 *
(continued on next page)
X. Xie et al. / Fungal Genetics and Biology 41 (2004) 1104–1119 1107
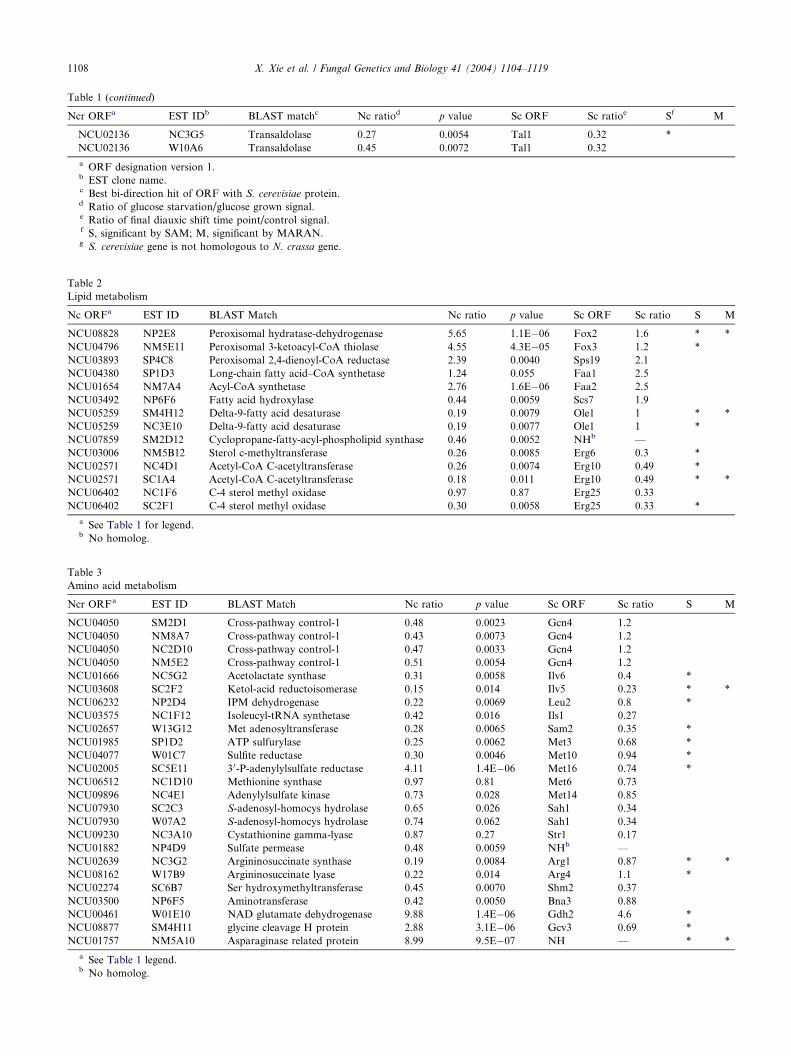
Table 1 (continued)
Ncr ORFa EST IDb BLAST matchc Nc ratiod p value Sc ORF Sc ratioe Sf M
NCU02136 NC3G5 Transaldolase 0.27 0.0054 Tal1 0.32 *NCU02136 W10A6 Transaldolase 0.45 0.0072 Tal1 0.32
a ORF designation version 1.b EST clone name.c Best bi-direction hit of ORF with S. cerevisiae protein.d Ratio of glucose starvation/glucose grown signal.e Ratio of final diauxic shift time point/control signal.f S, significant by SAM; M, significant by MARAN.g S. cerevisiae gene is not homologous to N. crassa gene.
Table 2Lipid metabolism
Nc ORFa EST ID BLAST Match Nc ratio p value Sc ORF Sc ratio S M
NCU08828 NP2E8 Peroxisomal hydratase-dehydrogenase 5.65 1.1E�06 Fox2 1.6 * *NCU04796 NM5E11 Peroxisomal 3-ketoacyl-CoA thiolase 4.55 4.3E�05 Fox3 1.2 *NCU03893 SP4C8 Peroxisomal 2,4-dienoyl-CoA reductase 2.39 0.0040 Sps19 2.1NCU04380 SP1D3 Long-chain fatty acid–CoA synthetase 1.24 0.055 Faa1 2.5NCU01654 NM7A4 Acyl-CoA synthetase 2.76 1.6E�06 Faa2 2.5NCU03492 NP6F6 Fatty acid hydroxylase 0.44 0.0059 Scs7 1.9NCU05259 SM4H12 Delta-9-fatty acid desaturase 0.19 0.0079 Ole1 1 * *NCU05259 NC3E10 Delta-9-fatty acid desaturase 0.19 0.0077 Ole1 1 *NCU07859 SM2D12 Cyclopropane-fatty-acyl-phospholipid synthase 0.46 0.0052 NHb —NCU03006 NM5B12 Sterol c-methyltransferase 0.26 0.0085 Erg6 0.3 *NCU02571 NC4D1 Acetyl-CoA C-acetyltransferase 0.26 0.0074 Erg10 0.49 *NCU02571 SC1A4 Acetyl-CoA C-acetyltransferase 0.18 0.011 Erg10 0.49 * *NCU06402 NC1F6 C-4 sterol methyl oxidase 0.97 0.87 Erg25 0.33NCU06402 SC2F1 C-4 sterol methyl oxidase 0.30 0.0058 Erg25 0.33 *
a See Table 1 for legend.b No homolog.
Table 3Amino acid metabolism
Ncr ORFa EST ID BLAST Match Nc ratio p value Sc ORF Sc ratio S M
NCU04050 SM2D1 Cross-pathway control-1 0.48 0.0023 Gcn4 1.2NCU04050 NM8A7 Cross-pathway control-1 0.43 0.0073 Gcn4 1.2NCU04050 NC2D10 Cross-pathway control-1 0.47 0.0033 Gcn4 1.2NCU04050 NM5E2 Cross-pathway control-1 0.51 0.0054 Gcn4 1.2NCU01666 NC5G2 Acetolactate synthase 0.31 0.0058 Ilv6 0.4 *NCU03608 SC2F2 Ketol-acid reductoisomerase 0.15 0.014 Ilv5 0.23 * *NCU06232 NP2D4 IPM dehydrogenase 0.22 0.0069 Leu2 0.8 *NCU03575 NC1F12 Isoleucyl-tRNA synthetase 0.42 0.016 Ils1 0.27NCU02657 W13G12 Met adenosyltransferase 0.28 0.0065 Sam2 0.35 *NCU01985 SP1D2 ATP sulfurylase 0.25 0.0062 Met3 0.68 *NCU04077 W01C7 Sulfite reductase 0.30 0.0046 Met10 0.94 *NCU02005 SC5E11 30-P-adenylylsulfate reductase 4.11 1.4E�06 Met16 0.74 *NCU06512 NC1D10 Methionine synthase 0.97 0.81 Met6 0.73NCU09896 NC4E1 Adenylylsulfate kinase 0.73 0.028 Met14 0.85NCU07930 SC2C3 S-adenosyl-homocys hydrolase 0.65 0.026 Sah1 0.34NCU07930 W07A2 S-adenosyl-homocys hydrolase 0.74 0.062 Sah1 0.34NCU09230 NC3A10 Cystathionine gamma-lyase 0.87 0.27 Str1 0.17NCU01882 NP4D9 Sulfate permease 0.48 0.0059 NHb —NCU02639 NC3G2 Argininosuccinate synthase 0.19 0.0084 Arg1 0.87 * *NCU08162 W17B9 Argininosuccinate lyase 0.22 0.014 Arg4 1.1 *NCU02274 SC6B7 Ser hydroxymethyltransferase 0.45 0.0070 Shm2 0.37NCU03500 NP6F5 Aminotransferase 0.42 0.0050 Bna3 0.88NCU00461 W01E10 NAD glutamate dehydrogenase 9.88 1.4E�06 Gdh2 4.6 *NCU08877 SM4H11 glycine cleavage H protein 2.88 3.1E�06 Gcv3 0.69 *NCU01757 NM5A10 Asparaginase related protein 8.99 9.5E�07 NH — * *
a See Table 1 legend.b No homolog.
1108 X. Xie et al. / Fungal Genetics and Biology 41 (2004) 1104–1119
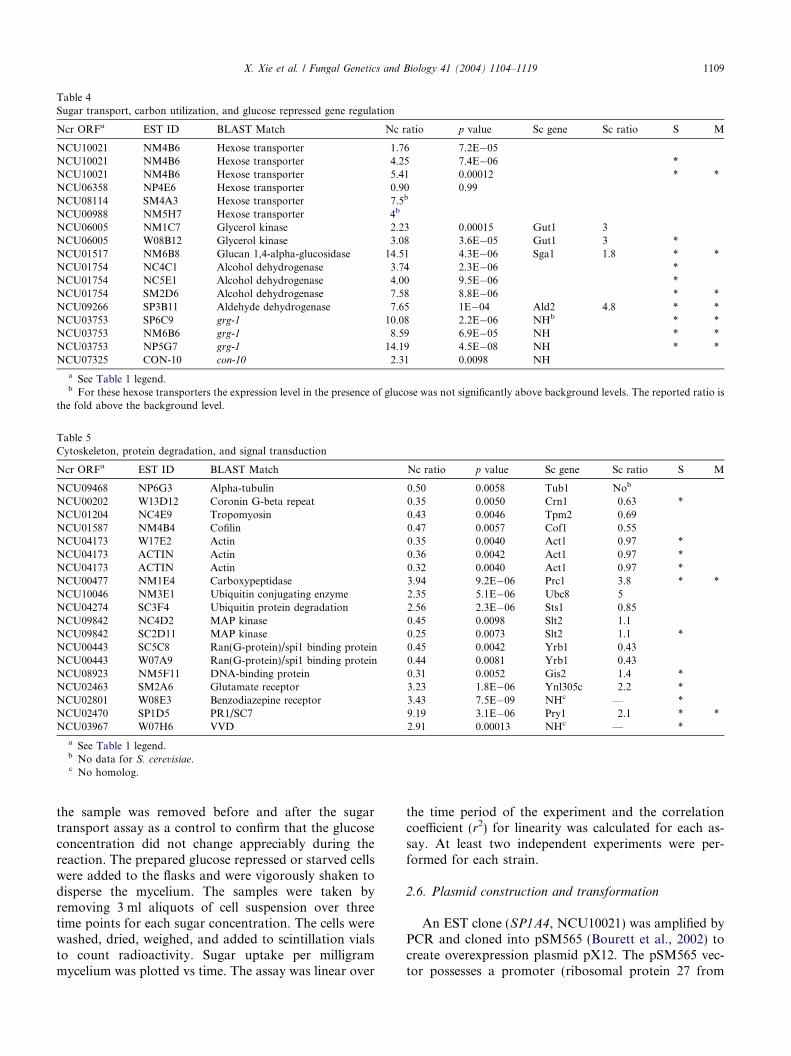
Table 4Sugar transport, carbon utilization, and glucose repressed gene regulation
Ncr ORFa EST ID BLAST Match Nc ratio p value Sc gene Sc ratio S M
NCU10021 NM4B6 Hexose transporter 1.76 7.2E�05NCU10021 NM4B6 Hexose transporter 4.25 7.4E�06 *NCU10021 NM4B6 Hexose transporter 5.41 0.00012 * *NCU06358 NP4E6 Hexose transporter 0.90 0.99NCU08114 SM4A3 Hexose transporter 7.5b
NCU00988 NM5H7 Hexose transporter 4b
NCU06005 NM1C7 Glycerol kinase 2.23 0.00015 Gut1 3NCU06005 W08B12 Glycerol kinase 3.08 3.6E�05 Gut1 3 *NCU01517 NM6B8 Glucan 1,4-alpha-glucosidase 14.51 4.3E�06 Sga1 1.8 * *NCU01754 NC4C1 Alcohol dehydrogenase 3.74 2.3E�06 *NCU01754 NC5E1 Alcohol dehydrogenase 4.00 9.5E�06 *NCU01754 SM2D6 Alcohol dehydrogenase 7.58 8.8E�06 * *NCU09266 SP3B11 Aldehyde dehydrogenase 7.65 1E�04 Ald2 4.8 * *NCU03753 SP6C9 grg-1 10.08 2.2E�06 NHb * *NCU03753 NM6B6 grg-1 8.59 6.9E�05 NH * *NCU03753 NP5G7 grg-1 14.19 4.5E�08 NH * *NCU07325 CON-10 con-10 2.31 0.0098 NH
a See Table 1 legend.b For these hexose transporters the expression level in the presence of glucose was not significantly above background levels. The reported ratio is
the fold above the background level.
Table 5Cytoskeleton, protein degradation, and signal transduction
Ncr ORFa EST ID BLAST Match Nc ratio p value Sc gene Sc ratio S M
NCU09468 NP6G3 Alpha-tubulin 0.50 0.0058 Tub1 Nob
NCU00202 W13D12 Coronin G-beta repeat 0.35 0.0050 Crn1 0.63 *NCU01204 NC4E9 Tropomyosin 0.43 0.0046 Tpm2 0.69NCU01587 NM4B4 Cofilin 0.47 0.0057 Cof1 0.55NCU04173 W17E2 Actin 0.35 0.0040 Act1 0.97 *NCU04173 ACTIN Actin 0.36 0.0042 Act1 0.97 *NCU04173 ACTIN Actin 0.32 0.0040 Act1 0.97 *NCU00477 NM1E4 Carboxypeptidase 3.94 9.2E�06 Prc1 3.8 * *NCU10046 NM3E1 Ubiquitin conjugating enzyme 2.35 5.1E�06 Ubc8 5NCU04274 SC3F4 Ubiquitin protein degradation 2.56 2.3E�06 Sts1 0.85NCU09842 NC4D2 MAP kinase 0.45 0.0098 Slt2 1.1NCU09842 SC2D11 MAP kinase 0.25 0.0073 Slt2 1.1 *NCU00443 SC5C8 Ran(G-protein)/spi1 binding protein 0.45 0.0042 Yrb1 0.43NCU00443 W07A9 Ran(G-protein)/spi1 binding protein 0.44 0.0081 Yrb1 0.43NCU08923 NM5F11 DNA-binding protein 0.31 0.0052 Gis2 1.4 *NCU02463 SM2A6 Glutamate receptor 3.23 1.8E�06 Ynl305c 2.2 *NCU02801 W08E3 Benzodiazepine receptor 3.43 7.5E�09 NHc — *NCU02470 SP1D5 PR1/SC7 9.19 3.1E�06 Pry1 2.1 * *NCU03967 W07H6 VVD 2.91 0.00013 NHc — *
a See Table 1 legend.b No data for S. cerevisiae.c No homolog.
X. Xie et al. / Fungal Genetics and Biology 41 (2004) 1104–1119 1109
the sample was removed before and after the sugartransport assay as a control to confirm that the glucoseconcentration did not change appreciably during thereaction. The prepared glucose repressed or starved cellswere added to the flasks and were vigorously shaken todisperse the mycelium. The samples were taken byremoving 3 ml aliquots of cell suspension over threetime points for each sugar concentration. The cells werewashed, dried, weighed, and added to scintillation vialsto count radioactivity. Sugar uptake per milligrammycelium was plotted vs time. The assay was linear over
the time period of the experiment and the correlationcoefficient (r2) for linearity was calculated for each as-say. At least two independent experiments were per-formed for each strain.
2.6. Plasmid construction and transformation
An EST clone (SP1A4, NCU10021) was amplified byPCR and cloned into pSM565 (Bourett et al., 2002) tocreate overexpression plasmid pX12. The pSM565 vec-tor possesses a promoter (ribosomal protein 27 from
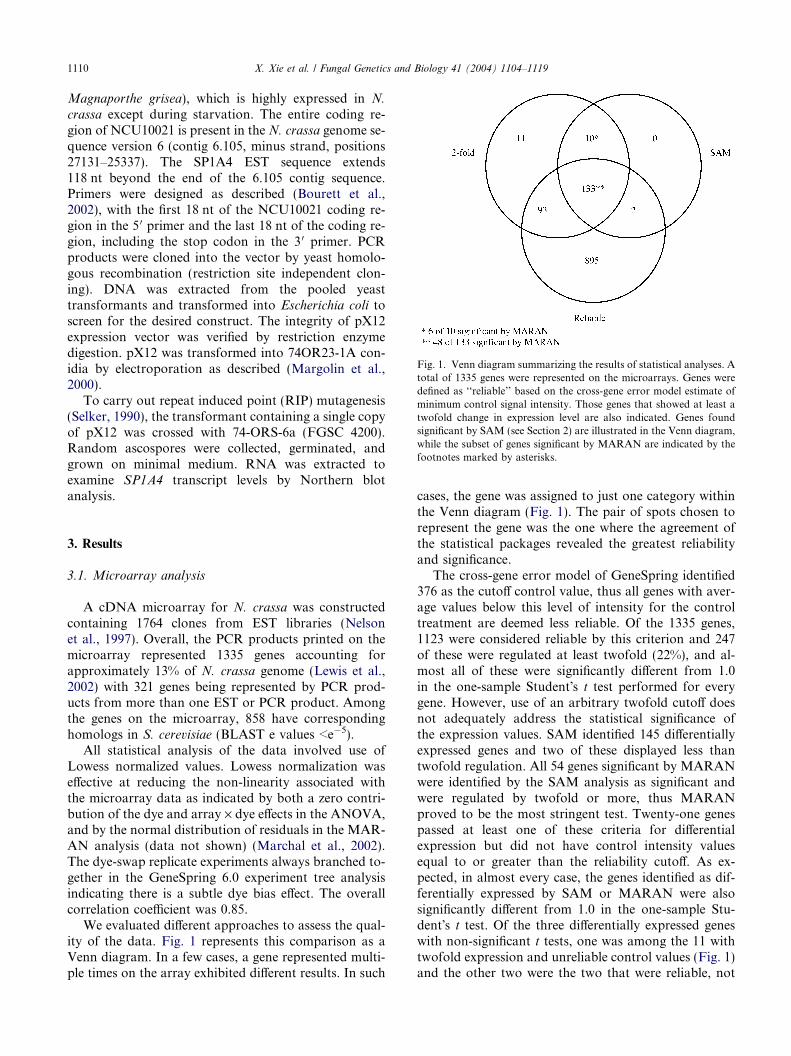
Fig. 1. Venn diagram summarizing the results of statistical analyses. Atotal of 1335 genes were represented on the microarrays. Genes weredefined as ‘‘reliable’’ based on the cross-gene error model estimate ofminimum control signal intensity. Those genes that showed at least atwofold change in expression level are also indicated. Genes foundsignificant by SAM (see Section 2) are illustrated in the Venn diagram,while the subset of genes significant by MARAN are indicated by thefootnotes marked by asterisks.
1110 X. Xie et al. / Fungal Genetics and Biology 41 (2004) 1104–1119
Magnaporthe grisea), which is highly expressed in N.
crassa except during starvation. The entire coding re-gion of NCU10021 is present in the N. crassa genome se-quence version 6 (contig 6.105, minus strand, positions27131–25337). The SP1A4 EST sequence extends118 nt beyond the end of the 6.105 contig sequence.Primers were designed as described (Bourett et al.,2002), with the first 18 nt of the NCU10021 coding re-gion in the 5 0 primer and the last 18 nt of the coding re-gion, including the stop codon in the 3 0 primer. PCRproducts were cloned into the vector by yeast homolo-gous recombination (restriction site independent clon-ing). DNA was extracted from the pooled yeasttransformants and transformed into Escherichia coli toscreen for the desired construct. The integrity of pX12expression vector was verified by restriction enzymedigestion. pX12 was transformed into 74OR23-1A con-idia by electroporation as described (Margolin et al.,2000).
To carry out repeat induced point (RIP) mutagenesis(Selker, 1990), the transformant containing a single copyof pX12 was crossed with 74-ORS-6a (FGSC 4200).Random ascospores were collected, germinated, andgrown on minimal medium. RNA was extracted toexamine SP1A4 transcript levels by Northern blotanalysis.
3. Results
3.1. Microarray analysis
A cDNA microarray for N. crassa was constructedcontaining 1764 clones from EST libraries (Nelsonet al., 1997). Overall, the PCR products printed on themicroarray represented 1335 genes accounting forapproximately 13% of N. crassa genome (Lewis et al.,2002) with 321 genes being represented by PCR prod-ucts from more than one EST or PCR product. Amongthe genes on the microarray, 858 have correspondinghomologs in S. cerevisiae (BLAST e values <e�5).
All statistical analysis of the data involved use ofLowess normalized values. Lowess normalization waseffective at reducing the non-linearity associated withthe microarray data as indicated by both a zero contri-bution of the dye and array · dye effects in the ANOVA,and by the normal distribution of residuals in the MAR-AN analysis (data not shown) (Marchal et al., 2002).The dye-swap replicate experiments always branched to-gether in the GeneSpring 6.0 experiment tree analysisindicating there is a subtle dye bias effect. The overallcorrelation coefficient was 0.85.
We evaluated different approaches to assess the qual-ity of the data. Fig. 1 represents this comparison as aVenn diagram. In a few cases, a gene represented multi-ple times on the array exhibited different results. In such
cases, the gene was assigned to just one category withinthe Venn diagram (Fig. 1). The pair of spots chosen torepresent the gene was the one where the agreement ofthe statistical packages revealed the greatest reliabilityand significance.
The cross-gene error model of GeneSpring identified376 as the cutoff control value, thus all genes with aver-age values below this level of intensity for the controltreatment are deemed less reliable. Of the 1335 genes,1123 were considered reliable by this criterion and 247of these were regulated at least twofold (22%), and al-most all of these were significantly different from 1.0in the one-sample Student�s t test performed for everygene. However, use of an arbitrary twofold cutoff doesnot adequately address the statistical significance ofthe expression values. SAM identified 145 differentiallyexpressed genes and two of these displayed less thantwofold regulation. All 54 genes significant by MARANwere identified by the SAM analysis as significant andwere regulated by twofold or more, thus MARANproved to be the most stringent test. Twenty-one genespassed at least one of these criteria for differentialexpression but did not have control intensity valuesequal to or greater than the reliability cutoff. As ex-pected, in almost every case, the genes identified as dif-ferentially expressed by SAM or MARAN were alsosignificantly different from 1.0 in the one-sample Stu-dent�s t test. Of the three differentially expressed geneswith non-significant t tests, one was among the 11 withtwofold expression and unreliable control values (Fig. 1)and the other two were the two that were reliable, not
X. Xie et al. / Fungal Genetics and Biology 41 (2004) 1104–1119 1111
twofold expressed, but were significant by SAM (Fig. 1).In total, 703 of the 1335 different genes (53%) were sig-nificant by the t test, thus, the t test represented the leaststringent means used to identify differentially expressedgenes.
Transcript levels of 133 different genes increased atleast twofold under glucose limitation, while transcriptlevels of 109 genes decreased twofold. A larger set ofgenes were regulated, but by less than twofold. Forexample, hexokinase (p = 0.0069) and glucokinase(p = 0.007) were regulated by just less than twofold(Table 1).
Glyceraldehyde 3-phosphate dehydrogenase providesan example with six independent locations on the array.Three of the six locations indicated that the gene wasregulated (1.27- to 1.38-fold; p = 0.0056, p = 0.038)and data for three of the locations indicated that thegene was not differentially regulated (1.02- to 1.24-fold;p = 0.86, p = 0.15). Our interpretation of this is thatglyceraldehyde 3-phosphate dehydrogenase respondsslightly to glucose concentration, but the ability to de-tect this regulation is at the limit of sensitivity of ourmicroarray and additional repetitions of the experimentwould be required to gain additional statistical support.
3.2. Transcriptional response of N. crassa during glucose
deprivation
The largest groups of known transcripts in both listsrepresent genes involved in metabolism (Tables 1–4).Transcript levels for genes for general biosynthetic pro-cesses, including lipid and amino acid biosynthesis (Ta-bles 2 and 3), decreased with glucose starvation, whereasexpression of genes for utilization of alternative carbonsources, including lipids and amino acids, was up-regu-lated (Tables 2 and 4).
Twenty-five ESTs representing 12 genes involved in 9of the 11 steps in glycolysis are present on the micro-array. The mRNA levels for genes encoding most glyco-lytic enzymes decline after the downshift from glucose-rich to glucose-deficient medium (Table 1, Fig. 2). Themicroarray contains 14 genes encoding enzymes of theTCA cycle and the glyoxylate cycle. Several genes ofthe TCA cycle and all of the genes of the glyoxylate cyclewere induced upon glucose starvation (Table 1, Fig. 2).We found that transcript levels for pyruvate decarboxyl-ase, which catalyzes the unidirectional rate-limited stepof fermentation, was higher in the presence of glucosethan in its absence. The transcript level of phosphoenol-pyruvate carboxykinase, the key gene in gluconeogene-sis, was elevated 30-fold upon glucose exhaustion inour experiments and this induction was verified byNorthern blot analysis (Fig. 3). In the presence of alter-native carbon sources, such as provided by peptone,phosphoenoylpyruvate carboxykinase (NCU09873.1)mRNA expression is more strongly induced than in min-
imal medium (Fig. 3). In general, the transcriptional re-sponse of central carbon metabolism in N. crassa issimilar to that observed for S. cerevisiae (Table 1,Fig. 2).
3.3. Identification of putative glucose transporters
Four predicted glucose transporter homologs wererepresented on the microarray. Transcript levels forthree of these were repressed by glucose. This expressionpattern is expected for high-affinity glucose transporters.The expression level of NCU08114 (clone SM4A3) andNCU00988 (clone NM5H7) was too low in the glu-cose-repressed culture to provide reliable estimates fortheir fold regulation, however, the signals forNCU08114 and NCU00988 were 7.5- and 4-fold higherthan the background signal (Table 4). NCU10021 wasrepresented by clones NM4B6 and SP1A4. The SP1A4clone data were not reliable, however, the NM4B6 clonewas represented on the microarray in three separatelocations and the signal in the glucose-repressed condi-tions could be reliably measured. Regulation of the dif-ferent probe spots for NCU10021 ranged from 1.8- to5.4-fold (Table 4) and this finding was confirmed bynorthern blot analysis (Fig. 3). The lack of precision inmeasuring regulation of NCU10021 is due to the lowsignal intensity for the gene in glucose-repressed cells.NCU06358, another hexose transporter homolog, wasnot glucose-regulated based on microarray analysis,however, Northern blot analysis demonstrated thatthere is glucose-induction of expression for this gene(Fig. 3). The automated annotations for NCU10021.1and NCU06358.1 were in error. The NCU10021.1 cod-ing region is truncated at the N-terminus and was notpreviously included in analyses of sugar transporterhomologs (Galagan et al., 2003). The NCU06358.1 cod-ing region suffered from an incorrect intron call. Thecorrected sequences, designated NCU10021.2 andNCU06358.2, are more similar to each other and to an-other transporter homolog, rco-3, than they are toNCU00988.1 and NCU08114.1 (Fig. 4). Based on acomparison of sugar transporter homologs of N. crassa,S. cerevisiae, and Schizosaccharomyces pombe (Galaganet al., 2003), NCU10021.2 and NCU06358.2 are proba-bly glucose transporters.
3.4. Functional analysis of a high-affinity glucose
transporter
The robust glucose-repression of NCU10021.2 (hgt-1)determined by microarray analysis and subsequentNorthern blot analysis prompted us to determinewhether this gene encodes a high-affinity glucose trans-porter in N. crassa. The transformants bearing the over-expression plasmid (S2, S9, and S13, Fig. 5A) expressedhgt-1 mRNA in the presence of glucose. The size of the
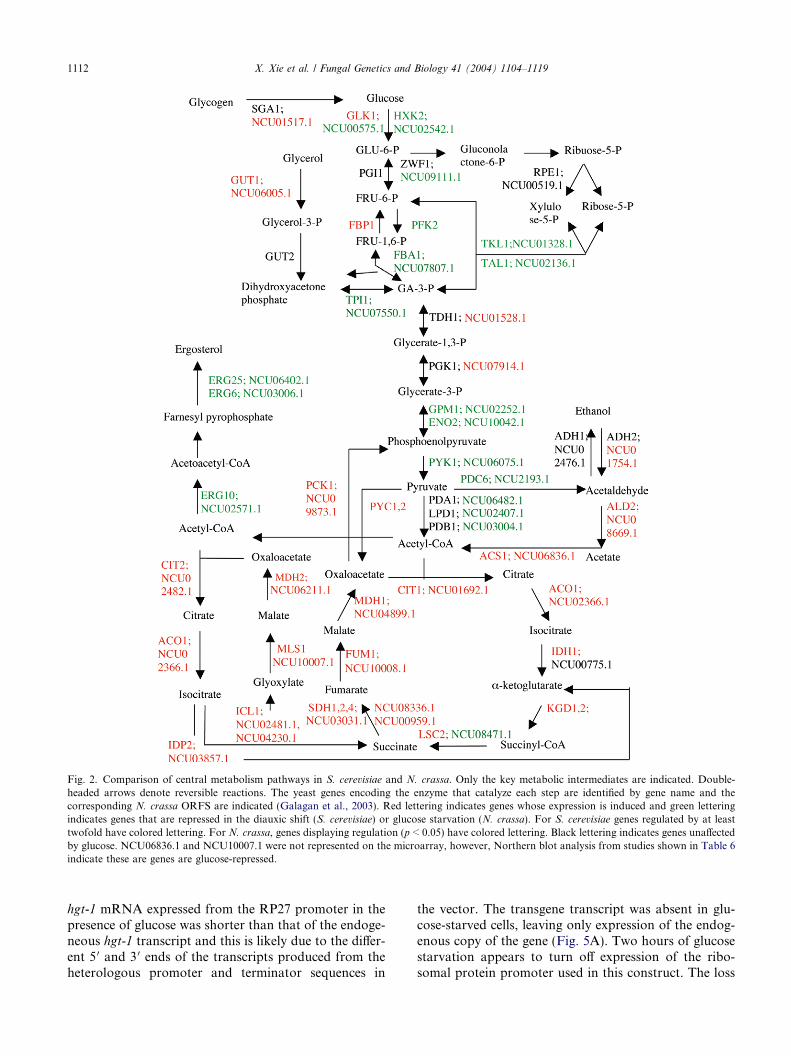
Fig. 2. Comparison of central metabolism pathways in S. cerevisiae and N. crassa. Only the key metabolic intermediates are indicated. Double-headed arrows denote reversible reactions. The yeast genes encoding the enzyme that catalyze each step are identified by gene name and thecorresponding N. crassa ORFS are indicated (Galagan et al., 2003). Red lettering indicates genes whose expression is induced and green letteringindicates genes that are repressed in the diauxic shift (S. cerevisiae) or glucose starvation (N. crassa). For S. cerevisiae genes regulated by at leasttwofold have colored lettering. For N. crassa, genes displaying regulation (p < 0.05) have colored lettering. Black lettering indicates genes unaffectedby glucose. NCU06836.1 and NCU10007.1 were not represented on the microarray, however, Northern blot analysis from studies shown in Table 6indicate these are genes are glucose-repressed.
1112 X. Xie et al. / Fungal Genetics and Biology 41 (2004) 1104–1119
hgt-1 mRNA expressed from the RP27 promoter in thepresence of glucose was shorter than that of the endoge-neous hgt-1 transcript and this is likely due to the differ-ent 5 0 and 3 0 ends of the transcripts produced from theheterologous promoter and terminator sequences in
the vector. The transgene transcript was absent in glu-cose-starved cells, leaving only expression of the endog-enous copy of the gene (Fig. 5A). Two hours of glucosestarvation appears to turn off expression of the ribo-somal protein promoter used in this construct. The loss
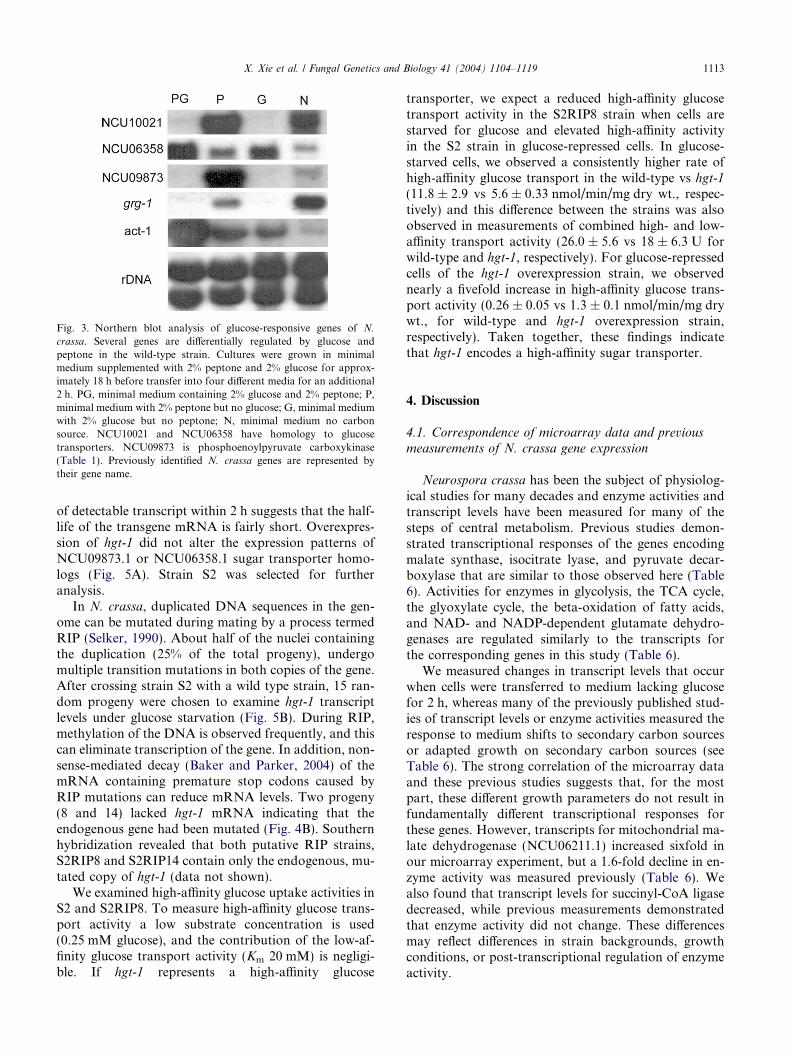
Fig. 3. Northern blot analysis of glucose-responsive genes of N.
crassa. Several genes are differentially regulated by glucose andpeptone in the wild-type strain. Cultures were grown in minimalmedium supplemented with 2% peptone and 2% glucose for approx-imately 18 h before transfer into four different media for an additional2 h. PG, minimal medium containing 2% glucose and 2% peptone; P,minimal medium with 2% peptone but no glucose; G, minimal mediumwith 2% glucose but no peptone; N, minimal medium no carbonsource. NCU10021 and NCU06358 have homology to glucosetransporters. NCU09873 is phosphoenoylpyruvate carboxykinase(Table 1). Previously identified N. crassa genes are represented bytheir gene name.
X. Xie et al. / Fungal Genetics and Biology 41 (2004) 1104–1119 1113
of detectable transcript within 2 h suggests that the half-life of the transgene mRNA is fairly short. Overexpres-sion of hgt-1 did not alter the expression patterns ofNCU09873.1 or NCU06358.1 sugar transporter homo-logs (Fig. 5A). Strain S2 was selected for furtheranalysis.
In N. crassa, duplicated DNA sequences in the gen-ome can be mutated during mating by a process termedRIP (Selker, 1990). About half of the nuclei containingthe duplication (25% of the total progeny), undergomultiple transition mutations in both copies of the gene.After crossing strain S2 with a wild type strain, 15 ran-dom progeny were chosen to examine hgt-1 transcriptlevels under glucose starvation (Fig. 5B). During RIP,methylation of the DNA is observed frequently, and thiscan eliminate transcription of the gene. In addition, non-sense-mediated decay (Baker and Parker, 2004) of themRNA containing premature stop codons caused byRIP mutations can reduce mRNA levels. Two progeny(8 and 14) lacked hgt-1 mRNA indicating that theendogenous gene had been mutated (Fig. 4B). Southernhybridization revealed that both putative RIP strains,S2RIP8 and S2RIP14 contain only the endogenous, mu-tated copy of hgt-1 (data not shown).
We examined high-affinity glucose uptake activities inS2 and S2RIP8. To measure high-affinity glucose trans-port activity a low substrate concentration is used(0.25 mM glucose), and the contribution of the low-af-finity glucose transport activity (Km 20 mM) is negligi-ble. If hgt-1 represents a high-affinity glucose
transporter, we expect a reduced high-affinity glucosetransport activity in the S2RIP8 strain when cells arestarved for glucose and elevated high-affinity activityin the S2 strain in glucose-repressed cells. In glucose-starved cells, we observed a consistently higher rate ofhigh-affinity glucose transport in the wild-type vs hgt-1(11.8 ± 2.9 vs 5.6 ± 0.33 nmol/min/mg dry wt., respec-tively) and this difference between the strains was alsoobserved in measurements of combined high- and low-affinity transport activity (26.0 ± 5.6 vs 18 ± 6.3 U forwild-type and hgt-1, respectively). For glucose-repressedcells of the hgt-1 overexpression strain, we observednearly a fivefold increase in high-affinity glucose trans-port activity (0.26 ± 0.05 vs 1.3 ± 0.1 nmol/min/mg drywt., for wild-type and hgt-1 overexpression strain,respectively). Taken together, these findings indicatethat hgt-1 encodes a high-affinity sugar transporter.
4. Discussion
4.1. Correspondence of microarray data and previousmeasurements of N. crassa gene expression
Neurospora crassa has been the subject of physiolog-ical studies for many decades and enzyme activities andtranscript levels have been measured for many of thesteps of central metabolism. Previous studies demon-strated transcriptional responses of the genes encodingmalate synthase, isocitrate lyase, and pyruvate decar-boxylase that are similar to those observed here (Table6). Activities for enzymes in glycolysis, the TCA cycle,the glyoxylate cycle, the beta-oxidation of fatty acids,and NAD- and NADP-dependent glutamate dehydro-genases are regulated similarly to the transcripts forthe corresponding genes in this study (Table 6).
We measured changes in transcript levels that occurwhen cells were transferred to medium lacking glucosefor 2 h, whereas many of the previously published stud-ies of transcript levels or enzyme activities measured theresponse to medium shifts to secondary carbon sourcesor adapted growth on secondary carbon sources (seeTable 6). The strong correlation of the microarray dataand these previous studies suggests that, for the mostpart, these different growth parameters do not result infundamentally different transcriptional responses forthese genes. However, transcripts for mitochondrial ma-late dehydrogenase (NCU06211.1) increased sixfold inour microarray experiment, but a 1.6-fold decline in en-zyme activity was measured previously (Table 6). Wealso found that transcript levels for succinyl-CoA ligasedecreased, while previous measurements demonstratedthat enzyme activity did not change. These differencesmay reflect differences in strain backgrounds, growthconditions, or post-transcriptional regulation of enzymeactivity.
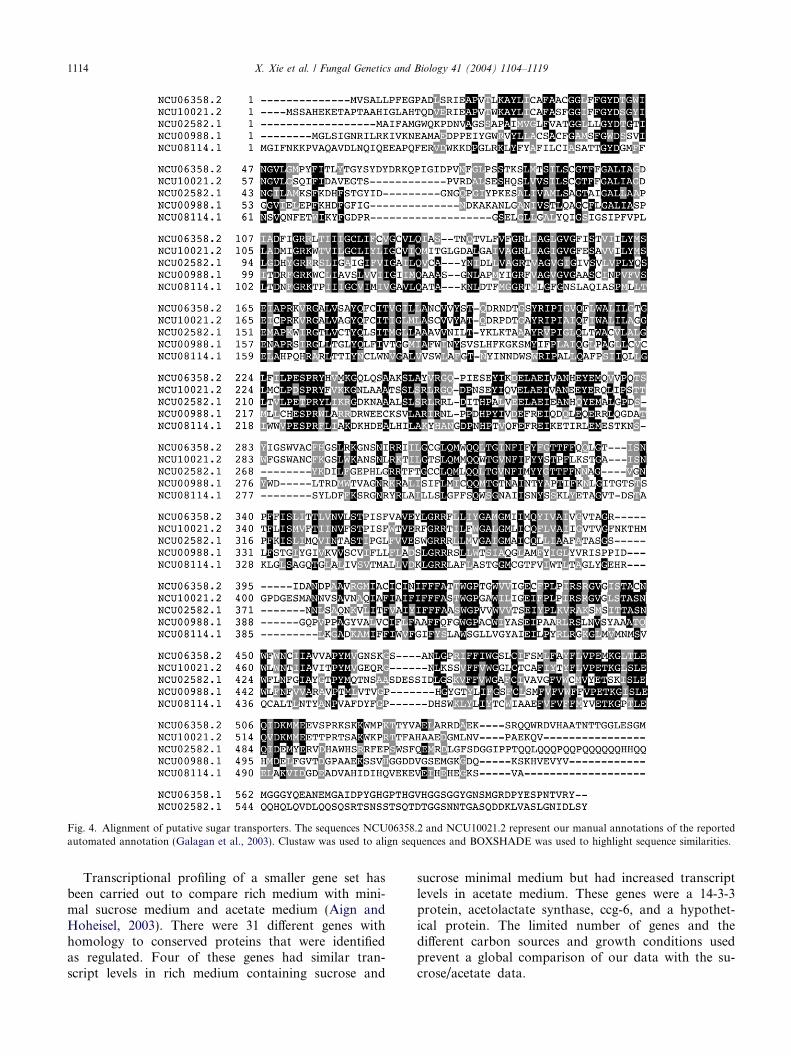
Fig. 4. Alignment of putative sugar transporters. The sequences NCU06358.2 and NCU10021.2 represent our manual annotations of the reportedautomated annotation (Galagan et al., 2003). Clustaw was used to align sequences and BOXSHADE was used to highlight sequence similarities.
1114 X. Xie et al. / Fungal Genetics and Biology 41 (2004) 1104–1119
Transcriptional profiling of a smaller gene set hasbeen carried out to compare rich medium with mini-mal sucrose medium and acetate medium (Aign andHoheisel, 2003). There were 31 different genes withhomology to conserved proteins that were identifiedas regulated. Four of these genes had similar tran-script levels in rich medium containing sucrose and
sucrose minimal medium but had increased transcriptlevels in acetate medium. These genes were a 14-3-3protein, acetolactate synthase, ccg-6, and a hypothet-ical protein. The limited number of genes and thedifferent carbon sources and growth conditions usedprevent a global comparison of our data with the su-crose/acetate data.
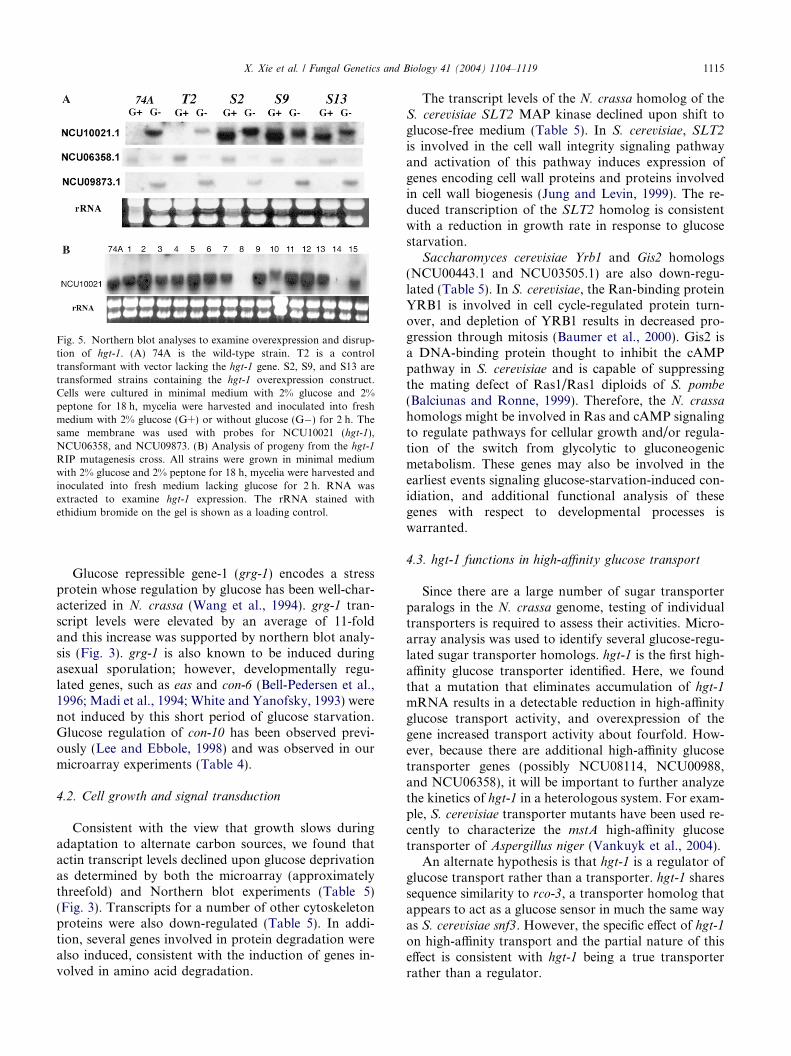
Fig. 5. Northern blot analyses to examine overexpression and disrup-tion of hgt-1. (A) 74A is the wild-type strain. T2 is a controltransformant with vector lacking the hgt-1 gene. S2, S9, and S13 aretransformed strains containing the hgt-1 overexpression construct.Cells were cultured in minimal medium with 2% glucose and 2%peptone for 18 h, mycelia were harvested and inoculated into freshmedium with 2% glucose (G+) or without glucose (G�) for 2 h. Thesame membrane was used with probes for NCU10021 (hgt-1),NCU06358, and NCU09873. (B) Analysis of progeny from the hgt-1
RIP mutagenesis cross. All strains were grown in minimal mediumwith 2% glucose and 2% peptone for 18 h, mycelia were harvested andinoculated into fresh medium lacking glucose for 2 h. RNA wasextracted to examine hgt-1 expression. The rRNA stained withethidium bromide on the gel is shown as a loading control.
X. Xie et al. / Fungal Genetics and Biology 41 (2004) 1104–1119 1115
Glucose repressible gene-1 (grg-1) encodes a stressprotein whose regulation by glucose has been well-char-acterized in N. crassa (Wang et al., 1994). grg-1 tran-script levels were elevated by an average of 11-foldand this increase was supported by northern blot analy-sis (Fig. 3). grg-1 is also known to be induced duringasexual sporulation; however, developmentally regu-lated genes, such as eas and con-6 (Bell-Pedersen et al.,1996; Madi et al., 1994; White and Yanofsky, 1993) werenot induced by this short period of glucose starvation.Glucose regulation of con-10 has been observed previ-ously (Lee and Ebbole, 1998) and was observed in ourmicroarray experiments (Table 4).
4.2. Cell growth and signal transduction
Consistent with the view that growth slows duringadaptation to alternate carbon sources, we found thatactin transcript levels declined upon glucose deprivationas determined by both the microarray (approximatelythreefold) and Northern blot experiments (Table 5)(Fig. 3). Transcripts for a number of other cytoskeletonproteins were also down-regulated (Table 5). In addi-tion, several genes involved in protein degradation werealso induced, consistent with the induction of genes in-volved in amino acid degradation.
The transcript levels of the N. crassa homolog of theS. cerevisiae SLT2 MAP kinase declined upon shift toglucose-free medium (Table 5). In S. cerevisiae, SLT2is involved in the cell wall integrity signaling pathwayand activation of this pathway induces expression ofgenes encoding cell wall proteins and proteins involvedin cell wall biogenesis (Jung and Levin, 1999). The re-duced transcription of the SLT2 homolog is consistentwith a reduction in growth rate in response to glucosestarvation.
Saccharomyces cerevisiae Yrb1 and Gis2 homologs(NCU00443.1 and NCU03505.1) are also down-regu-lated (Table 5). In S. cerevisiae, the Ran-binding proteinYRB1 is involved in cell cycle-regulated protein turn-over, and depletion of YRB1 results in decreased pro-gression through mitosis (Baumer et al., 2000). Gis2 isa DNA-binding protein thought to inhibit the cAMPpathway in S. cerevisiae and is capable of suppressingthe mating defect of Ras1/Ras1 diploids of S. pombe
(Balciunas and Ronne, 1999). Therefore, the N. crassa
homologs might be involved in Ras and cAMP signalingto regulate pathways for cellular growth and/or regula-tion of the switch from glycolytic to gluconeogenicmetabolism. These genes may also be involved in theearliest events signaling glucose-starvation-induced con-idiation, and additional functional analysis of thesegenes with respect to developmental processes iswarranted.
4.3. hgt-1 functions in high-affinity glucose transport
Since there are a large number of sugar transporterparalogs in the N. crassa genome, testing of individualtransporters is required to assess their activities. Micro-array analysis was used to identify several glucose-regu-lated sugar transporter homologs. hgt-1 is the first high-affinity glucose transporter identified. Here, we foundthat a mutation that eliminates accumulation of hgt-1mRNA results in a detectable reduction in high-affinityglucose transport activity, and overexpression of thegene increased transport activity about fourfold. How-ever, because there are additional high-affinity glucosetransporter genes (possibly NCU08114, NCU00988,and NCU06358), it will be important to further analyzethe kinetics of hgt-1 in a heterologous system. For exam-ple, S. cerevisiae transporter mutants have been used re-cently to characterize the mstA high-affinity glucosetransporter of Aspergillus niger (Vankuyk et al., 2004).
An alternate hypothesis is that hgt-1 is a regulator ofglucose transport rather than a transporter. hgt-1 sharessequence similarity to rco-3, a transporter homolog thatappears to act as a glucose sensor in much the same wayas S. cerevisiae snf3. However, the specific effect of hgt-1on high-affinity transport and the partial nature of thiseffect is consistent with hgt-1 being a true transporterrather than a regulator.
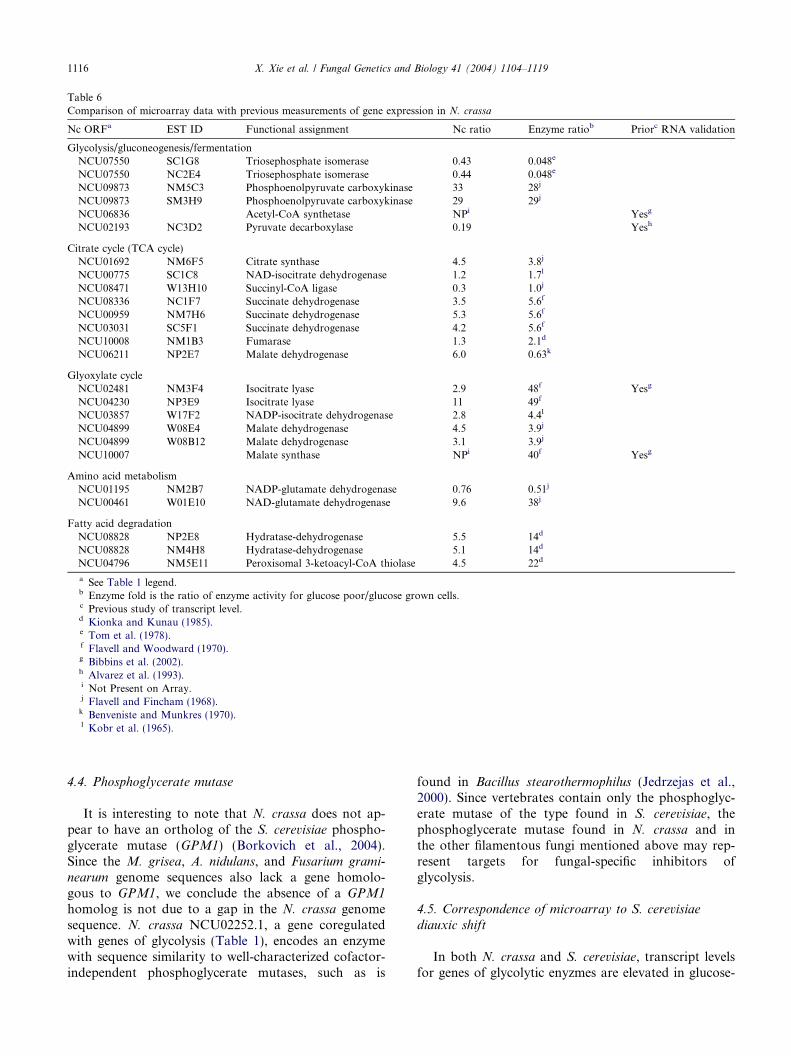
Table 6Comparison of microarray data with previous measurements of gene expression in N. crassa
Nc ORFa EST ID Functional assignment Nc ratio Enzyme ratiob Priorc RNA validation
Glycolysis/gluconeogenesis/fermentationNCU07550 SC1G8 Triosephosphate isomerase 0.43 0.048e
NCU07550 NC2E4 Triosephosphate isomerase 0.44 0.048e
NCU09873 NM5C3 Phosphoenolpyruvate carboxykinase 33 28j
NCU09873 SM3H9 Phosphoenolpyruvate carboxykinase 29 29j
NCU06836 Acetyl-CoA synthetase NPi Yesg
NCU02193 NC3D2 Pyruvate decarboxylase 0.19 Yesh
Citrate cycle (TCA cycle)NCU01692 NM6F5 Citrate synthase 4.5 3.8j
NCU00775 SC1C8 NAD-isocitrate dehydrogenase 1.2 1.7l
NCU08471 W13H10 Succinyl-CoA ligase 0.3 1.0j
NCU08336 NC1F7 Succinate dehydrogenase 3.5 5.6f
NCU00959 NM7H6 Succinate dehydrogenase 5.3 5.6f
NCU03031 SC5F1 Succinate dehydrogenase 4.2 5.6f
NCU10008 NM1B3 Fumarase 1.3 2.1d
NCU06211 NP2E7 Malate dehydrogenase 6.0 0.63k
Glyoxylate cycleNCU02481 NM3F4 Isocitrate lyase 2.9 48f Yesg
NCU04230 NP3E9 Isocitrate lyase 11 49f
NCU03857 W17F2 NADP-isocitrate dehydrogenase 2.8 4.4l
NCU04899 W08E4 Malate dehydrogenase 4.5 3.9j
NCU04899 W08B12 Malate dehydrogenase 3.1 3.9j
NCU10007 Malate synthase NPi 40f Yesg
Amino acid metabolismNCU01195 NM2B7 NADP-glutamate dehydrogenase 0.76 0.51j
NCU00461 W01E10 NAD-glutamate dehydrogenase 9.6 38j
Fatty acid degradationNCU08828 NP2E8 Hydratase-dehydrogenase 5.5 14d
NCU08828 NM4H8 Hydratase-dehydrogenase 5.1 14d
NCU04796 NM5E11 Peroxisomal 3-ketoacyl-CoA thiolase 4.5 22d
a See Table 1 legend.b Enzyme fold is the ratio of enzyme activity for glucose poor/glucose grown cells.c Previous study of transcript level.d Kionka and Kunau (1985).e Tom et al. (1978).f Flavell and Woodward (1970).g Bibbins et al. (2002).h Alvarez et al. (1993).i Not Present on Array.j Flavell and Fincham (1968).k Benveniste and Munkres (1970).l Kobr et al. (1965).
1116 X. Xie et al. / Fungal Genetics and Biology 41 (2004) 1104–1119
4.4. Phosphoglycerate mutase
It is interesting to note that N. crassa does not ap-pear to have an ortholog of the S. cerevisiae phospho-glycerate mutase (GPM1) (Borkovich et al., 2004).Since the M. grisea, A. nidulans, and Fusarium grami-
nearum genome sequences also lack a gene homolo-gous to GPM1, we conclude the absence of a GPM1homolog is not due to a gap in the N. crassa genomesequence. N. crassa NCU02252.1, a gene coregulatedwith genes of glycolysis (Table 1), encodes an enzymewith sequence similarity to well-characterized cofactor-independent phosphoglycerate mutases, such as is
found in Bacillus stearothermophilus (Jedrzejas et al.,2000). Since vertebrates contain only the phosphoglyc-erate mutase of the type found in S. cerevisiae, thephosphoglycerate mutase found in N. crassa and inthe other filamentous fungi mentioned above may rep-resent targets for fungal-specific inhibitors ofglycolysis.
4.5. Correspondence of microarray to S. cerevisiae
diauxic shift
In both N. crassa and S. cerevisiae, transcript levelsfor genes of glycolytic enyzmes are elevated in glucose-
X. Xie et al. / Fungal Genetics and Biology 41 (2004) 1104–1119 1117
rich medium. Pyruvate is a key glycolytic product occu-pying a branch point for fermentation, gluconeogenesis,and the TCA cycle (and ultimately respiration). Thefluxes through these pathways are mediated by pyruvatedecarboxylase (fermentation), phosphoenolpyruvatecarboxykinase (gluconeogenesis), and pyruvate dehy-drogenase (TCA cycle) (Fig. 2). The transcript levelsof genes encoding subunits of the pyruvate dehydroge-nase complex (NCU06482.1 and NCU03004.1) are re-duced fivefold upon glucose starvation (Table 1, Fig.2). Once glucose becomes limiting, down-regulation ofpyruvate dehydrogenase would reduce flow of pyruvateinto the TCA cycle to preserve pyruvate for biosynthe-sis. In contrast, in S. cerevisiae a slight increase inexpression of these genes is observed upon glucose lim-itation. Glucose limitation leads to increased transcriptlevels for all enzymes of the TCA cycle in S. cerevisiae.However, in N. crassa, transcript levels for isocitratedehydrogenase (NCU00775.1), succinyl-CoA ligase(NCU08471.1), and fumarase (NCU10008.1) increaseonly slightly or decline (Fig. 2, Table 1). Thus, bothpyruvate dehydrogenase and several of the TCA cyclegenes in N. crassa are not strongly repressed by glucose.This is the major difference in regulation of centralmetabolism between the two fungi. N. crassa does notrepress the genes for the TCA cycle in favor of fermen-tation. The genes encoding the remaining enzymes of theTCA cycle and all of the genes of the glyoxylate cycle areup-regulated after transfer to glucose-free medium (Fig.2, Table 1). The glyoxylate cycle permits gluconeogene-sis from acetate and other intermediates and replenishesintermediates of the TCA cycle. Gluconeogenesis re-quires the activities of the glyoxylate pathway and partof the TCA cycle to produce oxaloacetate (Fig. 2). Wefound that transcript levels of TCA cycle genes involvedin the conversion of succinate to oxaloacetate were coor-dinately regulated with the genes for the glyoxylatepathway (Table 1).
4.6. Ethanolic fermentation
At high glucose concentrations, N. crassa culture fil-trates can accumulate up to 2% ethanol, and the effi-ciency of conversion of glucose to ethanol canapproach 100% (Colvin et al., 1973). Pyruvate decarbox-ylase was expressed at a higher level in the presence ofglucose, and acetaldehyde should be produced in abun-dance. The acetaldehyde may be efficiently reduced toethanol using NADH via alcohol dehydrogenase. In S.
cerevisiae ADH1 generates ethanol and ADH2 is in-volved in its degradation. The correspondence of N.
crassa alcohol dehydrogenases with those of S. cerevi-siae at the sequence level is such that orthology cannotbe readily assigned. However, two alcohol dehydrogen-ases represented by NCU02476.1 and NCU01754.1 havestrong identity (>50%) to S. cerevisiae ADH1, ADH2,
and ADH3. NCU02476.1 was not strongly regulatedby glucose (Table 1), while NCU01754.1 is strongly re-pressed by glucose (Table 4). These two N. crassa pro-teins likely play roles in ethanol synthesis anddegradation, respectively.
Trichoderma reesei and N. crassa are both sapro-phytes deriving energy from degradation of plant mate-rial. Recently, transcript levels for a number of genes ofcentral metabolism in T. reesei were examined. It wasconcluded that T. reesei primarily utilizes glucose viarespiration and carries out a low rate of conversion ofpyruvate to acetate (Chambergo et al., 2002). In con-trast, N. crassa utilizes glucose in a manner in whichthe rate of glycolysis exceeds the rate at which the prod-ucts of glycolysis are utilized by the TCA cycle and res-piration. Fermentation to ethanol rather than acetate isrequired to generate NAD+ to support the high rate ofglycolysis. N. crassa is well known for its rapid growthrate, and energy demands to support this high growthrate may require fermentation as well as respiration.In addition, rapid removal of glucose from a glucose-rich environment and production of ethanol may repre-sent a strategy that N. crassa utilizes for competitionwith other microbes.
The N. crassa genome sequence reveals a large num-ber of extracellular plant cell wall degrading enzymesthat allow utilization of cellulose and other plant cellwall materials (Galagan et al., 2003). Thus, we concludethat N. crassa may have some advantages over S. cere-visiae and other filamentous fungi for bioethanol pro-duction from lignocellulosic substrate. Improving theability of S. cerevisiae to degrade plant cell wall materialis possible, but overall, yeasts are not well adapted tousing complex lignocellulosic materials (Walfridsson etal., 1995; Zaldivar et al., 2002). Although other filamen-tous fungi, such as T. reesei, are efficient degraders ofplant cell wall materials, unlike N. crassa, they havenot evolved to efficiently produce ethanol as a fermenta-tion product. Thus, N. crassa may be an excellent modelsystem to explore pathway engineering to optimize bio-ethanol production from lignocellulosic materials by fil-amentous fungi.
Acknowledgments
We thank the Laboratory for Functional Genom-ics, Department of Biology, Texas A & M University,and Dr. Terry Thomas for assistance with array spot-ting and the Gene Technology Laboratory, Depart-ment of Biology, Texas A & M University forassistance with DNA sequencing and oligonucleotidesynthesis. This work was supported by National Sci-ence Foundation grant MCB-9974608 to DJE and Na-tional Institutes of Health grants GM58529 andP01NS39546 to DBP.
1118 X. Xie et al. / Fungal Genetics and Biology 41 (2004) 1104–1119
References
Aign, V., Hoheisel, J.D., 2003. Analysis of nutrient-dependenttranscript variations in Neurospora crassa. Fungal Genet. Biol.40, 225–233.
Allen, K.E., Mcnally, M.T., Lowendorf, H.S., Slayman, C.W., Free,S.J., 1989. Deoxyglucose-resistant mutants of Neurospora crassa—isolation, mapping, and biochemical-characterization. J. Bacteriol.171, 53–58.
Alvarez, M.E., Rosa, A.L., Temporini, E.D., Wolstenholme, A.,Panzetta, G., Patrito, L., Maccioni, H.J.F., 1993. The 59-kDapolypeptide constituent of 8–10 nm cytoplastic filaments inNeurospora crassa is a pyruvate dacarboxylase. Gene 130, 253–258.
Bailey, L.A., Ebbole, D.J., 1998. The fluffy gene of Neurospora crassa
encodes a Gal4p-type C6 zinc cluster protein required for conidialdevelopment. Genetics 148, 1813–1820.
Baker, K.E., Parker, R., 2004. Nonsense-mediated mRNA decay:terminating erroneous gene expression. Curr. Opin. Cell Biol. 16,293–299.
Balciunas, D., Ronne, H., 1999. Yeast genes GIS1-4: multicopysuppressors of the Gal� phenotype of snf1 mig1 srb8/10/11 cells.Mol. Gen. Genet. 262, 589–599.
Baumer, M., Kunzler, M., Steigemann, P., Braus, G.H., Irniger, S.,2000. Yeast Ran-binding protein Yrb1p is required for efficientproteolysis of cell cycle regulatory proteins Pds1p and Sic1p. J.Biol. Chem. 275, 38929–38937.
Bell-Pedersen, D., Dunlap, J.C., Loros, J.J., 1996. Distinct cis-actingelements mediate clock, light, and developmental regulation of theNeurospora crassa eas (ccg-2) gene. Mol. Cell. Biol. 16, 513–521.
Benveniste, K., Munkres, K.D., 1970. Cytoplasmic and mitochondriamalate dehydrogenase of Neurospora. Regulatory and enzymicproperties. Biochim. Biophys. Acta. 220, 161–177.
Bibbins, M., Crepin, V.F., Cummings, N.J., Mizote, T., Baker, K.,Mellits, K.H., Connerton, I.F., 2002. A regulator gene for acetateutilisation from Neurospora crassa. Mol. Genet. Genomics 267,498–505.
Borkovich, K.A., Alex, L.A., Yarden, O., Freitag, M., Turner, G.E.,Read, N.D., Seiler, S., Bell-Pedersen, D., Paietta, J., Plesovsky, N.,Plamann, M., Goodrich-Tanrikulu, M., Schulte, U., Mannhaupt,G., Nargang, F.E., Radford, A., Selitrennikoff, C.P., Galagan,J.E., Dunlap, J.C., Loros, J.J., Catcheside, D., Inoue, H.,Aramayo, R., Polymenis, M., Selker, E.U., Sachs, M.S., Marzluf,G.A., Paulsen, I., Davis, R.H., Ebbole, D.J., Zelter, A., Kalkman,E.R., O�Rourke, R., Bowring, F., Yeadon, J., Ishii, C., Suzuki, K.,Sakai, W., Pratt, R.J., 2004. Lessons from the genome sequence ofNeurospora crassa: tracing the path from genomic blueprint tomulticellular organism. Microbiol. Mol. Biol. Rev. 68, 1–108.
Bourett, T.M., Sweigard, J.A., Czymmek, K.J., Carroll, A., Howard,R.J., 2002. Reef coral fluorescent proteins for visualizing fungalpathogens. Fungal Genet. Biol. 37, 211–220.
Chambergo, F.S., Bonaccorsi, E.D., Ferreira, A.J., Junior, J.R.,Abrahao-Neto, J., Farah, J.P., El-Dorry, H., 2002. Elucidation ofthe metabolic fate of glucose in the filamentous fungus Trichoderma
reesei using expressed sequence tag (EST) analysis and cDNAmicroarray. J. Biol. Chem. 277, 13983–13988.
Colvin, H.J., Sauer, B.L., Munkres, K.D., 1973. Glucose utilizationand ethanolic fermentation by wild type and extrachromosomalmutants of Neurospora crassa. J. Bacteriol. 116, 1322–1328.
Davis, R.H., De Serres, F.J., 1970. Genetic and microbial researchtechniques for Neurospora crassa. Methods Enzymol. 17A, 79–143.
DeRisi, J.L., Iyer, V.R., Brown, P.O., 1997. Exploring the metabolicand genetic control of gene expression on a genomic scale. Science278, 680–686.
Engelen, K., Coessens, B., Marchal, K., De Moor, B., 2003. MARAN:normalizing micro-array data. Bioinformatics 19, 893–894.
Flavell, R.B., Fincham, J.R., 1968. Acetate-nonutilizing mutants ofNeurospora crassa. II. Biochemical deficiencies and the roles ofcertain enzymes. J. Bacteriol. 95, 1063–1068.
Flavell, R.B., Woodward, D.O., 1970. The regulation of synthesis ofKrebs cycle enzymes in Neurospora by catabolite and end productrepression. Eur. J. Biochem. 13, 548–553.
Galagan, J.E., Calvo, S.E., Borkovich, K.A., Selker, E.U., Read,N.D., Jaffe, D., FitzHugh, W., Ma, L.J., Smirnov, S., Purcell, S.,Rehman, B., Elkins, T., Engels, R., Wang, S.G., Nielsen, C.B.,Butler, J., Endrizzi, M., Qui, D.Y., Ianakiev, P., Pedersen, D.B.,Nelson, M.A., Werner-Washburne, M., Selitrennikoff, C.P., Kin-sey, J.A., Braun, E.L., Zelter, A., Schulte, U., Kothe, G.O., Jedd,G., Mewes, W., Staben, C., Marcotte, E., Greenberg, D., Roy, A.,Foley, K., Naylor, J., Stabge-Thomann, N., Barrett, R., Gnerre, S.,Kamal, M., Kamvysselis, M., Mauceli, E., Bielke, C., Rudd, S.,Frishman, D., Krystofova, S., Rasmussen, C., Metzenberg, R.L.,Perkins, D.D., Kroken, S., Cogoni, C., Macino, G., Catcheside, D.,Li, W.X., Pratt, R.J., Osmani, S.A., DeSouza, C.P.C., Glass, L.,Orbach, M.J., Berglund, J.A., Voelker, R., Yarden, O., Plamann,M., Seller, S., Dunlap, J., Radford, A., Aramayo, R., Natvig, D.O.,Alex, L.A., Mannhaupt, G., Ebbole, D.J., Freitag, M., Paulsen, I.,Sachs, M.S., Lander, E.S., Nusbaum, C., Birren, B., 2003. Thegenome sequence of the filamentous fungus Neurospora crassa.Nature 422, 859–868.
Ivey, F.D., Kays, A.M., Borkovich, K.A., 2002. Shared and indepen-dent roles for a G alpha(i) protein and adenylyl cyclase inregulating development and stress responses in Neurospora crassa.Eukaryot. Cell 1, 634–642.
Jedrzejas, M.J., Chander, M., Setlow, P., Krishnasamy, G., 2000.Structure and mechanism of action of a novel phosphoglyceratemutase from Bacillus stearothermophilus. EMBO J. 19,1419–1431.
Jung, U.S., Levin, D.F., 1999. Genome-wide analysis of geneexpression regulated by the yeast cell wall integrity signalingpathway. Mol. Microbiol. 34, 1049–1057.
Kays, A.M., Rowley, P.S., Baasiri, R.A., Borkovich, K.A., 2000.Regulation of conidiation and adenylyl cyclase levels by the Galpha protein GNA-3 in Neurospora crassa. Mol. Cell. Biol. 20,7693–7705.
Kelly, J.M., Drysdale, M.R., Sealy-Lewis, H.M., Jones, I.G., Loc-kington, R.A., 1990. Alcohol dehydrogenase III in Aspergillus
nidulans is anaerobically induced and post-transcriptionally regu-lated. Mol. Gen. Genet. 222, 323–328.
Kionka, C., Kunau, W.H., 1985. Inducible beta-oxidation pathway inNeurospora crassa. J. Bacteriol. 161, 153–157.
Kobr, M.J., Turian, G., Zimmerman, E.J., 1965. Changes in enzymesregulating isocitrate breakdown in Neurospora crassa. Arch.Microbiol. 52, 169–177.
Lee, K., Ebbole, D.J., 1998. Tissue-specific repression of starvationand stress responses of the Neurospora crassa con-10 gene ismediated by RCO1. Fungal Genet. Biol. 23, 269–278.
Lewis, Z.A., Correa, A., Schwerdtfeger, C., Link, K.L., Xie, X.,Gomer, R.H., Thomas, T., Ebbole, D.J., Bell-Pedersen, D., 2002.Overexpression of White Collar-1 (WC-1) activates circadianclock-associated genes, but is not sufficient to induce most light-regulated gene expression in Neurospora crassa. Mol. Microbiol.45, 917–931.
Lockington, R.A., Borlace, G.N., Kelly, J.M., 1997. Pyruvate decar-boxylase and anaerobic survival in Aspergillus nidulans. Gene 191,61–67.
Madi, L., Ebbole, D.J., White, B.T., Yanofsky, C., 1994. Mutants ofNeurospora crassa that alter gene-expression and conidia develop-ment. Proc. Natl. Acad. Sci. USA 91, 6226–6230.
Madi, L., McBride, S.A., Bailey, L.A., Ebbole, D.J., 1997. rco-3, agene involved in glucose transport and conidiation in Neurospora
crassa. Genetics 146, 499–508.
X. Xie et al. / Fungal Genetics and Biology 41 (2004) 1104–1119 1119
Marchal, K., Engelen, K., De Brabanter, J., Aert, S., De Moor, B.,Ayoubi, T., Van Hummelen, P., 2002. Comparison of differentmethodologies to identify differentially expressed genes in two-sample cDNA microarrays. J. Biol. Syst. 10, 409–430.
Margolin, B.S., Freitag, M., Selker, E.U., 2000. Improved plasmids forgene targeting at the his-3 locus of Neurospora crassa by electro-poration: correction. Fungal Genet. Newsl. 47, 112.
Nelson, M.A., Kang, S.C., Braun, E.L., Crawford, M.E., Dolan, P.L.,Leonard, P.M., Mitchell, J., Armijo, A.M., Bean, L., Blueyes, E.,Cushing, T., Errett, A., Fleharty, M., Gorman, M., Judson, K.,Miller, R., Ortega, J., Pavlova, I., Perea, J., Todisco, S., Trujillo, R.,Valentine, J., Wells, A., Werner-Washburne,M., Yazzie, S., Natvig,D.O., 1997. Expressed sequences from conidial, mycelial, and sexualstages of Neurospora crassa. Fungal Genet. Biol. 21, 348–363.
Ricci, M., Krappmann, D., Russo, V.E.A., 1991. Nitrogen and carbonstarvation regulate conidia and protoperithecia formation inNeurospora crassa grown on solid media. Fungal Genet. Newslett.38, 87–88.
Scarborough, G.A., 1970. Sugar transport in Neurospora crassa. J.Biol. Chem. 245, 3985–3987.
Schneider, R.P., Wiley, W.R., 1971. Kinetic characteristics of the twoglucose transport system in Neurospora crassa. J. Bacteriol. 106,479–486.
Selker, E.U., 1990. Premeiotic instability of repeated sequences inNeurospora crassa. Annu. Rev. Genet. 24, 579–613.
Springer,M.L., 1993. Genetic control of fungal differentiation: the threesporulation pathways of Neurospora crassa. Bioessays 15, 365–374.
Tom, G.D., Viswanath-Reddy, M., Howe Jr., H.B., 1978. Effect ofcarbon source on enzymes involved in glycerol metabolism inNeurospora crassa. Arch. Microbiol. 117, 259–263.
Tusher, V.G., Tibshirani, R., Chu, G., 2001. Significance analysis ofmicroarrays applied to the ionizing radiation response. Proc. Natl.Acad. Sci. USA 98, 5116–5121.
Vankuyk, P.A., Diderich, J.A., MacCabe, A.P., Hererro, O., Ruijter,G.J., Visser, J., 2004. Aspergillus niger mstA encodes a high-affinitysugar/H+ symporter which is regulated in response to extracellularpH. Biochem. J. 379, 375–383.
Walfridsson, M., Hallborn, J., Penttila, M., Keranen, S., Hahn-Hagerdal, B., 1995. Xylose-metabolizing Saccharomyces cerevisiae
strains overexpressing the TKL1 and TAL1 genes encoding thepentose phosphate pathway enzymes transketolase and transaldol-ase. Appl. Environ. Microbiol. 61, 4184–4190.
Wang, Z., Deak, M., Free, S.J., 1994. Cis-acting region required forthe regulated expression of grg-1, a Neurospora glucose-repressiblegene: two regulatory sites (CRE and NRS) are required to repressgrg-1 expression. J. Mol. Biol. 44, 407–418.
White, B.T., Yanofsky, C., 1993. Structural characterization andexpression analysis of the Neurospora Conidiation gene con-6. Dev.Biol. 160, 254–264.
Zaldivar, J., Borges, A., Johansson, B., Smits, H.P., Villas-Boas, S.G.,Nielsen, J., Olsson, L., 2002. Fermentation performance andintracellular metabolite patterns in laboratory and industrialxylose-fermenting Saccharomyces cerevisiae. Appl. Microbiol.Biotechnol. 59, 422–436.