trace metal speciation predictions in natural aquatic systems: incorporation of dissolved organic...
TRANSCRIPT
This version available http://nora.nerc.ac.uk/19305/ NERC has developed NORA to enable users to access research outputs wholly or partially funded by NERC. Copyright and other rights for material on this site are retained by the rights owners. Users should read the terms and conditions of use of this material at http://nora.nerc.ac.uk/policies.html#access This document is the author’s final manuscript version of the journal article, incorporating any revisions agreed during the peer review process. Some differences between this and the publisher’s version remain. You are advised to consult the publisher’s version if you wish to cite from this article. The definitive version is available at www.publish.csiro.au/
Article (refereed) - postprint
Mueller, Kristin K.; Lofts, Stephen; Fortin, Claude; Campbell, Peter G.C. 2012 Trace metal speciation predictions in natural aquatic systems: incorporation of dissolved organic matter (DOM) spectroscopic quality. Environmental Chemistry, 9 (4). 356-368. 10.1071/EN11156
Contact CEH NORA team at [email protected]
The NERC and CEH trademarks and logos (‘the Trademarks’) are registered trademarks of NERC in the UK and other countries, and may not be used without the prior written consent of the Trademark owner.
Trace metal speciation predictions in natural aquatic systems: incorporation of 1
dissolved organic matter (DOM) spectroscopic quality 2
3
4
5
Kristin K. Mueller1, Stephen Lofts
2, Claude Fortin
1 and Peter G.C. Campbell
1,* 6
7
8
1 INRS Eau Terre et Environnement, Université du Québec, 490 de la Couronne, Québec 9
(Québec), Canada G1K 9A9 10
11
2 Centre for Ecology and Hydrology, Lancaster Environment Centre, Library Avenue, 12
Bailrigg, Lancaster, LA1 4AP, United Kingdom 13
14
15
16
17
*Corresponding author: [email protected] 18
Telephone 418-654-2538; Fax 418-654-2600 19
20
21
22
23
2
Abstract 24
To calculate metal speciation in natural waters, modellers must choose the proportion of dissolved 25
organic matter (DOM) that is actively involved in metal complexation, defined here as the % active 26
fulvic acid (FA); to be able to estimate this proportion spectroscopically would be very useful. In 27
the present study, we determined the free Cd2+
, Cu2+
, Ni2+
and Zn2+
concentrations in eight 28
Canadian Shield lakes and compared these measured concentrations to those predicted by the 29
Windermere Humic Aqueous Model (WHAM VI). For seven of the eight lakes, the measured 30
proportions of Cd2+
and Zn2+
fell within the range of values predicted by WHAM; the measured 31
proportion of Cu2+
fell within this range for only half of the lakes sampled, whereas for Ni, WHAM 32
systematically overestimated the proportion of Ni2+
. With the aim of ascribing the differences 33
between measured and modeled metal speciation to variations in DOM quality, the % active FA 34
needed to fit modeled to measured free metal concentrations was compared to the lake-to-lake 35
variation in the spectroscopic quality of the DOM, as determined by absorbance and fluorescence 36
measurements. Relationships between % active FA and DOM quality were apparent for Cd, Cu, Ni 37
and Zn, suggesting the possibility of estimating the % active FA spectroscopically and then using 38
this information to refine model predictions. The relationships for Ni differed markedly from those 39
observed for the other metals, suggesting that the DOM binding sites active in Cd, Cu and Zn 40
complexation are different from those involved in Ni complexation. To our knowledge, this is the 41
first time that such a distinction has been resolved in natural water samples. 42
43
3
Running Head 44
Predicting metal speciation in lake waters 45
46
Environmental Context 47
To assess the risk posed by environmental contaminants such as metals, one needs to be able to 48
identify the key chemical species that prevail in natural waters. One of the recognized stumbling 49
blocks is the need to quantify the influence of heterogeneous dissolved organic matter (DOM). 50
Here we explore the possibility of using the optical signature of DOM to determine its quality, to 51
alleviate the need to make assumptions about its metal-binding properties, and to improve the 52
prediction of trace metal species distributions in natural waters. 53
54
55
4
1 Introduction 56
Knowledge of the speciation of trace metals in natural waters is widely recognised as a key to 57
understanding both their geochemical mobility and their ecotoxicological impacts. In natural 58
freshwater systems, trace metals may interact with a variety of ligands, including common 59
inorganic anions (e.g. OH–, HCO3–, CO32–, Cl–, F– and SO42–), simple monomeric organic 60
molecules of natural or anthropogenic origin (e.g. metabolites such as citrate or glycine, or 61
polycarboxylates such as nitrilotriacetic acid) and dissolved humic substances (fulvic acid (FA) and 62
humic acid (HA)).[1] From a geochemical or ecotoxicological perspective, the key species is the 63
free metal ion (Mz+
), which is usually presumed to be in equilibrium with these various dissolved or 64
particulate ligands and with the epithelial or cell surfaces of the resident aquatic organisms; it is the 65
master species from which the concentrations of all other species of interest can in principle be 66
calculated. 67
Several approaches have been used to determine free metal ion concentrations in natural waters. 68
For example, the equilibrium ion exchange technique (IET) has been employed to determine Cd2+
, 69
Ni2+
and Zn2+
concentrations in environmental samples.[2–4] Various electrochemical techniques 70
have also been used, including potentiometry with ion-selective electrodes (ISEs)[5,6] and cathodic 71
stripping voltammetry,[5,7] as has the Donnan membrane technique.[8,9] However, given the 72
complexity of the analytical matrices in which the free metal ion is found, and the often very low 73
ambient metal concentrations, the determination of [Mz+
] in natural waters is not a routine 74
measurement. 75
A complementary approach to such analytical determinations would be the use of chemical 76
equilibrium models to calculate the free metal ion concentration. For simple systems, containing 77
inorganic cations and anions together with simple monomeric ligands, such an approach is 78
reasonably straightforward. However, for waters containing natural dissolved organic matter 79
(DOM), the chemical equilibrium calculations must deal with the challenging presence of FA and 80
5
HA. These ubiquitous but poorly defined materials behave like multidentate ligands and 81
polyelectrolytes in solution. Dudal and Gérard[10] have reviewed various approaches that have 82
been developed to account for natural organic matter in aqueous chemical equilibrium models, 83
including two that are currently widely used: the Windermere Humic Aqueous Model (WHAM) 84
and the Non-Ideal Competitive Adsorption (NICA)–Donnan model. In addition to FA and HA, 85
DOM also includes biogenic molecules (amino acids, proteins and carbohydrates), the 86
concentrations of which tend to be maintained at very low levels due to their degradation and 87
uptake by heterotrophic microorganisms. As a result, these other components of the DOM pool 88
normally will not affect trace element speciation.[11] In waters affected by wastewater effluents, 89
the DOM may also include strong chelating agents of anthropogenic origin. 90
Recent comparisons of free metal ion concentrations measured in natural aquatic systems with the 91
concentrations predicted for these systems with the NICA and WHAM speciation models have 92
demonstrated major differences between measured and predicted values for some metals, notably 93
Cu, Ni and Pb.[3,12,13] Lofts and Tipping[14] have discussed possible reasons for these 94
differences, including errors in measuring the free metal ion, errors in measuring the variables that 95
are used as input data for the model and differences between the DOM present in the natural waters 96
and the types of (isolated) FA and HA that have traditionally been used to calibrate or parameterise 97
the chemical equilibrium models. In the present paper we have explored this latter factor. 98
One of the challenges involved in applying a chemical equilibrium model to a natural water is to 99
estimate the FA and HA content of the water. Current speciation models that include dissolved 100
organic matter (DOM), such as WHAM, incorporate the measured quantity of DOM, but users 101
must define the DOM quality by choosing the percentage of the DOM that is actively involved in 102
metal complexation, and by deciding what proportions of this ‘active’ DOM should be designated 103
FA and HA. To be able to estimate this ‘percentage active’ DOM spectroscopically would be very 104
useful. For example, the specific ultraviolet absorbance of the DOM (SUVA254), a measure of the 105
6
aromaticity of the organic matter, has been used to estimate the proportion of DOM that is present 106
as HA or FA in solution and that participates in the complexation of Cu in reconstituted natural 107
water samples[15,16] and in the complexation of Cu[17] and Cd[18,19] in soil extracts. A better a 108
priori understanding of the quality of DOM in a given sample would alleviate the need to make 109
assumptions about the activity of DOM and might reduce the discrepancies between predicted and 110
measured free metal concentrations. 111
The purpose of this paper is thus three-fold: (i) to determine the free Cd2+
, Cu2+
, Ni2+
and Zn2+
112
concentrations in a set of lakes located along a metal contamination gradient; (ii) to compare these 113
measured concentrations with the free metal concentrations predicted by WHAM VI and (iii) to 114
explore the use of the optical signature of the DOM in each lake as a means of estimating the 115
proportion of the natural DOM that is active in metal complexation. 116
Knowledge of the speciation of trace metals in natural waters is widely recognised as a key to 117
understanding both their geochemical mobility and their ecotoxicological impacts. In natural 118
freshwater systems, trace metals may interact with a variety of ligands, including common 119
inorganic anions (e.g. OH–, HCO3
–, CO3
2–, Cl
–, F
– and SO4
2–), simple monomeric organic 120
molecules of natural or anthropogenic origin (e.g. metabolites such as citrate or glycine, or 121
polycarboxylates such as nitrilotriacetic acid) and dissolved humic substances (fulvic acid (FA) and 122
humic acid (HA)).[1] From a geochemical or ecotoxicological perspective, the key species is the 123
free metal ion (Mz+
), which is usually presumed to be in equilibrium with these various dissolved or 124
particulate ligands and with the epithelial or cell surfaces of the resident aquatic organisms; it is the 125
master species from which the concentrations of all other species of interest can in principle be 126
calculated. 127
Several approaches have been used to determine free metal ion concentrations in natural waters. 128
For example, the equilibrium ion exchange technique (IET) has been employed to determine Cd2+
, 129
Ni2+
and Zn2+
concentrations in environmental samples.[2–4] Various electrochemical techniques 130
7
have also been used, including potentiometry with ion-selective electrodes (ISEs)[5,6] and cathodic 131
stripping voltammetry,[5,7] as has the Donnan membrane technique.[8,9] However, given the 132
complexity of the analytical matrices in which the free metal ion is found, and the often very low 133
ambient metal concentrations, the determination of [Mz+
] in natural waters is not a routine 134
measurement. 135
A complementary approach to such analytical determinations would be the use of chemical 136
equilibrium models to calculate the free metal ion concentration. For simple systems, containing 137
inorganic cations and anions together with simple monomeric ligands, such an approach is 138
reasonably straightforward. However, for waters containing natural dissolved organic matter 139
(DOM), the chemical equilibrium calculations must deal with the challenging presence of FA and 140
HA. These ubiquitous but poorly defined materials behave like multidentate ligands and 141
polyelectrolytes in solution. Dudal and Gérard[10] have reviewed various approaches that have 142
been developed to account for natural organic matter in aqueous chemical equilibrium models, 143
including two that are currently widely used: the Windermere Humic Aqueous Model (WHAM) 144
and the Non-Ideal Competitive Adsorption (NICA)–Donnan model. In addition to FA and HA, 145
DOM also includes biogenic molecules (amino acids, proteins and carbohydrates), the 146
concentrations of which tend to be maintained at very low levels due to their degradation and 147
uptake by heterotrophic microorganisms. As a result, these other components of the DOM pool 148
normally will not affect trace element speciation.[11] In waters affected by wastewater effluents, 149
the DOM may also include strong chelating agents of anthropogenic origin. 150
Recent comparisons of free metal ion concentrations measured in natural aquatic systems with the 151
concentrations predicted for these systems with the NICA and WHAM speciation models have 152
demonstrated major differences between measured and predicted values for some metals, notably 153
Cu, Ni and Pb.[3,12,13] Lofts and Tipping[14] have discussed possible reasons for these 154
differences, including errors in measuring the free metal ion, errors in measuring the variables that 155
8
are used as input data for the model and differences between the DOM present in the natural waters 156
and the types of (isolated) FA and HA that have traditionally been used to calibrate or parameterise 157
the chemical equilibrium models. In the present paper we have explored this latter factor. 158
One of the challenges involved in applying a chemical equilibrium model to a natural water is to 159
estimate the FA and HA content of the water. Current speciation models that include dissolved 160
organic matter (DOM), such as WHAM, incorporate the measured quantity of DOM, but users 161
must define the DOM quality by choosing the percentage of the DOM that is actively involved in 162
metal complexation, and by deciding what proportions of this ‘active’ DOM should be designated 163
FA and HA. To be able to estimate this ‘percentage active’ DOM spectroscopically would be very 164
useful. For example, the specific ultraviolet absorbance of the DOM (SUVA254), a measure of the 165
aromaticity of the organic matter, has been used to estimate the proportion of DOM that is present 166
as HA or FA in solution and that participates in the complexation of Cu in reconstituted natural 167
water samples[15,16] and in the complexation of Cu[17] and Cd[18,19] in soil extracts. A better a 168
priori understanding of the quality of DOM in a given sample would alleviate the need to make 169
assumptions about the activity of DOM and might reduce the discrepancies between predicted and 170
measured free metal concentrations. 171
The purpose of this paper is thus three-fold: (i) to determine the free Cd2+
, Cu2+
, Ni2+
and Zn2+
172
concentrations in a set of lakes located along a metal contamination gradient; (ii) to compare these 173
measured concentrations with the free metal concentrations predicted by WHAM VI and (iii) to 174
explore the use of the optical signature of the DOM in each lake as a means of estimating the 175
proportion of the natural DOM that is active in metal complexation. 176

9
2 Methodology 177
2.1 Study area 178
Although a detailed description of the study sites can be found in Mueller et al.[20] a brief 179
description is given here. Lake water was collected from lakes in two different regions on the 180
Canadian Shield: near Rouyn-Noranda in north-western Québec and near Sudbury in north-central 181
Ontario. Both study areas have been greatly affected by metal mining and smelting activities, 182
particularly by atmospheric deposition of acid and metals.[21,22] The pH of the lakes tends to 183
decrease and total metal concentrations tend to increase with a decrease in the down-wind distance 184
from the metal smelters, particularly in the Sudbury area.[23] Acid mine drainage from point 185
sources, such as abandoned mines or mineralised outcrops, may also decrease the pH of lake water 186
locally. In each region, lakes were chosen to represent a gradient in water quality (pH, dissolved 187
organic carbon (DOC)) and trace metal concentrations. 188
2.2 Lake water sampling 189
Lake water samples were taken from four lakes in each of the study areas during July and August 190
2008. Sampling sites were chosen in the littoral zones of small, well mixed lakes and the sampling 191
sites were considered to be representative of the whole lake epilimnion. The spatial variability of 192
water chemistry (i.e. pH and concentrations of DOC and major cations) is known to be minimal 193
within many of the sampled lakes.[3] 194
Lake water was collected passively using equilibrium diffusion sampling as described in Fortin et 195
al.[3] and Mueller et al.[20] Briefly, 250-mL polypropylene jars (Nalgene, Nalge Nunc 196
International Corporation, Rochester, NY) topped with custom-made plastic lids fitted with a 0.2-197
µm filter membrane (HT Tuffryn Membrane, Pall Canada Ltd, Ville St-Laurent, QC, Canada) were 198
filled with Milli-Q (Millipore, EMD Millipore, Billerica, MA) ultrapure water (>18 MΩ cm) and 199
fixed to plastic rods that were anchored to the lake bottom. The samplers were installed at a depth 200
of 1 m from the lake surface and left to equilibrate for 13 to 14 days. Following this equilibration 201
10
period, the samplers were brought to the surface, the membrane surface rinsed with ultrapure water, 202
the membranes pierced with a clean plastic pipette tip and the custom jar lids replaced with clean 203
polypropylene screw lids. The sample jars were bagged and stored in the dark at 4 °C in field 204
coolers for a maximum of 12 days until they were transported back to the laboratory. Note that lake 205
water pH, conductivity and temperature were measured in the field at the time of sample collection. 206
207
2.3 Sample analysis 208
All plastic laboratory and sampling equipment was soaked in 10 % (v/v) nitric acid for at least 24 h 209
and then rinsed a minimum of six times with ultrapure water and dried under a Class 100 laminar 210
flow hood. The only exception was for the polystyrene vials used for storing the subsamples for 211
anion analyses; these vials were rinsed three times with ultrapure water only. All glassware was 212
soaked in a 2 N HCl solution before being rinsed with ultrapure water. 213
Once the polypropylene jars had arrived in the central laboratory, they were opened in a clean Class 214
100 laminar flow hood, and subsamples were collected as follows. A 10-mL subsample was 215
transferred to a polypropylene vial and acidified to 2 % (v/v) with concentrated ultra-trace nitric 216
acid (BDH Aristar Ultra, VWR International, Mississauga, ON, Canada) for analysis of major 217
cations (Ca, Mg) by atomic optical emission spectroscopy (ICP-OES, Varian Vista AX CCD, 218
Agilent Technologies Canada Inc., Mississauga, ON) and total metals (Cd, Cu, Ni and Zn) by 219
inductively coupled plasma–mass spectrometry (ICP-MS, Element X Series, Thermo Scientific, 220
Mississauga, ON). A second 10-mL subsample was transferred to a polystyrene vial for the 221
determination of anion concentrations (F–, Cl
–, NO3
–, SO4
2– and PO4
3–) by ion chromatography 222
(Dionex ICS-2000, Thermo Scientific). 223
Details concerning the quantitative and qualitative characterisation of DOM can be found in 224
Mueller et al.[20] Briefly, 20-mL subsamples were transferred to amber borosilicate vials (I-Chem 225
11
Brand, Thermo Fisher Scientific, Rockwood, TN) for total organic carbon analysis (TOC-VCPH, 226
Shimadzu Scientific Instruments, Columbia, MD). Subsamples (1 mL) were transferred to 3-mL 227
glass vacutainers (Kendall Monoject, Mansfield, MA) for total inorganic carbon analysis by gas 228
chromatography (Varian 3800 GC, Agilent Technologies Canada Inc.). The absorption (Varian 229
UV-Vis Cary 300 Spectrophotometer, Agilent Technologies Canada Inc.) and fluorescence (Varian 230
Cary Eclipse Fluorescence Spectrophotometer, Agilent Technologies Canada Inc.) spectra of lake 231
water DOM were also measured. The specific UV absorbance (SUVA, L m–1
mg–1
C) was also 232
calculated by dividing the measured absorbance at 254 nm by the concentration of DOC.[24] 233
Excitation–emission matrix (EEM) fluorescence spectra were measured using 1-cm quartz cuvettes 234
at excitation wavelengths from 210 to 400 nm at increments of 5 nm and at emission wavelengths 235
from 300 to 580 nm at increments of 2 nm. The fluorescence index was calculated as the ratio 236
between the fluorescence emission intensity at 470 nm over that at 520 nm for an excitation at 237
370 nm.[25,26] Finally, the multivariable statistical tool, parallel factor analysis (PARAFAC), was 238
employed to deconvolute the EEM spectra using the procedure outlined by Stedmon and Bro[27] as 239
implemented in a MATLAB environment, using the ‘N-way toolbox for MATLAB’.[28] 240
241
2.4 Metal speciation measurements 242
All sub-samples for metal speciation measurements were filtered (0.2-µm polycarbonate filter; 243
AMD Manufacturing Inc., Mississauga, ON) under a laminar flow hood before analysis. A 244
precipitate was observed in a few samples, which prompted a filtration step for all samples just 245
before the metal speciation analyses. WHAM metal speciation simulations were performed using 246
the element concentrations measured on these filtered samples. All calibration solutions were 247
prepared using ultrapure water. Stock solutions of Cd, Cu, Ni and Zn were prepared from ICP-MS 248
standard solutions (4 % HNO3, PlasmaCAL, SPC Science, Baie D’Urfé, QC, Canada). To take into 249
account the variable natural conditions of each lake sampled, e.g. pH, ionic strength and total metal 250
12
concentrations, a lake-specific limit of quantification (LOQ) was calculated for the measurement of 251
the free metal ion for each lake, based on the standard deviation of triplicate measurements. When 252
the free metal value for a lake fell below its LOQ, it was discarded and the free metal ion 253
concentration or percentage was not reported. 254
255
2.4.1 Ion exchange technique (IET) 256
The concentrations of Cd2+
, Ni2+
and Zn2+
were measured following the methods described by 257
Fortin and Campbell[29] and updated by Fortin et al.[3] Briefly, the IET involves the equilibration 258
of the free metal ions in an unknown sample with a cation exchange resin (Dowex 50W-X8, 50-100 259
mesh, Sigma–Aldrich Canada Ltd, Oakville, ON, Canada) that has been calibrated with standard 260
solutions according to the following reaction: 261
xK
x CatxMRCatRxM
cIE
)3()3( 2
2 (1) 262
263
where M2+
is the free metal ion, RxCat represents the resin with binding sites filled by a mono- or 264
divalent cation (Catx+
), x is the charge on the cation and R2M represents the resin with binding sites 265
filled by the metal ion of interest. The conditional equilibrium constant (KIEc) for the above reaction 266
is calculated using the following equation: 267
x
x
xxc
IECatRM
CatMRK
32
3
2 (2) 268
269
Under swamping electrolyte conditions, [Catx+
] and [RxCat] are assumed to remain constant and 270
Eqn 2 is rearranged to give the resin distribution coefficient at fixed ionic strength and pH, λo,i,pH 271
(L g–1
). 272
13
2
2
3
3
,,M
MR
CatR
CatK
x
x
xxc
IEpHio
(3) 273
274
The resin was calibrated with standard solutions with a pH range of 5.3 to 8.9 and with known 275
concentrations of free Cd2+
(0.24 to 42 nM), Ni2+
(13 to 202 nM) and Zn2+
(4.9 to 148 nM) and the 276
resin distribution coefficient (λ) was calculated for each metal before applying the method to the 277
natural unknown samples (see Supplementary Material). 278
Experimentally, the resin was pre-equilibrated with a matrix solution that had an ionic strength 279
(Ca(NO3)2 as the swamping electrolyte) and pH similar to the calibrating solution and the natural 280
samples; a sufficient volume from a 25 mM Ca(NO3)2 (99.0 %, Sigma–Aldrich Canada Ltd) stock 281
solution was also added to each natural sample so as to obtain a constant Ca concentration of 282
0.46 mM in all natural samples. By levelling the ionic strength of the natural samples, we ensured 283
that the time needed to reach equilibrium between the resin and the sample was similar for all 284
samples and that a single metal-specific distribution coefficient could be used. After a steady-state 285
had been reached between the resin and the sample (190 mL), the resin was rinsed with ultra-pure 286
water and eluted with a volume (V, 6 mL) of 10 % (v/v) ultra-trace nitric acid (BDH Aristar Ultra, 287
VWR International). The amount of free metal originally bound to the resin at steady-state ([R2M]) 288
was calculated using the following equation: 289
290
r
Eluate
m
VMMR
2 (4) 291
292
where EluateM is the concentration of metal measured in the eluate and rm is the mass of the resin 293
used (approximately 7 mg; weighed precisely). Finally, by combining equations 3 and 4, the free 294
metal concentration in the sample was calculated using equation 5. 295
14
296
rpHio
Eluate
m
VMM
,,
2
(5) 297
298
2.4.2 Cupric ion selective electrode (Cu ISE) 299
Because the IET tends to overestimate free Cu2+
when the lake pH is greater than 6.5,[3] we 300
determined Cu2+
in the lake samples using a cupric ion selective electrode (Cu ISE, Orion, Thermo 301
Scientific) following the methods outlined by Rachou et al.[6] The Cu ISE was calibrated daily 302
with a solution containing 0.1-mM copper nitrate (Cu(NO3)2, PlasmaCAL, SPC Science), 1-mM 303
iminodiacetic acid (IDA, Sigma–Aldrich Canada Ltd), 2.5-mM potassium hydrogen phthalate 304
(KHC8H4O4, 99.95 %, Sigma–Aldrich Canada Ltd), 10-mM potassium nitrate (KNO3, 99.995 %, 305
Fluka, Sigma–Aldrich Canada Ltd) and 6-mM sodium hydroxide (NaOH, 98 %, Sigma–Aldrich 306
Canada Ltd). The calibration solution was split into 5 to 11 subsamples with pH values varying 307
from 2 to 11, adjusted by the addition of small known amounts of either HNO3 or NaOH, and 308
allowed to equilibrate overnight. The free Cu2+
concentration calculated ranged from the method 309
detection limit (three times the standard deviation (s.d.) of six replicate blank measurements) of 310
2.6 × 10⁻¹¹
to 6.3 × 10⁻⁵
M. The calibration subsamples with pH values above 6 were bubbled with 311
N2 gas, to avoid a decrease in pH with the dissolution of atmospheric carbon dioxide, CO2 (aq). The 312
pH and temperature of the samples were respectively monitored using an Orion (Orion, Thermo 313
Scientific) electrode and probe. During Cu ISE measurements, constant stirring and temperature 314
conditions were also maintained. The calibrated response of the Cu ISE electrode was determined 315
from the plot of the measured ISE potential against the calculated pCu for each calibration 316
subsample. For the natural water samples, the concentration of Cu2+
was then calculated using the 317
Cu ISE calibration equation and the measured electrode potential. The natural samples were 318
amended with KNO3 (99.995 %, Fluka, Sigma–Aldrich Canada Ltd; a specific volume of a 1.0-M 319
15
stock solution was added to achieve a final concentration of 10 mM KNO3) to ensure a constant 320
ionic strength among the natural samples. 321
322
2.5 Metal speciation calculations 323
The free Cd2+
, Cu2+
, Ni2+
and Zn2+
concentrations measured for each lake were compared with 324
values calculated using the WHAM, model version 6.1.[30] Several assumptions were made in the 325
application of the model to the lake water samples. First, we assumed that the DOC-to-DOM ratio 326
was 2,[31] that 65 % of the DOM was active in the complexation of metals[32] and that this active 327
fraction was composed of FAs only. We also assumed that both FeIII
and AlIII
activities are 328
controlled by the solubility of their hydroxides, as calculated using the respective empirical 329
equations given by Lofts et al.[33] and Tipping.[34] Other measured WHAM input parameters 330
included pH and the total concentrations of Na, Mg, K, Ca, Cr, Co, Ni, Cu, Zn, Cd, Cl, NO3, SO4, 331
CO3 (measured as total inorganic carbon) and F. The measured surface temperature of the lakes 332
sampled (used in the WHAM simulations) varied between 20 and 23 °C. Separate WHAM 333
simulations were run for lake samples analysed using the IET free ion measurement method (for 334
the analysis of free Cd2+
, Ni2+
and Zn2+
) and for those analysed with the ISE method (for the 335
analysis of free Cu2+
); the input data for these simulations corresponded exactly to the composition 336
of the samples used for the free metal ion analyses, thus accounting for the differences in their ionic 337
composition (respective additions of Ca(NO3)2 and KNO3). 338
339
2.6 Statistical analysis 340
All statistical analyses were calculated at the α equals 0.05 confidence level using SigmaPlot 11.0 341
(Systat Software Inc., San Jose, CA). Parametric t-tests and linear and non-linear regression were 342
used when the normality and homogeneity of variances among datasets were confirmed; otherwise, 343
the appropriate non-parametric tests were employed (Mann–Whitney Rank Sum test, in place of the 344

16
t-test). Note that for the regression equations generated between the WHAM calculated percentage 345
of FA active in metal complexation (%aFAopt) and the relative contribution of PARAFAC 346
fluorescence components 1 and 3 to the overall fluorescence spectrum of lake DOM (see 347
Relationships between %aFAopt and DOM spectroscopic properties below), the assumptions of 348
normality and homogeneity of variance were confirmed. The only exception was for Ni, where the 349
variance among the datasets was not constant (P = 0.01). 350
351
3 Results and Discussion 352
3.1 Water quality 353
The speciation of dissolved metals in freshwater systems is sensitive to the concentration of DOM, 354
which tends to complex free metal ions, but may also be affected by other water quality variables, 355
notably the concentrations of Ca, Mg, Al, Fe and the H+ ion, these being potential competitors for 356
the cation binding sites on the DOM.[35] In addition, for a water of given composition, the total 357
dissolved concentration of the metal may affect its speciation (i.e. a limited number of high affinity 358
binding sites). In the following two subsections we describe how the water chemistry varied among 359
the studied lakes. 360
3.1.1 Background water chemistry 361
The water quality (i.e. [major cations], pH) of the lakes was described in Mueller et al.[20] for 2007 362
and 2008. Only the 2008 data are considered here, since the metal speciation measurements date 363
from that year. Wide ranges in general water chemistry (pH, Ca, Mg and DOC concentrations) 364
were found among the eight lakes sampled (Table 1), reflecting both regional geological 365
differences and local differences at the watershed scale.[20] The lakes in both sampling regions 366
have low concentrations of calcium ([Ca]: 68 to 464 µM) and magnesium ([Mg]: 27 to 274 µM), 367
contributing to generally soft water. Lake Bethel, from the Sudbury region, had the highest pH and 368
17
the highest Ca and Mg concentrations of all the lakes; for the IET measurements, all other lake 369
water samples were thus adjusted upwards to these Ca concentrations (see Ion exchange technique 370
(IET) above). 371
Lakes from the Rouyn-Noranda region are circumneutral, with a mean pH of 7.25 and a narrow 372
range of values between pH 6.81 and 7.69. The mean pH for the Sudbury lakes (7.07) is slightly 373
lower than that of the Rouyn-Noranda lakes and pH values span a wider range (6.40 to 8.08). 374
Historically, the Rouyn-Noranda lakes were less affected by anthropogenic acidification than were 375
those in the Sudbury area,[36] despite massive SO2 emissions from the Horne smelter; the Rouyn-376
Noranda lakes are located in the Abitibi clay belt and are effectively better buffered against acid 377
deposition. Although the average circumneutral pH of the lakes in the Sudbury regions is evidence 378
of the recovery of these lakes from historical acidification in recent years,[37] pH values in the 379
lakes of this region spanned a wider range than in the Rouyn-Noranda lakes. 380
Based on their historical chlorophyll-a concentrations (1–4 µg chl-a L–1
; P. G. C. Campbell, 381
unpubl. data), the four studied lakes in the Rouyn-Noranda region are oligotrophic, as are Lakes 382
Raft and Whitson in the Greater Sudbury area (2–3 µg chl-a L–1
; 383
http://www.greatersudbury.ca/cms/index.cfm?app=div_lakewaterquality&lang=en&currID=619, 384
accessed 7 August 2012). We were unable to find comparable data for Lake Geneva, which lies 385
outside the Greater Sudbury area, but given the lack of development in its watershed, it is also 386
likely oligotrophic. The only exception is Lake Bethel, which is much more productive (12–387
24 µg chl-a L–1
; 388
http://www.greatersudbury.ca/cms/index.cfm?app=div_lakewaterquality&lang=en&currID=619) 389
and can be classified as eutrophic. 390
391
18
3.1.2 Dissolved organic carbon 392
The mean DOC concentration of the Rouyn-Noranda lakes was higher (6.1 mg C L–1
) and spanned 393
a wider range (4.9 to 8.1 mg C L–1
) than in the lakes from the Sudbury region (mean of 3.4 mg L–1
; 394
range from 2.0 to 4.9 mg L–1
). The higher DOC concentration in the lakes in the Rouyn-Noranda 395
region than Sudbury lakes reflects the greater soil cover and the higher watershed-to-lake area 396
ratios for the Rouyn-Noranda lakes. As described in Mueller et al.[20] the quantity and the quality 397
of DOM in the lakes sampled vary as a function of regional watershed characteristics as well as 398
DOM processing within the watershed and within the lake itself. 399
DOM optical quality (SUVA254 and Fluorescence Index) was found to differ significantly between 400
sampling regions and among lakes (see Table S1 for more details) and is described elsewhere.[20]
401
The authors also used PARAFAC to extract fluorescence components from EEM fluorescence 402
spectra measured for 19 lakes in the Rouyn-Noranda and Sudbury regions, including the eight lakes 403
retained for the present study. Of particular interest were the humic-like fluorescence components 404
of ubiquitous origin (C1) and allochthonous origin (C3). Component C1 corresponds to a reduced 405
quinone fluorophore associated with higher plant matter, whereas C3 corresponds to an oxidised 406
quinone fluorophore.[20] We used the proportion of each of these DOM fluorescence components 407
(relative to the sum of all four PARAFAC fluorescence components, i.e. C1/CT or C3/CT) as 408
measures of the quality of DOM sampled in our lakes, and in particular as proxies for the fraction 409
of DOM active in the complexation of trace elements (see Optimisation of WHAM VI predictions 410
below). 411
412
19
3.2 Lake-to-lake variations in metal concentrations and metal speciation 413
3.2.1 Total dissolved metal ion concentrations 414
The total dissolved metal concentrations (Cd, Cu, Ni and Zn) varied markedly among the eight 415
lakes sampled (Table 1). For lakes in the Rouyn-Noranda region, the concentration gradient ratios 416
(i.e. the ratio of the maximum metal concentration to the minimum metal concentration, 417
[M]max/[M]min) decreased in the sequence Cd (33) ~ Zn (31) > Cu (7) > Ni (2.5). In the Sudbury 418
region, the [M]max/[M]min ratios decreased in the order Ni (63) > Cd (31) > Cu (16) > Zn (5). Lakes 419
in the Rouyn-Noranda region had significantly higher mean total concentrations of Cd (P = 0.004) 420
and Zn (P = 0.030) than the lakes in the Sudbury area, but lower concentrations of Ni (P < 0.001). 421
No significant difference in total dissolved Cu was found between the sampling regions. 422
The lake-to-lake variability in the measured total dissolved metal concentrations within a given 423
region is largely due to variations in atmospheric loading from local mining and smelting 424
activities.[21,38] Despite the marked reductions in smelter emissions that have been achieved over 425
the past 30 years, lakes in close proximity to and down-wind from the metal smelters (e.g. Lakes 426
Dufault and Dasserat in the Rouyn-Noranda region, Lakes Raft and Whitson in the Sudbury area) 427
still have considerably higher total dissolved metal concentrations than do those located upwind or 428
far downwind. 429
430
3.2.2 Free metal ion concentrations 431
The free Cd2+
, Cu2+
, Ni2+
and Zn2+
concentrations also varied among lakes (Table 1). The ratio of 432
[M2+
]max/[M2+
]min for the Rouyn-Noranda lakes decreased as follows: Zn (121) > Cd (54) > Cu 433
(5.5). Free Ni2+
concentrations were only measurable in one replicate sample from one lake for the 434
Rouyn-Noranda region and, therefore, no concentration gradient ratio was calculated. The ratio of 435
20
[M2+
]max/[M2+
]min for the Sudbury lakes decreased in the sequence Ni (136) > Cu (64) > Cd 436
(40) > Zn (22). As anticipated, lakes that had the highest concentrations of dissolved metal also 437
exhibited the highest free metal ion concentrations. 438
In the present context, where we are comparing measured and predicted metal speciation in 439
different lakes, it is important to consider the relative proportion of the free metal ion in each lake, 440
as this measure takes into account the differences in total dissolved metal concentrations among 441
lakes. As anticipated, copper was much more strongly complexed than the other three metals – the 442
mean percentage of free metal for copper was only 1.3 %, whereas the mean percentages for Cd2+
443
(54 %), Ni2+
(29 %) and Zn2+
(50 %) were much higher (Table 1). For all four metals, and in both 444
the Rouyn-Noranda and Sudbury regions, the percentage of free metal tended to decrease as the pH 445
increased, pointing to complexation competition by protons as an important factor affecting metal 446
speciation. A general decline in the percentage of free metal was also observed for Cd, Cu and Ni 447
as the DOC concentration increased, presumably reflecting an increase in the ligand-to-metal ratio 448
(see Supplementary Materials for these pH and DOC relationships). 449
450
3.2.3 Comparison of the observed metal speciation with literature values 451
In comparing metal speciation in different freshwater environments, the reported free metal ion 452
concentrations are not particularly useful, since they will vary according to the metal loadings 453
affecting the water body. Comparisons of free metal ion proportions are a more meaningful way of 454
evaluating how metal speciation varies from one lake or river to another. In Table 2, we have 455
compiled free metal ion percentages that have been reported in the literature for Cd, Cu, Ni and Zn 456
(the recent review paper by Lofts and Tipping[14] was used as a starting point to identify papers 457
where free metal ion concentrations for natural waters had been reported). Table 2 cannot claim to 458
be comprehensive, as the representation of surface waters from Switzerland and Canada is 459
21
abnormally high, but the compilation does offer some insight into metal-to-metal differences in 460
metal speciation. 461
Copper is the metal for which the Table 2 database is the most extensive and it is also consistently 462
the most strongly complexed metal, followed by Ni > Cd ≥ Zn. For a given metal, however, there 463
are distinct regional differences; the percentage of free metal is virtually always lower in the 464
alkaline Swiss lakes than in the more acidic and more dilute lakes on the Canadian Precambrian 465
Shield. On a relative scale, this difference is particularly notable for Cu2+
, where the percentage can 466
be less than 0.001 % in many of the Swiss lakes but consistently above 1 % in the Canadian surface 467
waters. Factors contributing to this trend include the aforementioned differences is pH and 468
alkalinity (carbonate and hydroxide complexation), but also the metal loadings. Total dissolved 469
metal concentrations in the Canadian lakes are much higher than in the Swiss surface waters (Table 470
2), presumably reflecting inputs from the mining and smelting activities that are prevalent on the 471
Canadian Shield. Higher total metal concentrations, and the resulting higher metal-to-DOM ratios, 472
would be expected to lead to lower degrees of complexation. 473
474
3.3 Lake-to-lake variations in predicted metal speciation and comparison with measured values 475
3.3.1 Initial WHAM simulations 476
Free metal ion concentrations 477
The WHAM VI chemical equilibrium model has been described in detail by Tipping.[39,40] In 478
comparisons with its predecessor (Model V), Model VI does a better job of simulating metal 479
binding to FA and HA, particularly at low metal concentrations, for low [M]/DOC ratios and for 480
metals that tend to bind to the strong metal-binding sites (putative N and S functional groups) that 481
were expressly introduced into Model VI. In brief, FA and HA are assumed to be rigid spheres of 482
uniform size (radii of 0.8 and 1.7 nm) with two classes of ion-binding groups positioned randomly 483
22
on their surface: type A sites correspond to monoprotic carboxylic acid groups, whereas type B 484
sites are modelled as weaker (e.g. phenolic) acid groups. Metal ions and their first hydrolysis 485
products (MOH(n–1)+
) compete with each other, and with protons, for the type A and type B groups. 486
Bidentate metal-binding sites are generated by combining pairs of proton-binding sites (A–A or A–487
B combinations). Only proton-binding sites that are sufficiently close to each other are able to form 488
bi-dentate sites (≤0.45 nm apart; estimated statistically). Similar rules are used to generate 489
tridentate metal-binding sites. 490
When using WHAM to predict the free metal concentrations in the studied lakes, we initially 491
assumed that the components of the DOC pool that participate in metal complexation reactions 492
could be represented entirely by FA (100 % FA, 0 % HA), and that this FA portion corresponds to 493
65 % of the DOC; these choices were based on the recommendation of Bryan et al.[32] for copper 494
complexation in natural waters. Good agreement was observed between predicted and measured 495
values of [Cd2+
] (Fig. 1a), over a 100-fold concentration range (0.01 to 1.1 nM). Agreement for 496
[Zn2+
] was also reasonable (Fig. 1d) over a similar 100-fold concentration range but for free Zn2+
497
concentrations (2 to 280 nM) that were considerably higher than for Cd2+
. In the least contaminated 498
lakes (Geneva, Bethel and notably Opasatica), the predicted free Zn2+
concentrations were 499
somewhat higher than the measured values, suggesting that WHAM VI may underestimate Zn 500
complexation at low dissolved Zn-to-DOC molar ratios. 501
At high free Cu2+
concentrations (>0.4 nM) our ISE measurements and the free Cu2+
values 502
predicted by WHAM VI were in very good agreement (Fig. 1b), but below this threshold, in Lakes 503
Vaudray, Geneva, Opasatica and Bethel, our measured values were 4 to 22 times higher than the 504
predicted values. In their study of Cu speciation in three natural waters with similar low total 505
dissolved Cu concentrations (19–30 nM), Unsworth et al.[12] also reported measured values of 506
Cu2+
that exceeded WHAM VI predictions; free Cu2+
concentrations as estimated by two 507
23
independent techniques (Donnan membrane; Hollow-fibre permeable liquid membrane) were 1 to 3 508
orders of magnitude higher than the WHAM VI predictions. 509
The generic constants used in WHAM VI have been generated from laboratory titrations of isolated 510
HA and FA. Copper/DOC ratios in these titrations are very often higher than those encountered in 511
natural water samples, and thus one might have expected calculations with the generic constants to 512
underestimate copper complexation. However, we observe the opposite result (overestimation of 513
Cu complexation, as was the case for Unsworth et al.[12]). Clearly more experiments to determine 514
the conditional equilibrium constants for the complexation of Cu to DOM should be carried out 515
under conditions approaching those found in natural waters (e.g. low Cu/DOC ratios; natural rather 516
than isolated organic matter). 517
In our experiments, but not in those of Unsworth et al.,[12] there is a second possible explanation 518
of an analytical nature for the discrepancy between measured and modelled free Cu2+
519
concentrations. In the four lakes with low total Cu concentrations, the total dissolved Cu 520
concentration may be below that which is necessary to properly measure the free Cu2+
521
concentration using an ISE (~10–7
M) in a partially buffered system.[6,31,41] In such systems, if 522
the buffering capacity is insufficient, Cu contamination from the electrode during the 523
potentiometric measurement may artificially increase the apparent [Cu2+
] value. However, if this 524
were the case, all four lakes might be expected to exhibit similar Cu2+
concentrations, which is not 525
the case. Note too that in all our lakes, the free Cu2+
concentration is buffered by the DOM 526
naturally present in the samples. 527
Finally, WHAM VI consistently over-predicted the free Ni2+
concentration in all the lakes where 528
the ambient concentration was above the method detection limit (Fig. 1c), i.e. the opposite result 529
from that with Cu, suggesting that the default equilibrium constants for the complexation of Ni to 530
24
natural DOM are too low for the environmental conditions found in our lakes. Van Laer et al.[42] 531
came to a similar conclusion in their study of the complexation of Ni by the DOM present in six 532
Belgian surface waters. At their background Ni concentrations (40 to 80 nM), the measured free-533
ion fraction, as measured using the Donnan membrane technique, varied from 4 to 45 %; WHAM 534
VI overestimated the free-ion proportion more than two-fold, even if it was assumed that all the 535
DOM was present as FA and actively participating in Ni complexation. 536
Free metal ion percentages 537
A comparison was also made between measured and modelled ‘percentage free metal’ values to 538
take into account differences in the total metal concentrations specific to each lake (Fig. 2). A lake-539
specific percentage free metal limit of quantification (LOQ) was calculated for each lake based on 540
three times the standard deviations of triplicate measurements of both the free metal and total metal 541
concentrations measured for each lake. Any percentage free metal value calculated for a lake that 542
yielded a value below its LOQ was discarded. 543
In addition to using the default assumption that 65 % of the DOM is present as FA and is active in 544
metal complexation, we also calculated a range of model percentage free metal predictions by 545
arbitrarily halving (33 %) and doubling (130 %) this value. It should be noted that increasing the 546
%aFA to a value higher than 100 % simply increases the number of FA binding sites involved to a 547
value that exceeds the complexation capacity (µmol binding sites per unit carbon) of the default 548
FA. In the presentation of the results of these simulations (Fig. 2), the calculated percentage free 549
metal is depicted as an envelope of values for each lake: the middle value corresponds to the 550
default value obtained with the assumption of 65 % aFA, whereas the upper and lower values 551
correspond to the percentage free metal calculated with 33 and 130 % as the proportions of DOM 552
active in metal complexation. The bracket of upper and lower percentage free metal values included 553
the measured percentage free metal values for both Cd and Zn in most lakes (7 of 8). The lakes for 554

25
which the measured value fell outside the predicted envelope were those with the lowest total and 555
free metal concentrations. Even with the assumption of only 33 % aFA, i.e. minimum 556
complexation, WHAM VI still predicted a lower percentage free Cu2+
than the measured value for 557
the lakes with the lowest total Cu concentrations (4 of 8). Similarly, even with the assumption of 558
130 % aFA, i.e. maximum complexation, the measured values of percentage free Ni2+
all fell below 559
the minimum predicted value. 560
3.3.2 Optimization of WHAM VI predictions 561
The chemical equilibrium simulations discussed to this point were run with WHAM VI in its 562
default mode, using the assumptions that were outlined earlier. Among the adjustable WHAM input 563
parameters are (i) the user-defined proportion of DOM active in metal complexation and (ii) the 564
relative proportions of FA and HA making up the DOM that is active in metal complexation. The 565
latter parameter varies as a function of the type of organic matter, e.g. whether it is derived from 566
soil water, peat water or lake water.[32] The proportion of DOM that is active in metal 567
complexation is usually unknown and must be estimated by the user of WHAM. 568
At this point, we retained the assumption that the DOM actively involved in metal complexation 569
could be represented as FA, but we removed any constraint on the ‘percentage active FA’ and ran 570
multiple simulations for each lake and each metal, individually. The optimal percentage of FA 571
actively involved in metal complexation (%aFAopt) required to exactly predict the measured free 572
metal ion was calculated by repeatedly running WHAM Model VI, adjusting the FA concentration 573
until the predicted free metal ion concentration equalled the observed value. A computer code was 574
used to automatically run WHAM and optimise the values of %aFA. The %aFAopt was calculated 575
in this manner for each metal and for each lake as: 576
26
[DOC]2
[FA]100aFA%
opt
opt
577
where [FA]opt is the optimised FA concentration (mg L–1
) and [DOC] is the DOC concentration 578
(mg L–1
). In a given lake and for a particular metal, an optimal %aFA for each of the triplicate 579
samples was calculated by finding the FA concentration that best described all the measured free 580
ion concentrations for each sample simultaneously (Table 3). This was done by adjusting the model 581
FA concentration, as before, and minimising the error term. 582
583
where [M]obs,i and [M]calc,i are the observed and calculated free ion concentrations for metal i. 584
By increasing or decreasing the %aFA, the number of FA binding sites involved in metal 585
complexation is either increased or decreased, whereas the intrinsic metal binding affinities at these 586
binding sites remain constant. In other words, the ligand concentration is adjusted. As can be seen 587
in Table 3, the optimal %aFA values obtained in this manner varied from lake to lake, presumably 588
reflecting inter-lake differences in the quality of the DOM. For Cu2+
the %aFAopt values all fell in 589
the 8 to 90 % range, but for Cd2+
, Zn2+
and particularly Ni2+
, the values were all much higher, often 590
exceeding the notional limit of 100 %: 61 to 250 % for Cd2+
; 65 to 410 % for Zn2+
and 440 to 591
1900 % for Ni. 592
3.3.3 Possible reasons for the divergence between WHAM calculations and measured metal 593
speciation 594
Although increasing the %aFA, and thus augmenting the number of binding sites on the FA (as 595
described in the preceding section), is an acceptable adjustment, increasing this value up to three 596
orders of magnitude higher than the default value is clearly unrealistic. This result suggests that in 597
i
ii
1
2
calc,obs, )]M[]M([

27
addition to adjusting the binding capacity of the FA, it will likely also be necessary to adjust metal 598
binding affinities (KMA)[39] for Cd, Zn and especially Ni. There may well be natural ligands 599
present in the lake water that have a higher affinity for Ni than does FA. Further experiments to 600
determine the binding constants of these metals with natural DOM, at environmentally realistic 601
metal concentrations, are clearly needed. 602
Discrepancies between WHAM predictions and measured free-metal ion concentrations could also 603
arise if ligands other than FA and HA were involved in metal complexation. For example, Baken et 604
al.[43] detected amino-polycarboxylate anions in some urban Belgian surface waters and suggested 605
that these ligands of anthropogenic origin were responsible for the greater than expected metal 606
complexation in these samples (as seen here for Ni). However, such an explanation seems unlikely 607
in the present case, given the remote location of our lakes and the absence of urban wastewater 608
inputs. 609
610
3.4 Relationships between %aFAopt and DOM spectroscopic properties 611
Given the marked lake-to-lake differences in %aFAopt, we explored possible relationships between 612
this value and the optical properties of the DOM in the original lake water samples. Initially we 613
looked for relationships with SUVA254 values, given the promising results obtained by soil 614
scientists working on Cu and Cd speciation in soil solutions.[17,18] However, plots of %aFAopt 615
against SUVA254 or the fluorescence index failed to yield useful relationships (see Figs S5, S6). 616
Our interest then turned to the fluorescence spectrum, to determine if it could be used to estimate 617
the proportion of DOM that is active in metal complexation. We plotted the relative fluorescence of 618
each of the four PARAFAC fluorescence components against the %aFA needed to force the 619
WHAM-calculated free metal concentration to equal the measured free metal ion concentration 620

28
(%aFAopt) (see Figs S7, S8). The most statistically significant relationships with %aFAopt for the 621
four metals emerged for C1/CT and C3/CT (Fig. 3). In seeking such relationships, we are using the 622
fluorescence EEM as a ‘proxy’ for the composition of the DOM. Although spectrofluorimetry does 623
not necessarily probe the functional groups or the exact sites involved in metal complexation by the 624
DOM, it is nevertheless a useful and easy way to track changes in the quality of DOM in natural 625
aquatic samples.[20,44] 626
For Cd, the strongest (R2 = 0.79) and most statistically significant (P < 0.0001) relationship 627
(y = 380e(–6.4x)
) emerged between %FAopt and the relative proportion of C3 (Fig. 3e). A statistically 628
significant (P < 0.001) positive linear relationship (y = 1100x – 260; R2 = 0.62) was found between 629
Cu and C1/CT (Fig. 3b). For Ni a strong (R2 = 0.96) and significant (P < 0.001) linear relationship 630
(y = –20 000x + 6800) was observed with C1/CT (Fig. 3c). Finally, a weak (R2 = 0.33), but 631
statistically significant (P = 0.01) decreasing exponential relationship (y = 560e(–5.3x)
) was found 632
between Zn and C3/CT (Fig. 3h). 633
In terms of the ubiquitous humic-like DOM fluorescence component (C1), the positive linear 634
relationships between %aFAopt and C1/CT for Cd and Cu (Fig. 3a, b) suggest that with an increase 635
in the relative contribution of this component in the lakewater samples, the proportion of the DOM 636
that is involved in Cd and Cu complexation increases. In contrast, a negative linear relationship was 637
found for Ni (Fig. 3c), indicating a decrease in the binding capacity of the DOM for Ni. With 638
respect to the allochthonous-like DOM component (C3), the negative exponential relationships 639
between %aFAopt and C3/CT for Cd and Zn (Fig. 3e, h) suggest that with an increase in the 640
allochthonous signature of the DOM in the lakewater samples, the proportion of the DOM that is 641
involved in Cd and Zn complexation decreases. In contrast, a weak but positive relationship with 642
the C3/CT ratio was found for Ni – as the allochthonous signature of the DOM in the lake samples 643
decreases, the binding activity of the DOM for Ni increases. This singular behaviour of Ni, as 644
29
demonstrated by the contrast between Fig. 3c and 3g and the comparable plots for the other metals, 645
suggests that the DOM binding sites active in Cd, Cu and Zn complexation are different from those 646
involved in Ni complexation. To our knowledge, this is the first time that such a distinction has 647
been resolved in natural water samples. 648
Admittedly the relationships shown in Fig. 3 will have to be explored over a wider range of DOM 649
samples, but they do support our original idea that the proportion of DOM active in metal 650
complexation could be estimated on the basis of its fluorescence signature and then introduced into 651
chemical equilibrium models such as WHAM. To test this idea, we incorporated each lake’s 652
optimised %aFA value, as calculated from the relationship between %aFA optimised and C1/CT or 653
C3/CT for each metal and lake (i.e. the regressions shown in Fig. 3), into WHAM and re-ran the 654
chemical equilibrium simulations to predict the free M2+
concentrations; this was done for each 655
metal, since the optimised %aFA value is metal-specific. Fig. 4 depicts the comparison between 656
these ‘improved’ WHAM calculations of free M2+
and the measured free M2+
concentrations. 657
Compared with the results presented in Fig. 1, the greatest improvement using the C1/CT ratio was 658
found for nickel, for which the modelled free Ni2+
decreased to within at most a factor of 1.3 659
difference from the measured free Ni2+
concentrations. For Cd2+
and Zn2+
, metals for which the 660
original WHAM predictions were already good, no improvement was noted (indeed the agreement 661
was slightly worse than with the arbitrary value of 65 % active FA). Although the WHAM 662
calculation of free Ni2+
in our lakes was improved by estimating the proportion of FAs active in Ni 663
complexation from the spectroscopic quality of DOM, the estimated %aFA was still unrealistically 664
high, as mentioned earlier. Nevertheless, the idea of using the spectroscopic quality of DOM as a 665
proxy for the proportion of DOM that is active in metal complexation remains promising. 666
667
30
3.5 Conclusions 668
The main goal of this study was to explore the possibility of incorporating a measure of the quality 669
of DOM into chemical speciation models, such as WHAM, to improve their predictions of trace 670
metal speciation in natural aquatic systems. For Cd, Cu, Ni and Zn, we have shown that such an 671
approach is feasible, using simple fluorescence measurements on lakewater DOM to estimate the 672
proportion of DOM that is actively involved in metal complexation (as was done in generating Fig. 673
4). However, our results have also indicated that in addition to adjustments to the metal-binding 674
capacity of the DOM, it may also be necessary to adjust the affinity constants that are used by 675
WHAM to calculate the speciation of some metals, especially Ni; the possibility of using the 676
spectroscopic properties of DOM to predict its metal-binding affinity should be explored. The 677
possible involvement of ligands other than FA and HA in metal complexation should also be 678
considered, particularly for samples with low total trace metal concentrations. Improved trace metal 679
speciation predictions, especially at low, environmentally significant metal concentrations, will be 680
important not only for geochemical studies, but also for the prediction of chronic toxicity in natural 681
aquatic systems (e.g. as part of models such as the Biotic Ligand Model or BLM[45]). 682
4 Acknowledgements 683
The authors acknowledge the technical assistance provided by M.G. Bordeleau, S. Duval, P. 684
Fournier and J. Perreault in the laboratory and P. Girard and A. Cremazy in the field. Sampling was 685
greatly facilitated by the personnel of the Laurentian University Cooperative Freshwater Ecology 686
Unit, led by J. Gunn, in the Sudbury area and by L. Jourdain of the Ministère des Ressources 687
naturelles et de la Faune du Québec in the Rouyn-Noranda area. Access to limnological data for 688
the Sudbury area lakes was provided by Stephen Monet of the City of Greater Sudbury. Financial 689
support was provided by the Natural Sciences and Engineering Research Council of Canada and by 690
the Metals in the Human Environment Research Network (www.mithe-rn.org). P.G.C. Campbell 691
31
and C. Fortin are supported by the Canada Research Chair Program. S. Lofts acknowledges the 692
support of the Natural Environment Research Council . 693
694
5 References 695
[1] G. E. Batley, S. C. Apte, J. L. Stauber, Speciation and bioavailability of trace metals in 696
water: Progress since 1982. Aust. J. Chem. 2004, 57, 903-19. 697
[2] L. E. Doig, K. Liber, Nickel speciation in the presence of different sources and fractions of 698
dissolved organic matter. Ecotoxicol.Environ.Saf. 2007, 66, 169-77. 699
[3] C. Fortin, Y. Couillard, B. Vigneault, P. G. C. Campbell, Determination of free Cd, Cu and 700
Zn concentrations in lake waters by in situ diffusion followed by column equilibration ion-701
exchange. Aquat. Geochem. 2010, 16, 151-72. 702
[4] I. A. M. Worms, K. J. Wilkinson, Determination of Ni2+
using an equilibrium ion exchange 703
technique: Important chemical factors and applicability to environmental samples. Anal. Chim. 704
Acta. 2008, 616, 95-102. 705
[5] H. B. Xue, W. G. Sunda, Comparison of [Cu2+
] measurements in lake water determined by 706
ligand exchange and cathodic stripping voltammetry and by ion-selective electrode. Environ. Sci. 707
Technol. 1997, 31, 1902-9. 708
[6] J. Rachou, C. Gagnon, S. Sauvé, Use of an ion-selective electrode for free copper 709
measurements in low salinity and low ionic strength matrices. Environ. Chem. 2007, 4, 90-7. 710
[7] H. B. Xue, L. Sigg, Free cupric ion concentration and Cu(II) speciation in a eutrophic lake. 711
Limnol. Oceanogr. 1993, 38, 1200-13. 712
[8] L. Sigg, F. Black, J. Buffle, J. Cao, R. Cleven, W. Davison, J. Galceran, P. Gunkel, E. Kalis, 713
D. Kistler, M. Martin, S. Noel, Y. Nur, N. Odzak, J. Puy, W. Van Riemsdijk, E. Temminghoff, M. 714
L. Tercier-Waeber, S. Toepperwien, R. M. Town, E. Unsworth, K. W. Warnken, L. P. Weng, H. B. 715
32
Xue, H. Zhang, Comparison of analytical techniques for dynamic trace metal speciation in natural 716
freshwaters. Environ. Sci. Technol. 2006, 40, 1934-41. 717
[9] L. Weng, F. Alonso Vega, W. H. Van Riemsdijk, Strategies in the application of the 718
Donnan membrane technique. Environ. Chem. 2011, 8, 466. 719
[10] Y. Dudal, F. Gérard, Accounting for natural organic matter in aqueous chemical equilibrium 720
models: a review of the theories and applications. Earth-Sci. Rev. 2004, 66, 199-216. 721
[11] F. M. M. Morel, J. G. Hering, Principles and Applications of Aquatic Chemistry, (1993, pp. 722
358-95 (J. Wiley & Sons Ltd.: New York, NY, USA). 723
[12] E. R. Unsworth, K. W. Warnken, H. Zhang, W. Davison, F. Black, J. Buffle, J. Cao, R. 724
Cleven, J. Galceran, P. Gunkel, E. Kalis, D. Kistler, H. P. van Leeuwen, M. Martin, S. Noel, Y. 725
Nur, O. Odzak, J. Puy, W. Van Riemsdijk, L. Sigg, E. Temminghoff, M. L. Tercier-Waeber, S. 726
Toepperwein, R. M. Town, L. Weng, H. Xue, Model predictions of metal speciation in freshwaters 727
compared to measurements by in situ techniques. Environ. Sci. Technol. 2006, 40, 1942-9. 728
[13] J. W. Guthrie, N. M. Hassan, M. S. A. Salam, I. I. Fasfous, C. A. Murimboh, J. Murimboh, 729
C. L. Chakrabarti, D. C. Grégoire, Complexation of Ni, Cu, Zn, and Cd by DOC in some metal-730
impacted freshwater lakes: a comparison of approaches using electrochemical determination of 731
free-metal-ion and labile complexes and a computer speciation model, WHAM V and VI. Anal. 732
Chim. Acta. 2005, 528, 205-18. 733
[14] S. Lofts, E. Tipping, Assessing WHAM/Model VII against field measurements of free metal 734
ion concentrations: model performance and the role of uncertainty in parameters and inputs. 735
Environ. Chem. 2011, 8, 501-16. 736
[15] J. G. Richards, P. J. Curtis, B. K. Burnison, R. C. Playle, Effects of natural organic matter 737
source on reducing metal toxicity to rainbow trout (Oncorhynchus mykiss) and on metal binding to 738
their gills. Environ. Toxicol. Chem. 2001, 20, 1159-66. 739
33
[16] C. D. Luider, J. Crusius, R. C. Playle, P. J. Curtis, Influence of natural organic matter source 740
on copper speciation as demonstrated by Cu binding to fish gills, by ion selective electrode, and by 741
DGT gel sampler. Environ. Sci. Technol. 2004, 38, 2865-72. 742
[17] F. Amery, F. Degryse, K. Cheyns, I. De Troyer, J. Mertens, R. Merckx, E. Smolders, The 743
UV-absorbance of dissolved organic matter predicts the fivefold variation in its affinity for 744
mobilizing Cu in an agricultural soil horizon. Eur. J. Soil Sci. 2008, 59, 1087-95. 745
[18] J. Y. Cornu, A. Schneider, K. Jezequel, L. Denaix, Modelling the complexation of Cd in soil 746
solution at different temperatures using the UV-absorbance of dissolved organic matter. Geoderma. 747
2011, 162, 65-70. 748
[19] J. Y. Cornu, C. Parat, A. Schneider, L. Authier, M. Dauthieu, V. Sappin-Didier, L. Denaix, 749
Cadmium speciation assessed by voltammetry, ion exchange and geochemical calculation in soil 750
solutions collected after soil rewetting. Chemosphere. 2009, 76, 502-8. 751
[20] K. K. Mueller, C. Fortin, P. G. C. Campbell, Spatial variation in the optical properties of 752
dissolved organic matter (DOM) in lakes on the Canadian Precambrian shield and links to 753
watershed characteristics. Aquat. Geochem. 2012, 18, 21-44. 754
[21] U. Borgmann, T. B. Reynoldson, F. Rosa, W. P. Norwood, Final report on the effects of 755
atmospheric deposition of metals from the Sudbury smelters on aquatic ecosystems. Report No. 01-756
023 1998 (Environment Canada: Burlington, ON, Canada). 757
[22] A. S. Dixit, S. Alpay, S. S. Dixit, J. P. Smol, Paleolimnological reconstructions of Rouyn-758
Noranda lakes within the zone of influence of the Horne Smelter, Quebec, Canada. J. Paleolimnol. 759
2007, 38, 209-26. 760
[23] N. D. Yan, G. E. Miller, Effects of deposition of acids and metals on chemistry and biology 761
of lakes near Sudbury, Ontario, in Environmental impacts of smelters (Ed. J. O. Nriagu) 1984, pp. 762
243-82 (John Wiley & Sons). 763
34
[24] J. L. Weishaar, G. R. Aiken, B. A. Bergamaschi, M. S. Fram, R. Fujii, K. Mopper, 764
Evaluation of specific ultraviolet absorbance as an indicator of the chemical composition and 765
reactivity of dissolved organic carbon. Environ. Sci. Technol. 2003, 37, 4702-8. 766
[25] R. M. Cory, M. P. Miller, D. M. McKnight, J. J. Guerard, P. L. Miller, Effect of instrument-767
specific response on the analysis of fulvic acid fluorescence spectra. Limnol. Oceanogr. Methods. 768
2010, 8, 67-78. 769
[26] D. McKnight, M., E. W. Boyer, P. K. Westerhoff, P. T. Doran, T. Kulbe, D. T. Andersen, 770
Spectrofluorometric characterization of dissolved organic matter for identification of precursor 771
organic material and aromaticity. Limnol. Oceanogr. 2001, 46, 38-48. 772
[27] C. A. Stedmon, R. Bro, Characterizing dissolved organic matter fluorescence with parallel 773
factor analysis: a tutorial. Limnol. Oceanogr. Methods. 2008, 6, 572-9. 774
[28] C. A. Andersson, R. Bro, The N-way Toolbox for MATLAB. Chemometrics Intell. Lab. 775
Syst. 2000, 52, 1-4. 776
[29] C. Fortin, P. G. C. Campbell, An ion-exchange technique for free-metal ion measurements 777
(Cd2+
, Zn2+
): applications to complex aqueous media. Int. J. Environ. Anal. Chem. 1998, 72, 173-778
94. 779
[30] E. Tipping, Humic ion-binding Model VI: an improved description of the interactions of 780
protons and metal ions with humic substances. Aquat.Geochem. 1998, 4, 3-48. 781
[31] J. Buffle, Complexation Reactions in Aquatic Systems: An Analytical Approach 1988 (Ellis 782
Horwood Ltd.: Chichester, UK). 783
[32] S. E. Bryan, E. Tipping, J. Hamilton-Taylor, Comparison of measured and modelled copper 784
binding by natural organic matter in freshwaters. Comp. Biochem. Physiol., C: Toxicol. Pharmacol. 785
2002, 133, 37-49. 786
[33] S. Lofts, E. Tipping, J. Hamilton-Taylor, The chemical speciation of Fe(III) in freshwaters. 787
Aquat. Geochem. 2008, 14, 337-58. 788
35
[34] E. Tipping, Modelling Al competition for heavy metal binding by dissolved organic matter 789
in soil and surface waters of acid and neutral pH. Geoderma. 2005, 127, 293-304. 790
[35] E. Tipping, C. Rey-Castro, S. E. Bryan, J. Hamilton-Taylor, Al(III) and Fe(III) binding by 791
humic substances in freshwaters, and implications for trace metal speciation. Geochim. 792
Cosmochim. Acta. 2002, 66, 3211-24. 793
[36] J. Dupont, Quebec lake survey: II. Origin and extent of acidification. Water Air Soil Pollut. 794
1992, 61, 125-37. 795
[37] W. Keller, N. Yan, J. Gunn, J. Heneberry, Recovery of acidified lakes: Lessons from 796
Sudbury, Ontario, Canada. Water Air Soil Pollut.: Focus. 2007, 7, 317-22. 797
[38] Y. Couillard, M. Courcelles, A. Cattaneo, S. Wunsam, A test of the integrity of metal 798
records in sediment cores based on the documented history of metal contamination in Lac Dufault 799
(Québec, Canada). J.Paleolimnol. 2004, 32, 149-62. 800
[39] E. Tipping, Cation binding by humic substances 2002 (Cambridge University Press: 801
Cambridge, UK). 802
[40] E. Tipping, S. Lofts, J. E. Sonke, Humic Ion-Binding Model VII: a revised parameterisation 803
of cation-binding by humic substances. Environ. Chem. 2011, 8, 225-35. 804
[41] A. M. Mota, M. M. Correia Dos Santos, Trace metal speciation of labile chemical species: 805
Electrochemical methods, in Metal Speciation and Bioavailability in Aquatic Systems (Eds A. 806
Tessier, D. Turner) 1995, pp. 205-57 (J. Wiley & Sons: Chichester, UK). 807
[42] L. Van Laer, E. Smolders, F. Degryse, C. Janssen, K. A. C. De Schamphelaere, Speciation 808
of nickel in surface waters measured with the Donnan membrane technique. Anal. Chim. Acta. 809
2006, 578, 195-202. 810
[43] S. Baken, F. Degryse, L. Verheyen, R. Merckx, E. Smolders, Metal complexation properties 811
of freshwater dissolved organic matter are explained by its aromaticity and by anthropogenic 812
ligands. Environ. Sci. Technol. 2011, 45, 2584-90. 813
36
[44] J. B. Fellman, E. Hood, R. G. M. Spencer, Fluorescence spectroscopy opens new windows 814
into dissolved organic matter dynamics in freshwater ecosystems: A review. Limnol. Oceanogr. 815
2010, 55, 2452-62. 816
[45] V. I. Slaveykova, K. J. Wilkinson, Predicting the bioavailability of metals and metal 817
complexes: Critical review of the Biotic Ligand Model. Environ. Chem. 2005, 2, 9-24. 818
[46] E. J. J. Kalis, L. P. Weng, F. Dousma, E. J. M. Temminghoff, W. H. Van Riemsdijk, 819
Measuring free metal ion concentrations in situ in natural waters using the Donnan Membrane 820
Technique. Environ. Sci. Technol. 2006, 40, 955-61. 821
[47] Y. Gopalapillai, I. I. Fasfous, J. D. Murimboh, T. Yapici, P. Chakraborty, C. L. Chakrabarti, 822
Determination of free nickel ion concentrations using the ion exchange technique: application to 823
aqueous mining and municipal effluents. Aquat. Geochem. 2008, 14, 99-116. 824
[48] H. B. Xue, A. Oestreich, D. Kistler, L. Sigg, Free cupric ion concentrations and Cu 825
complexation in selected Swiss lakes and rivers. Aquat. Sci. 1996, 58, 69-87. 826
[49] H. B. Xue, L. Sigg, Zinc speciation in lake waters and its determination by ligand exchange 827
with EDTA and differential pulse anodic stripping voltammetry. Anal. Chim. Acta. 1994, 284, 505-828
15. 829
830
831
37
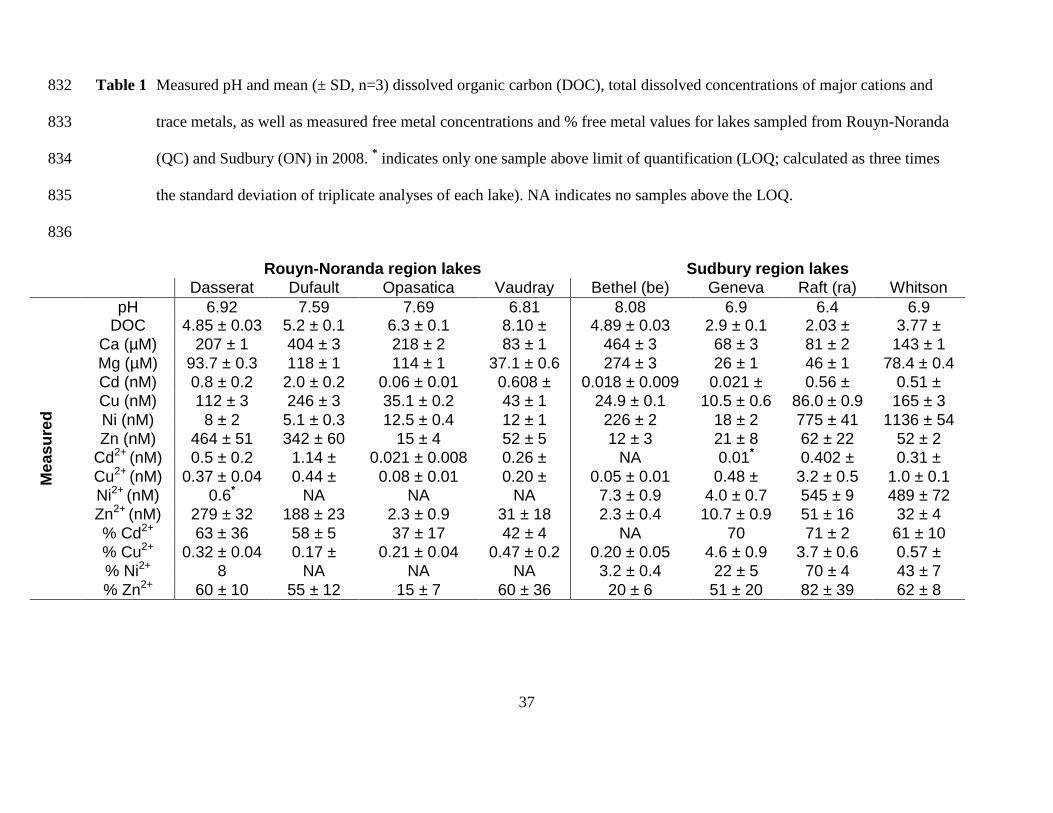
Table 1 Measured pH and mean (± SD, n=3) dissolved organic carbon (DOC), total dissolved concentrations of major cations and 832
trace metals, as well as measured free metal concentrations and % free metal values for lakes sampled from Rouyn-Noranda 833
(QC) and Sudbury (ON) in 2008. * indicates only one sample above limit of quantification (LOQ; calculated as three times 834
the standard deviation of triplicate analyses of each lake). NA indicates no samples above the LOQ. 835
836
Rouyn-Noranda region lakes Sudbury region lakes
Dasserat
(DS)
Dufault
(DU)
Opasatica
(OP)
Vaudray
(VA)
Bethel (be) Geneva
(ge)
Raft (ra) Whitson
(wh)
Me
as
ure
d
pH 6.92 7.59 7.69 6.81 8.08 6.9 6.4 6.9 DOC
(mg∙L-1)
4.85 ± 0.03 5.2 ± 0.1 6.3 ± 0.1 8.10 ±
0.08
4.89 ± 0.03 2.9 ± 0.1 2.03 ±
0.03
3.77 ±
0.05 Ca (µM) 207 ± 1 404 ± 3 218 ± 2 83 ± 1 464 ± 3 68 ± 3 81 ± 2 143 ± 1
Mg (µM) 93.7 ± 0.3 118 ± 1 114 ± 1 37.1 ± 0.6 274 ± 3 26 ± 1 46 ± 1 78.4 ± 0.4
Cd (nM) 0.8 ± 0.2 2.0 ± 0.2 0.06 ± 0.01 0.608 ±
0.005
0.018 ± 0.009 0.021 ±
0.005
0.56 ±
0.02
0.51 ±
0.04 Cu (nM) 112 ± 3 246 ± 3 35.1 ± 0.2 43 ± 1 24.9 ± 0.1 10.5 ± 0.6 86.0 ± 0.9 165 ± 3
Ni (nM) 8 ± 2 5.1 ± 0.3 12.5 ± 0.4 12 ± 1 226 ± 2 18 ± 2 775 ± 41 1136 ± 54
Zn (nM) 464 ± 51 342 ± 60 15 ± 4 52 ± 5 12 ± 3 21 ± 8 62 ± 22 52 ± 2
Cd2+ (nM) 0.5 ± 0.2 1.14 ±
0.06
0.021 ± 0.008 0.26 ±
0.02
NA 0.01* 0.402 ±
0.004
0.31 ±
0.05 Cu2+ (nM) 0.37 ± 0.04 0.44 ±
0.09
0.08 ± 0.01 0.20 ±
0.08
0.05 ± 0.01 0.48 ±
0.09
3.2 ± 0.5 1.0 ± 0.1
Ni2+ (nM) 0.6* NA NA NA 7.3 ± 0.9 4.0 ± 0.7 545 ± 9 489 ± 72
Zn2+ (nM) 279 ± 32 188 ± 23 2.3 ± 0.9 31 ± 18 2.3 ± 0.4 10.7 ± 0.9 51 ± 16 32 ± 4
% Cd2+ 63 ± 36 58 ± 5 37 ± 17 42 ± 4 NA 70 71 ± 2 61 ± 10
% Cu2+ 0.32 ± 0.04 0.17 ±
0.04
0.21 ± 0.04 0.47 ± 0.2 0.20 ± 0.05 4.6 ± 0.9 3.7 ± 0.6 0.57 ±
0.08 % Ni2+ 8 NA NA NA 3.2 ± 0.4 22 ± 5 70 ± 4 43 ± 7
% Zn2+ 60 ± 10 55 ± 12 15 ± 7 60 ± 36 20 ± 6 51 ± 20 82 ± 39 62 ± 8

38
837
838
Table 2 Mean (± SD, n=3) calculated %aFAopt for lakes sampled from Rouyn-839
Noranda (QC) and Sudbury (ON) in 2008. 840
841
%aFAopt
Lake (code) Cd Cu Ni Zn
Dasserat (DS) 93 ± 41 80 ± 12 1400a 95 ± 33
Dufault (DU) 61 ± 3 56 ± 8 NAb 65 ± 21
Opasatica (OP) 75 ± 5 16 ± 3 NA 310 ± 33
Vaudray (VA) 92 ± 14 32 ± 7 NA 95 ± 90
Bethel (be) NA 9 ± 2 1900 ± 130 190 ± 36
Geneva (ge) 140a 8 ± 1 890 ± 170 290 ± 120
Raft (ra) 250 ± 23 86 ± 8 440 ± 74 410 ± 4
Whitson (wh) 140 ± 31 90 ± 8 580 ± 75 180 ± 51
842
a indicates only one sample above limit of quantification (LOQ; calculated as three 843
times the standard deviation of triplicate analyses of each lake). 844
b NA indicates values not available. 845
846
847
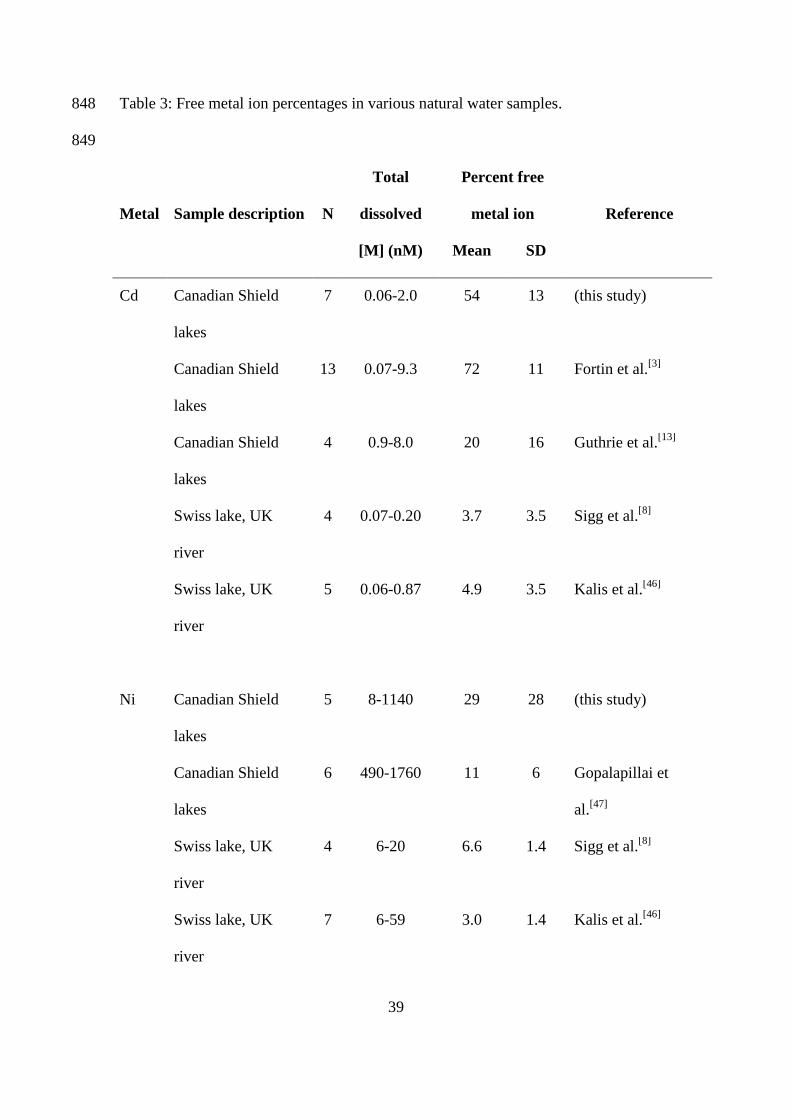
39
Table 3: Free metal ion percentages in various natural water samples. 848
849
Metal
Sample description
N
Total
dissolved
[M] (nM)
Percent free
metal ion
Reference
Mean SD
Cd Canadian Shield
lakes
7 0.06-2.0 54 13 (this study)
Canadian Shield
lakes
13 0.07-9.3 72 11 Fortin et al.[3]
Canadian Shield
lakes
4 0.9-8.0 20 16 Guthrie et al.[13]
Swiss lake, UK
river
4 0.07-0.20 3.7 3.5 Sigg et al.[8]
Swiss lake, UK
river
5 0.06-0.87 4.9 3.5 Kalis et al.[46]
Ni Canadian Shield
lakes
5 8-1140 29 28 (this study)
Canadian Shield
lakes
6 490-1760 11 6 Gopalapillai et
al.[47]
Swiss lake, UK
river
4 6-20 6.6 1.4 Sigg et al.[8]
Swiss lake, UK
river
7 6-59 3.0 1.4 Kalis et al.[46]
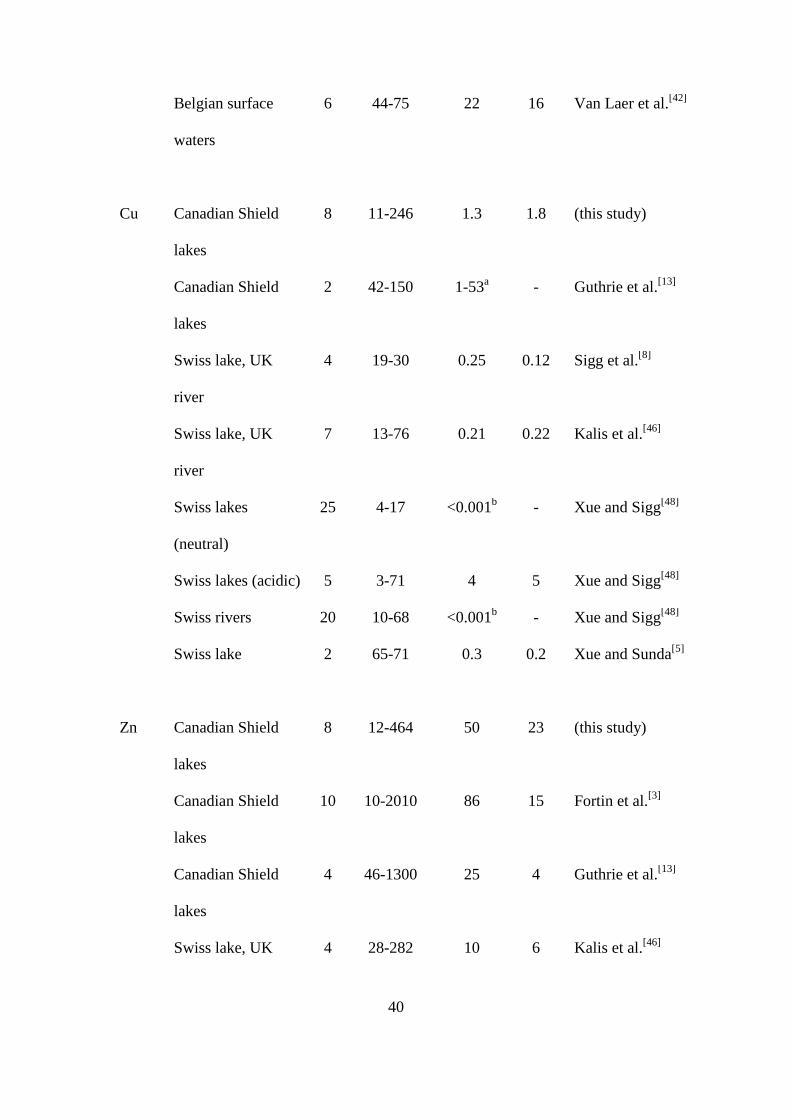
40
Belgian surface
waters
6 44-75 22 16 Van Laer et al.[42]
Cu Canadian Shield
lakes
8 11-246 1.3 1.8 (this study)
Canadian Shield
lakes
2 42-150 1-53a
- Guthrie et al.[13]
Swiss lake, UK
river
4 19-30 0.25 0.12 Sigg et al.[8]
Swiss lake, UK
river
7 13-76 0.21 0.22 Kalis et al.[46]
Swiss lakes
(neutral)
25 4-17 <0.001b - Xue and Sigg
[48]
Swiss lakes (acidic) 5 3-71 4 5 Xue and Sigg[48]
Swiss rivers 20 10-68 <0.001b - Xue and Sigg
[48]
Swiss lake 2 65-71 0.3 0.2 Xue and Sunda[5]
Zn Canadian Shield
lakes
8 12-464 50 23 (this study)
Canadian Shield
lakes
10 10-2010 86 15 Fortin et al.[3]
Canadian Shield
lakes
4 46-1300 25 4 Guthrie et al.[13]
Swiss lake, UK 4 28-282 10 6 Kalis et al.[46]
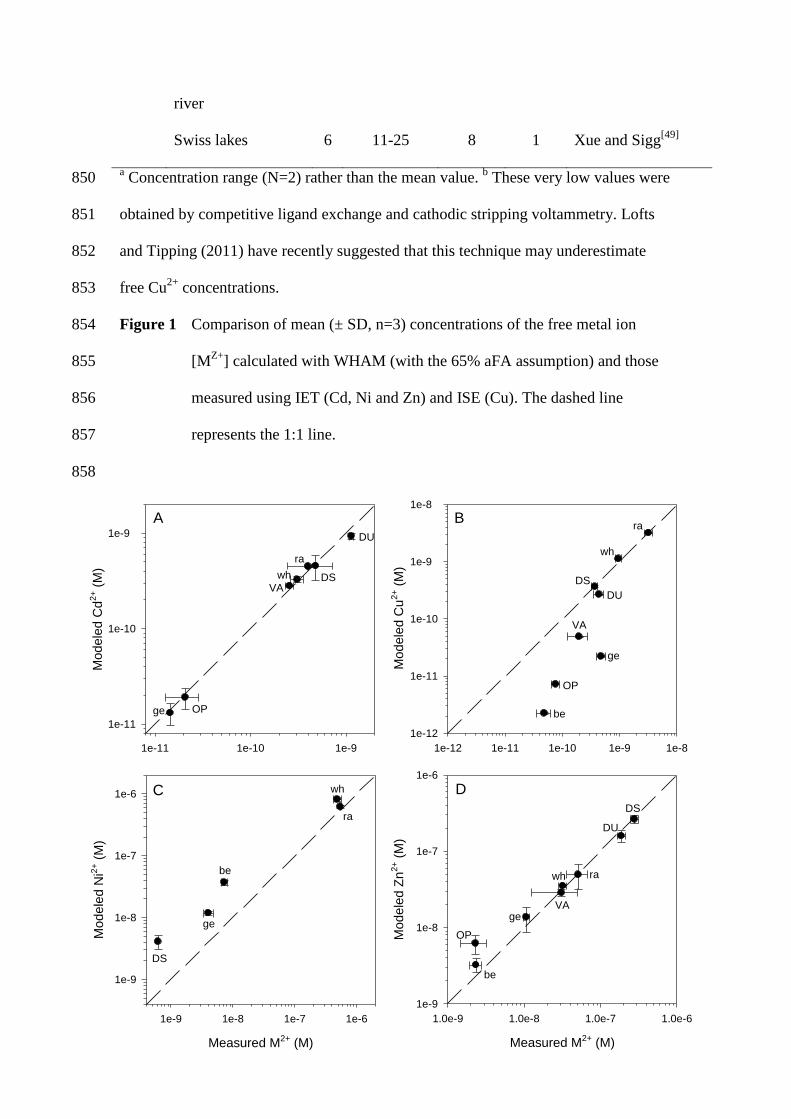
41
river
Swiss lakes 6 11-25 8 1 Xue and Sigg[49]
a Concentration range (N=2) rather than the mean value.
b These very low values were 850
obtained by competitive ligand exchange and cathodic stripping voltammetry. Lofts 851
and Tipping (2011) have recently suggested that this technique may underestimate 852
free Cu2+
concentrations. 853
Figure 1 Comparison of mean (± SD, n=3) concentrations of the free metal ion 854
[MZ+
] calculated with WHAM (with the 65% aFA assumption) and those 855
measured using IET (Cd, Ni and Zn) and ISE (Cu). The dashed line 856
represents the 1:1 line. 857
858
Measured M2+ (M)
1e-9 1e-8 1e-7 1e-6
Mo
dele
d N
i2+ (
M)
1e-9
1e-8
1e-7
1e-6
1e-12 1e-11 1e-10 1e-9 1e-8
Mo
dele
d C
u2
+ (
M)
1e-12
1e-11
1e-10
1e-9
1e-8
Measured M2+ (M)
1.0e-9 1.0e-8 1.0e-7 1.0e-6
Mo
dele
d Z
n2
+ (
M)
1e-9
1e-8
1e-7
1e-6
1e-11 1e-10 1e-9
Mo
dele
d C
d2
+ (
M)
1e-11
1e-10
1e-9
C
BA
D
DU
DS
ra
wh
VA
OPge
ge
OP
VA
wh
DS
ra
DU
be
DS
ra
wh
ge
be
ge
OP
VA
wh
DS
ra
DU
be
42
Figure 2 Comparison between measured percent free Cd2+
(A), Cu2+
(B), Ni2+
(C) 859
43
and Zn2+
(D) and WHAM predicted percent free MZ+
for eight lakes 860
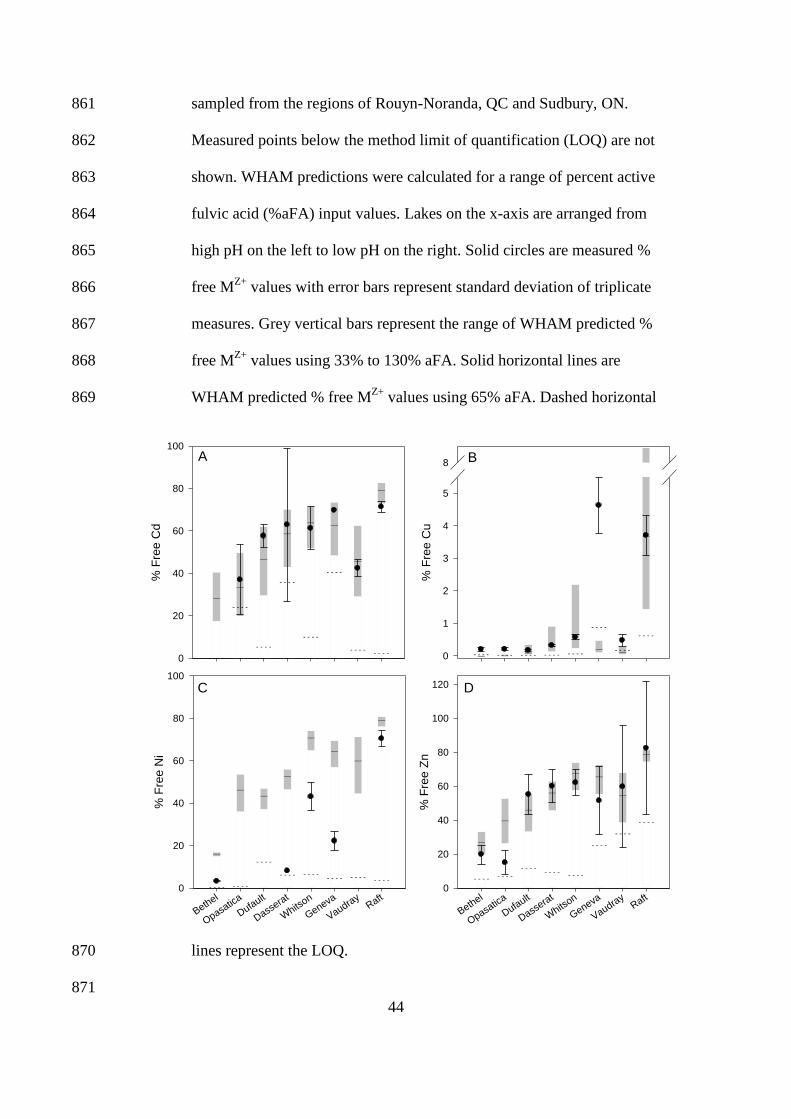
44
sampled from the regions of Rouyn-Noranda, QC and Sudbury, ON. 861
Measured points below the method limit of quantification (LOQ) are not 862
shown. WHAM predictions were calculated for a range of percent active 863
fulvic acid (%aFA) input values. Lakes on the x-axis are arranged from 864
high pH on the left to low pH on the right. Solid circles are measured % 865
free MZ+
values with error bars represent standard deviation of triplicate 866
measures. Grey vertical bars represent the range of WHAM predicted % 867
free MZ+
values using 33% to 130% aFA. Solid horizontal lines are 868
WHAM predicted % free MZ+
values using 65% aFA. Dashed horizontal 869
lines represent the LOQ. 870
871
% F
ree C
d
0
20
40
60
80
100
—
—
—
—
— —
—
—
- - - -
- - - -
- - - -
- - - -
- - - -
- - - -
- - - -- - - -
Bethel
Opasatic
a
Dufault
Dassera
t
Whits
on
Geneva
Vaudray
Raft
% F
ree N
i
0
20
40
60
80
100
—
——
—
—
—
—
—
- - - - - - - -
- - - -
- - - - - - - -- - - - - - - - - - - -
% F
ree C
u
0
1
2
3
4
5
8
— — ——
—
— —
—
- - - - - - - - - - - - - - - - - - - -
- - - -
- - - -
- - - -
Bethel
Opasatic
a
Dufault
Dassera
t
Whits
on
Geneva
Vaudray
Raft
% F
ree Z
n
0
20
40
60
80
100
120
—
—
—
—
— —
—
—
- - - - - - - -- - - -
- - - -- - - -
- - - -
- - - -
- - - -
A B
C D
45
Figure 3 Relationship between the WHAM calculated percent fulvic acid active in 872
complexation (%aFAoptimized) for Cd, Cu, Ni and Zn and the relative 873
contribution of PARAFAC fluorescence components 1 (panels a – d) and 874
3 (panels e – h) to the overall fluorescence spectrum of lake DOM. Points 875
of the same shape and fill represent replicate samples. Solid lines represent 876
regression equations of statistical significance at the 0.05 alpha level. 877
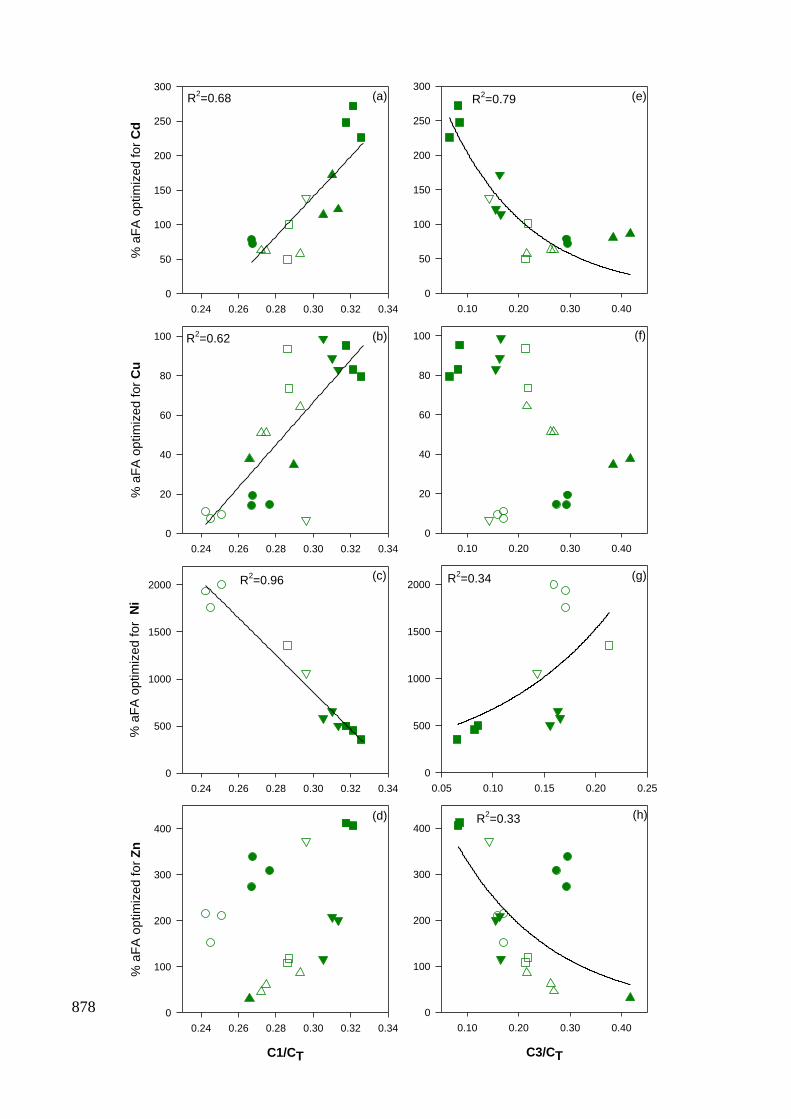
46
878
0.10 0.20 0.30 0.40
0
50
100
150
200
250
300
0.10 0.20 0.30 0.40
0
20
40
60
80
100
0.05 0.10 0.15 0.20 0.25
0
500
1000
1500
2000
C3/CT
0.10 0.20 0.30 0.40
0
100
200
300
400
(e)
(f)
(g)
(h)
0.24 0.26 0.28 0.30 0.32 0.34
% a
FA
op
tim
ize
d f
or
Cd
0
50
100
150
200
250
300
0.24 0.26 0.28 0.30 0.32 0.34
% a
FA
op
tim
ize
d f
or
Cu
0
20
40
60
80
100
0.24 0.26 0.28 0.30 0.32 0.34
% a
FA
op
tim
ize
d f
or
Ni
0
500
1000
1500
2000
C1/CT
0.24 0.26 0.28 0.30 0.32 0.34
% a
FA
op
tim
ize
d f
or
Zn
0
100
200
300
400
(a)
(b)
(c)
(d)
R2=0.68 R
2=0.79
R2=0.62
R2=0.96 R
2=0.34
R2=0.33
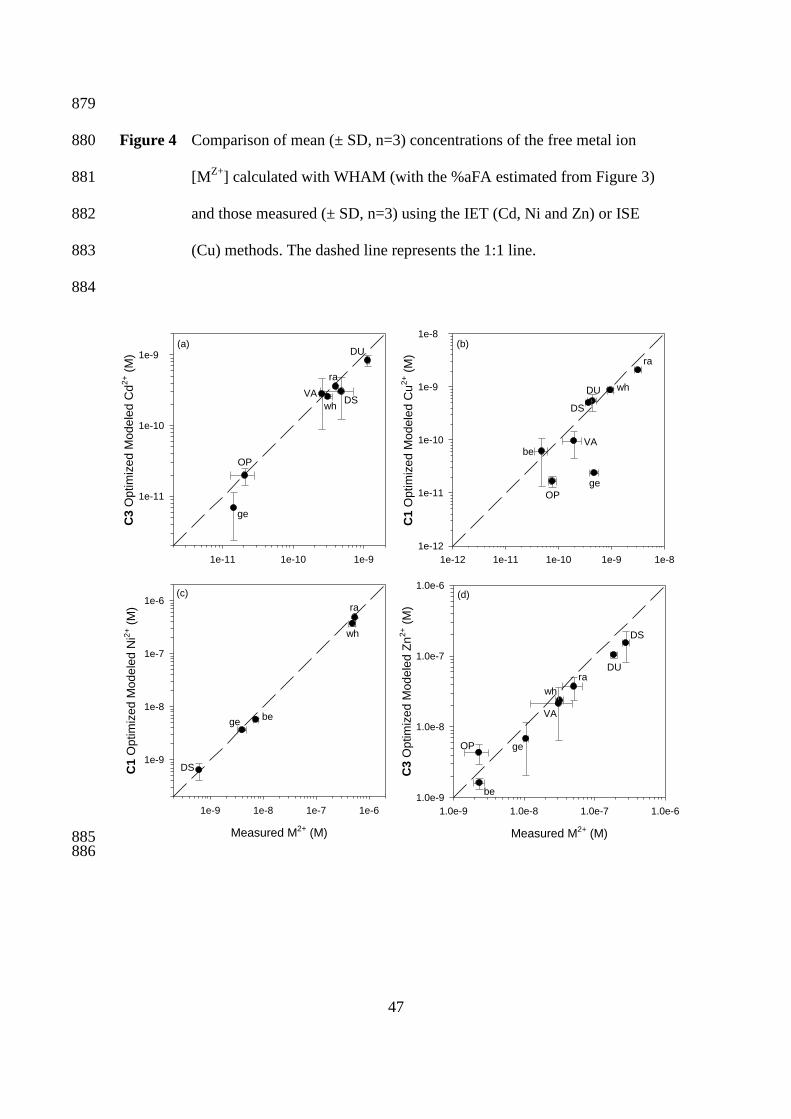
47
879
Figure 4 Comparison of mean (± SD, n=3) concentrations of the free metal ion 880
[MZ+
] calculated with WHAM (with the %aFA estimated from Figure 3) 881
and those measured (± SD, n=3) using the IET (Cd, Ni and Zn) or ISE 882
(Cu) methods. The dashed line represents the 1:1 line. 883
884
Measured M2+ (M)
1e-9 1e-8 1e-7 1e-6
C1 O
ptim
ized
Modele
d N
i2+ (
M)
1e-9
1e-8
1e-7
1e-6
Measured M2+ (M)
1.0e-9 1.0e-8 1.0e-7 1.0e-6
C3
Optim
ized
Mode
led
Zn
2+ (
M)
1.0e-9
1.0e-8
1.0e-7
1.0e-6
1e-11 1e-10 1e-9
C3 O
ptim
ized
Mod
ele
d C
d2
+ (
M)
1e-11
1e-10
1e-9
(c)
(a)
(d)
DU
DS
ra
wh
VA
OP
ge
ra
wh
be
DS
ge
DU
DS
ra
wh
VA
OP ge
be
1e-12 1e-11 1e-10 1e-9 1e-8
C1 O
ptim
ize
d M
ode
led
Cu
2+ (
M)
1e-12
1e-11
1e-10
1e-9
1e-8(b)
DU
DS
ra
wh
VA
OP
ge
be
885 886