trace element concentrations in surface estuarine and marine sediments along the mississippi gulf...
TRANSCRIPT

Environ Monit Assess (2012) 184:1107–1119DOI 10.1007/s10661-011-2025-7
Trace element concentrations in surface estuarineand marine sediments along the MississippiGulf Coast following Hurricane Katrina
Crystal Warren · Nurdan S. Duzgoren-Aydin ·James Weston · Kristine L. Willett
Received: 18 June 2010 / Accepted: 16 March 2011 / Published online: 15 April 2011© Springer Science+Business Media B.V. 2011
Abstract Hurricanes are relatively frequent eco-logical disturbances that may cause potentiallylong-term impacts to the coastal environment.Hurricane Katrina hit the Mississippi Gulf Coastin August 2005, and caused a storm surge withthe potential to change the trace element con-tent of coastal surface sediments. In this study,surface estuarine and marine sediments were col-lected monthly following the storm from tensites along the Mississippi Gulf Coast (MobileBay, Grand Bay Bayous Heron and Cumbest,Pascagoula, Ocean Springs, Biloxi Gulf, BackBiloxi Bay, Gulfport Gulf, Gulfport CourthouseRd, and Gulfport Marina). Concentrations of V,Cr, Mn, Fe, Co, Ni, Zn, As, Cd, and Pb were mea-
C. Warren · N. S. Duzgoren-Aydin · J. Weston ·K. L. WillettEnvironmental Toxicology Research Program,National Center for National Product Research,University of Mississippi, Oxford, MS 38677, USA
K. L. Willett (B)Department of Pharmacology and EnvironmentalToxicology Research Program, School of Pharmacy,The University of Mississippi, 303 Faser Hall,Box 1848, Oxford, MS 38677, USAe-mail: [email protected]
Present Address:N. S. Duzgoren-AydinDepartment of Geoscience and Geography, New JerseyCity University, Jersey City, NJ 07305, USA
sured by inductively coupled plasma–mass spec-trometry to evaluate their temporal and spatialvariations in the year following Hurricane Kat-rina. Sediments were characterized by pH, particlesize distribution and total carbon and nitrogencontent. Trace element contents of the sedimentswere determined in both <2 mm and <63 μmgrain size fractions. Results revealed no significanttemporal and spatial variability in trace elementconcentrations, in either size fraction. Potentialecological risk of the sediments was assessed byusing NOAA SQuiRTs’ guideline values; mostconcentrations remained below probable adverseeffects guidelines to marine organisms suggestingthat trace elements redistributed by HurricaneKatrina would not cause an adverse impact onresident organisms. Instead, the concentrations oftrace elements were site-dependent, with specificcontaminants relating to the use of the area priorto Hurricane Katrina.
Keywords Hurricane Katrina · Trace elements ·Marine sediment · Estuarine sediment ·Gulf coast
Introduction
Ecological disturbances, such as hurricanes, ty-phoons, and other cyclonic events can pro-duce massive disruptions in coastal environments

1108 Environ Monit Assess (2012) 184:1107–1119
(Greening et al. 2006). Recently, studies havebeen conducted to assess the short-term impactof several major hurricanes, including hurricanesHugh (1989), Andrew (1992), Mitch (1998), andKatrina (2005) (Doyle 2009). Unfortunately, stud-ies evaluating the long-term environmental im-pacts of hurricanes are not common, in large partbecause locations of hurricane landfall are un-predictable (Greening et al. 2006; Bortone 2006).However, examination of hurricane paths in theGulf of Mexico over the past 100 years revealedthat the entire coastline had been repeatedly im-pacted by hurricane force winds and storm surges(Bortone 2006). Also, based on a hurricane mod-eling system, Doyle (2009) predicted that at leastone major hurricane of Category 3 strength orgreater will strike the north-central Gulf Coastalone every 20 years, a higher probability com-pared to most other coastal regions. Therefore,long-term monitoring of the Gulf Coast could beimplemented to determine the impacts of indi-vidual hurricanes and hurricane seasons to theestuarine and coastal environment (Bortone 2006;Doyle 2009).
Hurricane Katrina hit the Mississippi GulfCoast on August 29, 2005 as a Category 3 storm,leaving a devastating impact to the coastal com-munity, and unknown effects to the estuarineand coastal environment. Numerous studies havebeen conducted on contaminant concentrationsand toxicity measurements in New Orleans andLake Pontchartrain immediately following thehurricane (Presley et al. 2006; Cobb et al. 2006;Van Metre et al. 2006; Adams et al. 2007; Stoutet al. 2007; Liebl et al. 2008; Shi et al. 2010; Abelet al. 2010). In general, concentrations of organiccontaminants (such as polycyclic aromatic hydro-carbons (PAHs), pesticides, and polychlorinatedbiphenyls) decreased in the months following thestorm, although few concentrations were detectedabove the EPA’s Human Health Medium SpecificScreening Levels (Van Metre et al. 2006; Lieblet al. 2008). However, in New Orleans, concentra-tions of total trace elements remained the samecompared to pre-Katrina studies (Liebl et al.2008), and both As and Pb were detected at con-centrations that exceeded drinking water regula-tory guidelines (Adams et al. 2007). Overall, bothorganic and inorganic contaminant concentrations
in the New Orleans area were thought to be theresult of redistribution from the floodwaters, andnot from a new source.
EPA, NOAA, and USGS assessed the short-term ecological impacts of Hurricane Katrina tothe Mississippi Sound by analyzing sediment sam-ples collected 2 months after the storm (Macauley2007). When compared to samples analyzed be-fore the storm, the concentrations of organic con-taminants and trace elements remained similar.Overall, some ecological changes were detected,but the evidence did not suggest widespread, per-manent damage. In fact, some improvements tothe coastal ecosystem may have occurred due tothe “flushing” out of the area from the stormsurge and rainfall (Macauley 2007; Macauley et al.2010).
The research presented here focused on thepotential longer-term environmental impact ofHurricane Katrina on the elemental composi-tion, specifically trace element concentrations, ofsurface marine and estuarine sediments alongthe Mississippi Gulf Coast at ten sites betweenGulfport, MS and Mobile Bay, AL. Sites closestto the eye of Hurricane Katrina (Gulfport, MS)were hypothesized to be more heavily impacteddue to the intense wind and storm surge effects,resulting in mixing of the water column, and thusmay have led to redistribution of existing con-taminants or introduction of new contaminantsources. Based on this scenario, Mobile Bay, ALwas predicted to be the least impacted site, dueto its distance from Hurricane Katrina’s landfall.The storm surge ranged from 5.2 to 6.7 m highalong the coast from Gulfport to Pascagoula, andpenetrated at least 9 km inland along the coast,and up to 19 km along bays and rivers, sometimescrossing Interstate 10. In Mobile Bay, the stormsurge penetrated 3.1–4.6 m along the coast and2.4–3.7 m into the bay (Knabb et al. 2005).
We have previously reported bioassay resultsfrom H4IIE rat hepatoma ethoxyresorufin-O-deethylase (EROD) and yeast estrogen screen(YES) for water samples and concentrations ofPAH contaminants found in the surface marineand estuarine sediment samples collected fromour sites in the year following Hurricane Katrina(Weston et al. 2010). In this study, however, thesurface sediment concentrations of V, Cr, Mn, Fe,

Environ Monit Assess (2012) 184:1107–1119 1109
Co, Ni, Zn, As, Cd, and Pb were measured notonly to evaluate their temporal and spatial vari-ations in the year following Hurricane Katrina,but also to establish background values for theselected elements for future studies evaluating es-tuarine and marine sediment quality in the region.
No trace element data existed for all the se-lected sites prior to Hurricane Katrina, so the ab-solute impact of Hurricane Katrina on trace metalredistribution could not be assessed. Instead, wehave compared the data obtained just after thehurricane (September–October, 2005) with thoseof the data gathered 1 year later (September–October, 2006) to evaluate effects of HurricaneKatrina indirectly. Sediments were characterizedby pH, particle size distribution and total carbonand nitrogen content. Particle size distributionand its potential effects on the distribution andconcentrations of trace elements of the sedimentswere also considered. Finally, potential ecologicalrisk of the sediments in the study areas was as-sessed by using NOAA SQuiRTs’ guideline values.
Methods and materials
Site descriptions
Ten sites located east of Hurricane Katrina’s land-fall (between Gulfport, MS and Mobile Bay, AL)were sampled between September 2005–2006 andhave been previously described (Weston et al.2010). Briefly, all of the sites had signs of hurri-cane damage during the first sampling in Septem-ber 2005. The sampling sites closest to HurricaneKatrina’s landfall in Bay St. Louis, MS were lo-cated in Gulfport (GPM, GPG, and GPC), about27 km to the east of the eye of the storm. Two siteswere located near Biloxi, MS; one was in a backcove of Biloxi Bay (BBB), and the other was nearthe mouth of the bay (BG). Samples were alsocollected from the University of Southern Missis-sippi’s Gulf Coast Research Laboratory (GCRL)and at the Pascagoula River (PR). Two samplingsites were located within the Grand Bay Na-tional Estuarine Reserve along Bayous Cumbest(GBBC) and Heron (GBBH). Mobile Bay, AL(MB, ∼145 km east of Hurricane Katrina’s land-
fall) was expected to be the least impacted of thesampling sites.
Four of the sites were located near boat ramps(GCRL, PR, GBBC, and GBBH), and four ofthe sites were on sandy beaches (GPG, GPC, BG,and MB). GPM was within a marina destroyed byKatrina. The BBB site was the most littered withanthropogenic debris and oyster shells from an ad-jacent seafood processing plant. At the GPM andBG sites, wooden piers were removed during thesampling period, whereas GPC samples containedbits of charcoal and asphalt from the repaving ofan adjacent parking lot.
Field sampling
All sites were sampled monthly from Septem-ber 2005–2006, except at the BBB and BG sites,which were not sampled in September 2005 be-cause access was not yet available. At all sites,subsurface (0.25 m) water quality, including pH,was measured using a Hydrolab Quanta (HachCo, Loveland, CO), and surface sediment sam-ples were collected and stored in glass jars withTeflon liners for chemical and physical analyses.To avoid contamination of samples, personnelavoided using personal care products and woreshoulder length gloves. Samples remained on iceduring sampling and transportation back to theUniversity of Mississippi, where they were storedat −20◦C until extracted.
Sediment characterization
Five to twelve samples from each samplingsite were analyzed for particle size distribu-tion and carbon (C) and nitrogen (N) con-tents (Weston et al. 2010). Briefly, before analy-sis, 5 g of freeze-dried sediments were digestedwith 10 mL 30% hydrogen peroxide (H2O2)
to remove organic content. Particle size dis-tribution was measured with a Horiba modelLA-910 laser scattering particle size analyzer(LPSA). The particle sizes were then clas-sified as coarse-sand (2 mm–500 μm), medium-sand (499 μm–200 μm), fine-sand (199 μm–64 μm), silt (63 μm–2 μm), or clay (<2 μm).In this study, the terms “sand, silt, and clay”refer to particle size only. Additionally, fine-,
1110 Environ Monit Assess (2012) 184:1107–1119
medium- and coarse-sand size (i.e., <2 mm and>63 μm) are collectively referred as “sand sizefraction”. For percent C and N content measure-ments, approximately 1 g of <2 mm sediment wasanalyzed using a Vario Max CNS instrument.
Sediment samples were also analyzed for pH.Approximately 4 g of <2 mm sediment wasadded to 10 mL deionized water and mechanicallyshaken for 30 min. Next, the samples were cen-trifuged at 1,048 ×g for 10 min. Samples were thensyringe-filtered (0.45 μm pore size) and measuredusing a calibrated pH meter probe.
Trace element analyses
Before extraction, 50 g of each sediment sam-ple was freeze-dried and sieved. Large debris,including large rocks and shell fragments, wereremoved. Portions of samples were separated forLPSA analysis (5 g) and CHN analysis (3 g).Sediments were then fractioned into two particlesizes: <2 mm (sand + silt + clay) and <63 μm(silt + clay), and both sections underwent iden-tical extractions, following the EPA 3052 proce-dure modified by Duzgoren-Aydin et al. (2011).Briefly, samples were microwave-digested usinga CEM Mars 5 Accelerated Reaction System(Matthews, CA) programmed to 180◦C, 100%power, 1,600 W for a 5-min ramp time before a15-min duration time. Sediment portions (1 mg)were digested using a ratio of 10:3:2 mL nitric,hydrofluoric, and hydrochloric acids, respectively.Extracts were then rinsed with an additional 2 mLnitric acid, and syringe-filtered (0.45 μm poresize). Samples were diluted 25 times with deion-ized water, and again syringe-filtered (0.20 μmpore size).
The internal standard mixture, multi-elementand environmental calibration standards, andstock tuning solutions were purchased from Agi-lent Technologies (Palo Alto, CA). Samples wereanalyzed by collision reaction cell ICP-MS (Agi-lent G3272A) for the following elements: As, Cd,Co, Cr, Fe, Mn, Ni, Pb, V, and Zn. These elementswere selected for analysis because they are knownenvironmental contaminants and can potentiallycause toxicity in estuarine and coastal ecosystems(Wenning et al. 2005; Buchman 2008).
For quality control, at least one blank and onestandard reference material (SRM) were extractedwith each set of ten samples. Standard reference ma-terials were obtained from the National Instituteof Standards and Technology (Gaithersburg, MD)and included SRM-2702 (marine sediment frommouth of Baltimore Harbor, Baltimore, MD)and SRM-1944 (New York/New Jersey Water-way Sediment). The average percent recoveries ofall analyzed elements from both standard refer-ence sediments were higher than 90% with rel-ative standard deviations (RSD) less than 6%.Specifically, the percent recoveries (mean ± stan-dard deviation) for SRM 1944 (n = 5) and SRM2702 (n = 11) were as follows: V, 93 ± 3% and96 ± 3%; Cr, 94 ± 3% and 96 ± 5%; Mn, 96 ± 3%and 101 ± 6%; Fe, 91 ± 4% and 94 ± 1%; Co, 95 ±4% and 98 ± 4%; Ni, 95 ± 4% and 100 ± 4%; Zn,97 ± 5% and 91 ± 4%; As, 95 ± 4 and 96 ± 3%;Cd, 99 ± 4% and 97 ± 3%; and Pb, 98 ± 3% and102 ± 6% (Duzgoren-Aydin et al. 2011).
For every 20 to 25 samples, one replicatesample was digested and analyzed separately.The percentage differences between the repli-cate samples were calculated by using a for-mula
[(Xmax − Xmin) /Xmax
] × 100, where Xmin
and Xmax represent the low and high values ofthe two measurements, respectively. Although themean percentage differences for each element wasusually less than 12% (which is less than 2 × SRMRSD values, 6%), high percentage differences(>12%) can be attributed to sample heterogeneitywhich is particularly true for solid-bound traceelements. Rarely, when the percentage differencewas higher than 20%, these results were removedfrom further analyses.
Statistical analysis
Kruskal–Wallis one-way ANOVA (α = 0.05) andDunn’s Multiple Comparison Post-hoc Test wereused to make between site and month compar-isons. Differences in concentrations between theparticle sizes for specific sites were examined us-ing two-way ANOVA (p < 0.05) and Bonfer-roni’s Post-hoc Test. Nonparametric correlations(Spearman) were used to assess any relation-ships between specific trace metals and physico-

Environ Monit Assess (2012) 184:1107–1119 1111
chemical characteristics (i.e., particle size distrib-ution, total carbon percentage). All analyses wereperformed using GraphPad PRISM 5.0 software.
Results and discussion
Particle size distribution
The sediment samples from all sites were domi-nated by medium- to fine-sand (63–98%) and silt(1–35%) size fractions, with very little clay content(0–2%; Fig. 1a). Samples from Gulfport (includingGPM, GPG, and GPC) consisted of mostly sand(average (avg): 98%), with only a small fraction ofsilt and clay. The two sampling locations in Biloxivaried greatly; the samples from the gulf side(BG) contained 98% sand (>80% of which wasmedium- and fine-sand size) and 2% silt, whileBBB samples had 63% sand and 37% silt andclay. Other predominantly sand-dominated sam-
GPGGPM
GPCBBB BG
GCRL PR
GBBC
GBBH MB0
20
40
60
80
100
Sand - CoarseSand - MediumSand - FineSilt
Clay
a
Cu
mu
lati
ve %
GPGGPM
GPCBBB BG
GCRL PR
GBBC
GBBH MB0
1
2
3
4% C% N
b
Site
% C
om
po
siti
on
Fig. 1 a Average particle size distribution per site (n = 5–12). Particle sizes were classified as: coarse-sand (2 mm–500 μm), medium-sand (499–200 μm), fine-sand (199–64 μm), silt (63–2 μm), or clay (<2 μm). b Percentages ofcarbon and nitrogen (avg ± SE) per site
ples included those from MB and PR, having 93%and 85% sand size particles, respectively. Samplesfrom GCRL, GBBC and GBBH contained mostlymedium- to fine-sand, but also had higher averagepercentages of silt and clay (30%, 25%, 15%,respectively). Because a significant difference ingrain size distribution existed between the sites,consideration of the potential effects caused byparticle size distribution on the elemental compo-sitions was essential. Therefore, the element con-centrations in two size fractions for each sample:<2 mm (sand + silt + clay sizes) and <63 μm (onlysilt + clay sizes) were determined and discussedbelow.
Total carbon and nitrogen contents
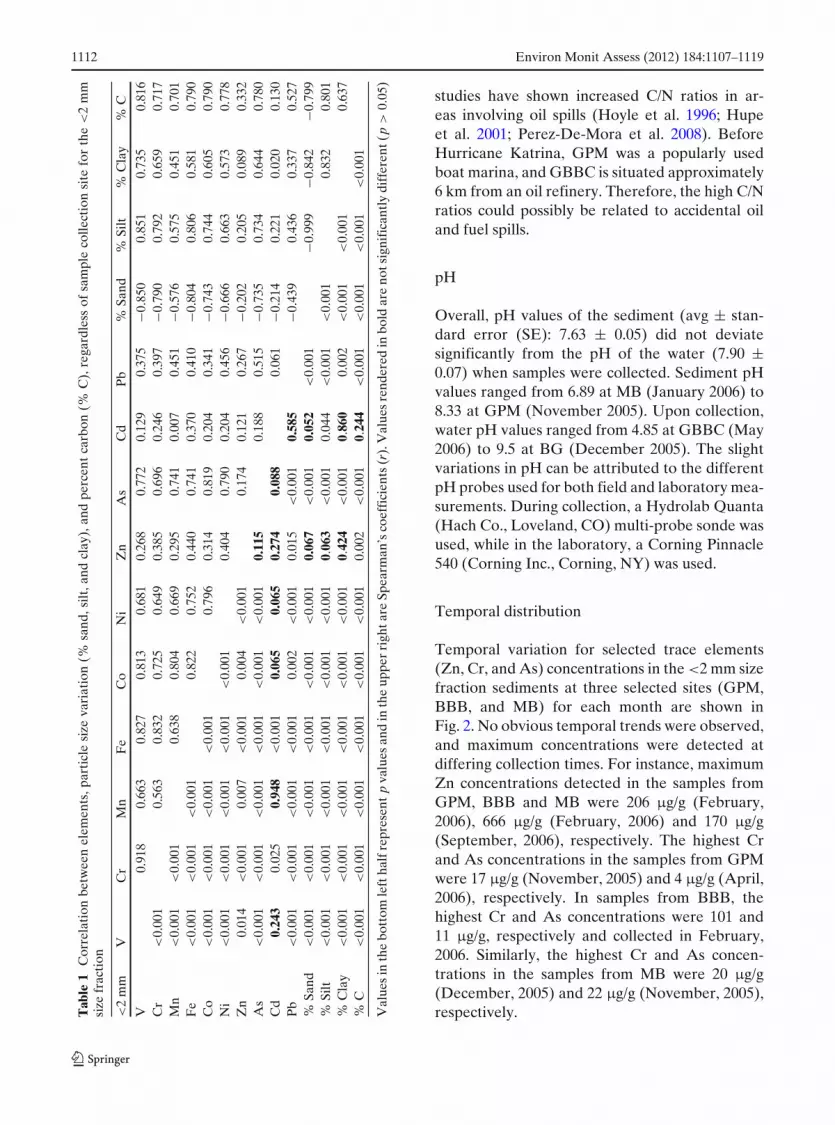
In general, the samples that contained the mostsilt and clay content (GBBC, BBB, and GCRL)also had the highest average percent total C(1.8%, 3.3%, and 3.0%, respectively, Fig. 1b;rclay-C% = 0.637; rsilt-C% = 0.801, p < 0.001, Ta-ble 1) and total average nitrogen (0.09%, 0.19%,and 0.16%, respectively). Alternatively, the sam-ples that contained the greatest percentage ofsand had the lowest percentage of total C(rsand-C% = −0.799, p < 0.001, Table 1). Organicmatter preferentially adheres to fine-size particles(silt and clay) due to their large surface area (Goniet al. 2003; Liu et al. 2009), and trace elementsusually exhibit a high affinity for organic mat-ter due to the numerous functional groups thatare able to bind inorganic elements (Harter andNaidu 1995). As summarized in Table 1, the per-cent total C was moderately to highly correlatedwith all of the analyzed elements except Cd. Ourprevious study (Weston et al. 2010) on the samestudy sites documented that sampling locationswhich contained high C content also containedrelatively high concentrations of PAHs. The ra-tio of C/N is often calculated to determine thesources of carbon to a particular area (Meyersand Teranes 2001; Meyers 2003). Overall, the C/Nratio of sediments from the Gulf Coast variedfrom 7 to 155. Among the sites, GPM, PR, andGBBC had the highest average C/N ratios (21–59), suggesting that the source of organic materialswas primarily from terrestrial materials (Meyers1994; Kaushal and Binford 1992). Additionally,
1112 Environ Monit Assess (2012) 184:1107–1119
Tab
le1
Cor
rela
tion
betw
een
elem
ents
,par
ticl
esi
zeva
riat
ion
(%sa
nd,s
ilt,a
ndcl
ay),
and
perc
ent
carb
on(%
C),
rega
rdle
ssof
sam
ple
colle
ctio
nsi
tefo
rth
e<
2m
msi
zefr
acti
on
<2
mm
VC
rM
nF
eC
oN
iZ
nA
sC
dP
b%
Sand
%Si
lt%
Cla
y%
C
V0.
918
0.66
30.
827
0.81
30.
681
0.26
80.
772
0.12
90.
375
−0.8
500.
851
0.73
50.
816
Cr
<0.
001
0.56
30.
832
0.72
50.
649
0.38
50.
696
0.24
60.
397
−0.7
900.
792
0.65
90.
717
Mn
<0.
001
<0.
001
0.63
80.
804
0.66
90.
295
0.74
10.
007
0.45
1−0
.576
0.57
50.
451
0.70
1F
e<
0.00
1<
0.00
1<
0.00
10.
822
0.75
20.
440
0.74
10.
370
0.41
0−0
.804
0.80
60.
581
0.79
0C
o<
0.00
1<
0.00
1<
0.00
1<
0.00
10.
796
0.31
40.
819
0.20
40.
341
−0.7
430.
744
0.60
50.
790
Ni
<0.
001
<0.
001
<0.
001
<0.
001
<0.
001
0.40
40.
790
0.20
40.
456
−0.6
660.
663
0.57
30.
778
Zn
0.01
4<
0.00
10.
007
<0.
001
0.00
4<
0.00
10.
174
0.12
10.
267
−0.2
020.
205
0.08
90.
332
As
<0.
001
<0.
001
<0.
001
<0.
001
<0.
001
<0.
001
0.11
50.
188
0.51
5−0
.735
0.73
40.
644
0.78
0C
d0.
243
0.02
50.
948
<0.
001
0.06
50.
065
0.27
40.
088
0.06
1−0
.214
0.22
10.
020
0.13
0P
b<
0.00
1<
0.00
1<
0.00
1<
0.00
10.
002
<0.
001
0.01
5<
0.00
10.
585
−0.4
390.
436
0.33
70.
527
%Sa
nd<
0.00
1<
0.00
1<
0.00
1<
0.00
1<
0.00
1<
0.00
10.
067
<0.
001
0.05
2<
0.00
1−0
.999
−0.8
42−0
.799
%Si
lt<
0.00
1<
0.00
1<
0.00
1<
0.00
1<
0.00
1<
0.00
10.
063
<0.
001
0.04
4<
0.00
1<
0.00
10.
832
0.80
1%
Cla
y<
0.00
1<
0.00
1<
0.00
1<
0.00
1<
0.00
1<
0.00
10.
424
<0.
001
0.86
00.
002
<0.
001
<0.
001
0.63
7%
C<
0.00
1<
0.00
1<
0.00
1<
0.00
1<
0.00
1<
0.00
10.
002
<0.
001
0.24
4<
0.00
1<
0.00
1<
0.00
1<
0.00
1
Val
ues
inth
ebo
ttom
left
half
repr
esen
tp
valu
esan
din
the
uppe
rri
ghta
reSp
earm
an’s
coef
fici
ents
(r).
Val
ues
rend
ered
inbo
ldar
eno
tsig
nifi
cant
lydi
ffer
ent(
p>
0.05
)
studies have shown increased C/N ratios in ar-eas involving oil spills (Hoyle et al. 1996; Hupeet al. 2001; Perez-De-Mora et al. 2008). BeforeHurricane Katrina, GPM was a popularly usedboat marina, and GBBC is situated approximately6 km from an oil refinery. Therefore, the high C/Nratios could possibly be related to accidental oiland fuel spills.
pH
Overall, pH values of the sediment (avg ± stan-dard error (SE): 7.63 ± 0.05) did not deviatesignificantly from the pH of the water (7.90 ±0.07) when samples were collected. Sediment pHvalues ranged from 6.89 at MB (January 2006) to8.33 at GPM (November 2005). Upon collection,water pH values ranged from 4.85 at GBBC (May2006) to 9.5 at BG (December 2005). The slightvariations in pH can be attributed to the differentpH probes used for both field and laboratory mea-surements. During collection, a Hydrolab Quanta(Hach Co., Loveland, CO) multi-probe sonde wasused, while in the laboratory, a Corning Pinnacle540 (Corning Inc., Corning, NY) was used.
Temporal distribution
Temporal variation for selected trace elements(Zn, Cr, and As) concentrations in the <2 mm sizefraction sediments at three selected sites (GPM,BBB, and MB) for each month are shown inFig. 2. No obvious temporal trends were observed,and maximum concentrations were detected atdiffering collection times. For instance, maximumZn concentrations detected in the samples fromGPM, BBB and MB were 206 μg/g (February,2006), 666 μg/g (February, 2006) and 170 μg/g(September, 2006), respectively. The highest Crand As concentrations in the samples from GPMwere 17 μg/g (November, 2005) and 4 μg/g (April,2006), respectively. In samples from BBB, thehighest Cr and As concentrations were 101 and11 μg/g, respectively and collected in February,2006. Similarly, the highest Cr and As concen-trations in the samples from MB were 20 μg/g(December, 2005) and 22 μg/g (November, 2005),respectively.

Environ Monit Assess (2012) 184:1107–1119 1113
MB
0
50
100
150
200
Zin
c (µ
g/g
)BBB
0
200
400
600
800
Zin
c (µ
g/g
)
GPM
0
50
100
150
200
250
Zin
c (µ
g/g
)
0
5
10
15
2081
Ch
rom
ium
(µg
/g)
MB
0
50
100
150
Ch
rom
ium
(µg
/g)
BBB
0
5
10
15
81GPM
Ch
rom
ium
(µg
/g)
Sept 0
5
Oct 05
Nov 05
Dec 05
Jan 06
Feb 06
Mar 06
Apr 06
May 06
Jun 06
Jul 0
6
Aug 06
Sept 0
60
5
10
15
20
25
Ars
enic
(µg
/g)
MB
Sept 0
5
Oct 05
Nov 05
Dec 05
Jan 06
Feb 06
Mar 06
Apr 06
May 06
Jun 06
Jul 0
6
Aug 06
Sept 0
60
5
10
15
Ars
enic
(µg
/g)
BBB
Sept 0
5
Oct 05
Nov 05
Dec 05
Jan 06
Feb 06
Mar 06
Apr 06
May 06
Jun 06
Jul 0
6
Aug 06
Sept 0
60
1
2
3
4
8
GPM
Ars
enic
(µg
/g)
Fig. 2 Temporal variation for selected (Zn, Cr, and As)trace element concentrations in the <2 mm size frac-tion at selected sites: Mobile Bay (MB), Back BiloxiBay (BBB), and Gulfport Marina (GPM). Solid lines and
dashed lines represent NOAA SQuiRTs thresholds forERL (Effects Range Low) and PEL (Probable EffectsLevel), respectively
To further statistically address whether a tem-poral trend existed in trace element concentra-tions in the surface sediments, trace element con-centrations at two time periods (September andOctober, 2005 and August and September, 2006)were plotted in Fig. 3 for the <63 μm size fractionin order to reduce the confounding effects of par-ticle size. No statistical differences in the overalldistribution of trace elements in the year afterthe storm surge impact were observed. This isconsistent with our previous study (Weston et al.2010) reporting that no temporal or spatial trendwas seen at any of the sites, in regards to sedimentPAH concentrations.
Spatial distribution
Once it was established that there were no tempo-ral trends at any of the sites in the year followingHurricane Katrina, trace element concentrationswere averaged for each site regardless of samplecollection time. In the <2 mm size fraction, sam-ples from BBB contained the highest concentra-tions of trace elements, especially Zn, Mn, Cr,Ni, and As, followed by samples from GCRL andGBBC (Table 2). These three sites also had thehighest % C and highest % silt and clay size frac-tions. Alternatively, samples from GPG, GPM,GPC, and BG contained the lowest concentra-

1114 Environ Monit Assess (2012) 184:1107–1119
0
20
40
60
80
100Vanadium
(µg
met
al/g
dry
wt.
sed
)
0
20
40
60
80
100Chromium
0
500
1000
1500
2000
2500Manganese
(µg
met
al/g
dry
wt.
sed
)
0
10000
20000
30000Iron
0
5
10
15Cobalt
0
10
20
30
40
50Nickel
GPG, GPM, G
PC
BG, BBB, G
CRL
PR, GBBC, G
BBH MB
0
100
200
300Zinc
(µg
met
al/g
dry
wt.
sed
)
GPG, GPM, G
PC
BG, BBB, G
CRL
PR, GBBC, G
BBH MB
0
5
10
15Arsenic
GPG, GPM, G
PC
BG, BBB, G
CRL
PR, GBBC, G
BBH MB
0
1
2
3
4Cadmium
GPG, GPM, G
PC
BG, BBB, G
CRL
PR, GBBC, G
BBH MB
0
20
40
60
80
100Lead
09-10/200508-09/2006
Fig. 3 Temporal variation showing average (± SE) con-centrations (μg/g) of trace elements directly following thestorm (September and October 2005) to concentrations
1 year after the storm (August and September 2006) in the<63 μm size fraction. No temporal trends were observed.Sites were grouped according to geographic location
tions of trace elements which would be expectedto be related to the high % of sand and low Ccontent (Turner and Millward 2002; Fugate andFriedrichs 2003; Ganju et al. 2004; Uncles et al.2006; Bettinetti et al. 2009; Liu et al. 2009). Theseobservations are also consistent with the previ-ous study (Weston et al. 2010) documenting thatGPM and BBB had the highest concentrations oftotal PAHs. Samples from GPM contained highconcentrations of Pb (9.4–148.4 μg/g) comparedto samples from the other sites. The high Pb con-centration, in spite of the high sand content, wasprobably due to the fact that GPM was an activeboat marina prior to Hurricane Katrina’s landfall(Scancar et al. 2007).
In order to compare sampling locations to oneanother, sites were ranked with respect to indi-vidual trace element concentrations using a cumu-lative sum of squares method, for both particle
sizes (Table 3). Briefly, sites were ranked fromthe highest individual element concentration (1)to the lowest concentration (10), and the valueswere squared to further separate the degree ofdifference between two closely ranked sites, andthe squared values were summed. Sites with thelowest rank and sums of squares values repre-sent sediments which contain higher trace elementconcentrations. As stated earlier, samples fromBBB, GCRL, and GBBC contained the highestconcentrations of contaminants in the <2 mm par-ticle size fraction. However, samples from GPC,GPG, and GCRL had the highest concentrationsin the <63 μm size fraction. This further em-phasizes the relationship between trace elementconcentrations and particle size.
Pre-existing data directly corresponding tothe sampling locations herein were not avail-able, however, background concentrations for the

Environ Monit Assess (2012) 184:1107–1119 1115T
able
2A
vera
getr
ace
elem
ent
conc
entr
atio
ns(w
ith
Stan
dard
Err
or(S
E)
init
alic
s)of
the
surf
ace
sedi
men
tsco
llect
edfr
omte
nsi
tes
alon
gth
eM
issi
ssip
piG
ulf
Coa
st,
intw
odi
ffer
entp
arti
cle
size
frac
tion
s(<
2m
man
d<
63μ
m)
VSE
Cr
SEM
nSE
Fe
SEC
oSE
Ni
SEZ
nSE
As
SEC
dSE
Pb
SE
<2
mm
size
frac
tion
GP
G6.
372.
547.
542.
6442
.121
.21.
380.
580.
980.
214.
502.
3079
.348
.41.
470.
740.
720.
324.
453.
22G
PM
10.2
1.33
11.3
1.48
79.3
15.6
2.60
0.58
1.24
0.18
5.32
1.30
108
22.4
2.34
0.33
0.21
0.04
49.5
17.8
GP
C4.
891.
0310
.52.
9438
.512
.11.
880.
360.
760.
143.
501.
4412
030
.40.
840.
360.
320.
040.
730.
73B
BB
42.3
4.32
55.5
6.17
240
26.6
15.8
1.85
7.93
0.70
17.8
1.27
347
53.3
7.43
0.77
0.43
0.04
29.6
3.50
BG
5.81
1.85
8.41
1.83
13.0
5.91
1.70
0.52
0.69
0.18
2.06
0.50
147
20.0
0.37
0.19
0.30
0.03
0.00
-G
CR
L41
.97.
1237
.64.
9318
238
.012
.42.
245.
260.
8015
.83.
3715
144
.66.
571.
000.
340.
0819
.02.
54P
R26
.95.
0131
.75.
8678
.39.
738.
932.
213.
990.
827.
141.
0810
521
.53.
430.
480.
430.
048.
021.
90G
BB
C22
.72.
5631
.61.
8997
.411
.613
.41.
782.
560.
3410
.71.
2818
621
.13.
990.
360.
520.
0825
.91.
89G
BB
H15
.71.
9121
.72.
2150
.54.
845.
290.
741.
530.
245.
110.
4984
.415
.92.
720.
320.
460.
0619
.92.
20M
B11
.81.
2912
.31.
2915
224
.23.
560.
382.
320.
475.
701.
3372
.916
.74.
721.
940.
340.
1012
.91.
98
<63
μm
size
frac
tion
GP
G53
.89.
5096
.411
.847
112
321
.98.
026.
862.
2236
.61.
2224
220
.411
.50.
321.
270.
2433
.012
.3G
PM
12.1
1.01
15.6
1.63
97.4
6.70
2.48
0.45
1.56
0.12
9.89
1.14
407
271
2.50
0.13
0.27
0.04
92.2
24.1
GP
C73
.02.
9397
.311
.094
820
528
.52.
0310
.60.
3839
.05.
9432
257
.617
.12.
091.
040.
1851
.512
.3B
BB
61.7
4.26
69.3
4.91
370
78.6
17.7
2.77
10.2
0.95
26.4
2.54
438
90.9
10.3
1.18
0.73
0.11
41.6
5.85
BG
48.1
5.74
90.9
9.99
192
19.1
17.9
0.46
6.39
0.60
28.5
4.75
145
14.4
7.61
0.87
0.88
0.03
18.3
3.29
GC
RL
75.3
2.87
83.1
4.29
431
63.4
22.0
2.31
9.38
0.43
32.5
2.72
212
13.8
12.6
0.58
0.60
0.06
36.9
2.38
PR
51.0
6.02
67.6
9.69
189
38.4
19.4
1.72
8.00
0.77
21.5
3.96
175
15.0
6.80
1.21
0.78
0.18
43.1
11.3
GB
BC
50.2
3.48
69.3
4.60
132
6.90
25.4
1.65
5.13
0.50
19.3
2.55
278
13.6
7.17
0.57
0.96
0.07
62.3
3.96
GB
BH
32.3
2.43
48.8
3.08
80.0
6.28
11.1
0.74
2.46
0.34
10.5
1.39
120
12.6
4.09
0.27
1.27
0.51
56.0
4.69
MB
40.2
4.41
64.8
7.68
1460
230
11.7
1.04
4.40
0.37
27.2
4.09
152
19.5
5.42
0.64
0.41
0.06
36.5
4.18
All
conc
entr
atio
nsar
esh
own
inμ
g/g,
exce
ptF
e(m
g/g)
.Val
ues
rend
ered
inbo
ldin
the
<2
mm
frac
tion
exce
edE
RL
(eff
ects
rang
elo
w)
guid
elin
es,w
hile
valu
esre
nder
edin
bold
and
unde
rlin
edsu
rpas
sP
EL
(pro
babl
eef
fect
sle
vel)
guid
elin
esus
ing
the
NO
AA
SQui
RT
sgu
idel
ines

1116 Environ Monit Assess (2012) 184:1107–1119
Table 3 Comparison of sample sites based on their cumu-lative sediment elemental concentrations using the non-parametric sums of squares method, for two particle sizefractions (<2 mm and <63 μm)
Site Ranking Sum of squares
<2 mm <63 μm <2 mm <63 μm
GPG 8 2 666 191GPM 7 10 443 786GPC 9 1 722 47BBB 1 4 32 250BG 10 7 840 413GCRL 2 3 109 213PR 4 6 238 372GBBC 3 5 110 325GBBH 5 9 334 697MB 6 8 354 555
Sites are ranked from highest cumulative trace elementconcentrations (1) to lowest (10)
Mississippi River Delta and Gulf of Mexico havebeen previously summarized (Wade et al. 2008), andtrace element concentrations have been reportedat other sites in the Gulf of Mexico prior to Hur-ricane Katrina. Most elemental (As, Co, Cr, Mn,Ni, and V) concentrations from our coastal locationswere within previously reported crustal and averagecrustal (shale) background levels (Krauskopf1979; Taylor and McLennan 1985; Swarzenskiet al. 2006). Lead and Zn concentrations were,however, up to sevenfold greater than backgroundlevels, particularly at BBB (Zn) and GPM (Pb)suggesting their potential anthropogenic origin.Trace element concentrations from several siteswere also compared to data obtained from EPA’sEnvironmental Monitoring and Assessment Prog-ram (EMAP) from 1991 to 1994 (http://iaspub.epa.gov/emap/webdev_emap.search). For exam-ple, our MB and GBBH sites were situated nearbyEMAP’s LA91LR06 and LA92SR13 locations, re-spectively. On average, MB and GBBH containedhigher concentrations of Cd (6–11-fold), Pb (1.5–2-fold), and Zn (2–2.5-fold). Additionally, PRcontained two- to sixfold higher concentrations ofAs, Cd, Cr, Fe, Mn, Ni, Pb, and Zn comparedto EMAP’s LA94SR15. The observed increasein trace element concentrations in the sedimentscould be attributed to ever increasing anthro-pogenic contribution in the region and needs tobe investigated further.
Particle size fractionation
Particle size variation plays a significant role in thedistribution and concentration of trace elementsin the surface sediments along the Mississippi GulfCoast (Tables 1 and 2). As expected (Fergusson1990; Siegel 2002), the trace element concentra-tions in the <63 μm size fraction were higher thanthose in the <2 mm size fraction with the excep-tion of Fe at GPM and Zn at BG. However, whendata were analyzed by two-way ANOVA incor-porating sites and particle size fractions, trace ele-ment concentrations were not always statisticallysignificantly different. For example, most traceelement concentrations analyzed from BBB ex-cept V were statistically similar between both sizefractions which were consistent with the fact thatBBB samples had the highest silt (35%) and clay(2%) components. Among the analyzed elementsCd, Zn, As, and Mn concentrations from mostsampling sites were similar in both size fractions.On the other hand, V, Cr, Fe, Co, and Ni concen-trations in the <63 μm fractions were significantlyhigher than those in the <2 mm size fraction frommost of the sampling sites (p values ranged from<0.05 to <0.001).
Correlations between particle size variationand elemental concentrations regardless of col-lection locations for the sediment in the <2 mmsize fraction are also shown in Table 1. With theexception of the values in bold type (p > 0.05),most of the analyzed elements were noticeablycorrelated with each other. This was particularlytrue for V, Cr, Fe, Co, and Ni. On the otherhand, Cd was not correlated with any other metalsexcept Cr and Fe. Similarly, Cd was not correlatedwith % sand, clay or C. This could be attributedto the fact that Cd has been reported to be rel-atively mobile compared to other trace elements(Kabata-Pendias 2001; Basta et al. 2005).
Potential risk from sediment exposure
The trace elements concentrations of the surfacesediments along the Mississippi Gulf Coast inthe <2 mm particle size fraction were comparedto NOAA’s Screening Quick Reference Tables(SQuiRTs) to evaluate potential adverse effectsto marine organisms. Values which exceed the

Environ Monit Assess (2012) 184:1107–1119 1117
effects range low (ERL) represent concentrationsat which toxicity may begin to be observed insensitive species, whereas the probable effectslevels (PEL) are concentrations in which adverseeffects are frequently expected. Several samplescontained concentrations that exceeded NOAASQuiRTs’ ERL and PEL threshold values (Ta-ble 3). Average concentrations of Pb at GPM(49.5 μg/g) and Zn at GBBC (186 μg/g) surpassedERL thresholds of 46.7 μg/g (Pb) and 150 μg/g(Zn), respectively. Furthermore, 78% of samplesfrom BBB exceeded the Zn PEL threshold valueof 271 μg/g (see Fig. 2). Also interesting at BBB,during February 2006, ERL values were surpassedfor Cr, Ni, Zn, As, and Pb.
Our results also compare well to the short-termstudies performed immediately following Hurri-cane Katrina. Macauley (2007) reported that thecompounds most often detected above ERLs af-ter Hurricane Katrina were As, Cd, and Ni. Inour samples, the elements that most frequentlyexceeded ERL levels were Zn and As, althoughCd and Ni also exceeded the guideline values atparticular sites. Samples from the previous studywere collected from deeper depths in the Gulf ofMexico, whereas our samples were collected atwading distance. Overall, our results are similarto those obtained from studies related to previoushurricanes in the Gulf of Mexico. For example,acute impacts were seen in the Gulf Coast afterthe 2004 hurricane season, although conditions re-turned to normal within a few months (Greeninget al. 2006; Hagy et al. 2006; Mallin and Corbett2006; USGS 2007).
Conclusions
The goal of this study was to measure trace ele-ment concentrations in surface estuarine and ma-rine sediments along the Gulf Coast to determineif Hurricane Katrina had a long-term environ-mental impact to the area. Physical and chemicalcharacterization of sediments and comparison oftrace element concentrations to NOAA SQuiRTsthreshold values were done. In summary, no long-term spatial or temporal trends were observedwith regards to sediment trace element concentra-tions following Hurricane Katrina. Instead, conta-
mination was site-specific, with the specific con-taminants relating to the use of the area priorto Hurricane Katrina (e.g., high concentrations ofPb within a former marina). Among the severalfactors that may control the distribution of traceelement concentrations in the sediment, particlesize distribution seems to be primary. Overall,the samples from BBB had the highest concen-trations of trace elements, followed by samplesfrom GCRL and GBBC, whereas samples fromthe three Gulfport sites contained the lowest el-ement concentrations. However, most concentra-tions remained below NOAA SQuiRTs guidelinesfor probable adverse effects (PELs) to marineorganisms suggesting that Hurricane Katrina didnot cause a significant trace element-associatedadverse toxicological impact in the estuaries andmarine settings along the Gulf Coast.
Acknowledgements This research was supportedby funds from NOAA-NIUST and NOAANA05NOS4261163. Determination of some sedimentcharacteristics were made with the assistance of SamTesta from the Water Quality and Ecology Research Unitof the USDA Agricultural Research Service’s NationalSedimentation Laboratory. Technical help was alsoprovided with ICP-MS analyses from Dr. Bharathi Avula.
References
Abel, M. T., Cobb, G. P., Presley, S. M., Ray, G. L.,Rainwater, T. R., Austin, G. P., et al. (2010). Leaddistributions and risks in New Orleans followingHurricanes Katrina and Rita. Environmental Toxicol-ogy and Chemistry, 29, 1429–1437.
Adams, C., Witt, E. C., Wang, J. M., Shaver, D. K.,Summers, D., Filali-Meknassi, Y., et al. (2007). Chem-ical quality of depositional sediments and associatedsoils in New Orleans and the Louisiana peninsula fol-lowing Hurricane Katrina. Environmental Science &Technology, 41, 3437–3443.
Basta, N. T, Ryan, J. A., & Chaney, R. L. (2005). Trace el-ement chemistry in residual-treated soil: Key conceptsand metal bioavailability. Journal of EnvironmentalQuality, 34, 49–63.
Bettinetti, R., Galassi, S., Falandysz, J., Camusso, M., &Vignati, D. A. L. (2009). Sediment quality assessmentin the Gulf of GdaA"sk (Baltic Sea) using comple-mentary lines of evidence. Environmental Manage-ment, 43, 1313–1320.
Bortone, S. A. (2006). Recommendations on establishing aresearch strategy in the Gulf of Mexico to assess theeffects of hurricanes on coastal ecosystems. Estuariesand Coasts, 29, 1062–1066.

1118 Environ Monit Assess (2012) 184:1107–1119
Buchman, M. F. (2008). NOAA screening quick referencetables, NOAA OR&R report 08-1.-34. Of f ice of Re-sponse and Restoration Division. Silver Spring, MD:National Oceanic and Atmospheric Administration.
Cobb, G. P., Abel, M. T., Rainwater, T. R., Austin, G. P.,Cox, S. B., Kendall, R. J., et al. (2006). Metal distri-butions in New Orleans following Hurricanes Katrinaand Rita: a continuation study. Environmental Science& Technology, 40, 4571–4577.
Doyle, T. W. (2009). Hurricane frequency and landfall dis-tribution for coastal wetlands of the Gulf Coast, USA.Wetlands, 29, 35–43.
Duzgoren-Aydin, N. S., Avula, B., Willett, K. L., &Khan, I. (2011). Determination of total and partiallyextractable solid-bound element concentrations us-ing collision/reaction cell inductively coupled plasma-mass spectrometry and their significance in environ-mental studies. Environmental Monitoring and Assess-ment, 172, 51–66.
Fergusson, J. E. (1990). The heavy elements: Chemistry,environmental impact and health ef fects. Oxford: Perg-amon.
Fugate, D. C., & Friedrichs, C. T. (2003). Controls onsuspended aggregate size in partially mixed estuaries.Estuarine Coastal and Shelf Science, 58, 389–404.
Ganju, N. K., Schoellhamer, D. H., Warner, J. C., Barad,M. F., & Schladow, S. G. (2004). Tidal oscillation ofsediment between a river and a bay: a conceptualmodel. Estuarine Coastal and Shelf Science, 60, 81–90.
Goni, M. A., Teixeira, M. J., & Perkey, D. W. (2003).Sources and distribution of organic matter in a river-dominated estuary (Winyah Bay, SC, U.S.A.). Estuar-ine Coastal and Shelf Science, 57, 1023–1048.
Greening, H., Doering, P., & Corbett, C. (2006). Hurricaneimpacts on coastal ecosystems. Estuaries and Coasts,29, 877–879.
Hagy, J. D., Lehrter, J. C., & Murrell, M. C. (2006). Effectsof Hurricane Ivan on water quality in Pensacola Bay,Florida. Estuaries and Coasts, 29, 919–925.
Harter, R. D., & Naidu, R. (1995). Role of metal-organiccomplexation in metal sorption by soils. Advances inAgronomy, 55, 219–263.
Hoyle, B. L., Scow, K. M., Fogg, G. E., & Darby, J. L.(1996). Effect of carbon:nitrogen ratio on kinetics ofphenol biodegradation by Acinetobacter johnsonii insaturated sand. Biodegradation, 6, 283–293.
Hupe, C., Koning, M., Luth, J. C., Heerenklage, K., &Stegmann, R. (2001). Optimisation of microbial soiltreatment. In R. Stegmann, G. Brunner, W. Calmano,& G. Matz (Eds.), Treatment of contaminated soils (pp.343–354). Berlin: Springer.
Kabata-Pendias, A. (2001). Trace elements in soils andplants. Boca Raton: CRC.
Kaushal, S., & Binford, M. W. (1992). Relationship be-tween C:N ratios of lake sediments, organic mattersources, and historical deforestation in Lake Pleasant,Massachusetts, USA. Journal of Paleolimnology, 22,439–442.
Knabb, R. D., Rhome, J. R., & Brown, D. R. (2005). Trop-ical cyclone report: Hurricane Katrina, 23–30 August2005. Miami, FL: National Hurricane Center.
Krauskopf, K. B. (1979). Introduction to geochemistry.Toyko: McGraw-Hill.
Liebl, A. L., Granados, L. H., Zhang, Q., Wang, G. D.,Mielke, H. W., Gonzales, C. R., et al. (2008). Effectsof post-Hurricane Katrina New Orleans (LA, U.S.A.)sediments on early development of the Japanesemedaka (Oryzias latipes). Environmental Toxicologyand Chemistry, 27, 2557–2564.
Liu, J. T., Hung, J. J., & Huang, Y. W. (2009). Partition ofsuspended and riverbed sediments related to the salt-wedge in the lower reaches of a small mountainousriver. Marine Geology, 264, 152–164.
Macauley, J. M. (2007). Environmental conditions in theNorthern Gulf of Mexico coastal waters following Hur-ricane Katrina. EPA/600/R-07/063. US. Washington,DC: Environmental Protection Agency.
Macauley, J. M., Smith, L. M., Harwell, L. C., & Benson,W. H. (2010). Sediment quality in near coastal watersof the Gulf of Mexico: Influence of Hurricane Katrina.Environmental Toxicology and Chemistry, 29, 1403–1408.
Mallin, M. A., & Corbett, C. A. (2006). How hurricane at-tributes determine the extent of environmental effects:Multiple hurricanes and different coastal systems. Es-tuaries and Coasts, 29, 1046–1061.
Meyers, P. A. (1994). Preservation of elemental and iso-topic source identification of sedimentary organic-matter. Chemical Geology, 114, 289–302.
Meyers, P. A. (2003). Applications of organic geochemistryto paleolimnological reconstructions: A summary ofexamples from the Laurentian Great Lakes. OrganicGeochemistry, 34, 261–289.
Meyers, P. A., & Teranes, J. (2001). Sediment organic mat-ter. In W. Last, & J. Smol (Eds.), Tracking environ-mental change using lake sediments, physical and geo-chemical methods (pp. 239–269). Netherlands: Kluwer.
Perez-De-Mora, A., Madejon, E., Cabrera, F., Buegger, F.,Fuss, R., Pritsch, K., et al. (2008). Long-term impact ofacid resin waste deposits on soil quality of forest areasI. Contaminants and abiotic properties. Science of theTotal Environment, 406, 88–98.
Presley, S. M., Rainwater, T. R., Austin, G. P., Platt, S. G.,Zak, J. C., Cobb, G. P., et al. (2006). Assessmentof pathogens and toxicants in New Orleans, LA fol-lowing Hurricane Katrina. Environmental Science &Technology, 40, 468–474.
Scancar, J., Zuliani, T., Turk, T., & Milacic, R. (2007).Organotin compounds and selected metals in the ma-rine environment of Northern Adriatic Sea. Environ-mental Monitoring and Assessment, 127, 271–282.
Shi, H., Witt, E. C., III, Shu, S., Su, T., Wang, J., &Adams, C. (2010). Toxic trace element assessment forsoils/sediments deposited during Hurricanes Katrinaand Rita from Southern Louisiana, U.S.A.: A sequen-tial extraction analysis. Environmental Toxicology andChemistry, 29, 1419–1428.
Siegel, F. R. (2002). Environmental geochemistry of poten-tially toxic metals. Berlin: Springer.
Stout, S. A., Liu, B., Millner, G. C., Hamlin, D., & Healey,E. (2007). Use of chemical fingerprinting to estab-lish the presence of spilled crude oil in a residential

Environ Monit Assess (2012) 184:1107–1119 1119
area following Hurricane Katrina, St. Bernard parish,Louisiana. Environmental Science & Technology, 41,7242–7251.
Swarzenski, P. W., Baskaran, M., Rosenbauer, R. J., &Orem, W. H. (2006). Historical trace element distri-bution in sediments from the Mississippi River delta.Estuaries and Coasts, 29, 1094–1107.
Taylor, S. R., & McLennan, S. M. (1985). The continentalcrust: Its composition and evolution. Oxford: Blackwell.
Turner, A., & Millward, G. E. (2002). Suspended particles:their role in estuarine biogeochemical cycles. Estuar-ine, Coastal and Shelf Science, 55, 857–883.
Uncles, R. J., Stephens, J. A., & Law, D. J. (2006). Turbid-ity maximum in the macrotidal, highly turbid HumberEstuary, U.K.: Flocs, fluid mud, stationary suspensionsand tidal bores. Estuarine Coastal and Shelf Science,67, 30–52.
USGS (United States Geological Survey) (2007). Scienceand the storms: The USGS response to the hurri-canes of 2005. USGS Circular 1306. Washington, DC:Department of the Interior.
Van Metre, P. C., Horowitz, A. J., Mahler, B. J.,Foreman, W. T., Fuller, C. C., Burkhardt, M. R., et al.(2006). Effects of Hurricanes Katrina and Rita on thechemistry of bottom sediments in Lake Pontchartrain,Louisiana, USA. Environmental Science & Technol-ogy, 40, 6894–6902.
Wade, T. L., Soliman, Y., Sweet, S. T., Wolff, G. A., &Presley, B. J. (2008). Trace elements and poly-cyclic aromatic hydrocarbons (PAHs) concentrationsin deep Gulf of Mexico sediments. Deep Sea ResearchPart II, 55, 2585–2593.
Wenning, R. J., Batley, G. E., Ingersoll, C. G., & Moore,D. W. (2005). Use of sediment quality guidelines andrelated tools for assessment of contaminated sediments.Pensacola, FL: Society of Environmental Toxicologyand Chemistry.
Weston, J., Warren, C., Chaudhary, A., Emerson, B.,Argote, K., Khan, S., et al. (2010). Use of bioassaysand sediment PAH concentrations to predict toxicityat coastal Hurricane Katrina impacted sites. Environ-mental Toxicology and Chemistry, 29, 1409–1418.