trabecular pattern analysis of proximal femur radiographs for osteoporosis detection
TRANSCRIPT
Journal of Biomedical & Pharmaceutical Engineering 1:1 (2007) 45-51 ISSN: 1793-4532
All Rights Reserved _______________________________________________________________________________________________________
_______________________________________________________________________________________________________ © 2007 Biomedical & Pharmaceutical Engineering Cluster, Nanyang Technological University 45
Trabecular Pattern Analysis of Proximal Femur Radiographs for Osteoporosis Detection
J.T. Pramudito1,4, S. Soegijoko1, T.R. Mengko1, F.I. Muchtadi2, R.G. Wachjudi3
1School of Electrical Engineering & Informatics, Institut Teknologi Bandung, Indonesia 2Faculty of Industrial Technology, Institut Teknologi Bandung, Indonesia
3Department of Internal Medicine, Faculty of Medicine, Padjadjaran University, Indonesia 4Faculty of Industrial Technology, Parahyangan Catholic University, Indonesia
Corresponding Author: J.T. PRAMUDITO; Mailing Address: Jalan Ganesha 10, Bandung 40132, Indonesia; Tel: +62-22-425 4049; Fax: +62-22-253 4117; Email: [email protected] , [email protected]
Abstract The most common approach to the study of the structural changes with age in the proximal femur is by means of the Singh index. However, subjectivity of its grades determination may limit its practical value. In this paper, we used several texture analysis techniques to characterize the trabecular pattern changes in proximal femur recorded in radiographs that lead to osteoporosis detection. Texture analysis was used to rank 41 radiographs and then compared to Singh index grading performed by experienced experts. We compare three texture analysis methods namely Gabor filter, wavelet transforms and fractal dimension to extract the features that represent the structural change in trabecular pattern. The assessment of osteoporosis can be performed by observing and analyzing the trabecular patterns recorded in proximal femur radiographs. The predetermined Singh indexes of trabecular pattern are used to justify the classification result. The features extracted using Gabor filter, wavelet transform and fractal analysis are found to be significantly correlated with predetermined Singh indexes (r=0.87, r=0.84 and r=0.79 with p=0.001).
Keywords: trabecular change, proximal femur, Gabor filter, wavelet transform, fractal dimension. Received 12 January 2007; accepted 29 June 2007
1 INTRODUCTION
Osteoporosis is characterized by an absolute decrease in the amount of bone to a level below that required for mechanical support of normal activity and by the occurrence of non-traumatic skeletal fracture [1]. In other words osteoporosis is very much related to the bone strength. Optimal estimation of bone strength could probably be achieved if both bone structure and mass could be measured together [1].
Bone mass can be measured by Bone Mineral Densitometry (BMD) techniques using various mode such as ultrasound or Dual Energy X-ray Absorptiometry (DEXA). For the time being DEXA is considered as a gold standard to detect osteoporosis. Bone structure can be estimated by observing the change of trabecular pattern in proximal femur radiograph. The observation of trabecular pattern
change for diagnosis of osteoporosis was first proposed in the 1960s using radiographs of proximal femur. The diagnosis was known as Singh Index grading system but always been considered too variable for diagnosis or epidemiology [2-5].
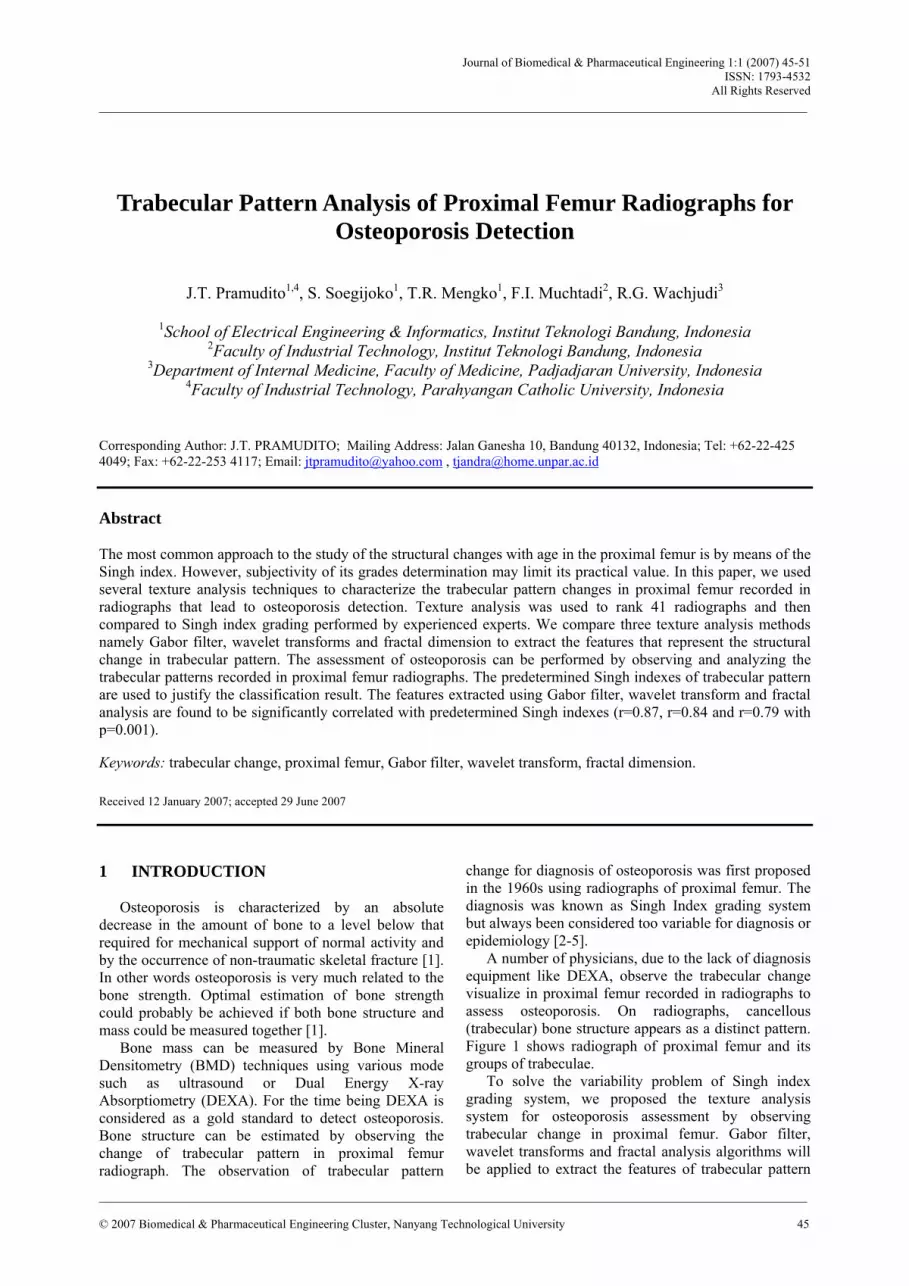
A number of physicians, due to the lack of diagnosis equipment like DEXA, observe the trabecular change visualize in proximal femur recorded in radiographs to assess osteoporosis. On radiographs, cancellous (trabecular) bone structure appears as a distinct pattern. Figure 1 shows radiograph of proximal femur and its groups of trabeculae.
To solve the variability problem of Singh index grading system, we proposed the texture analysis system for osteoporosis assessment by observing trabecular change in proximal femur. Gabor filter, wavelet transforms and fractal analysis algorithms will be applied to extract the features of trabecular pattern
Trabecular Pattern Analysis of Proximal Femur Radiographs for Osteoporosis Detection _______________________________________________________________________________________________________
_______________________________________________________________________________________________________ © 2007 Biomedical & Pharmaceutical Engineering Cluster, Nanyang Technological University 46
recorded on proximal femur radiographs. Initial research in features extraction of proximal femur trabecular pattern using Gabor filter and discrete wavelet transform (DWT) has been performed with quite promising result [6-7]. The extracted features will represent the quality or structure of the bone, better quality represents better bone strength, lower quality leads to low bone strength and could be suspected as osteoporotic. The extracted features of the samples, in the form of energy, are then compared with their corresponding Singh index determined by physician.
Figure 1: Proximal femur radiograph and its trabecular groups.
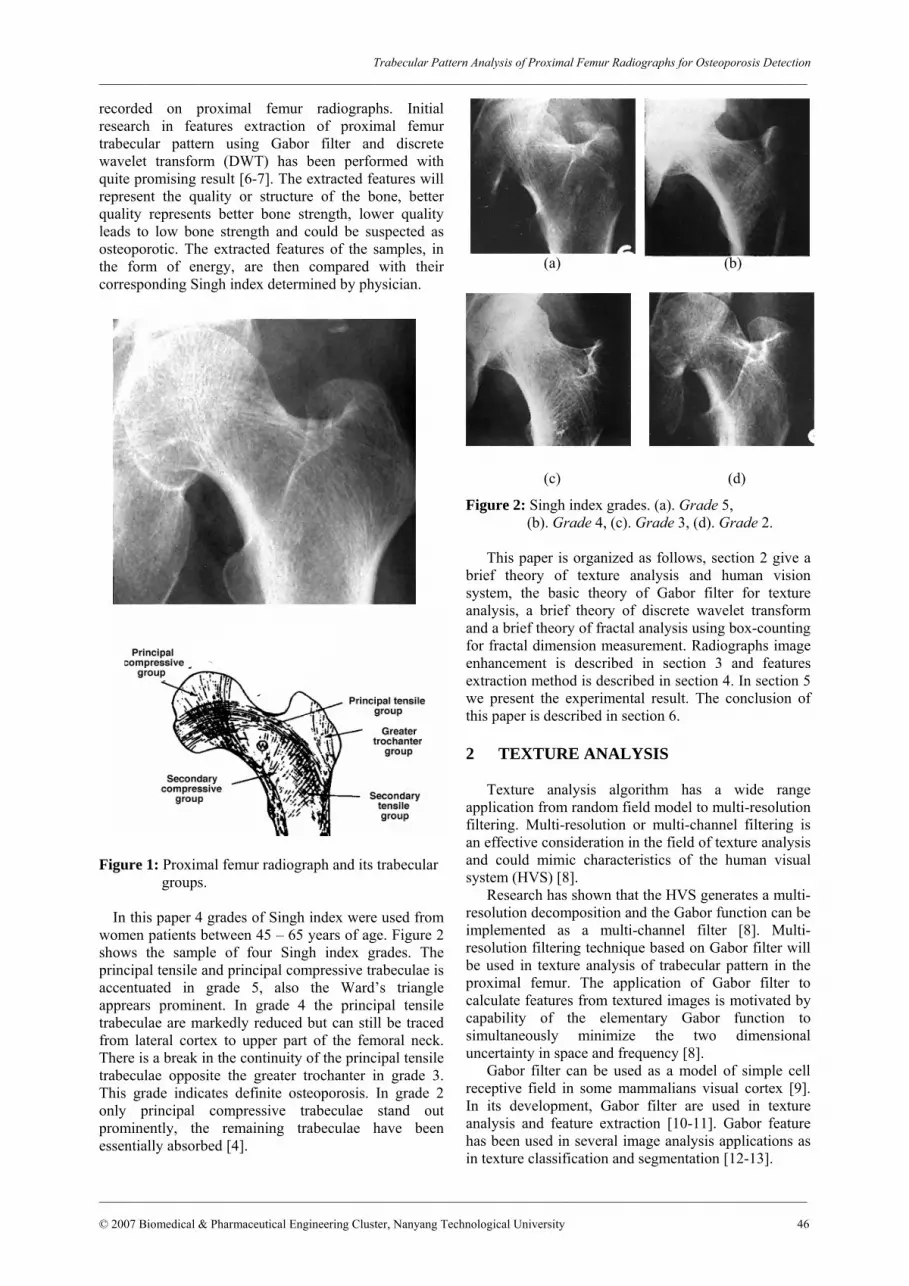
In this paper 4 grades of Singh index were used from women patients between 45 – 65 years of age. Figure 2 shows the sample of four Singh index grades. The principal tensile and principal compressive trabeculae is accentuated in grade 5, also the Ward’s triangle apprears prominent. In grade 4 the principal tensile trabeculae are markedly reduced but can still be traced from lateral cortex to upper part of the femoral neck. There is a break in the continuity of the principal tensile trabeculae opposite the greater trochanter in grade 3. This grade indicates definite osteoporosis. In grade 2 only principal compressive trabeculae stand out prominently, the remaining trabeculae have been essentially absorbed [4].
(a) (b) (c) (d)
Figure 2: Singh index grades. (a). Grade 5, (b). Grade 4, (c). Grade 3, (d). Grade 2.
This paper is organized as follows, section 2 give a brief theory of texture analysis and human vision system, the basic theory of Gabor filter for texture analysis, a brief theory of discrete wavelet transform and a brief theory of fractal analysis using box-counting for fractal dimension measurement. Radiographs image enhancement is described in section 3 and features extraction method is described in section 4. In section 5 we present the experimental result. The conclusion of this paper is described in section 6. 2 TEXTURE ANALYSIS
Texture analysis algorithm has a wide range application from random field model to multi-resolution filtering. Multi-resolution or multi-channel filtering is an effective consideration in the field of texture analysis and could mimic characteristics of the human visual system (HVS) [8].
Research has shown that the HVS generates a multi-resolution decomposition and the Gabor function can be implemented as a multi-channel filter [8]. Multi-resolution filtering technique based on Gabor filter will be used in texture analysis of trabecular pattern in the proximal femur. The application of Gabor filter to calculate features from textured images is motivated by capability of the elementary Gabor function to simultaneously minimize the two dimensional uncertainty in space and frequency [8].
Gabor filter can be used as a model of simple cell receptive field in some mammalians visual cortex [9]. In its development, Gabor filter are used in texture analysis and feature extraction [10-11]. Gabor feature has been used in several image analysis applications as in texture classification and segmentation [12-13].
Trabecular Pattern Analysis of Proximal Femur Radiographs for Osteoporosis Detection _______________________________________________________________________________________________________
_______________________________________________________________________________________________________ © 2007 Biomedical & Pharmaceutical Engineering Cluster, Nanyang Technological University 47
The Gabor filter is applied to the classification of osteoporosis level based on the change in trabecular pattern. Classification is performed based on features extracted by Gabor filter in the form of energy. The classification results are then compared with the Singh index determined by physician.
2.1 Gabor Filter
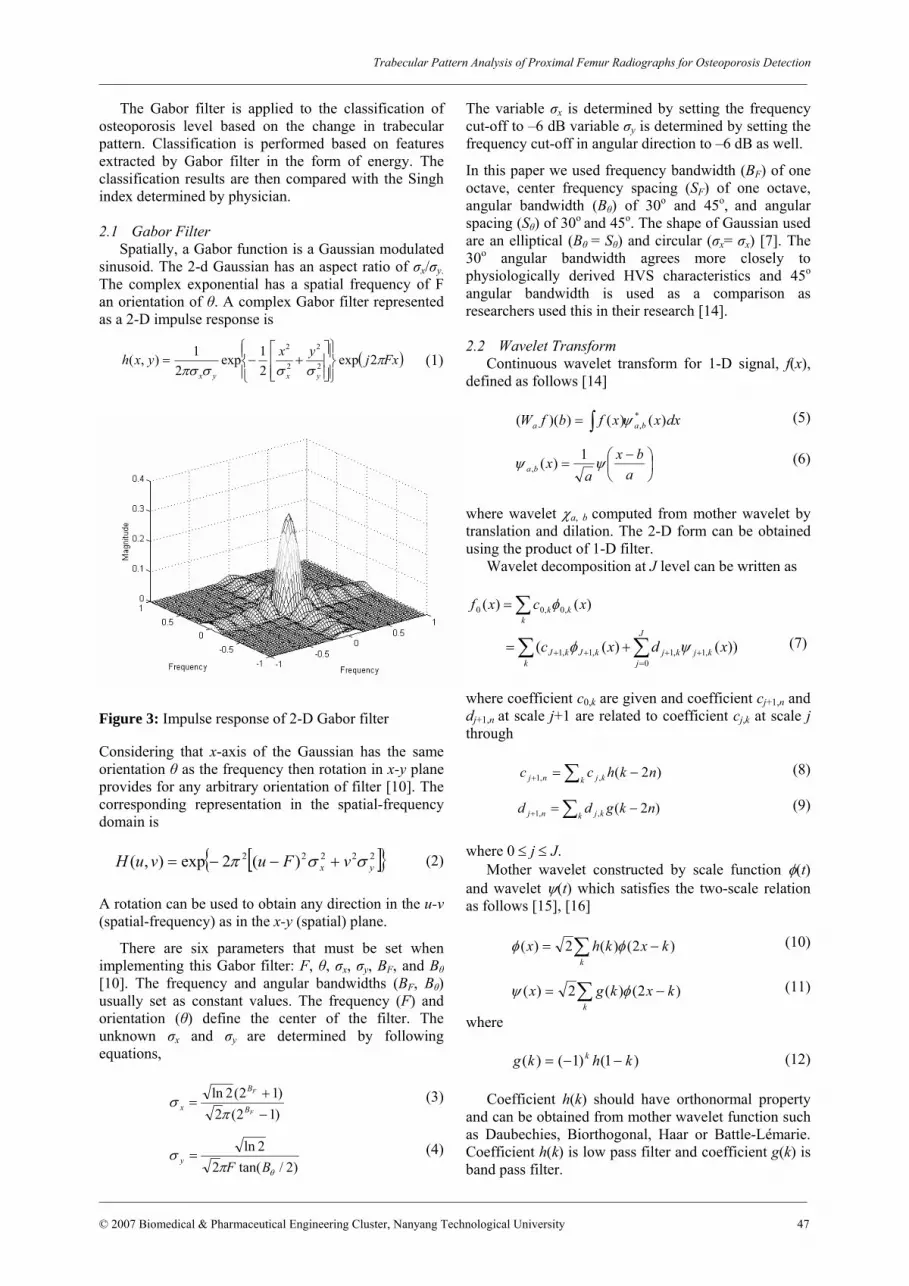
Spatially, a Gabor function is a Gaussian modulated sinusoid. The 2-d Gaussian has an aspect ratio of σx/σy. The complex exponential has a spatial frequency of F an orientation of θ. A complex Gabor filter represented as a 2-D impulse response is
( )Fxjyxyxhyxyx
πσσσπσ
2exp21exp
21),( 2
2
2
2
⎪⎭
⎪⎬⎫
⎪⎩
⎪⎨⎧
⎥⎥⎦
⎤
⎢⎢⎣
⎡+−=
Figure 3: Impulse response of 2-D Gabor filter
Considering that x-axis of the Gaussian has the same orientation θ as the frequency then rotation in x-y plane provides for any arbitrary orientation of filter [10]. The corresponding representation in the spatial-frequency domain is
[ ]{ }22222 )(2exp),( yx vFuvuH σσπ +−−= (2)
A rotation can be used to obtain any direction in the u-v (spatial-frequency) as in the x-y (spatial) plane.
There are six parameters that must be set when implementing this Gabor filter: F, θ, σx, σy, BF, and Bθ [10]. The frequency and angular bandwidths (BF, Bθ) usually set as constant values. The frequency (F) and orientation (θ) define the center of the filter. The unknown σx and σy are determined by following equations,
)12(2)12(2ln
−+
=F
F
B
B
x πσ (3)
)2/tan(22ln
θπσ
BFy = (4)
The variable σx is determined by setting the frequency cut-off to –6 dB variable σy is determined by setting the frequency cut-off in angular direction to –6 dB as well.
In this paper we used frequency bandwidth (BF) of one octave, center frequency spacing (SF) of one octave, angular bandwidth (Bθ) of 30o and 45o, and angular spacing (Sθ) of 30o and 45o. The shape of Gaussian used are an elliptical (Bθ = Sθ) and circular (σx= σx) [7]. The 30o angular bandwidth agrees more closely to physiologically derived HVS characteristics and 45o angular bandwidth is used as a comparison as researchers used this in their research [14]. 2.2 Wavelet Transform
Continuous wavelet transform for 1-D signal, f(x), defined as follows [14]
dxxxfbfW baa )()())(( *,ψ∫= (5)
⎟⎠⎞
⎜⎝⎛ −
=a
bxa
xba ψψ 1)(, (6)
where wavelet χa, b computed from mother wavelet by translation and dilation. The 2-D form can be obtained using the product of 1-D filter.
Wavelet decomposition at J level can be written as
∑=k
kk xcxf )()( ,0,00 φ
∑ ∑=
++++ +=k
J
jkjkjkJkJ xdxc
0,1,1,1,1 ))()(( ψφ (7)
where coefficient c0,k are given and coefficient cj+1,n and dj+1,n at scale j+1 are related to coefficient cj,k at scale j through
∑ −=+ k kjnj nkhcc )2(,,1 (8)
∑ −=+ k kjnj nkgdd )2(,,1 (9)
where 0 ≤ j ≤ J. Mother wavelet constructed by scale function φ(t)
and wavelet ψ(t) which satisfies the two-scale relation as follows [15], [16]
∑ −=k
kxkhx )2()(2)( φφ (10)
∑ −=k
kxkgx )2()(2)( φψ (11)
where
)1()1()( khkg k −−= (12)
Coefficient h(k) should have orthonormal property and can be obtained from mother wavelet function such as Daubechies, Biorthogonal, Haar or Battle-Lémarie. Coefficient h(k) is low pass filter and coefficient g(k) is band pass filter.
(1)
Trabecular Pattern Analysis of Proximal Femur Radiographs for Osteoporosis Detection _______________________________________________________________________________________________________
_______________________________________________________________________________________________________ © 2007 Biomedical & Pharmaceutical Engineering Cluster, Nanyang Technological University 48
To analyze discrete signal such as digital image, the discrete wavelet transform (DWT) should be used. In practice, DWT is computed by applying separated filter bank to signal f(x) or image I(x).
),(]]*[*[)( 2,11,21, jinyxjin bbLHHbbL ↓↓−= (13)
),(]]*[*[)( 2,11,21,1 jinyxjin bbLGHbbD ↓↓−= (14)
),(]]*[*[)( 2,11,21,2 jinyxjin bbLHGbbD ↓↓−= (15)
),(]]*[*[)( 2,11,21,3 jinyxjin bbLGGbbD ↓↓−= (16)
* is convolution operator, ↓2,1 (↓1,2) is sub sampling along row(column) and L0 = I(x) is original image. H and G are low pass and band pass filter respectively. Ln is the result of low pass filtering and thus referred as low resolution image at scale n. Dni is obtained from band pass filtering at certain direction and thus containing detail direction information at scale n and called as detail image.
Original image I is represented by a set of sub image at different scale: {Ld, Dni}i=1,2,3; n=1..d which is the multiscale representation with depth d of image I. For this research, the mother wavelet function used is Haar wavelet. The application of equations 13, 14, 15 and 16 for the calculation of 2-D wavelet coefficients is shown in decomposition scheme as follow
Figure 4: Decomposition scheme for the calculation of 2-D wavelet coefficients. 2.3 Fractal Dimension
Fractal based texture classification is another approach that could be applied to analyze trabecular change in proximal femur. A fractal is defined as a set for which Hausdorff-Besicovich dimension is greater than the topological dimension [17]. One way to measure fractal dimension is using box-counting algorithm [18]. The box-counting dimension is much more widely used than the self-similarity dimension since the box-counting dimension can measure pictures that are not self-similar (and most real-life applications are not self-similar).
To calculate this dimension for a fractal S, imagine this fractal lying on an evenly-spaced grid, and count how many boxes are required to cover the set. The box-counting dimension is calculated by seeing how this
number changes as we make the grid finer. Suppose that N(ε) is the number of boxes of side length ε required to cover the set. Then the box-counting dimension is defined as:
)/1log()(log
0lim)(dim ε
ε
ε
Nbox S
→= (17)
3 IMAGE ENHANCEMENT OF RADIOGRAPHS
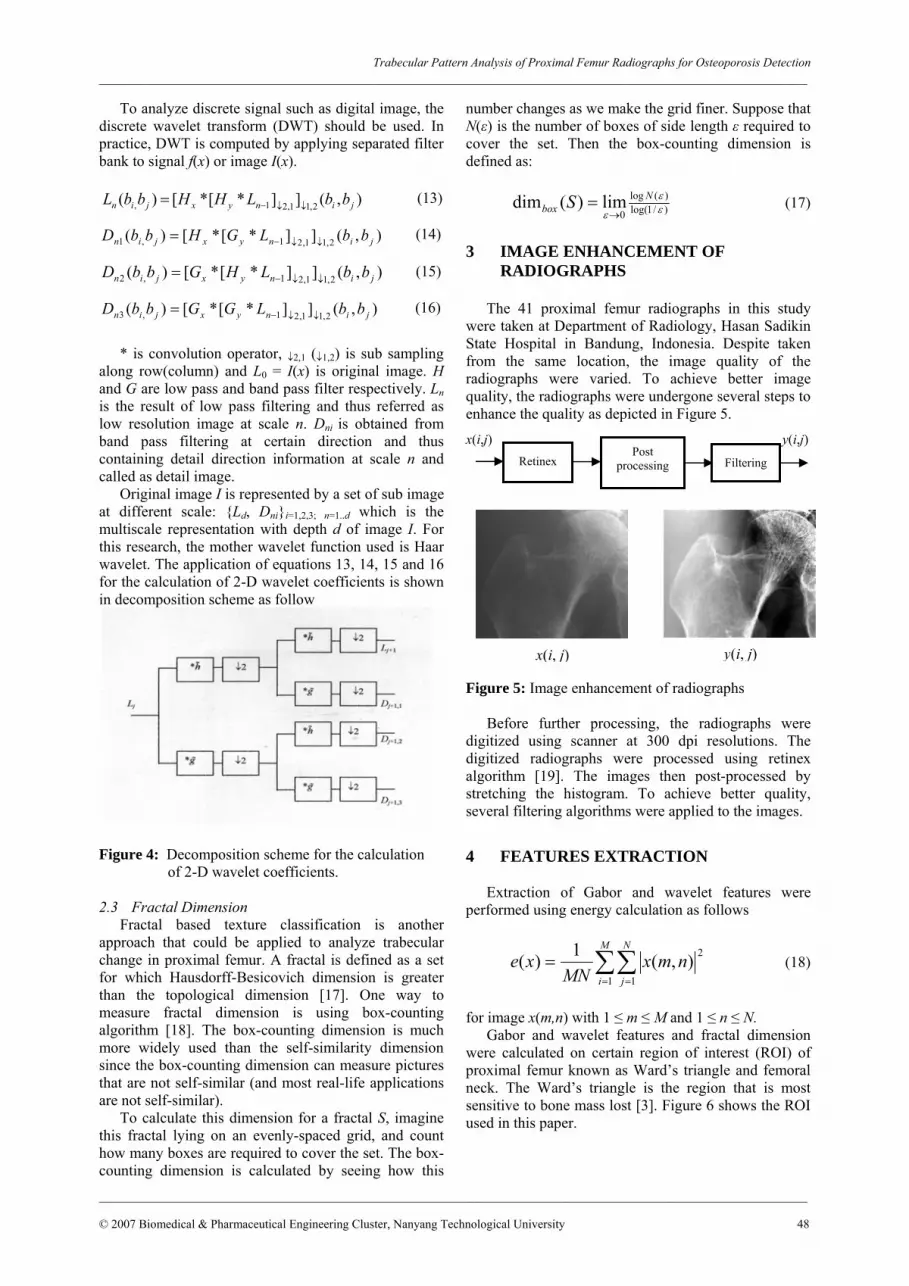
The 41 proximal femur radiographs in this study were taken at Department of Radiology, Hasan Sadikin State Hospital in Bandung, Indonesia. Despite taken from the same location, the image quality of the radiographs were varied. To achieve better image quality, the radiographs were undergone several steps to enhance the quality as depicted in Figure 5.
x(i,j) y(i,j) Figure 5: Image enhancement of radiographs
Before further processing, the radiographs were
digitized using scanner at 300 dpi resolutions. The digitized radiographs were processed using retinex algorithm [19]. The images then post-processed by stretching the histogram. To achieve better quality, several filtering algorithms were applied to the images.
4 FEATURES EXTRACTION
Extraction of Gabor and wavelet features were performed using energy calculation as follows
∑∑= =
=M
i
N
jnmx
MNxe
1 1
2),(1)( (18)
for image x(m,n) with 1 ≤ m ≤ M and 1 ≤ n ≤ N. Gabor and wavelet features and fractal dimension
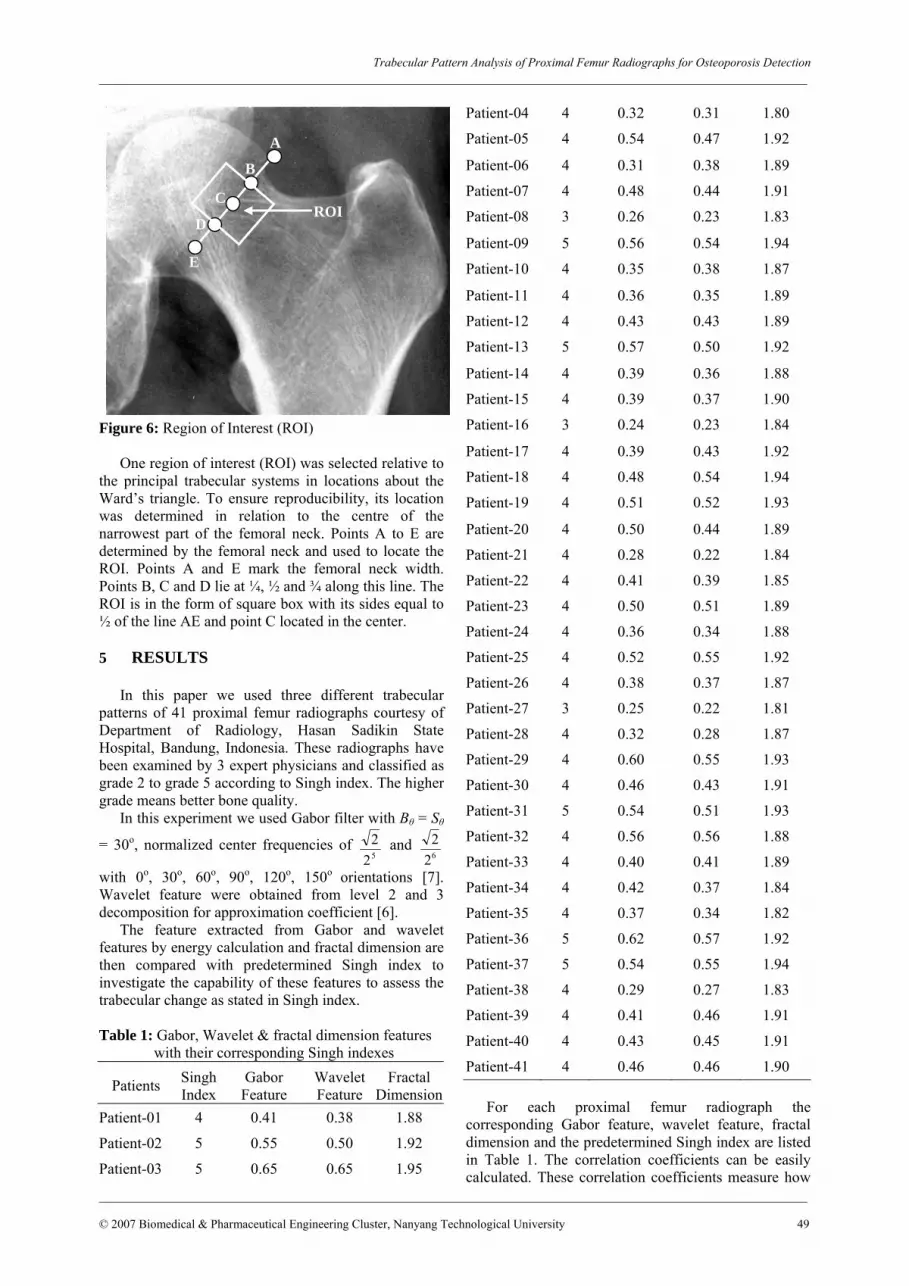
were calculated on certain region of interest (ROI) of proximal femur known as Ward’s triangle and femoral neck. The Ward’s triangle is the region that is most sensitive to bone mass lost [3]. Figure 6 shows the ROI used in this paper.
Retinex Post
processing Filtering
x(i, j) y(i, j)
Trabecular Pattern Analysis of Proximal Femur Radiographs for Osteoporosis Detection _______________________________________________________________________________________________________
_______________________________________________________________________________________________________ © 2007 Biomedical & Pharmaceutical Engineering Cluster, Nanyang Technological University 49
Figure 6: Region of Interest (ROI)
One region of interest (ROI) was selected relative to the principal trabecular systems in locations about the Ward’s triangle. To ensure reproducibility, its location was determined in relation to the centre of the narrowest part of the femoral neck. Points A to E are determined by the femoral neck and used to locate the ROI. Points A and E mark the femoral neck width. Points B, C and D lie at ¼, ½ and ¾ along this line. The ROI is in the form of square box with its sides equal to ½ of the line AE and point C located in the center. 5 RESULTS
In this paper we used three different trabecular patterns of 41 proximal femur radiographs courtesy of Department of Radiology, Hasan Sadikin State Hospital, Bandung, Indonesia. These radiographs have been examined by 3 expert physicians and classified as grade 2 to grade 5 according to Singh index. The higher grade means better bone quality.
In this experiment we used Gabor filter with Bθ = Sθ
= 30o, normalized center frequencies of 522 and
622
with 0o, 30o, 60o, 90o, 120o, 150o orientations [7]. Wavelet feature were obtained from level 2 and 3 decomposition for approximation coefficient [6].
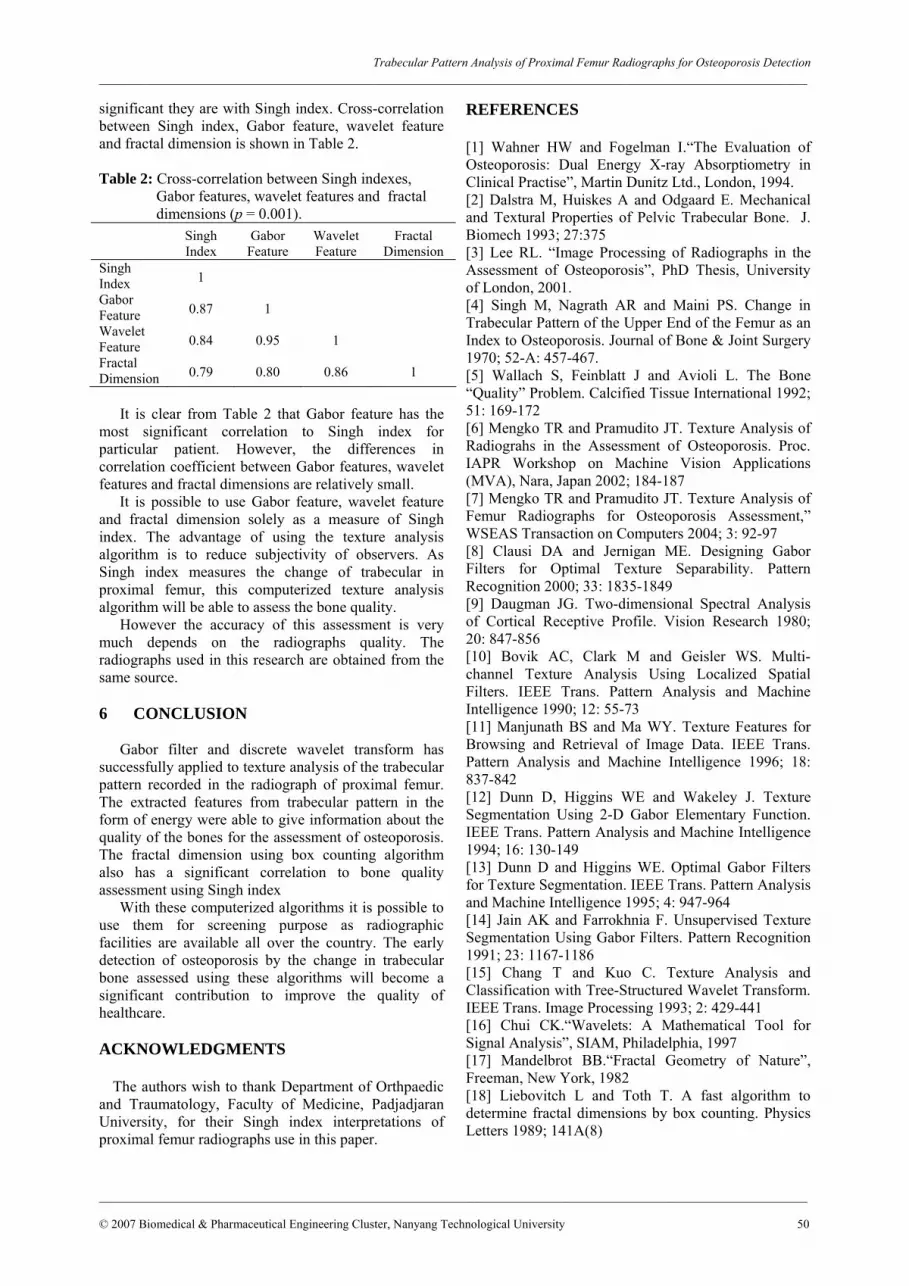
The feature extracted from Gabor and wavelet features by energy calculation and fractal dimension are then compared with predetermined Singh index to investigate the capability of these features to assess the trabecular change as stated in Singh index.
Table 1: Gabor, Wavelet & fractal dimension features
with their corresponding Singh indexes
Patients Singh Index
Gabor Feature
Wavelet Feature
Fractal Dimension
Patient-01 4 0.41 0.38 1.88
Patient-02 5 0.55 0.50 1.92
Patient-03 5 0.65 0.65 1.95
Patient-04 4 0.32 0.31 1.80
Patient-05 4 0.54 0.47 1.92
Patient-06 4 0.31 0.38 1.89
Patient-07 4 0.48 0.44 1.91
Patient-08 3 0.26 0.23 1.83
Patient-09 5 0.56 0.54 1.94
Patient-10 4 0.35 0.38 1.87
Patient-11 4 0.36 0.35 1.89
Patient-12 4 0.43 0.43 1.89
Patient-13 5 0.57 0.50 1.92
Patient-14 4 0.39 0.36 1.88
Patient-15 4 0.39 0.37 1.90
Patient-16 3 0.24 0.23 1.84
Patient-17 4 0.39 0.43 1.92
Patient-18 4 0.48 0.54 1.94
Patient-19 4 0.51 0.52 1.93
Patient-20 4 0.50 0.44 1.89
Patient-21 4 0.28 0.22 1.84
Patient-22 4 0.41 0.39 1.85
Patient-23 4 0.50 0.51 1.89
Patient-24 4 0.36 0.34 1.88
Patient-25 4 0.52 0.55 1.92
Patient-26 4 0.38 0.37 1.87
Patient-27 3 0.25 0.22 1.81
Patient-28 4 0.32 0.28 1.87
Patient-29 4 0.60 0.55 1.93
Patient-30 4 0.46 0.43 1.91
Patient-31 5 0.54 0.51 1.93
Patient-32 4 0.56 0.56 1.88
Patient-33 4 0.40 0.41 1.89
Patient-34 4 0.42 0.37 1.84
Patient-35 4 0.37 0.34 1.82
Patient-36 5 0.62 0.57 1.92
Patient-37 5 0.54 0.55 1.94
Patient-38 4 0.29 0.27 1.83
Patient-39 4 0.41 0.46 1.91
Patient-40 4 0.43 0.45 1.91
Patient-41 4 0.46 0.46 1.90 For each proximal femur radiograph the
corresponding Gabor feature, wavelet feature, fractal dimension and the predetermined Singh index are listed in Table 1. The correlation coefficients can be easily calculated. These correlation coefficients measure how
A
E
B
C
D ROI
Trabecular Pattern Analysis of Proximal Femur Radiographs for Osteoporosis Detection _______________________________________________________________________________________________________
_______________________________________________________________________________________________________ © 2007 Biomedical & Pharmaceutical Engineering Cluster, Nanyang Technological University 50
significant they are with Singh index. Cross-correlation between Singh index, Gabor feature, wavelet feature and fractal dimension is shown in Table 2. Table 2: Cross-correlation between Singh indexes, Gabor features, wavelet features and fractal dimensions (p = 0.001). Singh
Index Gabor
Feature Wavelet Feature
Fractal Dimension
Singh Index 1 Gabor Feature 0.87 1 Wavelet Feature 0.84 0.95 1 Fractal Dimension 0.79 0.80 0.86 1
It is clear from Table 2 that Gabor feature has the
most significant correlation to Singh index for particular patient. However, the differences in correlation coefficient between Gabor features, wavelet features and fractal dimensions are relatively small.
It is possible to use Gabor feature, wavelet feature and fractal dimension solely as a measure of Singh index. The advantage of using the texture analysis algorithm is to reduce subjectivity of observers. As Singh index measures the change of trabecular in proximal femur, this computerized texture analysis algorithm will be able to assess the bone quality.
However the accuracy of this assessment is very much depends on the radiographs quality. The radiographs used in this research are obtained from the same source.
6 CONCLUSION
Gabor filter and discrete wavelet transform has successfully applied to texture analysis of the trabecular pattern recorded in the radiograph of proximal femur. The extracted features from trabecular pattern in the form of energy were able to give information about the quality of the bones for the assessment of osteoporosis. The fractal dimension using box counting algorithm also has a significant correlation to bone quality assessment using Singh index
With these computerized algorithms it is possible to use them for screening purpose as radiographic facilities are available all over the country. The early detection of osteoporosis by the change in trabecular bone assessed using these algorithms will become a significant contribution to improve the quality of healthcare.
ACKNOWLEDGMENTS The authors wish to thank Department of Orthpaedic and Traumatology, Faculty of Medicine, Padjadjaran University, for their Singh index interpretations of proximal femur radiographs use in this paper.
REFERENCES [1] Wahner HW and Fogelman I.“The Evaluation of Osteoporosis: Dual Energy X-ray Absorptiometry in Clinical Practise”, Martin Dunitz Ltd., London, 1994. [2] Dalstra M, Huiskes A and Odgaard E. Mechanical and Textural Properties of Pelvic Trabecular Bone. J. Biomech 1993; 27:375 [3] Lee RL. “Image Processing of Radiographs in the Assessment of Osteoporosis”, PhD Thesis, University of London, 2001. [4] Singh M, Nagrath AR and Maini PS. Change in Trabecular Pattern of the Upper End of the Femur as an Index to Osteoporosis. Journal of Bone & Joint Surgery 1970; 52-A: 457-467. [5] Wallach S, Feinblatt J and Avioli L. The Bone “Quality” Problem. Calcified Tissue International 1992; 51: 169-172 [6] Mengko TR and Pramudito JT. Texture Analysis of Radiograhs in the Assessment of Osteoporosis. Proc. IAPR Workshop on Machine Vision Applications (MVA), Nara, Japan 2002; 184-187 [7] Mengko TR and Pramudito JT. Texture Analysis of Femur Radiographs for Osteoporosis Assessment,” WSEAS Transaction on Computers 2004; 3: 92-97 [8] Clausi DA and Jernigan ME. Designing Gabor Filters for Optimal Texture Separability. Pattern Recognition 2000; 33: 1835-1849 [9] Daugman JG. Two-dimensional Spectral Analysis of Cortical Receptive Profile. Vision Research 1980; 20: 847-856 [10] Bovik AC, Clark M and Geisler WS. Multi-channel Texture Analysis Using Localized Spatial Filters. IEEE Trans. Pattern Analysis and Machine Intelligence 1990; 12: 55-73 [11] Manjunath BS and Ma WY. Texture Features for Browsing and Retrieval of Image Data. IEEE Trans. Pattern Analysis and Machine Intelligence 1996; 18: 837-842 [12] Dunn D, Higgins WE and Wakeley J. Texture Segmentation Using 2-D Gabor Elementary Function. IEEE Trans. Pattern Analysis and Machine Intelligence 1994; 16: 130-149 [13] Dunn D and Higgins WE. Optimal Gabor Filters for Texture Segmentation. IEEE Trans. Pattern Analysis and Machine Intelligence 1995; 4: 947-964 [14] Jain AK and Farrokhnia F. Unsupervised Texture Segmentation Using Gabor Filters. Pattern Recognition 1991; 23: 1167-1186 [15] Chang T and Kuo C. Texture Analysis and Classification with Tree-Structured Wavelet Transform. IEEE Trans. Image Processing 1993; 2: 429-441 [16] Chui CK.“Wavelets: A Mathematical Tool for Signal Analysis”, SIAM, Philadelphia, 1997 [17] Mandelbrot BB.“Fractal Geometry of Nature”, Freeman, New York, 1982 [18] Liebovitch L and Toth T. A fast algorithm to determine fractal dimensions by box counting. Physics Letters 1989; 141A(8)

Trabecular Pattern Analysis of Proximal Femur Radiographs for Osteoporosis Detection _______________________________________________________________________________________________________
_______________________________________________________________________________________________________ © 2007 Biomedical & Pharmaceutical Engineering Cluster, Nanyang Technological University 51
[19] Funt BV, Ciurea F and McCann JJ. Retinex in Matlab. Proc. IS&T/SID Eighth Color Imaging Conference, Sc