town of corte madera
TRANSCRIPT
TitleandIDX.doc i
TOWN OF CORTE MADERA
Incorporated June 10, 1916
and
SANITARY DISTRICT NO. 2 of MARIN COUNTY Incorporated January 21, 1901
A Subsidiary District to the Town of Corte Madera
FY 2011-2012
ADOPTED BUDGET
TOWN COUNCIL/DISTRICT BOARD OF DIRECTORS
Alexandra Cock, Mayor/President
Bob Ravasio, Vice-Mayor/Vice President
Carla Condon, Council/Boardmember
Diane Furst, Council/Boardmember
Michael Lappert, Council/Boardmember
Prepared by
David James Bracken, Town Manager and Town Engineer
and
George T. Warman, Jr., Director of Administrative Services/Town Treasurer
TitleandIDX.doc ii
TABLE OF CONTENTS
Budget Message .................................................................................................................................................................................... M1
Town Resolution Adopting Budget for FY 2011-2012 ........................................................................................................................ M12
District Resolution Adopting Budget for FY 2011-2012 ...................................................................................................................... M14
Key to Funding Sources Abbreviations Used in Budget ...................................................................................................................... M16
Summaries
Statement of Estimated Fund Balances ............................................................................................................................................ S1
Town Revenue Summary ................................................................................................................................................................. S7
Town Expenditure Summary ........................................................................................................................................................... S12
Permanent Staffing Summary .......................................................................................................................................................... S26
Town General Purpose Tax Revenue Summary .............................................................................................................................. S30
Town General Purpose Tax Revenue Expenditure Summary .......................................................................................................... S34
Graphic Analysis of Revenue Base .................................................................................................................................................. S37
Forecasting Model ................................................................................................................................................................................ FM1
General Capital Projects & Studies ....................................................................................................................................................... GC1
General Government ............................................................................................................................................................................. GG1
Mayor & Council ............................................................................................................................................................................. GG4
Legal Services .................................................................................................................................................................................. GG6
Town Administration ....................................................................................................................................................................... GG7
Administrative Services ................................................................................................................................................................... GG11
Town Hall Building Maintenance .................................................................................................................................................... GG15
Self-Insurance Program .................................................................................................................................................................... GG16
Planning & Building Department ......................................................................................................................................................... PB1
Summary .......................................................................................................................................................................................... PB3
Current & Advanced Planning ......................................................................................................................................................... PB6
Building Regulation ......................................................................................................................................................................... PB8
Police Services ...................................................................................................................................................................................... P1
Fire Department .................................................................................................................................................................................... F1
Summary .......................................................................................................................................................................................... F4
Fire Administration .......................................................................................................................................................................... F8
Fire Prevention ................................................................................................................................................................................. F9
Fire Suppression ............................................................................................................................................................................... F10
Emergency Medical Services ........................................................................................................................................................... F14
TitleandIDX.doc iii
TABLE OF CONTENTS
Continued
Fire Department, continued
Disaster Preparedness ................................................................................................................................. F16
Public Works Department ...................................................................................................................................... PW1
Summary ..................................................................................................................................................... PW4
Engineering & Public Works Administration ............................................................................................. PW8
Vehicles & Equipment ................................................................................................................................ PW10
Flood Control & Storm Drainage ............................................................................................................... PW14
Parks & Beautification ................................................................................................................................ PW17
Street Maintenance ..................................................................................................................................... PW20
Street Sweeping .......................................................................................................................................... PW23
Street Lighting ............................................................................................................................................ PW24
Street Traffic Signals, Signs, Striping ........................................................................................................ PW25
Weed Abatement for Fire Protection .......................................................................................................... PW26
NPDES ........................................................................................................................................................ PW27
Recreation Department .......................................................................................................................................... R1
Summary ..................................................................................................................................................... R3
Recreation Center & Programs ................................................................................................................... R8
Outdoor Facilities & Programs ................................................................................................................... R10
Neil Cummins Gym & Programs................................................................................................................ R11
Kids Club After School Programs .............................................................................................................. R12
Summer Camps & Playground Programs ................................................................................................... R13
Other Budgets ........................................................................................................................................................ Q1
Animal Control Services ............................................................................................................................. Q3
Marin Telecommunications Agency ........................................................................................................... Q4
Library Services .......................................................................................................................................... Q5
Property Tax Collection Services ............................................................................................................... Q6
July 4th ......................................................................................................................................................... Q7
Corte Madera Chamber of Commerce ........................................................................................................ Q8
Marin Emergency Radio Authority ............................................................................................................ Q9
Debt Service ................................................................................................................................................ Q10
Transportation Authority of Marin ............................................................................................................. Q13
Marin Local Agency Formation Commission (LAFCO) ........................................................................... Q14
Marin General Services Authority .............................................................................................................. Q15
Marin Housing Authority ........................................................................................................................... Q16
Sewer Fund ............................................................................................................................................................ SF1
Sewer Capital Projects ........................................................................................................................................... SC1
TitleandIDX.doc iv
BLANK PAGE

M 1
BUDGET MESSAGE
FISCAL YEAR 2011-2012
June 17, 2011
TO: MAYOR AND TOWN COUNCIL
FROM: DAVID JAMES BRACKEN, TOWN MANAGER AND TOWN ENGINEER
GEORGE T. WARMAN, JR., DIRECTOR OF ADMINISTRATIVE SERVICES/TOWN TREASURER
RE: PROPOSED FY 2011-2012 BUDGET FOR TOWN OF CORTE MADERA AND
SANITARY DISTRICT NO. 2
Summary
Attached are the proposed Operating and Capital Projects Budgets for the Town of Corte Madera and Sanitary District No. 2 for
FY 2011-2012. Corte Madera is certainly not alone in continuing to feel the affects of the largest and longest recession the country and
world have experienced since 1929. I would like to say we have “lived through it”; however it would be more appropriate to say that
we continue to live with it. We are once again projecting sales tax and property tax revenues to remain flat in comparison to last fiscal
year, although this could be considered as somewhat of a blessing compared to the many municipalities that are expecting a decline in
these revenue sources.
I have stated in past budget messages that one of the most important graphs in the budget is one that shows recurring revenues over or
under recurring expenditures. This graph is shown on page FM8. From FY 2002-2003 through FY 2008-2009 we almost continually
showed a negative cash flow, i.e., expenditures exceeded revenues. A reversal of this trend started in FY 2005-2006 with a continued
effort to reduce expenditures through staffing reductions, furloughs, reductions and/or deferrals of non-personnel operating expenses,
complete deferral of equipment replacements, and complete elimination of Studies and Capital Projects funded by Unrestricted
General Fund monies. Although it hasn’t come without heartache, these efforts are continuing to pay off. It is estimated that recurring
revenues have exceeded recurring expenditures since FY 2009-2010, and that the trend is projected to continue for FY 2012-2013.
Although it will not be confirmed until sometime in September, it is expected that the difference between the two will be as follows:
$104,000 for FY 2009-2010, $679,000 for FY 2010-2011, $297,000 for FY 2011-2012, and $400,000 for FY 2012-2013.
M 2
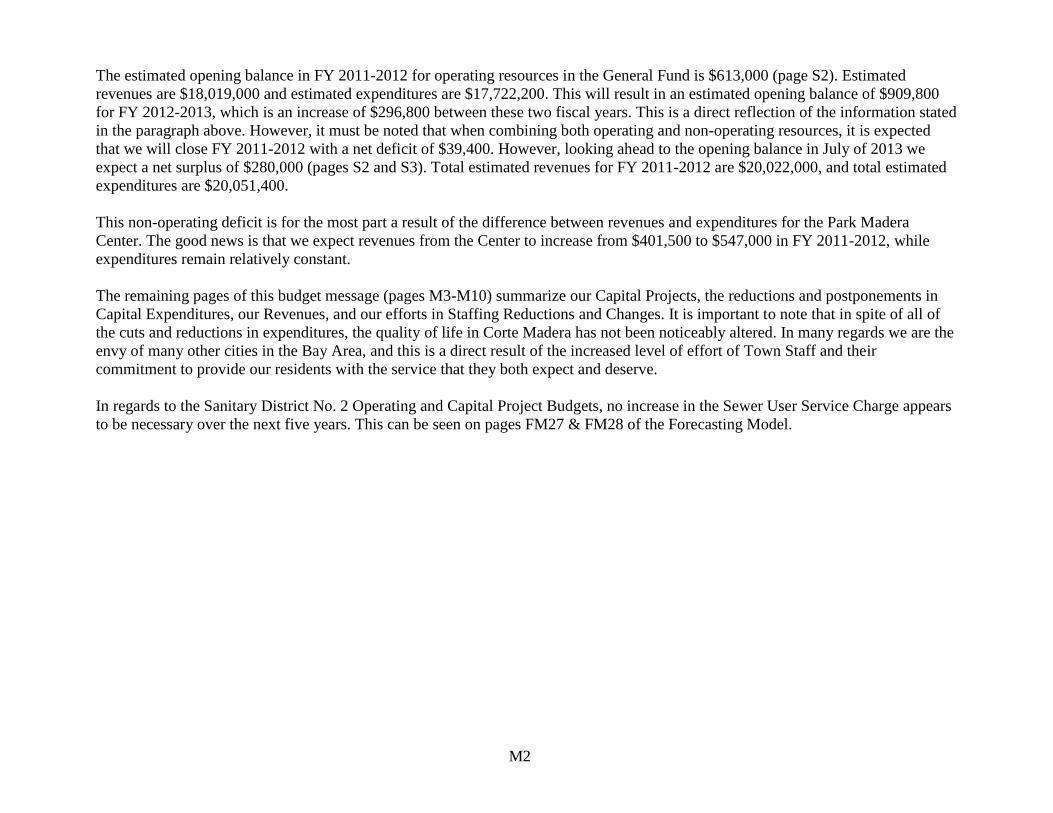
The estimated opening balance in FY 2011-2012 for operating resources in the General Fund is $613,000 (page S2). Estimated
revenues are $18,019,000 and estimated expenditures are $17,722,200. This will result in an estimated opening balance of $909,800
for FY 2012-2013, which is an increase of $296,800 between these two fiscal years. This is a direct reflection of the information stated
in the paragraph above. However, it must be noted that when combining both operating and non-operating resources, it is expected
that we will close FY 2011-2012 with a net deficit of $39,400. However, looking ahead to the opening balance in July of 2013 we
expect a net surplus of $280,000 (pages S2 and S3). Total estimated revenues for FY 2011-2012 are $20,022,000, and total estimated
expenditures are $20,051,400.
This non-operating deficit is for the most part a result of the difference between revenues and expenditures for the Park Madera
Center. The good news is that we expect revenues from the Center to increase from $401,500 to $547,000 in FY 2011-2012, while
expenditures remain relatively constant.
The remaining pages of this budget message (pages M3-M10) summarize our Capital Projects, the reductions and postponements in
Capital Expenditures, our Revenues, and our efforts in Staffing Reductions and Changes. It is important to note that in spite of all of
the cuts and reductions in expenditures, the quality of life in Corte Madera has not been noticeably altered. In many regards we are the
envy of many other cities in the Bay Area, and this is a direct result of the increased level of effort of Town Staff and their
commitment to provide our residents with the service that they both expect and deserve.
In regards to the Sanitary District No. 2 Operating and Capital Project Budgets, no increase in the Sewer User Service Charge appears
to be necessary over the next five years. This can be seen on pages FM27 & FM28 of the Forecasting Model.
M 3
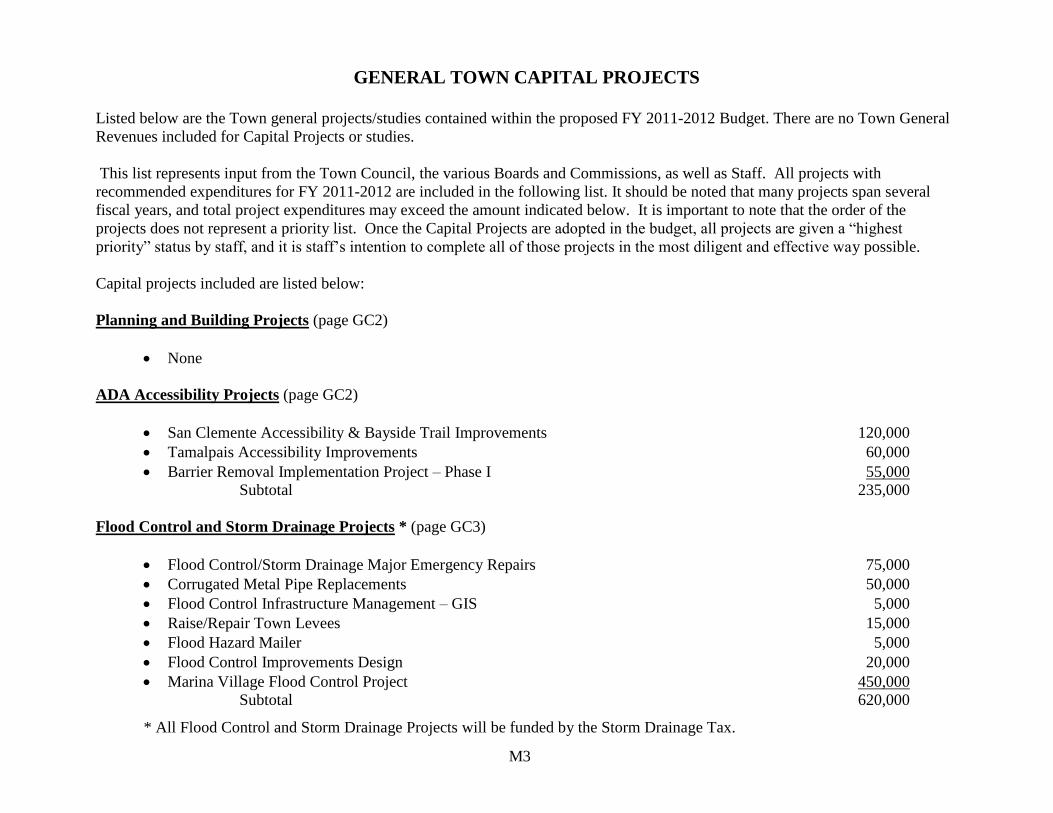
GENERAL TOWN CAPITAL PROJECTS
Listed below are the Town general projects/studies contained within the proposed FY 2011-2012 Budget. There are no Town General
Revenues included for Capital Projects or studies.
This list represents input from the Town Council, the various Boards and Commissions, as well as Staff. All projects with
recommended expenditures for FY 2011-2012 are included in the following list. It should be noted that many projects span several
fiscal years, and total project expenditures may exceed the amount indicated below. It is important to note that the order of the
projects does not represent a priority list. Once the Capital Projects are adopted in the budget, all projects are given a “highest
priority” status by staff, and it is staff’s intention to complete all of those projects in the most diligent and effective way possible.
Capital projects included are listed below:
Planning and Building Projects (page GC2)
None
ADA Accessibility Projects (page GC2)
San Clemente Accessibility & Bayside Trail Improvements 120,000
Tamalpais Accessibility Improvements 60,000
Barrier Removal Implementation Project – Phase I 55,000
Subtotal 235,000
Flood Control and Storm Drainage Projects * (page GC3)
Flood Control/Storm Drainage Major Emergency Repairs 75,000
Corrugated Metal Pipe Replacements 50,000
Flood Control Infrastructure Management – GIS 5,000
Raise/Repair Town Levees 15,000
Flood Hazard Mailer 5,000
Flood Control Improvements Design 20,000
Marina Village Flood Control Project 450,000
Subtotal 620,000
* All Flood Control and Storm Drainage Projects will be funded by the Storm Drainage Tax.
M 4
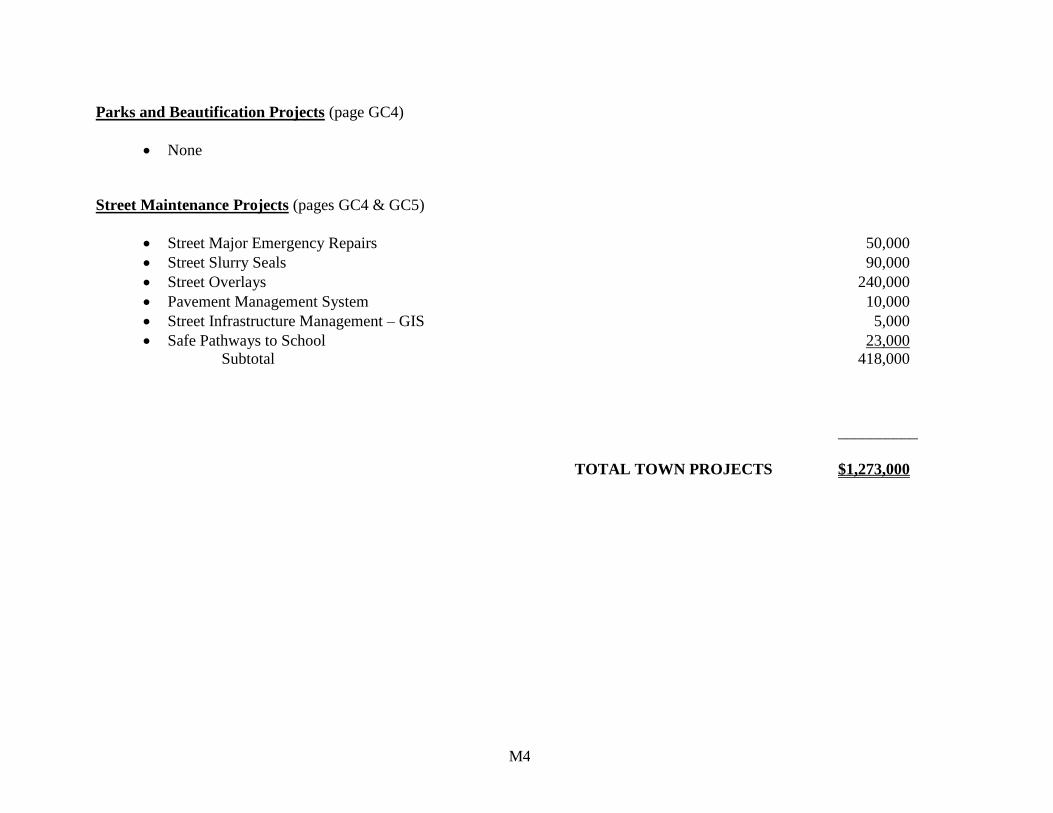
Parks and Beautification Projects (page GC4)
None
Street Maintenance Projects (pages GC4 & GC5)
Street Major Emergency Repairs 50,000
Street Slurry Seals 90,000
Street Overlays 240,000
Pavement Management System 10,000
Street Infrastructure Management – GIS 5,000
Safe Pathways to School 23,000
Subtotal 418,000
__________
TOTAL TOWN PROJECTS $1,273,000
M 5
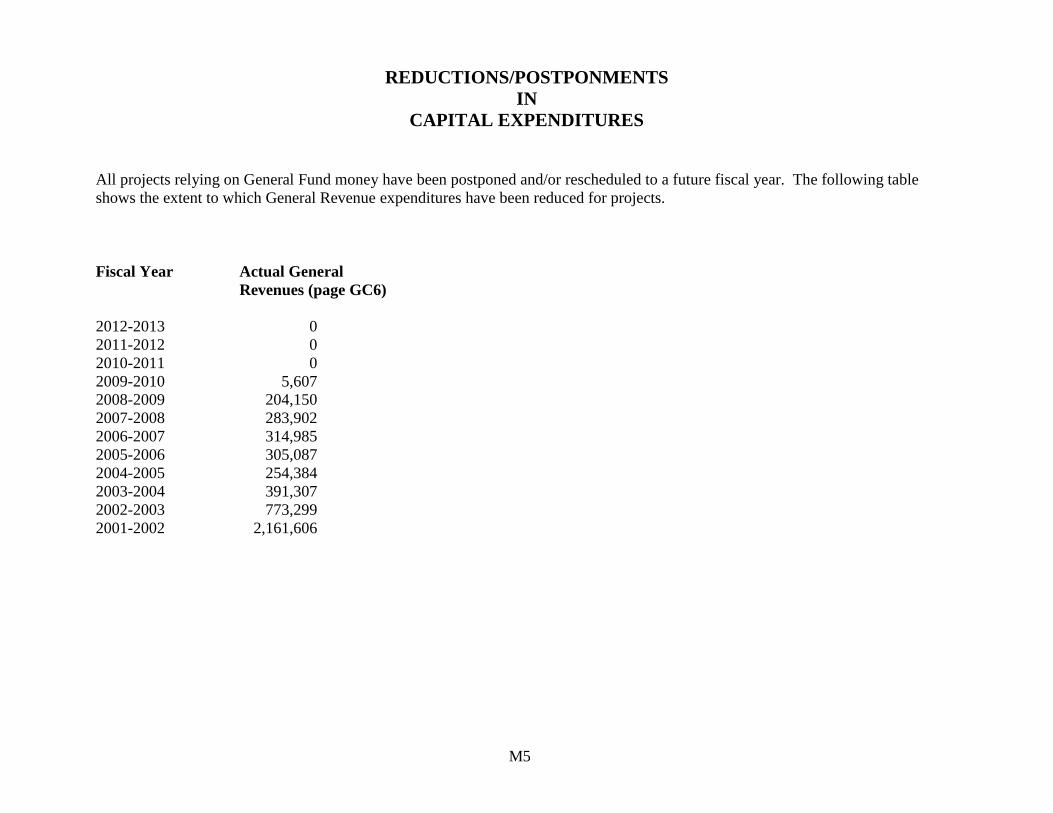
REDUCTIONS/POSTPONMENTS
IN
CAPITAL EXPENDITURES
All projects relying on General Fund money have been postponed and/or rescheduled to a future fiscal year. The following table
shows the extent to which General Revenue expenditures have been reduced for projects.
Fiscal Year Actual General
Revenues (page GC6)
2012-2013 0
2011-2012 0
2010-2011 0
2009-2010 5,607
2008-2009 204,150
2007-2008 283,902
2006-2007 314,985
2005-2006 305,087
2004-2005 254,384
2003-2004 391,307
2002-2003 773,299
2001-2002 2,161,606
M 6
REVENUES
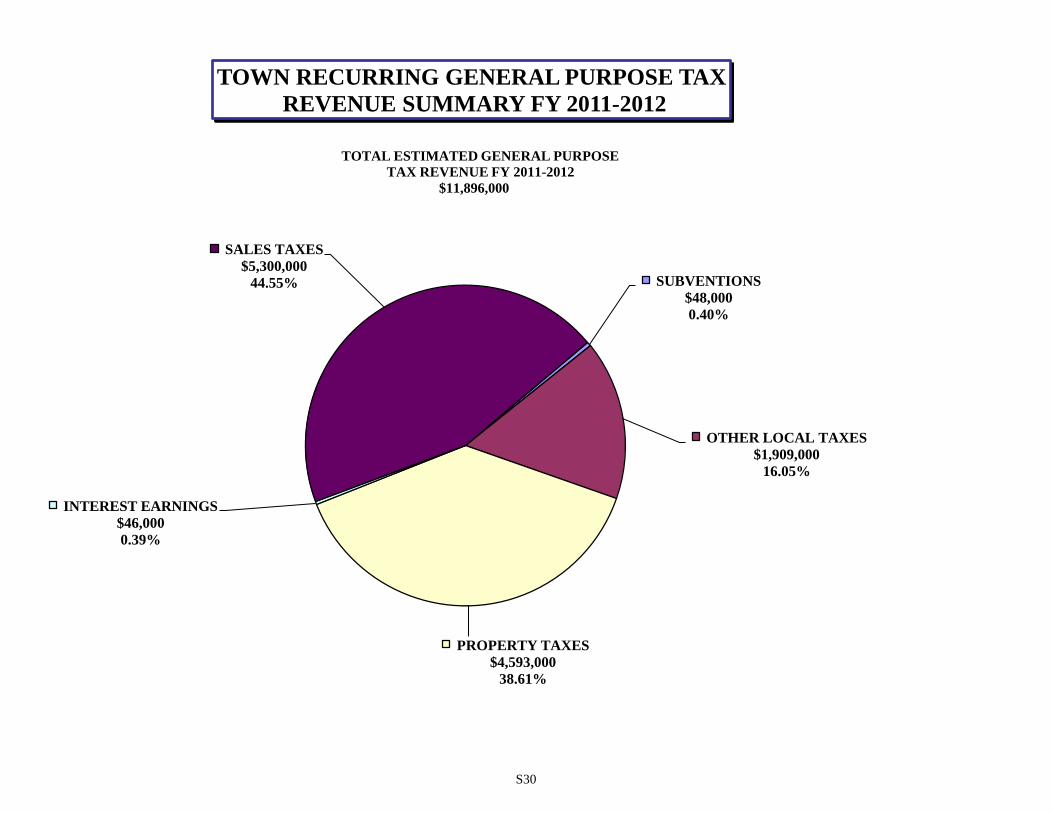
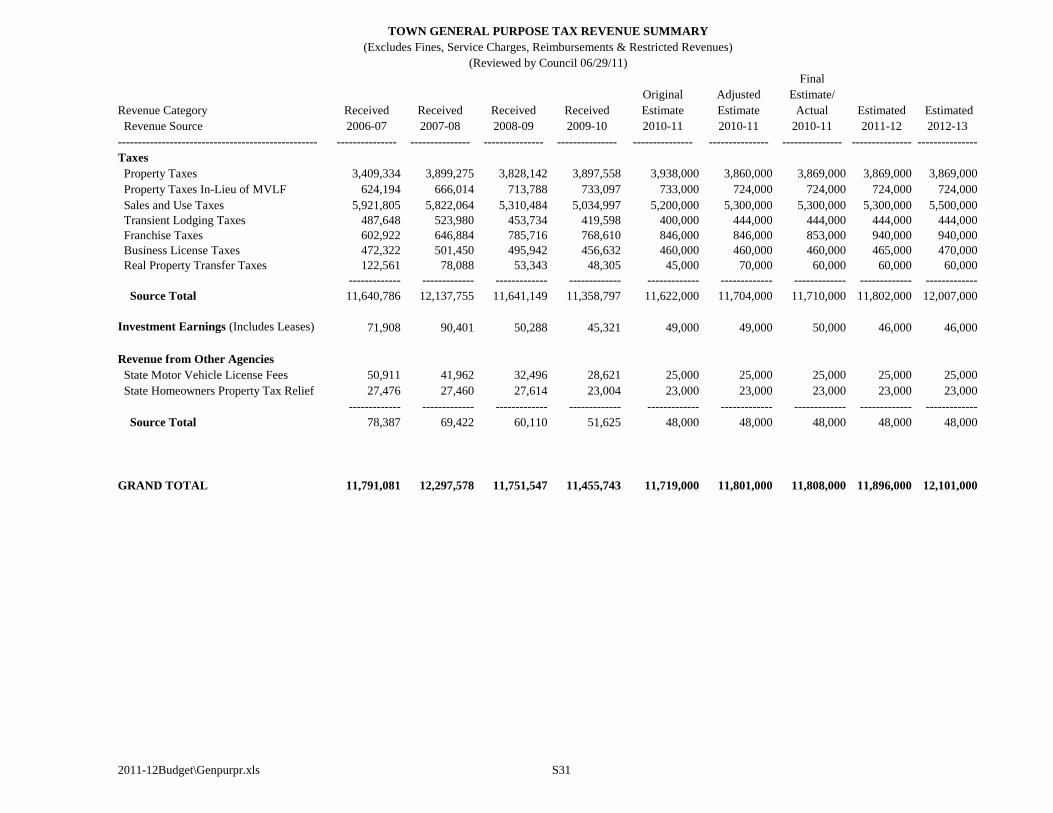
Town revenues in total are presented on pages S7 through S9 and General Purpose Unrestricted Tax Revenues are presented on pages
S30 and S31. Sales Tax is our major revenue source representing approximately 45% of our Unrestricted Tax Revenues and 32% of
our total recurring revenues. A ten-year analysis of this source is included on pages S38 through S42. Due to the economy, sales taxes
have experienced a substantial drop from a peak of $5,922,000 in FY2006-2007 to an estimate of $5,300,000 in FY 2010-2011. Marin
Honda, our number two sales tax producer, relocated to San Rafael at the end of May, 2011. The 1960 vintage showroom and office
complex is being demolished and replaced with a new building. A Mini Auto Dealership is expected to be in operation just prior to
Thanksgiving. Due to this change, the Sales Tax estimate for FY 2011-12 has been left flat at $5,300,000. Had Marin Honda not
relocated, the estimate would have been $5,500,000, which is the Sales Tax estimate for FY 2012-2013.
Property Taxes are the next major source of revenue representing approximately 39% of our Unrestricted Tax Revenues and 28% of
our total recurring revenues. Current Secured Property Taxes are expected to remain at the FY 2010-2011 level of $3,188,000 over the
next two years. This is a substantial change from the past. See pages S44 & S45. There are five categories of property tax revenue.
Current secured is 82% of the total.
The voter approved Storm Drainage Tax (Ordinance No. 821, enacted November 4, 1997) became effective July 1, 1998 for a 25-year
period (FY 1998-1999 through FY 2022-2023). The Storm Drainage Tax now generates $640,000 per year and is restricted to specific
purposes. The Storm Drainage Tax replaced the Storm Drainage Special Benefit Assessment, which generated $350,000 per year.
Transient Lodging Taxes have dropped from a recent peak in FY 2007-2008 of $524,000 to an estimate of $444,000 in FY 2010-2011
and are expected to remain flat over the next two years. See page S49.
On November 2, 2010, a four-year renewal of the Paramedic Tax from July 1, 2011 through June 30, 2015 failed passage by 76
affirmative votes. The measure is being placed before the voters again on November 8, 2011 for the same four years. The budget
assumes this second measure will pass. If it fails again, $397,000 is lost in the FY 2011-2012 budget and the Town will face a serious
problem.
The downturn in the economy has caused declines in Business License Taxes (see pages S52-S60), Real Property Transfer Taxes,
State Motor Vehicle License Fees, and Building/Planning and Engineering Fees. Increases are expected in Franchise Taxes. Page S61
illustrates the dramatic drop in building permit activity in FY 2009-2010. Building permit activity has resumed a more normal level in
mid FY 2010-2011 and is anticipated to return to historic levels over the next two fiscal years..
M 7
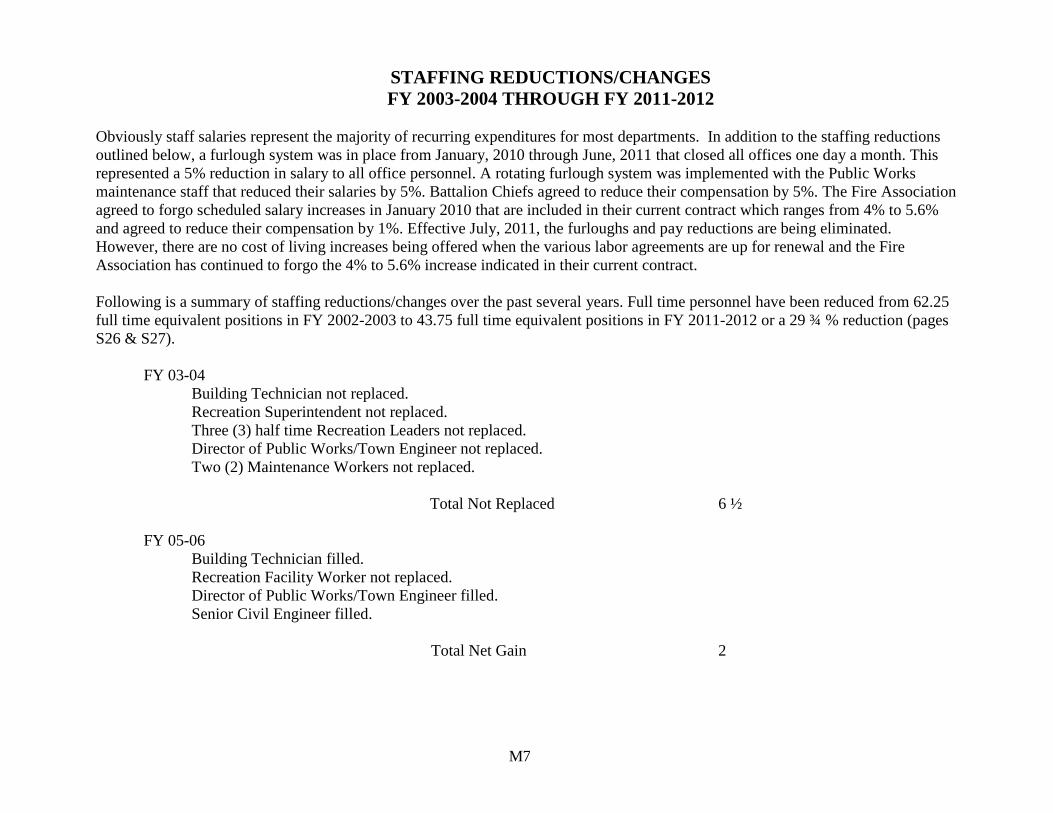
STAFFING REDUCTIONS/CHANGES
FY 2003-2004 THROUGH FY 2011-2012
Obviously staff salaries represent the majority of recurring expenditures for most departments. In addition to the staffing reductions
outlined below, a furlough system was in place from January, 2010 through June, 2011 that closed all offices one day a month. This
represented a 5% reduction in salary to all office personnel. A rotating furlough system was implemented with the Public Works
maintenance staff that reduced their salaries by 5%. Battalion Chiefs agreed to reduce their compensation by 5%. The Fire Association
agreed to forgo scheduled salary increases in January 2010 that are included in their current contract which ranges from 4% to 5.6%
and agreed to reduce their compensation by 1%. Effective July, 2011, the furloughs and pay reductions are being eliminated.
However, there are no cost of living increases being offered when the various labor agreements are up for renewal and the Fire
Association has continued to forgo the 4% to 5.6% increase indicated in their current contract.
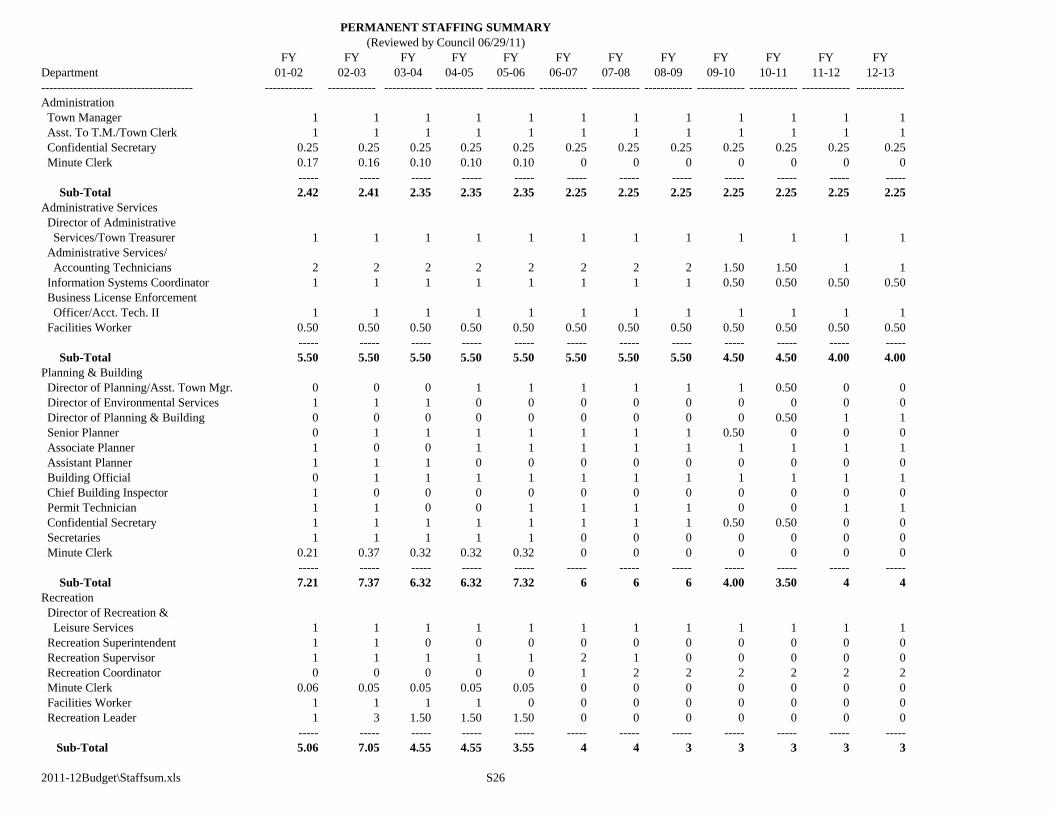
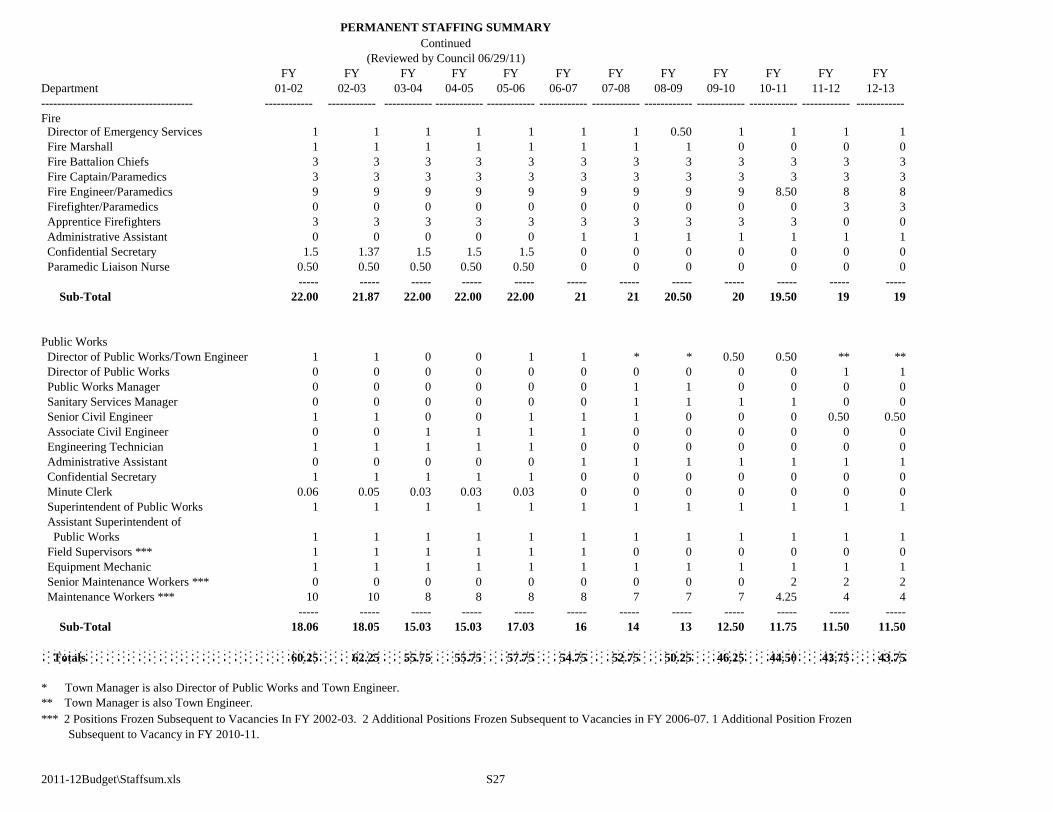
Following is a summary of staffing reductions/changes over the past several years. Full time personnel have been reduced from 62.25
full time equivalent positions in FY 2002-2003 to 43.75 full time equivalent positions in FY 2011-2012 or a 29 ¾ % reduction (pages
S26 & S27).
FY 03-04
Building Technician not replaced.
Recreation Superintendent not replaced.
Three (3) half time Recreation Leaders not replaced.
Director of Public Works/Town Engineer not replaced.
Two (2) Maintenance Workers not replaced.
Total Not Replaced 6 ½
FY 05-06
Building Technician filled.
Recreation Facility Worker not replaced.
Director of Public Works/Town Engineer filled.
Senior Civil Engineer filled.
Total Net Gain 2
M 8
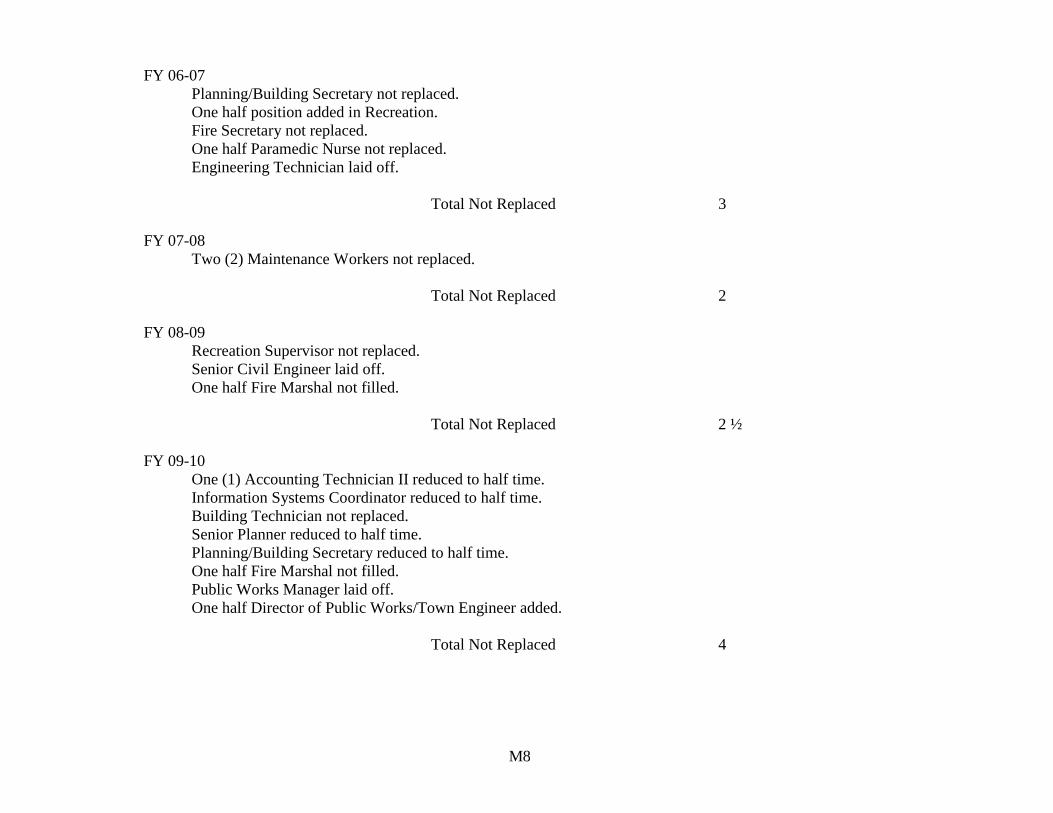
FY 06-07
Planning/Building Secretary not replaced.
One half position added in Recreation.
Fire Secretary not replaced.
One half Paramedic Nurse not replaced.
Engineering Technician laid off.
Total Not Replaced 3
FY 07-08
Two (2) Maintenance Workers not replaced.
Total Not Replaced 2
FY 08-09
Recreation Supervisor not replaced.
Senior Civil Engineer laid off.
One half Fire Marshal not filled.
Total Not Replaced 2 ½
FY 09-10
One (1) Accounting Technician II reduced to half time.
Information Systems Coordinator reduced to half time.
Building Technician not replaced.
Senior Planner reduced to half time.
Planning/Building Secretary reduced to half time.
One half Fire Marshal not filled.
Public Works Manager laid off.
One half Director of Public Works/Town Engineer added.
Total Not Replaced 4
M 9
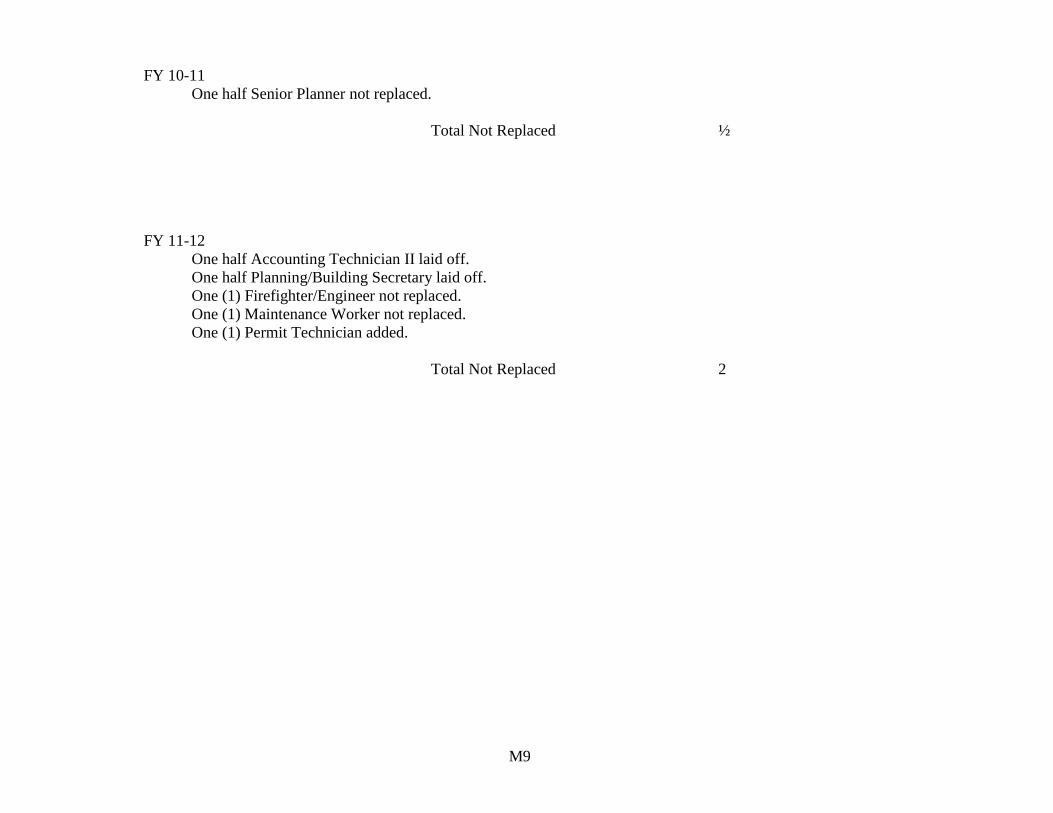
FY 10-11
One half Senior Planner not replaced.
Total Not Replaced ½
FY 11-12
One half Accounting Technician II laid off.
One half Planning/Building Secretary laid off.
One (1) Firefighter/Engineer not replaced.
One (1) Maintenance Worker not replaced.
One (1) Permit Technician added.
Total Not Replaced 2
M 10
ACKNOWLEDGMENTS
Special thanks to the Department Heads and their staffs for assistance in development of the FY 2011 - 2012 Budget. In preparing the
draft budget, all departments were requested to make an attempt to reduce their requested operating budget as much as possible. The
proposed budget demonstrates their understanding and concern that cuts in operations must be balanced with the impacts those cuts
may have on quality of service, on the requirements of government mandates, and on the potential for increased liability, etc. We are
greatly appreciative of this level of professionalism in the entire Town staff. In addition, we are particularly appreciative of the efforts
of Jasmine Dali, Jonna Intoschi, Lina Azevedo, and Donna Robertson, for their assistance in completing the Town and Sanitary
District No. 2 Budget for FY 2011 - 2012.
RECOMMENDATION
It is recommended that the Town Council review the proposed Town of Corte Madera and Sanitary District No. 2 Operating and
Capital Budgets for FY 2011 - 2012, consider public input and provide direction to Town Staff.
David James Bracken George T. Warman, Jr.
Town Manager Director of Administrative Services/
Town Treasurer

M 11
BLANK PAGE
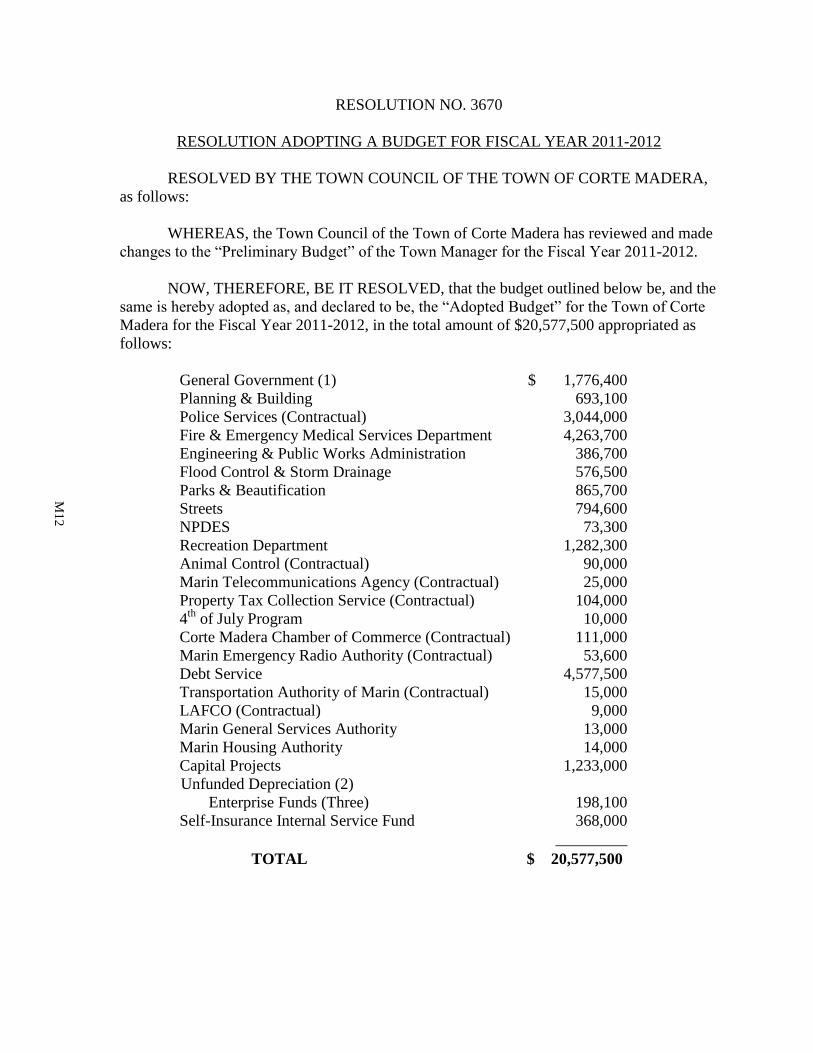
RESOLUTION NO. 3670
RESOLUTION ADOPTING A BUDGET FOR FISCAL YEAR 2011-2012
RESOLVED BY THE TOWN COUNCIL OF THE TOWN OF CORTE MADERA,
as follows:
WHEREAS, the Town Council of the Town of Corte Madera has reviewed and made
changes to the “Preliminary Budget” of the Town Manager for the Fiscal Year 2011-2012.
NOW, THEREFORE, BE IT RESOLVED, that the budget outlined below be, and the
same is hereby adopted as, and declared to be, the “Adopted Budget” for the Town of Corte
Madera for the Fiscal Year 2011-2012, in the total amount of $20,577,500 appropriated as
follows:
General Government (1) $ 1,776,400
Planning & Building 693,100
Police Services (Contractual) 3,044,000
Fire & Emergency Medical Services Department 4,263,700
Engineering & Public Works Administration 386,700
Flood Control & Storm Drainage 576,500
Parks & Beautification 865,700
Streets 794,600
NPDES 73,300
Recreation Department 1,282,300
Animal Control (Contractual) 90,000
Marin Telecommunications Agency (Contractual) 25,000
Property Tax Collection Service (Contractual) 104,000
4th
of July Program 10,000
Corte Madera Chamber of Commerce (Contractual) 111,000
Marin Emergency Radio Authority (Contractual) 53,600
Debt Service 4,577,500
Transportation Authority of Marin (Contractual) 15,000
LAFCO (Contractual) 9,000
Marin General Services Authority 13,000
Marin Housing Authority 14,000
Capital Projects 1,233,000
Unfunded Depreciation (2)
Enterprise Funds (Three) 198,100
Self-Insurance Internal Service Fund 368,000
_________
TOTAL $ 20,577,500
M1
2
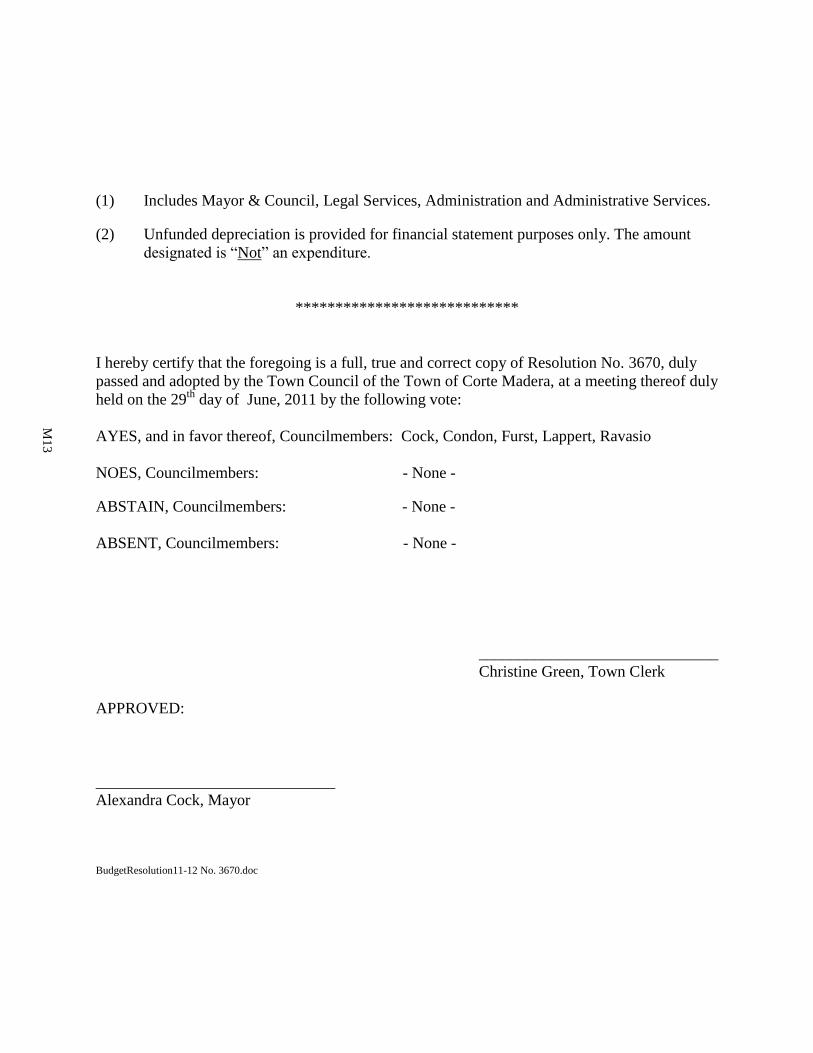
(1) Includes Mayor & Council, Legal Services, Administration and Administrative Services.
(2) Unfunded depreciation is provided for financial statement purposes only. The amount
designated is “Not” an expenditure.
****************************
I hereby certify that the foregoing is a full, true and correct copy of Resolution No. 3670, duly
passed and adopted by the Town Council of the Town of Corte Madera, at a meeting thereof duly
held on the 29th
day of June, 2011 by the following vote:
AYES, and in favor thereof, Councilmembers: Cock, Condon, Furst, Lappert, Ravasio
NOES, Councilmembers: - None -
ABSTAIN, Councilmembers: - None -
ABSENT, Councilmembers: - None -
______________________________
Christine Green, Town Clerk
APPROVED:
______________________________
Alexandra Cock, Mayor
BudgetResolution11-12 No. 3670.doc
M1
3
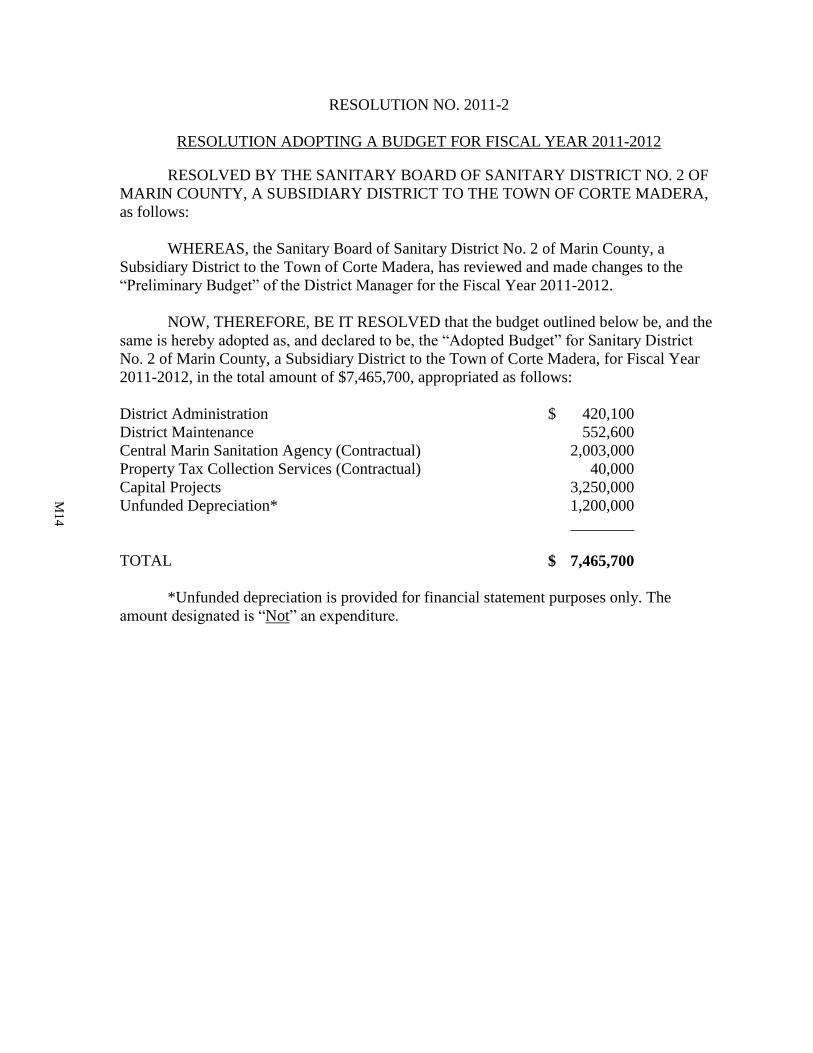
RESOLUTION NO. 2011-2
RESOLUTION ADOPTING A BUDGET FOR FISCAL YEAR 2011-2012
RESOLVED BY THE SANITARY BOARD OF SANITARY DISTRICT NO. 2 OF
MARIN COUNTY, A SUBSIDIARY DISTRICT TO THE TOWN OF CORTE MADERA,
as follows:
WHEREAS, the Sanitary Board of Sanitary District No. 2 of Marin County, a
Subsidiary District to the Town of Corte Madera, has reviewed and made changes to the
“Preliminary Budget” of the District Manager for the Fiscal Year 2011-2012.
NOW, THEREFORE, BE IT RESOLVED that the budget outlined below be, and the
same is hereby adopted as, and declared to be, the “Adopted Budget” for Sanitary District
No. 2 of Marin County, a Subsidiary District to the Town of Corte Madera, for Fiscal Year
2011-2012, in the total amount of $7,465,700, appropriated as follows:
District Administration $ 420,100
District Maintenance 552,600
Central Marin Sanitation Agency (Contractual) 2,003,000
Property Tax Collection Services (Contractual) 40,000
Capital Projects 3,250,000
Unfunded Depreciation* 1,200,000
________
TOTAL $ 7,465,700
*Unfunded depreciation is provided for financial statement purposes only. The
amount designated is “Not” an expenditure.
M1
4
************************
I hereby certify that the foregoing is a full, true and correct copy of Resolution No. 2011-2
duly passed and adopted by the Sanitary Board of Sanitary District No. 2 of Marin County, a
Subsidiary District to the Town of Corte Madera, at a meeting thereof duly held on the 29th
day of June, 2011 by the following vote:
AYES, and in favor thereof, Board Members: Cock, Condon, Furst, Lappert, Ravasio
NOES, Board Members: - None -
ABSTAIN, Board Members: - None -
ABSENT, Board Members: - None -
_________________________________
Christine Green, District Clerk
Sanitary District No. 2 of Marin County,
A Subsidiary District to the
Town of Corte Madera
APPROVED:
____________________________
Alexandra Cock, President
SanitaryDistrictResolution11-12 No. 2011-2.doc
M1
5
BudgetKey.doc M16
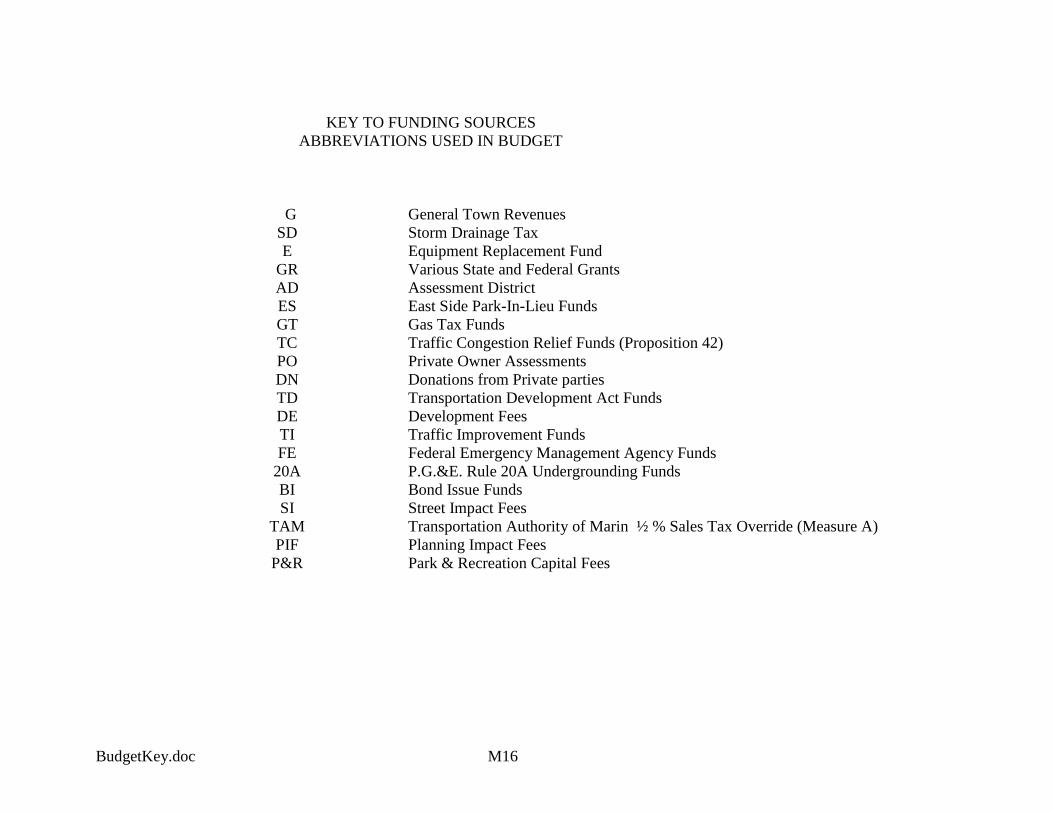
KEY TO FUNDING SOURCES
ABBREVIATIONS USED IN BUDGET
G General Town Revenues
SD Storm Drainage Tax
E Equipment Replacement Fund
GR Various State and Federal Grants
AD Assessment District
ES East Side Park-In-Lieu Funds
GT Gas Tax Funds
TC Traffic Congestion Relief Funds (Proposition 42)
PO Private Owner Assessments
DN Donations from Private parties
TD Transportation Development Act Funds
DE Development Fees
TI Traffic Improvement Funds
FE Federal Emergency Management Agency Funds
20A P.G.&E. Rule 20A Undergrounding Funds
BI Bond Issue Funds
SI Street Impact Fees
TAM
PIF
P&R
Transportation Authority of Marin ½ % Sales Tax Override (Measure A)
Planning Impact Fees
Park & Recreation Capital Fees
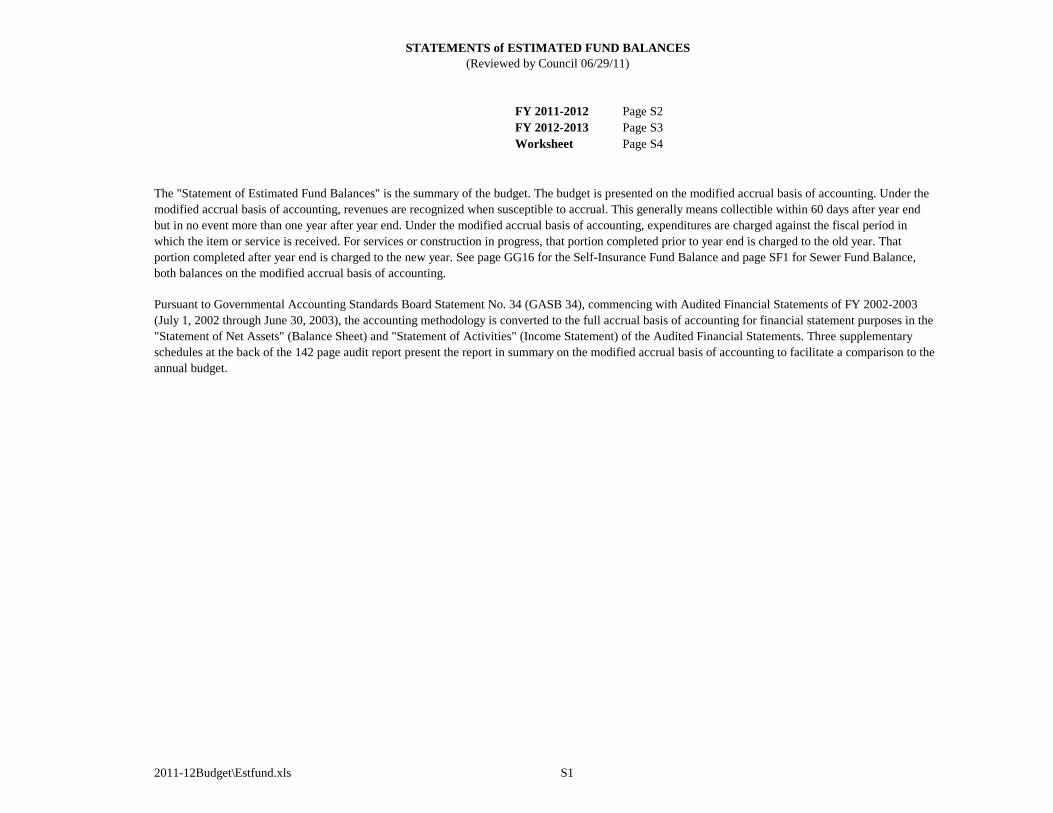
FY 2011-2012 Page S2
FY 2012-2013 Page S3
Worksheet Page S4
2011-12Budget\Estfund.xls S1
(Reviewed by Council 06/29/11)
STATEMENTS of ESTIMATED FUND BALANCES
The "Statement of Estimated Fund Balances" is the summary of the budget. The budget is presented on the modified accrual basis of accounting. Under the
modified accrual basis of accounting, revenues are recognized when susceptible to accrual. This generally means collectible within 60 days after year end
but in no event more than one year after year end. Under the modified accrual basis of accounting, expenditures are charged against the fiscal period in
which the item or service is received. For services or construction in progress, that portion completed prior to year end is charged to the old year. That
portion completed after year end is charged to the new year. See page GG16 for the Self-Insurance Fund Balance and page SF1 for Sewer Fund Balance,
both balances on the modified accrual basis of accounting.
Pursuant to Governmental Accounting Standards Board Statement No. 34 (GASB 34), commencing with Audited Financial Statements of FY 2002-2003
(July 1, 2002 through June 30, 2003), the accounting methodology is converted to the full accrual basis of accounting for financial statement purposes in the
"Statement of Net Assets" (Balance Sheet) and "Statement of Activities" (Income Statement) of the Audited Financial Statements. Three supplementary
schedules at the back of the 142 page audit report present the report in summary on the modified accrual basis of accounting to facilitate a comparison to the
annual budget.
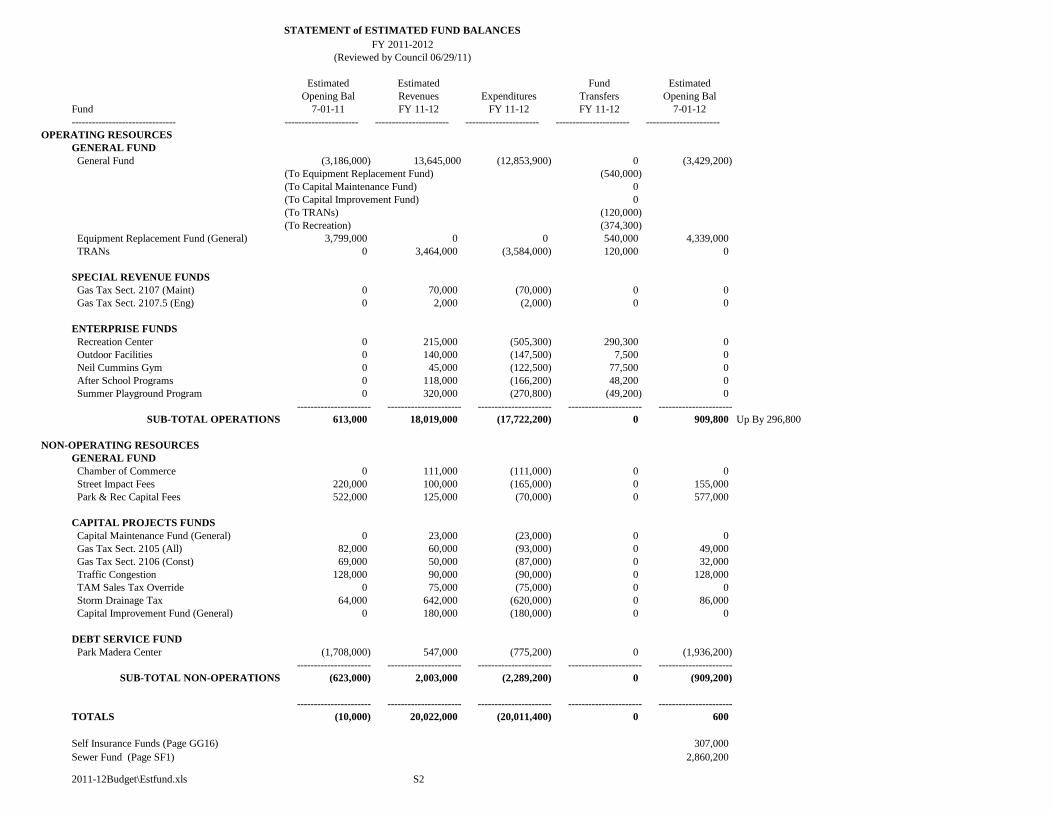
Estimated Estimated Fund Estimated
Opening Bal Revenues Expenditures Transfers Opening Bal
Fund 7-01-11 FY 11-12 FY 11-12 FY 11-12 7-01-12
------------------------------- ---------------------- ---------------------- ---------------------- ---------------------- ----------------------
OPERATING RESOURCES
GENERAL FUND
General Fund (3,186,000) 13,645,000 (12,853,900) 0 (3,429,200)
(To Equipment Replacement Fund) (540,000)
(To Capital Maintenance Fund) 0
(To Capital Improvement Fund) 0
(To TRANs) (120,000)
(To Recreation) (374,300)
Equipment Replacement Fund (General) 3,799,000 0 0 540,000 4,339,000
TRANs 0 3,464,000 (3,584,000) 120,000 0
SPECIAL REVENUE FUNDS
Gas Tax Sect. 2107 (Maint) 0 70,000 (70,000) 0 0
Gas Tax Sect. 2107.5 (Eng) 0 2,000 (2,000) 0 0
ENTERPRISE FUNDS
Recreation Center 0 215,000 (505,300) 290,300 0
Outdoor Facilities 0 140,000 (147,500) 7,500 0
Neil Cummins Gym 0 45,000 (122,500) 77,500 0
After School Programs 0 118,000 (166,200) 48,200 0
Summer Playground Program 0 320,000 (270,800) (49,200) 0
---------------------- ---------------------- ---------------------- ---------------------- ----------------------
SUB-TOTAL OPERATIONS 613,000 18,019,000 (17,722,200) 0 909,800 Up By 296,800
NON-OPERATING RESOURCES
GENERAL FUND
Chamber of Commerce 0 111,000 (111,000) 0 0
Street Impact Fees 220,000 100,000 (165,000) 0 155,000
Park & Rec Capital Fees 522,000 125,000 (70,000) 0 577,000
CAPITAL PROJECTS FUNDS
Capital Maintenance Fund (General) 0 23,000 (23,000) 0 0
Gas Tax Sect. 2105 (All) 82,000 60,000 (93,000) 0 49,000
Gas Tax Sect. 2106 (Const) 69,000 50,000 (87,000) 0 32,000
Traffic Congestion 128,000 90,000 (90,000) 0 128,000
TAM Sales Tax Override 0 75,000 (75,000) 0 0
Storm Drainage Tax 64,000 642,000 (620,000) 0 86,000
Capital Improvement Fund (General) 0 180,000 (180,000) 0 0
DEBT SERVICE FUND
Park Madera Center (1,708,000) 547,000 (775,200) 0 (1,936,200)
---------------------- ---------------------- ---------------------- ---------------------- ----------------------
SUB-TOTAL NON-OPERATIONS (623,000) 2,003,000 (2,289,200) 0 (909,200)
---------------------- ---------------------- ---------------------- ---------------------- ----------------------
TOTALS (10,000) 20,022,000 (20,011,400) 0 600
Self Insurance Funds (Page GG16) 307,000
Sewer Fund (Page SF1) 2,860,200
2011-12Budget\Estfund.xls S2
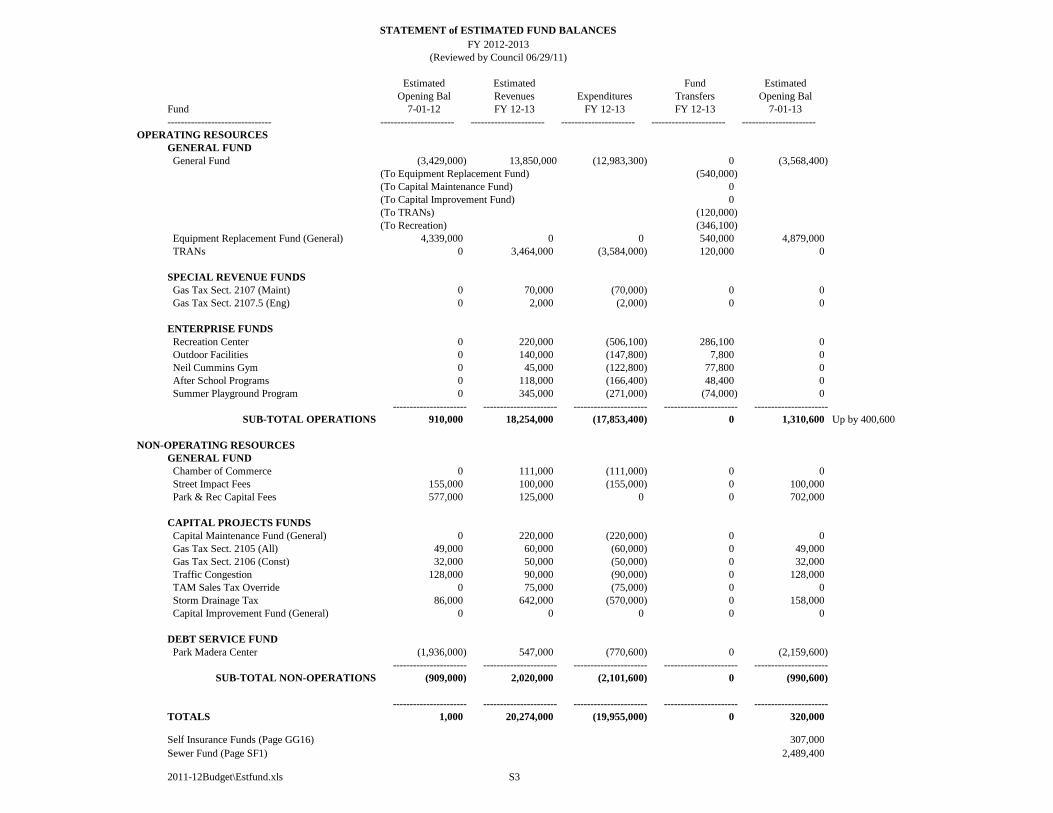
STATEMENT of ESTIMATED FUND BALANCES
FY 2011-2012
(Reviewed by Council 06/29/11)
Estimated Estimated Fund Estimated
Opening Bal Revenues Expenditures Transfers Opening Bal
Fund 7-01-12 FY 12-13 FY 12-13 FY 12-13 7-01-13
------------------------------- ---------------------- ---------------------- ---------------------- ---------------------- ----------------------
OPERATING RESOURCES
GENERAL FUND
General Fund (3,429,000) 13,850,000 (12,983,300) 0 (3,568,400)
(To Equipment Replacement Fund) (540,000)
(To Capital Maintenance Fund) 0
(To Capital Improvement Fund) 0
(To TRANs) (120,000)
(To Recreation) (346,100)
Equipment Replacement Fund (General) 4,339,000 0 0 540,000 4,879,000
TRANs 0 3,464,000 (3,584,000) 120,000 0
SPECIAL REVENUE FUNDS
Gas Tax Sect. 2107 (Maint) 0 70,000 (70,000) 0 0
Gas Tax Sect. 2107.5 (Eng) 0 2,000 (2,000) 0 0
ENTERPRISE FUNDS
Recreation Center 0 220,000 (506,100) 286,100 0
Outdoor Facilities 0 140,000 (147,800) 7,800 0
Neil Cummins Gym 0 45,000 (122,800) 77,800 0
After School Programs 0 118,000 (166,400) 48,400 0
Summer Playground Program 0 345,000 (271,000) (74,000) 0
---------------------- ---------------------- ---------------------- ---------------------- ----------------------
SUB-TOTAL OPERATIONS 910,000 18,254,000 (17,853,400) 0 1,310,600 Up by 400,600
NON-OPERATING RESOURCES
GENERAL FUND
Chamber of Commerce 0 111,000 (111,000) 0 0
Street Impact Fees 155,000 100,000 (155,000) 0 100,000
Park & Rec Capital Fees 577,000 125,000 0 0 702,000
CAPITAL PROJECTS FUNDS
Capital Maintenance Fund (General) 0 220,000 (220,000) 0 0
Gas Tax Sect. 2105 (All) 49,000 60,000 (60,000) 0 49,000
Gas Tax Sect. 2106 (Const) 32,000 50,000 (50,000) 0 32,000
Traffic Congestion 128,000 90,000 (90,000) 0 128,000
TAM Sales Tax Override 0 75,000 (75,000) 0 0
Storm Drainage Tax 86,000 642,000 (570,000) 0 158,000
Capital Improvement Fund (General) 0 0 0 0 0
DEBT SERVICE FUND
Park Madera Center (1,936,000) 547,000 (770,600) 0 (2,159,600)
---------------------- ---------------------- ---------------------- ---------------------- ----------------------
SUB-TOTAL NON-OPERATIONS (909,000) 2,020,000 (2,101,600) 0 (990,600)
---------------------- ---------------------- ---------------------- ---------------------- ----------------------
TOTALS 1,000 20,274,000 (19,955,000) 0 320,000
Self Insurance Funds (Page GG16) 307,000
Sewer Fund (Page SF1) 2,489,400
2011-12Budget\Estfund.xls S3
FY 2012-2013
(Reviewed by Council 06/29/11)
STATEMENT of ESTIMATED FUND BALANCES
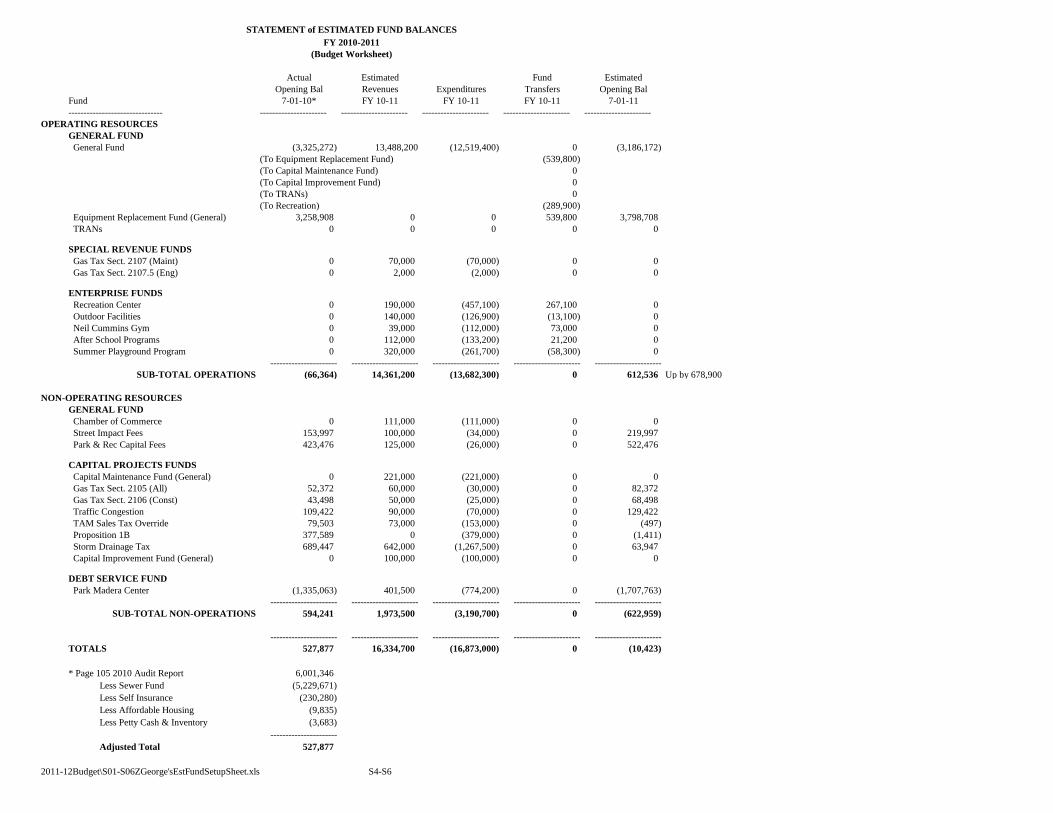
Actual Estimated Fund Estimated
Opening Bal Revenues Expenditures Transfers Opening Bal
Fund 7-01-10* FY 10-11 FY 10-11 FY 10-11 7-01-11
------------------------------- ---------------------- ---------------------- ---------------------- ---------------------- ----------------------
OPERATING RESOURCES
GENERAL FUND
General Fund (3,325,272) 13,488,200 (12,519,400) 0 (3,186,172)
(To Equipment Replacement Fund) (539,800)
(To Capital Maintenance Fund) 0
(To Capital Improvement Fund) 0
(To TRANs) 0
(To Recreation) (289,900)
Equipment Replacement Fund (General) 3,258,908 0 0 539,800 3,798,708
TRANs 0 0 0 0 0
SPECIAL REVENUE FUNDS
Gas Tax Sect. 2107 (Maint) 0 70,000 (70,000) 0 0
Gas Tax Sect. 2107.5 (Eng) 0 2,000 (2,000) 0 0
ENTERPRISE FUNDS
Recreation Center 0 190,000 (457,100) 267,100 0
Outdoor Facilities 0 140,000 (126,900) (13,100) 0
Neil Cummins Gym 0 39,000 (112,000) 73,000 0
After School Programs 0 112,000 (133,200) 21,200 0
Summer Playground Program 0 320,000 (261,700) (58,300) 0
---------------------- ---------------------- ---------------------- ---------------------- ----------------------
SUB-TOTAL OPERATIONS (66,364) 14,361,200 (13,682,300) 0 612,536 Up by 678,900
NON-OPERATING RESOURCES
GENERAL FUND
Chamber of Commerce 0 111,000 (111,000) 0 0
Street Impact Fees 153,997 100,000 (34,000) 0 219,997
Park & Rec Capital Fees 423,476 125,000 (26,000) 0 522,476
CAPITAL PROJECTS FUNDS
Capital Maintenance Fund (General) 0 221,000 (221,000) 0 0
Gas Tax Sect. 2105 (All) 52,372 60,000 (30,000) 0 82,372
Gas Tax Sect. 2106 (Const) 43,498 50,000 (25,000) 0 68,498
Traffic Congestion 109,422 90,000 (70,000) 0 129,422
TAM Sales Tax Override 79,503 73,000 (153,000) 0 (497)
Proposition 1B 377,589 0 (379,000) 0 (1,411)
Storm Drainage Tax 689,447 642,000 (1,267,500) 0 63,947
Capital Improvement Fund (General) 0 100,000 (100,000) 0 0
DEBT SERVICE FUND
Park Madera Center (1,335,063) 401,500 (774,200) 0 (1,707,763)
---------------------- ---------------------- ---------------------- ---------------------- ----------------------
SUB-TOTAL NON-OPERATIONS 594,241 1,973,500 (3,190,700) 0 (622,959)
---------------------- ---------------------- ---------------------- ---------------------- ----------------------
TOTALS 527,877 16,334,700 (16,873,000) 0 (10,423)
* Page 105 2010 Audit Report 6,001,346
Less Sewer Fund (5,229,671)
Less Self Insurance (230,280)
Less Affordable Housing (9,835)
Less Petty Cash & Inventory (3,683)
----------------------
Adjusted Total 527,877
2011-12Budget\S01-S06ZGeorge'sEstFundSetupSheet.xls S4-S6
STATEMENT of ESTIMATED FUND BALANCES
FY 2010-2011
(Budget Worksheet)
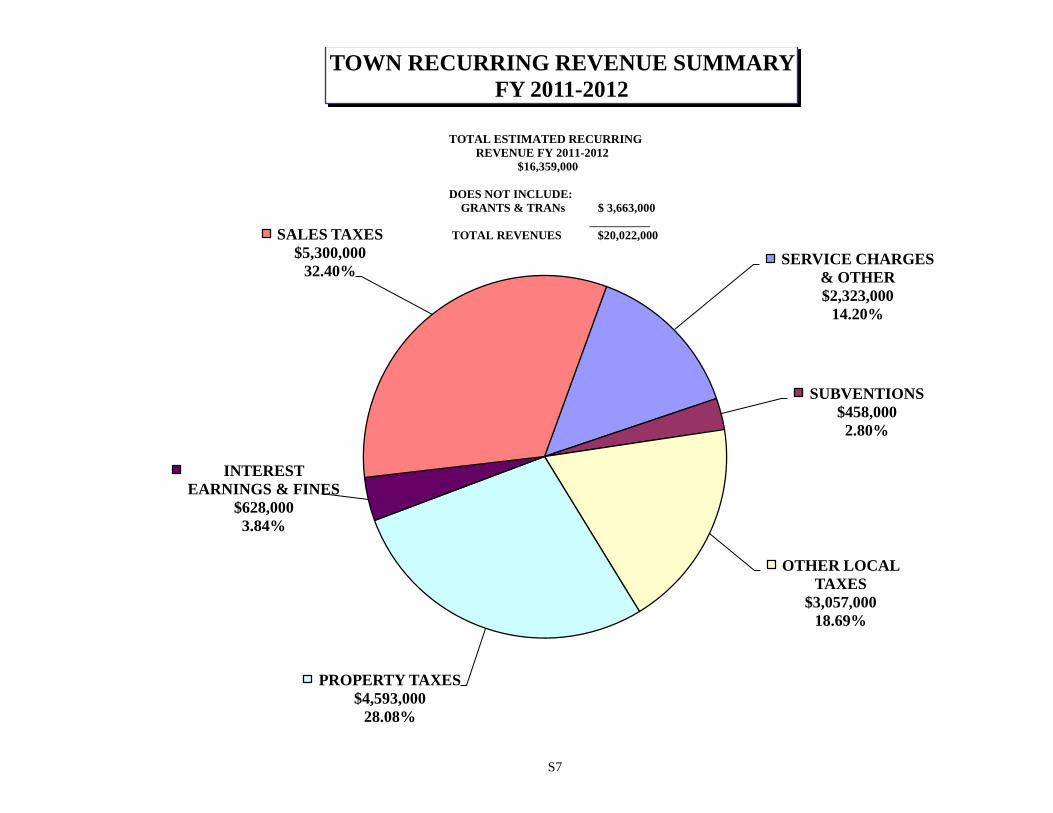
SERVICE CHARGES
& OTHER
$2,323,000
14.20%
SUBVENTIONS
$458,000
2.80%
OTHER LOCAL
TAXES
$3,057,000
18.69%
PROPERTY TAXES
$4,593,000
28.08%
INTEREST
EARNINGS & FINES
$628,000
3.84%
SALES TAXES
$5,300,000
32.40%
TOWN RECURRING REVENUE SUMMARY
FY 2011-2012
TOTAL ESTIMATED RECURRING
REVENUE FY 2011-2012
$16,359,000
DOES NOT INCLUDE:
GRANTS & TRANs $ 3,663,000
__________
TOTAL REVENUES $20,022,000
S7
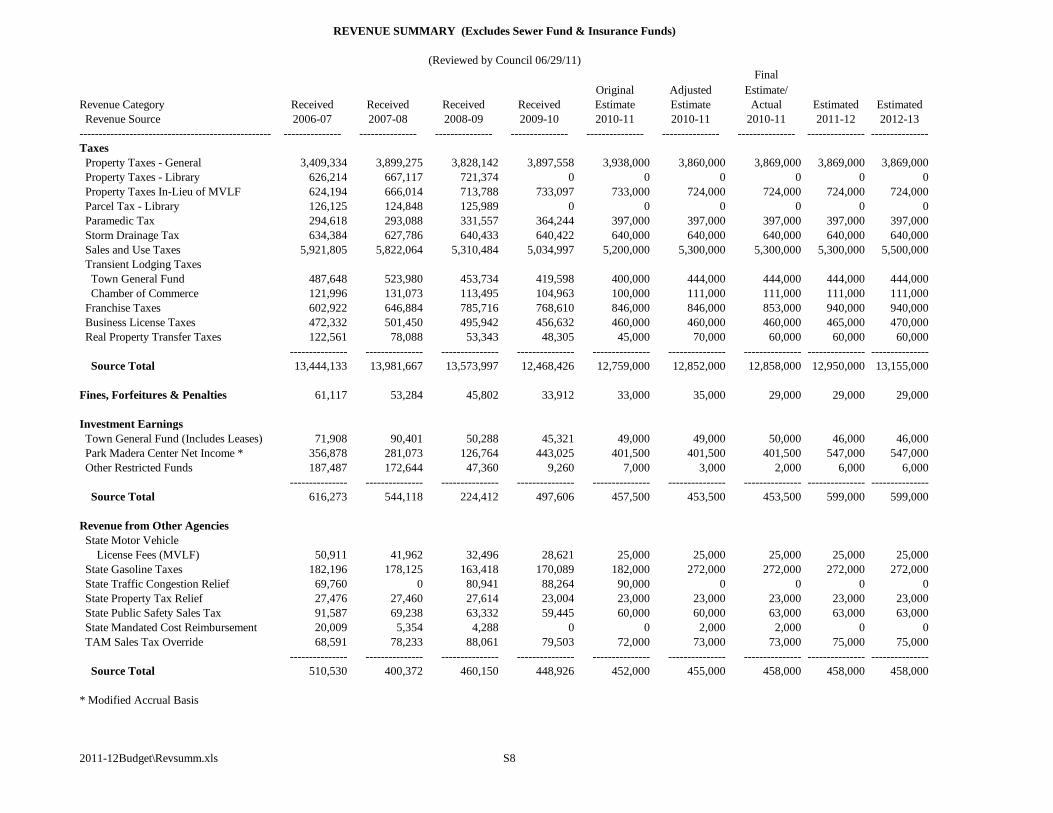
REVENUE SUMMARY (Excludes Sewer Fund & Insurance Funds)
Final
Original Adjusted Estimate/
Revenue Category Received Received Received Received Estimate Estimate Actual Estimated Estimated
Revenue Source 2006-07 2007-08 2008-09 2009-10 2010-11 2010-11 2010-11 2011-12 2012-13
-------------------------------------------------- --------------- --------------- --------------- --------------- --------------- --------------- --------------- --------------- ---------------
Taxes
Property Taxes - General 3,409,334 3,899,275 3,828,142 3,897,558 3,938,000 3,860,000 3,869,000 3,869,000 3,869,000
Property Taxes - Library 626,214 667,117 721,374 0 0 0 0 0 0
Property Taxes In-Lieu of MVLF 624,194 666,014 713,788 733,097 733,000 724,000 724,000 724,000 724,000
Parcel Tax - Library 126,125 124,848 125,989 0 0 0 0 0 0
Paramedic Tax 294,618 293,088 331,557 364,244 397,000 397,000 397,000 397,000 397,000
Storm Drainage Tax 634,384 627,786 640,433 640,422 640,000 640,000 640,000 640,000 640,000
Sales and Use Taxes 5,921,805 5,822,064 5,310,484 5,034,997 5,200,000 5,300,000 5,300,000 5,300,000 5,500,000
Transient Lodging Taxes
Town General Fund 487,648 523,980 453,734 419,598 400,000 444,000 444,000 444,000 444,000
Chamber of Commerce 121,996 131,073 113,495 104,963 100,000 111,000 111,000 111,000 111,000
Franchise Taxes 602,922 646,884 785,716 768,610 846,000 846,000 853,000 940,000 940,000
Business License Taxes 472,332 501,450 495,942 456,632 460,000 460,000 460,000 465,000 470,000
Real Property Transfer Taxes 122,561 78,088 53,343 48,305 45,000 70,000 60,000 60,000 60,000
--------------- --------------- --------------- --------------- --------------- --------------- --------------- --------------- ---------------
Source Total 13,444,133 13,981,667 13,573,997 12,468,426 12,759,000 12,852,000 12,858,000 12,950,000 13,155,000
Fines, Forfeitures & Penalties 61,117 53,284 45,802 33,912 33,000 35,000 29,000 29,000 29,000
Investment Earnings
Town General Fund (Includes Leases) 71,908 90,401 50,288 45,321 49,000 49,000 50,000 46,000 46,000
Park Madera Center Net Income * 356,878 281,073 126,764 443,025 401,500 401,500 401,500 547,000 547,000
Other Restricted Funds 187,487 172,644 47,360 9,260 7,000 3,000 2,000 6,000 6,000
--------------- --------------- --------------- --------------- --------------- --------------- --------------- --------------- ---------------
Source Total 616,273 544,118 224,412 497,606 457,500 453,500 453,500 599,000 599,000
Revenue from Other Agencies
State Motor Vehicle
License Fees (MVLF) 50,911 41,962 32,496 28,621 25,000 25,000 25,000 25,000 25,000
State Gasoline Taxes 182,196 178,125 163,418 170,089 182,000 272,000 272,000 272,000 272,000
State Traffic Congestion Relief 69,760 0 80,941 88,264 90,000 0 0 0 0
State Property Tax Relief 27,476 27,460 27,614 23,004 23,000 23,000 23,000 23,000 23,000
State Public Safety Sales Tax 91,587 69,238 63,332 59,445 60,000 60,000 63,000 63,000 63,000
State Mandated Cost Reimbursement 20,009 5,354 4,288 0 0 2,000 2,000 0 0
TAM Sales Tax Override 68,591 78,233 88,061 79,503 72,000 73,000 73,000 75,000 75,000
--------------- --------------- --------------- --------------- --------------- --------------- --------------- --------------- ---------------
Source Total 510,530 400,372 460,150 448,926 452,000 455,000 458,000 458,000 458,000
* Modified Accrual Basis
2011-12Budget\Revsumm.xls S8
(Reviewed by Council 06/29/11)
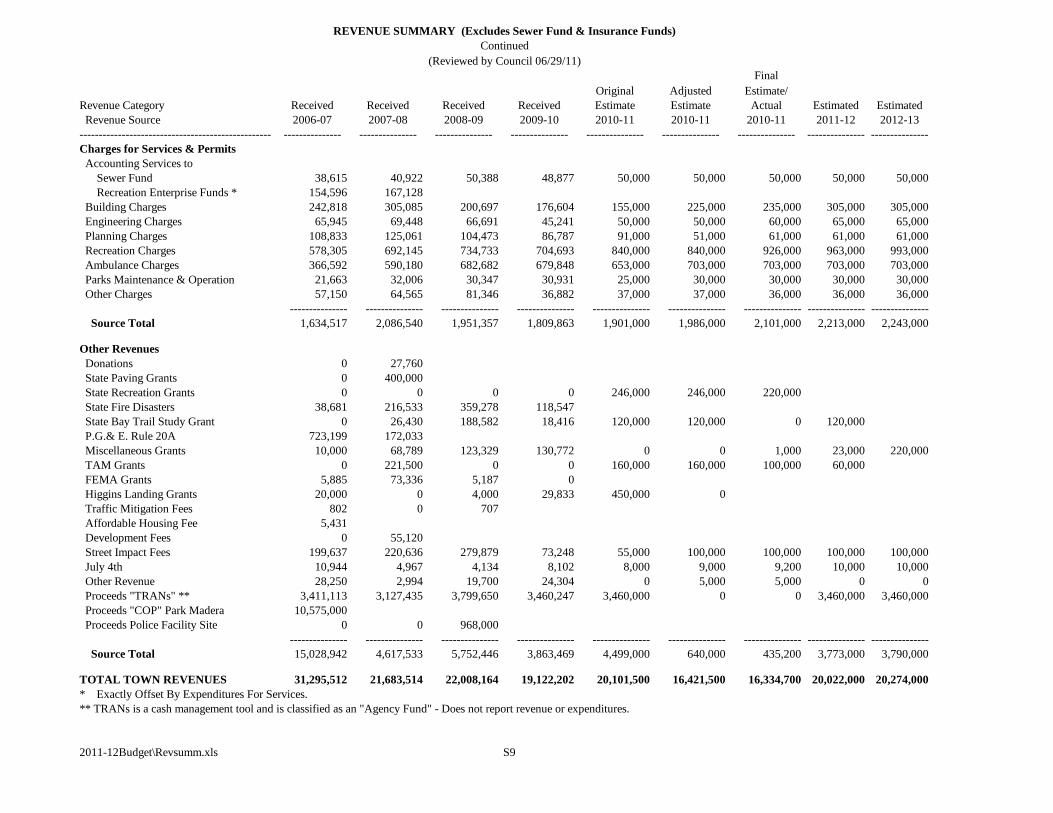
REVENUE SUMMARY (Excludes Sewer Fund & Insurance Funds)
Continued
Final
Original Adjusted Estimate/
Revenue Category Received Received Received Received Estimate Estimate Actual Estimated Estimated
Revenue Source 2006-07 2007-08 2008-09 2009-10 2010-11 2010-11 2010-11 2011-12 2012-13
-------------------------------------------------- --------------- --------------- --------------- --------------- --------------- --------------- --------------- --------------- ---------------
Charges for Services & Permits
Accounting Services to
Sewer Fund 38,615 40,922 50,388 48,877 50,000 50,000 50,000 50,000 50,000
Recreation Enterprise Funds * 154,596 167,128
Building Charges 242,818 305,085 200,697 176,604 155,000 225,000 235,000 305,000 305,000
Engineering Charges 65,945 69,448 66,691 45,241 50,000 50,000 60,000 65,000 65,000
Planning Charges 108,833 125,061 104,473 86,787 91,000 51,000 61,000 61,000 61,000
Recreation Charges 578,305 692,145 734,733 704,693 840,000 840,000 926,000 963,000 993,000
Ambulance Charges 366,592 590,180 682,682 679,848 653,000 703,000 703,000 703,000 703,000
Parks Maintenance & Operation 21,663 32,006 30,347 30,931 25,000 30,000 30,000 30,000 30,000
Other Charges 57,150 64,565 81,346 36,882 37,000 37,000 36,000 36,000 36,000
--------------- --------------- --------------- --------------- --------------- --------------- --------------- --------------- ---------------
Source Total 1,634,517 2,086,540 1,951,357 1,809,863 1,901,000 1,986,000 2,101,000 2,213,000 2,243,000
Other Revenues
Donations 0 27,760
State Paving Grants 0 400,000
State Recreation Grants 0 0 0 0 246,000 246,000 220,000
State Fire Disasters 38,681 216,533 359,278 118,547
State Bay Trail Study Grant 0 26,430 188,582 18,416 120,000 120,000 0 120,000
P.G.& E. Rule 20A 723,199 172,033
Miscellaneous Grants 10,000 68,789 123,329 130,772 0 0 1,000 23,000 220,000
TAM Grants 0 221,500 0 0 160,000 160,000 100,000 60,000
FEMA Grants 5,885 73,336 5,187 0
Higgins Landing Grants 20,000 0 4,000 29,833 450,000 0
Traffic Mitigation Fees 802 0 707
Affordable Housing Fee 5,431
Development Fees 0 55,120
Street Impact Fees 199,637 220,636 279,879 73,248 55,000 100,000 100,000 100,000 100,000
July 4th 10,944 4,967 4,134 8,102 8,000 9,000 9,200 10,000 10,000
Other Revenue 28,250 2,994 19,700 24,304 0 5,000 5,000 0 0
Proceeds "TRANs" ** 3,411,113 3,127,435 3,799,650 3,460,247 3,460,000 0 0 3,460,000 3,460,000
Proceeds "COP" Park Madera 10,575,000
Proceeds Police Facility Site 0 0 968,000
--------------- --------------- --------------- --------------- --------------- --------------- --------------- --------------- ---------------
Source Total 15,028,942 4,617,533 5,752,446 3,863,469 4,499,000 640,000 435,200 3,773,000 3,790,000
TOTAL TOWN REVENUES 31,295,512 21,683,514 22,008,164 19,122,202 20,101,500 16,421,500 16,334,700 20,022,000 20,274,000
* Exactly Offset By Expenditures For Services.
** TRANs is a cash management tool and is classified as an "Agency Fund" - Does not report revenue or expenditures.
2011-12Budget\Revsumm.xls S9
(Reviewed by Council 06/29/11)

BLANK PAGE
2011-12Budget\Estfund.xls S10
BLANK PAGE
2011-12Budget\Estfund.xls S11
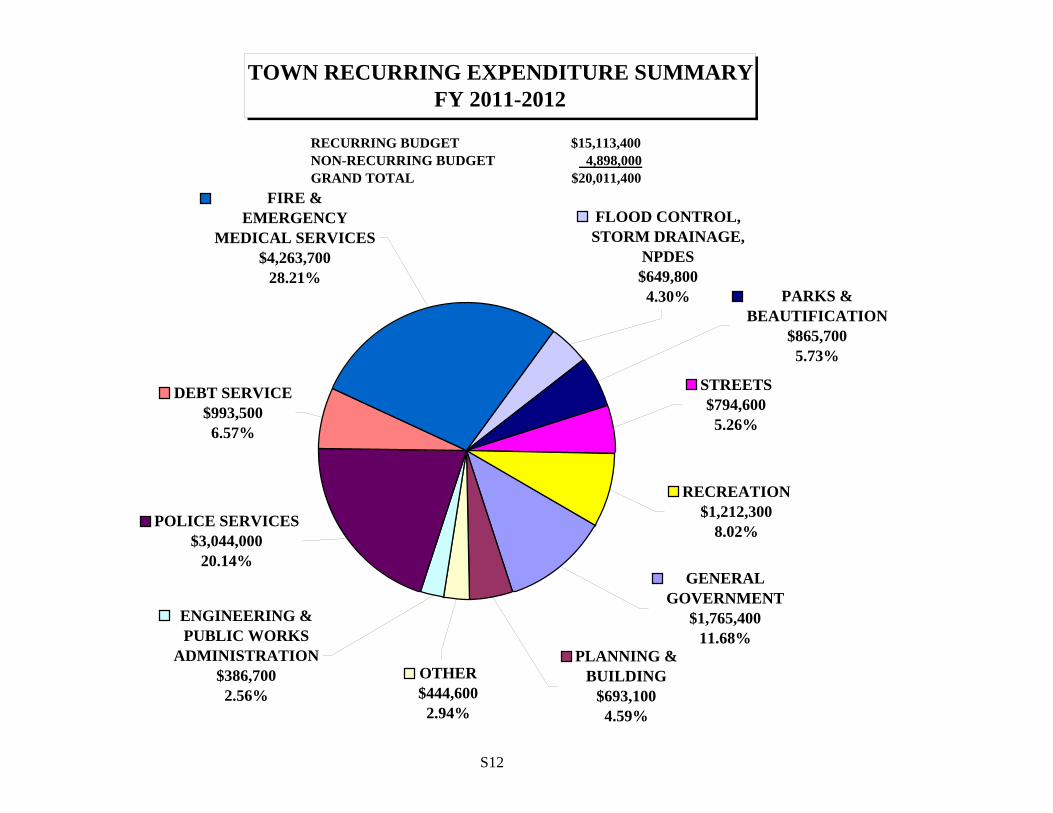
TOWN RECURRING EXPENDITURE SUMMARYFY 2011-2012
GENERAL GOVERNMENT
$1,765,400 11.68%
PLANNING & BUILDING
$693,100 4.59%
OTHER$444,600
2.94%
ENGINEERING & PUBLIC WORKS
ADMINISTRATION$386,700
2.56%
POLICE SERVICES$3,044,000
20.14%
DEBT SERVICE$993,500
6.57%
FIRE & EMERGENCY
MEDICAL SERVICES$4,263,700
28.21%
FLOOD CONTROL, STORM DRAINAGE,
NPDES$649,800
4.30% PARKS & BEAUTIFICATION
$865,700 5.73%
STREETS$794,600
5.26%
RECREATION$1,212,300
8.02%
RECURRING BUDGET $15,113,400NON-RECURRING BUDGET 4,898,000GRAND TOTAL $20,011,400
S12
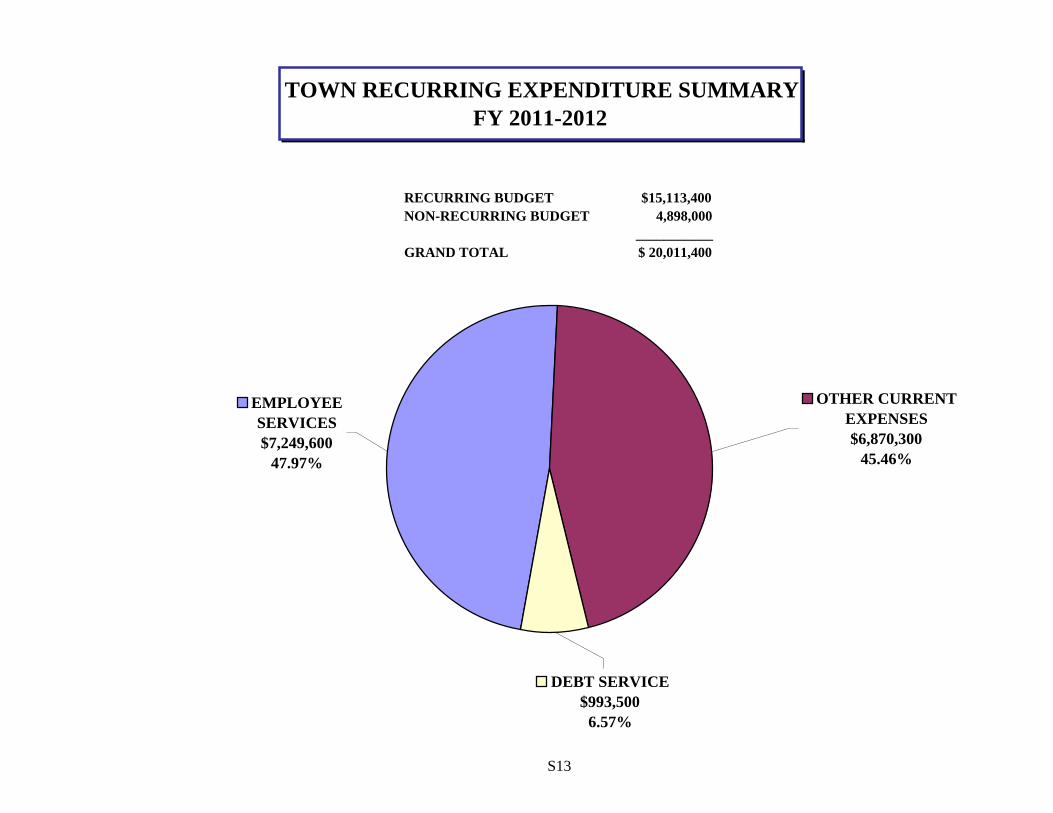
TOWN RECURRING EXPENDITURE SUMMARY FY 2011-2012
EMPLOYEE SERVICES$7,249,600
47.97%
OTHER CURRENT EXPENSES$6,870,300
45.46%
DEBT SERVICE$993,500
6.57%
S13
RECURRING BUDGET $15,113,400NON-RECURRING BUDGET 4,898,000 ___________GRAND TOTAL $ 20,011,400
Original Adjusted Estimate/ Staff Council
Expended Expended Expended Budget Budget Actual Request Approve % Projection
Budget Activity 2007-08 2008-09 2009-10 2010-11 2010-11 2010-11 2011-12 2011-12 Change 2012-13
---------------------- -------------- -------------- -------------- -------------- -------------- -------------- -------------- -------------- -------------- --------------
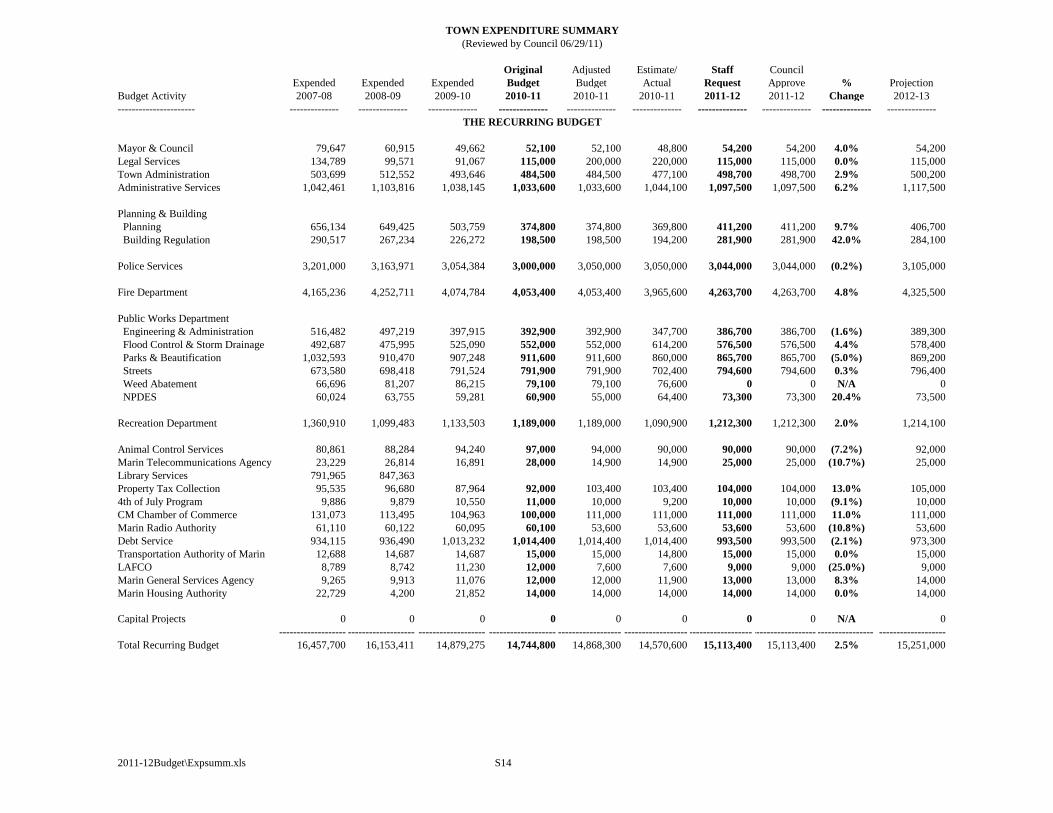
Mayor & Council 79,647 60,915 49,662 52,100 52,100 48,800 54,200 54,200 4.0% 54,200
Legal Services 134,789 99,571 91,067 115,000 200,000 220,000 115,000 115,000 0.0% 115,000
Town Administration 503,699 512,552 493,646 484,500 484,500 477,100 498,700 498,700 2.9% 500,200
Administrative Services 1,042,461 1,103,816 1,038,145 1,033,600 1,033,600 1,044,100 1,097,500 1,097,500 6.2% 1,117,500
Planning & Building
Planning 656,134 649,425 503,759 374,800 374,800 369,800 411,200 411,200 9.7% 406,700
Building Regulation 290,517 267,234 226,272 198,500 198,500 194,200 281,900 281,900 42.0% 284,100
Police Services 3,201,000 3,163,971 3,054,384 3,000,000 3,050,000 3,050,000 3,044,000 3,044,000 (0.2%) 3,105,000
Fire Department 4,165,236 4,252,711 4,074,784 4,053,400 4,053,400 3,965,600 4,263,700 4,263,700 4.8% 4,325,500
Public Works Department
Engineering & Administration 516,482 497,219 397,915 392,900 392,900 347,700 386,700 386,700 (1.6%) 389,300
Flood Control & Storm Drainage 492,687 475,995 525,090 552,000 552,000 614,200 576,500 576,500 4.4% 578,400
Parks & Beautification 1,032,593 910,470 907,248 911,600 911,600 860,000 865,700 865,700 (5.0%) 869,200
Streets 673,580 698,418 791,524 791,900 791,900 702,400 794,600 794,600 0.3% 796,400
Weed Abatement 66,696 81,207 86,215 79,100 79,100 76,600 0 0 N/A 0
NPDES 60,024 63,755 59,281 60,900 55,000 64,400 73,300 73,300 20.4% 73,500
Recreation Department 1,360,910 1,099,483 1,133,503 1,189,000 1,189,000 1,090,900 1,212,300 1,212,300 2.0% 1,214,100
Animal Control Services 80,861 88,284 94,240 97,000 94,000 90,000 90,000 90,000 (7.2%) 92,000
Marin Telecommunications Agency 23,229 26,814 16,891 28,000 14,900 14,900 25,000 25,000 (10.7%) 25,000
Library Services 791,965 847,363
Property Tax Collection 95,535 96,680 87,964 92,000 103,400 103,400 104,000 104,000 13.0% 105,000
4th of July Program 9,886 9,879 10,550 11,000 10,000 9,200 10,000 10,000 (9.1%) 10,000
CM Chamber of Commerce 131,073 113,495 104,963 100,000 111,000 111,000 111,000 111,000 11.0% 111,000
Marin Radio Authority 61,110 60,122 60,095 60,100 53,600 53,600 53,600 53,600 (10.8%) 53,600
Debt Service 934,115 936,490 1,013,232 1,014,400 1,014,400 1,014,400 993,500 993,500 (2.1%) 973,300
Transportation Authority of Marin 12,688 14,687 14,687 15,000 15,000 14,800 15,000 15,000 0.0% 15,000
LAFCO 8,789 8,742 11,230 12,000 7,600 7,600 9,000 9,000 (25.0%) 9,000
Marin General Services Agency 9,265 9,913 11,076 12,000 12,000 11,900 13,000 13,000 8.3% 14,000
Marin Housing Authority 22,729 4,200 21,852 14,000 14,000 14,000 14,000 14,000 0.0% 14,000
Capital Projects 0 0 0 0 0 0 0 0 N/A 0
------------------- ------------------- ------------------- ------------------- ------------------- ------------------- ------------------- ------------------- ------------------- -------------------
Total Recurring Budget 16,457,700 16,153,411 14,879,275 14,744,800 14,868,300 14,570,600 15,113,400 15,113,400 2.5% 15,251,000
2011-12Budget\Expsumm.xls S14
THE RECURRING BUDGET
TOWN EXPENDITURE SUMMARY
(Reviewed by Council 06/29/11)
Original Adjusted Estimate/ Staff Council
Expended Expended Expended Budget Budget Actual Request Approve % Projection
Budget Activity 2007-08 2008-09 2009-10 2010-11 2010-11 2010-11 2011-12 2011-12 Change 2012-13
---------------------- -------------- -------------- -------------- -------------- -------------- -------------- -------------- -------------- -------------- --------------
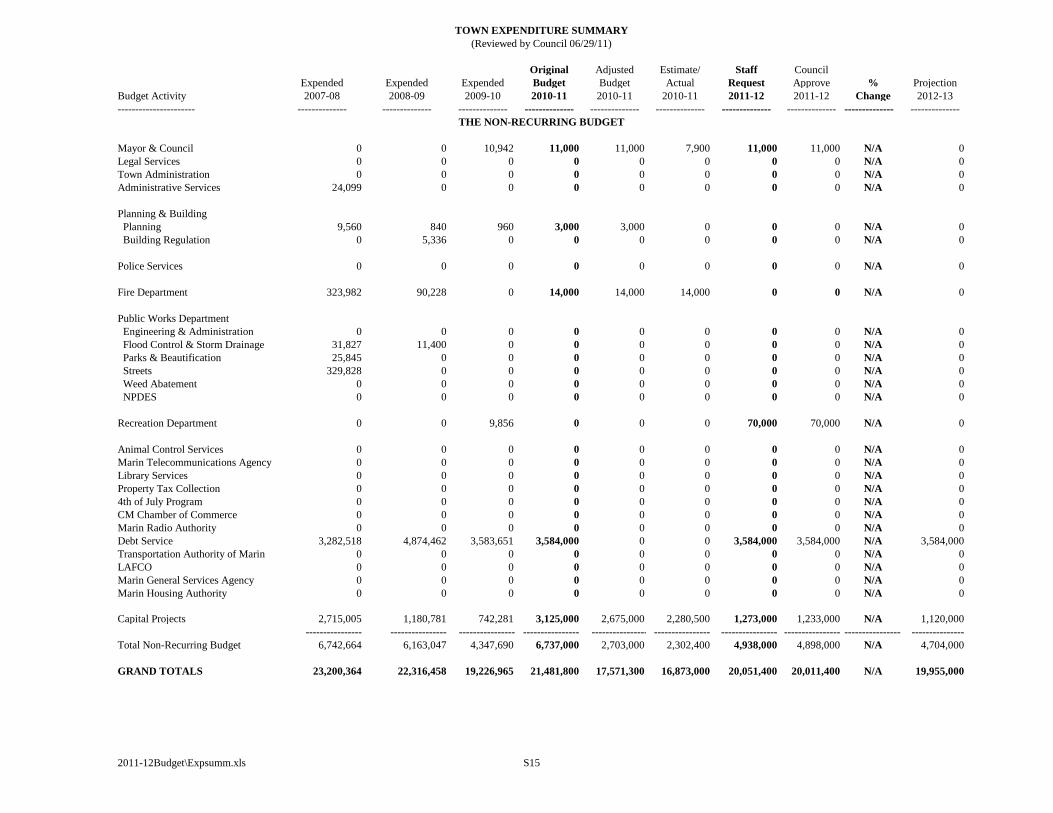
Mayor & Council 0 0 10,942 11,000 11,000 7,900 11,000 11,000 N/A 0
Legal Services 0 0 0 0 0 0 0 0 N/A 0
Town Administration 0 0 0 0 0 0 0 0 N/A 0
Administrative Services 24,099 0 0 0 0 0 0 0 N/A 0
Planning & Building
Planning 9,560 840 960 3,000 3,000 0 0 0 N/A 0
Building Regulation 0 5,336 0 0 0 0 0 0 N/A 0
Police Services 0 0 0 0 0 0 0 0 N/A 0
Fire Department 323,982 90,228 0 14,000 14,000 14,000 0 0 N/A 0
Public Works Department
Engineering & Administration 0 0 0 0 0 0 0 0 N/A 0
Flood Control & Storm Drainage 31,827 11,400 0 0 0 0 0 0 N/A 0
Parks & Beautification 25,845 0 0 0 0 0 0 0 N/A 0
Streets 329,828 0 0 0 0 0 0 0 N/A 0
Weed Abatement 0 0 0 0 0 0 0 0 N/A 0
NPDES 0 0 0 0 0 0 0 0 N/A 0
Recreation Department 0 0 9,856 0 0 0 70,000 70,000 N/A 0
Animal Control Services 0 0 0 0 0 0 0 0 N/A 0
Marin Telecommunications Agency 0 0 0 0 0 0 0 0 N/A 0
Library Services 0 0 0 0 0 0 0 0 N/A 0
Property Tax Collection 0 0 0 0 0 0 0 0 N/A 0
4th of July Program 0 0 0 0 0 0 0 0 N/A 0
CM Chamber of Commerce 0 0 0 0 0 0 0 0 N/A 0
Marin Radio Authority 0 0 0 0 0 0 0 0 N/A 0
Debt Service 3,282,518 4,874,462 3,583,651 3,584,000 0 0 3,584,000 3,584,000 N/A 3,584,000
Transportation Authority of Marin 0 0 0 0 0 0 0 0 N/A 0
LAFCO 0 0 0 0 0 0 0 0 N/A 0
Marin General Services Agency 0 0 0 0 0 0 0 0 N/A 0
Marin Housing Authority 0 0 0 0 0 0 0 0 N/A 0
Capital Projects 2,715,005 1,180,781 742,281 3,125,000 2,675,000 2,280,500 1,273,000 1,233,000 N/A 1,120,000
---------------- ---------------- ---------------- ---------------- ---------------- ---------------- ---------------- ---------------- ---------------- ---------------
Total Non-Recurring Budget 6,742,664 6,163,047 4,347,690 6,737,000 2,703,000 2,302,400 4,938,000 4,898,000 N/A 4,704,000
GRAND TOTALS 23,200,364 22,316,458 19,226,965 21,481,800 17,571,300 16,873,000 20,051,400 20,011,400 N/A 19,955,000
2011-12Budget\Expsumm.xls S15
THE NON-RECURRING BUDGET
TOWN EXPENDITURE SUMMARY
(Reviewed by Council 06/29/11)

BLANK PAGE
2011-12Budget\Charts-Graphs.xls S16
BLANK PAGE
2011-12Budget\Charts-Graphs.xls S17-S24 (1)
BLANK PAGE
2011-12Budget\Charts-Graphs.xls S17-S24 (2)

BLANK PAGE
2011-12Budget\Staffsum.xls S25
FY FY FY FY FY FY FY FY FY FY FY FY
Department 01-02 02-03 03-04 04-05 05-06 06-07 07-08 08-09 09-10 10-11 11-12 12-13
-------------------------------------- ------------ ------------ ------------ ------------ ------------ ------------ ------------ ------------ ------------ ------------ ------------ ------------
Administration
Town Manager 1 1 1 1 1 1 1 1 1 1 1 1
Asst. To T.M./Town Clerk 1 1 1 1 1 1 1 1 1 1 1 1
Confidential Secretary 0.25 0.25 0.25 0.25 0.25 0.25 0.25 0.25 0.25 0.25 0.25 0.25
Minute Clerk 0.17 0.16 0.10 0.10 0.10 0 0 0 0 0 0 0
----- ----- ----- ----- ----- ----- ----- ----- ----- ----- ----- -----
Sub-Total 2.42 2.41 2.35 2.35 2.35 2.25 2.25 2.25 2.25 2.25 2.25 2.25
Administrative Services
Director of Administrative
Services/Town Treasurer 1 1 1 1 1 1 1 1 1 1 1 1
Administrative Services/
Accounting Technicians 2 2 2 2 2 2 2 2 1.50 1.50 1 1
Information Systems Coordinator 1 1 1 1 1 1 1 1 0.50 0.50 0.50 0.50
Business License Enforcement
Officer/Acct. Tech. II 1 1 1 1 1 1 1 1 1 1 1 1
Facilities Worker 0.50 0.50 0.50 0.50 0.50 0.50 0.50 0.50 0.50 0.50 0.50 0.50
----- ----- ----- ----- ----- ----- ----- ----- ----- ----- ----- -----
Sub-Total 5.50 5.50 5.50 5.50 5.50 5.50 5.50 5.50 4.50 4.50 4.00 4.00
Planning & Building
Director of Planning/Asst. Town Mgr. 0 0 0 1 1 1 1 1 1 0.50 0 0
Director of Environmental Services 1 1 1 0 0 0 0 0 0 0 0 0
Director of Planning & Building 0 0 0 0 0 0 0 0 0 0.50 1 1
Senior Planner 0 1 1 1 1 1 1 1 0.50 0 0 0
Associate Planner 1 0 0 1 1 1 1 1 1 1 1 1
Assistant Planner 1 1 1 0 0 0 0 0 0 0 0 0
Building Official 0 1 1 1 1 1 1 1 1 1 1 1
Chief Building Inspector 1 0 0 0 0 0 0 0 0 0 0 0
Permit Technician 1 1 0 0 1 1 1 1 0 0 1 1
Confidential Secretary 1 1 1 1 1 1 1 1 0.50 0.50 0 0
Secretaries 1 1 1 1 1 0 0 0 0 0 0 0
Minute Clerk 0.21 0.37 0.32 0.32 0.32 0 0 0 0 0 0 0
----- ----- ----- ----- ----- ----- ----- ----- ----- ----- ----- -----
Sub-Total 7.21 7.37 6.32 6.32 7.32 6 6 6 4.00 3.50 4 4
Recreation
Director of Recreation &
Leisure Services 1 1 1 1 1 1 1 1 1 1 1 1
Recreation Superintendent 1 1 0 0 0 0 0 0 0 0 0 0
Recreation Supervisor 1 1 1 1 1 2 1 0 0 0 0 0
Recreation Coordinator 0 0 0 0 0 1 2 2 2 2 2 2
Minute Clerk 0.06 0.05 0.05 0.05 0.05 0 0 0 0 0 0 0
Facilities Worker 1 1 1 1 0 0 0 0 0 0 0 0
Recreation Leader 1 3 1.50 1.50 1.50 0 0 0 0 0 0 0
----- ----- ----- ----- ----- ----- ----- ----- ----- ----- ----- -----
Sub-Total 5.06 7.05 4.55 4.55 3.55 4 4 3 3 3 3 3
2011-12Budget\Staffsum.xls S26
PERMANENT STAFFING SUMMARY
(Reviewed by Council 06/29/11)
FY FY FY FY FY FY FY FY FY FY FY FY
Department 01-02 02-03 03-04 04-05 05-06 06-07 07-08 08-09 09-10 10-11 11-12 12-13
-------------------------------------- ------------ ------------ ------------ ------------ ------------ ------------ ------------ ------------ ------------ ------------ ------------ ------------
Fire Director of Emergency Services 1 1 1 1 1 1 1 0.50 1 1 1 1
Fire Marshall 1 1 1 1 1 1 1 1 0 0 0 0
Fire Battalion Chiefs 3 3 3 3 3 3 3 3 3 3 3 3
Fire Captain/Paramedics 3 3 3 3 3 3 3 3 3 3 3 3
Fire Engineer/Paramedics 9 9 9 9 9 9 9 9 9 8.50 8 8
Firefighter/Paramedics 0 0 0 0 0 0 0 0 0 0 3 3
Apprentice Firefighters 3 3 3 3 3 3 3 3 3 3 0 0
Administrative Assistant 0 0 0 0 0 1 1 1 1 1 1 1
Confidential Secretary 1.5 1.37 1.5 1.5 1.5 0 0 0 0 0 0 0
Paramedic Liaison Nurse 0.50 0.50 0.50 0.50 0.50 0 0 0 0 0 0 0
----- ----- ----- ----- ----- ----- ----- ----- ----- ----- ----- -----
Sub-Total 22.00 21.87 22.00 22.00 22.00 21 21 20.50 20 19.50 19 19
Public Works
Director of Public Works/Town Engineer 1 1 0 0 1 1 * * 0.50 0.50 ** **
Director of Public Works 0 0 0 0 0 0 0 0 0 0 1 1
Public Works Manager 0 0 0 0 0 0 1 1 0 0 0 0
Sanitary Services Manager 0 0 0 0 0 0 1 1 1 1 0 0
Senior Civil Engineer 1 1 0 0 1 1 1 0 0 0 0.50 0.50
Associate Civil Engineer 0 0 1 1 1 1 0 0 0 0 0 0
Engineering Technician 1 1 1 1 1 0 0 0 0 0 0 0
Administrative Assistant 0 0 0 0 0 1 1 1 1 1 1 1
Confidential Secretary 1 1 1 1 1 0 0 0 0 0 0 0
Minute Clerk 0.06 0.05 0.03 0.03 0.03 0 0 0 0 0 0 0
Superintendent of Public Works 1 1 1 1 1 1 1 1 1 1 1 1
Assistant Superintendent of
Public Works 1 1 1 1 1 1 1 1 1 1 1 1
Field Supervisors *** 1 1 1 1 1 1 0 0 0 0 0 0
Equipment Mechanic 1 1 1 1 1 1 1 1 1 1 1 1
Senior Maintenance Workers *** 0 0 0 0 0 0 0 0 0 2 2 2
Maintenance Workers *** 10 10 8 8 8 8 7 7 7 4.25 4 4
----- ----- ----- ----- ----- ----- ----- ----- ----- ----- ----- -----
Sub-Total 18.06 18.05 15.03 15.03 17.03 16 14 13 12.50 11.75 11.50 11.50
Totals 60.25 62.25 55.75 55.75 57.75 54.75 52.75 50.25 46.25 44.50 43.75 43.75
* Town Manager is also Director of Public Works and Town Engineer.
** Town Manager is also Town Engineer.
2011-12Budget\Staffsum.xls S27
*** 2 Positions Frozen Subsequent to Vacancies In FY 2002-03. 2 Additional Positions Frozen Subsequent to Vacancies in FY 2006-07. 1 Additional Position Frozen
Subsequent to Vacancy in FY 2010-11.
(Reviewed by Council 06/29/11)
PERMANENT STAFFING SUMMARY
Continued

BLANK PAGE
2011-12Budget\Staffsum.xls S28

BLANK PAGE
2011-12Budget\Staffsum.xls S29
S30
SUBVENTIONS
$48,000
0.40%
OTHER LOCAL TAXES
$1,909,000
16.05%
PROPERTY TAXES
$4,593,000
38.61%
INTEREST EARNINGS
$46,000
0.39%
SALES TAXES
$5,300,000
44.55%
TOWN RECURRING GENERAL PURPOSE TAX
REVENUE SUMMARY FY 2011-2012
TOTAL ESTIMATED GENERAL PURPOSE
TAX REVENUE FY 2011-2012
$11,896,000
Final
Original Adjusted Estimate/
Revenue Category Received Received Received Received Estimate Estimate Actual Estimated Estimated
Revenue Source 2006-07 2007-08 2008-09 2009-10 2010-11 2010-11 2010-11 2011-12 2012-13
-------------------------------------------------- --------------- --------------- --------------- --------------- --------------- --------------- --------------- --------------- ---------------
Taxes
Property Taxes 3,409,334 3,899,275 3,828,142 3,897,558 3,938,000 3,860,000 3,869,000 3,869,000 3,869,000
Property Taxes In-Lieu of MVLF 624,194 666,014 713,788 733,097 733,000 724,000 724,000 724,000 724,000
Sales and Use Taxes 5,921,805 5,822,064 5,310,484 5,034,997 5,200,000 5,300,000 5,300,000 5,300,000 5,500,000
Transient Lodging Taxes 487,648 523,980 453,734 419,598 400,000 444,000 444,000 444,000 444,000
Franchise Taxes 602,922 646,884 785,716 768,610 846,000 846,000 853,000 940,000 940,000
Business License Taxes 472,322 501,450 495,942 456,632 460,000 460,000 460,000 465,000 470,000
Real Property Transfer Taxes 122,561 78,088 53,343 48,305 45,000 70,000 60,000 60,000 60,000
------------- ------------- ------------- ------------- ------------- ------------- ------------- ------------- -------------
Source Total 11,640,786 12,137,755 11,641,149 11,358,797 11,622,000 11,704,000 11,710,000 11,802,000 12,007,000
Investment Earnings (Includes Leases) 71,908 90,401 50,288 45,321 49,000 49,000 50,000 46,000 46,000
Revenue from Other Agencies
State Motor Vehicle License Fees 50,911 41,962 32,496 28,621 25,000 25,000 25,000 25,000 25,000
State Homeowners Property Tax Relief 27,476 27,460 27,614 23,004 23,000 23,000 23,000 23,000 23,000
------------- ------------- ------------- ------------- ------------- ------------- ------------- ------------- -------------
Source Total 78,387 69,422 60,110 51,625 48,000 48,000 48,000 48,000 48,000
GRAND TOTAL 11,791,081 12,297,578 11,751,547 11,455,743 11,719,000 11,801,000 11,808,000 11,896,000 12,101,000
2011-12Budget\Genpurpr.xls S31
TOWN GENERAL PURPOSE TAX REVENUE SUMMARY
(Reviewed by Council 06/29/11)
(Excludes Fines, Service Charges, Reimbursements & Restricted Revenues)

BLANK PAGES
2011-12Budget\Genpurpr.xls S32-S36
2011-12Budget\Charts-Graphs.xls S37
GRAPHIC ANALYSIS OF REVENUE BASE
S38
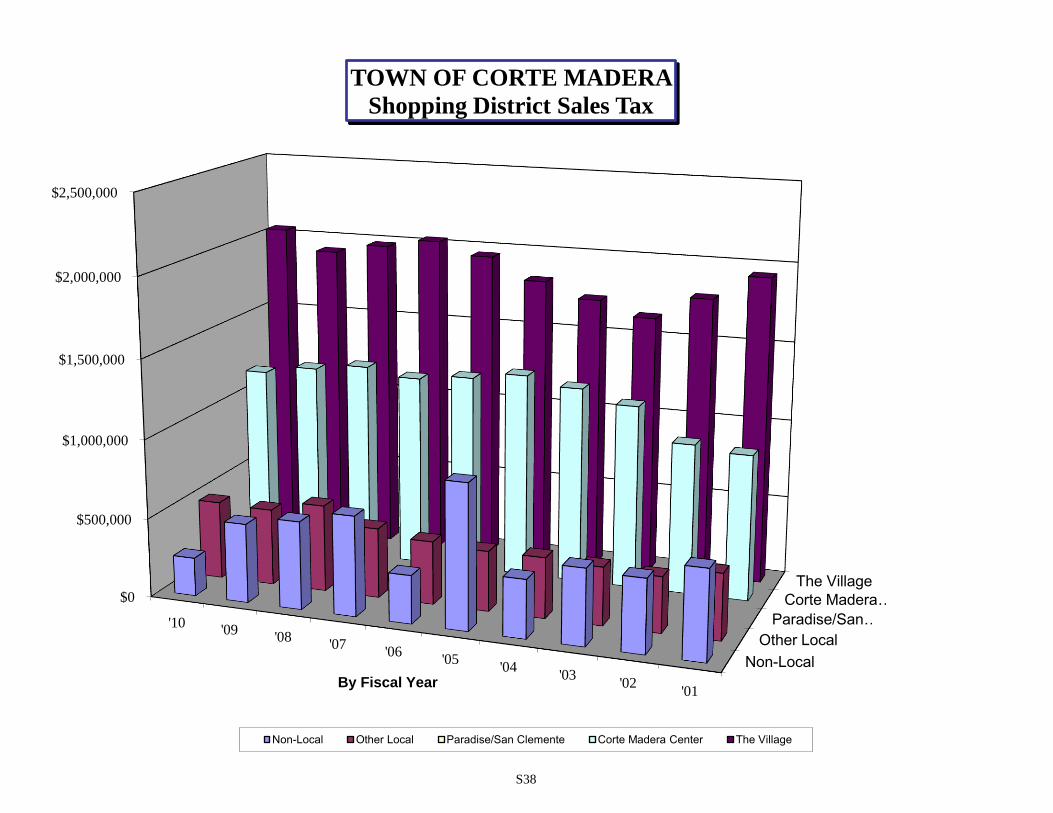
Non-Local
Other Local
Paradise/San …
Corte Madera …
The Village$0
$500,000
$1,000,000
$1,500,000
$2,000,000
$2,500,000
'10'09
'08'07
'06'05
'04'03
'02'01
By Fiscal Year
TOWN OF CORTE MADERA
Shopping District Sales Tax
Non-Local Other Local Paradise/San Clemente Corte Madera Center The Village
S39
-
100,000
200,000
300,000
400,000
500,000
600,000
700,000
800,000
900,000
1,000,000
1,100,000
1,200,000
'10 '09 '08 '07 '06 '05 '04 '03 '02 '01
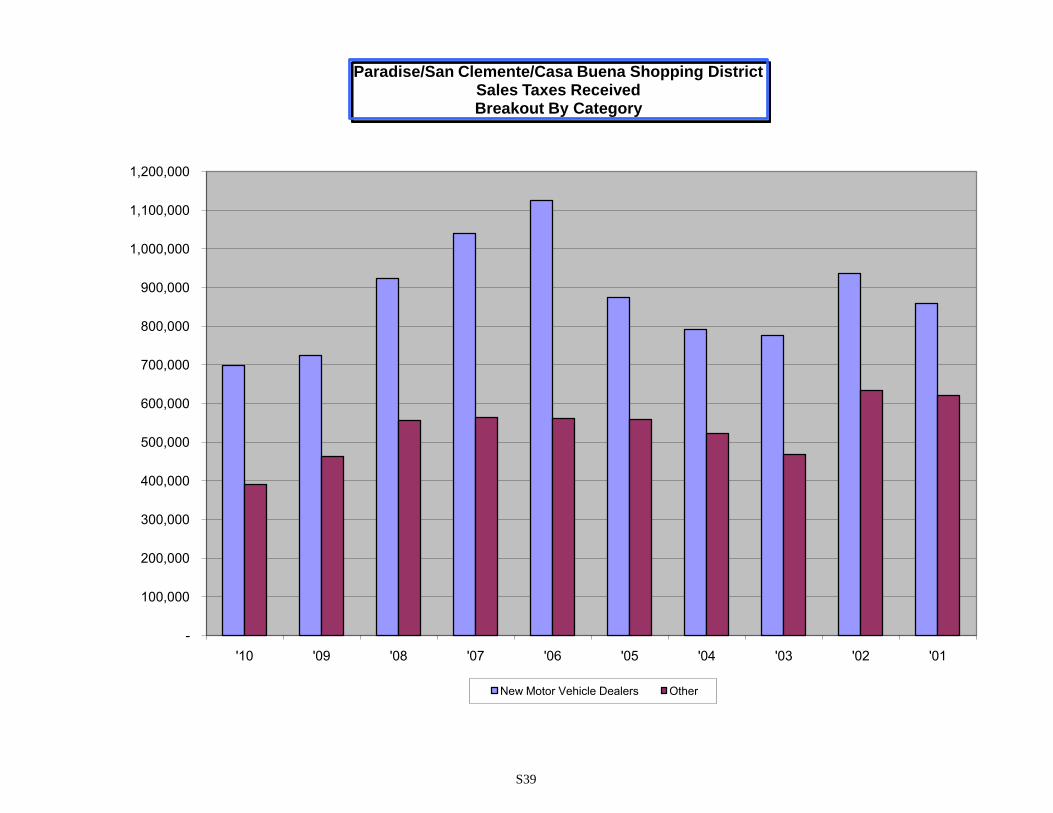
Paradise/San Clemente/Casa Buena Shopping DistrictSales Taxes ReceivedBreakout By Category
New Motor Vehicle Dealers Other
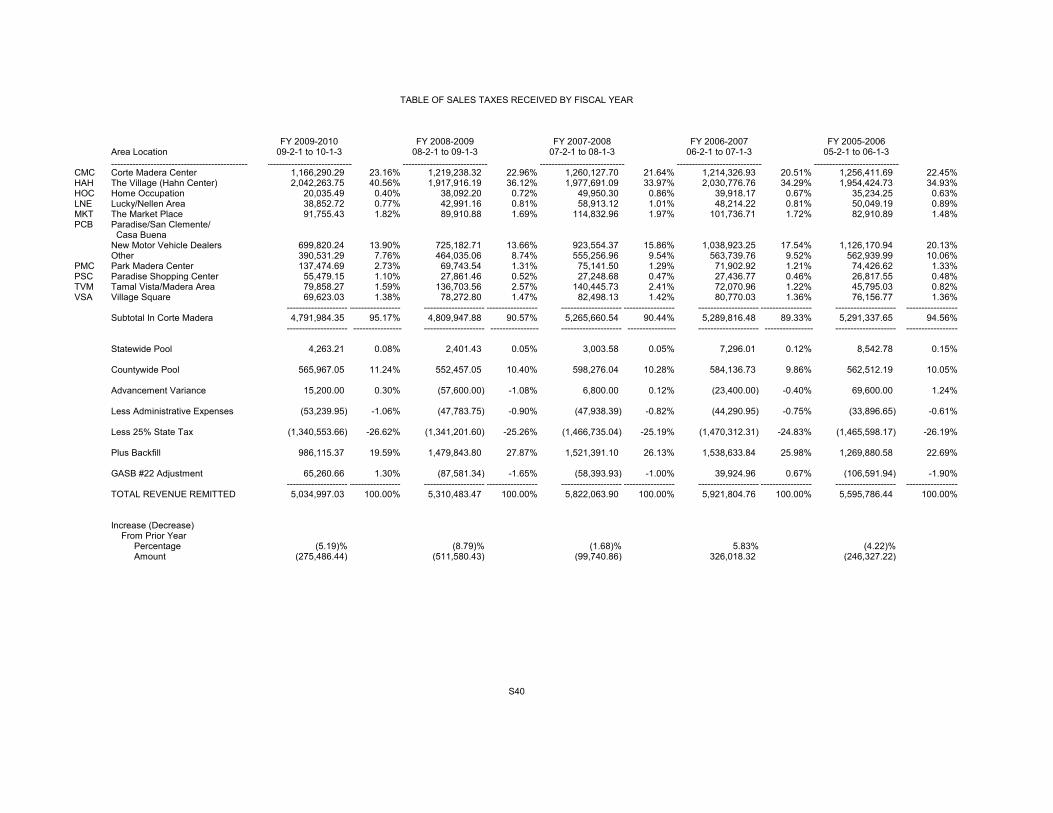
TABLE OF SALES TAXES RECEIVED BY FISCAL YEAR
FY 2009-2010 FY 2008-2009 FY 2007-2008 FY 2006-2007 FY 2005-2006Area Location 09-2-1 to 10-1-3 08-2-1 to 09-1-3 07-2-1 to 08-1-3 06-2-1 to 07-1-3 05-2-1 to 06-1-3
--------------------------------------------- ---------------------------- ---------------------------- ---------------------------- ---------------------------- ----------------------------CMC Corte Madera Center 1,166,290.29 23.16% 1,219,238.32 22.96% 1,260,127.70 21.64% 1,214,326.93 20.51% 1,256,411.69 22.45%HAH The Village (Hahn Center) 2,042,263.75 40.56% 1,917,916.19 36.12% 1,977,691.09 33.97% 2,030,776.76 34.29% 1,954,424.73 34.93%HOC Home Occupation 20,035.49 0.40% 38,092.20 0.72% 49,950.30 0.86% 39,918.17 0.67% 35,234.25 0.63%LNE Lucky/Nellen Area 38,852.72 0.77% 42,991.16 0.81% 58,913.12 1.01% 48,214.22 0.81% 50,049.19 0.89%MKT The Market Place 91,755.43 1.82% 89,910.88 1.69% 114,832.96 1.97% 101,736.71 1.72% 82,910.89 1.48%PCB Paradise/San Clemente/
Casa BuenaNew Motor Vehicle Dealers 699,820.24 13.90% 725,182.71 13.66% 923,554.37 15.86% 1,038,923.25 17.54% 1,126,170.94 20.13%Other 390,531.29 7.76% 464,035.06 8.74% 555,256.96 9.54% 563,739.76 9.52% 562,939.99 10.06%
PMC Park Madera Center 137,474.69 2.73% 69,743.54 1.31% 75,141.50 1.29% 71,902.92 1.21% 74,426.62 1.33%PSC Paradise Shopping Center 55,479.15 1.10% 27,861.46 0.52% 27,248.68 0.47% 27,436.77 0.46% 26,817.55 0.48%TVM Tamal Vista/Madera Area 79,858.27 1.59% 136,703.56 2.57% 140,445.73 2.41% 72,070.96 1.22% 45,795.03 0.82%VSA Village Square 69,623.03 1.38% 78,272.80 1.47% 82,498.13 1.42% 80,770.03 1.36% 76,156.77 1.36%
-------------------- ----------------- -------------------- ----------------- -------------------- ----------------- -------------------- ----------------- -------------------- -----------------Subtotal In Corte Madera 4,791,984.35 95.17% 4,809,947.88 90.57% 5,265,660.54 90.44% 5,289,816.48 89.33% 5,291,337.65 94.56%
-------------------- ----------------- -------------------- ----------------- -------------------- ----------------- -------------------- ----------------- -------------------- -----------------
Statewide Pool 4,263.21 0.08% 2,401.43 0.05% 3,003.58 0.05% 7,296.01 0.12% 8,542.78 0.15%
Countywide Pool 565,967.05 11.24% 552,457.05 10.40% 598,276.04 10.28% 584,136.73 9.86% 562,512.19 10.05%
Advancement Variance 15,200.00 0.30% (57,600.00) -1.08% 6,800.00 0.12% (23,400.00) -0.40% 69,600.00 1.24%
Less Administrative Expenses (53,239.95) -1.06% (47,783.75) -0.90% (47,938.39) -0.82% (44,290.95) -0.75% (33,896.65) -0.61%
Less 25% State Tax (1,340,553.66) -26.62% (1,341,201.60) -25.26% (1,466,735.04) -25.19% (1,470,312.31) -24.83% (1,465,598.17) -26.19%
Plus Backfill 986,115.37 19.59% 1,479,843.80 27.87% 1,521,391.10 26.13% 1,538,633.84 25.98% 1,269,880.58 22.69%
GASB #22 Adjustment 65,260.66 1.30% (87,581.34) -1.65% (58,393.93) -1.00% 39,924.96 0.67% (106,591.94) -1.90%-------------------- ----------------- -------------------- ----------------- -------------------- ----------------- -------------------- ----------------- -------------------- -----------------
TOTAL REVENUE REMITTED 5,034,997.03 100.00% 5,310,483.47 100.00% 5,822,063.90 100.00% 5,921,804.76 100.00% 5,595,786.44 100.00%
Increase (Decrease) From Prior Year Percentage (5.19)% (8.79)% (1.68)% 5.83% (4.22)% Amount (275,486.44) (511,580.43) (99,740.86) 326,018.32 (246,327.22)
S40
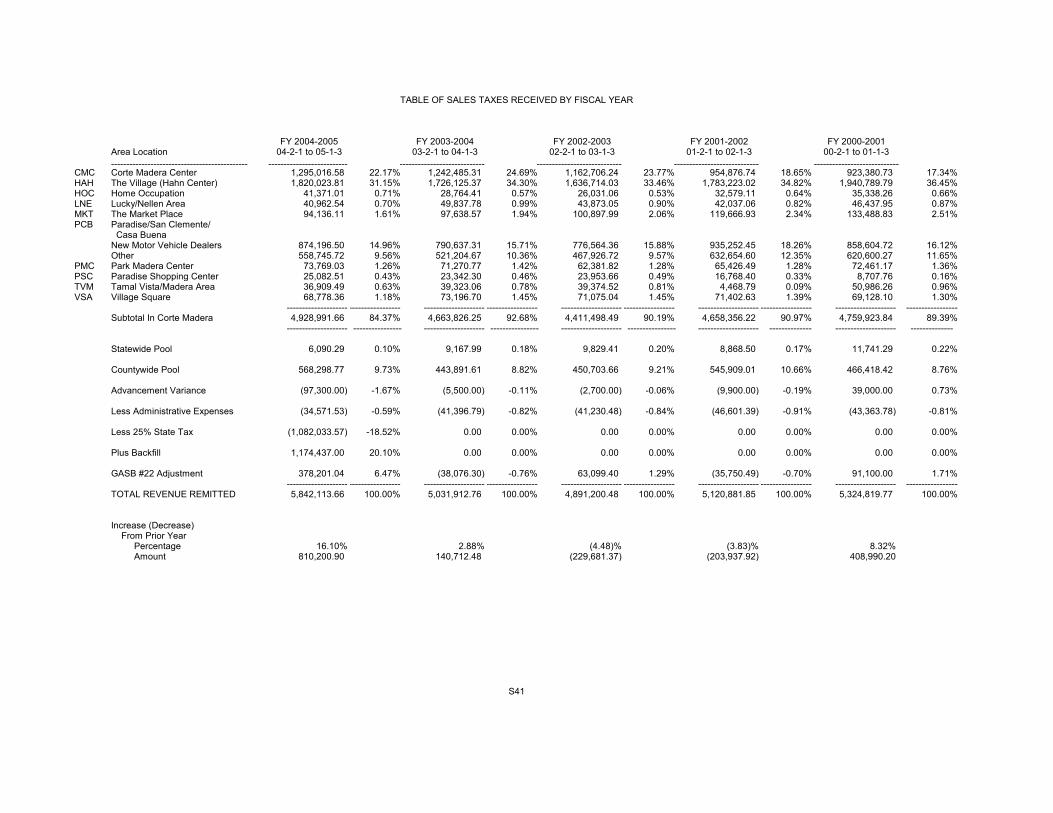
TABLE OF SALES TAXES RECEIVED BY FISCAL YEAR
FY 2004-2005 FY 2003-2004 FY 2002-2003 FY 2001-2002 FY 2000-2001Area Location 04-2-1 to 05-1-3 03-2-1 to 04-1-3 02-2-1 to 03-1-3 01-2-1 to 02-1-3 00-2-1 to 01-1-3
--------------------------------------------- ---------------------------- ---------------------------- ---------------------------- ---------------------------- ----------------------------CMC Corte Madera Center 1,295,016.58 22.17% 1,242,485.31 24.69% 1,162,706.24 23.77% 954,876.74 18.65% 923,380.73 17.34%HAH The Village (Hahn Center) 1,820,023.81 31.15% 1,726,125.37 34.30% 1,636,714.03 33.46% 1,783,223.02 34.82% 1,940,789.79 36.45%HOC Home Occupation 41,371.01 0.71% 28,764.41 0.57% 26,031.06 0.53% 32,579.11 0.64% 35,338.26 0.66%LNE Lucky/Nellen Area 40,962.54 0.70% 49,837.78 0.99% 43,873.05 0.90% 42,037.06 0.82% 46,437.95 0.87%MKT The Market Place 94,136.11 1.61% 97,638.57 1.94% 100,897.99 2.06% 119,666.93 2.34% 133,488.83 2.51%PCB Paradise/San Clemente/
Casa BuenaNew Motor Vehicle Dealers 874,196.50 14.96% 790,637.31 15.71% 776,564.36 15.88% 935,252.45 18.26% 858,604.72 16.12%Other 558,745.72 9.56% 521,204.67 10.36% 467,926.72 9.57% 632,654.60 12.35% 620,600.27 11.65%
PMC Park Madera Center 73,769.03 1.26% 71,270.77 1.42% 62,381.82 1.28% 65,426.49 1.28% 72,461.17 1.36%PSC Paradise Shopping Center 25,082.51 0.43% 23,342.30 0.46% 23,953.66 0.49% 16,768.40 0.33% 8,707.76 0.16%TVM Tamal Vista/Madera Area 36,909.49 0.63% 39,323.06 0.78% 39,374.52 0.81% 4,468.79 0.09% 50,986.26 0.96%VSA Village Square 68,778.36 1.18% 73,196.70 1.45% 71,075.04 1.45% 71,402.63 1.39% 69,128.10 1.30%
-------------------- ----------------- -------------------- ----------------- -------------------- ----------------- -------------------- ----------------- -------------------- -----------------Subtotal In Corte Madera 4,928,991.66 84.37% 4,663,826.25 92.68% 4,411,498.49 90.19% 4,658,356.22 90.97% 4,759,923.84 89.39%
-------------------- ----------------- -------------------- ----------------- -------------------- ----------------- -------------------- -------------- -------------------- --------------
Statewide Pool 6,090.29 0.10% 9,167.99 0.18% 9,829.41 0.20% 8,868.50 0.17% 11,741.29 0.22%
Countywide Pool 568,298.77 9.73% 443,891.61 8.82% 450,703.66 9.21% 545,909.01 10.66% 466,418.42 8.76%
Advancement Variance (97,300.00) -1.67% (5,500.00) -0.11% (2,700.00) -0.06% (9,900.00) -0.19% 39,000.00 0.73%
Less Administrative Expenses (34,571.53) -0.59% (41,396.79) -0.82% (41,230.48) -0.84% (46,601.39) -0.91% (43,363.78) -0.81%
Less 25% State Tax (1,082,033.57) -18.52% 0.00 0.00% 0.00 0.00% 0.00 0.00% 0.00 0.00%
Plus Backfill 1,174,437.00 20.10% 0.00 0.00% 0.00 0.00% 0.00 0.00% 0.00 0.00%
GASB #22 Adjustment 378,201.04 6.47% (38,076.30) -0.76% 63,099.40 1.29% (35,750.49) -0.70% 91,100.00 1.71%-------------------- ----------------- -------------------- ----------------- -------------------- ----------------- -------------------- ----------------- -------------------- -----------------
TOTAL REVENUE REMITTED 5,842,113.66 100.00% 5,031,912.76 100.00% 4,891,200.48 100.00% 5,120,881.85 100.00% 5,324,819.77 100.00%
Increase (Decrease) From Prior Year Percentage 16.10% 2.88% (4.48)% (3.83)% 8.32% Amount 810,200.90 140,712.48 (229,681.37) (203,937.92) 408,990.20
S41
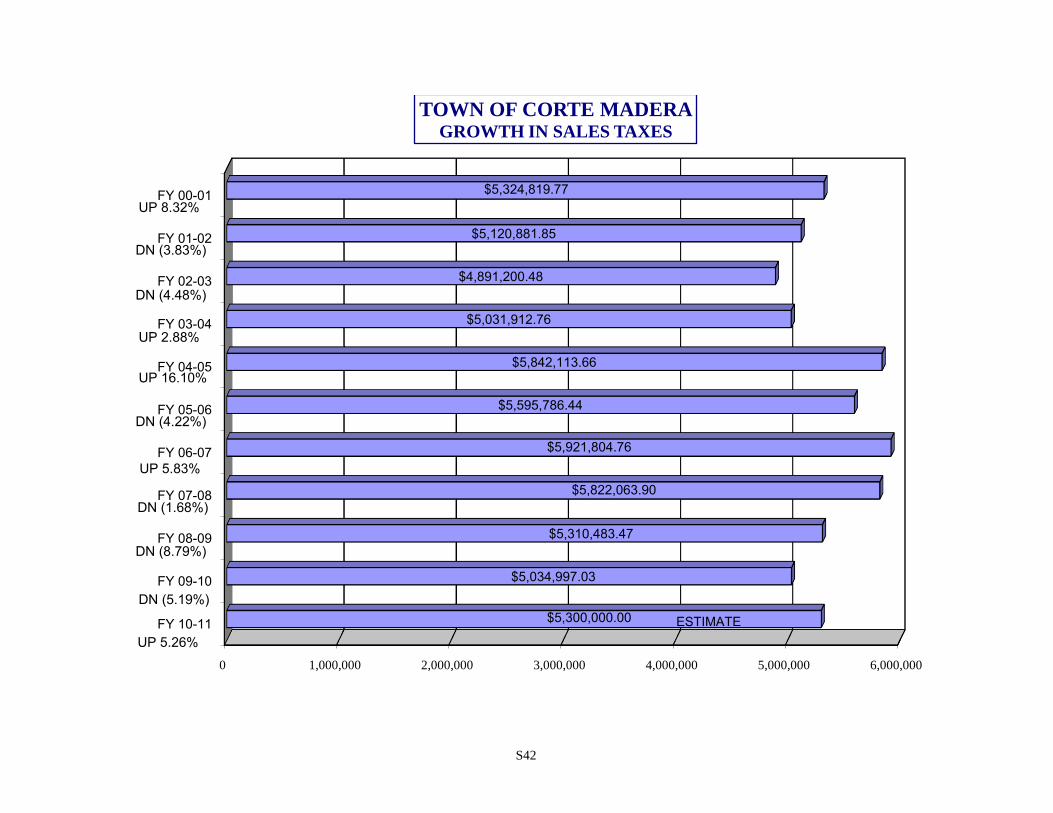
S42
0 1,000,000 2,000,000 3,000,000 4,000,000 5,000,000 6,000,000
FY 10-11
FY 09-10
FY 08-09
FY 07-08
FY 06-07
FY 05-06
FY 04-05
FY 03-04
FY 02-03
FY 01-02
FY 00-01
$5,300,000.00
$5,034,997.03
$5,310,483.47
$5,822,063.90
$5,921,804.76
$5,595,786.44
$5,842,113.66
$5,031,912.76
$4,891,200.48
$5,120,881.85
$5,324,819.77
TOWN OF CORTE MADERAGROWTH IN SALES TAXES
ESTIMATE
DN (5.19%)
UP 5.26%
UP 8.32%
DN (3.83%)
DN (4.48%)
UP 2.88%
UP 16.10%
DN (4.22%)
UP 5.83%
DN (1.68%)
DN (8.79%)
BLANK PAGE
2011-12Budget\Charts-Graphs.xls S43
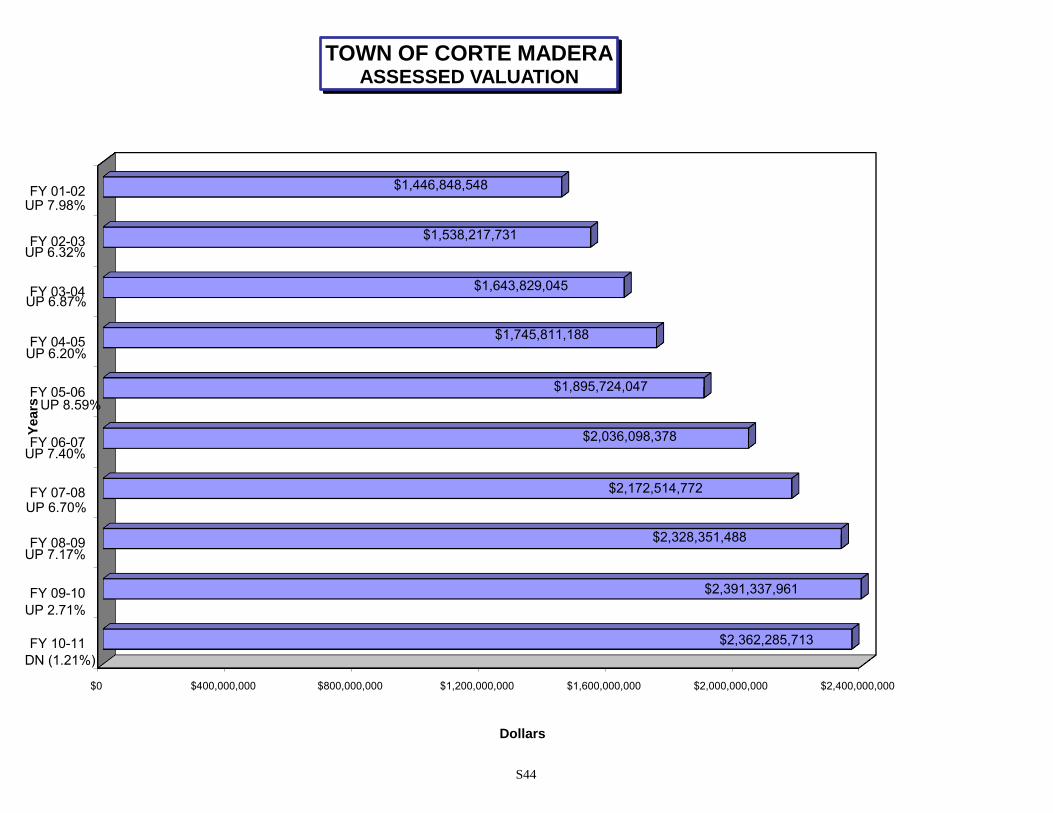
S44
$0 $400,000,000 $800,000,000 $1,200,000,000 $1,600,000,000 $2,000,000,000 $2,400,000,000
FY 10-11
FY 09-10
FY 08-09
FY 07-08
FY 06-07
FY 05-06
FY 04-05
FY 03-04
FY 02-03
FY 01-02
$2,362,285,713
$2,391,337,961
$2,328,351,488
$2,172,514,772
$2,036,098,378
$1,895,724,047
$1,745,811,188
$1,643,829,045
$1,538,217,731
$1,446,848,548
Dollars
Years
TOWN OF CORTE MADERAASSESSED VALUATION
UP 7.17%
UP 2.71%
DN (1.21%)
UP 7.98%
UP 6.32%
UP 6.87%
UP 6.20%
UP 8.59%
UP 7.40%
UP 6.70%
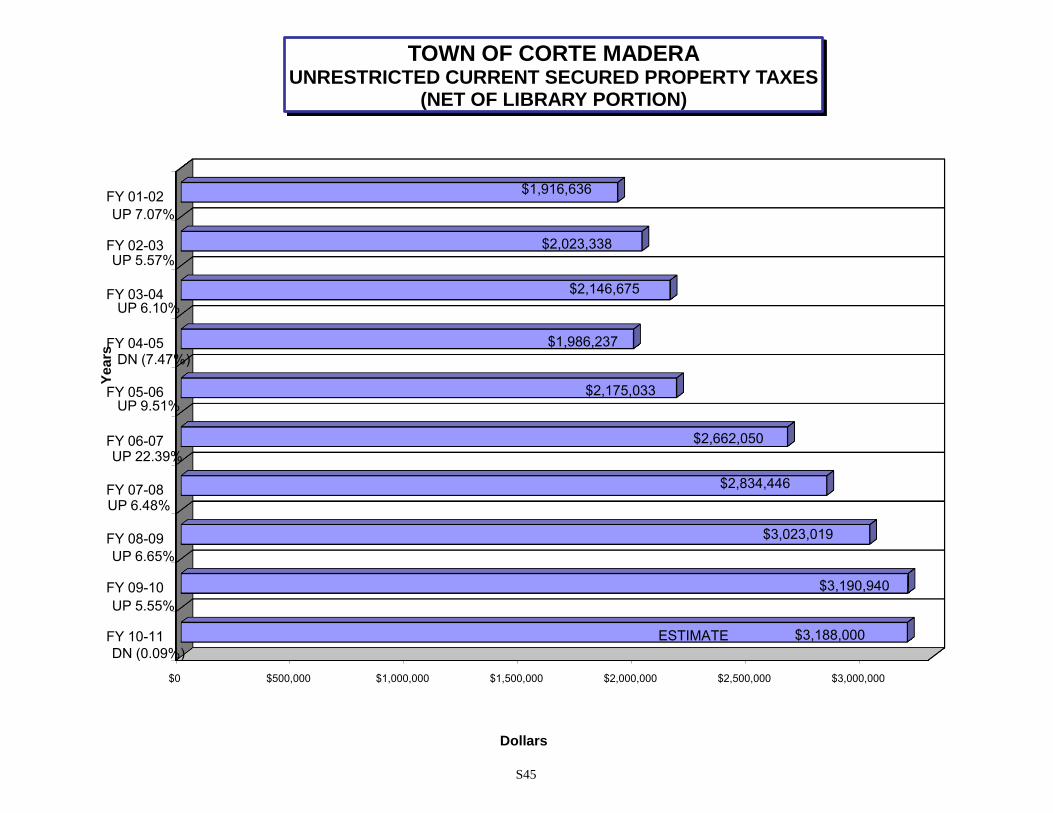
S45
$0 $500,000 $1,000,000 $1,500,000 $2,000,000 $2,500,000 $3,000,000
FY 10-11
FY 09-10
FY 08-09
FY 07-08
FY 06-07
FY 05-06
FY 04-05
FY 03-04
FY 02-03
FY 01-02
$3,188,000
$3,190,940
$3,023,019
$2,834,446
$2,662,050
$2,175,033
$1,986,237
$2,146,675
$2,023,338
$1,916,636
Dollars
Ye
ars
TOWN OF CORTE MADERAUNRESTRICTED CURRENT SECURED PROPERTY TAXES
(NET OF LIBRARY PORTION)
ESTIMATE
UP 6.65%
UP 5.55%
DN (0.09%)
UP 7.07%
UP 5.57%
UP 6.10%
DN (7.47%)
UP 9.51%
UP 22.39%
UP 6.48%

BLANK PAGE
2011-12Budget\Charts-Graphs.xls S46
BLANK PAGE
2011-12Budget\Charts-Graphs.xls S47
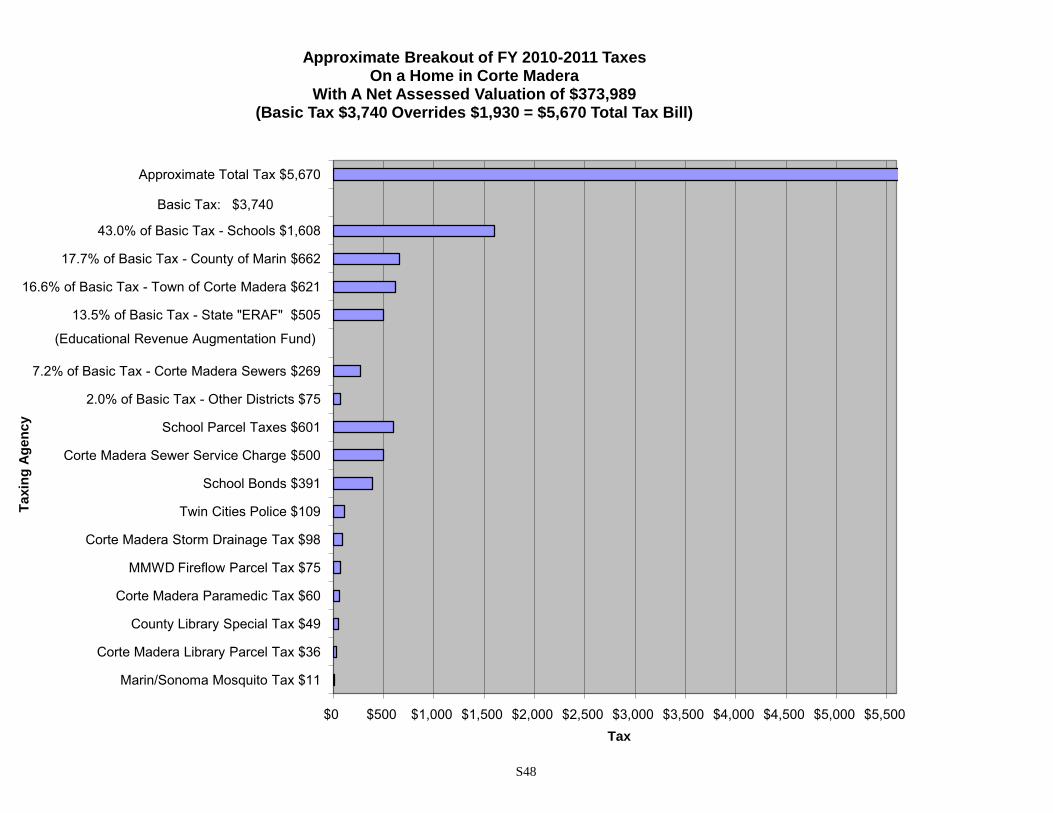
S48
$0 $500 $1,000 $1,500 $2,000 $2,500 $3,000 $3,500 $4,000 $4,500 $5,000 $5,500
Marin/Sonoma Mosquito Tax $11
Corte Madera Library Parcel Tax $36
County Library Special Tax $49
Corte Madera Paramedic Tax $60
MMWD Fireflow Parcel Tax $75
Corte Madera Storm Drainage Tax $98
Twin Cities Police $109
School Bonds $391
Corte Madera Sewer Service Charge $500
School Parcel Taxes $601
2.0% of Basic Tax - Other Districts $75
7.2% of Basic Tax - Corte Madera Sewers $269
13.5% of Basic Tax - State "ERAF" $505
16.6% of Basic Tax - Town of Corte Madera $621
17.7% of Basic Tax - County of Marin $662
43.0% of Basic Tax - Schools $1,608
Approximate Total Tax $5,670
Tax
Ta
xin
g A
ge
ncy
Approximate Breakout of FY 2010-2011 TaxesOn a Home in Corte Madera
With A Net Assessed Valuation of $373,989(Basic Tax $3,740 Overrides $1,930 = $5,670 Total Tax Bill)
Basic Tax: $3,740
(Educational Revenue Augmentation Fund)
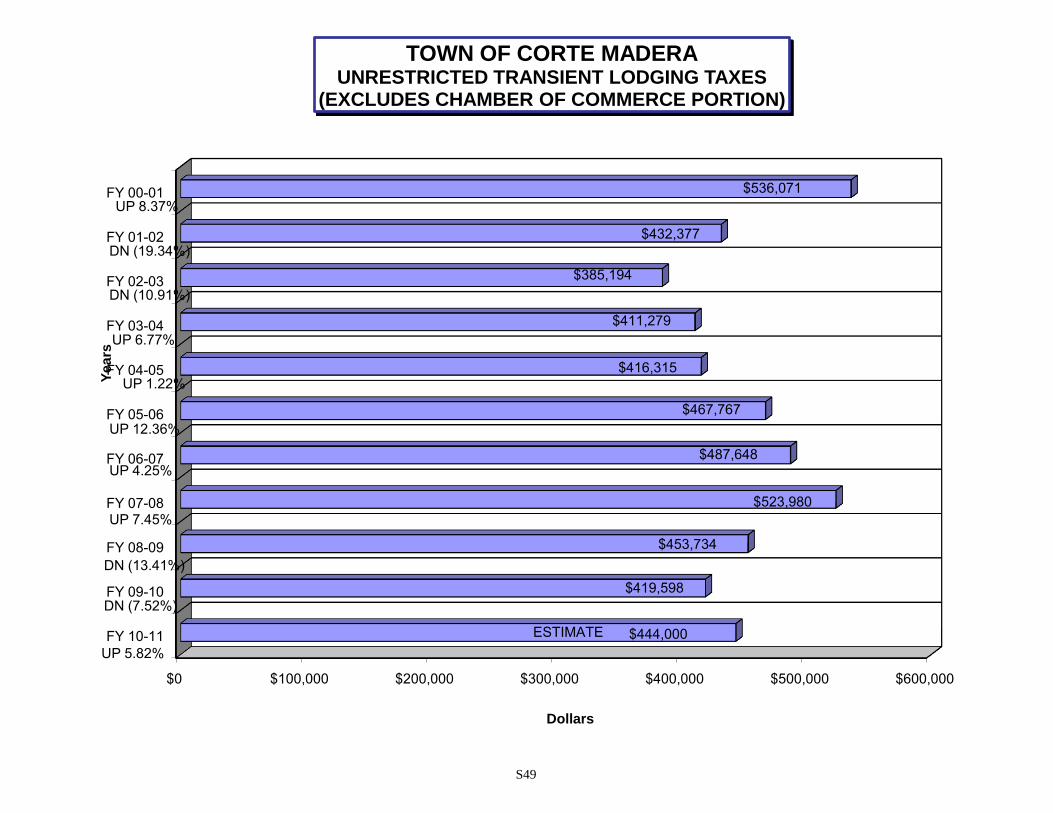
S49
$0 $100,000 $200,000 $300,000 $400,000 $500,000 $600,000
FY 10-11
FY 09-10
FY 08-09
FY 07-08
FY 06-07
FY 05-06
FY 04-05
FY 03-04
FY 02-03
FY 01-02
FY 00-01
$444,000
$419,598
$453,734
$523,980
$487,648
$467,767
$416,315
$411,279
$385,194
$432,377
$536,071
Dollars
Ye
ars
TOWN OF CORTE MADERAUNRESTRICTED TRANSIENT LODGING TAXES
(EXCLUDES CHAMBER OF COMMERCE PORTION)
DN (7.52%)
UP 5.82%
DN (19.34%)
DN (10.91%)
UP 6.77%
UP 1.22%
UP 12.36%
UP 4.25%
UP 7.45%
DN (13.41%)
ESTIMATE
UP 8.37%

BLANK PAGE
2011-12Budget\Charts-Graphs.xls S50
BLANK PAGE
2011-12Budget\Charts-Graphs.xls S51
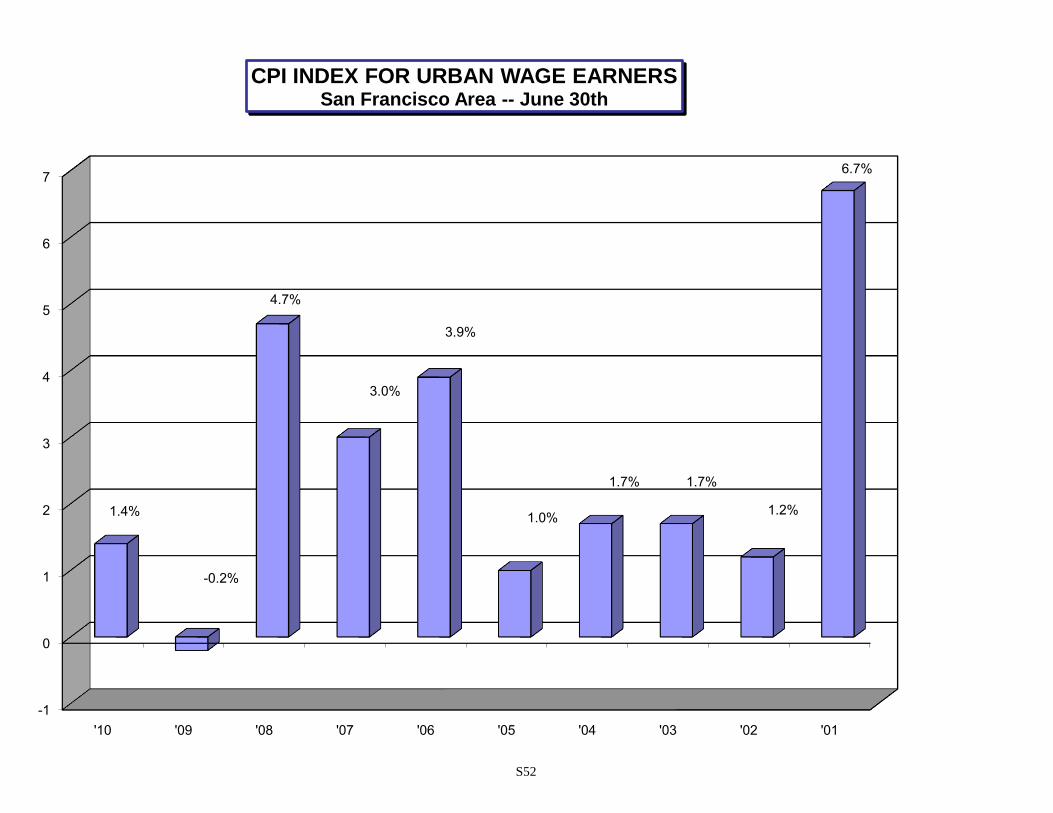
S52
-1
0
1
2
3
4
5
6
7
'10 '09 '08 '07 '06 '05 '04 '03 '02 '01
CPI INDEX FOR URBAN WAGE EARNERSSan Francisco Area -- June 30th
3.0%
3.9%
1.0%
1.7% 1.7%
1.2%
6.7%
1.4%
-0.2%
4.7%
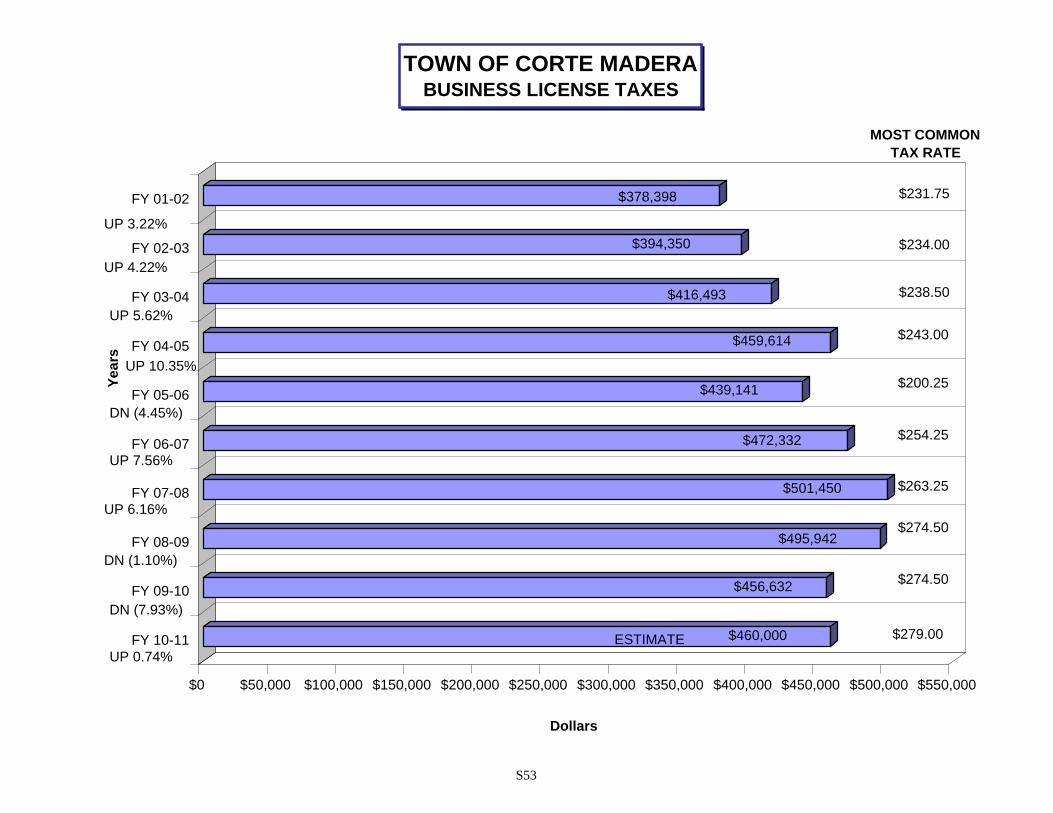
S53
$460,000
$456,632
$495,942
$501,450
$472,332
$439,141
$459,614
$416,493
$394,350
$378,398
$0 $50,000 $100,000 $150,000 $200,000 $250,000 $300,000 $350,000 $400,000 $450,000 $500,000 $550,000
Dollars
FY 10-11
FY 09-10
FY 08-09
FY 07-08
FY 06-07
FY 05-06
FY 04-05
FY 03-04
FY 02-03
FY 01-02
Year
s
TOWN OF CORTE MADERABUSINESS LICENSE TAXES
ESTIMATE
DN (1.10%)
MOST COMMONTAX RATE
$274.50
$279.00
$231.75
$234.00
$238.50
$243.00
$200.25
$254.25
$263.25
DN (7.93%)
$274.50
UP 0.74%
UP 3.22%
UP 4.22%
UP 5.62%
UP 10.35%
DN (4.45%)
UP 7.56%
UP 6.16%

BLANK PAGE
2011-12Budget\Charts-Graphs.xls S54
BLANK PAGE
2011-12Budget\Charts-Graphs.xls S55
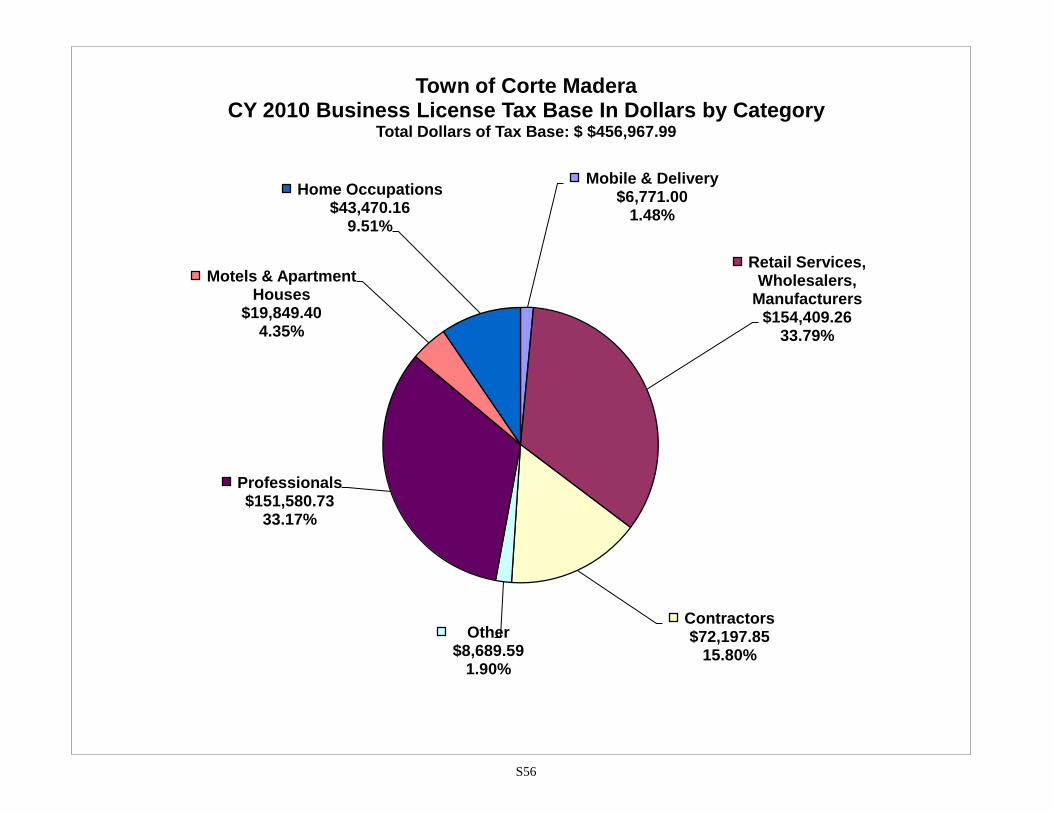
S56
Mobile & Delivery$6,771.00
1.48%
Retail Services, Wholesalers,
Manufacturers$154,409.26
33.79%
Contractors$72,197.85
15.80%
Other$8,689.59
1.90%
Professionals$151,580.73
33.17%
Motels & Apartment Houses
$19,849.404.35%
Home Occupations$43,470.16
9.51%
Town of Corte Madera CY 2010 Business License Tax Base In Dollars by Category
Total Dollars of Tax Base: $ $456,967.99
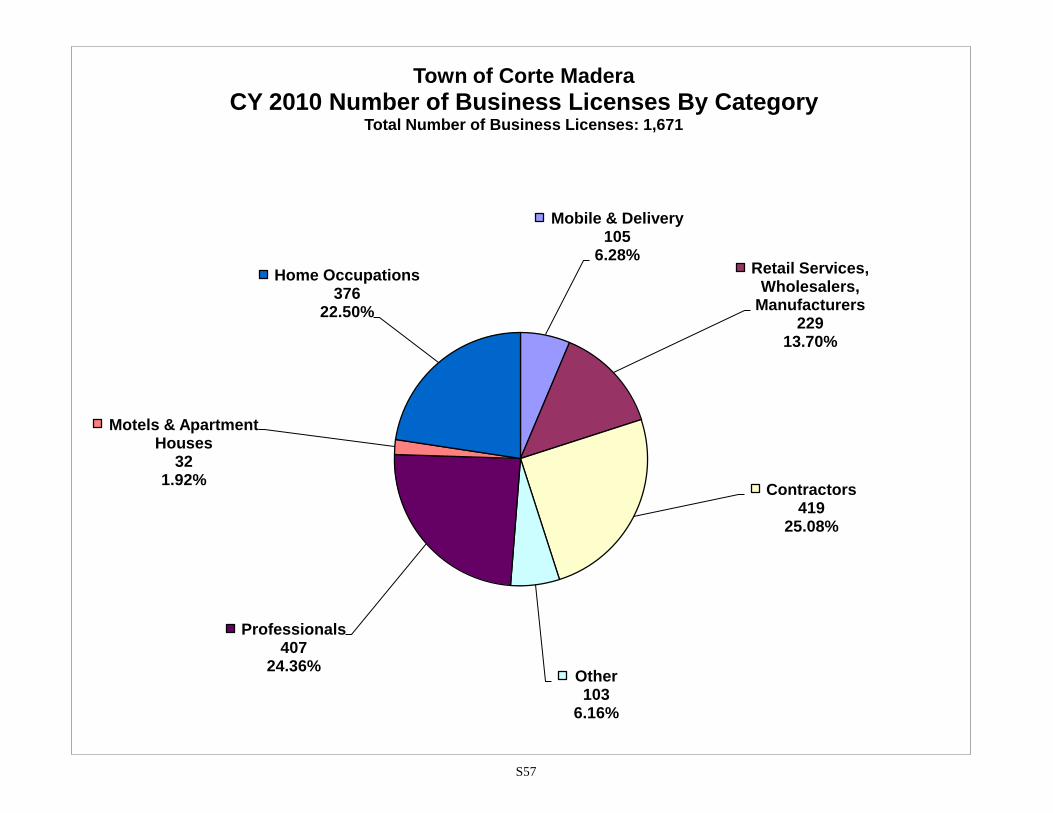
S57
Mobile & Delivery105
6.28%Retail Services,
Wholesalers, Manufacturers
22913.70%
Contractors419
25.08%
Other103
6.16%
Professionals407
24.36%
Motels & Apartment Houses
321.92%
Home Occupations376
22.50%
Town of Corte Madera
CY 2010 Number of Business Licenses By CategoryTotal Number of Business Licenses: 1,671

BLANK PAGE
2011-12Budget\Charts-Graphs.xls S58
BLANK PAGE
2011-12Budget\Charts-Graphs.xls S59
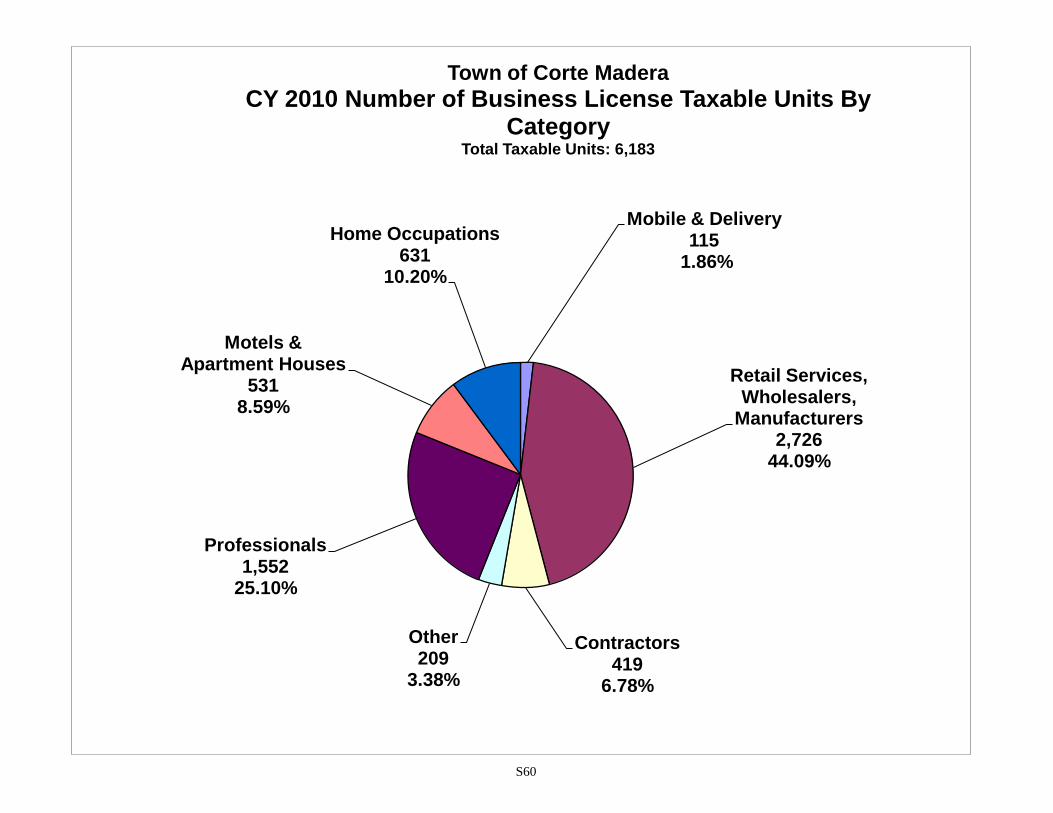
S60
Mobile & Delivery 115
1.86%
Retail Services, Wholesalers,
Manufacturers2,726
44.09%
Contractors419
6.78%
Other209
3.38%
Professionals1,552
25.10%
Motels & Apartment Houses
5318.59%
Home Occupations 631
10.20%
Town of Corte Madera
CY 2010 Number of Business License Taxable Units By Category
Total Taxable Units: 6,183
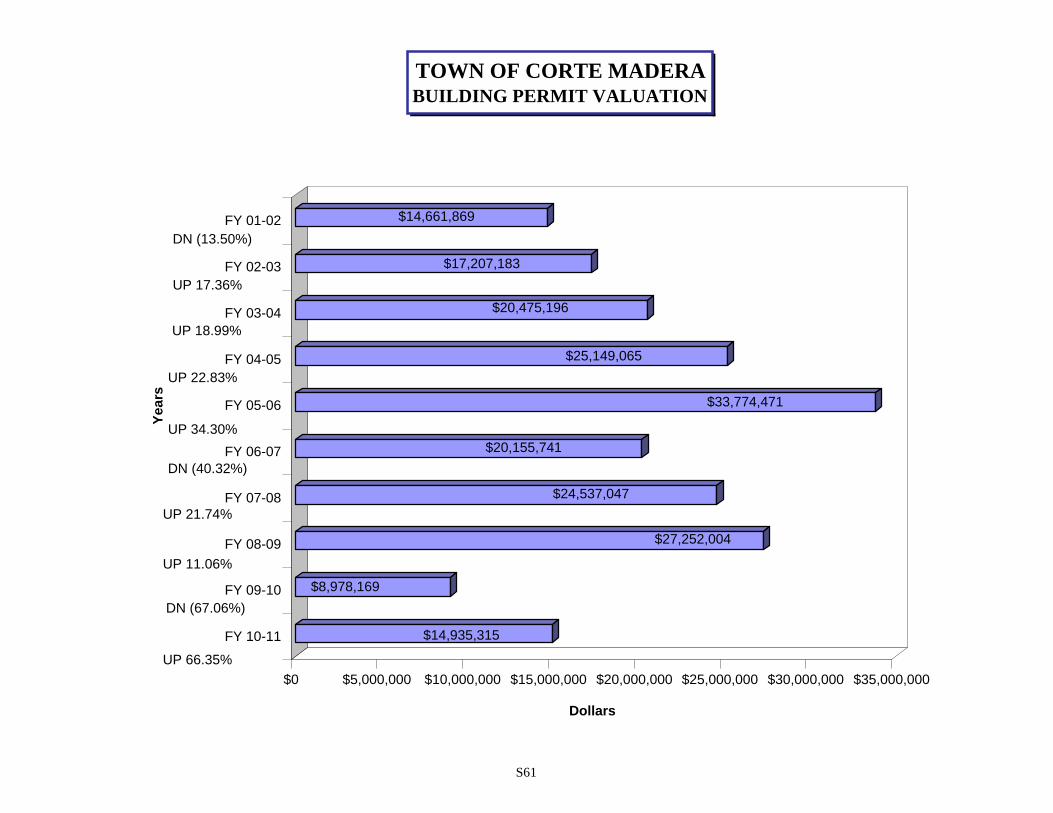
S61
$14,935,315
$8,978,169
$27,252,004
$24,537,047
$20,155,741
$33,774,471
$25,149,065
$20,475,196
$17,207,183
$14,661,869
$0 $5,000,000 $10,000,000 $15,000,000 $20,000,000 $25,000,000 $30,000,000 $35,000,000
Dollars
FY 10-11
FY 09-10
FY 08-09
FY 07-08
FY 06-07
FY 05-06
FY 04-05
FY 03-04
FY 02-03
FY 01-02
Year
s
TOWN OF CORTE MADERABUILDING PERMIT VALUATION
UP 66.35%
DN (13.50%)
UP 17.36%
UP 18.99%
UP 22.83%
UP 21.74%
UP 11.06%
DN (67.06%)
DN (40.32%)
UP 34.30%

BLANK PAGE
2011-12Budget\Charts-Graphs.xls S62
FORECASTING MODEL
2011-12Budget\tablerec.xls FM1
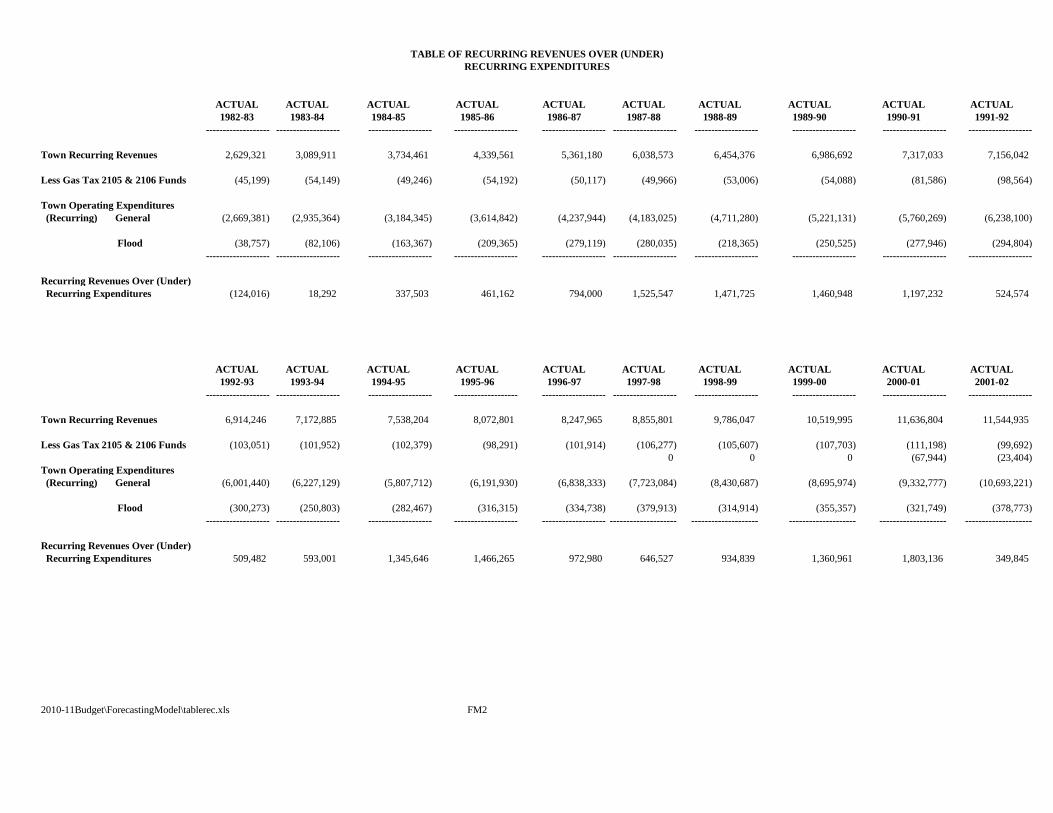
TABLE OF RECURRING REVENUES OVER (UNDER)
RECURRING EXPENDITURES
ACTUAL ACTUAL ACTUAL ACTUAL ACTUAL ACTUAL ACTUAL ACTUAL ACTUAL ACTUAL
1982-83 1983-84 1984-85 1985-86 1986-87 1987-88 1988-89 1989-90 1990-91 1991-92
------------------- ------------------- ------------------- ------------------- ------------------- ------------------- ------------------- ------------------- ------------------- -------------------
Town Recurring Revenues 2,629,321 3,089,911 3,734,461 4,339,561 5,361,180 6,038,573 6,454,376 6,986,692 7,317,033 7,156,042
Less Gas Tax 2105 & 2106 Funds (45,199) (54,149) (49,246) (54,192) (50,117) (49,966) (53,006) (54,088) (81,586) (98,564)
Town Operating Expenditures
(Recurring) General (2,669,381) (2,935,364) (3,184,345) (3,614,842) (4,237,944) (4,183,025) (4,711,280) (5,221,131) (5,760,269) (6,238,100)
Flood (38,757) (82,106) (163,367) (209,365) (279,119) (280,035) (218,365) (250,525) (277,946) (294,804)
------------------- ------------------- ------------------- ------------------- ------------------- ------------------- ------------------- ------------------- ------------------- -------------------
Recurring Revenues Over (Under)
Recurring Expenditures (124,016) 18,292 337,503 461,162 794,000 1,525,547 1,471,725 1,460,948 1,197,232 524,574
ACTUAL ACTUAL ACTUAL ACTUAL ACTUAL ACTUAL ACTUAL ACTUAL ACTUAL ACTUAL
1992-93 1993-94 1994-95 1995-96 1996-97 1997-98 1998-99 1999-00 2000-01 2001-02
------------------- ------------------- ------------------- ------------------- ------------------- ------------------- ------------------- ------------------- ------------------- -------------------
Town Recurring Revenues 6,914,246 7,172,885 7,538,204 8,072,801 8,247,965 8,855,801 9,786,047 10,519,995 11,636,804 11,544,935
Less Gas Tax 2105 & 2106 Funds (103,051) (101,952) (102,379) (98,291) (101,914) (106,277) (105,607) (107,703) (111,198) (99,692)
0 0 0 (67,944) (23,404)
Town Operating Expenditures
(Recurring) General (6,001,440) (6,227,129) (5,807,712) (6,191,930) (6,838,333) (7,723,084) (8,430,687) (8,695,974) (9,332,777) (10,693,221)
Flood (300,273) (250,803) (282,467) (316,315) (334,738) (379,913) (314,914) (355,357) (321,749) (378,773)
------------------- ------------------- ------------------- ------------------- ------------------- -------------------- -------------------- -------------------- -------------------- --------------------
Recurring Revenues Over (Under)
Recurring Expenditures 509,482 593,001 1,345,646 1,466,265 972,980 646,527 934,839 1,360,961 1,803,136 349,845
2010-11Budget\ForecastingModel\tablerec.xls FM2
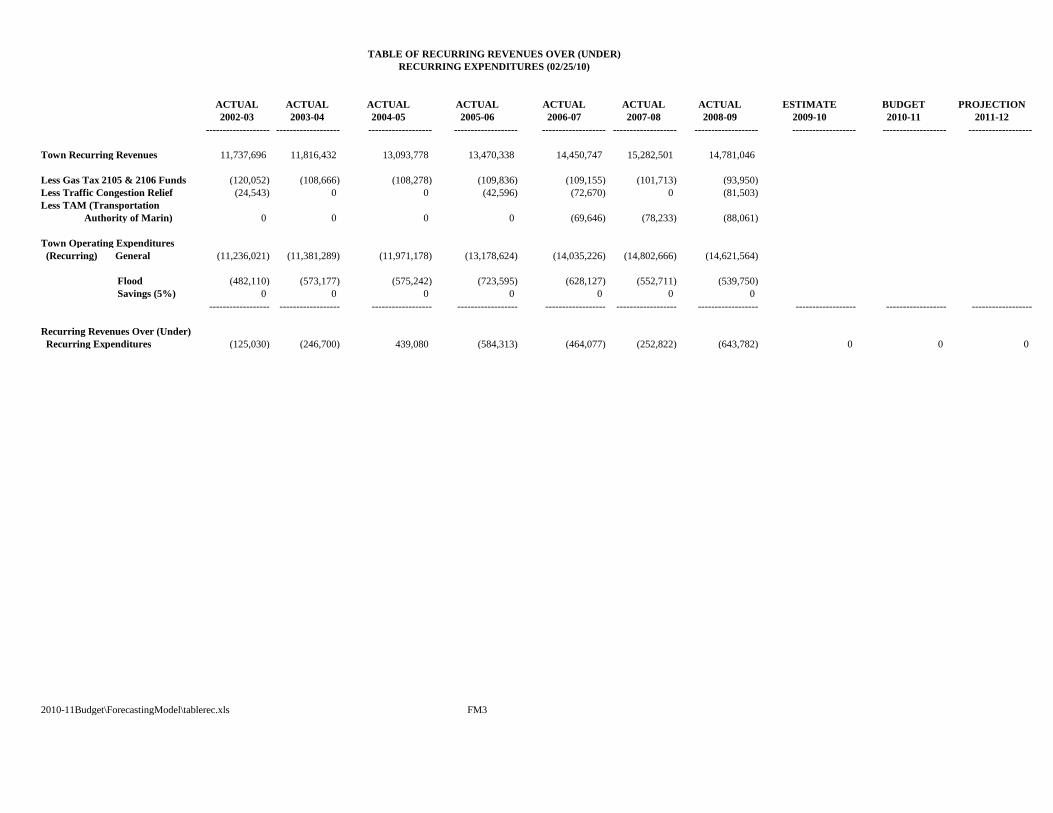
TABLE OF RECURRING REVENUES OVER (UNDER)
RECURRING EXPENDITURES (02/25/10)
ACTUAL ACTUAL ACTUAL ACTUAL ACTUAL ACTUAL ACTUAL ESTIMATE BUDGET PROJECTION
2002-03 2003-04 2004-05 2005-06 2006-07 2007-08 2008-09 2009-10 2010-11 2011-12
------------------- ------------------- ------------------- ------------------- ------------------- ------------------- ------------------- ------------------- ------------------- -------------------
Town Recurring Revenues 11,737,696 11,816,432 13,093,778 13,470,338 14,450,747 15,282,501 14,781,046
Less Gas Tax 2105 & 2106 Funds (120,052) (108,666) (108,278) (109,836) (109,155) (101,713) (93,950)
Less Traffic Congestion Relief (24,543) 0 0 (42,596) (72,670) 0 (81,503)
Less TAM (Transportation
Authority of Marin) 0 0 0 0 (69,646) (78,233) (88,061)
Town Operating Expenditures
(Recurring) General (11,236,021) (11,381,289) (11,971,178) (13,178,624) (14,035,226) (14,802,666) (14,621,564)
Flood (482,110) (573,177) (575,242) (723,595) (628,127) (552,711) (539,750)
Savings (5%) 0 0 0 0 0 0 0
------------------ ------------------ ------------------ ------------------ ------------------ ------------------ ------------------ ------------------ ------------------ ------------------
Recurring Revenues Over (Under)
Recurring Expenditures (125,030) (246,700) 439,080 (584,313) (464,077) (252,822) (643,782) 0 0 0
2010-11Budget\ForecastingModel\tablerec.xls FM3
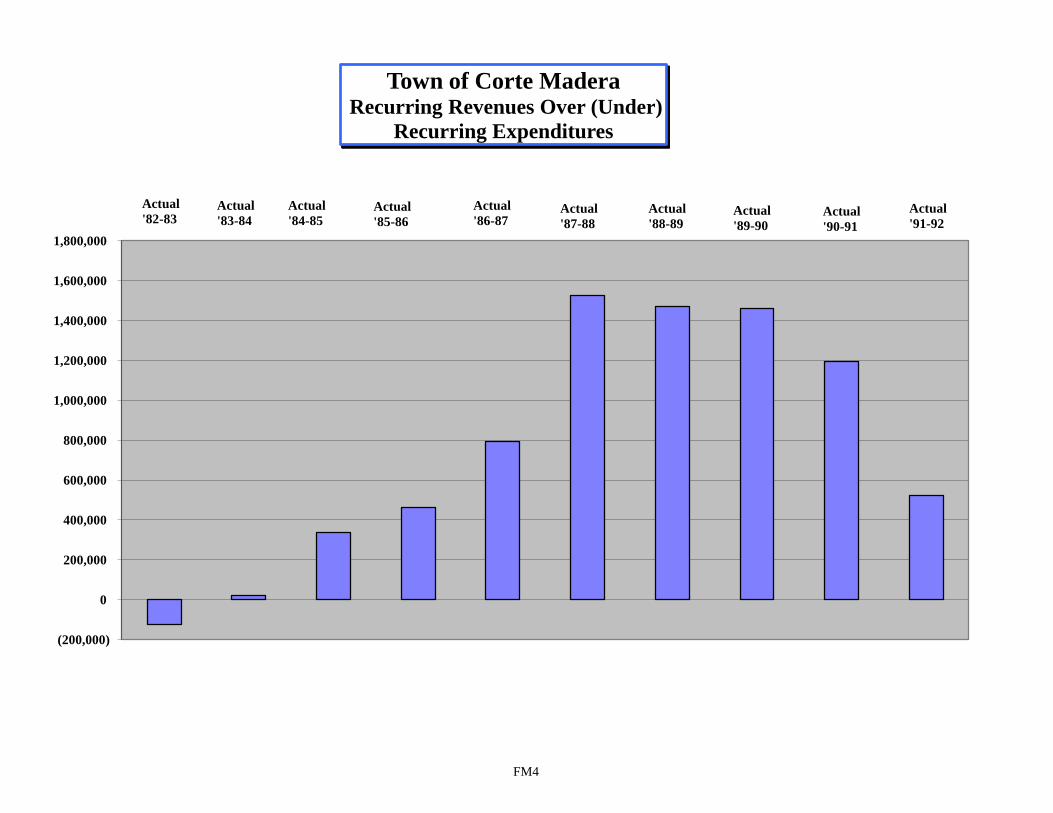
(200,000)
0
200,000
400,000
600,000
800,000
1,000,000
1,200,000
1,400,000
1,600,000
1,800,000
Town of Corte MaderaRecurring Revenues Over (Under)
Recurring Expenditures
Actual
'82-83Actual
'83-84
Actual
'84-85Actual
'85-86
Actual
'86-87Actual
'87-88
Actual
'88-89Actual
'89-90Actual
'90-91
Actual
'91-92
FM4
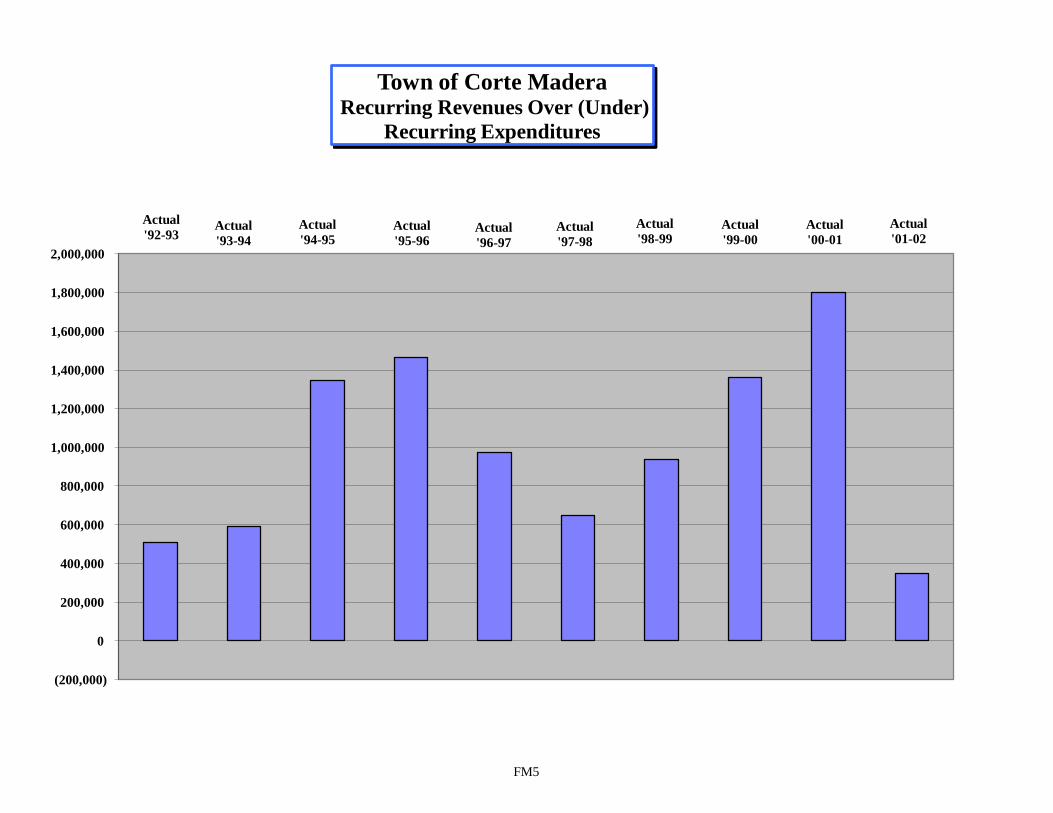
(200,000)
0
200,000
400,000
600,000
800,000
1,000,000
1,200,000
1,400,000
1,600,000
1,800,000
2,000,000
Town of Corte MaderaRecurring Revenues Over (Under)
Recurring Expenditures
Actual
'92-93Actual
'93-94
Actual
'94-95Actual
'95-96Actual
'96-97
Actual
'97-98
Actual
'98-99Actual
'99-00
Actual
'00-01
Actual
'01-02
FM5

BLANK PAGE
2011-12Budget\tablerec.xls FM6
BLANK PAGE
2011-12Budget\Excel\tablerec.xls FM7
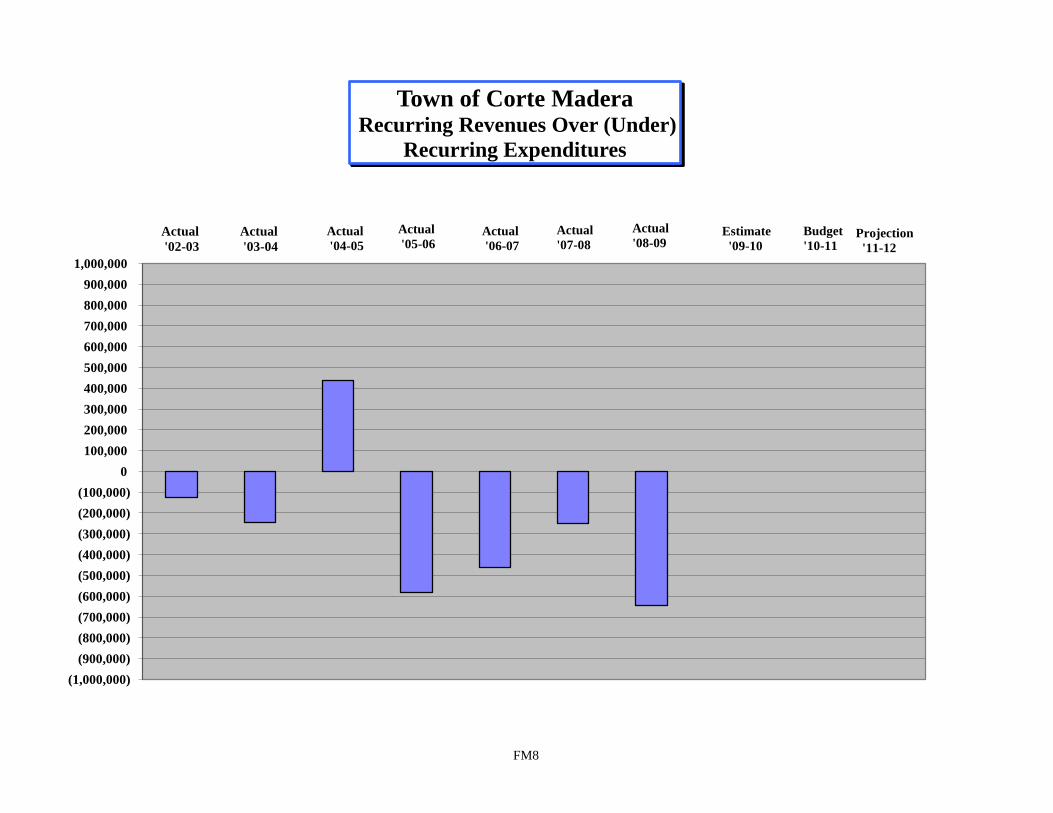
(1,000,000)
(900,000)
(800,000)
(700,000)
(600,000)
(500,000)
(400,000)
(300,000)
(200,000)
(100,000)
0
100,000
200,000
300,000
400,000
500,000
600,000
700,000
800,000
900,000
1,000,000
Town of Corte MaderaRecurring Revenues Over (Under)
Recurring Expenditures
Actual
'03-04
Actual
'02-03
Actual
'04-05
Actual
'05-06Actual
'07-08Actual
'06-07
Actual
'08-09Estimate
'09-10
Budget
'10-11Projection
'11-12
FM8
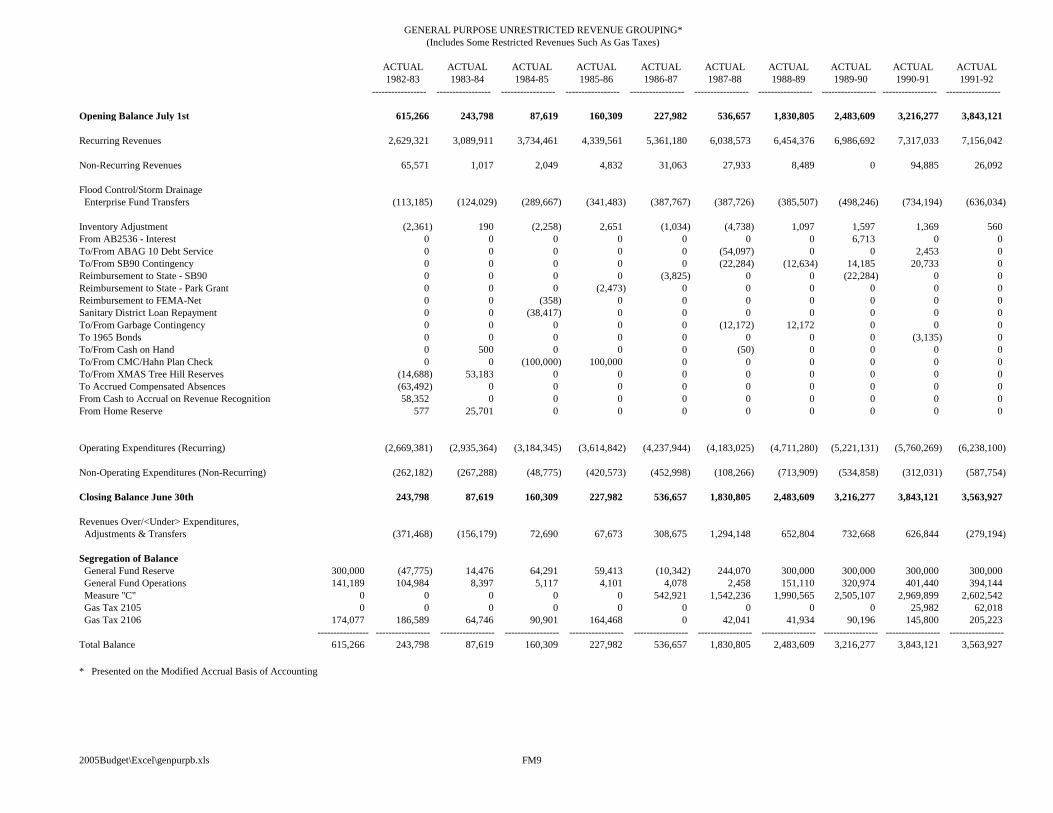
GENERAL PURPOSE UNRESTRICTED REVENUE GROUPING*
(Includes Some Restricted Revenues Such As Gas Taxes)
ACTUAL ACTUAL ACTUAL ACTUAL ACTUAL ACTUAL ACTUAL ACTUAL ACTUAL ACTUAL
1982-83 1983-84 1984-85 1985-86 1986-87 1987-88 1988-89 1989-90 1990-91 1991-92
----------------- ----------------- ----------------- ----------------- ----------------- ----------------- ----------------- ----------------- ----------------- -----------------
Opening Balance July 1st 615,266 243,798 87,619 160,309 227,982 536,657 1,830,805 2,483,609 3,216,277 3,843,121
Recurring Revenues 2,629,321 3,089,911 3,734,461 4,339,561 5,361,180 6,038,573 6,454,376 6,986,692 7,317,033 7,156,042
Non-Recurring Revenues 65,571 1,017 2,049 4,832 31,063 27,933 8,489 0 94,885 26,092
Flood Control/Storm Drainage
Enterprise Fund Transfers (113,185) (124,029) (289,667) (341,483) (387,767) (387,726) (385,507) (498,246) (734,194) (636,034)
Inventory Adjustment (2,361) 190 (2,258) 2,651 (1,034) (4,738) 1,097 1,597 1,369 560
From AB2536 - Interest 0 0 0 0 0 0 0 6,713 0 0
To/From ABAG 10 Debt Service 0 0 0 0 0 (54,097) 0 0 2,453 0
To/From SB90 Contingency 0 0 0 0 0 (22,284) (12,634) 14,185 20,733 0
Reimbursement to State - SB90 0 0 0 0 (3,825) 0 0 (22,284) 0 0
Reimbursement to State - Park Grant 0 0 0 (2,473) 0 0 0 0 0 0
Reimbursement to FEMA-Net 0 0 (358) 0 0 0 0 0 0 0
Sanitary District Loan Repayment 0 0 (38,417) 0 0 0 0 0 0 0
To/From Garbage Contingency 0 0 0 0 0 (12,172) 12,172 0 0 0
To 1965 Bonds 0 0 0 0 0 0 0 0 (3,135) 0
To/From Cash on Hand 0 500 0 0 0 (50) 0 0 0 0
To/From CMC/Hahn Plan Check 0 0 (100,000) 100,000 0 0 0 0 0 0
To/From XMAS Tree Hill Reserves (14,688) 53,183 0 0 0 0 0 0 0 0
To Accrued Compensated Absences (63,492) 0 0 0 0 0 0 0 0 0
From Cash to Accrual on Revenue Recognition 58,352 0 0 0 0 0 0 0 0 0
From Home Reserve 577 25,701 0 0 0 0 0 0 0 0
Operating Expenditures (Recurring) (2,669,381) (2,935,364) (3,184,345) (3,614,842) (4,237,944) (4,183,025) (4,711,280) (5,221,131) (5,760,269) (6,238,100)
Non-Operating Expenditures (Non-Recurring) (262,182) (267,288) (48,775) (420,573) (452,998) (108,266) (713,909) (534,858) (312,031) (587,754)
Closing Balance June 30th 243,798 87,619 160,309 227,982 536,657 1,830,805 2,483,609 3,216,277 3,843,121 3,563,927
Revenues Over/<Under> Expenditures,
Adjustments & Transfers (371,468) (156,179) 72,690 67,673 308,675 1,294,148 652,804 732,668 626,844 (279,194)
Segregation of Balance
General Fund Reserve 300,000 (47,775) 14,476 64,291 59,413 (10,342) 244,070 300,000 300,000 300,000 300,000
General Fund Operations 141,189 104,984 8,397 5,117 4,101 4,078 2,458 151,110 320,974 401,440 394,144
Measure "C" 0 0 0 0 0 542,921 1,542,236 1,990,565 2,505,107 2,969,899 2,602,542
Gas Tax 2105 0 0 0 0 0 0 0 0 0 25,982 62,018
Gas Tax 2106 174,077 186,589 64,746 90,901 164,468 0 42,041 41,934 90,196 145,800 205,223
----------------- ----------------- ----------------- ----------------- ----------------- ----------------- ----------------- ----------------- ----------------- ----------------- -----------------
Total Balance 615,266 243,798 87,619 160,309 227,982 536,657 1,830,805 2,483,609 3,216,277 3,843,121 3,563,927
* Presented on the Modified Accrual Basis of Accounting
2005Budget\Excel\genpurpb.xls FM9
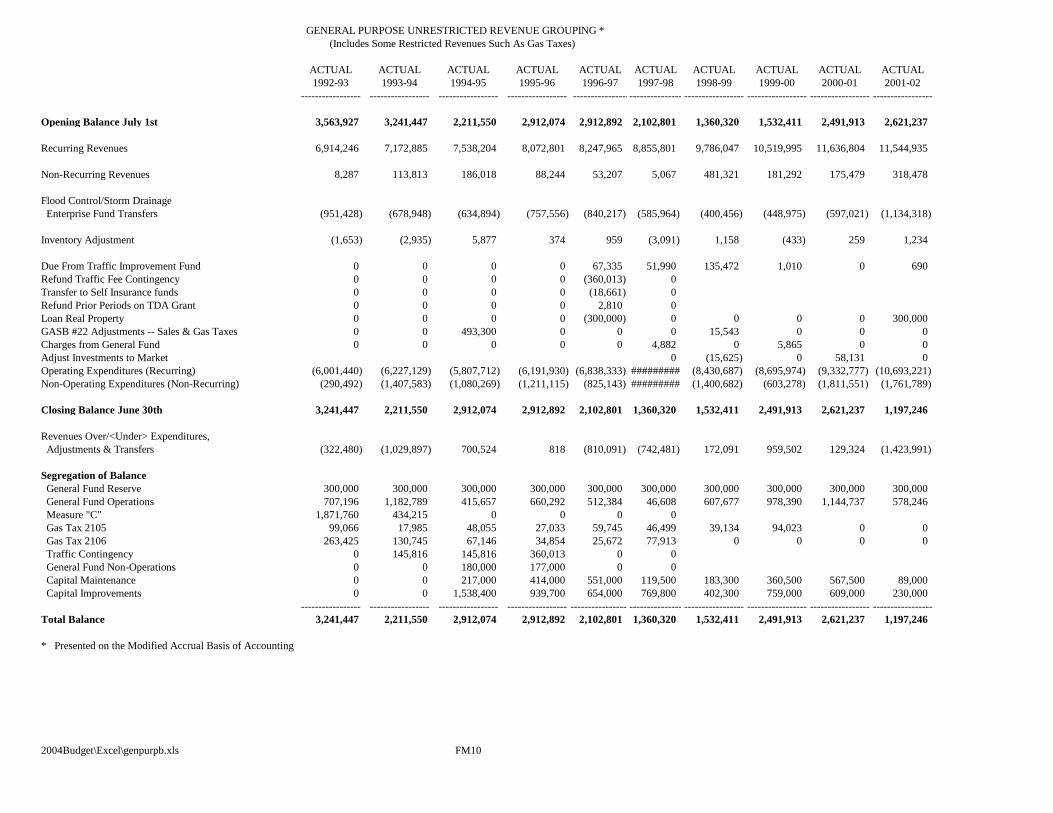
GENERAL PURPOSE UNRESTRICTED REVENUE GROUPING *
(Includes Some Restricted Revenues Such As Gas Taxes)
ACTUAL ACTUAL ACTUAL ACTUAL ACTUAL ACTUAL ACTUAL ACTUAL ACTUAL ACTUAL
1992-93 1993-94 1994-95 1995-96 1996-97 1997-98 1998-99 1999-00 2000-01 2001-02
----------------- ----------------- ----------------- ----------------- --------------------------------------------------- ----------------- ----------------- -----------------
Opening Balance July 1st 3,563,927 3,241,447 2,211,550 2,912,074 2,912,892 2,102,801 1,360,320 1,532,411 2,491,913 2,621,237
Recurring Revenues 6,914,246 7,172,885 7,538,204 8,072,801 8,247,965 8,855,801 9,786,047 10,519,995 11,636,804 11,544,935
Non-Recurring Revenues 8,287 113,813 186,018 88,244 53,207 5,067 481,321 181,292 175,479 318,478
Flood Control/Storm Drainage
Enterprise Fund Transfers (951,428) (678,948) (634,894) (757,556) (840,217) (585,964) (400,456) (448,975) (597,021) (1,134,318)
Inventory Adjustment (1,653) (2,935) 5,877 374 959 (3,091) 1,158 (433) 259 1,234
Due From Traffic Improvement Fund 0 0 0 0 67,335 51,990 135,472 1,010 0 690
Refund Traffic Fee Contingency 0 0 0 0 (360,013) 0
Transfer to Self Insurance funds 0 0 0 0 (18,661) 0
Refund Prior Periods on TDA Grant 0 0 0 0 2,810 0
Loan Real Property 0 0 0 0 (300,000) 0 0 0 0 300,000
GASB #22 Adjustments -- Sales & Gas Taxes 0 0 493,300 0 0 0 15,543 0 0 0
Charges from General Fund 0 0 0 0 0 4,882 0 5,865 0 0
Adjust Investments to Market 0 (15,625) 0 58,131 0
Operating Expenditures (Recurring) (6,001,440) (6,227,129) (5,807,712) (6,191,930) (6,838,333) ######### (8,430,687) (8,695,974) (9,332,777) (10,693,221)
Non-Operating Expenditures (Non-Recurring) (290,492) (1,407,583) (1,080,269) (1,211,115) (825,143) ######### (1,400,682) (603,278) (1,811,551) (1,761,789)
Closing Balance June 30th 3,241,447 2,211,550 2,912,074 2,912,892 2,102,801 1,360,320 1,532,411 2,491,913 2,621,237 1,197,246
Revenues Over/<Under> Expenditures,
Adjustments & Transfers (322,480) (1,029,897) 700,524 818 (810,091) (742,481) 172,091 959,502 129,324 (1,423,991)
Segregation of Balance
General Fund Reserve 300,000 300,000 300,000 300,000 300,000 300,000 300,000 300,000 300,000 300,000
General Fund Operations 707,196 1,182,789 415,657 660,292 512,384 46,608 607,677 978,390 1,144,737 578,246
Measure "C" 1,871,760 434,215 0 0 0 0
Gas Tax 2105 99,066 17,985 48,055 27,033 59,745 46,499 39,134 94,023 0 0
Gas Tax 2106 263,425 130,745 67,146 34,854 25,672 77,913 0 0 0 0
Traffic Contingency 0 145,816 145,816 360,013 0 0
General Fund Non-Operations 0 0 180,000 177,000 0 0
Capital Maintenance 0 0 217,000 414,000 551,000 119,500 183,300 360,500 567,500 89,000
Capital Improvements 0 0 1,538,400 939,700 654,000 769,800 402,300 759,000 609,000 230,000
----------------- ----------------- ----------------- ----------------- --------------------------------------------------- ----------------- ----------------- -----------------
Total Balance 3,241,447 2,211,550 2,912,074 2,912,892 2,102,801 1,360,320 1,532,411 2,491,913 2,621,237 1,197,246
* Presented on the Modified Accrual Basis of Accounting
2004Budget\Excel\genpurpb.xls FM10
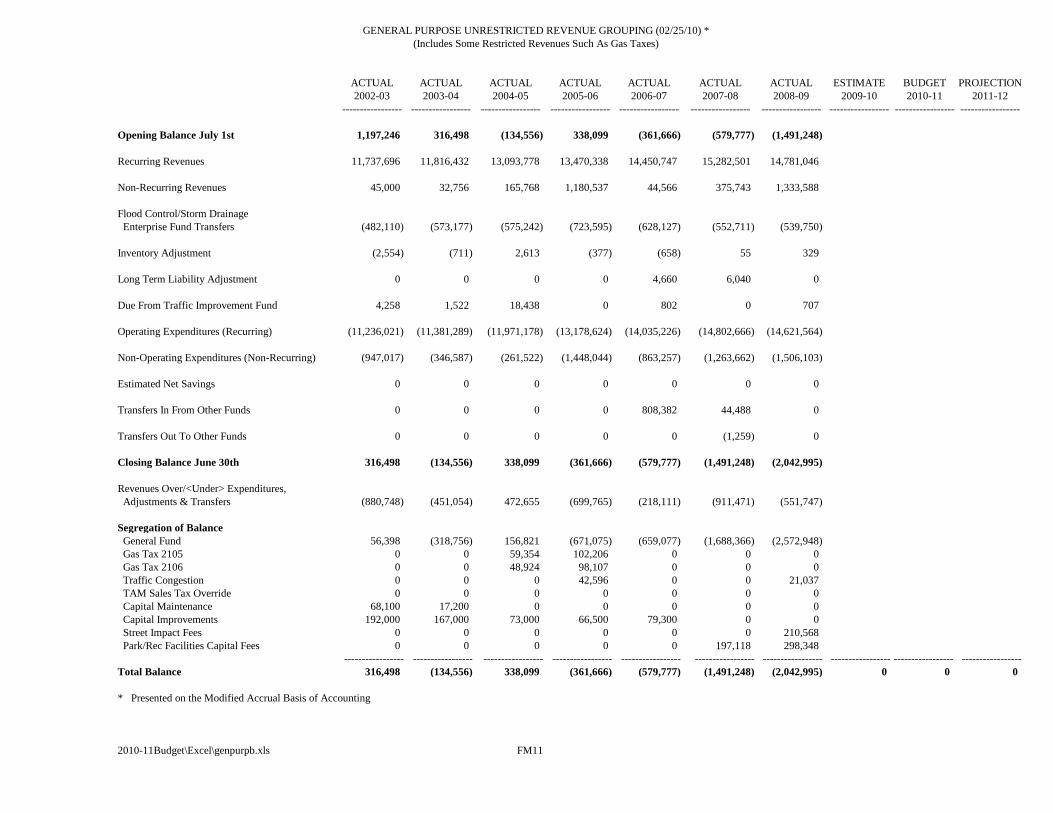
GENERAL PURPOSE UNRESTRICTED REVENUE GROUPING (02/25/10) *
(Includes Some Restricted Revenues Such As Gas Taxes)
ACTUAL ACTUAL ACTUAL ACTUAL ACTUAL ACTUAL ACTUAL ESTIMATE BUDGET PROJECTION
2002-03 2003-04 2004-05 2005-06 2006-07 2007-08 2008-09 2009-10 2010-11 2011-12
----------------- ----------------- ----------------- ----------------- ----------------- ----------------- ----------------- ----------------- ----------------- -----------------
Opening Balance July 1st 1,197,246 316,498 (134,556) 338,099 (361,666) (579,777) (1,491,248)
Recurring Revenues 11,737,696 11,816,432 13,093,778 13,470,338 14,450,747 15,282,501 14,781,046
Non-Recurring Revenues 45,000 32,756 165,768 1,180,537 44,566 375,743 1,333,588
Flood Control/Storm Drainage
Enterprise Fund Transfers (482,110) (573,177) (575,242) (723,595) (628,127) (552,711) (539,750)
Inventory Adjustment (2,554) (711) 2,613 (377) (658) 55 329
Long Term Liability Adjustment 0 0 0 0 4,660 6,040 0
Due From Traffic Improvement Fund 4,258 1,522 18,438 0 802 0 707
Operating Expenditures (Recurring) (11,236,021) (11,381,289) (11,971,178) (13,178,624) (14,035,226) (14,802,666) (14,621,564)
Non-Operating Expenditures (Non-Recurring) (947,017) (346,587) (261,522) (1,448,044) (863,257) (1,263,662) (1,506,103)
Estimated Net Savings 0 0 0 0 0 0 0
Transfers In From Other Funds 0 0 0 0 808,382 44,488 0
Transfers Out To Other Funds 0 0 0 0 0 (1,259) 0
Closing Balance June 30th 316,498 (134,556) 338,099 (361,666) (579,777) (1,491,248) (2,042,995)
Revenues Over/<Under> Expenditures,
Adjustments & Transfers (880,748) (451,054) 472,655 (699,765) (218,111) (911,471) (551,747)
Segregation of Balance
General Fund 56,398 (318,756) 156,821 (671,075) (659,077) (1,688,366) (2,572,948)
Gas Tax 2105 0 0 59,354 102,206 0 0 0
Gas Tax 2106 0 0 48,924 98,107 0 0 0
Traffic Congestion 0 0 0 42,596 0 0 21,037
TAM Sales Tax Override 0 0 0 0 0 0 0
Capital Maintenance 68,100 17,200 0 0 0 0 0
Capital Improvements 192,000 167,000 73,000 66,500 79,300 0 0
Street Impact Fees 0 0 0 0 0 0 210,568
Park/Rec Facilities Capital Fees 0 0 0 0 0 197,118 298,348
----------------- ----------------- ----------------- ----------------- ----------------- ----------------- ----------------- ----------------- ----------------- -----------------
Total Balance 316,498 (134,556) 338,099 (361,666) (579,777) (1,491,248) (2,042,995) 0 0 0
* Presented on the Modified Accrual Basis of Accounting
2010-11Budget\Excel\genpurpb.xls FM11
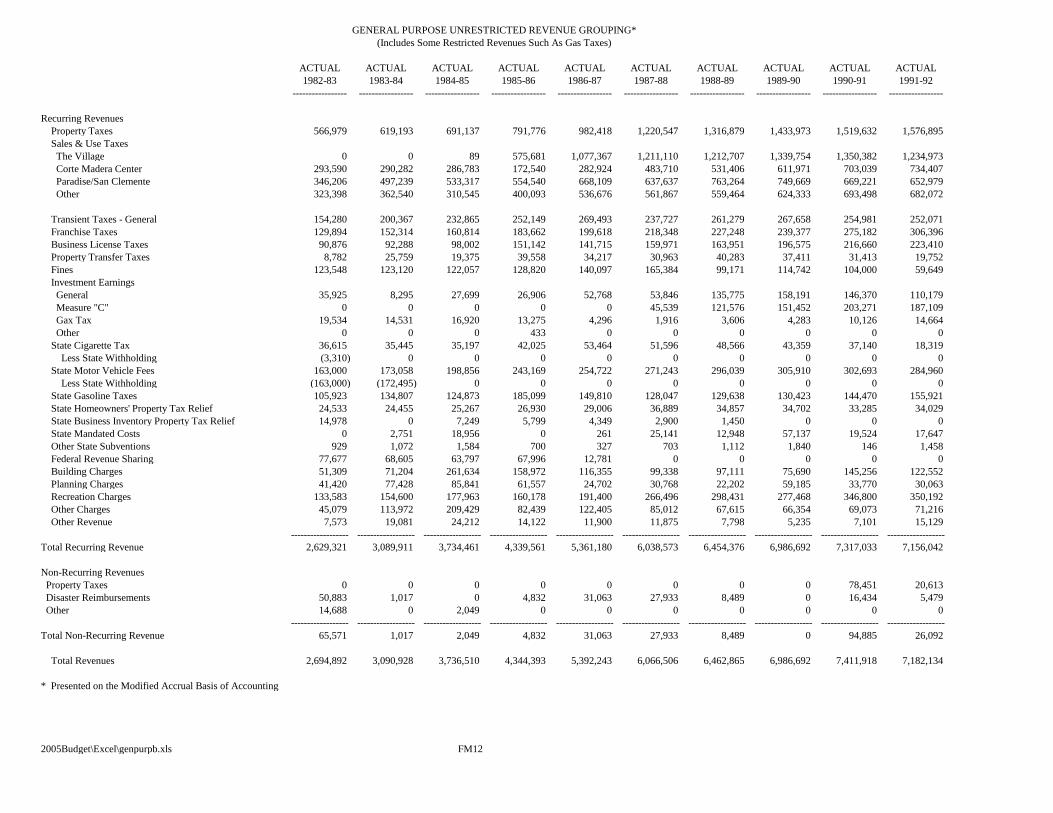
GENERAL PURPOSE UNRESTRICTED REVENUE GROUPING*
(Includes Some Restricted Revenues Such As Gas Taxes)
ACTUAL ACTUAL ACTUAL ACTUAL ACTUAL ACTUAL ACTUAL ACTUAL ACTUAL ACTUAL
1982-83 1983-84 1984-85 1985-86 1986-87 1987-88 1988-89 1989-90 1990-91 1991-92
----------------- ----------------- ----------------- ----------------- ----------------- ----------------- ----------------- ----------------- ----------------- -----------------
Recurring Revenues
Property Taxes 566,979 619,193 691,137 791,776 982,418 1,220,547 1,316,879 1,433,973 1,519,632 1,576,895
Sales & Use Taxes
The Village 0 0 89 575,681 1,077,367 1,211,110 1,212,707 1,339,754 1,350,382 1,234,973
Corte Madera Center 293,590 290,282 286,783 172,540 282,924 483,710 531,406 611,971 703,039 734,407
Paradise/San Clemente 346,206 497,239 533,317 554,540 668,109 637,637 763,264 749,669 669,221 652,979
Other 323,398 362,540 310,545 400,093 536,676 561,867 559,464 624,333 693,498 682,072
Transient Taxes - General 154,280 200,367 232,865 252,149 269,493 237,727 261,279 267,658 254,981 252,071
Franchise Taxes 129,894 152,314 160,814 183,662 199,618 218,348 227,248 239,377 275,182 306,396
Business License Taxes 90,876 92,288 98,002 151,142 141,715 159,971 163,951 196,575 216,660 223,410
Property Transfer Taxes 8,782 25,759 19,375 39,558 34,217 30,963 40,283 37,411 31,413 19,752
Fines 123,548 123,120 122,057 128,820 140,097 165,384 99,171 114,742 104,000 59,649
Investment Earnings
General 35,925 8,295 27,699 26,906 52,768 53,846 135,775 158,191 146,370 110,179
Measure "C" 0 0 0 0 0 45,539 121,576 151,452 203,271 187,109
Gax Tax 19,534 14,531 16,920 13,275 4,296 1,916 3,606 4,283 10,126 14,664
Other 0 0 0 433 0 0 0 0 0 0
State Cigarette Tax 36,615 35,445 35,197 42,025 53,464 51,596 48,566 43,359 37,140 18,319
Less State Withholding (3,310) 0 0 0 0 0 0 0 0 0
State Motor Vehicle Fees 163,000 173,058 198,856 243,169 254,722 271,243 296,039 305,910 302,693 284,960
Less State Withholding (163,000) (172,495) 0 0 0 0 0 0 0 0
State Gasoline Taxes 105,923 134,807 124,873 185,099 149,810 128,047 129,638 130,423 144,470 155,921
State Homeowners' Property Tax Relief 24,533 24,455 25,267 26,930 29,006 36,889 34,857 34,702 33,285 34,029
State Business Inventory Property Tax Relief 14,978 0 7,249 5,799 4,349 2,900 1,450 0 0 0
State Mandated Costs 0 2,751 18,956 0 261 25,141 12,948 57,137 19,524 17,647
Other State Subventions 929 1,072 1,584 700 327 703 1,112 1,840 146 1,458
Federal Revenue Sharing 77,677 68,605 63,797 67,996 12,781 0 0 0 0 0
Building Charges 51,309 71,204 261,634 158,972 116,355 99,338 97,111 75,690 145,256 122,552
Planning Charges 41,420 77,428 85,841 61,557 24,702 30,768 22,202 59,185 33,770 30,063
Recreation Charges 133,583 154,600 177,963 160,178 191,400 266,496 298,431 277,468 346,800 350,192
Other Charges 45,079 113,972 209,429 82,439 122,405 85,012 67,615 66,354 69,073 71,216
Other Revenue 7,573 19,081 24,212 14,122 11,900 11,875 7,798 5,235 7,101 15,129
------------------ ------------------ ------------------ ------------------ ------------------ ------------------ ------------------ ------------------ ------------------ ------------------
Total Recurring Revenue 2,629,321 3,089,911 3,734,461 4,339,561 5,361,180 6,038,573 6,454,376 6,986,692 7,317,033 7,156,042
Non-Recurring Revenues
Property Taxes 0 0 0 0 0 0 0 0 78,451 20,613
Disaster Reimbursements 50,883 1,017 0 4,832 31,063 27,933 8,489 0 16,434 5,479
Other 14,688 0 2,049 0 0 0 0 0 0 0
------------------ ------------------ ------------------ ------------------ ------------------ ------------------ ------------------ ------------------ ------------------ ------------------
Total Non-Recurring Revenue 65,571 1,017 2,049 4,832 31,063 27,933 8,489 0 94,885 26,092
Total Revenues 2,694,892 3,090,928 3,736,510 4,344,393 5,392,243 6,066,506 6,462,865 6,986,692 7,411,918 7,182,134
* Presented on the Modified Accrual Basis of Accounting
2005Budget\Excel\genpurpb.xls FM12
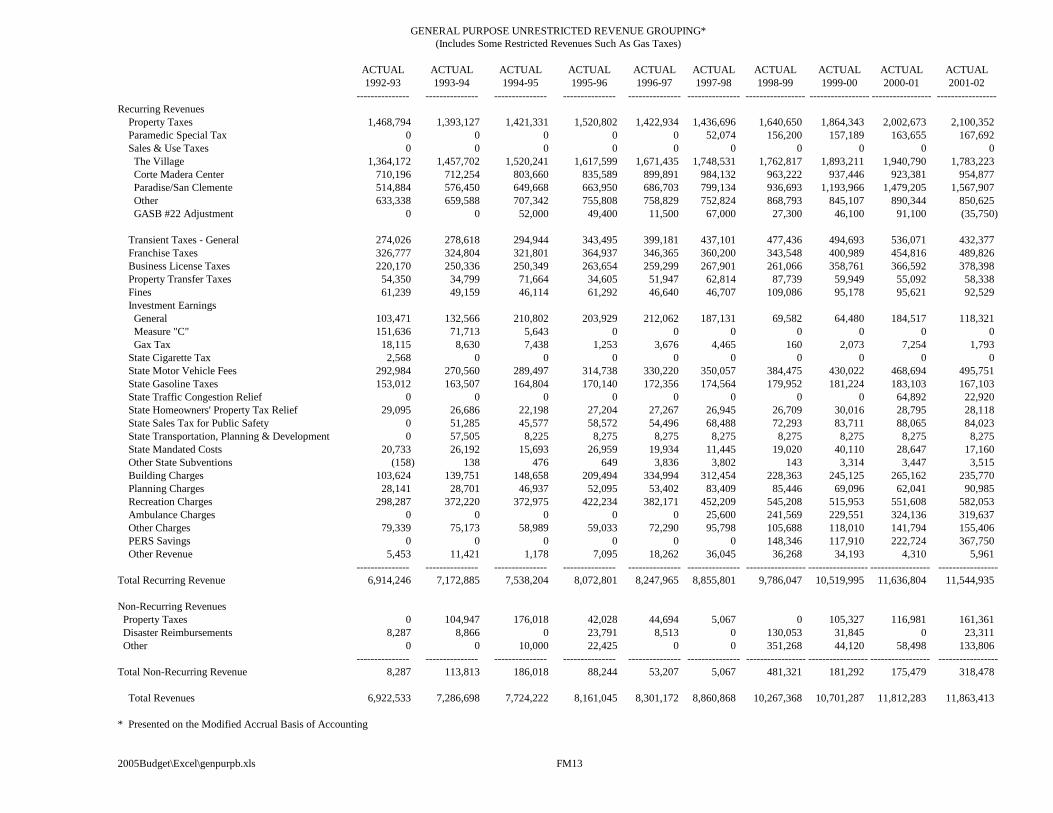
GENERAL PURPOSE UNRESTRICTED REVENUE GROUPING*
(Includes Some Restricted Revenues Such As Gas Taxes)
ACTUAL ACTUAL ACTUAL ACTUAL ACTUAL ACTUAL ACTUAL ACTUAL ACTUAL ACTUAL
1992-93 1993-94 1994-95 1995-96 1996-97 1997-98 1998-99 1999-00 2000-01 2001-02
--------------- --------------- --------------- --------------- --------------- --------------- ----------------- ----------------- ----------------- -----------------
Recurring Revenues
Property Taxes 1,468,794 1,393,127 1,421,331 1,520,802 1,422,934 1,436,696 1,640,650 1,864,343 2,002,673 2,100,352
Paramedic Special Tax 0 0 0 0 0 52,074 156,200 157,189 163,655 167,692
Sales & Use Taxes 0 0 0 0 0 0 0 0 0 0
The Village 1,364,172 1,457,702 1,520,241 1,617,599 1,671,435 1,748,531 1,762,817 1,893,211 1,940,790 1,783,223
Corte Madera Center 710,196 712,254 803,660 835,589 899,891 984,132 963,222 937,446 923,381 954,877
Paradise/San Clemente 514,884 576,450 649,668 663,950 686,703 799,134 936,693 1,193,966 1,479,205 1,567,907
Other 633,338 659,588 707,342 755,808 758,829 752,824 868,793 845,107 890,344 850,625
GASB #22 Adjustment 0 0 52,000 49,400 11,500 67,000 27,300 46,100 91,100 (35,750)
Transient Taxes - General 274,026 278,618 294,944 343,495 399,181 437,101 477,436 494,693 536,071 432,377
Franchise Taxes 326,777 324,804 321,801 364,937 346,365 360,200 343,548 400,989 454,816 489,826
Business License Taxes 220,170 250,336 250,349 263,654 259,299 267,901 261,066 358,761 366,592 378,398
Property Transfer Taxes 54,350 34,799 71,664 34,605 51,947 62,814 87,739 59,949 55,092 58,338
Fines 61,239 49,159 46,114 61,292 46,640 46,707 109,086 95,178 95,621 92,529
Investment Earnings
General 103,471 132,566 210,802 203,929 212,062 187,131 69,582 64,480 184,517 118,321
Measure "C" 151,636 71,713 5,643 0 0 0 0 0 0 0
Gax Tax 18,115 8,630 7,438 1,253 3,676 4,465 160 2,073 7,254 1,793
State Cigarette Tax 2,568 0 0 0 0 0 0 0 0 0
State Motor Vehicle Fees 292,984 270,560 289,497 314,738 330,220 350,057 384,475 430,022 468,694 495,751
State Gasoline Taxes 153,012 163,507 164,804 170,140 172,356 174,564 179,952 181,224 183,103 167,103
State Traffic Congestion Relief 0 0 0 0 0 0 0 0 64,892 22,920
State Homeowners' Property Tax Relief 29,095 26,686 22,198 27,204 27,267 26,945 26,709 30,016 28,795 28,118
State Sales Tax for Public Safety 0 51,285 45,577 58,572 54,496 68,488 72,293 83,711 88,065 84,023
State Transportation, Planning & Development 0 57,505 8,225 8,275 8,275 8,275 8,275 8,275 8,275 8,275
State Mandated Costs 20,733 26,192 15,693 26,959 19,934 11,445 19,020 40,110 28,647 17,160
Other State Subventions (158) 138 476 649 3,836 3,802 143 3,314 3,447 3,515
Building Charges 103,624 139,751 148,658 209,494 334,994 312,454 228,363 245,125 265,162 235,770
Planning Charges 28,141 28,701 46,937 52,095 53,402 83,409 85,446 69,096 62,041 90,985
Recreation Charges 298,287 372,220 372,975 422,234 382,171 452,209 545,208 515,953 551,608 582,053
Ambulance Charges 0 0 0 0 0 25,600 241,569 229,551 324,136 319,637
Other Charges 79,339 75,173 58,989 59,033 72,290 95,798 105,688 118,010 141,794 155,406
PERS Savings 0 0 0 0 0 0 148,346 117,910 222,724 367,750
Other Revenue 5,453 11,421 1,178 7,095 18,262 36,045 36,268 34,193 4,310 5,961
--------------- --------------- --------------- --------------- --------------- --------------- ----------------- ----------------- ----------------- -----------------
Total Recurring Revenue 6,914,246 7,172,885 7,538,204 8,072,801 8,247,965 8,855,801 9,786,047 10,519,995 11,636,804 11,544,935
Non-Recurring Revenues
Property Taxes 0 104,947 176,018 42,028 44,694 5,067 0 105,327 116,981 161,361
Disaster Reimbursements 8,287 8,866 0 23,791 8,513 0 130,053 31,845 0 23,311
Other 0 0 10,000 22,425 0 0 351,268 44,120 58,498 133,806
--------------- --------------- --------------- --------------- --------------- --------------- ----------------- ----------------- ----------------- -----------------
Total Non-Recurring Revenue 8,287 113,813 186,018 88,244 53,207 5,067 481,321 181,292 175,479 318,478
Total Revenues 6,922,533 7,286,698 7,724,222 8,161,045 8,301,172 8,860,868 10,267,368 10,701,287 11,812,283 11,863,413
* Presented on the Modified Accrual Basis of Accounting
2005Budget\Excel\genpurpb.xls FM13
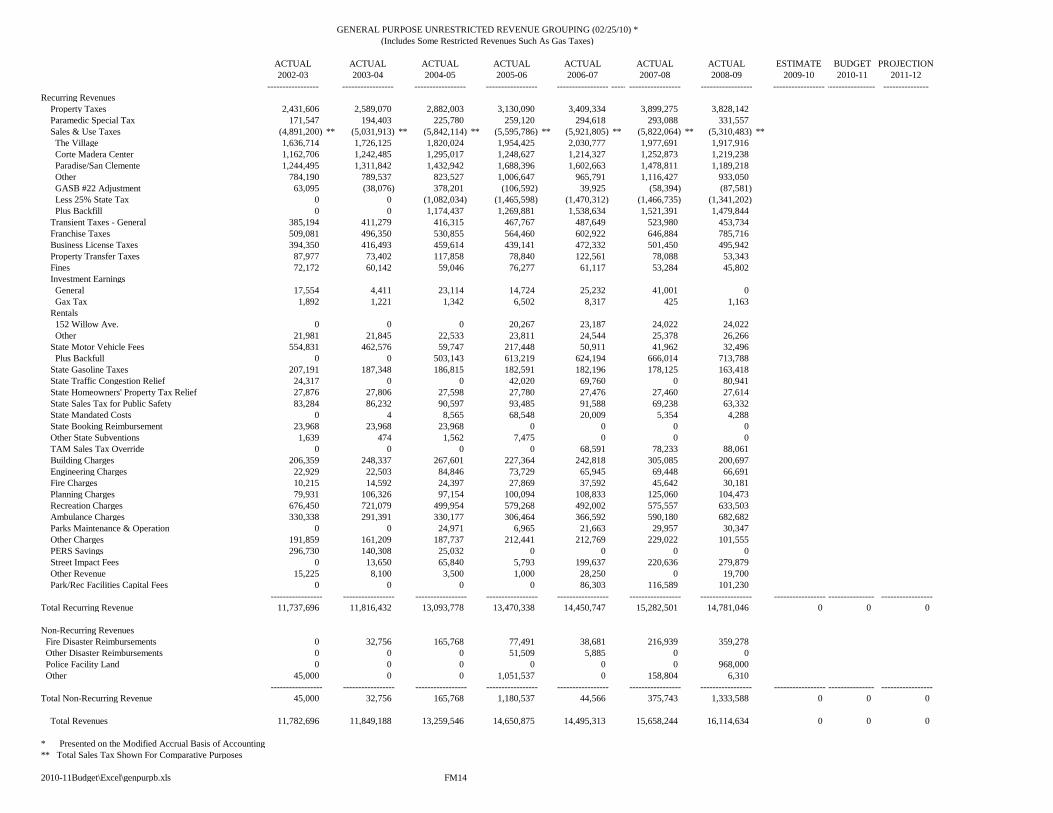
GENERAL PURPOSE UNRESTRICTED REVENUE GROUPING (02/25/10) *
(Includes Some Restricted Revenues Such As Gas Taxes)
ACTUAL ACTUAL ACTUAL ACTUAL ACTUAL ACTUAL ACTUAL ESTIMATE BUDGET PROJECTION
2002-03 2003-04 2004-05 2005-06 2006-07 2007-08 2008-09 2009-10 2010-11 2011-12
----------------- ----------------- ----------------- ----------------- --------------------------------------------------- ----------------- ----------------- ----------------- ---------------
Recurring Revenues
Property Taxes 2,431,606 2,589,070 2,882,003 3,130,090 3,409,334 3,899,275 3,828,142
Paramedic Special Tax 171,547 194,403 225,780 259,120 294,618 293,088 331,557
Sales & Use Taxes (4,891,200) ** (5,031,913) ** (5,842,114) ** (5,595,786) ** (5,921,805) ** (5,822,064) ** (5,310,483) **
The Village 1,636,714 1,726,125 1,820,024 1,954,425 2,030,777 1,977,691 1,917,916
Corte Madera Center 1,162,706 1,242,485 1,295,017 1,248,627 1,214,327 1,252,873 1,219,238
Paradise/San Clemente 1,244,495 1,311,842 1,432,942 1,688,396 1,602,663 1,478,811 1,189,218
Other 784,190 789,537 823,527 1,006,647 965,791 1,116,427 933,050
GASB #22 Adjustment 63,095 (38,076) 378,201 (106,592) 39,925 (58,394) (87,581)
Less 25% State Tax 0 0 (1,082,034) (1,465,598) (1,470,312) (1,466,735) (1,341,202)
Plus Backfill 0 0 1,174,437 1,269,881 1,538,634 1,521,391 1,479,844
Transient Taxes - General 385,194 411,279 416,315 467,767 487,649 523,980 453,734
Franchise Taxes 509,081 496,350 530,855 564,460 602,922 646,884 785,716
Business License Taxes 394,350 416,493 459,614 439,141 472,332 501,450 495,942
Property Transfer Taxes 87,977 73,402 117,858 78,840 122,561 78,088 53,343
Fines 72,172 60,142 59,046 76,277 61,117 53,284 45,802
Investment Earnings
General 17,554 4,411 23,114 14,724 25,232 41,001 0
Gax Tax 1,892 1,221 1,342 6,502 8,317 425 1,163
Rentals
152 Willow Ave. 0 0 0 20,267 23,187 24,022 24,022
Other 21,981 21,845 22,533 23,811 24,544 25,378 26,266
State Motor Vehicle Fees 554,831 462,576 59,747 217,448 50,911 41,962 32,496
Plus Backfull 0 0 503,143 613,219 624,194 666,014 713,788
State Gasoline Taxes 207,191 187,348 186,815 182,591 182,196 178,125 163,418
State Traffic Congestion Relief 24,317 0 0 42,020 69,760 0 80,941
State Homeowners' Property Tax Relief 27,876 27,806 27,598 27,780 27,476 27,460 27,614
State Sales Tax for Public Safety 83,284 86,232 90,597 93,485 91,588 69,238 63,332
State Mandated Costs 0 4 8,565 68,548 20,009 5,354 4,288
State Booking Reimbursement 23,968 23,968 23,968 0 0 0 0
Other State Subventions 1,639 474 1,562 7,475 0 0 0
TAM Sales Tax Override 0 0 0 0 68,591 78,233 88,061
Building Charges 206,359 248,337 267,601 227,364 242,818 305,085 200,697
Engineering Charges 22,929 22,503 84,846 73,729 65,945 69,448 66,691
Fire Charges 10,215 14,592 24,397 27,869 37,592 45,642 30,181
Planning Charges 79,931 106,326 97,154 100,094 108,833 125,060 104,473
Recreation Charges 676,450 721,079 499,954 579,268 492,002 575,557 633,503
Ambulance Charges 330,338 291,391 330,177 306,464 366,592 590,180 682,682
Parks Maintenance & Operation 0 0 24,971 6,965 21,663 29,957 30,347
Other Charges 191,859 161,209 187,737 212,441 212,769 229,022 101,555
PERS Savings 296,730 140,308 25,032 0 0 0 0
Street Impact Fees 0 13,650 65,840 5,793 199,637 220,636 279,879
Other Revenue 15,225 8,100 3,500 1,000 28,250 0 19,700
Park/Rec Facilities Capital Fees 0 0 0 0 86,303 116,589 101,230
----------------- ----------------- ----------------- ----------------- ----------------- ----------------- ----------------- ---------------------------------- -----------------
Total Recurring Revenue 11,737,696 11,816,432 13,093,778 13,470,338 14,450,747 15,282,501 14,781,046 0 0 0
Non-Recurring Revenues
Fire Disaster Reimbursements 0 32,756 165,768 77,491 38,681 216,939 359,278
Other Disaster Reimbursements 0 0 0 51,509 5,885 0 0
Police Facility Land 0 0 0 0 0 0 968,000
Other 45,000 0 0 1,051,537 0 158,804 6,310
----------------- ----------------- ----------------- ----------------- ----------------- ----------------- ----------------- ---------------------------------- -----------------
Total Non-Recurring Revenue 45,000 32,756 165,768 1,180,537 44,566 375,743 1,333,588 0 0 0
Total Revenues 11,782,696 11,849,188 13,259,546 14,650,875 14,495,313 15,658,244 16,114,634 0 0 0
* Presented on the Modified Accrual Basis of Accounting
** Total Sales Tax Shown For Comparative Purposes
2010-11Budget\Excel\genpurpb.xls FM14
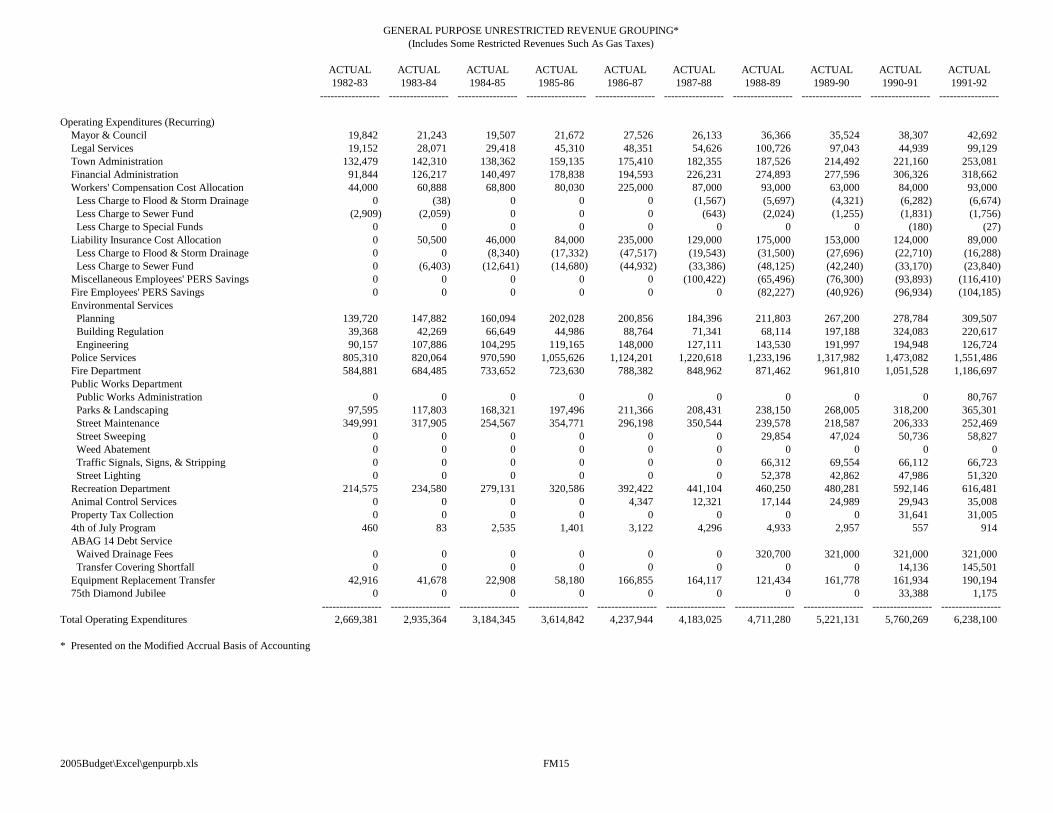
GENERAL PURPOSE UNRESTRICTED REVENUE GROUPING*
(Includes Some Restricted Revenues Such As Gas Taxes)
ACTUAL ACTUAL ACTUAL ACTUAL ACTUAL ACTUAL ACTUAL ACTUAL ACTUAL ACTUAL
1982-83 1983-84 1984-85 1985-86 1986-87 1987-88 1988-89 1989-90 1990-91 1991-92
----------------- ----------------- ----------------- ----------------- ----------------- ----------------- ----------------- ----------------- ----------------- -----------------
Operating Expenditures (Recurring)
Mayor & Council 19,842 21,243 19,507 21,672 27,526 26,133 36,366 35,524 38,307 42,692
Legal Services 19,152 28,071 29,418 45,310 48,351 54,626 100,726 97,043 44,939 99,129
Town Administration 132,479 142,310 138,362 159,135 175,410 182,355 187,526 214,492 221,160 253,081
Financial Administration 91,844 126,217 140,497 178,838 194,593 226,231 274,893 277,596 306,326 318,662
Workers' Compensation Cost Allocation 44,000 60,888 68,800 80,030 225,000 87,000 93,000 63,000 84,000 93,000
Less Charge to Flood & Storm Drainage 0 (38) 0 0 0 (1,567) (5,697) (4,321) (6,282) (6,674)
Less Charge to Sewer Fund (2,909) (2,059) 0 0 0 (643) (2,024) (1,255) (1,831) (1,756)
Less Charge to Special Funds 0 0 0 0 0 0 0 0 (180) (27)
Liability Insurance Cost Allocation 0 50,500 46,000 84,000 235,000 129,000 175,000 153,000 124,000 89,000
Less Charge to Flood & Storm Drainage 0 0 (8,340) (17,332) (47,517) (19,543) (31,500) (27,696) (22,710) (16,288)
Less Charge to Sewer Fund 0 (6,403) (12,641) (14,680) (44,932) (33,386) (48,125) (42,240) (33,170) (23,840)
Miscellaneous Employees' PERS Savings 0 0 0 0 0 (100,422) (65,496) (76,300) (93,893) (116,410)
Fire Employees' PERS Savings 0 0 0 0 0 0 (82,227) (40,926) (96,934) (104,185)
Environmental Services
Planning 139,720 147,882 160,094 202,028 200,856 184,396 211,803 267,200 278,784 309,507
Building Regulation 39,368 42,269 66,649 44,986 88,764 71,341 68,114 197,188 324,083 220,617
Engineering 90,157 107,886 104,295 119,165 148,000 127,111 143,530 191,997 194,948 126,724
Police Services 805,310 820,064 970,590 1,055,626 1,124,201 1,220,618 1,233,196 1,317,982 1,473,082 1,551,486
Fire Department 584,881 684,485 733,652 723,630 788,382 848,962 871,462 961,810 1,051,528 1,186,697
Public Works Department
Public Works Administration 0 0 0 0 0 0 0 0 0 80,767
Parks & Landscaping 97,595 117,803 168,321 197,496 211,366 208,431 238,150 268,005 318,200 365,301
Street Maintenance 349,991 317,905 254,567 354,771 296,198 350,544 239,578 218,587 206,333 252,469
Street Sweeping 0 0 0 0 0 0 29,854 47,024 50,736 58,827
Weed Abatement 0 0 0 0 0 0 0 0 0 0
Traffic Signals, Signs, & Stripping 0 0 0 0 0 0 66,312 69,554 66,112 66,723
Street Lighting 0 0 0 0 0 0 52,378 42,862 47,986 51,320
Recreation Department 214,575 234,580 279,131 320,586 392,422 441,104 460,250 480,281 592,146 616,481
Animal Control Services 0 0 0 0 4,347 12,321 17,144 24,989 29,943 35,008
Property Tax Collection 0 0 0 0 0 0 0 0 31,641 31,005
4th of July Program 460 83 2,535 1,401 3,122 4,296 4,933 2,957 557 914
ABAG 14 Debt Service
Waived Drainage Fees 0 0 0 0 0 0 320,700 321,000 321,000 321,000
Transfer Covering Shortfall 0 0 0 0 0 0 0 0 14,136 145,501
Equipment Replacement Transfer 42,916 41,678 22,908 58,180 166,855 164,117 121,434 161,778 161,934 190,194
75th Diamond Jubilee 0 0 0 0 0 0 0 0 33,388 1,175
----------------- ----------------- ----------------- ----------------- ----------------- ----------------- ----------------- ----------------- ----------------- -----------------
Total Operating Expenditures 2,669,381 2,935,364 3,184,345 3,614,842 4,237,944 4,183,025 4,711,280 5,221,131 5,760,269 6,238,100
* Presented on the Modified Accrual Basis of Accounting
2005Budget\Excel\genpurpb.xls FM15
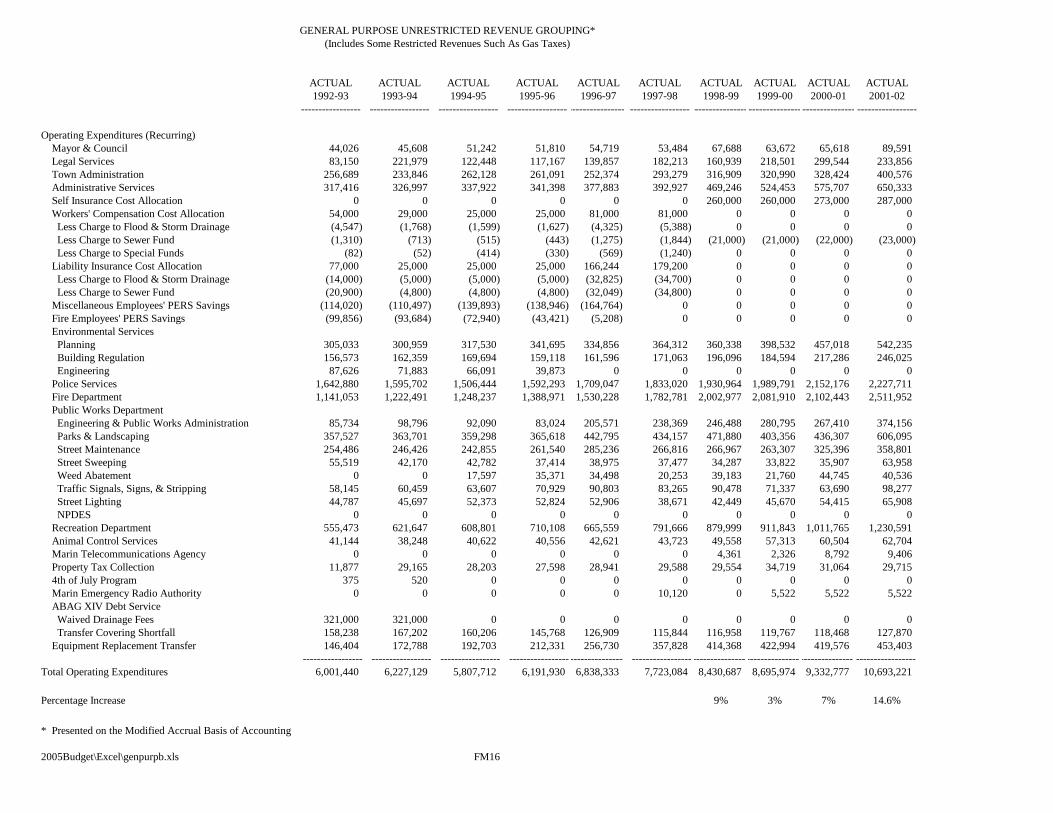
GENERAL PURPOSE UNRESTRICTED REVENUE GROUPING*
(Includes Some Restricted Revenues Such As Gas Taxes)
ACTUAL ACTUAL ACTUAL ACTUAL ACTUAL ACTUAL ACTUAL ACTUAL ACTUAL ACTUAL
1992-93 1993-94 1994-95 1995-96 1996-97 1997-98 1998-99 1999-00 2000-01 2001-02
----------------- ----------------- ----------------- ----------------- ----------------- ----------------- --------------------------------------------------------------------
Operating Expenditures (Recurring)
Mayor & Council 44,026 45,608 51,242 51,810 54,719 53,484 67,688 63,672 65,618 89,591
Legal Services 83,150 221,979 122,448 117,167 139,857 182,213 160,939 218,501 299,544 233,856
Town Administration 256,689 233,846 262,128 261,091 252,374 293,279 316,909 320,990 328,424 400,576
Administrative Services 317,416 326,997 337,922 341,398 377,883 392,927 469,246 524,453 575,707 650,333
Self Insurance Cost Allocation 0 0 0 0 0 0 260,000 260,000 273,000 287,000
Workers' Compensation Cost Allocation 54,000 29,000 25,000 25,000 81,000 81,000 0 0 0 0
Less Charge to Flood & Storm Drainage (4,547) (1,768) (1,599) (1,627) (4,325) (5,388) 0 0 0 0
Less Charge to Sewer Fund (1,310) (713) (515) (443) (1,275) (1,844) (21,000) (21,000) (22,000) (23,000)
Less Charge to Special Funds (82) (52) (414) (330) (569) (1,240) 0 0 0 0
Liability Insurance Cost Allocation 77,000 25,000 25,000 25,000 166,244 179,200 0 0 0 0
Less Charge to Flood & Storm Drainage (14,000) (5,000) (5,000) (5,000) (32,825) (34,700) 0 0 0 0
Less Charge to Sewer Fund (20,900) (4,800) (4,800) (4,800) (32,049) (34,800) 0 0 0 0
Miscellaneous Employees' PERS Savings (114,020) (110,497) (139,893) (138,946) (164,764) 0 0 0 0 0
Fire Employees' PERS Savings (99,856) (93,684) (72,940) (43,421) (5,208) 0 0 0 0 0
Environmental Services
Planning 305,033 300,959 317,530 341,695 334,856 364,312 360,338 398,532 457,018 542,235
Building Regulation 156,573 162,359 169,694 159,118 161,596 171,063 196,096 184,594 217,286 246,025
Engineering 87,626 71,883 66,091 39,873 0 0 0 0 0 0
Police Services 1,642,880 1,595,702 1,506,444 1,592,293 1,709,047 1,833,020 1,930,964 1,989,791 2,152,176 2,227,711
Fire Department 1,141,053 1,222,491 1,248,237 1,388,971 1,530,228 1,782,781 2,002,977 2,081,910 2,102,443 2,511,952
Public Works Department
Engineering & Public Works Administration 85,734 98,796 92,090 83,024 205,571 238,369 246,488 280,795 267,410 374,156
Parks & Landscaping 357,527 363,701 359,298 365,618 442,795 434,157 471,880 403,356 436,307 606,095
Street Maintenance 254,486 246,426 242,855 261,540 285,236 266,816 266,967 263,307 325,396 358,801
Street Sweeping 55,519 42,170 42,782 37,414 38,975 37,477 34,287 33,822 35,907 63,958
Weed Abatement 0 0 17,597 35,371 34,498 20,253 39,183 21,760 44,745 40,536
Traffic Signals, Signs, & Stripping 58,145 60,459 63,607 70,929 90,803 83,265 90,478 71,337 63,690 98,277
Street Lighting 44,787 45,697 52,373 52,824 52,906 38,671 42,449 45,670 54,415 65,908
NPDES 0 0 0 0 0 0 0 0 0 0
Recreation Department 555,473 621,647 608,801 710,108 665,559 791,666 879,999 911,843 1,011,765 1,230,591
Animal Control Services 41,144 38,248 40,622 40,556 42,621 43,723 49,558 57,313 60,504 62,704
Marin Telecommunications Agency 0 0 0 0 0 0 4,361 2,326 8,792 9,406
Property Tax Collection 11,877 29,165 28,203 27,598 28,941 29,588 29,554 34,719 31,064 29,715
4th of July Program 375 520 0 0 0 0 0 0 0 0
Marin Emergency Radio Authority 0 0 0 0 0 10,120 0 5,522 5,522 5,522
ABAG XIV Debt Service
Waived Drainage Fees 321,000 321,000 0 0 0 0 0 0 0 0
Transfer Covering Shortfall 158,238 167,202 160,206 145,768 126,909 115,844 116,958 119,767 118,468 127,870
Equipment Replacement Transfer 146,404 172,788 192,703 212,331 256,730 357,828 414,368 422,994 419,576 453,403
----------------- ----------------- ----------------- ---------------------------------- -------------------------------------------------------------------- -----------------
Total Operating Expenditures 6,001,440 6,227,129 5,807,712 6,191,930 6,838,333 7,723,084 8,430,687 8,695,974 9,332,777 10,693,221
Percentage Increase 9% 3% 7% 14.6%
* Presented on the Modified Accrual Basis of Accounting
2005Budget\Excel\genpurpb.xls FM16
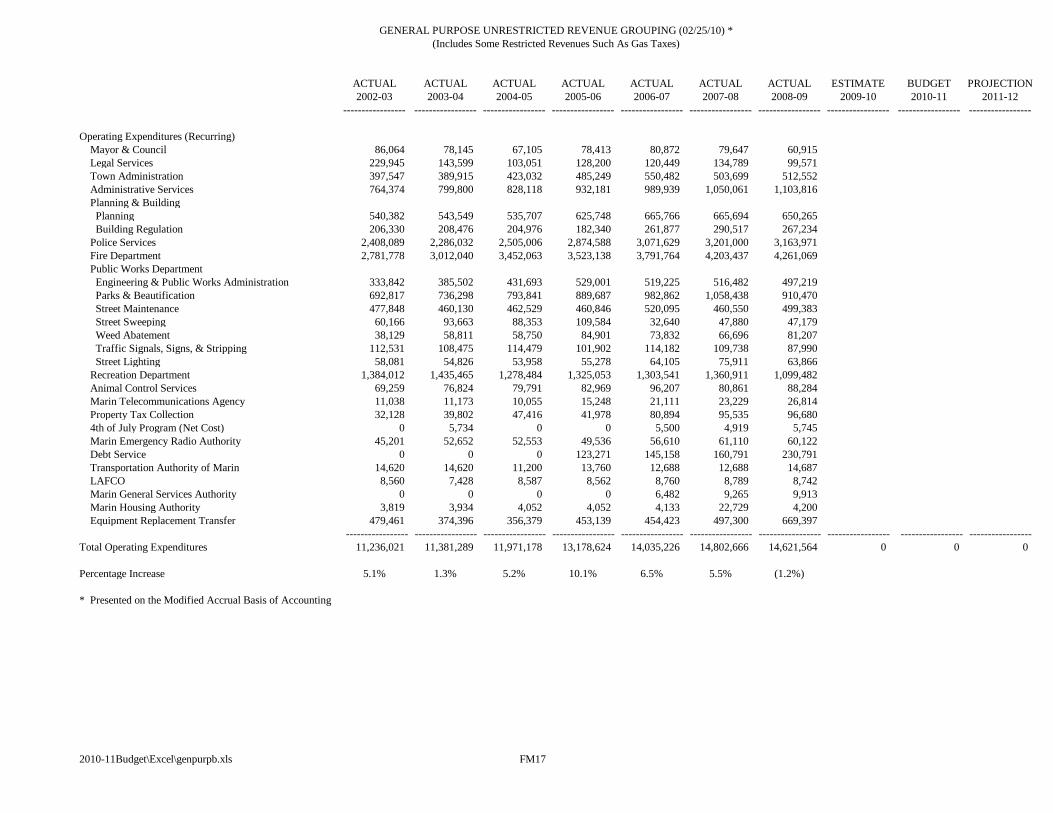
GENERAL PURPOSE UNRESTRICTED REVENUE GROUPING (02/25/10) *
(Includes Some Restricted Revenues Such As Gas Taxes)
ACTUAL ACTUAL ACTUAL ACTUAL ACTUAL ACTUAL ACTUAL ESTIMATE BUDGET PROJECTION
2002-03 2003-04 2004-05 2005-06 2006-07 2007-08 2008-09 2009-10 2010-11 2011-12
----------------- ----------------- ----------------- ----------------- ----------------- ----------------- ----------------- ----------------- ----------------- -----------------
Operating Expenditures (Recurring)
Mayor & Council 86,064 78,145 67,105 78,413 80,872 79,647 60,915
Legal Services 229,945 143,599 103,051 128,200 120,449 134,789 99,571
Town Administration 397,547 389,915 423,032 485,249 550,482 503,699 512,552
Administrative Services 764,374 799,800 828,118 932,181 989,939 1,050,061 1,103,816
Planning & Building
Planning 540,382 543,549 535,707 625,748 665,766 665,694 650,265
Building Regulation 206,330 208,476 204,976 182,340 261,877 290,517 267,234
Police Services 2,408,089 2,286,032 2,505,006 2,874,588 3,071,629 3,201,000 3,163,971
Fire Department 2,781,778 3,012,040 3,452,063 3,523,138 3,791,764 4,203,437 4,261,069
Public Works Department
Engineering & Public Works Administration 333,842 385,502 431,693 529,001 519,225 516,482 497,219
Parks & Beautification 692,817 736,298 793,841 889,687 982,862 1,058,438 910,470
Street Maintenance 477,848 460,130 462,529 460,846 520,095 460,550 499,383
Street Sweeping 60,166 93,663 88,353 109,584 32,640 47,880 47,179
Weed Abatement 38,129 58,811 58,750 84,901 73,832 66,696 81,207
Traffic Signals, Signs, & Stripping 112,531 108,475 114,479 101,902 114,182 109,738 87,990
Street Lighting 58,081 54,826 53,958 55,278 64,105 75,911 63,866
Recreation Department 1,384,012 1,435,465 1,278,484 1,325,053 1,303,541 1,360,911 1,099,482
Animal Control Services 69,259 76,824 79,791 82,969 96,207 80,861 88,284
Marin Telecommunications Agency 11,038 11,173 10,055 15,248 21,111 23,229 26,814
Property Tax Collection 32,128 39,802 47,416 41,978 80,894 95,535 96,680
4th of July Program (Net Cost) 0 5,734 0 0 5,500 4,919 5,745
Marin Emergency Radio Authority 45,201 52,652 52,553 49,536 56,610 61,110 60,122
Debt Service 0 0 0 123,271 145,158 160,791 230,791
Transportation Authority of Marin 14,620 14,620 11,200 13,760 12,688 12,688 14,687
LAFCO 8,560 7,428 8,587 8,562 8,760 8,789 8,742
Marin General Services Authority 0 0 0 0 6,482 9,265 9,913
Marin Housing Authority 3,819 3,934 4,052 4,052 4,133 22,729 4,200
Equipment Replacement Transfer 479,461 374,396 356,379 453,139 454,423 497,300 669,397
----------------- ----------------- ----------------- ----------------- ----------------- ----------------- ----------------- ----------------- ----------------- -----------------
Total Operating Expenditures 11,236,021 11,381,289 11,971,178 13,178,624 14,035,226 14,802,666 14,621,564 0 0 0
Percentage Increase 5.1% 1.3% 5.2% 10.1% 6.5% 5.5% (1.2%)
* Presented on the Modified Accrual Basis of Accounting
2010-11Budget\Excel\genpurpb.xls FM17
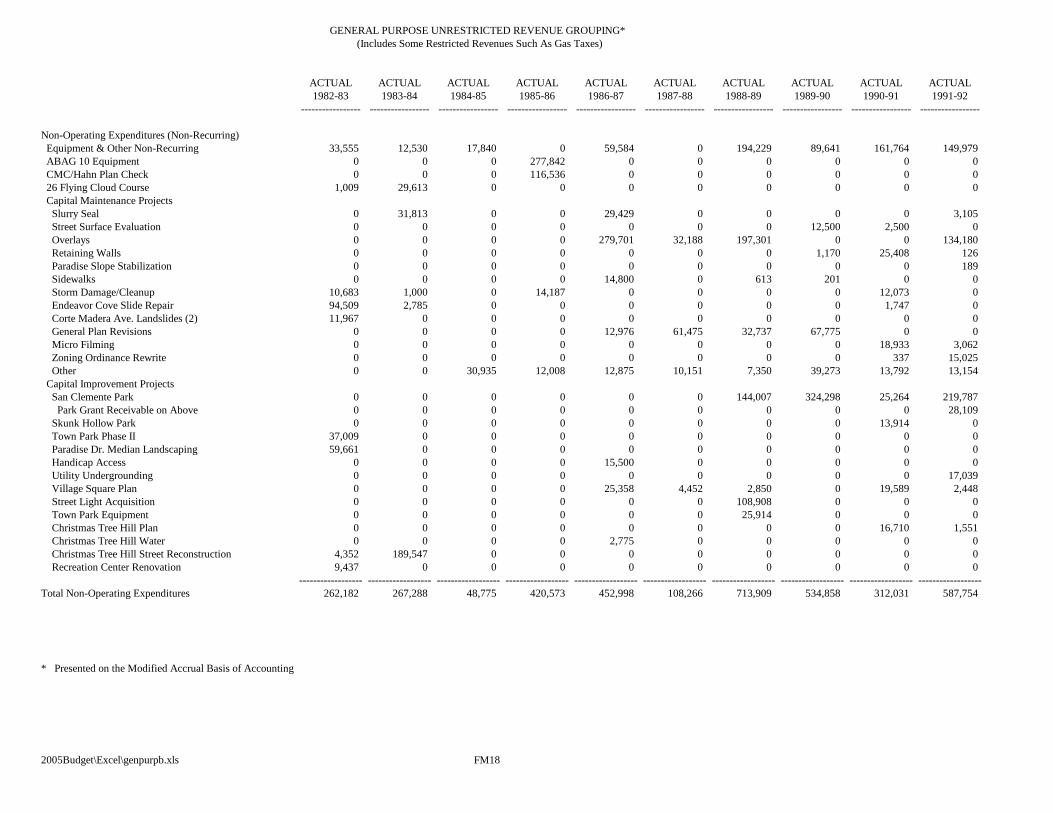
GENERAL PURPOSE UNRESTRICTED REVENUE GROUPING*
(Includes Some Restricted Revenues Such As Gas Taxes)
ACTUAL ACTUAL ACTUAL ACTUAL ACTUAL ACTUAL ACTUAL ACTUAL ACTUAL ACTUAL
1982-83 1983-84 1984-85 1985-86 1986-87 1987-88 1988-89 1989-90 1990-91 1991-92
----------------- ----------------- ----------------- ----------------- ----------------- ----------------- ----------------- ----------------- ----------------- -----------------
Non-Operating Expenditures (Non-Recurring)
Equipment & Other Non-Recurring 33,555 12,530 17,840 0 59,584 0 194,229 89,641 161,764 149,979
ABAG 10 Equipment 0 0 0 277,842 0 0 0 0 0 0
CMC/Hahn Plan Check 0 0 0 116,536 0 0 0 0 0 0
26 Flying Cloud Course 1,009 29,613 0 0 0 0 0 0 0 0
Capital Maintenance Projects
Slurry Seal 0 31,813 0 0 29,429 0 0 0 0 3,105
Street Surface Evaluation 0 0 0 0 0 0 0 12,500 2,500 0
Overlays 0 0 0 0 279,701 32,188 197,301 0 0 134,180
Retaining Walls 0 0 0 0 0 0 0 1,170 25,408 126
Paradise Slope Stabilization 0 0 0 0 0 0 0 0 0 189
Sidewalks 0 0 0 0 14,800 0 613 201 0 0
Storm Damage/Cleanup 10,683 1,000 0 14,187 0 0 0 0 12,073 0
Endeavor Cove Slide Repair 94,509 2,785 0 0 0 0 0 0 1,747 0
Corte Madera Ave. Landslides (2) 11,967 0 0 0 0 0 0 0 0 0
General Plan Revisions 0 0 0 0 12,976 61,475 32,737 67,775 0 0
Micro Filming 0 0 0 0 0 0 0 0 18,933 3,062
Zoning Ordinance Rewrite 0 0 0 0 0 0 0 0 337 15,025
Other 0 0 30,935 12,008 12,875 10,151 7,350 39,273 13,792 13,154
Capital Improvement Projects
San Clemente Park 0 0 0 0 0 0 144,007 324,298 25,264 219,787
Park Grant Receivable on Above 0 0 0 0 0 0 0 0 0 28,109
Skunk Hollow Park 0 0 0 0 0 0 0 0 13,914 0
Town Park Phase II 37,009 0 0 0 0 0 0 0 0 0
Paradise Dr. Median Landscaping 59,661 0 0 0 0 0 0 0 0 0
Handicap Access 0 0 0 0 15,500 0 0 0 0 0
Utility Undergrounding 0 0 0 0 0 0 0 0 0 17,039
Village Square Plan 0 0 0 0 25,358 4,452 2,850 0 19,589 2,448
Street Light Acquisition 0 0 0 0 0 0 108,908 0 0 0
Town Park Equipment 0 0 0 0 0 0 25,914 0 0 0
Christmas Tree Hill Plan 0 0 0 0 0 0 0 0 16,710 1,551
Christmas Tree Hill Water 0 0 0 0 2,775 0 0 0 0 0
Christmas Tree Hill Street Reconstruction 4,352 189,547 0 0 0 0 0 0 0 0
Recreation Center Renovation 9,437 0 0 0 0 0 0 0 0 0
------------------ ------------------ ------------------ ------------------ ------------------ ------------------ ------------------ ------------------ ------------------ ------------------
Total Non-Operating Expenditures 262,182 267,288 48,775 420,573 452,998 108,266 713,909 534,858 312,031 587,754
* Presented on the Modified Accrual Basis of Accounting
2005Budget\Excel\genpurpb.xls FM18
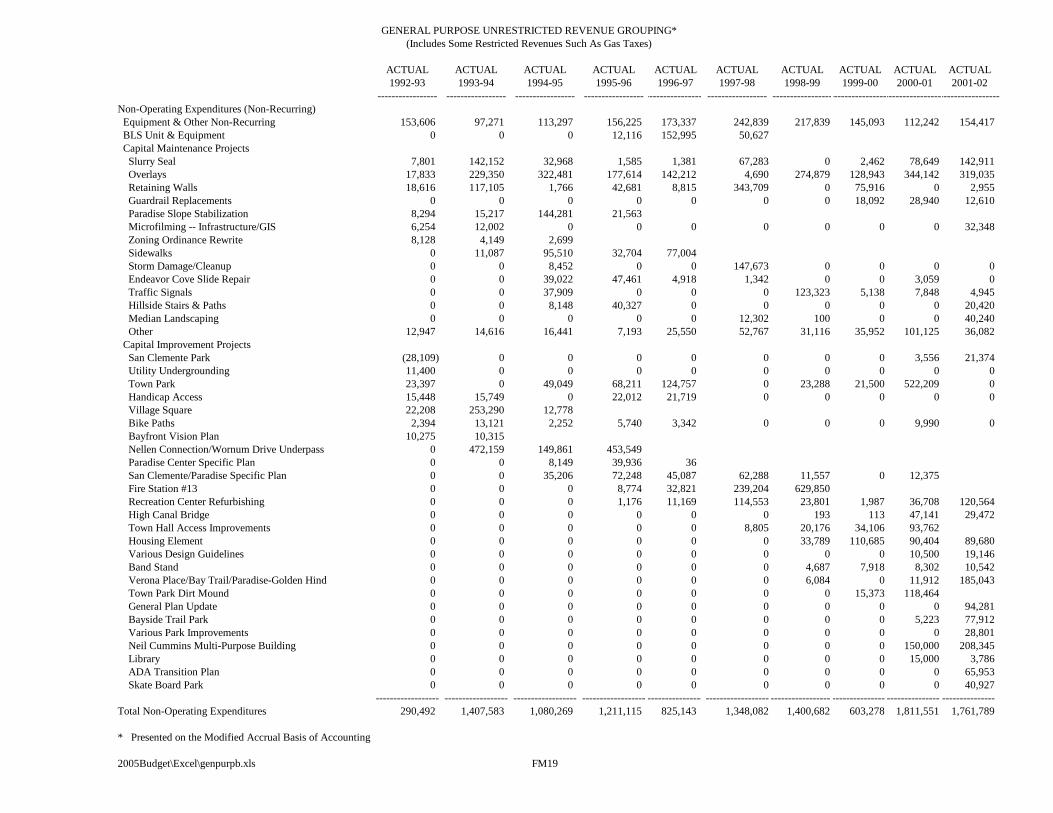
GENERAL PURPOSE UNRESTRICTED REVENUE GROUPING*
(Includes Some Restricted Revenues Such As Gas Taxes)
ACTUAL ACTUAL ACTUAL ACTUAL ACTUAL ACTUAL ACTUAL ACTUAL ACTUAL ACTUAL
1992-93 1993-94 1994-95 1995-96 1996-97 1997-98 1998-99 1999-00 2000-01 2001-02
----------------- ----------------- ----------------- ----------------- ----------------- ----------------- --------------------------------------------------------------------
Non-Operating Expenditures (Non-Recurring)
Equipment & Other Non-Recurring 153,606 97,271 113,297 156,225 173,337 242,839 217,839 145,093 112,242 154,417
BLS Unit & Equipment 0 0 0 12,116 152,995 50,627
Capital Maintenance Projects
Slurry Seal 7,801 142,152 32,968 1,585 1,381 67,283 0 2,462 78,649 142,911
Overlays 17,833 229,350 322,481 177,614 142,212 4,690 274,879 128,943 344,142 319,035
Retaining Walls 18,616 117,105 1,766 42,681 8,815 343,709 0 75,916 0 2,955
Guardrail Replacements 0 0 0 0 0 0 0 18,092 28,940 12,610
Paradise Slope Stabilization 8,294 15,217 144,281 21,563
Microfilming -- Infrastructure/GIS 6,254 12,002 0 0 0 0 0 0 0 32,348
Zoning Ordinance Rewrite 8,128 4,149 2,699
Sidewalks 0 11,087 95,510 32,704 77,004
Storm Damage/Cleanup 0 0 8,452 0 0 147,673 0 0 0 0
Endeavor Cove Slide Repair 0 0 39,022 47,461 4,918 1,342 0 0 3,059 0
Traffic Signals 0 0 37,909 0 0 0 123,323 5,138 7,848 4,945
Hillside Stairs & Paths 0 0 8,148 40,327 0 0 0 0 0 20,420
Median Landscaping 0 0 0 0 0 12,302 100 0 0 40,240
Other 12,947 14,616 16,441 7,193 25,550 52,767 31,116 35,952 101,125 36,082
Capital Improvement Projects
San Clemente Park (28,109) 0 0 0 0 0 0 0 3,556 21,374
Utility Undergrounding 11,400 0 0 0 0 0 0 0 0 0
Town Park 23,397 0 49,049 68,211 124,757 0 23,288 21,500 522,209 0
Handicap Access 15,448 15,749 0 22,012 21,719 0 0 0 0 0
Village Square 22,208 253,290 12,778
Bike Paths 2,394 13,121 2,252 5,740 3,342 0 0 0 9,990 0
Bayfront Vision Plan 10,275 10,315
Nellen Connection/Wornum Drive Underpass 0 472,159 149,861 453,549
Paradise Center Specific Plan 0 0 8,149 39,936 36
San Clemente/Paradise Specific Plan 0 0 35,206 72,248 45,087 62,288 11,557 0 12,375
Fire Station #13 0 0 0 8,774 32,821 239,204 629,850
Recreation Center Refurbishing 0 0 0 1,176 11,169 114,553 23,801 1,987 36,708 120,564
High Canal Bridge 0 0 0 0 0 0 193 113 47,141 29,472
Town Hall Access Improvements 0 0 0 0 0 8,805 20,176 34,106 93,762
Housing Element 0 0 0 0 0 0 33,789 110,685 90,404 89,680
Various Design Guidelines 0 0 0 0 0 0 0 0 10,500 19,146
Band Stand 0 0 0 0 0 0 4,687 7,918 8,302 10,542
Verona Place/Bay Trail/Paradise-Golden Hind 0 0 0 0 0 0 6,084 0 11,912 185,043
Town Park Dirt Mound 0 0 0 0 0 0 0 15,373 118,464
General Plan Update 0 0 0 0 0 0 0 0 0 94,281
Bayside Trail Park 0 0 0 0 0 0 0 0 5,223 77,912
Various Park Improvements 0 0 0 0 0 0 0 0 0 28,801
Neil Cummins Multi-Purpose Building 0 0 0 0 0 0 0 0 150,000 208,345
Library 0 0 0 0 0 0 0 0 15,000 3,786
ADA Transition Plan 0 0 0 0 0 0 0 0 0 65,953
Skate Board Park 0 0 0 0 0 0 0 0 0 40,927
------------------ ------------------ ------------------ ------------------------------------------------------------------------------------------------------------------------------
Total Non-Operating Expenditures 290,492 1,407,583 1,080,269 1,211,115 825,143 1,348,082 1,400,682 603,278 1,811,551 1,761,789
* Presented on the Modified Accrual Basis of Accounting
2005Budget\Excel\genpurpb.xls FM19
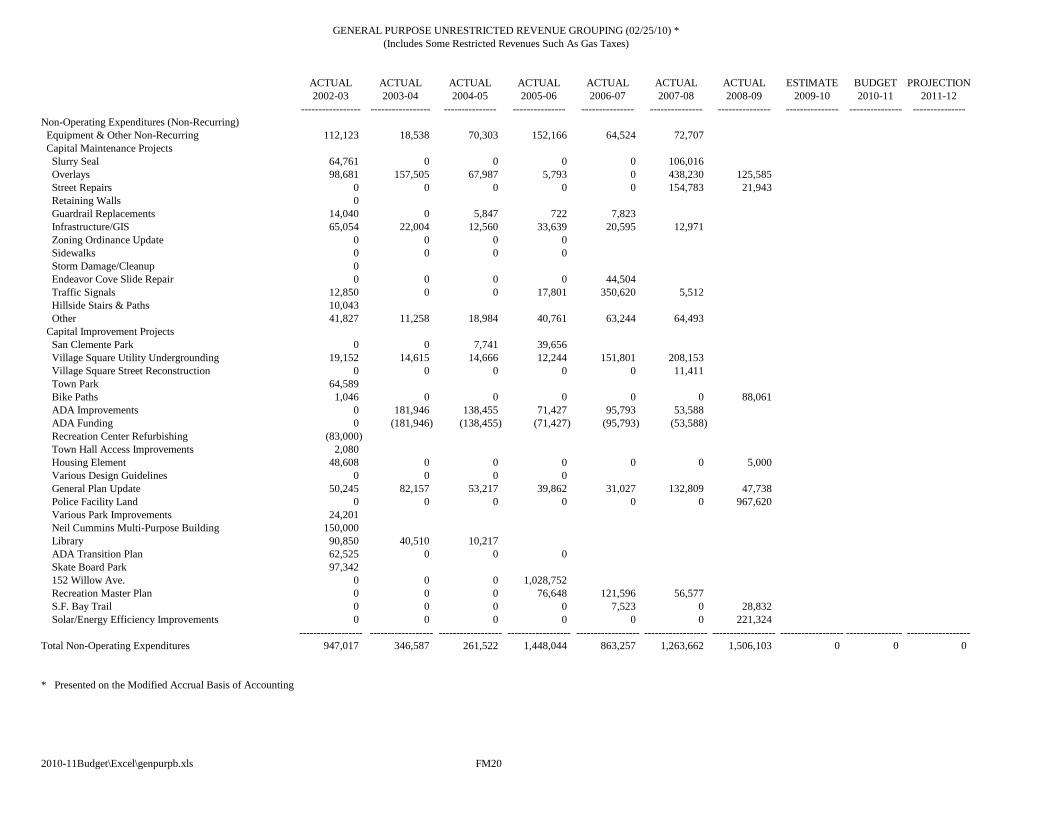
GENERAL PURPOSE UNRESTRICTED REVENUE GROUPING (02/25/10) *
(Includes Some Restricted Revenues Such As Gas Taxes)
ACTUAL ACTUAL ACTUAL ACTUAL ACTUAL ACTUAL ACTUAL ESTIMATE BUDGET PROJECTION
2002-03 2003-04 2004-05 2005-06 2006-07 2007-08 2008-09 2009-10 2010-11 2011-12
----------------- ----------------- --------------- --------------- --------------- --------------- --------------- --------------- --------------- ---------------
Non-Operating Expenditures (Non-Recurring)
Equipment & Other Non-Recurring 112,123 18,538 70,303 152,166 64,524 72,707
Capital Maintenance Projects
Slurry Seal 64,761 0 0 0 0 106,016
Overlays 98,681 157,505 67,987 5,793 0 438,230 125,585
Street Repairs 0 0 0 0 0 154,783 21,943
Retaining Walls 0
Guardrail Replacements 14,040 0 5,847 722 7,823
Infrastructure/GIS 65,054 22,004 12,560 33,639 20,595 12,971
Zoning Ordinance Update 0 0 0 0
Sidewalks 0 0 0 0
Storm Damage/Cleanup 0
Endeavor Cove Slide Repair 0 0 0 0 44,504
Traffic Signals 12,850 0 0 17,801 350,620 5,512
Hillside Stairs & Paths 10,043
Other 41,827 11,258 18,984 40,761 63,244 64,493
Capital Improvement Projects
San Clemente Park 0 0 7,741 39,656
Village Square Utility Undergrounding 19,152 14,615 14,666 12,244 151,801 208,153
Village Square Street Reconstruction 0 0 0 0 0 11,411
Town Park 64,589
Bike Paths 1,046 0 0 0 0 0 88,061
ADA Improvements 0 181,946 138,455 71,427 95,793 53,588
ADA Funding 0 (181,946) (138,455) (71,427) (95,793) (53,588)
Recreation Center Refurbishing (83,000)
Town Hall Access Improvements 2,080
Housing Element 48,608 0 0 0 0 0 5,000
Various Design Guidelines 0 0 0 0
General Plan Update 50,245 82,157 53,217 39,862 31,027 132,809 47,738
Police Facility Land 0 0 0 0 0 0 967,620
Various Park Improvements 24,201
Neil Cummins Multi-Purpose Building 150,000
Library 90,850 40,510 10,217
ADA Transition Plan 62,525 0 0 0
Skate Board Park 97,342
152 Willow Ave. 0 0 0 1,028,752
Recreation Master Plan 0 0 0 76,648 121,596 56,577
S.F. Bay Trail 0 0 0 0 7,523 0 28,832
Solar/Energy Efficiency Improvements 0 0 0 0 0 0 221,324
------------------ ------------------ ------------------ ------------------ ------------------ ------------------ ------------------ ------------------------------------ ------------------
Total Non-Operating Expenditures 947,017 346,587 261,522 1,448,044 863,257 1,263,662 1,506,103 0 0 0
* Presented on the Modified Accrual Basis of Accounting
2010-11Budget\Excel\genpurpb.xls FM20
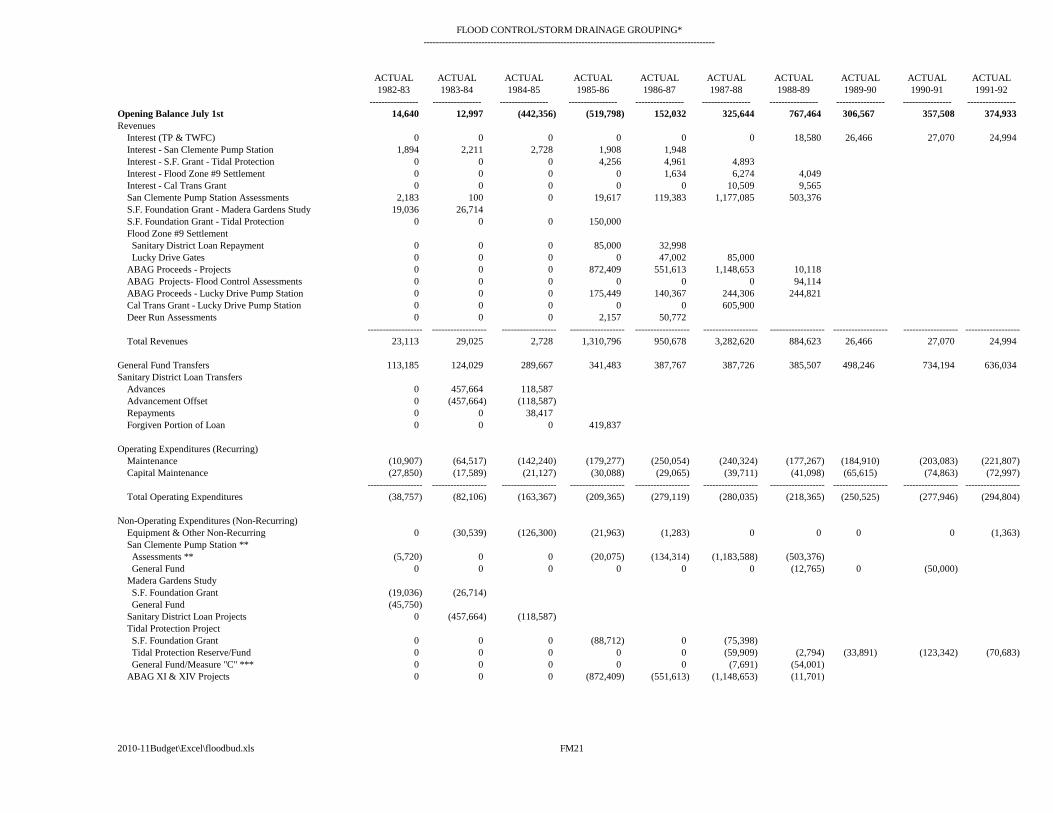
FLOOD CONTROL/STORM DRAINAGE GROUPING*
------------------------------------------------------------------------------------------------
ACTUAL ACTUAL ACTUAL ACTUAL ACTUAL ACTUAL ACTUAL ACTUAL ACTUAL ACTUAL
1982-83 1983-84 1984-85 1985-86 1986-87 1987-88 1988-89 1989-90 1990-91 1991-92
---------------- ---------------- ---------------- ---------------- ---------------- ---------------- ---------------- ---------------- ---------------- ----------------
Opening Balance July 1st 14,640 12,997 (442,356) (519,798) 152,032 325,644 767,464 306,567 357,508 374,933
Revenues
Interest (TP & TWFC) 0 0 0 0 0 0 18,580 26,466 27,070 24,994
Interest - San Clemente Pump Station 1,894 2,211 2,728 1,908 1,948
Interest - S.F. Grant - Tidal Protection 0 0 0 4,256 4,961 4,893
Interest - Flood Zone #9 Settlement 0 0 0 0 1,634 6,274 4,049
Interest - Cal Trans Grant 0 0 0 0 0 10,509 9,565
San Clemente Pump Station Assessments 2,183 100 0 19,617 119,383 1,177,085 503,376
S.F. Foundation Grant - Madera Gardens Study 19,036 26,714
S.F. Foundation Grant - Tidal Protection 0 0 0 150,000
Flood Zone #9 Settlement
Sanitary District Loan Repayment 0 0 0 85,000 32,998
Lucky Drive Gates 0 0 0 0 47,002 85,000
ABAG Proceeds - Projects 0 0 0 872,409 551,613 1,148,653 10,118
ABAG Projects- Flood Control Assessments 0 0 0 0 0 0 94,114
ABAG Proceeds - Lucky Drive Pump Station 0 0 0 175,449 140,367 244,306 244,821
Cal Trans Grant - Lucky Drive Pump Station 0 0 0 0 0 605,900
Deer Run Assessments 0 0 0 2,157 50,772
------------------ ------------------ ------------------ ------------------ ------------------ ------------------ ------------------ ------------------ ------------------ ------------------
Total Revenues 23,113 29,025 2,728 1,310,796 950,678 3,282,620 884,623 26,466 27,070 24,994
General Fund Transfers 113,185 124,029 289,667 341,483 387,767 387,726 385,507 498,246 734,194 636,034
Sanitary District Loan Transfers
Advances 0 457,664 118,587
Advancement Offset 0 (457,664) (118,587)
Repayments 0 0 38,417
Forgiven Portion of Loan 0 0 0 419,837
Operating Expenditures (Recurring)
Maintenance (10,907) (64,517) (142,240) (179,277) (250,054) (240,324) (177,267) (184,910) (203,083) (221,807)
Capital Maintenance (27,850) (17,589) (21,127) (30,088) (29,065) (39,711) (41,098) (65,615) (74,863) (72,997)
------------------ ------------------ ------------------ ------------------ ------------------ ------------------ ------------------ ------------------ ------------------ ------------------
Total Operating Expenditures (38,757) (82,106) (163,367) (209,365) (279,119) (280,035) (218,365) (250,525) (277,946) (294,804)
Non-Operating Expenditures (Non-Recurring)
Equipment & Other Non-Recurring 0 (30,539) (126,300) (21,963) (1,283) 0 0 0 0 (1,363)
San Clemente Pump Station **
Assessments ** (5,720) 0 0 (20,075) (134,314) (1,183,588) (503,376)
General Fund 0 0 0 0 0 0 (12,765) 0 (50,000)
Madera Gardens Study
S.F. Foundation Grant (19,036) (26,714)
General Fund (45,750)
Sanitary District Loan Projects 0 (457,664) (118,587)
Tidal Protection Project
S.F. Foundation Grant 0 0 0 (88,712) 0 (75,398)
Tidal Protection Reserve/Fund 0 0 0 0 0 (59,909) (2,794) (33,891) (123,342) (70,683)
General Fund/Measure "C" *** 0 0 0 0 0 (7,691) (54,001)
ABAG XI & XIV Projects 0 0 0 (872,409) (551,613) (1,148,653) (11,701)
2010-11Budget\Excel\floodbud.xls FM21
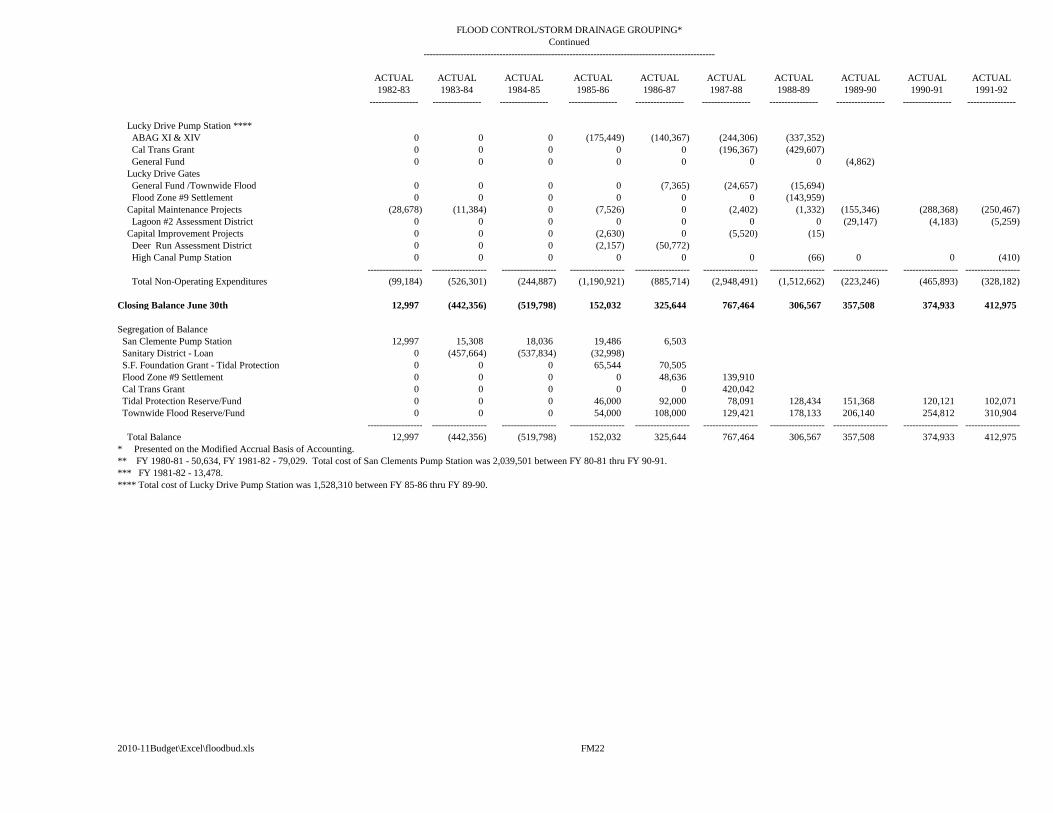
FLOOD CONTROL/STORM DRAINAGE GROUPING*
Continued
------------------------------------------------------------------------------------------------
ACTUAL ACTUAL ACTUAL ACTUAL ACTUAL ACTUAL ACTUAL ACTUAL ACTUAL ACTUAL
1982-83 1983-84 1984-85 1985-86 1986-87 1987-88 1988-89 1989-90 1990-91 1991-92
---------------- ---------------- ---------------- ---------------- ---------------- ---------------- ---------------- ---------------- ---------------- ----------------
Lucky Drive Pump Station ****
ABAG XI & XIV 0 0 0 (175,449) (140,367) (244,306) (337,352)
Cal Trans Grant 0 0 0 0 0 (196,367) (429,607)
General Fund 0 0 0 0 0 0 0 (4,862)
Lucky Drive Gates
General Fund /Townwide Flood 0 0 0 0 (7,365) (24,657) (15,694)
Flood Zone #9 Settlement 0 0 0 0 0 0 (143,959)
Capital Maintenance Projects (28,678) (11,384) 0 (7,526) 0 (2,402) (1,332) (155,346) (288,368) (250,467)
Lagoon #2 Assessment District 0 0 0 0 0 0 0 (29,147) (4,183) (5,259)
Capital Improvement Projects 0 0 0 (2,630) 0 (5,520) (15)
Deer Run Assessment District 0 0 0 (2,157) (50,772)
High Canal Pump Station 0 0 0 0 0 0 (66) 0 0 (410)
------------------ ------------------ ------------------ ------------------ ------------------ ------------------ ------------------ ------------------ ------------------ ------------------
Total Non-Operating Expenditures (99,184) (526,301) (244,887) (1,190,921) (885,714) (2,948,491) (1,512,662) (223,246) (465,893) (328,182)
Closing Balance June 30th 12,997 (442,356) (519,798) 152,032 325,644 767,464 306,567 357,508 374,933 412,975
Segregation of Balance
San Clemente Pump Station 12,997 15,308 18,036 19,486 6,503
Sanitary District - Loan 0 (457,664) (537,834) (32,998)
S.F. Foundation Grant - Tidal Protection 0 0 0 65,544 70,505
Flood Zone #9 Settlement 0 0 0 0 48,636 139,910
Cal Trans Grant 0 0 0 0 0 420,042
Tidal Protection Reserve/Fund 0 0 0 46,000 92,000 78,091 128,434 151,368 120,121 102,071
Townwide Flood Reserve/Fund 0 0 0 54,000 108,000 129,421 178,133 206,140 254,812 310,904
------------------ ------------------ ------------------ ------------------ ------------------ ------------------ ------------------ ------------------ ------------------ ------------------
Total Balance 12,997 (442,356) (519,798) 152,032 325,644 767,464 306,567 357,508 374,933 412,975
* Presented on the Modified Accrual Basis of Accounting.
** FY 1980-81 - 50,634, FY 1981-82 - 79,029. Total cost of San Clements Pump Station was 2,039,501 between FY 80-81 thru FY 90-91.
*** FY 1981-82 - 13,478.
**** Total cost of Lucky Drive Pump Station was 1,528,310 between FY 85-86 thru FY 89-90.
2010-11Budget\Excel\floodbud.xls FM22
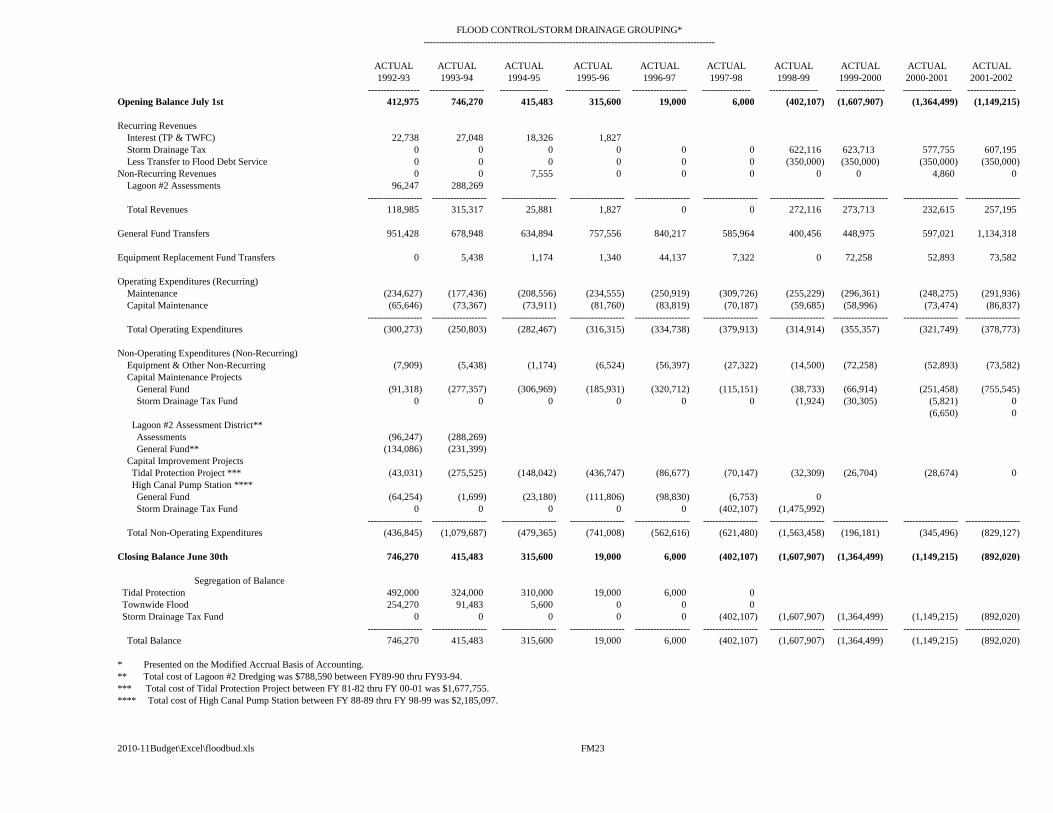
FLOOD CONTROL/STORM DRAINAGE GROUPING*
------------------------------------------------------------------------------------------------
ACTUAL ACTUAL ACTUAL ACTUAL ACTUAL ACTUAL ACTUAL ACTUAL ACTUAL ACTUAL
1992-93 1993-94 1994-95 1995-96 1996-97 1997-98 1998-99 1999-2000 2000-2001 2001-2002
----------------- ------------------ ---------------- ------------------ ------------------ ---------------- ---------------- ---------------- ---------------- ----------------
Opening Balance July 1st 412,975 746,270 415,483 315,600 19,000 6,000 (402,107) (1,607,907) (1,364,499) (1,149,215)
Recurring Revenues
Interest (TP & TWFC) 22,738 27,048 18,326 1,827
Storm Drainage Tax 0 0 0 0 0 0 622,116 623,713 577,755 607,195
Less Transfer to Flood Debt Service 0 0 0 0 0 0 (350,000) (350,000) (350,000) (350,000)
Non-Recurring Revenues 0 0 7,555 0 0 0 0 0 4,860 0
Lagoon #2 Assessments 96,247 288,269
------------------ ------------------ ------------------ ------------------ ------------------ ------------------ ------------------ ------------------ ------------------ ------------------
Total Revenues 118,985 315,317 25,881 1,827 0 0 272,116 273,713 232,615 257,195
General Fund Transfers 951,428 678,948 634,894 757,556 840,217 585,964 400,456 448,975 597,021 1,134,318
Equipment Replacement Fund Transfers 0 5,438 1,174 1,340 44,137 7,322 0 72,258 52,893 73,582
Operating Expenditures (Recurring)
Maintenance (234,627) (177,436) (208,556) (234,555) (250,919) (309,726) (255,229) (296,361) (248,275) (291,936)
Capital Maintenance (65,646) (73,367) (73,911) (81,760) (83,819) (70,187) (59,685) (58,996) (73,474) (86,837)
------------------ ------------------ ------------------ ------------------ ------------------ ------------------ ------------------ ------------------ ------------------ ------------------
Total Operating Expenditures (300,273) (250,803) (282,467) (316,315) (334,738) (379,913) (314,914) (355,357) (321,749) (378,773)
Non-Operating Expenditures (Non-Recurring)
Equipment & Other Non-Recurring (7,909) (5,438) (1,174) (6,524) (56,397) (27,322) (14,500) (72,258) (52,893) (73,582)
Capital Maintenance Projects
General Fund (91,318) (277,357) (306,969) (185,931) (320,712) (115,151) (38,733) (66,914) (251,458) (755,545)
Storm Drainage Tax Fund 0 0 0 0 0 0 (1,924) (30,305) (5,821) 0
(6,650) 0
Lagoon #2 Assessment District**
Assessments (96,247) (288,269)
General Fund** (134,086) (231,399)
Capital Improvement Projects
Tidal Protection Project *** (43,031) (275,525) (148,042) (436,747) (86,677) (70,147) (32,309) (26,704) (28,674) 0
High Canal Pump Station ****
General Fund (64,254) (1,699) (23,180) (111,806) (98,830) (6,753) 0
Storm Drainage Tax Fund 0 0 0 0 0 (402,107) (1,475,992)
------------------ ------------------ ------------------ ------------------ ------------------ ------------------ ------------------ ------------------ ------------------ ------------------
Total Non-Operating Expenditures (436,845) (1,079,687) (479,365) (741,008) (562,616) (621,480) (1,563,458) (196,181) (345,496) (829,127)
Closing Balance June 30th 746,270 415,483 315,600 19,000 6,000 (402,107) (1,607,907) (1,364,499) (1,149,215) (892,020)
Segregation of Balance
Tidal Protection 492,000 324,000 310,000 19,000 6,000 0
Townwide Flood 254,270 91,483 5,600 0 0 0
Storm Drainage Tax Fund 0 0 0 0 0 (402,107) (1,607,907) (1,364,499) (1,149,215) (892,020)
------------------ ------------------ ------------------ ------------------ ------------------ ------------------ ------------------ ------------------ ------------------ ------------------
Total Balance 746,270 415,483 315,600 19,000 6,000 (402,107) (1,607,907) (1,364,499) (1,149,215) (892,020)
* Presented on the Modified Accrual Basis of Accounting.
** Total cost of Lagoon #2 Dredging was $788,590 between FY89-90 thru FY93-94.
*** Total cost of Tidal Protection Project between FY 81-82 thru FY 00-01 was $1,677,755.
**** Total cost of High Canal Pump Station between FY 88-89 thru FY 98-99 was $2,185,097.
2010-11Budget\Excel\floodbud.xls FM23
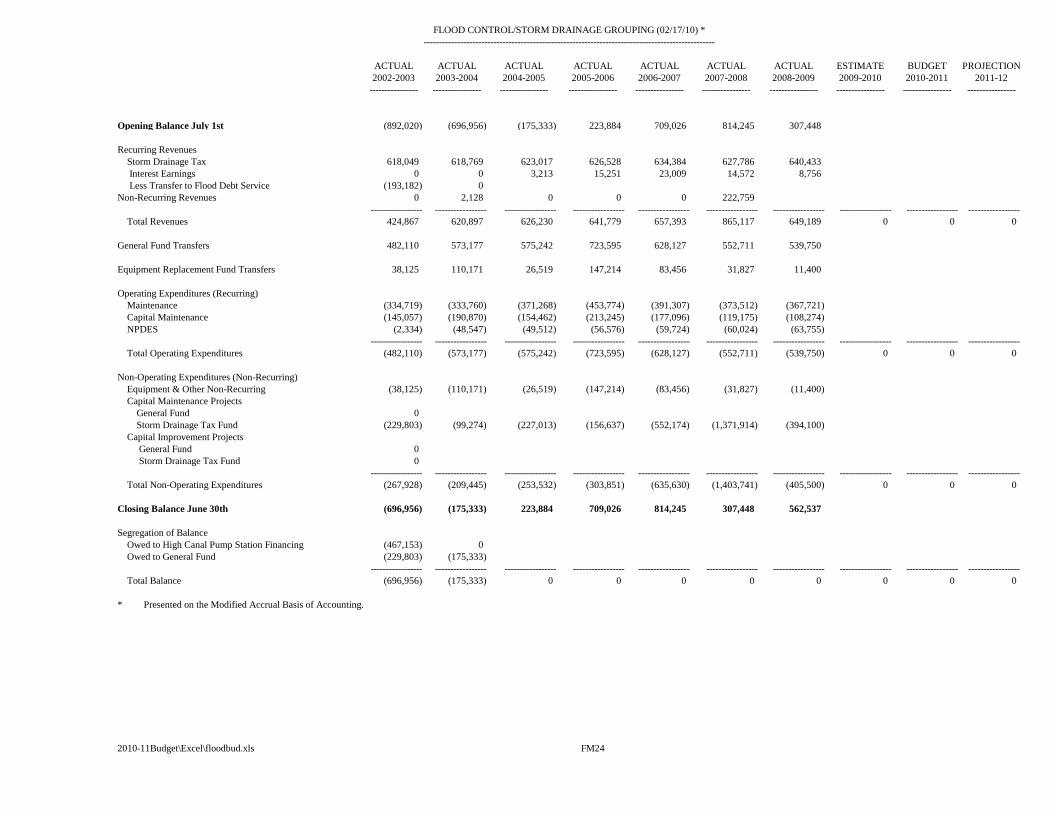
FLOOD CONTROL/STORM DRAINAGE GROUPING (02/17/10) *
------------------------------------------------------------------------------------------------
ACTUAL ACTUAL ACTUAL ACTUAL ACTUAL ACTUAL ACTUAL ESTIMATE BUDGET PROJECTION
2002-2003 2003-2004 2004-2005 2005-2006 2006-2007 2007-2008 2008-2009 2009-2010 2010-2011 2011-12
---------------- ---------------- ---------------- ---------------- ---------------- ---------------- ---------------- ---------------- ---------------- ----------------
Opening Balance July 1st (892,020) (696,956) (175,333) 223,884 709,026 814,245 307,448
Recurring Revenues
Storm Drainage Tax 618,049 618,769 623,017 626,528 634,384 627,786 640,433
Interest Earnings 0 0 3,213 15,251 23,009 14,572 8,756
Less Transfer to Flood Debt Service (193,182) 0
Non-Recurring Revenues 0 2,128 0 0 0 222,759
----------------- ----------------- ----------------- ----------------- ----------------- ----------------- ----------------- ----------------- ----------------- -----------------
Total Revenues 424,867 620,897 626,230 641,779 657,393 865,117 649,189 0 0 0
General Fund Transfers 482,110 573,177 575,242 723,595 628,127 552,711 539,750
Equipment Replacement Fund Transfers 38,125 110,171 26,519 147,214 83,456 31,827 11,400
Operating Expenditures (Recurring)
Maintenance (334,719) (333,760) (371,268) (453,774) (391,307) (373,512) (367,721)
Capital Maintenance (145,057) (190,870) (154,462) (213,245) (177,096) (119,175) (108,274)
NPDES (2,334) (48,547) (49,512) (56,576) (59,724) (60,024) (63,755)
----------------- ----------------- ----------------- ----------------- ----------------- ----------------- ----------------- ----------------- ----------------- -----------------
Total Operating Expenditures (482,110) (573,177) (575,242) (723,595) (628,127) (552,711) (539,750) 0 0 0
Non-Operating Expenditures (Non-Recurring)
Equipment & Other Non-Recurring (38,125) (110,171) (26,519) (147,214) (83,456) (31,827) (11,400)
Capital Maintenance Projects
General Fund 0
Storm Drainage Tax Fund (229,803) (99,274) (227,013) (156,637) (552,174) (1,371,914) (394,100)
Capital Improvement Projects
General Fund 0
Storm Drainage Tax Fund 0
----------------- ----------------- ----------------- ----------------- ----------------- ----------------- ----------------- ----------------- ----------------- -----------------
Total Non-Operating Expenditures (267,928) (209,445) (253,532) (303,851) (635,630) (1,403,741) (405,500) 0 0 0
Closing Balance June 30th (696,956) (175,333) 223,884 709,026 814,245 307,448 562,537
Segregation of Balance
Owed to High Canal Pump Station Financing (467,153) 0
Owed to General Fund (229,803) (175,333)
----------------- ----------------- ----------------- ----------------- ----------------- ----------------- ----------------- ----------------- ----------------- -----------------
Total Balance (696,956) (175,333) 0 0 0 0 0 0 0 0
* Presented on the Modified Accrual Basis of Accounting.
2010-11Budget\Excel\floodbud.xls FM24
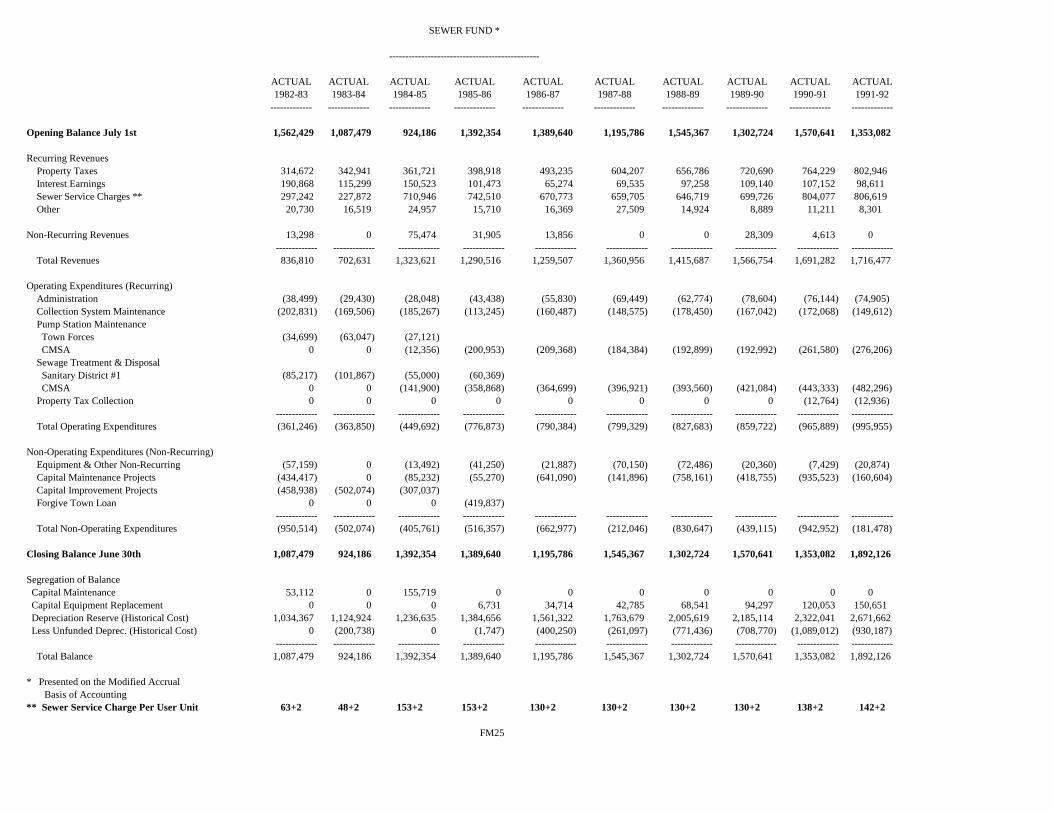
ACTUAL ACTUAL ACTUAL ACTUAL ACTUAL ACTUAL ACTUAL ACTUAL ACTUAL ACTUAL
1982-83 1983-84 1984-85 1985-86 1986-87 1987-88 1988-89 1989-90 1990-91 1991-92
------------- ------------- ------------- ------------- ------------- ------------- ------------- ------------- ------------- -------------
Opening Balance July 1st 1,562,429 1,087,479 924,186 1,392,354 1,389,640 1,195,786 1,545,367 1,302,724 1,570,641 1,353,082
Recurring Revenues
Property Taxes 314,672 342,941 361,721 398,918 493,235 604,207 656,786 720,690 764,229 802,946
Interest Earnings 190,868 115,299 150,523 101,473 65,274 69,535 97,258 109,140 107,152 98,611
Sewer Service Charges ** 297,242 227,872 710,946 742,510 670,773 659,705 646,719 699,726 804,077 806,619
Other 20,730 16,519 24,957 15,710 16,369 27,509 14,924 8,889 11,211 8,301
Non-Recurring Revenues 13,298 0 75,474 31,905 13,856 0 0 28,309 4,613 0
------------- ------------- ------------- ------------- ------------- ------------- ------------- ------------- ------------- -------------
Total Revenues 836,810 702,631 1,323,621 1,290,516 1,259,507 1,360,956 1,415,687 1,566,754 1,691,282 1,716,477
Operating Expenditures (Recurring)
Administration (38,499) (29,430) (28,048) (43,438) (55,830) (69,449) (62,774) (78,604) (76,144) (74,905)
Collection System Maintenance (202,831) (169,506) (185,267) (113,245) (160,487) (148,575) (178,450) (167,042) (172,068) (149,612)
Pump Station Maintenance
Town Forces (34,699) (63,047) (27,121)
CMSA 0 0 (12,356) (200,953) (209,368) (184,384) (192,899) (192,992) (261,580) (276,206)
Sewage Treatment & Disposal
Sanitary District #1 (85,217) (101,867) (55,000) (60,369)
CMSA 0 0 (141,900) (358,868) (364,699) (396,921) (393,560) (421,084) (443,333) (482,296)
Property Tax Collection 0 0 0 0 0 0 0 0 (12,764) (12,936)
------------- ------------- ------------- ------------- ------------- ------------- ------------- ------------- ------------- -------------
Total Operating Expenditures (361,246) (363,850) (449,692) (776,873) (790,384) (799,329) (827,683) (859,722) (965,889) (995,955)
Non-Operating Expenditures (Non-Recurring)
Equipment & Other Non-Recurring (57,159) 0 (13,492) (41,250) (21,887) (70,150) (72,486) (20,360) (7,429) (20,874)
Capital Maintenance Projects (434,417) 0 (85,232) (55,270) (641,090) (141,896) (758,161) (418,755) (935,523) (160,604)
Capital Improvement Projects (458,938) (502,074) (307,037)
Forgive Town Loan 0 0 0 (419,837)
------------- ------------- ------------- ------------- ------------- ------------- ------------- ------------- ------------- -------------
Total Non-Operating Expenditures (950,514) (502,074) (405,761) (516,357) (662,977) (212,046) (830,647) (439,115) (942,952) (181,478)
Closing Balance June 30th 1,087,479 924,186 1,392,354 1,389,640 1,195,786 1,545,367 1,302,724 1,570,641 1,353,082 1,892,126
Segregation of Balance
Capital Maintenance 53,112 0 155,719 0 0 0 0 0 0 0
Capital Equipment Replacement 0 0 0 6,731 34,714 42,785 68,541 94,297 120,053 150,651
Depreciation Reserve (Historical Cost) 1,034,367 1,124,924 1,236,635 1,384,656 1,561,322 1,763,679 2,005,619 2,185,114 2,322,041 2,671,662
Less Unfunded Deprec. (Historical Cost) 0 (200,738) 0 (1,747) (400,250) (261,097) (771,436) (708,770) (1,089,012) (930,187)
------------- ------------- ------------- ------------- ------------- ------------- ------------- ------------- ------------- -------------
Total Balance 1,087,479 924,186 1,392,354 1,389,640 1,195,786 1,545,367 1,302,724 1,570,641 1,353,082 1,892,126
* Presented on the Modified Accrual
Basis of Accounting
** Sewer Service Charge Per User Unit 63+2 48+2 153+2 153+2 130+2 130+2 130+2 130+2 138+2 142+2
FM25
SEWER FUND *
-----------------------------------------------
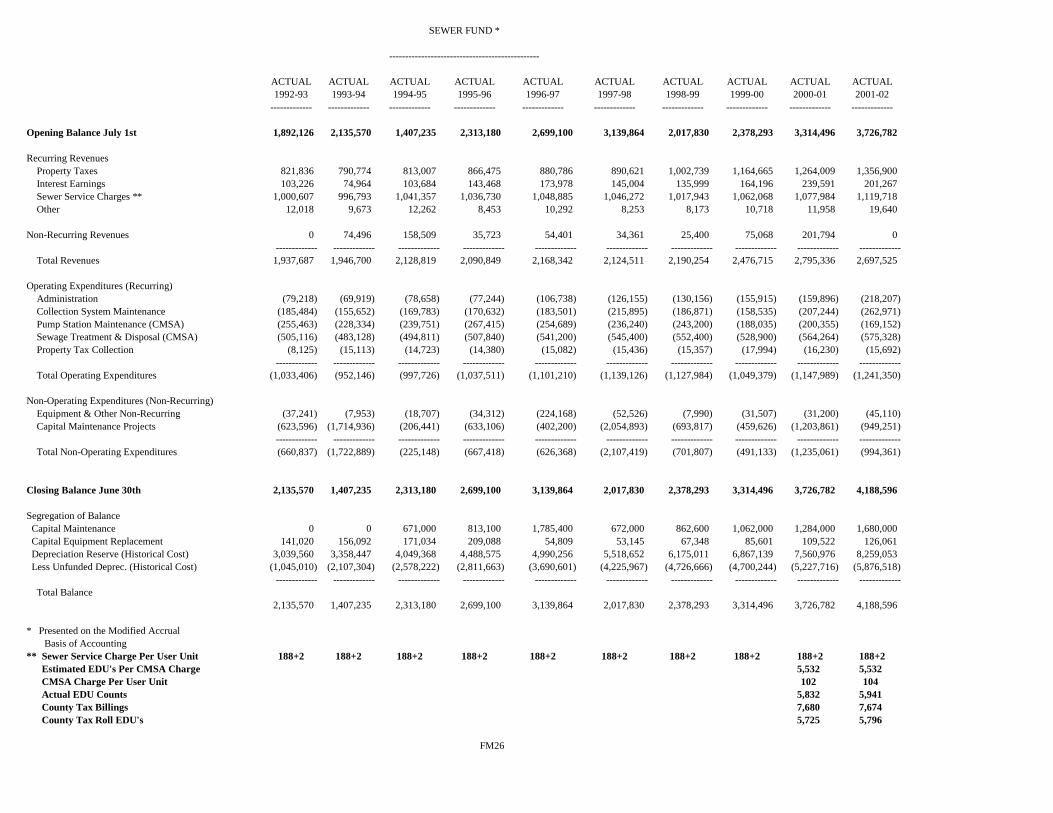
ACTUAL ACTUAL ACTUAL ACTUAL ACTUAL ACTUAL ACTUAL ACTUAL ACTUAL ACTUAL
1992-93 1993-94 1994-95 1995-96 1996-97 1997-98 1998-99 1999-00 2000-01 2001-02
------------- ------------- ------------- ------------- ------------- ------------- ------------- ------------- ------------- -------------
Opening Balance July 1st 1,892,126 2,135,570 1,407,235 2,313,180 2,699,100 3,139,864 2,017,830 2,378,293 3,314,496 3,726,782
Recurring Revenues
Property Taxes 821,836 790,774 813,007 866,475 880,786 890,621 1,002,739 1,164,665 1,264,009 1,356,900
Interest Earnings 103,226 74,964 103,684 143,468 173,978 145,004 135,999 164,196 239,591 201,267
Sewer Service Charges ** 1,000,607 996,793 1,041,357 1,036,730 1,048,885 1,046,272 1,017,943 1,062,068 1,077,984 1,119,718
Other 12,018 9,673 12,262 8,453 10,292 8,253 8,173 10,718 11,958 19,640
Non-Recurring Revenues 0 74,496 158,509 35,723 54,401 34,361 25,400 75,068 201,794 0
------------- ------------- ------------- ------------- ------------- ------------- ------------- ------------- ------------- -------------
Total Revenues 1,937,687 1,946,700 2,128,819 2,090,849 2,168,342 2,124,511 2,190,254 2,476,715 2,795,336 2,697,525
Operating Expenditures (Recurring)
Administration (79,218) (69,919) (78,658) (77,244) (106,738) (126,155) (130,156) (155,915) (159,896) (218,207)
Collection System Maintenance (185,484) (155,652) (169,783) (170,632) (183,501) (215,895) (186,871) (158,535) (207,244) (262,971)
Pump Station Maintenance (CMSA) (255,463) (228,334) (239,751) (267,415) (254,689) (236,240) (243,200) (188,035) (200,355) (169,152)
Sewage Treatment & Disposal (CMSA) (505,116) (483,128) (494,811) (507,840) (541,200) (545,400) (552,400) (528,900) (564,264) (575,328)
Property Tax Collection (8,125) (15,113) (14,723) (14,380) (15,082) (15,436) (15,357) (17,994) (16,230) (15,692)
------------- ------------- ------------- ------------- ------------- ------------- ------------- ------------- ------------- -------------
Total Operating Expenditures (1,033,406) (952,146) (997,726) (1,037,511) (1,101,210) (1,139,126) (1,127,984) (1,049,379) (1,147,989) (1,241,350)
Non-Operating Expenditures (Non-Recurring)
Equipment & Other Non-Recurring (37,241) (7,953) (18,707) (34,312) (224,168) (52,526) (7,990) (31,507) (31,200) (45,110)
Capital Maintenance Projects (623,596) (1,714,936) (206,441) (633,106) (402,200) (2,054,893) (693,817) (459,626) (1,203,861) (949,251)
------------- ------------- ------------- ------------- ------------- ------------- ------------- ------------- ------------- -------------
Total Non-Operating Expenditures (660,837) (1,722,889) (225,148) (667,418) (626,368) (2,107,419) (701,807) (491,133) (1,235,061) (994,361)
Closing Balance June 30th 2,135,570 1,407,235 2,313,180 2,699,100 3,139,864 2,017,830 2,378,293 3,314,496 3,726,782 4,188,596
Segregation of Balance
Capital Maintenance 0 0 671,000 813,100 1,785,400 672,000 862,600 1,062,000 1,284,000 1,680,000
Capital Equipment Replacement 141,020 156,092 171,034 209,088 54,809 53,145 67,348 85,601 109,522 126,061
Depreciation Reserve (Historical Cost) 3,039,560 3,358,447 4,049,368 4,488,575 4,990,256 5,518,652 6,175,011 6,867,139 7,560,976 8,259,053
Less Unfunded Deprec. (Historical Cost) (1,045,010) (2,107,304) (2,578,222) (2,811,663) (3,690,601) (4,225,967) (4,726,666) (4,700,244) (5,227,716) (5,876,518)
------------- ------------- ------------- ------------- ------------- ------------- ------------- ------------- ------------- -------------
Total Balance
2,135,570 1,407,235 2,313,180 2,699,100 3,139,864 2,017,830 2,378,293 3,314,496 3,726,782 4,188,596
* Presented on the Modified Accrual
Basis of Accounting
** Sewer Service Charge Per User Unit 188+2 188+2 188+2 188+2 188+2 188+2 188+2 188+2 188+2 188+2
Estimated EDU's Per CMSA Charge 5,532 5,532
CMSA Charge Per User Unit 102 104
Actual EDU Counts 5,832 5,941
County Tax Billings 7,680 7,674
County Tax Roll EDU's 5,725 5,796
FM26
SEWER FUND *
-----------------------------------------------
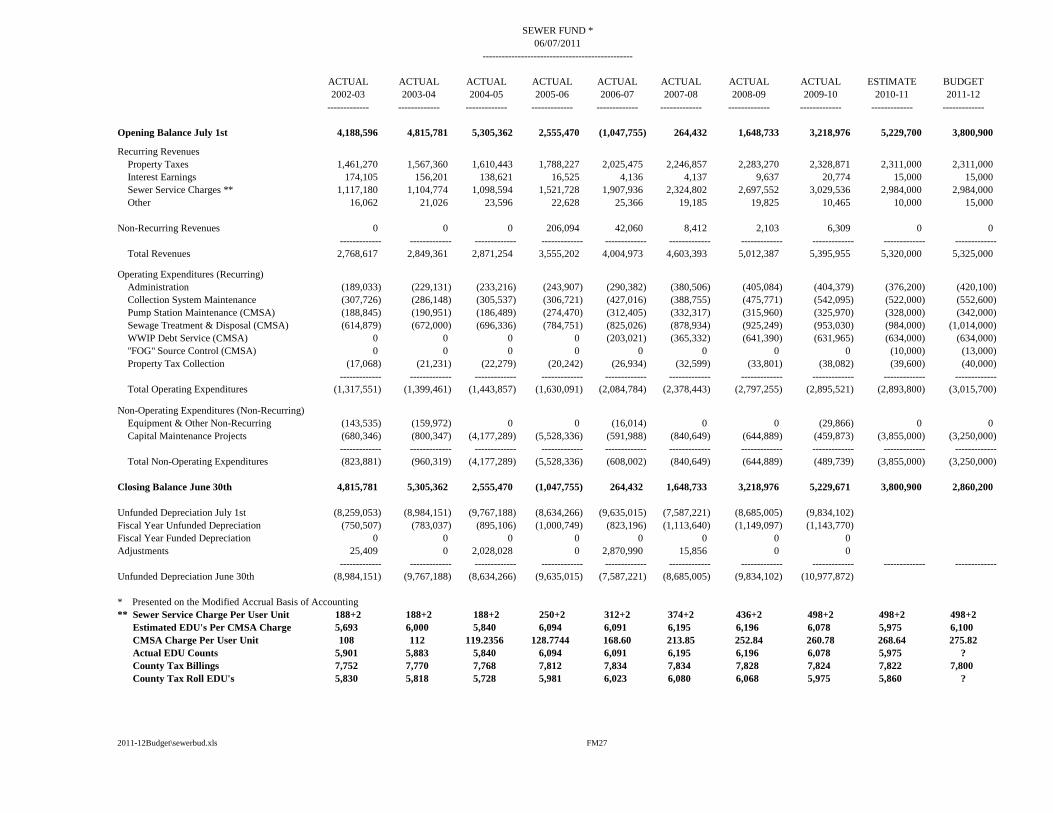
ACTUAL ACTUAL ACTUAL ACTUAL ACTUAL ACTUAL ACTUAL ACTUAL ESTIMATE BUDGET
2002-03 2003-04 2004-05 2005-06 2006-07 2007-08 2008-09 2009-10 2010-11 2011-12
------------- ------------- ------------- ------------- ------------- ------------- ------------- ------------- ------------- -------------
Opening Balance July 1st 4,188,596 4,815,781 5,305,362 2,555,470 (1,047,755) 264,432 1,648,733 3,218,976 5,229,700 3,800,900
Recurring Revenues
Property Taxes 1,461,270 1,567,360 1,610,443 1,788,227 2,025,475 2,246,857 2,283,270 2,328,871 2,311,000 2,311,000
Interest Earnings 174,105 156,201 138,621 16,525 4,136 4,137 9,637 20,774 15,000 15,000
Sewer Service Charges ** 1,117,180 1,104,774 1,098,594 1,521,728 1,907,936 2,324,802 2,697,552 3,029,536 2,984,000 2,984,000
Other 16,062 21,026 23,596 22,628 25,366 19,185 19,825 10,465 10,000 15,000
Non-Recurring Revenues 0 0 0 206,094 42,060 8,412 2,103 6,309 0 0
------------- ------------- ------------- ------------- ------------- ------------- ------------- ------------- ------------- -------------
Total Revenues 2,768,617 2,849,361 2,871,254 3,555,202 4,004,973 4,603,393 5,012,387 5,395,955 5,320,000 5,325,000
Operating Expenditures (Recurring)
Administration (189,033) (229,131) (233,216) (243,907) (290,382) (380,506) (405,084) (404,379) (376,200) (420,100)
Collection System Maintenance (307,726) (286,148) (305,537) (306,721) (427,016) (388,755) (475,771) (542,095) (522,000) (552,600)
Pump Station Maintenance (CMSA) (188,845) (190,951) (186,489) (274,470) (312,405) (332,317) (315,960) (325,970) (328,000) (342,000)
Sewage Treatment & Disposal (CMSA) (614,879) (672,000) (696,336) (784,751) (825,026) (878,934) (925,249) (953,030) (984,000) (1,014,000)
WWIP Debt Service (CMSA) 0 0 0 0 (203,021) (365,332) (641,390) (631,965) (634,000) (634,000)
"FOG" Source Control (CMSA) 0 0 0 0 0 0 0 0 (10,000) (13,000)
Property Tax Collection (17,068) (21,231) (22,279) (20,242) (26,934) (32,599) (33,801) (38,082) (39,600) (40,000)
------------- ------------- ------------- ------------- ------------- ------------- ------------- ------------- ------------- -------------
Total Operating Expenditures (1,317,551) (1,399,461) (1,443,857) (1,630,091) (2,084,784) (2,378,443) (2,797,255) (2,895,521) (2,893,800) (3,015,700)
Non-Operating Expenditures (Non-Recurring)
Equipment & Other Non-Recurring (143,535) (159,972) 0 0 (16,014) 0 0 (29,866) 0 0
Capital Maintenance Projects (680,346) (800,347) (4,177,289) (5,528,336) (591,988) (840,649) (644,889) (459,873) (3,855,000) (3,250,000)
------------- ------------- ------------- ------------- ------------- ------------- ------------- ------------- ------------- -------------
Total Non-Operating Expenditures (823,881) (960,319) (4,177,289) (5,528,336) (608,002) (840,649) (644,889) (489,739) (3,855,000) (3,250,000)
Closing Balance June 30th 4,815,781 5,305,362 2,555,470 (1,047,755) 264,432 1,648,733 3,218,976 5,229,671 3,800,900 2,860,200
Unfunded Depreciation July 1st (8,259,053) (8,984,151) (9,767,188) (8,634,266) (9,635,015) (7,587,221) (8,685,005) (9,834,102)
Fiscal Year Unfunded Depreciation (750,507) (783,037) (895,106) (1,000,749) (823,196) (1,113,640) (1,149,097) (1,143,770)
Fiscal Year Funded Depreciation 0 0 0 0 0 0 0 0
Adjustments 25,409 0 2,028,028 0 2,870,990 15,856 0 0
------------- ------------- ------------- ------------- ------------- ------------- ------------- ------------- ------------- -------------
Unfunded Depreciation June 30th (8,984,151) (9,767,188) (8,634,266) (9,635,015) (7,587,221) (8,685,005) (9,834,102) (10,977,872)
* Presented on the Modified Accrual Basis of Accounting
** Sewer Service Charge Per User Unit 188+2 188+2 188+2 250+2 312+2 374+2 436+2 498+2 498+2 498+2
Estimated EDU's Per CMSA Charge 5,693 6,000 5,840 6,094 6,091 6,195 6,196 6,078 5,975 6,100
CMSA Charge Per User Unit 108 112 119.2356 128.7744 168.60 213.85 252.84 260.78 268.64 275.82
Actual EDU Counts 5,901 5,883 5,840 6,094 6,091 6,195 6,196 6,078 5,975 ?
County Tax Billings 7,752 7,770 7,768 7,812 7,834 7,834 7,828 7,824 7,822 7,800
County Tax Roll EDU's 5,830 5,818 5,728 5,981 6,023 6,080 6,068 5,975 5,860 ?
2011-12Budget\sewerbud.xls FM27
-----------------------------------------------
SEWER FUND *
06/07/2011
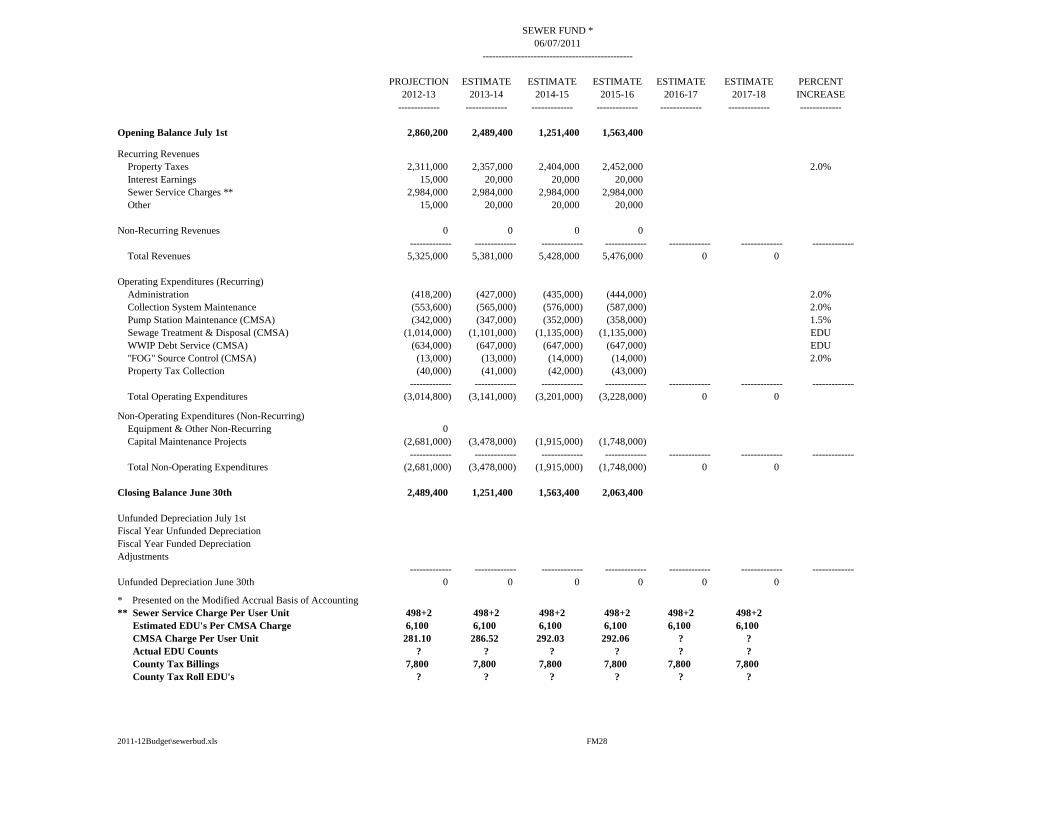
PROJECTION ESTIMATE ESTIMATE ESTIMATE ESTIMATE ESTIMATE PERCENT
2012-13 2013-14 2014-15 2015-16 2016-17 2017-18 INCREASE
------------- ------------- ------------- ------------- ------------- ------------- -------------
Opening Balance July 1st 2,860,200 2,489,400 1,251,400 1,563,400
Recurring Revenues
Property Taxes 2,311,000 2,357,000 2,404,000 2,452,000 2.0%
Interest Earnings 15,000 20,000 20,000 20,000
Sewer Service Charges ** 2,984,000 2,984,000 2,984,000 2,984,000
Other 15,000 20,000 20,000 20,000
Non-Recurring Revenues 0 0 0 0
------------- ------------- ------------- ------------- ------------- ------------- -------------
Total Revenues 5,325,000 5,381,000 5,428,000 5,476,000 0 0
Operating Expenditures (Recurring)
Administration (418,200) (427,000) (435,000) (444,000) 2.0%
Collection System Maintenance (553,600) (565,000) (576,000) (587,000) 2.0%
Pump Station Maintenance (CMSA) (342,000) (347,000) (352,000) (358,000) 1.5%
Sewage Treatment & Disposal (CMSA) (1,014,000) (1,101,000) (1,135,000) (1,135,000) EDU
WWIP Debt Service (CMSA) (634,000) (647,000) (647,000) (647,000) EDU
"FOG" Source Control (CMSA) (13,000) (13,000) (14,000) (14,000) 2.0%
Property Tax Collection (40,000) (41,000) (42,000) (43,000)
------------- ------------- ------------- ------------- ------------- ------------- -------------
Total Operating Expenditures (3,014,800) (3,141,000) (3,201,000) (3,228,000) 0 0
Non-Operating Expenditures (Non-Recurring)
Equipment & Other Non-Recurring 0
Capital Maintenance Projects (2,681,000) (3,478,000) (1,915,000) (1,748,000)
------------- ------------- ------------- ------------- ------------- ------------- -------------
Total Non-Operating Expenditures (2,681,000) (3,478,000) (1,915,000) (1,748,000) 0 0
Closing Balance June 30th 2,489,400 1,251,400 1,563,400 2,063,400
Unfunded Depreciation July 1st
Fiscal Year Unfunded Depreciation
Fiscal Year Funded Depreciation
Adjustments
------------- ------------- ------------- ------------- ------------- ------------- -------------
Unfunded Depreciation June 30th 0 0 0 0 0 0
* Presented on the Modified Accrual Basis of Accounting
** Sewer Service Charge Per User Unit 498+2 498+2 498+2 498+2 498+2 498+2
Estimated EDU's Per CMSA Charge 6,100 6,100 6,100 6,100 6,100 6,100
CMSA Charge Per User Unit 281.10 286.52 292.03 292.06 ? ?
Actual EDU Counts ? ? ? ? ? ?
County Tax Billings 7,800 7,800 7,800 7,800 7,800 7,800
County Tax Roll EDU's ? ? ? ? ? ?
2011-12Budget\sewerbud.xls FM28
06/07/2011
-----------------------------------------------
SEWER FUND *

2011-12Budget\GenCapitalProjectsList.xls GC1
GENERAL CAPITAL
PROJECTS & STUDIES
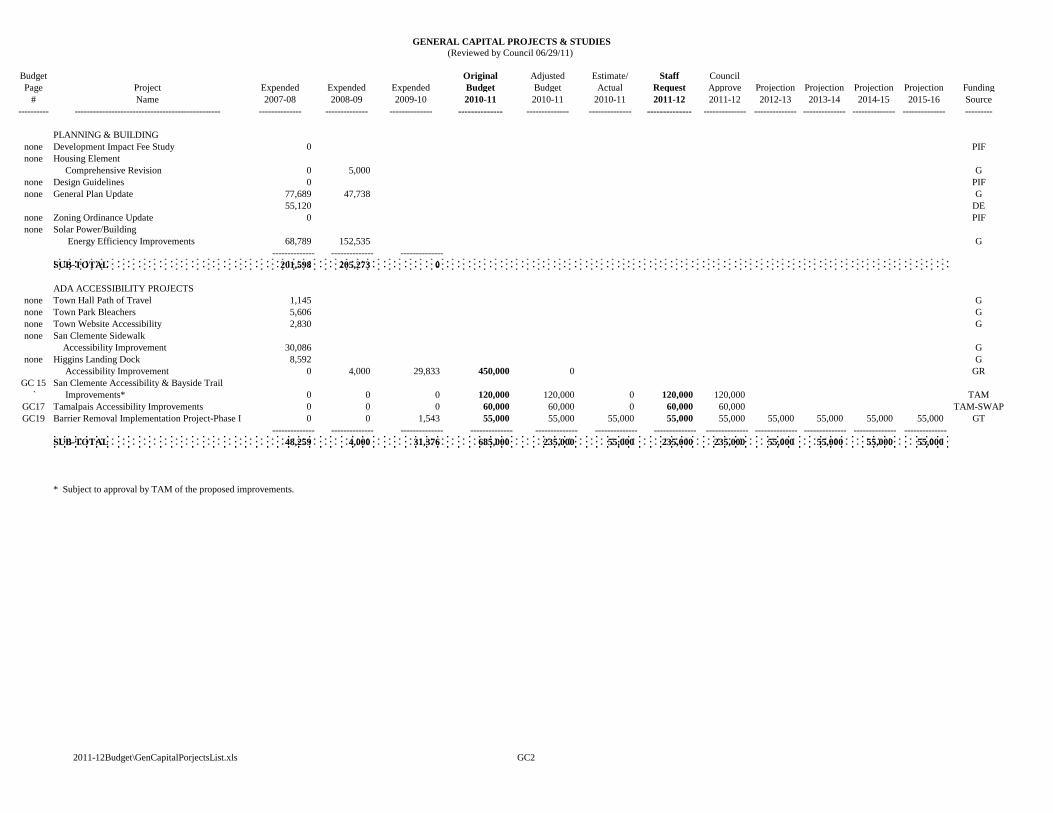
GENERAL CAPITAL PROJECTS & STUDIES
(Reviewed by Council 06/29/11)
Budget Original Adjusted Estimate/ Staff Council
Page Project Expended Expended Expended Budget Budget Actual Request Approve Projection Projection Projection Projection Funding
# Name 2007-08 2008-09 2009-10 2010-11 2010-11 2010-11 2011-12 2011-12 2012-13 2013-14 2014-15 2015-16 Source
---------- ------------------------------------------------ -------------- -------------- -------------- -------------- -------------- -------------- -------------- -------------- -------------- -------------- -------------- -------------- ---------
PLANNING & BUILDING
none Development Impact Fee Study 0 PIF
none Housing Element
Comprehensive Revision 0 5,000 G
none Design Guidelines 0 PIF
none General Plan Update 77,689 47,738 G
55,120 DE
none Zoning Ordinance Update 0 PIF
none Solar Power/Building
Energy Efficiency Improvements 68,789 152,535 G
-------------- -------------- --------------
SUB-TOTAL 201,598 205,273 0
ADA ACCESSIBILITY PROJECTS
none Town Hall Path of Travel 1,145 G
none Town Park Bleachers 5,606 G
none Town Website Accessibility 2,830 G
none San Clemente Sidewalk
Accessibility Improvement 30,086 G
none Higgins Landing Dock 8,592 G
Accessibility Improvement 0 4,000 29,833 450,000 0 GR
GC 15 San Clemente Accessibility & Bayside Trail
` Improvements* 0 0 0 120,000 120,000 0 120,000 120,000 TAM
GC17 Tamalpais Accessibility Improvements 0 0 0 60,000 60,000 0 60,000 60,000 TAM-SWAP
GC19 Barrier Removal Implementation Project-Phase I 0 0 1,543 55,000 55,000 55,000 55,000 55,000 55,000 55,000 55,000 55,000 GT
-------------- -------------- -------------- -------------- -------------- -------------- -------------- -------------- -------------- -------------- -------------- --------------
SUB-TOTAL 48,259 4,000 31,376 685,000 235,000 55,000 235,000 235,000 55,000 55,000 55,000 55,000
* Subject to approval by TAM of the proposed improvements.
2011-12Budget\GenCapitalPorjectsList.xls GC2
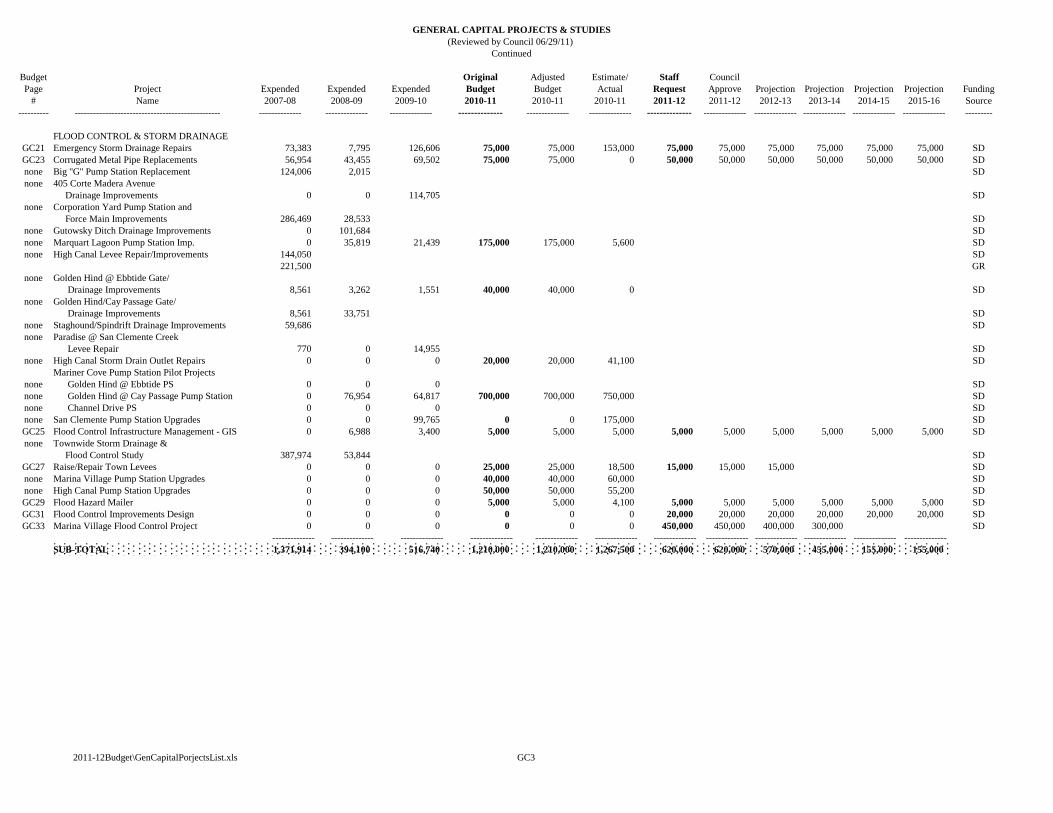
GENERAL CAPITAL PROJECTS & STUDIES
(Reviewed by Council 06/29/11)
Continued
Budget Original Adjusted Estimate/ Staff Council
Page Project Expended Expended Expended Budget Budget Actual Request Approve Projection Projection Projection Projection Funding
# Name 2007-08 2008-09 2009-10 2010-11 2010-11 2010-11 2011-12 2011-12 2012-13 2013-14 2014-15 2015-16 Source
---------- ------------------------------------------------ -------------- -------------- -------------- -------------- -------------- -------------- -------------- -------------- -------------- -------------- -------------- -------------- ---------
FLOOD CONTROL & STORM DRAINAGE
GC21 Emergency Storm Drainage Repairs 73,383 7,795 126,606 75,000 75,000 153,000 75,000 75,000 75,000 75,000 75,000 75,000 SD
GC23 Corrugated Metal Pipe Replacements 56,954 43,455 69,502 75,000 75,000 0 50,000 50,000 50,000 50,000 50,000 50,000 SD
none Big "G" Pump Station Replacement 124,006 2,015 SD
none 405 Corte Madera Avenue
Drainage Improvements 0 0 114,705 SD
none Corporation Yard Pump Station and
Force Main Improvements 286,469 28,533 SD
none Gutowsky Ditch Drainage Improvements 0 101,684 SD
none Marquart Lagoon Pump Station Imp. 0 35,819 21,439 175,000 175,000 5,600 SD
none High Canal Levee Repair/Improvements 144,050 SD
221,500 GR
none Golden Hind @ Ebbtide Gate/
Drainage Improvements 8,561 3,262 1,551 40,000 40,000 0 SD
none Golden Hind/Cay Passage Gate/
Drainage Improvements 8,561 33,751 SD
none Staghound/Spindrift Drainage Improvements 59,686 SD
none Paradise @ San Clemente Creek
Levee Repair 770 0 14,955 SD
none High Canal Storm Drain Outlet Repairs 0 0 0 20,000 20,000 41,100 SD
Mariner Cove Pump Station Pilot Projects
none Golden Hind @ Ebbtide PS 0 0 0 SD
none Golden Hind @ Cay Passage Pump Station 0 76,954 64,817 700,000 700,000 750,000 SD
none Channel Drive PS 0 0 0 SD
none San Clemente Pump Station Upgrades 0 0 99,765 0 0 175,000 SD
GC25 Flood Control Infrastructure Management - GIS 0 6,988 3,400 5,000 5,000 5,000 5,000 5,000 5,000 5,000 5,000 5,000 SD
none Townwide Storm Drainage &
Flood Control Study 387,974 53,844 SD
GC27 Raise/Repair Town Levees 0 0 0 25,000 25,000 18,500 15,000 15,000 15,000 SD
none Marina Village Pump Station Upgrades 0 0 0 40,000 40,000 60,000 SD
none High Canal Pump Station Upgrades 0 0 0 50,000 50,000 55,200 SD
GC29 Flood Hazard Mailer 0 0 0 5,000 5,000 4,100 5,000 5,000 5,000 5,000 5,000 5,000 SD
GC31 Flood Control Improvements Design 0 0 0 0 0 0 20,000 20,000 20,000 20,000 20,000 20,000 SD
GC33 Marina Village Flood Control Project 0 0 0 0 0 0 450,000 450,000 400,000 300,000 SD
-------------- -------------- -------------- -------------- -------------- -------------- -------------- -------------- -------------- -------------- -------------- --------------
SUB-TOTAL 1,371,914 394,100 516,740 1,210,000 1,210,000 1,267,500 620,000 620,000 570,000 455,000 155,000 155,000
2011-12Budget\GenCapitalPorjectsList.xls GC3
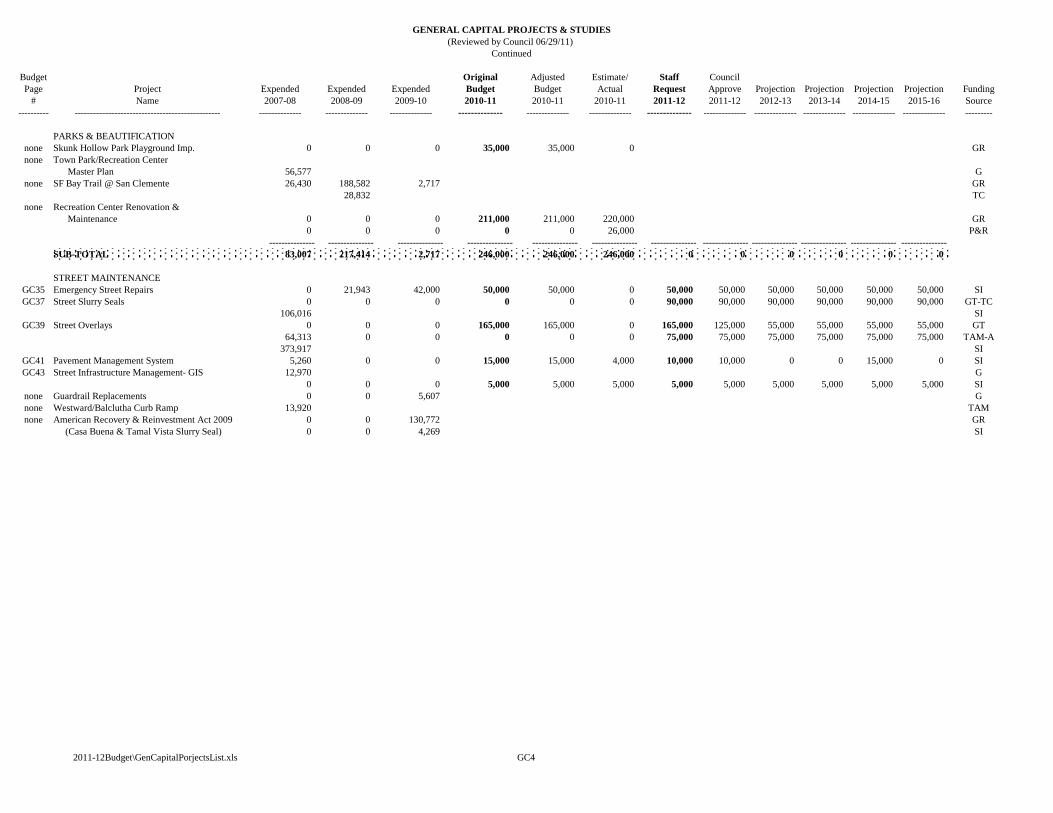
GENERAL CAPITAL PROJECTS & STUDIES
(Reviewed by Council 06/29/11)
Continued
Budget Original Adjusted Estimate/ Staff Council
Page Project Expended Expended Expended Budget Budget Actual Request Approve Projection Projection Projection Projection Funding
# Name 2007-08 2008-09 2009-10 2010-11 2010-11 2010-11 2011-12 2011-12 2012-13 2013-14 2014-15 2015-16 Source
---------- ------------------------------------------------ -------------- -------------- -------------- -------------- -------------- -------------- -------------- -------------- -------------- -------------- -------------- -------------- ---------
PARKS & BEAUTIFICATION
none Skunk Hollow Park Playground Imp. 0 0 0 35,000 35,000 0 GR
none Town Park/Recreation Center
Master Plan 56,577 G
none SF Bay Trail @ San Clemente 26,430 188,582 2,717 GR
28,832 TC
none Recreation Center Renovation &
Maintenance 0 0 0 211,000 211,000 220,000 GR
0 0 0 0 0 26,000 P&R
--------------- --------------- --------------- --------------- --------------- --------------- --------------- --------------- --------------- --------------- --------------- ---------------
SUB-TOTAL 83,007 217,414 2,717 246,000 246,000 246,000 0 0 0 0 0 0
STREET MAINTENANCE
GC35 Emergency Street Repairs 0 21,943 42,000 50,000 50,000 0 50,000 50,000 50,000 50,000 50,000 50,000 SI
GC37 Street Slurry Seals 0 0 0 0 0 0 90,000 90,000 90,000 90,000 90,000 90,000 GT-TC
106,016 SI
GC39 Street Overlays 0 0 0 165,000 165,000 0 165,000 125,000 55,000 55,000 55,000 55,000 GT
64,313 0 0 0 0 0 75,000 75,000 75,000 75,000 75,000 75,000 TAM-A
373,917 SI
GC41 Pavement Management System 5,260 0 0 15,000 15,000 4,000 10,000 10,000 0 0 15,000 0 SI
GC43 Street Infrastructure Management- GIS 12,970 G
0 0 0 5,000 5,000 5,000 5,000 5,000 5,000 5,000 5,000 5,000 SI
none Guardrail Replacements 0 0 5,607 G
none Westward/Balclutha Curb Ramp 13,920 TAM
none American Recovery & Reinvestment Act 2009 0 0 130,772 GR
(Casa Buena & Tamal Vista Slurry Seal) 0 0 4,269 SI
2011-12Budget\GenCapitalPorjectsList.xls GC4
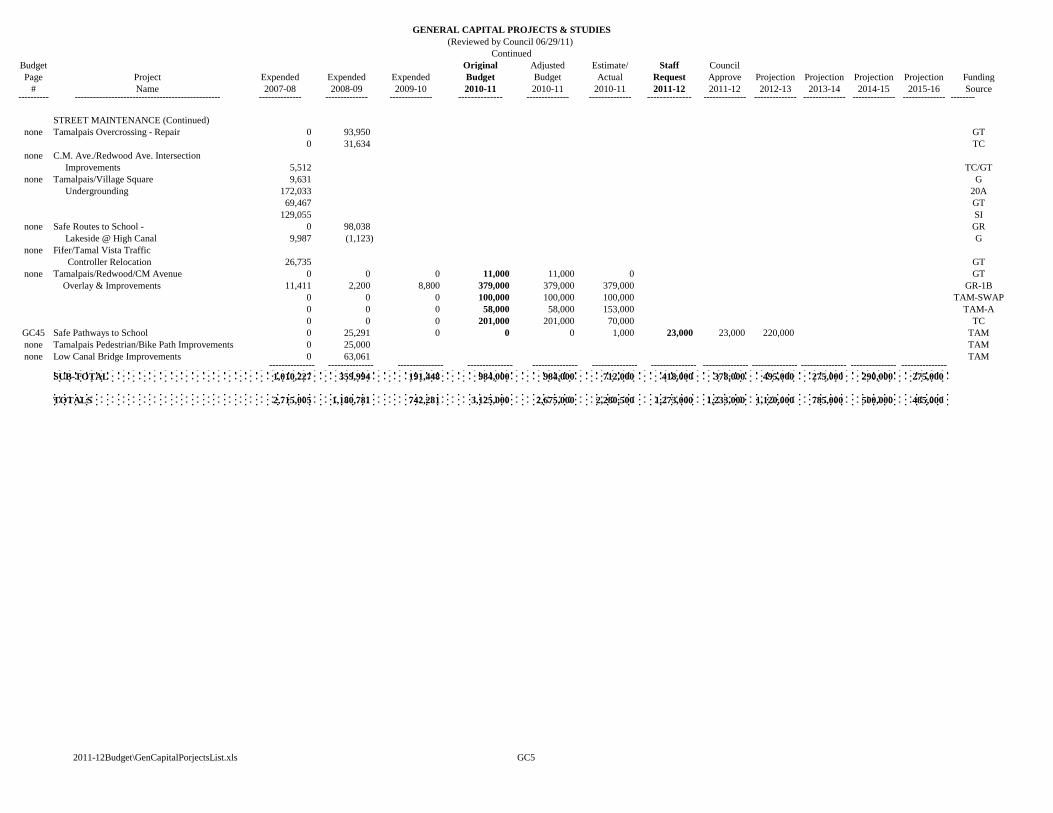
Continued
Budget Original Adjusted Estimate/ Staff Council
Page Project Expended Expended Expended Budget Budget Actual Request Approve Projection Projection Projection Projection Funding
# Name 2007-08 2008-09 2009-10 2010-11 2010-11 2010-11 2011-12 2011-12 2012-13 2013-14 2014-15 2015-16 Source---------- ------------------------------------------------ -------------- -------------- -------------- -------------- -------------- -------------- -------------- -------------- -------------- -------------- -------------- -------------- --------
STREET MAINTENANCE (Continued)
none Tamalpais Overcrossing - Repair 0 93,950 GT
0 31,634 TC
none C.M. Ave./Redwood Ave. Intersection
Improvements 5,512 TC/GT
none Tamalpais/Village Square 9,631 G
Undergrounding 172,033 20A
69,467 GT
129,055 SI
none Safe Routes to School - 0 98,038 GR
Lakeside @ High Canal 9,987 (1,123) G
none Fifer/Tamal Vista Traffic
Controller Relocation 26,735 GT
none Tamalpais/Redwood/CM Avenue 0 0 0 11,000 11,000 0 GT
Overlay & Improvements 11,411 2,200 8,800 379,000 379,000 379,000 GR-1B
0 0 0 100,000 100,000 100,000 TAM-SWAP
0 0 0 58,000 58,000 153,000 TAM-A
0 0 0 201,000 201,000 70,000 TC
GC45 Safe Pathways to School 0 25,291 0 0 0 1,000 23,000 23,000 220,000 TAM
none Tamalpais Pedestrian/Bike Path Improvements 0 25,000 TAM
none Low Canal Bridge Improvements 0 63,061 TAM--------------- --------------- --------------- --------------- --------------- --------------- --------------- --------------- --------------- --------------- --------------- ---------------
SUB-TOTAL 1,010,227 359,994 191,448 984,000 984,000 712,000 418,000 378,000 495,000 275,000 290,000 275,000
TOTALS 2,715,005 1,180,781 742,281 3,125,000 2,675,000 2,280,500 1,273,000 1,233,000 1,120,000 785,000 500,000 485,000
(Reviewed by Council 06/29/11)
GENERAL CAPITAL PROJECTS & STUDIES
2011-12Budget\GenCapitalPorjectsList.xls GC5
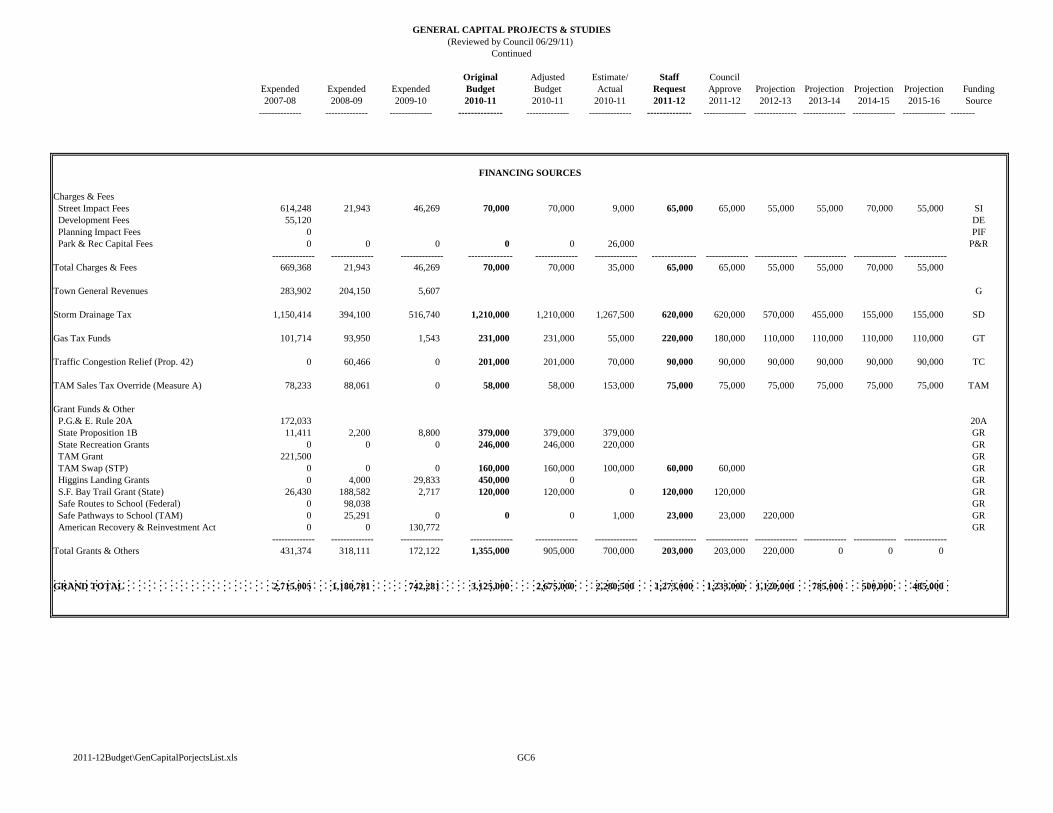
GENERAL CAPITAL PROJECTS & STUDIES
(Reviewed by Council 06/29/11)
Continued
Original Adjusted Estimate/ Staff Council
Expended Expended Expended Budget Budget Actual Request Approve Projection Projection Projection Projection Funding
2007-08 2008-09 2009-10 2010-11 2010-11 2010-11 2011-12 2011-12 2012-13 2013-14 2014-15 2015-16 Source
-------------- -------------- -------------- -------------- -------------- -------------- -------------- -------------- -------------- -------------- -------------- -------------- --------
FINANCING SOURCES
Charges & Fees
Street Impact Fees 614,248 21,943 46,269 70,000 70,000 9,000 65,000 65,000 55,000 55,000 70,000 55,000 SI
Development Fees 55,120 DE
Planning Impact Fees 0 PIF
Park & Rec Capital Fees 0 0 0 0 0 26,000 P&R
-------------- -------------- -------------- -------------- -------------- -------------- -------------- -------------- -------------- -------------- -------------- --------------
Total Charges & Fees 669,368 21,943 46,269 70,000 70,000 35,000 65,000 65,000 55,000 55,000 70,000 55,000
Town General Revenues 283,902 204,150 5,607 G
Storm Drainage Tax 1,150,414 394,100 516,740 1,210,000 1,210,000 1,267,500 620,000 620,000 570,000 455,000 155,000 155,000 SD
Gas Tax Funds 101,714 93,950 1,543 231,000 231,000 55,000 220,000 180,000 110,000 110,000 110,000 110,000 GT
Traffic Congestion Relief (Prop. 42) 0 60,466 0 201,000 201,000 70,000 90,000 90,000 90,000 90,000 90,000 90,000 TC
TAM Sales Tax Override (Measure A) 78,233 88,061 0 58,000 58,000 153,000 75,000 75,000 75,000 75,000 75,000 75,000 TAM
Grant Funds & Other
P.G.& E. Rule 20A 172,033 20A
State Proposition 1B 11,411 2,200 8,800 379,000 379,000 379,000 GR
State Recreation Grants 0 0 0 246,000 246,000 220,000 GR
TAM Grant 221,500 GR
TAM Swap (STP) 0 0 0 160,000 160,000 100,000 60,000 60,000 GR
Higgins Landing Grants 0 4,000 29,833 450,000 0 GR
S.F. Bay Trail Grant (State) 26,430 188,582 2,717 120,000 120,000 0 120,000 120,000 GR
Safe Routes to School (Federal) 0 98,038 GR
Safe Pathways to School (TAM) 0 25,291 0 0 0 1,000 23,000 23,000 220,000 GR
American Recovery & Reinvestment Act 0 0 130,772 GR
-------------- -------------- -------------- -------------- -------------- -------------- -------------- -------------- -------------- -------------- -------------- --------------
Total Grants & Others 431,374 318,111 172,122 1,355,000 905,000 700,000 203,000 203,000 220,000 0 0 0
GRAND TOTAL 2,715,005 1,180,781 742,281 3,125,000 2,675,000 2,280,500 1,273,000 1,233,000 1,120,000 785,000 500,000 485,000
2011-12Budget\GenCapitalPorjectsList.xls GC6

BLANK PAGE
2011-12Budget\GenCapitalProjectsList.xls GC7-GC13
GENERAL CAPITAL PROJECTS & STUDIES
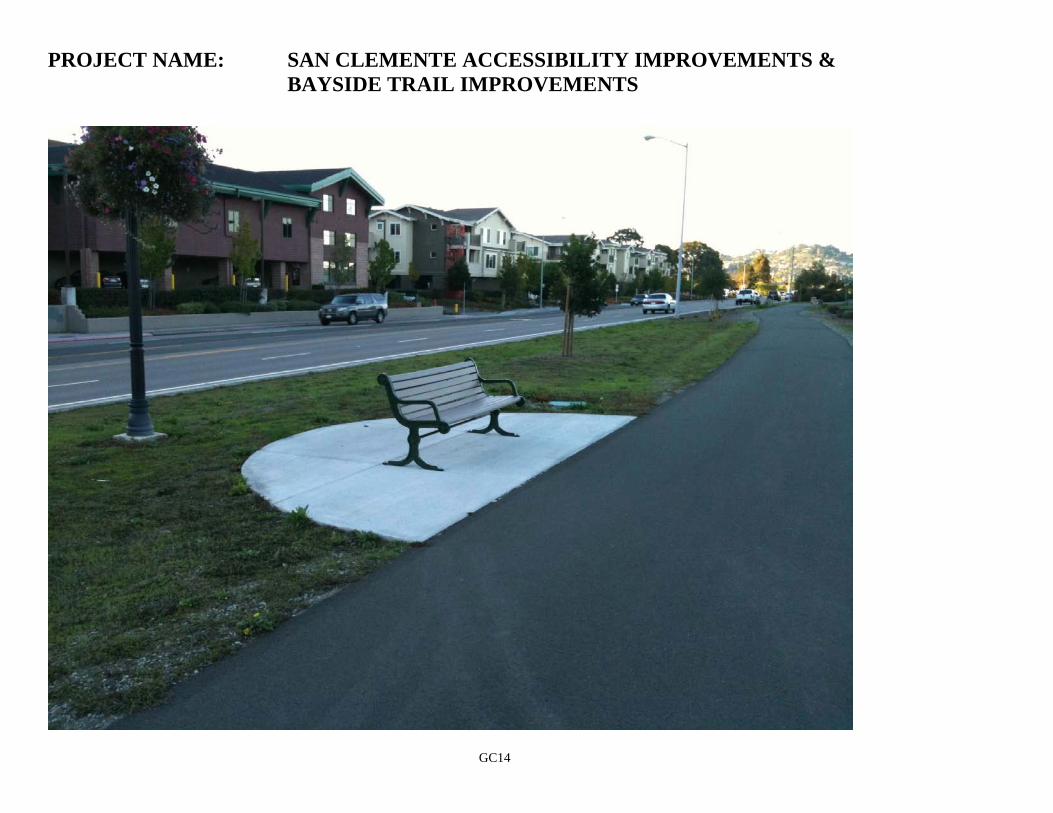
GC14
PROJECT NAME: SAN CLEMENTE ACCESSIBILITY IMPROVEMENTS &
BAYSIDE TRAIL IMPROVEMENTS
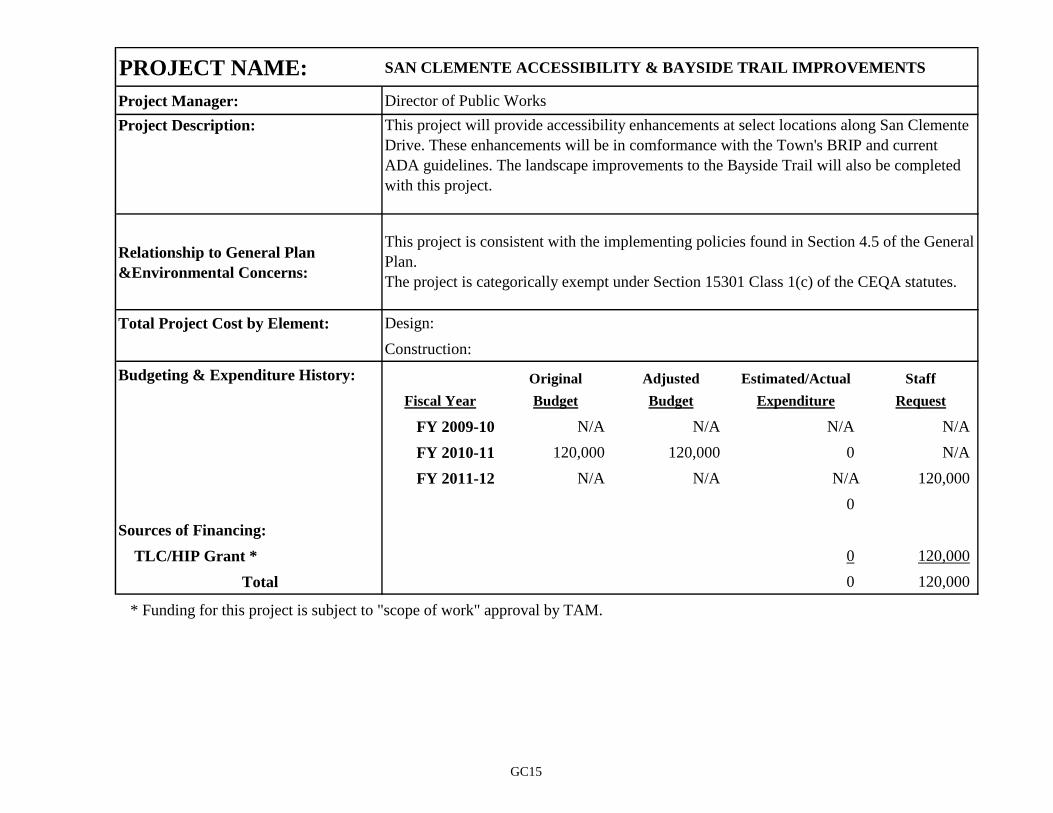
PROJECT NAME: SAN CLEMENTE ACCESSIBILITY & BAYSIDE TRAIL IMPROVEMENTS
Project Manager: Director of Public Works
Project Description:
Relationship to General Plan
&Environmental Concerns:
Total Project Cost by Element: Design:
Construction:
Budgeting & Expenditure History: Original Adjusted Estimated/Actual Staff
Fiscal Year Budget Budget Expenditure Request
FY 2009-10 N/A N/A N/A N/A
FY 2010-11 120,000 120,000 0 N/A
FY 2011-12 N/A N/A N/A 120,000
0
Sources of Financing:
TLC/HIP Grant * 0 120,000
Total 0 120,000
* Funding for this project is subject to "scope of work" approval by TAM.
This project is consistent with the implementing policies found in Section 4.5 of the General
Plan.
The project is categorically exempt under Section 15301 Class 1(c) of the CEQA statutes.
This project will provide accessibility enhancements at select locations along San Clemente
Drive. These enhancements will be in comformance with the Town's BRIP and current
ADA guidelines. The landscape improvements to the Bayside Trail will also be completed
with this project.
GC15
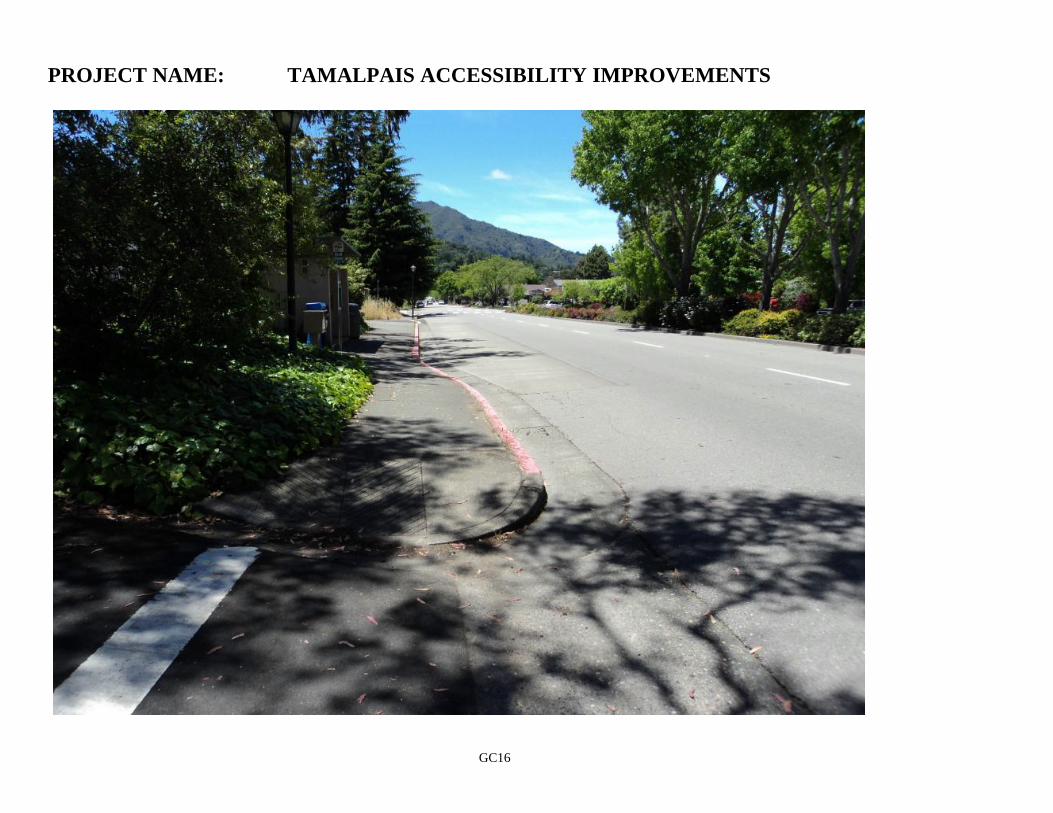
GC16
PROJECT NAME: TAMALPAIS ACCESSIBILITY IMPROVEMENTS
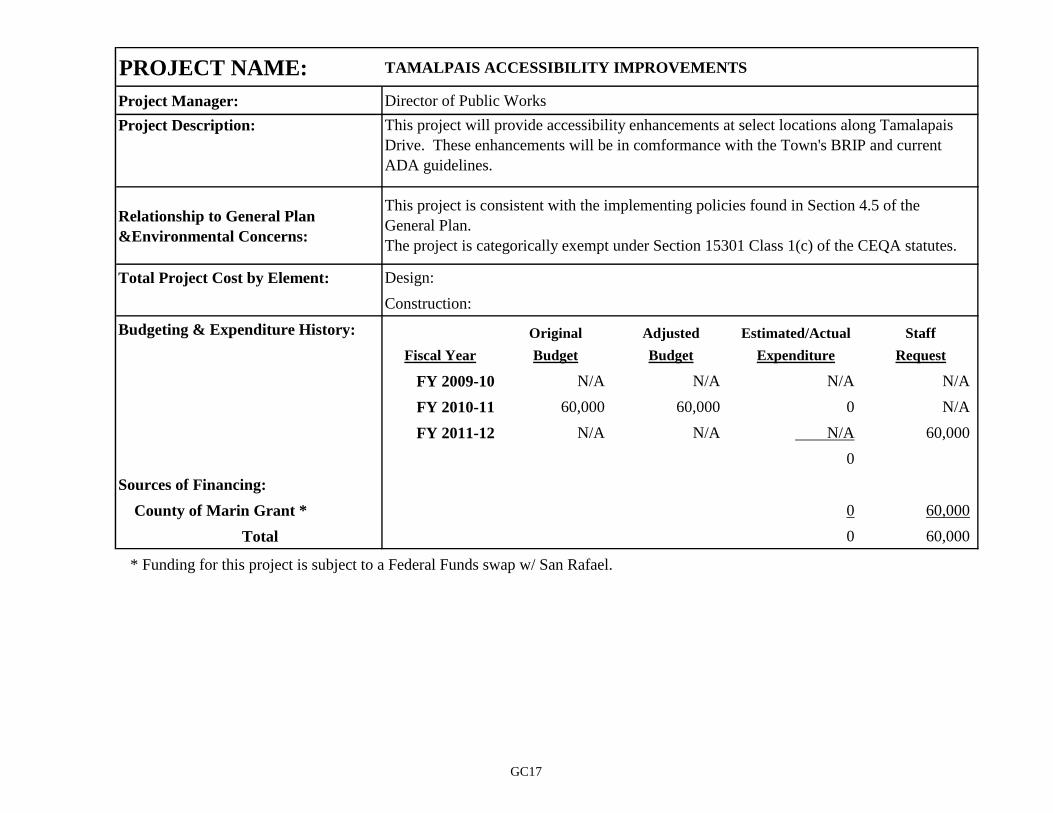
PROJECT NAME: TAMALPAIS ACCESSIBILITY IMPROVEMENTS
Project Manager: Director of Public Works
Project Description:
Relationship to General Plan
&Environmental Concerns:
Total Project Cost by Element: Design:
Construction:
Budgeting & Expenditure History: Original Adjusted Estimated/Actual Staff
Fiscal Year Budget Budget Expenditure Request
FY 2009-10 N/A N/A N/A N/A
FY 2010-11 60,000 60,000 0 N/A
FY 2011-12 N/A N/A N/A 60,000
0
Sources of Financing:
County of Marin Grant * 0 60,000
Total 0 60,000
* Funding for this project is subject to a Federal Funds swap w/ San Rafael.
This project will provide accessibility enhancements at select locations along Tamalapais
Drive. These enhancements will be in comformance with the Town's BRIP and current
ADA guidelines.
This project is consistent with the implementing policies found in Section 4.5 of the
General Plan.
The project is categorically exempt under Section 15301 Class 1(c) of the CEQA statutes.
GC17
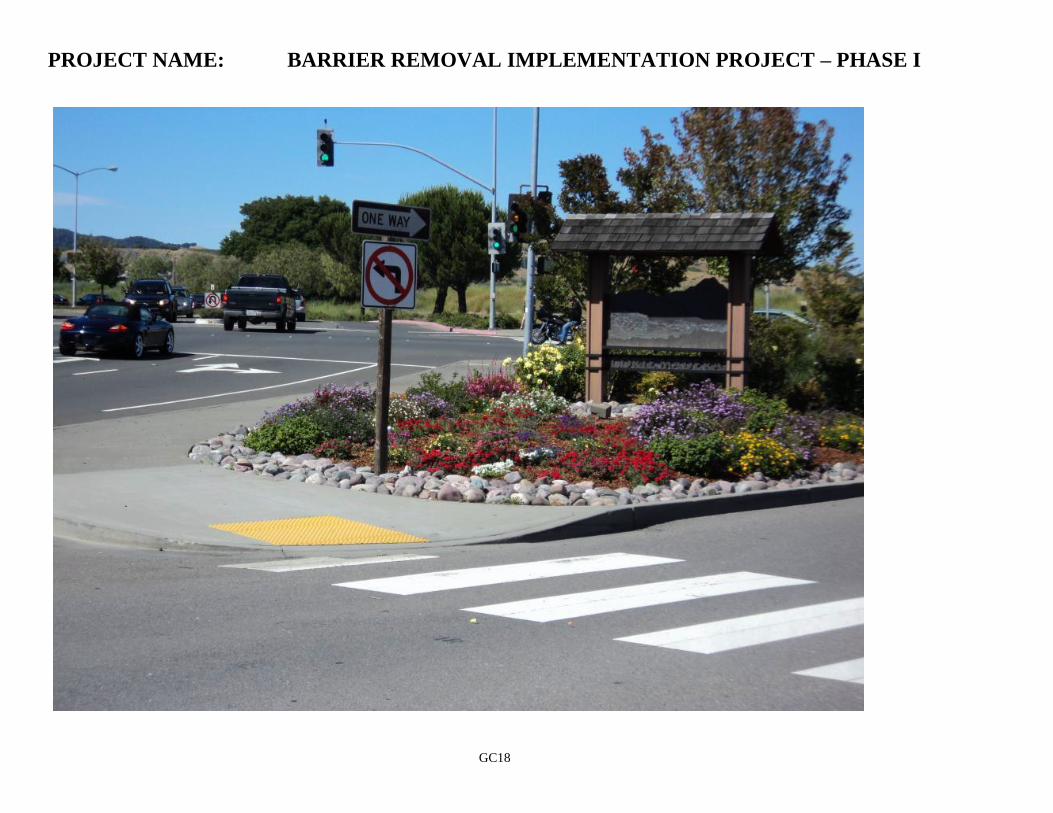
GC18
PROJECT NAME: BARRIER REMOVAL IMPLEMENTATION PROJECT – PHASE I
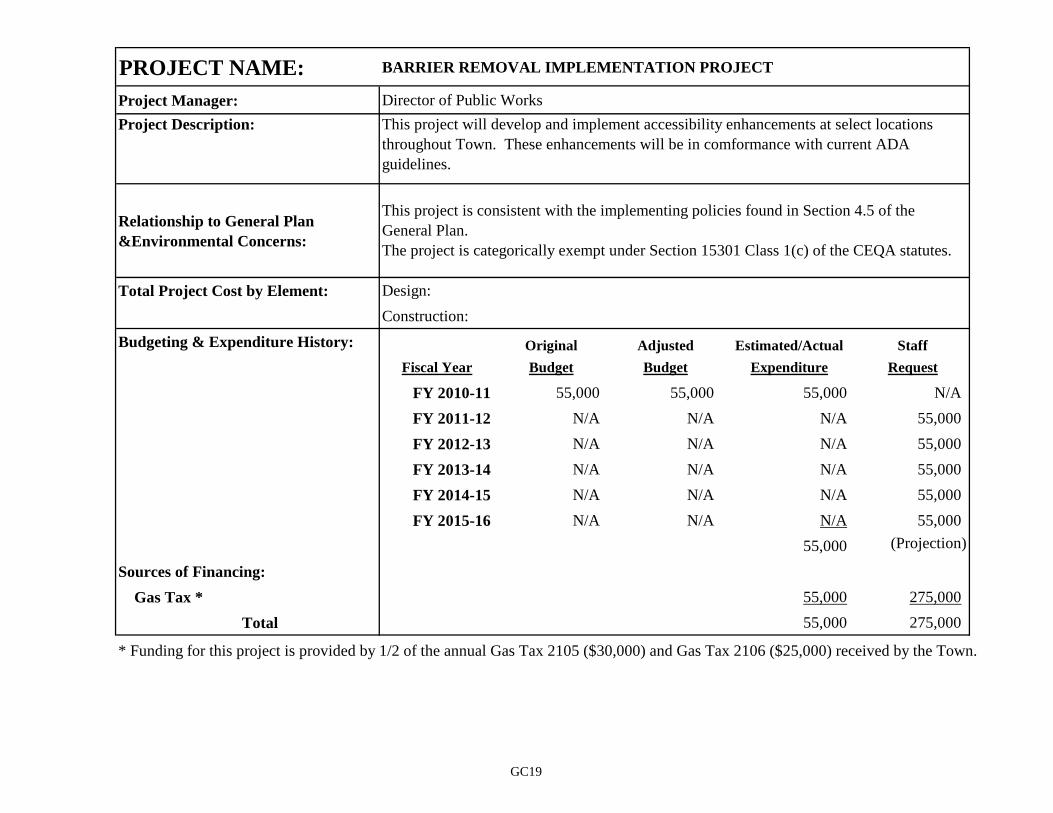
PROJECT NAME: BARRIER REMOVAL IMPLEMENTATION PROJECT
Project Manager: Director of Public Works
Project Description:
Relationship to General Plan
&Environmental Concerns:
Total Project Cost by Element: Design:
Construction:
Budgeting & Expenditure History: Original Adjusted Estimated/Actual Staff
Fiscal Year Budget Budget Expenditure Request
FY 2010-11 55,000 55,000 55,000 N/A
FY 2011-12 N/A N/A N/A 55,000
FY 2012-13 N/A N/A N/A 55,000
FY 2013-14 N/A N/A N/A 55,000
FY 2014-15 N/A N/A N/A 55,000
FY 2015-16 N/A N/A N/A 55,000
55,000 (Projection)
Sources of Financing:
Gas Tax * 55,000 275,000
Total 55,000 275,000
* Funding for this project is provided by 1/2 of the annual Gas Tax 2105 ($30,000) and Gas Tax 2106 ($25,000) received by the Town.
This project is consistent with the implementing policies found in Section 4.5 of the
General Plan.
The project is categorically exempt under Section 15301 Class 1(c) of the CEQA statutes.
This project will develop and implement accessibility enhancements at select locations
throughout Town. These enhancements will be in comformance with current ADA
guidelines.
GC19
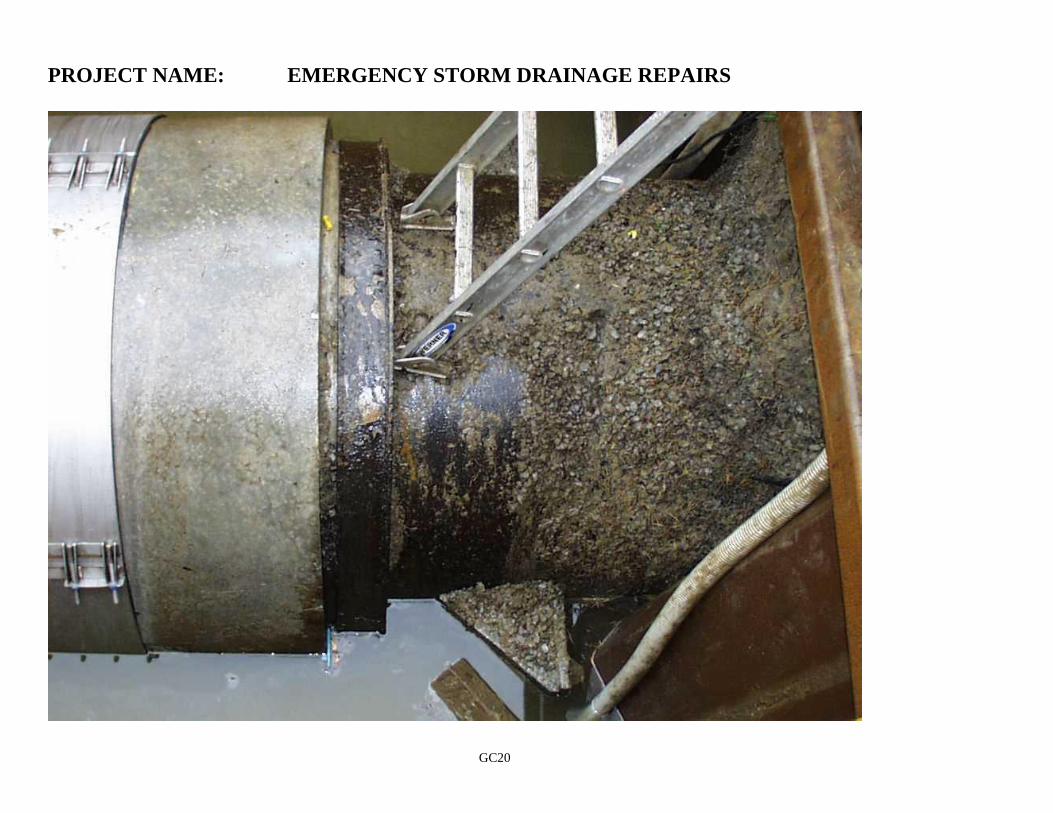
GC20
PROJECT NAME: EMERGENCY STORM DRAINAGE REPAIRS
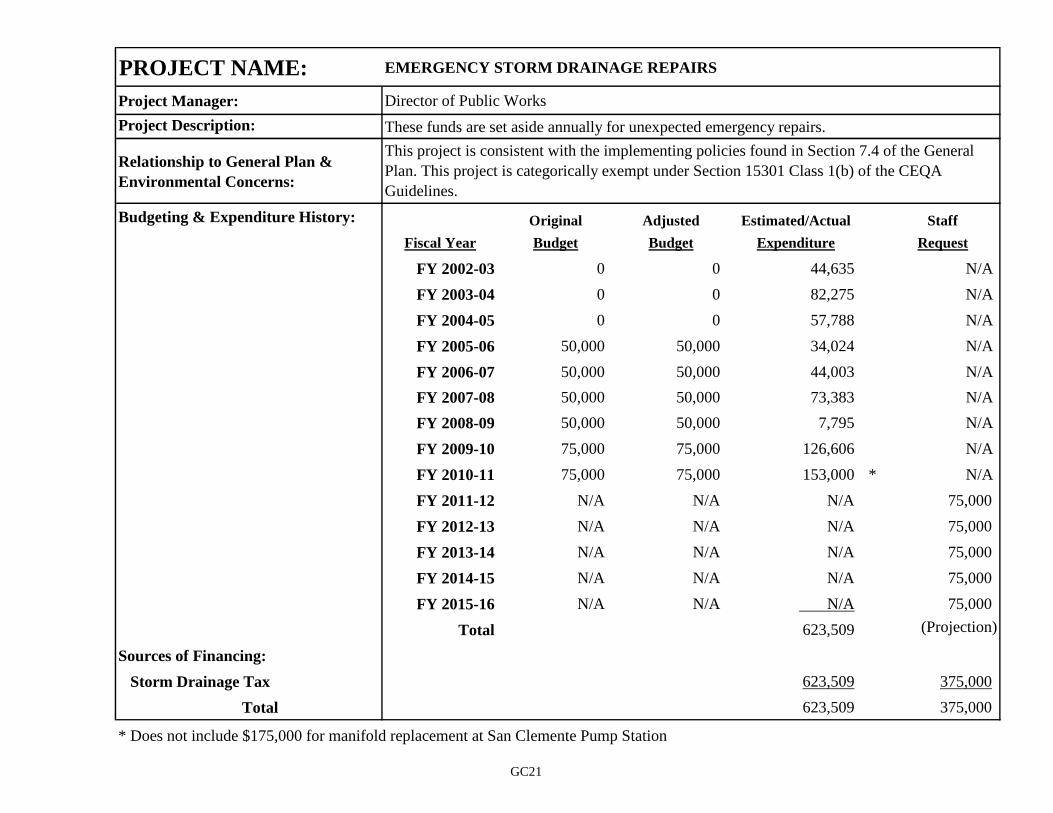
PROJECT NAME: EMERGENCY STORM DRAINAGE REPAIRS
Project Manager: Director of Public Works
Project Description: These funds are set aside annually for unexpected emergency repairs.
Relationship to General Plan &
Environmental Concerns:
Budgeting & Expenditure History: Original Adjusted Estimated/Actual Staff
Fiscal Year Budget Budget Expenditure Request
FY 2002-03 0 0 44,635 N/A
FY 2003-04 0 0 82,275 N/A
FY 2004-05 0 0 57,788 N/A
FY 2005-06 50,000 50,000 34,024 N/A
FY 2006-07 50,000 50,000 44,003 N/A
FY 2007-08 50,000 50,000 73,383 N/A
FY 2008-09 50,000 50,000 7,795 N/A
FY 2009-10 75,000 75,000 126,606 N/A
FY 2010-11 75,000 75,000 153,000 * N/A
FY 2011-12 N/A N/A N/A 75,000
FY 2012-13 N/A N/A N/A 75,000
FY 2013-14 N/A N/A N/A 75,000
FY 2014-15 N/A N/A N/A 75,000
FY 2015-16 N/A N/A N/A 75,000
Total 623,509 (Projection)
Sources of Financing:
Storm Drainage Tax 623,509 375,000
Total 623,509 375,000
* Does not include $175,000 for manifold replacement at San Clemente Pump Station
This project is consistent with the implementing policies found in Section 7.4 of the General
Plan. This project is categorically exempt under Section 15301 Class 1(b) of the CEQA
Guidelines.
GC21
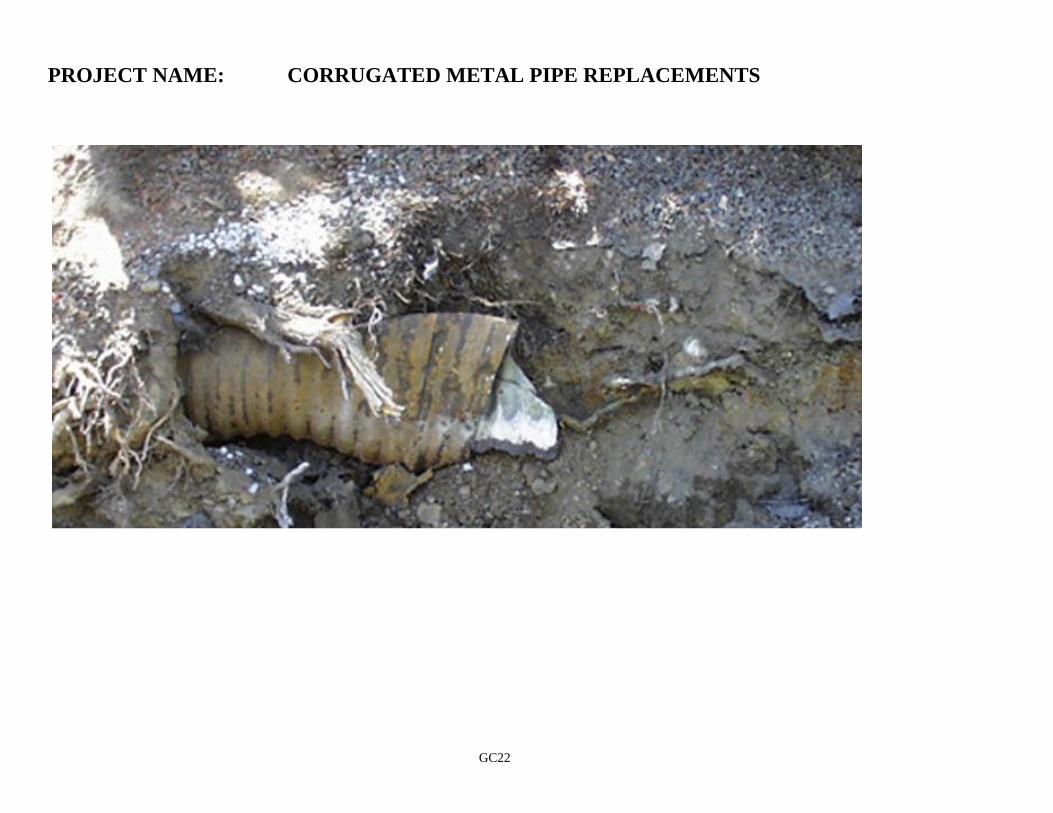
GC22
PROJECT NAME: CORRUGATED METAL PIPE REPLACEMENTS
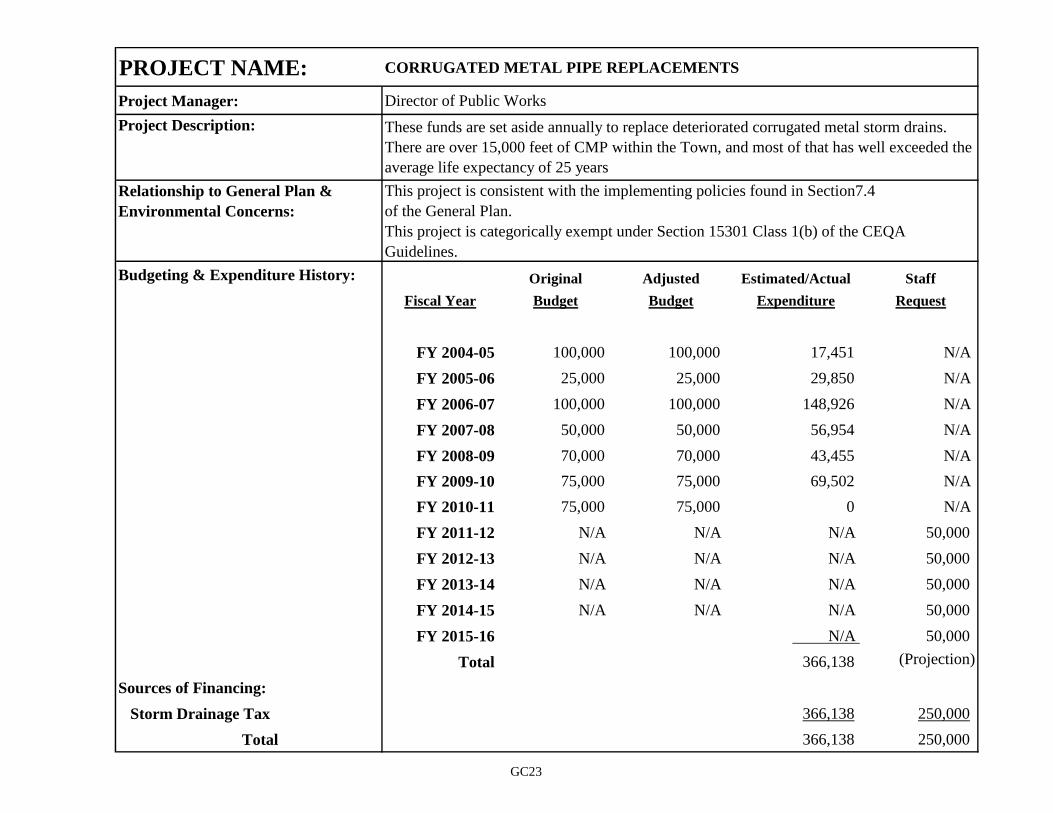
PROJECT NAME: CORRUGATED METAL PIPE REPLACEMENTS
Project Manager: Director of Public Works
Project Description:
Relationship to General Plan & This project is consistent with the implementing policies found in Section7.4
Environmental Concerns: of the General Plan.
This project is categorically exempt under Section 15301 Class 1(b) of the CEQA
Guidelines.
Budgeting & Expenditure History: Original Adjusted Estimated/Actual Staff
Fiscal Year Budget Budget Expenditure Request
FY 2004-05 100,000 100,000 17,451 N/A
FY 2005-06 25,000 25,000 29,850 N/A
FY 2006-07 100,000 100,000 148,926 N/A
FY 2007-08 50,000 50,000 56,954 N/A
FY 2008-09 70,000 70,000 43,455 N/A
FY 2009-10 75,000 75,000 69,502 N/A
FY 2010-11 75,000 75,000 0 N/A
FY 2011-12 N/A N/A N/A 50,000
FY 2012-13 N/A N/A N/A 50,000
FY 2013-14 N/A N/A N/A 50,000
FY 2014-15 N/A N/A N/A 50,000
FY 2015-16 N/A 50,000
Total 366,138 (Projection)
Sources of Financing:
Storm Drainage Tax 366,138 250,000
Total 366,138 250,000
These funds are set aside annually to replace deteriorated corrugated metal storm drains.
There are over 15,000 feet of CMP within the Town, and most of that has well exceeded the
average life expectancy of 25 years
GC23
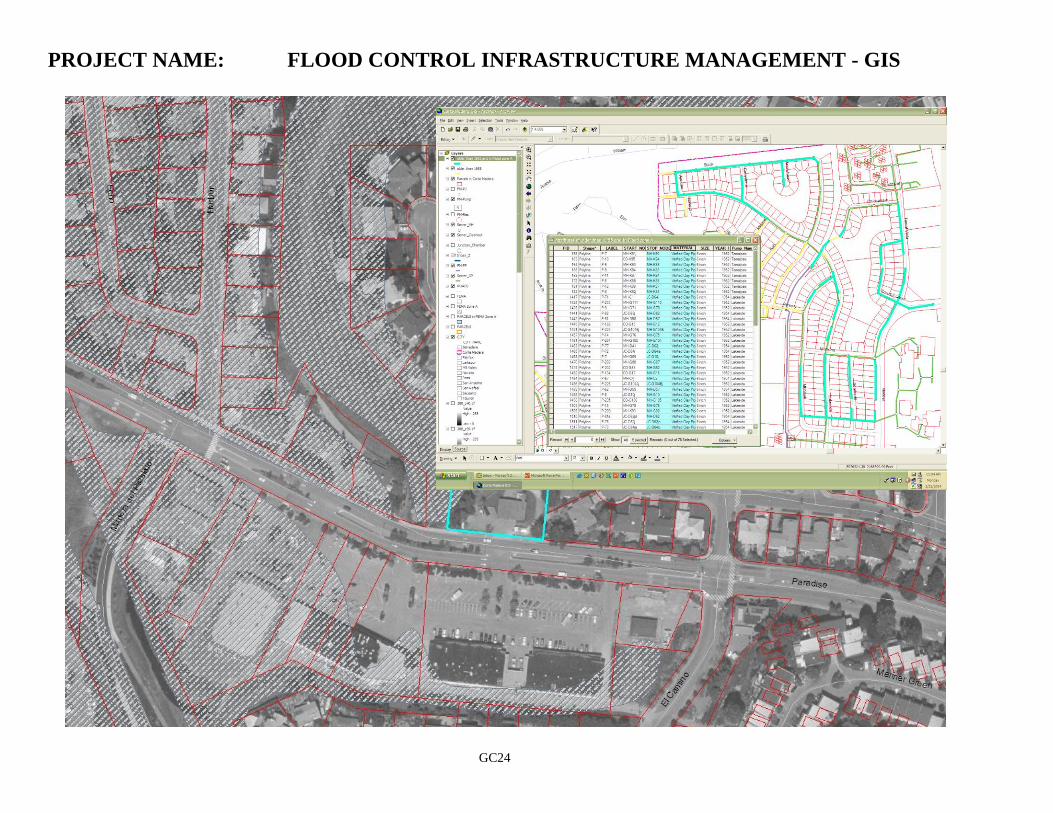
GC24
PROJECT NAME: FLOOD CONTROL INFRASTRUCTURE MANAGEMENT - GIS
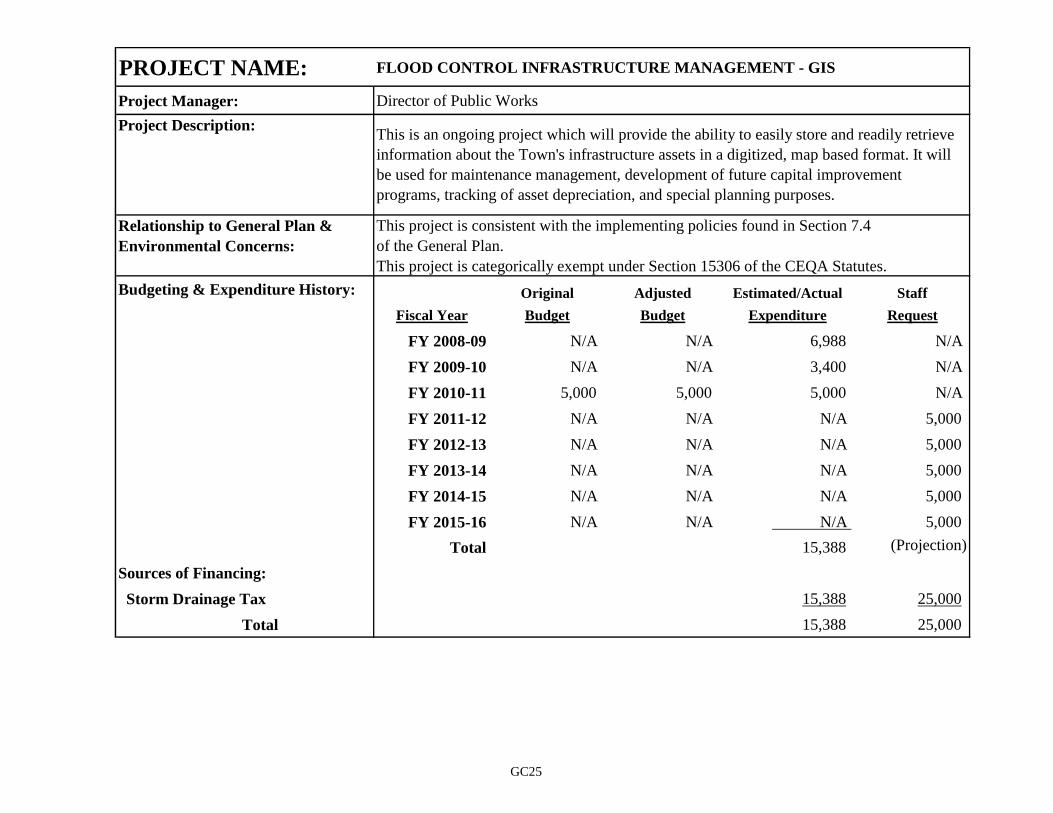
PROJECT NAME: FLOOD CONTROL INFRASTRUCTURE MANAGEMENT - GIS
Project Manager: Director of Public Works
Project Description:
Relationship to General Plan & This project is consistent with the implementing policies found in Section 7.4
Environmental Concerns: of the General Plan.
This project is categorically exempt under Section 15306 of the CEQA Statutes.
Budgeting & Expenditure History: Original Adjusted Estimated/Actual Staff
Fiscal Year Budget Budget Expenditure Request
FY 2008-09 N/A N/A 6,988 N/A
FY 2009-10 N/A N/A 3,400 N/A
FY 2010-11 5,000 5,000 5,000 N/A
FY 2011-12 N/A N/A N/A 5,000
FY 2012-13 N/A N/A N/A 5,000
FY 2013-14 N/A N/A N/A 5,000
FY 2014-15 N/A N/A N/A 5,000
FY 2015-16 N/A N/A N/A 5,000
Total 15,388 (Projection)
Sources of Financing:
Storm Drainage Tax 15,388 25,000
Total 15,388 25,000
This is an ongoing project which will provide the ability to easily store and readily retrieve
information about the Town's infrastructure assets in a digitized, map based format. It will
be used for maintenance management, development of future capital improvement
programs, tracking of asset depreciation, and special planning purposes.
GC25
GC26
PROJECT NAME: RAISE/REPAIR TOWN LEVEES
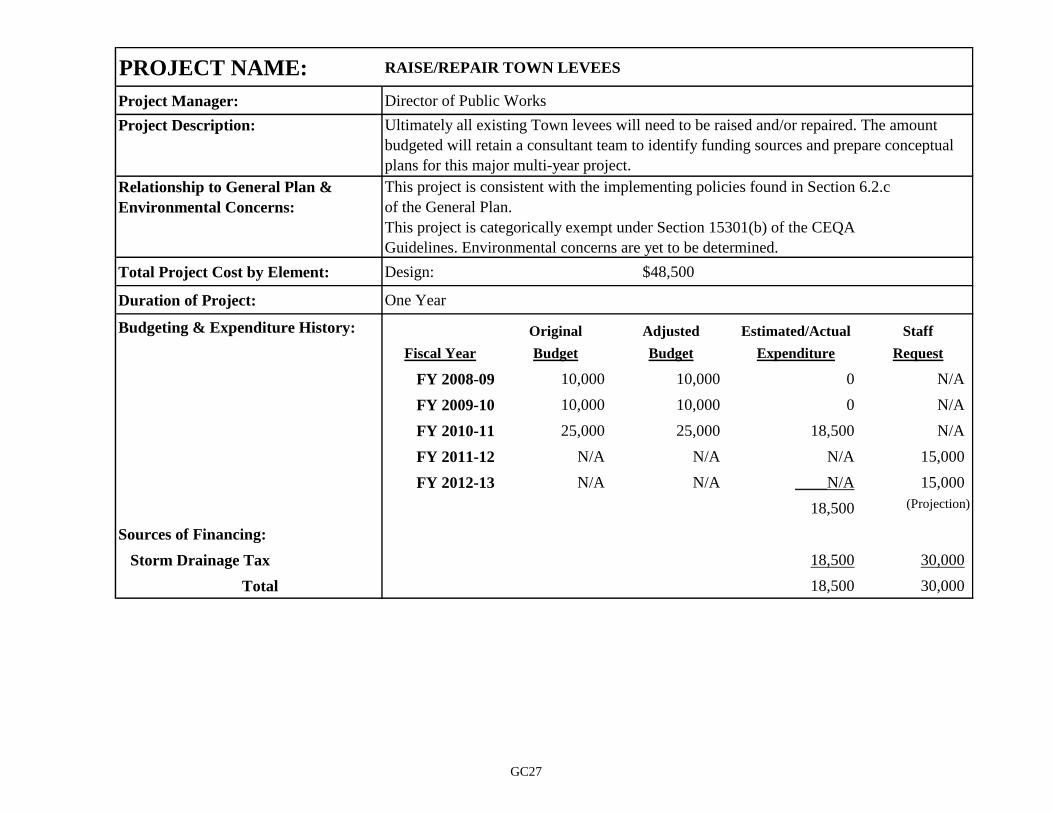
PROJECT NAME: RAISE/REPAIR TOWN LEVEES
Project Manager: Director of Public Works
Project Description:
Relationship to General Plan & This project is consistent with the implementing policies found in Section 6.2.c
Environmental Concerns: of the General Plan.
This project is categorically exempt under Section 15301(b) of the CEQA
Guidelines. Environmental concerns are yet to be determined.
Total Project Cost by Element: Design: $48,500
Duration of Project: One Year
Budgeting & Expenditure History: Original Adjusted Estimated/Actual Staff
Fiscal Year Budget Budget Expenditure Request
FY 2008-09 10,000 10,000 0 N/A
FY 2009-10 10,000 10,000 0 N/A
FY 2010-11 25,000 25,000 18,500 N/A
FY 2011-12 N/A N/A N/A 15,000
FY 2012-13 N/A N/A ____N/A 15,000
18,500 (Projection)
Sources of Financing:
Storm Drainage Tax 18,500 30,000
Total 18,500 30,000
Ultimately all existing Town levees will need to be raised and/or repaired. The amount
budgeted will retain a consultant team to identify funding sources and prepare conceptual
plans for this major multi-year project.
GC27
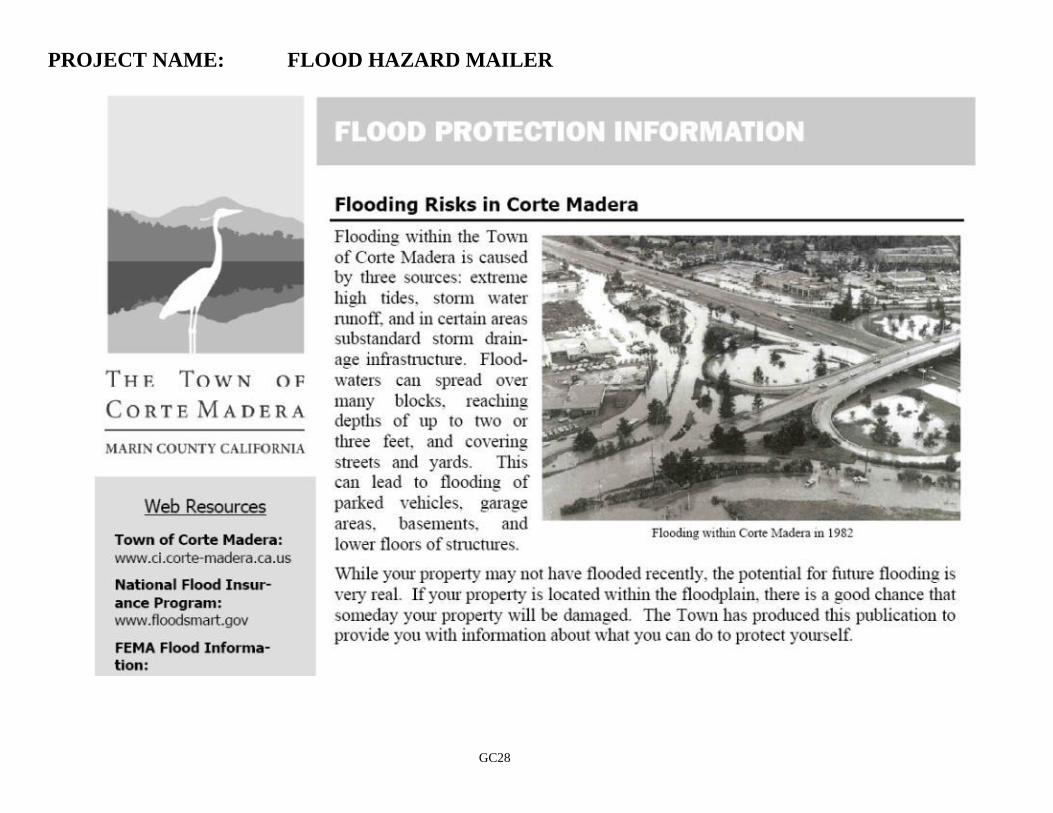
GC28
PROJECT NAME: FLOOD HAZARD MAILER
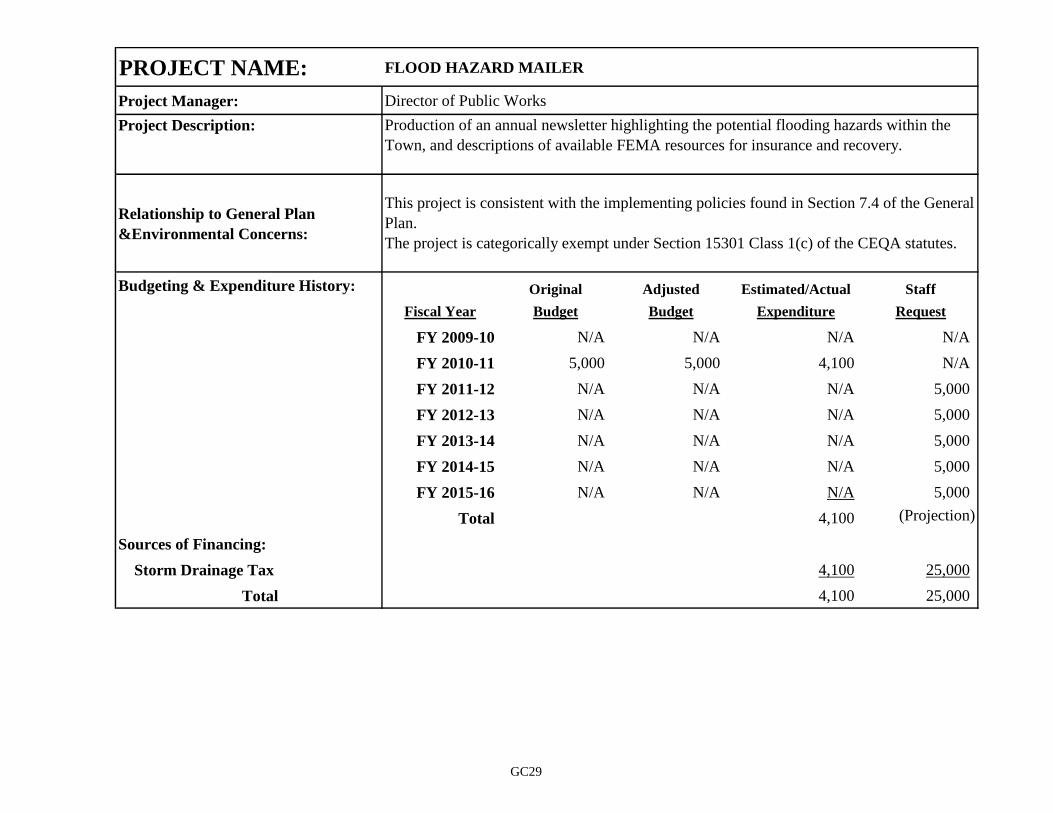
PROJECT NAME: FLOOD HAZARD MAILER
Project Manager: Director of Public Works
Project Description:
Relationship to General Plan
&Environmental Concerns:
Budgeting & Expenditure History: Original Adjusted Estimated/Actual Staff
Fiscal Year Budget Budget Expenditure Request
FY 2009-10 N/A N/A N/A N/A
FY 2010-11 5,000 5,000 4,100 N/A
FY 2011-12 N/A N/A N/A 5,000
FY 2012-13 N/A N/A N/A 5,000
FY 2013-14 N/A N/A N/A 5,000
FY 2014-15 N/A N/A N/A 5,000
FY 2015-16 N/A N/A N/A 5,000
Total 4,100 (Projection)
Sources of Financing:
Storm Drainage Tax 4,100 25,000
Total 4,100 25,000
Production of an annual newsletter highlighting the potential flooding hazards within the
Town, and descriptions of available FEMA resources for insurance and recovery.
This project is consistent with the implementing policies found in Section 7.4 of the General
Plan.
The project is categorically exempt under Section 15301 Class 1(c) of the CEQA statutes.
GC29
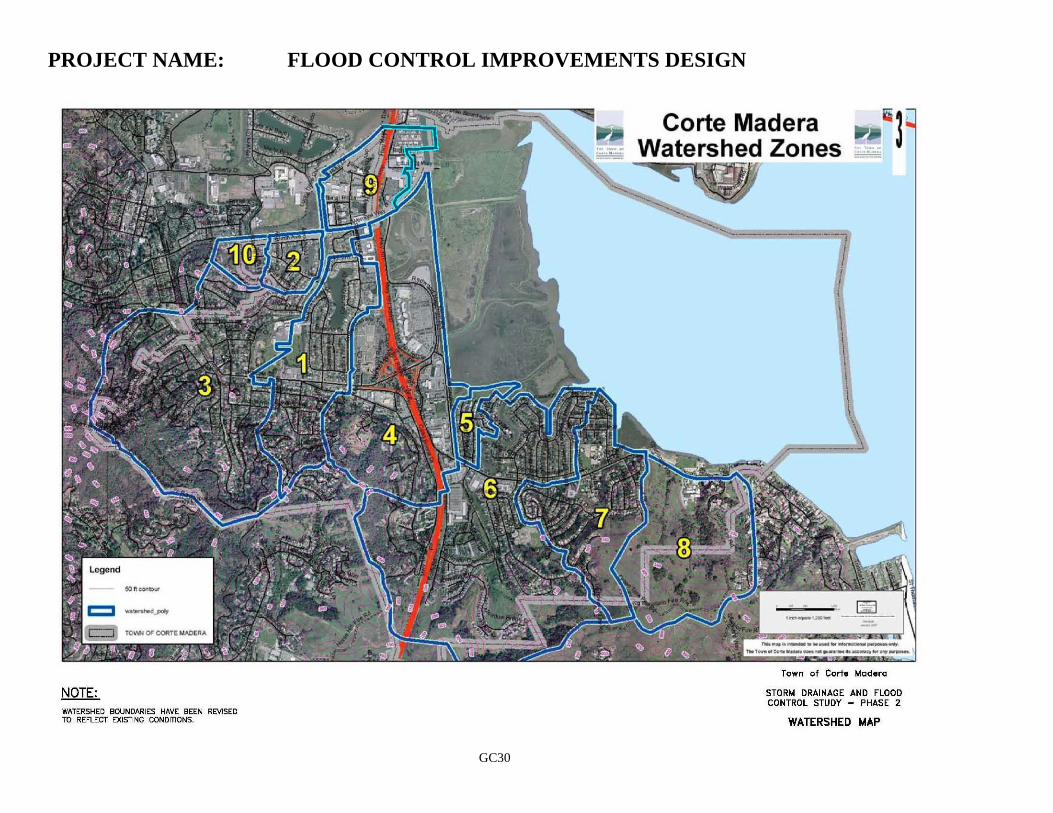
GC30
PROJECT NAME: FLOOD CONTROL IMPROVEMENTS DESIGN
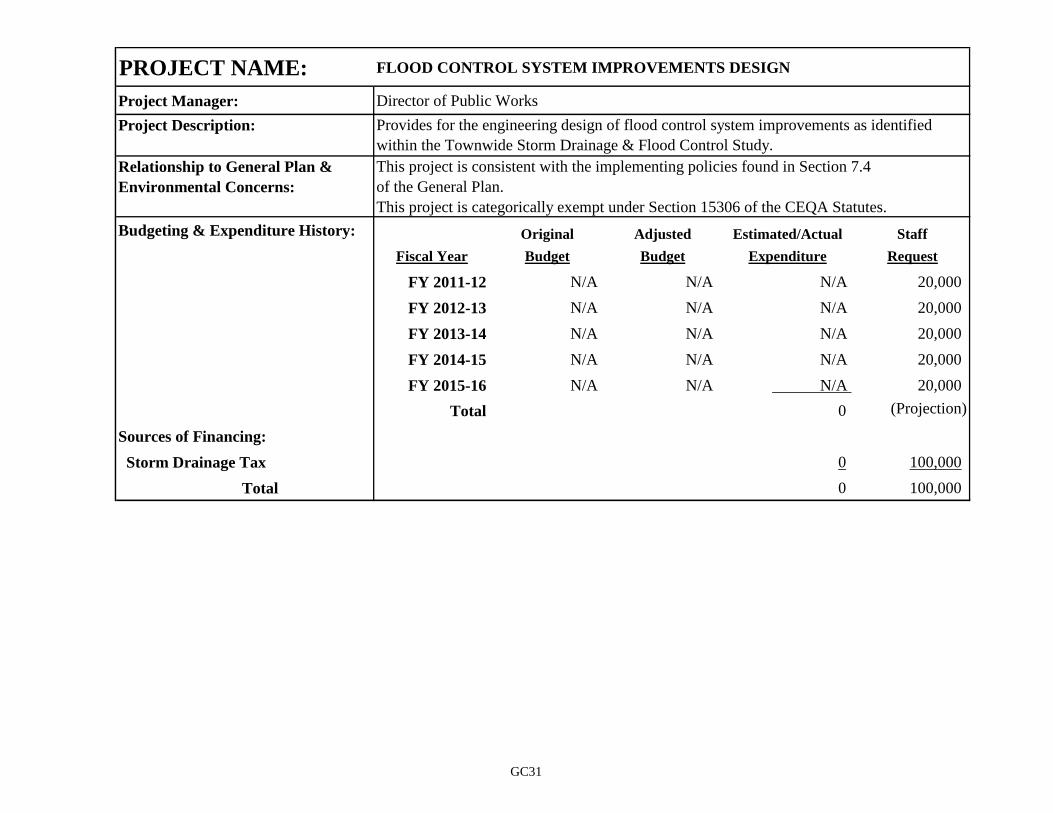
PROJECT NAME: FLOOD CONTROL SYSTEM IMPROVEMENTS DESIGN
Project Manager: Director of Public Works
Project Description:
Relationship to General Plan & This project is consistent with the implementing policies found in Section 7.4
Environmental Concerns: of the General Plan.
This project is categorically exempt under Section 15306 of the CEQA Statutes.
Budgeting & Expenditure History: Original Adjusted Estimated/Actual Staff
Fiscal Year Budget Budget Expenditure Request
FY 2011-12 N/A N/A N/A 20,000
FY 2012-13 N/A N/A N/A 20,000
FY 2013-14 N/A N/A N/A 20,000
FY 2014-15 N/A N/A N/A 20,000
FY 2015-16 N/A N/A N/A 20,000
Total 0 (Projection)
Sources of Financing:
Storm Drainage Tax 0 100,000
Total 0 100,000
Provides for the engineering design of flood control system improvements as identified
within the Townwide Storm Drainage & Flood Control Study.
GC31
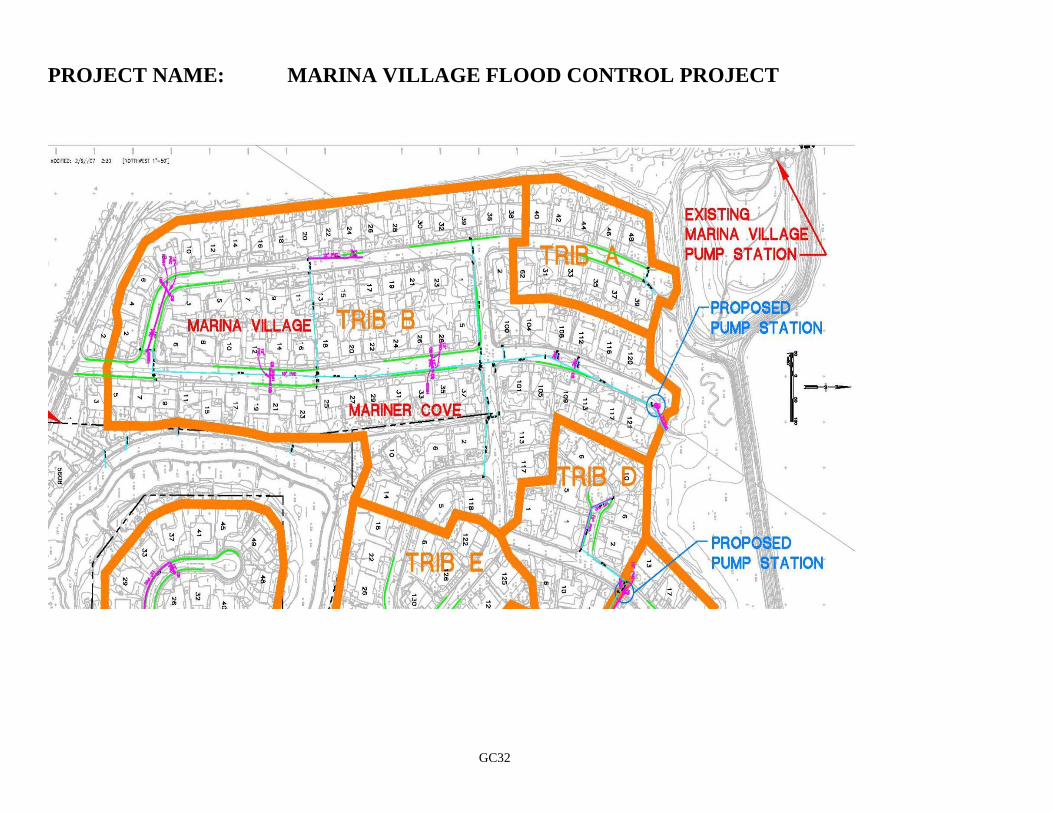
GC32
PROJECT NAME: MARINA VILLAGE FLOOD CONTROL PROJECT
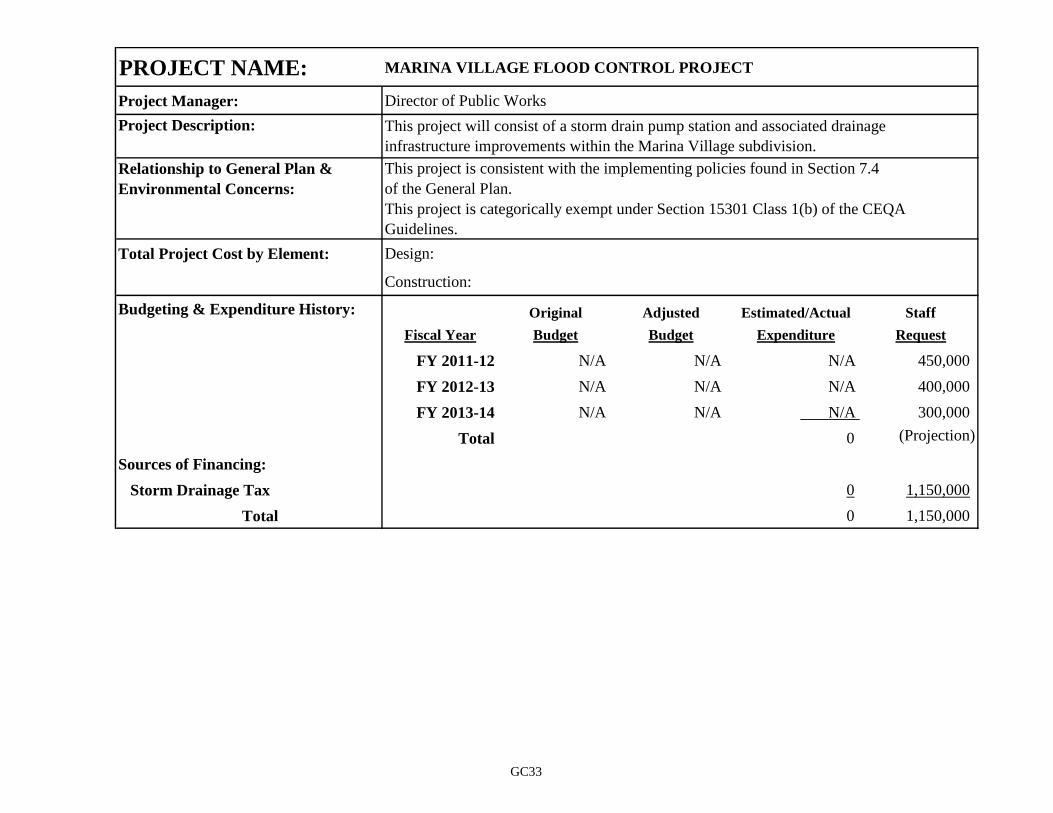
PROJECT NAME: MARINA VILLAGE FLOOD CONTROL PROJECT
Project Manager: Director of Public Works
Project Description:
Relationship to General Plan & This project is consistent with the implementing policies found in Section 7.4
Environmental Concerns: of the General Plan.
This project is categorically exempt under Section 15301 Class 1(b) of the CEQA
Guidelines.
Total Project Cost by Element: Design:
Construction:
Budgeting & Expenditure History: Original Adjusted Estimated/Actual Staff
Fiscal Year Budget Budget Expenditure Request
FY 2011-12 N/A N/A N/A 450,000
FY 2012-13 N/A N/A N/A 400,000
FY 2013-14 N/A N/A N/A 300,000
Total 0 (Projection)
Sources of Financing:
Storm Drainage Tax 0 1,150,000
Total 0 1,150,000
This project will consist of a storm drain pump station and associated drainage
infrastructure improvements within the Marina Village subdivision.
GC33
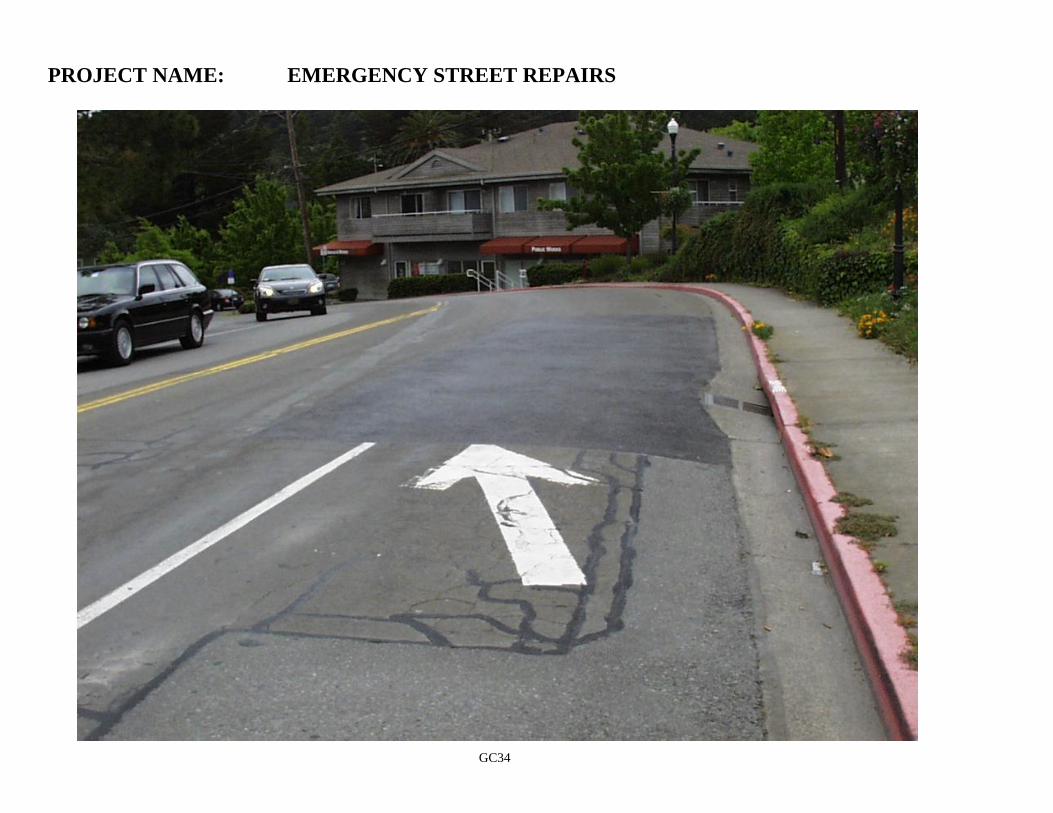
GC34
PROJECT NAME: EMERGENCY STREET REPAIRS
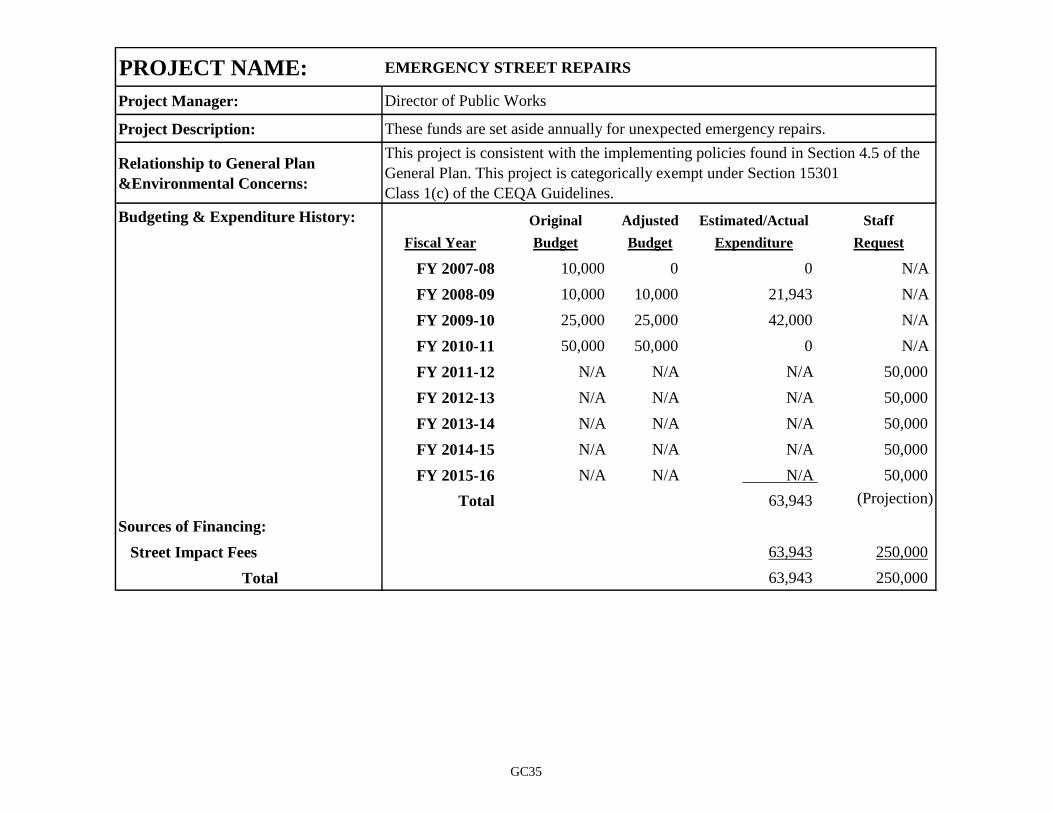
PROJECT NAME: EMERGENCY STREET REPAIRS
Project Manager: Director of Public Works
Project Description: These funds are set aside annually for unexpected emergency repairs.
Relationship to General Plan
&Environmental Concerns:
Budgeting & Expenditure History: Original Adjusted Estimated/Actual Staff
Fiscal Year Budget Budget Expenditure Request
FY 2007-08 10,000 0 0 N/A
FY 2008-09 10,000 10,000 21,943 N/A
FY 2009-10 25,000 25,000 42,000 N/A
FY 2010-11 50,000 50,000 0 N/A
FY 2011-12 N/A N/A N/A 50,000
FY 2012-13 N/A N/A N/A 50,000
FY 2013-14 N/A N/A N/A 50,000
FY 2014-15 N/A N/A N/A 50,000
FY 2015-16 N/A N/A N/A 50,000
Total 63,943 (Projection)
Sources of Financing:
Street Impact Fees 63,943 250,000
Total 63,943 250,000
This project is consistent with the implementing policies found in Section 4.5 of the
General Plan. This project is categorically exempt under Section 15301
Class 1(c) of the CEQA Guidelines.
GC35
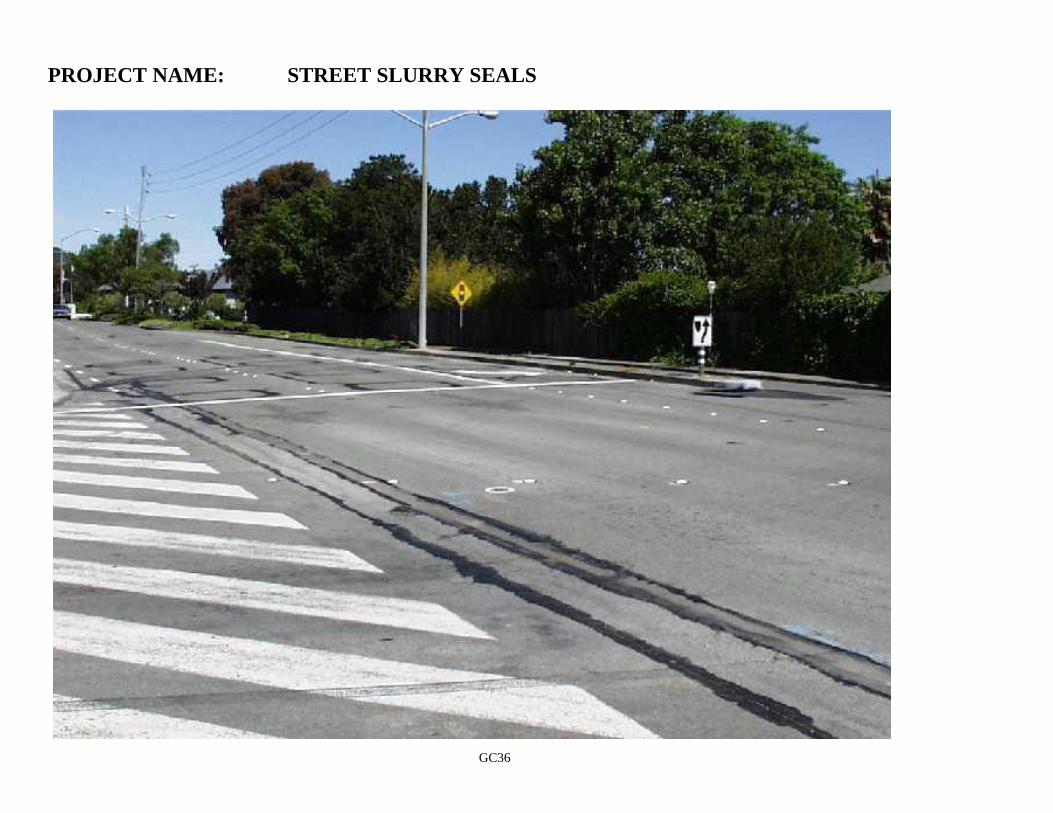
GC36
PROJECT NAME: STREET SLURRY SEALS
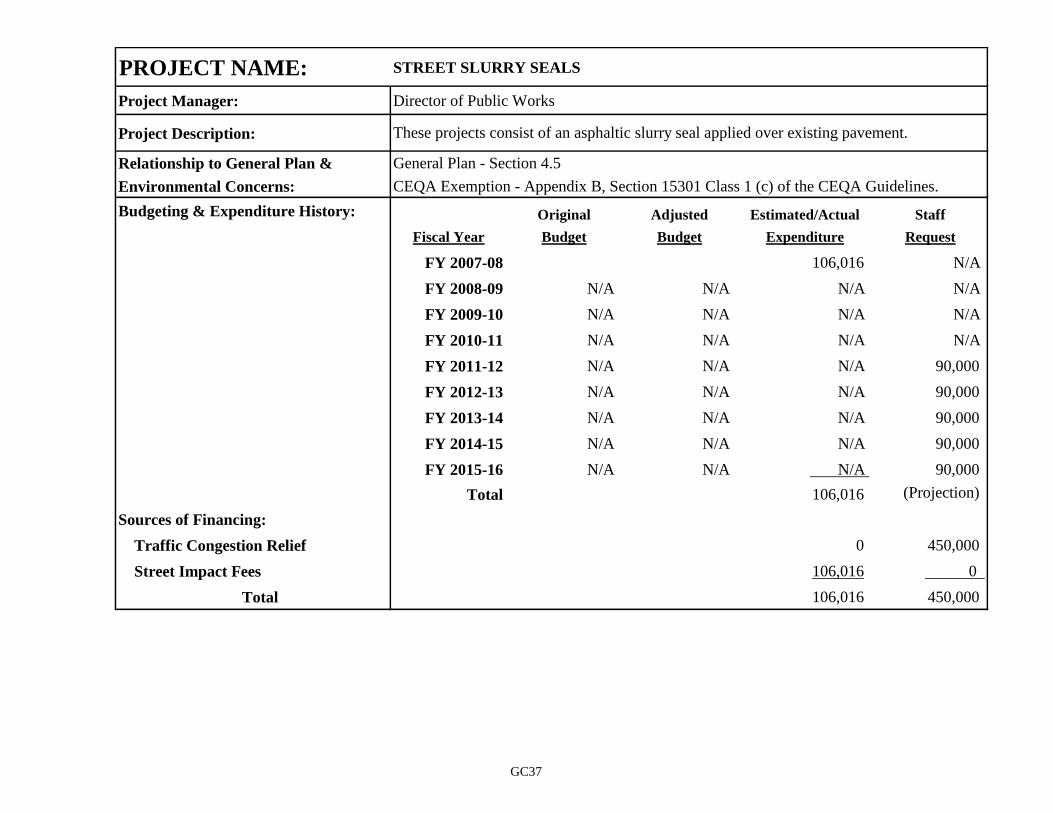
PROJECT NAME: STREET SLURRY SEALS
Project Manager: Director of Public Works
Project Description:
Relationship to General Plan & General Plan - Section 4.5
Environmental Concerns: CEQA Exemption - Appendix B, Section 15301 Class 1 (c) of the CEQA Guidelines.
Budgeting & Expenditure History: Original Adjusted Estimated/Actual Staff
Fiscal Year Budget Budget Expenditure Request
FY 2007-08 106,016 N/A
FY 2008-09 N/A N/A N/A N/A
FY 2009-10 N/A N/A N/A N/A
FY 2010-11 N/A N/A N/A N/A
FY 2011-12 N/A N/A N/A 90,000
FY 2012-13 N/A N/A N/A 90,000
FY 2013-14 N/A N/A N/A 90,000
FY 2014-15 N/A N/A N/A 90,000
FY 2015-16 N/A N/A N/A 90,000
Total 106,016 (Projection)
Sources of Financing:
Traffic Congestion Relief 0 450,000
Street Impact Fees 106,016 0
Total 106,016 450,000
These projects consist of an asphaltic slurry seal applied over existing pavement.
GC37
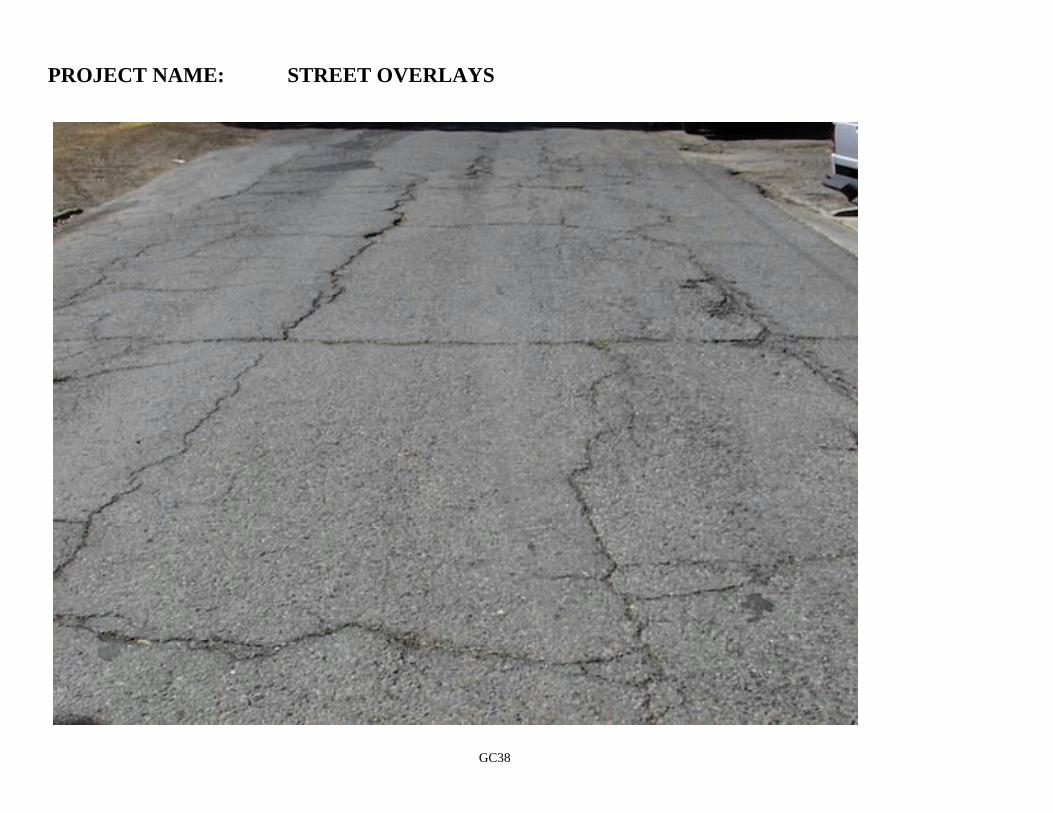
GC38
PROJECT NAME: STREET OVERLAYS
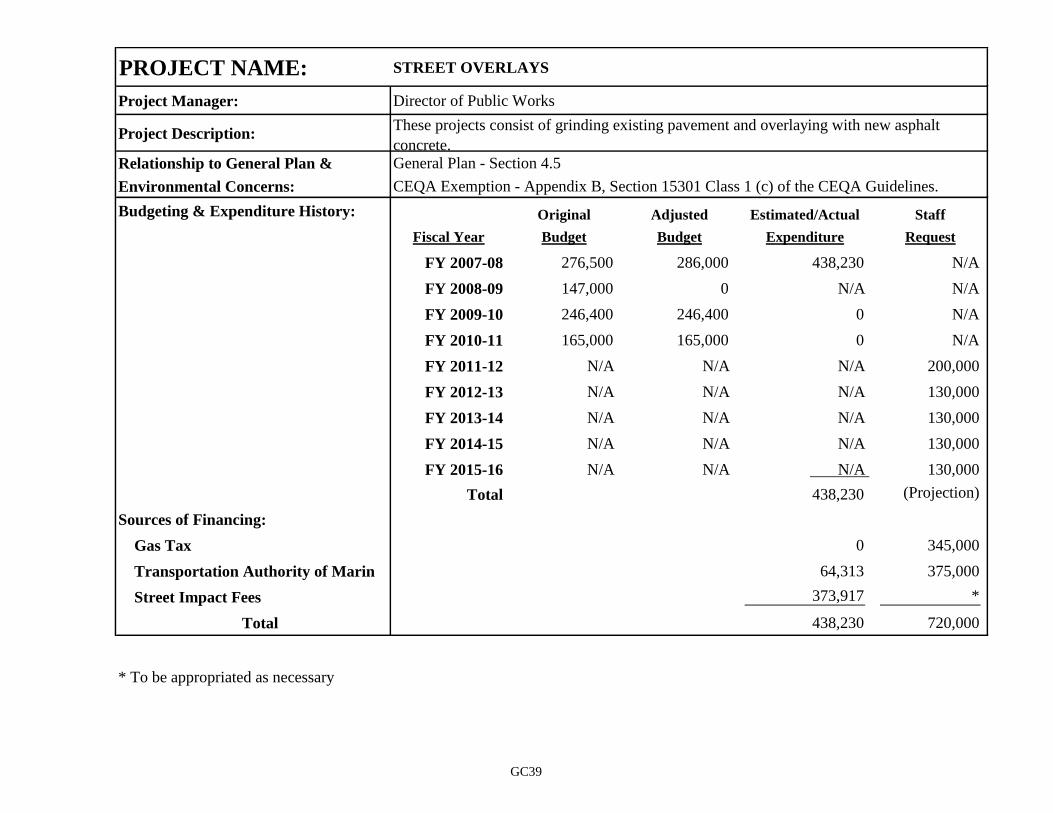
PROJECT NAME: STREET OVERLAYS
Project Manager: Director of Public Works
Project Description:
Relationship to General Plan & General Plan - Section 4.5
Environmental Concerns: CEQA Exemption - Appendix B, Section 15301 Class 1 (c) of the CEQA Guidelines.
Budgeting & Expenditure History: Original Adjusted Estimated/Actual Staff
Fiscal Year Budget Budget Expenditure Request
FY 2007-08 276,500 286,000 438,230 N/A
FY 2008-09 147,000 0 N/A N/A
FY 2009-10 246,400 246,400 0 N/A
FY 2010-11 165,000 165,000 0 N/A
FY 2011-12 N/A N/A N/A 200,000
FY 2012-13 N/A N/A N/A 130,000
FY 2013-14 N/A N/A N/A 130,000
FY 2014-15 N/A N/A N/A 130,000
FY 2015-16 N/A N/A N/A 130,000
Total 438,230 (Projection)
Sources of Financing:
Gas Tax 0 345,000
Transportation Authority of Marin 64,313 375,000
Street Impact Fees 373,917 *
Total 438,230 720,000
* To be appropriated as necessary
These projects consist of grinding existing pavement and overlaying with new asphalt
concrete.
GC39
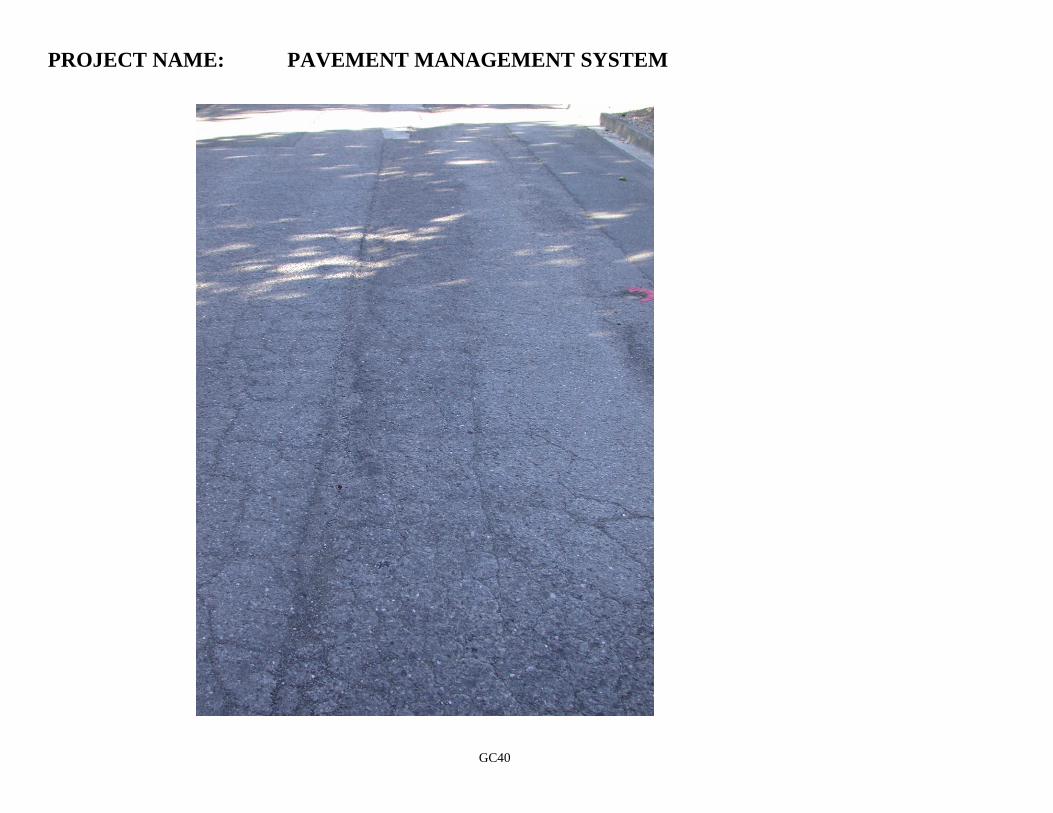
GC40
PROJECT NAME: PAVEMENT MANAGEMENT SYSTEM
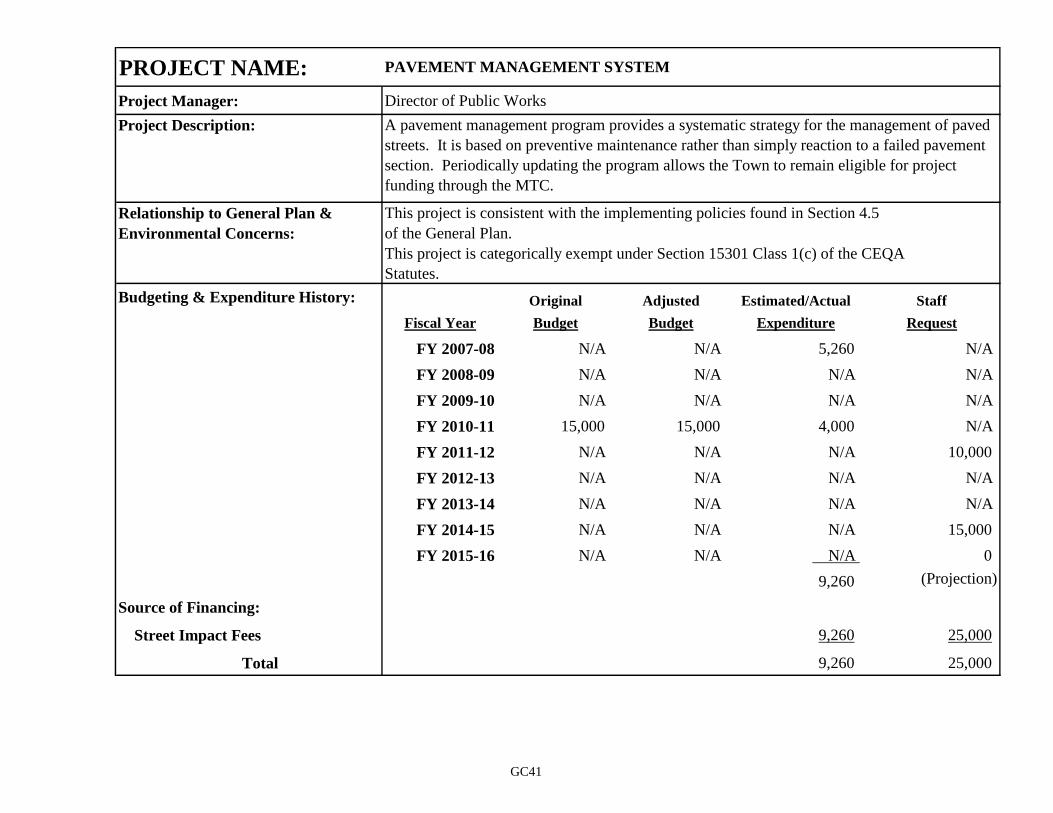
PROJECT NAME:
Project Manager: Director of Public Works
Project Description:
Relationship to General Plan & This project is consistent with the implementing policies found in Section 4.5
Environmental Concerns: of the General Plan.
This project is categorically exempt under Section 15301 Class 1(c) of the CEQA
Statutes.
Budgeting & Expenditure History: Original Adjusted Estimated/Actual Staff
Fiscal Year Budget Budget Expenditure Request
FY 2007-08 N/A N/A 5,260 N/A
FY 2008-09 N/A N/A N/A N/A
FY 2009-10 N/A N/A N/A N/A
FY 2010-11 15,000 15,000 4,000 N/A
FY 2011-12 N/A N/A N/A 10,000
FY 2012-13 N/A N/A N/A N/A
FY 2013-14 N/A N/A N/A N/A
FY 2014-15 N/A N/A N/A 15,000
FY 2015-16 N/A N/A N/A 0
9,260 (Projection)
Source of Financing:
Street Impact Fees 9,260 25,000
Total 9,260 25,000
A pavement management program provides a systematic strategy for the management of paved
streets. It is based on preventive maintenance rather than simply reaction to a failed pavement
section. Periodically updating the program allows the Town to remain eligible for project
funding through the MTC.
PAVEMENT MANAGEMENT SYSTEM
GC41

GC42
PROJECT NAME: STREET INFRASTRUCTURE MANAGEMENT - GIS
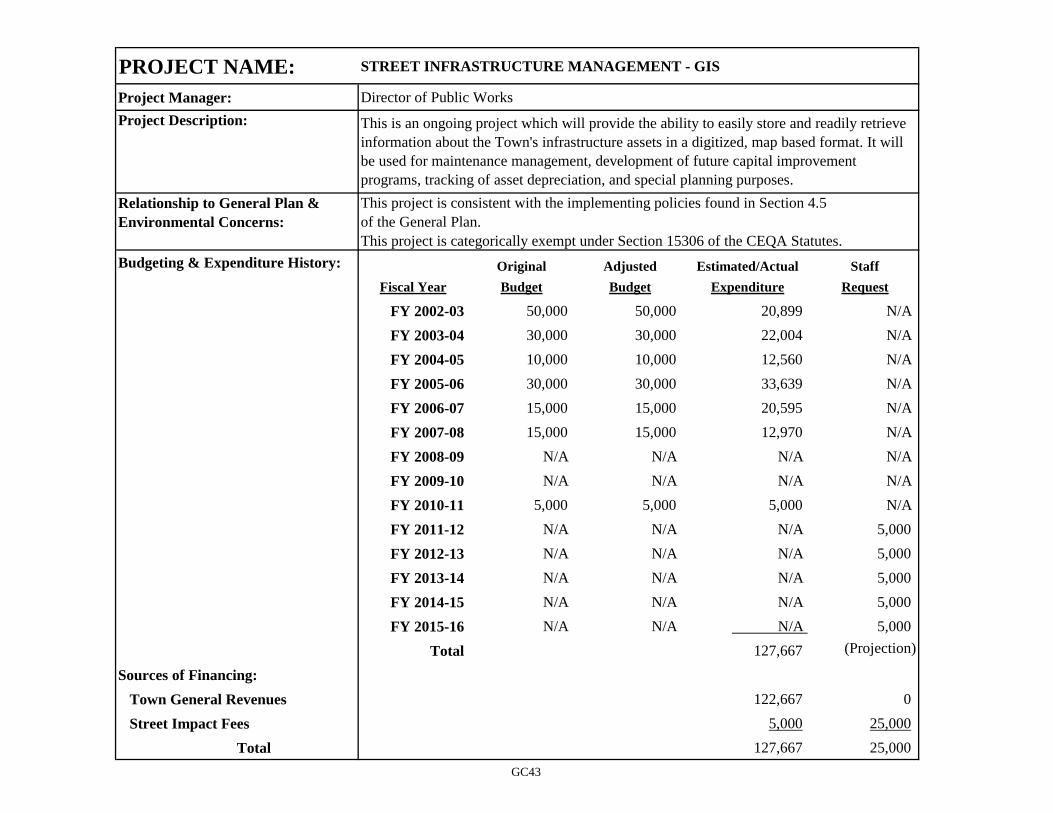
PROJECT NAME: STREET INFRASTRUCTURE MANAGEMENT - GIS
Project Manager: Director of Public Works
Project Description:
Relationship to General Plan & This project is consistent with the implementing policies found in Section 4.5
Environmental Concerns: of the General Plan.
This project is categorically exempt under Section 15306 of the CEQA Statutes.
Budgeting & Expenditure History: Original Adjusted Estimated/Actual Staff
Fiscal Year Budget Budget Expenditure Request
FY 2002-03 50,000 50,000 20,899 N/A
FY 2003-04 30,000 30,000 22,004 N/A
FY 2004-05 10,000 10,000 12,560 N/A
FY 2005-06 30,000 30,000 33,639 N/A
FY 2006-07 15,000 15,000 20,595 N/A
FY 2007-08 15,000 15,000 12,970 N/A
FY 2008-09 N/A N/A N/A N/A
FY 2009-10 N/A N/A N/A N/A
FY 2010-11 5,000 5,000 5,000 N/A
FY 2011-12 N/A N/A N/A 5,000
FY 2012-13 N/A N/A N/A 5,000
FY 2013-14 N/A N/A N/A 5,000
FY 2014-15 N/A N/A N/A 5,000
FY 2015-16 N/A N/A N/A 5,000
Total 127,667 (Projection)
Sources of Financing:
Town General Revenues 122,667 0
Street Impact Fees 5,000 25,000
Total 127,667 25,000
This is an ongoing project which will provide the ability to easily store and readily retrieve
information about the Town's infrastructure assets in a digitized, map based format. It will
be used for maintenance management, development of future capital improvement
programs, tracking of asset depreciation, and special planning purposes.
GC43
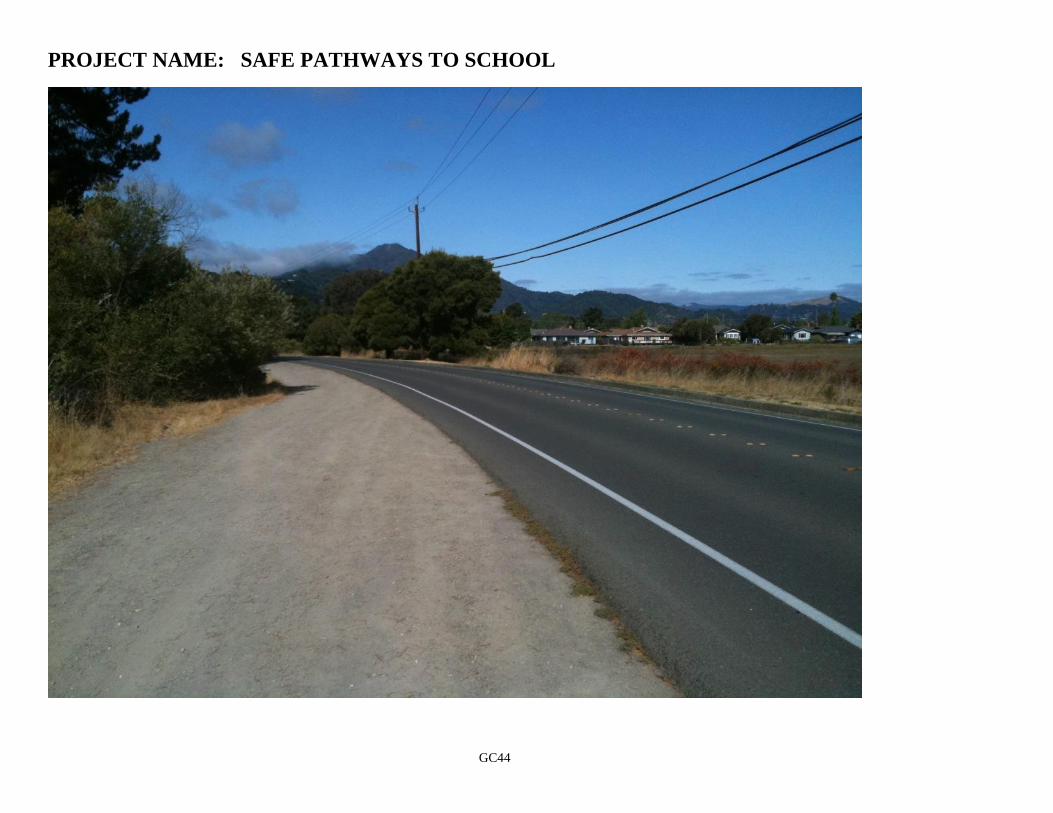
GC44
PROJECT NAME: SAFE PATHWAYS TO SCHOOL
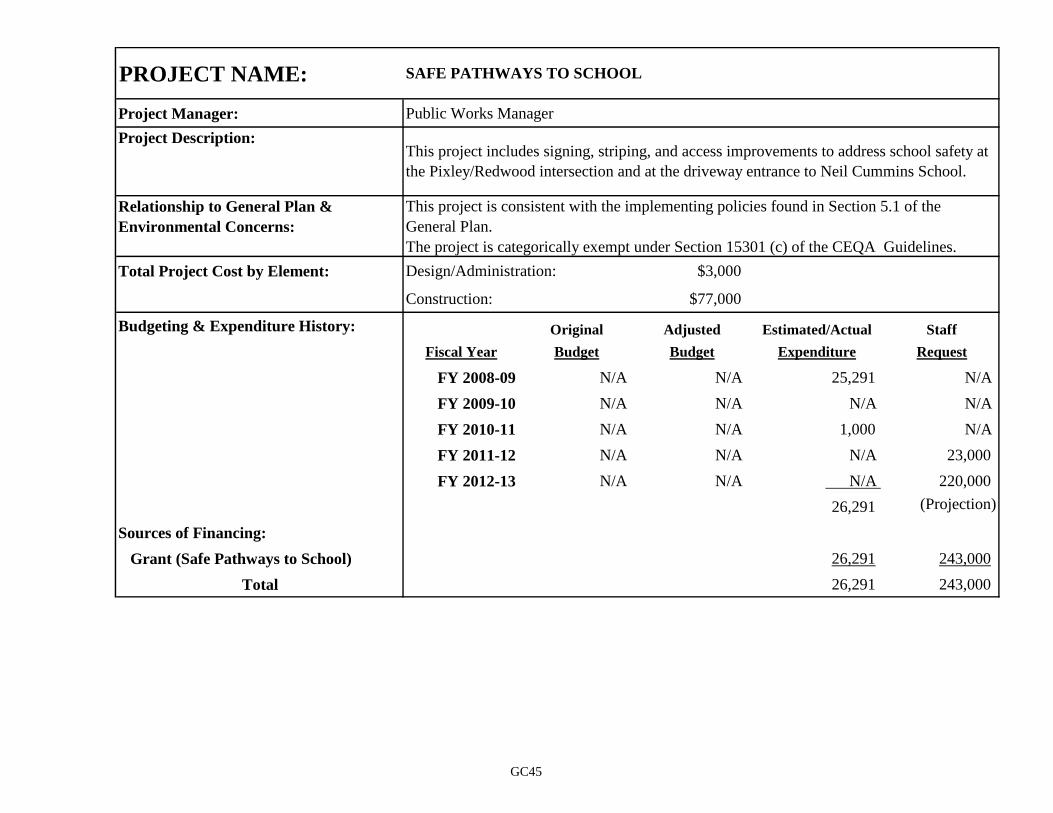
PROJECT NAME:
Project Manager: Public Works Manager
Project Description:
Relationship to General Plan & This project is consistent with the implementing policies found in Section 5.1 of the
Environmental Concerns: General Plan.
The project is categorically exempt under Section 15301 (c) of the CEQA Guidelines.
Total Project Cost by Element: Design/Administration: $3,000
Construction: $77,000
Budgeting & Expenditure History: Original Adjusted Estimated/Actual Staff
Fiscal Year Budget Budget Expenditure Request
FY 2008-09 N/A N/A 25,291 N/A
FY 2009-10 N/A N/A N/A N/A
FY 2010-11 N/A N/A 1,000 N/A
FY 2011-12 N/A N/A N/A 23,000
FY 2012-13 N/A N/A N/A 220,000
26,291 (Projection)
Sources of Financing:
Grant (Safe Pathways to School) 26,291 243,000
Total 26,291 243,000
This project includes signing, striping, and access improvements to address school safety at
the Pixley/Redwood intersection and at the driveway entrance to Neil Cummins School.
SAFE PATHWAYS TO SCHOOL
GC45
BLANK PAGE
2011-12Budget\GenCapitalProjectsList.xls GC46

BLANK PAGE
2011-12Budget\Gengovt.xls GG1

BLANK PAGE
2011-12Budget\Gengovt.xls GG2

BLANK PAGE
2011-12Budget\Gengovt.xls GG3
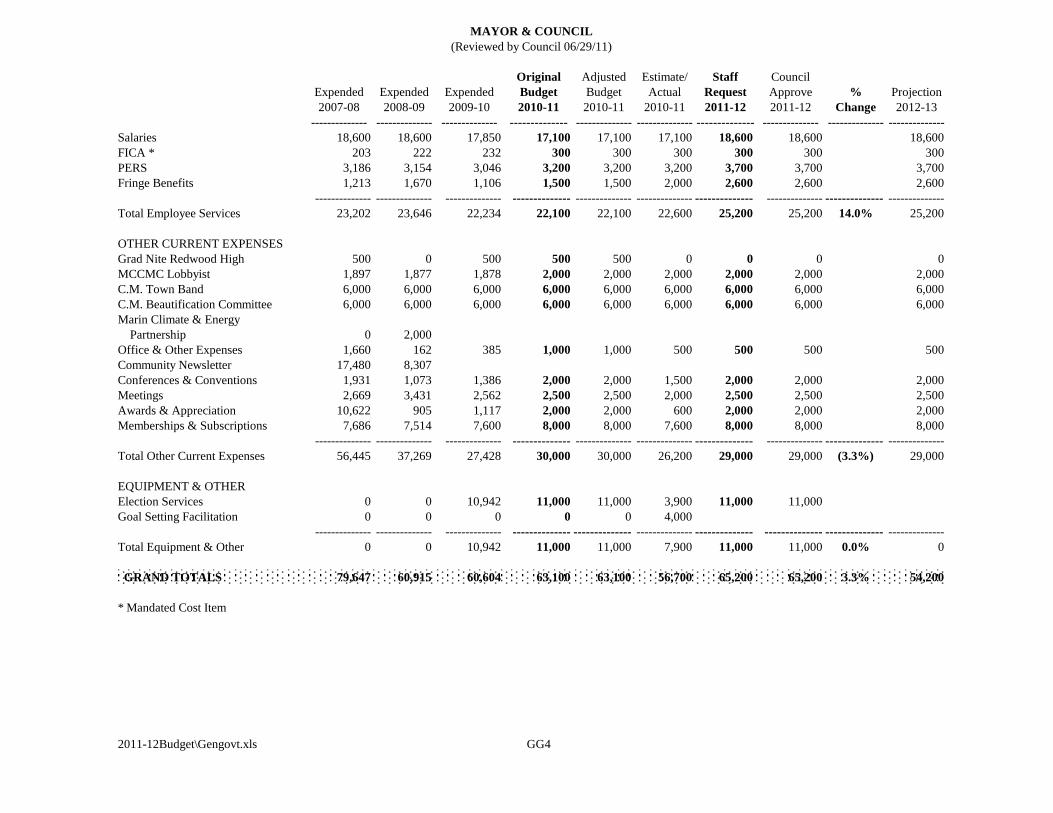
Original Adjusted Estimate/ Staff Council
Expended Expended Expended Budget Budget Actual Request Approve % Projection
2007-08 2008-09 2009-10 2010-11 2010-11 2010-11 2011-12 2011-12 Change 2012-13
-------------- -------------- -------------- -------------- -------------- -------------- -------------- -------------- -------------- --------------
Salaries 18,600 18,600 17,850 17,100 17,100 17,100 18,600 18,600 18,600
FICA * 203 222 232 300 300 300 300 300 300
PERS 3,186 3,154 3,046 3,200 3,200 3,200 3,700 3,700 3,700
Fringe Benefits 1,213 1,670 1,106 1,500 1,500 2,000 2,600 2,600 2,600
-------------- -------------- -------------- -------------- -------------- -------------- -------------- -------------- -------------- --------------
Total Employee Services 23,202 23,646 22,234 22,100 22,100 22,600 25,200 25,200 14.0% 25,200
OTHER CURRENT EXPENSES
Grad Nite Redwood High 500 0 500 500 500 0 0 0 0
MCCMC Lobbyist 1,897 1,877 1,878 2,000 2,000 2,000 2,000 2,000 2,000
C.M. Town Band 6,000 6,000 6,000 6,000 6,000 6,000 6,000 6,000 6,000
C.M. Beautification Committee 6,000 6,000 6,000 6,000 6,000 6,000 6,000 6,000 6,000
Marin Climate & Energy
Partnership 0 2,000
Office & Other Expenses 1,660 162 385 1,000 1,000 500 500 500 500
Community Newsletter 17,480 8,307
Conferences & Conventions 1,931 1,073 1,386 2,000 2,000 1,500 2,000 2,000 2,000
Meetings 2,669 3,431 2,562 2,500 2,500 2,000 2,500 2,500 2,500
Awards & Appreciation 10,622 905 1,117 2,000 2,000 600 2,000 2,000 2,000
Memberships & Subscriptions 7,686 7,514 7,600 8,000 8,000 7,600 8,000 8,000 8,000
-------------- -------------- -------------- -------------- -------------- -------------- -------------- -------------- -------------- --------------
Total Other Current Expenses 56,445 37,269 27,428 30,000 30,000 26,200 29,000 29,000 (3.3%) 29,000
EQUIPMENT & OTHER
Election Services 0 0 10,942 11,000 11,000 3,900 11,000 11,000
Goal Setting Facilitation 0 0 0 0 0 4,000
-------------- -------------- -------------- -------------- -------------- -------------- -------------- -------------- -------------- --------------
Total Equipment & Other 0 0 10,942 11,000 11,000 7,900 11,000 11,000 0.0% 0
GRAND TOTALS 79,647 60,915 60,604 63,100 63,100 56,700 65,200 65,200 3.3% 54,200
* Mandated Cost Item
2011-12Budget\Gengovt.xls GG4
MAYOR & COUNCIL
(Reviewed by Council 06/29/11)
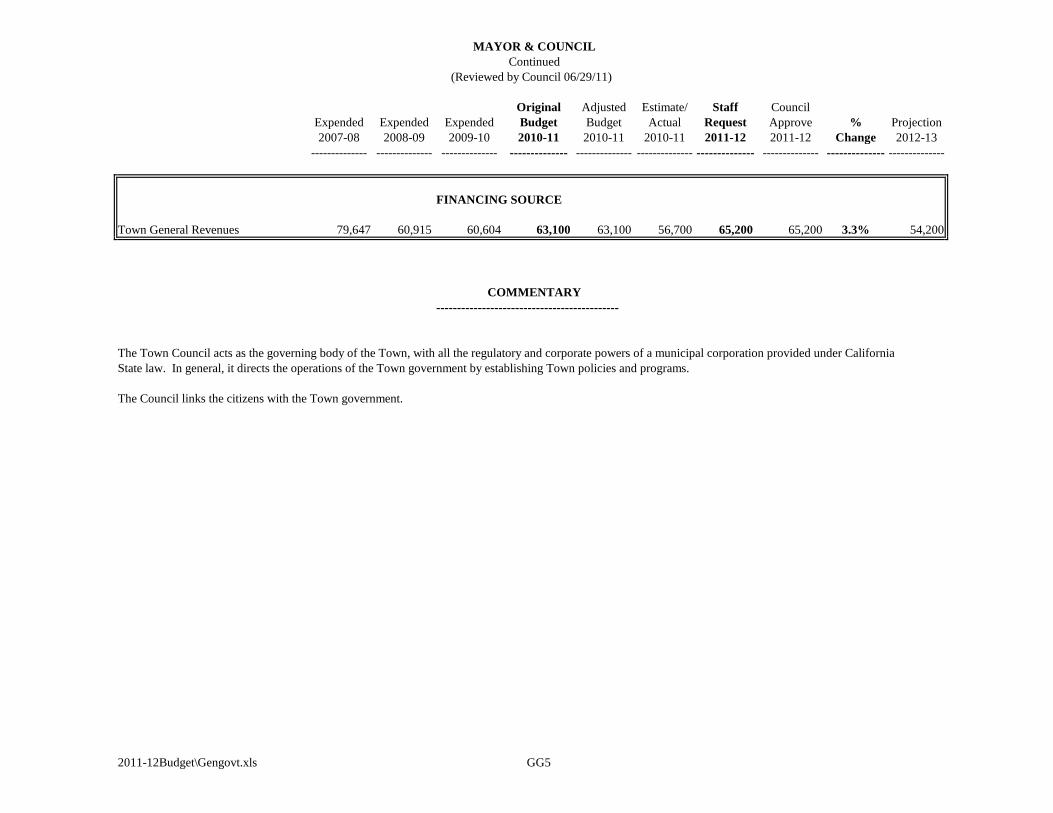
MAYOR & COUNCIL
Continued
Original Adjusted Estimate/ Staff Council
Expended Expended Expended Budget Budget Actual Request Approve % Projection
2007-08 2008-09 2009-10 2010-11 2010-11 2010-11 2011-12 2011-12 Change 2012-13
-------------- -------------- -------------- -------------- -------------- -------------- -------------- -------------- -------------- --------------
FINANCING SOURCE
Town General Revenues 79,647 60,915 60,604 63,100 63,100 56,700 65,200 65,200 3.3% 54,200
COMMENTARY
--------------------------------------------
The Town Council acts as the governing body of the Town, with all the regulatory and corporate powers of a municipal corporation provided under California
State law. In general, it directs the operations of the Town government by establishing Town policies and programs.
The Council links the citizens with the Town government.
2011-12Budget\Gengovt.xls GG5
(Reviewed by Council 06/29/11)
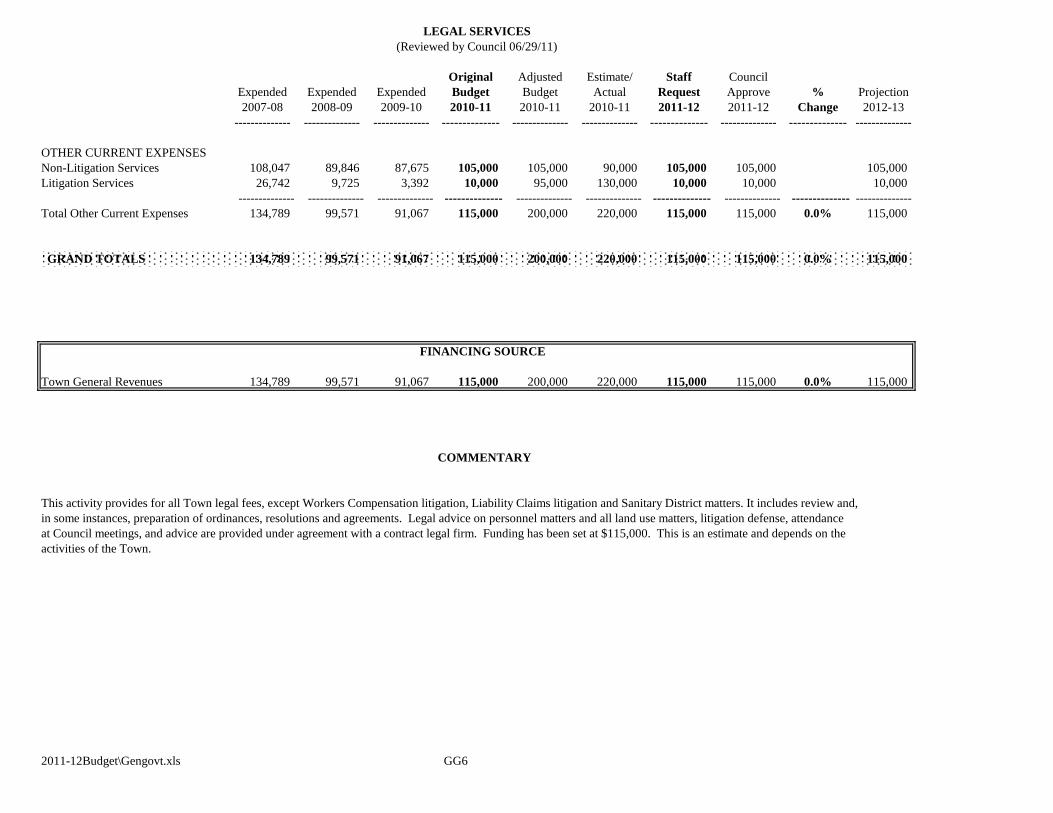
Original Adjusted Estimate/ Staff Council
Expended Expended Expended Budget Budget Actual Request Approve % Projection
2007-08 2008-09 2009-10 2010-11 2010-11 2010-11 2011-12 2011-12 Change 2012-13
-------------- -------------- -------------- -------------- -------------- -------------- -------------- -------------- -------------- --------------
OTHER CURRENT EXPENSES
Non-Litigation Services 108,047 89,846 87,675 105,000 105,000 90,000 105,000 105,000 105,000
Litigation Services 26,742 9,725 3,392 10,000 95,000 130,000 10,000 10,000 10,000
-------------- -------------- -------------- -------------- -------------- -------------- -------------- -------------- -------------- --------------
Total Other Current Expenses 134,789 99,571 91,067 115,000 200,000 220,000 115,000 115,000 0.0% 115,000
GRAND TOTALS 134,789 99,571 91,067 115,000 200,000 220,000 115,000 115,000 0.0% 115,000
FINANCING SOURCE
Town General Revenues 134,789 99,571 91,067 115,000 200,000 220,000 115,000 115,000 0.0% 115,000
COMMENTARY
This activity provides for all Town legal fees, except Workers Compensation litigation, Liability Claims litigation and Sanitary District matters. It includes review and,
in some instances, preparation of ordinances, resolutions and agreements. Legal advice on personnel matters and all land use matters, litigation defense, attendance
at Council meetings, and advice are provided under agreement with a contract legal firm. Funding has been set at $115,000. This is an estimate and depends on the
activities of the Town.
2011-12Budget\Gengovt.xls GG6
LEGAL SERVICES
(Reviewed by Council 06/29/11)
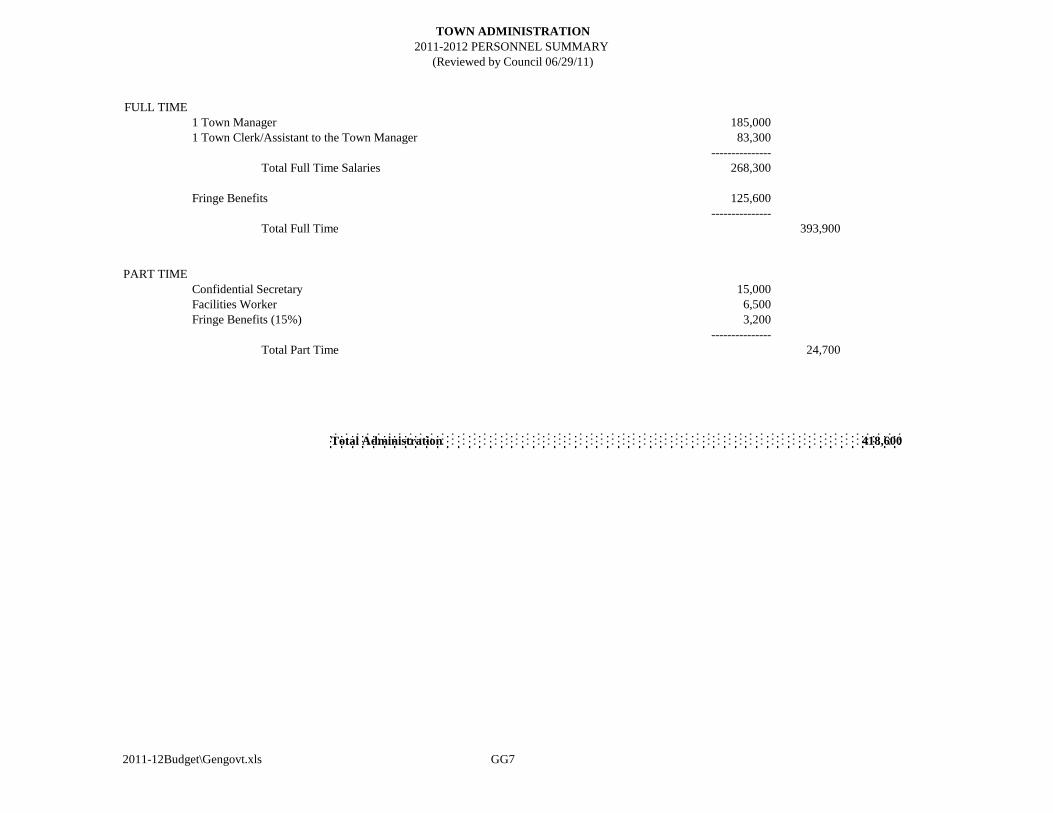
TOWN ADMINISTRATION
2011-2012 PERSONNEL SUMMARY
FULL TIME
1 Town Manager 185,000
1 Town Clerk/Assistant to the Town Manager 83,300
---------------
Total Full Time Salaries 268,300
Fringe Benefits 125,600
---------------
Total Full Time 393,900
PART TIME
Confidential Secretary 15,000
Facilities Worker 6,500
Fringe Benefits (15%) 3,200
---------------
Total Part Time 24,700
Total Administration 418,600
2011-12Budget\Gengovt.xls GG7
(Reviewed by Council 06/29/11)
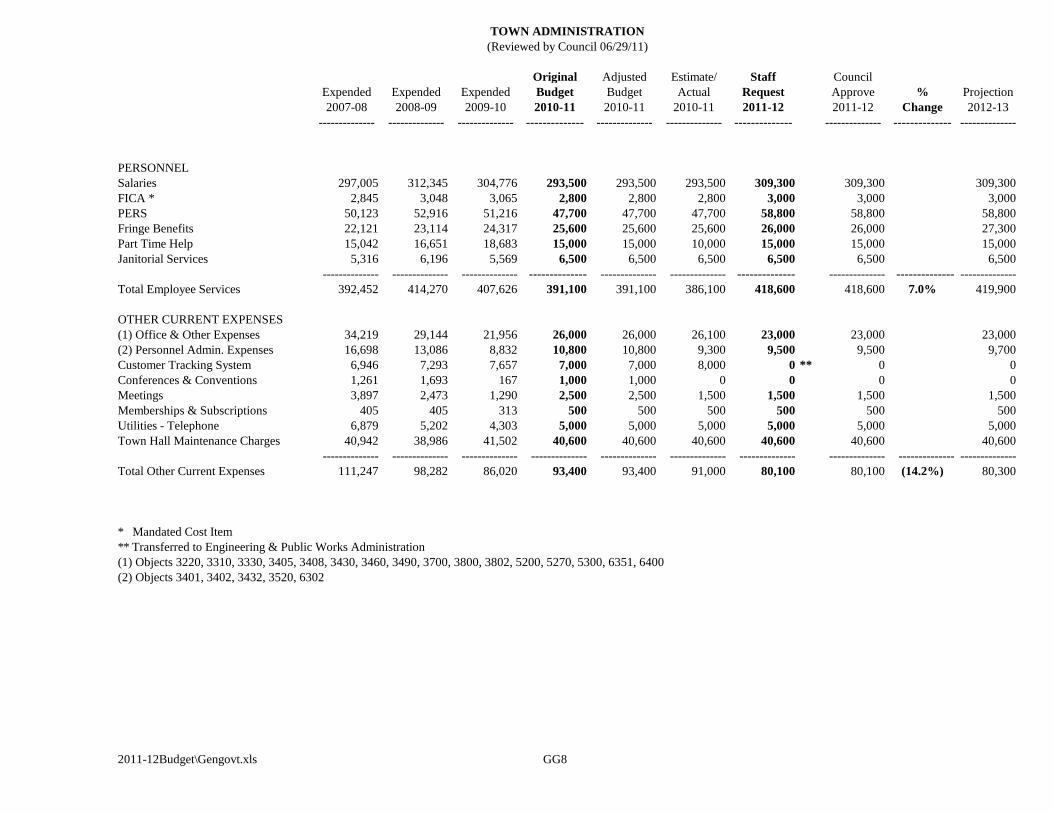
TOWN ADMINISTRATION
Original Adjusted Estimate/ Staff Council
Expended Expended Expended Budget Budget Actual Request Approve % Projection
2007-08 2008-09 2009-10 2010-11 2010-11 2010-11 2011-12 2011-12 Change 2012-13
-------------- -------------- -------------- -------------- -------------- -------------- -------------- -------------- -------------- --------------
PERSONNEL
Salaries 297,005 312,345 304,776 293,500 293,500 293,500 309,300 309,300 309,300
FICA * 2,845 3,048 3,065 2,800 2,800 2,800 3,000 3,000 3,000
PERS 50,123 52,916 51,216 47,700 47,700 47,700 58,800 58,800 58,800
Fringe Benefits 22,121 23,114 24,317 25,600 25,600 25,600 26,000 26,000 27,300
Part Time Help 15,042 16,651 18,683 15,000 15,000 10,000 15,000 15,000 15,000
Janitorial Services 5,316 6,196 5,569 6,500 6,500 6,500 6,500 6,500 6,500
-------------- -------------- -------------- -------------- -------------- -------------- -------------- -------------- -------------- --------------
Total Employee Services 392,452 414,270 407,626 391,100 391,100 386,100 418,600 418,600 7.0% 419,900
OTHER CURRENT EXPENSES
(1) Office & Other Expenses 34,219 29,144 21,956 26,000 26,000 26,100 23,000 23,000 23,000
(2) Personnel Admin. Expenses 16,698 13,086 8,832 10,800 10,800 9,300 9,500 9,500 9,700
Customer Tracking System 6,946 7,293 7,657 7,000 7,000 8,000 0 ** 0 0
Conferences & Conventions 1,261 1,693 167 1,000 1,000 0 0 0 0
Meetings 3,897 2,473 1,290 2,500 2,500 1,500 1,500 1,500 1,500
Memberships & Subscriptions 405 405 313 500 500 500 500 500 500
Utilities - Telephone 6,879 5,202 4,303 5,000 5,000 5,000 5,000 5,000 5,000
Town Hall Maintenance Charges 40,942 38,986 41,502 40,600 40,600 40,600 40,600 40,600 40,600
-------------- -------------- -------------- -------------- -------------- -------------- -------------- -------------- -------------- --------------
Total Other Current Expenses 111,247 98,282 86,020 93,400 93,400 91,000 80,100 80,100 (14.2%) 80,300
* Mandated Cost Item
** Transferred to Engineering & Public Works Administration
(1) Objects 3220, 3310, 3330, 3405, 3408, 3430, 3460, 3490, 3700, 3800, 3802, 5200, 5270, 5300, 6351, 6400
(2) Objects 3401, 3402, 3432, 3520, 6302
2011-12Budget\Gengovt.xls GG8
(Reviewed by Council 06/29/11)
TOWN ADMINISTRATION
Continued
COMMENTARY
-------------------------------
Administration includes the positions of Town Manager and Town Clerk/Assistant to the Town Manager. Administration oversees the Town's functions,
and together with the Management Team, implements goals and objectives established by the Town Council. This activity performs the Town Clerk
and Council Election functions. All recruitment, medical exams, and labor relations costs for the Town are included in the Administration Budget.
Identified goals and objectives are established each year by the Town Council.
2011-12Budget\Gengovt.xls GG10
(Reviewed by Council 06/29/11)
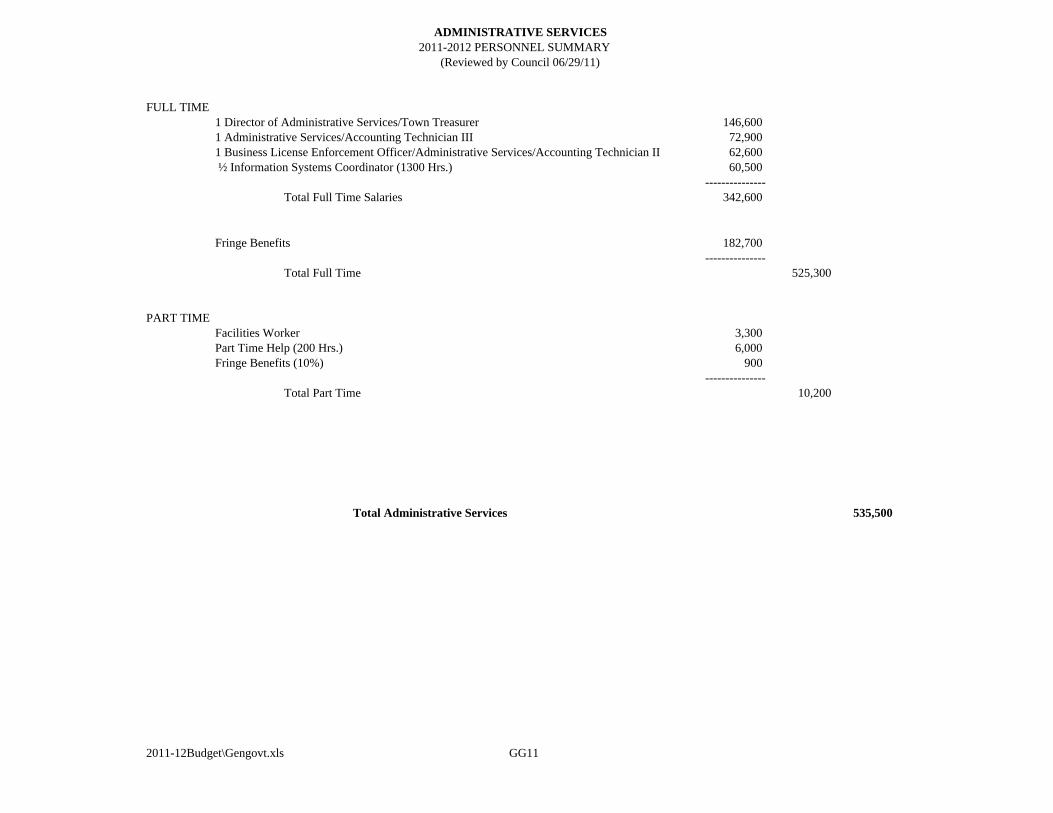
FULL TIME1 Director of Administrative Services/Town Treasurer 146,6001 Administrative Services/Accounting Technician III 72,9001 Business License Enforcement Officer/Administrative Services/Accounting Technician II 62,600 ½ Information Systems Coordinator (1300 Hrs.) 60,500
---------------Total Full Time Salaries 342,600
Fringe Benefits 182,700---------------
Total Full Time 525,300
PART TIMEFacilities Worker 3,300Part Time Help (200 Hrs.) 6,000Fringe Benefits (10%) 900
---------------Total Part Time 10,200
Total Administrative Services 535,500
2011-12Budget\Gengovt.xls GG11
ADMINISTRATIVE SERVICES2011-2012 PERSONNEL SUMMARY
(Reviewed by Council 06/29/11)
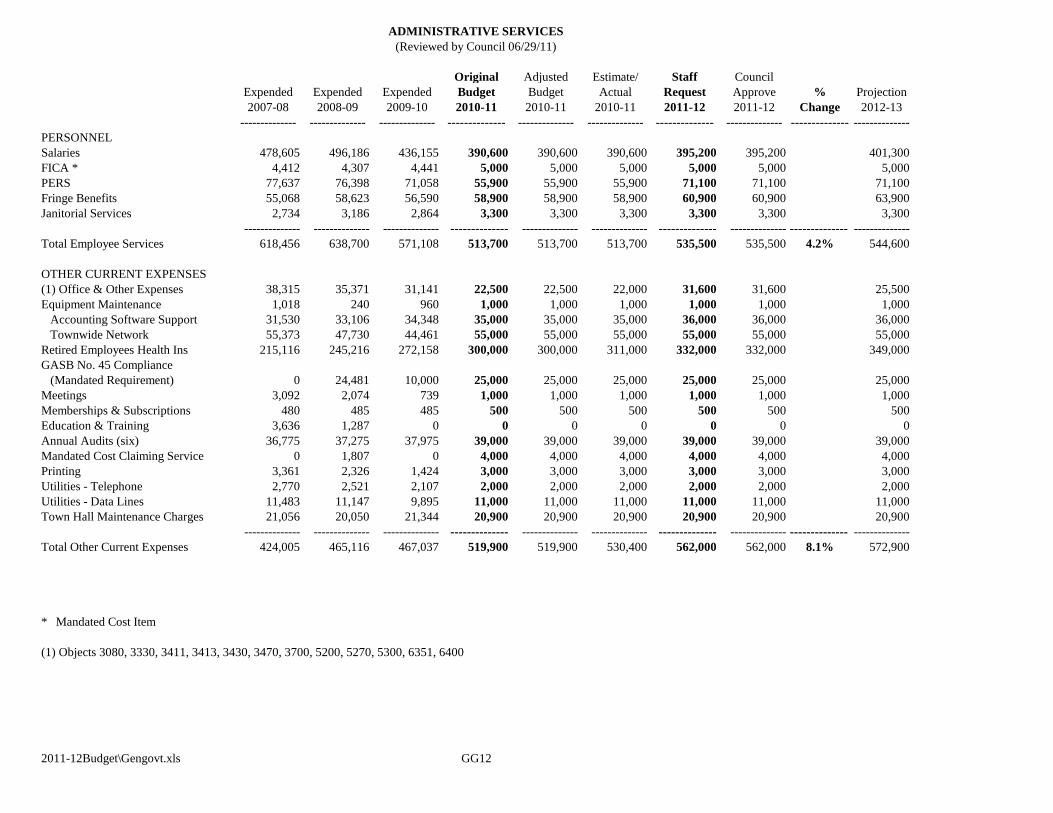
Original Adjusted Estimate/ Staff Council
Expended Expended Expended Budget Budget Actual Request Approve % Projection
2007-08 2008-09 2009-10 2010-11 2010-11 2010-11 2011-12 2011-12 Change 2012-13
-------------- -------------- -------------- -------------- -------------- -------------- -------------- -------------- -------------- --------------
PERSONNEL
Salaries 478,605 496,186 436,155 390,600 390,600 390,600 395,200 395,200 401,300
FICA * 4,412 4,307 4,441 5,000 5,000 5,000 5,000 5,000 5,000
PERS 77,637 76,398 71,058 55,900 55,900 55,900 71,100 71,100 71,100
Fringe Benefits 55,068 58,623 56,590 58,900 58,900 58,900 60,900 60,900 63,900
Janitorial Services 2,734 3,186 2,864 3,300 3,300 3,300 3,300 3,300 3,300
-------------- -------------- -------------- -------------- -------------- -------------- -------------- -------------- -------------- --------------
Total Employee Services 618,456 638,700 571,108 513,700 513,700 513,700 535,500 535,500 4.2% 544,600
OTHER CURRENT EXPENSES
(1) Office & Other Expenses 38,315 35,371 31,141 22,500 22,500 22,000 31,600 31,600 25,500
Equipment Maintenance 1,018 240 960 1,000 1,000 1,000 1,000 1,000 1,000
Accounting Software Support 31,530 33,106 34,348 35,000 35,000 35,000 36,000 36,000 36,000
Townwide Network 55,373 47,730 44,461 55,000 55,000 55,000 55,000 55,000 55,000
Retired Employees Health Ins 215,116 245,216 272,158 300,000 300,000 311,000 332,000 332,000 349,000
GASB No. 45 Compliance
(Mandated Requirement) 0 24,481 10,000 25,000 25,000 25,000 25,000 25,000 25,000
Meetings 3,092 2,074 739 1,000 1,000 1,000 1,000 1,000 1,000
Memberships & Subscriptions 480 485 485 500 500 500 500 500 500
Education & Training 3,636 1,287 0 0 0 0 0 0 0
Annual Audits (six) 36,775 37,275 37,975 39,000 39,000 39,000 39,000 39,000 39,000
Mandated Cost Claiming Service 0 1,807 0 4,000 4,000 4,000 4,000 4,000 4,000
Printing 3,361 2,326 1,424 3,000 3,000 3,000 3,000 3,000 3,000
Utilities - Telephone 2,770 2,521 2,107 2,000 2,000 2,000 2,000 2,000 2,000
Utilities - Data Lines 11,483 11,147 9,895 11,000 11,000 11,000 11,000 11,000 11,000
Town Hall Maintenance Charges 21,056 20,050 21,344 20,900 20,900 20,900 20,900 20,900 20,900
-------------- -------------- -------------- -------------- -------------- -------------- -------------- -------------- -------------- --------------
Total Other Current Expenses 424,005 465,116 467,037 519,900 519,900 530,400 562,000 562,000 8.1% 572,900
* Mandated Cost Item
(1) Objects 3080, 3330, 3411, 3413, 3430, 3470, 3700, 5200, 5270, 5300, 6351, 6400
2011-12Budget\Gengovt.xls GG12
ADMINISTRATIVE SERVICES
(Reviewed by Council 06/29/11)
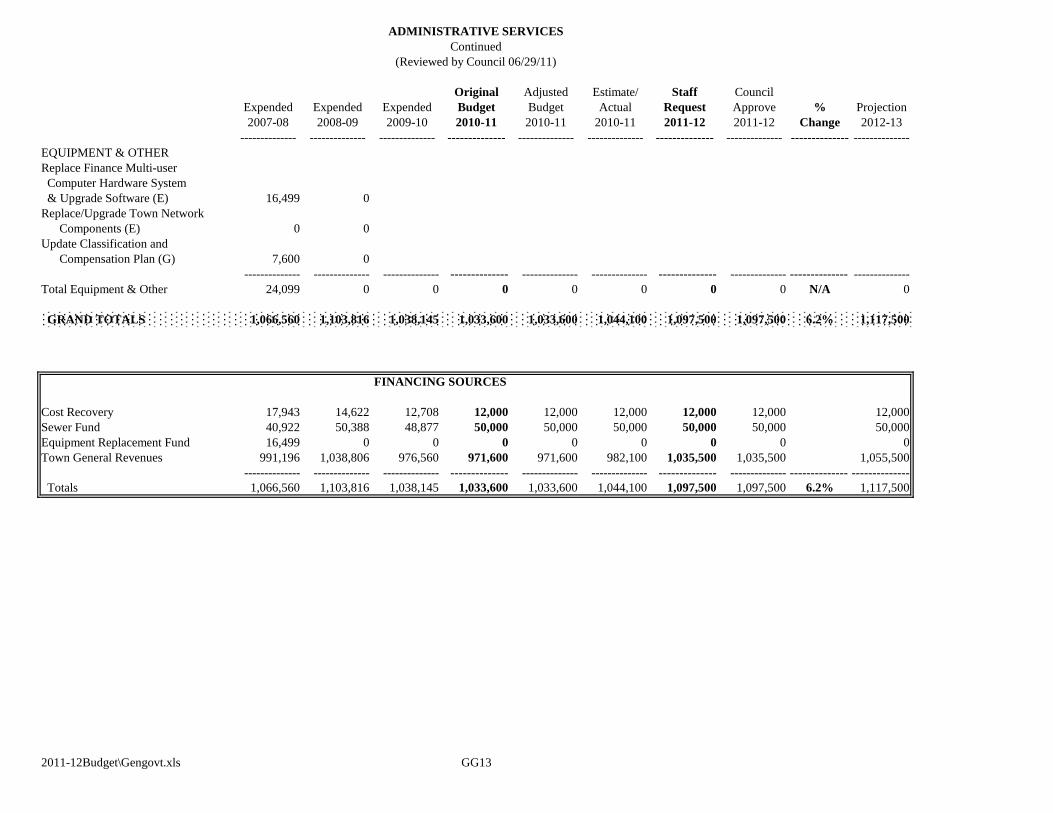
Original Adjusted Estimate/ Staff Council
Expended Expended Expended Budget Budget Actual Request Approve % Projection
2007-08 2008-09 2009-10 2010-11 2010-11 2010-11 2011-12 2011-12 Change 2012-13
-------------- -------------- -------------- -------------- -------------- -------------- -------------- -------------- -------------- --------------
EQUIPMENT & OTHER
Replace Finance Multi-user
Computer Hardware System
& Upgrade Software (E) 16,499 0
Replace/Upgrade Town Network
Components (E) 0 0
Update Classification and
Compensation Plan (G) 7,600 0
-------------- -------------- -------------- -------------- -------------- -------------- -------------- -------------- -------------- --------------
Total Equipment & Other 24,099 0 0 0 0 0 0 0 N/A 0
GRAND TOTALS 1,066,560 1,103,816 1,038,145 1,033,600 1,033,600 1,044,100 1,097,500 1,097,500 6.2% 1,117,500
FINANCING SOURCES
Cost Recovery 17,943 14,622 12,708 12,000 12,000 12,000 12,000 12,000 12,000
Sewer Fund 40,922 50,388 48,877 50,000 50,000 50,000 50,000 50,000 50,000
Equipment Replacement Fund 16,499 0 0 0 0 0 0 0 0
Town General Revenues 991,196 1,038,806 976,560 971,600 971,600 982,100 1,035,500 1,035,500 1,055,500
-------------- -------------- -------------- -------------- -------------- -------------- -------------- -------------- -------------- --------------
Totals 1,066,560 1,103,816 1,038,145 1,033,600 1,033,600 1,044,100 1,097,500 1,097,500 6.2% 1,117,500
2011-12Budget\Gengovt.xls GG13
ADMINISTRATIVE SERVICES
Continued
(Reviewed by Council 06/29/11)
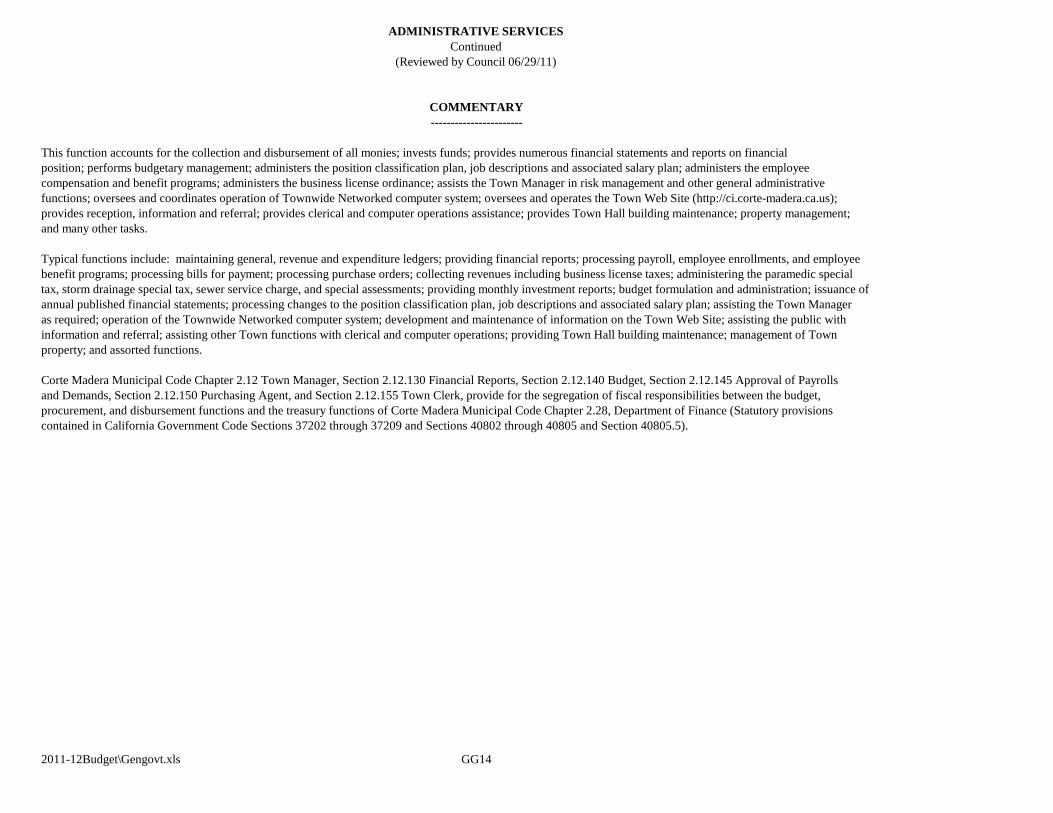
COMMENTARY
-----------------------
This function accounts for the collection and disbursement of all monies; invests funds; provides numerous financial statements and reports on financial
position; performs budgetary management; administers the position classification plan, job descriptions and associated salary plan; administers the employee
compensation and benefit programs; administers the business license ordinance; assists the Town Manager in risk management and other general administrative
functions; oversees and coordinates operation of Townwide Networked computer system; oversees and operates the Town Web Site (http://ci.corte-madera.ca.us);
provides reception, information and referral; provides clerical and computer operations assistance; provides Town Hall building maintenance; property management;
and many other tasks.
Typical functions include: maintaining general, revenue and expenditure ledgers; providing financial reports; processing payroll, employee enrollments, and employee
benefit programs; processing bills for payment; processing purchase orders; collecting revenues including business license taxes; administering the paramedic special
tax, storm drainage special tax, sewer service charge, and special assessments; providing monthly investment reports; budget formulation and administration; issuance of
annual published financial statements; processing changes to the position classification plan, job descriptions and associated salary plan; assisting the Town Manager
as required; operation of the Townwide Networked computer system; development and maintenance of information on the Town Web Site; assisting the public with
information and referral; assisting other Town functions with clerical and computer operations; providing Town Hall building maintenance; management of Town
property; and assorted functions.
Corte Madera Municipal Code Chapter 2.12 Town Manager, Section 2.12.130 Financial Reports, Section 2.12.140 Budget, Section 2.12.145 Approval of Payrolls
and Demands, Section 2.12.150 Purchasing Agent, and Section 2.12.155 Town Clerk, provide for the segregation of fiscal responsibilities between the budget,
procurement, and disbursement functions and the treasury functions of Corte Madera Municipal Code Chapter 2.28, Department of Finance (Statutory provisions
contained in California Government Code Sections 37202 through 37209 and Sections 40802 through 40805 and Section 40805.5).
2011-12Budget\Gengovt.xls GG14
Continued
(Reviewed by Council 06/29/11)
ADMINISTRATIVE SERVICES
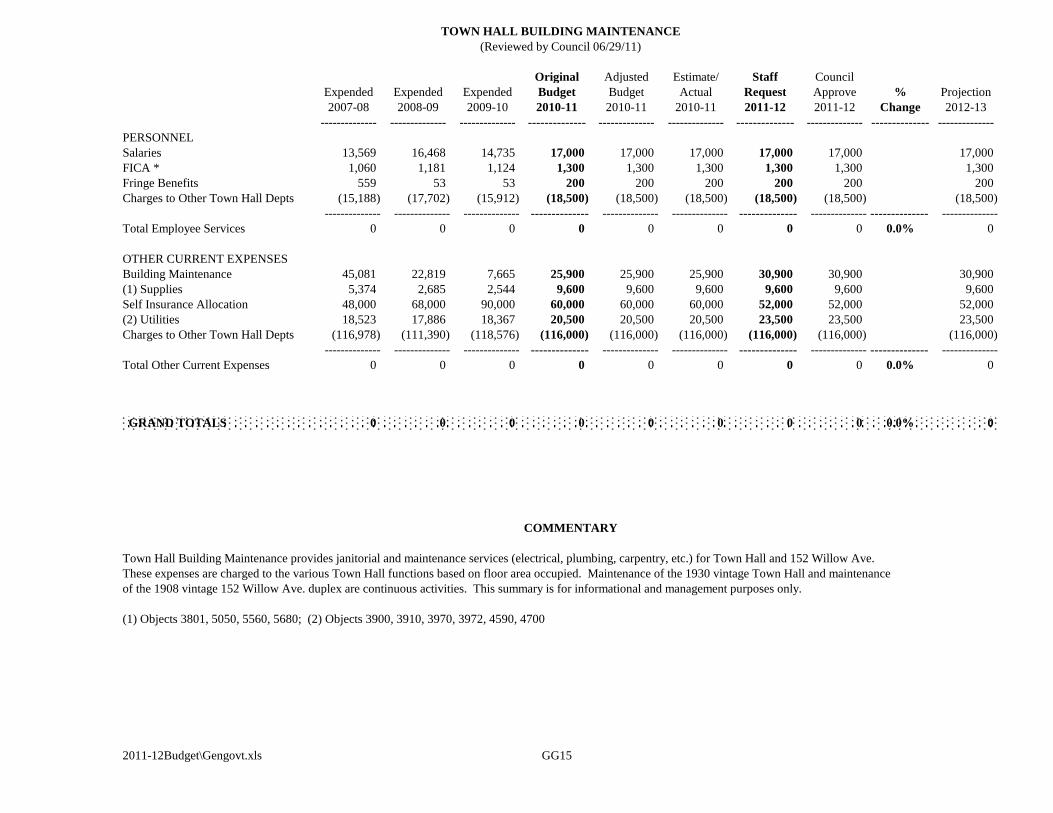
Original Adjusted Estimate/ Staff Council
Expended Expended Expended Budget Budget Actual Request Approve % Projection
2007-08 2008-09 2009-10 2010-11 2010-11 2010-11 2011-12 2011-12 Change 2012-13
-------------- -------------- -------------- -------------- -------------- -------------- -------------- -------------- -------------- --------------
PERSONNEL
Salaries 13,569 16,468 14,735 17,000 17,000 17,000 17,000 17,000 17,000
FICA * 1,060 1,181 1,124 1,300 1,300 1,300 1,300 1,300 1,300
Fringe Benefits 559 53 53 200 200 200 200 200 200
Charges to Other Town Hall Depts (15,188) (17,702) (15,912) (18,500) (18,500) (18,500) (18,500) (18,500) (18,500)
-------------- -------------- -------------- -------------- -------------- -------------- -------------- -------------- -------------- --------------
Total Employee Services 0 0 0 0 0 0 0 0 0.0% 0
OTHER CURRENT EXPENSES
Building Maintenance 45,081 22,819 7,665 25,900 25,900 25,900 30,900 30,900 30,900
(1) Supplies 5,374 2,685 2,544 9,600 9,600 9,600 9,600 9,600 9,600
Self Insurance Allocation 48,000 68,000 90,000 60,000 60,000 60,000 52,000 52,000 52,000
(2) Utilities 18,523 17,886 18,367 20,500 20,500 20,500 23,500 23,500 23,500
Charges to Other Town Hall Depts (116,978) (111,390) (118,576) (116,000) (116,000) (116,000) (116,000) (116,000) (116,000)
-------------- -------------- -------------- -------------- -------------- -------------- -------------- -------------- -------------- --------------
Total Other Current Expenses 0 0 0 0 0 0 0 0 0.0% 0
GRAND TOTALS 0 0 0 0 0 0 0 0 0.0% 0
COMMENTARY
Town Hall Building Maintenance provides janitorial and maintenance services (electrical, plumbing, carpentry, etc.) for Town Hall and 152 Willow Ave.
These expenses are charged to the various Town Hall functions based on floor area occupied. Maintenance of the 1930 vintage Town Hall and maintenance
of the 1908 vintage 152 Willow Ave. duplex are continuous activities. This summary is for informational and management purposes only.
(1) Objects 3801, 5050, 5560, 5680; (2) Objects 3900, 3910, 3970, 3972, 4590, 4700
2011-12Budget\Gengovt.xls GG15
TOWN HALL BUILDING MAINTENANCE
(Reviewed by Council 06/29/11)
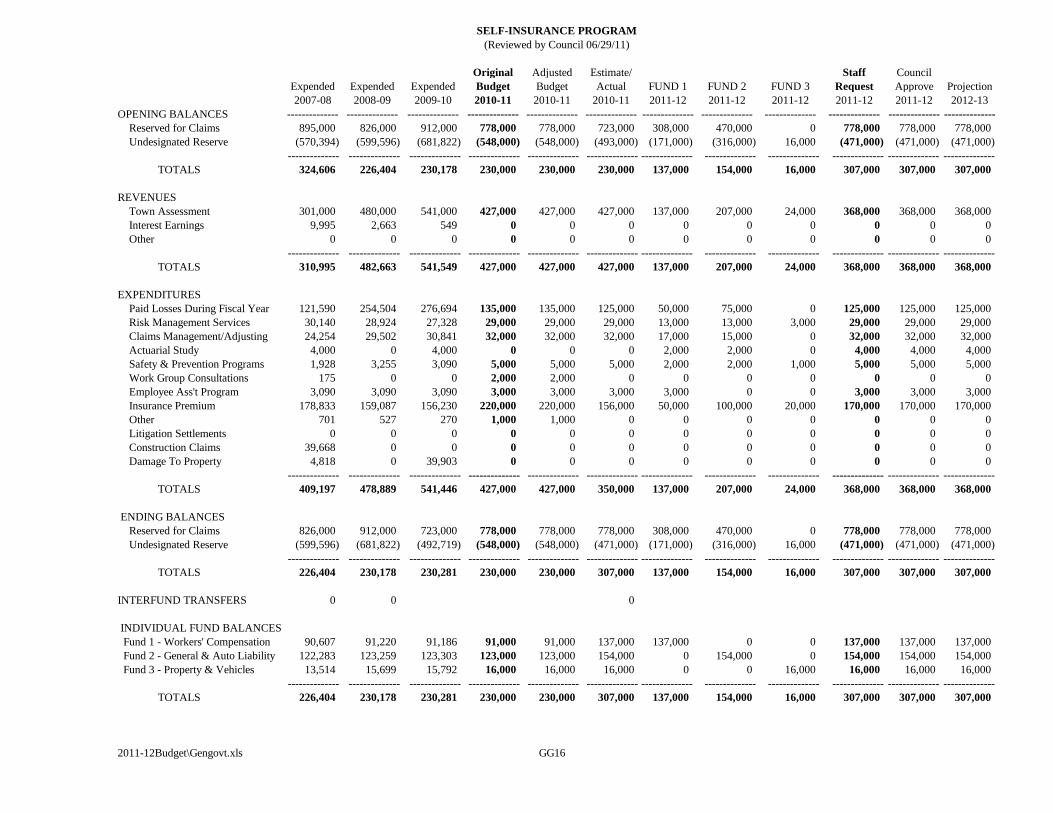
SELF-INSURANCE PROGRAM
Original Adjusted Estimate/ Staff Council
Expended Expended Expended Budget Budget Actual FUND 1 FUND 2 FUND 3 Request Approve Projection
2007-08 2008-09 2009-10 2010-11 2010-11 2010-11 2011-12 2011-12 2011-12 2011-12 2011-12 2012-13
OPENING BALANCES -------------- -------------- -------------- -------------- -------------- -------------- -------------- -------------- -------------- -------------- -------------- --------------
Reserved for Claims 895,000 826,000 912,000 778,000 778,000 723,000 308,000 470,000 0 778,000 778,000 778,000
Undesignated Reserve (570,394) (599,596) (681,822) (548,000) (548,000) (493,000) (171,000) (316,000) 16,000 (471,000) (471,000) (471,000)
-------------- -------------- -------------- -------------- -------------- -------------- -------------- -------------- -------------- -------------- -------------- --------------
TOTALS 324,606 226,404 230,178 230,000 230,000 230,000 137,000 154,000 16,000 307,000 307,000 307,000
REVENUES
Town Assessment 301,000 480,000 541,000 427,000 427,000 427,000 137,000 207,000 24,000 368,000 368,000 368,000
Interest Earnings 9,995 2,663 549 0 0 0 0 0 0 0 0 0
Other 0 0 0 0 0 0 0 0 0 0 0 0
-------------- -------------- -------------- -------------- -------------- -------------- -------------- -------------- -------------- -------------- -------------- --------------
TOTALS 310,995 482,663 541,549 427,000 427,000 427,000 137,000 207,000 24,000 368,000 368,000 368,000
EXPENDITURES
Paid Losses During Fiscal Year 121,590 254,504 276,694 135,000 135,000 125,000 50,000 75,000 0 125,000 125,000 125,000
Risk Management Services 30,140 28,924 27,328 29,000 29,000 29,000 13,000 13,000 3,000 29,000 29,000 29,000
Claims Management/Adjusting 24,254 29,502 30,841 32,000 32,000 32,000 17,000 15,000 0 32,000 32,000 32,000
Actuarial Study 4,000 0 4,000 0 0 0 2,000 2,000 0 4,000 4,000 4,000
Safety & Prevention Programs 1,928 3,255 3,090 5,000 5,000 5,000 2,000 2,000 1,000 5,000 5,000 5,000
Work Group Consultations 175 0 0 2,000 2,000 0 0 0 0 0 0 0
Employee Ass't Program 3,090 3,090 3,090 3,000 3,000 3,000 3,000 0 0 3,000 3,000 3,000
Insurance Premium 178,833 159,087 156,230 220,000 220,000 156,000 50,000 100,000 20,000 170,000 170,000 170,000
Other 701 527 270 1,000 1,000 0 0 0 0 0 0 0
Litigation Settlements 0 0 0 0 0 0 0 0 0 0 0 0
Construction Claims 39,668 0 0 0 0 0 0 0 0 0 0 0
Damage To Property 4,818 0 39,903 0 0 0 0 0 0 0 0 0
-------------- -------------- -------------- -------------- -------------- -------------- -------------- -------------- -------------- -------------- -------------- --------------
TOTALS 409,197 478,889 541,446 427,000 427,000 350,000 137,000 207,000 24,000 368,000 368,000 368,000
ENDING BALANCES
Reserved for Claims 826,000 912,000 723,000 778,000 778,000 778,000 308,000 470,000 0 778,000 778,000 778,000
Undesignated Reserve (599,596) (681,822) (492,719) (548,000) (548,000) (471,000) (171,000) (316,000) 16,000 (471,000) (471,000) (471,000)
-------------- -------------- -------------- -------------- -------------- -------------- -------------- -------------- -------------- -------------- -------------- --------------
TOTALS 226,404 230,178 230,281 230,000 230,000 307,000 137,000 154,000 16,000 307,000 307,000 307,000
INTERFUND TRANSFERS 0 0 0
INDIVIDUAL FUND BALANCES
Fund 1 - Workers' Compensation 90,607 91,220 91,186 91,000 91,000 137,000 137,000 0 0 137,000 137,000 137,000
Fund 2 - General & Auto Liability 122,283 123,259 123,303 123,000 123,000 154,000 0 154,000 0 154,000 154,000 154,000
Fund 3 - Property & Vehicles 13,514 15,699 15,792 16,000 16,000 16,000 0 0 16,000 16,000 16,000 16,000
-------------- -------------- -------------- -------------- -------------- -------------- -------------- -------------- -------------- -------------- -------------- --------------
TOTALS 226,404 230,178 230,281 230,000 230,000 307,000 137,000 154,000 16,000 307,000 307,000 307,000
2011-12Budget\Gengovt.xls GG16
(Reviewed by Council 06/29/11)
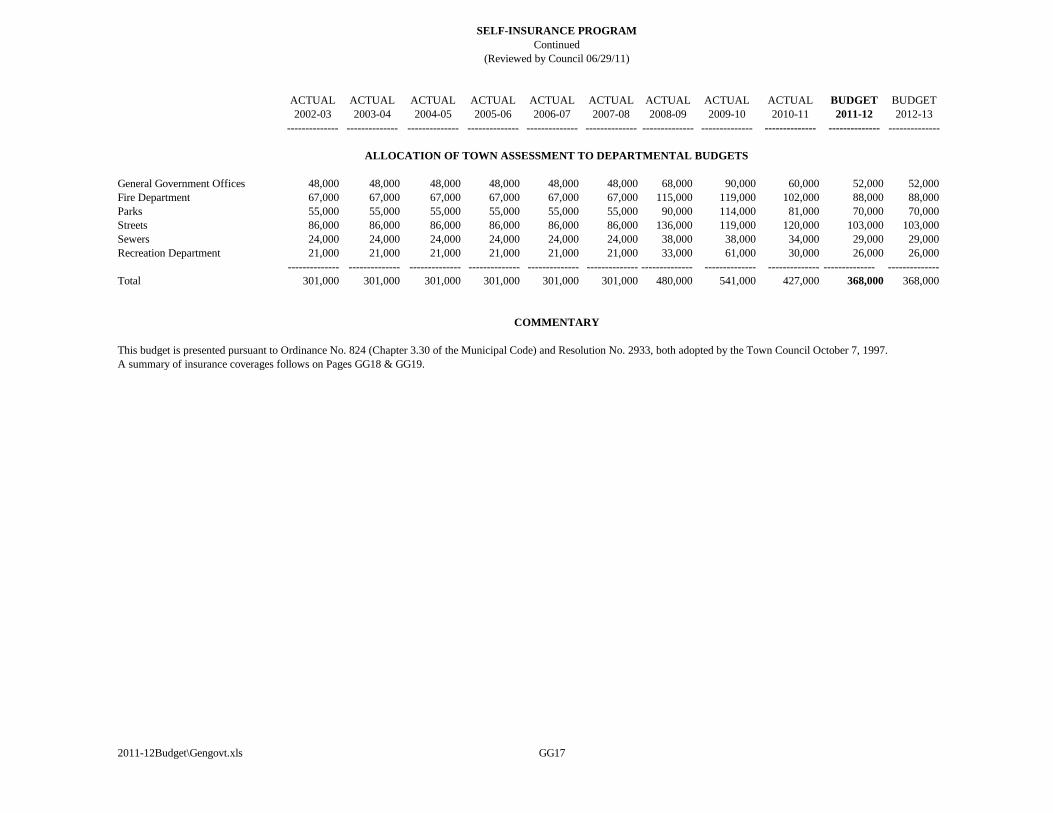
ACTUAL ACTUAL ACTUAL ACTUAL ACTUAL ACTUAL ACTUAL ACTUAL ACTUAL BUDGET BUDGET
2002-03 2003-04 2004-05 2005-06 2006-07 2007-08 2008-09 2009-10 2010-11 2011-12 2012-13
-------------- -------------- -------------- -------------- -------------- -------------- -------------- -------------- -------------- -------------- --------------
General Government Offices 48,000 48,000 48,000 48,000 48,000 48,000 68,000 90,000 60,000 52,000 52,000
Fire Department 67,000 67,000 67,000 67,000 67,000 67,000 115,000 119,000 102,000 88,000 88,000
Parks 55,000 55,000 55,000 55,000 55,000 55,000 90,000 114,000 81,000 70,000 70,000
Streets 86,000 86,000 86,000 86,000 86,000 86,000 136,000 119,000 120,000 103,000 103,000
Sewers 24,000 24,000 24,000 24,000 24,000 24,000 38,000 38,000 34,000 29,000 29,000
Recreation Department 21,000 21,000 21,000 21,000 21,000 21,000 33,000 61,000 30,000 26,000 26,000
-------------- -------------- -------------- -------------- -------------- -------------- -------------- -------------- -------------- -------------- --------------
Total 301,000 301,000 301,000 301,000 301,000 301,000 480,000 541,000 427,000 368,000 368,000
This budget is presented pursuant to Ordinance No. 824 (Chapter 3.30 of the Municipal Code) and Resolution No. 2933, both adopted by the Town Council October 7, 1997.
A summary of insurance coverages follows on Pages GG18 & GG19.
2011-12Budget\Gengovt.xls GG17
COMMENTARY
(Reviewed by Council 06/29/11)
SELF-INSURANCE PROGRAM
Continued
ALLOCATION OF TOWN ASSESSMENT TO DEPARTMENTAL BUDGETS
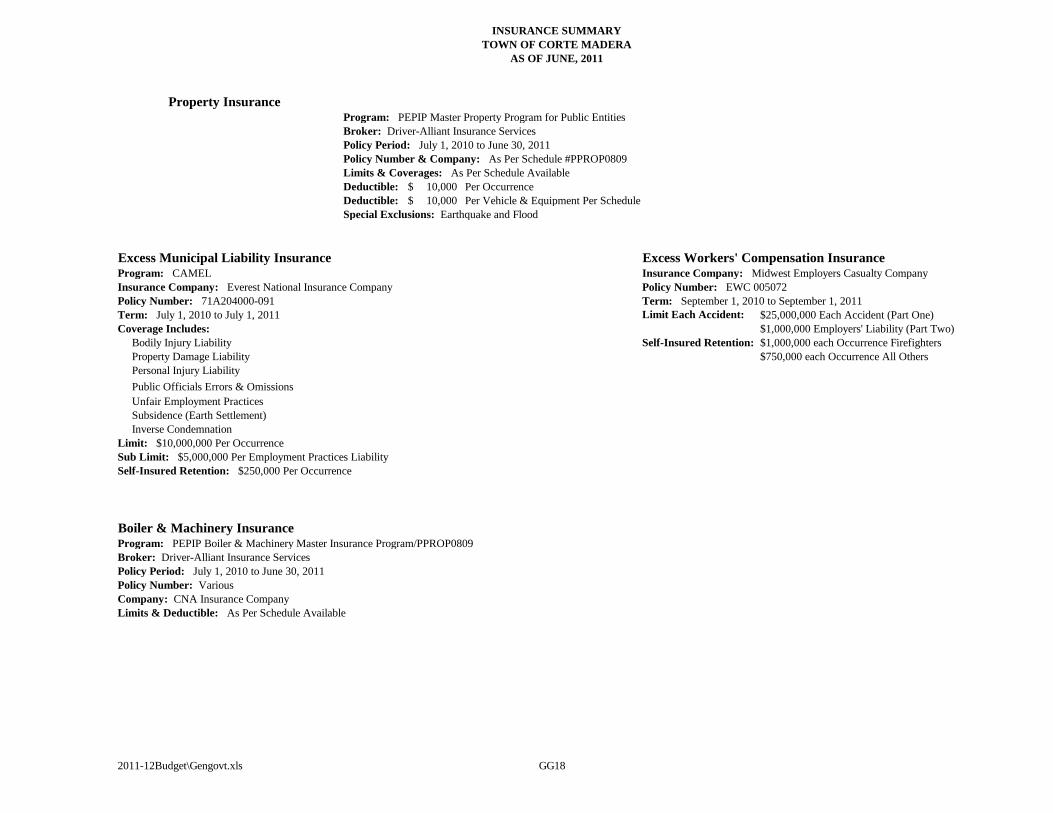
INSURANCE SUMMARY
TOWN OF CORTE MADERA
AS OF JUNE, 2011
Property InsuranceProgram: PEPIP Master Property Program for Public Entities
Broker: Driver-Alliant Insurance Services
Policy Period: July 1, 2010 to June 30, 2011
Policy Number & Company: As Per Schedule #PPROP0809
Limits & Coverages: As Per Schedule Available
Deductible: 10,000$ Per Occurrence
Deductible: 10,000$ Per Vehicle & Equipment Per Schedule
Special Exclusions: Earthquake and Flood
Excess Municipal Liability Insurance Excess Workers' Compensation InsuranceProgram: CAMEL Insurance Company: Midwest Employers Casualty Company
Insurance Company: Everest National Insurance Company Policy Number: EWC 005072
Policy Number: 71A204000-091 Term: September 1, 2010 to September 1, 2011
Term: July 1, 2010 to July 1, 2011 Limit Each Accident: $25,000,000 Each Accident (Part One)
Coverage Includes: $1,000,000 Employers' Liability (Part Two)
Bodily Injury Liability Self-Insured Retention: $1,000,000 each Occurrence Firefighters
Property Damage Liability $750,000 each Occurrence All Others
Personal Injury Liability
Public Officials Errors & Omissions
Unfair Employment Practices
Subsidence (Earth Settlement)
Inverse Condemnation
Limit: $10,000,000 Per Occurrence
Sub Limit: $5,000,000 Per Employment Practices Liability
Self-Insured Retention: $250,000 Per Occurrence
Boiler & Machinery InsuranceProgram: PEPIP Boiler & Machinery Master Insurance Program/PPROP0809
Broker: Driver-Alliant Insurance Services
Policy Period: July 1, 2010 to June 30, 2011
Policy Number: Various
Company: CNA Insurance Company
Limits & Deductible: As Per Schedule Available
2011-12Budget\Gengovt.xls GG18
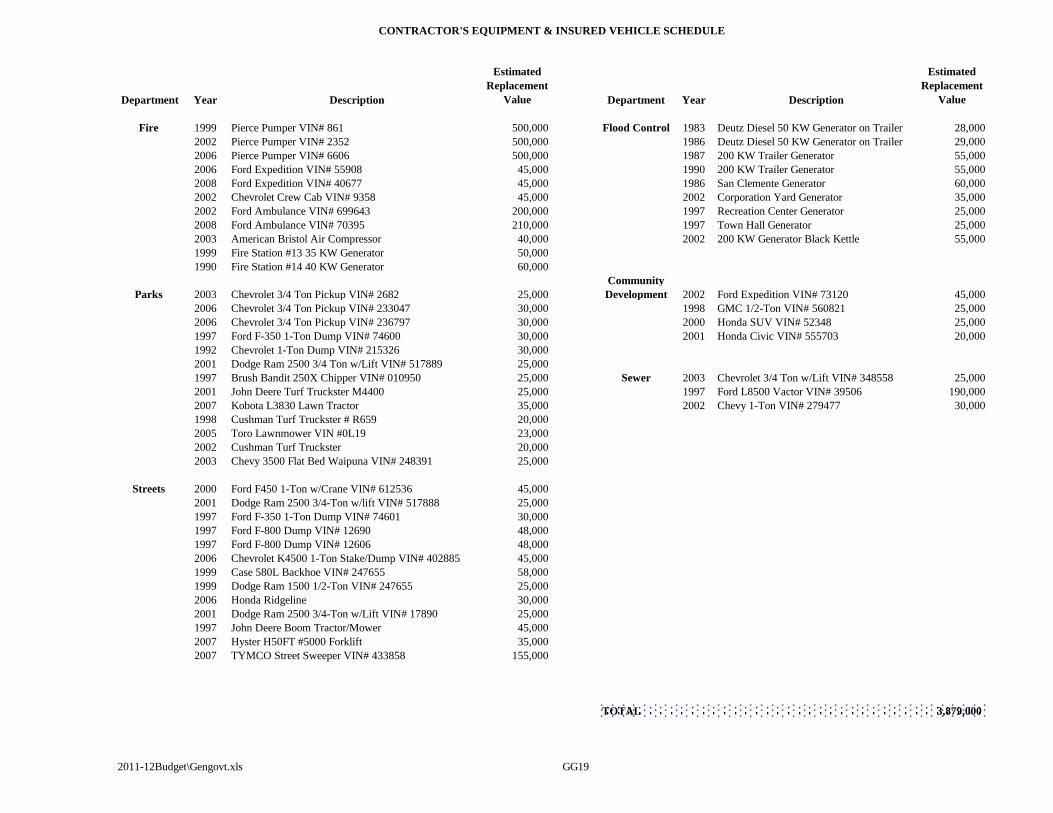
CONTRACTOR'S EQUIPMENT & INSURED VEHICLE SCHEDULE
Department Year Description
Estimated
Replacement
Value Department Year Description
Estimated
Replacement
Value
Fire 1999 Pierce Pumper VIN# 861 500,000 Flood Control 1983 Deutz Diesel 50 KW Generator on Trailer 28,000
2002 Pierce Pumper VIN# 2352 500,000 1986 Deutz Diesel 50 KW Generator on Trailer 29,000
2006 Pierce Pumper VIN# 6606 500,000 1987 200 KW Trailer Generator 55,000
2006 Ford Expedition VIN# 55908 45,000 1990 200 KW Trailer Generator 55,000
2008 Ford Expedition VIN# 40677 45,000 1986 San Clemente Generator 60,000
2002 Chevrolet Crew Cab VIN# 9358 45,000 2002 Corporation Yard Generator 35,000
2002 Ford Ambulance VIN# 699643 200,000 1997 Recreation Center Generator 25,000
2008 Ford Ambulance VIN# 70395 210,000 1997 Town Hall Generator 25,000
2003 American Bristol Air Compressor 40,000 2002 200 KW Generator Black Kettle 55,000
1999 Fire Station #13 35 KW Generator 50,000
1990 Fire Station #14 40 KW Generator 60,000
Community
Parks 2003 Chevrolet 3/4 Ton Pickup VIN# 2682 25,000 Development 2002 Ford Expedition VIN# 73120 45,000
2006 Chevrolet 3/4 Ton Pickup VIN# 233047 30,000 1998 GMC 1/2-Ton VIN# 560821 25,000
2006 Chevrolet 3/4 Ton Pickup VIN# 236797 30,000 2000 Honda SUV VIN# 52348 25,000
1997 Ford F-350 1-Ton Dump VIN# 74600 30,000 2001 Honda Civic VIN# 555703 20,000
1992 Chevrolet 1-Ton Dump VIN# 215326 30,000
2001 Dodge Ram 2500 3/4 Ton w/Lift VIN# 517889 25,000
1997 Brush Bandit 250X Chipper VIN# 010950 25,000 Sewer 2003 Chevrolet 3/4 Ton w/Lift VIN# 348558 25,000
2001 John Deere Turf Truckster M4400 25,000 1997 Ford L8500 Vactor VIN# 39506 190,000
2007 Kobota L3830 Lawn Tractor 35,000 2002 Chevy 1-Ton VIN# 279477 30,000
1998 Cushman Turf Truckster # R659 20,000
2005 Toro Lawnmower VIN #0L19 23,000
2002 Cushman Turf Truckster 20,000
2003 Chevy 3500 Flat Bed Waipuna VIN# 248391 25,000
Streets 2000 Ford F450 1-Ton w/Crane VIN# 612536 45,000
2001 Dodge Ram 2500 3/4-Ton w/lift VIN# 517888 25,000
1997 Ford F-350 1-Ton Dump VIN# 74601 30,000
1997 Ford F-800 Dump VIN# 12690 48,000
1997 Ford F-800 Dump VIN# 12606 48,000
2006 Chevrolet K4500 1-Ton Stake/Dump VIN# 402885 45,000
1999 Case 580L Backhoe VIN# 247655 58,000
1999 Dodge Ram 1500 1/2-Ton VIN# 247655 25,000
2006 Honda Ridgeline 30,000
2001 Dodge Ram 2500 3/4-Ton w/Lift VIN# 17890 25,000
1997 John Deere Boom Tractor/Mower 45,000
2007 Hyster H50FT #5000 Forklift 35,000
2007 TYMCO Street Sweeper VIN# 433858 155,000
TOTAL 3,879,000
2011-12Budget\Gengovt.xls GG19

BLANK PAGE
2011-12Budget\Gengovt.xls GG20
BLANK PAGE
2011-12Budget\Planning-Building.xls PB1

BLANK PAGE
2011-12Budget\Planning-Building.xls PB2
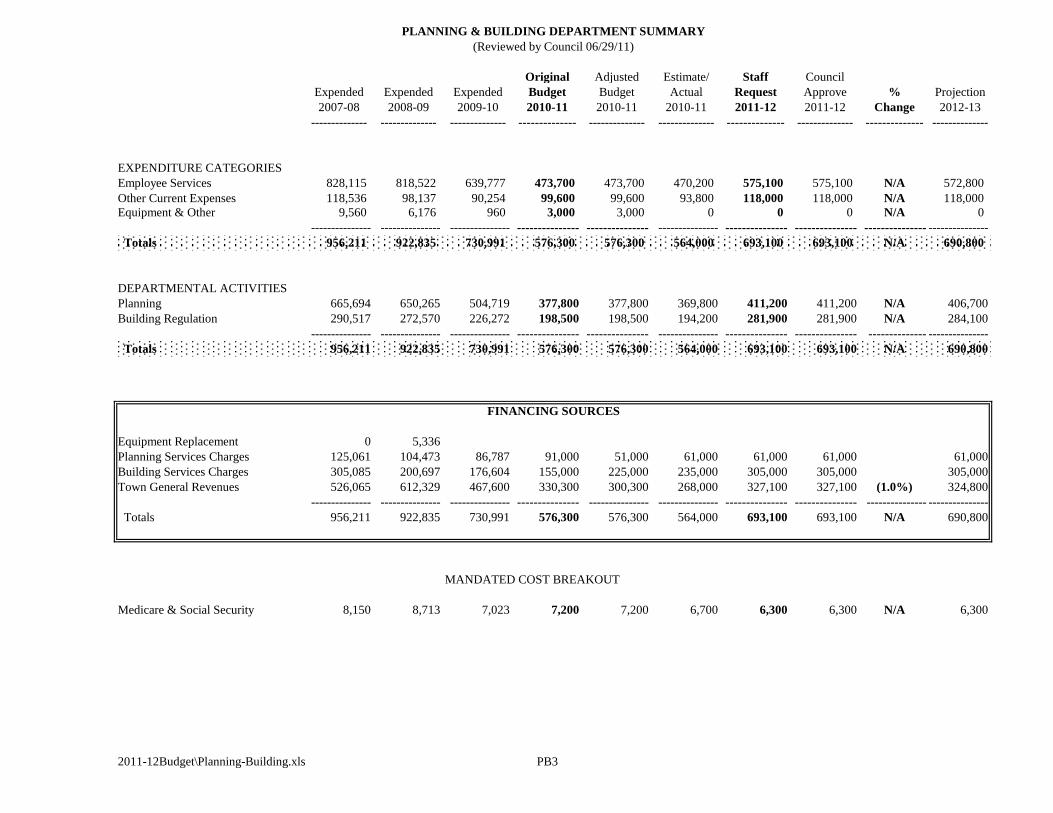
Original Adjusted Estimate/ Staff Council
Expended Expended Expended Budget Budget Actual Request Approve % Projection
2007-08 2008-09 2009-10 2010-11 2010-11 2010-11 2011-12 2011-12 Change 2012-13
-------------- -------------- -------------- -------------- -------------- -------------- -------------- -------------- -------------- --------------
EXPENDITURE CATEGORIES
Employee Services 828,115 818,522 639,777 473,700 473,700 470,200 575,100 575,100 N/A 572,800
Other Current Expenses 118,536 98,137 90,254 99,600 99,600 93,800 118,000 118,000 N/A 118,000
Equipment & Other 9,560 6,176 960 3,000 3,000 0 0 0 N/A 0
--------------- --------------- --------------- --------------- --------------- --------------- --------------- --------------- --------------- ---------------
Totals 956,211 922,835 730,991 576,300 576,300 564,000 693,100 693,100 N/A 690,800
DEPARTMENTAL ACTIVITIES
Planning 665,694 650,265 504,719 377,800 377,800 369,800 411,200 411,200 N/A 406,700
Building Regulation 290,517 272,570 226,272 198,500 198,500 194,200 281,900 281,900 N/A 284,100
--------------- --------------- --------------- --------------- --------------- --------------- --------------- --------------- -------------- ---------------
Totals 956,211 922,835 730,991 576,300 576,300 564,000 693,100 693,100 N/A 690,800
Equipment Replacement 0 5,336
Planning Services Charges 125,061 104,473 86,787 91,000 51,000 61,000 61,000 61,000 61,000
Building Services Charges 305,085 200,697 176,604 155,000 225,000 235,000 305,000 305,000 305,000
Town General Revenues 526,065 612,329 467,600 330,300 300,300 268,000 327,100 327,100 (1.0%) 324,800
--------------- --------------- --------------- --------------- --------------- --------------- --------------- --------------- --------------- ---------------
Totals 956,211 922,835 730,991 576,300 576,300 564,000 693,100 693,100 N/A 690,800
MANDATED COST BREAKOUT
Medicare & Social Security 8,150 8,713 7,023 7,200 7,200 6,700 6,300 6,300 N/A 6,300
2011-12Budget\Planning-Building.xls PB3
PLANNING & BUILDING DEPARTMENT SUMMARY
(Reviewed by Council 06/29/11)
FINANCING SOURCES
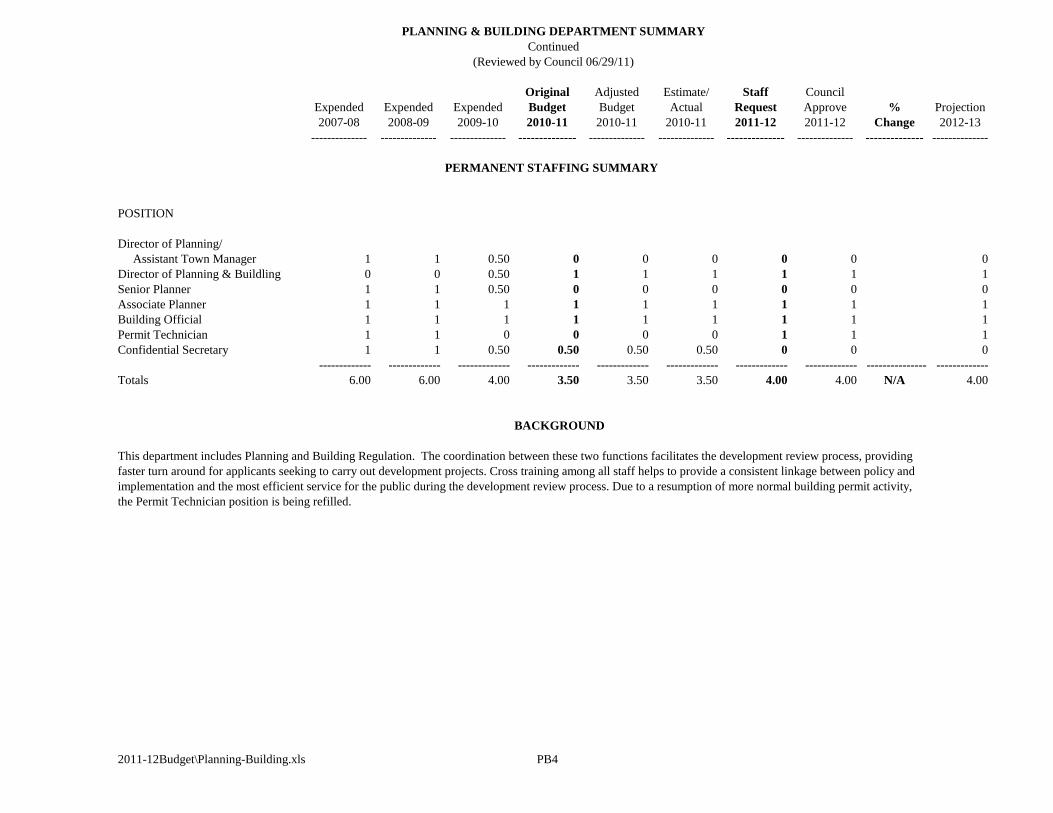
Original Adjusted Estimate/ Staff Council
Expended Expended Expended Budget Budget Actual Request Approve % Projection
2007-08 2008-09 2009-10 2010-11 2010-11 2010-11 2011-12 2011-12 Change 2012-13
-------------- -------------- -------------- -------------- -------------- -------------- -------------- -------------- -------------- --------------
PERMANENT STAFFING SUMMARY
POSITION
Director of Planning/
Assistant Town Manager 1 1 0.50 0 0 0 0 0 0
Director of Planning & Buildling 0 0 0.50 1 1 1 1 1 1
Senior Planner 1 1 0.50 0 0 0 0 0 0
Associate Planner 1 1 1 1 1 1 1 1 1
Building Official 1 1 1 1 1 1 1 1 1
Permit Technician 1 1 0 0 0 0 1 1 1
Confidential Secretary 1 1 0.50 0.50 0.50 0.50 0 0 0
------------- ------------- ------------- ------------- ------------- ------------- ------------- ------------- --------------- -------------
Totals 6.00 6.00 4.00 3.50 3.50 3.50 4.00 4.00 N/A 4.00
BACKGROUND
This department includes Planning and Building Regulation. The coordination between these two functions facilitates the development review process, providing
faster turn around for applicants seeking to carry out development projects. Cross training among all staff helps to provide a consistent linkage between policy and
implementation and the most efficient service for the public during the development review process. Due to a resumption of more normal building permit activity,
the Permit Technician position is being refilled.
2011-12Budget\Planning-Building.xls PB4
(Reviewed by Council 06/29/11)
Continued
PLANNING & BUILDING DEPARTMENT SUMMARY
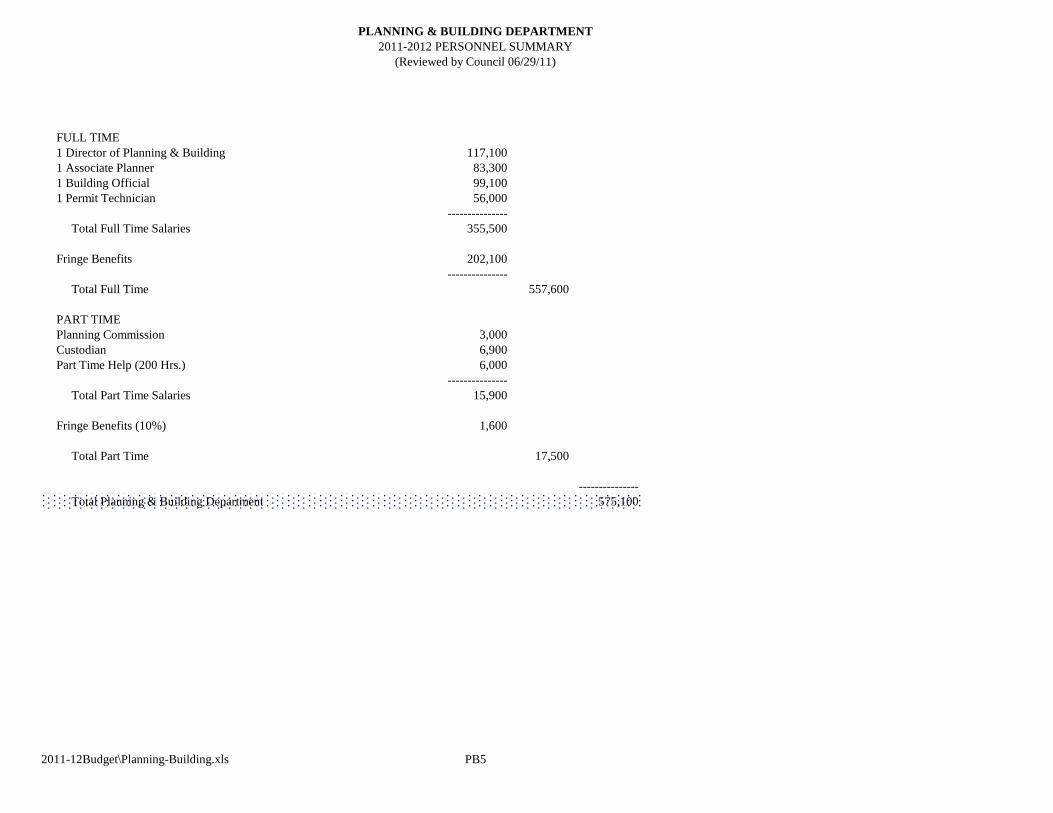
FULL TIME
1 Director of Planning & Building 117,100
1 Associate Planner 83,300
1 Building Official 99,100
1 Permit Technician 56,000
---------------
Total Full Time Salaries 355,500
Fringe Benefits 202,100
---------------
Total Full Time 557,600
PART TIME
Planning Commission 3,000
Custodian 6,900
Part Time Help (200 Hrs.) 6,000
---------------
Total Part Time Salaries 15,900
Fringe Benefits (10%) 1,600
Total Part Time 17,500
---------------
Total Planning & Building Department 575,100
2011-12Budget\Planning-Building.xls PB5
PLANNING & BUILDING DEPARTMENT
2011-2012 PERSONNEL SUMMARY
(Reviewed by Council 06/29/11)
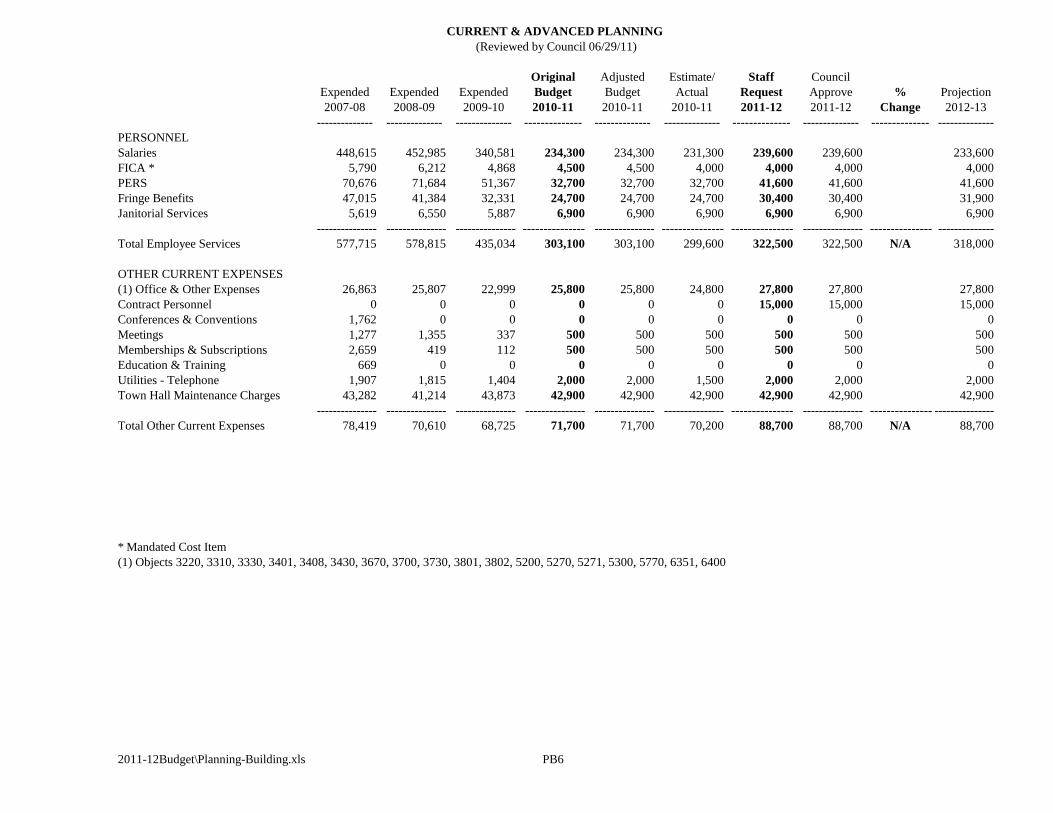
Original Adjusted Estimate/ Staff Council
Expended Expended Expended Budget Budget Actual Request Approve % Projection
2007-08 2008-09 2009-10 2010-11 2010-11 2010-11 2011-12 2011-12 Change 2012-13
-------------- -------------- -------------- -------------- -------------- -------------- -------------- -------------- -------------- --------------
PERSONNEL
Salaries 448,615 452,985 340,581 234,300 234,300 231,300 239,600 239,600 233,600
FICA * 5,790 6,212 4,868 4,500 4,500 4,000 4,000 4,000 4,000
PERS 70,676 71,684 51,367 32,700 32,700 32,700 41,600 41,600 41,600
Fringe Benefits 47,015 41,384 32,331 24,700 24,700 24,700 30,400 30,400 31,900
Janitorial Services 5,619 6,550 5,887 6,900 6,900 6,900 6,900 6,900 6,900
--------------- --------------- --------------- --------------- --------------- --------------- --------------- --------------- --------------- --------------
Total Employee Services 577,715 578,815 435,034 303,100 303,100 299,600 322,500 322,500 N/A 318,000
OTHER CURRENT EXPENSES
(1) Office & Other Expenses 26,863 25,807 22,999 25,800 25,800 24,800 27,800 27,800 27,800
Contract Personnel 0 0 0 0 0 0 15,000 15,000 15,000
Conferences & Conventions 1,762 0 0 0 0 0 0 0 0
Meetings 1,277 1,355 337 500 500 500 500 500 500
Memberships & Subscriptions 2,659 419 112 500 500 500 500 500 500
Education & Training 669 0 0 0 0 0 0 0 0
Utilities - Telephone 1,907 1,815 1,404 2,000 2,000 1,500 2,000 2,000 2,000
Town Hall Maintenance Charges 43,282 41,214 43,873 42,900 42,900 42,900 42,900 42,900 42,900
--------------- --------------- --------------- --------------- --------------- --------------- --------------- --------------- --------------- ---------------
Total Other Current Expenses 78,419 70,610 68,725 71,700 71,700 70,200 88,700 88,700 N/A 88,700
* Mandated Cost Item
(1) Objects 3220, 3310, 3330, 3401, 3408, 3430, 3670, 3700, 3730, 3801, 3802, 5200, 5270, 5271, 5300, 5770, 6351, 6400
2011-12Budget\Planning-Building.xls PB6
CURRENT & ADVANCED PLANNING
(Reviewed by Council 06/29/11)
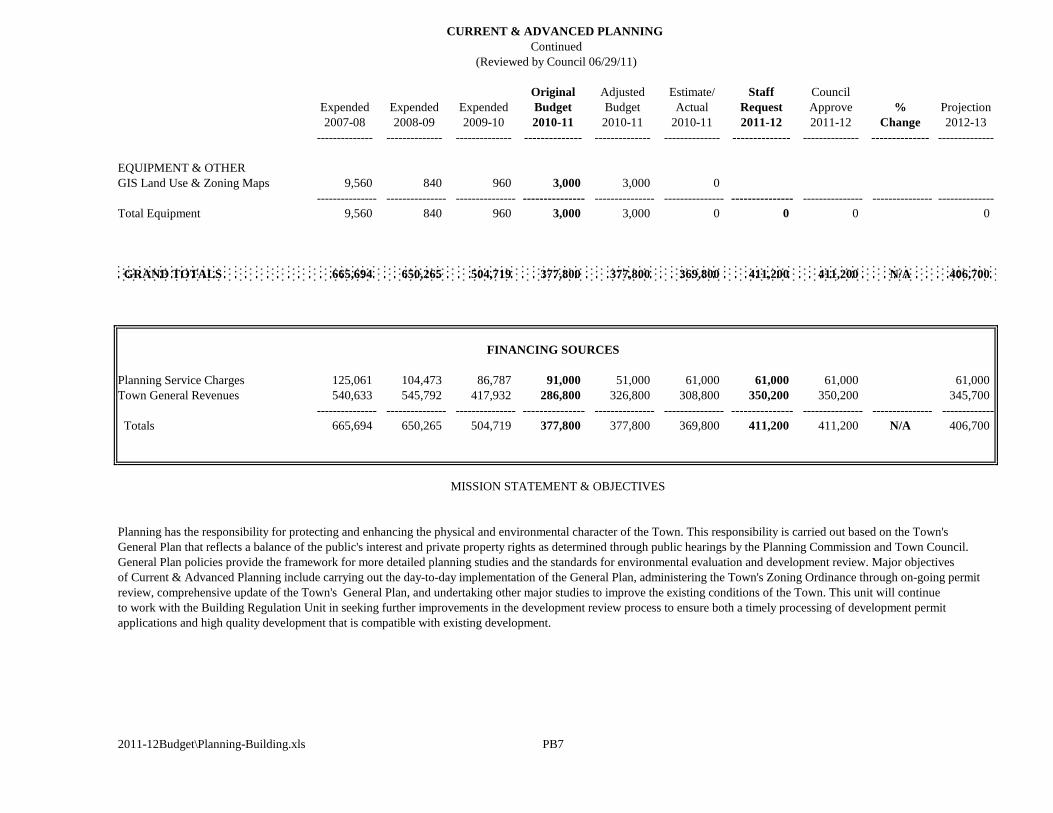
Original Adjusted Estimate/ Staff Council
Expended Expended Expended Budget Budget Actual Request Approve % Projection
2007-08 2008-09 2009-10 2010-11 2010-11 2010-11 2011-12 2011-12 Change 2012-13
-------------- -------------- -------------- -------------- -------------- -------------- -------------- -------------- -------------- --------------
EQUIPMENT & OTHER
GIS Land Use & Zoning Maps 9,560 840 960 3,000 3,000 0
--------------- --------------- --------------- --------------- --------------- --------------- --------------- --------------- --------------- --------------
Total Equipment 9,560 840 960 3,000 3,000 0 0 0 0
GRAND TOTALS 665,694 650,265 504,719 377,800 377,800 369,800 411,200 411,200 N/A 406,700
Planning Service Charges 125,061 104,473 86,787 91,000 51,000 61,000 61,000 61,000 61,000
Town General Revenues 540,633 545,792 417,932 286,800 326,800 308,800 350,200 350,200 345,700
--------------- --------------- --------------- --------------- --------------- --------------- --------------- --------------- --------------- -------------
Totals 665,694 650,265 504,719 377,800 377,800 369,800 411,200 411,200 N/A 406,700
MISSION STATEMENT & OBJECTIVES
Planning has the responsibility for protecting and enhancing the physical and environmental character of the Town. This responsibility is carried out based on the Town's
General Plan that reflects a balance of the public's interest and private property rights as determined through public hearings by the Planning Commission and Town Council.
General Plan policies provide the framework for more detailed planning studies and the standards for environmental evaluation and development review. Major objectives
of Current & Advanced Planning include carrying out the day-to-day implementation of the General Plan, administering the Town's Zoning Ordinance through on-going permit
review, comprehensive update of the Town's General Plan, and undertaking other major studies to improve the existing conditions of the Town. This unit will continue
to work with the Building Regulation Unit in seeking further improvements in the development review process to ensure both a timely processing of development permit
applications and high quality development that is compatible with existing development.
2011-12Budget\Planning-Building.xls PB7
FINANCING SOURCES
(Reviewed by Council 06/29/11)
CURRENT & ADVANCED PLANNING
Continued
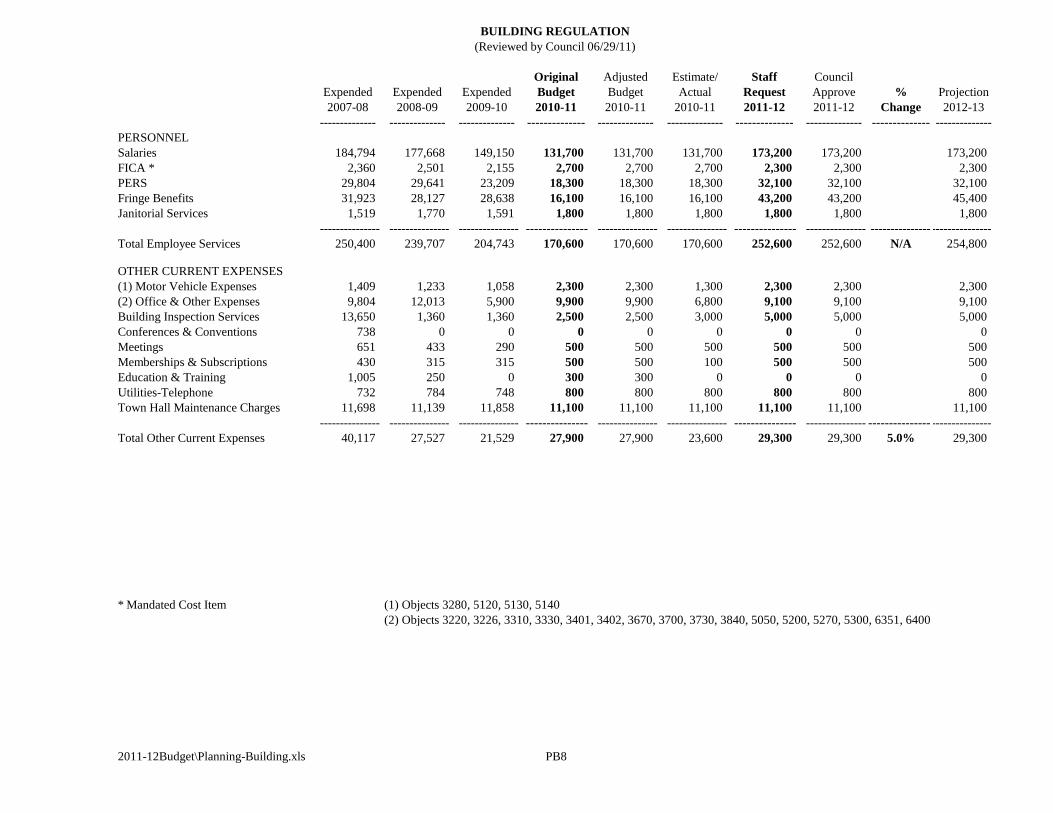
Original Adjusted Estimate/ Staff Council
Expended Expended Expended Budget Budget Actual Request Approve % Projection
2007-08 2008-09 2009-10 2010-11 2010-11 2010-11 2011-12 2011-12 Change 2012-13
-------------- -------------- -------------- -------------- -------------- -------------- -------------- -------------- -------------- --------------
PERSONNEL
Salaries 184,794 177,668 149,150 131,700 131,700 131,700 173,200 173,200 173,200
FICA * 2,360 2,501 2,155 2,700 2,700 2,700 2,300 2,300 2,300
PERS 29,804 29,641 23,209 18,300 18,300 18,300 32,100 32,100 32,100
Fringe Benefits 31,923 28,127 28,638 16,100 16,100 16,100 43,200 43,200 45,400
Janitorial Services 1,519 1,770 1,591 1,800 1,800 1,800 1,800 1,800 1,800
--------------- --------------- --------------- --------------- --------------- --------------- --------------- --------------- ------------------------------
Total Employee Services 250,400 239,707 204,743 170,600 170,600 170,600 252,600 252,600 N/A 254,800
OTHER CURRENT EXPENSES
(1) Motor Vehicle Expenses 1,409 1,233 1,058 2,300 2,300 1,300 2,300 2,300 2,300
(2) Office & Other Expenses 9,804 12,013 5,900 9,900 9,900 6,800 9,100 9,100 9,100
Building Inspection Services 13,650 1,360 1,360 2,500 2,500 3,000 5,000 5,000 5,000
Conferences & Conventions 738 0 0 0 0 0 0 0 0
Meetings 651 433 290 500 500 500 500 500 500
Memberships & Subscriptions 430 315 315 500 500 100 500 500 500
Education & Training 1,005 250 0 300 300 0 0 0 0
Utilities-Telephone 732 784 748 800 800 800 800 800 800
Town Hall Maintenance Charges 11,698 11,139 11,858 11,100 11,100 11,100 11,100 11,100 11,100
--------------- --------------- --------------- --------------- --------------- --------------- --------------- --------------- ------------------------------
Total Other Current Expenses 40,117 27,527 21,529 27,900 27,900 23,600 29,300 29,300 5.0% 29,300
* Mandated Cost Item (1) Objects 3280, 5120, 5130, 5140
(2) Objects 3220, 3226, 3310, 3330, 3401, 3402, 3670, 3700, 3730, 3840, 5050, 5200, 5270, 5300, 6351, 6400
2011-12Budget\Planning-Building.xls PB8
BUILDING REGULATION
(Reviewed by Council 06/29/11)
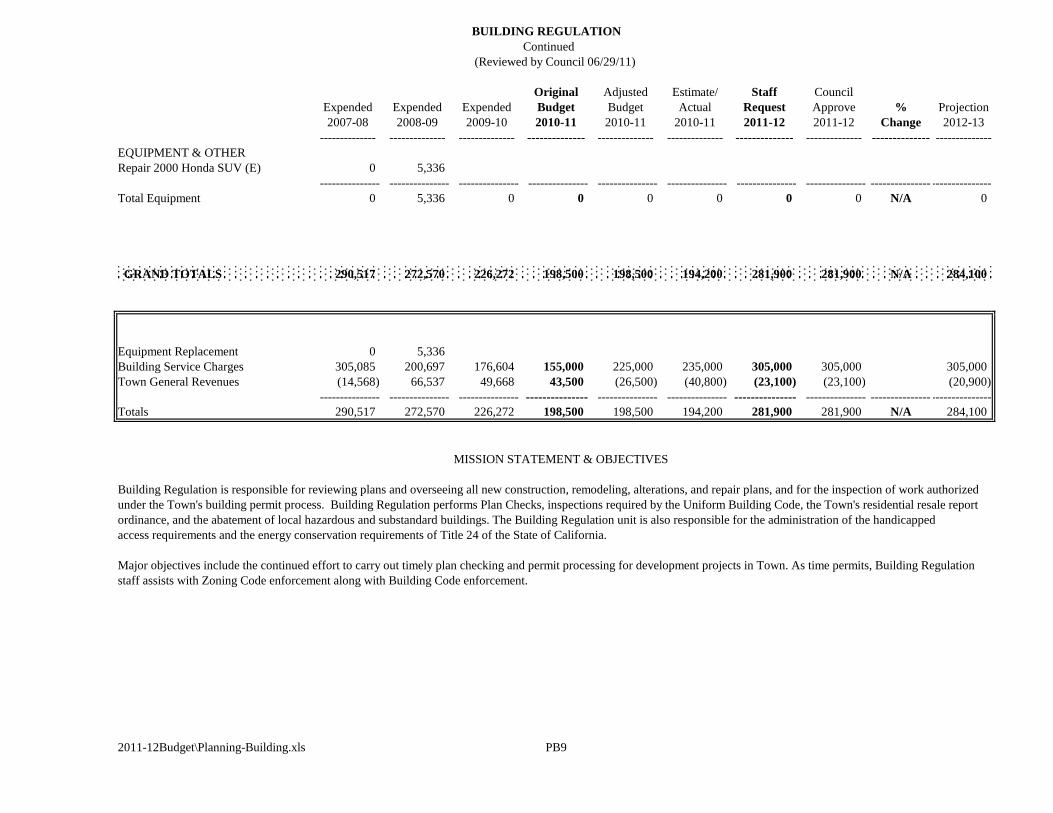
BUILDING REGULATION
Continued
Original Adjusted Estimate/ Staff Council
Expended Expended Expended Budget Budget Actual Request Approve % Projection
2007-08 2008-09 2009-10 2010-11 2010-11 2010-11 2011-12 2011-12 Change 2012-13
-------------- -------------- -------------- -------------- -------------- -------------- -------------- -------------- -------------- --------------
EQUIPMENT & OTHER
Repair 2000 Honda SUV (E) 0 5,336
--------------- --------------- --------------- --------------- --------------- --------------- --------------- --------------- ------------------------------
Total Equipment 0 5,336 0 0 0 0 0 0 N/A 0
GRAND TOTALS 290,517 272,570 226,272 198,500 198,500 194,200 281,900 281,900 N/A 284,100
Equipment Replacement 0 5,336
Building Service Charges 305,085 200,697 176,604 155,000 225,000 235,000 305,000 305,000 305,000
Town General Revenues (14,568) 66,537 49,668 43,500 (26,500) (40,800) (23,100) (23,100) (20,900)
--------------- --------------- --------------- --------------- --------------- --------------- --------------- --------------- ------------------------------
Totals 290,517 272,570 226,272 198,500 198,500 194,200 281,900 281,900 N/A 284,100
MISSION STATEMENT & OBJECTIVES
Building Regulation is responsible for reviewing plans and overseeing all new construction, remodeling, alterations, and repair plans, and for the inspection of work authorized
under the Town's building permit process. Building Regulation performs Plan Checks, inspections required by the Uniform Building Code, the Town's residential resale report
ordinance, and the abatement of local hazardous and substandard buildings. The Building Regulation unit is also responsible for the administration of the handicapped
access requirements and the energy conservation requirements of Title 24 of the State of California.
Major objectives include the continued effort to carry out timely plan checking and permit processing for development projects in Town. As time permits, Building Regulation
staff assists with Zoning Code enforcement along with Building Code enforcement.
2011-12Budget\Planning-Building.xls PB9
(Reviewed by Council 06/29/11)

BLANK PAGE
2011-12Budget\Planning-Building.xls PB10

BLANK PAGE
2011-12Budget\Police.xls P1

BLANK PAGE
2011-12Budget\Police.xls P2
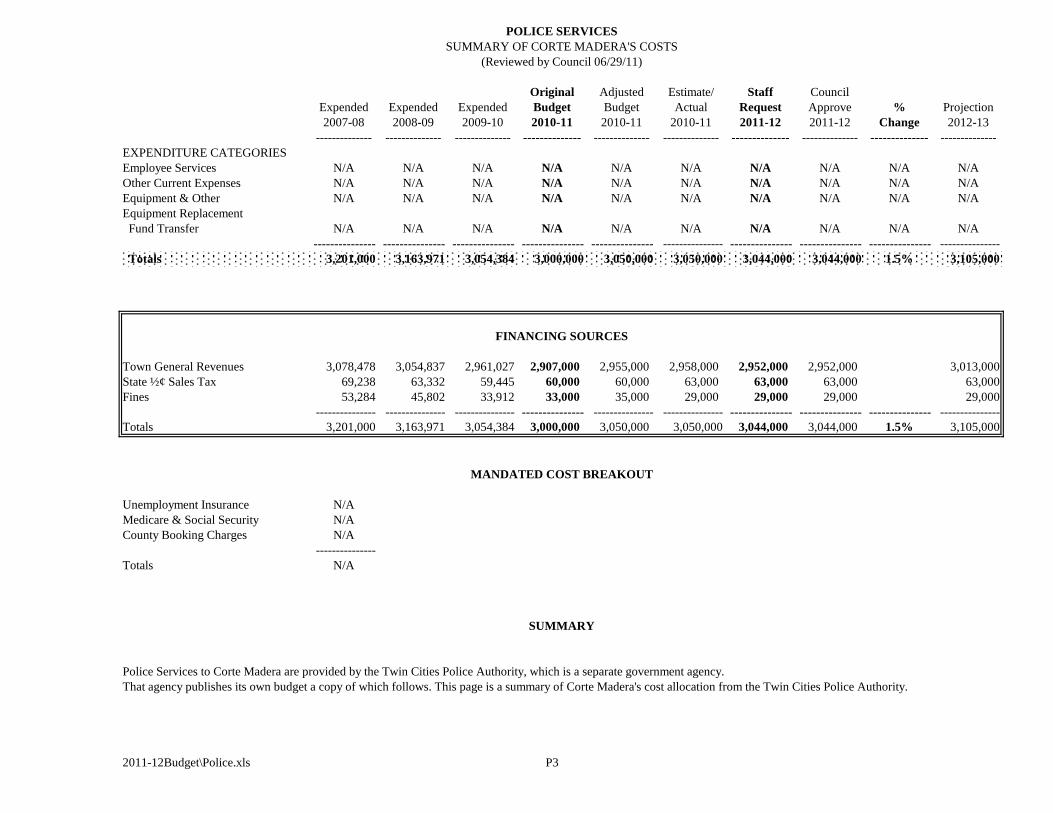
Original Adjusted Estimate/ Staff Council
Expended Expended Expended Budget Budget Actual Request Approve % Projection
2007-08 2008-09 2009-10 2010-11 2010-11 2010-11 2011-12 2011-12 Change 2012-13
-------------- -------------- -------------- -------------- -------------- -------------- -------------- -------------- -------------- --------------
EXPENDITURE CATEGORIES
Employee Services N/A N/A N/A N/A N/A N/A N/A N/A N/A N/A
Other Current Expenses N/A N/A N/A N/A N/A N/A N/A N/A N/A N/A
Equipment & Other N/A N/A N/A N/A N/A N/A N/A N/A N/A N/A
Equipment Replacement
Fund Transfer N/A N/A N/A N/A N/A N/A N/A N/A N/A N/A
--------------- --------------- --------------- --------------- --------------- --------------- --------------- --------------- --------------- ---------------
Totals 3,201,000 3,163,971 3,054,384 3,000,000 3,050,000 3,050,000 3,044,000 3,044,000 1.5% 3,105,000
Town General Revenues 3,078,478 3,054,837 2,961,027 2,907,000 2,955,000 2,958,000 2,952,000 2,952,000 3,013,000
State ½¢ Sales Tax 69,238 63,332 59,445 60,000 60,000 63,000 63,000 63,000 63,000
Fines 53,284 45,802 33,912 33,000 35,000 29,000 29,000 29,000 29,000
--------------- --------------- --------------- --------------- --------------- --------------- --------------- --------------- --------------- ---------------
Totals 3,201,000 3,163,971 3,054,384 3,000,000 3,050,000 3,050,000 3,044,000 3,044,000 1.5% 3,105,000
Unemployment Insurance N/A
Medicare & Social Security N/A
County Booking Charges N/A
---------------
Totals N/A
Police Services to Corte Madera are provided by the Twin Cities Police Authority, which is a separate government agency.
That agency publishes its own budget a copy of which follows. This page is a summary of Corte Madera's cost allocation from the Twin Cities Police Authority.
2011-12Budget\Police.xls P3
MANDATED COST BREAKOUT
SUMMARY
POLICE SERVICES
SUMMARY OF CORTE MADERA'S COSTS
(Reviewed by Council 06/29/11)
FINANCING SOURCES
P4
TWIN CITIES POLICE AUTHORITY
BUDGET FY 2011-2012
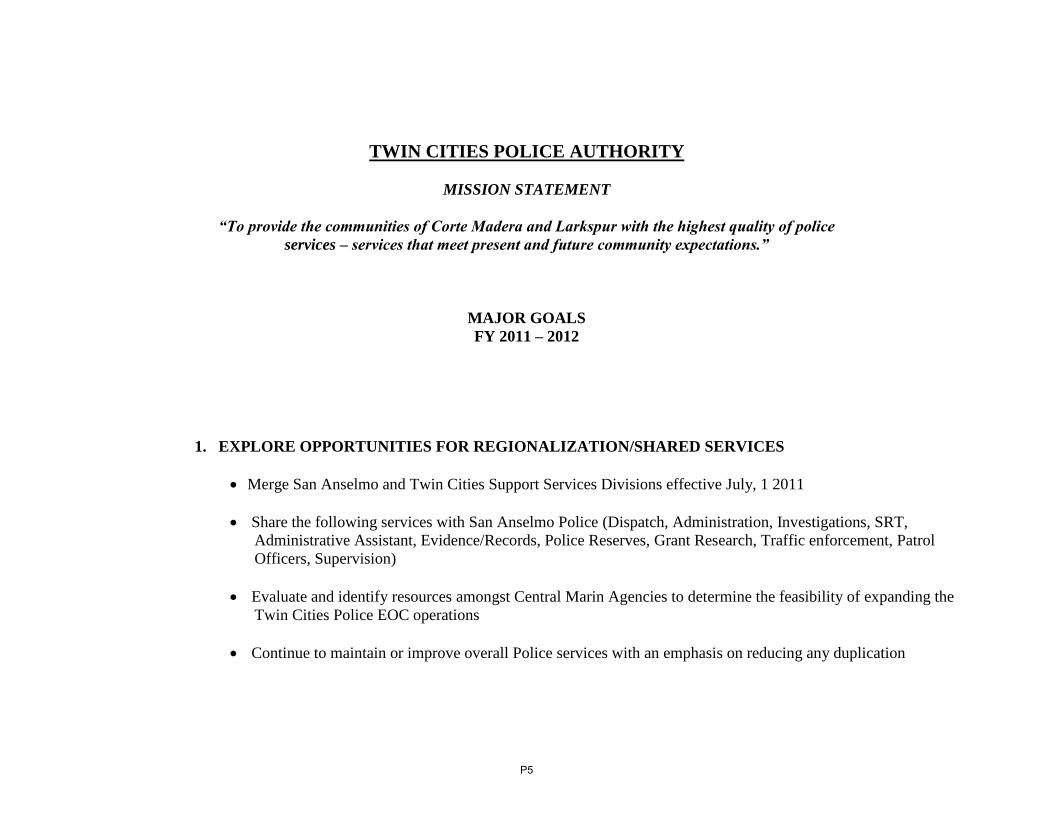
TWIN CITIES POLICE AUTHORITY
MISSION STATEMENT
“To provide the communities of Corte Madera and Larkspur with the highest quality of police
services – services that meet present and future community expectations.”
MAJOR GOALS
FY 2011 – 2012
1. EXPLORE OPPORTUNITIES FOR REGIONALIZATION/SHARED SERVICES
Merge San Anselmo and Twin Cities Support Services Divisions effective July, 1 2011
Share the following services with San Anselmo Police (Dispatch, Administration, Investigations, SRT,
Administrative Assistant, Evidence/Records, Police Reserves, Grant Research, Traffic enforcement, Patrol
Officers, Supervision)
Evaluate and identify resources amongst Central Marin Agencies to determine the feasibility of expanding the
Twin Cities Police EOC operations
Continue to maintain or improve overall Police services with an emphasis on reducing any duplication
P5
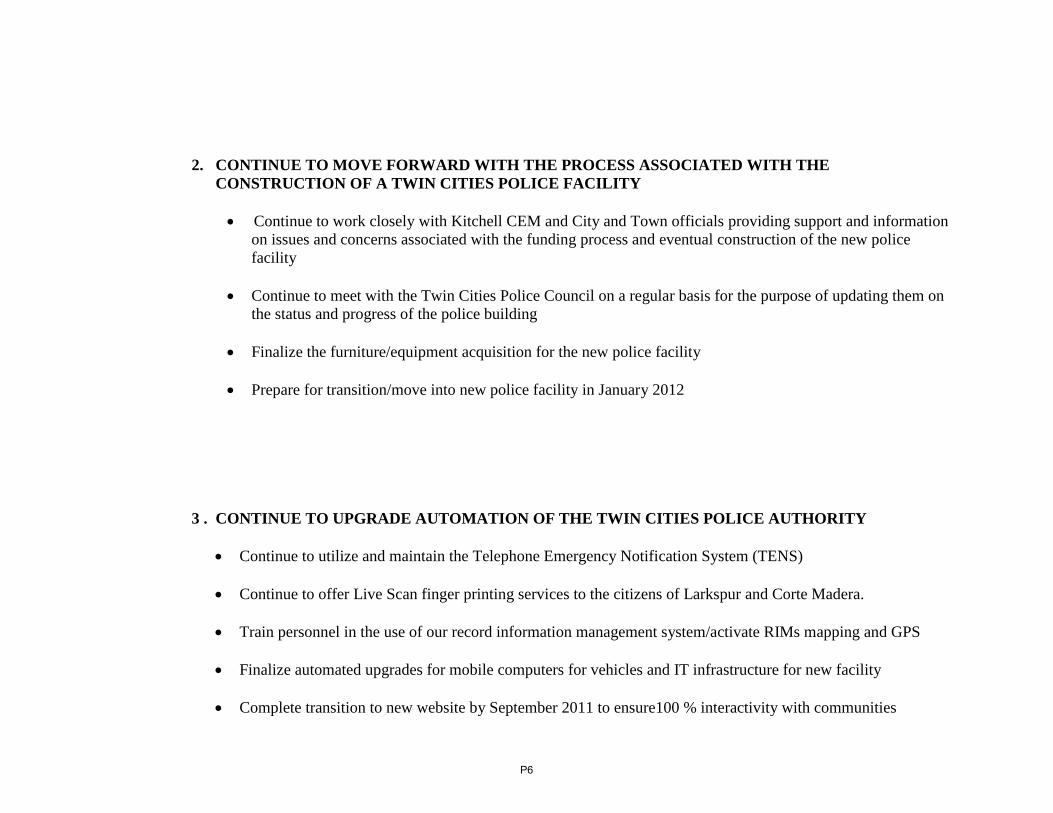
2. CONTINUE TO MOVE FORWARD WITH THE PROCESS ASSOCIATED WITH THE
CONSTRUCTION OF A TWIN CITIES POLICE FACILITY
Continue to work closely with Kitchell CEM and City and Town officials providing support and information
on issues and concerns associated with the funding process and eventual construction of the new police
facility
Continue to meet with the Twin Cities Police Council on a regular basis for the purpose of updating them on
the status and progress of the police building
Finalize the furniture/equipment acquisition for the new police facility
Prepare for transition/move into new police facility in January 2012
3 . CONTINUE TO UPGRADE AUTOMATION OF THE TWIN CITIES POLICE AUTHORITY
Continue to utilize and maintain the Telephone Emergency Notification System (TENS)
Continue to offer Live Scan finger printing services to the citizens of Larkspur and Corte Madera.
Train personnel in the use of our record information management system/activate RIMs mapping and GPS
Finalize automated upgrades for mobile computers for vehicles and IT infrastructure for new facility
Complete transition to new website by September 2011 to ensure100 % interactivity with communities
P6
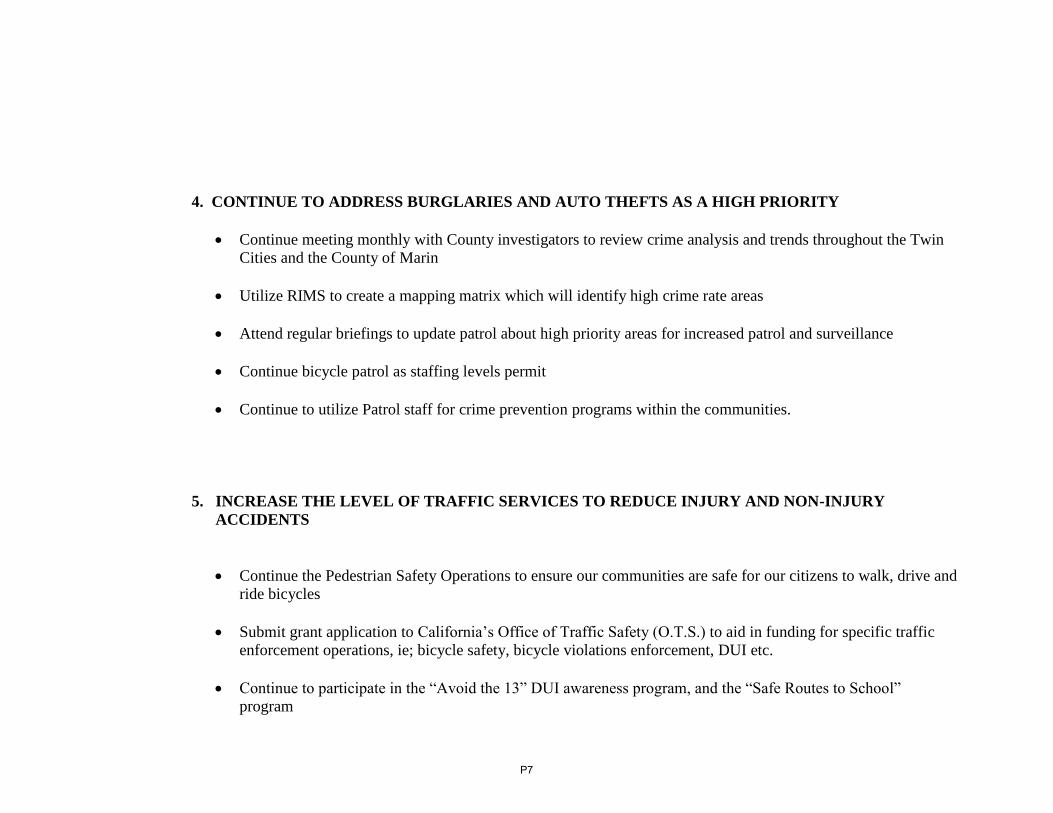
4. CONTINUE TO ADDRESS BURGLARIES AND AUTO THEFTS AS A HIGH PRIORITY
Continue meeting monthly with County investigators to review crime analysis and trends throughout the Twin
Cities and the County of Marin
Utilize RIMS to create a mapping matrix which will identify high crime rate areas
Attend regular briefings to update patrol about high priority areas for increased patrol and surveillance
Continue bicycle patrol as staffing levels permit
Continue to utilize Patrol staff for crime prevention programs within the communities.
5. INCREASE THE LEVEL OF TRAFFIC SERVICES TO REDUCE INJURY AND NON-INJURY
ACCIDENTS
Continue the Pedestrian Safety Operations to ensure our communities are safe for our citizens to walk, drive and
ride bicycles
Submit grant application to California’s Office of Traffic Safety (O.T.S.) to aid in funding for specific traffic
enforcement operations, ie; bicycle safety, bicycle violations enforcement, DUI etc.
Continue to participate in the “Avoid the 13” DUI awareness program, and the “Safe Routes to School”
program
P7
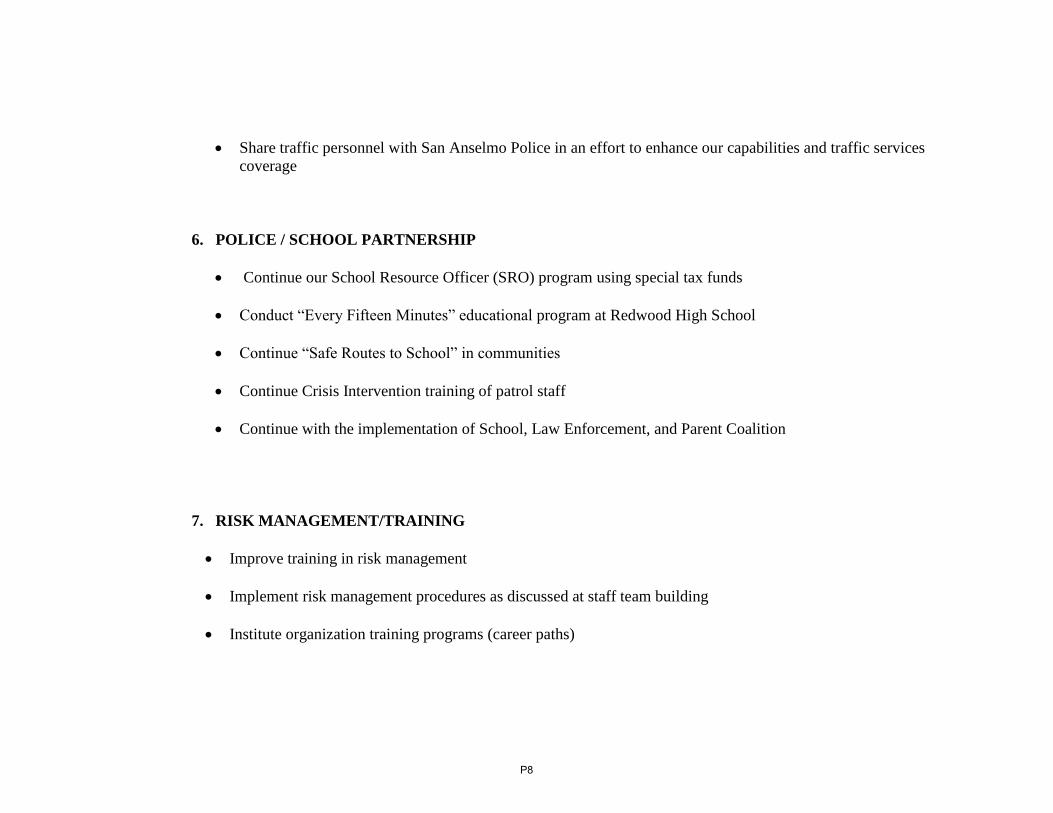
Share traffic personnel with San Anselmo Police in an effort to enhance our capabilities and traffic services
coverage
6. POLICE / SCHOOL PARTNERSHIP
Continue our School Resource Officer (SRO) program using special tax funds
Conduct “Every Fifteen Minutes” educational program at Redwood High School
Continue “Safe Routes to School” in communities
Continue Crisis Intervention training of patrol staff
Continue with the implementation of School, Law Enforcement, and Parent Coalition
7. RISK MANAGEMENT/TRAINING
Improve training in risk management
Implement risk management procedures as discussed at staff team building
Institute organization training programs (career paths)
P8
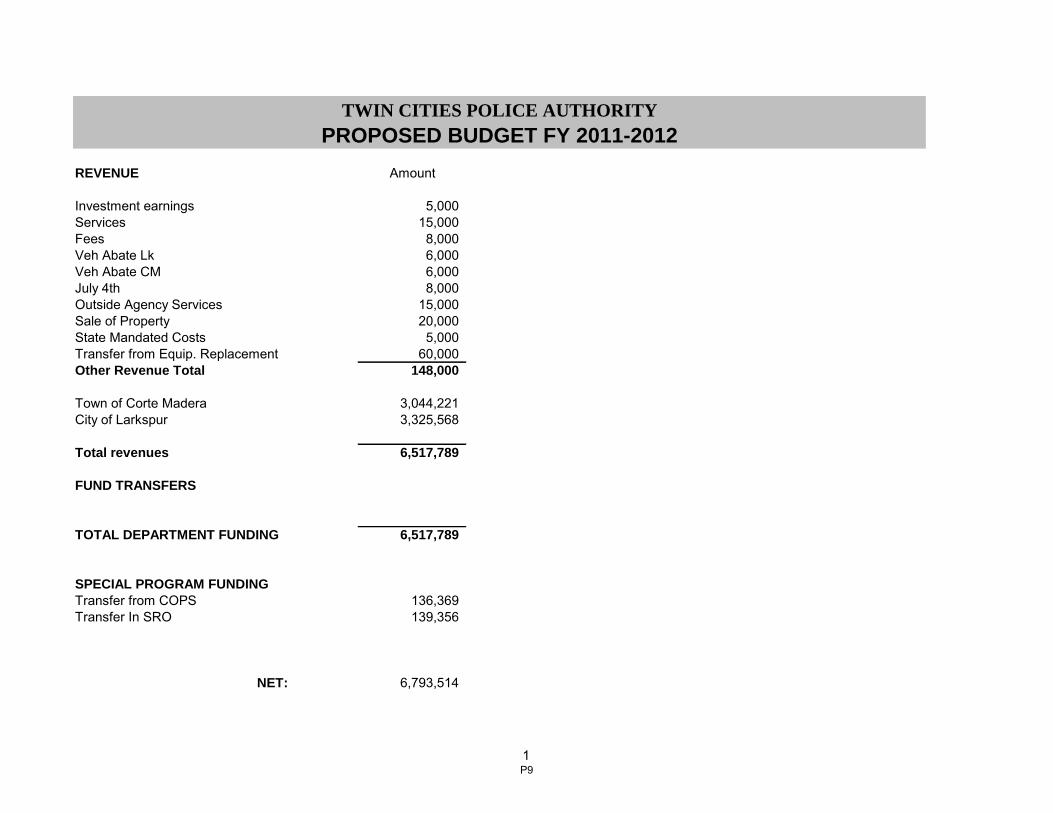
REVENUE Amount
Investment earnings 5,000
Services 15,000
Fees 8,000
Veh Abate Lk 6,000
Veh Abate CM 6,000
July 4th 8,000
Outside Agency Services 15,000
Sale of Property 20,000
State Mandated Costs 5,000
Transfer from Equip. Replacement 60,000
Other Revenue Total 148,000
Town of Corte Madera 3,044,221
City of Larkspur 3,325,568
Total revenues 6,517,789
FUND TRANSFERS
TOTAL DEPARTMENT FUNDING 6,517,789
SPECIAL PROGRAM FUNDING
Transfer from COPS 136,369
Transfer In SRO 139,356
NET: 6,793,514
TWIN CITIES POLICE AUTHORITY
PROPOSED BUDGET FY 2011-2012
1P9
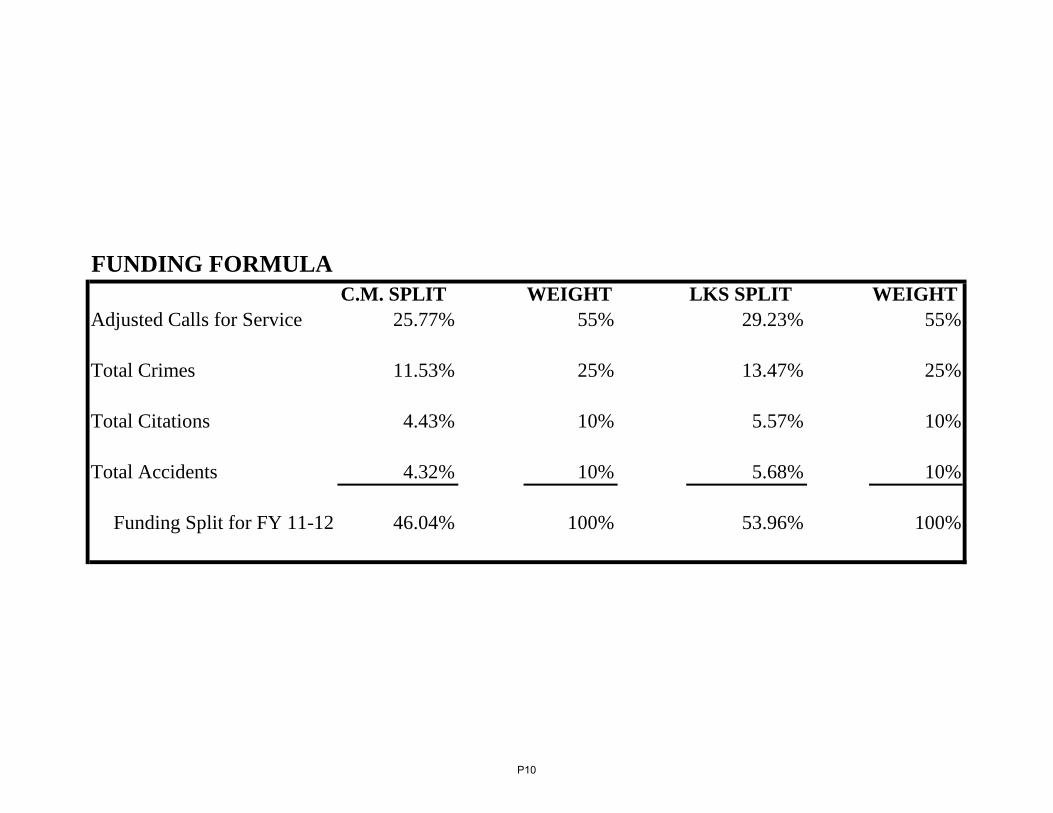
FUNDING FORMULA
C.M. SPLIT WEIGHT LKS SPLIT WEIGHT
Adjusted Calls for Service 25.77% 55% 29.23% 55%
Total Crimes 11.53% 25% 13.47% 25%
Total Citations 4.43% 10% 5.57% 10%
Total Accidents 4.32% 10% 5.68% 10%
Funding Split for FY 11-12 46.04% 100% 53.96% 100%
P10
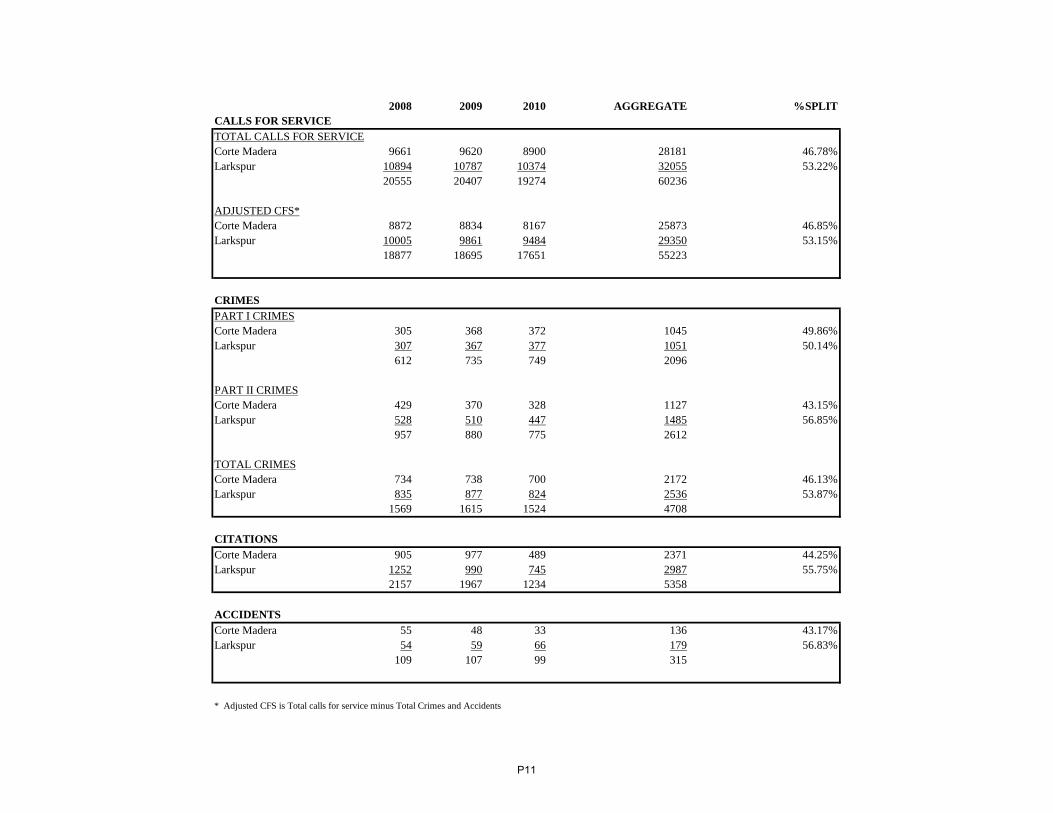
2008 2009 2010 AGGREGATE %SPLIT
CALLS FOR SERVICE
TOTAL CALLS FOR SERVICE
Corte Madera 9661 9620 8900 28181 46.78%
Larkspur 10894 10787 10374 32055 53.22%
20555 20407 19274 60236
ADJUSTED CFS*
Corte Madera 8872 8834 8167 25873 46.85%
Larkspur 10005 9861 9484 29350 53.15%
18877 18695 17651 55223
CRIMES
PART I CRIMES
Corte Madera 305 368 372 1045 49.86%
Larkspur 307 367 377 1051 50.14%
612 735 749 2096
PART II CRIMES
Corte Madera 429 370 328 1127 43.15%
Larkspur 528 510 447 1485 56.85%
957 880 775 2612
TOTAL CRIMES
Corte Madera 734 738 700 2172 46.13%
Larkspur 835 877 824 2536 53.87%
1569 1615 1524 4708
CITATIONS
Corte Madera 905 977 489 2371 44.25%
Larkspur 1252 990 745 2987 55.75%
2157 1967 1234 5358
ACCIDENTS
Corte Madera 55 48 33 136 43.17%
Larkspur 54 59 66 179 56.83%
109 107 99 315
* Adjusted CFS is Total calls for service minus Total Crimes and Accidents
P11
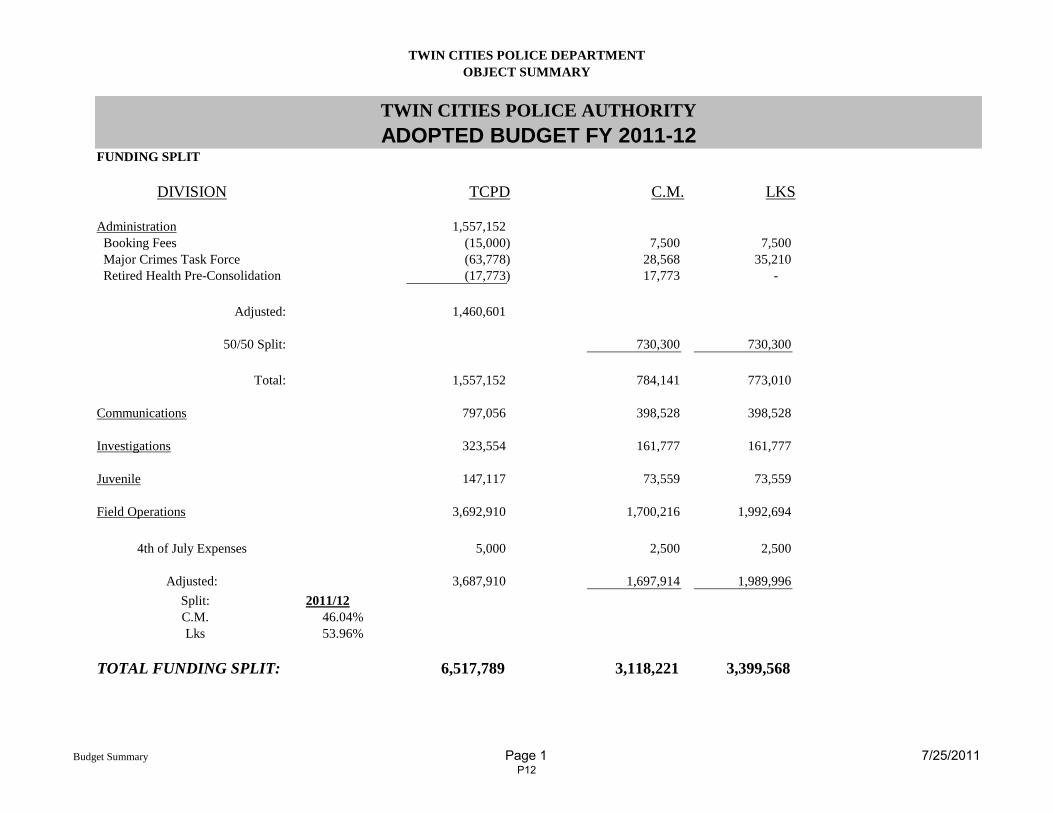
TWIN CITIES POLICE DEPARTMENT
OBJECT SUMMARY
FUNDING SPLIT
DIVISION TCPD C.M. LKS
Administration 1,557,152
Booking Fees (15,000) 7,500 7,500
Major Crimes Task Force (63,778) 28,568 35,210
Retired Health Pre-Consolidation (17,773) 17,773 -
Adjusted: 1,460,601
50/50 Split: 730,300 730,300
Total: 1,557,152 784,141 773,010
Communications 797,056 398,528 398,528
Investigations 323,554 161,777 161,777
Juvenile 147,117 73,559 73,559
Field Operations 3,692,910 1,700,216 1,992,694
4th of July Expenses 5,000 2,500 2,500
Adjusted: 3,687,910 1,697,914 1,989,996
Split: 2011/12
C.M. 46.04%
Lks 53.96%
TOTAL FUNDING SPLIT: 6,517,789 3,118,221 3,399,568
ADOPTED BUDGET FY 2011-12
TWIN CITIES POLICE AUTHORITY
Budget Summary Page 1 7/25/2011P12
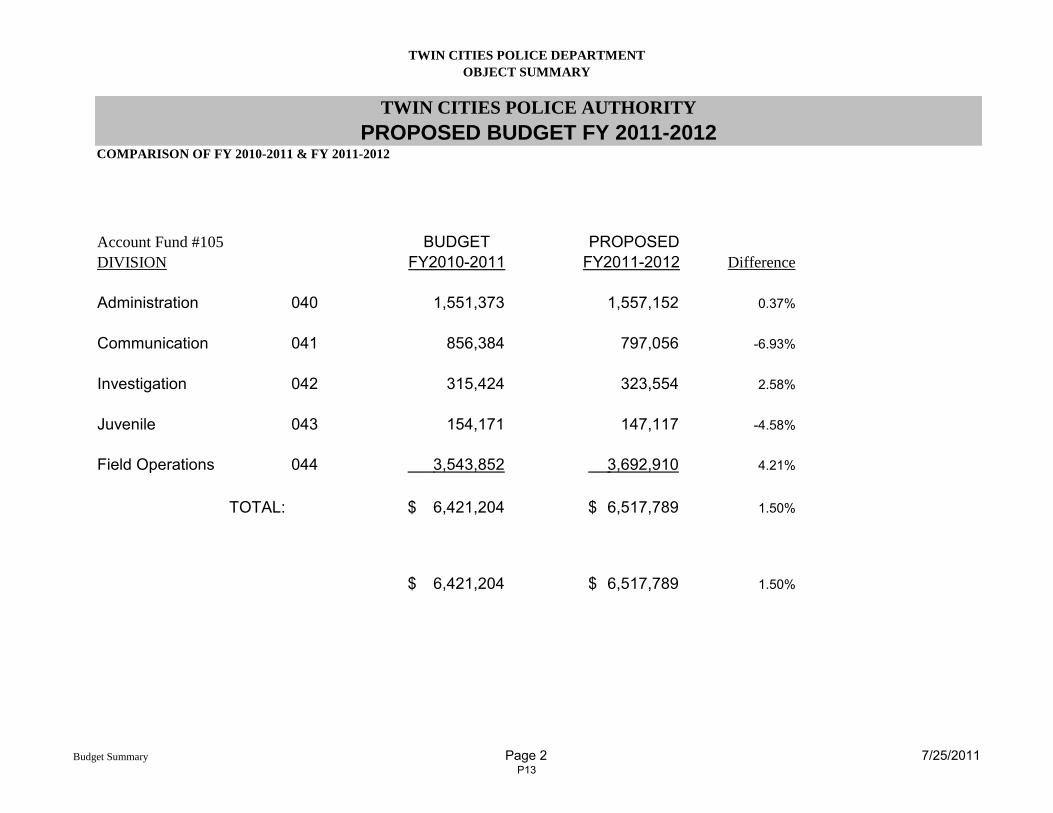
TWIN CITIES POLICE DEPARTMENT
OBJECT SUMMARY
COMPARISON OF FY 2010-2011 & FY 2011-2012
Account Fund #105 BUDGET PROPOSED
DIVISION FY2010-2011 FY2011-2012 Difference
Administration 040 1,551,373 1,557,152 0.37%
Communication 041 856,384 797,056 -6.93%
Investigation 042 315,424 323,554 2.58%
Juvenile 043 154,171 147,117 -4.58%
Field Operations 044 3,543,852 3,692,910 4.21%
TOTAL: 6,421,204$ 6,517,789$ 1.50%
6,421,204$ 6,517,789$ 1.50%
TWIN CITIES POLICE AUTHORITY
PROPOSED BUDGET FY 2011-2012
Budget Summary Page 2 7/25/2011P13
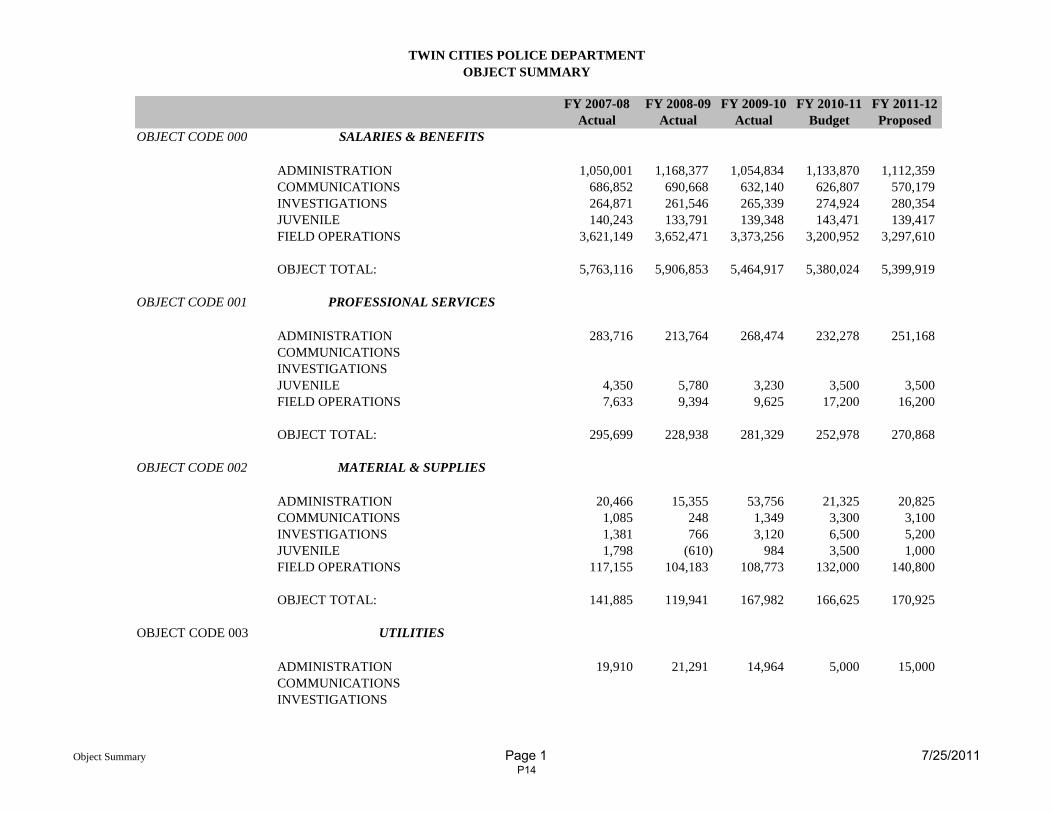
TWIN CITIES POLICE DEPARTMENT
OBJECT SUMMARY
FY 2007-08 FY 2008-09 FY 2009-10 FY 2010-11 FY 2011-12
Actual Actual Actual Budget Proposed
OBJECT CODE 000 SALARIES & BENEFITS
ADMINISTRATION 1,050,001 1,168,377 1,054,834 1,133,870 1,112,359
COMMUNICATIONS 686,852 690,668 632,140 626,807 570,179
INVESTIGATIONS 264,871 261,546 265,339 274,924 280,354
JUVENILE 140,243 133,791 139,348 143,471 139,417
FIELD OPERATIONS 3,621,149 3,652,471 3,373,256 3,200,952 3,297,610
OBJECT TOTAL: 5,763,116 5,906,853 5,464,917 5,380,024 5,399,919
OBJECT CODE 001 PROFESSIONAL SERVICES
ADMINISTRATION 283,716 213,764 268,474 232,278 251,168
COMMUNICATIONS
INVESTIGATIONS
JUVENILE 4,350 5,780 3,230 3,500 3,500
FIELD OPERATIONS 7,633 9,394 9,625 17,200 16,200
OBJECT TOTAL: 295,699 228,938 281,329 252,978 270,868
OBJECT CODE 002 MATERIAL & SUPPLIES
ADMINISTRATION 20,466 15,355 53,756 21,325 20,825
COMMUNICATIONS 1,085 248 1,349 3,300 3,100
INVESTIGATIONS 1,381 766 3,120 6,500 5,200
JUVENILE 1,798 (610) 984 3,500 1,000
FIELD OPERATIONS 117,155 104,183 108,773 132,000 140,800
OBJECT TOTAL: 141,885 119,941 167,982 166,625 170,925
OBJECT CODE 003 UTILITIES
ADMINISTRATION 19,910 21,291 14,964 5,000 15,000
COMMUNICATIONS
INVESTIGATIONS
Object Summary Page 1 7/25/2011P14
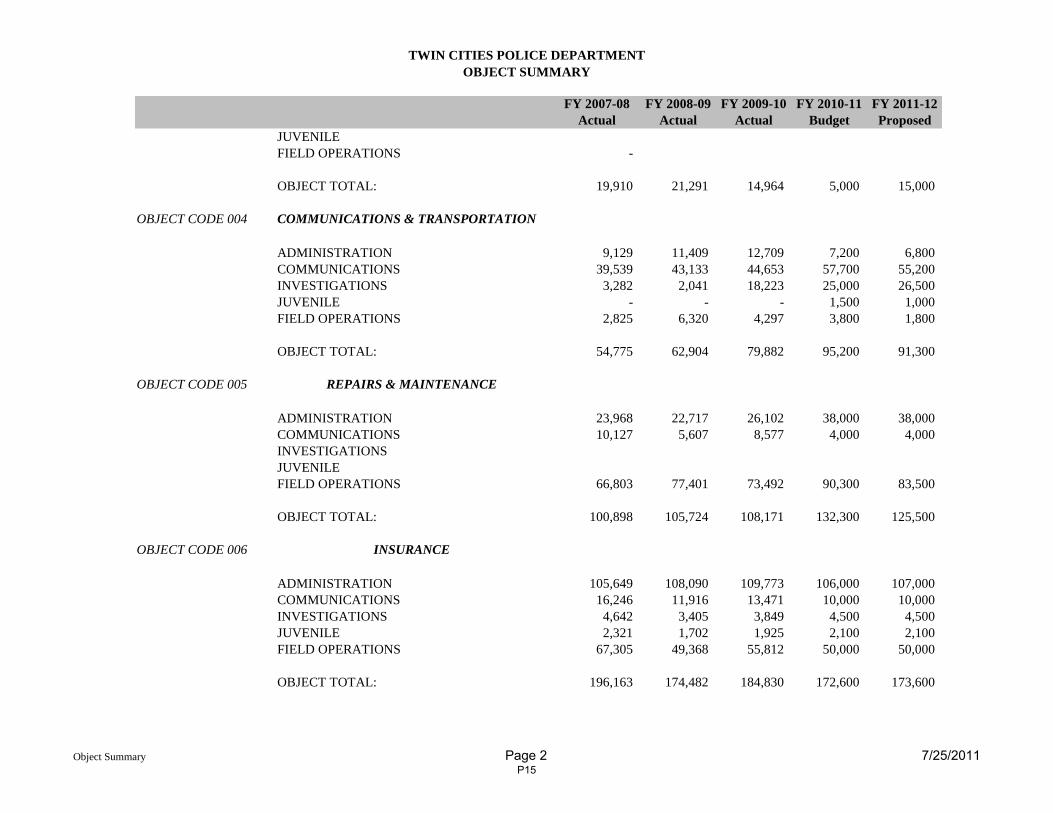
TWIN CITIES POLICE DEPARTMENT
OBJECT SUMMARY
FY 2007-08 FY 2008-09 FY 2009-10 FY 2010-11 FY 2011-12
Actual Actual Actual Budget Proposed
JUVENILE
FIELD OPERATIONS -
OBJECT TOTAL: 19,910 21,291 14,964 5,000 15,000
OBJECT CODE 004 COMMUNICATIONS & TRANSPORTATION
ADMINISTRATION 9,129 11,409 12,709 7,200 6,800
COMMUNICATIONS 39,539 43,133 44,653 57,700 55,200
INVESTIGATIONS 3,282 2,041 18,223 25,000 26,500
JUVENILE - - - 1,500 1,000
FIELD OPERATIONS 2,825 6,320 4,297 3,800 1,800
OBJECT TOTAL: 54,775 62,904 79,882 95,200 91,300
OBJECT CODE 005 REPAIRS & MAINTENANCE
ADMINISTRATION 23,968 22,717 26,102 38,000 38,000
COMMUNICATIONS 10,127 5,607 8,577 4,000 4,000
INVESTIGATIONS
JUVENILE
FIELD OPERATIONS 66,803 77,401 73,492 90,300 83,500
OBJECT TOTAL: 100,898 105,724 108,171 132,300 125,500
OBJECT CODE 006 INSURANCE
ADMINISTRATION 105,649 108,090 109,773 106,000 107,000
COMMUNICATIONS 16,246 11,916 13,471 10,000 10,000
INVESTIGATIONS 4,642 3,405 3,849 4,500 4,500
JUVENILE 2,321 1,702 1,925 2,100 2,100
FIELD OPERATIONS 67,305 49,368 55,812 50,000 50,000
OBJECT TOTAL: 196,163 174,482 184,830 172,600 173,600
Object Summary Page 2 7/25/2011P15
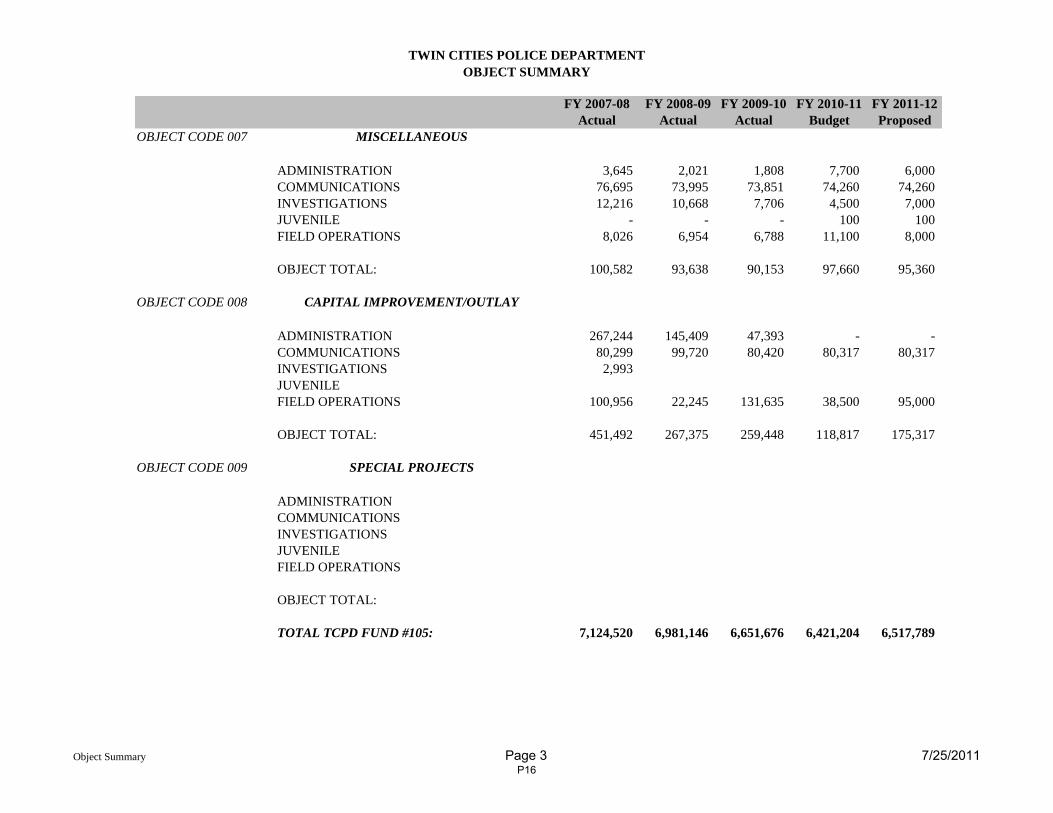
TWIN CITIES POLICE DEPARTMENT
OBJECT SUMMARY
FY 2007-08 FY 2008-09 FY 2009-10 FY 2010-11 FY 2011-12
Actual Actual Actual Budget Proposed
OBJECT CODE 007 MISCELLANEOUS
ADMINISTRATION 3,645 2,021 1,808 7,700 6,000
COMMUNICATIONS 76,695 73,995 73,851 74,260 74,260
INVESTIGATIONS 12,216 10,668 7,706 4,500 7,000
JUVENILE - - - 100 100
FIELD OPERATIONS 8,026 6,954 6,788 11,100 8,000
OBJECT TOTAL: 100,582 93,638 90,153 97,660 95,360
OBJECT CODE 008 CAPITAL IMPROVEMENT/OUTLAY
ADMINISTRATION 267,244 145,409 47,393 - -
COMMUNICATIONS 80,299 99,720 80,420 80,317 80,317
INVESTIGATIONS 2,993
JUVENILE
FIELD OPERATIONS 100,956 22,245 131,635 38,500 95,000
OBJECT TOTAL: 451,492 267,375 259,448 118,817 175,317
OBJECT CODE 009 SPECIAL PROJECTS
ADMINISTRATION
COMMUNICATIONS
INVESTIGATIONS
JUVENILE
FIELD OPERATIONS
OBJECT TOTAL:
TOTAL TCPD FUND #105: 7,124,520 6,981,146 6,651,676 6,421,204 6,517,789
Object Summary Page 3 7/25/2011P16
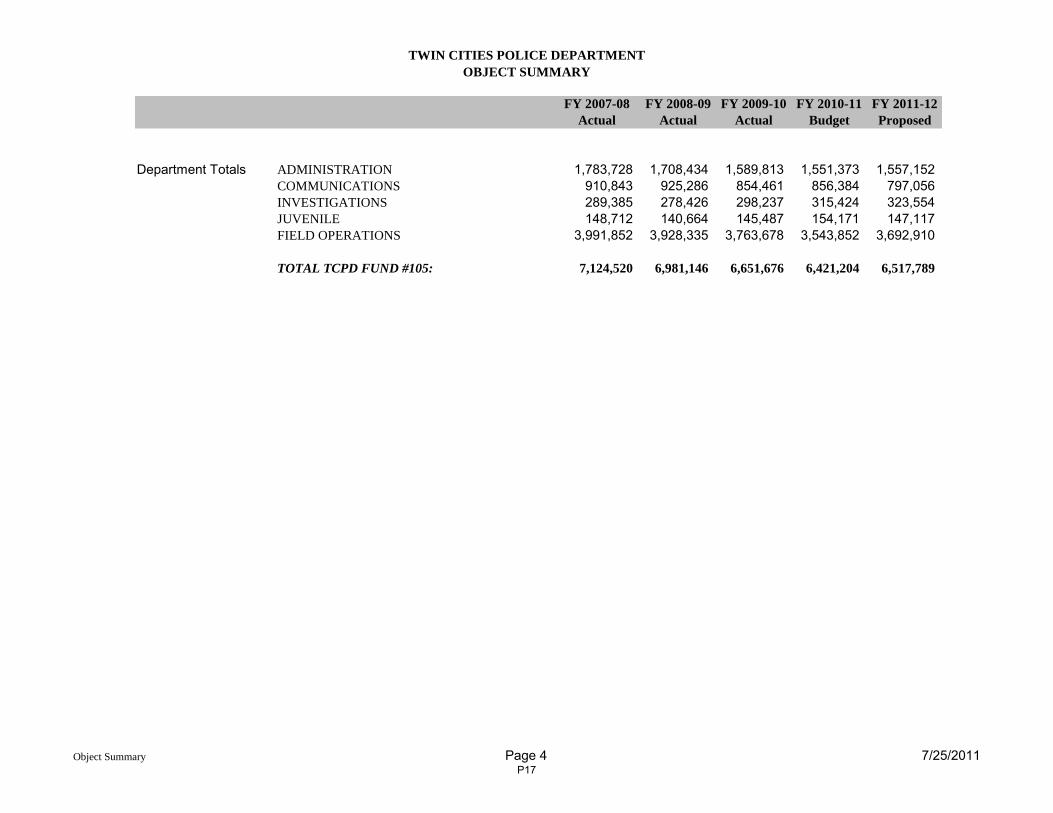
TWIN CITIES POLICE DEPARTMENT
OBJECT SUMMARY
FY 2007-08 FY 2008-09 FY 2009-10 FY 2010-11 FY 2011-12
Actual Actual Actual Budget Proposed
Department Totals ADMINISTRATION 1,783,728 1,708,434 1,589,813 1,551,373 1,557,152
COMMUNICATIONS 910,843 925,286 854,461 856,384 797,056
INVESTIGATIONS 289,385 278,426 298,237 315,424 323,554
JUVENILE 148,712 140,664 145,487 154,171 147,117
FIELD OPERATIONS 3,991,852 3,928,335 3,763,678 3,543,852 3,692,910
TOTAL TCPD FUND #105: 7,124,520 6,981,146 6,651,676 6,421,204 6,517,789
Object Summary Page 4 7/25/2011P17
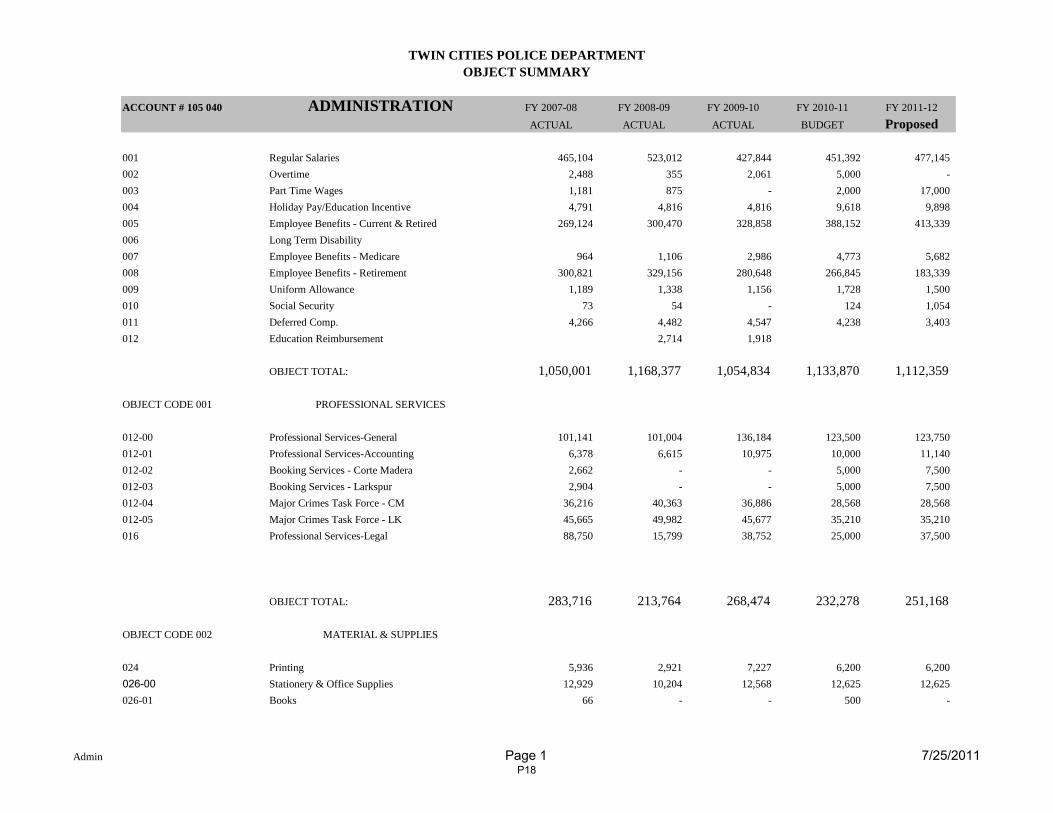
TWIN CITIES POLICE DEPARTMENT
OBJECT SUMMARY
ACCOUNT # 105 040 ADMINISTRATION FY 2007-08 FY 2008-09 FY 2009-10 FY 2010-11 FY 2011-12
ACTUAL ACTUAL ACTUAL BUDGET Proposed
001 Regular Salaries 465,104 523,012 427,844 451,392 477,145
002 Overtime 2,488 355 2,061 5,000 -
003 Part Time Wages 1,181 875 - 2,000 17,000
004 Holiday Pay/Education Incentive 4,791 4,816 4,816 9,618 9,898
005 Employee Benefits - Current & Retired 269,124 300,470 328,858 388,152 413,339
006 Long Term Disability
007 Employee Benefits - Medicare 964 1,106 2,986 4,773 5,682
008 Employee Benefits - Retirement 300,821 329,156 280,648 266,845 183,339
009 Uniform Allowance 1,189 1,338 1,156 1,728 1,500
010 Social Security 73 54 - 124 1,054
011 Deferred Comp. 4,266 4,482 4,547 4,238 3,403
012 Education Reimbursement 2,714 1,918
OBJECT TOTAL: 1,050,001 1,168,377 1,054,834 1,133,870 1,112,359
OBJECT CODE 001 PROFESSIONAL SERVICES
012-00 Professional Services-General 101,141 101,004 136,184 123,500 123,750
012-01 Professional Services-Accounting 6,378 6,615 10,975 10,000 11,140
012-02 Booking Services - Corte Madera 2,662 - - 5,000 7,500
012-03 Booking Services - Larkspur 2,904 - - 5,000 7,500
012-04 Major Crimes Task Force - CM 36,216 40,363 36,886 28,568 28,568
012-05 Major Crimes Task Force - LK 45,665 49,982 45,677 35,210 35,210
016 Professional Services-Legal 88,750 15,799 38,752 25,000 37,500
OBJECT TOTAL: 283,716 213,764 268,474 232,278 251,168
OBJECT CODE 002 MATERIAL & SUPPLIES
024 Printing 5,936 2,921 7,227 6,200 6,200
026-00 Stationery & Office Supplies 12,929 10,204 12,568 12,625 12,625
026-01 Books 66 - - 500 -
Admin Page 1 7/25/2011P18
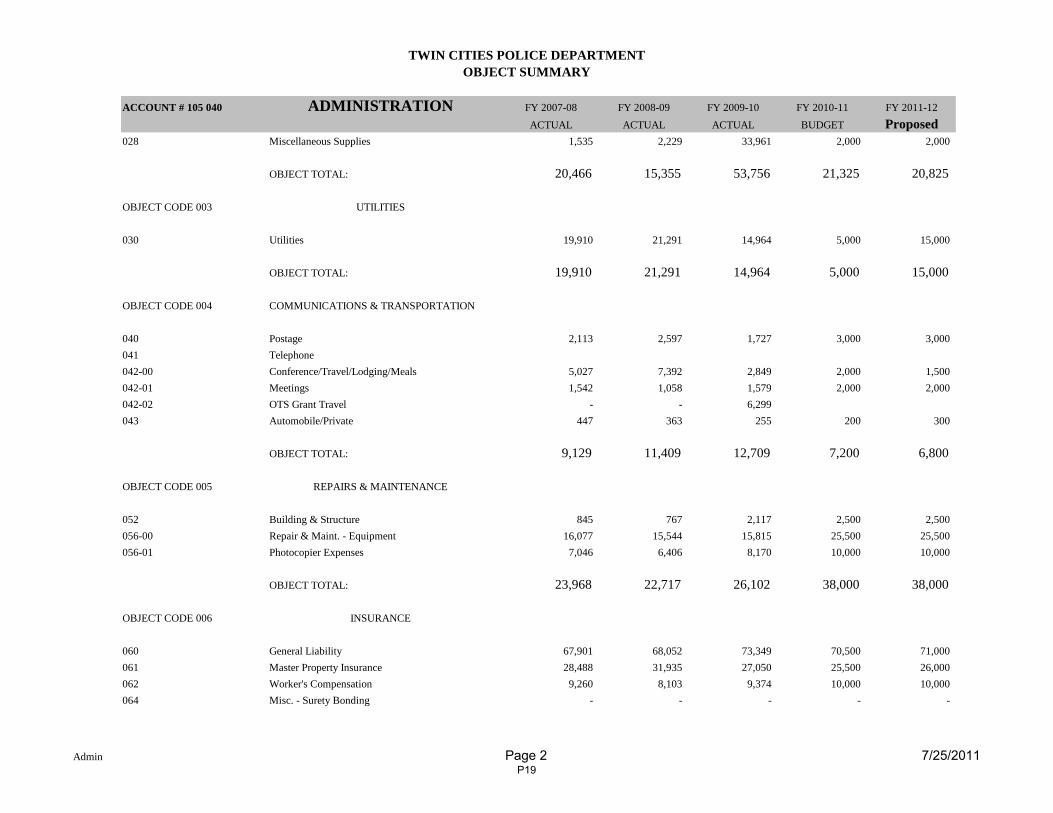
TWIN CITIES POLICE DEPARTMENT
OBJECT SUMMARY
ACCOUNT # 105 040 ADMINISTRATION FY 2007-08 FY 2008-09 FY 2009-10 FY 2010-11 FY 2011-12
ACTUAL ACTUAL ACTUAL BUDGET Proposed
028 Miscellaneous Supplies 1,535 2,229 33,961 2,000 2,000
OBJECT TOTAL: 20,466 15,355 53,756 21,325 20,825
OBJECT CODE 003 UTILITIES
030 Utilities 19,910 21,291 14,964 5,000 15,000
OBJECT TOTAL: 19,910 21,291 14,964 5,000 15,000
OBJECT CODE 004 COMMUNICATIONS & TRANSPORTATION
040 Postage 2,113 2,597 1,727 3,000 3,000
041 Telephone
042-00 Conference/Travel/Lodging/Meals 5,027 7,392 2,849 2,000 1,500
042-01 Meetings 1,542 1,058 1,579 2,000 2,000
042-02 OTS Grant Travel - - 6,299
043 Automobile/Private 447 363 255 200 300
OBJECT TOTAL: 9,129 11,409 12,709 7,200 6,800
OBJECT CODE 005 REPAIRS & MAINTENANCE
052 Building & Structure 845 767 2,117 2,500 2,500
056-00 Repair & Maint. - Equipment 16,077 15,544 15,815 25,500 25,500
056-01 Photocopier Expenses 7,046 6,406 8,170 10,000 10,000
OBJECT TOTAL: 23,968 22,717 26,102 38,000 38,000
OBJECT CODE 006 INSURANCE
060 General Liability 67,901 68,052 73,349 70,500 71,000
061 Master Property Insurance 28,488 31,935 27,050 25,500 26,000
062 Worker's Compensation 9,260 8,103 9,374 10,000 10,000
064 Misc. - Surety Bonding - - - - -
Admin Page 2 7/25/2011P19
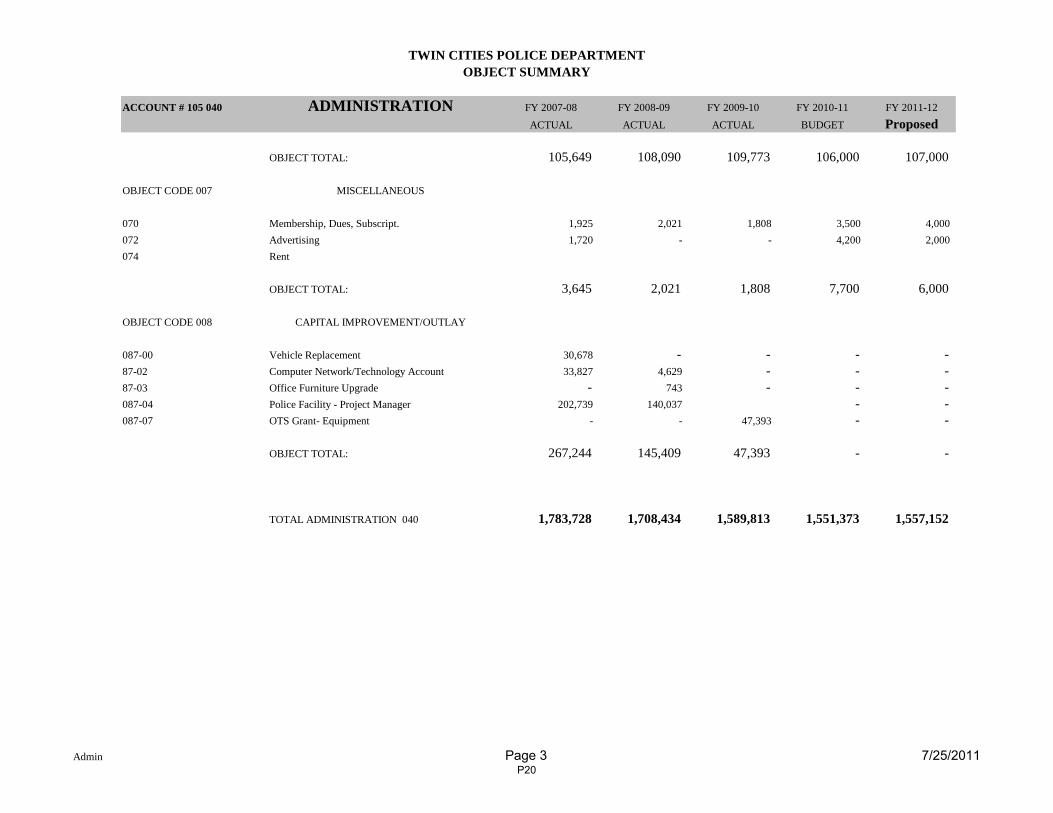
TWIN CITIES POLICE DEPARTMENT
OBJECT SUMMARY
ACCOUNT # 105 040 ADMINISTRATION FY 2007-08 FY 2008-09 FY 2009-10 FY 2010-11 FY 2011-12
ACTUAL ACTUAL ACTUAL BUDGET Proposed
OBJECT TOTAL: 105,649 108,090 109,773 106,000 107,000
OBJECT CODE 007 MISCELLANEOUS
070 Membership, Dues, Subscript. 1,925 2,021 1,808 3,500 4,000
072 Advertising 1,720 - - 4,200 2,000
074 Rent
OBJECT TOTAL: 3,645 2,021 1,808 7,700 6,000
OBJECT CODE 008 CAPITAL IMPROVEMENT/OUTLAY
087-00 Vehicle Replacement 30,678 - - - -
87-02 Computer Network/Technology Account 33,827 4,629 - - -
87-03 Office Furniture Upgrade - 743 - - -
087-04 Police Facility - Project Manager 202,739 140,037 - -
087-07 OTS Grant- Equipment - - 47,393 - -
OBJECT TOTAL: 267,244 145,409 47,393 - -
TOTAL ADMINISTRATION 040 1,783,728 1,708,434 1,589,813 1,551,373 1,557,152
Admin Page 3 7/25/2011P20
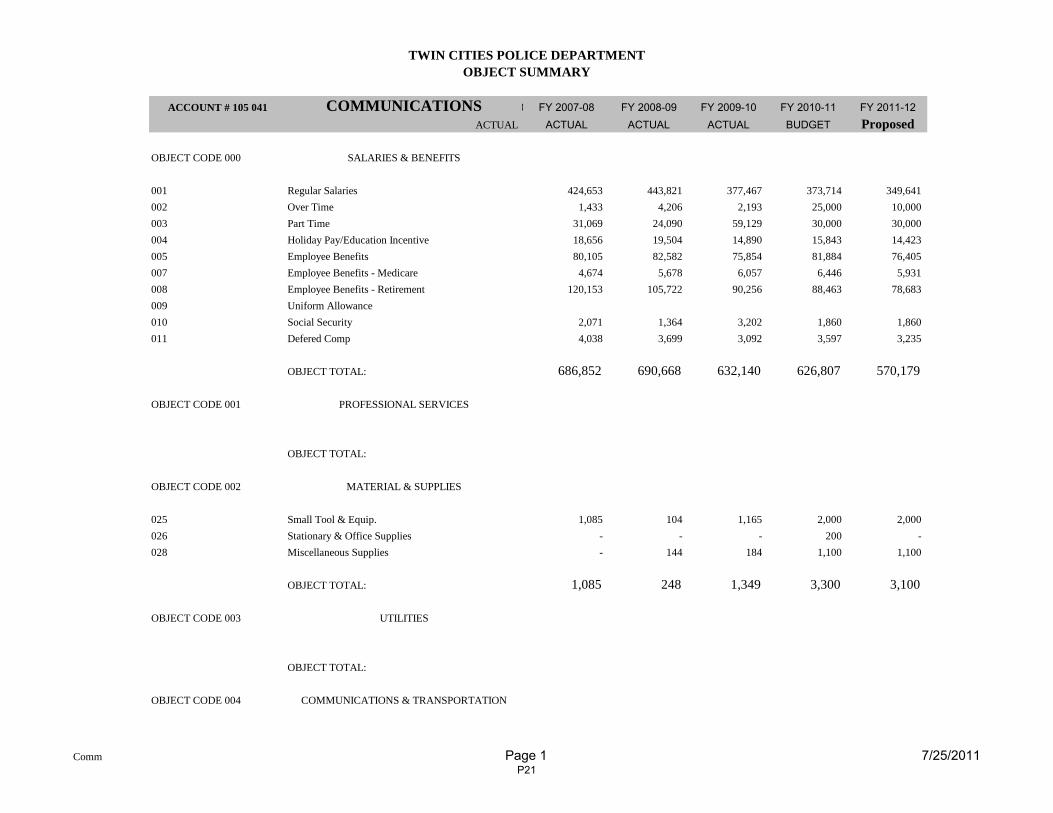
TWIN CITIES POLICE DEPARTMENT
OBJECT SUMMARY
ACCOUNT # 105 041 COMMUNICATIONS FY 2006-07FY 2007-08 FY 2008-09 FY 2009-10 FY 2010-11 FY 2011-12
ACTUAL ACTUAL ACTUAL ACTUAL BUDGET Proposed
OBJECT CODE 000 SALARIES & BENEFITS
001 Regular Salaries 424,653 443,821 377,467 373,714 349,641
002 Over Time 1,433 4,206 2,193 25,000 10,000
003 Part Time 31,069 24,090 59,129 30,000 30,000
004 Holiday Pay/Education Incentive 18,656 19,504 14,890 15,843 14,423
005 Employee Benefits 80,105 82,582 75,854 81,884 76,405
007 Employee Benefits - Medicare 4,674 5,678 6,057 6,446 5,931
008 Employee Benefits - Retirement 120,153 105,722 90,256 88,463 78,683
009 Uniform Allowance
010 Social Security 2,071 1,364 3,202 1,860 1,860
011 Defered Comp 4,038 3,699 3,092 3,597 3,235
OBJECT TOTAL: 686,852 690,668 632,140 626,807 570,179
OBJECT CODE 001 PROFESSIONAL SERVICES
OBJECT TOTAL:
OBJECT CODE 002 MATERIAL & SUPPLIES
025 Small Tool & Equip. 1,085 104 1,165 2,000 2,000
026 Stationary & Office Supplies - - - 200 -
028 Miscellaneous Supplies - 144 184 1,100 1,100
OBJECT TOTAL: 1,085 248 1,349 3,300 3,100
OBJECT CODE 003 UTILITIES
OBJECT TOTAL:
OBJECT CODE 004 COMMUNICATIONS & TRANSPORTATION
Comm Page 1 7/25/2011P21
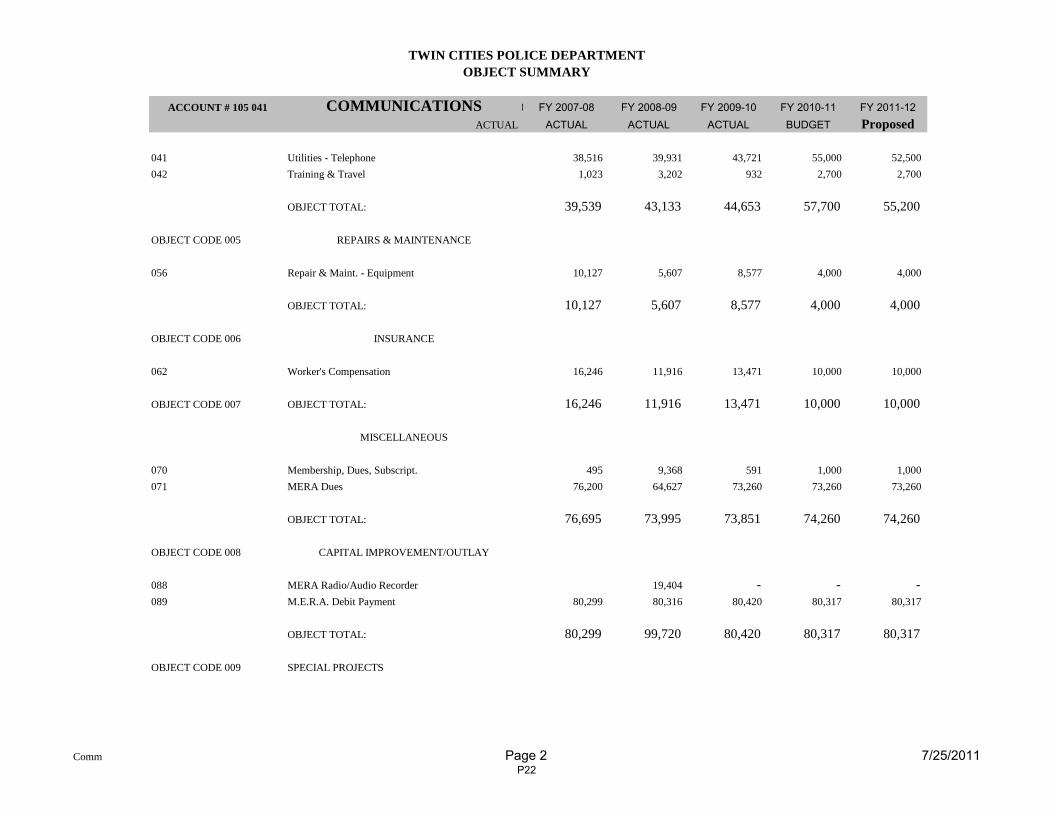
TWIN CITIES POLICE DEPARTMENT
OBJECT SUMMARY
ACCOUNT # 105 041 COMMUNICATIONS FY 2006-07FY 2007-08 FY 2008-09 FY 2009-10 FY 2010-11 FY 2011-12
ACTUAL ACTUAL ACTUAL ACTUAL BUDGET Proposed
041 Utilities - Telephone 38,516 39,931 43,721 55,000 52,500
042 Training & Travel 1,023 3,202 932 2,700 2,700
OBJECT TOTAL: 39,539 43,133 44,653 57,700 55,200
OBJECT CODE 005 REPAIRS & MAINTENANCE
056 Repair & Maint. - Equipment 10,127 5,607 8,577 4,000 4,000
OBJECT TOTAL: 10,127 5,607 8,577 4,000 4,000
OBJECT CODE 006 INSURANCE
062 Worker's Compensation 16,246 11,916 13,471 10,000 10,000
OBJECT CODE 007 OBJECT TOTAL: 16,246 11,916 13,471 10,000 10,000
MISCELLANEOUS
070 Membership, Dues, Subscript. 495 9,368 591 1,000 1,000
071 MERA Dues 76,200 64,627 73,260 73,260 73,260
OBJECT TOTAL: 76,695 73,995 73,851 74,260 74,260
OBJECT CODE 008 CAPITAL IMPROVEMENT/OUTLAY
088 MERA Radio/Audio Recorder 19,404 - - -
089 M.E.R.A. Debit Payment 80,299 80,316 80,420 80,317 80,317
OBJECT TOTAL: 80,299 99,720 80,420 80,317 80,317
OBJECT CODE 009 SPECIAL PROJECTS
Comm Page 2 7/25/2011P22
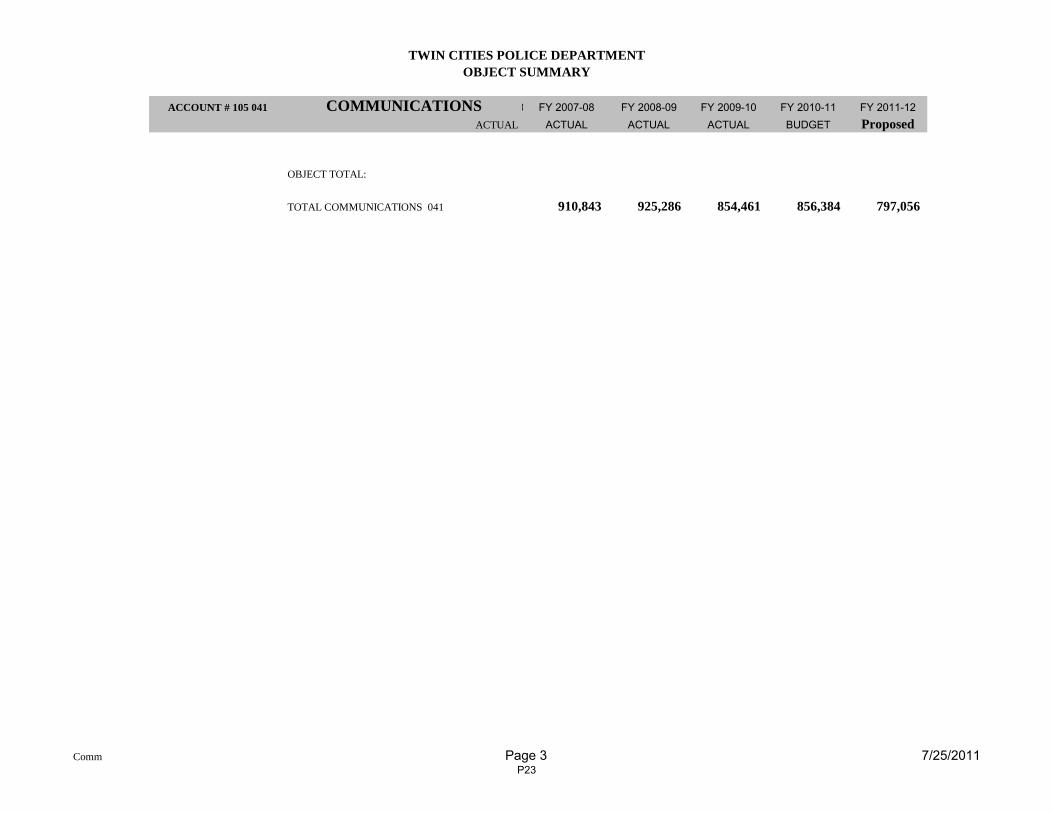
TWIN CITIES POLICE DEPARTMENT
OBJECT SUMMARY
ACCOUNT # 105 041 COMMUNICATIONS FY 2006-07FY 2007-08 FY 2008-09 FY 2009-10 FY 2010-11 FY 2011-12
ACTUAL ACTUAL ACTUAL ACTUAL BUDGET Proposed
OBJECT TOTAL:
TOTAL COMMUNICATIONS 041 910,843 925,286 854,461 856,384 797,056
Comm Page 3 7/25/2011P23
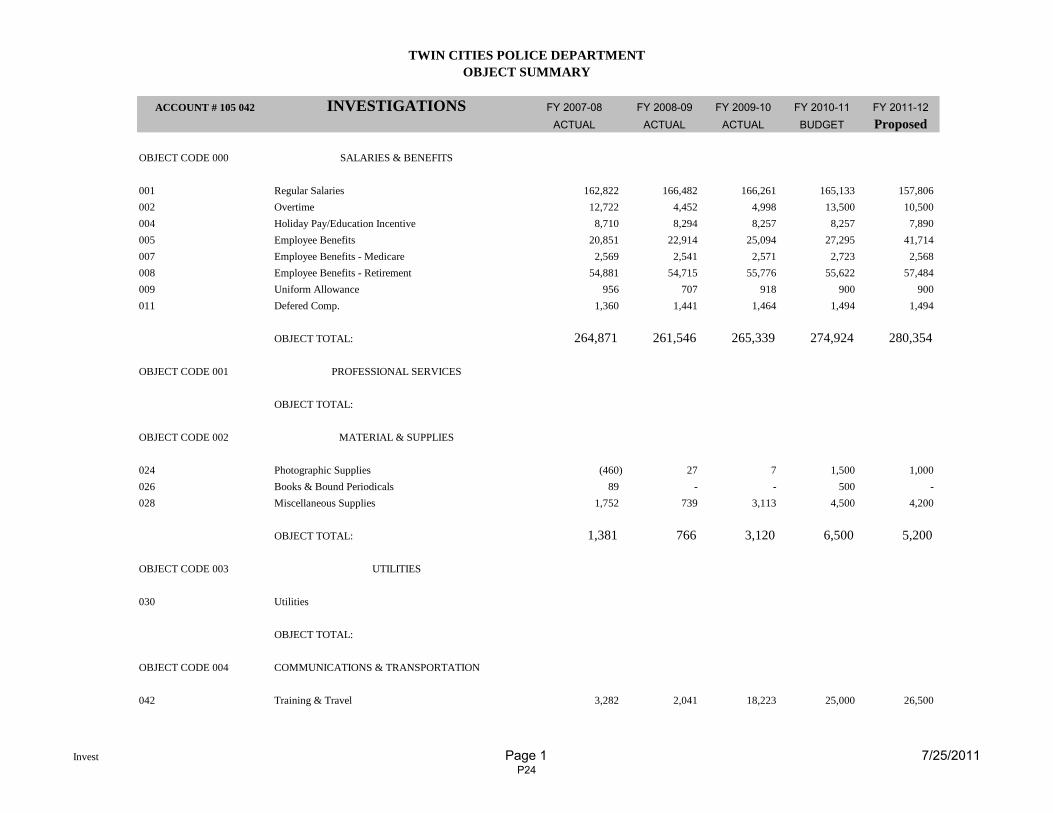
TWIN CITIES POLICE DEPARTMENT
OBJECT SUMMARY
ACCOUNT # 105 042 INVESTIGATIONS FY 2007-08 FY 2008-09 FY 2009-10 FY 2010-11 FY 2011-12
ACTUAL ACTUAL ACTUAL BUDGET Proposed
OBJECT CODE 000 SALARIES & BENEFITS
001 Regular Salaries 162,822 166,482 166,261 165,133 157,806
002 Overtime 12,722 4,452 4,998 13,500 10,500
004 Holiday Pay/Education Incentive 8,710 8,294 8,257 8,257 7,890
005 Employee Benefits 20,851 22,914 25,094 27,295 41,714
007 Employee Benefits - Medicare 2,569 2,541 2,571 2,723 2,568
008 Employee Benefits - Retirement 54,881 54,715 55,776 55,622 57,484
009 Uniform Allowance 956 707 918 900 900
011 Defered Comp. 1,360 1,441 1,464 1,494 1,494
OBJECT TOTAL: 264,871 261,546 265,339 274,924 280,354
OBJECT CODE 001 PROFESSIONAL SERVICES
OBJECT TOTAL:
OBJECT CODE 002 MATERIAL & SUPPLIES
024 Photographic Supplies (460) 27 7 1,500 1,000
026 Books & Bound Periodicals 89 - - 500 -
028 Miscellaneous Supplies 1,752 739 3,113 4,500 4,200
OBJECT TOTAL: 1,381 766 3,120 6,500 5,200
OBJECT CODE 003 UTILITIES
030 Utilities
OBJECT TOTAL:
OBJECT CODE 004 COMMUNICATIONS & TRANSPORTATION
042 Training & Travel 3,282 2,041 18,223 25,000 26,500
Invest Page 1 7/25/2011P24
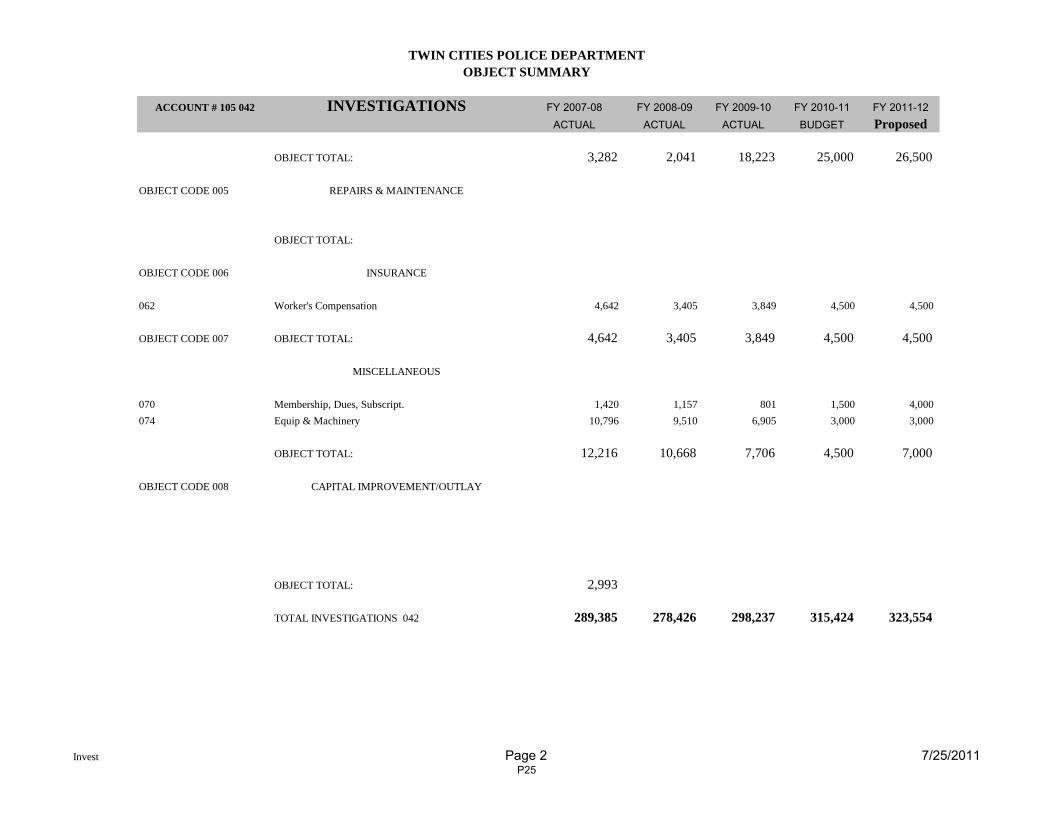
TWIN CITIES POLICE DEPARTMENT
OBJECT SUMMARY
ACCOUNT # 105 042 INVESTIGATIONS FY 2007-08 FY 2008-09 FY 2009-10 FY 2010-11 FY 2011-12
ACTUAL ACTUAL ACTUAL BUDGET Proposed
OBJECT TOTAL: 3,282 2,041 18,223 25,000 26,500
OBJECT CODE 005 REPAIRS & MAINTENANCE
OBJECT TOTAL:
OBJECT CODE 006 INSURANCE
062 Worker's Compensation 4,642 3,405 3,849 4,500 4,500
OBJECT CODE 007 OBJECT TOTAL: 4,642 3,405 3,849 4,500 4,500
MISCELLANEOUS
070 Membership, Dues, Subscript. 1,420 1,157 801 1,500 4,000
074 Equip & Machinery 10,796 9,510 6,905 3,000 3,000
OBJECT TOTAL: 12,216 10,668 7,706 4,500 7,000
OBJECT CODE 008 CAPITAL IMPROVEMENT/OUTLAY
OBJECT TOTAL: 2,993
TOTAL INVESTIGATIONS 042 289,385 278,426 298,237 315,424 323,554
Invest Page 2 7/25/2011P25
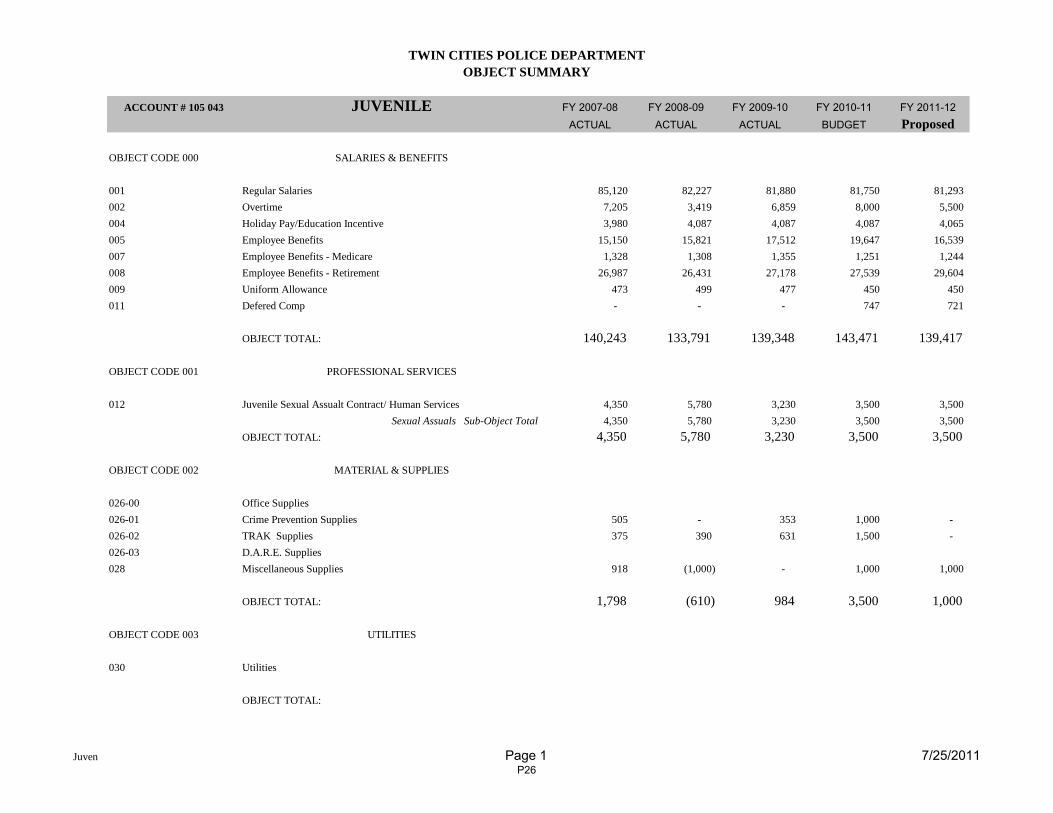
TWIN CITIES POLICE DEPARTMENT
OBJECT SUMMARY
ACCOUNT # 105 043 JUVENILE FY 2007-08 FY 2008-09 FY 2009-10 FY 2010-11 FY 2011-12
ACTUAL ACTUAL ACTUAL BUDGET Proposed
OBJECT CODE 000 SALARIES & BENEFITS
001 Regular Salaries 85,120 82,227 81,880 81,750 81,293
002 Overtime 7,205 3,419 6,859 8,000 5,500
004 Holiday Pay/Education Incentive 3,980 4,087 4,087 4,087 4,065
005 Employee Benefits 15,150 15,821 17,512 19,647 16,539
007 Employee Benefits - Medicare 1,328 1,308 1,355 1,251 1,244
008 Employee Benefits - Retirement 26,987 26,431 27,178 27,539 29,604
009 Uniform Allowance 473 499 477 450 450
011 Defered Comp - - - 747 721
OBJECT TOTAL: 140,243 133,791 139,348 143,471 139,417
OBJECT CODE 001 PROFESSIONAL SERVICES
012 Juvenile Sexual Assualt Contract/ Human Services 4,350 5,780 3,230 3,500 3,500
Sexual Assuals Sub-Object Total 4,350 5,780 3,230 3,500 3,500
OBJECT TOTAL: 4,350 5,780 3,230 3,500 3,500
OBJECT CODE 002 MATERIAL & SUPPLIES
026-00 Office Supplies
026-01 Crime Prevention Supplies 505 - 353 1,000 -
026-02 TRAK Supplies 375 390 631 1,500 -
026-03 D.A.R.E. Supplies
028 Miscellaneous Supplies 918 (1,000) - 1,000 1,000
OBJECT TOTAL: 1,798 (610) 984 3,500 1,000
OBJECT CODE 003 UTILITIES
030 Utilities
OBJECT TOTAL:
Juven Page 1 7/25/2011P26
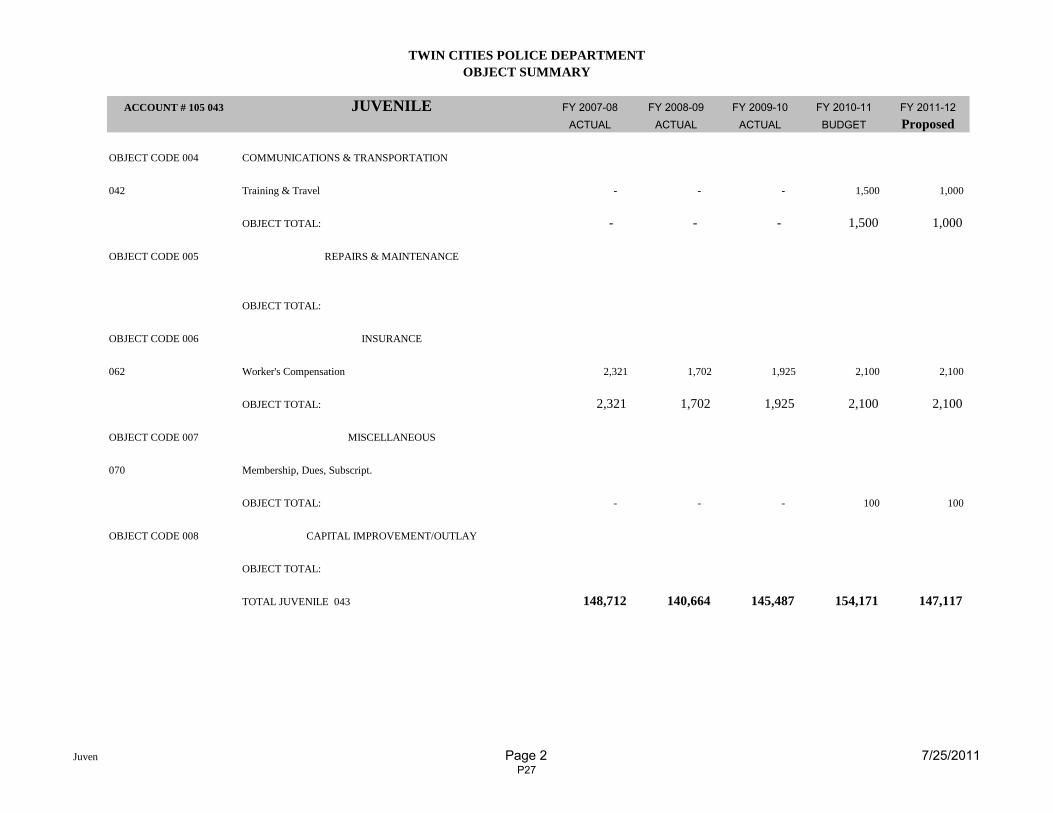
TWIN CITIES POLICE DEPARTMENT
OBJECT SUMMARY
ACCOUNT # 105 043 JUVENILE FY 2007-08 FY 2008-09 FY 2009-10 FY 2010-11 FY 2011-12
ACTUAL ACTUAL ACTUAL BUDGET Proposed
OBJECT CODE 004 COMMUNICATIONS & TRANSPORTATION
042 Training & Travel - - - 1,500 1,000
OBJECT TOTAL: - - - 1,500 1,000
OBJECT CODE 005 REPAIRS & MAINTENANCE
OBJECT TOTAL:
OBJECT CODE 006 INSURANCE
062 Worker's Compensation 2,321 1,702 1,925 2,100 2,100
OBJECT TOTAL: 2,321 1,702 1,925 2,100 2,100
OBJECT CODE 007 MISCELLANEOUS
070 Membership, Dues, Subscript.
OBJECT TOTAL: - - - 100 100
OBJECT CODE 008 CAPITAL IMPROVEMENT/OUTLAY
OBJECT TOTAL:
TOTAL JUVENILE 043 148,712 140,664 145,487 154,171 147,117
Juven Page 2 7/25/2011P27
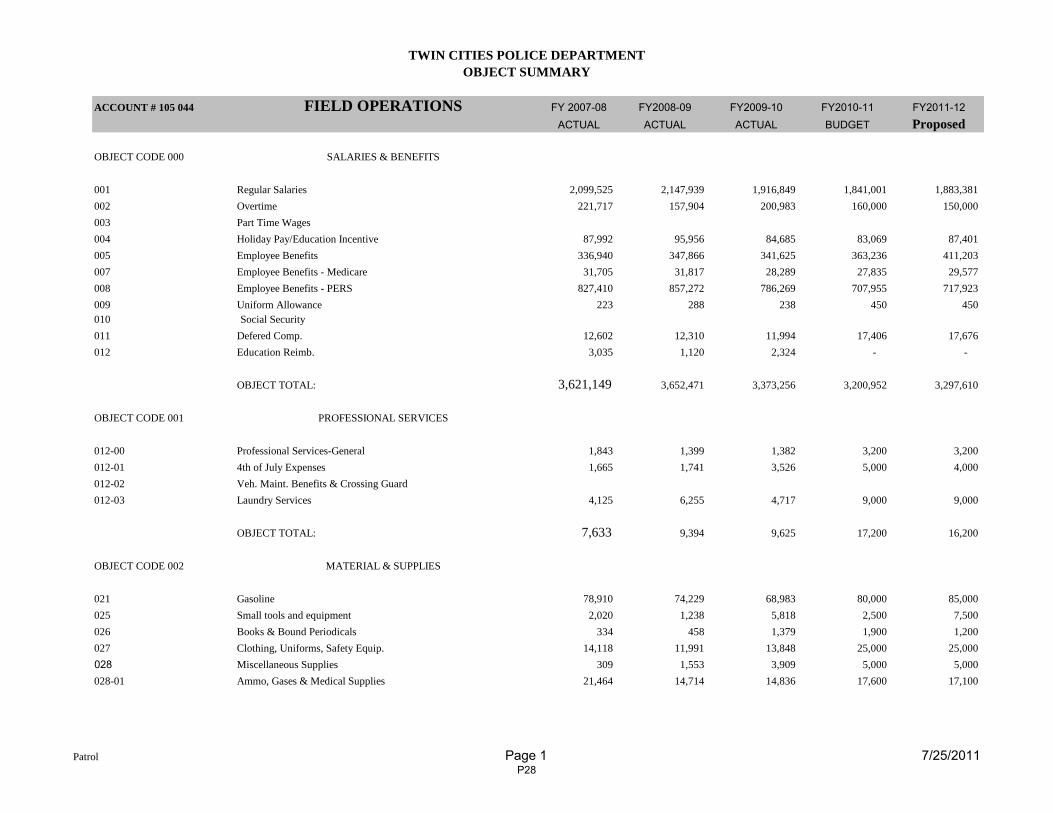
TWIN CITIES POLICE DEPARTMENT
OBJECT SUMMARY
ACCOUNT # 105 044 FIELD OPERATIONS FY 1996-97 FY 2007-08 FY2008-09 FY2009-10 FY2010-11 FY2011-12
ACTUAL ACTUAL ACTUAL BUDGET Proposed
OBJECT CODE 000 SALARIES & BENEFITS
001 Regular Salaries 2,099,525 2,147,939 1,916,849 1,841,001 1,883,381
002 Overtime 221,717 157,904 200,983 160,000 150,000
003 Part Time Wages
004 Holiday Pay/Education Incentive 87,992 95,956 84,685 83,069 87,401
005 Employee Benefits 336,940 347,866 341,625 363,236 411,203
007 Employee Benefits - Medicare 31,705 31,817 28,289 27,835 29,577
008 Employee Benefits - PERS 827,410 857,272 786,269 707,955 717,923
009 Uniform Allowance 223 288 238 450 450
010 Social Security
011 Defered Comp. 12,602 12,310 11,994 17,406 17,676
012 Education Reimb. 3,035 1,120 2,324 - -
OBJECT TOTAL: 3,621,149 3,652,471 3,373,256 3,200,952 3,297,610
OBJECT CODE 001 PROFESSIONAL SERVICES
012-00 Professional Services-General 1,843 1,399 1,382 3,200 3,200
012-01 4th of July Expenses 1,665 1,741 3,526 5,000 4,000
012-02 Veh. Maint. Benefits & Crossing Guard
012-03 Laundry Services 4,125 6,255 4,717 9,000 9,000
OBJECT TOTAL: 7,633 9,394 9,625 17,200 16,200
OBJECT CODE 002 MATERIAL & SUPPLIES
021 Gasoline 78,910 74,229 68,983 80,000 85,000
025 Small tools and equipment 2,020 1,238 5,818 2,500 7,500
026 Books & Bound Periodicals 334 458 1,379 1,900 1,200
027 Clothing, Uniforms, Safety Equip. 14,118 11,991 13,848 25,000 25,000
028 Miscellaneous Supplies 309 1,553 3,909 5,000 5,000
028-01 Ammo, Gases & Medical Supplies 21,464 14,714 14,836 17,600 17,100
Patrol Page 1 7/25/2011P28
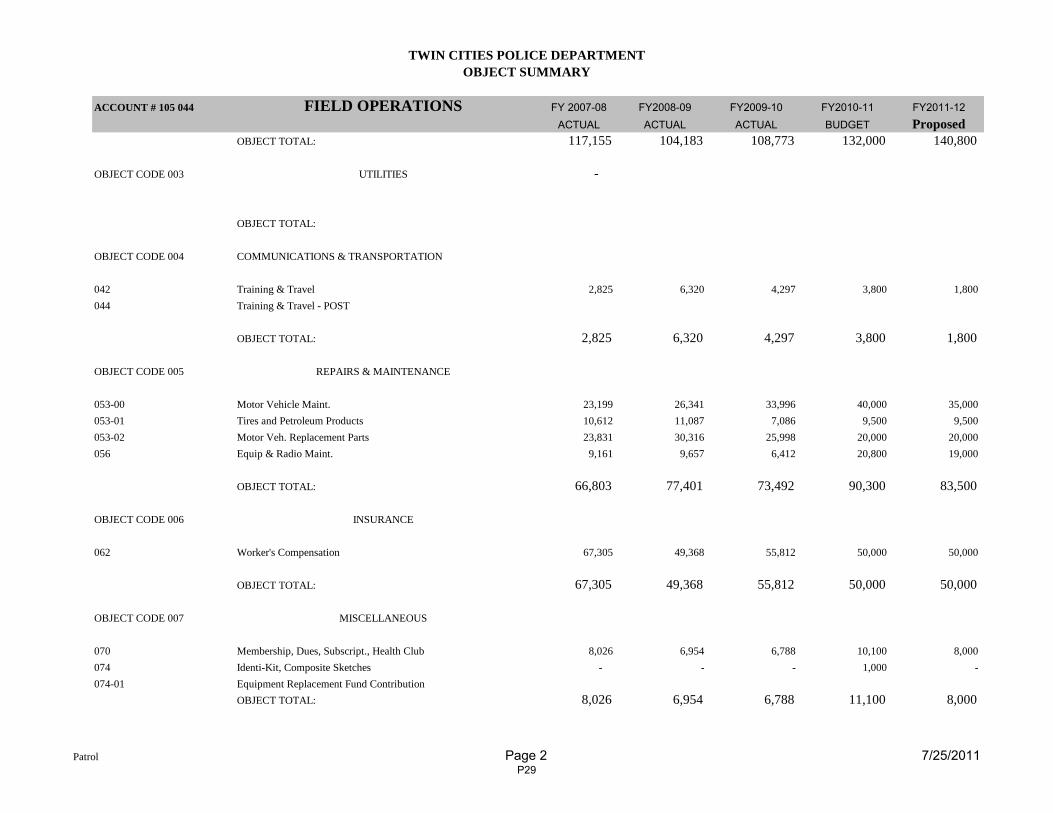
TWIN CITIES POLICE DEPARTMENT
OBJECT SUMMARY
ACCOUNT # 105 044 FIELD OPERATIONS FY 1996-97 FY 2007-08 FY2008-09 FY2009-10 FY2010-11 FY2011-12
ACTUAL ACTUAL ACTUAL BUDGET Proposed
OBJECT TOTAL: 117,155 104,183 108,773 132,000 140,800
OBJECT CODE 003 UTILITIES -
OBJECT TOTAL:
OBJECT CODE 004 COMMUNICATIONS & TRANSPORTATION
042 Training & Travel 2,825 6,320 4,297 3,800 1,800
044 Training & Travel - POST
OBJECT TOTAL: 2,825 6,320 4,297 3,800 1,800
OBJECT CODE 005 REPAIRS & MAINTENANCE
053-00 Motor Vehicle Maint. 23,199 26,341 33,996 40,000 35,000
053-01 Tires and Petroleum Products 10,612 11,087 7,086 9,500 9,500
053-02 Motor Veh. Replacement Parts 23,831 30,316 25,998 20,000 20,000
056 Equip & Radio Maint. 9,161 9,657 6,412 20,800 19,000
OBJECT TOTAL: 66,803 77,401 73,492 90,300 83,500
OBJECT CODE 006 INSURANCE
062 Worker's Compensation 67,305 49,368 55,812 50,000 50,000
OBJECT TOTAL: 67,305 49,368 55,812 50,000 50,000
OBJECT CODE 007 MISCELLANEOUS
070 Membership, Dues, Subscript., Health Club 8,026 6,954 6,788 10,100 8,000
074 Identi-Kit, Composite Sketches - - - 1,000 -
074-01 Equipment Replacement Fund Contribution
OBJECT TOTAL: 8,026 6,954 6,788 11,100 8,000
Patrol Page 2 7/25/2011P29
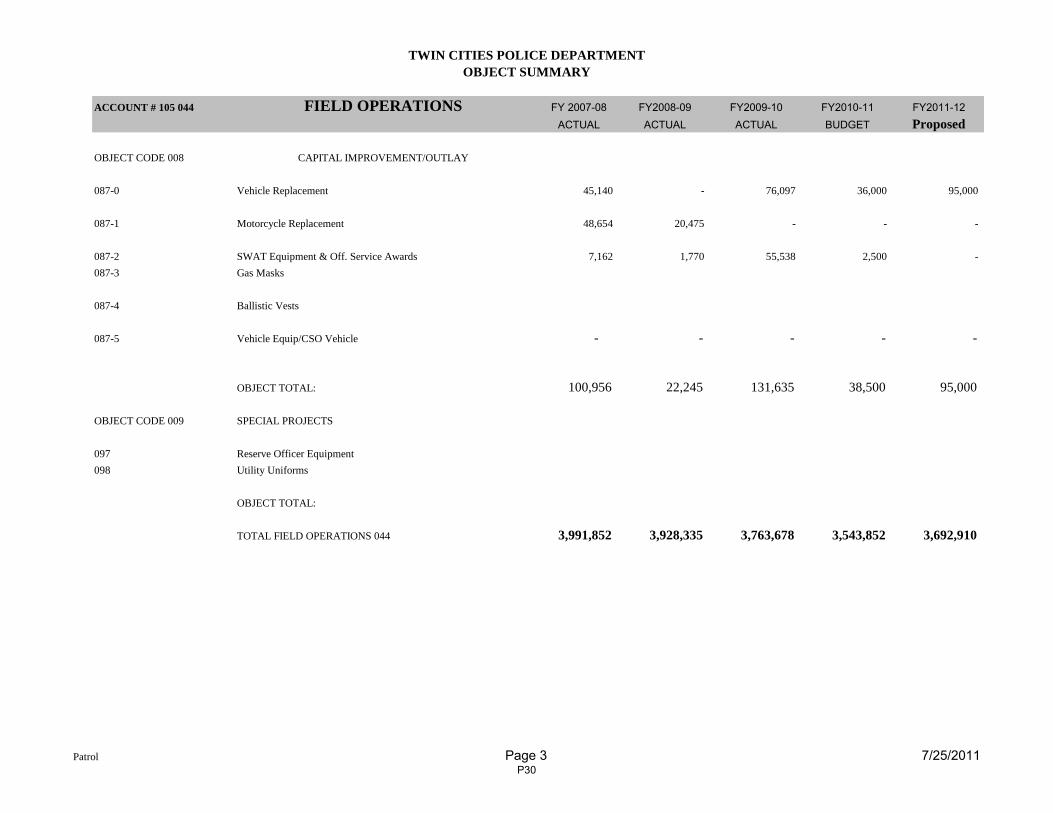
TWIN CITIES POLICE DEPARTMENT
OBJECT SUMMARY
ACCOUNT # 105 044 FIELD OPERATIONS FY 1996-97 FY 2007-08 FY2008-09 FY2009-10 FY2010-11 FY2011-12
ACTUAL ACTUAL ACTUAL BUDGET Proposed
OBJECT CODE 008 CAPITAL IMPROVEMENT/OUTLAY
087-0 Vehicle Replacement 45,140 - 76,097 36,000 95,000
087-1 Motorcycle Replacement 48,654 20,475 - - -
087-2 SWAT Equipment & Off. Service Awards 7,162 1,770 55,538 2,500 -
087-3 Gas Masks
087-4 Ballistic Vests
087-5 Vehicle Equip/CSO Vehicle - - - - -
OBJECT TOTAL: 100,956 22,245 131,635 38,500 95,000
OBJECT CODE 009 SPECIAL PROJECTS
097 Reserve Officer Equipment
098 Utility Uniforms
OBJECT TOTAL:
TOTAL FIELD OPERATIONS 044 3,991,852 3,928,335 3,763,678 3,543,852 3,692,910
Patrol Page 3 7/25/2011P30
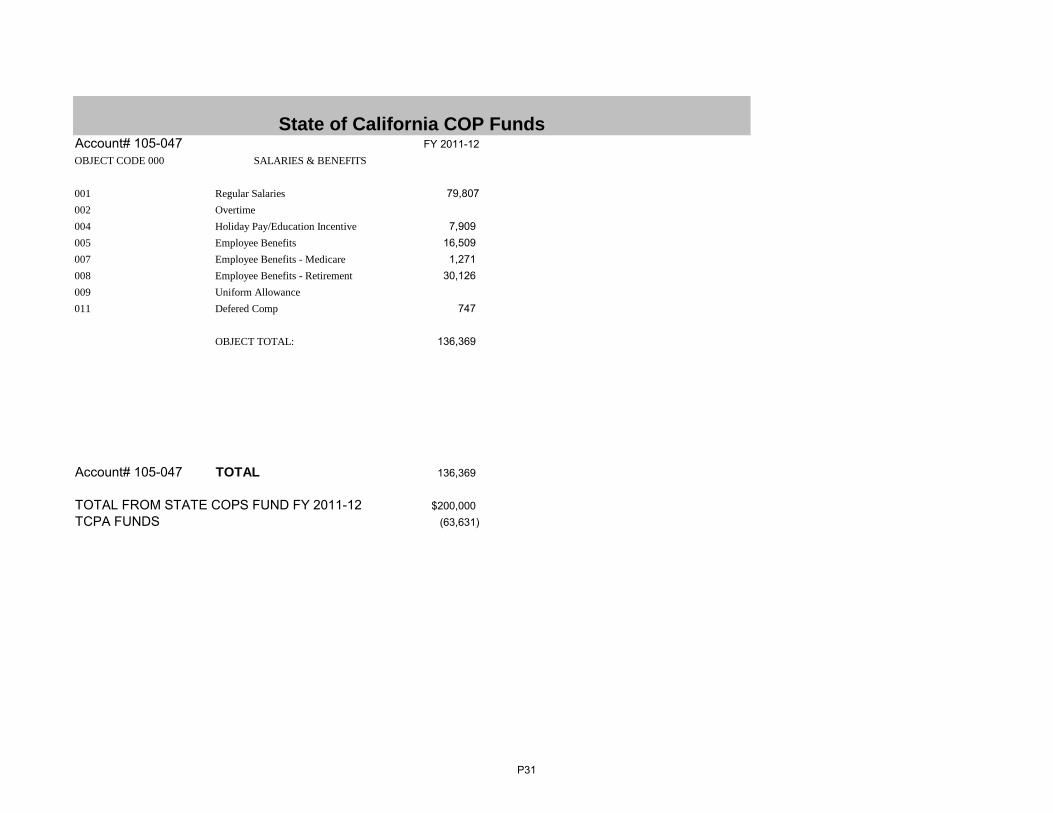
Account# 105-047 FY 2011-12
OBJECT CODE 000 SALARIES & BENEFITS
001 Regular Salaries 79,807
002 Overtime
004 Holiday Pay/Education Incentive 7,909
005 Employee Benefits 16,509
007 Employee Benefits - Medicare 1,271
008 Employee Benefits - Retirement 30,126
009 Uniform Allowance
011 Defered Comp 747
OBJECT TOTAL: 136,369
Account# 105-047 TOTAL 136,369
TOTAL FROM STATE COPS FUND FY 2011-12 $200,000
TCPA FUNDS (63,631)
State of California COP Funds
P31
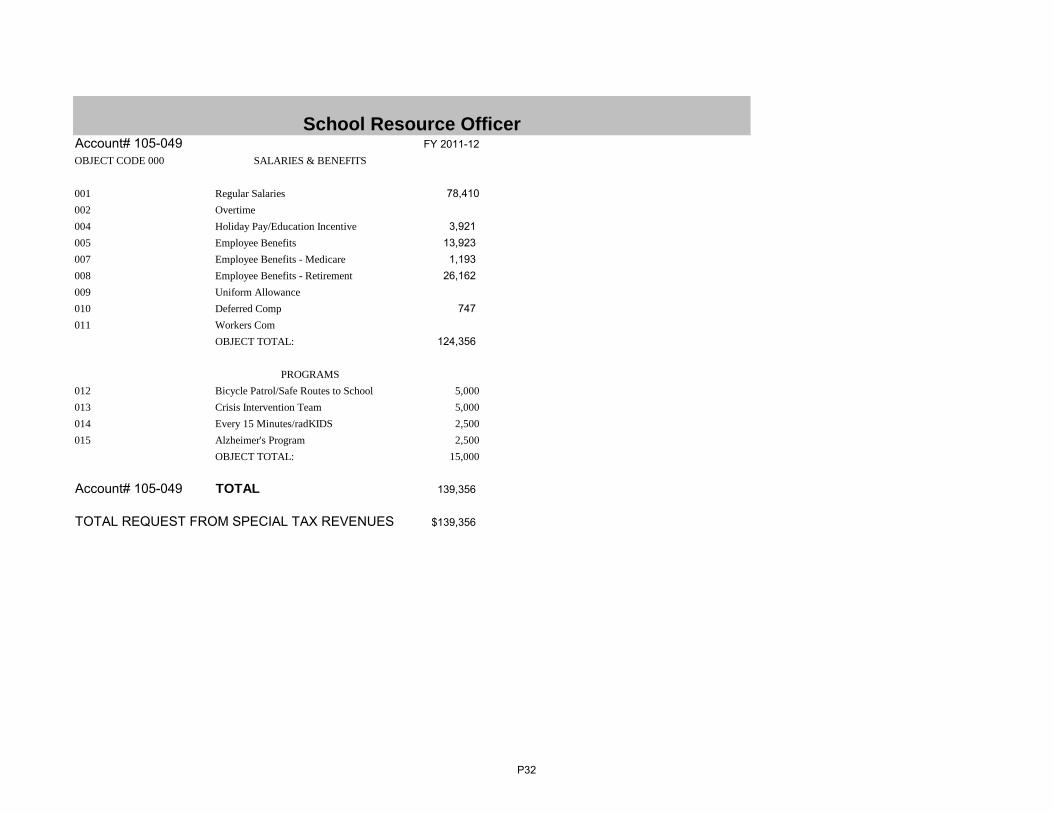
Account# 105-049 FY 2011-12
OBJECT CODE 000 SALARIES & BENEFITS
001 Regular Salaries 78,410
002 Overtime
004 Holiday Pay/Education Incentive 3,921
005 Employee Benefits 13,923
007 Employee Benefits - Medicare 1,193
008 Employee Benefits - Retirement 26,162
009 Uniform Allowance
010 Deferred Comp 747
011 Workers Com
OBJECT TOTAL: 124,356
PROGRAMS
012 Bicycle Patrol/Safe Routes to School 5,000
013 Crisis Intervention Team 5,000
014 Every 15 Minutes/radKIDS 2,500
015 Alzheimer's Program 2,500
OBJECT TOTAL: 15,000
Account# 105-049 TOTAL 139,356
TOTAL REQUEST FROM SPECIAL TAX REVENUES $139,356
School Resource Officer
P32
BLANK PAGE
2011-12Budget\Police.xls P33
P33
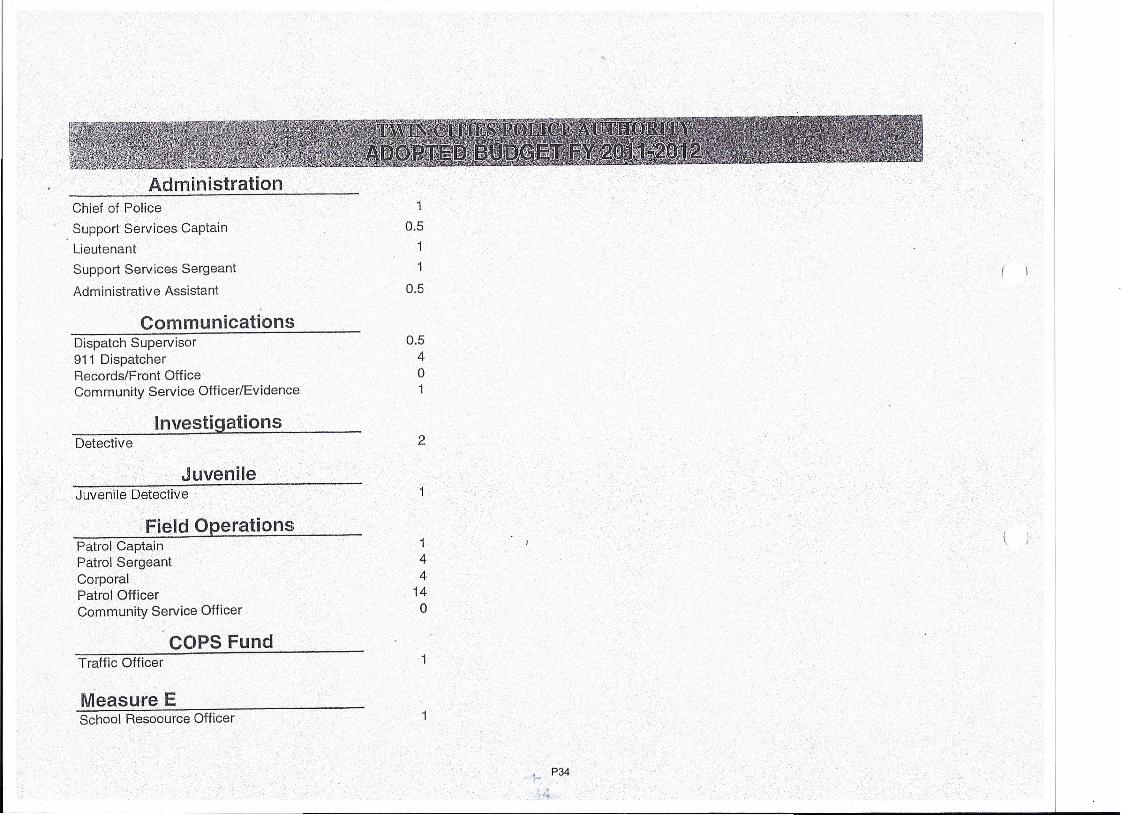
AdmlinistrationChief of Police 1. Support Services Captain 0.5lieutenant 1
Support Services Sergeant 1
Administrative Assistant 0.5
CommunicationsDispatch Supervisor 0.5911 Dispatcher 4Records/Front Office 0Community Service Officer/Evidence 1
InvestigationsDetective 2
JuvenileJuvenile Detective
Field OperationsPatrol Captain 1 I \Patrol Sergeant 4Corporal 4Patrol Officer 14Community Service Officer 0
COPS FundTraffic Officer 1
Measure ESchool Resoource Officer
1- P34
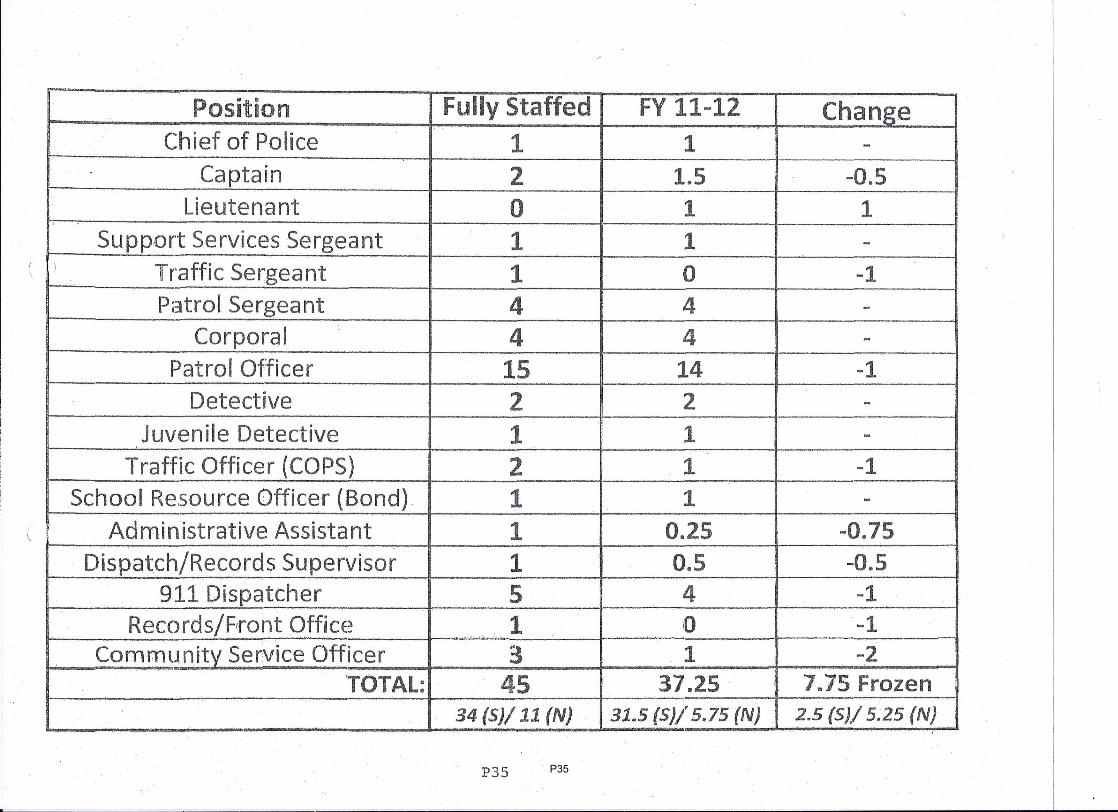
P35
\.
Position Fully Staffed FY11-12 ChangeChief of Police 1 1 -
Captain 2 1.5 -0.5Lieutenant 0 1 1
•Support Services Sergeant 1 1 -
) Traffic Sergeant 1 0 -1Patrol Sergeant 4 4 -
Corporal 4 4 -Patrol Officer 15 14 -1
Detective 2 2 -Juvenile Detective 1 1 --
Traffic Officer (COPS) 2 1 -1School Resource Officer (Bond) 1 1 -
. -Administrative Assistant 1 0.25 -0.75
Dispatch/Records Supervisor 1 0.5 -0.5911 Dispatcher 5 4 -1
Records/Front Office 1 0 -1,.J.M' ~ " '.
Community Service Officer :~ -2 I
1'TOTAL: 45 , 37 ..25 . 7.75 Frozen
34 (5)/11 (N) 31.5 (5)/5.75 (N) . 2.5 (5)/5.25 (N)-P35

BLANK PAGE
2011-12Budget\Police.xls P36
P36

BLANK PAGE
2011-12Budget\Fire.xls F1

BLANK PAGE
2011-12Budget\Fire.xls F2

BLANK PAGE
2011-12Budget\Fire.xls F3
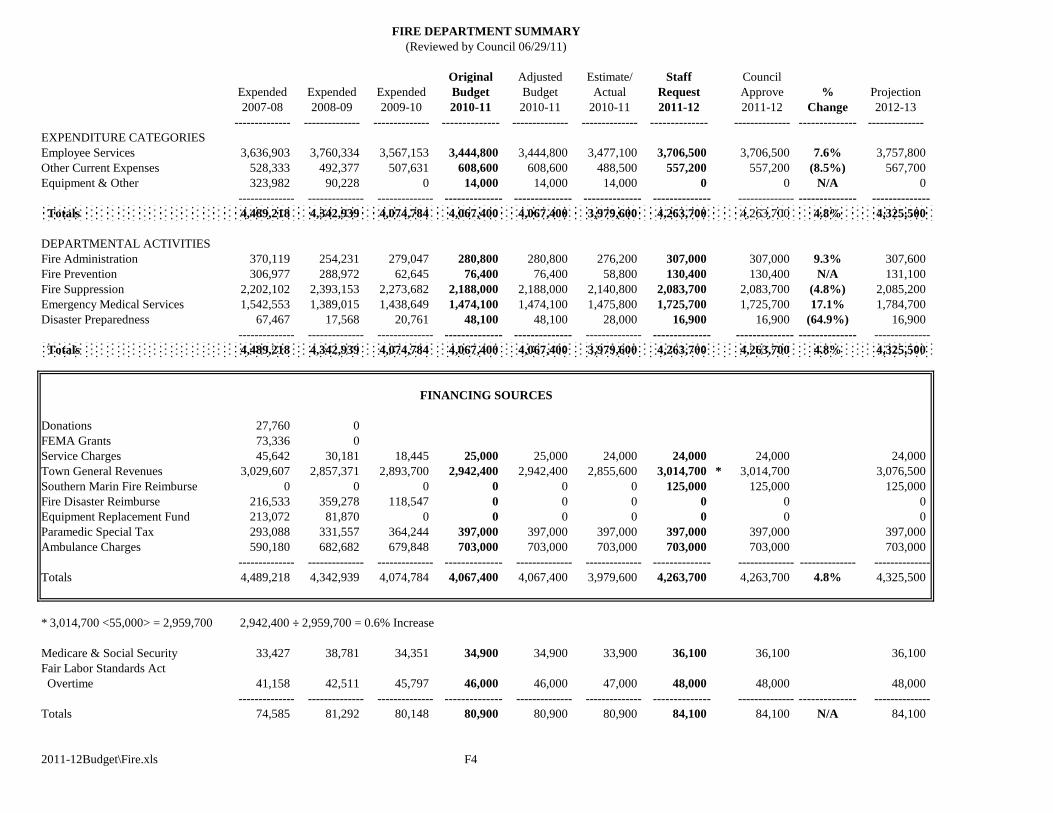
Original Adjusted Estimate/ Staff Council
Expended Expended Expended Budget Budget Actual Request Approve % Projection
2007-08 2008-09 2009-10 2010-11 2010-11 2010-11 2011-12 2011-12 Change 2012-13
-------------- -------------- -------------- -------------- -------------- -------------- -------------- -------------- -------------- --------------
EXPENDITURE CATEGORIES
Employee Services 3,636,903 3,760,334 3,567,153 3,444,800 3,444,800 3,477,100 3,706,500 3,706,500 7.6% 3,757,800
Other Current Expenses 528,333 492,377 507,631 608,600 608,600 488,500 557,200 557,200 (8.5%) 567,700
Equipment & Other 323,982 90,228 0 14,000 14,000 14,000 0 0 N/A 0
-------------- -------------- -------------- -------------- -------------- -------------- -------------- -------------- -------------- --------------
Totals 4,489,218 4,342,939 4,074,784 4,067,400 4,067,400 3,979,600 4,263,700 4,263,700 4.8% 4,325,500
DEPARTMENTAL ACTIVITIES
Fire Administration 370,119 254,231 279,047 280,800 280,800 276,200 307,000 307,000 9.3% 307,600
Fire Prevention 306,977 288,972 62,645 76,400 76,400 58,800 130,400 130,400 N/A 131,100
Fire Suppression 2,202,102 2,393,153 2,273,682 2,188,000 2,188,000 2,140,800 2,083,700 2,083,700 (4.8%) 2,085,200
Emergency Medical Services 1,542,553 1,389,015 1,438,649 1,474,100 1,474,100 1,475,800 1,725,700 1,725,700 17.1% 1,784,700
Disaster Preparedness 67,467 17,568 20,761 48,100 48,100 28,000 16,900 16,900 (64.9%) 16,900
-------------- -------------- -------------- -------------- -------------- -------------- -------------- -------------- -------------- --------------
Totals 4,489,218 4,342,939 4,074,784 4,067,400 4,067,400 3,979,600 4,263,700 4,263,700 4.8% 4,325,500
Donations 27,760 0
FEMA Grants 73,336 0
Service Charges 45,642 30,181 18,445 25,000 25,000 24,000 24,000 24,000 24,000
Town General Revenues 3,029,607 2,857,371 2,893,700 2,942,400 2,942,400 2,855,600 3,014,700 * 3,014,700 3,076,500
Southern Marin Fire Reimburse 0 0 0 0 0 0 125,000 125,000 125,000
Fire Disaster Reimburse 216,533 359,278 118,547 0 0 0 0 0 0
Equipment Replacement Fund 213,072 81,870 0 0 0 0 0 0 0
Paramedic Special Tax 293,088 331,557 364,244 397,000 397,000 397,000 397,000 397,000 397,000
Ambulance Charges 590,180 682,682 679,848 703,000 703,000 703,000 703,000 703,000 703,000
-------------- -------------- -------------- -------------- -------------- -------------- -------------- -------------- -------------- --------------
Totals 4,489,218 4,342,939 4,074,784 4,067,400 4,067,400 3,979,600 4,263,700 4,263,700 4.8% 4,325,500
* 3,014,700 <55,000> = 2,959,700 2,942,400 ÷ 2,959,700 = 0.6% Increase
Medicare & Social Security 33,427 38,781 34,351 34,900 34,900 33,900 36,100 36,100 36,100
Fair Labor Standards Act
Overtime 41,158 42,511 45,797 46,000 46,000 47,000 48,000 48,000 48,000
-------------- -------------- -------------- -------------- -------------- -------------- -------------- -------------- -------------- --------------
Totals 74,585 81,292 80,148 80,900 80,900 80,900 84,100 84,100 N/A 84,100
2011-12Budget\Fire.xls F4
FIRE DEPARTMENT SUMMARY
(Reviewed by Council 06/29/11)
FINANCING SOURCES
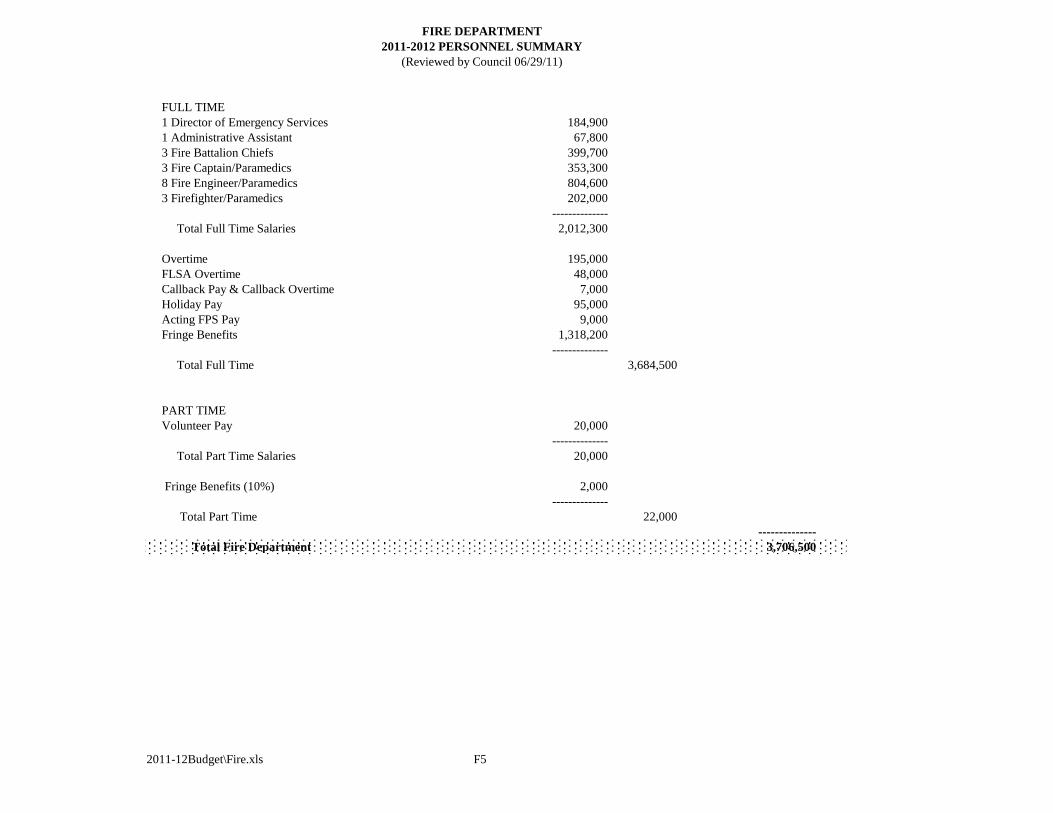
FULL TIME
1 Director of Emergency Services 184,900
1 Administrative Assistant 67,800
3 Fire Battalion Chiefs 399,700
3 Fire Captain/Paramedics 353,300
8 Fire Engineer/Paramedics 804,600
3 Firefighter/Paramedics 202,000
--------------
Total Full Time Salaries 2,012,300
Overtime 195,000
FLSA Overtime 48,000
Callback Pay & Callback Overtime 7,000
Holiday Pay 95,000
Acting FPS Pay 9,000
Fringe Benefits 1,318,200
--------------
Total Full Time 3,684,500
PART TIME
Volunteer Pay 20,000
--------------
Total Part Time Salaries 20,000
Fringe Benefits (10%) 2,000
--------------
Total Part Time 22,000
--------------
Total Fire Department 3,706,500
2011-12Budget\Fire.xls F5
FIRE DEPARTMENT
2011-2012 PERSONNEL SUMMARY
(Reviewed by Council 06/29/11)
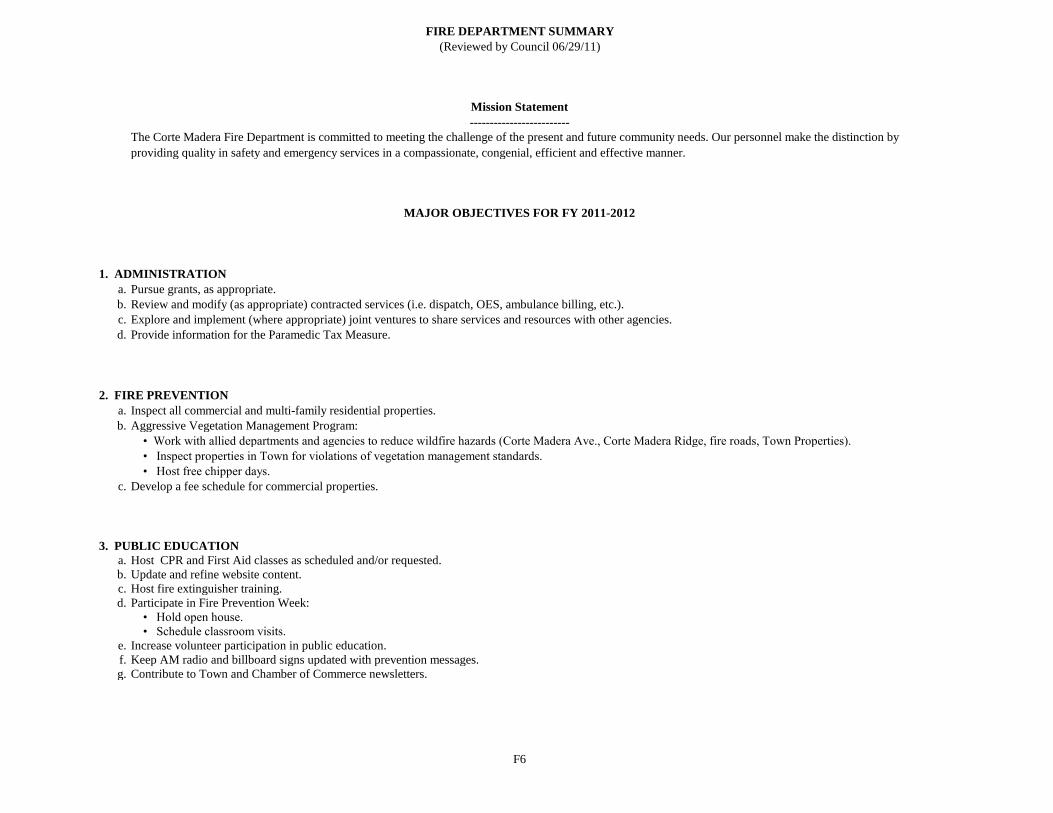
FIRE DEPARTMENT SUMMARY
(Reviewed by Council 06/29/11)
Mission Statement
-------------------------
The Corte Madera Fire Department is committed to meeting the challenge of the present and future community needs. Our personnel make the distinction by
providing quality in safety and emergency services in a compassionate, congenial, efficient and effective manner.
MAJOR OBJECTIVES FOR FY 2011-2012
1. ADMINISTRATION
a. Pursue grants, as appropriate.
b. Review and modify (as appropriate) contracted services (i.e. dispatch, OES, ambulance billing, etc.).
c. Explore and implement (where appropriate) joint ventures to share services and resources with other agencies.
d. Provide information for the Paramedic Tax Measure.
2. FIRE PREVENTION
a. Inspect all commercial and multi-family residential properties.
b. Aggressive Vegetation Management Program:
• Work with allied departments and agencies to reduce wildfire hazards (Corte Madera Ave., Corte Madera Ridge, fire roads, Town Properties).
• Inspect properties in Town for violations of vegetation management standards.
• Host free chipper days.
c. Develop a fee schedule for commercial properties.
3. PUBLIC EDUCATION
a. Host CPR and First Aid classes as scheduled and/or requested.
b. Update and refine website content.
c. Host fire extinguisher training.
d. Participate in Fire Prevention Week:
• Hold open house.
• Schedule classroom visits.
e. Increase volunteer participation in public education.
f. Keep AM radio and billboard signs updated with prevention messages.
g. Contribute to Town and Chamber of Commerce newsletters.
F6
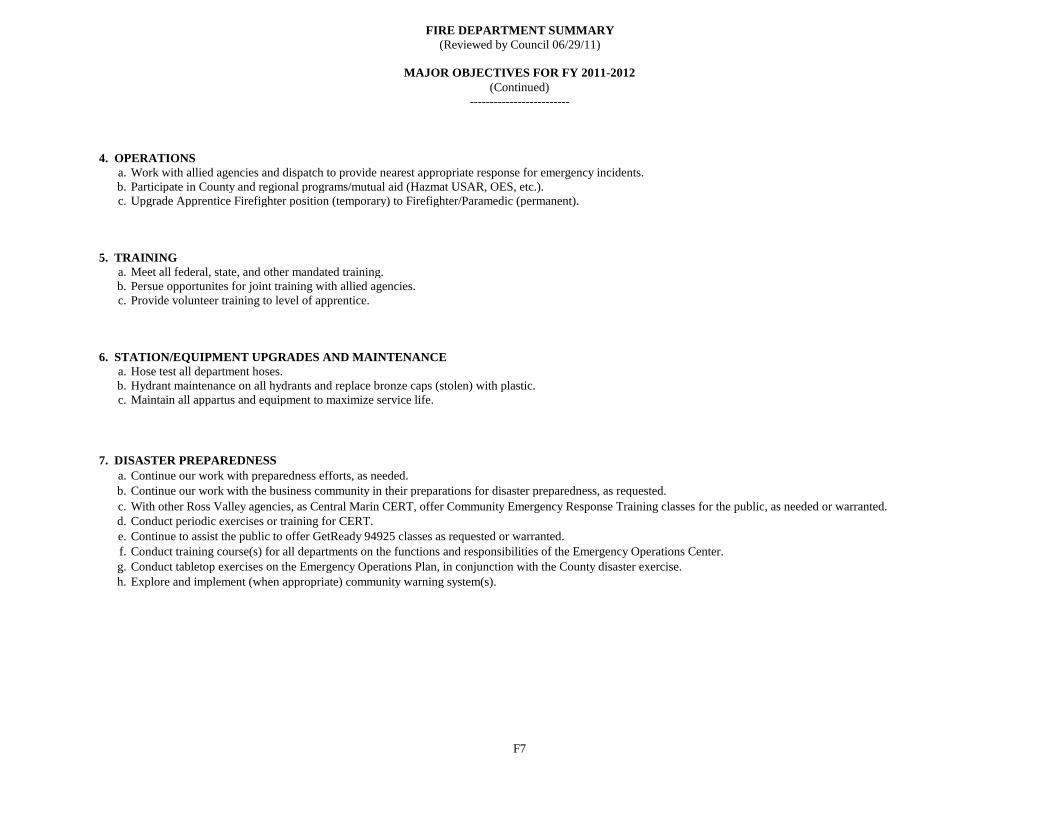
FIRE DEPARTMENT SUMMARY
(Reviewed by Council 06/29/11)
MAJOR OBJECTIVES FOR FY 2011-2012
(Continued)
-------------------------
4. OPERATIONS
a. Work with allied agencies and dispatch to provide nearest appropriate response for emergency incidents.
b. Participate in County and regional programs/mutual aid (Hazmat USAR, OES, etc.).
c. Upgrade Apprentice Firefighter position (temporary) to Firefighter/Paramedic (permanent).
5. TRAINING
a. Meet all federal, state, and other mandated training.
b. Persue opportunites for joint training with allied agencies.
c. Provide volunteer training to level of apprentice.
6. STATION/EQUIPMENT UPGRADES AND MAINTENANCE
a. Hose test all department hoses.
b. Hydrant maintenance on all hydrants and replace bronze caps (stolen) with plastic.
c. Maintain all appartus and equipment to maximize service life.
7. DISASTER PREPAREDNESS
a. Continue our work with preparedness efforts, as needed.
b. Continue our work with the business community in their preparations for disaster preparedness, as requested.
c. With other Ross Valley agencies, as Central Marin CERT, offer Community Emergency Response Training classes for the public, as needed or warranted.
d. Conduct periodic exercises or training for CERT.
e. Continue to assist the public to offer GetReady 94925 classes as requested or warranted.
f. Conduct training course(s) for all departments on the functions and responsibilities of the Emergency Operations Center.
g. Conduct tabletop exercises on the Emergency Operations Plan, in conjunction with the County disaster exercise.
h. Explore and implement (when appropriate) community warning system(s).
F7
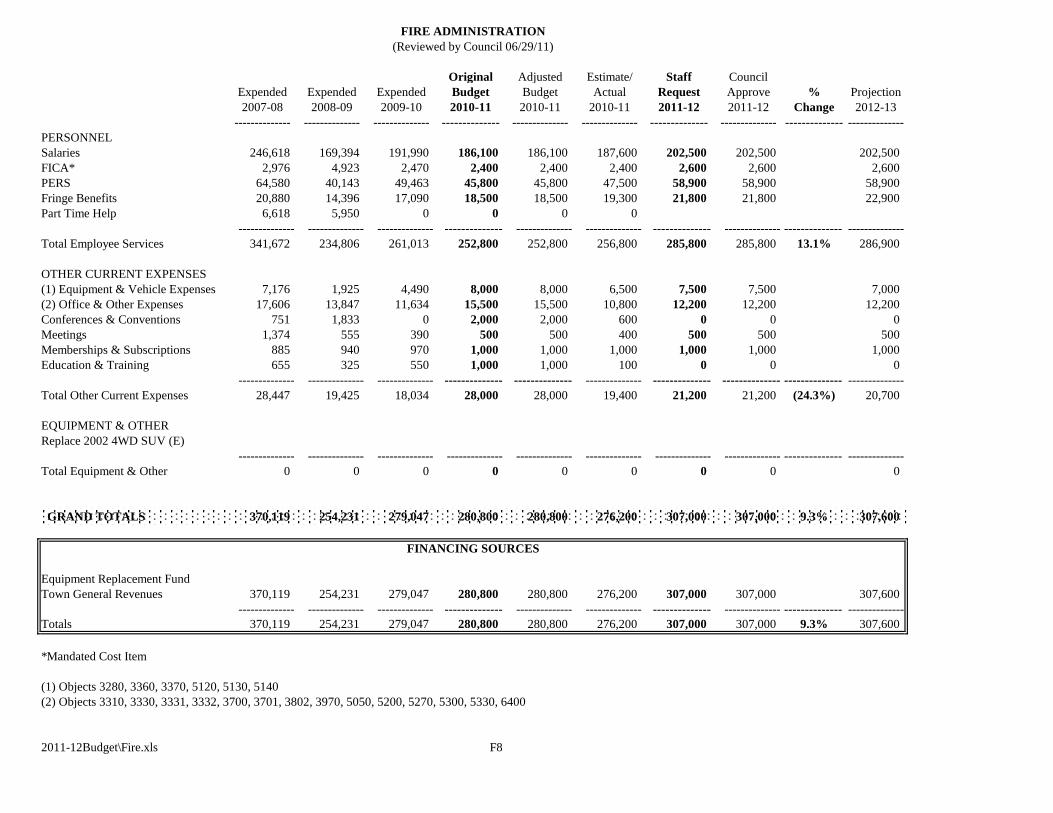
Original Adjusted Estimate/ Staff Council
Expended Expended Expended Budget Budget Actual Request Approve % Projection
2007-08 2008-09 2009-10 2010-11 2010-11 2010-11 2011-12 2011-12 Change 2012-13
-------------- -------------- -------------- -------------- -------------- -------------- -------------- -------------- -------------- --------------
PERSONNEL
Salaries 246,618 169,394 191,990 186,100 186,100 187,600 202,500 202,500 202,500
FICA* 2,976 4,923 2,470 2,400 2,400 2,400 2,600 2,600 2,600
PERS 64,580 40,143 49,463 45,800 45,800 47,500 58,900 58,900 58,900
Fringe Benefits 20,880 14,396 17,090 18,500 18,500 19,300 21,800 21,800 22,900
Part Time Help 6,618 5,950 0 0 0 0
-------------- -------------- -------------- -------------- -------------- -------------- -------------- -------------- -------------- --------------
Total Employee Services 341,672 234,806 261,013 252,800 252,800 256,800 285,800 285,800 13.1% 286,900
OTHER CURRENT EXPENSES
(1) Equipment & Vehicle Expenses 7,176 1,925 4,490 8,000 8,000 6,500 7,500 7,500 7,000
(2) Office & Other Expenses 17,606 13,847 11,634 15,500 15,500 10,800 12,200 12,200 12,200
Conferences & Conventions 751 1,833 0 2,000 2,000 600 0 0 0
Meetings 1,374 555 390 500 500 400 500 500 500
Memberships & Subscriptions 885 940 970 1,000 1,000 1,000 1,000 1,000 1,000
Education & Training 655 325 550 1,000 1,000 100 0 0 0
-------------- -------------- -------------- -------------- -------------- -------------- -------------- -------------- -------------- --------------
Total Other Current Expenses 28,447 19,425 18,034 28,000 28,000 19,400 21,200 21,200 (24.3%) 20,700
EQUIPMENT & OTHER
Replace 2002 4WD SUV (E)
-------------- -------------- -------------- -------------- -------------- -------------- -------------- -------------- -------------- --------------
Total Equipment & Other 0 0 0 0 0 0 0 0 0
GRAND TOTALS 370,119 254,231 279,047 280,800 280,800 276,200 307,000 307,000 9.3% 307,600
FINANCING SOURCES
Equipment Replacement Fund
Town General Revenues 370,119 254,231 279,047 280,800 280,800 276,200 307,000 307,000 307,600
-------------- -------------- -------------- -------------- -------------- -------------- -------------- -------------- -------------- --------------
Totals 370,119 254,231 279,047 280,800 280,800 276,200 307,000 307,000 9.3% 307,600
*Mandated Cost Item
(1) Objects 3280, 3360, 3370, 5120, 5130, 5140
(2) Objects 3310, 3330, 3331, 3332, 3700, 3701, 3802, 3970, 5050, 5200, 5270, 5300, 5330, 6400
2011-12Budget\Fire.xls F8
FIRE ADMINISTRATION
(Reviewed by Council 06/29/11)
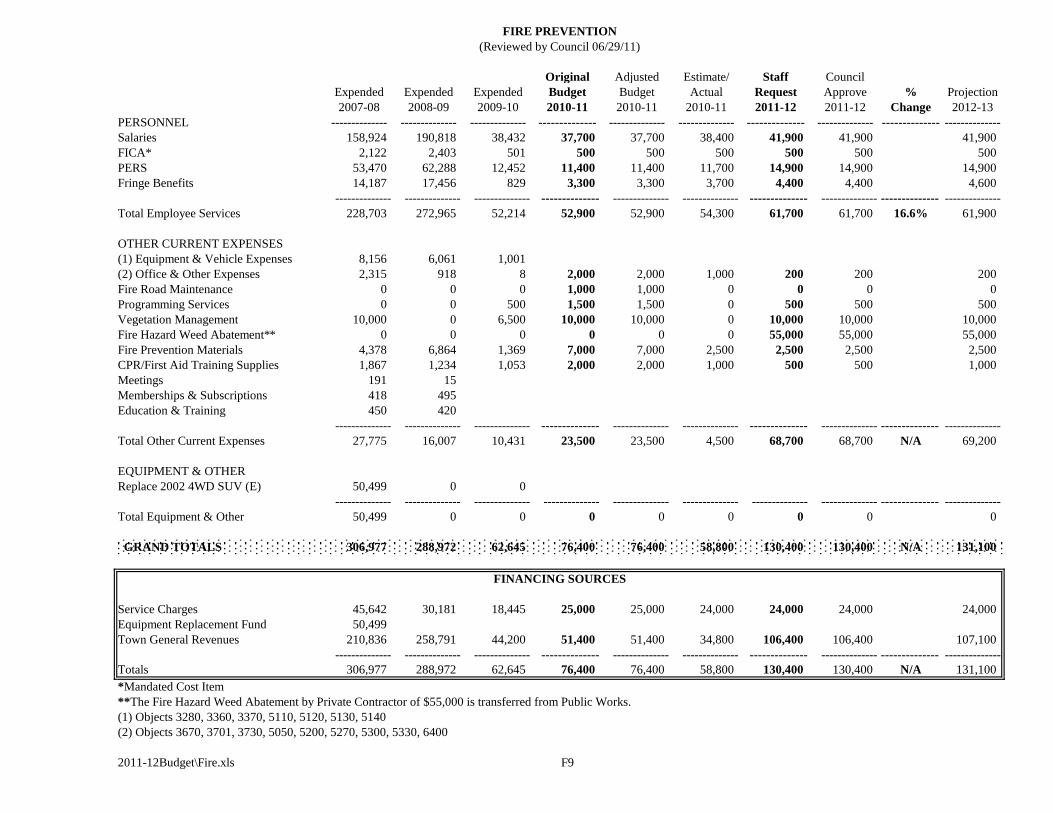
Original Adjusted Estimate/ Staff Council
Expended Expended Expended Budget Budget Actual Request Approve % Projection
2007-08 2008-09 2009-10 2010-11 2010-11 2010-11 2011-12 2011-12 Change 2012-13
PERSONNEL -------------- -------------- -------------- -------------- -------------- -------------- -------------- -------------- -------------- --------------
Salaries 158,924 190,818 38,432 37,700 37,700 38,400 41,900 41,900 41,900
FICA* 2,122 2,403 501 500 500 500 500 500 500
PERS 53,470 62,288 12,452 11,400 11,400 11,700 14,900 14,900 14,900
Fringe Benefits 14,187 17,456 829 3,300 3,300 3,700 4,400 4,400 4,600
-------------- -------------- -------------- -------------- -------------- -------------- -------------- -------------- -------------- --------------
Total Employee Services 228,703 272,965 52,214 52,900 52,900 54,300 61,700 61,700 16.6% 61,900
OTHER CURRENT EXPENSES
(1) Equipment & Vehicle Expenses 8,156 6,061 1,001
(2) Office & Other Expenses 2,315 918 8 2,000 2,000 1,000 200 200 200
Fire Road Maintenance 0 0 0 1,000 1,000 0 0 0 0
Programming Services 0 0 500 1,500 1,500 0 500 500 500
Vegetation Management 10,000 0 6,500 10,000 10,000 0 10,000 10,000 10,000
Fire Hazard Weed Abatement** 0 0 0 0 0 0 55,000 55,000 55,000
Fire Prevention Materials 4,378 6,864 1,369 7,000 7,000 2,500 2,500 2,500 2,500
CPR/First Aid Training Supplies 1,867 1,234 1,053 2,000 2,000 1,000 500 500 1,000
Meetings 191 15
Memberships & Subscriptions 418 495
Education & Training 450 420
-------------- -------------- -------------- -------------- -------------- -------------- -------------- -------------- -------------- --------------
Total Other Current Expenses 27,775 16,007 10,431 23,500 23,500 4,500 68,700 68,700 N/A 69,200
EQUIPMENT & OTHER
Replace 2002 4WD SUV (E) 50,499 0 0
-------------- -------------- -------------- -------------- -------------- -------------- -------------- -------------- -------------- --------------
Total Equipment & Other 50,499 0 0 0 0 0 0 0 0
GRAND TOTALS 306,977 288,972 62,645 76,400 76,400 58,800 130,400 130,400 N/A 131,100
FINANCING SOURCES
Service Charges 45,642 30,181 18,445 25,000 25,000 24,000 24,000 24,000 24,000
Equipment Replacement Fund 50,499
Town General Revenues 210,836 258,791 44,200 51,400 51,400 34,800 106,400 106,400 107,100
-------------- -------------- -------------- -------------- -------------- -------------- -------------- -------------- -------------- --------------
Totals 306,977 288,972 62,645 76,400 76,400 58,800 130,400 130,400 N/A 131,100
*Mandated Cost Item
**The Fire Hazard Weed Abatement by Private Contractor of $55,000 is transferred from Public Works.
(1) Objects 3280, 3360, 3370, 5110, 5120, 5130, 5140
(2) Objects 3670, 3701, 3730, 5050, 5200, 5270, 5300, 5330, 6400
2011-12Budget\Fire.xls F9
FIRE PREVENTION
(Reviewed by Council 06/29/11)
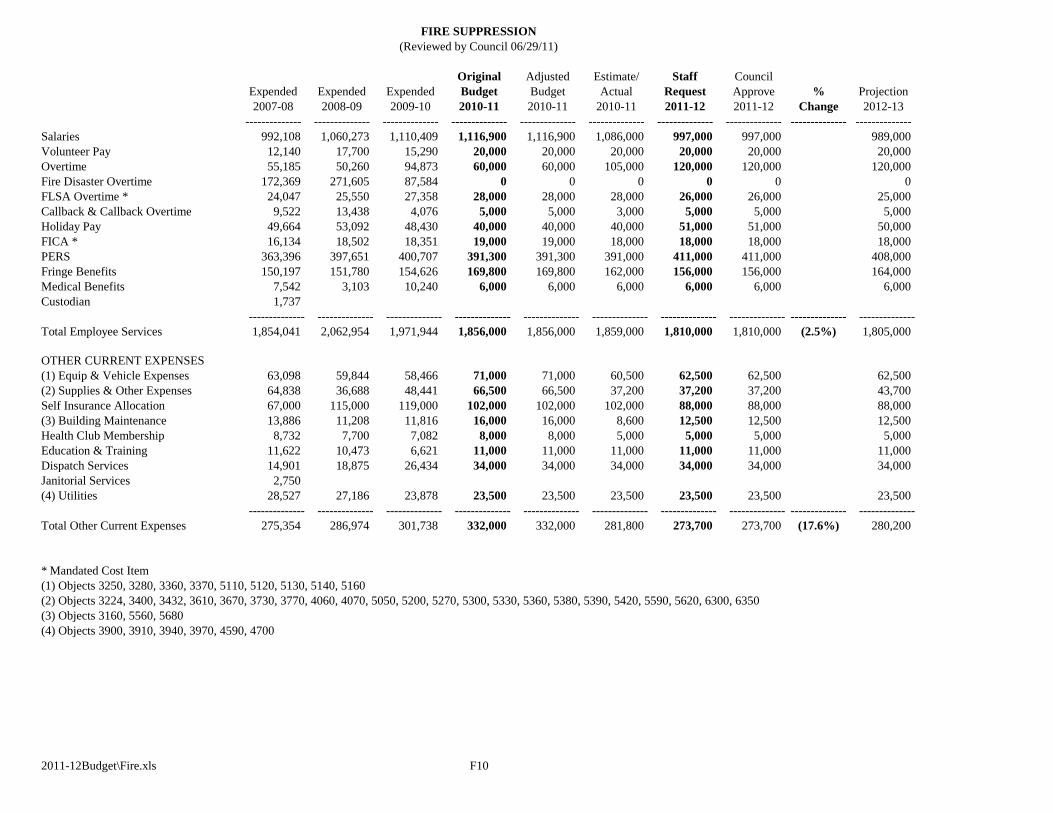
Original Adjusted Estimate/ Staff Council
Expended Expended Expended Budget Budget Actual Request Approve % Projection
2007-08 2008-09 2009-10 2010-11 2010-11 2010-11 2011-12 2011-12 Change 2012-13
-------------- -------------- -------------- -------------- -------------- -------------- -------------- -------------- -------------- --------------
Salaries 992,108 1,060,273 1,110,409 1,116,900 1,116,900 1,086,000 997,000 997,000 989,000
Volunteer Pay 12,140 17,700 15,290 20,000 20,000 20,000 20,000 20,000 20,000
Overtime 55,185 50,260 94,873 60,000 60,000 105,000 120,000 120,000 120,000
Fire Disaster Overtime 172,369 271,605 87,584 0 0 0 0 0 0
FLSA Overtime * 24,047 25,550 27,358 28,000 28,000 28,000 26,000 26,000 25,000
Callback & Callback Overtime 9,522 13,438 4,076 5,000 5,000 3,000 5,000 5,000 5,000
Holiday Pay 49,664 53,092 48,430 40,000 40,000 40,000 51,000 51,000 50,000
FICA * 16,134 18,502 18,351 19,000 19,000 18,000 18,000 18,000 18,000
PERS 363,396 397,651 400,707 391,300 391,300 391,000 411,000 411,000 408,000
Fringe Benefits 150,197 151,780 154,626 169,800 169,800 162,000 156,000 156,000 164,000
Medical Benefits 7,542 3,103 10,240 6,000 6,000 6,000 6,000 6,000 6,000
Custodian 1,737
-------------- -------------- -------------- -------------- -------------- -------------- -------------- -------------- -------------- --------------
Total Employee Services 1,854,041 2,062,954 1,971,944 1,856,000 1,856,000 1,859,000 1,810,000 1,810,000 (2.5%) 1,805,000
OTHER CURRENT EXPENSES
(1) Equip & Vehicle Expenses 63,098 59,844 58,466 71,000 71,000 60,500 62,500 62,500 62,500
(2) Supplies & Other Expenses 64,838 36,688 48,441 66,500 66,500 37,200 37,200 37,200 43,700
Self Insurance Allocation 67,000 115,000 119,000 102,000 102,000 102,000 88,000 88,000 88,000
(3) Building Maintenance 13,886 11,208 11,816 16,000 16,000 8,600 12,500 12,500 12,500
Health Club Membership 8,732 7,700 7,082 8,000 8,000 5,000 5,000 5,000 5,000
Education & Training 11,622 10,473 6,621 11,000 11,000 11,000 11,000 11,000 11,000
Dispatch Services 14,901 18,875 26,434 34,000 34,000 34,000 34,000 34,000 34,000
Janitorial Services 2,750
(4) Utilities 28,527 27,186 23,878 23,500 23,500 23,500 23,500 23,500 23,500
-------------- -------------- -------------- -------------- -------------- -------------- -------------- -------------- -------------- --------------
Total Other Current Expenses 275,354 286,974 301,738 332,000 332,000 281,800 273,700 273,700 (17.6%) 280,200
* Mandated Cost Item
(1) Objects 3250, 3280, 3360, 3370, 5110, 5120, 5130, 5140, 5160
(2) Objects 3224, 3400, 3432, 3610, 3670, 3730, 3770, 4060, 4070, 5050, 5200, 5270, 5300, 5330, 5360, 5380, 5390, 5420, 5590, 5620, 6300, 6350
(3) Objects 3160, 5560, 5680
(4) Objects 3900, 3910, 3940, 3970, 4590, 4700
2011-12Budget\Fire.xls F10
FIRE SUPPRESSION
(Reviewed by Council 06/29/11)
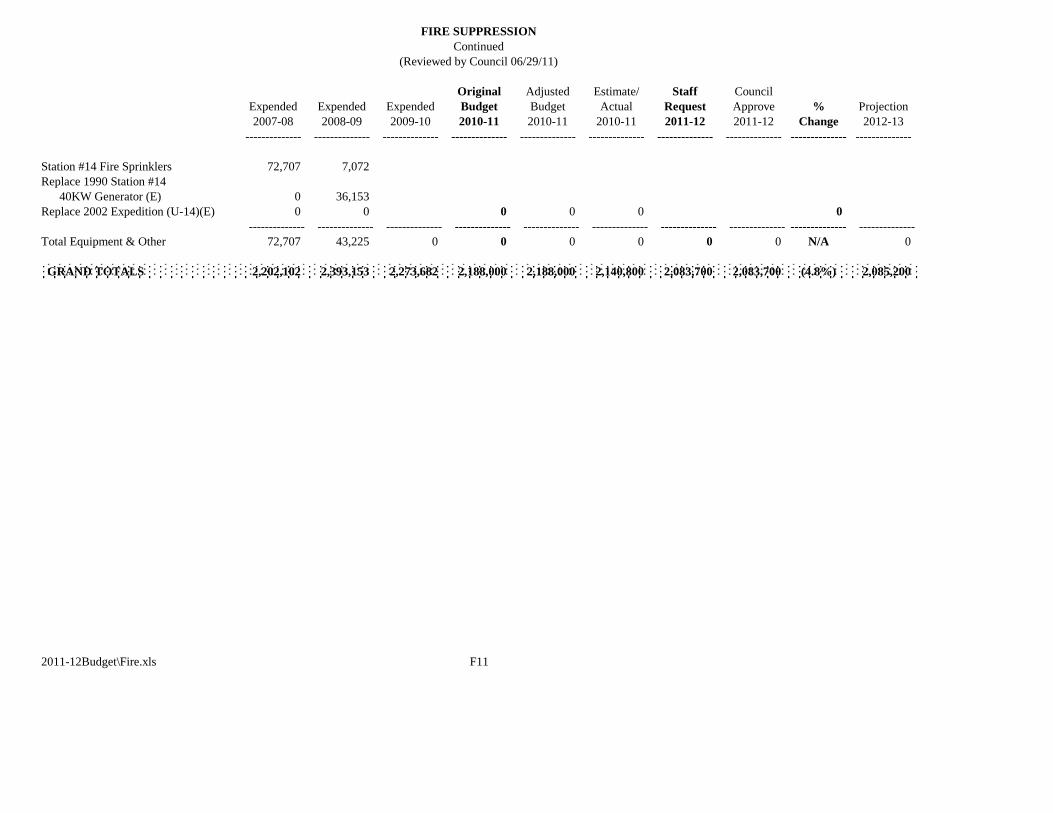
Original Adjusted Estimate/ Staff Council
Expended Expended Expended Budget Budget Actual Request Approve % Projection
2007-08 2008-09 2009-10 2010-11 2010-11 2010-11 2011-12 2011-12 Change 2012-13
-------------- -------------- -------------- -------------- -------------- -------------- -------------- -------------- -------------- --------------
Station #14 Fire Sprinklers 72,707 7,072
Replace 1990 Station #14
40KW Generator (E) 0 36,153
Replace 2002 Expedition (U-14)(E) 0 0 0 0 0 0
-------------- -------------- -------------- -------------- -------------- -------------- -------------- -------------- -------------- --------------
Total Equipment & Other 72,707 43,225 0 0 0 0 0 0 N/A 0
GRAND TOTALS 2,202,102 2,393,153 2,273,682 2,188,000 2,188,000 2,140,800 2,083,700 2,083,700 (4.8%) 2,085,200
2011-12Budget\Fire.xls F11
(Reviewed by Council 06/29/11)
FIRE SUPPRESSION
Continued
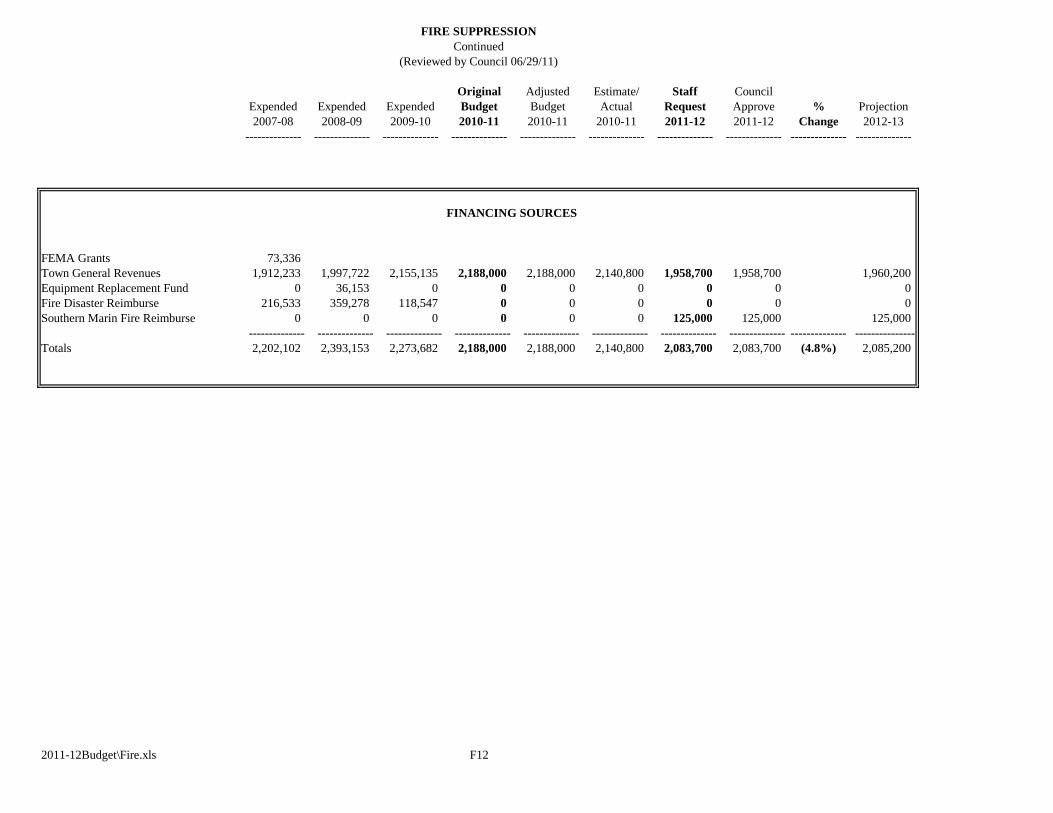
Original Adjusted Estimate/ Staff Council
Expended Expended Expended Budget Budget Actual Request Approve % Projection
2007-08 2008-09 2009-10 2010-11 2010-11 2010-11 2011-12 2011-12 Change 2012-13
-------------- -------------- -------------- -------------- -------------- -------------- -------------- -------------- -------------- --------------
FINANCING SOURCES
FEMA Grants 73,336
Town General Revenues 1,912,233 1,997,722 2,155,135 2,188,000 2,188,000 2,140,800 1,958,700 1,958,700 1,960,200
Equipment Replacement Fund 0 36,153 0 0 0 0 0 0 0
Fire Disaster Reimburse 216,533 359,278 118,547 0 0 0 0 0 0
Southern Marin Fire Reimburse 0 0 0 0 0 0 125,000 125,000 125,000
-------------- -------------- -------------- -------------- -------------- -------------- -------------- -------------- -------------- ---------------
Totals 2,202,102 2,393,153 2,273,682 2,188,000 2,188,000 2,140,800 2,083,700 2,083,700 (4.8%) 2,085,200
2011-12Budget\Fire.xls F12
FIRE SUPPRESSION
Continued
(Reviewed by Council 06/29/11)
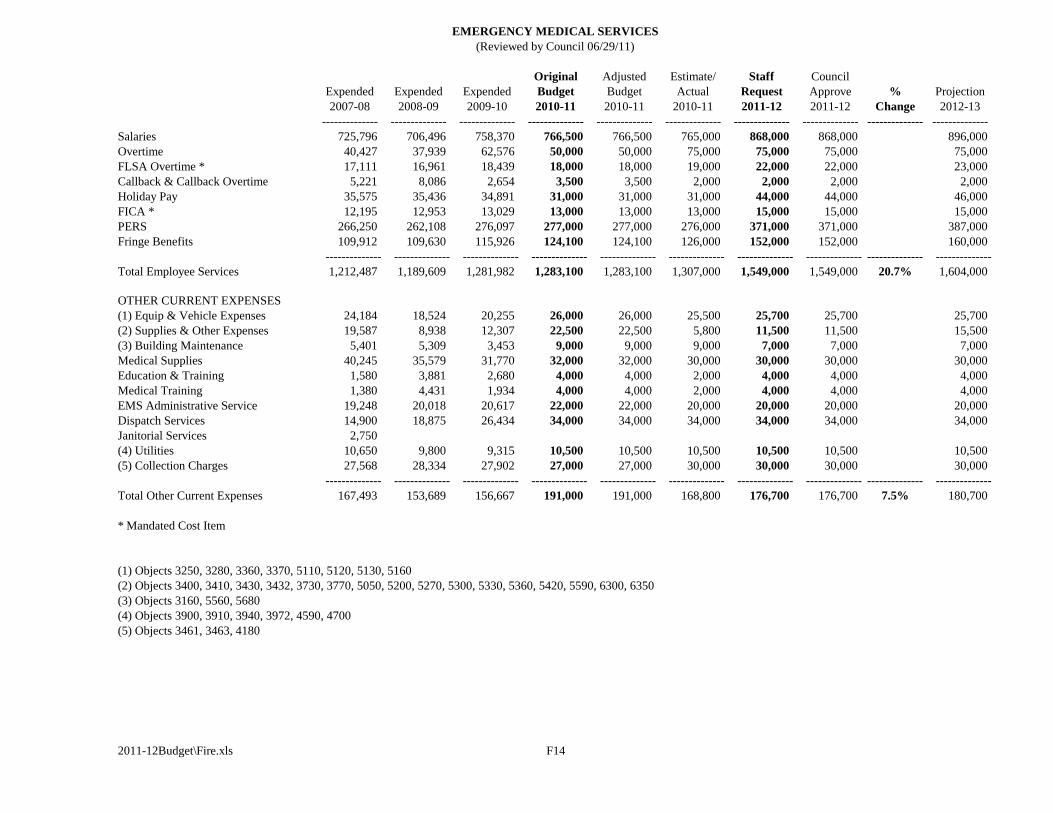
Original Adjusted Estimate/ Staff Council
Expended Expended Expended Budget Budget Actual Request Approve % Projection
2007-08 2008-09 2009-10 2010-11 2010-11 2010-11 2011-12 2011-12 Change 2012-13
-------------- -------------- -------------- -------------- -------------- -------------- -------------- -------------- -------------- --------------
Salaries 725,796 706,496 758,370 766,500 766,500 765,000 868,000 868,000 896,000
Overtime 40,427 37,939 62,576 50,000 50,000 75,000 75,000 75,000 75,000
FLSA Overtime * 17,111 16,961 18,439 18,000 18,000 19,000 22,000 22,000 23,000
Callback & Callback Overtime 5,221 8,086 2,654 3,500 3,500 2,000 2,000 2,000 2,000
Holiday Pay 35,575 35,436 34,891 31,000 31,000 31,000 44,000 44,000 46,000
FICA * 12,195 12,953 13,029 13,000 13,000 13,000 15,000 15,000 15,000
PERS 266,250 262,108 276,097 277,000 277,000 276,000 371,000 371,000 387,000
Fringe Benefits 109,912 109,630 115,926 124,100 124,100 126,000 152,000 152,000 160,000
-------------- -------------- -------------- -------------- -------------- -------------- -------------- -------------- -------------- --------------
Total Employee Services 1,212,487 1,189,609 1,281,982 1,283,100 1,283,100 1,307,000 1,549,000 1,549,000 20.7% 1,604,000
OTHER CURRENT EXPENSES
(1) Equip & Vehicle Expenses 24,184 18,524 20,255 26,000 26,000 25,500 25,700 25,700 25,700
(2) Supplies & Other Expenses 19,587 8,938 12,307 22,500 22,500 5,800 11,500 11,500 15,500
(3) Building Maintenance 5,401 5,309 3,453 9,000 9,000 9,000 7,000 7,000 7,000
Medical Supplies 40,245 35,579 31,770 32,000 32,000 30,000 30,000 30,000 30,000
Education & Training 1,580 3,881 2,680 4,000 4,000 2,000 4,000 4,000 4,000
Medical Training 1,380 4,431 1,934 4,000 4,000 2,000 4,000 4,000 4,000
EMS Administrative Service 19,248 20,018 20,617 22,000 22,000 20,000 20,000 20,000 20,000
Dispatch Services 14,900 18,875 26,434 34,000 34,000 34,000 34,000 34,000 34,000
Janitorial Services 2,750
(4) Utilities 10,650 9,800 9,315 10,500 10,500 10,500 10,500 10,500 10,500
(5) Collection Charges 27,568 28,334 27,902 27,000 27,000 30,000 30,000 30,000 30,000
-------------- -------------- -------------- -------------- -------------- -------------- -------------- -------------- -------------- --------------
Total Other Current Expenses 167,493 153,689 156,667 191,000 191,000 168,800 176,700 176,700 7.5% 180,700
* Mandated Cost Item
(1) Objects 3250, 3280, 3360, 3370, 5110, 5120, 5130, 5160
(2) Objects 3400, 3410, 3430, 3432, 3730, 3770, 5050, 5200, 5270, 5300, 5330, 5360, 5420, 5590, 6300, 6350
(3) Objects 3160, 5560, 5680
(4) Objects 3900, 3910, 3940, 3972, 4590, 4700
(5) Objects 3461, 3463, 4180
2011-12Budget\Fire.xls F14
EMERGENCY MEDICAL SERVICES
(Reviewed by Council 06/29/11)
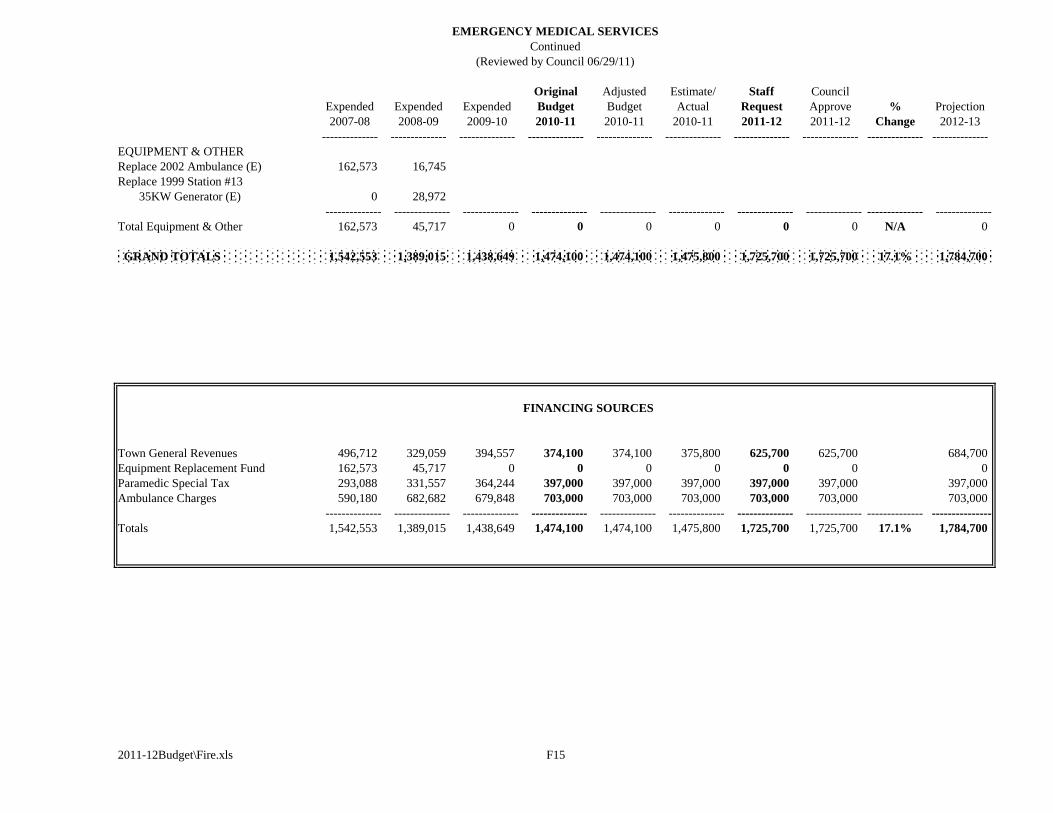
Original Adjusted Estimate/ Staff Council
Expended Expended Expended Budget Budget Actual Request Approve % Projection
2007-08 2008-09 2009-10 2010-11 2010-11 2010-11 2011-12 2011-12 Change 2012-13
-------------- -------------- -------------- -------------- -------------- -------------- -------------- -------------- -------------- --------------
EQUIPMENT & OTHER
Replace 2002 Ambulance (E) 162,573 16,745
Replace 1999 Station #13
35KW Generator (E) 0 28,972
-------------- -------------- -------------- -------------- -------------- -------------- -------------- -------------- -------------- --------------
Total Equipment & Other 162,573 45,717 0 0 0 0 0 0 N/A 0
GRAND TOTALS 1,542,553 1,389,015 1,438,649 1,474,100 1,474,100 1,475,800 1,725,700 1,725,700 17.1% 1,784,700
FINANCING SOURCES
Town General Revenues 496,712 329,059 394,557 374,100 374,100 375,800 625,700 625,700 684,700
Equipment Replacement Fund 162,573 45,717 0 0 0 0 0 0 0
Paramedic Special Tax 293,088 331,557 364,244 397,000 397,000 397,000 397,000 397,000 397,000
Ambulance Charges 590,180 682,682 679,848 703,000 703,000 703,000 703,000 703,000 703,000
-------------- -------------- -------------- -------------- -------------- -------------- -------------- -------------- -------------- ---------------
Totals 1,542,553 1,389,015 1,438,649 1,474,100 1,474,100 1,475,800 1,725,700 1,725,700 17.1% 1,784,700
2011-12Budget\Fire.xls F15
(Reviewed by Council 06/29/11)
EMERGENCY MEDICAL SERVICES
Continued
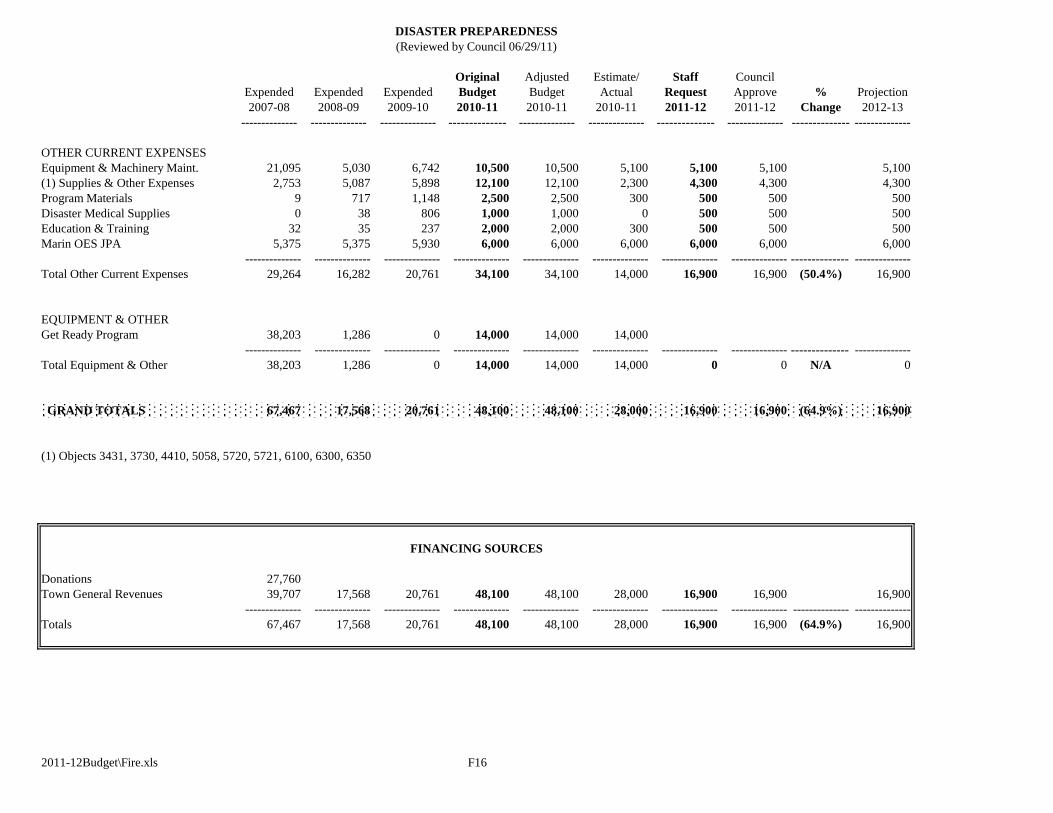
Original Adjusted Estimate/ Staff Council
Expended Expended Expended Budget Budget Actual Request Approve % Projection
2007-08 2008-09 2009-10 2010-11 2010-11 2010-11 2011-12 2011-12 Change 2012-13
-------------- -------------- -------------- -------------- -------------- -------------- -------------- -------------- -------------- --------------
OTHER CURRENT EXPENSES
Equipment & Machinery Maint. 21,095 5,030 6,742 10,500 10,500 5,100 5,100 5,100 5,100
(1) Supplies & Other Expenses 2,753 5,087 5,898 12,100 12,100 2,300 4,300 4,300 4,300
Program Materials 9 717 1,148 2,500 2,500 300 500 500 500
Disaster Medical Supplies 0 38 806 1,000 1,000 0 500 500 500
Education & Training 32 35 237 2,000 2,000 300 500 500 500
Marin OES JPA 5,375 5,375 5,930 6,000 6,000 6,000 6,000 6,000 6,000
-------------- -------------- -------------- -------------- -------------- -------------- -------------- -------------- -------------- --------------
Total Other Current Expenses 29,264 16,282 20,761 34,100 34,100 14,000 16,900 16,900 (50.4%) 16,900
EQUIPMENT & OTHER
Get Ready Program 38,203 1,286 0 14,000 14,000 14,000
-------------- -------------- -------------- -------------- -------------- -------------- -------------- -------------- -------------- --------------
Total Equipment & Other 38,203 1,286 0 14,000 14,000 14,000 0 0 N/A 0
GRAND TOTALS 67,467 17,568 20,761 48,100 48,100 28,000 16,900 16,900 (64.9%) 16,900
(1) Objects 3431, 3730, 4410, 5058, 5720, 5721, 6100, 6300, 6350
FINANCING SOURCES
Donations 27,760
Town General Revenues 39,707 17,568 20,761 48,100 48,100 28,000 16,900 16,900 16,900
-------------- -------------- -------------- -------------- -------------- -------------- -------------- -------------- -------------- --------------
Totals 67,467 17,568 20,761 48,100 48,100 28,000 16,900 16,900 (64.9%) 16,900
2011-12Budget\Fire.xls F16
DISASTER PREPAREDNESS
(Reviewed by Council 06/29/11)

BLANK PAGE
2011-12Budget\PubWorks.xls PW1

BLANK PAGE
2011-12Budget\PubWorks.xls PW2

BLANK PAGE
2011-12Budget\PubWorks.xls PW3
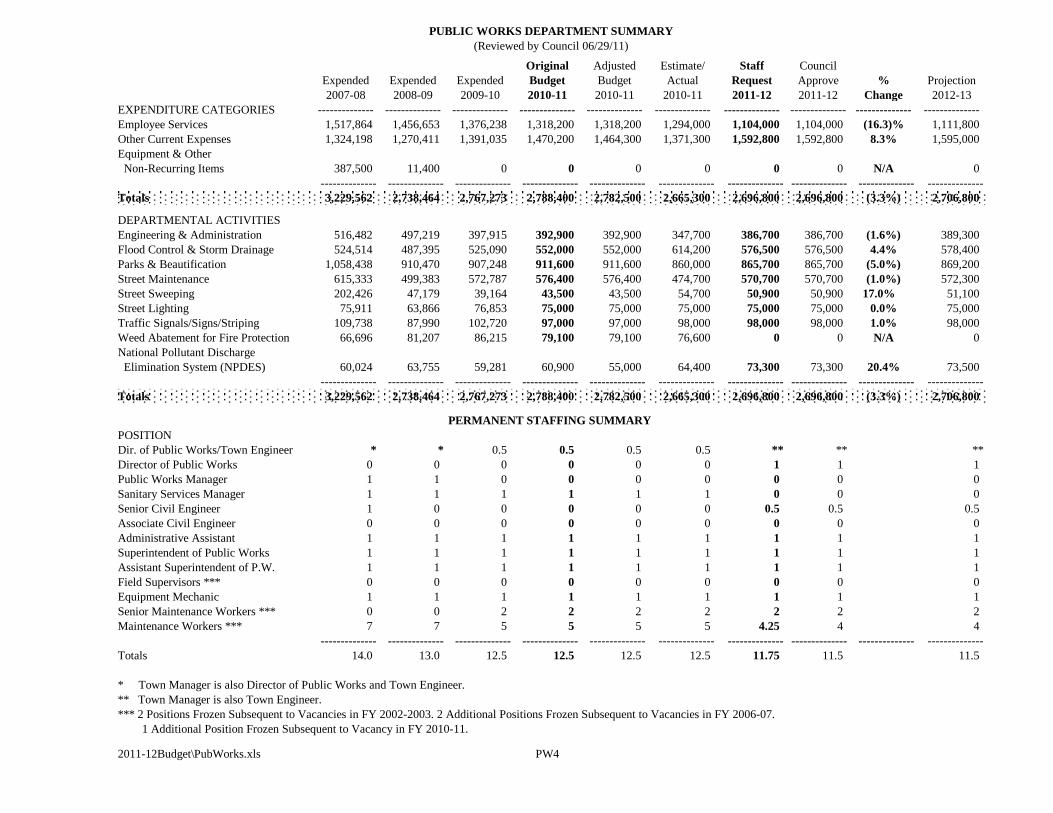
Original Adjusted Estimate/ Staff Council
Expended Expended Expended Budget Budget Actual Request Approve % Projection
2007-08 2008-09 2009-10 2010-11 2010-11 2010-11 2011-12 2011-12 Change 2012-13
EXPENDITURE CATEGORIES -------------- -------------- -------------- -------------- -------------- -------------- -------------- -------------- -------------- --------------
Employee Services 1,517,864 1,456,653 1,376,238 1,318,200 1,318,200 1,294,000 1,104,000 1,104,000 (16.3)% 1,111,800
Other Current Expenses 1,324,198 1,270,411 1,391,035 1,470,200 1,464,300 1,371,300 1,592,800 1,592,800 8.3% 1,595,000
Equipment & Other
Non-Recurring Items 387,500 11,400 0 0 0 0 0 0 N/A 0
-------------- -------------- -------------- -------------- -------------- -------------- -------------- -------------- -------------- --------------
Totals 3,229,562 2,738,464 2,767,273 2,788,400 2,782,500 2,665,300 2,696,800 2,696,800 (3.3%) 2,706,800
DEPARTMENTAL ACTIVITIES
Engineering & Administration 516,482 497,219 397,915 392,900 392,900 347,700 386,700 386,700 (1.6%) 389,300
Flood Control & Storm Drainage 524,514 487,395 525,090 552,000 552,000 614,200 576,500 576,500 4.4% 578,400
Parks & Beautification 1,058,438 910,470 907,248 911,600 911,600 860,000 865,700 865,700 (5.0%) 869,200
Street Maintenance 615,333 499,383 572,787 576,400 576,400 474,700 570,700 570,700 (1.0%) 572,300
Street Sweeping 202,426 47,179 39,164 43,500 43,500 54,700 50,900 50,900 17.0% 51,100
Street Lighting 75,911 63,866 76,853 75,000 75,000 75,000 75,000 75,000 0.0% 75,000
Traffic Signals/Signs/Striping 109,738 87,990 102,720 97,000 97,000 98,000 98,000 98,000 1.0% 98,000
Weed Abatement for Fire Protection 66,696 81,207 86,215 79,100 79,100 76,600 0 0 N/A 0
National Pollutant Discharge
Elimination System (NPDES) 60,024 63,755 59,281 60,900 55,000 64,400 73,300 73,300 20.4% 73,500
-------------- -------------- -------------- -------------- -------------- -------------- -------------- -------------- -------------- --------------
Totals 3,229,562 2,738,464 2,767,273 2,788,400 2,782,500 2,665,300 2,696,800 2,696,800 (3.3%) 2,706,800
PERMANENT STAFFING SUMMARY
POSITION
Dir. of Public Works/Town Engineer * * 0.5 0.5 0.5 0.5 ** ** **
Director of Public Works 0 0 0 0 0 0 1 1 1
Public Works Manager 1 1 0 0 0 0 0 0 0
Sanitary Services Manager 1 1 1 1 1 1 0 0 0
Senior Civil Engineer 1 0 0 0 0 0 0.5 0.5 0.5
Associate Civil Engineer 0 0 0 0 0 0 0 0 0
Administrative Assistant 1 1 1 1 1 1 1 1 1
Superintendent of Public Works 1 1 1 1 1 1 1 1 1
Assistant Superintendent of P.W. 1 1 1 1 1 1 1 1 1
Field Supervisors *** 0 0 0 0 0 0 0 0 0
Equipment Mechanic 1 1 1 1 1 1 1 1 1
Senior Maintenance Workers *** 0 0 2 2 2 2 2 2 2
Maintenance Workers *** 7 7 5 5 5 5 4.25 4 4
-------------- -------------- -------------- -------------- -------------- -------------- -------------- -------------- -------------- --------------
Totals 14.0 13.0 12.5 12.5 12.5 12.5 11.75 11.5 11.5
* Town Manager is also Director of Public Works and Town Engineer.
** Town Manager is also Town Engineer.
*** 2 Positions Frozen Subsequent to Vacancies in FY 2002-2003. 2 Additional Positions Frozen Subsequent to Vacancies in FY 2006-07.
1 Additional Position Frozen Subsequent to Vacancy in FY 2010-11.
2011-12Budget\PubWorks.xls PW4
PUBLIC WORKS DEPARTMENT SUMMARY
(Reviewed by Council 06/29/11)
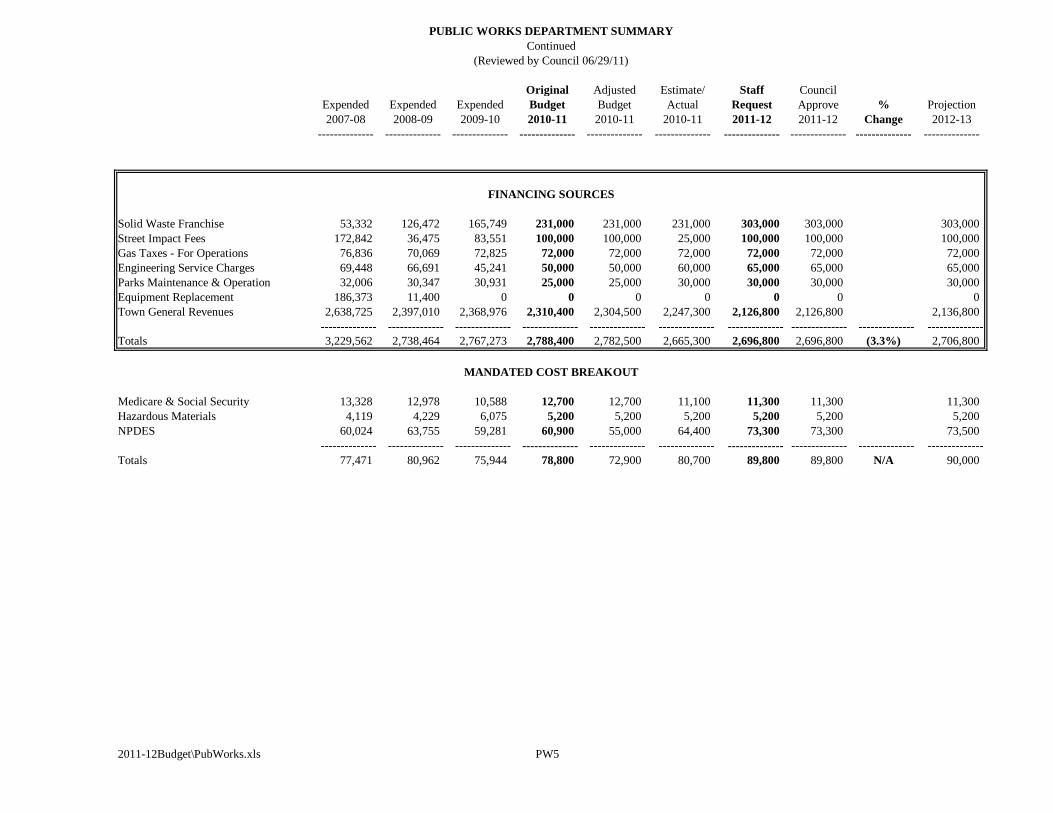
PUBLIC WORKS DEPARTMENT SUMMARY
Continued
Original Adjusted Estimate/ Staff Council
Expended Expended Expended Budget Budget Actual Request Approve % Projection
2007-08 2008-09 2009-10 2010-11 2010-11 2010-11 2011-12 2011-12 Change 2012-13
-------------- -------------- -------------- -------------- -------------- -------------- -------------- -------------- -------------- --------------
FINANCING SOURCES
Solid Waste Franchise 53,332 126,472 165,749 231,000 231,000 231,000 303,000 303,000 303,000
Street Impact Fees 172,842 36,475 83,551 100,000 100,000 25,000 100,000 100,000 100,000
Gas Taxes - For Operations 76,836 70,069 72,825 72,000 72,000 72,000 72,000 72,000 72,000
Engineering Service Charges 69,448 66,691 45,241 50,000 50,000 60,000 65,000 65,000 65,000
Parks Maintenance & Operation 32,006 30,347 30,931 25,000 25,000 30,000 30,000 30,000 30,000
Equipment Replacement 186,373 11,400 0 0 0 0 0 0 0
Town General Revenues 2,638,725 2,397,010 2,368,976 2,310,400 2,304,500 2,247,300 2,126,800 2,126,800 2,136,800
-------------- -------------- -------------- -------------- -------------- -------------- -------------- -------------- -------------- --------------
Totals 3,229,562 2,738,464 2,767,273 2,788,400 2,782,500 2,665,300 2,696,800 2,696,800 (3.3%) 2,706,800
MANDATED COST BREAKOUT
Medicare & Social Security 13,328 12,978 10,588 12,700 12,700 11,100 11,300 11,300 11,300
Hazardous Materials 4,119 4,229 6,075 5,200 5,200 5,200 5,200 5,200 5,200
NPDES 60,024 63,755 59,281 60,900 55,000 64,400 73,300 73,300 73,500
-------------- -------------- -------------- -------------- -------------- -------------- -------------- -------------- -------------- --------------
Totals 77,471 80,962 75,944 78,800 72,900 80,700 89,800 89,800 N/A 90,000
2011-12Budget\PubWorks.xls PW5
(Reviewed by Council 06/29/11)
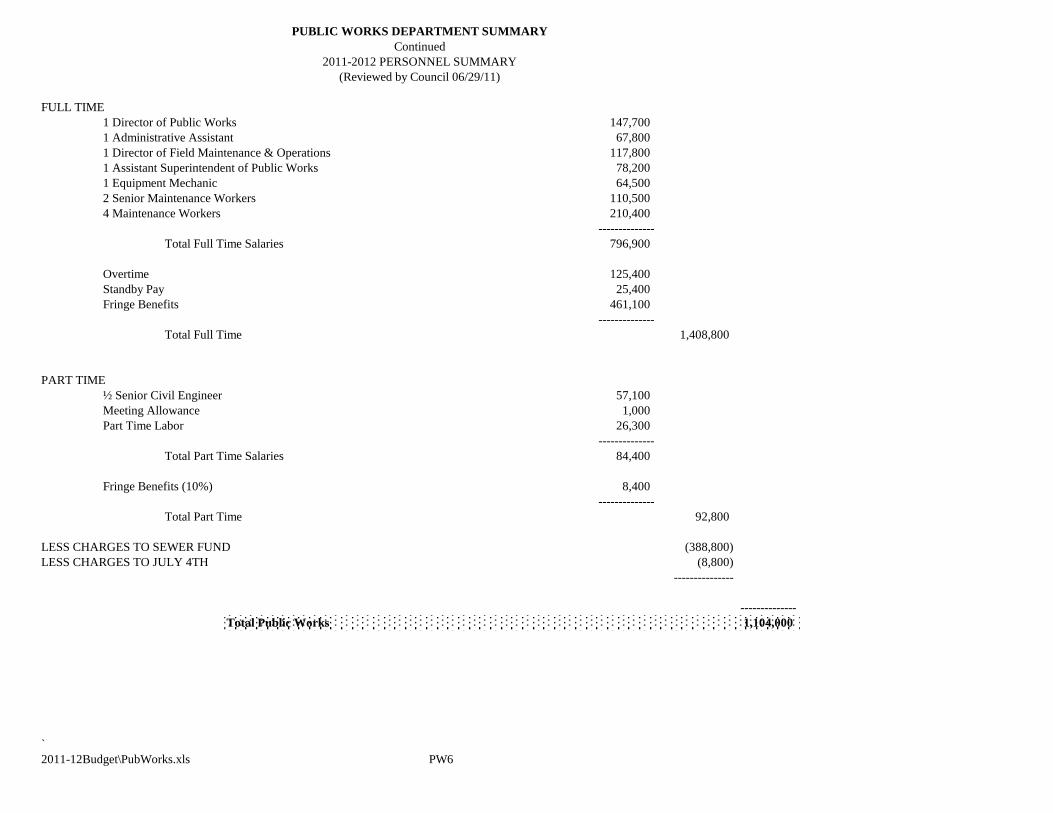
FULL TIME
1 Director of Public Works 147,700
1 Administrative Assistant 67,800
1 Director of Field Maintenance & Operations 117,800
1 Assistant Superintendent of Public Works 78,200
1 Equipment Mechanic 64,500
2 Senior Maintenance Workers 110,500
4 Maintenance Workers 210,400
--------------
Total Full Time Salaries 796,900
Overtime 125,400
Standby Pay 25,400
Fringe Benefits 461,100
--------------
Total Full Time 1,408,800
PART TIME
½ Senior Civil Engineer 57,100
Meeting Allowance 1,000
Part Time Labor 26,300
--------------
Total Part Time Salaries 84,400
Fringe Benefits (10%) 8,400
--------------
Total Part Time 92,800
LESS CHARGES TO SEWER FUND (388,800)
LESS CHARGES TO JULY 4TH (8,800)
---------------
--------------
Total Public Works 1,104,000
`
2011-12Budget\PubWorks.xls PW6
PUBLIC WORKS DEPARTMENT SUMMARY
Continued
2011-2012 PERSONNEL SUMMARY
(Reviewed by Council 06/29/11)
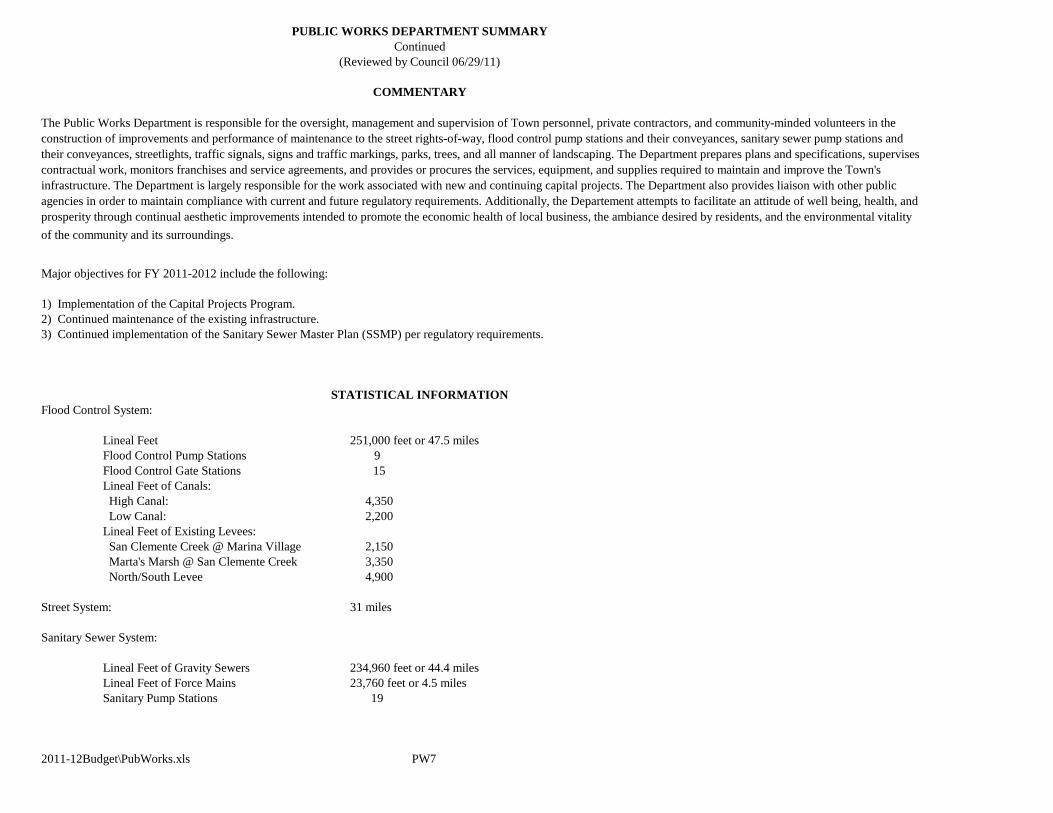
Major objectives for FY 2011-2012 include the following:
1) Implementation of the Capital Projects Program.
2) Continued maintenance of the existing infrastructure.
3) Continued implementation of the Sanitary Sewer Master Plan (SSMP) per regulatory requirements.
Flood Control System:
Lineal Feet 251,000 feet or 47.5 miles
Flood Control Pump Stations 9
Flood Control Gate Stations 15
Lineal Feet of Canals:
High Canal: 4,350
Low Canal: 2,200
Lineal Feet of Existing Levees:
San Clemente Creek @ Marina Village 2,150
Marta's Marsh @ San Clemente Creek 3,350
North/South Levee 4,900
Street System: 31 miles
Sanitary Sewer System:
Lineal Feet of Gravity Sewers 234,960 feet or 44.4 miles
Lineal Feet of Force Mains 23,760 feet or 4.5 miles
Sanitary Pump Stations 19
2011-12Budget\PubWorks.xls PW7
of the community and its surroundings.
COMMENTARY
STATISTICAL INFORMATION
PUBLIC WORKS DEPARTMENT SUMMARY
Continued
(Reviewed by Council 06/29/11)
The Public Works Department is responsible for the oversight, management and supervision of Town personnel, private contractors, and community-minded volunteers in the
construction of improvements and performance of maintenance to the street rights-of-way, flood control pump stations and their conveyances, sanitary sewer pump stations and
their conveyances, streetlights, traffic signals, signs and traffic markings, parks, trees, and all manner of landscaping. The Department prepares plans and specifications, supervises
contractual work, monitors franchises and service agreements, and provides or procures the services, equipment, and supplies required to maintain and improve the Town's
infrastructure. The Department is largely responsible for the work associated with new and continuing capital projects. The Department also provides liaison with other public
agencies in order to maintain compliance with current and future regulatory requirements. Additionally, the Departement attempts to facilitate an attitude of well being, health, and
prosperity through continual aesthetic improvements intended to promote the economic health of local business, the ambiance desired by residents, and the environmental vitality
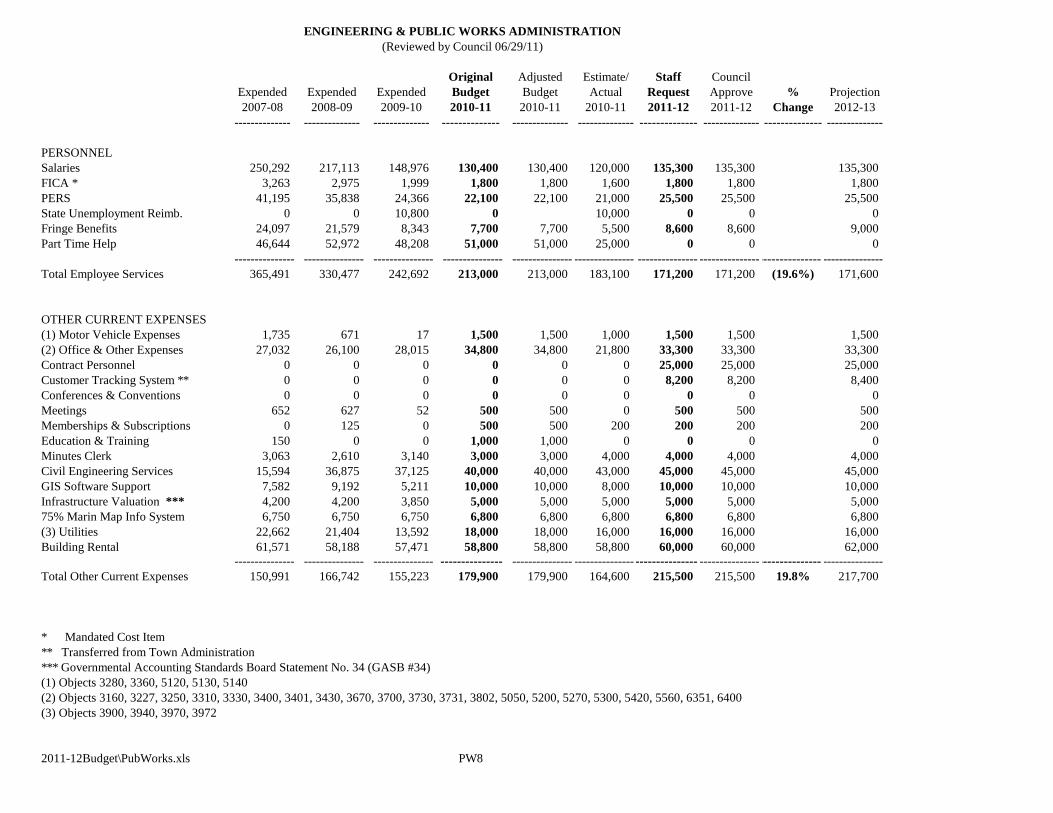
Original Adjusted Estimate/ Staff Council
Expended Expended Expended Budget Budget Actual Request Approve % Projection
2007-08 2008-09 2009-10 2010-11 2010-11 2010-11 2011-12 2011-12 Change 2012-13
-------------- -------------- -------------- -------------- -------------- -------------- -------------- -------------- -------------- --------------
PERSONNEL
Salaries 250,292 217,113 148,976 130,400 130,400 120,000 135,300 135,300 135,300
FICA * 3,263 2,975 1,999 1,800 1,800 1,600 1,800 1,800 1,800
PERS 41,195 35,838 24,366 22,100 22,100 21,000 25,500 25,500 25,500
State Unemployment Reimb. 0 0 10,800 0 10,000 0 0 0
Fringe Benefits 24,097 21,579 8,343 7,700 7,700 5,500 8,600 8,600 9,000
Part Time Help 46,644 52,972 48,208 51,000 51,000 25,000 0 0 0
--------------- --------------- --------------- --------------- --------------- --------------- --------------- ------------------------------ ---------------
Total Employee Services 365,491 330,477 242,692 213,000 213,000 183,100 171,200 171,200 (19.6%) 171,600
OTHER CURRENT EXPENSES
(1) Motor Vehicle Expenses 1,735 671 17 1,500 1,500 1,000 1,500 1,500 1,500
(2) Office & Other Expenses 27,032 26,100 28,015 34,800 34,800 21,800 33,300 33,300 33,300
Contract Personnel 0 0 0 0 0 0 25,000 25,000 25,000
Customer Tracking System ** 0 0 0 0 0 0 8,200 8,200 8,400
Conferences & Conventions 0 0 0 0 0 0 0 0 0
Meetings 652 627 52 500 500 0 500 500 500
Memberships & Subscriptions 0 125 0 500 500 200 200 200 200
Education & Training 150 0 0 1,000 1,000 0 0 0 0
Minutes Clerk 3,063 2,610 3,140 3,000 3,000 4,000 4,000 4,000 4,000
Civil Engineering Services 15,594 36,875 37,125 40,000 40,000 43,000 45,000 45,000 45,000
GIS Software Support 7,582 9,192 5,211 10,000 10,000 8,000 10,000 10,000 10,000
Infrastructure Valuation *** 4,200 4,200 3,850 5,000 5,000 5,000 5,000 5,000 5,000
75% Marin Map Info System 6,750 6,750 6,750 6,800 6,800 6,800 6,800 6,800 6,800
(3) Utilities 22,662 21,404 13,592 18,000 18,000 16,000 16,000 16,000 16,000
Building Rental 61,571 58,188 57,471 58,800 58,800 58,800 60,000 60,000 62,000
--------------- --------------- --------------- --------------- --------------- --------------- --------------- ------------------------------ ---------------
Total Other Current Expenses 150,991 166,742 155,223 179,900 179,900 164,600 215,500 215,500 19.8% 217,700
* Mandated Cost Item
** Transferred from Town Administration
*** Governmental Accounting Standards Board Statement No. 34 (GASB #34)
(1) Objects 3280, 3360, 5120, 5130, 5140
(2) Objects 3160, 3227, 3250, 3310, 3330, 3400, 3401, 3430, 3670, 3700, 3730, 3731, 3802, 5050, 5200, 5270, 5300, 5420, 5560, 6351, 6400
(3) Objects 3900, 3940, 3970, 3972
2011-12Budget\PubWorks.xls PW8
ENGINEERING & PUBLIC WORKS ADMINISTRATION
(Reviewed by Council 06/29/11)
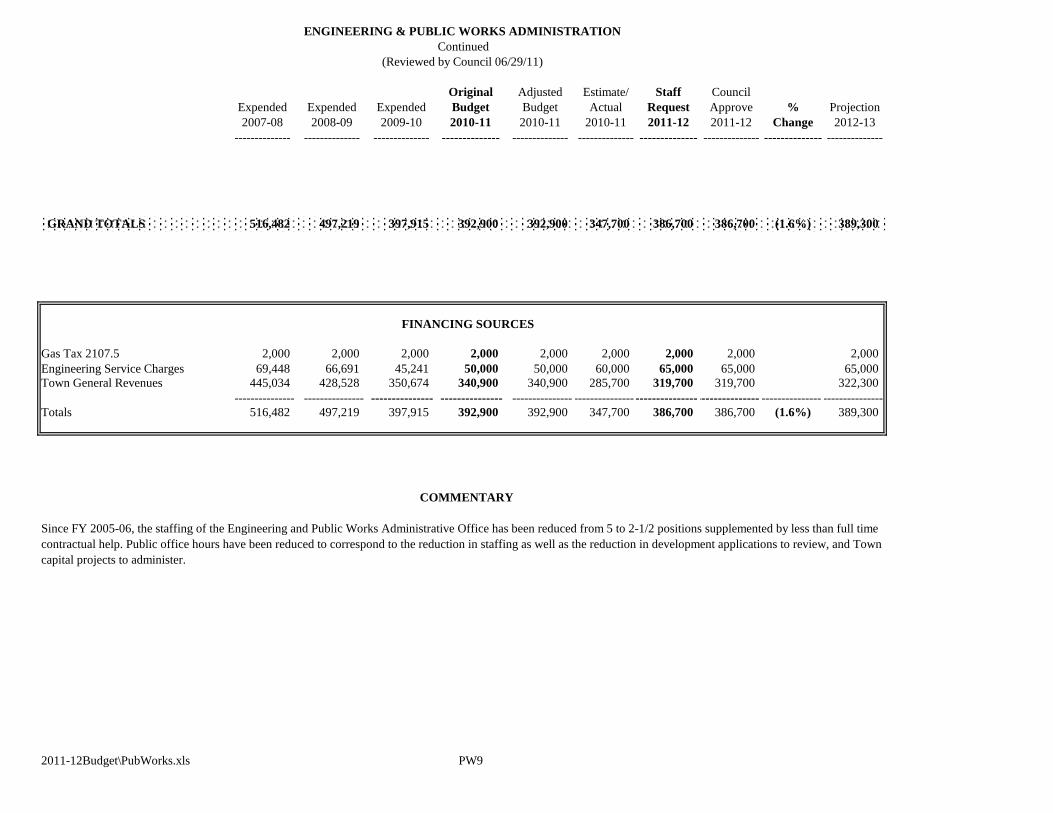
ENGINEERING & PUBLIC WORKS ADMINISTRATION
Continued
Original Adjusted Estimate/ Staff Council
Expended Expended Expended Budget Budget Actual Request Approve % Projection
2007-08 2008-09 2009-10 2010-11 2010-11 2010-11 2011-12 2011-12 Change 2012-13
-------------- -------------- -------------- -------------- -------------- -------------- -------------- -------------- -------------- --------------
GRAND TOTALS 516,482 497,219 397,915 392,900 392,900 347,700 386,700 386,700 (1.6%) 389,300
FINANCING SOURCES
Gas Tax 2107.5 2,000 2,000 2,000 2,000 2,000 2,000 2,000 2,000 2,000
Engineering Service Charges 69,448 66,691 45,241 50,000 50,000 60,000 65,000 65,000 65,000
Town General Revenues 445,034 428,528 350,674 340,900 340,900 285,700 319,700 319,700 322,300
--------------- --------------- --------------- --------------- --------------- --------------- ------------------------------ --------------- ---------------
Totals 516,482 497,219 397,915 392,900 392,900 347,700 386,700 386,700 (1.6%) 389,300
COMMENTARY
2011-12Budget\PubWorks.xls PW9
Since FY 2005-06, the staffing of the Engineering and Public Works Administrative Office has been reduced from 5 to 2-1/2 positions supplemented by less than full time
contractual help. Public office hours have been reduced to correspond to the reduction in staffing as well as the reduction in development applications to review, and Town
capital projects to administer.
(Reviewed by Council 06/29/11)
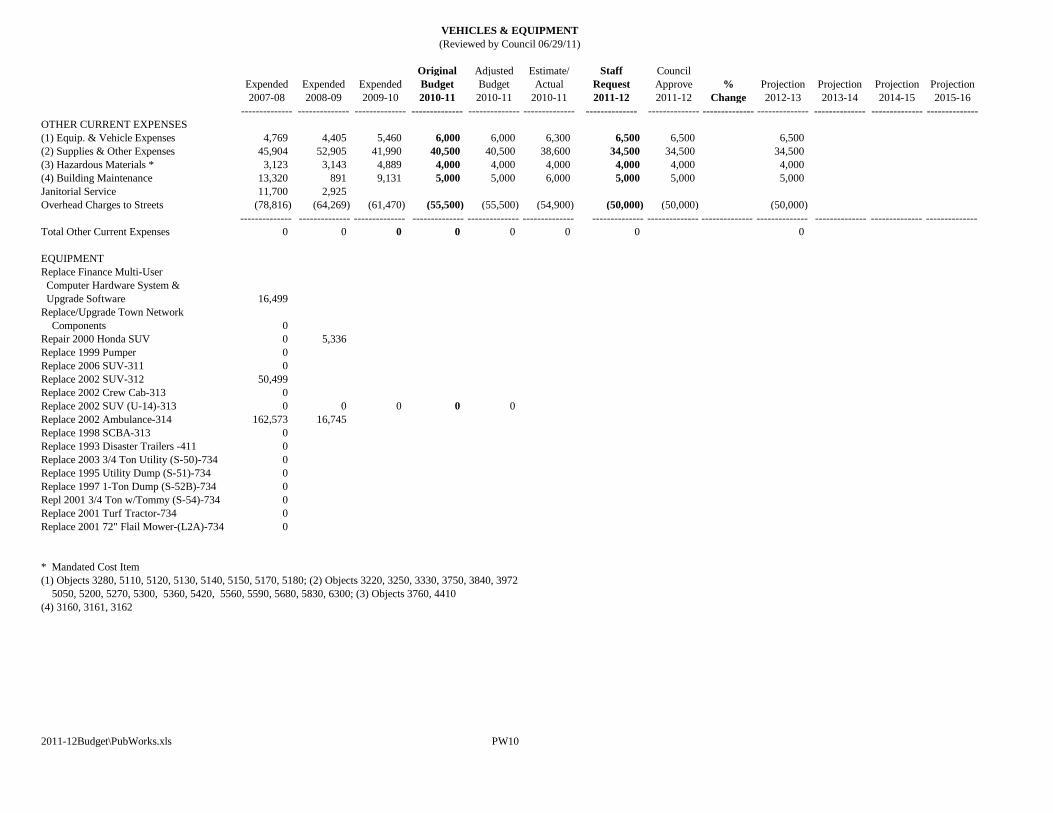
VEHICLES & EQUIPMENT
Original Adjusted Estimate/ Staff Council
Expended Expended Expended Budget Budget Actual Request Approve % Projection Projection Projection Projection
2007-08 2008-09 2009-10 2010-11 2010-11 2010-11 2011-12 2011-12 Change 2012-13 2013-14 2014-15 2015-16
-------------- -------------- -------------- -------------- -------------- -------------- -------------- -------------- -------------- -------------- -------------- -------------- --------------
OTHER CURRENT EXPENSES
(1) Equip. & Vehicle Expenses 4,769 4,405 5,460 6,000 6,000 6,300 6,500 6,500 6,500
(2) Supplies & Other Expenses 45,904 52,905 41,990 40,500 40,500 38,600 34,500 34,500 34,500
(3) Hazardous Materials * 3,123 3,143 4,889 4,000 4,000 4,000 4,000 4,000 4,000
(4) Building Maintenance 13,320 891 9,131 5,000 5,000 6,000 5,000 5,000 5,000
Janitorial Service 11,700 2,925
Overhead Charges to Streets (78,816) (64,269) (61,470) (55,500) (55,500) (54,900) (50,000) (50,000) (50,000)
-------------- -------------- -------------- -------------- -------------- -------------- -------------- -------------- -------------- -------------- -------------- -------------- --------------
Total Other Current Expenses 0 0 0 0 0 0 0 0
EQUIPMENT
Replace Finance Multi-User
Computer Hardware System &
Upgrade Software 16,499
Replace/Upgrade Town Network
Components 0
Repair 2000 Honda SUV 0 5,336
Replace 1999 Pumper 0
Replace 2006 SUV-311 0
Replace 2002 SUV-312 50,499
Replace 2002 Crew Cab-313 0
Replace 2002 SUV (U-14)-313 0 0 0 0 0
Replace 2002 Ambulance-314 162,573 16,745
Replace 1998 SCBA-313 0
Replace 1993 Disaster Trailers -411 0
Replace 2003 3/4 Ton Utility (S-50)-734 0
Replace 1995 Utility Dump (S-51)-734 0
Replace 1997 1-Ton Dump (S-52B)-734 0
Repl 2001 3/4 Ton w/Tommy (S-54)-734 0
Replace 2001 Turf Tractor-734 0
Replace 2001 72" Flail Mower-(L2A)-734 0
* Mandated Cost Item
(1) Objects 3280, 5110, 5120, 5130, 5140, 5150, 5170, 5180; (2) Objects 3220, 3250, 3330, 3750, 3840, 3972
5050, 5200, 5270, 5300, 5360, 5420, 5560, 5590, 5680, 5830, 6300; (3) Objects 3760, 4410
(4) 3160, 3161, 3162
2011-12Budget\PubWorks.xls PW10
(Reviewed by Council 06/29/11)
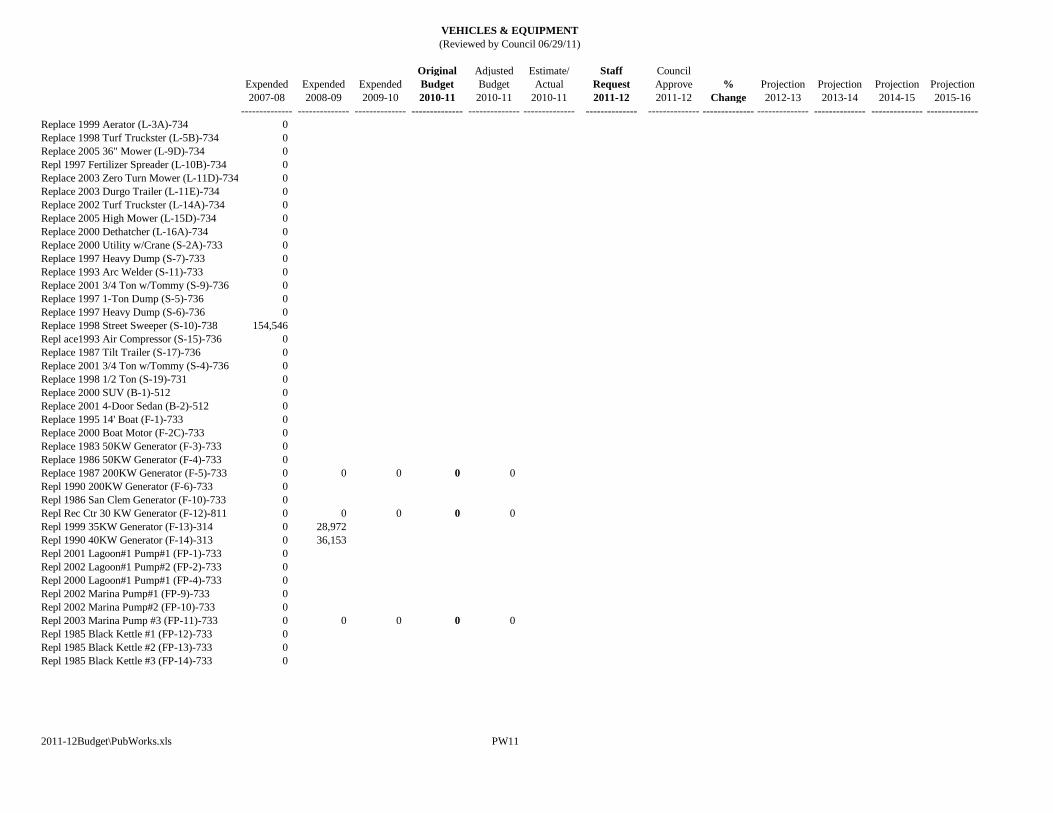
VEHICLES & EQUIPMENT
Original Adjusted Estimate/ Staff Council
Expended Expended Expended Budget Budget Actual Request Approve % Projection Projection Projection Projection
2007-08 2008-09 2009-10 2010-11 2010-11 2010-11 2011-12 2011-12 Change 2012-13 2013-14 2014-15 2015-16
-------------- -------------- -------------- -------------- -------------- -------------- -------------- -------------- -------------- -------------- -------------- -------------- --------------
Replace 1999 Aerator (L-3A)-734 0
Replace 1998 Turf Truckster (L-5B)-734 0
Replace 2005 36" Mower (L-9D)-734 0
Repl 1997 Fertilizer Spreader (L-10B)-734 0
Replace 2003 Zero Turn Mower (L-11D)-734 0
Replace 2003 Durgo Trailer (L-11E)-734 0
Replace 2002 Turf Truckster (L-14A)-734 0
Replace 2005 High Mower (L-15D)-734 0
Replace 2000 Dethatcher (L-16A)-734 0
Replace 2000 Utility w/Crane (S-2A)-733 0
Replace 1997 Heavy Dump (S-7)-733 0
Replace 1993 Arc Welder (S-11)-733 0
Replace 2001 3/4 Ton w/Tommy (S-9)-736 0
Replace 1997 1-Ton Dump (S-5)-736 0
Replace 1997 Heavy Dump (S-6)-736 0
Replace 1998 Street Sweeper (S-10)-738 154,546
Repl ace1993 Air Compressor (S-15)-736 0
Replace 1987 Tilt Trailer (S-17)-736 0
Replace 2001 3/4 Ton w/Tommy (S-4)-736 0
Replace 1998 1/2 Ton (S-19)-731 0
Replace 2000 SUV (B-1)-512 0
Replace 2001 4-Door Sedan (B-2)-512 0
Replace 1995 14' Boat (F-1)-733 0
Replace 2000 Boat Motor (F-2C)-733 0
Replace 1983 50KW Generator (F-3)-733 0
Replace 1986 50KW Generator (F-4)-733 0
Replace 1987 200KW Generator (F-5)-733 0 0 0 0 0
Repl 1990 200KW Generator (F-6)-733 0
Repl 1986 San Clem Generator (F-10)-733 0
Repl Rec Ctr 30 KW Generator (F-12)-811 0 0 0 0 0
Repl 1999 35KW Generator (F-13)-314 0 28,972
Repl 1990 40KW Generator (F-14)-313 0 36,153
Repl 2001 Lagoon#1 Pump#1 (FP-1)-733 0
Repl 2002 Lagoon#1 Pump#2 (FP-2)-733 0
Repl 2000 Lagoon#1 Pump#1 (FP-4)-733 0
Repl 2002 Marina Pump#1 (FP-9)-733 0
Repl 2002 Marina Pump#2 (FP-10)-733 0
Repl 2003 Marina Pump #3 (FP-11)-733 0 0 0 0 0
Repl 1985 Black Kettle #1 (FP-12)-733 0
Repl 1985 Black Kettle #2 (FP-13)-733 0
Repl 1985 Black Kettle #3 (FP-14)-733 0
2011-12Budget\PubWorks.xls PW11
(Reviewed by Council 06/29/11)
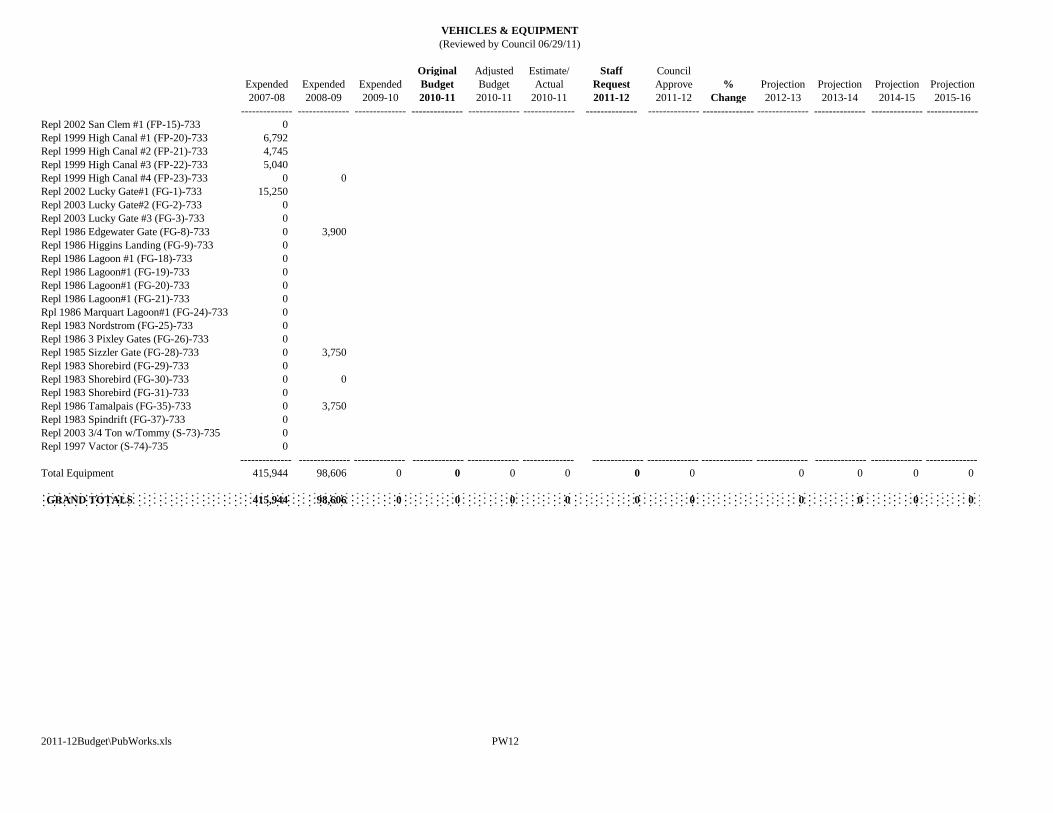
VEHICLES & EQUIPMENT
Original Adjusted Estimate/ Staff Council
Expended Expended Expended Budget Budget Actual Request Approve % Projection Projection Projection Projection
2007-08 2008-09 2009-10 2010-11 2010-11 2010-11 2011-12 2011-12 Change 2012-13 2013-14 2014-15 2015-16
-------------- -------------- -------------- -------------- -------------- -------------- -------------- -------------- -------------- -------------- -------------- -------------- --------------
Repl 2002 San Clem #1 (FP-15)-733 0
Repl 1999 High Canal #1 (FP-20)-733 6,792
Repl 1999 High Canal #2 (FP-21)-733 4,745
Repl 1999 High Canal #3 (FP-22)-733 5,040
Repl 1999 High Canal #4 (FP-23)-733 0 0
Repl 2002 Lucky Gate#1 (FG-1)-733 15,250
Repl 2003 Lucky Gate#2 (FG-2)-733 0
Repl 2003 Lucky Gate #3 (FG-3)-733 0
Repl 1986 Edgewater Gate (FG-8)-733 0 3,900
Repl 1986 Higgins Landing (FG-9)-733 0
Repl 1986 Lagoon #1 (FG-18)-733 0
Repl 1986 Lagoon#1 (FG-19)-733 0
Repl 1986 Lagoon#1 (FG-20)-733 0
Repl 1986 Lagoon#1 (FG-21)-733 0
Rpl 1986 Marquart Lagoon#1 (FG-24)-733 0
Repl 1983 Nordstrom (FG-25)-733 0
Repl 1986 3 Pixley Gates (FG-26)-733 0
Repl 1985 Sizzler Gate (FG-28)-733 0 3,750
Repl 1983 Shorebird (FG-29)-733 0
Repl 1983 Shorebird (FG-30)-733 0 0
Repl 1983 Shorebird (FG-31)-733 0
Repl 1986 Tamalpais (FG-35)-733 0 3,750
Repl 1983 Spindrift (FG-37)-733 0
Repl 2003 3/4 Ton w/Tommy (S-73)-735 0
Repl 1997 Vactor (S-74)-735 0
-------------- -------------- -------------- -------------- -------------- -------------- -------------- -------------- -------------- -------------- -------------- -------------- --------------
Total Equipment 415,944 98,606 0 0 0 0 0 0 0 0 0 0
GRAND TOTALS 415,944 98,606 0 0 0 0 0 0 0 0 0 0
2011-12Budget\PubWorks.xls PW12
(Reviewed by Council 06/29/11)
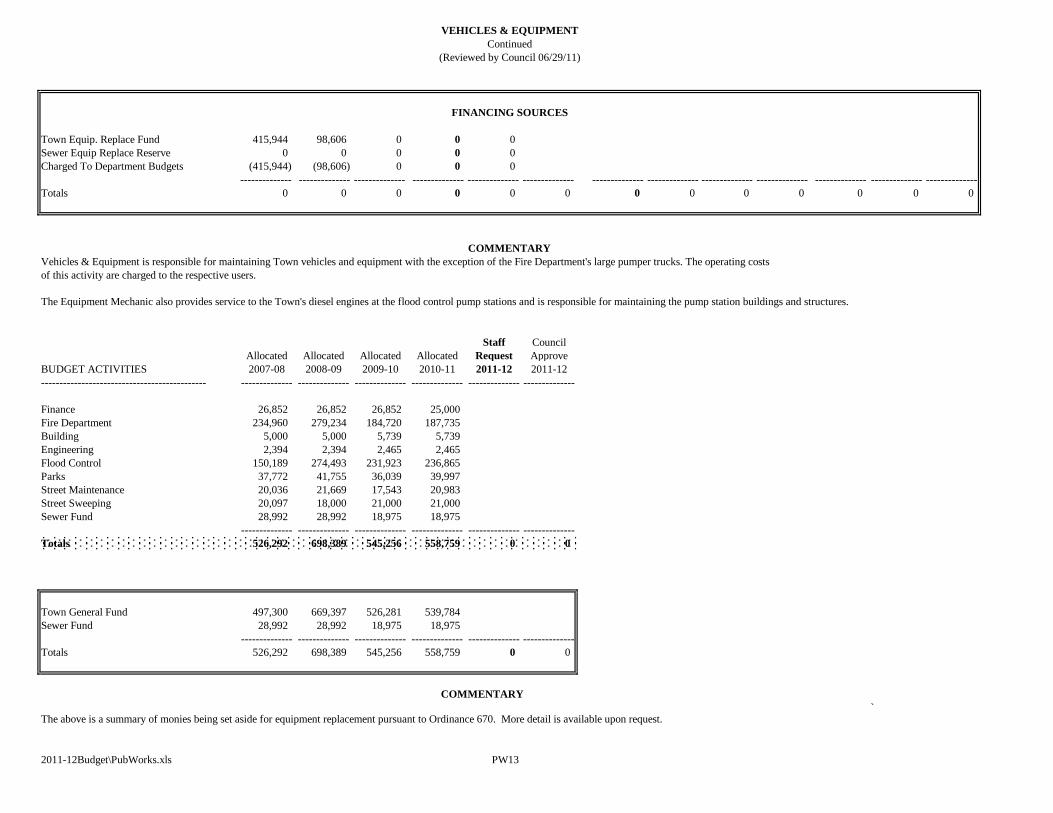
VEHICLES & EQUIPMENT
Continued
FINANCING SOURCES
Town Equip. Replace Fund 415,944 98,606 0 0 0
Sewer Equip Replace Reserve 0 0 0 0 0
Charged To Department Budgets (415,944) (98,606) 0 0 0
-------------- -------------- -------------- -------------- -------------- -------------- -------------- -------------- -------------- -------------- -------------- -------------- --------------
Totals 0 0 0 0 0 0 0 0 0 0 0 0 0
COMMENTARY
Vehicles & Equipment is responsible for maintaining Town vehicles and equipment with the exception of the Fire Department's large pumper trucks. The operating costs
of this activity are charged to the respective users.
Staff Council
Allocated Allocated Allocated Allocated Request Approve
BUDGET ACTIVITIES 2007-08 2008-09 2009-10 2010-11 2011-12 2011-12
--------------------------------------------- -------------- -------------- -------------- -------------- -------------- --------------
Finance 26,852 26,852 26,852 25,000
Fire Department 234,960 279,234 184,720 187,735
Building 5,000 5,000 5,739 5,739
Engineering 2,394 2,394 2,465 2,465
Flood Control 150,189 274,493 231,923 236,865
Parks 37,772 41,755 36,039 39,997
Street Maintenance 20,036 21,669 17,543 20,983
Street Sweeping 20,097 18,000 21,000 21,000
Sewer Fund 28,992 28,992 18,975 18,975
-------------- -------------- -------------- -------------- -------------- --------------
Totals 526,292 698,389 545,256 558,759 0 0
Town General Fund 497,300 669,397 526,281 539,784
Sewer Fund 28,992 28,992 18,975 18,975
-------------- -------------- -------------- -------------- -------------- --------------
Totals 526,292 698,389 545,256 558,759 0 0
COMMENTARY
`
2011-12Budget\PubWorks.xls PW13
The above is a summary of monies being set aside for equipment replacement pursuant to Ordinance 670. More detail is available upon request.
The Equipment Mechanic also provides service to the Town's diesel engines at the flood control pump stations and is responsible for maintaining the pump station buildings and structures.
(Reviewed by Council 06/29/11)
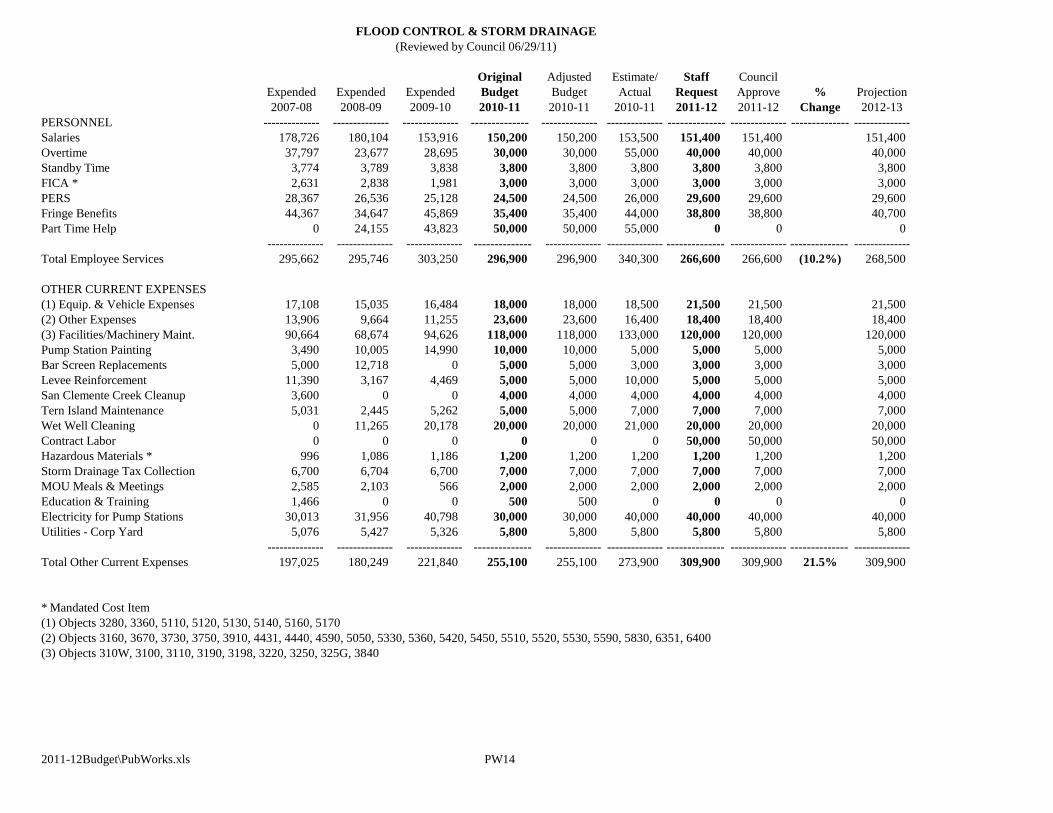
Original Adjusted Estimate/ Staff Council
Expended Expended Expended Budget Budget Actual Request Approve % Projection
2007-08 2008-09 2009-10 2010-11 2010-11 2010-11 2011-12 2011-12 Change 2012-13
PERSONNEL -------------- -------------- -------------- -------------- -------------- -------------- -------------- -------------- -------------- --------------
Salaries 178,726 180,104 153,916 150,200 150,200 153,500 151,400 151,400 151,400
Overtime 37,797 23,677 28,695 30,000 30,000 55,000 40,000 40,000 40,000
Standby Time 3,774 3,789 3,838 3,800 3,800 3,800 3,800 3,800 3,800
FICA * 2,631 2,838 1,981 3,000 3,000 3,000 3,000 3,000 3,000
PERS 28,367 26,536 25,128 24,500 24,500 26,000 29,600 29,600 29,600
Fringe Benefits 44,367 34,647 45,869 35,400 35,400 44,000 38,800 38,800 40,700
Part Time Help 0 24,155 43,823 50,000 50,000 55,000 0 0 0
-------------- -------------- -------------- -------------- -------------- -------------- -------------- -------------- -------------- --------------
Total Employee Services 295,662 295,746 303,250 296,900 296,900 340,300 266,600 266,600 (10.2%) 268,500
OTHER CURRENT EXPENSES
(1) Equip. & Vehicle Expenses 17,108 15,035 16,484 18,000 18,000 18,500 21,500 21,500 21,500
(2) Other Expenses 13,906 9,664 11,255 23,600 23,600 16,400 18,400 18,400 18,400
(3) Facilities/Machinery Maint. 90,664 68,674 94,626 118,000 118,000 133,000 120,000 120,000 120,000
Pump Station Painting 3,490 10,005 14,990 10,000 10,000 5,000 5,000 5,000 5,000
Bar Screen Replacements 5,000 12,718 0 5,000 5,000 3,000 3,000 3,000 3,000
Levee Reinforcement 11,390 3,167 4,469 5,000 5,000 10,000 5,000 5,000 5,000
San Clemente Creek Cleanup 3,600 0 0 4,000 4,000 4,000 4,000 4,000 4,000
Tern Island Maintenance 5,031 2,445 5,262 5,000 5,000 7,000 7,000 7,000 7,000
Wet Well Cleaning 0 11,265 20,178 20,000 20,000 21,000 20,000 20,000 20,000
Contract Labor 0 0 0 0 0 0 50,000 50,000 50,000
Hazardous Materials * 996 1,086 1,186 1,200 1,200 1,200 1,200 1,200 1,200
Storm Drainage Tax Collection 6,700 6,704 6,700 7,000 7,000 7,000 7,000 7,000 7,000
MOU Meals & Meetings 2,585 2,103 566 2,000 2,000 2,000 2,000 2,000 2,000
Education & Training 1,466 0 0 500 500 0 0 0 0
Electricity for Pump Stations 30,013 31,956 40,798 30,000 30,000 40,000 40,000 40,000 40,000
Utilities - Corp Yard 5,076 5,427 5,326 5,800 5,800 5,800 5,800 5,800 5,800
-------------- -------------- -------------- -------------- -------------- -------------- -------------- -------------- -------------- --------------
Total Other Current Expenses 197,025 180,249 221,840 255,100 255,100 273,900 309,900 309,900 21.5% 309,900
* Mandated Cost Item
(1) Objects 3280, 3360, 5110, 5120, 5130, 5140, 5160, 5170
(2) Objects 3160, 3670, 3730, 3750, 3910, 4431, 4440, 4590, 5050, 5330, 5360, 5420, 5450, 5510, 5520, 5530, 5590, 5830, 6351, 6400
(3) Objects 310W, 3100, 3110, 3190, 3198, 3220, 3250, 325G, 3840
2011-12Budget\PubWorks.xls PW14
FLOOD CONTROL & STORM DRAINAGE
(Reviewed by Council 06/29/11)
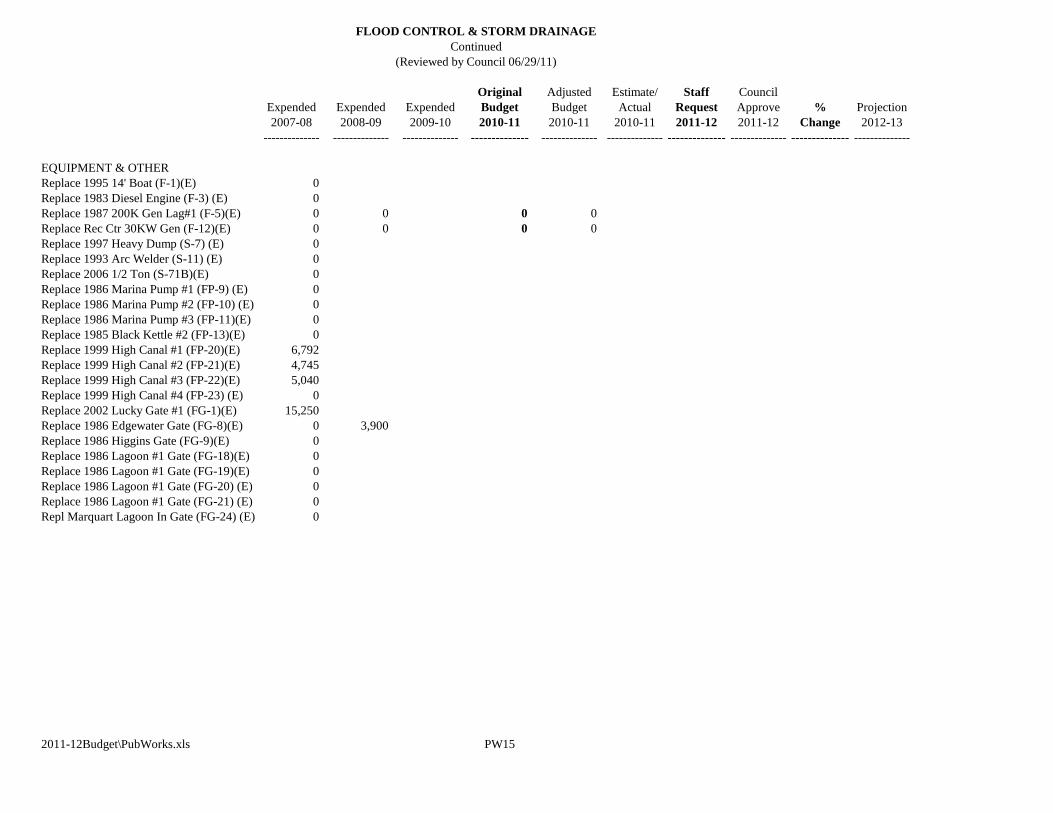
Original Adjusted Estimate/ Staff Council
Expended Expended Expended Budget Budget Actual Request Approve % Projection
2007-08 2008-09 2009-10 2010-11 2010-11 2010-11 2011-12 2011-12 Change 2012-13
-------------- -------------- -------------- -------------- -------------- -------------- -------------- -------------- -------------- --------------
EQUIPMENT & OTHER
Replace 1995 14' Boat (F-1)(E) 0
Replace 1983 Diesel Engine (F-3) (E) 0
Replace 1987 200K Gen Lag#1 (F-5)(E) 0 0 0 0
Replace Rec Ctr 30KW Gen (F-12)(E) 0 0 0 0
Replace 1997 Heavy Dump (S-7) (E) 0
Replace 1993 Arc Welder (S-11) (E) 0
Replace 2006 1/2 Ton (S-71B)(E) 0
Replace 1986 Marina Pump #1 (FP-9) (E) 0
Replace 1986 Marina Pump #2 (FP-10) (E) 0
Replace 1986 Marina Pump #3 (FP-11)(E) 0
Replace 1985 Black Kettle #2 (FP-13)(E) 0
Replace 1999 High Canal #1 (FP-20)(E) 6,792
Replace 1999 High Canal #2 (FP-21)(E) 4,745
Replace 1999 High Canal #3 (FP-22)(E) 5,040
Replace 1999 High Canal #4 (FP-23) (E) 0
Replace 2002 Lucky Gate #1 (FG-1)(E) 15,250
Replace 1986 Edgewater Gate (FG-8)(E) 0 3,900
Replace 1986 Higgins Gate (FG-9)(E) 0
Replace 1986 Lagoon #1 Gate (FG-18)(E) 0
Replace 1986 Lagoon #1 Gate (FG-19)(E) 0
Replace 1986 Lagoon #1 Gate (FG-20) (E) 0
Replace 1986 Lagoon #1 Gate (FG-21) (E) 0
Repl Marquart Lagoon In Gate (FG-24) (E) 0
2011-12Budget\PubWorks.xls PW15
FLOOD CONTROL & STORM DRAINAGE
Continued
(Reviewed by Council 06/29/11)
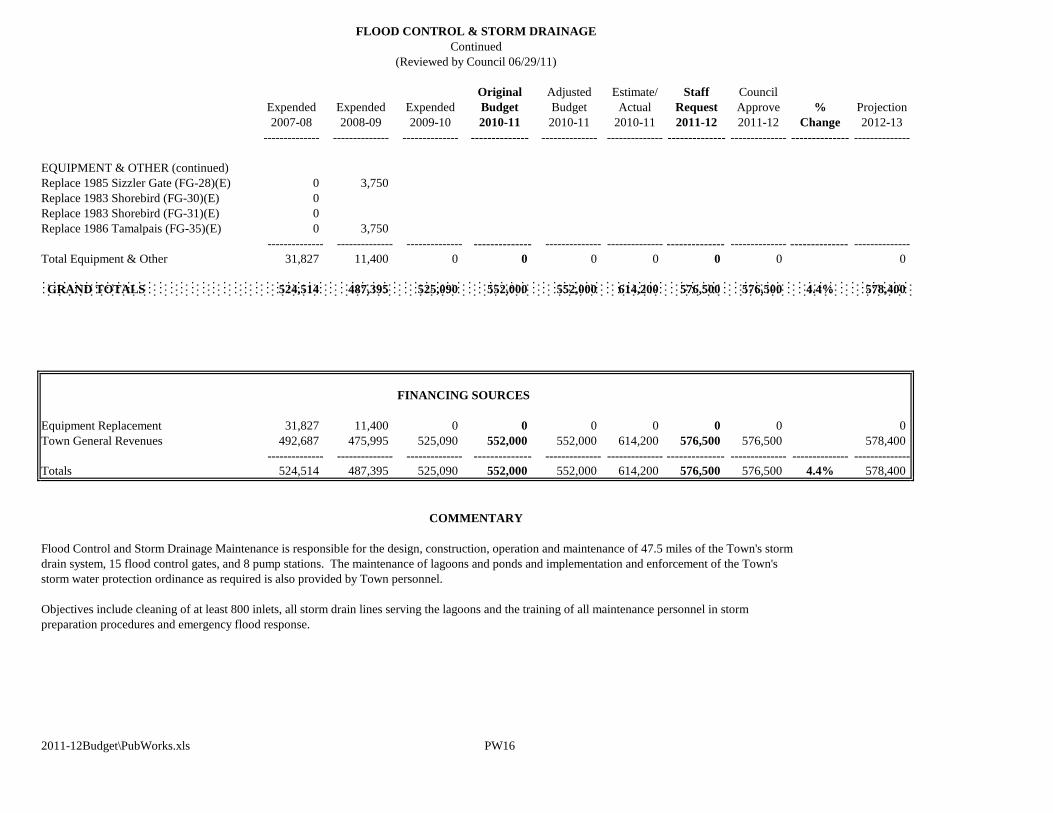
Original Adjusted Estimate/ Staff Council
Expended Expended Expended Budget Budget Actual Request Approve % Projection
2007-08 2008-09 2009-10 2010-11 2010-11 2010-11 2011-12 2011-12 Change 2012-13
-------------- -------------- -------------- -------------- -------------- -------------- -------------- -------------- -------------- --------------
EQUIPMENT & OTHER (continued)
Replace 1985 Sizzler Gate (FG-28)(E) 0 3,750
Replace 1983 Shorebird (FG-30)(E) 0
Replace 1983 Shorebird (FG-31)(E) 0
Replace 1986 Tamalpais (FG-35)(E) 0 3,750
-------------- -------------- -------------- -------------- -------------- -------------- -------------- -------------- -------------- --------------
Total Equipment & Other 31,827 11,400 0 0 0 0 0 0 0
GRAND TOTALS 524,514 487,395 525,090 552,000 552,000 614,200 576,500 576,500 4.4% 578,400
FINANCING SOURCES
Equipment Replacement 31,827 11,400 0 0 0 0 0 0 0
Town General Revenues 492,687 475,995 525,090 552,000 552,000 614,200 576,500 576,500 578,400
-------------- -------------- -------------- -------------- -------------- -------------- -------------- -------------- -------------- --------------
Totals 524,514 487,395 525,090 552,000 552,000 614,200 576,500 576,500 4.4% 578,400
COMMENTARY
Flood Control and Storm Drainage Maintenance is responsible for the design, construction, operation and maintenance of 47.5 miles of the Town's storm
drain system, 15 flood control gates, and 8 pump stations. The maintenance of lagoons and ponds and implementation and enforcement of the Town's
storm water protection ordinance as required is also provided by Town personnel.
Objectives include cleaning of at least 800 inlets, all storm drain lines serving the lagoons and the training of all maintenance personnel in storm
preparation procedures and emergency flood response.
2011-12Budget\PubWorks.xls PW16
Continued
(Reviewed by Council 06/29/11)
FLOOD CONTROL & STORM DRAINAGE
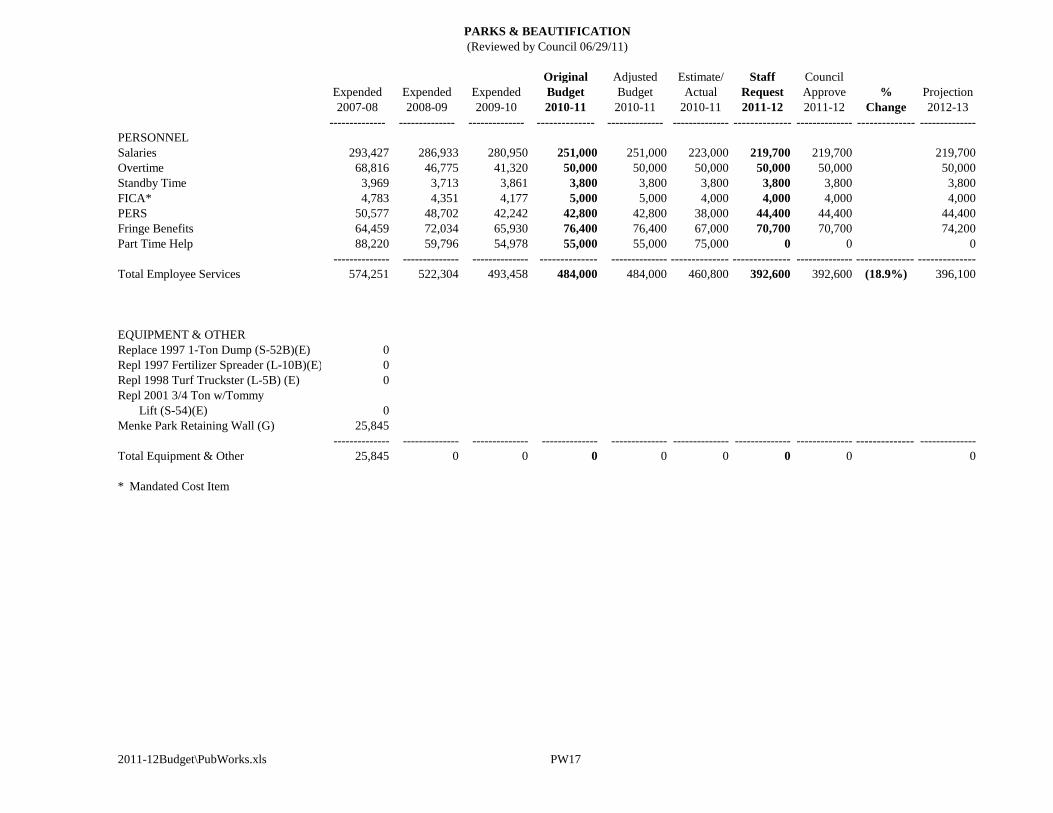
Original Adjusted Estimate/ Staff Council
Expended Expended Expended Budget Budget Actual Request Approve % Projection
2007-08 2008-09 2009-10 2010-11 2010-11 2010-11 2011-12 2011-12 Change 2012-13
-------------- -------------- -------------- -------------- -------------- -------------- -------------- -------------- -------------- --------------
PERSONNEL
Salaries 293,427 286,933 280,950 251,000 251,000 223,000 219,700 219,700 219,700
Overtime 68,816 46,775 41,320 50,000 50,000 50,000 50,000 50,000 50,000
Standby Time 3,969 3,713 3,861 3,800 3,800 3,800 3,800 3,800 3,800
FICA* 4,783 4,351 4,177 5,000 5,000 4,000 4,000 4,000 4,000
PERS 50,577 48,702 42,242 42,800 42,800 38,000 44,400 44,400 44,400
Fringe Benefits 64,459 72,034 65,930 76,400 76,400 67,000 70,700 70,700 74,200
Part Time Help 88,220 59,796 54,978 55,000 55,000 75,000 0 0 0
-------------- -------------- -------------- -------------- -------------- -------------- -------------- -------------- -------------- --------------
Total Employee Services 574,251 522,304 493,458 484,000 484,000 460,800 392,600 392,600 (18.9%) 396,100
EQUIPMENT & OTHER
Replace 1997 1-Ton Dump (S-52B)(E) 0
Repl 1997 Fertilizer Spreader (L-10B)(E) 0
Repl 1998 Turf Truckster (L-5B) (E) 0
Repl 2001 3/4 Ton w/Tommy
Lift (S-54)(E) 0
Menke Park Retaining Wall (G) 25,845
-------------- -------------- -------------- -------------- -------------- -------------- -------------- -------------- -------------- --------------
Total Equipment & Other 25,845 0 0 0 0 0 0 0 0
* Mandated Cost Item
2011-12Budget\PubWorks.xls PW17
PARKS & BEAUTIFICATION
(Reviewed by Council 06/29/11)
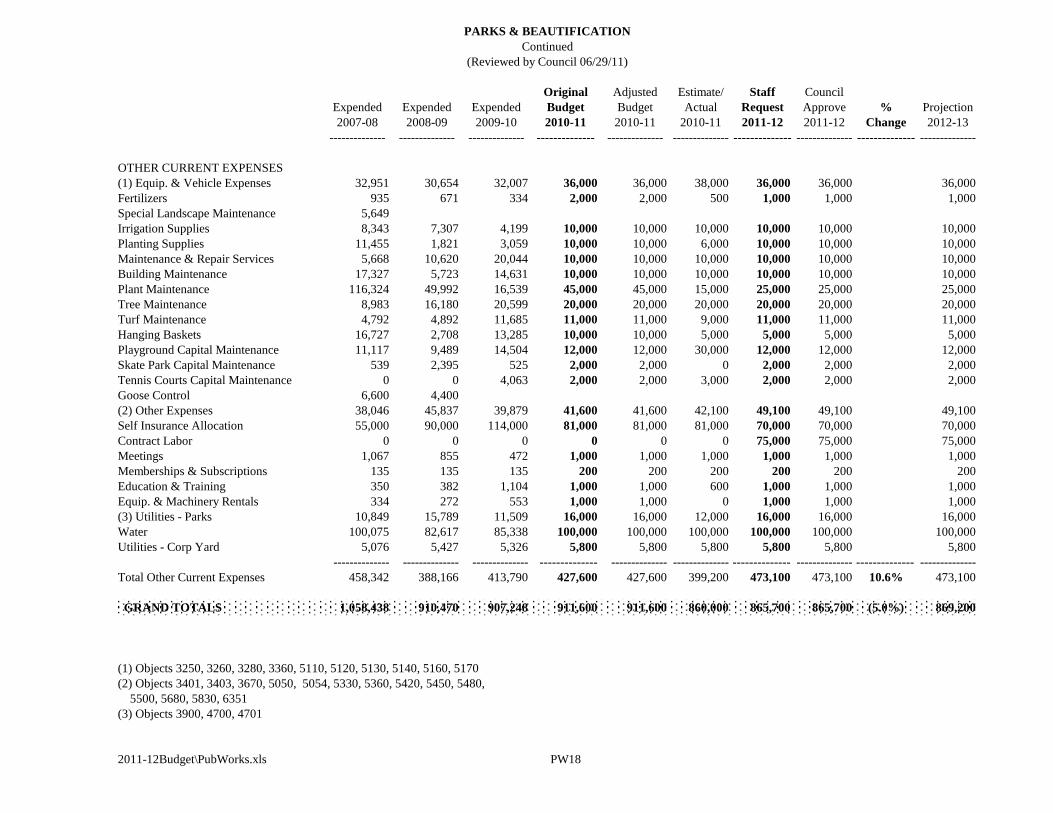
Continued
Original Adjusted Estimate/ Staff Council
Expended Expended Expended Budget Budget Actual Request Approve % Projection
2007-08 2008-09 2009-10 2010-11 2010-11 2010-11 2011-12 2011-12 Change 2012-13
-------------- -------------- -------------- -------------- -------------- -------------- -------------- -------------- -------------- --------------
OTHER CURRENT EXPENSES
(1) Equip. & Vehicle Expenses 32,951 30,654 32,007 36,000 36,000 38,000 36,000 36,000 36,000
Fertilizers 935 671 334 2,000 2,000 500 1,000 1,000 1,000
Special Landscape Maintenance 5,649
Irrigation Supplies 8,343 7,307 4,199 10,000 10,000 10,000 10,000 10,000 10,000
Planting Supplies 11,455 1,821 3,059 10,000 10,000 6,000 10,000 10,000 10,000
Maintenance & Repair Services 5,668 10,620 20,044 10,000 10,000 10,000 10,000 10,000 10,000
Building Maintenance 17,327 5,723 14,631 10,000 10,000 10,000 10,000 10,000 10,000
Plant Maintenance 116,324 49,992 16,539 45,000 45,000 15,000 25,000 25,000 25,000
Tree Maintenance 8,983 16,180 20,599 20,000 20,000 20,000 20,000 20,000 20,000
Turf Maintenance 4,792 4,892 11,685 11,000 11,000 9,000 11,000 11,000 11,000
Hanging Baskets 16,727 2,708 13,285 10,000 10,000 5,000 5,000 5,000 5,000
Playground Capital Maintenance 11,117 9,489 14,504 12,000 12,000 30,000 12,000 12,000 12,000
Skate Park Capital Maintenance 539 2,395 525 2,000 2,000 0 2,000 2,000 2,000
Tennis Courts Capital Maintenance 0 0 4,063 2,000 2,000 3,000 2,000 2,000 2,000
Goose Control 6,600 4,400
(2) Other Expenses 38,046 45,837 39,879 41,600 41,600 42,100 49,100 49,100 49,100
Self Insurance Allocation 55,000 90,000 114,000 81,000 81,000 81,000 70,000 70,000 70,000
Contract Labor 0 0 0 0 0 0 75,000 75,000 75,000
Meetings 1,067 855 472 1,000 1,000 1,000 1,000 1,000 1,000
Memberships & Subscriptions 135 135 135 200 200 200 200 200 200
Education & Training 350 382 1,104 1,000 1,000 600 1,000 1,000 1,000
Equip. & Machinery Rentals 334 272 553 1,000 1,000 0 1,000 1,000 1,000
(3) Utilities - Parks 10,849 15,789 11,509 16,000 16,000 12,000 16,000 16,000 16,000
Water 100,075 82,617 85,338 100,000 100,000 100,000 100,000 100,000 100,000
Utilities - Corp Yard 5,076 5,427 5,326 5,800 5,800 5,800 5,800 5,800 5,800
-------------- -------------- -------------- -------------- -------------- -------------- -------------- -------------- -------------- --------------
Total Other Current Expenses 458,342 388,166 413,790 427,600 427,600 399,200 473,100 473,100 10.6% 473,100
GRAND TOTALS 1,058,438 910,470 907,248 911,600 911,600 860,000 865,700 865,700 (5.0%) 869,200
(1) Objects 3250, 3260, 3280, 3360, 5110, 5120, 5130, 5140, 5160, 5170
(2) Objects 3401, 3403, 3670, 5050, 5054, 5330, 5360, 5420, 5450, 5480,
5500, 5680, 5830, 6351
(3) Objects 3900, 4700, 4701
2011-12Budget\PubWorks.xls PW18
(Reviewed by Council 06/29/11)
PARKS & BEAUTIFICATION
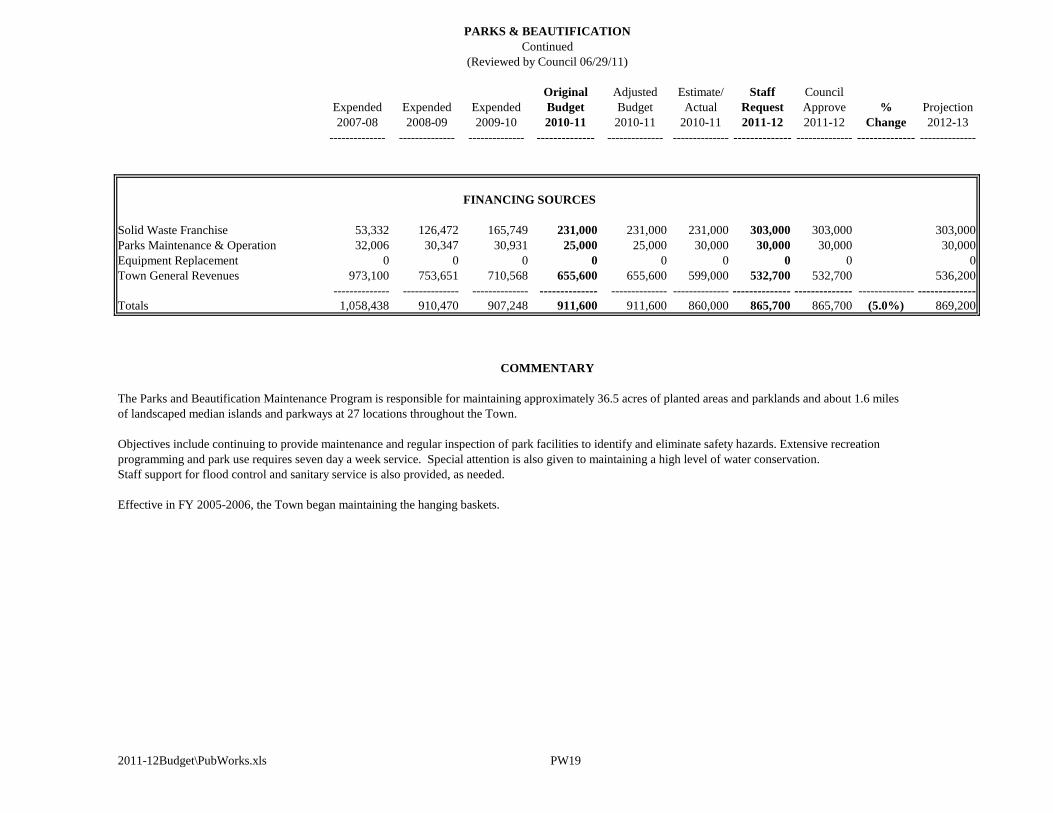
Original Adjusted Estimate/ Staff Council
Expended Expended Expended Budget Budget Actual Request Approve % Projection
2007-08 2008-09 2009-10 2010-11 2010-11 2010-11 2011-12 2011-12 Change 2012-13
-------------- -------------- -------------- -------------- -------------- -------------- -------------- -------------- -------------- --------------
FINANCING SOURCES
Solid Waste Franchise 53,332 126,472 165,749 231,000 231,000 231,000 303,000 303,000 303,000
Parks Maintenance & Operation 32,006 30,347 30,931 25,000 25,000 30,000 30,000 30,000 30,000
Equipment Replacement 0 0 0 0 0 0 0 0 0
Town General Revenues 973,100 753,651 710,568 655,600 655,600 599,000 532,700 532,700 536,200
-------------- -------------- -------------- -------------- -------------- -------------- -------------- -------------- -------------- --------------
Totals 1,058,438 910,470 907,248 911,600 911,600 860,000 865,700 865,700 (5.0%) 869,200
COMMENTARY
The Parks and Beautification Maintenance Program is responsible for maintaining approximately 36.5 acres of planted areas and parklands and about 1.6 miles
of landscaped median islands and parkways at 27 locations throughout the Town.
Objectives include continuing to provide maintenance and regular inspection of park facilities to identify and eliminate safety hazards. Extensive recreation
programming and park use requires seven day a week service. Special attention is also given to maintaining a high level of water conservation.
Staff support for flood control and sanitary service is also provided, as needed.
Effective in FY 2005-2006, the Town began maintaining the hanging baskets.
2011-12Budget\PubWorks.xls PW19
Continued
(Reviewed by Council 06/29/11)
PARKS & BEAUTIFICATION
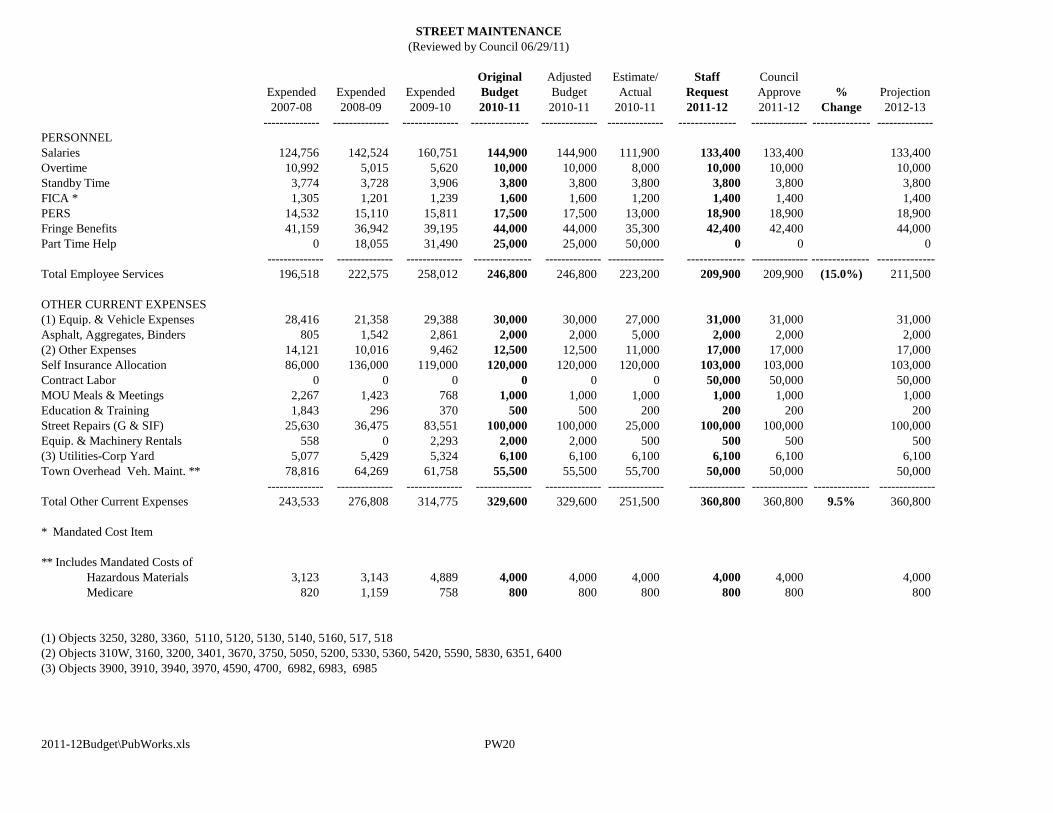
Original Adjusted Estimate/ Staff Council
Expended Expended Expended Budget Budget Actual Request Approve % Projection
2007-08 2008-09 2009-10 2010-11 2010-11 2010-11 2011-12 2011-12 Change 2012-13
-------------- -------------- -------------- -------------- -------------- -------------- -------------- -------------- -------------- --------------
PERSONNEL
Salaries 124,756 142,524 160,751 144,900 144,900 111,900 133,400 133,400 133,400
Overtime 10,992 5,015 5,620 10,000 10,000 8,000 10,000 10,000 10,000
Standby Time 3,774 3,728 3,906 3,800 3,800 3,800 3,800 3,800 3,800
FICA * 1,305 1,201 1,239 1,600 1,600 1,200 1,400 1,400 1,400
PERS 14,532 15,110 15,811 17,500 17,500 13,000 18,900 18,900 18,900
Fringe Benefits 41,159 36,942 39,195 44,000 44,000 35,300 42,400 42,400 44,000
Part Time Help 0 18,055 31,490 25,000 25,000 50,000 0 0 0
-------------- -------------- -------------- -------------- -------------- -------------- -------------- -------------- -------------- --------------
Total Employee Services 196,518 222,575 258,012 246,800 246,800 223,200 209,900 209,900 (15.0%) 211,500
OTHER CURRENT EXPENSES
(1) Equip. & Vehicle Expenses 28,416 21,358 29,388 30,000 30,000 27,000 31,000 31,000 31,000
Asphalt, Aggregates, Binders 805 1,542 2,861 2,000 2,000 5,000 2,000 2,000 2,000
(2) Other Expenses 14,121 10,016 9,462 12,500 12,500 11,000 17,000 17,000 17,000
Self Insurance Allocation 86,000 136,000 119,000 120,000 120,000 120,000 103,000 103,000 103,000
Contract Labor 0 0 0 0 0 0 50,000 50,000 50,000
MOU Meals & Meetings 2,267 1,423 768 1,000 1,000 1,000 1,000 1,000 1,000
Education & Training 1,843 296 370 500 500 200 200 200 200
Street Repairs (G & SIF) 25,630 36,475 83,551 100,000 100,000 25,000 100,000 100,000 100,000
Equip. & Machinery Rentals 558 0 2,293 2,000 2,000 500 500 500 500
(3) Utilities-Corp Yard 5,077 5,429 5,324 6,100 6,100 6,100 6,100 6,100 6,100
Town Overhead Veh. Maint. ** 78,816 64,269 61,758 55,500 55,500 55,700 50,000 50,000 50,000
-------------- -------------- -------------- -------------- -------------- -------------- -------------- -------------- -------------- --------------
Total Other Current Expenses 243,533 276,808 314,775 329,600 329,600 251,500 360,800 360,800 9.5% 360,800
* Mandated Cost Item
** Includes Mandated Costs of
Hazardous Materials 3,123 3,143 4,889 4,000 4,000 4,000 4,000 4,000 4,000
Medicare 820 1,159 758 800 800 800 800 800 800
(1) Objects 3250, 3280, 3360, 5110, 5120, 5130, 5140, 5160, 517, 518
(2) Objects 310W, 3160, 3200, 3401, 3670, 3750, 5050, 5200, 5330, 5360, 5420, 5590, 5830, 6351, 6400
(3) Objects 3900, 3910, 3940, 3970, 4590, 4700, 6982, 6983, 6985
2011-12Budget\PubWorks.xls PW20
STREET MAINTENANCE
(Reviewed by Council 06/29/11)
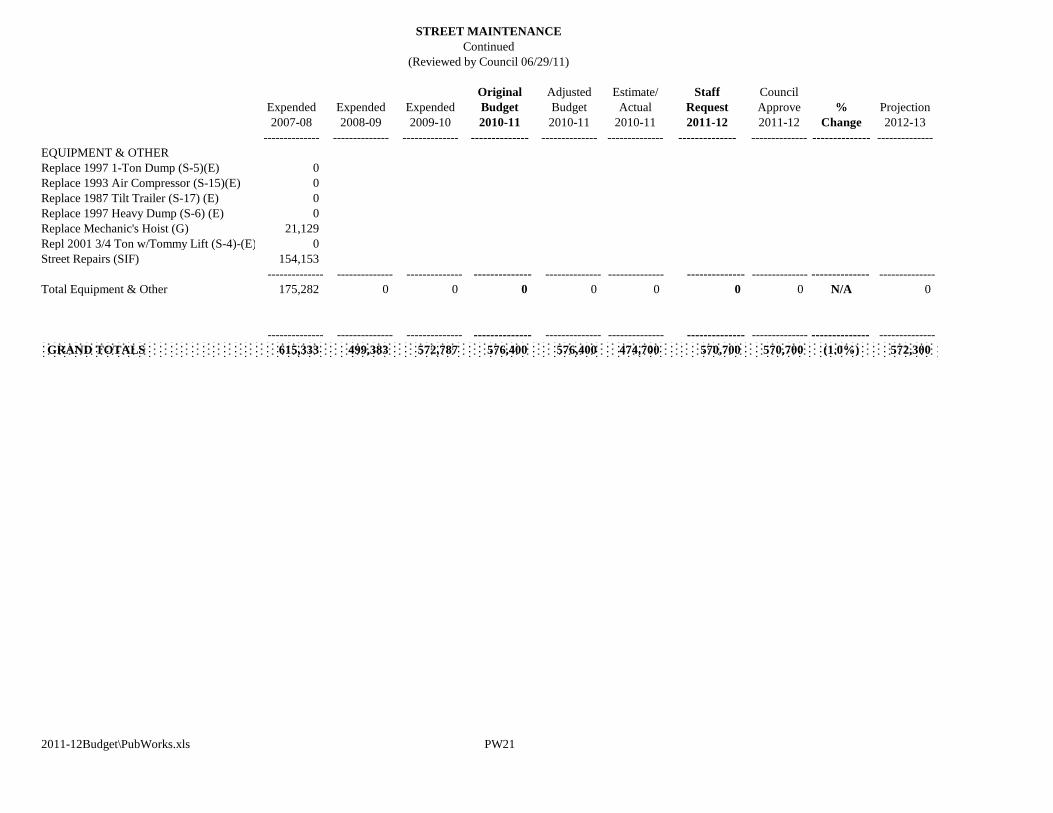
Continued
Original Adjusted Estimate/ Staff Council
Expended Expended Expended Budget Budget Actual Request Approve % Projection
2007-08 2008-09 2009-10 2010-11 2010-11 2010-11 2011-12 2011-12 Change 2012-13
-------------- -------------- -------------- -------------- -------------- -------------- -------------- -------------- -------------- --------------
EQUIPMENT & OTHER
Replace 1997 1-Ton Dump (S-5)(E) 0
Replace 1993 Air Compressor (S-15)(E) 0
Replace 1987 Tilt Trailer (S-17) (E) 0
Replace 1997 Heavy Dump (S-6) (E) 0
Replace Mechanic's Hoist (G) 21,129
Repl 2001 3/4 Ton w/Tommy Lift (S-4)-(E) 0
Street Repairs (SIF) 154,153
-------------- -------------- -------------- -------------- -------------- -------------- -------------- -------------- -------------- --------------
Total Equipment & Other 175,282 0 0 0 0 0 0 0 N/A 0
-------------- -------------- -------------- -------------- -------------- -------------- -------------- -------------- -------------- --------------
GRAND TOTALS 615,333 499,383 572,787 576,400 576,400 474,700 570,700 570,700 (1.0%) 572,300
2011-12Budget\PubWorks.xls PW21
STREET MAINTENANCE
(Reviewed by Council 06/29/11)
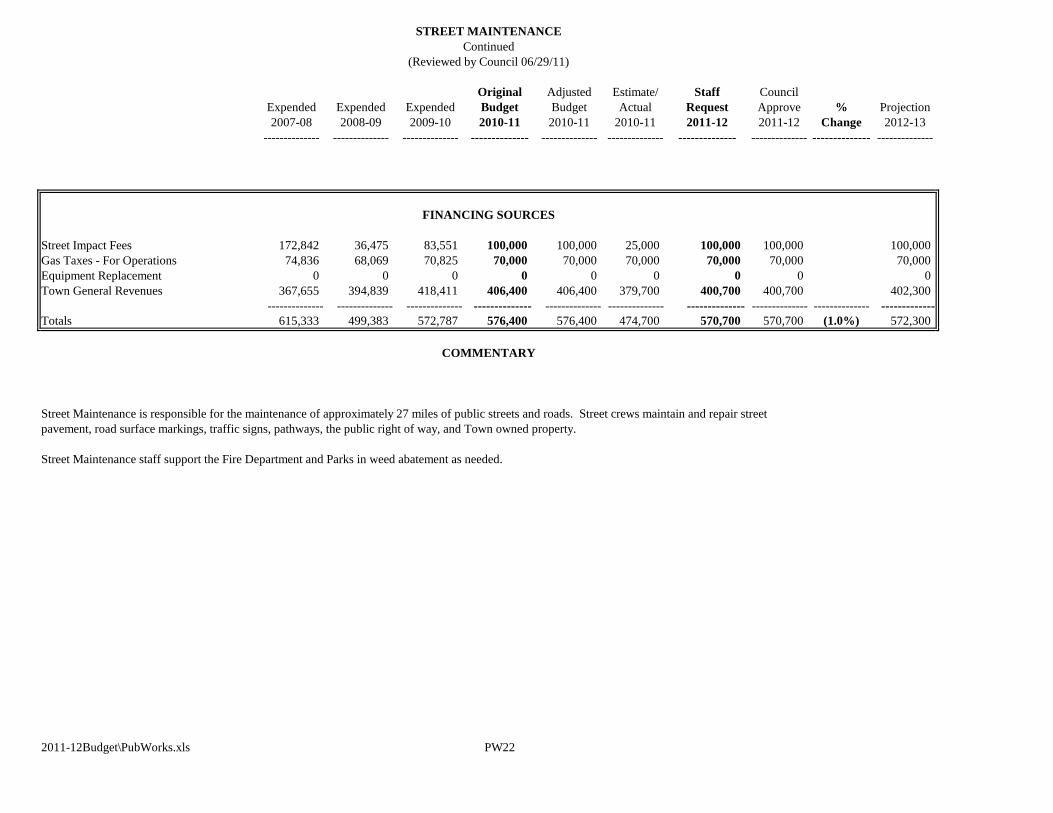
STREET MAINTENANCE
Continued
Original Adjusted Estimate/ Staff Council
Expended Expended Expended Budget Budget Actual Request Approve % Projection
2007-08 2008-09 2009-10 2010-11 2010-11 2010-11 2011-12 2011-12 Change 2012-13
-------------- -------------- -------------- -------------- -------------- -------------- -------------- -------------- -------------- --------------
FINANCING SOURCES
Street Impact Fees 172,842 36,475 83,551 100,000 100,000 25,000 100,000 100,000 100,000
Gas Taxes - For Operations 74,836 68,069 70,825 70,000 70,000 70,000 70,000 70,000 70,000
Equipment Replacement 0 0 0 0 0 0 0 0 0
Town General Revenues 367,655 394,839 418,411 406,400 406,400 379,700 400,700 400,700 402,300
-------------- -------------- -------------- -------------- -------------- -------------- -------------- -------------- -------------- -------------
Totals 615,333 499,383 572,787 576,400 576,400 474,700 570,700 570,700 (1.0%) 572,300
COMMENTARY
Street Maintenance is responsible for the maintenance of approximately 27 miles of public streets and roads. Street crews maintain and repair street
pavement, road surface markings, traffic signs, pathways, the public right of way, and Town owned property.
Street Maintenance staff support the Fire Department and Parks in weed abatement as needed.
2011-12Budget\PubWorks.xls PW22
(Reviewed by Council 06/29/11)
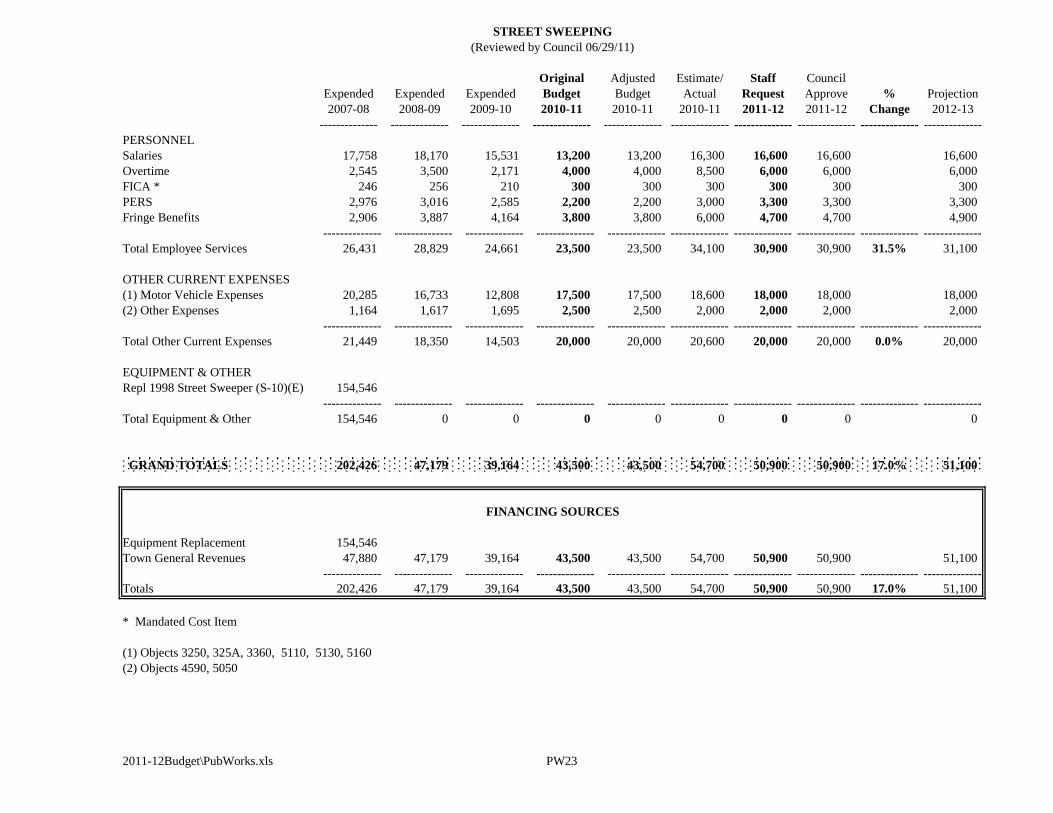
STREET SWEEPING
Original Adjusted Estimate/ Staff Council
Expended Expended Expended Budget Budget Actual Request Approve % Projection
2007-08 2008-09 2009-10 2010-11 2010-11 2010-11 2011-12 2011-12 Change 2012-13
-------------- -------------- -------------- -------------- -------------- -------------- -------------- -------------- -------------- --------------
PERSONNEL
Salaries 17,758 18,170 15,531 13,200 13,200 16,300 16,600 16,600 16,600
Overtime 2,545 3,500 2,171 4,000 4,000 8,500 6,000 6,000 6,000
FICA * 246 256 210 300 300 300 300 300 300
PERS 2,976 3,016 2,585 2,200 2,200 3,000 3,300 3,300 3,300
Fringe Benefits 2,906 3,887 4,164 3,800 3,800 6,000 4,700 4,700 4,900
-------------- -------------- -------------- -------------- -------------- -------------- -------------- -------------- -------------- --------------
Total Employee Services 26,431 28,829 24,661 23,500 23,500 34,100 30,900 30,900 31.5% 31,100
OTHER CURRENT EXPENSES
(1) Motor Vehicle Expenses 20,285 16,733 12,808 17,500 17,500 18,600 18,000 18,000 18,000
(2) Other Expenses 1,164 1,617 1,695 2,500 2,500 2,000 2,000 2,000 2,000
-------------- -------------- -------------- -------------- -------------- -------------- -------------- -------------- -------------- --------------
Total Other Current Expenses 21,449 18,350 14,503 20,000 20,000 20,600 20,000 20,000 0.0% 20,000
EQUIPMENT & OTHER
Repl 1998 Street Sweeper (S-10)(E) 154,546
-------------- -------------- -------------- -------------- -------------- -------------- -------------- -------------- -------------- --------------
Total Equipment & Other 154,546 0 0 0 0 0 0 0 0
GRAND TOTALS 202,426 47,179 39,164 43,500 43,500 54,700 50,900 50,900 17.0% 51,100
Equipment Replacement 154,546
Town General Revenues 47,880 47,179 39,164 43,500 43,500 54,700 50,900 50,900 51,100
-------------- -------------- -------------- -------------- -------------- -------------- -------------- -------------- -------------- --------------
Totals 202,426 47,179 39,164 43,500 43,500 54,700 50,900 50,900 17.0% 51,100
* Mandated Cost Item
(1) Objects 3250, 325A, 3360, 5110, 5130, 5160
(2) Objects 4590, 5050
2011-12Budget\PubWorks.xls PW23
FINANCING SOURCES
(Reviewed by Council 06/29/11)
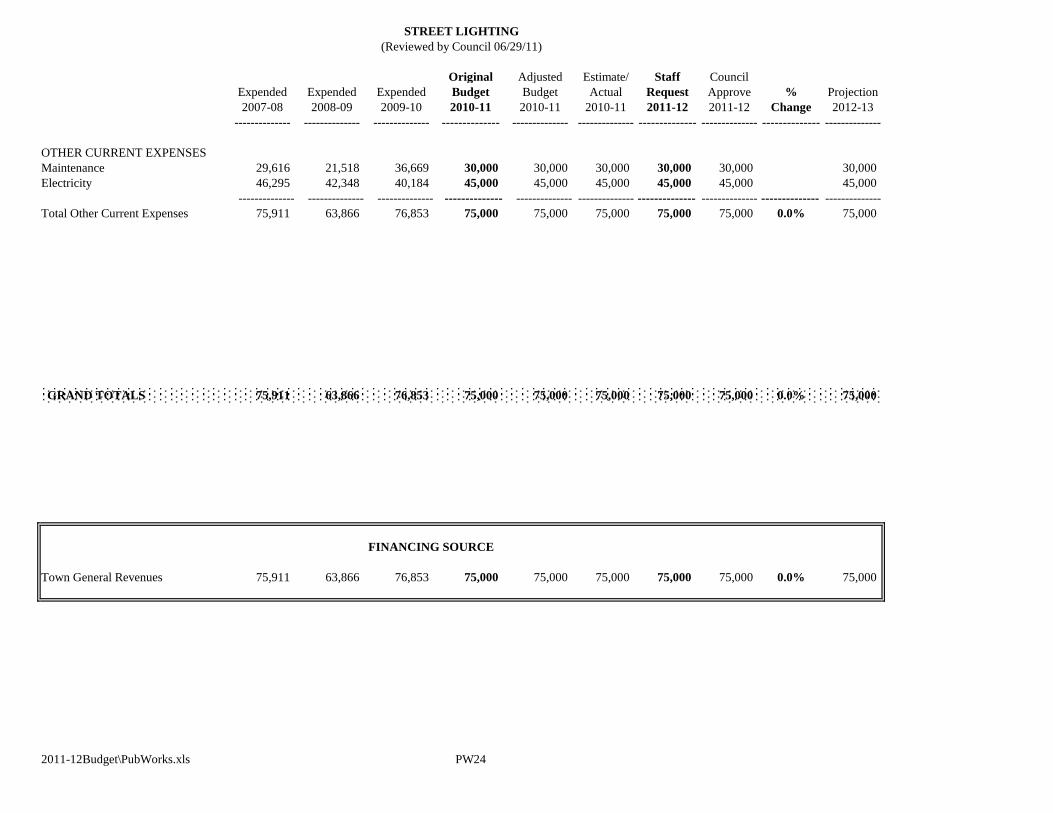
STREET LIGHTING
Original Adjusted Estimate/ Staff Council
Expended Expended Expended Budget Budget Actual Request Approve % Projection
2007-08 2008-09 2009-10 2010-11 2010-11 2010-11 2011-12 2011-12 Change 2012-13
-------------- -------------- -------------- -------------- -------------- -------------- -------------- -------------- -------------- --------------
OTHER CURRENT EXPENSES
Maintenance 29,616 21,518 36,669 30,000 30,000 30,000 30,000 30,000 30,000
Electricity 46,295 42,348 40,184 45,000 45,000 45,000 45,000 45,000 45,000
-------------- -------------- -------------- -------------- -------------- -------------- -------------- -------------- -------------- --------------
Total Other Current Expenses 75,911 63,866 76,853 75,000 75,000 75,000 75,000 75,000 0.0% 75,000
GRAND TOTALS 75,911 63,866 76,853 75,000 75,000 75,000 75,000 75,000 0.0% 75,000
FINANCING SOURCE
Town General Revenues 75,911 63,866 76,853 75,000 75,000 75,000 75,000 75,000 0.0% 75,000
2011-12Budget\PubWorks.xls PW24
(Reviewed by Council 06/29/11)
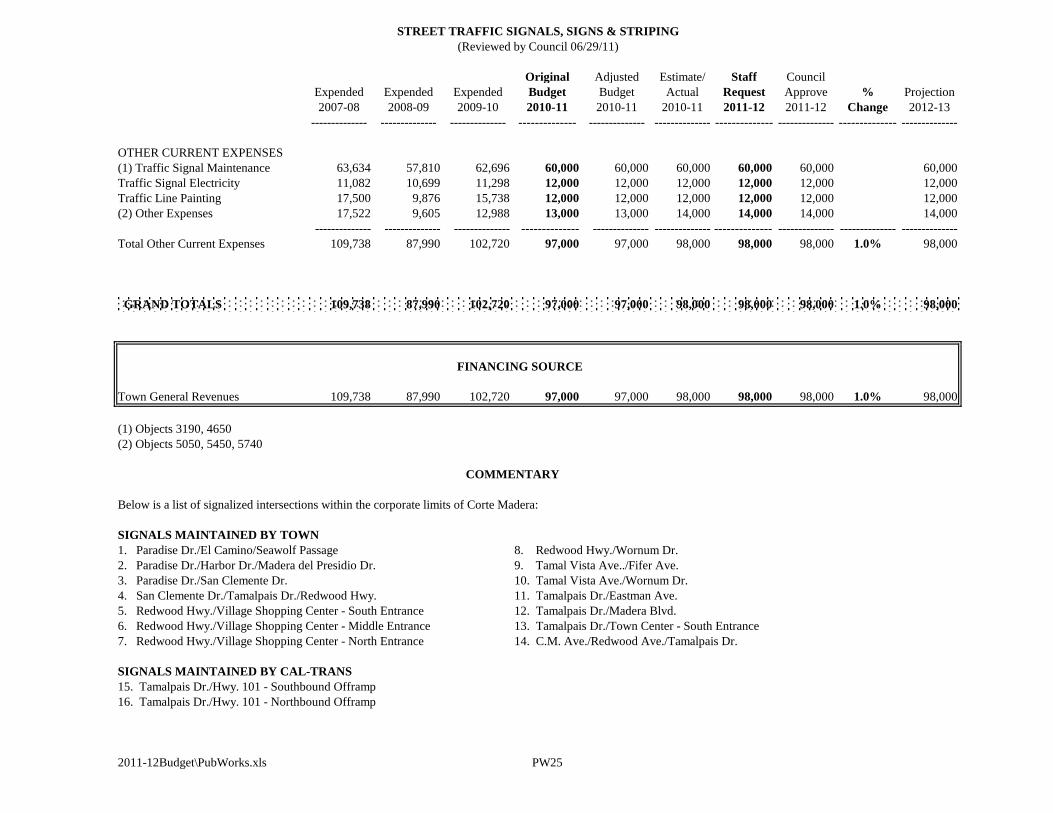
STREET TRAFFIC SIGNALS, SIGNS & STRIPING
Original Adjusted Estimate/ Staff Council
Expended Expended Expended Budget Budget Actual Request Approve % Projection
2007-08 2008-09 2009-10 2010-11 2010-11 2010-11 2011-12 2011-12 Change 2012-13
-------------- -------------- -------------- -------------- -------------- -------------- -------------- -------------- -------------- --------------
OTHER CURRENT EXPENSES
(1) Traffic Signal Maintenance 63,634 57,810 62,696 60,000 60,000 60,000 60,000 60,000 60,000
Traffic Signal Electricity 11,082 10,699 11,298 12,000 12,000 12,000 12,000 12,000 12,000
Traffic Line Painting 17,500 9,876 15,738 12,000 12,000 12,000 12,000 12,000 12,000
(2) Other Expenses 17,522 9,605 12,988 13,000 13,000 14,000 14,000 14,000 14,000
-------------- -------------- -------------- -------------- -------------- -------------- -------------- -------------- -------------- --------------
Total Other Current Expenses 109,738 87,990 102,720 97,000 97,000 98,000 98,000 98,000 1.0% 98,000
GRAND TOTALS 109,738 87,990 102,720 97,000 97,000 98,000 98,000 98,000 1.0% 98,000
FINANCING SOURCE
Town General Revenues 109,738 87,990 102,720 97,000 97,000 98,000 98,000 98,000 1.0% 98,000
(1) Objects 3190, 4650
(2) Objects 5050, 5450, 5740
Below is a list of signalized intersections within the corporate limits of Corte Madera:
SIGNALS MAINTAINED BY TOWN
1. Paradise Dr./El Camino/Seawolf Passage 8. Redwood Hwy./Wornum Dr.
2. Paradise Dr./Harbor Dr./Madera del Presidio Dr. 9. Tamal Vista Ave../Fifer Ave.
3. Paradise Dr./San Clemente Dr. 10. Tamal Vista Ave./Wornum Dr.
4. San Clemente Dr./Tamalpais Dr./Redwood Hwy. 11. Tamalpais Dr./Eastman Ave.
5. Redwood Hwy./Village Shopping Center - South Entrance 12. Tamalpais Dr./Madera Blvd.
6. Redwood Hwy./Village Shopping Center - Middle Entrance 13. Tamalpais Dr./Town Center - South Entrance
7. Redwood Hwy./Village Shopping Center - North Entrance 14. C.M. Ave./Redwood Ave./Tamalpais Dr.
SIGNALS MAINTAINED BY CAL-TRANS
15. Tamalpais Dr./Hwy. 101 - Southbound Offramp
16. Tamalpais Dr./Hwy. 101 - Northbound Offramp
2011-12Budget\PubWorks.xls PW25
COMMENTARY
(Reviewed by Council 06/29/11)
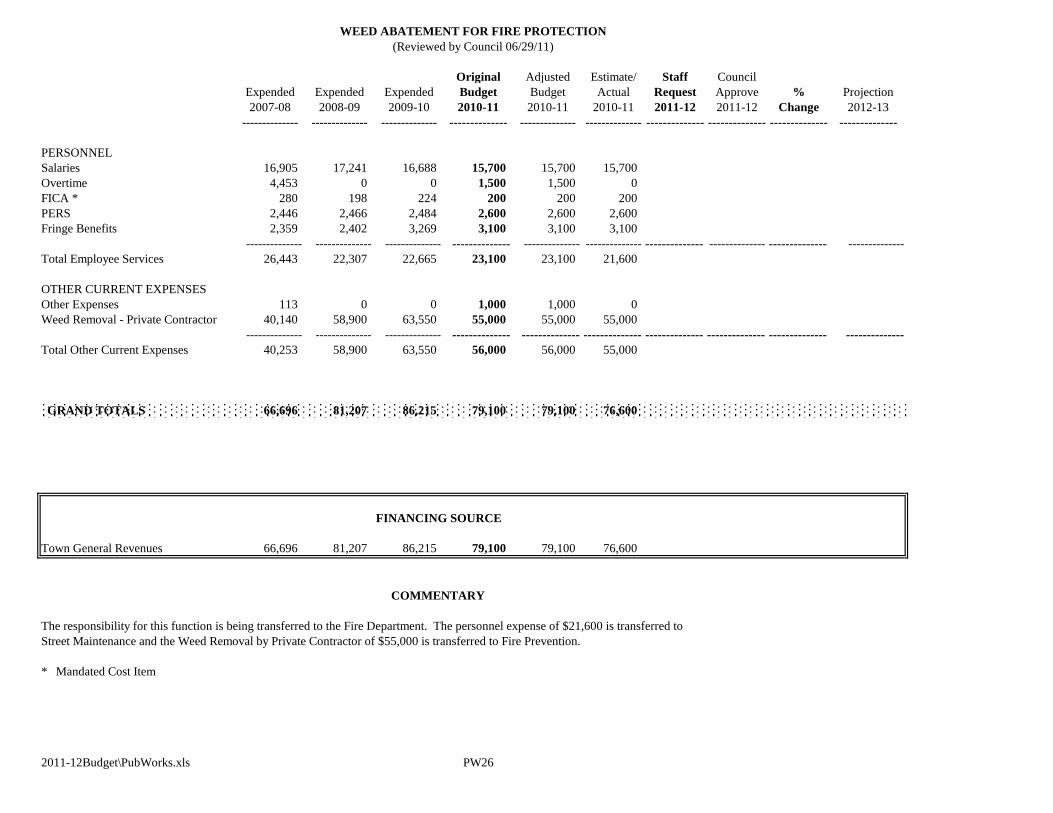
WEED ABATEMENT FOR FIRE PROTECTION
Original Adjusted Estimate/ Staff Council
Expended Expended Expended Budget Budget Actual Request Approve % Projection
2007-08 2008-09 2009-10 2010-11 2010-11 2010-11 2011-12 2011-12 Change 2012-13
-------------- -------------- -------------- -------------- -------------- -------------- -------------- -------------- -------------- --------------
PERSONNEL
Salaries 16,905 17,241 16,688 15,700 15,700 15,700
Overtime 4,453 0 0 1,500 1,500 0
FICA * 280 198 224 200 200 200
PERS 2,446 2,466 2,484 2,600 2,600 2,600
Fringe Benefits 2,359 2,402 3,269 3,100 3,100 3,100
-------------- -------------- -------------- -------------- -------------- -------------- -------------- -------------- -------------- --------------
Total Employee Services 26,443 22,307 22,665 23,100 23,100 21,600
OTHER CURRENT EXPENSES
Other Expenses 113 0 0 1,000 1,000 0
Weed Removal - Private Contractor 40,140 58,900 63,550 55,000 55,000 55,000
-------------- -------------- -------------- -------------- -------------- -------------- -------------- -------------- -------------- --------------
Total Other Current Expenses 40,253 58,900 63,550 56,000 56,000 55,000
GRAND TOTALS 66,696 81,207 86,215 79,100 79,100 76,600
FINANCING SOURCE
Town General Revenues 66,696 81,207 86,215 79,100 79,100 76,600
COMMENTARY
The responsibility for this function is being transferred to the Fire Department. The personnel expense of $21,600 is transferred to
Street Maintenance and the Weed Removal by Private Contractor of $55,000 is transferred to Fire Prevention.
* Mandated Cost Item
2011-12Budget\PubWorks.xls PW26
(Reviewed by Council 06/29/11)
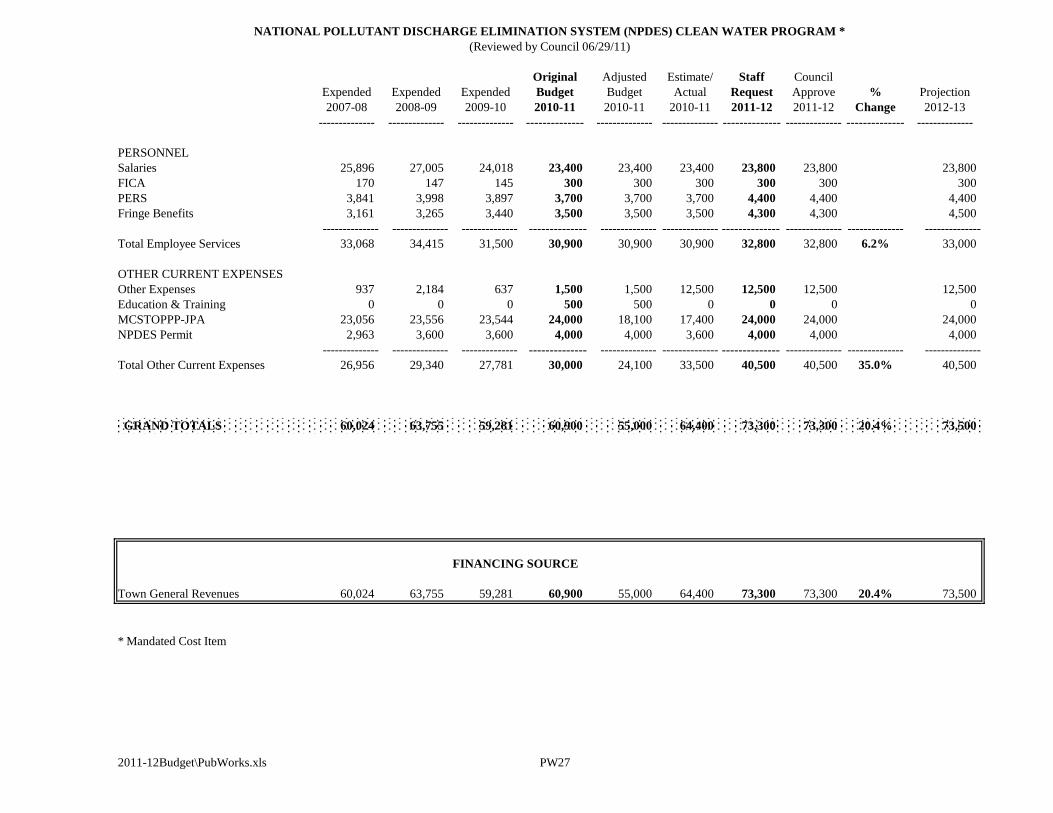
NATIONAL POLLUTANT DISCHARGE ELIMINATION SYSTEM (NPDES) CLEAN WATER PROGRAM *
Original Adjusted Estimate/ Staff Council
Expended Expended Expended Budget Budget Actual Request Approve % Projection
2007-08 2008-09 2009-10 2010-11 2010-11 2010-11 2011-12 2011-12 Change 2012-13
-------------- -------------- -------------- -------------- -------------- -------------- -------------- -------------- -------------- --------------
PERSONNEL
Salaries 25,896 27,005 24,018 23,400 23,400 23,400 23,800 23,800 23,800
FICA 170 147 145 300 300 300 300 300 300
PERS 3,841 3,998 3,897 3,700 3,700 3,700 4,400 4,400 4,400
Fringe Benefits 3,161 3,265 3,440 3,500 3,500 3,500 4,300 4,300 4,500
-------------- -------------- -------------- -------------- -------------- -------------- -------------- -------------- -------------- --------------
Total Employee Services 33,068 34,415 31,500 30,900 30,900 30,900 32,800 32,800 6.2% 33,000
OTHER CURRENT EXPENSES
Other Expenses 937 2,184 637 1,500 1,500 12,500 12,500 12,500 12,500
Education & Training 0 0 0 500 500 0 0 0 0
MCSTOPPP-JPA 23,056 23,556 23,544 24,000 18,100 17,400 24,000 24,000 24,000
NPDES Permit 2,963 3,600 3,600 4,000 4,000 3,600 4,000 4,000 4,000
-------------- -------------- -------------- -------------- -------------- -------------- -------------- -------------- -------------- --------------
Total Other Current Expenses 26,956 29,340 27,781 30,000 24,100 33,500 40,500 40,500 35.0% 40,500
GRAND TOTALS 60,024 63,755 59,281 60,900 55,000 64,400 73,300 73,300 20.4% 73,500
FINANCING SOURCE
Town General Revenues 60,024 63,755 59,281 60,900 55,000 64,400 73,300 73,300 20.4% 73,500
* Mandated Cost Item
2011-12Budget\PubWorks.xls PW27
(Reviewed by Council 06/29/11)

BLANK PAGE
2011-12Budget\PubWorks.xls PW28

BLANK PAGE
2011-12Budget\Recreation.xls R1

BLANK PAGE
2011-12Budget\Recreation.xls R2
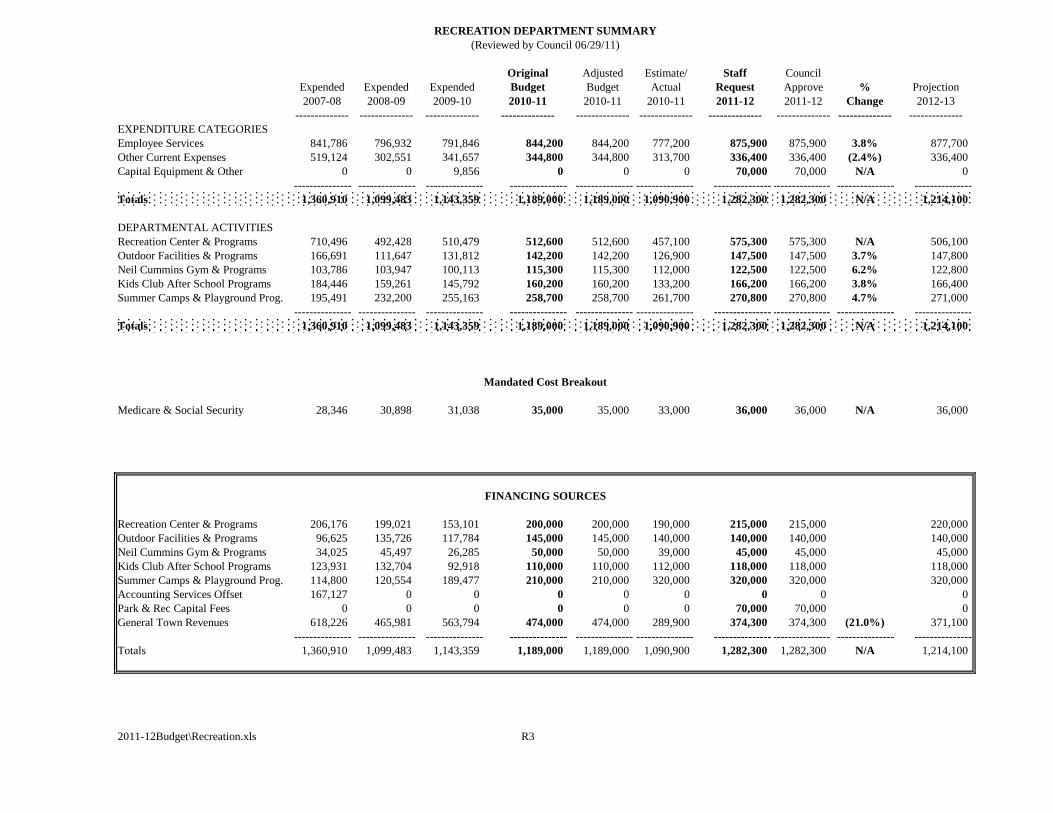
Original Adjusted Estimate/ Staff Council
Expended Expended Expended Budget Budget Actual Request Approve % Projection
2007-08 2008-09 2009-10 2010-11 2010-11 2010-11 2011-12 2011-12 Change 2012-13
-------------- -------------- -------------- -------------- -------------- -------------- -------------- -------------- -------------- --------------
EXPENDITURE CATEGORIES
Employee Services 841,786 796,932 791,846 844,200 844,200 777,200 875,900 875,900 3.8% 877,700
Other Current Expenses 519,124 302,551 341,657 344,800 344,800 313,700 336,400 336,400 (2.4%) 336,400
Capital Equipment & Other 0 0 9,856 0 0 0 70,000 70,000 N/A 0
--------------- --------------- --------------- --------------- --------------- --------------- --------------- --------------- --------------- ---------------
Totals 1,360,910 1,099,483 1,143,359 1,189,000 1,189,000 1,090,900 1,282,300 1,282,300 N/A 1,214,100
DEPARTMENTAL ACTIVITIES
Recreation Center & Programs 710,496 492,428 510,479 512,600 512,600 457,100 575,300 575,300 N/A 506,100
Outdoor Facilities & Programs 166,691 111,647 131,812 142,200 142,200 126,900 147,500 147,500 3.7% 147,800
Neil Cummins Gym & Programs 103,786 103,947 100,113 115,300 115,300 112,000 122,500 122,500 6.2% 122,800
Kids Club After School Programs 184,446 159,261 145,792 160,200 160,200 133,200 166,200 166,200 3.8% 166,400
Summer Camps & Playground Prog. 195,491 232,200 255,163 258,700 258,700 261,700 270,800 270,800 4.7% 271,000
--------------- --------------- --------------- --------------- --------------- --------------- --------------- --------------- --------------- ---------------
Totals 1,360,910 1,099,483 1,143,359 1,189,000 1,189,000 1,090,900 1,282,300 1,282,300 N/A 1,214,100
Medicare & Social Security 28,346 30,898 31,038 35,000 35,000 33,000 36,000 36,000 N/A 36,000
Recreation Center & Programs 206,176 199,021 153,101 200,000 200,000 190,000 215,000 215,000 220,000
Outdoor Facilities & Programs 96,625 135,726 117,784 145,000 145,000 140,000 140,000 140,000 140,000
Neil Cummins Gym & Programs 34,025 45,497 26,285 50,000 50,000 39,000 45,000 45,000 45,000
Kids Club After School Programs 123,931 132,704 92,918 110,000 110,000 112,000 118,000 118,000 118,000
Summer Camps & Playground Prog. 114,800 120,554 189,477 210,000 210,000 320,000 320,000 320,000 320,000
Accounting Services Offset 167,127 0 0 0 0 0 0 0 0
Park & Rec Capital Fees 0 0 0 0 0 0 70,000 70,000 0
General Town Revenues 618,226 465,981 563,794 474,000 474,000 289,900 374,300 374,300 (21.0%) 371,100
--------------- --------------- --------------- --------------- --------------- --------------- --------------- --------------- --------------- ---------------
Totals 1,360,910 1,099,483 1,143,359 1,189,000 1,189,000 1,090,900 1,282,300 1,282,300 N/A 1,214,100
2011-12Budget\Recreation.xls R3
FINANCING SOURCES
RECREATION DEPARTMENT SUMMARY
(Reviewed by Council 06/29/11)
Mandated Cost Breakout
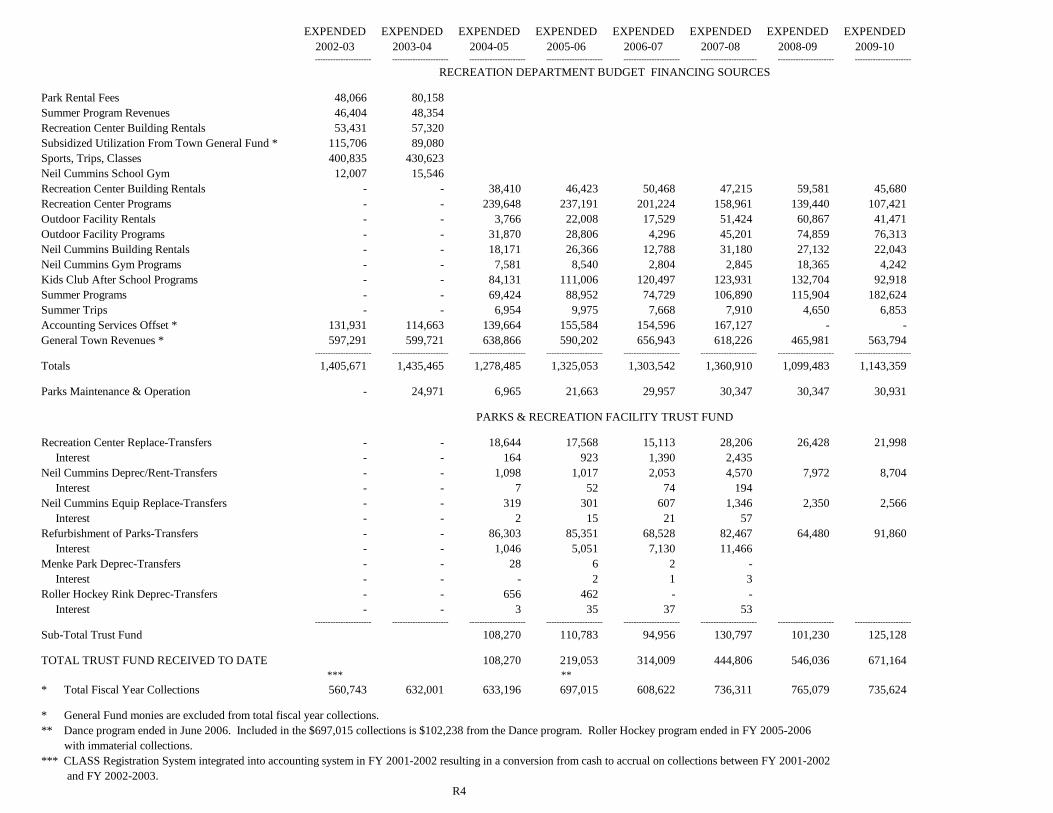
EXPENDED EXPENDED EXPENDED EXPENDED EXPENDED EXPENDED EXPENDED EXPENDED
2002-03 2003-04 2004-05 2005-06 2006-07 2007-08 2008-09 2009-10---------------------- ---------------------- ---------------------- ---------------------- ---------------------- ---------------------- ---------------------- ----------------------
Park Rental Fees 48,066 80,158
Summer Program Revenues 46,404 48,354
Recreation Center Building Rentals 53,431 57,320
Subsidized Utilization From Town General Fund * 115,706 89,080
Sports, Trips, Classes 400,835 430,623
Neil Cummins School Gym 12,007 15,546
Recreation Center Building Rentals - - 38,410 46,423 50,468 47,215 59,581 45,680
Recreation Center Programs - - 239,648 237,191 201,224 158,961 139,440 107,421
Outdoor Facility Rentals - - 3,766 22,008 17,529 51,424 60,867 41,471
Outdoor Facility Programs - - 31,870 28,806 4,296 45,201 74,859 76,313
Neil Cummins Building Rentals - - 18,171 26,366 12,788 31,180 27,132 22,043
Neil Cummins Gym Programs - - 7,581 8,540 2,804 2,845 18,365 4,242
Kids Club After School Programs - - 84,131 111,006 120,497 123,931 132,704 92,918
Summer Programs - - 69,424 88,952 74,729 106,890 115,904 182,624
Summer Trips - - 6,954 9,975 7,668 7,910 4,650 6,853
Accounting Services Offset * 131,931 114,663 139,664 155,584 154,596 167,127 - -
General Town Revenues * 597,291 599,721 638,866 590,202 656,943 618,226 465,981 563,794 ---------------------- ---------------------- ---------------------- ---------------------- ---------------------- ---------------------- ---------------------- ----------------------
Totals 1,405,671 1,435,465 1,278,485 1,325,053 1,303,542 1,360,910 1,099,483 1,143,359
Parks Maintenance & Operation - 24,971 6,965 21,663 29,957 30,347 30,347 30,931
Recreation Center Replace-Transfers - - 18,644 17,568 15,113 28,206 26,428 21,998
Interest - - 164 923 1,390 2,435
Neil Cummins Deprec/Rent-Transfers - - 1,098 1,017 2,053 4,570 7,972 8,704
Interest - - 7 52 74 194
Neil Cummins Equip Replace-Transfers - - 319 301 607 1,346 2,350 2,566
Interest - - 2 15 21 57
Refurbishment of Parks-Transfers - - 86,303 85,351 68,528 82,467 64,480 91,860
Interest - - 1,046 5,051 7,130 11,466
Menke Park Deprec-Transfers - - 28 6 2 -
Interest - - - 2 1 3
Roller Hockey Rink Deprec-Transfers - - 656 462 - -
Interest - - 3 35 37 53 ---------------------- ---------------------- ---------------------- ---------------------- ---------------------- ---------------------- ---------------------- ----------------------
Sub-Total Trust Fund 108,270 110,783 94,956 130,797 101,230 125,128
TOTAL TRUST FUND RECEIVED TO DATE 108,270 219,053 314,009 444,806 546,036 671,164
*** **
* Total Fiscal Year Collections 560,743 632,001 633,196 697,015 608,622 736,311 765,079 735,624
* General Fund monies are excluded from total fiscal year collections.
** Dance program ended in June 2006. Included in the $697,015 collections is $102,238 from the Dance program. Roller Hockey program ended in FY 2005-2006
with immaterial collections.
*** CLASS Registration System integrated into accounting system in FY 2001-2002 resulting in a conversion from cash to accrual on collections between FY 2001-2002
and FY 2002-2003.
R4
RECREATION DEPARTMENT BUDGET FINANCING SOURCES
PARKS & RECREATION FACILITY TRUST FUND
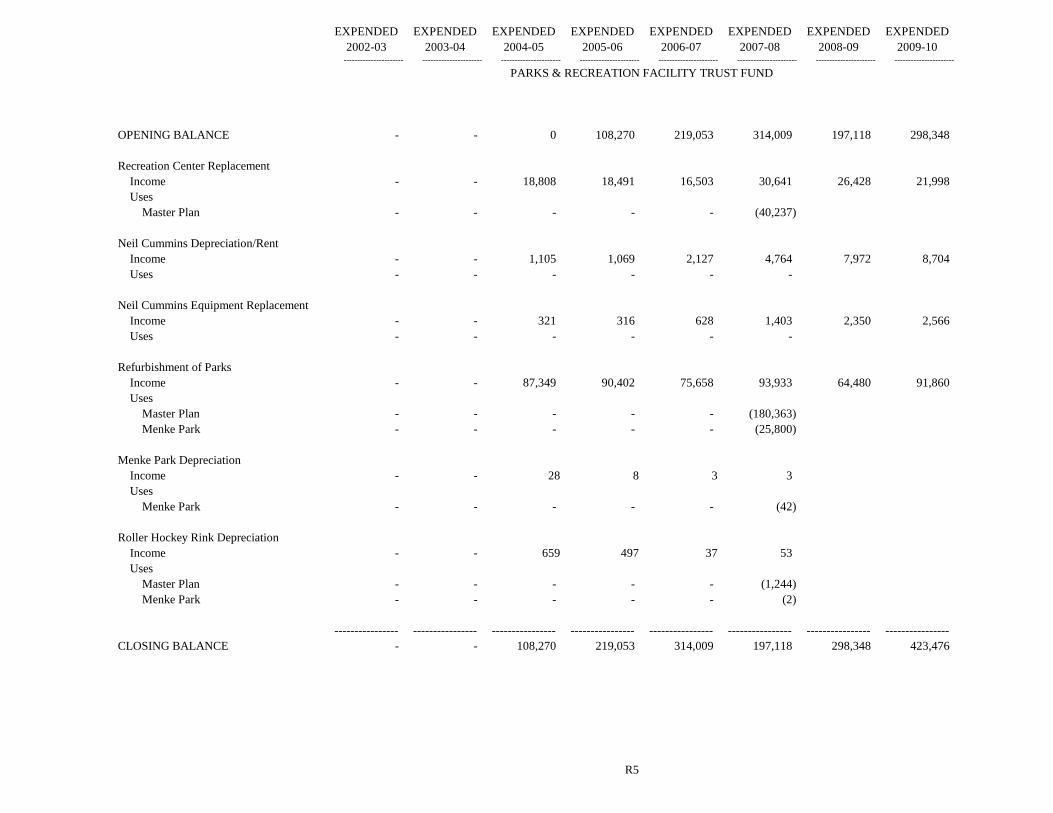
EXPENDED EXPENDED EXPENDED EXPENDED EXPENDED EXPENDED EXPENDED EXPENDED
2002-03 2003-04 2004-05 2005-06 2006-07 2007-08 2008-09 2009-10---------------------- ---------------------- ---------------------- ---------------------- ---------------------- ---------------------- ---------------------- ----------------------
OPENING BALANCE - - 0 108,270 219,053 314,009 197,118 298,348
Recreation Center Replacement
Income - - 18,808 18,491 16,503 30,641 26,428 21,998
Uses
Master Plan - - - - - (40,237)
Neil Cummins Depreciation/Rent
Income - - 1,105 1,069 2,127 4,764 7,972 8,704
Uses - - - - - -
Neil Cummins Equipment Replacement
Income - - 321 316 628 1,403 2,350 2,566
Uses - - - - - -
Refurbishment of Parks
Income - - 87,349 90,402 75,658 93,933 64,480 91,860
Uses
Master Plan - - - - - (180,363)
Menke Park - - - - - (25,800)
Menke Park Depreciation
Income - - 28 8 3 3
Uses
Menke Park - - - - - (42)
Roller Hockey Rink Depreciation
Income - - 659 497 37 53
Uses
Master Plan - - - - - (1,244)
Menke Park - - - - - (2)
---------------- ---------------- ---------------- ---------------- ---------------- ---------------- ---------------- ----------------
CLOSING BALANCE - - 108,270 219,053 314,009 197,118 298,348 423,476
R5
PARKS & RECREATION FACILITY TRUST FUND
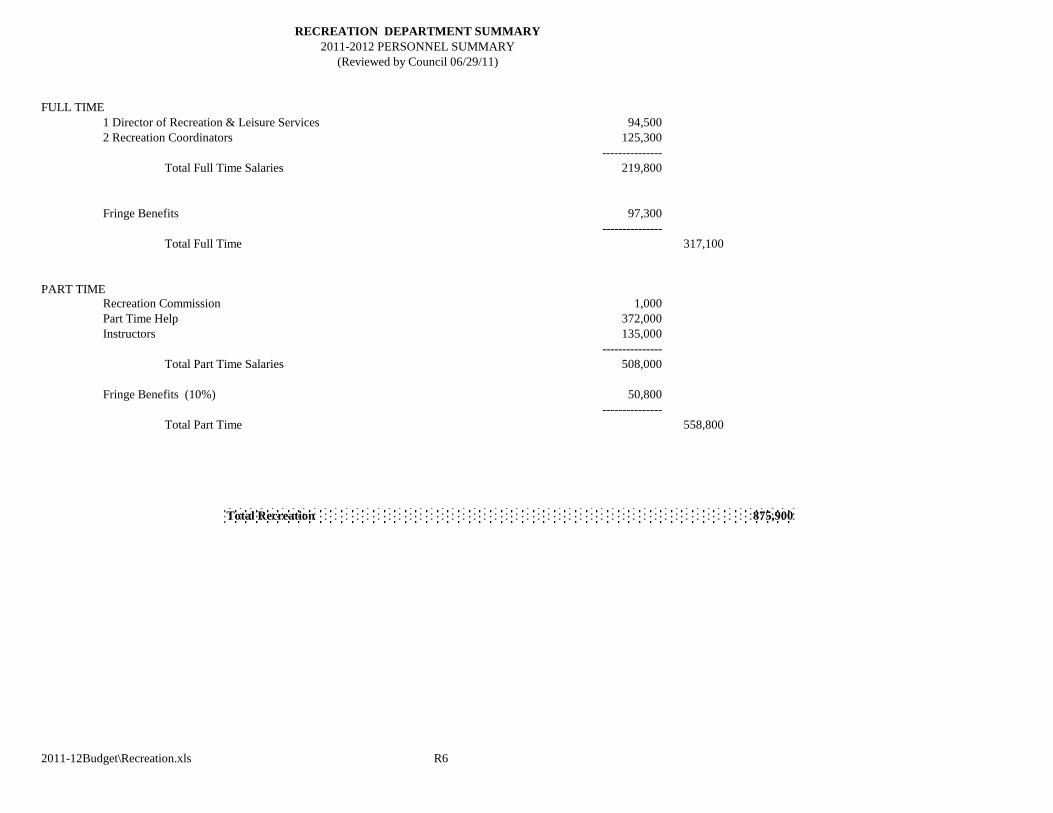
FULL TIME
1 Director of Recreation & Leisure Services 94,500
2 Recreation Coordinators 125,300
---------------
Total Full Time Salaries 219,800
Fringe Benefits 97,300
---------------
Total Full Time 317,100
PART TIME
Recreation Commission 1,000
Part Time Help 372,000
Instructors 135,000
---------------
Total Part Time Salaries 508,000
Fringe Benefits (10%) 50,800
---------------
Total Part Time 558,800
Total Recreation 875,900
2011-12Budget\Recreation.xls R6
RECREATION DEPARTMENT SUMMARY
2011-2012 PERSONNEL SUMMARY
(Reviewed by Council 06/29/11)
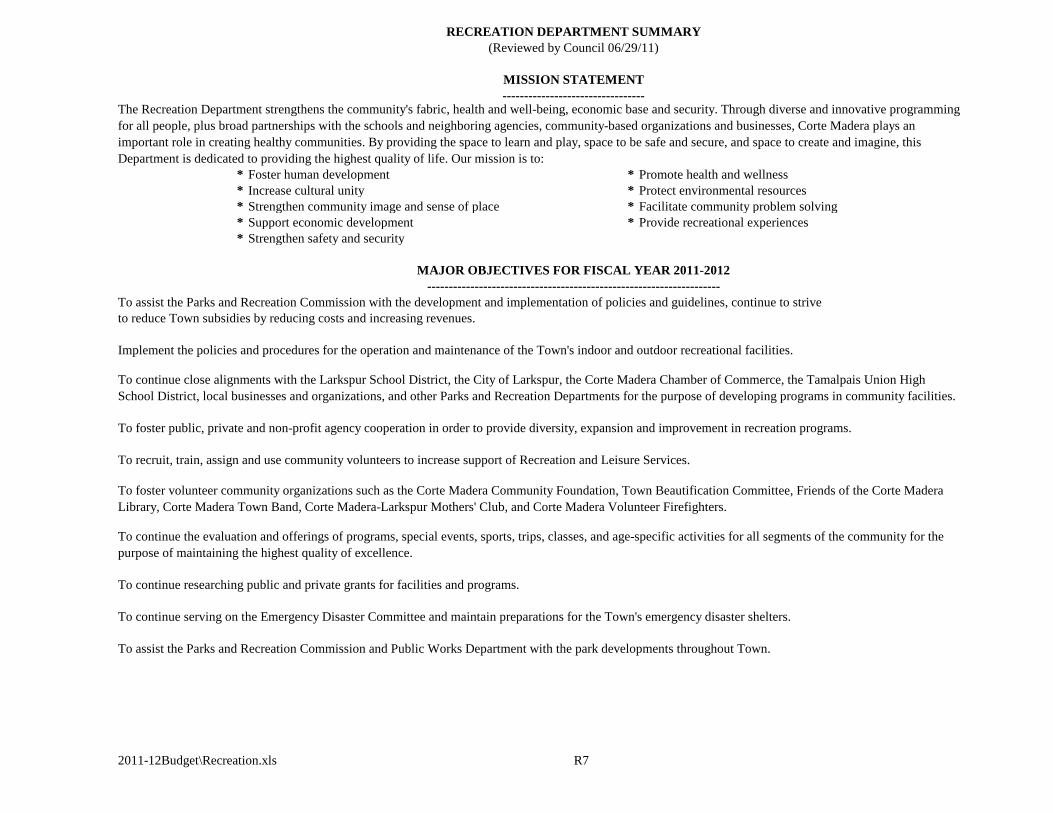
* Foster human development * Promote health and wellness
* Increase cultural unity * Protect environmental resources
* Strengthen community image and sense of place * Facilitate community problem solving
* Support economic development * Provide recreational experiences
* Strengthen safety and security
To assist the Parks and Recreation Commission with the development and implementation of policies and guidelines, continue to strive
to reduce Town subsidies by reducing costs and increasing revenues.
To foster public, private and non-profit agency cooperation in order to provide diversity, expansion and improvement in recreation programs.
To continue researching public and private grants for facilities and programs.
To continue serving on the Emergency Disaster Committee and maintain preparations for the Town's emergency disaster shelters.
To assist the Parks and Recreation Commission and Public Works Department with the park developments throughout Town.
2011-12Budget\Recreation.xls R7
RECREATION DEPARTMENT SUMMARY
(Reviewed by Council 06/29/11)
MISSION STATEMENT
---------------------------------
To continue the evaluation and offerings of programs, special events, sports, trips, classes, and age-specific activities for all segments of the community for the
purpose of maintaining the highest quality of excellence.
The Recreation Department strengthens the community's fabric, health and well-being, economic base and security. Through diverse and innovative programming
for all people, plus broad partnerships with the schools and neighboring agencies, community-based organizations and businesses, Corte Madera plays an
important role in creating healthy communities. By providing the space to learn and play, space to be safe and secure, and space to create and imagine, this
Department is dedicated to providing the highest quality of life. Our mission is to:
To recruit, train, assign and use community volunteers to increase support of Recreation and Leisure Services.
To foster volunteer community organizations such as the Corte Madera Community Foundation, Town Beautification Committee, Friends of the Corte Madera
Library, Corte Madera Town Band, Corte Madera-Larkspur Mothers' Club, and Corte Madera Volunteer Firefighters.
MAJOR OBJECTIVES FOR FISCAL YEAR 2011-2012
--------------------------------------------------------------------
Implement the policies and procedures for the operation and maintenance of the Town's indoor and outdoor recreational facilities.
To continue close alignments with the Larkspur School District, the City of Larkspur, the Corte Madera Chamber of Commerce, the Tamalpais Union High
School District, local businesses and organizations, and other Parks and Recreation Departments for the purpose of developing programs in community facilities.
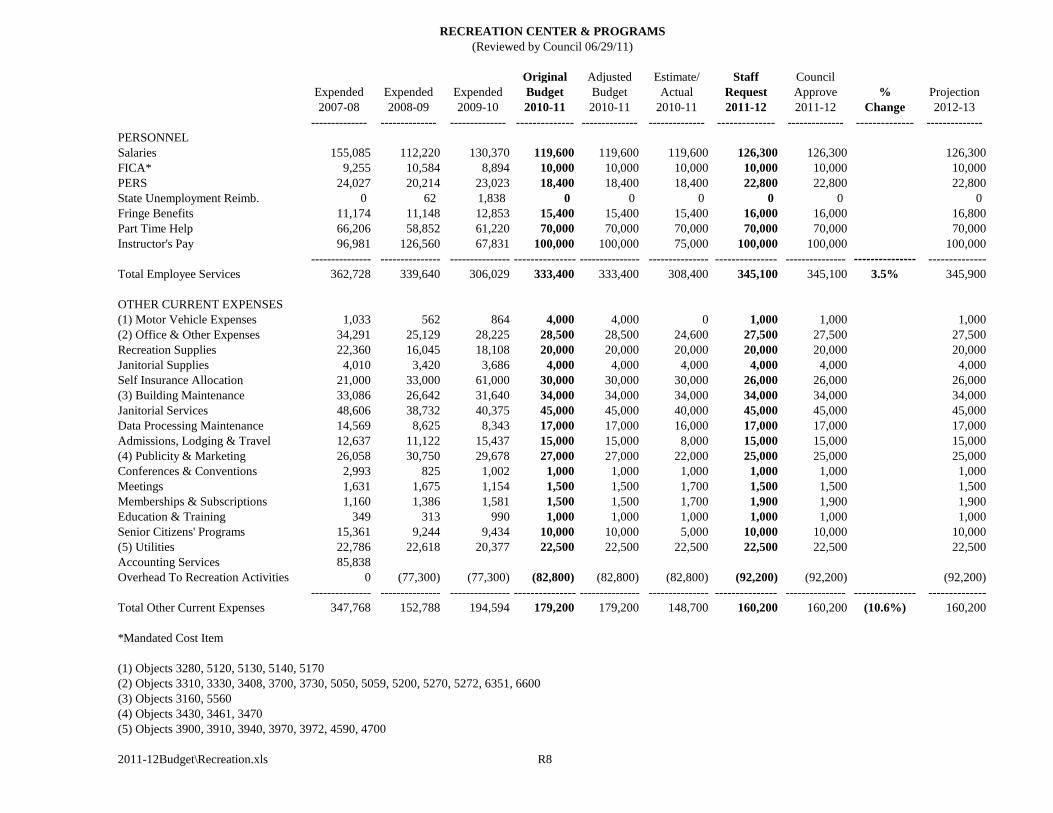
Original Adjusted Estimate/ Staff Council
Expended Expended Expended Budget Budget Actual Request Approve % Projection
2007-08 2008-09 2009-10 2010-11 2010-11 2010-11 2011-12 2011-12 Change 2012-13
-------------- -------------- -------------- -------------- -------------- -------------- -------------- -------------- -------------- --------------
PERSONNEL
Salaries 155,085 112,220 130,370 119,600 119,600 119,600 126,300 126,300 126,300
FICA* 9,255 10,584 8,894 10,000 10,000 10,000 10,000 10,000 10,000
PERS 24,027 20,214 23,023 18,400 18,400 18,400 22,800 22,800 22,800
State Unemployment Reimb. 0 62 1,838 0 0 0 0 0 0
Fringe Benefits 11,174 11,148 12,853 15,400 15,400 15,400 16,000 16,000 16,800
Part Time Help 66,206 58,852 61,220 70,000 70,000 70,000 70,000 70,000 70,000
Instructor's Pay 96,981 126,560 67,831 100,000 100,000 75,000 100,000 100,000 100,000
--------------- --------------- --------------- --------------- --------------- --------------- --------------- --------------- --------------- --------------
Total Employee Services 362,728 339,640 306,029 333,400 333,400 308,400 345,100 345,100 3.5% 345,900
OTHER CURRENT EXPENSES
(1) Motor Vehicle Expenses 1,033 562 864 4,000 4,000 0 1,000 1,000 1,000
(2) Office & Other Expenses 34,291 25,129 28,225 28,500 28,500 24,600 27,500 27,500 27,500
Recreation Supplies 22,360 16,045 18,108 20,000 20,000 20,000 20,000 20,000 20,000
Janitorial Supplies 4,010 3,420 3,686 4,000 4,000 4,000 4,000 4,000 4,000
Self Insurance Allocation 21,000 33,000 61,000 30,000 30,000 30,000 26,000 26,000 26,000
(3) Building Maintenance 33,086 26,642 31,640 34,000 34,000 34,000 34,000 34,000 34,000
Janitorial Services 48,606 38,732 40,375 45,000 45,000 40,000 45,000 45,000 45,000
Data Processing Maintenance 14,569 8,625 8,343 17,000 17,000 16,000 17,000 17,000 17,000
Admissions, Lodging & Travel 12,637 11,122 15,437 15,000 15,000 8,000 15,000 15,000 15,000
(4) Publicity & Marketing 26,058 30,750 29,678 27,000 27,000 22,000 25,000 25,000 25,000
Conferences & Conventions 2,993 825 1,002 1,000 1,000 1,000 1,000 1,000 1,000
Meetings 1,631 1,675 1,154 1,500 1,500 1,700 1,500 1,500 1,500
Memberships & Subscriptions 1,160 1,386 1,581 1,500 1,500 1,700 1,900 1,900 1,900
Education & Training 349 313 990 1,000 1,000 1,000 1,000 1,000 1,000
Senior Citizens' Programs 15,361 9,244 9,434 10,000 10,000 5,000 10,000 10,000 10,000
(5) Utilities 22,786 22,618 20,377 22,500 22,500 22,500 22,500 22,500 22,500
Accounting Services 85,838
Overhead To Recreation Activities 0 (77,300) (77,300) (82,800) (82,800) (82,800) (92,200) (92,200) (92,200)
--------------- --------------- --------------- --------------- --------------- --------------- --------------- --------------- --------------- --------------
Total Other Current Expenses 347,768 152,788 194,594 179,200 179,200 148,700 160,200 160,200 (10.6%) 160,200
*Mandated Cost Item
(1) Objects 3280, 5120, 5130, 5140, 5170
(2) Objects 3310, 3330, 3408, 3700, 3730, 5050, 5059, 5200, 5270, 5272, 6351, 6600
(3) Objects 3160, 5560
(4) Objects 3430, 3461, 3470
(5) Objects 3900, 3910, 3940, 3970, 3972, 4590, 4700
2011-12Budget\Recreation.xls R8
RECREATION CENTER & PROGRAMS
(Reviewed by Council 06/29/11)
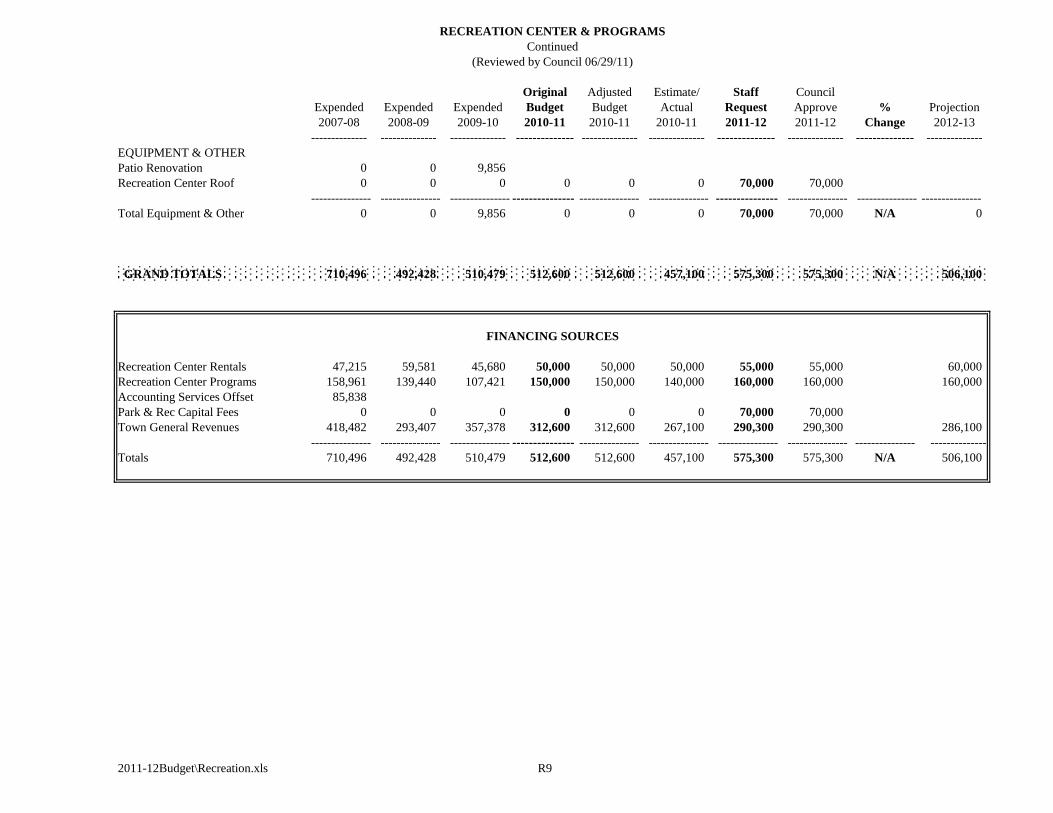
Original Adjusted Estimate/ Staff Council
Expended Expended Expended Budget Budget Actual Request Approve % Projection
2007-08 2008-09 2009-10 2010-11 2010-11 2010-11 2011-12 2011-12 Change 2012-13
-------------- -------------- -------------- -------------- -------------- -------------- -------------- -------------- -------------- --------------
EQUIPMENT & OTHER
Patio Renovation 0 0 9,856
Recreation Center Roof 0 0 0 0 0 0 70,000 70,000
--------------- --------------- --------------- --------------- --------------- --------------- --------------- --------------- --------------- ---------------
Total Equipment & Other 0 0 9,856 0 0 0 70,000 70,000 N/A 0
GRAND TOTALS 710,496 492,428 510,479 512,600 512,600 457,100 575,300 575,300 N/A 506,100
Recreation Center Rentals 47,215 59,581 45,680 50,000 50,000 50,000 55,000 55,000 60,000
Recreation Center Programs 158,961 139,440 107,421 150,000 150,000 140,000 160,000 160,000 160,000
Accounting Services Offset 85,838
Park & Rec Capital Fees 0 0 0 0 0 0 70,000 70,000
Town General Revenues 418,482 293,407 357,378 312,600 312,600 267,100 290,300 290,300 286,100
--------------- --------------- --------------- --------------- --------------- --------------- --------------- --------------- --------------- --------------
Totals 710,496 492,428 510,479 512,600 512,600 457,100 575,300 575,300 N/A 506,100
2011-12Budget\Recreation.xls R9
(Reviewed by Council 06/29/11)
FINANCING SOURCES
RECREATION CENTER & PROGRAMS
Continued
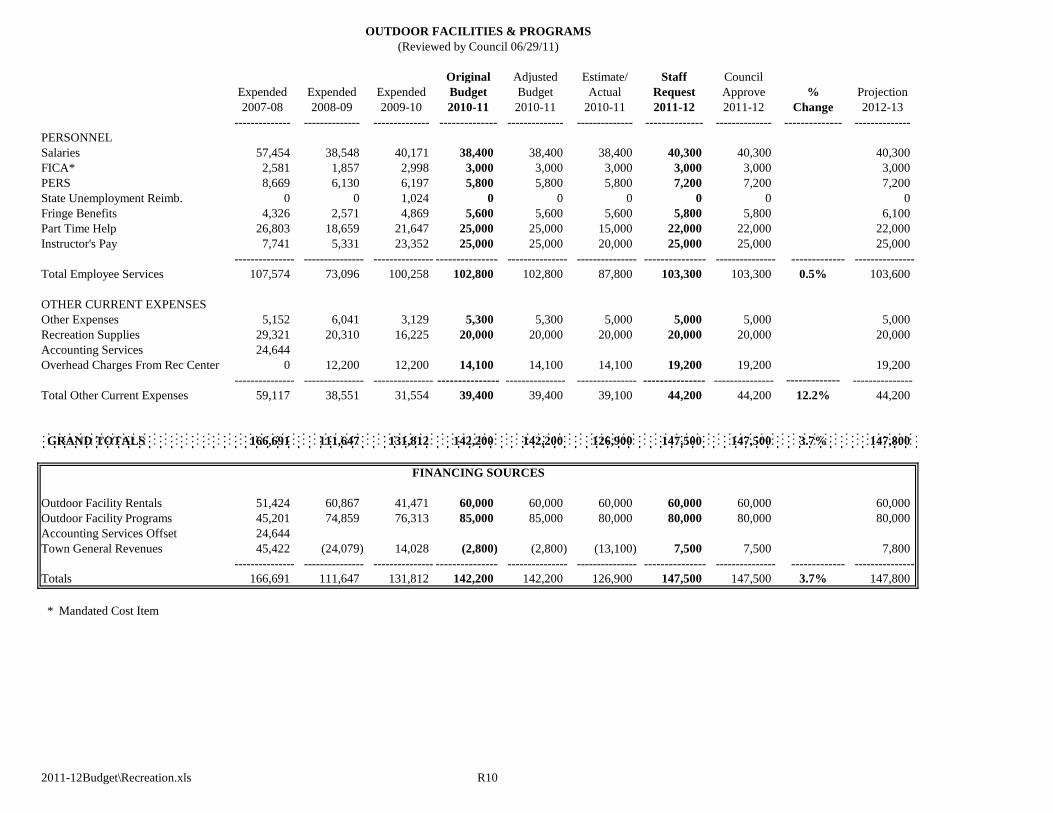
Original Adjusted Estimate/ Staff Council
Expended Expended Expended Budget Budget Actual Request Approve % Projection
2007-08 2008-09 2009-10 2010-11 2010-11 2010-11 2011-12 2011-12 Change 2012-13
-------------- -------------- -------------- -------------- -------------- -------------- -------------- -------------- -------------- --------------
PERSONNEL
Salaries 57,454 38,548 40,171 38,400 38,400 38,400 40,300 40,300 40,300
FICA* 2,581 1,857 2,998 3,000 3,000 3,000 3,000 3,000 3,000
PERS 8,669 6,130 6,197 5,800 5,800 5,800 7,200 7,200 7,200
State Unemployment Reimb. 0 0 1,024 0 0 0 0 0 0
Fringe Benefits 4,326 2,571 4,869 5,600 5,600 5,600 5,800 5,800 6,100
Part Time Help 26,803 18,659 21,647 25,000 25,000 15,000 22,000 22,000 22,000
Instructor's Pay 7,741 5,331 23,352 25,000 25,000 20,000 25,000 25,000 25,000
--------------- --------------- --------------- --------------- --------------- --------------- --------------- --------------- ------------- ---------------
Total Employee Services 107,574 73,096 100,258 102,800 102,800 87,800 103,300 103,300 0.5% 103,600
OTHER CURRENT EXPENSES
Other Expenses 5,152 6,041 3,129 5,300 5,300 5,000 5,000 5,000 5,000
Recreation Supplies 29,321 20,310 16,225 20,000 20,000 20,000 20,000 20,000 20,000
Accounting Services 24,644
Overhead Charges From Rec Center 0 12,200 12,200 14,100 14,100 14,100 19,200 19,200 19,200
--------------- --------------- --------------- --------------- --------------- --------------- --------------- --------------- ------------- ---------------
Total Other Current Expenses 59,117 38,551 31,554 39,400 39,400 39,100 44,200 44,200 12.2% 44,200
GRAND TOTALS 166,691 111,647 131,812 142,200 142,200 126,900 147,500 147,500 3.7% 147,800
Outdoor Facility Rentals 51,424 60,867 41,471 60,000 60,000 60,000 60,000 60,000 60,000
Outdoor Facility Programs 45,201 74,859 76,313 85,000 85,000 80,000 80,000 80,000 80,000
Accounting Services Offset 24,644
Town General Revenues 45,422 (24,079) 14,028 (2,800) (2,800) (13,100) 7,500 7,500 7,800
--------------- --------------- --------------- --------------- --------------- --------------- --------------- --------------- ------------- ---------------
Totals 166,691 111,647 131,812 142,200 142,200 126,900 147,500 147,500 3.7% 147,800
* Mandated Cost Item
2011-12Budget\Recreation.xls R10
OUTDOOR FACILITIES & PROGRAMS
(Reviewed by Council 06/29/11)
FINANCING SOURCES
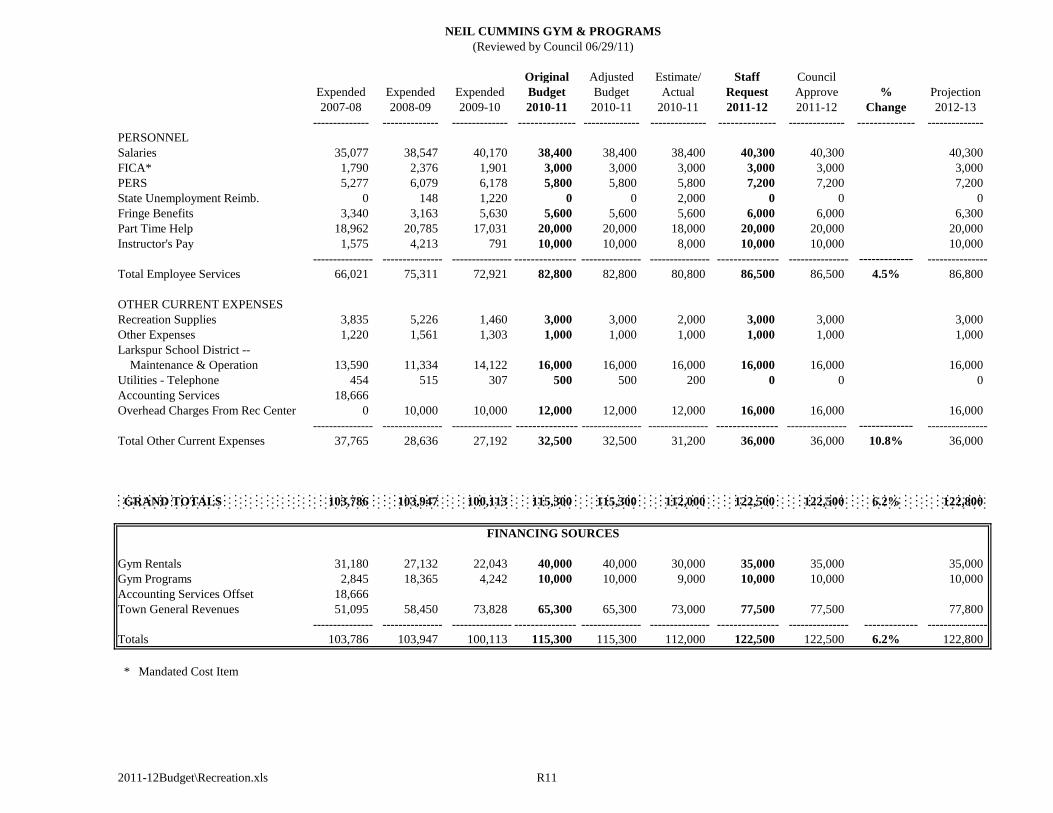
Original Adjusted Estimate/ Staff Council
Expended Expended Expended Budget Budget Actual Request Approve % Projection
2007-08 2008-09 2009-10 2010-11 2010-11 2010-11 2011-12 2011-12 Change 2012-13
-------------- -------------- -------------- -------------- -------------- -------------- -------------- -------------- -------------- --------------
PERSONNEL
Salaries 35,077 38,547 40,170 38,400 38,400 38,400 40,300 40,300 40,300
FICA* 1,790 2,376 1,901 3,000 3,000 3,000 3,000 3,000 3,000
PERS 5,277 6,079 6,178 5,800 5,800 5,800 7,200 7,200 7,200
State Unemployment Reimb. 0 148 1,220 0 0 2,000 0 0 0
Fringe Benefits 3,340 3,163 5,630 5,600 5,600 5,600 6,000 6,000 6,300
Part Time Help 18,962 20,785 17,031 20,000 20,000 18,000 20,000 20,000 20,000
Instructor's Pay 1,575 4,213 791 10,000 10,000 8,000 10,000 10,000 10,000
--------------- --------------- --------------- --------------- --------------- --------------- --------------- --------------- ------------- ---------------
Total Employee Services 66,021 75,311 72,921 82,800 82,800 80,800 86,500 86,500 4.5% 86,800
OTHER CURRENT EXPENSES
Recreation Supplies 3,835 5,226 1,460 3,000 3,000 2,000 3,000 3,000 3,000
Other Expenses 1,220 1,561 1,303 1,000 1,000 1,000 1,000 1,000 1,000
Larkspur School District --
Maintenance & Operation 13,590 11,334 14,122 16,000 16,000 16,000 16,000 16,000 16,000
Utilities - Telephone 454 515 307 500 500 200 0 0 0
Accounting Services 18,666
Overhead Charges From Rec Center 0 10,000 10,000 12,000 12,000 12,000 16,000 16,000 16,000
--------------- --------------- --------------- --------------- --------------- --------------- --------------- --------------- ------------- ---------------
Total Other Current Expenses 37,765 28,636 27,192 32,500 32,500 31,200 36,000 36,000 10.8% 36,000
GRAND TOTALS 103,786 103,947 100,113 115,300 115,300 112,000 122,500 122,500 6.2% 122,800
Gym Rentals 31,180 27,132 22,043 40,000 40,000 30,000 35,000 35,000 35,000
Gym Programs 2,845 18,365 4,242 10,000 10,000 9,000 10,000 10,000 10,000
Accounting Services Offset 18,666
Town General Revenues 51,095 58,450 73,828 65,300 65,300 73,000 77,500 77,500 77,800
--------------- --------------- --------------- --------------- --------------- --------------- --------------- --------------- ------------- ---------------
Totals 103,786 103,947 100,113 115,300 115,300 112,000 122,500 122,500 6.2% 122,800
* Mandated Cost Item
2011-12Budget\Recreation.xls R11
NEIL CUMMINS GYM & PROGRAMS
(Reviewed by Council 06/29/11)
FINANCING SOURCES
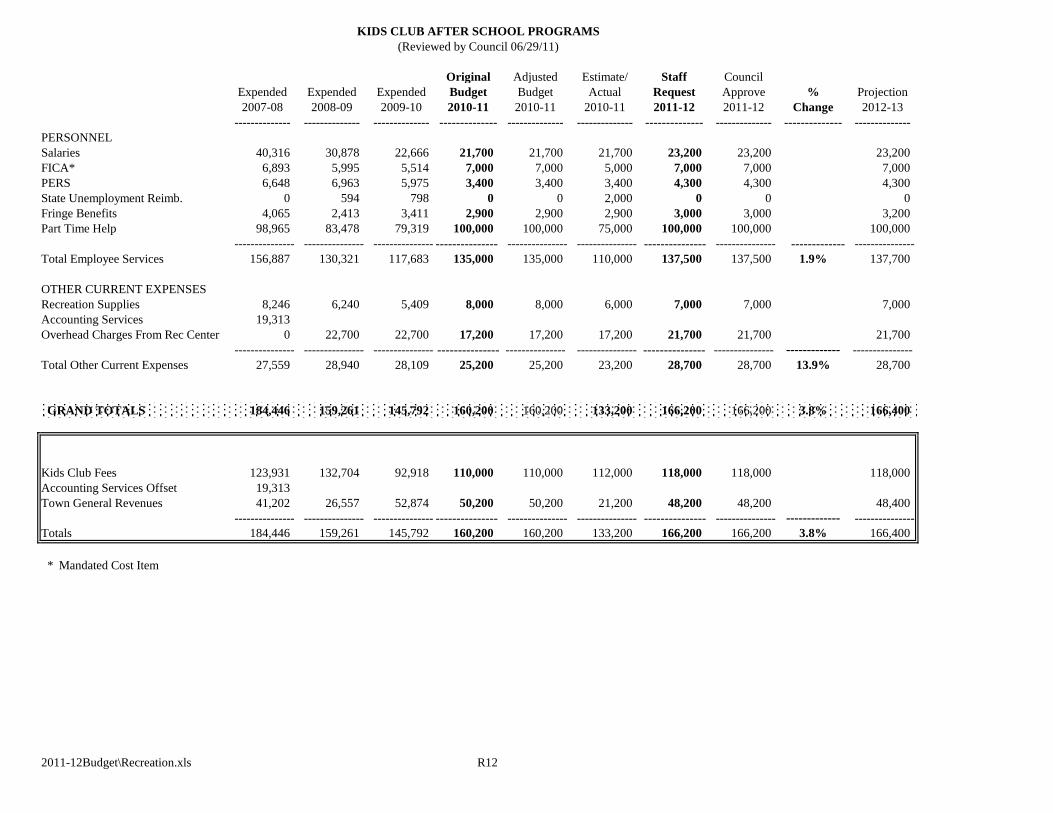
Original Adjusted Estimate/ Staff Council
Expended Expended Expended Budget Budget Actual Request Approve % Projection
2007-08 2008-09 2009-10 2010-11 2010-11 2010-11 2011-12 2011-12 Change 2012-13
-------------- -------------- -------------- -------------- -------------- -------------- -------------- -------------- -------------- --------------
PERSONNEL
Salaries 40,316 30,878 22,666 21,700 21,700 21,700 23,200 23,200 23,200
FICA* 6,893 5,995 5,514 7,000 7,000 5,000 7,000 7,000 7,000
PERS 6,648 6,963 5,975 3,400 3,400 3,400 4,300 4,300 4,300
State Unemployment Reimb. 0 594 798 0 0 2,000 0 0 0
Fringe Benefits 4,065 2,413 3,411 2,900 2,900 2,900 3,000 3,000 3,200
Part Time Help 98,965 83,478 79,319 100,000 100,000 75,000 100,000 100,000 100,000
--------------- --------------- --------------- --------------- --------------- --------------- --------------- --------------- ------------- ---------------
Total Employee Services 156,887 130,321 117,683 135,000 135,000 110,000 137,500 137,500 1.9% 137,700
OTHER CURRENT EXPENSES
Recreation Supplies 8,246 6,240 5,409 8,000 8,000 6,000 7,000 7,000 7,000
Accounting Services 19,313
Overhead Charges From Rec Center 0 22,700 22,700 17,200 17,200 17,200 21,700 21,700 21,700
--------------- --------------- --------------- --------------- --------------- --------------- --------------- --------------- ------------- ---------------
Total Other Current Expenses 27,559 28,940 28,109 25,200 25,200 23,200 28,700 28,700 13.9% 28,700
GRAND TOTALS 184,446 159,261 145,792 160,200 160,200 133,200 166,200 166,200 3.8% 166,400
Kids Club Fees 123,931 132,704 92,918 110,000 110,000 112,000 118,000 118,000 118,000
Accounting Services Offset 19,313
Town General Revenues 41,202 26,557 52,874 50,200 50,200 21,200 48,200 48,200 48,400
--------------- --------------- --------------- --------------- --------------- --------------- --------------- --------------- ------------- ---------------
Totals 184,446 159,261 145,792 160,200 160,200 133,200 166,200 166,200 3.8% 166,400
* Mandated Cost Item
2011-12Budget\Recreation.xls R12
KIDS CLUB AFTER SCHOOL PROGRAMS
(Reviewed by Council 06/29/11)
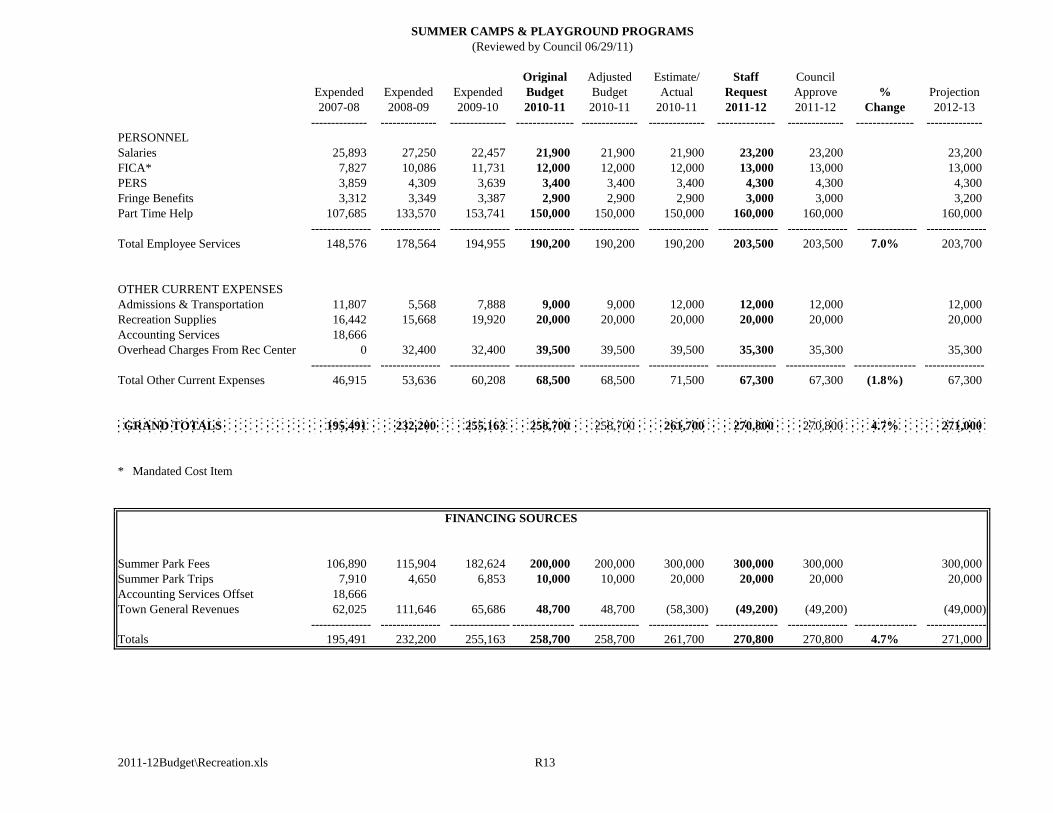
Original Adjusted Estimate/ Staff Council
Expended Expended Expended Budget Budget Actual Request Approve % Projection
2007-08 2008-09 2009-10 2010-11 2010-11 2010-11 2011-12 2011-12 Change 2012-13
-------------- -------------- -------------- -------------- -------------- -------------- -------------- -------------- -------------- --------------
PERSONNEL
Salaries 25,893 27,250 22,457 21,900 21,900 21,900 23,200 23,200 23,200
FICA* 7,827 10,086 11,731 12,000 12,000 12,000 13,000 13,000 13,000
PERS 3,859 4,309 3,639 3,400 3,400 3,400 4,300 4,300 4,300
Fringe Benefits 3,312 3,349 3,387 2,900 2,900 2,900 3,000 3,000 3,200
Part Time Help 107,685 133,570 153,741 150,000 150,000 150,000 160,000 160,000 160,000
--------------- --------------- --------------- --------------- --------------- --------------- --------------- --------------- --------------- ---------------
Total Employee Services 148,576 178,564 194,955 190,200 190,200 190,200 203,500 203,500 7.0% 203,700
OTHER CURRENT EXPENSES
Admissions & Transportation 11,807 5,568 7,888 9,000 9,000 12,000 12,000 12,000 12,000
Recreation Supplies 16,442 15,668 19,920 20,000 20,000 20,000 20,000 20,000 20,000
Accounting Services 18,666
Overhead Charges From Rec Center 0 32,400 32,400 39,500 39,500 39,500 35,300 35,300 35,300
--------------- --------------- --------------- --------------- --------------- --------------- --------------- --------------- --------------- ---------------
Total Other Current Expenses 46,915 53,636 60,208 68,500 68,500 71,500 67,300 67,300 (1.8%) 67,300
GRAND TOTALS 195,491 232,200 255,163 258,700 258,700 261,700 270,800 270,800 4.7% 271,000
* Mandated Cost Item
FINANCING SOURCES
Summer Park Fees 106,890 115,904 182,624 200,000 200,000 300,000 300,000 300,000 300,000
Summer Park Trips 7,910 4,650 6,853 10,000 10,000 20,000 20,000 20,000 20,000
Accounting Services Offset 18,666
Town General Revenues 62,025 111,646 65,686 48,700 48,700 (58,300) (49,200) (49,200) (49,000)
--------------- --------------- --------------- --------------- --------------- --------------- --------------- --------------- --------------- ---------------
Totals 195,491 232,200 255,163 258,700 258,700 261,700 270,800 270,800 4.7% 271,000
2011-12Budget\Recreation.xls R13
SUMMER CAMPS & PLAYGROUND PROGRAMS
(Reviewed by Council 06/29/11)

BLANK PAGE
2011-12Budget\Recreation.xls R14

BLANK PAGE
2011-12Budget\Otherbud.xls Q1

BLANK PAGE
2011-12Budget\Otherbud.xls Q2
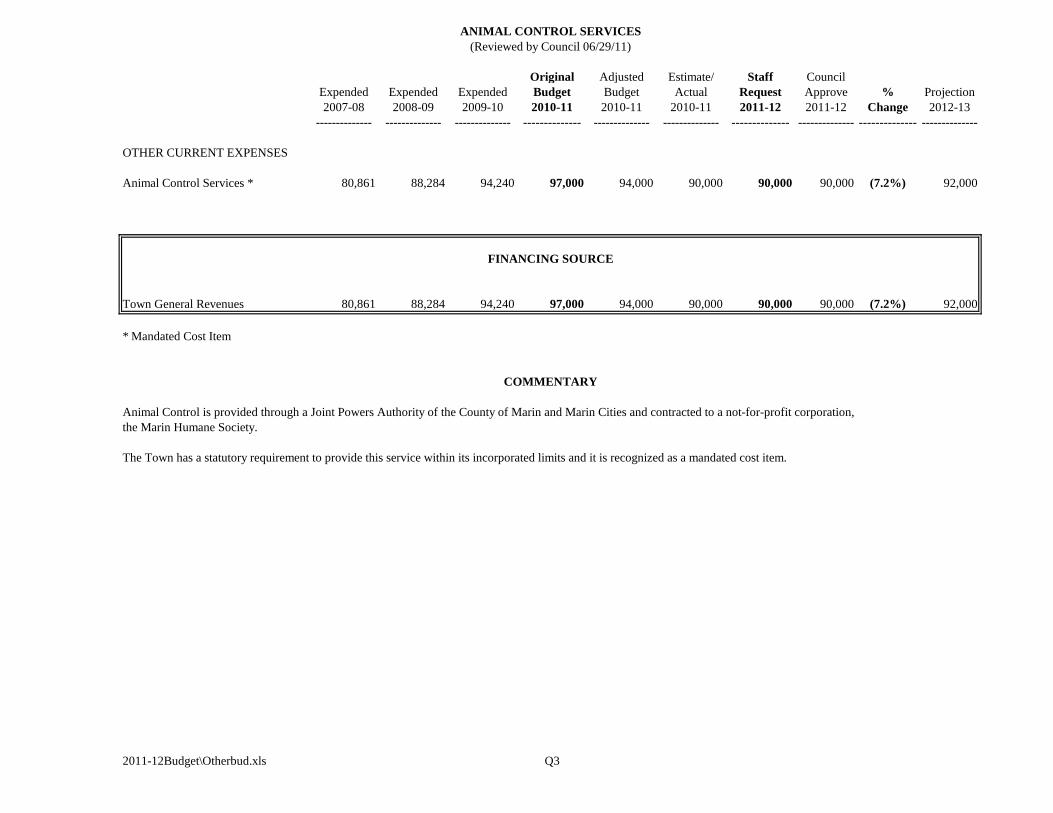
Original Adjusted Estimate/ Staff Council
Expended Expended Expended Budget Budget Actual Request Approve % Projection
2007-08 2008-09 2009-10 2010-11 2010-11 2010-11 2011-12 2011-12 Change 2012-13
-------------- -------------- -------------- -------------- -------------- -------------- -------------- -------------- -------------- --------------
OTHER CURRENT EXPENSES
Animal Control Services * 80,861 88,284 94,240 97,000 94,000 90,000 90,000 90,000 (7.2%) 92,000
Town General Revenues 80,861 88,284 94,240 97,000 94,000 90,000 90,000 90,000 (7.2%) 92,000
* Mandated Cost Item
Animal Control is provided through a Joint Powers Authority of the County of Marin and Marin Cities and contracted to a not-for-profit corporation,
the Marin Humane Society.
The Town has a statutory requirement to provide this service within its incorporated limits and it is recognized as a mandated cost item.
2011-12Budget\Otherbud.xls Q3
ANIMAL CONTROL SERVICES
(Reviewed by Council 06/29/11)
FINANCING SOURCE
COMMENTARY
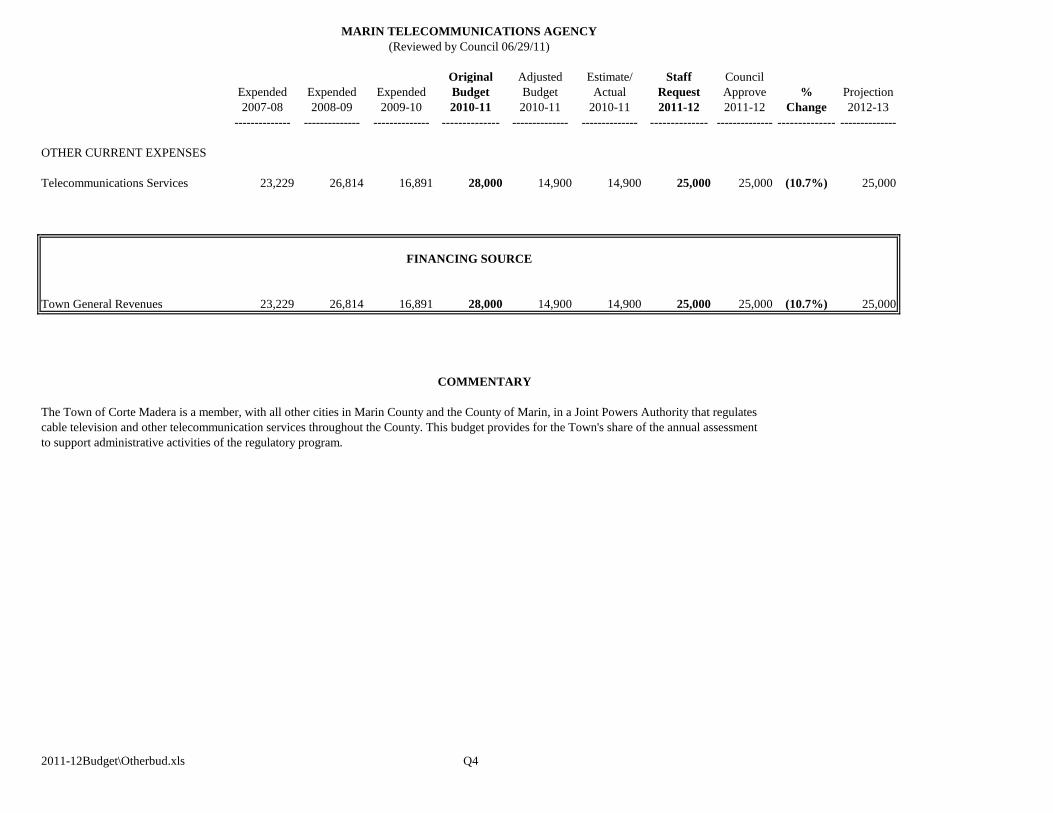
Original Adjusted Estimate/ Staff Council
Expended Expended Expended Budget Budget Actual Request Approve % Projection
2007-08 2008-09 2009-10 2010-11 2010-11 2010-11 2011-12 2011-12 Change 2012-13
-------------- -------------- -------------- -------------- -------------- -------------- -------------- -------------- -------------- --------------
OTHER CURRENT EXPENSES
Telecommunications Services 23,229 26,814 16,891 28,000 14,900 14,900 25,000 25,000 (10.7%) 25,000
Town General Revenues 23,229 26,814 16,891 28,000 14,900 14,900 25,000 25,000 (10.7%) 25,000
COMMENTARY
The Town of Corte Madera is a member, with all other cities in Marin County and the County of Marin, in a Joint Powers Authority that regulates
cable television and other telecommunication services throughout the County. This budget provides for the Town's share of the annual assessment
to support administrative activities of the regulatory program.
2011-12Budget\Otherbud.xls Q4
MARIN TELECOMMUNICATIONS AGENCY
(Reviewed by Council 06/29/11)
FINANCING SOURCE
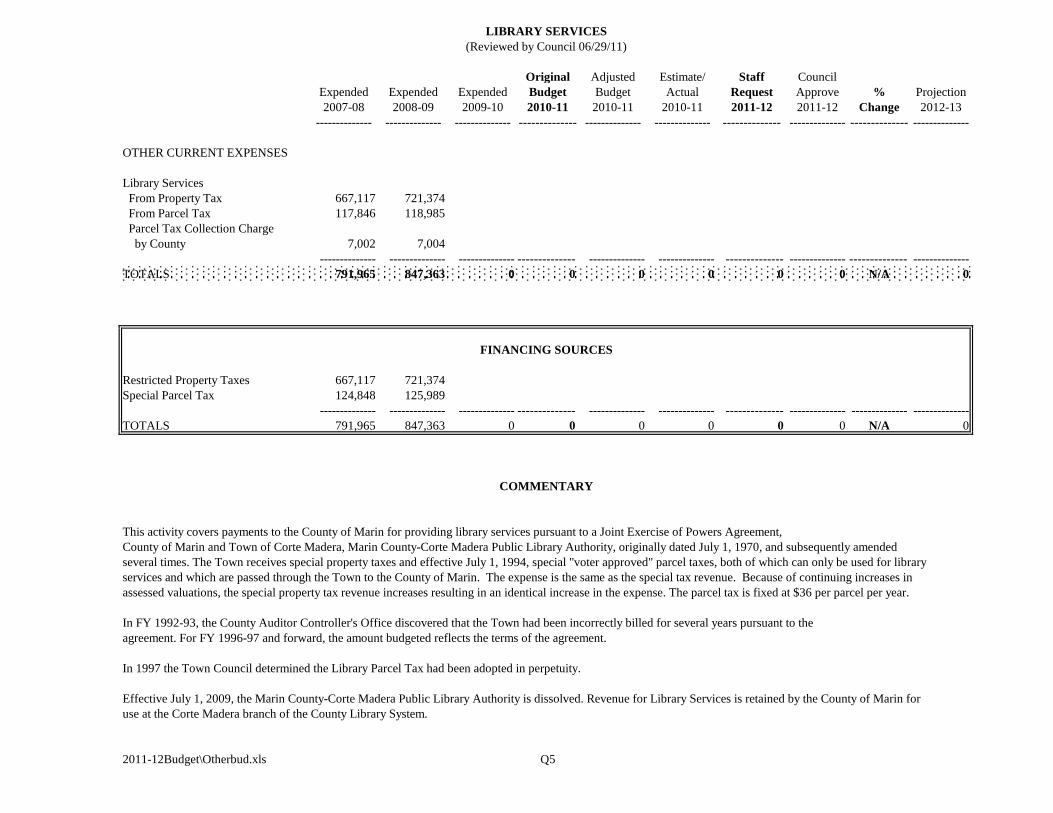
Original Adjusted Estimate/ Staff Council
Expended Expended Expended Budget Budget Actual Request Approve % Projection
2007-08 2008-09 2009-10 2010-11 2010-11 2010-11 2011-12 2011-12 Change 2012-13
-------------- -------------- -------------- -------------- -------------- -------------- -------------- -------------- -------------- --------------
OTHER CURRENT EXPENSES
Library Services
From Property Tax 667,117 721,374
From Parcel Tax 117,846 118,985
Parcel Tax Collection Charge
by County 7,002 7,004
-------------- -------------- -------------- -------------- -------------- -------------- -------------- -------------- -------------- --------------
TOTALS 791,965 847,363 0 0 0 0 0 0 N/A 0
Restricted Property Taxes 667,117 721,374
Special Parcel Tax 124,848 125,989
-------------- -------------- -------------- -------------- -------------- -------------- -------------- -------------- -------------- --------------
TOTALS 791,965 847,363 0 0 0 0 0 0 N/A 0
This activity covers payments to the County of Marin for providing library services pursuant to a Joint Exercise of Powers Agreement,
County of Marin and Town of Corte Madera, Marin County-Corte Madera Public Library Authority, originally dated July 1, 1970, and subsequently amended
several times. The Town receives special property taxes and effective July 1, 1994, special "voter approved" parcel taxes, both of which can only be used for library
services and which are passed through the Town to the County of Marin. The expense is the same as the special tax revenue. Because of continuing increases in
assessed valuations, the special property tax revenue increases resulting in an identical increase in the expense. The parcel tax is fixed at $36 per parcel per year.
In FY 1992-93, the County Auditor Controller's Office discovered that the Town had been incorrectly billed for several years pursuant to the
agreement. For FY 1996-97 and forward, the amount budgeted reflects the terms of the agreement.
In 1997 the Town Council determined the Library Parcel Tax had been adopted in perpetuity.
Effective July 1, 2009, the Marin County-Corte Madera Public Library Authority is dissolved. Revenue for Library Services is retained by the County of Marin for
use at the Corte Madera branch of the County Library System.
2011-12Budget\Otherbud.xls Q5
LIBRARY SERVICES
(Reviewed by Council 06/29/11)
FINANCING SOURCES
COMMENTARY
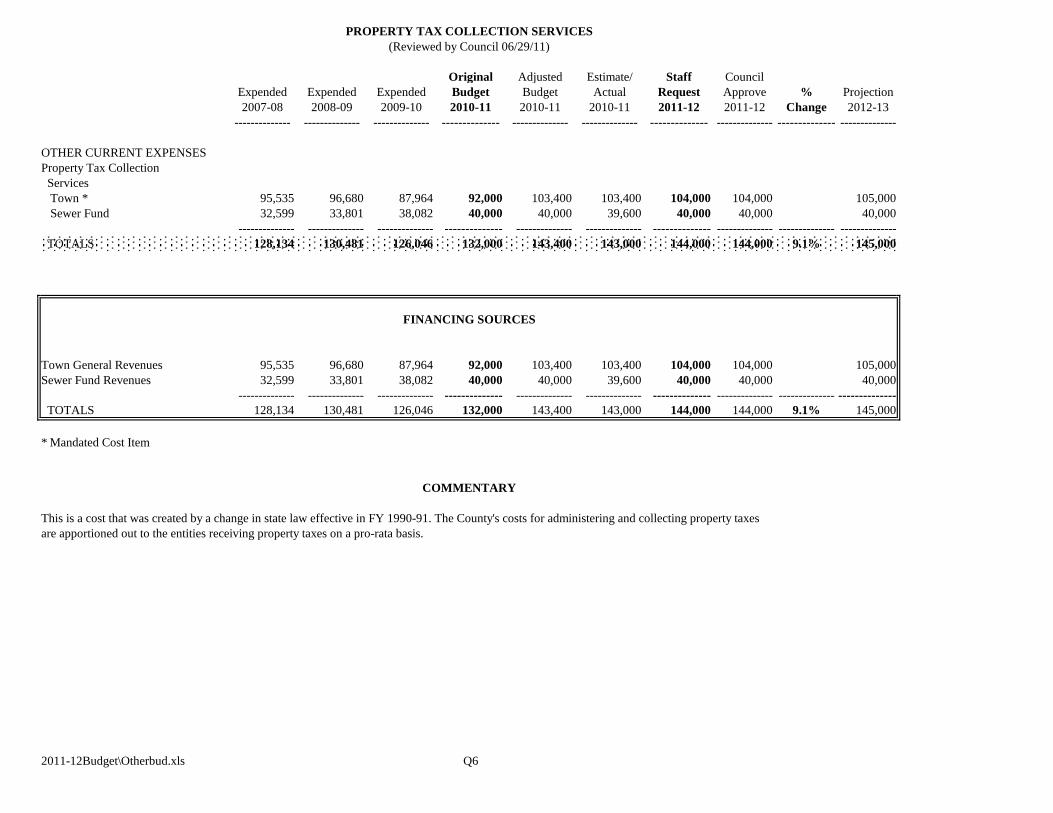
Original Adjusted Estimate/ Staff Council
Expended Expended Expended Budget Budget Actual Request Approve % Projection
2007-08 2008-09 2009-10 2010-11 2010-11 2010-11 2011-12 2011-12 Change 2012-13
-------------- -------------- -------------- -------------- -------------- -------------- -------------- -------------- -------------- --------------
OTHER CURRENT EXPENSES
Property Tax Collection
Services
Town * 95,535 96,680 87,964 92,000 103,400 103,400 104,000 104,000 105,000
Sewer Fund 32,599 33,801 38,082 40,000 40,000 39,600 40,000 40,000 40,000
-------------- -------------- -------------- -------------- -------------- -------------- -------------- -------------- -------------- --------------
TOTALS 128,134 130,481 126,046 132,000 143,400 143,000 144,000 144,000 9.1% 145,000
Town General Revenues 95,535 96,680 87,964 92,000 103,400 103,400 104,000 104,000 105,000
Sewer Fund Revenues 32,599 33,801 38,082 40,000 40,000 39,600 40,000 40,000 40,000
-------------- -------------- -------------- -------------- -------------- -------------- -------------- -------------- -------------- --------------
TOTALS 128,134 130,481 126,046 132,000 143,400 143,000 144,000 144,000 9.1% 145,000
* Mandated Cost Item
This is a cost that was created by a change in state law effective in FY 1990-91. The County's costs for administering and collecting property taxes
are apportioned out to the entities receiving property taxes on a pro-rata basis.
2011-12Budget\Otherbud.xls Q6
PROPERTY TAX COLLECTION SERVICES
(Reviewed by Council 06/29/11)
FINANCING SOURCES
COMMENTARY
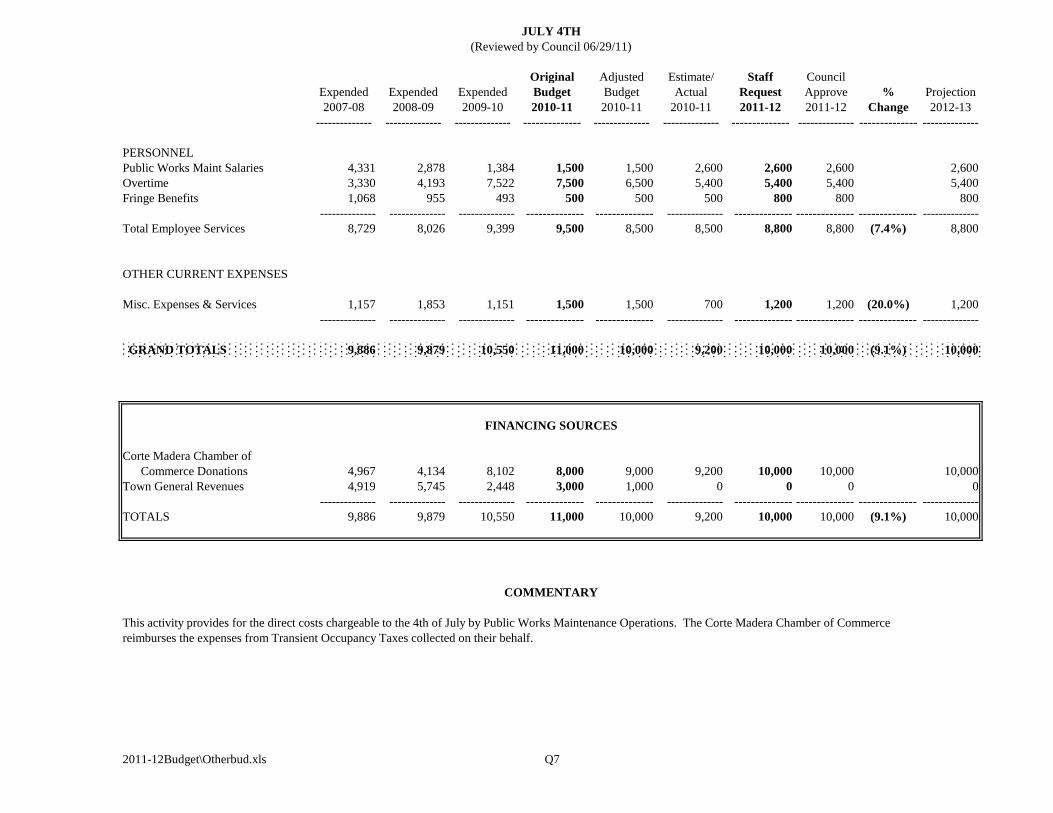
Original Adjusted Estimate/ Staff Council
Expended Expended Expended Budget Budget Actual Request Approve % Projection
2007-08 2008-09 2009-10 2010-11 2010-11 2010-11 2011-12 2011-12 Change 2012-13
-------------- -------------- -------------- -------------- -------------- -------------- -------------- -------------- -------------- --------------
PERSONNEL
Public Works Maint Salaries 4,331 2,878 1,384 1,500 1,500 2,600 2,600 2,600 2,600
Overtime 3,330 4,193 7,522 7,500 6,500 5,400 5,400 5,400 5,400
Fringe Benefits 1,068 955 493 500 500 500 800 800 800
-------------- -------------- -------------- -------------- -------------- -------------- -------------- -------------- -------------- --------------
Total Employee Services 8,729 8,026 9,399 9,500 8,500 8,500 8,800 8,800 (7.4%) 8,800
OTHER CURRENT EXPENSES
Misc. Expenses & Services 1,157 1,853 1,151 1,500 1,500 700 1,200 1,200 (20.0%) 1,200
-------------- -------------- -------------- -------------- -------------- -------------- -------------- -------------- -------------- --------------
GRAND TOTALS 9,886 9,879 10,550 11,000 10,000 9,200 10,000 10,000 (9.1%) 10,000
Corte Madera Chamber of
Commerce Donations 4,967 4,134 8,102 8,000 9,000 9,200 10,000 10,000 10,000
Town General Revenues 4,919 5,745 2,448 3,000 1,000 0 0 0 0
-------------- -------------- -------------- -------------- -------------- -------------- -------------- -------------- -------------- --------------
TOTALS 9,886 9,879 10,550 11,000 10,000 9,200 10,000 10,000 (9.1%) 10,000
This activity provides for the direct costs chargeable to the 4th of July by Public Works Maintenance Operations. The Corte Madera Chamber of Commerce
reimburses the expenses from Transient Occupancy Taxes collected on their behalf.
2011-12Budget\Otherbud.xls Q7
JULY 4TH
(Reviewed by Council 06/29/11)
FINANCING SOURCES
COMMENTARY
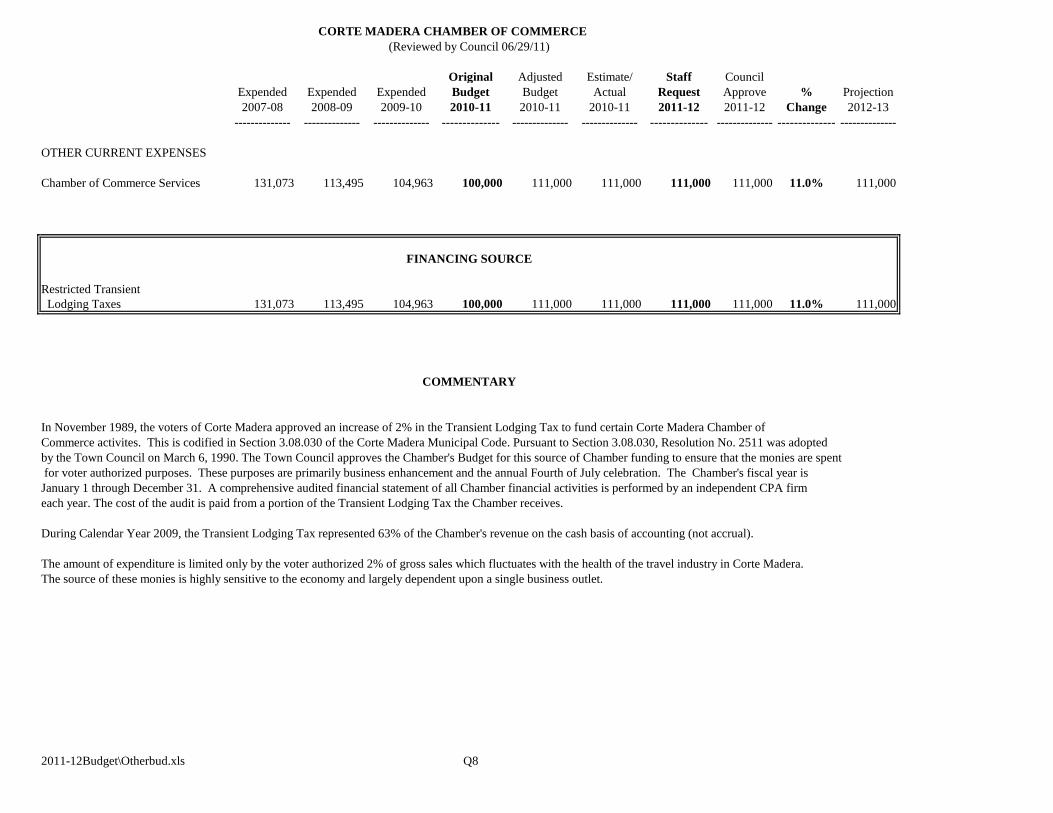
Original Adjusted Estimate/ Staff Council
Expended Expended Expended Budget Budget Actual Request Approve % Projection
2007-08 2008-09 2009-10 2010-11 2010-11 2010-11 2011-12 2011-12 Change 2012-13
-------------- -------------- -------------- -------------- -------------- -------------- -------------- -------------- -------------- --------------
OTHER CURRENT EXPENSES
Chamber of Commerce Services 131,073 113,495 104,963 100,000 111,000 111,000 111,000 111,000 11.0% 111,000
Restricted Transient
Lodging Taxes 131,073 113,495 104,963 100,000 111,000 111,000 111,000 111,000 11.0% 111,000
In November 1989, the voters of Corte Madera approved an increase of 2% in the Transient Lodging Tax to fund certain Corte Madera Chamber of
Commerce activites. This is codified in Section 3.08.030 of the Corte Madera Municipal Code. Pursuant to Section 3.08.030, Resolution No. 2511 was adopted
by the Town Council on March 6, 1990. The Town Council approves the Chamber's Budget for this source of Chamber funding to ensure that the monies are spent
for voter authorized purposes. These purposes are primarily business enhancement and the annual Fourth of July celebration. The Chamber's fiscal year is
January 1 through December 31. A comprehensive audited financial statement of all Chamber financial activities is performed by an independent CPA firm
each year. The cost of the audit is paid from a portion of the Transient Lodging Tax the Chamber receives.
During Calendar Year 2009, the Transient Lodging Tax represented 63% of the Chamber's revenue on the cash basis of accounting (not accrual).
The amount of expenditure is limited only by the voter authorized 2% of gross sales which fluctuates with the health of the travel industry in Corte Madera.
The source of these monies is highly sensitive to the economy and largely dependent upon a single business outlet.
2011-12Budget\Otherbud.xls Q8
CORTE MADERA CHAMBER OF COMMERCE
(Reviewed by Council 06/29/11)
FINANCING SOURCE
COMMENTARY
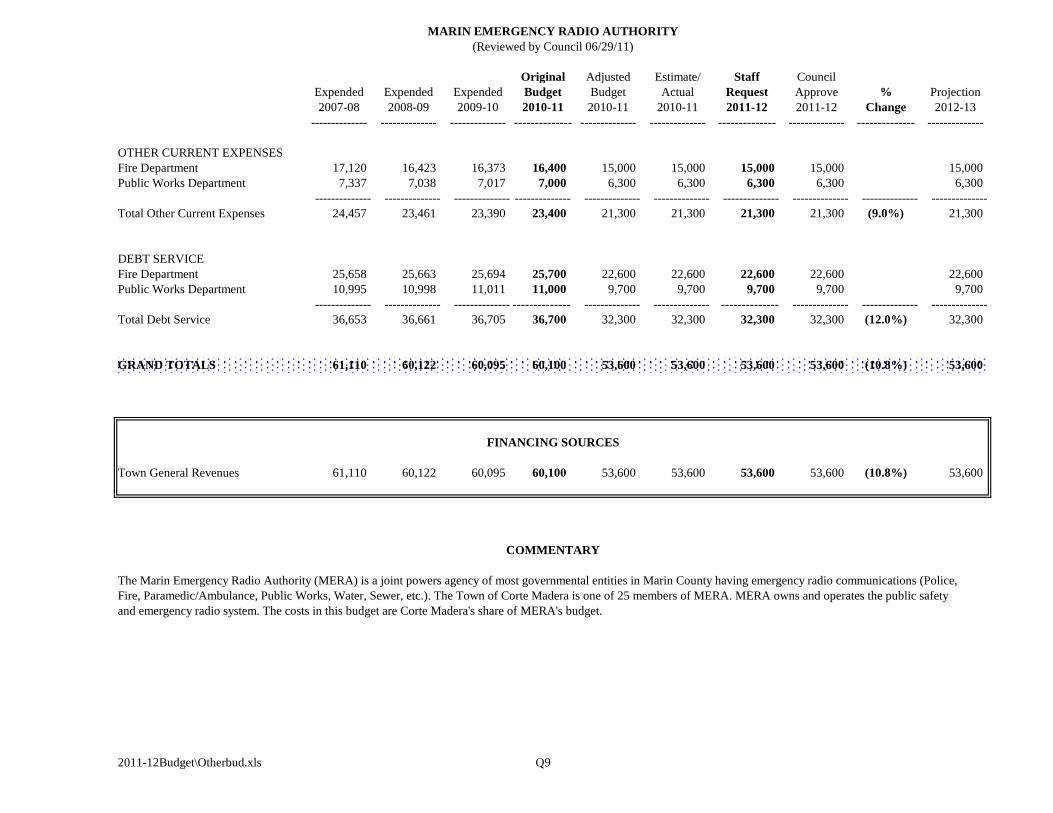
Original Adjusted Estimate/ Staff Council
Expended Expended Expended Budget Budget Actual Request Approve % Projection
2007-08 2008-09 2009-10 2010-11 2010-11 2010-11 2011-12 2011-12 Change 2012-13
-------------- -------------- -------------- -------------- -------------- -------------- -------------- -------------- -------------- --------------
OTHER CURRENT EXPENSES
Fire Department 17,120 16,423 16,373 16,400 15,000 15,000 15,000 15,000 15,000
Public Works Department 7,337 7,038 7,017 7,000 6,300 6,300 6,300 6,300 6,300
-------------- -------------- -------------- -------------- -------------- -------------- -------------- -------------- -------------- --------------
Total Other Current Expenses 24,457 23,461 23,390 23,400 21,300 21,300 21,300 21,300 (9.0%) 21,300
DEBT SERVICE
Fire Department 25,658 25,663 25,694 25,700 22,600 22,600 22,600 22,600 22,600
Public Works Department 10,995 10,998 11,011 11,000 9,700 9,700 9,700 9,700 9,700
-------------- -------------- -------------- -------------- -------------- -------------- -------------- -------------- -------------- --------------
Total Debt Service 36,653 36,661 36,705 36,700 32,300 32,300 32,300 32,300 (12.0%) 32,300
GRAND TOTALS 61,110 60,122 60,095 60,100 53,600 53,600 53,600 53,600 (10.8%) 53,600
Town General Revenues 61,110 60,122 60,095 60,100 53,600 53,600 53,600 53,600 (10.8%) 53,600
The Marin Emergency Radio Authority (MERA) is a joint powers agency of most governmental entities in Marin County having emergency radio communications (Police,
Fire, Paramedic/Ambulance, Public Works, Water, Sewer, etc.). The Town of Corte Madera is one of 25 members of MERA. MERA owns and operates the public safety
and emergency radio system. The costs in this budget are Corte Madera's share of MERA's budget.
2011-12Budget\Otherbud.xls Q9
COMMENTARY
FINANCING SOURCES
MARIN EMERGENCY RADIO AUTHORITY
(Reviewed by Council 06/29/11)

Original Adjusted Estimate/ Staff Council
Expended Expended Expended Budget Budget Actual Request Approve % Projection
2007-08 2008-09 2009-10 2010-11 2010-11 2010-11 2011-12 2011-12 Change 2012-13
-------------- -------------- -------------- -------------- -------------- -------------- -------------- -------------- -------------- --------------
PROPERTY ACQUISITIONS
Police Facility Site 0 967,620
-------------- -------------- --------------
0 967,620 0
DEBT SERVICE
152 Willow Avenue
Principal Retirement 88,317 92,200 96,255 100,500 100,500 100,500 104,900 104,900 109,500
Interest Expense 34,954 31,071 27,016 22,800 22,800 22,800 18,400 18,400 13,800
-------------- -------------- -------------- -------------- -------------- -------------- -------------- -------------- -------------- --------------
123,271 123,271 123,271 123,300 123,300 123,300 123,300 123,300 0.0% 123,300
Park Madera Center (Modified Accrual)
Principal Retirement 140,000 150,000 155,000 165,000 165,000 165,000 175,000 175,000 180,000
Interest Expense 630,373 622,748 614,577 606,200 606,200 606,200 597,200 597,200 587,600
Administrative Charges 2,950 2,950 3,450 3,000 3,000 3,000 3,000 3,000 3,000
-------------- -------------- -------------- -------------- -------------- -------------- -------------- -------------- -------------- --------------
773,323 775,698 773,027 774,200 774,200 774,200 775,200 775,200 0.0% 770,600
Tax & Revenue Anticipation Notes (TRANs)
Principal Retirement 3,100,000 3,750,000 3,435,000 3,435,000 0 0 3,435,000 3,435,000 3,435,000
Interest Expense 139,113 112,188 85,637 86,000 0 0 86,000 86,000 86,000
Administrative Charges 43,405 44,654 63,014 63,000 0 0 63,000 63,000 63,000
-------------- -------------- -------------- -------------- -------------- -------------- -------------- -------------- -------------- --------------
3,282,518 3,906,842 3,583,651 3,584,000 0 0 3,584,000 3,584,000 0.0% 3,584,000
Superior Court Traffic Fines
Principal Retirement 32,198 33,467 34,787 36,200 36,200 36,200 15,500 15,500 N/A
Interest Expense 5,323 4,054 2,734 1,300 1,300 1,300 100 100 N/A
-------------- -------------- -------------- -------------- -------------- -------------- -------------- -------------- -------------- --------------
37,521 37,521 37,521 37,500 37,500 37,500 15,600 15,600 (58.4%) N/A
2011-12Budget\Otherbud.xls Q10
DEBT SERVICE
(Reviewed by Council 06/29/11)
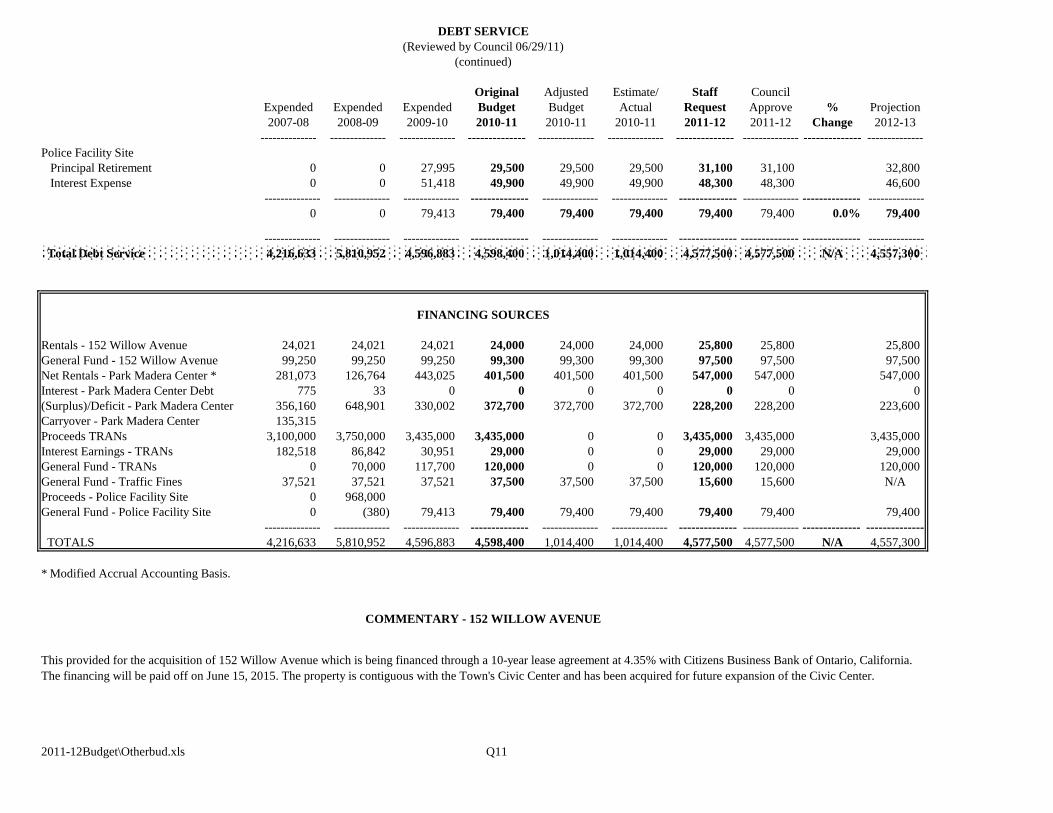
Original Adjusted Estimate/ Staff Council
Expended Expended Expended Budget Budget Actual Request Approve % Projection
2007-08 2008-09 2009-10 2010-11 2010-11 2010-11 2011-12 2011-12 Change 2012-13
-------------- -------------- -------------- -------------- -------------- -------------- -------------- -------------- -------------- --------------
Police Facility Site
Principal Retirement 0 0 27,995 29,500 29,500 29,500 31,100 31,100 32,800
Interest Expense 0 0 51,418 49,900 49,900 49,900 48,300 48,300 46,600
-------------- -------------- -------------- -------------- -------------- -------------- -------------- -------------- -------------- --------------
0 0 79,413 79,400 79,400 79,400 79,400 79,400 0.0% 79,400
-------------- -------------- -------------- -------------- -------------- -------------- -------------- -------------- -------------- --------------
Total Debt Service 4,216,633 5,810,952 4,596,883 4,598,400 1,014,400 1,014,400 4,577,500 4,577,500 N/A 4,557,300
Rentals - 152 Willow Avenue 24,021 24,021 24,021 24,000 24,000 24,000 25,800 25,800 25,800
General Fund - 152 Willow Avenue 99,250 99,250 99,250 99,300 99,300 99,300 97,500 97,500 97,500
Net Rentals - Park Madera Center * 281,073 126,764 443,025 401,500 401,500 401,500 547,000 547,000 547,000
Interest - Park Madera Center Debt 775 33 0 0 0 0 0 0 0
(Surplus)/Deficit - Park Madera Center 356,160 648,901 330,002 372,700 372,700 372,700 228,200 228,200 223,600
Carryover - Park Madera Center 135,315
Proceeds TRANs 3,100,000 3,750,000 3,435,000 3,435,000 0 0 3,435,000 3,435,000 3,435,000
Interest Earnings - TRANs 182,518 86,842 30,951 29,000 0 0 29,000 29,000 29,000
General Fund - TRANs 0 70,000 117,700 120,000 0 0 120,000 120,000 120,000
General Fund - Traffic Fines 37,521 37,521 37,521 37,500 37,500 37,500 15,600 15,600 N/A
Proceeds - Police Facility Site 0 968,000
General Fund - Police Facility Site 0 (380) 79,413 79,400 79,400 79,400 79,400 79,400 79,400
-------------- -------------- -------------- -------------- -------------- -------------- -------------- -------------- -------------- --------------
TOTALS 4,216,633 5,810,952 4,596,883 4,598,400 1,014,400 1,014,400 4,577,500 4,577,500 N/A 4,557,300
* Modified Accrual Accounting Basis.
2011-12Budget\Otherbud.xls Q11
DEBT SERVICE
(Reviewed by Council 06/29/11)
(continued)
FINANCING SOURCES
This provided for the acquisition of 152 Willow Avenue which is being financed through a 10-year lease agreement at 4.35% with Citizens Business Bank of Ontario, California.
The financing will be paid off on June 15, 2015. The property is contiguous with the Town's Civic Center and has been acquired for future expansion of the Civic Center.
COMMENTARY - 152 WILLOW AVENUE
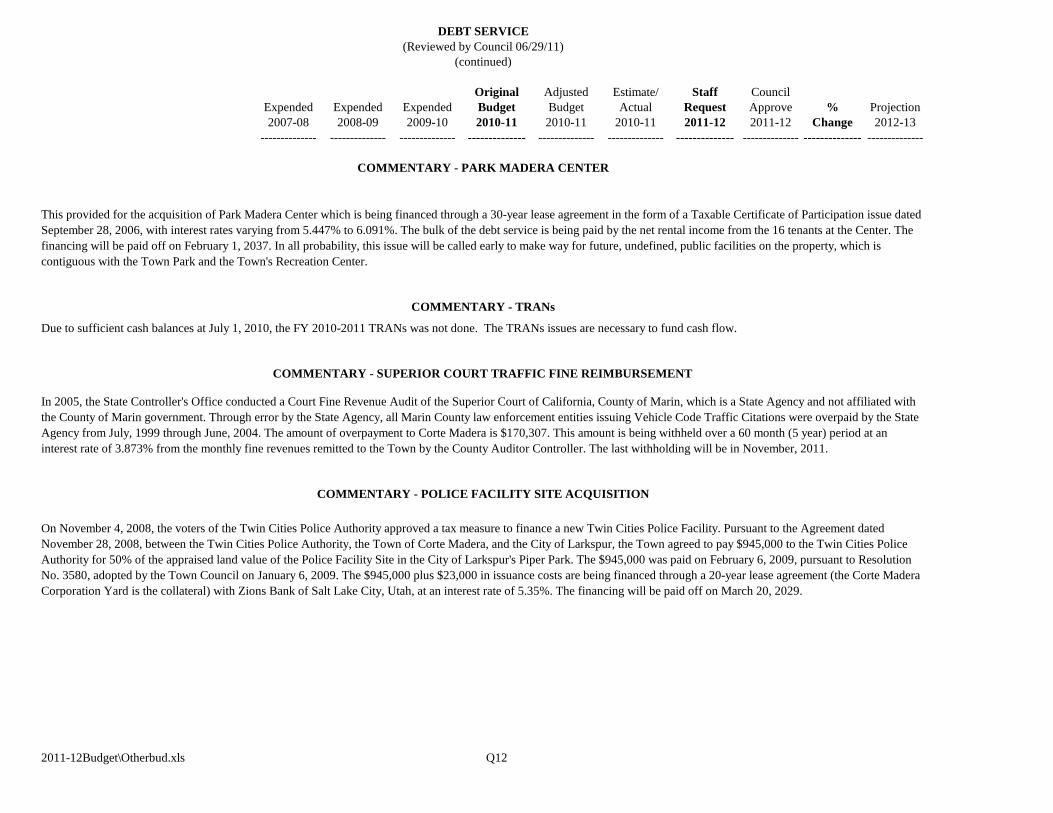
Original Adjusted Estimate/ Staff Council
Expended Expended Expended Budget Budget Actual Request Approve % Projection
2007-08 2008-09 2009-10 2010-11 2010-11 2010-11 2011-12 2011-12 Change 2012-13
-------------- -------------- -------------- -------------- -------------- -------------- -------------- -------------- -------------- --------------
2011-12Budget\Otherbud.xls Q12
COMMENTARY - POLICE FACILITY SITE ACQUISITION
(continued)
Due to sufficient cash balances at July 1, 2010, the FY 2010-2011 TRANs was not done. The TRANs issues are necessary to fund cash flow.
COMMENTARY - SUPERIOR COURT TRAFFIC FINE REIMBURSEMENT
In 2005, the State Controller's Office conducted a Court Fine Revenue Audit of the Superior Court of California, County of Marin, which is a State Agency and not affiliated with
the County of Marin government. Through error by the State Agency, all Marin County law enforcement entities issuing Vehicle Code Traffic Citations were overpaid by the State
Agency from July, 1999 through June, 2004. The amount of overpayment to Corte Madera is $170,307. This amount is being withheld over a 60 month (5 year) period at an
interest rate of 3.873% from the monthly fine revenues remitted to the Town by the County Auditor Controller. The last withholding will be in November, 2011.
COMMENTARY - PARK MADERA CENTER
On November 4, 2008, the voters of the Twin Cities Police Authority approved a tax measure to finance a new Twin Cities Police Facility. Pursuant to the Agreement dated
November 28, 2008, between the Twin Cities Police Authority, the Town of Corte Madera, and the City of Larkspur, the Town agreed to pay $945,000 to the Twin Cities Police
Authority for 50% of the appraised land value of the Police Facility Site in the City of Larkspur's Piper Park. The $945,000 was paid on February 6, 2009, pursuant to Resolution
No. 3580, adopted by the Town Council on January 6, 2009. The $945,000 plus $23,000 in issuance costs are being financed through a 20-year lease agreement (the Corte Madera
Corporation Yard is the collateral) with Zions Bank of Salt Lake City, Utah, at an interest rate of 5.35%. The financing will be paid off on March 20, 2029.
COMMENTARY - TRANs
This provided for the acquisition of Park Madera Center which is being financed through a 30-year lease agreement in the form of a Taxable Certificate of Participation issue dated
September 28, 2006, with interest rates varying from 5.447% to 6.091%. The bulk of the debt service is being paid by the net rental income from the 16 tenants at the Center. The
financing will be paid off on February 1, 2037. In all probability, this issue will be called early to make way for future, undefined, public facilities on the property, which is
contiguous with the Town Park and the Town's Recreation Center.
DEBT SERVICE
(Reviewed by Council 06/29/11)
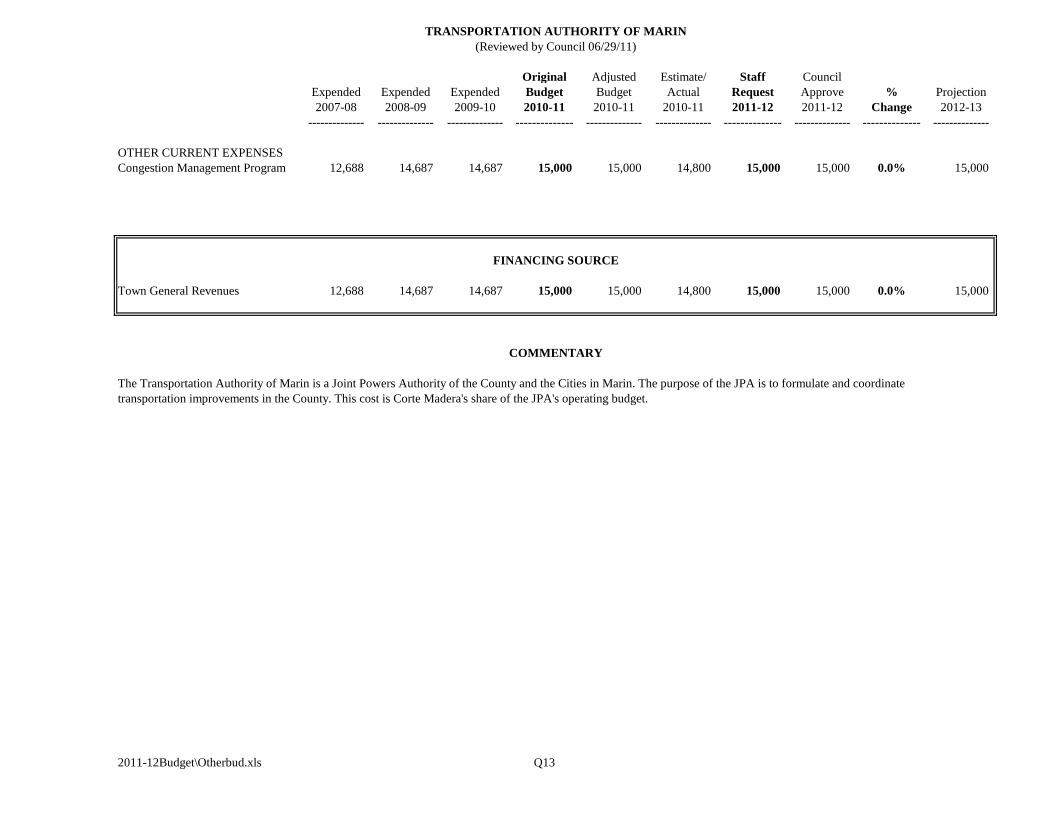
TRANSPORTATION AUTHORITY OF MARIN
Original Adjusted Estimate/ Staff Council
Expended Expended Expended Budget Budget Actual Request Approve % Projection
2007-08 2008-09 2009-10 2010-11 2010-11 2010-11 2011-12 2011-12 Change 2012-13
-------------- -------------- -------------- -------------- -------------- -------------- -------------- -------------- -------------- --------------
OTHER CURRENT EXPENSES
Congestion Management Program 12,688 14,687 14,687 15,000 15,000 14,800 15,000 15,000 0.0% 15,000
FINANCING SOURCE
Town General Revenues 12,688 14,687 14,687 15,000 15,000 14,800 15,000 15,000 0.0% 15,000
The Transportation Authority of Marin is a Joint Powers Authority of the County and the Cities in Marin. The purpose of the JPA is to formulate and coordinate
transportation improvements in the County. This cost is Corte Madera's share of the JPA's operating budget.
2011-12Budget\Otherbud.xls Q13
COMMENTARY
(Reviewed by Council 06/29/11)
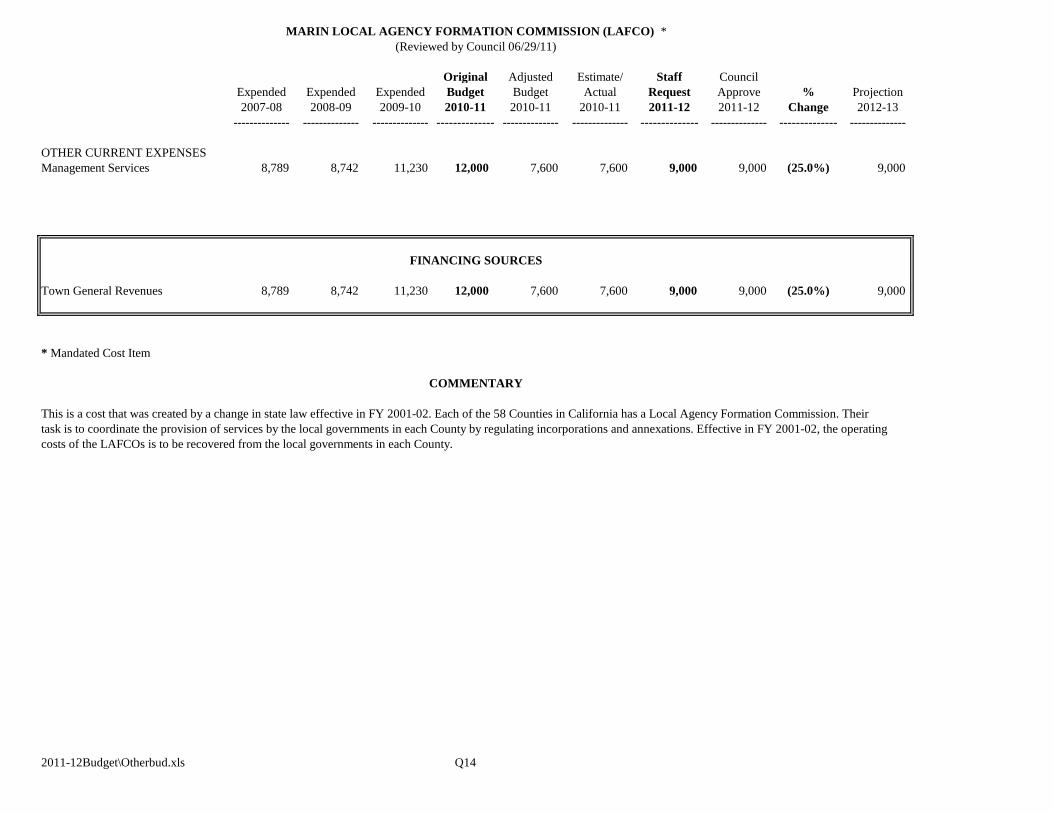
MARIN LOCAL AGENCY FORMATION COMMISSION (LAFCO) *
Original Adjusted Estimate/ Staff Council
Expended Expended Expended Budget Budget Actual Request Approve % Projection
2007-08 2008-09 2009-10 2010-11 2010-11 2010-11 2011-12 2011-12 Change 2012-13
-------------- -------------- -------------- -------------- -------------- -------------- -------------- -------------- -------------- --------------
OTHER CURRENT EXPENSES
Management Services 8,789 8,742 11,230 12,000 7,600 7,600 9,000 9,000 (25.0%) 9,000
FINANCING SOURCES
Town General Revenues 8,789 8,742 11,230 12,000 7,600 7,600 9,000 9,000 (25.0%) 9,000
* Mandated Cost Item
This is a cost that was created by a change in state law effective in FY 2001-02. Each of the 58 Counties in California has a Local Agency Formation Commission. Their
task is to coordinate the provision of services by the local governments in each County by regulating incorporations and annexations. Effective in FY 2001-02, the operating
costs of the LAFCOs is to be recovered from the local governments in each County.
2011-12Budget\Otherbud.xls Q14
COMMENTARY
(Reviewed by Council 06/29/11)
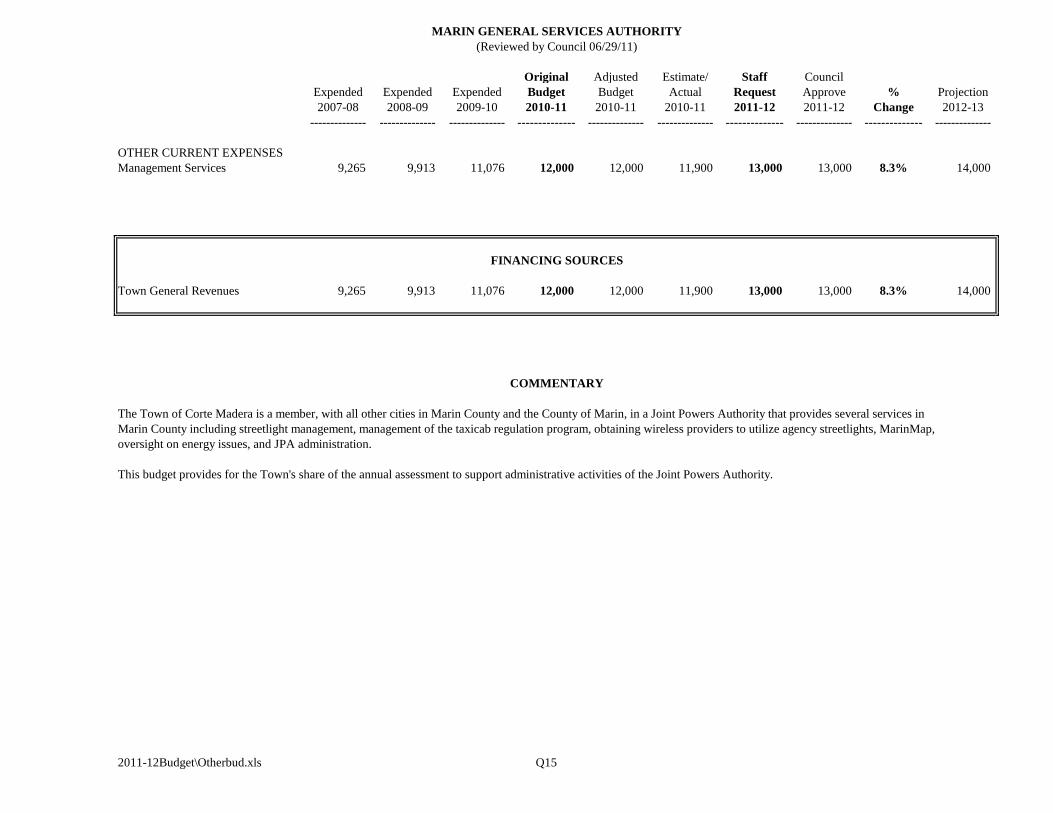
MARIN GENERAL SERVICES AUTHORITY
Original Adjusted Estimate/ Staff Council
Expended Expended Expended Budget Budget Actual Request Approve % Projection
2007-08 2008-09 2009-10 2010-11 2010-11 2010-11 2011-12 2011-12 Change 2012-13
-------------- -------------- -------------- -------------- -------------- -------------- -------------- -------------- -------------- --------------
OTHER CURRENT EXPENSES
Management Services 9,265 9,913 11,076 12,000 12,000 11,900 13,000 13,000 8.3% 14,000
FINANCING SOURCES
Town General Revenues 9,265 9,913 11,076 12,000 12,000 11,900 13,000 13,000 8.3% 14,000
The Town of Corte Madera is a member, with all other cities in Marin County and the County of Marin, in a Joint Powers Authority that provides several services in
Marin County including streetlight management, management of the taxicab regulation program, obtaining wireless providers to utilize agency streetlights, MarinMap,
oversight on energy issues, and JPA administration.
This budget provides for the Town's share of the annual assessment to support administrative activities of the Joint Powers Authority.
2011-12Budget\Otherbud.xls Q15
COMMENTARY
(Reviewed by Council 06/29/11)
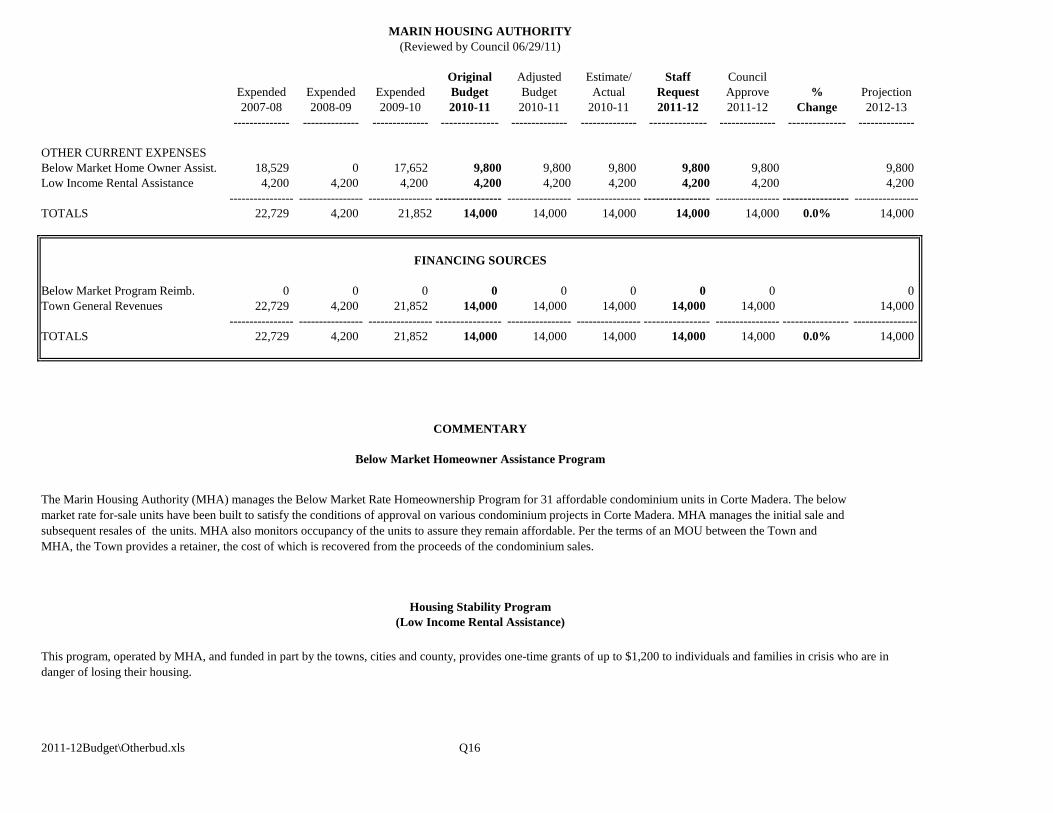
MARIN HOUSING AUTHORITY
Original Adjusted Estimate/ Staff Council
Expended Expended Expended Budget Budget Actual Request Approve % Projection
2007-08 2008-09 2009-10 2010-11 2010-11 2010-11 2011-12 2011-12 Change 2012-13
-------------- -------------- -------------- -------------- -------------- -------------- -------------- -------------- -------------- --------------
OTHER CURRENT EXPENSES
Below Market Home Owner Assist. 18,529 0 17,652 9,800 9,800 9,800 9,800 9,800 9,800
Low Income Rental Assistance 4,200 4,200 4,200 4,200 4,200 4,200 4,200 4,200 4,200
---------------- ---------------- ---------------- ---------------- ---------------- ---------------- ---------------- ---------------- ---------------- ----------------
TOTALS 22,729 4,200 21,852 14,000 14,000 14,000 14,000 14,000 0.0% 14,000
FINANCING SOURCES
Below Market Program Reimb. 0 0 0 0 0 0 0 0 0
Town General Revenues 22,729 4,200 21,852 14,000 14,000 14,000 14,000 14,000 14,000
---------------- ---------------- ---------------- ---------------- ---------------- ---------------- ---------------- ---------------- ---------------- ----------------
TOTALS 22,729 4,200 21,852 14,000 14,000 14,000 14,000 14,000 0.0% 14,000
2011-12Budget\Otherbud.xls Q16
(Reviewed by Council 06/29/11)
Below Market Homeowner Assistance Program
This program, operated by MHA, and funded in part by the towns, cities and county, provides one-time grants of up to $1,200 to individuals and families in crisis who are in
danger of losing their housing.
Housing Stability Program
(Low Income Rental Assistance)
COMMENTARY
The Marin Housing Authority (MHA) manages the Below Market Rate Homeownership Program for 31 affordable condominium units in Corte Madera. The below
market rate for-sale units have been built to satisfy the conditions of approval on various condominium projects in Corte Madera. MHA manages the initial sale and
subsequent resales of the units. MHA also monitors occupancy of the units to assure they remain affordable. Per the terms of an MOU between the Town and
MHA, the Town provides a retainer, the cost of which is recovered from the proceeds of the condominium sales.
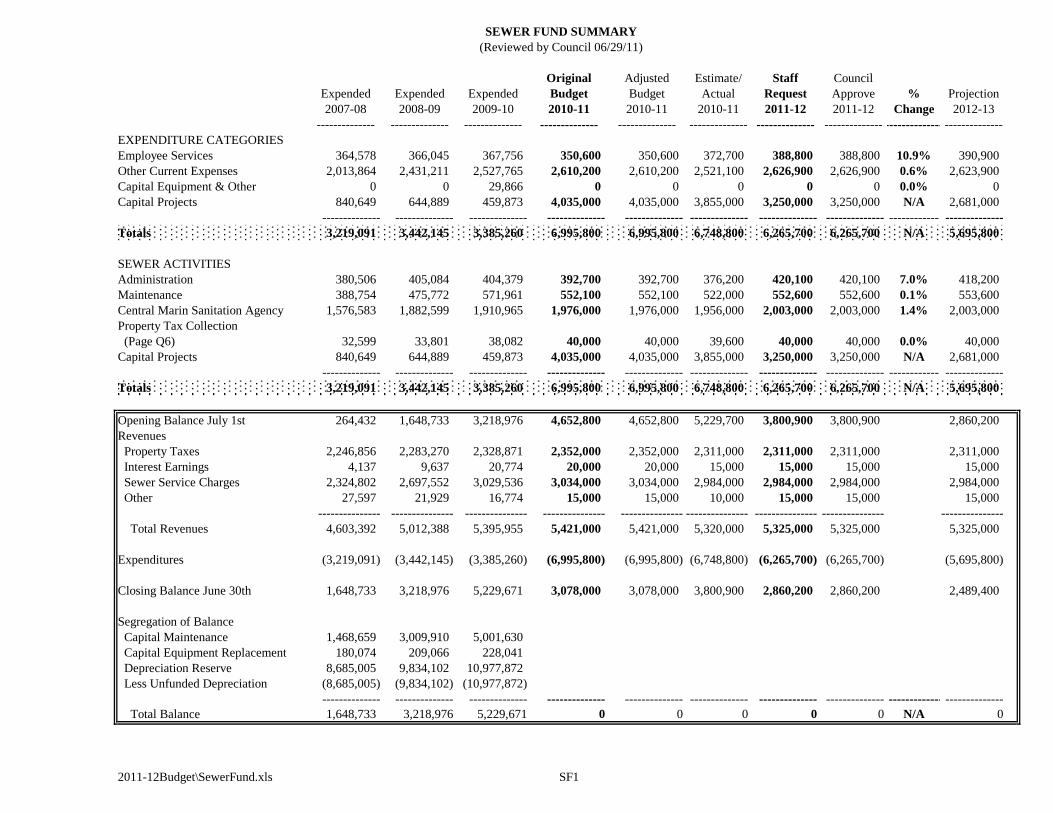
Original Adjusted Estimate/ Staff Council
Expended Expended Expended Budget Budget Actual Request Approve % Projection
2007-08 2008-09 2009-10 2010-11 2010-11 2010-11 2011-12 2011-12 Change 2012-13
-------------- -------------- -------------- -------------- -------------- -------------- -------------- -------------- -------------- --------------
EXPENDITURE CATEGORIES
Employee Services 364,578 366,045 367,756 350,600 350,600 372,700 388,800 388,800 10.9% 390,900
Other Current Expenses 2,013,864 2,431,211 2,527,765 2,610,200 2,610,200 2,521,100 2,626,900 2,626,900 0.6% 2,623,900
Capital Equipment & Other 0 0 29,866 0 0 0 0 0 0.0% 0
Capital Projects 840,649 644,889 459,873 4,035,000 4,035,000 3,855,000 3,250,000 3,250,000 N/A 2,681,000
-------------- -------------- -------------- -------------- -------------- -------------- -------------- -------------- ------------ --------------
Totals 3,219,091 3,442,145 3,385,260 6,995,800 6,995,800 6,748,800 6,265,700 6,265,700 N/A 5,695,800
SEWER ACTIVITIES
Administration 380,506 405,084 404,379 392,700 392,700 376,200 420,100 420,100 7.0% 418,200
Maintenance 388,754 475,772 571,961 552,100 552,100 522,000 552,600 552,600 0.1% 553,600
Central Marin Sanitation Agency 1,576,583 1,882,599 1,910,965 1,976,000 1,976,000 1,956,000 2,003,000 2,003,000 1.4% 2,003,000
Property Tax Collection
(Page Q6) 32,599 33,801 38,082 40,000 40,000 39,600 40,000 40,000 0.0% 40,000
Capital Projects 840,649 644,889 459,873 4,035,000 4,035,000 3,855,000 3,250,000 3,250,000 N/A 2,681,000
-------------- -------------- -------------- -------------- -------------- -------------- -------------- -------------- ------------ --------------
Totals 3,219,091 3,442,145 3,385,260 6,995,800 6,995,800 6,748,800 6,265,700 6,265,700 N/A 5,695,800
Opening Balance July 1st 264,432 1,648,733 3,218,976 4,652,800 4,652,800 5,229,700 3,800,900 3,800,900 2,860,200
Revenues
Property Taxes 2,246,856 2,283,270 2,328,871 2,352,000 2,352,000 2,311,000 2,311,000 2,311,000 2,311,000
Interest Earnings 4,137 9,637 20,774 20,000 20,000 15,000 15,000 15,000 15,000
Sewer Service Charges 2,324,802 2,697,552 3,029,536 3,034,000 3,034,000 2,984,000 2,984,000 2,984,000 2,984,000
Other 27,597 21,929 16,774 15,000 15,000 10,000 15,000 15,000 15,000
--------------- --------------- --------------- --------------- --------------- --------------- --------------- --------------- ---------------
Total Revenues 4,603,392 5,012,388 5,395,955 5,421,000 5,421,000 5,320,000 5,325,000 5,325,000 5,325,000
Expenditures (3,219,091) (3,442,145) (3,385,260) (6,995,800) (6,995,800) (6,748,800) (6,265,700) (6,265,700) (5,695,800)
Closing Balance June 30th 1,648,733 3,218,976 5,229,671 3,078,000 3,078,000 3,800,900 2,860,200 2,860,200 2,489,400
Segregation of Balance
Capital Maintenance 1,468,659 3,009,910 5,001,630
Capital Equipment Replacement 180,074 209,066 228,041
Depreciation Reserve 8,685,005 9,834,102 10,977,872
Less Unfunded Depreciation (8,685,005) (9,834,102) (10,977,872)
-------------- -------------- -------------- -------------- -------------- -------------- -------------- -------------- -----------------------------
Total Balance 1,648,733 3,218,976 5,229,671 0 0 0 0 0 N/A 0
2011-12Budget\SewerFund.xls SF1
SEWER FUND SUMMARY
(Reviewed by Council 06/29/11)
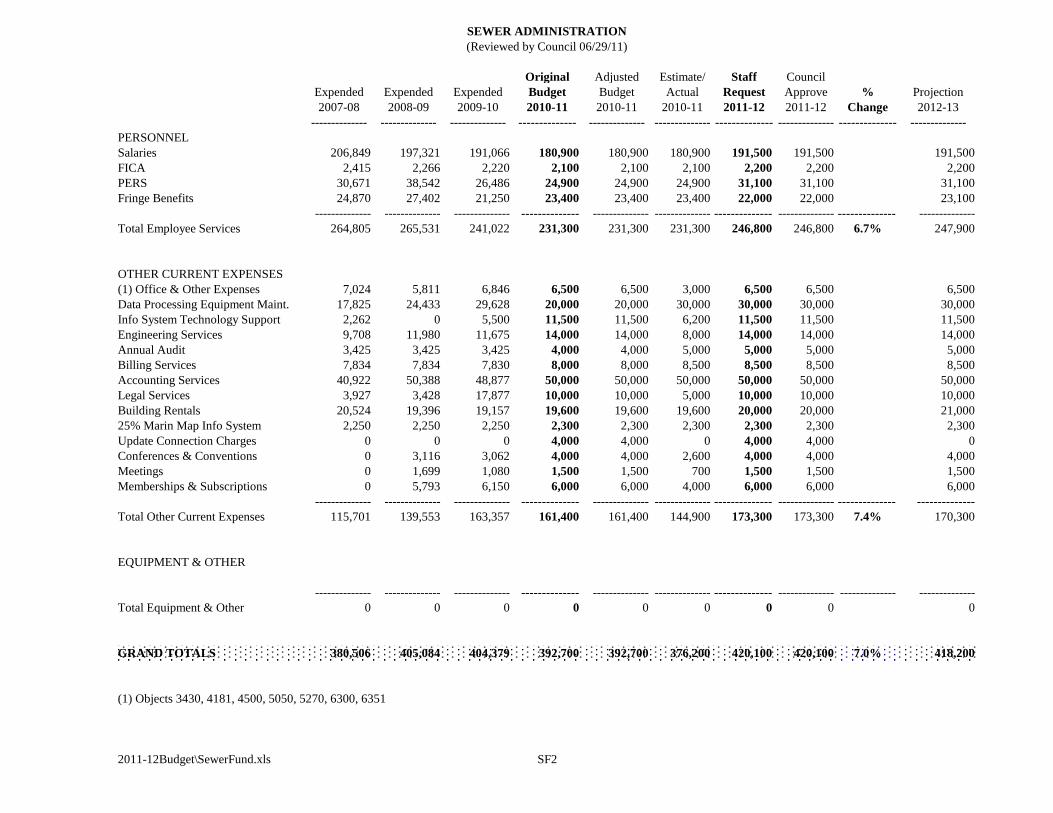
Original Adjusted Estimate/ Staff Council
Expended Expended Expended Budget Budget Actual Request Approve % Projection
2007-08 2008-09 2009-10 2010-11 2010-11 2010-11 2011-12 2011-12 Change 2012-13
-------------- -------------- -------------- -------------- -------------- -------------- -------------- -------------- -------------- --------------
PERSONNEL
Salaries 206,849 197,321 191,066 180,900 180,900 180,900 191,500 191,500 191,500
FICA 2,415 2,266 2,220 2,100 2,100 2,100 2,200 2,200 2,200
PERS 30,671 38,542 26,486 24,900 24,900 24,900 31,100 31,100 31,100
Fringe Benefits 24,870 27,402 21,250 23,400 23,400 23,400 22,000 22,000 23,100
-------------- -------------- -------------- -------------- -------------- -------------- -------------- -------------- -------------- --------------
Total Employee Services 264,805 265,531 241,022 231,300 231,300 231,300 246,800 246,800 6.7% 247,900
OTHER CURRENT EXPENSES
(1) Office & Other Expenses 7,024 5,811 6,846 6,500 6,500 3,000 6,500 6,500 6,500
Data Processing Equipment Maint. 17,825 24,433 29,628 20,000 20,000 30,000 30,000 30,000 30,000
Info System Technology Support 2,262 0 5,500 11,500 11,500 6,200 11,500 11,500 11,500
Engineering Services 9,708 11,980 11,675 14,000 14,000 8,000 14,000 14,000 14,000
Annual Audit 3,425 3,425 3,425 4,000 4,000 5,000 5,000 5,000 5,000
Billing Services 7,834 7,834 7,830 8,000 8,000 8,500 8,500 8,500 8,500
Accounting Services 40,922 50,388 48,877 50,000 50,000 50,000 50,000 50,000 50,000
Legal Services 3,927 3,428 17,877 10,000 10,000 5,000 10,000 10,000 10,000
Building Rentals 20,524 19,396 19,157 19,600 19,600 19,600 20,000 20,000 21,000
25% Marin Map Info System 2,250 2,250 2,250 2,300 2,300 2,300 2,300 2,300 2,300
Update Connection Charges 0 0 0 4,000 4,000 0 4,000 4,000 0
Conferences & Conventions 0 3,116 3,062 4,000 4,000 2,600 4,000 4,000 4,000
Meetings 0 1,699 1,080 1,500 1,500 700 1,500 1,500 1,500
Memberships & Subscriptions 0 5,793 6,150 6,000 6,000 4,000 6,000 6,000 6,000
-------------- -------------- -------------- -------------- -------------- -------------- -------------- -------------- -------------- --------------
Total Other Current Expenses 115,701 139,553 163,357 161,400 161,400 144,900 173,300 173,300 7.4% 170,300
EQUIPMENT & OTHER
-------------- -------------- -------------- -------------- -------------- -------------- -------------- -------------- -------------- --------------
Total Equipment & Other 0 0 0 0 0 0 0 0 0
GRAND TOTALS 380,506 405,084 404,379 392,700 392,700 376,200 420,100 420,100 7.0% 418,200
(1) Objects 3430, 4181, 4500, 5050, 5270, 6300, 6351
2011-12Budget\SewerFund.xls SF2
SEWER ADMINISTRATION
(Reviewed by Council 06/29/11)
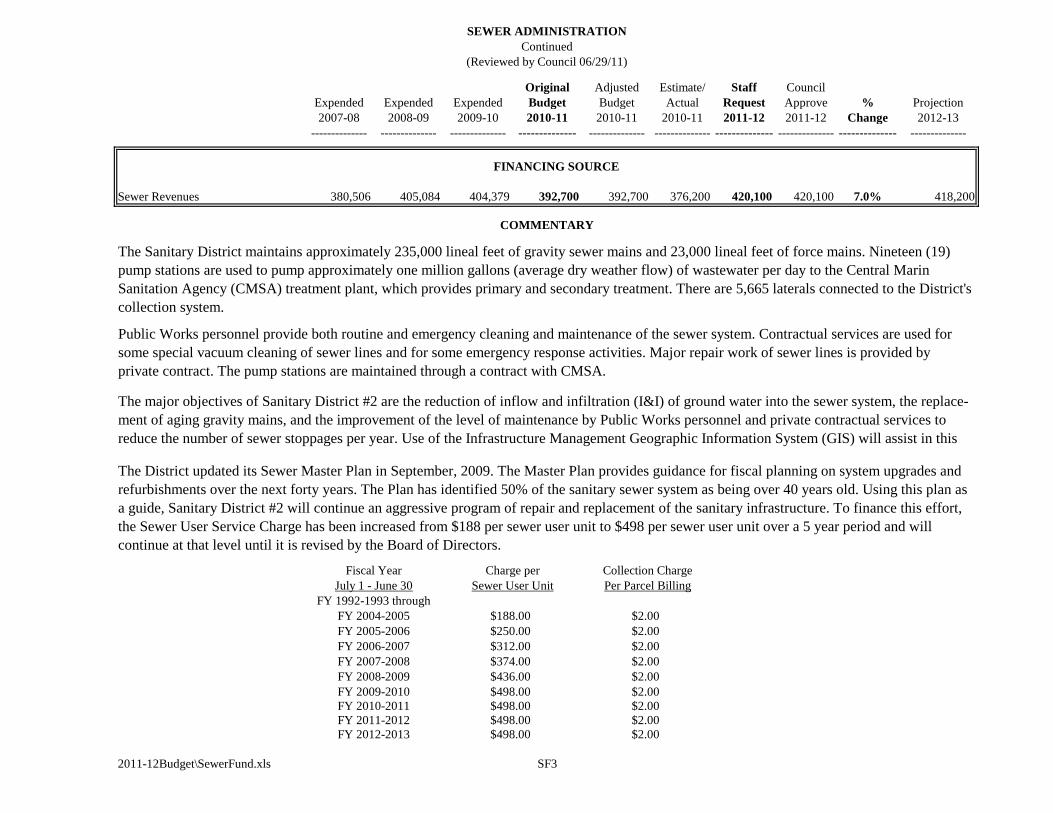
Original Adjusted Estimate/ Staff Council
Expended Expended Expended Budget Budget Actual Request Approve % Projection
2007-08 2008-09 2009-10 2010-11 2010-11 2010-11 2011-12 2011-12 Change 2012-13
-------------- -------------- -------------- -------------- -------------- -------------- -------------- -------------- -------------- --------------
FINANCING SOURCE
Sewer Revenues 380,506 405,084 404,379 392,700 392,700 376,200 420,100 420,100 7.0% 418,200
2011-12Budget\SewerFund.xls SF3
(Reviewed by Council 06/29/11)
COMMENTARY
SEWER ADMINISTRATION
Continued
$2.00$436.00
$2.00
$2.00
$2.00
$2.00
FY 1992-1993 through
FY 2008-2009
FY 2004-2005
FY 2005-2006
FY 2006-2007
FY 2007-2008
The Sanitary District maintains approximately 235,000 lineal feet of gravity sewer mains and 23,000 lineal feet of force mains. Nineteen (19)
pump stations are used to pump approximately one million gallons (average dry weather flow) of wastewater per day to the Central Marin
Sanitation Agency (CMSA) treatment plant, which provides primary and secondary treatment. There are 5,665 laterals connected to the District's
collection system.
Public Works personnel provide both routine and emergency cleaning and maintenance of the sewer system. Contractual services are used for
some special vacuum cleaning of sewer lines and for some emergency response activities. Major repair work of sewer lines is provided by
private contract. The pump stations are maintained through a contract with CMSA.
The major objectives of Sanitary District #2 are the reduction of inflow and infiltration (I&I) of ground water into the sewer system, the replace-
ment of aging gravity mains, and the improvement of the level of maintenance by Public Works personnel and private contractual services to
reduce the number of sewer stoppages per year. Use of the Infrastructure Management Geographic Information System (GIS) will assist in this
The District updated its Sewer Master Plan in September, 2009. The Master Plan provides guidance for fiscal planning on system upgrades and
refurbishments over the next forty years. The Plan has identified 50% of the sanitary sewer system as being over 40 years old. Using this plan as
a guide, Sanitary District #2 will continue an aggressive program of repair and replacement of the sanitary infrastructure. To finance this effort,
the Sewer User Service Charge has been increased from $188 per sewer user unit to $498 per sewer user unit over a 5 year period and will
continue at that level until it is revised by the Board of Directors.
Collection Charge
Per Parcel Billing
Fiscal Year
July 1 - June 30
Charge per
Sewer User Unit
$498.00 $2.00FY 2010-2011
$188.00
$250.00
FY 2009-2010 $2.00$498.00
$312.00
$374.00
FY 2012-2013 $498.00 $2.00
FY 2011-2012 $498.00 $2.00
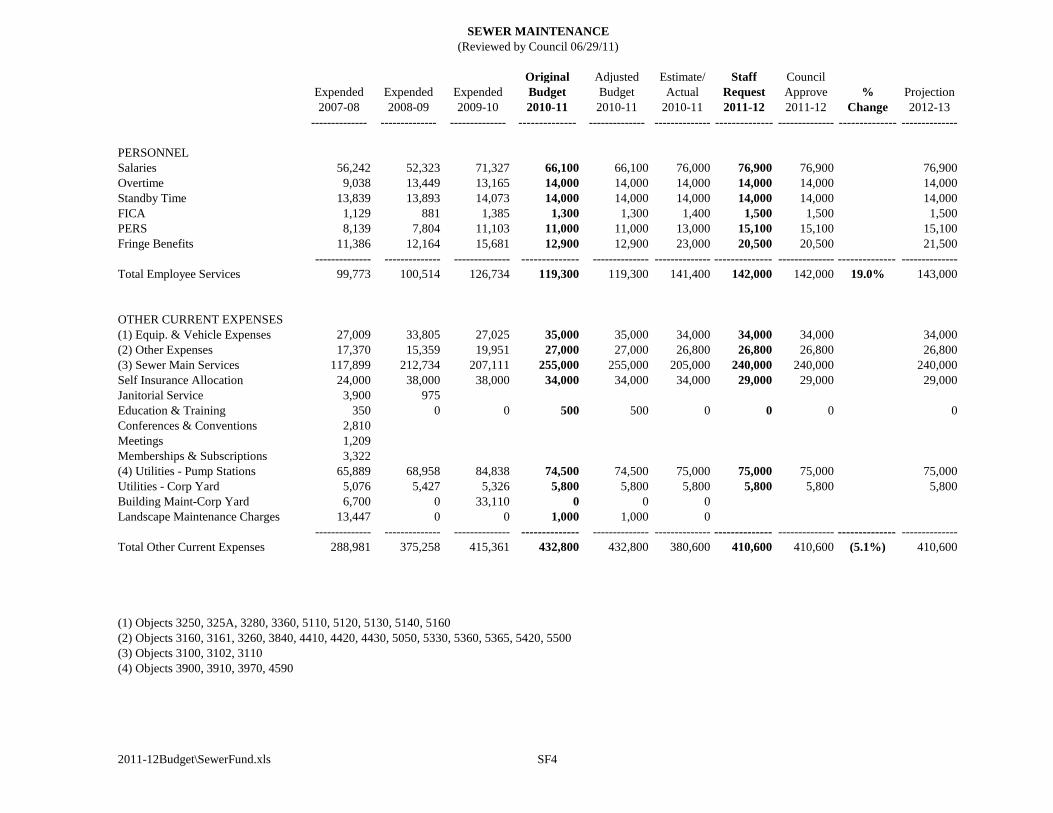
Original Adjusted Estimate/ Staff Council
Expended Expended Expended Budget Budget Actual Request Approve % Projection
2007-08 2008-09 2009-10 2010-11 2010-11 2010-11 2011-12 2011-12 Change 2012-13
-------------- -------------- -------------- -------------- -------------- -------------- -------------- -------------- -------------- --------------
PERSONNEL
Salaries 56,242 52,323 71,327 66,100 66,100 76,000 76,900 76,900 76,900
Overtime 9,038 13,449 13,165 14,000 14,000 14,000 14,000 14,000 14,000
Standby Time 13,839 13,893 14,073 14,000 14,000 14,000 14,000 14,000 14,000
FICA 1,129 881 1,385 1,300 1,300 1,400 1,500 1,500 1,500
PERS 8,139 7,804 11,103 11,000 11,000 13,000 15,100 15,100 15,100
Fringe Benefits 11,386 12,164 15,681 12,900 12,900 23,000 20,500 20,500 21,500
-------------- -------------- -------------- -------------- -------------- -------------- -------------- -------------- -------------- --------------
Total Employee Services 99,773 100,514 126,734 119,300 119,300 141,400 142,000 142,000 19.0% 143,000
OTHER CURRENT EXPENSES
(1) Equip. & Vehicle Expenses 27,009 33,805 27,025 35,000 35,000 34,000 34,000 34,000 34,000
(2) Other Expenses 17,370 15,359 19,951 27,000 27,000 26,800 26,800 26,800 26,800
(3) Sewer Main Services 117,899 212,734 207,111 255,000 255,000 205,000 240,000 240,000 240,000
Self Insurance Allocation 24,000 38,000 38,000 34,000 34,000 34,000 29,000 29,000 29,000
Janitorial Service 3,900 975
Education & Training 350 0 0 500 500 0 0 0 0
Conferences & Conventions 2,810
Meetings 1,209
Memberships & Subscriptions 3,322
(4) Utilities - Pump Stations 65,889 68,958 84,838 74,500 74,500 75,000 75,000 75,000 75,000
Utilities - Corp Yard 5,076 5,427 5,326 5,800 5,800 5,800 5,800 5,800 5,800
Building Maint-Corp Yard 6,700 0 33,110 0 0 0
Landscape Maintenance Charges 13,447 0 0 1,000 1,000 0
-------------- -------------- -------------- -------------- -------------- -------------- -------------- -------------- -------------- --------------
Total Other Current Expenses 288,981 375,258 415,361 432,800 432,800 380,600 410,600 410,600 (5.1%) 410,600
(1) Objects 3250, 325A, 3280, 3360, 5110, 5120, 5130, 5140, 5160
(2) Objects 3160, 3161, 3260, 3840, 4410, 4420, 4430, 5050, 5330, 5360, 5365, 5420, 5500
(3) Objects 3100, 3102, 3110
(4) Objects 3900, 3910, 3970, 4590
2011-12Budget\SewerFund.xls SF4
SEWER MAINTENANCE
(Reviewed by Council 06/29/11)
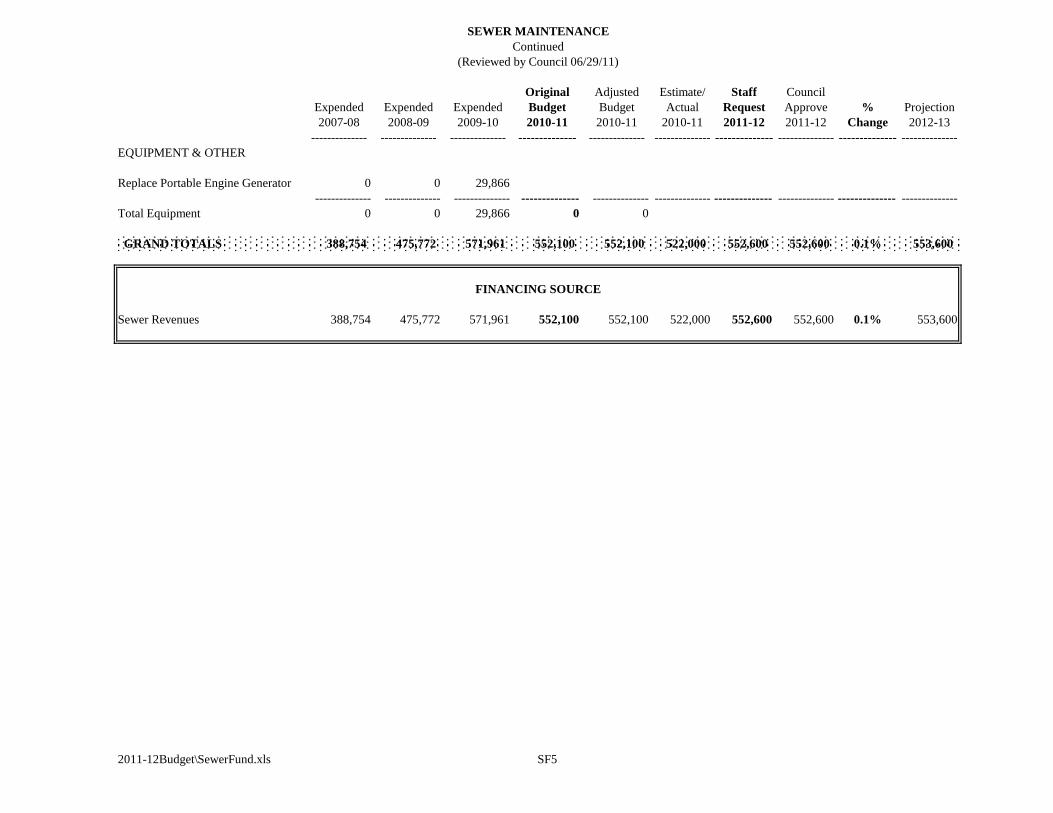
Original Adjusted Estimate/ Staff Council
Expended Expended Expended Budget Budget Actual Request Approve % Projection
2007-08 2008-09 2009-10 2010-11 2010-11 2010-11 2011-12 2011-12 Change 2012-13
-------------- -------------- -------------- -------------- -------------- -------------- -------------- -------------- -------------- --------------
EQUIPMENT & OTHER
Replace Portable Engine Generator 0 0 29,866
-------------- -------------- -------------- -------------- -------------- -------------- -------------- -------------- -------------- --------------
Total Equipment 0 0 29,866 0 0
GRAND TOTALS 388,754 475,772 571,961 552,100 552,100 522,000 552,600 552,600 0.1% 553,600
Sewer Revenues 388,754 475,772 571,961 552,100 552,100 522,000 552,600 552,600 0.1% 553,600
2011-12Budget\SewerFund.xls SF5
(Reviewed by Council 06/29/11)
FINANCING SOURCE
SEWER MAINTENANCE
Continued
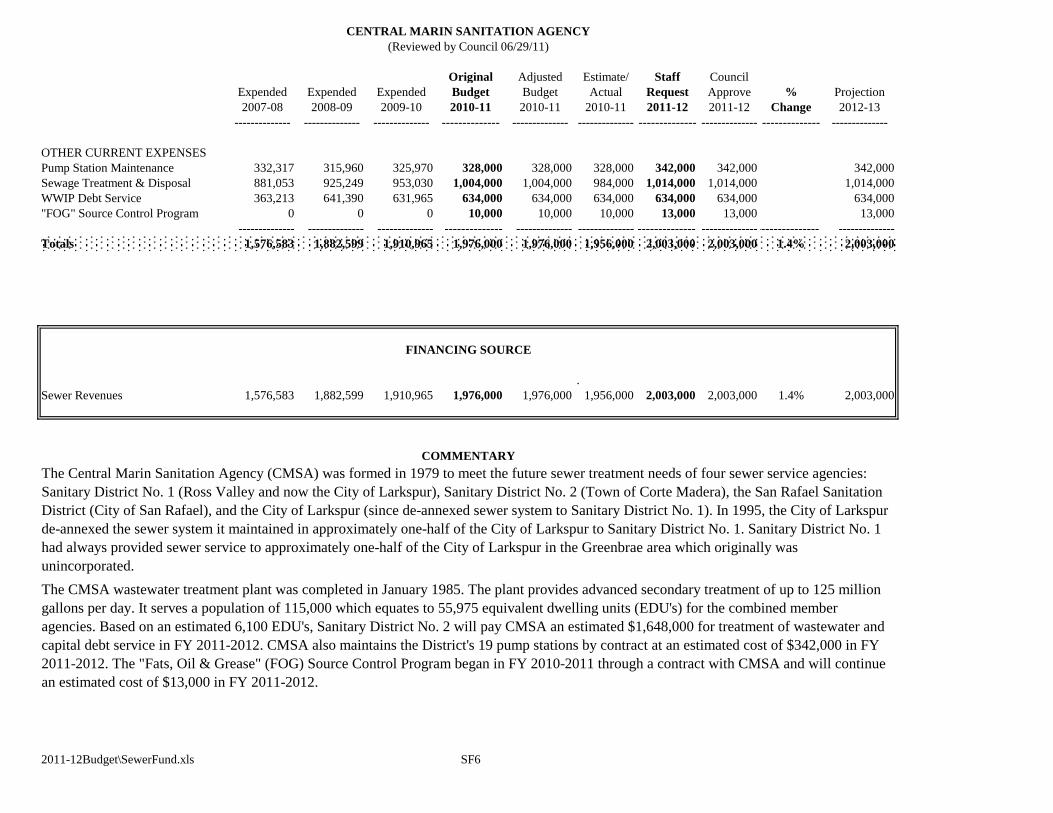
Original Adjusted Estimate/ Staff Council
Expended Expended Expended Budget Budget Actual Request Approve % Projection
2007-08 2008-09 2009-10 2010-11 2010-11 2010-11 2011-12 2011-12 Change 2012-13
-------------- -------------- -------------- -------------- -------------- -------------- -------------- -------------- -------------- --------------
OTHER CURRENT EXPENSES
Pump Station Maintenance 332,317 315,960 325,970 328,000 328,000 328,000 342,000 342,000 342,000
Sewage Treatment & Disposal 881,053 925,249 953,030 1,004,000 1,004,000 984,000 1,014,000 1,014,000 1,014,000
WWIP Debt Service 363,213 641,390 631,965 634,000 634,000 634,000 634,000 634,000 634,000
"FOG" Source Control Program 0 0 0 10,000 10,000 10,000 13,000 13,000 13,000
-------------- -------------- -------------- -------------- -------------- -------------- -------------- ----------------------------- --------------
Totals 1,576,583 1,882,599 1,910,965 1,976,000 1,976,000 1,956,000 2,003,000 2,003,000 1.4% 2,003,000
.
Sewer Revenues 1,576,583 1,882,599 1,910,965 1,976,000 1,976,000 1,956,000 2,003,000 2,003,000 1.4% 2,003,000
2011-12Budget\SewerFund.xls SF6
The Central Marin Sanitation Agency (CMSA) was formed in 1979 to meet the future sewer treatment needs of four sewer service agencies:
Sanitary District No. 1 (Ross Valley and now the City of Larkspur), Sanitary District No. 2 (Town of Corte Madera), the San Rafael Sanitation
District (City of San Rafael), and the City of Larkspur (since de-annexed sewer system to Sanitary District No. 1). In 1995, the City of Larkspur
de-annexed the sewer system it maintained in approximately one-half of the City of Larkspur to Sanitary District No. 1. Sanitary District No. 1
had always provided sewer service to approximately one-half of the City of Larkspur in the Greenbrae area which originally was
unincorporated.
The CMSA wastewater treatment plant was completed in January 1985. The plant provides advanced secondary treatment of up to 125 million
gallons per day. It serves a population of 115,000 which equates to 55,975 equivalent dwelling units (EDU's) for the combined member
agencies. Based on an estimated 6,100 EDU's, Sanitary District No. 2 will pay CMSA an estimated $1,648,000 for treatment of wastewater and
capital debt service in FY 2011-2012. CMSA also maintains the District's 19 pump stations by contract at an estimated cost of $342,000 in FY
2011-2012. The "Fats, Oil & Grease" (FOG) Source Control Program began in FY 2010-2011 through a contract with CMSA and will continue
an estimated cost of $13,000 in FY 2011-2012.
CENTRAL MARIN SANITATION AGENCY
FINANCING SOURCE
COMMENTARY
(Reviewed by Council 06/29/11)
SEWER FUND
CAPITAL PROJECTS
SC1
BLANK PAGE
2011-12Budget\SewerCapitalPorjectsList.xls SC2
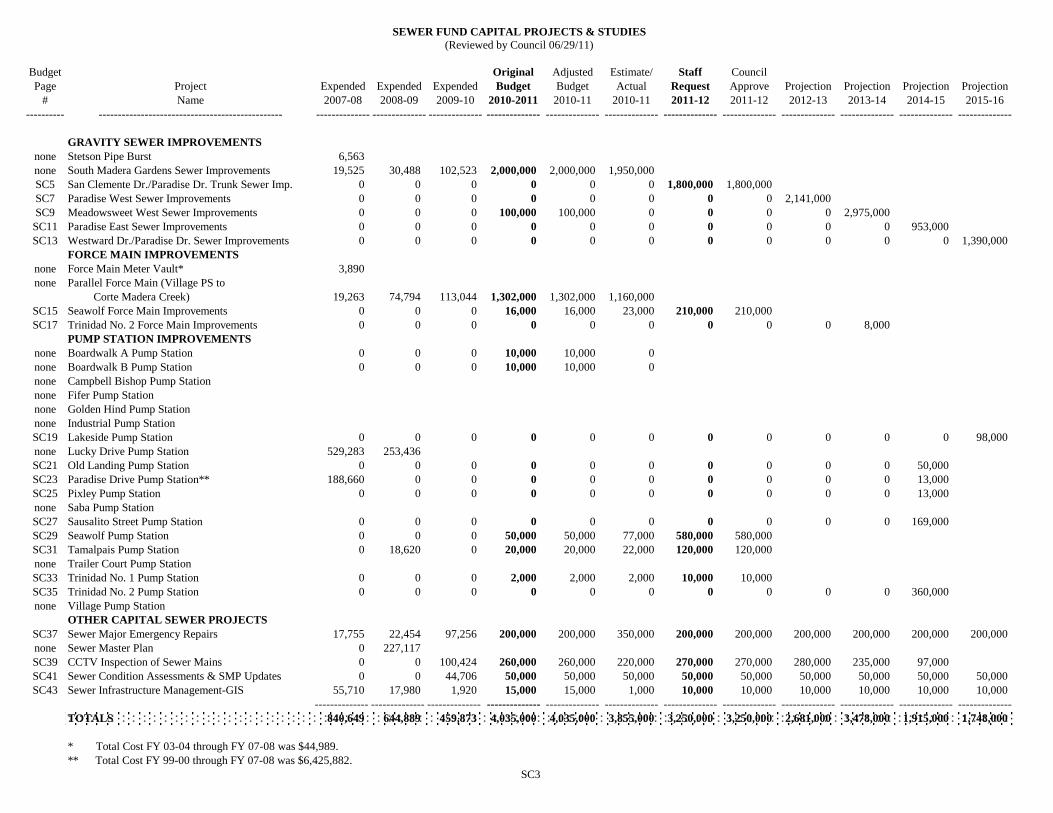
SEWER FUND CAPITAL PROJECTS & STUDIES
(Reviewed by Council 06/29/11)
Budget Original Adjusted Estimate/ Staff Council
Page Project Expended Expended Expended Budget Budget Actual Request Approve Projection Projection Projection Projection
# Name 2007-08 2008-09 2009-10 2010-2011 2010-11 2010-11 2011-12 2011-12 2012-13 2013-14 2014-15 2015-16
---------- ------------------------------------------------ -------------- -------------- -------------- -------------- -------------- -------------- -------------- -------------- -------------- -------------- -------------- --------------
GRAVITY SEWER IMPROVEMENTS
none Stetson Pipe Burst 6,563
none South Madera Gardens Sewer Improvements 19,525 30,488 102,523 2,000,000 2,000,000 1,950,000
SC5 San Clemente Dr./Paradise Dr. Trunk Sewer Imp. 0 0 0 0 0 0 1,800,000 1,800,000
SC7 Paradise West Sewer Improvements 0 0 0 0 0 0 0 0 2,141,000
SC9 Meadowsweet West Sewer Improvements 0 0 0 100,000 100,000 0 0 0 0 2,975,000
SC11 Paradise East Sewer Improvements 0 0 0 0 0 0 0 0 0 0 953,000
SC13 Westward Dr./Paradise Dr. Sewer Improvements 0 0 0 0 0 0 0 0 0 0 0 1,390,000
FORCE MAIN IMPROVEMENTS
none Force Main Meter Vault* 3,890
none Parallel Force Main (Village PS to
Corte Madera Creek) 19,263 74,794 113,044 1,302,000 1,302,000 1,160,000
SC15 Seawolf Force Main Improvements 0 0 0 16,000 16,000 23,000 210,000 210,000
SC17 Trinidad No. 2 Force Main Improvements 0 0 0 0 0 0 0 0 0 8,000
PUMP STATION IMPROVEMENTS
none Boardwalk A Pump Station 0 0 0 10,000 10,000 0
none Boardwalk B Pump Station 0 0 0 10,000 10,000 0
none Campbell Bishop Pump Station
none Fifer Pump Station
none Golden Hind Pump Station
none Industrial Pump Station
SC19 Lakeside Pump Station 0 0 0 0 0 0 0 0 0 0 0 98,000
none Lucky Drive Pump Station 529,283 253,436
SC21 Old Landing Pump Station 0 0 0 0 0 0 0 0 0 0 50,000
SC23 Paradise Drive Pump Station** 188,660 0 0 0 0 0 0 0 0 0 13,000
SC25 Pixley Pump Station 0 0 0 0 0 0 0 0 0 0 13,000
none Saba Pump Station
SC27 Sausalito Street Pump Station 0 0 0 0 0 0 0 0 0 0 169,000
SC29 Seawolf Pump Station 0 0 0 50,000 50,000 77,000 580,000 580,000
SC31 Tamalpais Pump Station 0 18,620 0 20,000 20,000 22,000 120,000 120,000
none Trailer Court Pump Station
SC33 Trinidad No. 1 Pump Station 0 0 0 2,000 2,000 2,000 10,000 10,000
SC35 Trinidad No. 2 Pump Station 0 0 0 0 0 0 0 0 0 0 360,000
none Village Pump Station
OTHER CAPITAL SEWER PROJECTS
SC37 Sewer Major Emergency Repairs 17,755 22,454 97,256 200,000 200,000 350,000 200,000 200,000 200,000 200,000 200,000 200,000
none Sewer Master Plan 0 227,117
SC39 CCTV Inspection of Sewer Mains 0 0 100,424 260,000 260,000 220,000 270,000 270,000 280,000 235,000 97,000
SC41 Sewer Condition Assessments & SMP Updates 0 0 44,706 50,000 50,000 50,000 50,000 50,000 50,000 50,000 50,000 50,000
SC43 Sewer Infrastructure Management-GIS 55,710 17,980 1,920 15,000 15,000 1,000 10,000 10,000 10,000 10,000 10,000 10,000
-------------- -------------- -------------- -------------- -------------- -------------- -------------- -------------- -------------- -------------- -------------- --------------
TOTALS 840,649 644,889 459,873 4,035,000 4,035,000 3,855,000 3,250,000 3,250,000 2,681,000 3,478,000 1,915,000 1,748,000
* Total Cost FY 03-04 through FY 07-08 was $44,989.
** Total Cost FY 99-00 through FY 07-08 was $6,425,882.
SC3
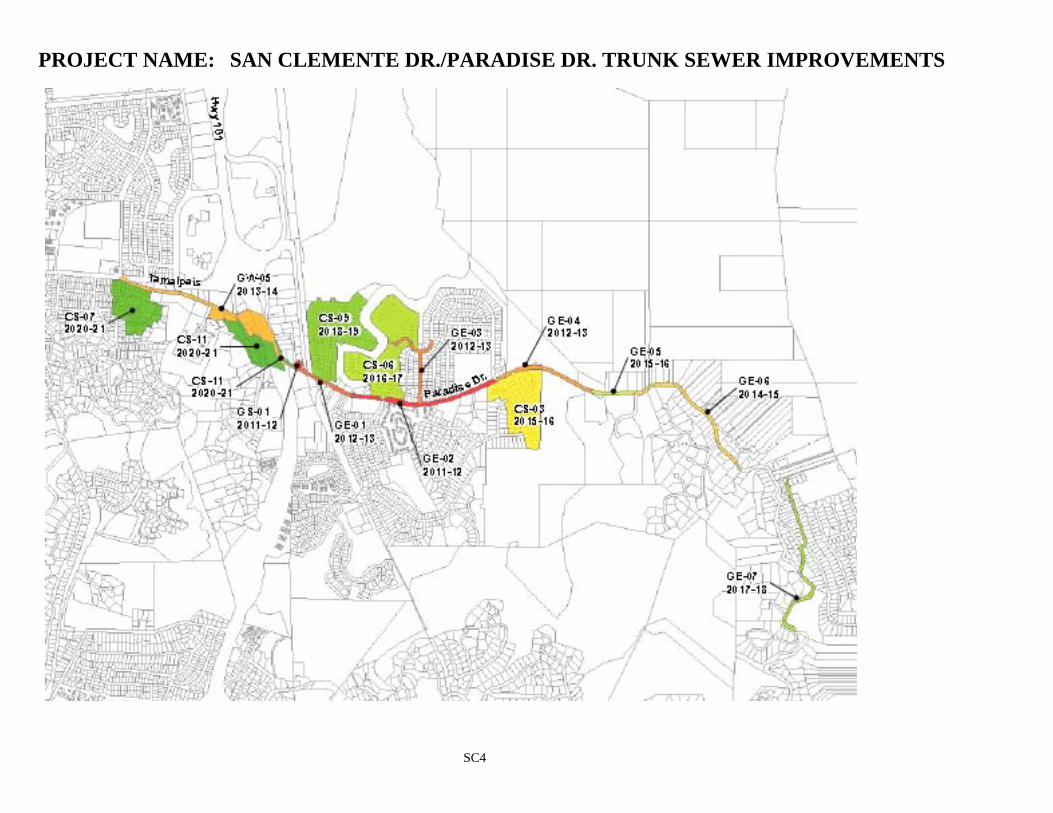
SC4
PROJECT NAME: SAN CLEMENTE DR./PARADISE DR. TRUNK SEWER IMPROVEMENTS
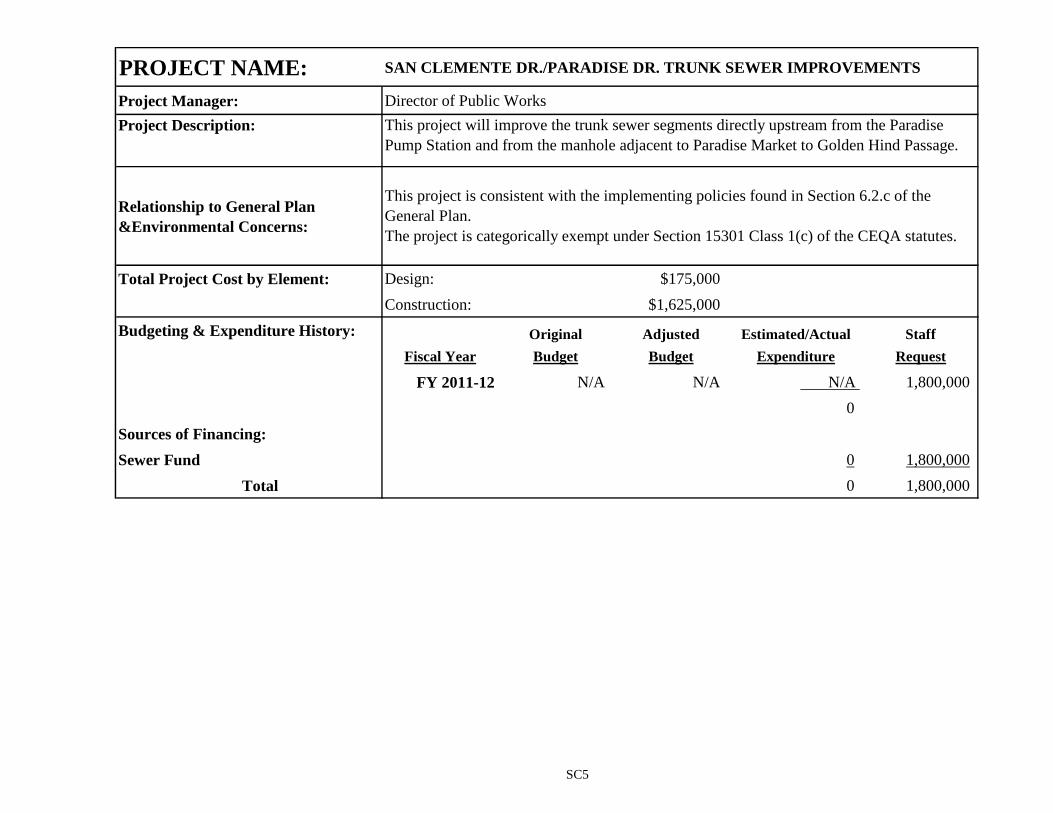
PROJECT NAME: SAN CLEMENTE DR./PARADISE DR. TRUNK SEWER IMPROVEMENTS
Project Manager: Director of Public Works
Project Description:
Relationship to General Plan
&Environmental Concerns:
Total Project Cost by Element: Design: $175,000
Construction: $1,625,000
Budgeting & Expenditure History: Original Adjusted Estimated/Actual Staff
Fiscal Year Budget Budget Expenditure Request
FY 2011-12 N/A N/A N/A 1,800,000
0
Sources of Financing:
Sewer Fund 0 1,800,000
Total 0 1,800,000
This project will improve the trunk sewer segments directly upstream from the Paradise
Pump Station and from the manhole adjacent to Paradise Market to Golden Hind Passage.
This project is consistent with the implementing policies found in Section 6.2.c of the
General Plan.
The project is categorically exempt under Section 15301 Class 1(c) of the CEQA statutes.
SC5
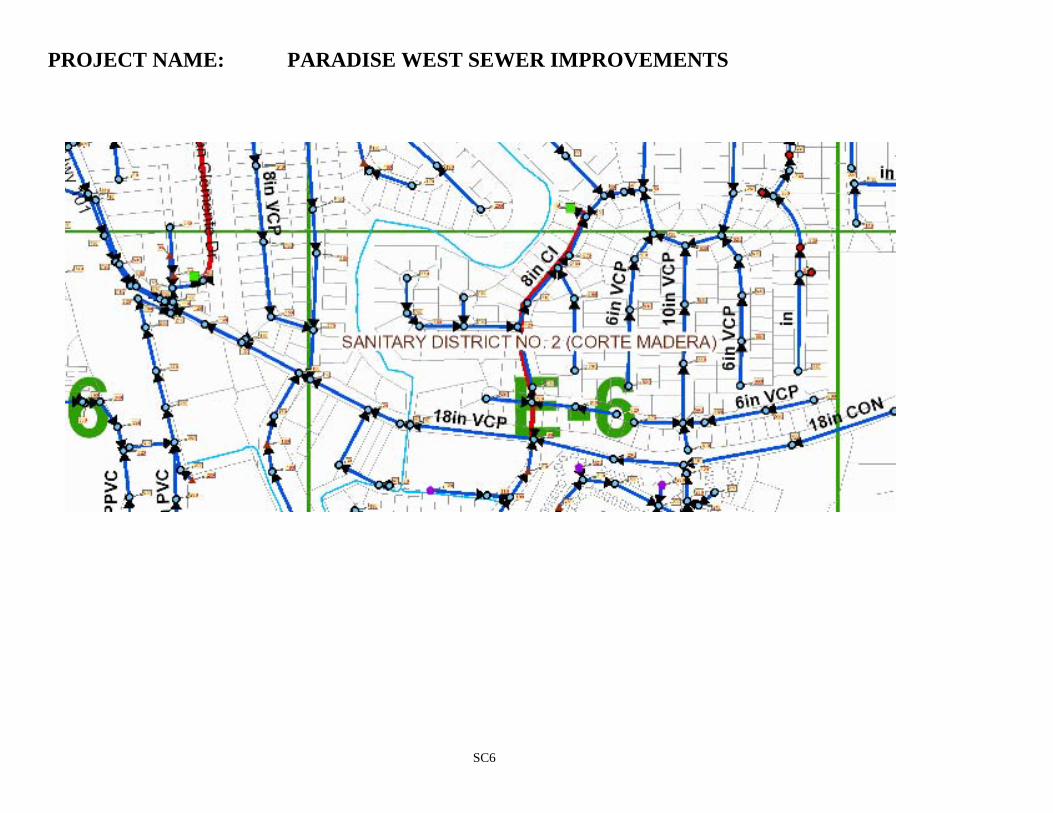
SC6
PROJECT NAME: PARADISE WEST SEWER IMPROVEMENTS
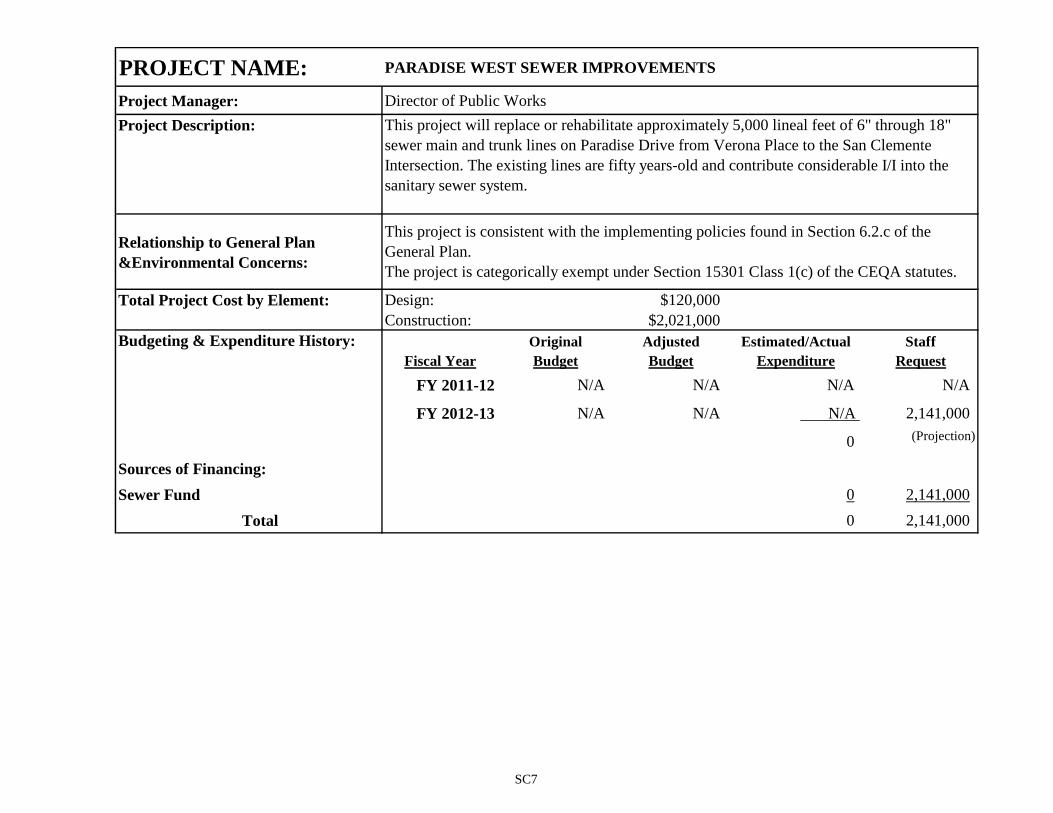
PROJECT NAME: PARADISE WEST SEWER IMPROVEMENTS
Project Manager: Director of Public Works
Project Description:
Relationship to General Plan
&Environmental Concerns:
Total Project Cost by Element: Design: $120,000
Construction: $2,021,000
Budgeting & Expenditure History: Original Adjusted Estimated/Actual Staff
Fiscal Year Budget Budget Expenditure Request
FY 2011-12 N/A N/A N/A N/A
FY 2012-13 N/A N/A N/A 2,141,000
0 (Projection)
Sources of Financing:
Sewer Fund 0 2,141,000
Total 0 2,141,000
This project will replace or rehabilitate approximately 5,000 lineal feet of 6" through 18"
sewer main and trunk lines on Paradise Drive from Verona Place to the San Clemente
Intersection. The existing lines are fifty years-old and contribute considerable I/I into the
sanitary sewer system.
This project is consistent with the implementing policies found in Section 6.2.c of the
General Plan.
The project is categorically exempt under Section 15301 Class 1(c) of the CEQA statutes.
SC7
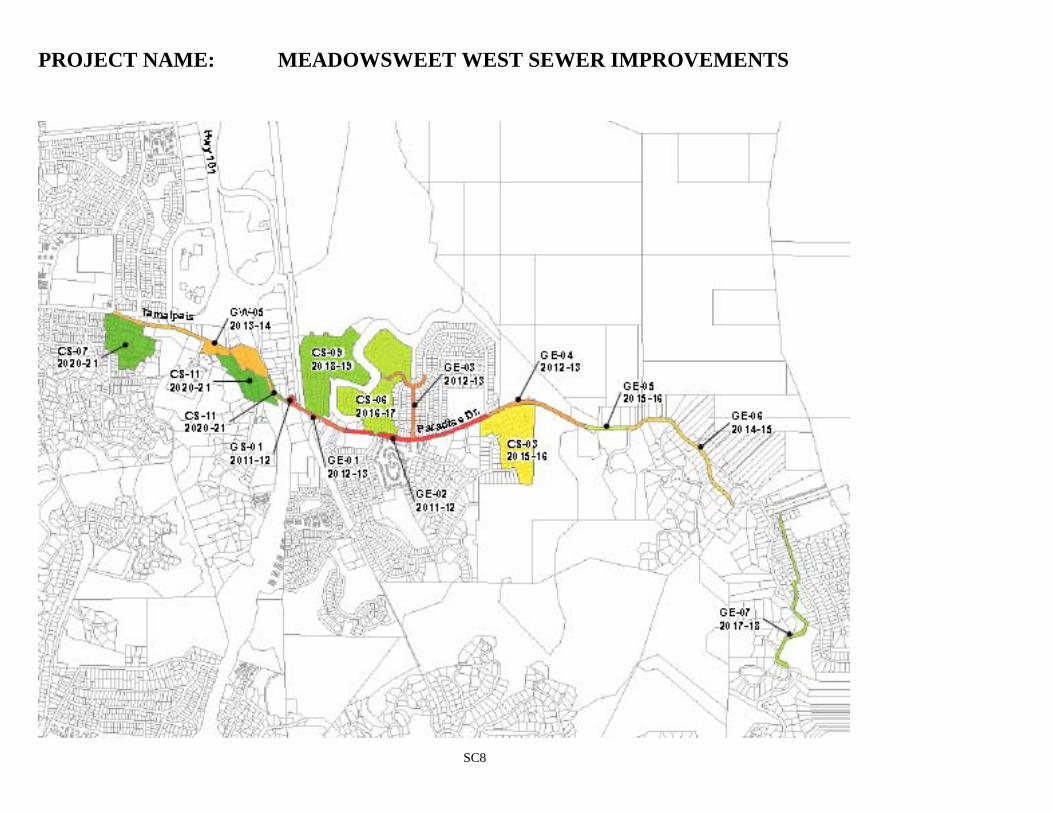
SC8
PROJECT NAME: MEADOWSWEET WEST SEWER IMPROVEMENTS
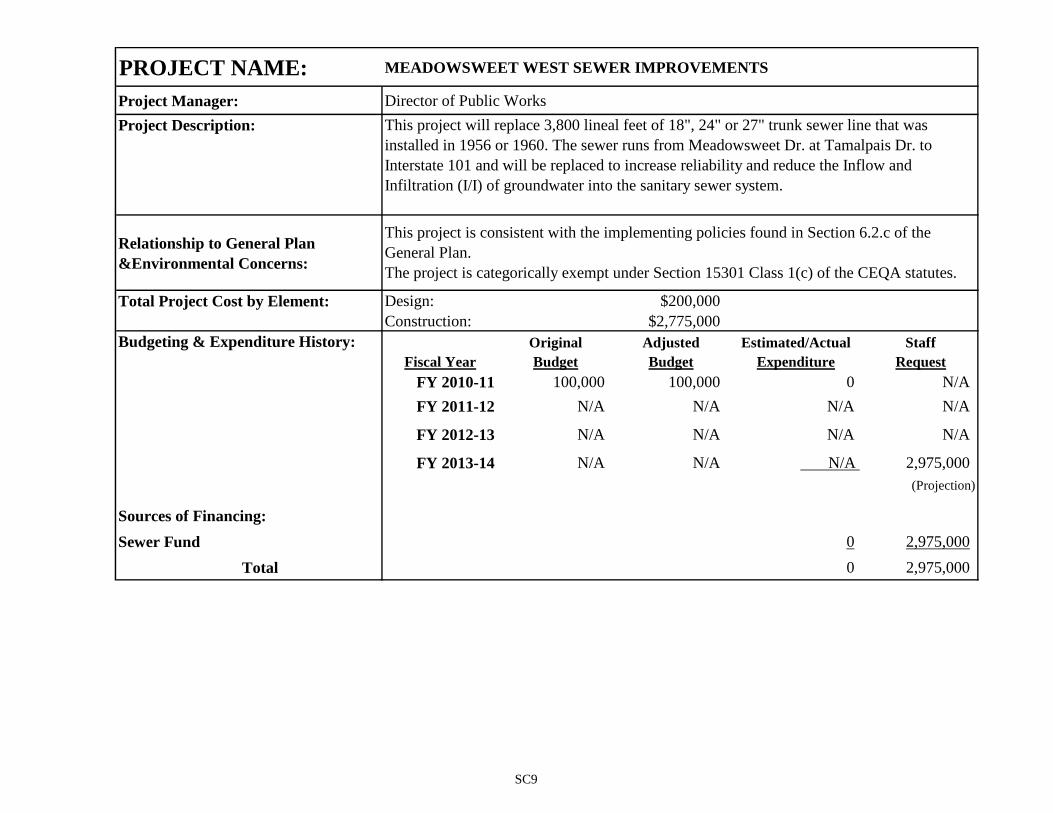
PROJECT NAME: MEADOWSWEET WEST SEWER IMPROVEMENTS
Project Manager: Director of Public Works
Project Description:
Relationship to General Plan
&Environmental Concerns:
Total Project Cost by Element: Design: $200,000
Construction: $2,775,000
Budgeting & Expenditure History: Original Adjusted Estimated/Actual Staff
Fiscal Year Budget Budget Expenditure Request
FY 2010-11 100,000 100,000 0 N/A
FY 2011-12 N/A N/A N/A N/A
FY 2012-13 N/A N/A N/A N/A
FY 2013-14 N/A N/A N/A 2,975,000
(Projection)
Sources of Financing:
Sewer Fund 0 2,975,000
Total 0 2,975,000
This project will replace 3,800 lineal feet of 18", 24" or 27" trunk sewer line that was
installed in 1956 or 1960. The sewer runs from Meadowsweet Dr. at Tamalpais Dr. to
Interstate 101 and will be replaced to increase reliability and reduce the Inflow and
Infiltration (I/I) of groundwater into the sanitary sewer system.
This project is consistent with the implementing policies found in Section 6.2.c of the
General Plan.
The project is categorically exempt under Section 15301 Class 1(c) of the CEQA statutes.
SC9
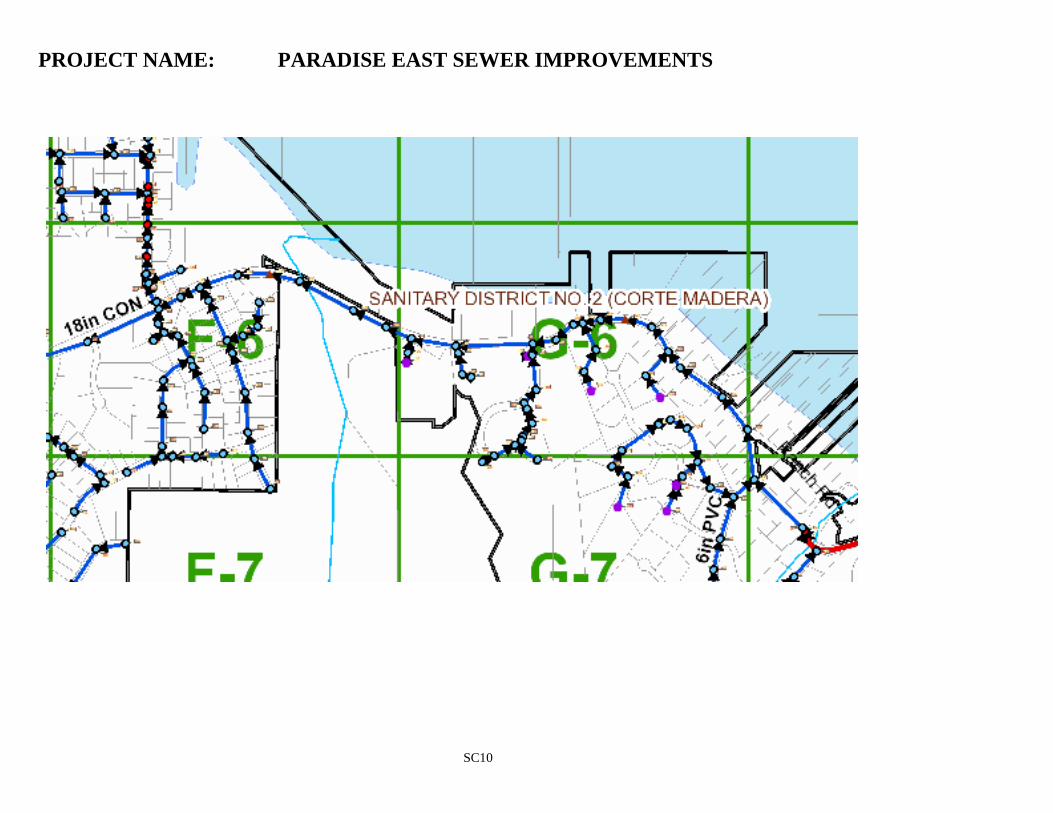
SC10
PROJECT NAME: PARADISE EAST SEWER IMPROVEMENTS
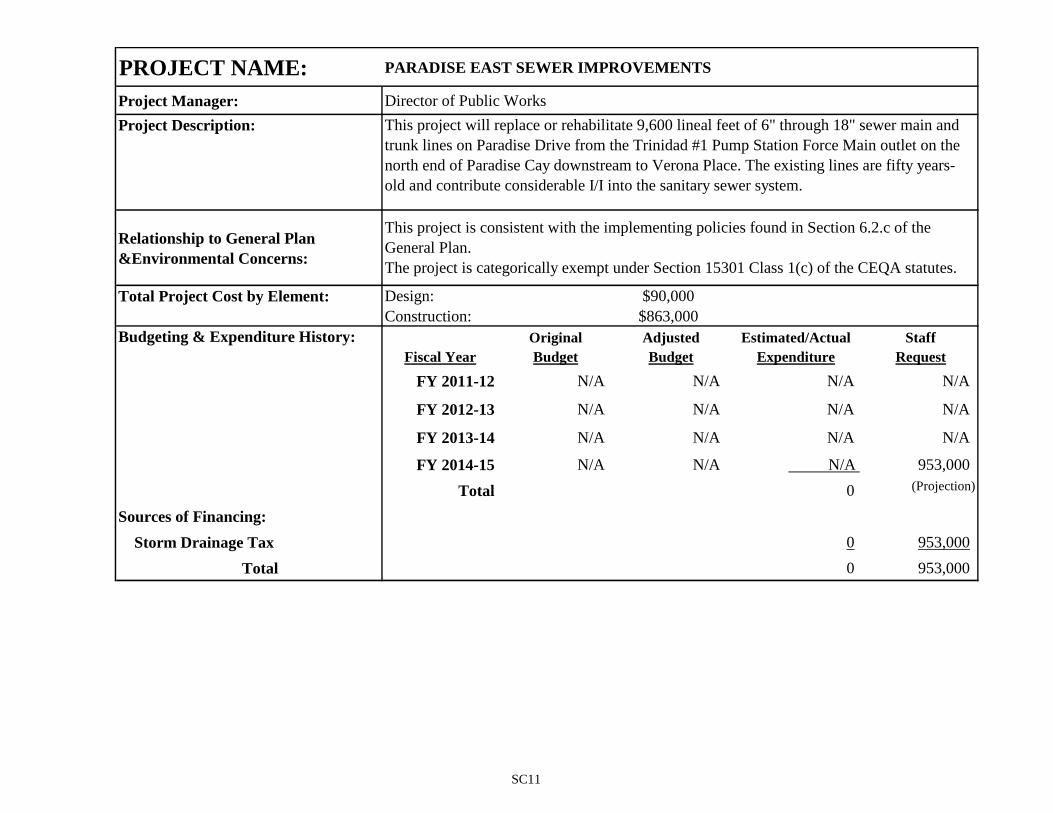
PROJECT NAME: PARADISE EAST SEWER IMPROVEMENTS
Project Manager: Director of Public Works
Project Description:
Relationship to General Plan
&Environmental Concerns:
Total Project Cost by Element: Design: $90,000
Construction: $863,000
Budgeting & Expenditure History: Original Adjusted Estimated/Actual Staff
Fiscal Year Budget Budget Expenditure Request
FY 2011-12 N/A N/A N/A N/A
FY 2012-13 N/A N/A N/A N/A
FY 2013-14 N/A N/A N/A N/A
FY 2014-15 N/A N/A N/A 953,000
Total 0 (Projection)
Sources of Financing:
Storm Drainage Tax 0 953,000
Total 0 953,000
This project will replace or rehabilitate 9,600 lineal feet of 6" through 18" sewer main and
trunk lines on Paradise Drive from the Trinidad #1 Pump Station Force Main outlet on the
north end of Paradise Cay downstream to Verona Place. The existing lines are fifty years-
old and contribute considerable I/I into the sanitary sewer system.
This project is consistent with the implementing policies found in Section 6.2.c of the
General Plan.
The project is categorically exempt under Section 15301 Class 1(c) of the CEQA statutes.
SC11
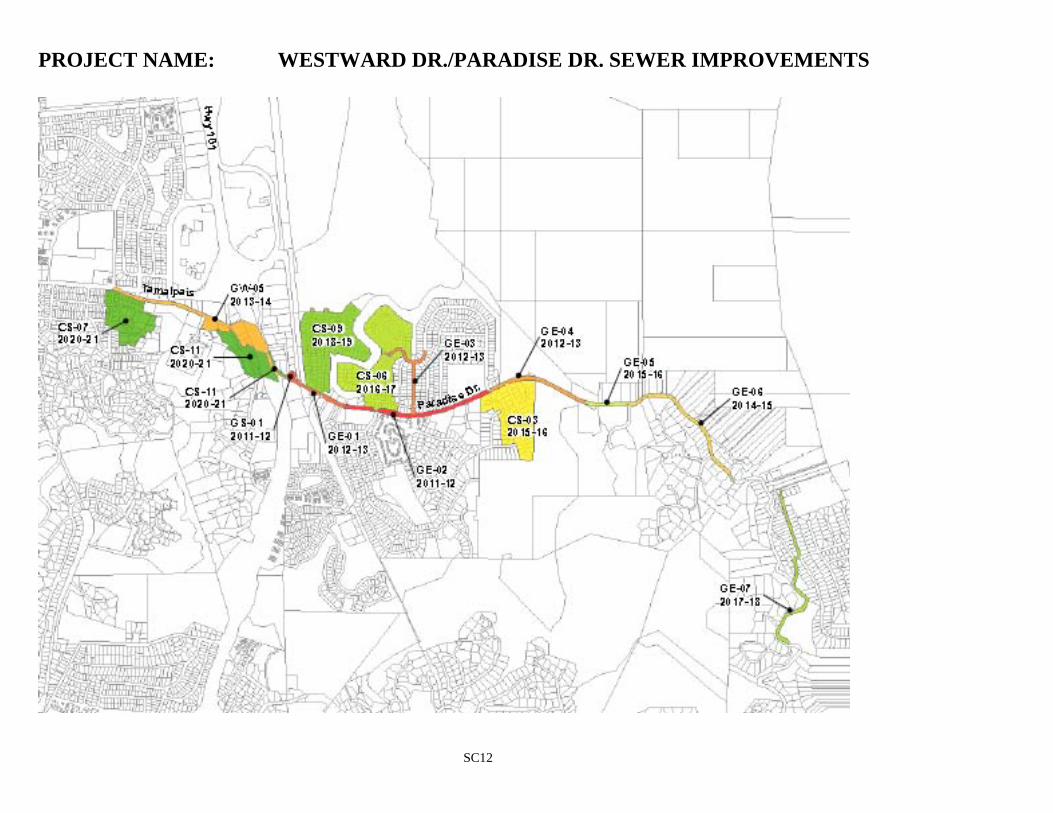
SC12
PROJECT NAME: WESTWARD DR./PARADISE DR. SEWER IMPROVEMENTS
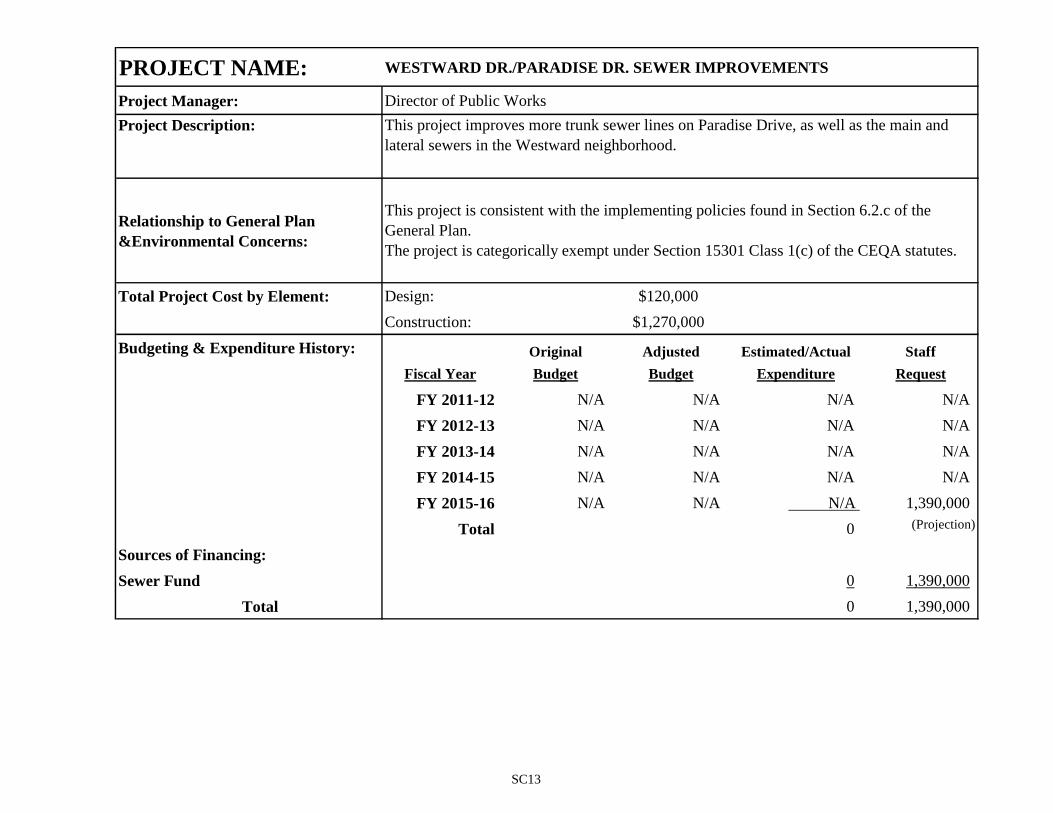
PROJECT NAME: WESTWARD DR./PARADISE DR. SEWER IMPROVEMENTS
Project Manager: Director of Public Works
Project Description:
Relationship to General Plan
&Environmental Concerns:
Total Project Cost by Element: Design: $120,000
Construction: $1,270,000
Budgeting & Expenditure History: Original Adjusted Estimated/Actual Staff
Fiscal Year Budget Budget Expenditure Request
FY 2011-12 N/A N/A N/A N/A
FY 2012-13 N/A N/A N/A N/A
FY 2013-14 N/A N/A N/A N/A
FY 2014-15 N/A N/A N/A N/A
FY 2015-16 N/A N/A N/A 1,390,000
Total 0 (Projection)
Sources of Financing:
Sewer Fund 0 1,390,000
Total 0 1,390,000
This project improves more trunk sewer lines on Paradise Drive, as well as the main and
lateral sewers in the Westward neighborhood.
This project is consistent with the implementing policies found in Section 6.2.c of the
General Plan.
The project is categorically exempt under Section 15301 Class 1(c) of the CEQA statutes.
SC13
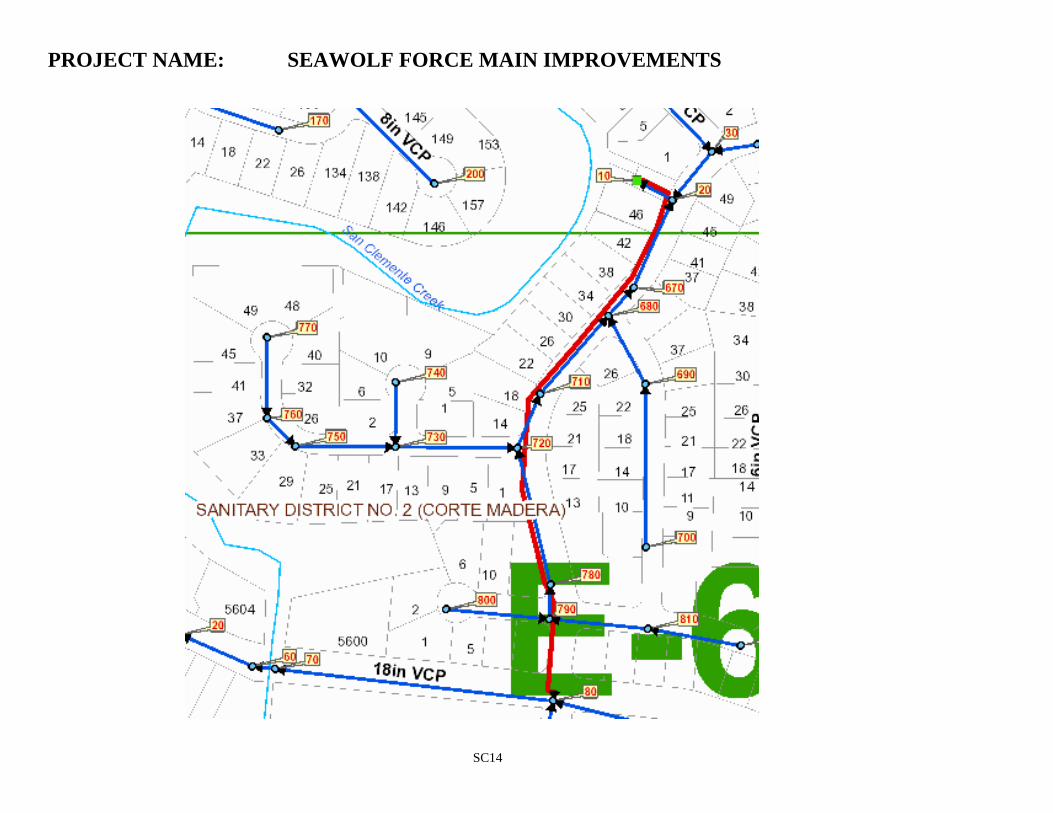
SC14
PROJECT NAME: SEAWOLF FORCE MAIN IMPROVEMENTS
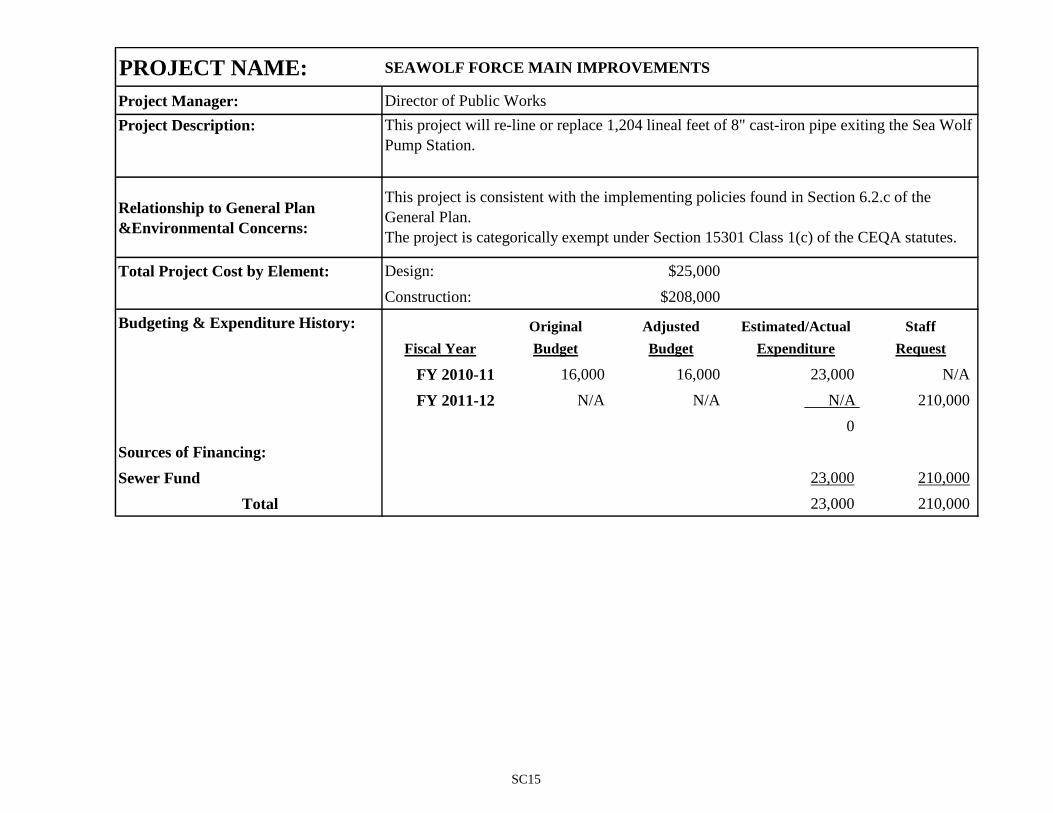
PROJECT NAME: SEAWOLF FORCE MAIN IMPROVEMENTS
Project Manager: Director of Public Works
Project Description:
Relationship to General Plan
&Environmental Concerns:
Total Project Cost by Element: Design: $25,000
Construction: $208,000
Budgeting & Expenditure History: Original Adjusted Estimated/Actual Staff
Fiscal Year Budget Budget Expenditure Request
FY 2010-11 16,000 16,000 23,000 N/A
FY 2011-12 N/A N/A N/A 210,000
0
Sources of Financing:
Sewer Fund 23,000 210,000
Total 23,000 210,000
This project will re-line or replace 1,204 lineal feet of 8" cast-iron pipe exiting the Sea Wolf
Pump Station.
This project is consistent with the implementing policies found in Section 6.2.c of the
General Plan.
The project is categorically exempt under Section 15301 Class 1(c) of the CEQA statutes.
SC15
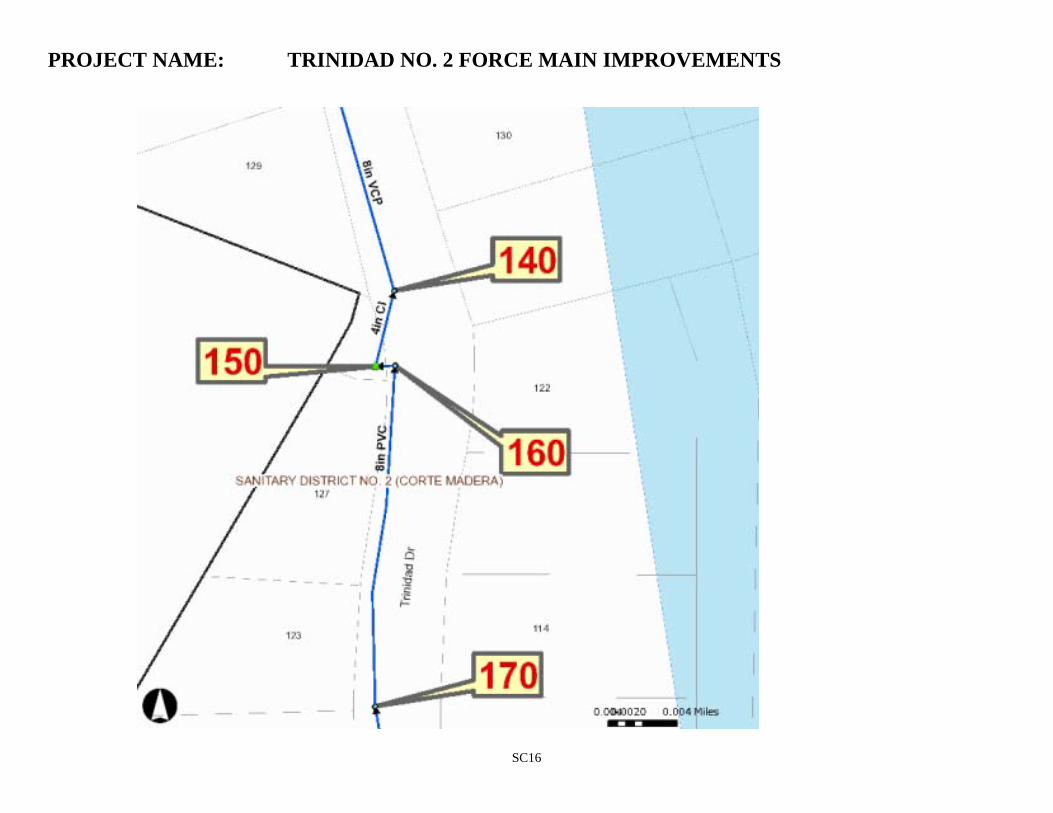
SC16
PROJECT NAME: TRINIDAD NO. 2 FORCE MAIN IMPROVEMENTS
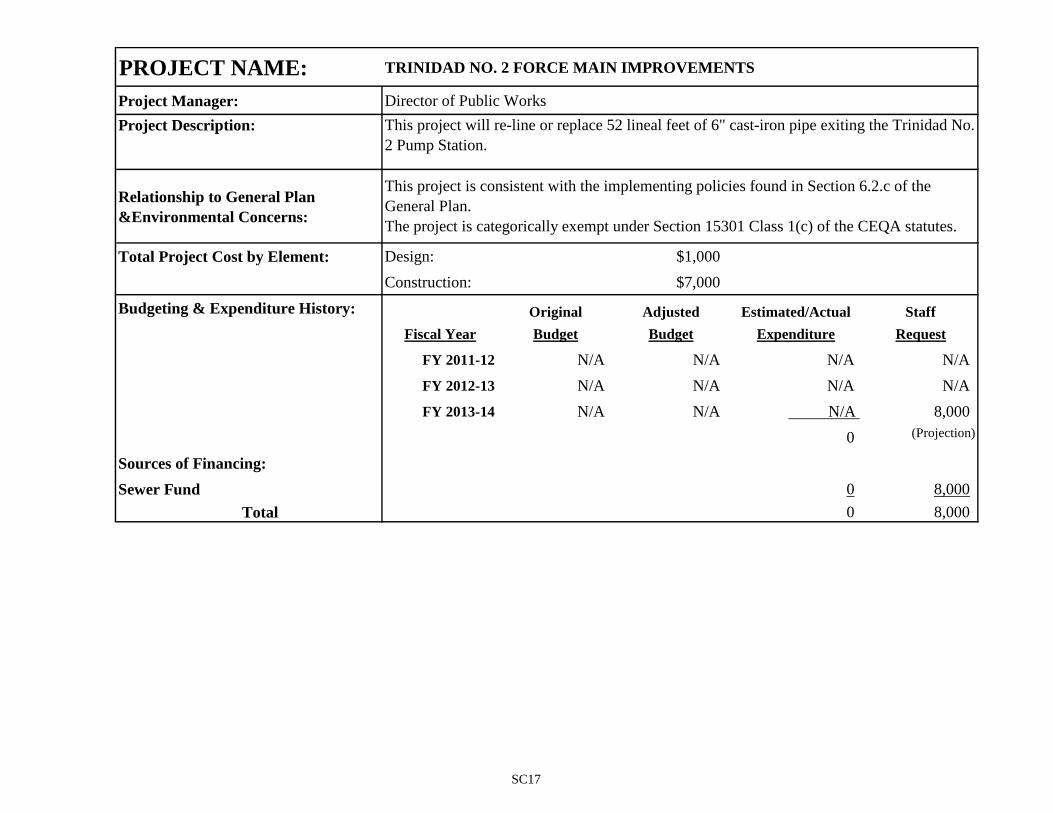
PROJECT NAME: TRINIDAD NO. 2 FORCE MAIN IMPROVEMENTS
Project Manager: Director of Public Works
Project Description:
Relationship to General Plan
&Environmental Concerns:
Total Project Cost by Element: Design: $1,000
Construction: $7,000
Budgeting & Expenditure History: Original Adjusted Estimated/Actual Staff
Fiscal Year Budget Budget Expenditure Request
FY 2011-12 N/A N/A N/A N/A
FY 2012-13 N/A N/A N/A N/A
FY 2013-14 N/A N/A N/A 8,000
0 (Projection)
Sources of Financing:
Sewer Fund 0 8,000
Total 0 8,000
This project will re-line or replace 52 lineal feet of 6" cast-iron pipe exiting the Trinidad No.
2 Pump Station.
This project is consistent with the implementing policies found in Section 6.2.c of the
General Plan.
The project is categorically exempt under Section 15301 Class 1(c) of the CEQA statutes.
SC17
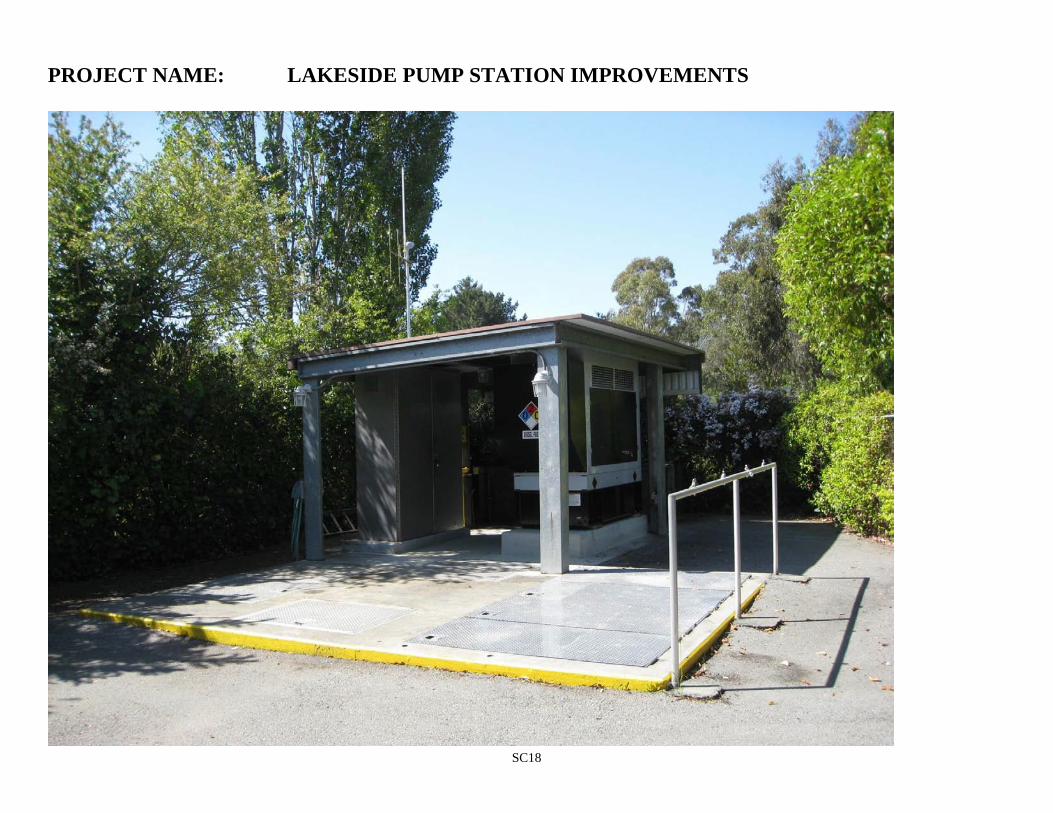
SC18
PROJECT NAME: LAKESIDE PUMP STATION IMPROVEMENTS
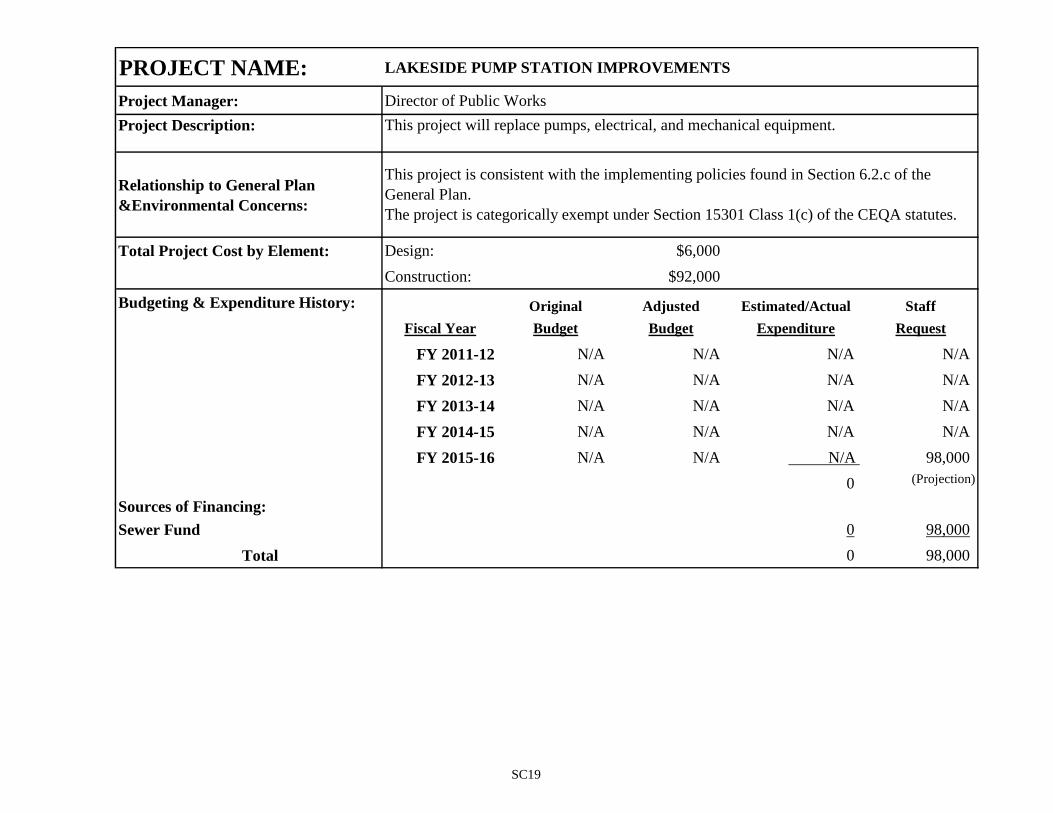
PROJECT NAME: LAKESIDE PUMP STATION IMPROVEMENTS
Project Manager: Director of Public Works
Project Description:
Relationship to General Plan
&Environmental Concerns:
Total Project Cost by Element: Design: $6,000
Construction: $92,000
Budgeting & Expenditure History: Original Adjusted Estimated/Actual Staff
Fiscal Year Budget Budget Expenditure Request
FY 2011-12 N/A N/A N/A N/A
FY 2012-13 N/A N/A N/A N/A
FY 2013-14 N/A N/A N/A N/A
FY 2014-15 N/A N/A N/A N/A
FY 2015-16 N/A N/A N/A 98,000
0 (Projection)
Sources of Financing:
Sewer Fund 0 98,000
Total 0 98,000
This project will replace pumps, electrical, and mechanical equipment.
This project is consistent with the implementing policies found in Section 6.2.c of the
General Plan.
The project is categorically exempt under Section 15301 Class 1(c) of the CEQA statutes.
SC19
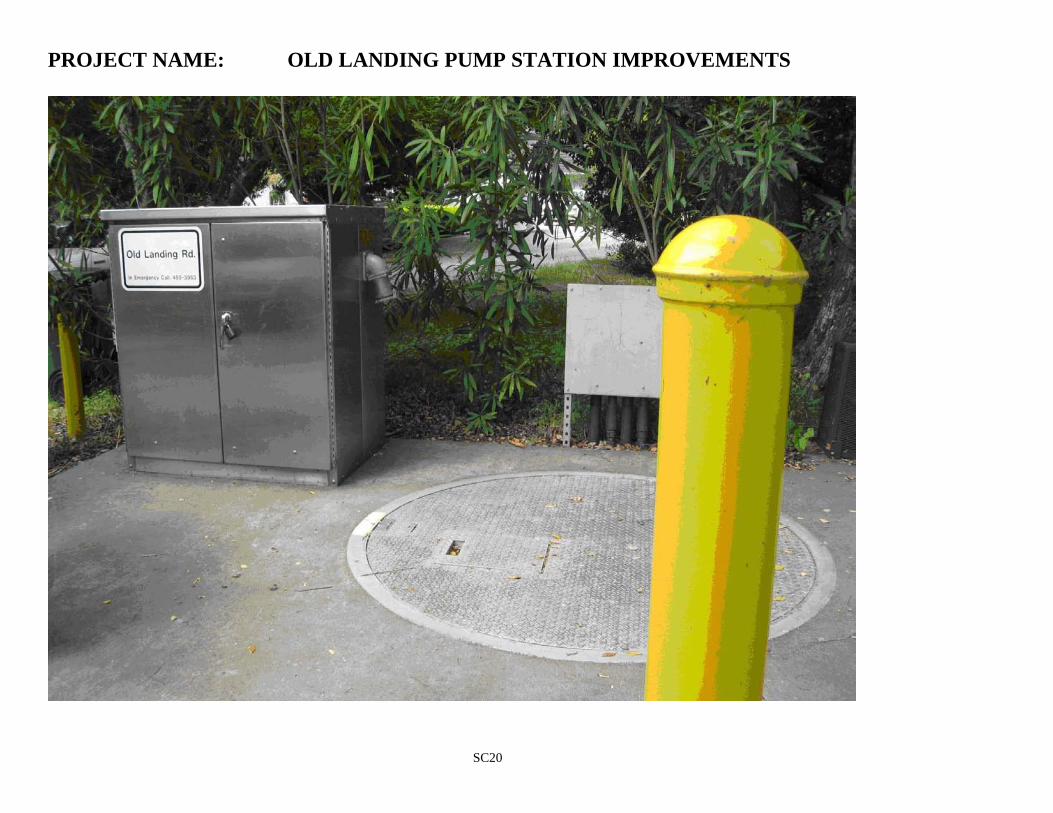
SC20
PROJECT NAME: OLD LANDING PUMP STATION IMPROVEMENTS
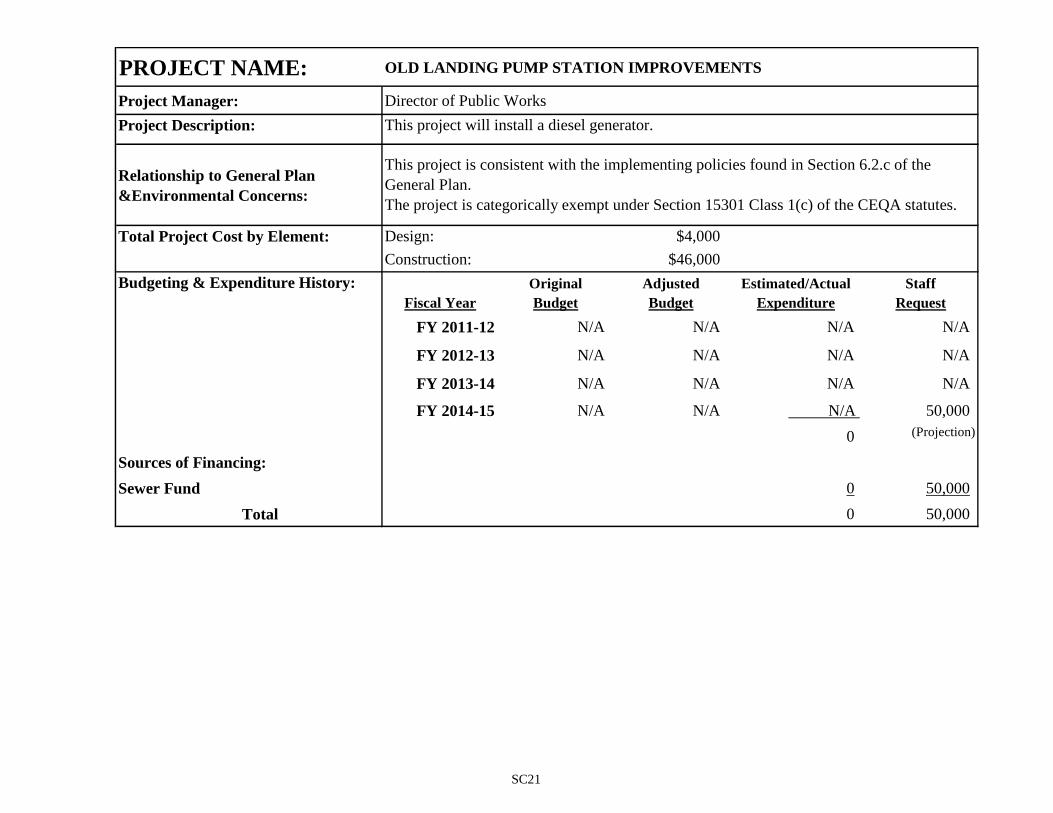
PROJECT NAME: OLD LANDING PUMP STATION IMPROVEMENTS
Project Manager: Director of Public Works
Project Description:
Relationship to General Plan
&Environmental Concerns:
Total Project Cost by Element: Design: $4,000
Construction: $46,000
Budgeting & Expenditure History: Original Adjusted Estimated/Actual Staff
Fiscal Year Budget Budget Expenditure Request
FY 2011-12 N/A N/A N/A N/A
FY 2012-13 N/A N/A N/A N/A
FY 2013-14 N/A N/A N/A N/A
FY 2014-15 N/A N/A N/A 50,000
0 (Projection)
Sources of Financing:
Sewer Fund 0 50,000
Total 0 50,000
This project will install a diesel generator.
This project is consistent with the implementing policies found in Section 6.2.c of the
General Plan.
The project is categorically exempt under Section 15301 Class 1(c) of the CEQA statutes.
SC21
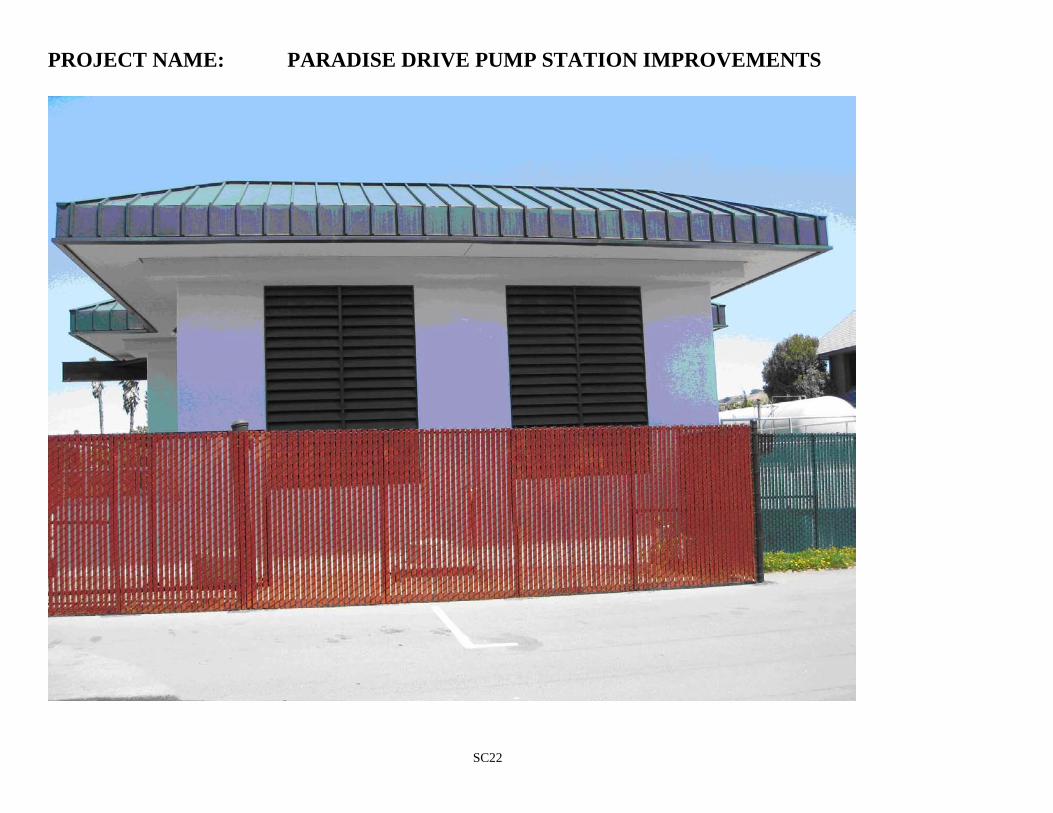
SC22
PROJECT NAME: PARADISE DRIVE PUMP STATION IMPROVEMENTS
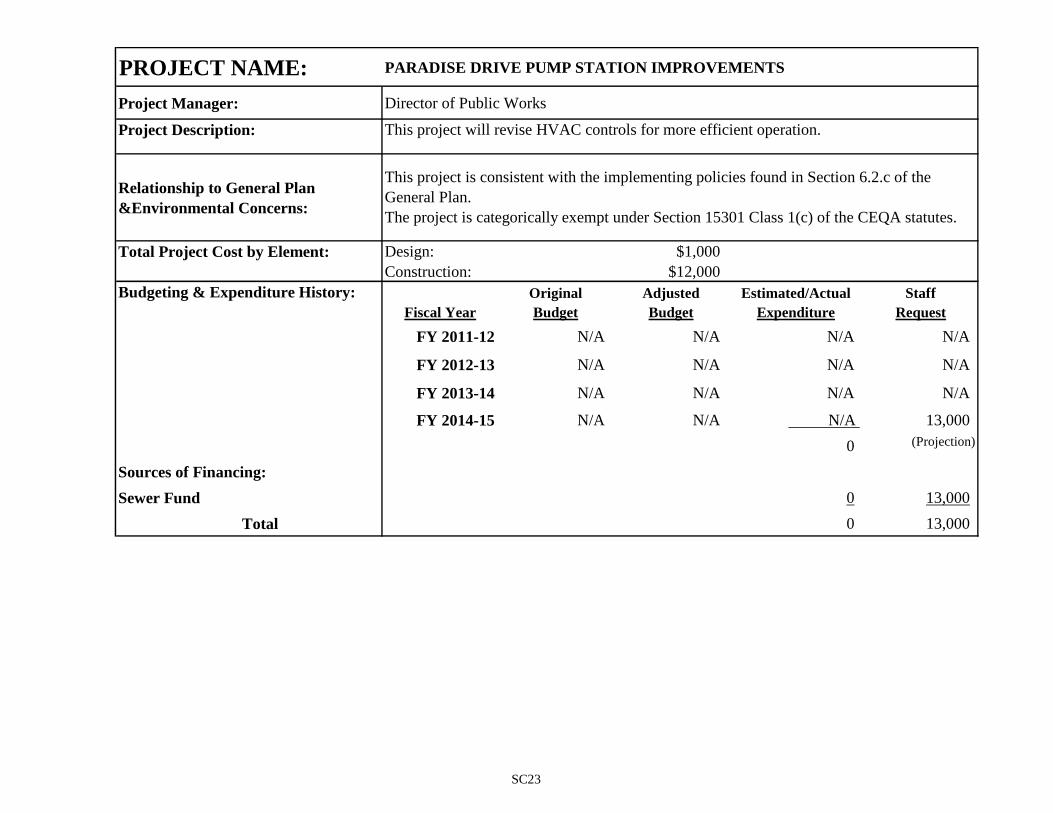
PROJECT NAME: PARADISE DRIVE PUMP STATION IMPROVEMENTS
Project Manager: Director of Public Works
Project Description:
Relationship to General Plan
&Environmental Concerns:
Total Project Cost by Element: Design: $1,000
Construction: $12,000
Budgeting & Expenditure History: Original Adjusted Estimated/Actual Staff
Fiscal Year Budget Budget Expenditure Request
FY 2011-12 N/A N/A N/A N/A
FY 2012-13 N/A N/A N/A N/A
FY 2013-14 N/A N/A N/A N/A
FY 2014-15 N/A N/A N/A 13,000
0 (Projection)
Sources of Financing:
Sewer Fund 0 13,000
Total 0 13,000
This project will revise HVAC controls for more efficient operation.
This project is consistent with the implementing policies found in Section 6.2.c of the
General Plan.
The project is categorically exempt under Section 15301 Class 1(c) of the CEQA statutes.
SC23
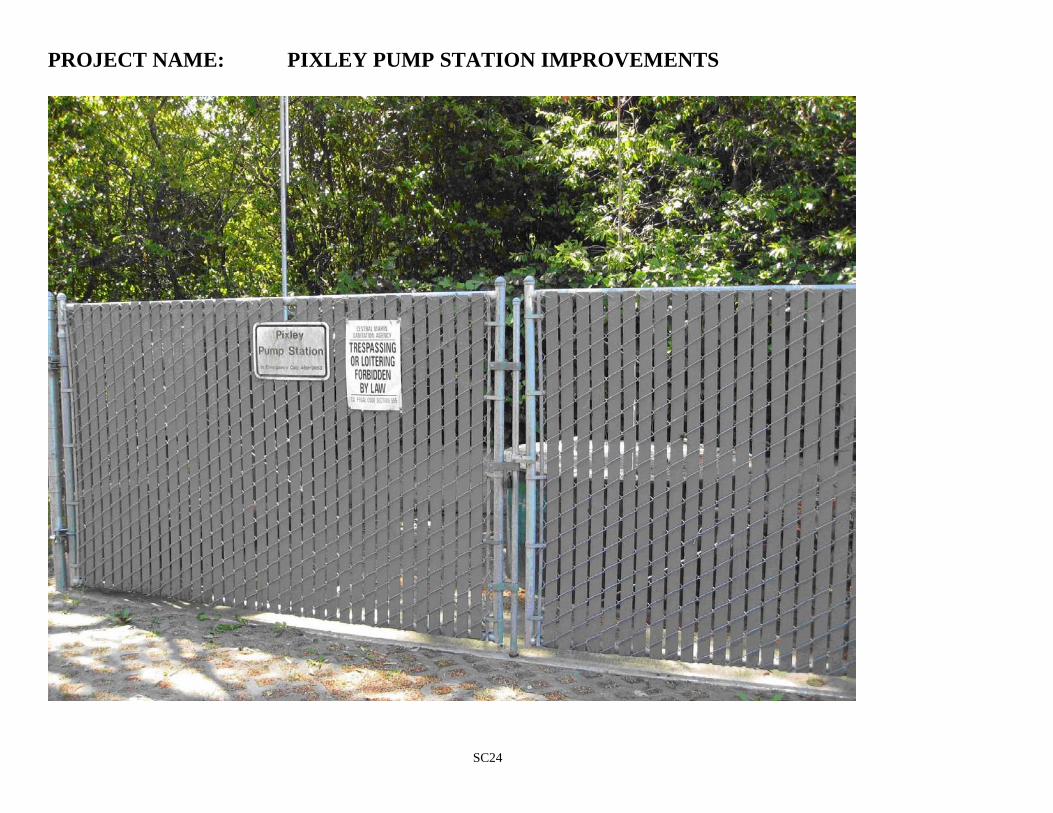
SC24
PROJECT NAME: PIXLEY PUMP STATION IMPROVEMENTS
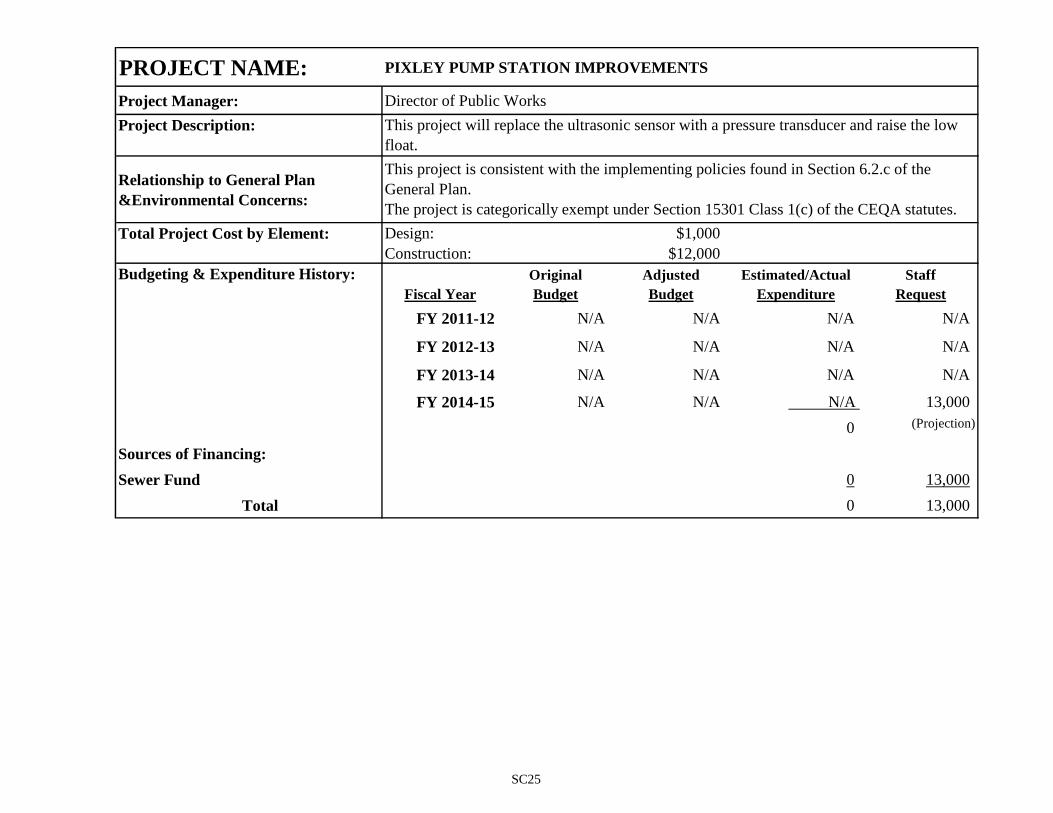
PROJECT NAME: PIXLEY PUMP STATION IMPROVEMENTS
Project Manager: Director of Public Works
Project Description:
Relationship to General Plan
&Environmental Concerns:
Total Project Cost by Element: Design: $1,000
Construction: $12,000
Budgeting & Expenditure History: Original Adjusted Estimated/Actual Staff
Fiscal Year Budget Budget Expenditure Request
FY 2011-12 N/A N/A N/A N/A
FY 2012-13 N/A N/A N/A N/A
FY 2013-14 N/A N/A N/A N/A
FY 2014-15 N/A N/A N/A 13,000
0 (Projection)
Sources of Financing:
Sewer Fund 0 13,000
Total 0 13,000
This project will replace the ultrasonic sensor with a pressure transducer and raise the low
float.
This project is consistent with the implementing policies found in Section 6.2.c of the
General Plan.
The project is categorically exempt under Section 15301 Class 1(c) of the CEQA statutes.
SC25
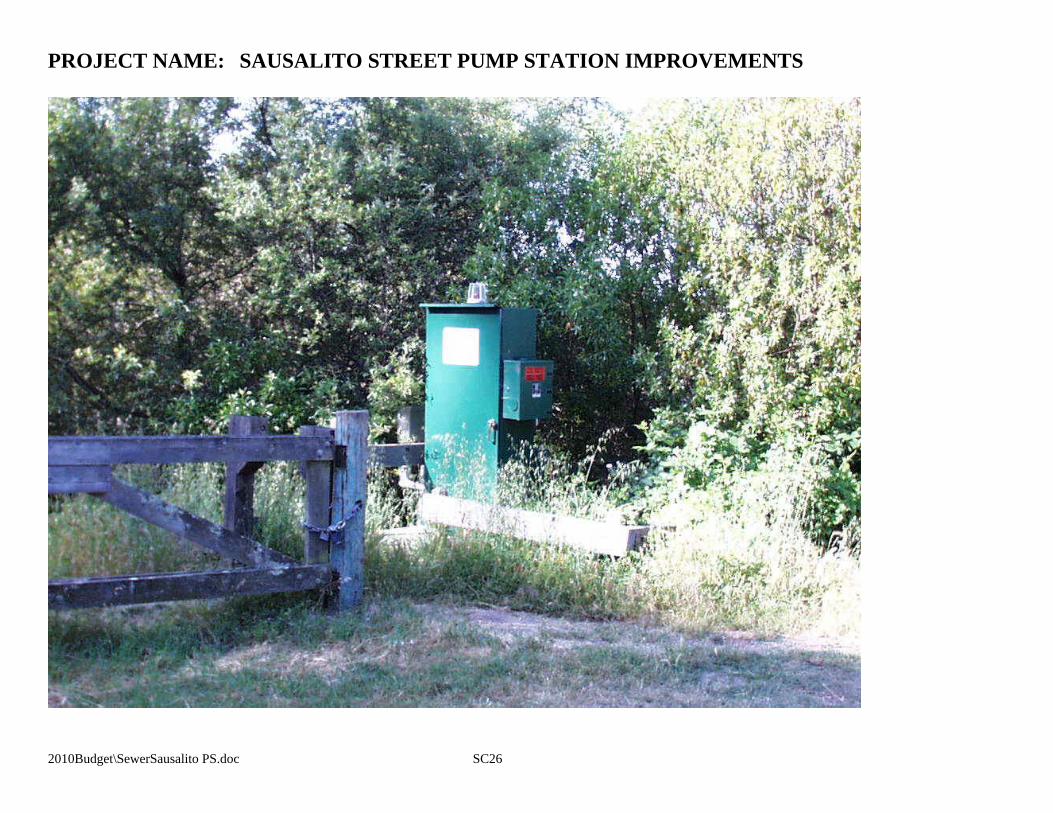
PROJECT NAME: SAUSALITO STREET PUMP STATION IMPROVEMENTS
2010Budget\SewerSausalito PS.doc SC26
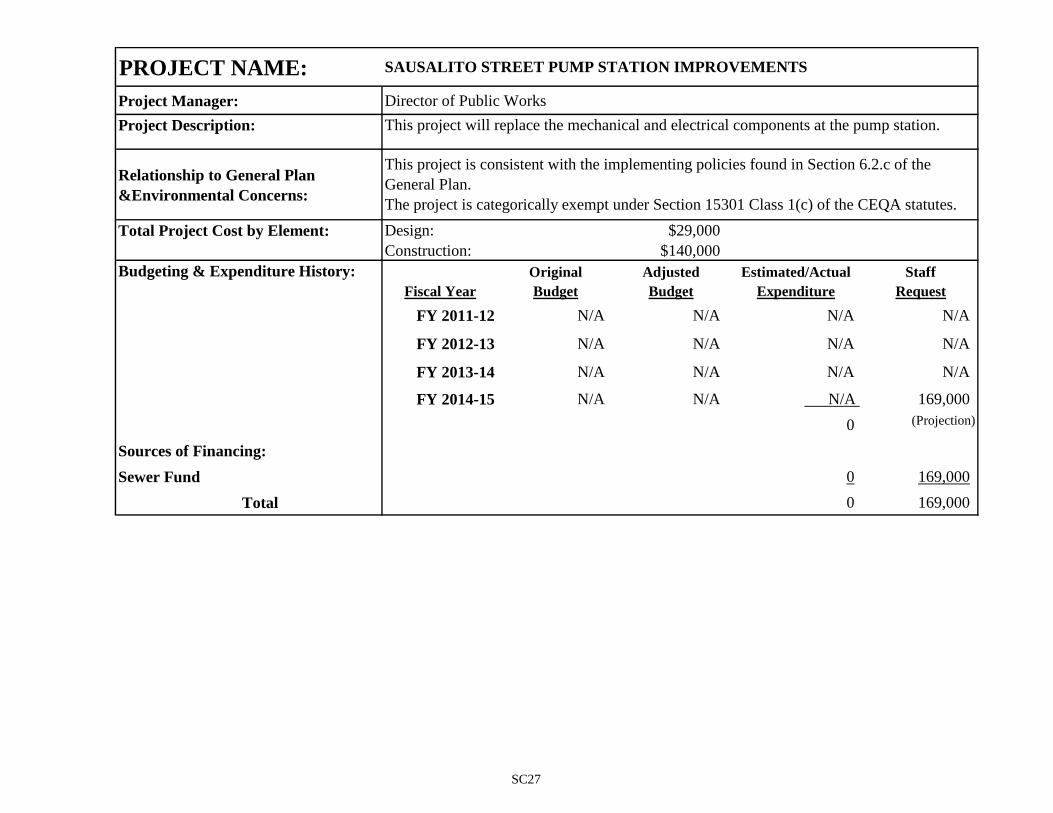
PROJECT NAME:
Project Manager: Director of Public Works
Project Description:
Relationship to General Plan
&Environmental Concerns:
Total Project Cost by Element: Design: $29,000
Construction: $140,000
Budgeting & Expenditure History: Original Adjusted Estimated/Actual Staff
Fiscal Year Budget Budget Expenditure Request
FY 2011-12 N/A N/A N/A N/A
FY 2012-13 N/A N/A N/A N/A
FY 2013-14 N/A N/A N/A N/A
FY 2014-15 N/A N/A N/A 169,000
0 (Projection)
Sources of Financing:
Sewer Fund 0 169,000
Total 0 169,000
SAUSALITO STREET PUMP STATION IMPROVEMENTS
This project will replace the mechanical and electrical components at the pump station.
This project is consistent with the implementing policies found in Section 6.2.c of the
General Plan.
The project is categorically exempt under Section 15301 Class 1(c) of the CEQA statutes.
SC27
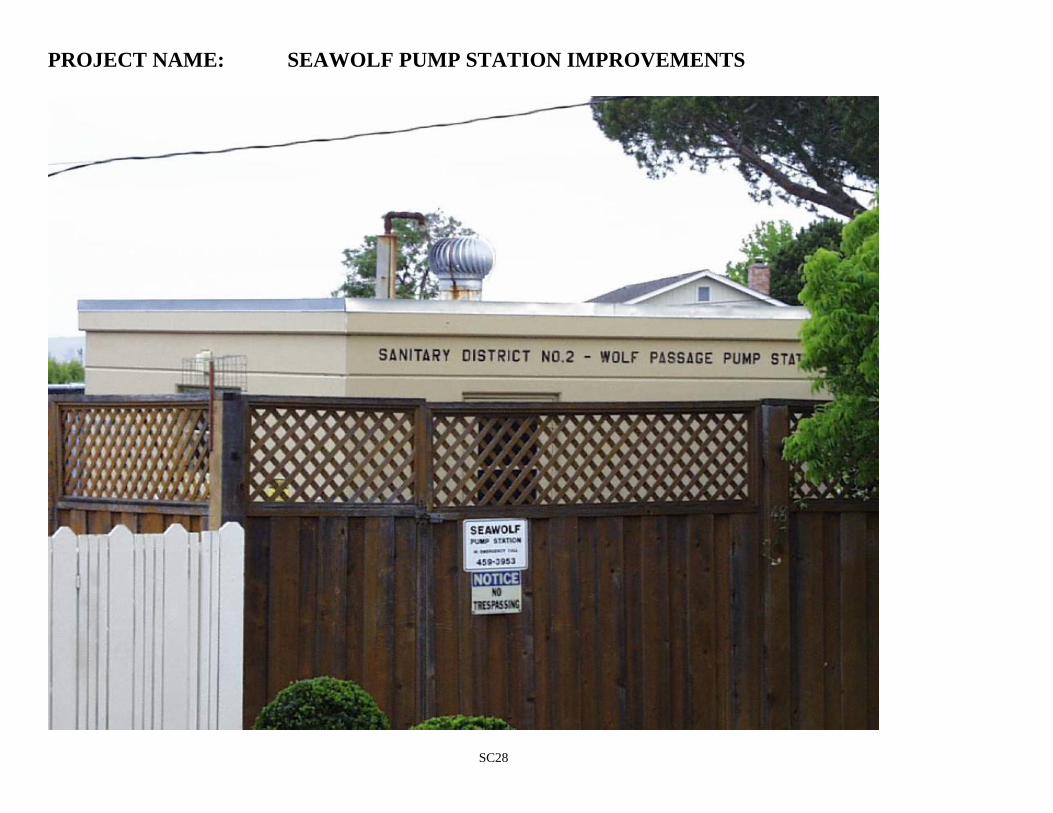
SC28
PROJECT NAME: SEAWOLF PUMP STATION IMPROVEMENTS
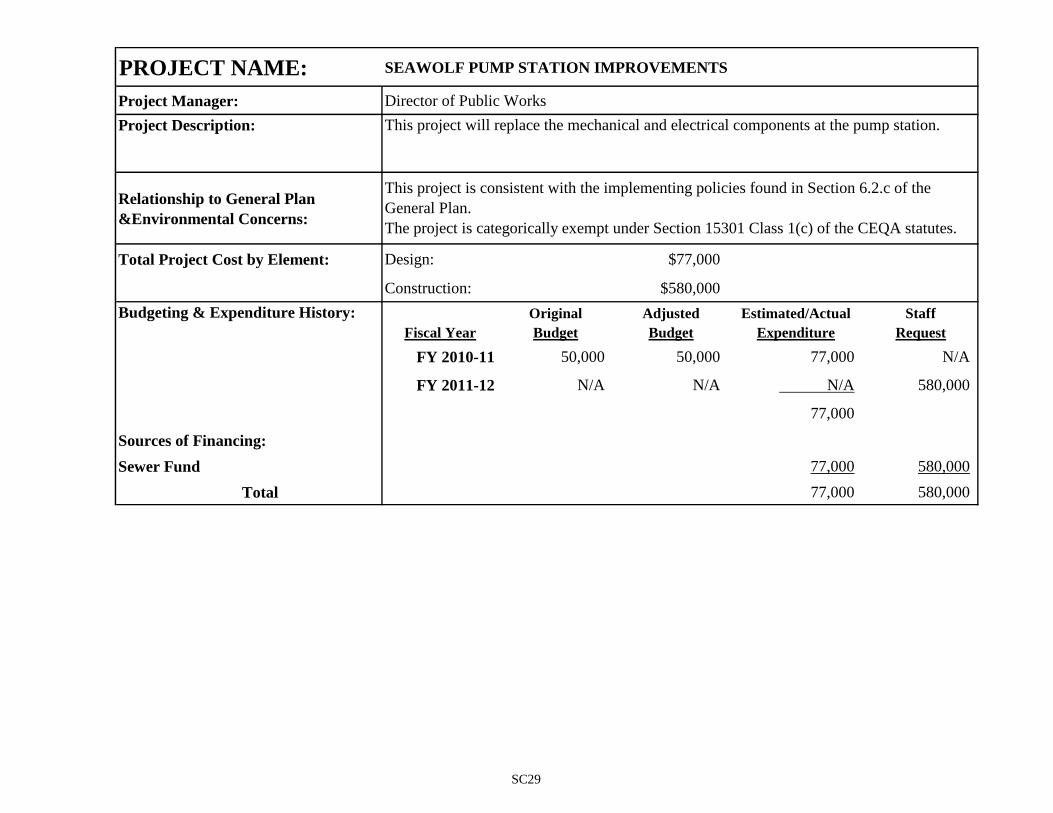
PROJECT NAME: SEAWOLF PUMP STATION IMPROVEMENTS
Project Manager: Director of Public Works
Project Description:
Relationship to General Plan
&Environmental Concerns:
Total Project Cost by Element: Design: $77,000
Construction: $580,000
Budgeting & Expenditure History: Original Adjusted Estimated/Actual Staff
Fiscal Year Budget Budget Expenditure Request
FY 2010-11 50,000 50,000 77,000 N/A
FY 2011-12 N/A N/A N/A 580,000
77,000
Sources of Financing:
Sewer Fund 77,000 580,000
Total 77,000 580,000
This project will replace the mechanical and electrical components at the pump station.
This project is consistent with the implementing policies found in Section 6.2.c of the
General Plan.
The project is categorically exempt under Section 15301 Class 1(c) of the CEQA statutes.
SC29
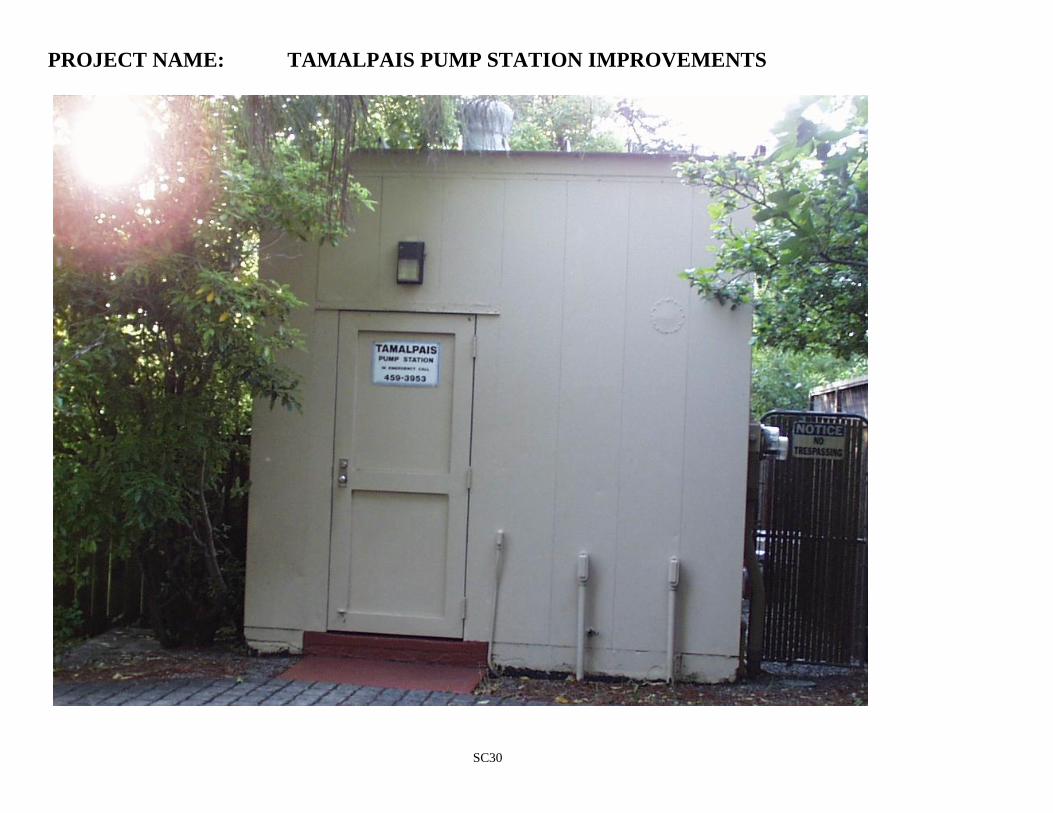
SC30
PROJECT NAME: TAMALPAIS PUMP STATION IMPROVEMENTS
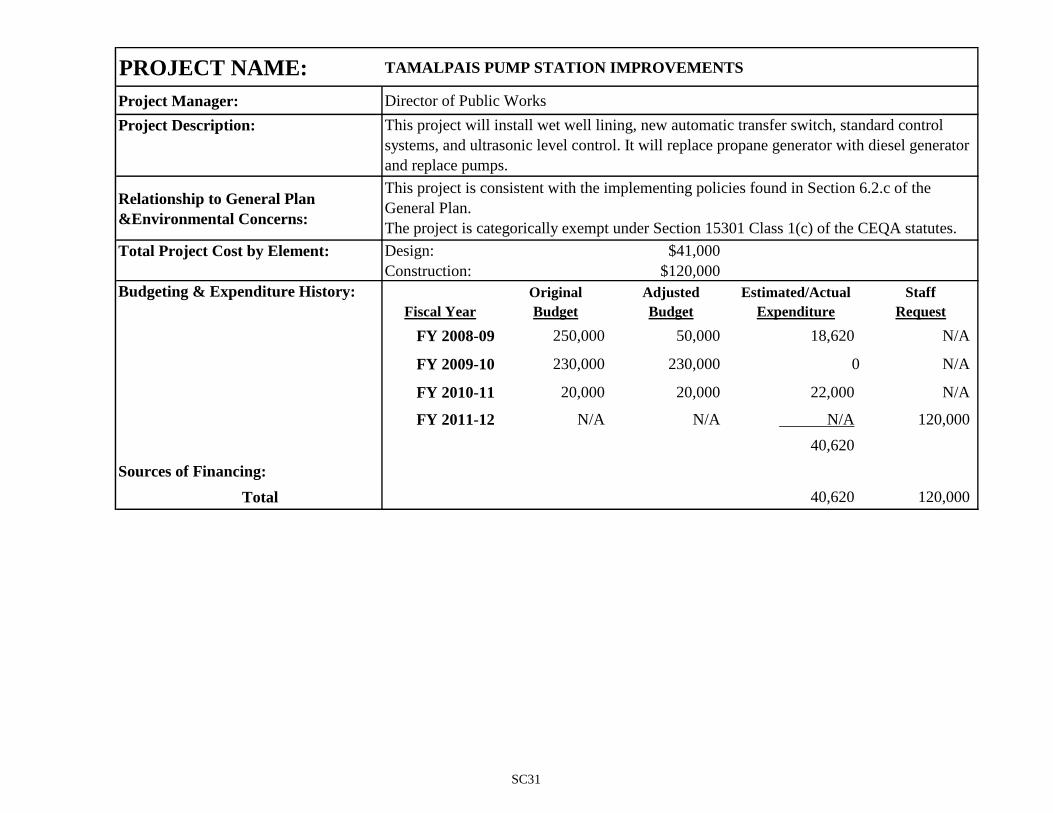
PROJECT NAME: TAMALPAIS PUMP STATION IMPROVEMENTS
Project Manager: Director of Public Works
Project Description:
Relationship to General Plan
&Environmental Concerns:
Total Project Cost by Element: Design: $41,000
Construction: $120,000
Budgeting & Expenditure History: Original Adjusted Estimated/Actual Staff
Fiscal Year Budget Budget Expenditure Request
FY 2008-09 250,000 50,000 18,620 N/A
FY 2009-10 230,000 230,000 0 N/A
FY 2010-11 20,000 20,000 22,000 N/A
FY 2011-12 N/A N/A N/A 120,000
40,620
Sources of Financing:
Total 40,620 120,000
This project will install wet well lining, new automatic transfer switch, standard control
systems, and ultrasonic level control. It will replace propane generator with diesel generator
and replace pumps.
This project is consistent with the implementing policies found in Section 6.2.c of the
General Plan.
The project is categorically exempt under Section 15301 Class 1(c) of the CEQA statutes.
SC31
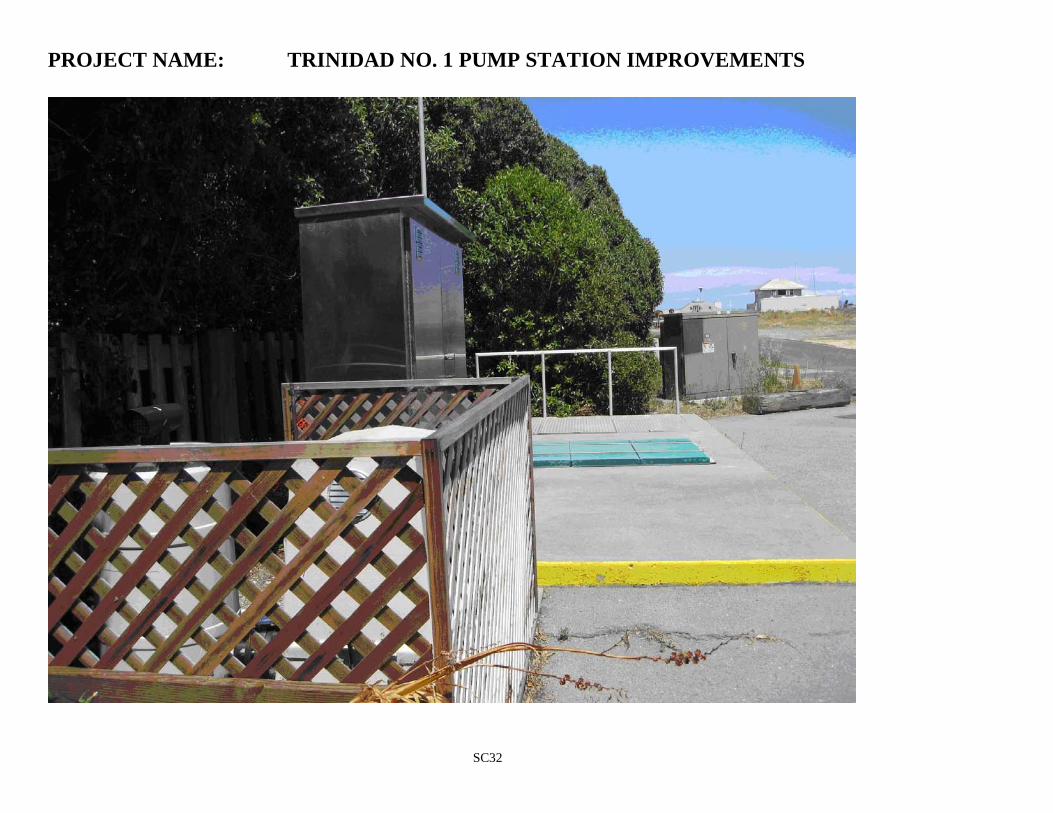
SC32
PROJECT NAME: TRINIDAD NO. 1 PUMP STATION IMPROVEMENTS
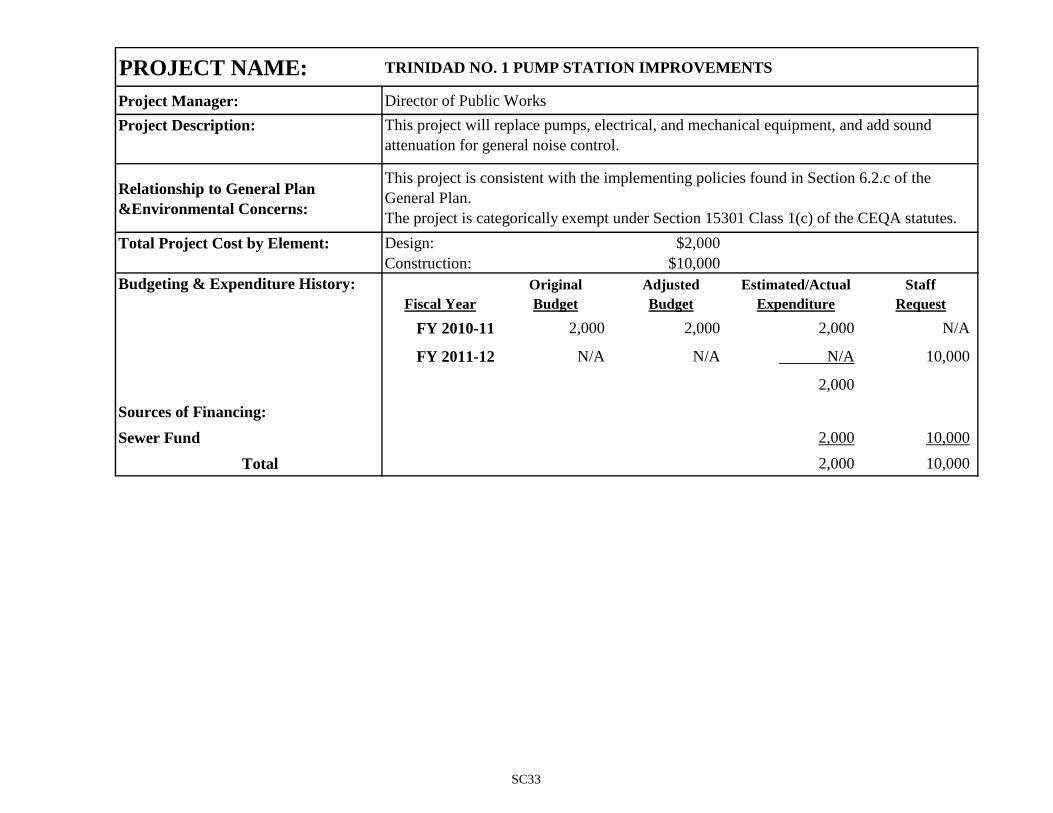
PROJECT NAME: TRINIDAD NO. 1 PUMP STATION IMPROVEMENTS
Project Manager: Director of Public Works
Project Description:
Relationship to General Plan
&Environmental Concerns:
Total Project Cost by Element: Design: $2,000
Construction: $10,000
Budgeting & Expenditure History: Original Adjusted Estimated/Actual Staff
Fiscal Year Budget Budget Expenditure Request
FY 2010-11 2,000 2,000 2,000 N/A
FY 2011-12 N/A N/A N/A 10,000
2,000
Sources of Financing:
Sewer Fund 2,000 10,000
Total 2,000 10,000
This project will replace pumps, electrical, and mechanical equipment, and add sound
attenuation for general noise control.
This project is consistent with the implementing policies found in Section 6.2.c of the
General Plan.
The project is categorically exempt under Section 15301 Class 1(c) of the CEQA statutes.
SC33
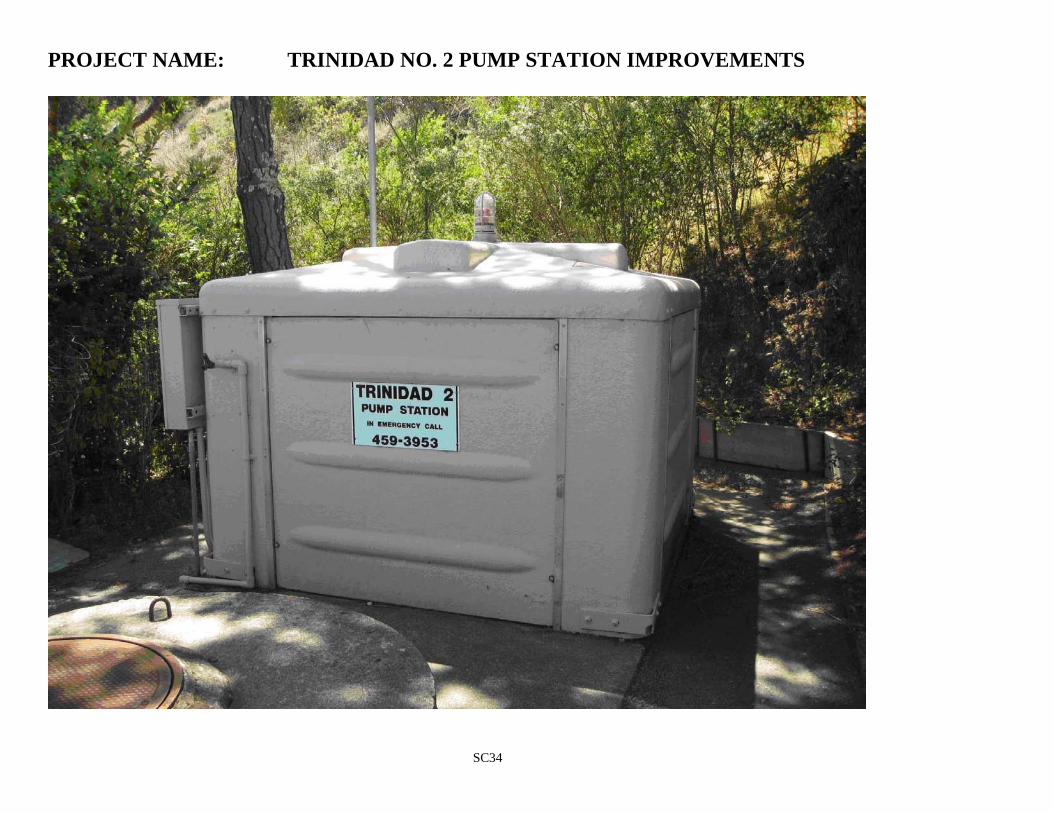
SC34
PROJECT NAME: TRINIDAD NO. 2 PUMP STATION IMPROVEMENTS
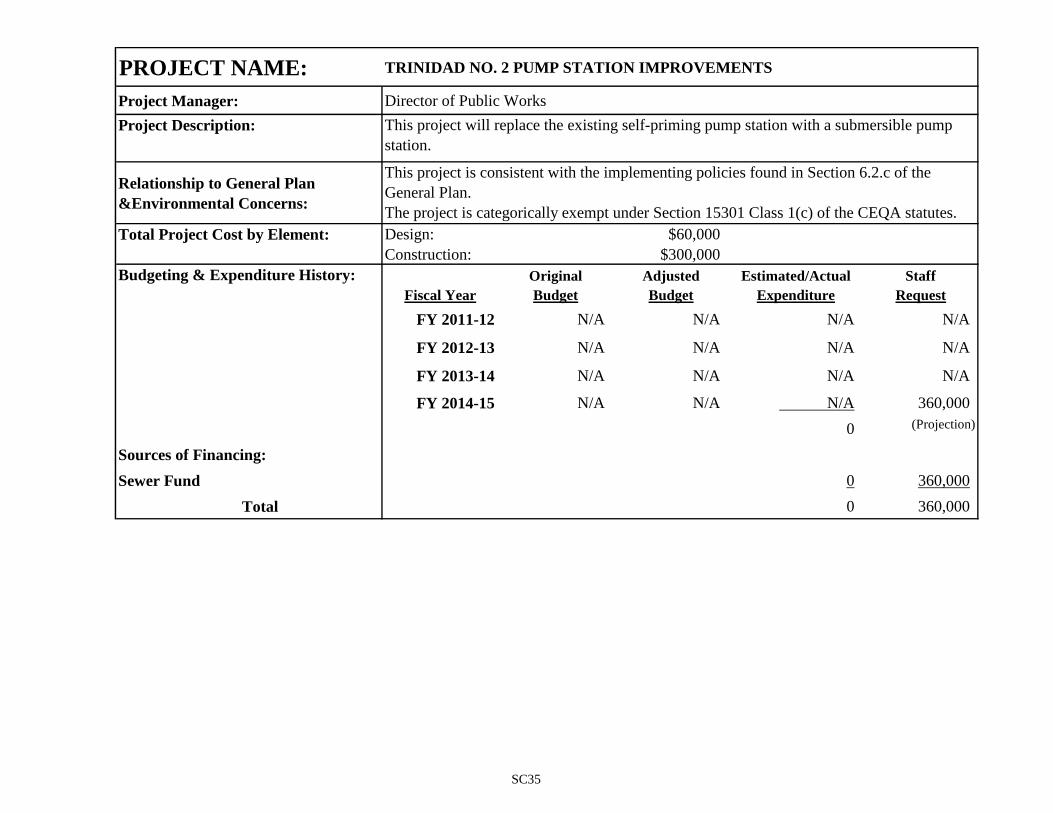
PROJECT NAME: TRINIDAD NO. 2 PUMP STATION IMPROVEMENTS
Project Manager: Director of Public Works
Project Description:
Relationship to General Plan
&Environmental Concerns:
Total Project Cost by Element: Design: $60,000
Construction: $300,000
Budgeting & Expenditure History: Original Adjusted Estimated/Actual Staff
Fiscal Year Budget Budget Expenditure Request
FY 2011-12 N/A N/A N/A N/A
FY 2012-13 N/A N/A N/A N/A
FY 2013-14 N/A N/A N/A N/A
FY 2014-15 N/A N/A N/A 360,000
0 (Projection)
Sources of Financing:
Sewer Fund 0 360,000
Total 0 360,000
This project will replace the existing self-priming pump station with a submersible pump
station.
This project is consistent with the implementing policies found in Section 6.2.c of the
General Plan.
The project is categorically exempt under Section 15301 Class 1(c) of the CEQA statutes.
SC35
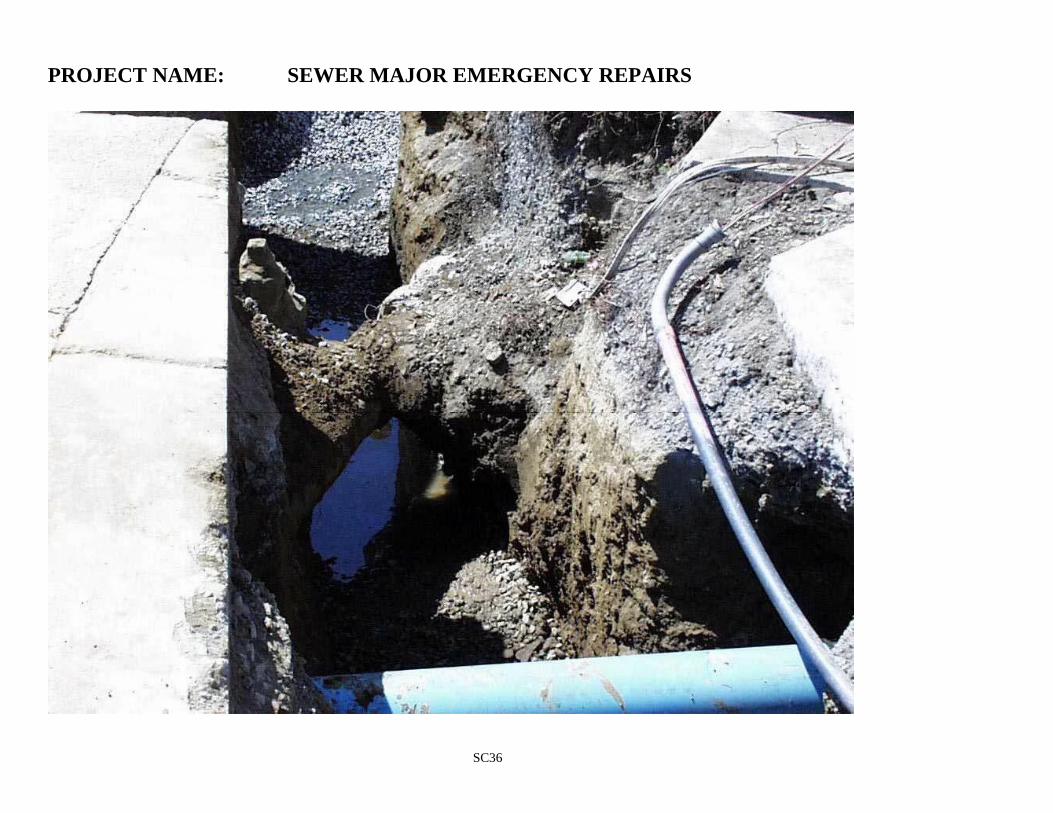
SC36
PROJECT NAME: SEWER MAJOR EMERGENCY REPAIRS
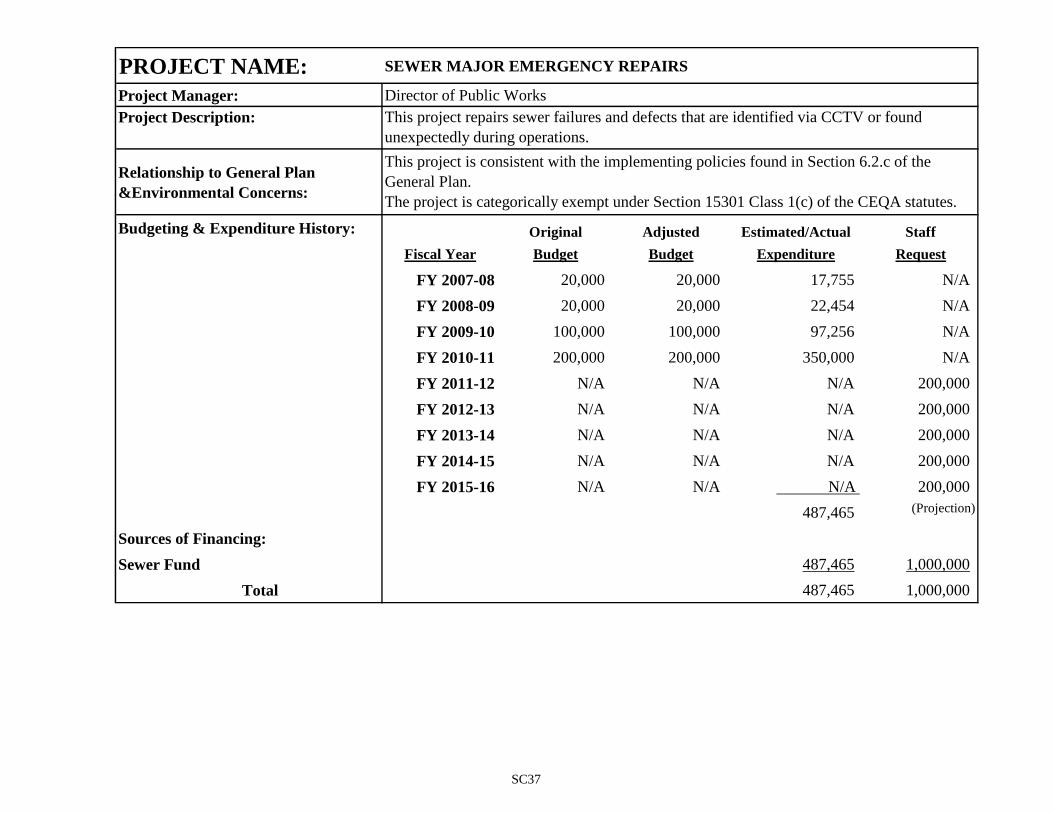
PROJECT NAME: SEWER MAJOR EMERGENCY REPAIRS
Project Manager: Director of Public Works
Project Description:
Relationship to General Plan
&Environmental Concerns:
Budgeting & Expenditure History: Original Adjusted Estimated/Actual Staff
Fiscal Year Budget Budget Expenditure Request
FY 2007-08 20,000 20,000 17,755 N/A
FY 2008-09 20,000 20,000 22,454 N/A
FY 2009-10 100,000 100,000 97,256 N/A
FY 2010-11 200,000 200,000 350,000 N/A
FY 2011-12 N/A N/A N/A 200,000
FY 2012-13 N/A N/A N/A 200,000
FY 2013-14 N/A N/A N/A 200,000
FY 2014-15 N/A N/A N/A 200,000
FY 2015-16 N/A N/A N/A 200,000
487,465 (Projection)
Sources of Financing:
Sewer Fund 487,465 1,000,000
Total 487,465 1,000,000
This project is consistent with the implementing policies found in Section 6.2.c of the
General Plan.
The project is categorically exempt under Section 15301 Class 1(c) of the CEQA statutes.
This project repairs sewer failures and defects that are identified via CCTV or found
unexpectedly during operations.
SC37
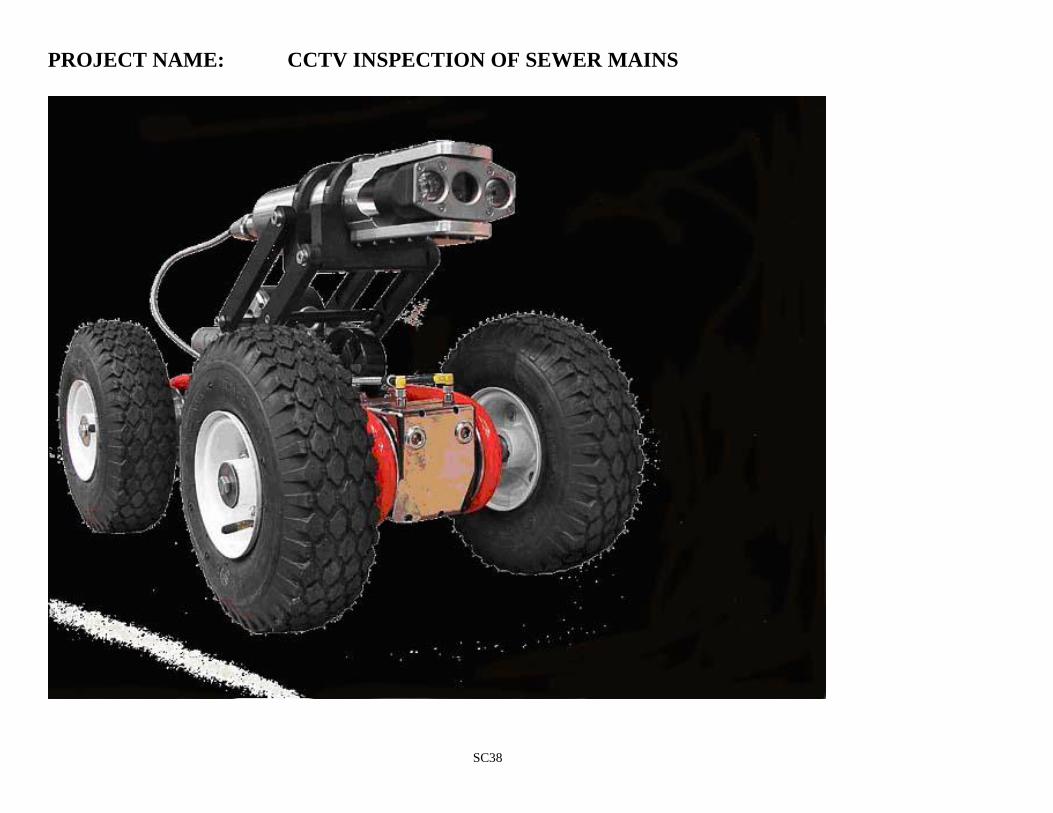
SC38
PROJECT NAME: CCTV INSPECTION OF SEWER MAINS
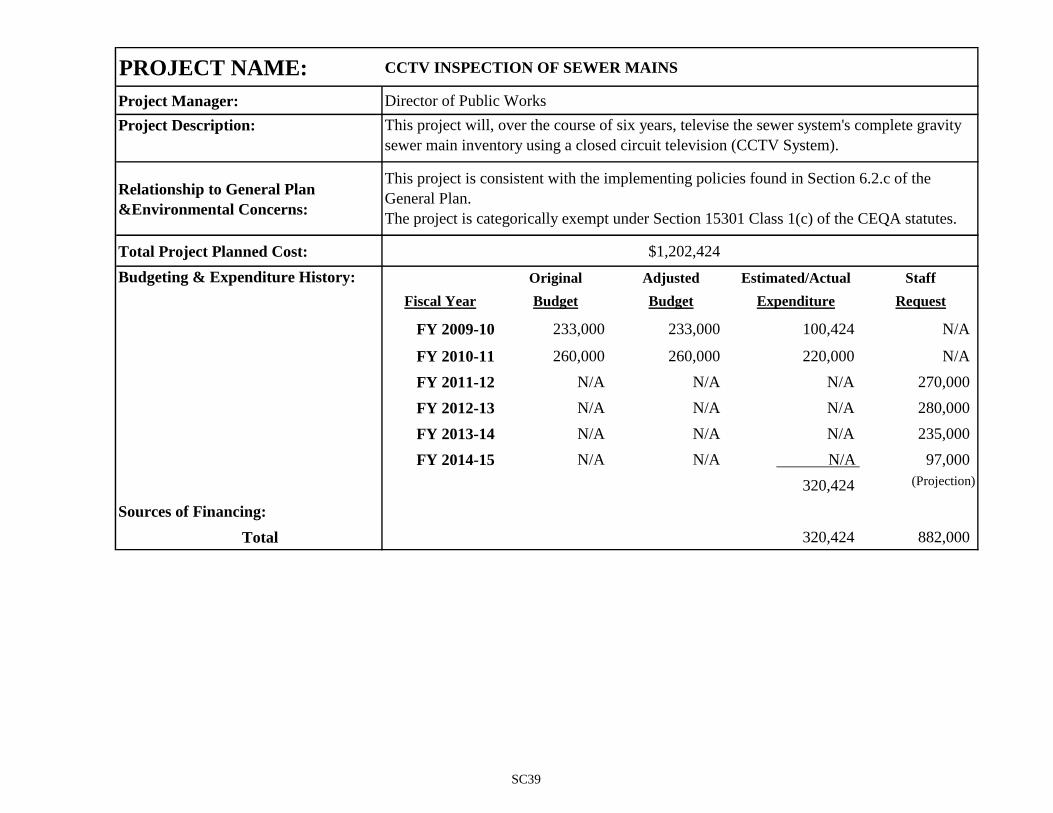
PROJECT NAME: CCTV INSPECTION OF SEWER MAINS
Project Manager: Director of Public Works
Project Description:
Relationship to General Plan
&Environmental Concerns:
Total Project Planned Cost: $1,202,424
Budgeting & Expenditure History: Original Adjusted Estimated/Actual Staff
Fiscal Year Budget Budget Expenditure Request
FY 2009-10 233,000 233,000 100,424 N/A
FY 2010-11 260,000 260,000 220,000 N/A
FY 2011-12 N/A N/A N/A 270,000
FY 2012-13 N/A N/A N/A 280,000
FY 2013-14 N/A N/A N/A 235,000
FY 2014-15 N/A N/A N/A 97,000
320,424 (Projection)
Sources of Financing:
Total 320,424 882,000
This project will, over the course of six years, televise the sewer system's complete gravity
sewer main inventory using a closed circuit television (CCTV System).
This project is consistent with the implementing policies found in Section 6.2.c of the
General Plan.
The project is categorically exempt under Section 15301 Class 1(c) of the CEQA statutes.
SC39
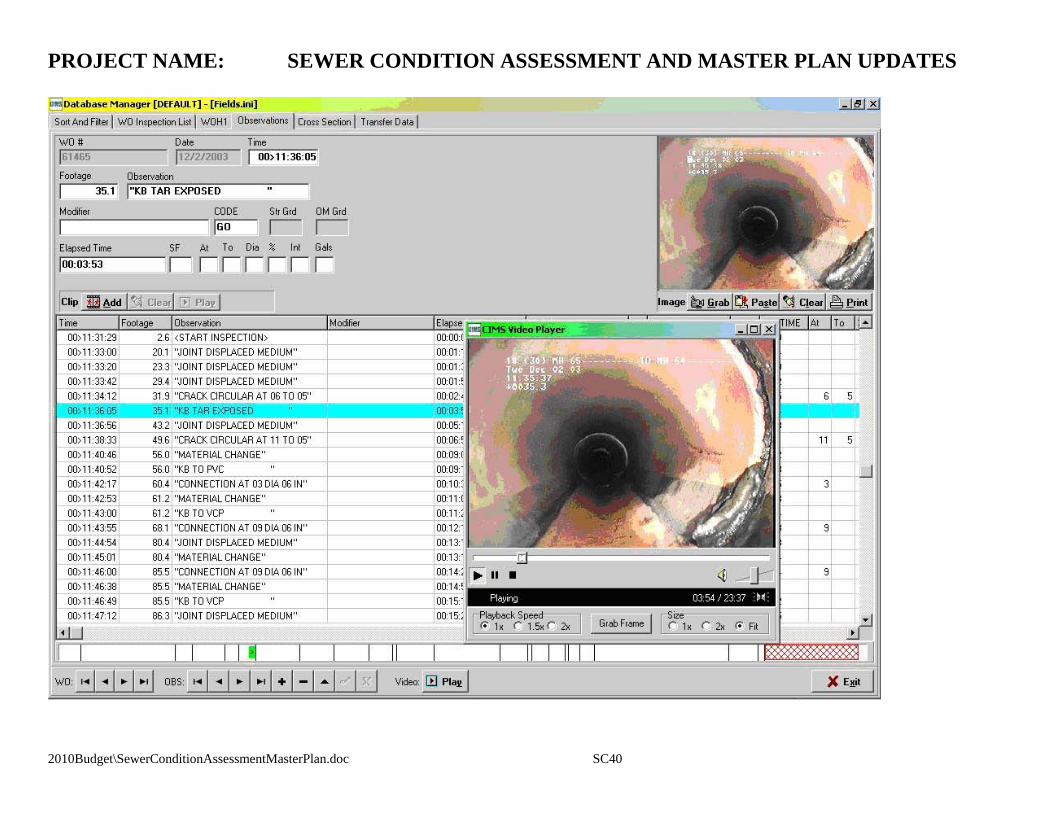
PROJECT NAME: SEWER CONDITION ASSESSMENT AND MASTER PLAN UPDATES
2010Budget\SewerConditionAssessmentMasterPlan.doc SC40
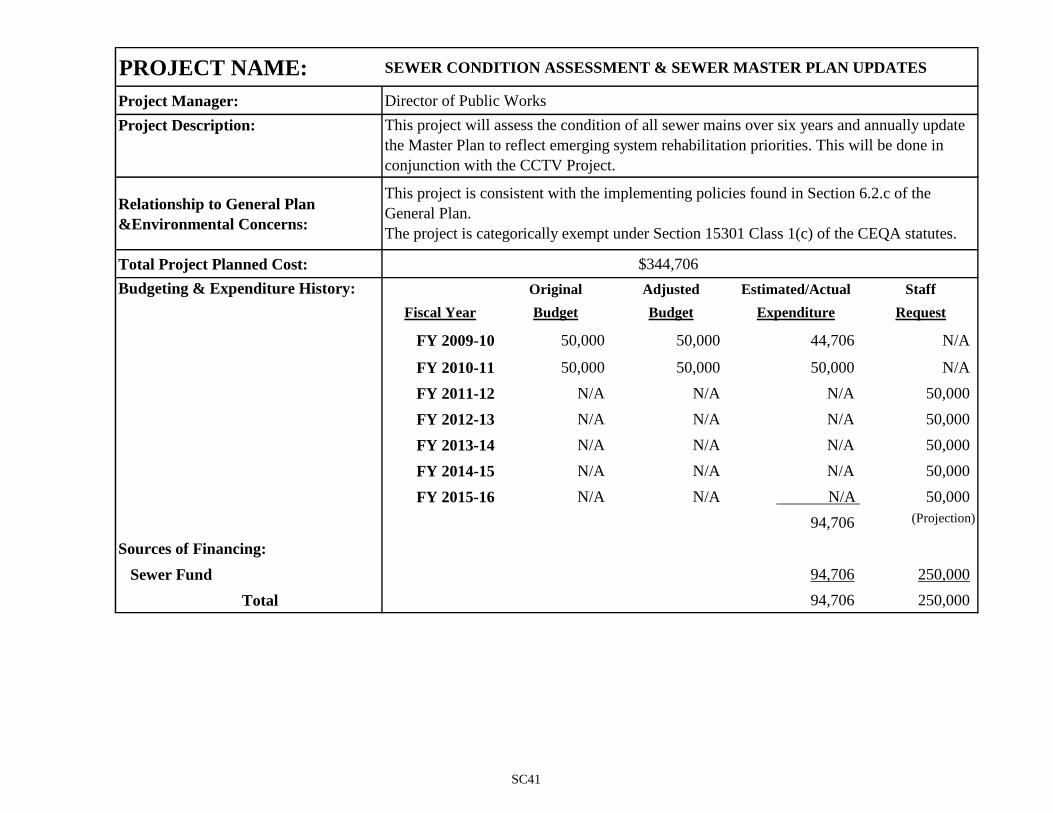
PROJECT NAME: SEWER CONDITION ASSESSMENT & SEWER MASTER PLAN UPDATES
Project Manager: Director of Public Works
Project Description:
Relationship to General Plan
&Environmental Concerns:
Total Project Planned Cost: $344,706
Budgeting & Expenditure History: Original Adjusted Estimated/Actual Staff
Fiscal Year Budget Budget Expenditure Request
FY 2009-10 50,000 50,000 44,706 N/A
FY 2010-11 50,000 50,000 50,000 N/A
FY 2011-12 N/A N/A N/A 50,000
FY 2012-13 N/A N/A N/A 50,000
FY 2013-14 N/A N/A N/A 50,000
FY 2014-15 N/A N/A N/A 50,000
FY 2015-16 N/A N/A N/A 50,000
94,706 (Projection)
Sources of Financing:
Sewer Fund 94,706 250,000
Total 94,706 250,000
This project will assess the condition of all sewer mains over six years and annually update
the Master Plan to reflect emerging system rehabilitation priorities. This will be done in
conjunction with the CCTV Project.
This project is consistent with the implementing policies found in Section 6.2.c of the
General Plan.
The project is categorically exempt under Section 15301 Class 1(c) of the CEQA statutes.
SC41
SC42
PROJECT NAME: SEWER INFRASTRUCTURE MANAGEMENT - GIS
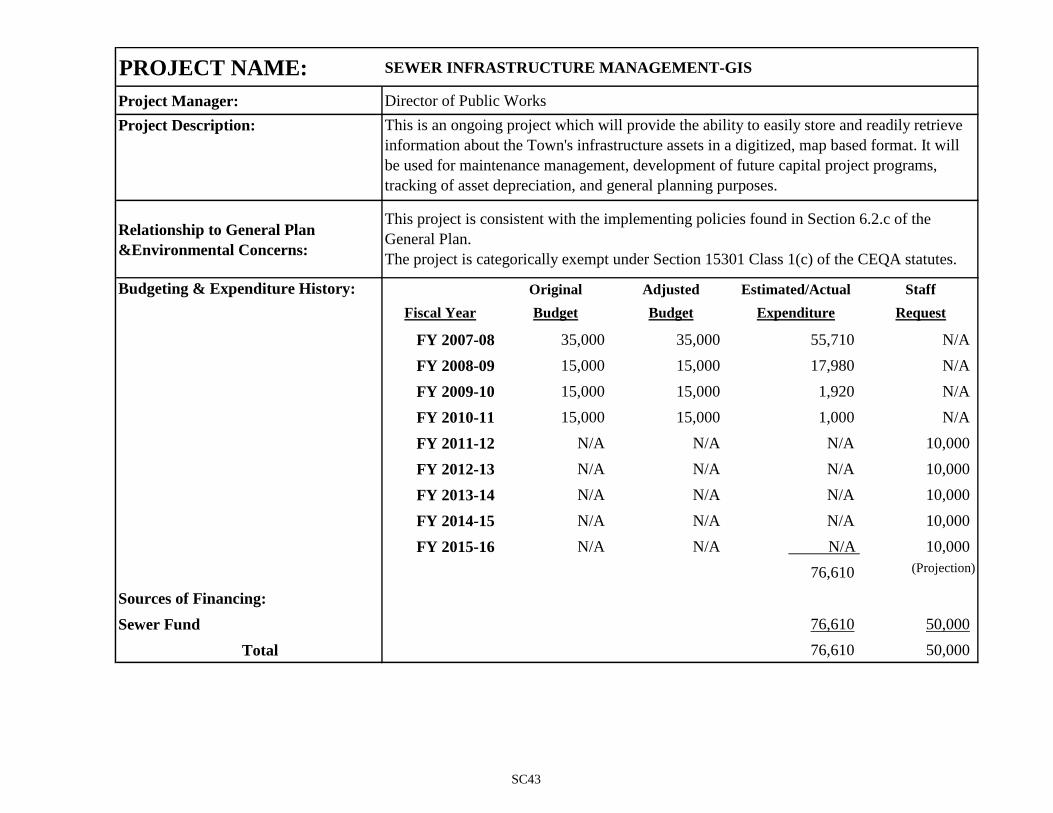
PROJECT NAME: SEWER INFRASTRUCTURE MANAGEMENT-GIS
Project Manager: Director of Public Works
Project Description:
Relationship to General Plan
&Environmental Concerns:
Budgeting & Expenditure History: Original Adjusted Estimated/Actual Staff
Fiscal Year Budget Budget Expenditure Request
FY 2007-08 35,000 35,000 55,710 N/A
FY 2008-09 15,000 15,000 17,980 N/A
FY 2009-10 15,000 15,000 1,920 N/A
FY 2010-11 15,000 15,000 1,000 N/A
FY 2011-12 N/A N/A N/A 10,000
FY 2012-13 N/A N/A N/A 10,000
FY 2013-14 N/A N/A N/A 10,000
FY 2014-15 N/A N/A N/A 10,000
FY 2015-16 N/A N/A N/A 10,000
76,610 (Projection)
Sources of Financing:
Sewer Fund 76,610 50,000
Total 76,610 50,000
This is an ongoing project which will provide the ability to easily store and readily retrieve
information about the Town's infrastructure assets in a digitized, map based format. It will
be used for maintenance management, development of future capital project programs,
tracking of asset depreciation, and general planning purposes.
This project is consistent with the implementing policies found in Section 6.2.c of the
General Plan.
The project is categorically exempt under Section 15301 Class 1(c) of the CEQA statutes.
SC43

BLANK PAGE
SC44