towards energy and resource efficient manufacturing: a processes and systems approach
TRANSCRIPT

l as onandthe
byent,tive
thergyer-
and% ofnce
to (in
thatrial
CIRP Annals - Manufacturing Technology 61 (2012) 587–609
ncy
the
rent
ory,
d in
cant
rea.
IRP.
Towards energy and resource efficient manufacturing:A processes and systems approach
Joost R. Duflou (2)a,*, John W. Sutherland (1)b, David Dornfeld (1)c, Christoph Herrmann d,Jack Jeswiet (1)e, Sami Kara (1)f, Michael Hauschild (1)g, Karel Kellens a
a Centre for Industrial Management, Department of Mechanical Engineering, KU Leuven, Belgiumb Division of Environmental and Ecological Engineering, Purdue University, West Lafayette, United Statesc Laboratory for Manufacturing and Sustainability, University of California, Berkeley, United Statesd Institute of Machine Tools and Production Technology (IWF), Technische Universitat Braunschweig, Germanye Department of Mechanical and Materials Engineering, Queen’s University, Kingston, Canadaf School of Mechanical & Manufacturing Engineering, University of New South Wales, Australiag Department of Manufacturing Engineering and Management, Technical University of Denmark, Lyngby, Denmark
1. Introduction
Manufacturing plays an indispensible role within the globaleconomy. Not only does manufacturing provide the goods neededby consumers and industries worldwide, it also accounts for asignificant portion of the employment, community presence, andeconomic strength. The industry sectors (including mining,manufacturing, and construction) account for nearly one-quarterof all jobs globally, with over 650 million individuals employed inthe sectors [201]. Job growth within the industry sectors has beenvibrant over the last decade, especially in the developing world,with 130 million industry jobs created between 1999 and 2009 assupply chains have become increasingly globalized [96,201]. Whilemanufacturing employment within industrialized countries hasremained at best flat over the last few decades, the productivity ofthe sector underwent extraordinary growth; for example, between1980 and 2005, the annual global production of aluminum morethan doubled from 15.4 Tg to 37.3 Tg [207]. Given its importance interms of employment and wealth creation (in 2007, industryconstituted approximately 20% of the GDP of the OECD countries[147]), manufacturing will continue to play a vital role in the globaleconomy. Unfortunately, manufacturing also must accept respon-
(e.g. metals, fossil oil-derived materials, and water) as welsignificant amounts of energy, resulting in substantial stressthe environment. Manufacturing also releases solid, liquid,
gaseous waste streams that can result in damage to
environment.
1.1. Scope
While all the resources consumed and wastes producedmanufacturing affect the environment to a greater or lesser extthe focus of the present work is on the efficient and effecutilization of resources, and in particular energy resources.
To illustrate the importance of industry with respect to
energy demand, consider, for example, the amount of eneassociated with the four principal end-uses: residential, commcial, industrial, and transportation. Residential, commercial,
transportation energy consumption represent 14%, 7%, and 27the global total, with industrial usage constituting the bala(51%) [204]. While these percentages change from countrycountry, and notably from developing to industrialized nations2007 the energy consumed by non-OECD countries exceeded
of the OECD countries for the first time), the sheer size of indust
A R T I C L E I N F O
Keywords:
Energy efficiency
Manufacturing
Sustainable development
A B S T R A C T
This paper aims to provide a systematic overview of the state of the art in energy and resource efficie
increasing methods and techniques in the domain of discrete part manufacturing, with attention for
effectiveness of the available options. For this purpose a structured approach, distinguishing diffe
system scale levels, is applied: starting from a unit process focus, respectively the multi-machine, fact
multi-facility and supply chain levels are covered. Determined by the research contributions reporte
literature, the de facto focus of the paper is mainly on energy related aspects of manufacturing. Signifi
opportunities for systematic efficiency improving measures are identified and summarized in this a
� 2012 C
Contents lists available at SciVerse ScienceDirect
CIRP Annals - Manufacturing Technology
journal homepage: http: / /ees.elsevier.com/cirp/default .asp
07)ring74]ted
sibility for placing increasing pressure on the environment.Industrial activity, and in particular the manufacturing sector,
has a large environmental burden associated with it. Manufac-turing consumes both renewable and non-renewable materials
ion.CO2
umrals
* Corresponding author.
E-mail address: [email protected] (J.R. Duflou).
0007-8506/$ – see front matter � 2012 CIRP.
http://dx.doi.org/10.1016/j.cirp.2012.05.002
energy consumption (250 quadrillion BTU or 264 EJ in 20suggests that this is an issue of importance [204]. Manufactuactivities dominate industrial energy consumption; Schipper [1reports that manufacturing is responsible for 84% of energy-relaindustry CO2 emissions and 90% of industry energy consumpt
Sizeable energy consumers, and consequently large
emitters, within the manufacturing sector include petrolerefining, primary metals processing, non-metallic mine

procturiproccostsignacadThisandmaifocumaninveperfcrite
Pabiliturinreguand
morcomwatcost140
Dthrobasemanmatproca sizmadinteand
Morinteopinreso
1.2.
Tare sinclufacturesoscopto ththatpart
Tsubsonmcyclsupprepron ubegi
Tassecallecontclimrecerelaeffocourembenvitrea
J.R. Duflou et al. / CIRP Annals - Manufacturing Technology 61 (2012) 587–609588
essing, chemical production, and paper products manufac-ng. These sectors are characterized by semi-continuousesses, for which material and energy demands form major
factors. The efficiency of these processes has receivedificant attention as an optimization objective in bothemic and industrial research environments for many years.
is somewhat different in the sectors focused on discrete part product manufacturing, where attention became visiblenly over the last decade. This paper is therefore predominantlysed on the industrial sectors active in discrete part/productufacturing. Until recently, companies in these sectorssting in new machine tools primarily took functionalormance and investment cost into account as selectionria.erhaps driven by concerns related to environmental sustain-ty, a trend towards more environmentally benign manufac-g can be observed today. In addition to more stringentlations (e.g. emission standards, worker exposure standards,banned materials), additional motivating factors to switch toe environmentally benign manufacturing solutions includepetitive economic advantages (e.g. conservation of energy,er, and materials, and reduced waste treatment and disposals) and proactive green behavior (e.g. corporate image, ISO01 certification [97], and eco-labeling) [68].iscrete part manufacturing industries emit CO2 indirectlyugh the consumption of electricity and directly through plant-d use of fossil fuels. It is becoming increasingly apparent thatufacturers play a critical, multi-faceted role in dictating theerial and energy resources in modern society. Not only do theesses designed and employed directly by manufacturers haveable environmental impact, but the product design decisionse by manufacturers also control the energy and resourcensive production of materials and chemicals and the energy
resources consumed by products across their life cycle.eover, as supply chains become more globalized, energynsive operations are increasingly being outsourced to devel-g nations that often utilize more CO2 intensive energyurces.
Objective
he environmental challenges that we face in the near futureignificant, and every part of society must proactively respond,ding manufacturing. Opportunities exist across the manu-ring enterprise for more efficient usage of energy and material
urces, and in particular improved material utilization. Thee of opportunities ranges from the process to the factory levele entire enterprise, and this paper will present research efforts
cover this scope, although attention will be limited to discrete manufacturing processes and systems.o support the design and realization of products and theirequent distribution, utilization, and disposition, some envir-ent-oriented software tools have been developed, e.g. life
e assessment software. Unfortunately, manufacturing data inort of such software tools are often not available, not
esentative of the situations faced by manufacturers, or basednrealistic assumptions. With this in mind, this paper will alson to address this deficiency.his paper has the ambition to provide a state of the art
1.3. Resource efficient and effective manufacturing
This contribution addresses both the efficiency and effective-ness with which we use energy and material resources, and somebrief explanation of the distinction between efficiency andeffectiveness is warranted. Efficiency refers to the amount ofresources required to produce a given level of output, where it is tobe understood that it is desirable to minimize the amount ofresources to achieve a given output level. Effectiveness is focused onmaking wise choices with respect to how resources are used. Toillustrate the difference between efficiency and effectiveness,consider the energy consumed in a grinding operation. Efficiencyimprovements might include changing the wheel type or employ-ing a different cutting fluid in order to reduce the energy requiredfor a given operation. An effectiveness approach might change theprocess plan entirely to use a dramatically smaller amount ofenergy, with the resulting process plan not needing the grindingoperation. In short, efficiency is doing things right, and effective-ness is doing the right things.
1.4. Manufacturing system organization
From the perspective of the organization of the system,manufacturing activities can be considered as being composedof multiple levels, from the level of the individual devices whereunit processes take place, through to that of the enterprise,incorporating all the activities in the manufacturing system,including supply chain externalities [165]. In the context of thispaper five levels are distinguished:
� Device/unit process: Individual device or machine tool in themanufacturing system, which is performing a unit process.Support equipment of the unit process is included here, such asgage systems and device level oil-circulating systems.� Line/cell/multi-machine system: Logical organization of devices in
the system that are acting in series or parallel to execute aspecific activity (such as manufacturing a part or assembly).Support equipment for the collection of devices is included here,such as chip conveyers and tool cribs.� Facility: Distinct physical entity housing multiple devices, which
may or may not be logically organized into lines, cells, etc.Support equipment required at the facility level are also includedhere, such as power generators, water purifiers, and HVACsystems.� Multi-factory system: Different facilities whose proximity to one
another allows them to make use of possible synergies in termsof reuse of waste and lost energy streams.� Enterprise/global supply chain: The entire manufacturing system,
consisting of all the individual facilities, the infrastructurerequired to support the facilities, as well as the transportationand supply chain externalities.
1.5. Paper overview
Depending on the scale of the considered system, differentstrategies can be applied to optimize efficiency and effectiveness ofmanufacturing systems. In order to offer a systematic review ofperceived opportunities and tested strategies, the paper is
ssment of the methodologies and technologies that can bed upon at different levels within the production system toribute to a significant impact reduction. Perhaps owing toate change, energy independence, and energy cost concerns,nt research work by many researchers has focused on energy-ted issues. Thus, the paper has a strong focus on energy-relatedrts. However, other resource streams are also covered. These, ofse, also represent indirect energy consumption throughodied energy, but also have other associated wide rangingronmental effects in their production and end-of-life (EOL)tment stages.
structured according to an increasing system scale, largelycorresponding to the levels distinguished above.
In Section 2, the individual process level is studied. Thematerial–process interaction, as achieved by stand-alone machinetools performing individual operations or a series of operations ona workpiece, is the focus. The unit processes studied in this sectionform the smallest building blocks for the composition ofmanufacturing systems. Choice of process principle and machinetool selection are typical measures that can be considered at thislevel. For machine tool designers, component selection andoptimized control of subsystems offer opportunities.
kes theact
theused int is
trently. In
ringell
thetur-
asuchtivethe
ssesrgy
Forase
ataandandelyAL
pitetherialses.ntalt al.
ine
ersinly[40,ion,ca-
y ofISOine
n –for
ycleend
and
J.R. Duflou et al. / CIRP Annals - Manufacturing Technology 61 (2012) 587–609 589
Possible interactions and synergies between different machinetools are considered in Section 3. Multi-machine ecosystems canallow reuse of energy and material flows through proper planningand control.
Section 4 focuses on spatial and temporal considerations atfactory level. Energy management aspects linked to productionplanning and the influence of factory layout, support facilities andbuilding technology on plant performance are reviewed here.
Wherever considerable energy and material waste flows cannotbe resolved at an in-house scale, industrial symbiosis amongdifferent manufacturing facilities can provide opportunities, asstudied in Section 5.
In a globalized economy, supply chain decisions can havesignificant consequences in terms of required transport efforts andthe nature of local supplies of energy and other resources. Thesensitivity of the environmental impact of manufacturing for thesefactors is analyzed in Section 6.
In order to provide the reader with a realistic view of themagnitude of the energy and resource efficiency affectingmeasures at the respective scale levels, examples and quantifiedeffects are reported in the different sections. While these can onlybe considered as illustrations of the system sensitivity for thetested strategies at different scales, it is the hope of the authors thatsuch examples contribute to a more balanced view on prioritiza-tion among the wide range of identified efficiency increasingmeasures.
2. Unit process level
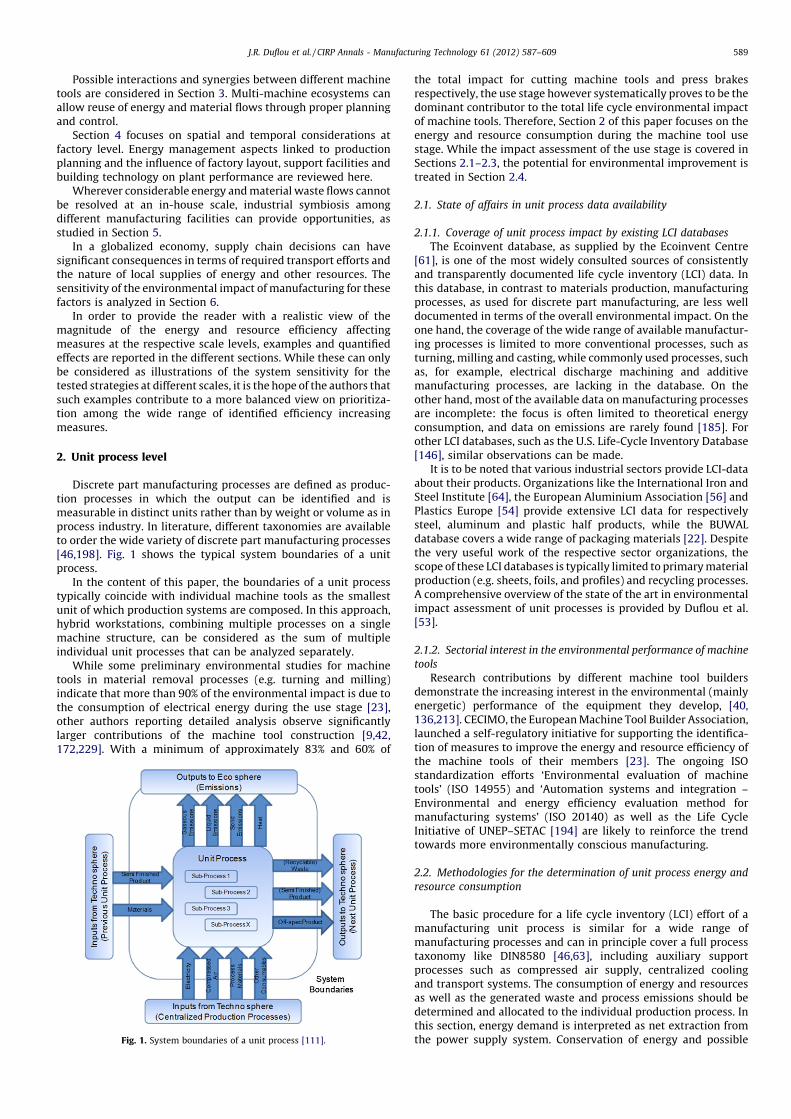
Discrete part manufacturing processes are defined as produc-tion processes in which the output can be identified and ismeasurable in distinct units rather than by weight or volume as inprocess industry. In literature, different taxonomies are availableto order the wide variety of discrete part manufacturing processes[46,198]. Fig. 1 shows the typical system boundaries of a unitprocess.
In the content of this paper, the boundaries of a unit processtypically coincide with individual machine tools as the smallestunit of which production systems are composed. In this approach,hybrid workstations, combining multiple processes on a singlemachine structure, can be considered as the sum of multipleindividual unit processes that can be analyzed separately.
While some preliminary environmental studies for machinetools in material removal processes (e.g. turning and milling)indicate that more than 90% of the environmental impact is due tothe consumption of electrical energy during the use stage [23],other authors reporting detailed analysis observe significantlylarger contributions of the machine tool construction [9,42,172,229]. With a minimum of approximately 83% and 60% of
the total impact for cutting machine tools and press brarespectively, the use stage however systematically proves to bedominant contributor to the total life cycle environmental impof machine tools. Therefore, Section 2 of this paper focuses onenergy and resource consumption during the machine tool
stage. While the impact assessment of the use stage is covereSections 2.1–2.3, the potential for environmental improvementreated in Section 2.4.
2.1. State of affairs in unit process data availability
2.1.1. Coverage of unit process impact by existing LCI databases
The Ecoinvent database, as supplied by the Ecoinvent Cen[61], is one of the most widely consulted sources of consisteand transparently documented life cycle inventory (LCI) datathis database, in contrast to materials production, manufactuprocesses, as used for discrete part manufacturing, are less wdocumented in terms of the overall environmental impact. Onone hand, the coverage of the wide range of available manufacing processes is limited to more conventional processes, suchturning, milling and casting, while commonly used processes, sas, for example, electrical discharge machining and addimanufacturing processes, are lacking in the database. On
other hand, most of the available data on manufacturing proceare incomplete: the focus is often limited to theoretical eneconsumption, and data on emissions are rarely found [185].other LCI databases, such as the U.S. Life-Cycle Inventory Datab[146], similar observations can be made.
It is to be noted that various industrial sectors provide LCI-dabout their products. Organizations like the International Iron
Steel Institute [64], the European Aluminium Association [56]
Plastics Europe [54] provide extensive LCI data for respectivsteel, aluminum and plastic half products, while the BUWdatabase covers a wide range of packaging materials [22]. Desthe very useful work of the respective sector organizations,
scope of these LCI databases is typically limited to primary mateproduction (e.g. sheets, foils, and profiles) and recycling procesA comprehensive overview of the state of the art in environmeimpact assessment of unit processes is provided by Duflou e[53].
2.1.2. Sectorial interest in the environmental performance of mach
tools
Research contributions by different machine tool builddemonstrate the increasing interest in the environmental (maenergetic) performance of the equipment they develop,
136,213]. CECIMO, the European Machine Tool Builder Associatlaunched a self-regulatory initiative for supporting the identifition of measures to improve the energy and resource efficiencthe machine tools of their members [23]. The ongoing
standardization efforts ‘Environmental evaluation of machtools’ (ISO 14955) and ‘Automation systems and integratioEnvironmental and energy efficiency evaluation method
manufacturing systems’ (ISO 20140) as well as the Life CInitiative of UNEP–SETAC [194] are likely to reinforce the trtowards more environmentally conscious manufacturing.
2.2. Methodologies for the determination of unit process energy
resource consumption
of a ofessort
lingrces
be. InomibleFig. 1. System boundaries of a unit process [111].
The basic procedure for a life cycle inventory (LCI) effort
manufacturing unit process is similar for a wide rangemanufacturing processes and can in principle cover a full proctaxonomy like DIN8580 [46,63], including auxiliary suppprocesses such as compressed air supply, centralized cooand transport systems. The consumption of energy and resouas well as the generated waste and process emissions shoulddetermined and allocated to the individual production processthis section, energy demand is interpreted as net extraction frthe power supply system. Conservation of energy and poss
reusbut
covebe ounti
2.2.1
and
Aanalcalcand
the
Etota
whephydemthe
covecentrespvari
Ogathengilossappr
2.2.2
Wprogogy
prochas
diffeT
availossdept
studemioutpappra semoraccuenermanquanopmwiththis
the
2.2.2
studintedefifunctoolsubsare
Aonlyprocmaiusingase
J.R. Duflou et al. / CIRP Annals - Manufacturing Technology 61 (2012) 587–609590
e in other unit processes is not taken into consideration here,will be considered as part of the energy and exergy analysisred in Section 3. Collection and documentation of LCI data canbtained in different ways, starting from theoretic calculationsl detailed process measurements and analysis.
. Equations to calculate the (minimum) theoretic process energy
resource consumption
bele et al. [1] describe a method for life cycle inventoryysis of production processes using theoretic equations toulate the energy and resource consumption as well as wasteprocess emissions. Equation 1 shows the general formula fortotal energy demand during production.
l ¼ Eth þ Eadditional þ Eperiphery (1)
re, Eth is the active energy theoretically needed to obtain thesical process effect, and represents the minimum energyand of the production process. Eadditional and Eperiphery stand for
additional energy demands of the machine tool (e.g. energy tor efficiency losses, or energy for machine functions such asral control) and peripherals (e.g. cutting fluid pump)ectively. Abele et al. [1] provide specific equations for a wideety of production processes.vercash et al. [150] developed a generic methodology toer unit process life cycle inventories (UPLCI) using rules ofneering and industrial practice to calculate energy and masses. As described below, this approach is also used as screeningoach within the CO2PE! – Initiative.
. Detailed process measurements and analysis
ithin the framework of the CO2PE! – collaborative researchramme [30], a life cycle assessment (LCA) oriented methodol-for systematic inventory analysis of manufacturing unit
esses (referred to as unit process life cycle inventories, UPLCI)been developed which comprises two approaches withrent levels of detail [111].he screening approach relies on representative, publiclylable data and theoretical calculations for energy use, material, and identification of variables for improvement, while the in-
h approach is subdivided into four modules, including a timey, a power consumption study, a consumables study, and an
ssions study. In this approach all relevant process inputs anduts are measured and analyzed in detail. The screeningoach provides the first insight in the unit process and results in
t of approximate LCI-data [150]. These data serve to guide thee detailed and complete in-depth approach leading to morerate LCI-data as well as the identification of the potential forgy and resource efficiency improvements of the involvedufacturing unit process. As far as the energy consumptiontification effort is concerned, the methodology under devel-ent as part of the ISO TC39WG12 efforts [98] corresponds well
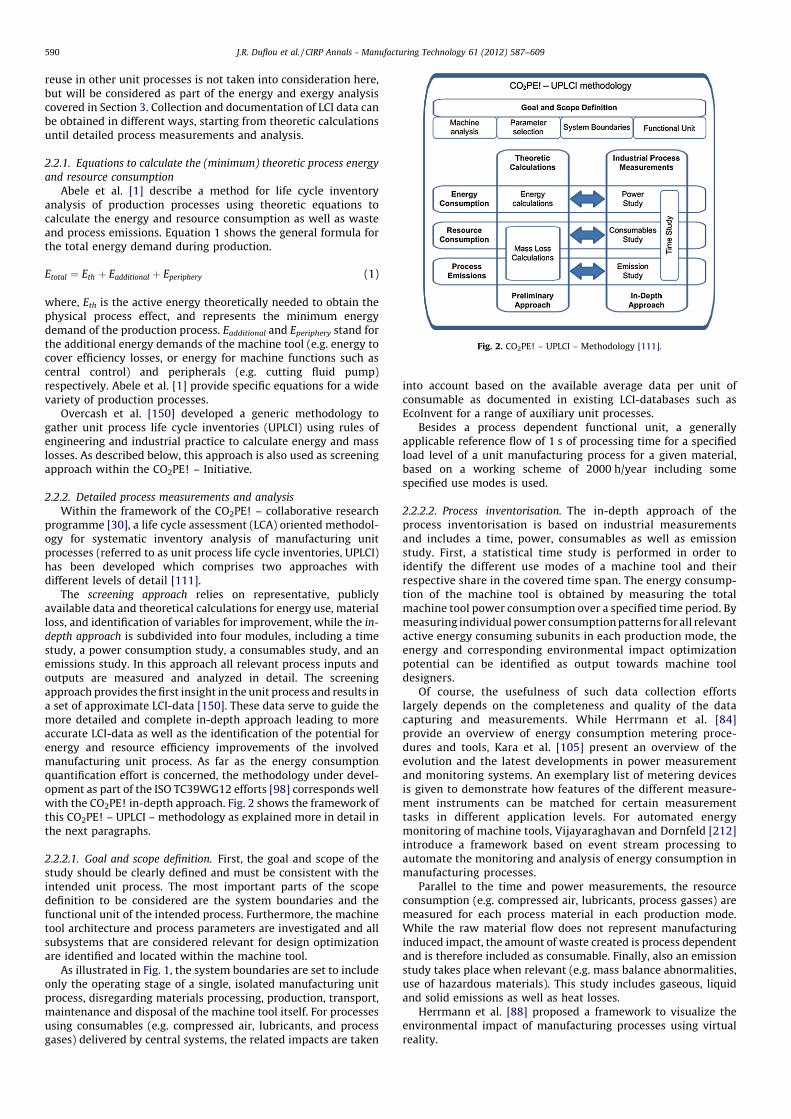
the CO2PE! in-depth approach. Fig. 2 shows the framework ofCO2PE! – UPLCI – methodology as explained more in detail innext paragraphs.
.1. Goal and scope definition. First, the goal and scope of they should be clearly defined and must be consistent with thended unit process. The most important parts of the scope
into account based on the available average data per unit ofconsumable as documented in existing LCI-databases such asEcoInvent for a range of auxiliary unit processes.
Besides a process dependent functional unit, a generallyapplicable reference flow of 1 s of processing time for a specifiedload level of a unit manufacturing process for a given material,based on a working scheme of 2000 h/year including somespecified use modes is used.
2.2.2.2. Process inventorisation. The in-depth approach of theprocess inventorisation is based on industrial measurementsand includes a time, power, consumables as well as emissionstudy. First, a statistical time study is performed in order toidentify the different use modes of a machine tool and theirrespective share in the covered time span. The energy consump-tion of the machine tool is obtained by measuring the totalmachine tool power consumption over a specified time period. Bymeasuring individual power consumption patterns for all relevantactive energy consuming subunits in each production mode, theenergy and corresponding environmental impact optimizationpotential can be identified as output towards machine tooldesigners.
Of course, the usefulness of such data collection effortslargely depends on the completeness and quality of the datacapturing and measurements. While Herrmann et al. [84]provide an overview of energy consumption metering proce-dures and tools, Kara et al. [105] present an overview of theevolution and the latest developments in power measurementand monitoring systems. An exemplary list of metering devicesis given to demonstrate how features of the different measure-ment instruments can be matched for certain measurementtasks in different application levels. For automated energymonitoring of machine tools, Vijayaraghavan and Dornfeld [212]introduce a framework based on event stream processing toautomate the monitoring and analysis of energy consumption inmanufacturing processes.
Parallel to the time and power measurements, the resource
Fig. 2. CO2PE! – UPLCI – Methodology [111].
nition to be considered are the system boundaries and thetional unit of the intended process. Furthermore, the machine
architecture and process parameters are investigated and allystems that are considered relevant for design optimization
identified and located within the machine tool.s illustrated in Fig. 1, the system boundaries are set to include
the operating stage of a single, isolated manufacturing unitess, disregarding materials processing, production, transport,
ntenance and disposal of the machine tool itself. For processesg consumables (e.g. compressed air, lubricants, and processs) delivered by central systems, the related impacts are taken
consumption (e.g. compressed air, lubricants, process gasses) aremeasured for each process material in each production mode.While the raw material flow does not represent manufacturinginduced impact, the amount of waste created is process dependentand is therefore included as consumable. Finally, also an emissionstudy takes place when relevant (e.g. mass balance abnormalities,use of hazardous materials). This study includes gaseous, liquidand solid emissions as well as heat losses.
Herrmann et al. [88] proposed a framework to visualize theenvironmental impact of manufacturing processes using virtualreality.

ith. Tosed,oldrityTherialich
tingract
canlion. Iningl totedalaon-es.
era-intoring
teds to
D)on-en-test
diesed
97]andtool
thet.
aser
J.R. Duflou et al. / CIRP Annals - Manufacturing Technology 61 (2012) 587–609 591
2.3. Data collection efforts: case studies
Various energy and resource consumption data collectionefforts are described in literature using one of the above mentionedapproaches. An overview of available case studies using the CO2PE!– Screening approach can be found on the UPLCI-website [202].This section provides a selection of case studies organizedaccording to the DIN 8580 taxonomy [46,63], which distinguishessix main categories of discrete part manufacturing processes:Primary shaping, Forming, Separating, Joining, Coating/Finishingand Processes which change the material properties. For each ofthe first three categories some case study results, based onindustrial measurements, are presented in the next paragraphs.
2.3.1. Primary shaping processes
Mognol et al. [133] investigated the energy consumption ofthree rapid prototyping systems: Thermojet (3DS), FDM3000(Stratasys) and EOSINT M250 Xtended (EOS). Since the electricalpower consumption of these systems was found to be approxi-mately constant over different operating modes, the authorsconcluded that the manufacturing time is the determining factorfor the total energy consumption.
More detailed studies, covering all aspects of impact generatingenergy and material flows, allow to provide a more refinedanalysis. A case study about the environmental impact of SelectiveLaser Melting (SLM) and Selective Laser Sintering (SLS) processeshas been conducted at the KU Leuven [110]. In-depth time studieswere performed on three different EOSINT P760 SLS machine tools.The non-productive modes comprise machine tool cleaning,preheating and cooling down. The productive modes are respon-sible for approximately 87% of the total production time, and canbe subdivided further into three main modes: the laser exposuremode, the recoating mode and observed other activities like fillingthe feed containers. Based on 63 batches (5801 products), Fig. 3presents the time distribution for products made of PA2200 with alayer thickness of 120 mm.
Fig. 4 shows the different power levels during the productivemode of an EOSINT P760 machine tool. Besides the laser cooler, theprocess heating units are the largest energy consumers.
Besides energy, SLS processes also need a process gas (typicallyN2) to create an inert working atmosphere. Since this atmosphereis created by an internal, compressed air driven N2-generator, thecompressed air consumption of 20 m3/h should be taken intoaccount. Furthermore, based on industrial observations, only halfof the residual powder is recyclable, which represents a wastematerial rate of approximately 45% of the input powder.
For a sample batch with a total product volume of 3.3 kg andproduction time of 15 h, the major contributor to the totalenvironmental impact was found to be the waste of raw material(see Table 1). Major opportunities to reduce the environmentalimpact of the SLS process for polymers seem to be to identifymeasures that result in a higher material utilization efficiency and/or methods to regenerate the residual powders for reuse.
The majority of discrete part casting operations occurs throughsand casting (60%) [203]. The sand casting process involvespouring of molten metal into a mold composed primarily of sandand binders. The binders used are primarily chemical (thermal
setting or catalytic reactions) and clay (green sand casting), wgreen sand molds used in about 90% of part production [205]form internal voids in the parts, chemically-bound cores are uwhich are stronger than green sand. Unlike permanent mcasting, sand molds are destroyed after each use, with the majoof the sand usually recycled into new molds and cores.
environmental concerns of sand casting include virgin mateconsumption, solid wastes, and hazardous air emissions, whhave been addressed over the past several decades. Sand casutilizes large amounts of sand; many foundries in the U.S. extsand from the sand dunes of the Great Lakes [220]. While sandbe reused, it breaks down over time. In the U.S. about ten miltons of waste foundry sand are generated annually [206]addition, the various types of green sand and chemical bindsystems form a variety of air emissions, which can be harmfuworkers [12,33,138]. Dalquist and Gutowski [37,38] investigasand casting and die casting using life cycle assessment. Haapet al. [71,72] have established a model to compare the envirmental performance of sand casting process design alternativ
In these case studies the contribution manufacturing options can make to impact avoidance has not been taken
account when compared to more conventional manufactuprocesses.
For additive processes an example of such an effect is illustraby Morrow et al. [137]. The authors present three case studiereveal the extent to which Direct Metal Deposition (DMmanufacturing of molds and dies can achieve reduced envirmental emissions and energy consumption relative to convtional manufacturing procedures. It is shown that DMD’s greaopportunity to reduce the environmental impact of tool andmanufacturing comes from its ability to enable laser-baremanufacturing.
For injection molding processes, Thiriez and Gutowski [1obtained specific energy consumption values of 3.39, 1.67
1.46 MJ/kg for hydraulic, hybrid and all-electric machine
variants, respectively. For hydraulic and hybrid machine tools,specific energy demand decreases with increasing throughpu
2.3.2. Forming processes
Fig. 4. Power levels during the productive modes of an EOSINT P700 Selective L
Sintering machine tool [110].
airy is
the
Fig. 3. Time distribution for SLS production modes (PA2200, layer thickness of
120 mm) [110].
Several authors investigated the energy consumption ofbending [39,52,108,172] and observed that the standby energsubstantial. On the one hand, due to diverse operator activities,
Table 1Environmental parameters of sample batch for SLS processing [110].
Impact (mPts) %
Energy 120 kWh 3120 31.9
Compressed air 340 m3 1598 16.3
Waste material 10.3 kg 5068 51.8

timein Fmodtion80 afor s
Iefficcoveup t
2.3.3
Dconsis letypitota
� Fix
en� Op
co� To
wo� Un
fri
Acons
Fig. 5
J.R. Duflou et al. / CIRP Annals - Manufacturing Technology 61 (2012) 587–609592
share of the standby mode (mode 1) is very high as indicatedig. 5. On the other hand, the power levels during the standbye are significant, ranging from 1.4 kW to 5 kW for conven-al hydraulic press brakes with a maximum capacity betweennd 170 ton. Similar conclusions were drawn by Shi et al. [179]tamping processes.
ngarao et al. [95] outlined the state of the art from a resourceiency point of view for sheet metal forming technologies,ring the total life cycle starting from raw materials productiono recycling technologies.
. Separating processes
ahmus and Gutowski [36] showed that the cutting energyumed by a modern automatic machine tool during machiningss than 15% of the total energy demand. Fig. 6 illustrates acal power profile of a turning process [121], which divides thel machine tool power in four power levels:
ed power: power demand of all activated machine componentssuring the operational readiness of the machine.erational power: power demand to distinctively operatemponents enabling the cutting as performed in air-cuts.ol tip power: power demand at tool tip to remove therkpiece material.productive power: power converted to heat mainly due toction during the material removal.
An empirical model to characterize the relationship betweenenergy consumption and process variables for chip formingmaterial removal processes was presented by Kara and Li [106]and Diaz et al. [43]. Eq. (2) shows the developed model predictingthe energy consumption of turning and milling processes withdeviations of less than 10% on the measured values, whichindicates that one generic model could be adopted to describe thespecific energy consumption under various cutting conditions.
SEC ¼ C0 þ C1
MRR(2)
where, SEC is the specific energy consumption [kJ/cm3], MRR is thematerial removal rate [cm3/s] and C0, C1 are machine tool specificcoefficients.
The environmental impact of CO2 laser cutting was analyzed byDuflou et al. [51] and Oliveira et al. [149]. In addition to energy, theassist gases consumed in the process (e.g. nitrogen and oxygen)and waste generated were also found to significantly contribute tothe total environmental impact of the use stage of a laser cuttingmachine tool. The laser source and chiller are responsible for morethan 80% of the total consumed energy.
Dhanik et al. [40] as well as Kellens et al. [109] investigated theenvironmental impact of the use stage of Electrical DischargeMachining (EDM) processes. Of all subunits, the different dielectricpumps proved to be the dominant energy consumers.
Fig. 8 summarizes the distribution of a range of different impactcreating factors for 1 h of EDM roughing with a copper electrode,on a hard metal workpiece. The environmental impact is mainlycaused by the consumed electrical energy (40.5%) and thedielectric fluid (43.4%).
2.4. Energy demand and resource consumption reducing strategies
Different strategies can be considered while aiming for thereduction of environmental impact at a unit process level. Machinetool manufacturers can work on the process efficiency byoptimizing the machine tool design, while process planners canwork on process parameters optimization, on machine toolselection or can consider process substitution.
2.4.1. Effects of optimized machine tool design
2.4.1.1. More efficient machine tool components. An obvious way toimprove the environmental performance of machine tools is thedevelopment and adapting of more energy efficient components.Among many others, the Self-regulatory Initiative (SRI) of CECIMO
. Time distribution for the production modes of the air bending process [52].
Fig. 6. Power profile of a turning process [121].
Fig. 8. Distribution of the environmental impact during 1 h of EDM roughing [109].
s shown in Fig. 7, an average breakdown of the fixed energyumption of machining processes is given by Li et al. [121].
Fig. 7. Average fixed energy breakdown adapted from [121].
[23] as well as the ISO standardization effort on the environmentalevaluation of machine tools [98], list potential measures towardsmore energy and resource efficient machine tool components.Examples can be found in more efficient drives, pumps, andspindles. Another example can be found in switching from active topassive workpiece clamping, offering significant reductions of thetime span in which active power is required for a wide range ofprocesses [98].
Abele et al. [2] explored the potential of an energy optimizedspindle unit with an adapted electric drive train. An axiomaticapproach to identify structural improvement potential with

el).ulicith
dbytorstion
werd isg arallers,trolf a
mal
essed
36]endting
thenotificrial
beg astheg a0%.ge-
tialsed
lan-
ess
erial
J.R. Duflou et al. / CIRP Annals - Manufacturing Technology 61 (2012) 587–609 593
guidance for the optimal implementation sequence of measureswas proposed by Zein et al. [226].
2.4.1.2. Technological changes. Instead of the gradual improvementof current machine tool technologies and devices, a shift toalternative, innovative technologies can yield significant environ-mental gains. For example, adopting new laser source technolo-gies, such as new generations of fiber and diode lasers, to replaceconventional CO2-lasers, holds the promise of an increase fromaround 12% for CO2-lasers to approximately 30% in laser sourceefficiency, while simultaneously resulting in lower output powerrequirement levels for most materials due to more favorableabsorption in the near infrared wavelength range for mostcommonly processed materials [52].
2.4.1.3. Waste recovery within a machine tool. Another way toimprove the energy and resource efficiency of manufacturingprocesses is the recovery of waste streams and heat losses within amachine tool. A recent patent [213] describes a system forrecovering heat losses of a laser cooler system using a Sterlingengine that drives a compressed air generator. A filter systemseparates nitrogen and/or oxygen from the compressed air that canbe used as assist gas within the machine tool itself.
Another example related to material resource efficiency can befound in the commonly applied recycling and remelting of runnersby casting processes.
A practical method to separate and collect un-sintered powdermaterials for polymer laser sintering processes has been developedby Dotchev and Yussof [49]. In order to control the input materialquality and use the fresh powder more efficiently, the authorssuggest using different grades according to the melt flow rate of therecycled powder.
In terms of energy recovery the kinetic energy recovery system(KERS) is a possible method of improving energy efficiency.Investigations by Diaz et al. [41] show reductions of the averageenergy consumption of high-speed cutting processes up to 25%depending on workpiece geometry and machining time.
2.4.1.4. Integrated or central peripherals. Consumables such ascompressed air and process gases can be produced within themachine tool itself or delivered from central support systems,causing different environmental impacts depending on the chosensolution. The same consideration applies for local or centralizedsupply of cooling and lubrication facilities. A comprehensiveliterature review about compressed air energy use, savings andpayback period of energy efficient strategies was compiled bySaidur et al. [170]. An overview of different derived energy savingopportunities at the machine level is shown in Fig. 9. Acomprehensive overview of compressed air systems designconsiderations is provided in Section 4.3.
2.4.2. Effects of optimized process control
2.4.2.1. Selective actuation of non-continuously required devices. Aneasy and highly effective way to reduce the electrical energyconsumption can be found in selectively shutting down devices ofwhich the functionality is not required in specific operational
modes (e.g. switching to a less energy consuming stand-by levSwitching from conventional, continuously active hydrasystems for air bending towards servomotor driven pumps wdirect control of hydraulic pistons, allows the required stanenergy to be reduced significantly (up to 65%) as the servomoonly need to be activated during the actual bending opera[39,108,172].
2.4.2.2. Reducing idle production times. Besides the required polevel of machine tools, the second parameter in energy demantime. Therefore reducing the unproductive idle time durinmanufacturing operation contributes to an increase in oveenergy efficiency. Using functional states for common suppliSchmitt et al. [176] proposed a self-optimization model to conthe energy consumption depending on the usage profile omachine tool, automatically switching to the most optiproduction mode.
2.4.2.3. Optimized process parameters. The selection of procparameters can have a significant influence on the consumenergy and resources. Diaz et al. [41,43] as well as Mori et al. [1illustrated that the energy consumption for drilling and face/milling can be reduced by setting the cutting conditions (cutspeed, feed rate and cutting depth) high, thereby shorteningmachining time, yet within a value range which does
compromise tool life and surface finish. Fig. 10 shows the specenergy demand for milling processes as function of the materemoval rate (MRR).
For deep hole machining, the power consumption canreduced with an adaptive pecking cycle, which executes peckinneeded by sensing cutting load. Finally, synchronization of
spindle acceleration/deceleration with the feed system durinrapid traverse stage can reduce the energy consumption up to 1Similar results were presented for drilling processes by Neubauer et al. [140].
Furthermore, Neugebauer et al. [142] defined preferenworking spaces with limited power consumption for robot baassembly systems.
2.4.2.4. Energy and resource efficient process modeling and p
ning. Various models for energy and resource efficient proc
Fig. 10. Specific energy demand for milling processes as function of the mat
removal rate (MRR) [43].
inudeingate,delst ora ofenters,d in
Fig. 9. Relative importance of different energy saving measures for compressed air
systems.
Adapted from [170].
modeling, planning and scheduling have been presentedliterature. Sheng et al. [178] were among the first to also inclenvironmental factors in their multi-objective process plannmodels in addition to traditional criteria such as production rquality and costs. Over the last decade, several variants of mohave been proposed, all defining the most energy efficienecological process or process chain, using the available datdifferent manufacturing unit processes and auxiliary equipm(e.g. robots and compressed air systems). Among many othexamples at unit process as well as system level can be foun[8,44,57,86,141,144,218].

2.4.3
2.4.3
isoncoulexamcycllow
but
techevalbackthe msolulatte
Passisviabimpto fl
Bproptrad
Klubrparaup t
2.4.3
procloadcontselecoulFig.
optiheremax
2.4.3
conscomimpgateLubr
[7,2I
for
119menform
Cemiasse
Fig. 17 diff
laser
J.R. Duflou et al. / CIRP Annals - Manufacturing Technology 61 (2012) 587–609594
. Effects of process/machine tool selection
.1. Process selection. Energy and resource efficiency compar- and deduced selection of alternative manufacturing processesd help to reduce the total environmental product impact. For
ple, Pecas et al. [152] developed a model to compare the lifee performance of mold manufacturing techniques suitable forproduction volumes. The model includes three independent
essential and complementary performance criteria: economic,nical, and environmental. Two candidate technologies wereuated: one involving a mold made of a spray metal shellfilled with resin and aluminum powder and another based on
achining of aluminum. While the former mold offers the besttion in terms of economic and environmental aspects, ther has a better technical performance.usavec et al. [156,157] present cryogenic and high pressure jetted machining (HPJAM), using liquid nitrogen as a coolant, asle machining technologies offering a cost-effective route torove economic and environmental performance in comparisonood cooling in conventional machining.rockhoff and Brinksmeier [20] as well as Reinhardt et al. [166]osed grind-hardening as a resource efficient alternative to the
itional hardening processes using induction.locke et al. [112] concluded that the directed supply oficoolant, with supply pressure as the dominant processmeter; could lead to significant reduction of tool temperatureo 30% compared to conventional flood cooling.
.2. Optimal machine tool capacity. For most manufacturingesses the fixed power level, which corresponds to a non-ed machine tool in stand-by mode, has a significantribution to the total power consumption. Therefore, a properction of the right equipment (and related maximum capacity)d reduce the energy consumption. An example can be found in11 which shows potential energy savings up to 50% by
mizing the selection of a laser cutting machine tool [52]. Target should be to use machine tools as near as possible to theirimum capacity.
.3. Optimal resource consumption. In addition to energyumption, the consumption of resources, such as lubricants,pressed air, and process gasses also causes environmentalact. In the domain of lubricants, several researchers investi-d strategies such as Dry Machining and Minimum Quantity
ication, aiming to avoid or limit resource consumption (e.g.16]).n parallel, environmentally benign fluids have been developedoperations which still require lubricants (e.g. [5,81,85,
,148,221]). A comprehensive overview of important develop-ts of new, environmentally benign lubricants for metaling processes was published by Bay et al. [13].larens et al. [27] provided a quantitative assessment of
ssions and energy consumption as well as a semi quantitativessment of health impacts associated with environmentally
adapted metalworking fluid systems. A comparative life cycleassessment of water and gas-based systems shows that delivery oflubricants in air rather than water can reduce solid waste by 60%,water use by 90% and aquatic toxicity by 80%, while virtuallyeliminating occupational health concerns.
3. Multi-machine level
A production system is a combination of different productionprocesses and typically is composed of diverse machines forprocessing or transportation as well as personnel. All theseproduction factors are being planned and controlled by a productionmanagement system. All involved technical equipment, with certainenergy and media consumption profiles, result in cumulative loadcurves for such measures as power or compressed air for the wholeprocess chain or the plant respectively.
3.1. Multi-machine ‘ecosystems’
A multi-machine ‘ecosystem’ describes a network of machineswithin a factory. The connection of these machines can be in aparallel organization, like in a job shop production, or in a sequenceorganization, like a process chain. Due to the structure of thenetwork, the output of one process may be the input for another.The qualitative condition of the output is not relevant. Thus, by-products, scrap, energetic emissions (waste heat, waste air,mechanical energy, etc.) or waste material, which arise in theproduction of products in one process, are inputs on the multi-machine level (Fig. 12). In this context the energetic or physicalflows can be classically recycled within the process chain, but alsobe reused in another process chain nearby. At the end of thesemultiple use stages, the further non-useable energetic or physicaloutput leaves the system boundary.
In the following, methods and tools are presented to captureand track energy and material flows in a multi-machine ecosystem.Furthermore, examples are presented of implementation possibi-lities in such ecosystems.
3.1.1. Energy flow and machine ecosystems
The multi-machine ecosystem can be described as an energycascade system with the purpose of completely utilizing energyflows (Fig. 13) [67,77,182]. A cascade example is the thermaldown-flow of heat. The thermal energy flows from a highertemperature level to the ambient temperature. During thisdownfall, the heat can be utilized in multiple processes [4].Thereby the quality of the energy flow decreases gradually withincreasing duration of utilization.
3.1.1.1. Modeling methodologies of energy flows in an ecosystem. Thefoundation for description, acquisition and analysis of all energeticflows into and out of a multi-machine ecosystem are the energy,
1. Power consumption in cutting mode in function of the laser output level for
erent laser cutting machines (3 configurations combined with different CO2
sources with indication of the maximum achievable output level) [52]. Fig. 12. Multi-machine ecosystem.

s ativeess,ntlythergyrce
. Int is
inglti-l todel
asteum
tuall oftc.)n of
theses34]
theess
thatntaltemgut31],71].y ofve-mstheow
e ofeat
flue be
thed iny of
thethislf is thethatiredere
and14].ereia a
ient
the
J.R. Duflou et al. / CIRP Annals - Manufacturing Technology 61 (2012) 587–609 595
exergy and entropy concepts. These three concepts are defined bythe first and second law of thermodynamics. The first law describesthat energy cannot be destroyed or created, it is conserved, and itcan just change form. The energy only serves as a carrier of quality,and it is the quality that is consumed during the conversion ofenergy [214]. The second law describes that energy has quality andquantity. Quality and quantity of energy or ‘work potential’ can bedescribed by the properties exergy and entropy [10,15,78,214].
The energy flows into and out of a system along paths of massflow, heat transfer and work [15]. The exergy is that part of energythat is convertible into all other forms of energy; it represents the‘useful’ energy respectively the technical working capacity of thestreams that flow to the system [15,214]. In contrast to energy,exergy can be destroyed. The amount of destroyed exergy isproportional to the generated entropy. In order to analyze amachine, an energy analysis, based on an energy balance accordingto the first law, can be carried out. The disadvantage is that indiscrete manufacturing, the energy analysis often only measuresone resource: electrical energy and other process connectedresources are not taken into consideration. Furthermore, noinformation on the system energy degradation is available. Toovercome these disadvantages, an exergy based method can beused to analyze a technical system.
The exergy method allows the complete measure of in- andoutgoing system streams and the derivation of information aboutenergy inflation in the system [15,78]. Thus, a minimization of allexergy losses leads to a minimum energy consumption of theprocess [162]. Furthermore, it can be derived that the exergy is theproperty that has an economic value [134]. The concept allows theidentification of energetic discharges. Beside the reduction of theseenergetic discharges, the concept can identify potentials for energybased machine ecosystems.
The exergy analysis allows the rational comparison of differentenergy forms and different process structures to identify optimalprocess parameters. In order to fulfill this task, the exergy analysiscalculates exergy losses on the basis of entropy functions of allprocess streams. The height of the exergy losses depends on thedifference of the current system state to the state of theenvironment, the so-called ‘dead state’. In the dead state athermodynamic equilibrium of the considered system with itsenvironment exists. Furthermore, there is no possibility of aspontaneous change within the system or the environment, norcan there be an interaction between them resulting in work [134].When using the exergy analysis to improve process structures, thecomponents of the process system have to be analyzed and thewhole system has to be compared with various different processalternatives [162]. Thus, the exergy analysis allows to determine
considered manufacturing processes are laser cutting asubtractive process, the Selective Laser Sintering as an addiprocess and bending as mass-conserving process. For each procthe input and output variables are determined and subsequeform the basis for the exergy analysis. The conclusion of
examination is that system analyses on the basis of exeefficiencies are able to appropriately present the resouefficiency of the involved manufacturing processes.
3.1.1.2. Example of energy flows in a multi-machine ecosystem
the following, examples are presented where the exergy concepused to analyze and describe a technical system.
Creyts et al. [34] use the exergy analysis of a metal machinprocess to understand and to present the energy flows in a mumachine ecosystem. The used model consists of a process modedetermine the waste stream characteristics and an exergy mothat performs the extended exergy analysis on the resulting wstreams. The examined process is the machining of an aluminworkpiece with a water–oil emulsion. In addition to the acmachining process, particularly the treatment and disposawaste streams (such as metal working fluid, cutting swarf, ewere exergetically examined. After the modeling and calculatiothe existing process, the influence of the input parameters onexergy was examined by a sensitivity analysis. Besides the analyof the influence of changed process parameters, Creyts et al. [perform an exergetical comparison of the used technologies fortreatment and disposal of waste streams with alternative procconfigurations and technologies. Both examinations showed
the exergy analysis is a suitable tool to integrate environmecriteria into the planning stages of industrial process sysdesign. Further examples are given, amongst others, by Szaret al. [191,192], Brodyansky et al. [21], Kotas [114], Meyer [1Dincer et al. [47], Gutowski et al. [69] and Saiganesh et al. [1
While an energy analysis can be used to quantify the efficiencstandalone machine tools (Section 2), opportunities for improment at the level of energy reuse are often requiring a systeapproach involving multiple unit processes. In most cases,
industrial waste heat is considered as source for energy flcascades. An example of cascading energy utilization is the usindustrial waste heat of a melting furnace as an input flow for a htreatment process. This is the case for example for the use of hot
gases of one process to preheat metal bolts, which have toprocessed, in a different process. Therefore, the flue gases flow incounter direction of the material flow. Thus the energy containethe flue gas is reused [14,154]. Another option is the heat recoverhot off gases in steel foundries. Due to constructive measure atfurnaces, a twin shell system can be built for heat recovery. In
system, iron melts in one half of the furnace while the other habeing loaded. The hot off gases from the melting side are piped toother side to pre-heat the charge. Precondition in this context is
the temperature level of waste heat is higher than the requprocess temperature of the heat utilization. Furthermore, thshould be a temporal concurrence between heat supply and demand the heat source and sink should be located at close distance [Beside the multi-machine utilization of industrial waste heat, this a possibility to supply the corporate internal heating network vheat exchanger with thermal energy in cases where ambtemperature requires conditioning of the work environment.
Another example of a multi-machine ecosystem is
Fig. 13. Energy cascade system [182].
g amiclownic
d ofuretterted
gasessr to
the location, type and magnitude of the dissipation of energy[3,15,21,191].
The advantage of the exergy analysis is that it can help to locateenergetic discharges in a system, which either are not identified ormisevaluated by the energy analysis. Moreover, these dischargescan be analyzed by calculating the exergy destruction rates underchanged process parameters and afterwards comparing it withrates of the original process [134].
Renaldi et al. [167] presents a comparison of different exergyefficiency definitions for the comparison of three differentmanufacturing processes on the basis of an exergy analysis. The
generation of electricity from industrial waste heat by usinRankine cycle (RC) [6,186]. The Rankine cycle is a thermodynacycle with the greatest efficiency for the conversion of
temperature heat into electricity. A modified version is the orgarankine cycle (ORC). In this case an organic fluid is used insteawater as the working fluid. Especially for low temperatapplications the ORC has more benefits than the RC due to bespecific properties of the organic fluids. Larjola [117] demonstrathat the ORC-process can use the exhaust air of a process (e.g.turbine, blast furnace, etc.) as input. The output of an ORC-procis electric power, produced from the given heat source. In orde
deteanal
Tcons[16]are aeffecdiffito adevimerapplamoabunin thstudin acan
the lZT v
Aheatexamin tweasizinener
3.1.2
SmacThe
AenviprovmacWithprocenermon[11,betwthe
withconcanal
3.1.2
the
macamoSuth
Lmulpartprodgenewasflowthe
the
Apresthe rhot
AA-6proptionprofiredu
J.R. Duflou et al. / CIRP Annals - Manufacturing Technology 61 (2012) 587–609596
rmine the electrical output of the ORC-process, the exergyysis can be used to calculate the cycle process.he utilization of a thermoelectric generator (TEG) can beidered as another possibility in recovering industrial waste heat. The TEG is based on solid-state thermoelectric materials whichble to directly convert heat into electricity due to the Seebeckt. It is a potentially preferable approach especially if there are
culties in effectively transporting the waste heat from the source separate energy conversion system [58]. The efficiency of TEGces can be expressed by means of the dimensionless figure ofit ZT. At present, the implementation of TEG is still limited iniances where the durability and maintenance-free operation areng the most important criteria [16]. Applications in moredant products, such as vehicle exhaust systems, are foreseeablee near future along with an increase in TEG performance. Ay by the U.S. Department of Energy concluded that applications
luminum smelting, glass manufacture and cement productionbe practical at a ZT value of two [80]. As an illustration, in one ofatest research outputs in TEG, researchers managed to achieve aalue of 1.8 at 850 K [155].nother case of recovering energy is usage of industrial waste
for preheating necessary media in other processes. Asple, [196] assesses the effect of reusing heat that is occurring
he context of large scale compressed air generation for aving mill. It is used to preheat steam, which is needed for theg process just before the weaving, resulting in significantgy savings of over 20%.
. Material flow and machine ecosystems
imilar to the energy flows, the material flows in a multi-hine ecosystem can be utilized to increase material efficiency.material based output of one process is the input for another.
possibility to describe the material flows in a multi-machineronment is the use of the input–output analysis. This conceptides the foundation to identify potentials of material basedhine ecosystems and is described in more detail in Section 6.2.
regard to the identification of input–output flows on the unitess level, a description and detection tool is the material/gy input–output analysis concept. In this analysis theetary units are substituted by material and/or energy units
118]. The concept is commonly used to analyze the flowseen different industrial sectors of an economy. In this context
method records material and/or energy flows among the unitsin the company or the supply chain [31,73,145,187]. Thus, thisept offers a starting position for the material flow-basedysis of a multi-machine ecosystem.
.1. Example of resource flows in a multi-machine ecosystem. Infollowing, two examples of a material flow-based multi-hine ecosystem are presented. Further examples are given,ng other, by Munoz and Sheng [139], Konijn et al. [113],erland and Gunter [189] and Xue et al. [223].ogozar et al. [126] present a first step into the direction of ati-machine ecosystem in the aluminum production process. As
of the melting process and the following processing steps touce aluminum tubes, rods and bars, aluminum scrap israted. To increase the resource and energy efficiency the scrap
collected within the different units and reinstated as an input in the melting process. The advantage of this approach is that
Gomes et al. [65] investigated the use of compartmentalizedmetalworking fluids for treatment and cleaning of foundry sand. Inthis case, fluid emulsion (water and mineral oil) that was ready tobe disposed was instead divided through a separation process intothe respective components of water and mineral oil. The treatedwater was used within the company as a substitute for tap water.The treated water has, compared to the tap water, higher values interms of hardness, alkalinity, nitrates, etc., but was however stillsuitable for use as cleaning fluid of foundry sand. But Gomes et al.[65] also point out that the implementation of this cascadeutilization is limited. On the one hand due to limited availability oftreated water, and on the other hand due to the limited economicand environmental potential in consequence of the high intensityof energy and resource consumption during the treatment process.
3.2. Process chain design and control
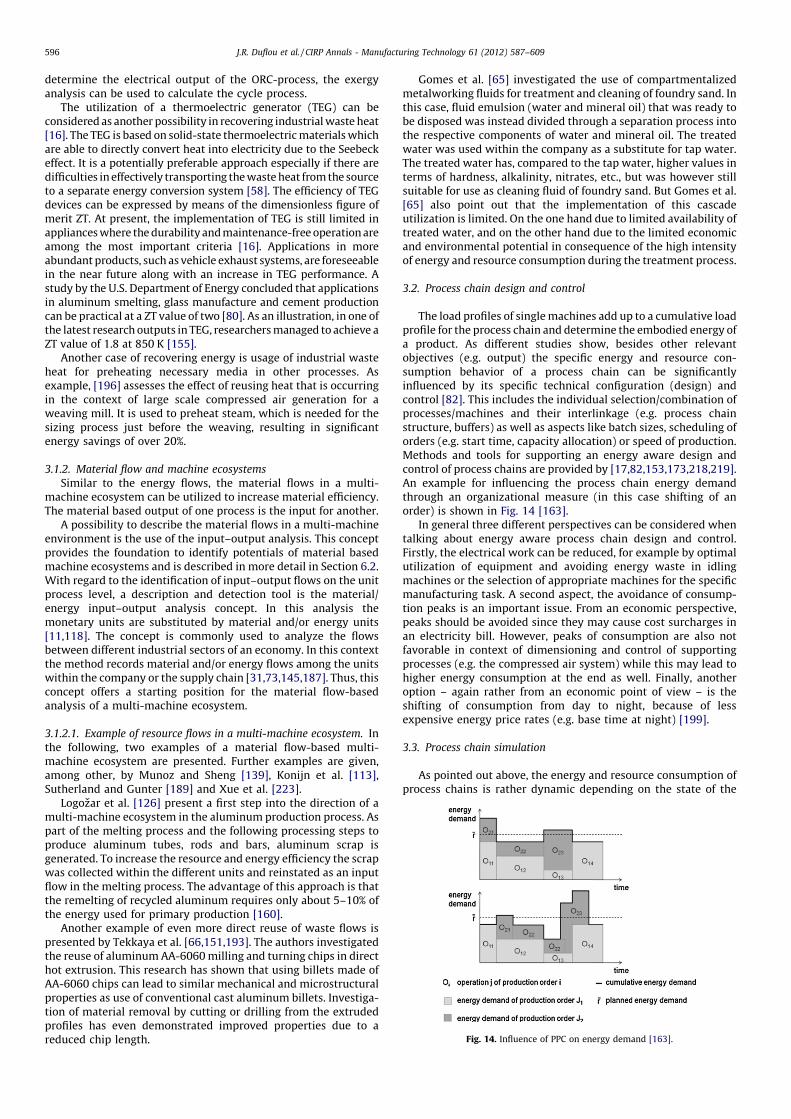
The load profiles of single machines add up to a cumulative loadprofile for the process chain and determine the embodied energy ofa product. As different studies show, besides other relevantobjectives (e.g. output) the specific energy and resource con-sumption behavior of a process chain can be significantlyinfluenced by its specific technical configuration (design) andcontrol [82]. This includes the individual selection/combination ofprocesses/machines and their interlinkage (e.g. process chainstructure, buffers) as well as aspects like batch sizes, scheduling oforders (e.g. start time, capacity allocation) or speed of production.Methods and tools for supporting an energy aware design andcontrol of process chains are provided by [17,82,153,173,218,219].An example for influencing the process chain energy demandthrough an organizational measure (in this case shifting of anorder) is shown in Fig. 14 [163].
In general three different perspectives can be considered whentalking about energy aware process chain design and control.Firstly, the electrical work can be reduced, for example by optimalutilization of equipment and avoiding energy waste in idlingmachines or the selection of appropriate machines for the specificmanufacturing task. A second aspect, the avoidance of consump-tion peaks is an important issue. From an economic perspective,peaks should be avoided since they may cause cost surcharges inan electricity bill. However, peaks of consumption are also notfavorable in context of dimensioning and control of supportingprocesses (e.g. the compressed air system) while this may lead tohigher energy consumption at the end as well. Finally, anotheroption – again rather from an economic point of view – is theshifting of consumption from day to night, because of lessexpensive energy price rates (e.g. base time at night) [199].
3.3. Process chain simulation
As pointed out above, the energy and resource consumption ofprocess chains is rather dynamic depending on the state of the
Fig. 14. Influence of PPC on energy demand [163].
remelting of recycled aluminum requires only about 5–10% ofenergy used for primary production [160].nother example of even more direct reuse of waste flows isented by Tekkaya et al. [66,151,193]. The authors investigatedeuse of aluminum AA-6060 milling and turning chips in direct
extrusion. This research has shown that using billets made of060 chips can lead to similar mechanical and microstructuralerties as use of conventional cast aluminum billets. Investiga-
of material removal by cutting or drilling from the extrudedles has even demonstrated improved properties due to aced chip length.

nu-ingsistdy’
and
byaryedeity)temughBS)
heir
can toess
ringing
offect
as
thisntalvel,
for theific
e ay tothattrol
J.R. Duflou et al. / CIRP Annals - Manufacturing Technology 61 (2012) 587–609 597
machines and their interactions. To cope with those dynamicswhen designing and controlling process chains, simulation is apromising approach [82,86]. Simulation can be used for singleprocess chains and, if incorporating several chains and additionalrelated aspects like technical building services, the factory as awhole (Section 4). Available commercial manufacturing systemsimulation tools do not consider these aspects yet. However, inresearch first approaches can be found (e.g. [45,70,79,90,92,101,102,125,128,161,181,184,213,215,217,222]). They aim at aug-menting material flow oriented discrete event simulation (DES)with environmentally relevant energy and resource flows. Acomprehensive overview and discussion of those approaches canbe found in [196]. In general three different basic paradigms can bedistinguished, as shown in Fig. 15, which differ regarding theembedding of evaluation schemes or the interfaces with othersimulation tools.
This inherent logic also leads to quite specific characteristicswith distinctive advantages or drawbacks of each approach.Simulation approaches pursuing paradigm A offer relatively goodcoverage of manifold energy and resource flows, comprehensiveevaluation schemes with relatively low modeling/simulation andgood transferability. As a drawback, certain energy orienteddynamics and interdependencies cannot be considered in detail.In contrast, paradigm B allows very detailed analysis of differentsubsystems and fields of action, but leads to quite complex modelswhich require knowledge and effort and are hardly transferable.Paradigm C as a ‘one-stop solution’ can basically overcome somedrawbacks of the other paradigms. However, the user is potentiallyrestricted by possible limitations of the utilized simulationenvironment which often do not allow combining the necessarylogic to integrate dynamic energy consumption and the strongdiscrete event and material flow oriented perspective [86].
4. Factory level
Most studies and experience indicate that, to be complete, onemust consider the operation of the factory, at a factory or plant level,as part of the efforts to reduce the impact and increase theeffectiveness of manufacturing. Advances towards the next gen-eration of manufacturing require the development and promotion of‘a holistic understanding of manufacturing’ [93,94]. This requires thecapability of holistic simulation involving technical building servicesand building climate, production machines/material flow, andproduction management, including production planning andscheduling. With this simulation capability, linking energy effi-ciency to the other important parameters in manufacturing iscritical. Synergies should be identified and encouraged, for example
The complexity and sophistication in the organization of mafacturing systems and processes necessitate a keen understandof the organization for accurate environmental analysis. To asin this effort, manufacturing can be broken into ‘levels of stuacross two orthogonal frameworks, spanning organizational
temporal levels.The different levels of manufacturing systems as proposed
[165] were provided in the overview in Section 1.4. The primfocus here is on the third level – the facility. Herrmann and Thi[82] present a holistic view on a production plant (facilconsidering three main partial systems: the production sysitself (with interlinked machines and personnel controlled throproduction management), the technical building services (Tand the building shell. The partial systems together with tdynamic interdependencies are shown in Fig. 16.
An equally compelling orthogonal view of manufacturing
be made based on temporal activities – through the designmanufacturing life cycle. This starts with product or procdesign, and continues through the design of the manufactuprocess, process optimization, and finally post-process finishand abatement. These temporal levels characterize a degreecontrol over the total environmental impact. They also affacility level consumption and impacts. These four levels arefollows [165]:
� Product design: The earliest in design and manufacturing. At
stage there is the most opportunity to influence environmeimpact and decisions throughout all future stages. At this lecritical decisions on part precision, materials, and designassembly/recycling are made. Here there is scope to designproduct as well as its manufacturing process to satisfy specrequirements in all applied criteria.� Process design: The product design is fixed; however her
manufacturing process to suit this design is created. Flexibilitoptimize the system is limited to known tools and processes
work with the specified design. Here there is extensive con
Fig. 15. Paradigms for simulating energy flows in manufacturing systems [86,196].
Fig. 16. Production facility as a complex control system [82].
ed
buteterical
or
ssesntal
has
better buildings, well optimized support facilities, effective main-tenance, diagnostics, improved process quality, better safety andnew service concepts, all the way up to new business models.
4.1. Factory level considerations
4.1.1. Defining levels of production in a facility – spatial and temporal
A key requirement for insuring that analysis and optimizationare actually effectively employed for planning and scheduling is toallow information to flow to where it is needed, e.g. for enterpriselevel and cross-enterprise optimization of energy consumption.
over the performance of the process in all the criteria as allowby the product design.� Process adjustments: The basic manufacturing process is fixed
small changes to the process through process paramselection and optimization are used to control the critfeatures such as precision, burr formation, and energyconsumable demand.� Post-processing: Post-process finishing and abatement proce
are used in controlling the part-precision and the environmeimpact; at this level there is no control over the process as italready been designed.

Fspatand
flexiplan
Ftioninfoeffecqualleveand
Tfactoabilicomstraperf
4.1.2
Tmetaddrmetpoinprodalsothe
be bthe
facilacco
Fleveof pconswatprofienerdocudencenvisimuenerlike
enerdetarela
C(tim
Fig. 1conta
Adap
J.R. Duflou et al. / CIRP Annals - Manufacturing Technology 61 (2012) 587–609598
ig. 17 illustrates the interaction between the temporal andial levels described by Reich-Weiser et al. [165]. Moving upto the right in the figure means a loss of decision-makingbility and, hence, an inability to control outcomes based onning.rom these hierarchies – which span temporal and organiza-al levels – one can get a sense of the complexity involved inrmation capture and transfer in manufacturing systems. Fortive decision-making, one needs to understand both whatity and quantity of information needs to pass between thels and how decisions early on will percolate through the spatialtemporal levels.he view shown in Fig. 17 points out two critical needs: firstly,ry wide planning and scheduling methodologies with the
ty to accommodate complex interactions, and secondly andplementary to this, monitoring and data communicationtegies and methodologies to be able to track the facilityormance over these spatial and temporal axes.
. Production planning and scheduling at the factory level
he literature on factory production planning and schedulinghodologies is rich. More recently, researchers have startedessing the inclusion of energy and other environmental
rics in the methodologies [57,82]. Herrmann and Thiede [82]t out that in addition to the energy consumed directly byuction machinery, there are a number of building services that
account for energy consumption in support of production anddemand for higher productivity (cost, quality, and time) mustalanced with facility management energy optimization sincecost of energy can be high enough to alter the plan for bestity operation. This can be done by use of simulation toolsrding to a stepwise procedure.ig. 18, illustrates the procedure starting from the process chainl of detail, including cycle times and availability. Next, analysisroduction machines with respect to all relevant energy andumables input to or output from the machine (e.g. cooling
er, compressed air, heat) are accounted for. The historic loadle for the facility and reality of pricing for peak and off peakgy consumption (electricity, natural gas, oil, etc.) are to be
propose a general multi-objective mixed integer linear program-ming formulation for optimizing a shop schedule. The methodconsiders both productivity (e.g. make span) and energy (e.g. peakload and carbon footprint) related criteria. This new methodologyconsiders the speed of operation as an independent variable, whichcan be varied to affect the peak load and energy consumption. Thisis most useful in situations in which the production machine toolsoften consume significant amounts of energy even in idle mode(and perhaps little additional energy when processing). So, idletime must be considered in the product flow determination.
Energy and resource utilization along the process chain for anautomotive gear train manufacturing facility were studied bySchlosser et al. [175]. This included both the core processes (suchas machining, heat treating, grinding, deburring, and washing) aswell as the various resources provided to the chain by the facility(such as plant ventilation, water, electricity, and compressed air)and facility wide provision of consumables for such a high volumeproduction operation (e.g. process water, central oil supply,nitrogen and other gases, and propane). The components of thisproduction facility addressed were at the first three levels ofmanufacturing, corresponding to Sections 2–4 in this paper. Thebroader enterprise aspects were not included.
4.2. Energy management: load control and peak load minimization
The previous section described strategies for balancing energy,consumables and production constraints at various levels withinthe factory. To achieve this, the primary concerns are with energymanagement and, as a corollary, monitoring and control of energyconsumption. The ability to actually manage these resources isdependent upon knowing the present state of consumption,historical consumption and the responsiveness of the system tochanges (planned or otherwise).
One of the goals of facility energy management is minimizationof peak load surcharges (cost-management) and the appropriatesizing of infrastructure and the power distribution as well asmeeting constraints of infrastructure and technical building services(e.g. heating, ventilation and air conditioning). This requires data forprocess and system characterization as well as continuous
7. An integrated view of manufacturing design levels and the decisions they
in. Arrows represent the flow of information from one decision to another.
ted from [165]. Fig. 18. Schematic of strategy for increasing energy efficiency in manufacturing
companies spanning process to facility level consumption and impacts [82].
mented. Finally, taking into consideration the interdepen-ies of the machines, building and facility, the best operatingronment and production plan can be determined based onlation. The authors mention that some of the measures forgy efficiency may conflict with manufacturing target criteriathroughput or availability. Further work [195] describes thegy oriented manufacturing system simulation approach inil. More examples of this methodology and a review of other
ted work were presented in [86].hallenged by the potential conflict between process efficiencye based) and factory efficiency (energy based), Fang et al. [57]
monitoring. There are, not surprisingly, different approaches to this.As mentioned in Section 2.2, Kara et al. [105] provide an up to
date overview and background in the developments and chal-lenges in electricity monitoring and metering systems andassociated standards. Focusing on reducing the energy consump-tion of machine tools or other production machinery as a means forsignificantly improving the environmental performance of man-ufacturing systems, Vijayaraghavan and Dornfeld [212] proposed amethodology, based on a communication interface standardMTConnect for manufacturing, for monitoring energy consump-tion patterns in larger systems. It is vital to correlate energy usage

aveure
oryeskelp
theandrialrgy,
theoryign
tiesion,sed
g ofher
tion
ingsrcest of
torying
tingrgyg. Arce
any
on-
ingity.nlyide
n argy
tooreble,
bymaluceg in
d to areow.andtwo
asrgy
J.R. Duflou et al. / CIRP Annals - Manufacturing Technology 61 (2012) 587–609 599
with the operations being performed in the manufacturing system.However, since this can be challenging due to complexity ofmanufacturing systems and the vast number of data sources, eventstream processing techniques were applied to automate themonitoring and analysis of energy consumption in manufacturingsystems. The technique is extensible to all levels described above.
Adding a contextual aspect to the power demands in industry aspart of industrial ‘smart metering’ was also proposed [87]. Energyconsumption for various industrial processes varies dramaticallyand thus the time dynamic nature of process energy, and theenergy of subordinate processes and machinery, must be under-stood. This can come from metering.
The event stream processing identifies trends in consumptionof critical resources. Using trend analysis the consumption ofelectric energy, gas, compressed air, technical heat and water canbe monitored, predicted and used to balance demand if thatcapability is present. For example, if the estimated workload isrising above a set maximum value within a given time period (e.g.15 min), consumers with low priority (e.g. redundant machines orheating treatment furnaces with a high thermal capacity) can beswitched off temporarily to meet the predefined limits.
One must either determine in advance the strategy for energyefficient operation of production systems through a priori optimiza-tion, or, if the architecture is capable thereof, process controls candecide if it is possible to reduce energy via local control and setcomponents to energy-optimal states. Verl et al. [211] describeinformation flows that generate energy control loops at differentlevels based on model information, and propose a matchingcommunication and control infrastructure. These mechanisms andcontrol allow the use of models automatically and coherently on allrequired levels of detail and abstraction. The energy consumptionmodel information is communicated only between the controls of aresource and sub-resources. Each control must understand theinterdependencies with and within its direct neighbors. The systemensures that communication and computational loads are limitedand balanced even for large systems. Fig. 19, from Verl et al. [211],schematically shows the various energy control loops that can be
traffic and material flow as well as location and insulation can ha large impact on the energy consumption for the structcontaining the manufacturing operations.
Commercial software is available for comprehensive factlayout and process and material flow simulation (e.g. AutodFactory Design Suite, Siemens FactoryCAD and FactoryFLOW) hcreate more efficient factory layouts based on digital models offactory. These tools allow engineers to analyze existing
proposed plant and system layouts for more efficient mateflows and scheduling and routing in production systems. Enematerials and other resource flows can also be tracked. Unlikeoptimization tools discussed earlier in this section, these factdesign tools are meant to compliment architectural desfunctions for a complete facility design.
The concept of life cycle management of production faciliwas introduced [74] to address the design, installation, operatadaptation and disposal of production facilities. Topics addresin this research include maintenance, re-use or reconfigurinproduction facilities or removal and reconstruction at anotlocation. As with product life cycles, the life cycle of a producfacility deserves attention.
4.3.1. Energy efficient building technology
The term ‘green factory’ often refers to the factory builddesigned and built to minimize energy use and to recover resou[48]. Industrial buildings often consume and waste a huge amounenergy in terms of electricity and heat. In particular, when a facor a building is designed as a new structure, energy efficient buildtechnologies can easily be implemented. However, in exisbuildings, small and inexpensive changes can lead to large enesavings and improve the energy efficiency of the whole buildinclear example of a factory designed to be energy and resouefficient, with respect to the building use, is the Ford Motor CompRouge Plant [59].
The following impacts are recognized as significantly ctributing to energy conservation.
The facades of a building have a number of functions includthermal and sound insulation as well as protection from humidIn particular, thermal insulation for production facilities is not oimportant from a sustainability point of view, but also to provthermal stability for the processing equipment.
Technically, the fenestration includes every opening ibuilding’s outer shell, e.g. windows, doors and gates. The eneloss in heating or cooling through these openings can add up30%. In the last decade or so, windows have become much msophisticated. Single pane windows have been replaced by doutriple or even quadruple panes. The layers are separatedinsulating materials, as inert gases, to reduce their therconductivity. A low emissivity coating on the glass can redheat loss in the winter and prevent unwanted heat from enterinsummer.
For production facilities, gates or material ports usually tencause the highest energy loss inside the fenestration, since theyoftentimes left open to permit a frequent and rapid material flRapid action doors open and close rapidly for each crossing
therefore prevent energy losses. This effect can be enhanced if
rapid action doors are arranged consecutively as a lock.The inside of a building should be illuminated as much
possible with daylight, since this is the most natural and ene
Fig. 19. Schematic of various energy control loops at the different levels of the
facility [211].
tionore,rgy
ina-mer
of
ysis
rthting
realized according to the proposed decentralized approach.
4.3. Factory design and operation influences
Diaz et al. [42] analyzed the energy consumption and CO2
emissions for each life cycle stage of two milling machine tools indifferent environments. Besides the machine tool energy, HVACand lighting of the working hall were found to be significant,consuming 40–65% of the total use stage energy.
Beyond the manufacturing floor and the production systems,the design of the factory, its physical layout, construction and
efficient type of light. The minimum intensity of illuminacannot always be achieved only through daylight. Therefartificial lighting is often necessary. In order to reduce the eneconsumption, a sensor, which measures the intensity of illumtion, can be installed. A controller in connection with a dimregulates the artificial light such that the overall intensityillumination is permanently above the minimum threshold.
4.3.2. Example of ‘green factory’ technology – compressed air anal
In a factory, compressed air is often regarded as the fouutility, after electricity, natural gas and water, in facilita

prodwidremprodprocpow(aboequiofte
Blarg3–9comexamfacilautoneedbe acomand
prodfromefficconsprodair sand
eneruse
Cfolloair fcomexcland
togeA
detecouloperperfComair
envifor tgeneof uefficcoulyearoffereliageneleadcomwhisystenab
4.4.
Gprac[91]resocustare
nomuncomor
J.R. Duflou et al. / CIRP Annals - Manufacturing Technology 61 (2012) 587–609600
uction activities. In manufacturing plants, compressed air isely used for actuating, cleaning, cooling, drying parts, andoving metal chips. However, the cost of compressed airuction is one of the most expensive and least understoodesses in a manufacturing facility [168]. The cost of electricer used to operate an air compressor continuously for a yearut 8200 h) is usually greater than the initial price of thepment [107]. Per unit of energy delivered, compressed air isn more expensive than the other three utilities.esides the cost issues, compressed air production consumes a
e amount of energy. In absolute terms it is estimated that about% of total energy consumed in the U.S. in 1997 is for airpression in manufacturing [35]. Yuan et al. [225] detail an
ple of compressed air use in automotive manufacturingities. Compressed air is used relatively indiscriminately inmotive manufacturing due to its ease of setup. There is no
for additional maintenance or special machines; the task canccomplished by adding piping. In addition, as a form of energy,pressed air represents no fire or explosion hazard; it is cleansafe and often regarded as totally ‘green’ [32]. In a largeuction facility, plant air is the more typical supply and suffers
a number of limitations, including complexity of system, lowiency (typically less than 60% of the total compressed airumed contributes directly to the goods and services for whichuction was intended [60]; leaks are a major problem in plantupply), energy storage limitations, unstable system pressure,associated high cost. This low efficiency translates into excessgy consumption. The associated carbon footprint for energyin providing compressed air was analyzed in [100].ommon supply patterns for compressed air include thewing, plant air: the whole plant is supplied with compressed
rom the air house, with pipes spread out in the plant to providepressed air to all facilities, point-of-use: each machine isusively supplied by an independently installed air compressor,local generation: a certain number of machines are groupedther and supplied by an air compressor.n investigation of the compressed air supply methodologies tormine which of the three supply options mentioned aboved be the most cost effective considering energy and relatedating costs, including equipment purchase and operation, wasormed for an automotive component production plant [225].pressed air in the facility studied was used to supply operatingto a number of CNC machine tools in the facility. Anronmental analysis and a cost of ownership study were madehe alternative system layouts. The analysis found that a ‘localration’ option would be preferable when compared with pointse and plant air options considering both cost and energyiency. Employment of local generation instead of plant aird potentially save $2000–$3200 dollars and 95,000 kWh each
on the CNC milling machines. Meanwhile, local generationrs numerous advantages over plant air with regard tobility, simplicity, leakage prevention, and flexibility. Localration is supplied by relatively short pipelines, which may
to a significant reduction of losses due to leaks. Extra localpressors may be connected to the CNC machines in parallel,ch automatically builds a great deal of redundancy into theem. Furthermore, the scale of local generation compressorsles greater flexibility as machines and processes change.
focuses on the ‘smoothness’ of production and constructing aprocess with the capability to produce the required results bydesigning out process inconsistency (or ‘muri’). This is to be donewhile trying to maintain as much flexibility as possible sinceexcessive constraints or rigidity often induce waste (as in excessiveset up/change over time or high minimum lot sizes, requiring extrainventory or inducing poor response to customer needs, i.e. poorresponse to ‘pull’.)
As an example of the second type of lean manufacturing, Comau[29] recently introduced a ‘smart assembly’ cell focused on theproduction of high precision complex assemblies as in valve trainsfor auto engines. Citing the large number of individual machinesand process steps used in traditional valve train assembly (some 72parts in one case at a cycle time from 25 to 30 s per machine andseveral minutes per assembly in total along with a large capitalinvestment), Comau’s smart machine replaces the entire line byfour operations and a total cycle time of 54 s. The cell, designed for325,000 cylinder head annually, requires only 223 sq. meters offloor space compared to 753 sq. meters. Mori Seiki announced asimilar system as well for a smart machining cell [135].
Although the Comau cell design was likely not motivated bygreen manufacturing concerns, the cell will have an impact onenergy consumption by nature of the reduced number of stand-alone processes and, importantly, the tremendous reduction infloor space. And, since idle time is a big energy consumptionconcern in standalone machine tools, the higher utilization willreduce idle time.
One of the main tools for the first type of ‘lean’ is the ValueStream Map (VSM) – charting exactly the material and informationflow in the system. Rother and Shook [169] define a value stream as‘all the actions (both value added and non-value added) currentlyrequired to bring a product through the main flows essential toevery product: (1) the production flow from raw material into thearms of the customer, and (2) the design flow from concept tolaunch.’ This can be a basis for introducing green manufacturingconcepts to the enterprise. It starts with a very careful (and oftentedious) assessment of the present state of the production system.This means outlining the processes and flow with the keyinterconnections and relationships, and collecting process datafor each process. Examples of the process data include: cycle time,changeover time, uptime (on demand machine availability),production batch sizes, number of operators, number of productvariations, pack size, working time (minus breaks), and scrap rate.Many of these characteristics have green implications, meaningthey are predictors of energy or resource consumption – like cycletime, which can help define process energy, or scrap rate, which isan indication of efficiency of conversion of resources into products.
Although the procedures for VSM are well established, the useof VSM in green manufacturing analysis is not so well defined. Thebest approach is to use the concepts of VSM and lean tocompliment the development and operation of efficient manu-facturing operations with the requirements of reduced energy andresource utilization – leading towards green and sustainablemanufacturing. If one reviews Ohno’s ‘seven wastes to be avoided’[123] and, realizing that this was developed before the currentconcern about the environment and green manufacturing was socommonly of interest, one can observe that many map directlyonto green manufacturing practice. For example, the ‘wastes’ ofproducing more than is needed, or storing/inventorying more than
Lean and green production influences at the facility level
reen manufacturing concepts are often linked to other leantices in industry. Lean manufacturing is defined by Holweg
as a production practice that ‘considers the expenditure ofurces for any goal other than the creation of value for the endomer to be wasteful, and thus a target for elimination’. Therea number of approaches to ‘lean’. The first approach isinally the elimination of waste and uses tools that assist invering waste in the process and system. A second approach is
e aligned with the Toyota Production System (TPS), which
needed, unnecessary transportation, unnecessary work steps orprocesses – all can be converted into wasted resources, energy, andother consumables or the indirect efforts of these wastes (such asfloor space and HVAC costs, additional tooling and the manu-facture and operation of it, unneeded raw materials and theassociated imbedded energy, transport, storage and recycling).
5. Multi-factory level – industrial symbiosis
Moving a further step up the manufacturing hierarchy from thefactory level, the interaction between industrial facilities comes

thethethetherial
eenallywasingtile
theralsandrest
for), oreeninal
theentomoustion
eretes,rialU.S.rks
ssesncerce
her,
J.R. Duflou et al. / CIRP Annals - Manufacturing Technology 61 (2012) 587–609 601
into scope. This interaction may occur between suppliers andcustomers in the supply chain, as described in Section 6 of thiskeynote, but it may also occur between economically independentcompanies exchanging and utilizing flows of materials or energy totheir mutual benefit, increasing the overall output from the giveninput of materials and resources compared to the situation whereeach facility would treat its waste streams in the conventional way,i.e. often just landfilling them. The mutualism in the interactionhas led to the introduction of the term ‘industrial symbiosis’ fromthe examples of mutualistic symbiotic relationships betweenorganisms of different species in natural ecosystems, in whichthese exchange flows of materials or protection for work in a waythat is mutually beneficial.
5.1. Definition of industrial symbiosis
A widely used definition of industrial symbiosis has beenformulated by Chertow [24]: ‘Industrial symbiosis engages tradi-tionally separate industries in a collective approach to competitiveadvantage involving physical exchange of materials, energy, water,and/or by-products. The keys to industrial symbiosis are collabora-tion and the synergistic possibilities offered by geographicproximity.’
The definition focuses on the fact that the industries areseparate, i.e. cleaner production activities involving differentdepartments or subsidiaries of one company are not consideredindustrial symbiosis (in the context of this paper these are coveredin Section 3 at the level of multi machine ecosystems). The natureof the engagement is described in the definition as ‘exchange of
physical flows of materials, energy or water’. In their discussion ofAustralian experience with industrial symbiosis, van Beers et al.[209] expand this point of the definition to include the joint use ofutility infrastructure for energy or water production or wastewatertreatment. The geographic proximity of the participants in theindustrial symbiosis is emphasized in the definition, and indeed,most known examples of industrial symbiosis involve companiesthat are closely co-located. There are, however, examples thatchallenge this part of the definition in discussing the Australianminerals industry; Schwarz and Steininger [177] report on a largeAustrian network of industrial waste recycling in the province ofStyria, where some of the participants are at distances thatnecessitate transport of the commodities through pipelines or roadtransport. Chertow’s definition also emphasizes that industrialsymbiosis is a collective approach, meaning that several industriesare normally involved. Again, the purpose is to distinguish theefforts beyond simple recycling activities, as carried out by scrapdealers for example. As a pragmatic way of deciding on this point,Chertow later writes: ‘To distinguish industrial symbiosis fromother types of exchanges, my colleagues and I have adopted a ‘3–2heuristic’ as a minimum criterion. Thus, at least three differententities must be involved in exchanging at least two differentresources to be counted as a basic type of industrial symbiosis. Byinvolving three entities, none of which is primarily engaged in arecycling oriented business, the 3–2 heuristic begins to recognizecomplex relationships rather than linear one-way exchanges.’ [26].
5.2. Practical examples of industrial symbiosis
The most well-known example remains the industrial ecosys-
waste flows totals around 2.9 mio tons [26]. The roots of
industrial symbiosis collaboration at Kalundborg go back to
1970s when some of the partners started collaborating on
reuse of water, but it was not until 1989 that the extent of
symbiotic relationships was realized, and the term industsymbiosis coined.
Since then, other examples of industrial symbiosis have bidentified or developed. A more comprehensive and geographicextended example is a network of collaborations that
discovered in the Austrian region of Styria in the 1990s, comprisa steel plant, power plants, paper producing industries, texindustry, cement industry and stone and ceramic industry asmain partners [177]. Examples from the mining and mineindustry in Australia focus on reuse of water, chemicals
mineral wastes [209]. Other examples are centered around foand pulp and paper industries where residual products are usedenergy production, and chemicals are recycled (e.g. [129,183]agro-industry systems like a Chinese example bordering betwindustrial ecology and supply chain integration. Here, an origsugar refinery activity has been expanded with industries usingtwo main by-product streams from the sugar production: spmolasses which are used in an alcohol plant, the residuals frwhich are used in fertilizing industry, and bagasse, the fibrresidues of the sugar canes, which are used in paper produc[227,228].
In East Asian countries like China, Korea and Singapore, whformal planning is more institutionalized, and in the United Staindustrial symbiosis typically occurs in the form of eco-industparks [26,124,228]. An eco-industrial park was defined for the
EPA by the Field Book for the Development of Eco-Industrial Pa[127] as: ‘a community of manufacturing and service busineseeking enhanced environmental and economic performathrough collaboration in managing environmental and resouissues including energy, water, and materials. By working toget
Fig. 20. Industrial symbiosis at Kalundborg.
Adapted from [190].
t isany’. Inble
andco-ateon-rkswn
tem constructed around a co-generation power plant in Kalund-borg, Denmark (Fig. 20) [190]. Multiple flows are involved, but themain ones are centered around the exchange of energy flows anddifferent qualities of water back and forth between power plantand the other main partners: an oil refinery, two biotechcompanies (pharmaceuticals and enzymes), and the municipalityof Kalundborg (district heating for 5000 homes). In addition thereare flows of flue gas treatment products between the power plantand a plasterboard producer (gypsum) and a local cement industry(fly ash), and between the biotech companies and local farmers(yeast slurry and sludge). On an annual basis, the exchange of
the community of businesses seeks a collective benefit thagreater than the sum of the individual benefits each compwould realize if it optimized its individual performance onlythe United States the US President’s Council on SustainaDevelopment, USPCSD in 1996 recommended that ‘Federal
state agencies should assist communities that want to create eindustrial parks that cluster businesses in the same area to crenew models of industrial efficiency, cooperation, and envirmental responsibility’ [208]. At that time, 15 eco-industrial pawere planned in the U.S., but until now few, if any, have shosuccessful and lasting examples of industrial symbiosis [26].
5.3.
Iin ainducom
� Revirto� Re
sidsy
Ibene
� Bereit
str� Br
mem
Fthe
enviI
highloweexceproc
� Co
wafee� Su
feeco� Av
wa
TimpresohandresodireofteAvoto th
Tsymsystfor
Kalu23 mand
demindusteachemstatiemi
Tbenedetestanques
J.R. Duflou et al. / CIRP Annals - Manufacturing Technology 61 (2012) 587–609602
Benefits realized through industrial symbiosis
t is clear that an industry will not voluntarily enter and remainn industrial symbiotic relationship with one or more otherstries if it does not entail clear economic benefits for thepany. The economic benefits can be direct through:
duced costs of raw materials on the input side, replacing costlygin resources or materials by waste that is free or very cheap
acquire from the symbiosis network.duced costs for the treatment of waste streams (on the outpute) as these are taken over by partners in the industrial
mbiosis network.
n addition to these financial benefits, there are more indirectfits through:
tter access to and supply security for resources that arestricted. This is particularly the case for water, but in the futureis also potentially the case for waste flows containing otherategic resources like metals.and value, satisfying important stakeholders among custo-ers, environmental regulators, local community members and
ployees [209].
or most companies, the economic and strategic benefits will bedrivers, but the question can be posed whether there are alsoronmental benefits, and if so, how large these are.ndustrial symbiosis typically allows an industry to substitute a
quality virgin resource (material, energy carrier or water) by ar quality substitute (waste) that per definition is available inss of demand in the region. This substitution involves threeesses: conversion, substitution and avoidance [210].
nversion involves collection of the waste materials, energy orter from the symbiosis partner, processing into a suitabledstock, and transport to the site of application.
bstitution involves the use of the generated alternativedstock, including possible adjustments of the process to
mpensate for lower quality inputs.oidance relates to the reduced or eliminated disposal of theste that has been recovered.
he conversion processes entail overall negative environmentalacts as they require facilities, energy and possibly otherurces and ancillary substances. Substitution, on the other, has indirect environmental benefits from helping to avoid
urce extraction and processing, but it may also cause negativect environmental impacts, since the use of lower grade inputsn requires more processing energy and produces more waste.idance normally has only positive environmental impacts duee reduced disposal of the avoided flows of waste or heat [210].o quantify the environmental impacts of the industrialbiosis, typically a comparison is performed to a referenceem without industrial symbiosis. In this way, annual savingssome of the central flows of the industrial symbiosis atndborg were quantified to 0.5 mio m3 surface water,io m3 of seawater and 1.3 mio GJ thermal energy (steam
hot water). In a similar approach, Chertow and Lombardi [25]
by-products, where it is unlikely that disposal at high costs wouldcontinue in the case where no symbiosis were established.Typically, alternative solutions would be developed, eliminatingor reducing the flow or finding other routes of utilizing the flows atlower costs or even commercializing them. Industrial developmentis full of examples on utilization of what was once a waste stream.Indeed, this kind of activity has been the nucleus around whichseveral of the known examples of industrial symbiosis have grown.Finally, the net environmental impact of the symbiosis isdetermined as the sum of the impacts associated to the threeprocesses, conversion, substitution and avoidance, including bothdirect impacts and indirect impacts from other activities inducedelsewhere in society by these processes. In order to determine theoverall benefit in terms of environmental impacts and resourceuse, there is a need to apply a life cycle perspective on the inducedchanges and identify any problem shifting to other parts of theinvolved product chains and between categories of environmentalimpact [18,75,183].
5.4. Hurdles and enhancers, constraints and concerns
Examining the existing examples of industrial symbiosis, itbecomes clear that they are often constructed around one or a fewcentral actor(s), with several more peripheral partners exchangingfew and minor streams. In areas where industrial water is a scarceresource, the exchange and reuse of this resource can be a centralelement in the symbiosis. When a central partner is a power plant,some of the partners will typically utilize waste heat and steamfrom the power plant. Depending on the nature of the partners,other flows that are exchanged in the symbiosis will involve wasteproducts, that can be reused and replace other resources for theusers, often using (down cycling) organic materials as fuels in heatproduction. In the systems described above, examples ofexchanged waste streams include gypsum, waste paper, textilewaste, fertilizing sludge, used solvents, wood residuals andhydrogen gas.
The question can be posed which factors determine theemergence of industrial symbiotic networks. Boons et al. [18]proposed the following list of societal mechanisms for enhancingthe development of industrial symbiosis:
� Coercion, forcing industries to adopt industrial symbiosisthrough legislation.� Imitation, when industries adopt industrial symbiosis routines
and concepts that they see in other industries for reasons ofstatus or to deal with uncertain situations (e.g. access toresources).� Private interest government, where a group of industries choose to
collectively adopt industrial symbiosis voluntarily, because ofthe threat of legislation if they remain inactive.� Demonstration projects, where policy actors initiate projects
experimenting with industrial symbiosis, and actively spread theresults as ‘best practice’ to accelerate its diffusion.� Training and professionalization of individuals in the concepts
and routines of industrial ecology who then subsequently start toapply these in their work environment.� Altering boundary conditions, to stimulate actors within regional
industrial systems to self-organize into industrial symbiosisnetworks.
onstrated savings of both costs and effluent discharges for anstrial symbiosis involving substitution of oil-fired on-sitem generation in Guayama, Puerto Rico (USA), at a petro-
ical complex by steam import from a coal-fired poweron. Emissions of SO2, NOx, and PM10 were reduced, but
ssions of CO and CO2 increased.he approach holds some methodological problems [210]: thefits may be considered confidential and hence difficult tormine because they are commercially sensitive. The use of thed-alone operation without symbiosis as reference scenario istionable, particularly in the case of large streams of waste or
While Boons et al. [18] put some faith in regulatoryinvolvement in the development of industrial symbiosis, Chertow[26] is less optimistic in this regard. Comparing the USexperience, trying to plan eco-industrial parks or industrialsymbioses, with the Kalundborg symbiosis case, the author drawstwo conclusions on why the latter has produced a successful andlasting industrial symbiosis and the former not: ‘First, we see thatrather than resulting from planning or a multi stakeholderprocess such as the ones pursued through the U.S. President’sCouncil on Sustainable Development, the Kalundborg symbiosis

isetantner
theent
text
tiesam/or
t toousande inor-on-ainialsr toon-
and ances,
asion,ffer
on aree of
ary thecin-ongses.dio-enttiver allnotlikega-
theionthe
the in
riestion
J.R. Duflou et al. / CIRP Annals - Manufacturing Technology 61 (2012) 587–609 603
emerged from self-organization initiated in the private sector toachieve certain goals., such as cost reduction, revenue enhance-ment, business expansion, and securing long-term access towater and energy. This implies that the symbiosis was not ‘seen’by outsiders because the exchanges emerged from the invisiblehand of the market rather than direct government policy orinvolvement. Second, once a revelation was made, a coordinativefunction was found to be helpful in organizing more exchangesand moving them forward’. Also in the Austrian and Australianexamples of successful industrial symbiosis networks, there hasbeen little active regulatory involvement in the development[177,209], and a conclusion seems to be that the industrialsymbiosis is a difficult thing to plan and stage by policy measures.Chertow [26] concludes that ‘. . .many of the successful industrialecosystems . . . did not arise in the ways pursued by the PCSD. Onefeature that several of these have in common is the experience of aquiet period where firms engaged in exchanges among them-selves, unconscious of a bigger picture, followed by an act ofdiscovery that revealed the pattern of existing symbioticexchanges and the resulting environmental benefits’. In theDanish case however, the role of public policy cannot becompletely dismissed since a rather ambitious environmentalpolicy must have played a motivating role in the development ofthe Kalundborg symbiosis, with green taxation leading to highprices of both waste treatment and water extraction and later alsoenergy. Building on the observation that a period of self-organization before being discovered as industrial symbiosisand marketed and expanded as such, was instrumental for theformation of the successful cases, Chertow [26] presents themodel in Fig. 21 for the progression of industrial symbiosisrelationships. She proposes a role for government and policy in:
� Help to identify and publicize already existing kernels ofcooperative activity in the form or symbiotic relationships,� Support such emerging kernels and help them expand by
involving other industries in the region, and� Provide incentives to catalyze the formation of new kernels by
identifying promising precursors to symbiosis, but abstain from‘supporting projects, through public or private investment, thathave much wishful thinking but no tangible kernels to roast’ [26].
With its name derived from a biological analogy and its centralrole in the whole concept of industrial ecology [24], industrial
existing processes is improved by industrial symbiosis (otherwthis would not occur in the first place) and hence this imporelement in the overall incentive to introduce new and cleatechnology is weakened. In this way, industrial symbiosis haspotential to act both as a driver and a barrier for the developmtowards a sustainable industrial society, depending on the conand the nature of the involved industries.
6. Supply chain level
A supply chain can be defined as ‘a set of three or more enti(organizations or individuals) directly involved in the upstreand the downstream flows of products, services, finances, andinformation from a source to a customer’ [83,130]. In contrasthe organizational/spatial hierarchy covered in the previsections, the focus here is on the provided good or service
its flow through the system. Transformation steps taking placsingle companies/factories are therefore interlinked by transptation processes entailing environmental impacts and use of nrenewable resources. Based on this, sustainable supply chmanagement has been defined as ‘management of raw materand services from suppliers to manufacturer/service providecustomer and back with improvement of the social and envirmental impacts explicitly considered’ [143,158].
6.1. Country specific variables
Based on the definition of the manufacturing system
efficiency indicators, three major country specific factors withinfluence on energy efficiency can be identified: climate, distanand energy sources and associated price structure. Considerednational averages, other factors, such as worker qualificatdegree of automation, age of machines, also significantly dibetween countries. However, these factors are not dependentgeographic location. In contrast to the first set of factors, theytransferable and their actual state depends on the specific caseach manufacturing company.
6.1.1. Energy source and energy cost
The different means of electricity production and provision vstrongly in terms of technology, use of fuels and impacts onenvironment. Conventional thermal energy generation by ineration of non-renewable resources, such as coal or gas are amthe most important contributors to emissions of greenhouse gaNuclear power generation contributes to the dispersion of ranuclides and increased background radiation in the environmand has unresolved problems with the storage of radioacwaste. Renewable sources, such as wind, water or solar powetap the energy inflow from the sun. Wind and sun are
associated with any emissions in the use stage, but have issues
land occupation and visual impacts that influence their propation. Hydroelectricity has impacts on riverine ecosystems andcreation of huge dams at hydropower stations causes submersof existing vegetation that leads to substantial emissions of
greenhouse gas methane in countries like Brazil. Fig. 22 showsenergy mix composition for the electricity net generationdifferent countries worldwide [204].
Significant differences can be observed between countlargely depending on conventional thermal energy genera
Fig. 21. The progression of industrial symbiosis relationships.
Adapted from [24].
bia,rgy in
ntal
be000inly
e ining
symbiosis with its exchange of waste streams between indepen-dent industries would seem to be an important element in the waytowards a more sustainable industrial society. But a relevantconcern is whether the focus on exchanging waste streams movesthe focus from a more traditional pollution prevention principlewhere waste should be prevented rather than treated and wastefulproduction processes should be substituted. And whether thecontractually based exchanges of waste flows in this way serve toperpetuate a wasteful production rather than motivate develop-ment of cleaner processes that avoid the waste productionaltogether. At least it is clear that the economic performance of
with certain high GHG emissions, such as Australia or Saudi Araand countries that already mainly switched to renewable enesources, like Brazil or Norway. Thus, energy consumptionspecific countries is associated with a specific environmeimpact depending on the sources.
The energy price is another important variable that needs toconsidered in this category. As depicted in Fig. 23, since 2electricity prices show a steady trend upwards which is macaused by rising price of fossil fuels (e.g. oil and gas) [83].
Studies show that this general trend is very likely to continuthe coming years despite temporal fluctuations due to chang
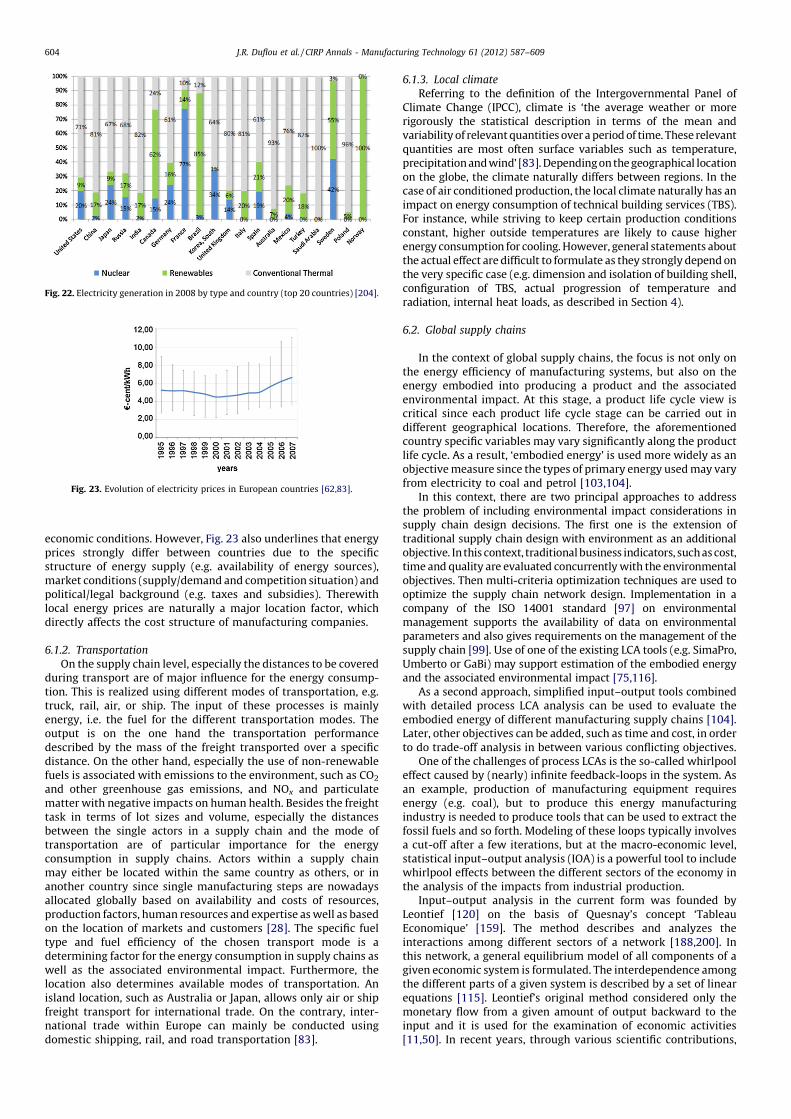
econpricstrumarpolilocadire
6.1.2
Oduritiontruceneroutpdescdistafueland
mattaskbetwtranconsmayanotallocprodon ttypedetewelllocaislanfreignatidom
Fig. 2
J.R. Duflou et al. / CIRP Annals - Manufacturing Technology 61 (2012) 587–609604
omic conditions. However, Fig. 23 also underlines that energyes strongly differ between countries due to the specificcture of energy supply (e.g. availability of energy sources),ket conditions (supply/demand and competition situation) andtical/legal background (e.g. taxes and subsidies). Therewithl energy prices are naturally a major location factor, whichctly affects the cost structure of manufacturing companies.
. Transportation
n the supply chain level, especially the distances to be coveredng transport are of major influence for the energy consump-. This is realized using different modes of transportation, e.g.k, rail, air, or ship. The input of these processes is mainlygy, i.e. the fuel for the different transportation modes. Theut is on the one hand the transportation performanceribed by the mass of the freight transported over a specificnce. On the other hand, especially the use of non-renewable
s is associated with emissions to the environment, such as CO2
other greenhouse gas emissions, and NOx and particulateter with negative impacts on human health. Besides the freight
in terms of lot sizes and volume, especially the distanceseen the single actors in a supply chain and the mode of
sportation are of particular importance for the energyumption in supply chains. Actors within a supply chain
either be located within the same country as others, or inher country since single manufacturing steps are nowadays
6.1.3. Local climate
Referring to the definition of the Intergovernmental Panel ofClimate Change (IPCC), climate is ‘the average weather or morerigorously the statistical description in terms of the mean andvariability of relevant quantities over a period of time. These relevantquantities are most often surface variables such as temperature,precipitation and wind’ [83]. Depending on the geographical locationon the globe, the climate naturally differs between regions. In thecase of air conditioned production, the local climate naturally has animpact on energy consumption of technical building services (TBS).For instance, while striving to keep certain production conditionsconstant, higher outside temperatures are likely to cause higherenergy consumption for cooling. However, general statements aboutthe actual effect are difficult to formulate as they strongly depend onthe very specific case (e.g. dimension and isolation of building shell,configuration of TBS, actual progression of temperature andradiation, internal heat loads, as described in Section 4).
6.2. Global supply chains
In the context of global supply chains, the focus is not only onthe energy efficiency of manufacturing systems, but also on theenergy embodied into producing a product and the associatedenvironmental impact. At this stage, a product life cycle view iscritical since each product life cycle stage can be carried out indifferent geographical locations. Therefore, the aforementionedcountry specific variables may vary significantly along the productlife cycle. As a result, ‘embodied energy’ is used more widely as anobjective measure since the types of primary energy used may varyfrom electricity to coal and petrol [103,104].
In this context, there are two principal approaches to addressthe problem of including environmental impact considerations insupply chain design decisions. The first one is the extension oftraditional supply chain design with environment as an additionalobjective. In this context, traditional business indicators, such as cost,time and quality are evaluated concurrently with the environmentalobjectives. Then multi-criteria optimization techniques are used tooptimize the supply chain network design. Implementation in acompany of the ISO 14001 standard [97] on environmentalmanagement supports the availability of data on environmentalparameters and also gives requirements on the management of thesupply chain [99]. Use of one of the existing LCA tools (e.g. SimaPro,Umberto or GaBi) may support estimation of the embodied energyand the associated environmental impact [75,116].
As a second approach, simplified input–output tools combinedwith detailed process LCA analysis can be used to evaluate theembodied energy of different manufacturing supply chains [104].Later, other objectives can be added, such as time and cost, in orderto do trade-off analysis in between various conflicting objectives.
One of the challenges of process LCAs is the so-called whirlpooleffect caused by (nearly) infinite feedback-loops in the system. Asan example, production of manufacturing equipment requiresenergy (e.g. coal), but to produce this energy manufacturingindustry is needed to produce tools that can be used to extract thefossil fuels and so forth. Modeling of these loops typically involvesa cut-off after a few iterations, but at the macro-economic level,statistical input–output analysis (IOA) is a powerful tool to includewhirlpool effects between the different sectors of the economy inthe analysis of the impacts from industrial production.
2. Electricity generation in 2008 by type and country (top 20 countries) [204].
Fig. 23. Evolution of electricity prices in European countries [62,83].
ated globally based on availability and costs of resources,uction factors, human resources and expertise as well as basedhe location of markets and customers [28]. The specific fuel
and fuel efficiency of the chosen transport mode is armining factor for the energy consumption in supply chains as
as the associated environmental impact. Furthermore, thetion also determines available modes of transportation. And location, such as Australia or Japan, allows only air or shipht transport for international trade. On the contrary, inter-
onal trade within Europe can mainly be conducted usingestic shipping, rail, and road transportation [83].
Input–output analysis in the current form was founded byLeontief [120] on the basis of Quesnay’s concept ‘TableauEconomique’ [159]. The method describes and analyzes theinteractions among different sectors of a network [188,200]. Inthis network, a general equilibrium model of all components of agiven economic system is formulated. The interdependence amongthe different parts of a given system is described by a set of linearequations [115]. Leontief’s original method considered only themonetary flow from a given amount of output backward to theinput and it is used for the examination of economic activities[11,50]. In recent years, through various scientific contributions,

ring
ntsility
besicsingate
canotal
wn
iblee ofosisands of
thed is
fortiese.g.
is ishus
for
ific in
pa-ajornu-ith
era-
rt ofort
ate
ncycanandnoting
sult. An
the
J.R. Duflou et al. / CIRP Annals - Manufacturing Technology 61 (2012) 587–609 605
the economic input–output tables have been combined withinformation on resource use and environmental emissions linkedto the economic flows to support analysis of the environmentalimpacts of different sectors of the economy [19,55,76,118,132,224]. The environmentally enhanced input–output analysis(EIO) has the strength of solving the whirlpool effect but thequality of the environmental information is deficient for manyenvironmental impacts. The emission of CO2 is one of the bestcovered aspects and this has been used to investigate theconsequences of moving production from industrialized nationsto developing countries such as China [89,122,180].
Another possible approach is to use a hybrid of product LCA andEIO analysis [164]. In this case, a matrix approach can be used todetermine what needs to be measured (either time or cost and eithergreen or sustainability), what was the geographic scope (local,regional, or global scope), and what was the manufacturing scope(product, machine/device, facility/line/cell, supply chain, or lifecycle scope). Then the iterative financial hybrid life cycle assessment(LCA) can be used in order to set up key areas as contributors to theGHG emissions and to estimate the electricity emissions in aparticular location while the transportation emissions of goodsbetween locations can be estimated by multiple sources.
7. Conclusions
A wide variety of considerations with relation to environmentalimpact reducing measures in general and energy and resourceefficiency in specific has been discussed and identified methodsand techniques for analysis and system optimization reviewed. Ateach system level a number of generic conclusions can be drawn.
For the unit process level it can be concluded that:
� Redesign of machine tools and selective control can significantlyincrease the energy efficiency without affecting productivity.Case studies illustrate improvements with a factor 1.2–3. Theobvious lack of priority for energy efficiency among machine toolbuilders leaves on average substantial space for improvementrequiring only well-known methods and techniques.� When allocating machine tools during process and production
planning, an appropriate choice at near nominal capacity level ishighly recommendable. Case studies demonstrate an influenceon the energy requirements of up to a factor 2.� Optimization of process parameter settings and well optimized
control allow to reduce the energy consumption. A factor 1.1 is atypical order of magnitude of the achievable improvements.
For this level systematic impact assessment methods have beendeveloped that allow to expect systematic data collection and LCIdatabase contributions over the next decade. This forms a first steptowards transparency in comparison of machine tool environ-mental efficiency and ultimately a machine tool eco-labelingsystem. External visibility of achieved efficiency levels throughsuch label should help to motivate machine tool builders to worktowards more energy and resource efficient solutions.
Related to multi-machine systems the following major conclu-sions can be formulated:
� Energy and material resource reuse opportunities can often beidentified through exergy cascading strategies. Examples with a
predicting energy and resource flows for larger manufactusystems.� Technical building services can consume considerable amou
of energy: it is obvious that factory layout and facoptimization need careful attention in a design stage.� Just like residential buildings, production facilities need to
constructed according to state of the art building phyprinciples, thus minimizing energy inputs for HVAC conditionof the work environment, while taking into account local climconditions.� Similar to the multi-machine strategy, production planning
be optimized at a facility wide level in order to limit the tenergy consumption.
At multi-facility level the following conclusions can be drawith respect to industrial symbiosis opportunities:
� The geographic co-location of production plants with posssynergies in terms of waste streams facilitates the exchangthe physical flows that are involved. As such industrial symbimay help to reduce industry’s need for treatment of solid
liquid waste and increase the overall efficiency both in termenergy and material resources.� Reported industrial symbiosis examples indicate that
principle has mainly been tested in process industry anhardly recognized in discrete manufacturing sectors.� The focus on exchanging waste streams may increase the risk
reduced attention for traditional pollution prevention activiaiming to avoid the generation of waste in the first place,
through internal recycling.� The most effective way of strengthening industrial symbios
to increase the economic motivation. Regulatory means tinclude taxation of the use of virgin resources and higher feesthe treatment of waste.
Considering the supply-chain level the choice for specproduction locations clearly influences the energy embeddeda product and the related environmental impact:
� While beyond the control of individual manufacturing comnies, regional electricity generation practices have a minfluence on the environmental impact associated with mafacturing operations (a factor 6 between countries wminimum and maximum impact of average electricity gention impact can be observed).� The production location also determines the need for transpo
raw materials and finished products as well as the transpmode, resulting in corresponding energy demands.� Depending on the type of operations performed, local clim
conditions can significantly influence the energy need.
It is obvious that the different opportunities for efficieimprovement identified at the respective distinguished levels
be combined in an integrated effort for impact reduction
economy improvement. However, the possible measures are
mutually independent: energy or material resource savmeasures at unit process level will, for example, typically rein a decrease in possible energy reuse at multi-machine leveloverall reduction in electrical energy consumption will reduce
lute
forringateent
for at
velst is
the
factor 1.2 efficiency improvement have been reported. However,this strategy has not yet been extensively explored.� Peak power and total energy consumption can be minimized by
means of planning and optimization methods supported bysimulation techniques.
At the factory level important conclusions are:
� When exceeding the level of multi machine chains, simulationtechniques become predominant to master the complexity of
impact of choice of location for a production facility in absoterms.
Most of the demonstrated available technological solutionsefficiency improvement only require well-known engineemethods for implementation. The authors conservatively estimthat combining such techniques with the reviewed intelligplanning and control optimization methods, offers a potentialglobal energy consumption reduction in manufacturing withleast 50%. A thorough optimization effort at all considered lecould result in more substantial improvements though. Ievident however that the replacement of machine tools and

redeexpemanaccostru
Aobserespattenatuof mimp
Ack
TfromCO2
of IW
Refe
[1]
[2]
[3]
[4]
[5]
[6]
[7]
[8]
[9]
[10]
[11]
[12]
[13]
[14]
[15]
[16]
[17]
[18]
[19]
[20]
[21]
[22][23]
J.R. Duflou et al. / CIRP Annals - Manufacturing Technology 61 (2012) 587–609606
sign and upgrading of facilities this will require cannot bected to happen overnight. Furthermore, the impact of theufacture of investment goods itself should be taken intount when considering early replacement of existing infra-cture.s a general recommendation for further research, the authorsrved a significantly less intensive research activity withect to resource efficiency utilization in comparison with thention spent to energy efficiency. Taking the non-continuousre of discrete part manufacturing and the time independency
aterial reuse options into account, material efficiencyrovement still offers substantial research potential.
nowledgements
he authors want to explicitly acknowledge the input received numerous CIRP colleagues and from researchers in the
PE! community. The authors want to acknowledge the supportT-Vlaanderen through its PhD grant no. 091232.
rences
Abele A, Anderl R, Birkhofer H (2005) Environmentally-Friendly Product Devel-opment – Methods and Tools. ISBN: 1-85233-903-9 (Chapter 3).
Abele E, Sielaff T, Schiffer A, Rothenbucher S (2011) Analyzing Energy Con-sumption of Machine Tool Spindle Units and Identification of Potential forImprovements of Efficiency. 18th CIRP LCE Conference, Braunschweig, 280–285.
Ahern JE (1980) The Exergy Method of Energy Systems Analysis, Wiley, NewYork. ISBN-10: 0471054941.
Akisawa A, Kang YT, Shimazaki Y, Kashiwagi T (1999) EnvironmentallyFriendly Energy System Models Using Material Circulation and Energy Cas-cade – The Optimization Work. Energy 24(7):561–578.
Alberts M, Kalaitzidou K, Melkote S (2009) An Investigation of GraphiteNanoplatelets as Lubricant in Grinding. International Journal of Machine Toolsand Manufacture 49(12–13):966–970.
Al-Rabghi O, Beirutty M, Akyurt M, Najjar Y, Alp T (1993) Recovery andUtilization of Waste Heat. Heat Recovery Systems & CHP 13(5):463–470.
Aurich JC, Herzenstiel P, Sudermann H, Magg T (2008) High-Performance DryGrinding Using a Grinding Wheel with a Defined Grain Pattern. CIRP Annals –Manufacturing Technology 57(1):357–362.
Avram OI, Xirouchakis P (2011) Evaluating the Use Phase Energy Require-ments of a Machine Tool System. Journal of Cleaner Production 19(6–7):699–711.
Azevedo M, Oliveira M, Peraira JP, Reis A (2011) Comparison of two LCAMethodologies in the Machine Tool Environmental Performance Improve-ment Process. 18th CIRP LCE Conference, Braunschweig, 575–580.
Baehr HD, Kabelac S (2009) Thermodynamik: Grundlagen und technischeAnwendungen, 14. aktualisierte Aufl., Springer Verlag, Berlin.
Bailey R, Allen JK, Bras B (2004) Applying Ecological Input–Output FlowAnalysis to Material Flows in Industrial Systems: Part I: Tracing Flows. Journalof Industrial Ecology 8(1–2):45–68.
Bates CE, Scott WD (1977) Decomposition of Resin Binders and the Relation-ship Between Gases Formed and the Casting Surface Quality – Part 3. AFSTransactions 85:209–226.
Bay N, Azushima A, Groche P, Ishibashi I, Merklein M, Morishita M, NakamuraT, Schmid S, Yoshida M (2010) Environmentally Benign Tribo-Systems forMetal Forming. CIRP Annals – Manufacturing Technology 59(2):760–780.
Bayerisches Landesamt fur Umweltschutz. (2005) Effiziente Energieverwen-dung in der Industrie – Teilprojekt ‘‘Metallschmelzberiebte’’ Effiziente Energie-nutzung in Nicht-Eisen-Metall-Schmelzbetrieben, Augsburg. (in German).
Bejan A (2001) Fundamentals of Exergy Analysis, Entropy Generation Mini-mization, and the Generation of Flow Architecture. International Journal ofEnergy Research 26(7):545–565.
Bell LE (2008) Cooling, Heating, Generating Power, and Recovering WasteHeat with Thermoelectric Systems. Science 321:1457–1461.
Bonneschky, A., 2002, Energiekennzahlen in PPS-Systemen, Diss. u.d.T.:Bonneschky, A.: Integration energiewirtschaftlicher Aspekte in Systemeder Produktionsplanung und -steuerung, Dissertation, Technische Universi-tat Cottbus.
Boons F, Spekkink W, Mouzakitis Y (2011) The Dynamics of Industrial
[24] Chertow MR (2000) Industrial Symbiosis, Literature and Taxonomy. AnnualReview of Energy and the Environment 25:313–337.
[25] Chertow MR, Lombardi DR (2005) Quantifying Economic and EnvironmentalBenefits of Co-Located Firms. Environmental Science and Technology39(17):6535–6541.
[26] Chertow MR (2007) Uncovering Industrial Symbiosis. Journal of IndustrialEcology 11(1):11–30.
[27] Clarens A, Zimmerman J, Keoleian G, Hayes K, Skerlos S (2008) Comparison ofLife Cycle Emissions and Energy Consumption for Environmentally AdaptedMetalworking Fluid Systems. Environmental Science and Technology42(22):8534–8540.
[28] Cohen MA, Mallik S (1997) Global Supply Chains – Research and Applications.Production and Operations Management 6(3):193–210.
[29] Comau, 2009, online http://WardsAuto.com/ar/comau_smart_assem-bly_091109/index.html (accessed 09.11.09).
[30] CO2PE! – Initiative. (2011) Cooperative Effort on Process Emissions in Manu-facturing. online http://www.mech.kuleuven.be/co2pe! (accessed 21.12.11).
[31] Costanza R (1980) Embodied Energy and Economic Valuation. Science210:1219–1224.
[32] Cox R (1996) Compressed Air – Clean Energy in a Green World. GlassInternational 19(2):50–52.
[33] Crandell, G.R., Schifo, J.F., Mosher, G., 2006, CERP Organic HAP EmissionMeasurements for Iron Foundries and Their Use in Development of an AFSHAP Guidance Document, AFS Transactions, Paper 06-031(10).
[34] Creyts JC, Carey VP (1999) Use of Extended Energy Analysis to Evaluate theEnvironmental Performance of Machining Processes. Institution of Mechan-ical Engineers Part E Journal of Process Mechanical Engineering 213(4):247–264.
[35] Curtner KL, O’Neill PJ, Winter D, Bursch P (1997) Simulation-based Featuresof the Compressed Air System Description Tool. XCEEDTM, Proceedings ofInternational Building Performance Simulation Association Conference, Prague.
[36] Dahmus J, Gutowski T (2004) An Environmental Analysis of Machining.Proceedings of ASME International Mechanical Engineering Congress and R&DExposition, 13–19.
[37] Dalquist S, Gutowski T (2004) Life Cycle Analysis of Conventional Manufac-turing Techniques: Sand Casting. Proceedings of ASME 2004 InternationalMechanical Engineering Congress and Exposition (IMECE2004), Anaheim, CA,631–641.
[38] Dalquist, S., Gutowski, T., 2004, Life Cycle Analysis of Conventional Manu-facturing Techniques: Die Casting, LMP Working Paper LMP-MIT-TGG-03-12-19-2004.
[39] Devoldere T, Dewulf W, Deprez W, Willems B, Duflou JR (2007) ImprovementPotential for Energy Consumption in Discrete Part Production Machines. 14thCIRP LCE Conference, Tokyo, 311–316.
[40] Dhanik S, Xirouchakis P, Perez R (2011) A System for Resource EfficientProcess Planning for Wire EDM. 18th CIRP LCE Conference, Braunschweig,219–224.
[41] Diaz N, Helu M, Jarvis A, Tonissen S, Dornfeld D, Schlosser R (2009) Strategiesfor Minimum Energy Operation for Precision Machining. Proceedings ofMTTRF 2009 Annual Meeting.
[42] Diaz N, Helu M, Jayanathan S, Chen Y, Horvath A, Dornfeld D (2010) Envir-onmental Analysis of Milling Machine Tool Use in Various ManufacturingEnvironments. IEEE International Symposium on Sustainable Systems andTechnologyArlington.
[43] Diaz N, Redelsheimer E, Dornfeld D (2011) Energy Consumption Charater-ization and Reduction Strategies for Milling Machine Tool Use. 18th CIRP LCEConference, Braunschweig, 263–267.
[44] Dietmair A, Verl A (2009) A generic Energy Consumption Model for DecisionMaking and Energy Efficiency Optimization in Manufacturing. InternationalJournal of Sustainable Engineering 2(2):123–133.
[45] Dietmair A, Verl A (2010) Energy Consumption Assessment and Optimisationin the Design and Use Phase of Machine Tools. 17th CIRP LCE Conference, Hefei,116–121.
[46] DIN8580. (2003) Manufacturing Processes – Term and Definitions, DeutchesInstitut Fur Normung E.V..
[47] Dincer I, Rosen MA (2007) Exergy: Energy, Environment, and SustainableDevelopment, Elsevier. ISBN: 978-0-08-044529-8.
[48] Dornfeld D (2012) Green Manufacturing: Fundamentals and Applications,Springer. ISBN: 978-1-4419-6015-3.
[49] Dotchev K, Yussof W (2009) Recycling of Polyamide 12 Based Powders in theLaser Sintering Process. Rapid Prototyping Journal 15(3):192–203.
[50] Duchin F (2004) Input–Output Economics and Material Flows, RensselearPolytechnic Institute, Troy, NY.
[51] Duflou JR, Kellens K, Devoldere T, Deprez W, Dewulf W (2010) Energy RelatedEnvironmental Impact Reduction Opportunities in Machine Design: CaseStudy of a Laser Cutting Machine. International Journal of Sustainable Man-ufacturing 2(1):80–98.
[52] Duflou JR, Kellens K, Renaldi Dewulf W (2011) Environmental Performance of
Symbiosis: A Proposal for a Conceptual Framework Based Upon a Compre-hensive Literature Review. Journal of Cleaner Production 19(9–10):905–911.Breuil JM (1992) Input–Output Analysis and Pollutant Emissions in France.The Energy Journal 13(3):173–184.
Brockhoff T, Brinksmeier E (1999) Grind-Hardening: A Comprehensive View.CIRP Annals – Manufacturing Technology 48(1):255–260.
Brodyansky VM, Sorin MV, Le Goff P (1994) The Efficiency of Ind. Processes:Exergy Analysis and Optimization, Elsevier, Amsterdam. ISBN-10:0444899960.
BUWAL database, Bundesamt fur Umwelt, Wald und Landschaft, 2006. CECIMO. (2009) Concept Description for CECIMO’s Self-regulatory Initiative
(SRI) for the Sector Specific Implementation of the Directive 2005/32/EC. Online: http://www.ecodesign-info.eu/document-tations/Machi- ne_tools_VA_20Oct09.pdf.
Sheet Metal Working Processes. Key Engineering Materials 473:21–26.[53] Duflou JR, Kellens K, Dewulf W (2011) Unit Process Impact Assessment for
Discrete Part Manufacturing: A State of the Art. CIRP Journal of ManufacturingScience and Technology 4(2):129–135.
[54] Eco Profiles. (2012) Eco profiles: life-cycle analysis, PlasticsEurope, Associationof plastics Manufacturers . online http://www.plasticseurope.org/plastics-sustainability/eco-profiles.aspx (accessed 10.01.12).
[55] Environmental Technology Laboratory. (2006) LCA Database based on 2000Input–Output Tables for Japan, Corporate Research & Development Center,Toshiba Corporation.
[56] European Aluminium Association, 2008, Environmental Profile Report for theEuropean Aluminium Industry, Life Cycle Inventory Data for AluminiumProduction and Transformation Processes in Europe.

008) und629.tions
ode-
e for
e for
etal9(4):
endseva.
with
ional
uzzyction
CO2
773.mbi-
an-
inersel.ains.
died32.g in.erial0.om-
6(9):
e Air353:
entalence,
and.dol-cessal of
Con-Flowctur-
erialomic
t ed.
hort80.
andcka-
peedmics
put–ental
ndlyrials
J.R. Duflou et al. / CIRP Annals - Manufacturing Technology 61 (2012) 587–609 607
[57] Fang K, Uhan N, Zhao F, Sutherland J (2011) A New Shop Scheduling Approachin Support of Sustainable Manufacturing. 18th CIRP LCE Conference, Braunsch-weig, 305–310.
[58] Fleurial JP (2009) Thermoelectric Power Generation Materials: Technologyand Application Opportunities. Journal of the Minerals Metals and MaterialsSociety 61(4):79–85.
[59] Ford, 2011, online http://media.ford.com/article_display.cfm?article_id=28471 (accessed 01.07.11).
[60] Foss R (2002) Managing Compressed Air Energy Part I: Demand Side Issues.Maintenance Technology. online http://www.mt-online.com/component/con-tent/article/134-august2001/622-managing-compressed-air-energy-part-i-demand-side-issues.html?directory=90 (accessed 26.05.06).
[61] Frischknecht, R., Jungbluth, N., Althaus, H.J., Doka, G., Dones, R., Hischier, R.,Hellweg, S., Nemecek, T., Rebitzer, G., Spielmann, M., 2007, Overview andMethodology, Ecoinvent Report No. 1, Swiss Centre for LCI, Dubendorf.
[62] German Federal Ministry of Economics and Technology. (2009) EnergyStatistics.
[63] Gibovic D, de Ciurana J (2008) Introduction and Applications of DIN 8580,University of Girona. ISBN: 978-84-96742-73-4.
[64] Global Steel Life Cycle Inventory (LCI). (2010) The World Steel Association.online http://www.worldsteel.org/steel-by-topic/life-cycle-assessment.html(accessed 10.01.12).
[65] Gomes JO, Gomes VEO, Fracaro de Souza J, Kawachi EI (2011) Saving Potentialof Water for Foundry Sand Using Treated Coolant Water. 18th CIRP LCEConference, Braunschweig, 407–412.
[66] Guley V, Khalifa B, Tekkaya AE (2011) The Effect of Extrusion Ratio andMaterial Flow on the Mechanical Properties of Aluminium Profiles Solid StateRecycled form 6060 Aluminium Alloy Chips. 14th ESAFORM Conference onMaterial Forming, AIP Conference Proceedings 1353, 1609–1614.
[67] Groscurth HM, Kummel R, van Gool W (1989) Thermodynamic Limits toEnergy Optimization. Energy 14(5):241–258.
[68] Gutowski TG, Murphy C, Allen D, Bauer D, Bras B, Piwonka T, Sheng P,Sutherland J, Thurston D, Wolff E (2005) Environmentally Benign Manufac-turing: Observations from Japan, Europe and the US. Journal of CleanerProduction 13:1–17.
[69] Gutowski TG, Branham MS, Dahmus JB, Jones AJ, Thiriez A, Sekulic DP (2009)Thermodynamic Analysis of Resources Used in Manufacturing Processes.Environmental Science and Technology 43(5):1584–1590.
[70] Haapala KR, Rivera JL, Sutherland JW (2008) Application of Life Cycle Assess-ment Tools to Sustainable Product Design and Manufacturing. InternationalJournal of Innovative Computing Information and Control Special Issue on RecentAdvances in Flexible Automation 4(3):577–591.
[71] Haapala KR, Rivera JL, Sutherland JW (2009) Reducing EnvironmentalImpacts of Steel Product Manufacturing. Transactions of NAMRI/SME37:419–426.
[72] Haapala, K.R., Catalina, A.V., Johnson, M.L., Sutherland, J.W., Development andApplication of Models for Steelmaking and Casting Environmental Perfor-mance, CIRP Journal of Manufacturing Science and Engineering.
[73] Hannon B (1973) The Structure of Ecosystems. Journal of Theoretical Biology41(3):535–546.
[74] Harms R, Fleschutz T, Seliger G (2010) Life Cycle Management of ProductionFacilities Using Semantic Web Technologies. CIRP Annals – ManufacturingTechnology 59(1):45–48.
[75] Hauschild M, Jeswiet J, Alting L (2005) From Life Cycle Assessment toSustainable Production: Status and Perspectives. CIRP Annals – ManufacturingTechnology 54(2):535–555.
[76] Hawdon D, Pearson P (1995) Input–Output Simulations of Energy, Environ-ment, Economy Interactions in the UK. Energy Economics 17(1):73–86.
[77] Hayakawa N, Wakazono Y, Kato T, Suzuoki Y, Kaya Y (1999) MinimizingEnergy Consumption in Industry by Cascade Use of waste Energy, EnergyConversion. IEEE Transactions 14(3):795–801.
[78] Hedman BA, Brown HL, Hamel BB (1980) Second Law Analysis of IndustrialProcesses. Energy 5(8–9):931–936.
[79] Heilala J, Vatanen S, Tonteri H, Montonen J, Lind S, Johansson B, Stahre J(2008) Simulation-based Sustainable Manufacturing System Design. WinterSimulation Conference 1922–1930.
[80] Hendricks T, Choate WT (2006) Engineering Scoping Study of ThermoelectricGenerator Systems for Industrial Waste Heat Recovery, Industrial TechnologiesProgram, U.S. Department of Energy.
[81] Herrmann C, Hesselbach J, Bock R, Dettmer T (2007) Coolants Made of NativeEster – Technical, Ecological and Cost Assessment from a Life Cycle Perspec-tive. 14th CIRP LCE Conference, Tokyo, 299–303.
[82] Hermann C, Thiede S (2009) Process Chain Simulation to Foster EnergyEfficiency in Manufacturing. CIRP Journal of Manufacturing Science and Tech-nology 1(4):221–229.
[83] Herrmann C, Kara S, Thiede S, Luger T (2010) Energy Efficiency in Manufac-turing – Perspectives from Germany and Australia. 17th CIRP LCE Conference,Hefei, 23–28.
[89] Herrmann IT, Hauschild M (2009) Effect of Globalisation on Carbon Footof Products. CIRP Annals – Manufacturing Technology 58(1):13–16.
[90] Hesselbach J, Martin L, Herrmann C, Thiede S, Ludemann B, Detzer R (2Energieeffizienz durch optimierte Abstimmung zwischen Produktiontechnischer Gebaudeausrustung. 15th CIRP LCE Conference, Sydney, 624–
[91] Holweg M (2007) The Genealogy of Lean Production. Journal of OperaManagement 25(2):420–437.
[92] Hornberger M (2009) Total Energy Efficiency Management. Elektronik Ecsign Congress, Munich.
[93] ICT Consultation Group. (2009) ICT and Energy Efficiency – The CasManufacturing, European Commission. p. 20.
[94] ICT Consultation Group. (2009) ICT and Energy Efficiency – The CasManufacturing, European Commission. p. 27.
[95] Ingarao G, Di Lorenzo R, Micari F (2011) Sustainability Issues in Sheet MForming Processes: An Overview. Journal of Cleaner Production 1337–347.
[96] International Labor Organisation (ILO). (2011) Global Employment Tr2011: The Challenge of a Jobs Recovery, International Labour Office, GenISBN: 9789221245469.
[97] ISO 14001:2004, Environmental Management Systems – Requirements
Guidance for Use, International Organization for Standardization.[98] ISO/CD 14955-1, Environmental Evaluation of Machine Tools, Internat
Organization for Standardization, Standard under development.[99] Jain V, Wadhwa S, Deshmukh SG (2007) Supplier Selection Using F
Association Rules Mining Approach. International Journal of ProduResearch 45(6):1323–1353.
[100] Jeswiet J, Astle B, Gawal D, Diarra D (2010) Energy Consumption andEmissions for Manufacturing Compressed Air. Trans NAMRI/SME 38:767–
[101] Johansson B, Kacker R, Kessel R, McLean C, Sriram R (2009) Utilizing Conatorial Testing on Discrete Event Simulation Models for Sustainable Mufacturing. ASME Conference 2:1095–1101.
[102] Junge, M., 2007, Simulationsgestutzte Entwicklung und Optimierung eenergieeffizienten Produktionssteuerung, Dissertation, Universitat Kas
[103] Kara S, Ibbotson S (2011) Embodied Energy of Manufacturing Supply ChCIRP Journal of Manufacturing Science and Technology 4(3):317–323.
[104] Kara S, Manmek S, Herrmann C (2010) Global Manufacturing & the EmboEnergy of Products. CIRP Annals – Manufacturing Technology 59(1):29–
[105] Kara S, Bogdanski G, Li W (2011) Electricity Metering and MonitorinManufacturing Systems. 18th CIRP LCE Conference, Braunschweig, 1–10
[106] Kara S, Li W (2011) Unit Process Energy Consumption Models for MatRemoval Processes. CIRP Annals – Manufacturing Technology 60(1):37–4
[107] Kaya AD, Phelan P, Chau D, Sarac HI (2002) Energy Conservation in Cpressed Air Systems. International Journal of Energy Research 2837–849.
[108] Kellens K, Dewulf W, Duflou JR (2011) Environmental Analysis of thBending Process, ESAFORM 2011. AIP Conference Proceedings 11650–1655.
[109] Kellens K, Renaldi Dewulf W, Duflou JR (2011) Preliminary EnvironmAssessment of Electrical Discharge Machining. 18th CIRP LCE ConferBraunschweig, 377–382.
[110] Kellens K, Yasa E, Renaldi Dewulf W, Kruth JP, Duflou JR (2011) EnergyResource Efficiency of SLS/SLM Processes. SFF Symposium, Texas, 1–16
[111] Kellens K, Dewulf W, Overcash M, Hauschild M, Duflou JR (2012) Methoogy for Systematic Analysis and Improvement of Manufacturing Unit ProLife Cycle Inventory, Part 1: Methodology Description. International JournLife Cycle Assessment 17(1):69–78.
[112] Klocke F, Schlosser R, Sangermann H (2011) Evaluation of the Energy
sumption of a Directed Lubricoolant Supply with Variable Pressures and
Rates in Cutting Processes. 9th Global Conference on Sustainable Manufaing, Saint Petersburg, 208–214.
[113] Konijn P, de Boer S, van Dalen J (1997) Input–Output Analysis of MatFlows with Application to Iron, Steel and Zinc. Structural Change and EconDynamics 8(1):129–153.
[114] Kotas TJ (1995) The Exergy Method of Thermal Plant Analysis, reprinKrieger, Malabar. ISBN-10: 0894649418.
[115] Kurz HD, Salvadori N (2000) Classical Roots of Input–Output Analysis a SAccount of its Long Prehistory. Economic Systems Research 12(2):153–1
[116] Lai J, Harjati A, McGinnis L, Zhou C, Guldberg T (2008) An EconomicEnvironmental Framework for Analyzing Globally Sourced Auto Parts Paging System. Journal of Cleaner Production 16(15):1632–1646.
[117] Larjola J (1995) Electricity from Industrial Waste Heat Using High-SOrganic Rankine Cycle (ORC). International Journal of Production Econo41(1–3):227–235.
[118] Lave LB, Cobas-Flores E, Hendrickson CT, McMichael FC (1995) Using InOutput Analysis to Estimate Economy-Wide Discharges. EnvironmScience & Technology 29(9):420–426.
[119] Leao F, Pashby I (2004) A Review on the Use of Environmentally-FrieDielectric Fluids in Electrical Discharge Machining. Journal of Mate
omic8(3):
ergyeig,
K on914.rld’s
trial
[84] Herrmann C, Zein A, Winter M (2010) Procedures and Tools for MeteringEnergy Consumption of Machine Tools. Manufacturing 2010, Poznan.
[85] Herrmann C, Zein A (2010) Polymer Water as Optimal Cutting Fluid –Technical Analysis. 43rd CIRP Conference on Manufacturing Systems, Vienna.
[86] Herrmann C, Thiede S, Kara S, Hesselbach J (2011) Energy Oriented Simula-tion of Manufacturing Systems – Concept and Application. CIRP Annals –Manufacturing Technology 60(1):45–48.
[87] Herrmann C, Suh S, Bogandanski G, Zein A, Cha J, Um J, Guzman A (2011)Context-aware Analysis Approach to Enhance Industrial Smart Metering.18th CIRP LCE Conference, Braunschweig, 323–328.
[88] Herrmann C, Zein A, Wits W, Van Houten F (2011) Visualization of Environ-mental Impacts for Manufacturing Processes using Virtual Reality. CIRPConference on Manufacturing Systems, Madison.
Processing Technology 149(1–3):341–346.[120] Leontief W (1936) Quantitative Input–Output Relations in the Econ
System of the United States. Review of Economics and Statistics 1105–125.
[121] Li W, Zein A, Kara S, Herrmann C (2011) An Investigation into Fixed EnConsumption of Machine Tools. 18th CIRP LCE Conference, Braunschw268–273.
[122] Li Y, Hewitt CN (2008) The Effect of Trade between China and the UNational and Global Carbon dioxide Emissions. Energy Policy 36:1907–1
[123] Liker J (2003) The Toyota Way: 14 Management Principles from the WoGreatest Manufacturer, McGraw-Hill. ISBN: 0-07-139231-9.
[124] Lin Y, Zhang Z, Wu F, Deng N (2004) Development of Ecological IndusParks in China. Fresenius Environment Bulletin 13(7):600–607.

[125]
[126]
[127]
[128]
[129]
[130]
[131]
[132]
[133]
[134]
[135]
[136]
[137]
[138]
[139]
[140]
[141]
[142]
[143]
[144]
[145]
[146]
[147]
[148
[149]
[150]
[151]
[152]
[153]
[154]
[155]
[156]
[157]
J.R. Duflou et al. / CIRP Annals - Manufacturing Technology 61 (2012) 587–609608
Lofgren, B., 2009, Capturing the Life Cycle Environmental Performance of aCompany’s Manufacturing System, Ph.D. thesis, Chalmers University ofTechnology.
Logozar K, Radonjic G, Bastic M (2006) Incorporation of Reverse LogisticsModel into In-Plant Recycling Process: A Case of Aluminium Industry.Resources Conservation and Recycling 49(1):49–67.
Lowe EA, Moran SR, Holmes DB (1995) Field Book for the Development of Eco-Industrial Parks, Draft Report, Indigo Dev. Co, Oakland, CA. (quoted fromChertow 2000).
Mani M, Lyons KW, Rachuri S, Subrahmanian E, Ameta G, Sriram RD, Feng SC(2008) Introducing Sustainability Early Into Manufacturing Process Planning.ASME 2008, Evanston, IL, 319–326.
Mattila T, Pakarinen S, Sokka L (2010) Quantifying the Total EnvironmentalImpacts of an Industrial Symbiosis – A Comparison of Process-, Hybrid andInput–Output Life Cycle Assessment. Environmental Science and Technology44(11):4309–4314.
Mentzer JT, DeWitt W, Keebler JS, Min S, Nix NW, Smith CD, Zacharia ZG(2001) Defining Supply Chain Management. Journal of Business Logistics22(2):1–26.
Meyer, L., 2006, Exergiebasierte Untersuchung der Entstehung von Umwelt-belastungen in Energieumwandlungsprozessen auf Komponentenebene:Exergookologische Analyse, Dissertation Universitat Darmstadt (in German).
Miller RE, Blair PD (1985) Input–Output Analysis: Foundations and Extensions,Prentice-Hall, Englewood Cliffs, NJ.
Mognol P, Lepicart D, Perry N (2006) Rapid Prototyping: Energy and Envir-onment in the Spotlight. Rapid Prototyping Journal 12(1):26–34.
Moran MJ, Sciubba E (1994) Exergy Analysis: Principles and Practice. Journalof Engineering for Gas Turbines and Power 116(2):285–290.
Mori M (2010) Power Consumption Reduction of Machine Tools. Presentationat EERE Working Group Meeting, CIRP General Assembly, Pisa.
Mori M, Fujishima M, Inamusa Y, Oda Y (2011) A Study on Energy EfficiencyImprovement for Machine Tools. CIRP Annals – Manufacturing Technology60(1):145–148.
Morrow W, Kim H, Mazumder J, Skerlos S (2007) Environmental Aspects ofLaser-Based and Conventional Tool and Die Manufacturing. Journal of CleanerProduction 15(10):932–943.
Mosher GE (1994) Calculating Emission Factors for Pouring, Cooling andShakeout. Modern Casting 84(10):28–31.
Munoz AA, Sheng P (1995) An Analytical Approach for Determining theEnvironmental Impact of Machining Processes. Journal of Materials ProcessingTechnology 53(3–4):736–758.
Neugebauer R, Wertheim R, Hochmuth C, Schmidt G, Dix M (2010) Modellingof Energy and Resource-Efficient Machining. Proceedings of the 4th CIRPConference on High Performance Cutting, Gifu, 295–300.
Neugebauer R, Schieck F, Goschel A, Schonherr J (2011) Heuristic-basedEvaluation of Energy Flows in Press Hardening Process Chains. Key Engineer-ing Materials 473:816–823.
Neugebauer R, Putz M, Bohme J, Todtermuschke M, Pfeifer M (2011) Newaspects of Energy Consumption Analysis in Assembly Processes and Equip-ment. 9th Global Conference on Sustainable Manufacturing, Saint Petersburg,203–207.
New Zealand Business Council (NZBC) for Sustainable Development. (2003)Business Guide to a Sustainable Supply Chain – A Practical Guide.
Newman ST, Nassehi A, Imani-Asrai R (2010) Energy Efficient Process Plan-ning for CNC Machining. 1st International Colloquium of the Cluster of Excel-lence (eniPROD), Chemnitz, 57–79.
Noble SB (1978) Material/Energy Accounting and Forecasting Models, Resources,Environment, and Economics, R.U. Ayres, New York, Wiley.
NREL, U.S. Life-Cycle Inventory Database, online http://www.nrel.gov/lci/database (accessed 10.01.12).
OECD Fact book. (2009) Economic, Environmental and Social Statistics. ISBN:92-64-05604-1.
] Oliveira JFG, Alves SM (2006) Development of Environmentally FriendlyFluid for CBN Grinding. CIRP Annals – Manufacturing Technology 55(1):343–346.
Oliveira M, Santos J, Almeida F, Reis A, Pereira JP, Rocha A (2011) Impact ofLaser-based Technologies in the Energy-consumption of Metal Cutters:Comparison between Commercially Available Systems. Key EngineeringMaterials 473:809–815.
Overcash M, Twomey J, Isaacs J (2009) Manufacturing Unit Process Life CycleInventories (UPLCI). Permis’09, Gaithersburg, 30–31.
Pantke K, Guley V, Khalifa B, Heilmann M, Biermann D, Tekkaya EA (2010)Aluminium Scrap Recycling by Hot Extrusion without Melting Process. 12thInternational Conference on Aluminium Alloys, Yokohama, 242–247.
Pecas P, Ribeiro I, Folgado R, Henriques E (2009) A Life Cycle EngineeringModel for Technology Selection: A Case Study on Plastic Injection Moulds forLow Production Volumes. Journal of Cleaner Production 17(9):846–856.
Pechmann A, Scholer I (2011) Optimizing Energy Costs by Intelligent Pro-
[158] Quadriguasi J, Walther G, Bloemhof J, Van Nunen JAEE, Spengler T (2009) AMethodology for Assessing Eco-Efficiency in Logistics Networks. EuropeanJournal of Operational Research 193(3):670–682.
[159] Quesnay F (1894) Tableau Economique (1758), first reprint edition. BritishEconomic Association, London.
[160] Quinkertz R, Rombach G, Liebig D (2001) A scenario to Optimize the EnergyDemand of Aluminium Production Depending on the Recycling Quota,Resources. Conservation and Recycling 33(3):217–234.
[161] Rahimifard S, Seow Y, Childs T (2010) Minimising Embodied Product Energyto Support Energy Efficient Manufacturing. CIRP Annals – ManufacturingTechnology 59(1):25–28.
[162] Radgen P, Lucas K (1996) Energy System Analysis of a Fertilizer Complex –Pinch Analysis vs. Exergy Analysis. Chemical Engineering & Technology19(2):192–195.
[163] Rager, M., 2008, Energieorientierte Produktionsplanung – Analyse, Konzep-tion und Umsetzung, Dissertation, Universitat Augsburg.
[164] Reich-Weiser C, Dornfeld D (2009) A Discussion of Greenhouse Gas EmissionTradeoffs and Water Scarcity Within the Supply Chain. Journal of Manufac-turing Systems 28(1):23–27.
[165] Reich-Weiser C, Vijayaraghavan A, Dornfeld D (2010) Appropriate Use ofGreen Manufacturing Frameworks. 17th CIRP LCE Conference, Heifei,196–201.
[166] Reinhardt G, Reinhardt S, Fockerer T, Zah M (2011) Comparison of theResource Efficiency of Alternative Process Chains for Surface Hardening.18th CIRP LCE Conference, Braunschweig, 311–316.
[167] Renaldi R, Kellens K, Dewulf W, Duflou J (2011) Exergy Efficiency Definitionsfor Manufacturing Processes. 18th CIRP LCE Conference, Braunschweig,329–334.
[168] Risi JD (1995) Energy Savings with Compressed air. Journal of the Associationof Energy Engineers 92(6):49–58.
[169] Rother M, Shook J (2003) Learning to See – Value Stream Mapping to CreateValue and Eliminate Muda, The Lean Enterprise Institute, Cambridge, MA.ISBN: 0-9667843-0-8.
[170] Saidur R, Rahim NA, Hasanuzzaman M (2010) A Review on Compressed-airEnergy Use And Energy Savings. Renewable and Sustainable Energy Reviews14(4):1135–1153.
[171] Saiganesh S, Sekulic DP (2010) Balancing Material and Exergy Flows for a PCBSoldering process: Method and a Case Study. IEEE International Symposium onSustainable Systems and Technology, Arlington.
[172] Santos JP, Oliveira M, Almeida FG, Pereira JP, Reis A (2011) Improving theEnvironmental Performance of Machine Tools: Influence of Technology andThroughput on the Electrical Energy Consumption of a Press-brake. Journal ofCleaner Production 19(4):356–364.
[173] Schieferdecker, B.. (2006) Energiemanagement-Tools – Anwendung im Indus-trieunternehmen, Springer, Berlin, Heidelberg. ISBN-10: 3540254781.
[174] Schipper M (2006) Energy-Related Carbon Dioxide Emissions in U.S. Manufac-turing, U.S. Energy Information Administration. DOE/EIA-0573(2005), onlinehttp://www.eia.doe.gov/oiaf/1605/ggrpt/pdf/industry_mecs.pdf (lastaccessed 05.07.11).
[175] Schlosser R, Klocke F, Dobbeler B, Riemer B, Hameyer K, Herold T, Zimmer-mann W, Nuding O, Schindler B, Niemczyk M (2011) Assessment of Energyand Resource Consumption of Processes and Process Chains within theAutomotive Sector. 18th CIRP LCE Conference, Braunschweig, 45–50.
[176] Schmitt R, Bittencourt JL, Bonefeld R (2011) Modeling Machine Tools for Self-Optimization of Energy Consumption. 18th CIRP LCE Conference, Braunsch-weig, 253–257.
[177] Schwarz EJ, Steininger KW (1997) Implementing Nature’s Lesson: The Indus-trial Recycling Network Enhancing Regional Development. Journal of CleanerProduction 5(1–2):47–56.
[178] Sheng P, Srinivasan M, Kobayashi S (1995) Multi-Objective Process Planningin Environmentally Conscious Manufacturing: A Feature-Based Approach.CIRP Annals – Manufacturing Technology 44(1):433–437.
[179] Shi CWP, Rugrungruang F, Yeo Z, Gwee KHK, Ng R, Song B (2011) IdentifyingCarbon Footprint Reduction Opportunities through Energy Measurements inSheet Metal Part Manufacturing. 18th CIRP LCE Conference, Braunschweig,389–394.
[180] Shui B, Harriss R (2005) The Role of CO2 Embodiment in US–China Trade.Energy Policy 34(18):4063–4068.
[181] Siemens AG (2010) Simulation of the Energy Consumption of Conveyor Lineswith Tecnomatix Plant Simulation. online www.slideshare.net/SiemensPLM(accessed 10.01.12).
[182] Sirkin T, ten Houten M (1994) The Cascade Chain: A Theory and Tool forAchieving Resource Sustainability with Applications for Product Design.Resources Conservation and Recycling 10(3):213–276.
[183] Sokka L, Pakarinen S, Melanen M (2011) Industrial Symbiosis Contributing toMore Sustainable Energy Use – An Example From the Forest Industry inKymenlaakso, Finland. Journal of Cleaner Production 19(4):285–293.
[184] Solding P, Petku D, Mardan N (2009) Using Simulation for More Sustainable
duction Scheduling. 18th CIRP LCE Conference, Braunschweig, 293–298.Pehnt, M., Bodeker, J., Arens, M., 2010, Die Nutzung industrieller Abwarme –technisch-wirtschaftliche Potenziale und energiepolitische Umsetzung,Research report (in German).
Pei Y, Shi X, LaLonde A, Wang H, Chen L, Snyder GJ (2011) Convergence ofElectronic Bands for High Performance Bulk Thermoelectrics. Nature 473:66–69.
Pusavec F, Krajnik P, Kopac J (2010) Transitioning to Sustainable Production –Part 1: Application on Machining Technologies. Journal of Cleaner Production18(2):174–184.
Pusavec F, Kramar D, Krajnik P, Kopac J (2010) Transitioning to SustainableProduction – Part 2: Evaluation of Sustainable Machining Technologies.Journal of Cleaner Production 18(12):1211–1221.
Production Systems – Methodologies and Case Studies. International Journalof Sustainable Engineering 2(2):111–122.
[185] Steiner, R., Frischknecht, R., 2007, Metals Processing and Compressed AirSupply, Ecoinvent report nr. 23, Swiss Centre for LCI, Dubendorf.
[186] Sternlicht B (1982) Waste Energy Recovery: An Excellent Investment Oppor-tunity. Energy Conversion and Management 22(4):361–373.
[187] Suh S (2005) Theory of Materials and Energy Flow Analysis in Ecology andEconomics. Ecological Modeling 189(3–4):251–269.
[188] Suh S (2009) Handbook on Input–Output Economics in Industrial Ecology, ECO-Efficiency in Industry and Science, Springer. ISBN: 978-1-4020-4083-2.
[189] Sutherland JW, Gunter KL (2001) Environmental Attributes of ManufacturingProcesses. Handbook of Environmentally Conscious Manufacturing, KluwerAcademic Publishers. pp. 293–316 (Chapter 13), ISBN: 978-0792384496.

Haagol of
g of
aser1.portnol-
tion- 7th
Beij-
andlogy
duc-able
anduring
zien-
t. ofnlinessed
012)s: A
ence,
imu-h toware
put–SFA,
entaldels.
6) Aotive
r the CIRP
o anoup.
Case
eizer).
J.R. Duflou et al. / CIRP Annals - Manufacturing Technology 61 (2012) 587–609 609
[190] Symbiosis Institute. (2011) Homepage of the Kalundborg Industrial SymbiosisActivities. online www.symbiosis.dk (accessed 27.06.11).
[191] Szargut, J., Morris, D.R., Steward, F.R., 1988, Exergy Analysis of Thermal,Chemical, and Metallurgical Processes, Hemisphere, ISBN-10: 0891165746.
[192] Szargut J, Morris DR (1990) Cumulative Exergy Losses Associated with theProduction of Lead Metal. International Journal of Energy Research 14(6):605–616.
[193] Tekkaya EA, Schikorra M, Becker D, Biermann D, Hammer N, Pantke K (2009)Hot Profile Extrusion of AA-6060 Aluminium Chips. Journal of MaterialsProcessing Technology 209(7):3343–3350.
[194] The Life Cycle Initiative. (2012) United Nations Environmental Programme andthe Society for Environmental Toxicology and Chemistry (UNEP–SETAC). onlinehttp://lcinitiative.unep.fr (accessed 10.01.12).
[195] Thiede S, Herrmann C, Kara S (2011) State of Research and InnovativeApproach for Simulating Energy Flows of Manufacturing Systems. 18th CIRPLCE Conference, Braunschweig, 347–352.
[196] Thiede, S., 2012, Energy Efficiency in Manufacturing Systems, Dissertation,TU, Braunschweig, Springer, ISBN: 978-3-642-25913-5.
[197] Thiriez A, Gutowski T (2006) An Environmental Analysis of Injection Mold-ing. IEEE Symposium on Electronics and the Environment, Scottsdale, 195–200.
[198] Todd RH, Allen DK, Alting L (1994) Fundamental Principles of ManufacturingProcesses, Industrial Press Inc. ISBN: 0-8311-3050-4.
[199] Tonsing E (1996) Energiemanagement im Betrieb reduziert Kosten. MagazinWirtschaft der Industrie- und Handelskammer Region Stuttgart 1:19–20.
[200] Ukidwe, N., 2005, Thermodynamic Input–Output Analysis of Economic andEcological Systems for Sustainable Engineering, Ph.D. thesis, Ohio StateUniversity.
[201] United Nations Environmental Programme (UNEP), 2011, Towards a GreenEconomy: Pathways to Sustainable Development and Poverty Eradication,Chapter on Manufacturing, online http://www.unep.org/greeneconomy(accessed 28.07.11).
[202] UPLCI, 2011, Online Database and Taxonomy (Screening Approach),www.wichita.edu/sustainability (accessed 11.09.11).
[203] U.S. Department of Energy (USDOE). (1999) Energy and Environmental Profileof the U.S. Metalcasting Industry, Office of Industrial Technologies.
[204] U.S. Energy Information Administration (EIA), 2010, online http://www.eia.-doe.gov (accessed 28.06.11).
[205] U.S. Environmental Protection Agency (USEPA). (1998) Profile of the MetalCasting Industry, EPA/310-R-97-004, EPA Office of Compliance Sector Note-book Project.
[206] U.S. Environmental Protection Agency (USEPA). (2002) Beneficial Reuse ofFoundry Sand: A Review of State Practices and Regulations, U.S. EnvironmentalProtection Agency, Washington, DC. online http://www.epa.gov/sectors/sec-torinfo/sectorprofiles/metalcasting/reuse.pdf (accessed 10.01.12).
[207] U.S. Geological Survey (USGS), 2010, Aluminium Statistics, Historical Statisticsfor Mineral and Material Commodities in the United States: USGS Data Series140, online http://minerals.usgs.gov/ds/2005/140/ (accessed 05.07.11).
[208] U.S. President’s Council on Sustainable Development (USPCSD). (1996) Sus-tainable America: A New Consensus for Prosperity, Opportunity, and a HealthyEnvironment for the Future, U.S. Government Printing Office, Washington, DC.(quoted from Chertow, 2007).
[209] van Beers D, Corder G, Bossilkov A, van Berkel R (2007) Industrial Symbiosisin the Australian Minerals Industry: The Cases of Kwinana and Gladstone.Journal of Industrial Ecology 11(1):55–72.
[210] Van Berkel R (2010) Quantifying Sustainability Benefits of Industrial Sym-bioses. Journal of Industrial Ecology 14(3):371–373.
[211] Verl A, Westkamper E, Abele E, Dietmair A, Schlechtendahl J, Friedrich J,
H, Schrems S (2011) Architecture for Multilevel Monitoring and ContrEnergy Consumption. 18th CIRP LCE Conference, Braunschweig, 45–50.
[212] Vijayaraghavan A, Dornfeld D (2010) Automated Energy MonitorinMachine Tools. CIRP Annals – Manufacturing Technology 59(1):21–24.
[213] Wahl, E., Vincke, K., Himmelsbach, M., 2011, Recovery of Energy from a LMachining System, US Patent Application publication, US2011/002440
[214] Wall, G., 1977, Exergy – A Useful Concept within Resource Accounting, ReNo. 77-42, Institute of Theoretical Physics, Chalmers University of Techogy and University of Goteborg, Goteborg, Sweden.
[215] Wang J, Yu J, Li S, Xiao G, Chang Q, Biller S (2008) A data enabled operabased simulation for automotive assembly. Asia Simulation Conference –International Conference on System Simulation and Scientific Computing,
ing, 726–731.[216] Weinert K, Inasaki I, Sutherland J, Wakabayashi T (2004) Dry Machining
Minimum Quantity Lubrication. CIRP Annals – Manufacturing Techno53(2):511–537.
[217] Weinert N, Chiotellis S, Seliger G (2009) Concept for Energy-Aware Protion Planning based on Energy Blocks. 7th Global Conference on SustainManufacturing, Chennai, 75–80.
[218] Weinert N, Chiotellis S, Seliger G (2011) Methodology for PlanningOperating Energy-Efficient Production Systems. CIRP Annals – ManufactTechnology 60(1):41–44.
[219] Weinert, N., 2011, Vorgehensweise fur Planung und Betrieb energieeffiter Produktionssysteme, Dissertation, TU Berlin, Fraunhofer Verlag.
[220] Wilson SE (2001) Michigan’s Sand Dunes, Pamphlet 7, Michigan DepEnvironmental Quality, Geological Survey Division, Lansing, MI. ohttp://www.michigan.gov/documents/deq/PA07_304669_7.pdf (acce10.01.12).
[221] Winter M, Ohlschlager G, Dettmer T, Ibbotson S, Herrmann C, Kara S (2Using Jatropha Oil Based Metalworking Fluids in Machining ProcesseFunctional and Ecological Life-Cycle Evaluation. 19th CIRP LCE ConferBerkeley.
[222] Wohlgemuth V, Page B, Kreutzer W (2006) Combining Discrete Event Slation and Material Flow Analysis in a Component-Based ApproacIndustrial Environmental Protection. Environmental Modeling & Soft21(11):1607–1617.
[223] Xue H, Kumar V, Pandit SM, Sutherland JW (2004) An Enhanced InOutput Model for Material Flow Analysis of Manufacturing Processes, JUDenver.
[224] Xue H, Kumar V, Sutherland JW (2007) Material Flows and EnvironmImpacts of Manufacturing Systems via Aggregated Input–Output MoJournal of Cleaner Production 15(13–14):1349–1358.
[225] Yuan C, Zhang T, Rangarajan A, Dornfeld D, Ziemba B, Whitbeck R (200Decision-Based Analysis of Compressed Air Usage Patterns in AutomManufacturing. Journal of Manufacturing Systems 25(4):293–300.
[226] Zein A, Li W, Hermann C, Kara S (2011) Energy Efficiency Measures foDesign and Operation of Machine Tools: An Axiomatic Approach. 18thLCE Conference, Braunschweig, 274–279.
[227] Zhu Q, Cote RP (2004) Integrating Green Supply Chain Management intEmbryonic Eco-Industrial Development: A Case Study of the Guitang GrJournal of Cleaner Production 12(8–10):1025–1035.
[228] Zhu Q, Lowe E, Wei Y, Barnes D (2007) Industrial Symbiosis in China: A
Study of the Guitang Group. Journal of Industrial Ecology 11(1):31–42.[229] Zust R, Zust S, Studer S (2010) Ecodesign-Potenzialanalyse in der Schw
MEM-Industrie – eine explorative Studie, Bundesamt fur Umwelt (BAFU