towards a taxonomy of search patterns of manufacturing flexibility in small and medium-sized firms
TRANSCRIPT

Towards a taxonomy of search patterns of manufacturing¯exibility in small and medium-sized ®rms
Marcello Bragliaa, Alberto Petronib,*aDipartimento di Ingegneria Meccanica, Nucleare e della Produzione, UniversitaÁ di Pisa, Via Bonanno Pisano 25/B, 56126 Pisa, Italy
bDipartimento di Ingegneria Industriale, UniversitaÁ di Parma, Viale delle Scienze, 43100 Parma, Italy
Received 1 November 1998; accepted 1 July 1999
Abstract
Manufacturing organizations are experiencing a wide range of forces which make it necessary for them tocontinuously adapt their operations and consider the consequences of their production activities on customerexpectations, supplier constraints and changes in the law. This paper presents an empirical veri®cation of knowledge
levels and the perceived strategic relevance of manufacturing ¯exibility. A questionnaire survey was conducted witha sample of 89 manufacturing ®rms located in the area around Brescia, one of the most industrialized areas inEurope. Initial results gave a better understanding of which type of ¯exibility is preferred when facing di�erent
environmental challenges. In addition, insights into managerial approaches were brought out through clustering anddiscriminant analysis which have made it possible to emphasize some signi®cant di�erences between ®rms in thesearch patterns of manufacturing ¯exibility. # 2000 Elsevier Science Ltd. All rights reserved.
Keywords: Manufacturing ¯exibility; Operations management; Small and medium-sized enterprises; Mechanical industry
1. Introduction
In general terms, manufacturing ¯exibility has been
de®ned as the ability of a manufacturing organization
to deploy and redeploy its resources e�ectively in re-
sponse to changing environmental and internal con-
ditions [1]. Manufacturing ¯exibility has been
emphasized as a major competitive concern in oper-
ations management [2] and its improvement is fre-
quently an important issue on the manufacturing
manager's agenda [3]. The manufacturing ¯exibility
choices made by ®rms are aimed at improving compe-
titiveness when faced with rapid changes [4,5]. With
globalization the company must consider international
markets and still maintain a certain threshold of ¯exi-
bility to adjust quickly and cost-e�ectively to local
markets requirements, evolving technical standards
and changes in the law [6]. Manufacturing ¯exibility
can also be directed towards speeding up the introduc-
tion of products, which is critical in situations of
increased uncertainty where products have short mar-
ket lives. But even when product innovation capability
is not critical (in established industries where fewer
product changes occur), manufacturers often have to
face considerable environmental uncertainty (due, for
instance, to safety and environmental legislation or
compliance to quality certi®cation requirements).
Despite the vast amount of research carried out on
manufacturing ¯exibility over the last decade, common
de®nitions and shared concepts still remain elusive.
Omega 28 (2000) 195±213
0305-0483/00/$ - see front matter # 2000 Elsevier Science Ltd. All rights reserved.
PII: S0305-0483(99 )00044-4
www.elsevier.com/locate/orms
* Corresponding author. Tel.: +39-0521-905-861; fax: +39-
0521-905-705.
E-mail addresses: [email protected] (M. Braglia), petro-
[email protected] (A. Petroni).

Many di�erent classi®cations of the concept are pro-
posed (e.g.[7±10]), and it is clear that approaches tooperational ¯exibility have not yet reached a paradig-matic stage. Furthermore, some empirical evidence
seems to con®rm that, despite the wide proliferation of¯exibility types and de®nitions proposed in the litera-ture, ¯exibility tends to be unidimensional when opera-
tionalized [6]. Even when adopting a speci®ctaxonomy, the basic types of ¯exibility are not unre-
lated [5]: new product introduction and mix ¯exibilityinteract in a fairly strict manner, tend to reinforce eachother and in¯uence common elements in operational
domains such as the possibility of reusing componentsand the involvement of personnel. It also appears tobe the case that mix ¯exibility can reduce the need for
volume ¯exibility by decreasing volume swings [11].The research illustrated below addresses the issue of
whether it is possible to track meaningful uniformityin the search patterns of manufacturing ¯exibilityadopted by small and medium-sized enterprises. The
underlying assumption is that the organizational adap-tive behavior, when faced with external contingencies,
is largely ®rm-speci®c (depending on the ®rm's physicaland managerial structure and organizational resourcesand capabilities) and path-dependent (depending on its
previous choices and past history) [12]. After morethan a decade of research into manufacturing ¯exi-bility, it is now recognized that ¯exibility and the
measures used to express it are user- and/or situation-speci®c [13].
This paper is divided into three parts. The ®rst triesto identify the nature of environmental changes that®rms are currently facing. The second part provides a
measurement of the perceived e�ectiveness of eachdimension of manufacturing ¯exibility when facingmajor environmental challenges. The third section il-
lustrates an attempt to build a taxonomy of small andmedium-sized enterprises (SMEs) based on their
approach to manufacturing ¯exibility. The data referto a sample of 89 SMEs located in the province ofBrescia, one of the most industrialized area of northern
Italy. The basic research model relies on the assump-tion that, by identifying speci®c environmental sourcesof uncertainty and the responses of the ®rms, one can
a priori identify critical dimensions of manufacturing¯exibility.
Previous work in this area, in assuming that man-agers face the task of balancing manufacturing ¯exi-bility and external uncertainty, have generally aimed at
building operational frameworks for the analysis ofmanufacturing ¯exibility, where managers are allowed
to delineate each of the types of ¯exibility with whichthey may be concerned.Both quantitative and qualitative approaches have
been followed when dealing with the measures of man-ufacturing ¯exibility types [14]. Quantitative physical
measures are based on actual production data (relatedto product, machines, processes, etc.). The relevant lit-
erature is extensive. Excellent reviews are presented[9,15,16].Two types of qualitative research can be identi®ed
based on whether perceptual scales are used or not. Inthe former case, major international surveys aimed atmeasuring ¯exibility investment and performance are
presented, for instance, in Refs. [17] and [18]. On theother hand, qualitative studies without perceptualscales have usually been placed in a framework in such
a way that ®rst the dimensions of change and the timehorizon are identi®ed, and then the critical elements of¯exibility are derived [2]. Dynamic equilibrium modelshave been used to visualize changes in external posi-
tioning, assessing the balance between ¯exibility andexternal uncertainty, and establishing long-term andshort-term action plans. These models have been used
together with audit checklists of external uncertaintyand manufacturing ¯exibility [19±21]. The practicalbene®ts of these studies include the provision of a less
ambiguous frame of reference for discussing the var-ious ¯exibilities the ®rm needs to manage.
2. Research framework and methodology
Two major objectives were pursued via the researchoutlined below. First, to gain an understanding of
which dimensions of manufacturing ¯exibility are per-ceived as being most e�ective and, as a consequence,are pursued by successful small and medium-sized®rms. Second, to explore the di�erent patterns of ¯exi-
bility search followed by the ®rms and relate these pat-terns to the characteristics of the ®rms and the natureof the industry where they operate.
The results presented in this paper are derived froma broad research program performed in three mainstages: initial survey design, questionnaire development
and data collection and analysis.
2.1. First stage: initial survey design
The ®rst stage was aimed at the identi®cation ofmajor dimensions of manufacturing ¯exibility and thegeneration of items able to capture the speci®c domain
of interest. An inductive approach was used to identifyitems for inclusion in the scales, and the available lit-erature was used to provide the theoretical foun-
dations.The ®rst step was aimed at splitting the overall con-
struct (manufacturing ¯exibility) into its component
subconstructs (dimensions). The attempt to classifymanufacturing ¯exibility has involved many research-ers (for an exhaustive review, see [15]). The problem
M. Braglia, A. Petroni / Omega 28 (2000) 195±213196

with many of these studies is that they either fail toprovide operational de®nitions of manufacturing ¯exi-
bility or consider the di�erent ¯exibility types at anaggregate level (de®ning a generic property of the man-ufacturing system rather than a speci®c attribute of it).
Since no conventionally accepted de®nition for manu-facturing ¯exibility types has been established, it is im-portant to summarize the operational de®nitions for
each type of ¯exibility.The dimensions of manufacturing ¯exibility con-
sidered for this study rely on a combination of the
manufacturing types as proposed in [8,13], since theseauthors have attempted to provide operational de®-nitions of a wide set of manufacturing ¯exibility types.The de®nitions of the subconstructs that were utilized
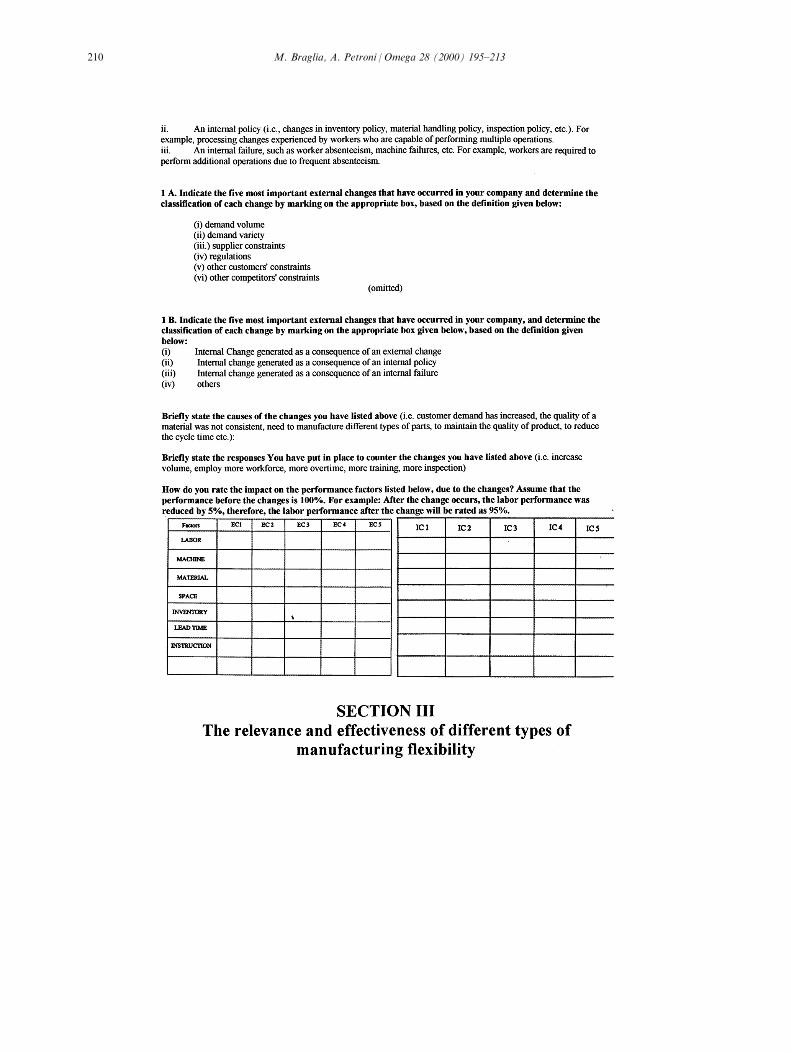
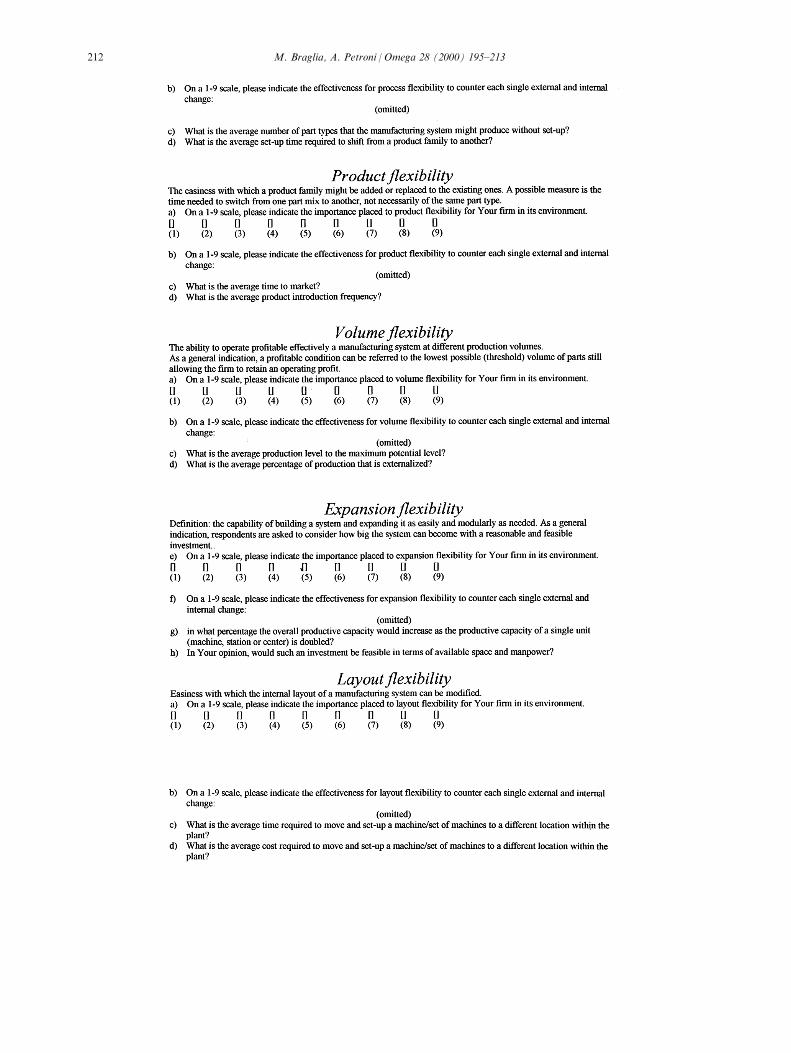
in the survey together with their speci®c measures arereported in the copy of the questionnaire which isshown in the appendix.
2.2. Second stage: questionnaire development
In the second stage, a population consisting of suc-
cessful small and medium-sized ®rms operating inmany industries was chosen. As concerns the size ofthe ®rms, the criterion was to include manufacturing
®rms with less than 250 employees and 20 millionsECU of aggregate sales. As for the `successful' attri-bute, the basic criteria for selecting the sample wasthat eligible ®rms should have had performances well
beyond the average industry-speci®c ®gures. Morespeci®cally, there were three basic requirements thathad to be met:
. +50% with respect to the yearly variation pro®tindex for the manufacturing sector;
. +20% with respect to the yearly variation pro-
duction index for the manufacturing sector;. +20% with respect to the yearly variation domestic
orders index for the manufacturing sector.
These cut-o� levels were agreed upon after indi-cations provided by two experts employed by theChamber of Commerce of Brescia. These ®gures were
drawn from the 1998 Joint Report of the samechamber of commerce.A ®nal population of 542 ®rms was obtained from
the database and 95 of these were approached through
personal contacts and following individual knowledgeof the experts. Six of them refused to be involved inthe research project and a ®nal sample of 89 ®rms was
obtained. The ®nal sample represented a wide spec-trum of activities within the mechanical industry (elec-tromechanical, components, machinery-building,
machining jobs), manufacturing practices (assembly,discrete parts manufacturing and machining), pro-duction type (one-of-a-kind, batch and mass pro-
duction) and commercialization type (catalogue, stock,job order).
In addition, in order to provide more complete in-formation for the hypothesis and render the prelimi-nary version of the questionnaire valid, `round table'
meetings were organized with eight CEOs from thesample. This stage proved to be particularly usefulsince it provided a direct insight into how speci®c
phenomena which came to the fore during the litera-ture survey found actual application in the industrialpractice within the context under investigation. This
activity pursued two distinct objectives: building aframework for a structured research hypothesis con-cerning determinants, modes and the e�ects of environ-mental changes in manufacturing ¯exibility practices
and, secondly, to decide upon which data should becollected in a subsequent questionnaire survey. Theresults of this process were edited for overlaps and rep-
etitions to produce a questionnaire with a ®nal list ofmore than 50 items. The structure of the questionnaireconsisted of three parts: the ®rst referred to the collec-
tion of general information, the second was aimed atinvestigating the basic characteristics of the competitivebase and the environmental features in which ®rms are
engaged, and the third concerned the perception of thee�ectiveness of the di�erent dimensions of manufactur-ing ¯exibility (subconstructs) in countering externaland internal stimuli and their relative level within the
®rm. Speci®cally, in the questionnaire, seven types ofmanufacturing ¯exibility were de®ned and describedand examples and explanations were provided to illus-
trate each particular ¯exibility type. A full samplecopy of the questionnaire is reported in the appendix.As for the questionnaire, some methodological notes
should be mentioned. Measurement for both Section 2and 3 of the questionnaire was made using discreteLikert-type scales. The number of points on the Likertscales was considered carefully, since reliability
increases as the number of scale points increases to ®veand continues to increase at a much smaller rate foradditional points above ®ve. Our choice to use 9-point
Likert scales followed Saaty's approach [22] used toestablish hierarchical priorities among perceptual state-ments thus making it possible to carry out further
analysis using the analytic hierarchy process.
2.3. Third stage: data collection and analysis
Finally, based on these two preliminary stages, a
questionnaire survey was presented to executives (pre-dominantly belonging to production functions, butalso including other technical functions) who were
identi®ed as being responsible for the strategic and op-erational management of the manufacturing processes.In the administration of the questionnaire, respondents
M. Braglia, A. Petroni / Omega 28 (2000) 195±213 197

were always assisted by at least one interviewer who,given the prevailing perceptual nature and the purpose
of the research, took the maximum possible care toavoid exerting any in¯uence on the respondent. Thepresence of an individual (who received thorough
training prior to the interview) helped avoid misinter-pretation of questions.Following this design, the study is illustrated in such
a way that, ®rst, a general description of the manufac-turing ¯exibility types considered and a classi®cationof environmental changes are provided. Then, overall
correlation between determinants and responses arepresented and discussed. Finally, a somewhat higher-level perspective will be taken which makes it possibleto pinpoint some signi®cant di�erences between ®rms
in the search patterns of manufacturing ¯exibility.
3. Phenomena observed
After collecting a large quantity of informationabout the ®rm's size, its market and productioncharacteristics, together with descriptions of the main
environmental changes that have occurred over the lastten years, respondents were asked to rate (on a 9-pointscale) the overall relevance and e�ectiveness of each
type of manufacturing ¯exibility for the ®rm as awhole.The ®rst important evidence is that, on average,
®rms look at manufacturing ¯exibility as an importantcompetitive tool (see the mean values of Table 1), andthat, moreover, there is a good knowledge of and
acquaintance with ¯exibility-related concepts. Whatemerges from the survey is that all dimensions of man-ufacturing ¯exibility are being increasingly exploited(except layout ¯exibility) and are becoming a matter of
survival for a host of ®rms even of limited size.As concerns the impact of each speci®c ¯exibility
type on the overall performance of the ®rm (measured
on a 9-point scale), ®gures vary according to the indus-try considered (Table 1). In particular, empirical ®nd-ings suggest that product ¯exibility is widely
acknowledged as an important performance factor inall four subindustries (reaching the highest mean scorefor the electromechanical sector), while machine, rout-ing and process ¯exibility seem to be largely recognized
as critical for machining ®rms as well as for com-ponents manufacturers. Volume and expansion ¯exi-bility are assigned a relatively high consideration by
machinery-building ®rms, while layout ¯exibility stilldoes not appear to draw much attention and concernfrom operations managers.
As far as the strategic use of manufacturing ¯exi-bility is concerned, even if beyond the scope of thisstudy, some ®ndings should be mentioned.
Among the major external and internal changes
which require a response in terms of manufacturing
¯exibility (Table 2), one should note those induced by
demand ¯uctuations (10.7% out of the overall number
of changes mentioned), customer satisfaction (12.4%),
competitors (10.5%), suppliers (6.8%) and institutions
(regulatory bodies and unions) (8.4%).
As far as the relationships between organizational
factors and manufacturing ¯exibility are concerned,
intangible factors, such as high involvement of workers
in problem-solving activities, close relationships with
suppliers, and ¯exible wage schemes, are associated
with greater process, volume, and product ¯exibility.
Finally, the ®eld analysis has also provided some
insights into the relationships between ¯exibility types,
and between them and internal uncertainty.
. Internal uncertainty is partly a result of external
uncertainty.
. More automation is associated empirically with less
¯exibility.
Table 1
Perceived strategic e�ectiveness of manufacturing ¯exibility
types
Industry N Mean Std. Deviation
Elettromechanical Machine 13 4.46 3.20
Routing 13 3.69 3.45
Process 13 6.85 2.76
Product 13 8.69 .63
Volume 13 7.08 2.53
Expansion 13 5.46 2.70
Layout 13 3.08 2.53
Components Machine 29 7.86 1.81
Routing 29 7.03 2.26
Process 29 6.31 2.78
Product 29 7.10 2.21
Volume 29 5.90 2.82
Expansion 29 5.07 3.12
Layout 29 3.76 2.64
Machining jobs Machine 10 8.70 .67
Routing 10 5.70 3.02
Process 10 7.50 1.65
Product 10 5.70 3.50
Volume 10 5.20 3.16
Expansion 10 4.60 3.06
Layout 10 3.60 2.50
Machinery-building Machine 34 5.47 3.35
Routing 34 3.12 2.58
Process 34 4.79 2.83
Product 34 7.53 1.74
Volume 34 7.21 2.33
Expansion 34 6.32 2.38
Layout 34 2.68 2.21
M. Braglia, A. Petroni / Omega 28 (2000) 195±213198

. Process and product ¯exibility are mutually reinfor-
cing and tend to be supported by similar factors.
. Process ¯exibility may reduce volume ¯uctuations
which, in theory, could reduce the need for volume
¯exibility.
. The possibility of reusing a component is signi®-
cantly correlated with high product mix require-
ments and product ¯exibility.
. Production reorganization prefers process reengi-
neering rather than layout redesign.
. Machine ¯exibility is shown to have a moderating
e�ect on process ¯exibility, but one which does not
necessarily cancel out the bene®ts of process ¯exibility.
4. Manufacturing ¯exibility: towards a taxonomy of
®rms
The third aim of the study, as pointed out earlier,was that of carrying out some meaningful classi®cationof ®rms based on their perception of the relevance and
Table 2
Environmental changes
Changesa Frequency Percent
Increased demand 34 5.5
Competitors' technological progress 32 5.2
Safety legislation 28 4.5
Increased product quality demanded by customers 22 3.6
Reduced delivery times demanded by customers 21 3.4
Job devision according to ISO norms 19 3.1
Increased product range demanded by customers 19 3.1
Lack of personnel competencies 18 2.9
Meaningful product/process innovation 18 2.9
Price competition 15 2.4
Product customization 14 2.3
Enhancement of controlling, testing and inspection systems 14 2.3
ISO registration 13 2.1
Reorganization of production 13 2.1
New production planning and control techniques 12 1.9
Re-organization of logistics 12 1.9
Increase of non-shop¯oor personnel (quality, inspection) 11 1.8
Reorganization of sales and post-sales 10 1.6
Market globalization 10 1.6
Demand reduction 9 1.5
Suppliers selection (reliability analysis) 9 1.5
Externalization of production phases 8 1.3
New materials/components 8 1.3
Impact on physical structures of quality program 8 1.3
Increase of customer number 7 1.1
Change of product mix 7 1.1
Stock reduction 7 1.1
Price ¯uctuations of raw materials 7 1.1
Suppliers collaboration/partnership 7 1.1
Reduction of delivery times from suppliers 6 1.0
Demand seasonality 6 1.0
Increase of production turns 6 1.0
Increase of shop-¯oor personnel 6 1.0
Tax and credit inducements for investment purposes 6 1.0
Smaller batches and more frequent delivery 5 .8
Union pressure 5 .8
Increase of suppliers number 5 .8
a Changes with more than ®ve counts have been included.
M. Braglia, A. Petroni / Omega 28 (2000) 195±213 199

e�ectiveness of the various types of manufacturing
¯exibility. With this purpose in mind, hierarchical clus-
tering analysis was conducted in order to identify the
critical features of homogeneous ®rms and intergroup
di�erences1. Distances among clusters were originally
measured using di�erent methodologies in order to
select the most appropriate one. Only two methods
(Ward's method and within-group linkages) proved to
be particularly e�ective for di�erentiation. Finally, the
most suitable method was found to minimize the incre-
ment of internal inertia within the clusters by Eucli-
dean distances. In choosing the number of clusters a
set of criteria were carefully considered: the analysis of
the rescaled distances in the dendrogram and of the
icicle (which are not reported in the interest of brevity)
and the impact of cluster con®gurations on the succes-
sive discriminant analysis. More speci®cally, the var-
iance explained by the (n ÿ 2) discriminant functions
were considered, where n is the number of clusters cho-
sen. With four clusters the ®rst two discriminant func-
tions explained 93.0% of variance, with ®ve clusters
three discriminant functions explained 95.6% of the
variance and with six clusters four discriminant func-
tions explained 91.8% of variance. Thus ®ve clustersof a homogeneous size were identi®ed (the number of®rms included in each cluster ranges from 16 to 20).
5. Description of clusters
Once each observation was ®tted into a cluster, the
complex phase of interpretation was carried out.Firstly in a more descriptive manner, and, then, morethoroughly through discriminant analysis. Fig. 1 illus-
trates the mean values of ¯exibility types as reportedby each cluster.The two horizontal lines have been drawn to indi-
cate the three value ranges:
(a) less than 3.5: low relevance;(b) 3.5 to 6.5: medium relevance;(c) more than 3.5: high relevance.
5.1. Cluster 1: ®rms responsive to all dimensions ofmanufacturing ¯exibility
Firms in this cluster are sensitive to all aspects ofmanufacturing ¯exibility, except for process and layout
¯exibility, and present the highest standard deviations.It should be emphasized that almost all cluster 1 ®rmshave attained UNI/EN 9000 quality certi®cation. This
indicates that compliance to normative regulationsoften implies, at least for more structured organiz-ations, a greater attention to managerial and organiz-
Fig. 1. Perceived e�ectiveness of ¯exibility types.
1 The unit of analysis was, then, the ®rm, which has been
distinguished according to the relevance granted to the seven
types of ¯exibility which have been outlined above. The i-th
observation corresponds to an ordered vector of the seven rel-
evance values (perceptual scores). Hierarchical cluster analysis
was used since this methodology is to be preferred when no
preliminary cluster de®nition and knowledge is attained.
M. Braglia, A. Petroni / Omega 28 (2000) 195±213200

ational aspects and, consequently, an increasing aware-
ness of competitive challenges such as ¯exibility.The cluster can be further split into two distinct sub-
groups.
The ®rst, consisting of component-manufacturersworking on a job order or production-for-inventory
basis, almost totally ignores process ¯exibility. Despitethe fact that their average size is highly variable, a sec-ond common feature is that they tend to establish
long-lasting relationships with many customers andsuppliers. In addition, such ®rms operate in an en-vironment which is de®ned as highly turbulent (in
terms of competitive pressure) but with medium levelsof uncertainty (the proxy for this variable is the degree
of demand predictability). Correlation analysis con-®rmed that, for this group of ®rms, the importancegranted to machine and routing ¯exibility increases as
annual sales variation increases. There also appears tobe a strong correlation between the degree of salesinternationalization and the perceived relevance of pro-
duct ¯exibility. This may be interpreted as the con®r-mation that innovation capabilities are acknowledged
as a critical condition for accessing new internationalmarkets. Summing up, ®rms of this group are ¯exi-bility-oriented, but production is largely product-
specialized and thus little e�ort is generally devoted tosigni®cantly modifying the production mix. The largenumber of customers together with the prevailing pro-
duction-for-inventory perspective adopted may par-tially justify a manufacturing strategy aimed at
curtailing customer contractual power and the ®rm'sdegree of dependence on customer expectations.A second group of cluster 1 ®rms is particularly
keen on process ¯exibility. This group is less homo-geneous than the ®rst group but, nonetheless, presents
some obvious common features. The ®rms are mainlymedium-sized machinery-manufacturers, but, unlikethe previous group, production is exclusively of the
one-of-a-kind type. Products are generally of highercomplexity and the competitive environment is verytough. These companies operate on the global market
and tender-based competition means that their evalu-ation by clients is not only based on the quality of the
®nal product (which is generally customized) but alsoupon the process followed to develop it. This meansthat ®rms in this group generally establish closer re-
lationships with customers and take care to continuallyupdate their production mix (this variable has beenproxied by the nature of demand change). It is also
interesting to note that these ®rms often reportdemand and customer satisfaction-related changes, but
seldom a meaningful product/process innovation. Sum-ming up, it is clear that the competitive environment ischaracterized to a signi®cant extent by incremental
rather than radical technological adjustments, requir-ing rapid responses.
5.2. Cluster 2: machine ¯exibility-oriented ®rms
Firms belonging to cluster 2 distinguish themselves
primarily for the importance given to machine ¯exi-bility, which, in fact, presents the lowest standard devi-ation. Another feature is the negligible weight assigned
to routing ¯exibility. Firms are mainly of small sizeand declare that they operate in a very tough competi-tive environment (average score: 8.07). It was ascer-
tained that most of ®rms have made substantialreplacement investments, mainly aimed at equippingtheir machinery with multipurpose tools. Furthermore,not a single ®rm of cluster 2 reported any changes re-
lated to production reorganization. This may be due toboth their reduced size and production saturation con-ditions. The former aspect implies that scarce attention
is given to the possibility of process and layout ration-alization, since it is clearly impossible for these ®rmsto establish appropriate bottleneck redundancies and
duplications of operation assignments. The latteraspect, which is due to the need to have a full returnon the investment, reduces the possibility of placingdi�erent jobs on di�erent machines (which are usually
already overloaded).Cluster 2 can also be subdivided into two groups.
The ®rst includes ®rms reporting high machine and
volume ¯exibility and low routing and expansion ¯exi-bility. This is in keeping with a situation wherebyannual sales ¯uctuations are not particularly signi®cant
(hence the low relevance of expansion ¯exibility), eventhough there are considerable monthly swings of bothvolume and production mix. Among the ®rms which
are machine ¯exibility-inclined one ®nds those thatconsider technology as the most important lever whenfacing a rather unstable market.The second group of ®rms all nominated, in addition
to machine ¯exibility, both product and expansion¯exibility as top priorities. Generally these organiz-ations operate on an international scenario and their
production is either of the one-of-a-kind type or cata-logue order-to-assembly type. It is worth noting thatthe vast majority of these ®rms are machinery manu-
facturers. New product development capability is criti-cal for international competition and is favored by thefact that the machinery set-up times and costs are rela-tively low. It is interesting to observe that the percep-
tion of the importance of process ¯exibility rises as thenumber of customers increases. This is because the suc-cess of these ®rms is strictly dependent on meeting cus-
tomers' technical speci®cations: the higher the latterare, the greater the product versatility.
5.3. Cluster 3: Innovation-oriented ®rms
Taking a closer look at Fig. 1, product ¯exibility
M. Braglia, A. Petroni / Omega 28 (2000) 195±213 201
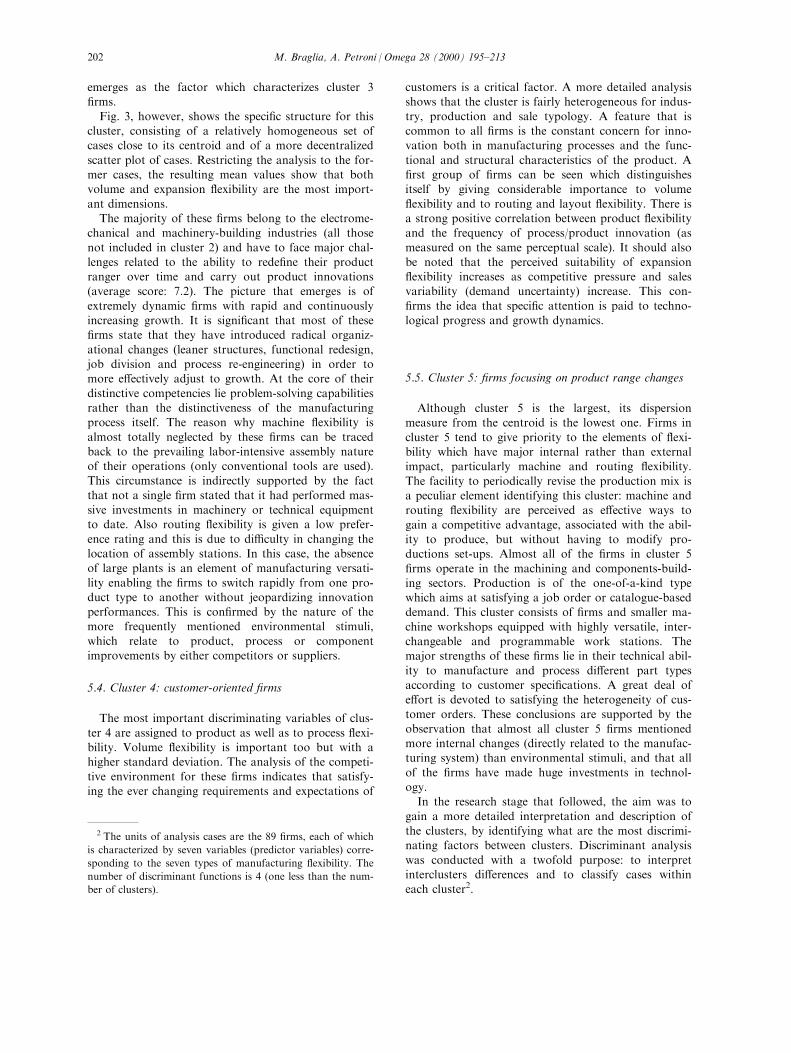
emerges as the factor which characterizes cluster 3®rms.
Fig. 3, however, shows the speci®c structure for thiscluster, consisting of a relatively homogeneous set ofcases close to its centroid and of a more decentralized
scatter plot of cases. Restricting the analysis to the for-mer cases, the resulting mean values show that bothvolume and expansion ¯exibility are the most import-
ant dimensions.The majority of these ®rms belong to the electrome-
chanical and machinery-building industries (all those
not included in cluster 2) and have to face major chal-lenges related to the ability to rede®ne their productranger over time and carry out product innovations(average score: 7.2). The picture that emerges is of
extremely dynamic ®rms with rapid and continuouslyincreasing growth. It is signi®cant that most of these®rms state that they have introduced radical organiz-
ational changes (leaner structures, functional redesign,job division and process re-engineering) in order tomore e�ectively adjust to growth. At the core of their
distinctive competencies lie problem-solving capabilitiesrather than the distinctiveness of the manufacturingprocess itself. The reason why machine ¯exibility is
almost totally neglected by these ®rms can be tracedback to the prevailing labor-intensive assembly natureof their operations (only conventional tools are used).This circumstance is indirectly supported by the fact
that not a single ®rm stated that it had performed mas-sive investments in machinery or technical equipmentto date. Also routing ¯exibility is given a low prefer-
ence rating and this is due to di�culty in changing thelocation of assembly stations. In this case, the absenceof large plants is an element of manufacturing versati-
lity enabling the ®rms to switch rapidly from one pro-duct type to another without jeopardizing innovationperformances. This is con®rmed by the nature of themore frequently mentioned environmental stimuli,
which relate to product, process or componentimprovements by either competitors or suppliers.
5.4. Cluster 4: customer-oriented ®rms
The most important discriminating variables of clus-
ter 4 are assigned to product as well as to process ¯exi-bility. Volume ¯exibility is important too but with ahigher standard deviation. The analysis of the competi-
tive environment for these ®rms indicates that satisfy-ing the ever changing requirements and expectations of
customers is a critical factor. A more detailed analysisshows that the cluster is fairly heterogeneous for indus-
try, production and sale typology. A feature that iscommon to all ®rms is the constant concern for inno-vation both in manufacturing processes and the func-
tional and structural characteristics of the product. A®rst group of ®rms can be seen which distinguishesitself by giving considerable importance to volume
¯exibility and to routing and layout ¯exibility. There isa strong positive correlation between product ¯exibilityand the frequency of process/product innovation (as
measured on the same perceptual scale). It should alsobe noted that the perceived suitability of expansion¯exibility increases as competitive pressure and salesvariability (demand uncertainty) increase. This con-
®rms the idea that speci®c attention is paid to techno-logical progress and growth dynamics.
5.5. Cluster 5: ®rms focusing on product range changes
Although cluster 5 is the largest, its dispersionmeasure from the centroid is the lowest one. Firms in
cluster 5 tend to give priority to the elements of ¯exi-bility which have major internal rather than externalimpact, particularly machine and routing ¯exibility.
The facility to periodically revise the production mix isa peculiar element identifying this cluster: machine androuting ¯exibility are perceived as e�ective ways to
gain a competitive advantage, associated with the abil-ity to produce, but without having to modify pro-ductions set-ups. Almost all of the ®rms in cluster 5
®rms operate in the machining and components-build-ing sectors. Production is of the one-of-a-kind typewhich aims at satisfying a job order or catalogue-baseddemand. This cluster consists of ®rms and smaller ma-
chine workshops equipped with highly versatile, inter-changeable and programmable work stations. Themajor strengths of these ®rms lie in their technical abil-
ity to manufacture and process di�erent part typesaccording to customer speci®cations. A great deal ofe�ort is devoted to satisfying the heterogeneity of cus-
tomer orders. These conclusions are supported by theobservation that almost all cluster 5 ®rms mentionedmore internal changes (directly related to the manufac-turing system) than environmental stimuli, and that all
of the ®rms have made huge investments in technol-ogy.In the research stage that followed, the aim was to
gain a more detailed interpretation and description ofthe clusters, by identifying what are the most discrimi-nating factors between clusters. Discriminant analysis
was conducted with a twofold purpose: to interpretinterclusters di�erences and to classify cases withineach cluster2.
2 The units of analysis cases are the 89 ®rms, each of which
is characterized by seven variables (predictor variables) corre-
sponding to the seven types of manufacturing ¯exibility. The
number of discriminant functions is 4 (one less than the num-
ber of clusters).
M. Braglia, A. Petroni / Omega 28 (2000) 195±213202

6. Interpreting interclusters di�erences
A study of the way clusters di�er was conducted in
order to (i) discriminate between groups using a
speci®c set of characteristics, (ii) establish to what
extent actual di�erences are included and (iii) decide
which discriminant functions are most e�ective.
A four-dimension graphic representation of the situ-
ation would be impossible.
Eigenvalues and cumulative function discriminant
power were, therefore, used to select the more repre-
sentative functions (Table 3).
As illustrated, function 1 and 2 count for almost
87% of the overall discriminant power. If function 4 is
also considered, nearly all of the di�erences between
the clusters can be explained (more than 95%).
In this case, a two-dimension chart is su�cient to
reveal meaningful information (Fig. 2).
A closer look at Fig. 2 reveals that along function 1
(the most discriminating function) cluster 5 is posi-
tioned at the right end of the horizontal axis while
cluster 3 is at the opposite end. The cluster 3 centroid
is 3.5 standard deviations o� the axis origin (i.e. the
mean of the whole sample) while the cluster 5 centroid
is positioned almost 3.5 standard deviations o� the
overall centroid. Both clusters are, therefore, quite dis-
tant each other. A closer look at the di�erences
between cluster 5 and cluster 3 may make it possible
to learn more about the meaning of function 1.
As far as function 2 is concerned, it is evident that
in the vertical direction all clusters are positioned very
close to the origin. Their distances from the origin is
less than 1 standard deviation, except for cluster 2
which has an abnormal behavior because it is posi-
tioned more than two standard deviations o� the over-
all centroid. Further investigation would be helpful in
order to understand what determines this peculiarity.
The third row of Table 7 suggests that, along function
3, cluster 1 presents an exceptional behavior (even
though to a lesser extent than in the former cases, its
Table 3
Eigenvalues and discriminant power of functions
Canonical discriminant function Eigenvalue Relative percentage Cumulative percentage
1 5.380 69.7 69.7
2 1.311 17.0 86.7
3 0.686 8.9 95.6
4 0.338 4.4 100.0
Fig. 2. Representation of clusters.
M. Braglia, A. Petroni / Omega 28 (2000) 195±213 203
distance from the origin being only 1.5 standard devi-
ations). The deviation of function 4 is even less accen-tuated.
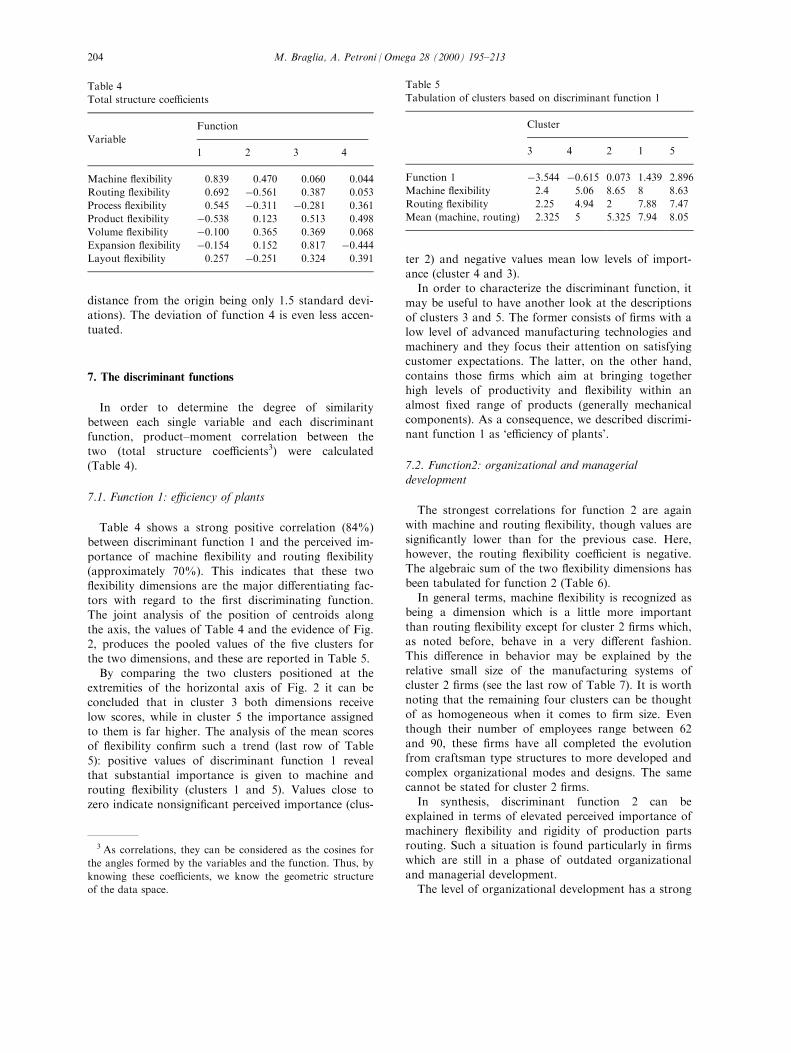
7. The discriminant functions
In order to determine the degree of similarity
between each single variable and each discriminantfunction, product±moment correlation between thetwo (total structure coe�cients3) were calculated
(Table 4).
7.1. Function 1: e�ciency of plants
Table 4 shows a strong positive correlation (84%)between discriminant function 1 and the perceived im-portance of machine ¯exibility and routing ¯exibility
(approximately 70%). This indicates that these two¯exibility dimensions are the major di�erentiating fac-tors with regard to the ®rst discriminating function.
The joint analysis of the position of centroids alongthe axis, the values of Table 4 and the evidence of Fig.2, produces the pooled values of the ®ve clusters for
the two dimensions, and these are reported in Table 5.By comparing the two clusters positioned at the
extremities of the horizontal axis of Fig. 2 it can beconcluded that in cluster 3 both dimensions receive
low scores, while in cluster 5 the importance assignedto them is far higher. The analysis of the mean scoresof ¯exibility con®rm such a trend (last row of Table
5): positive values of discriminant function 1 revealthat substantial importance is given to machine androuting ¯exibility (clusters 1 and 5). Values close to
zero indicate nonsigni®cant perceived importance (clus-
ter 2) and negative values mean low levels of import-ance (cluster 4 and 3).In order to characterize the discriminant function, it
may be useful to have another look at the descriptionsof clusters 3 and 5. The former consists of ®rms with alow level of advanced manufacturing technologies andmachinery and they focus their attention on satisfying
customer expectations. The latter, on the other hand,contains those ®rms which aim at bringing togetherhigh levels of productivity and ¯exibility within an
almost ®xed range of products (generally mechanicalcomponents). As a consequence, we described discrimi-nant function 1 as `e�ciency of plants'.
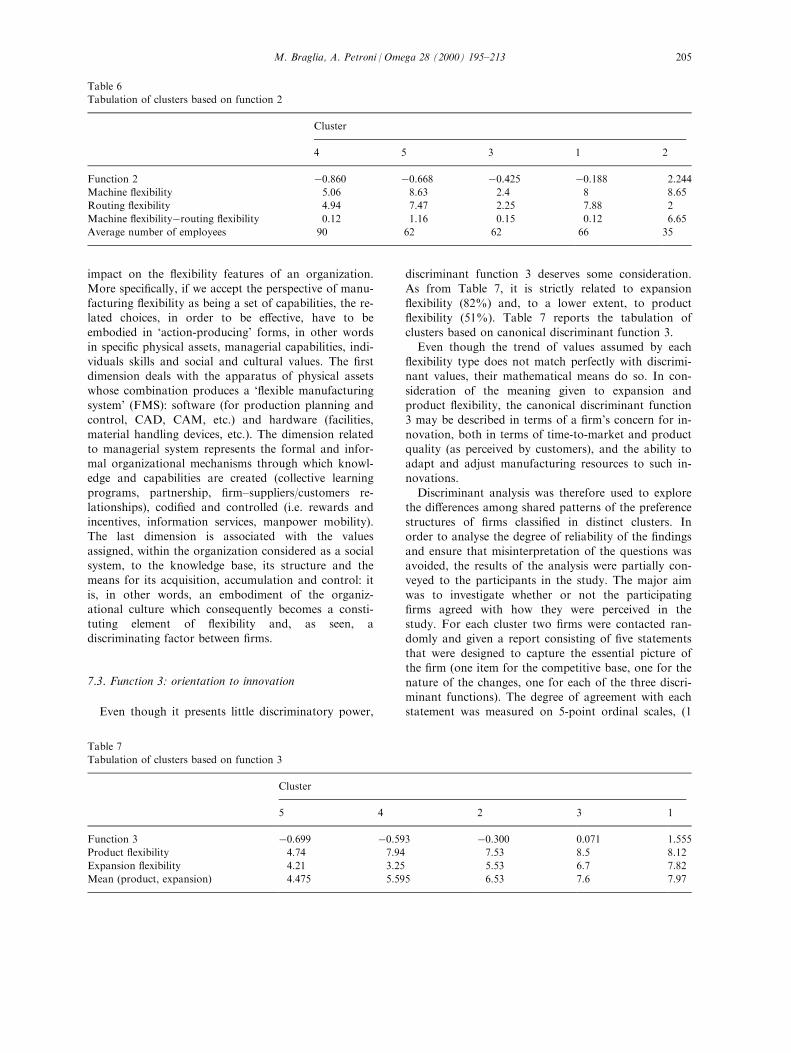
7.2. Function2: organizational and managerialdevelopment
The strongest correlations for function 2 are again
with machine and routing ¯exibility, though values aresigni®cantly lower than for the previous case. Here,however, the routing ¯exibility coe�cient is negative.
The algebraic sum of the two ¯exibility dimensions hasbeen tabulated for function 2 (Table 6).In general terms, machine ¯exibility is recognized as
being a dimension which is a little more important
than routing ¯exibility except for cluster 2 ®rms which,as noted before, behave in a very di�erent fashion.This di�erence in behavior may be explained by the
relative small size of the manufacturing systems ofcluster 2 ®rms (see the last row of Table 7). It is worthnoting that the remaining four clusters can be thought
of as homogeneous when it comes to ®rm size. Eventhough their number of employees range between 62and 90, these ®rms have all completed the evolutionfrom craftsman type structures to more developed and
complex organizational modes and designs. The samecannot be stated for cluster 2 ®rms.In synthesis, discriminant function 2 can be
explained in terms of elevated perceived importance ofmachinery ¯exibility and rigidity of production partsrouting. Such a situation is found particularly in ®rms
which are still in a phase of outdated organizationaland managerial development.The level of organizational development has a strong
Table 4
Total structure coe�cients
Variable
Function
1 2 3 4
Machine ¯exibility 0.839 0.470 0.060 0.044
Routing ¯exibility 0.692 ÿ0.561 0.387 0.053
Process ¯exibility 0.545 ÿ0.311 ÿ0.281 0.361
Product ¯exibility ÿ0.538 0.123 0.513 0.498
Volume ¯exibility ÿ0.100 0.365 0.369 0.068
Expansion ¯exibility ÿ0.154 0.152 0.817 ÿ0.444Layout ¯exibility 0.257 ÿ0.251 0.324 0.391
Table 5
Tabulation of clusters based on discriminant function 1
Cluster
3 4 2 1 5
Function 1 ÿ3.544 ÿ0.615 0.073 1.439 2.896
Machine ¯exibility 2.4 5.06 8.65 8 8.63
Routing ¯exibility 2.25 4.94 2 7.88 7.47
Mean (machine, routing) 2.325 5 5.325 7.94 8.05
3 As correlations, they can be considered as the cosines for
the angles formed by the variables and the function. Thus, by
knowing these coe�cients, we know the geometric structure
of the data space.
M. Braglia, A. Petroni / Omega 28 (2000) 195±213204
impact on the ¯exibility features of an organization.More speci®cally, if we accept the perspective of manu-
facturing ¯exibility as being a set of capabilities, the re-lated choices, in order to be e�ective, have to beembodied in `action-producing' forms, in other wordsin speci®c physical assets, managerial capabilities, indi-
viduals skills and social and cultural values. The ®rstdimension deals with the apparatus of physical assetswhose combination produces a `¯exible manufacturing
system' (FMS): software (for production planning andcontrol, CAD, CAM, etc.) and hardware (facilities,material handling devices, etc.). The dimension related
to managerial system represents the formal and infor-mal organizational mechanisms through which knowl-edge and capabilities are created (collective learning
programs, partnership, ®rm±suppliers/customers re-lationships), codi®ed and controlled (i.e. rewards andincentives, information services, manpower mobility).The last dimension is associated with the values
assigned, within the organization considered as a socialsystem, to the knowledge base, its structure and themeans for its acquisition, accumulation and control: it
is, in other words, an embodiment of the organiz-ational culture which consequently becomes a consti-tuting element of ¯exibility and, as seen, a
discriminating factor between ®rms.
7.3. Function 3: orientation to innovation
Even though it presents little discriminatory power,
discriminant function 3 deserves some consideration.As from Table 7, it is strictly related to expansion
¯exibility (82%) and, to a lower extent, to product¯exibility (51%). Table 7 reports the tabulation of
clusters based on canonical discriminant function 3.Even though the trend of values assumed by each
¯exibility type does not match perfectly with discrimi-nant values, their mathematical means do so. In con-
sideration of the meaning given to expansion andproduct ¯exibility, the canonical discriminant function3 may be described in terms of a ®rm's concern for in-
novation, both in terms of time-to-market and productquality (as perceived by customers), and the ability to
adapt and adjust manufacturing resources to such in-novations.
Discriminant analysis was therefore used to explorethe di�erences among shared patterns of the preference
structures of ®rms classi®ed in distinct clusters. Inorder to analyse the degree of reliability of the ®ndings
and ensure that misinterpretation of the questions wasavoided, the results of the analysis were partially con-veyed to the participants in the study. The major aim
was to investigate whether or not the participating®rms agreed with how they were perceived in the
study. For each cluster two ®rms were contacted ran-domly and given a report consisting of ®ve statements
that were designed to capture the essential picture ofthe ®rm (one item for the competitive base, one for the
nature of the changes, one for each of the three discri-minant functions). The degree of agreement with eachstatement was measured on 5-point ordinal scales, (1
Table 6
Tabulation of clusters based on function 2
Cluster
4 5 3 1 2
Function 2 ÿ0.860 ÿ0.668 ÿ0.425 ÿ0.188 2.244
Machine ¯exibility 5.06 8.63 2.4 8 8.65
Routing ¯exibility 4.94 7.47 2.25 7.88 2
Machine ¯exibilityÿrouting ¯exibility 0.12 1.16 0.15 0.12 6.65
Average number of employees 90 62 62 66 35
Table 7
Tabulation of clusters based on function 3
Cluster
5 4 2 3 1
Function 3 ÿ0.699 ÿ0.593 ÿ0.300 0.071 1.555
Product ¯exibility 4.74 7.94 7.53 8.5 8.12
Expansion ¯exibility 4.21 3.25 5.53 6.7 7.82
Mean (product, expansion) 4.475 5.595 6.53 7.6 7.97
M. Braglia, A. Petroni / Omega 28 (2000) 195±213 205
for `very low agreement', 5 for `very high agreement').The mean scores for the ten ®rms are:
®rm 1 4.0®rm 2 4.2
®rm 3 4.0®rm 4 4.2®rm 5 4.4
®rm 6 3.4®rm 7 4.4®rm 8 4.0
®rm 9 4.0®rm 10 4.0
The results are quite satisfactorily in all cases exceptfor ®rm 6 of cluster 3 which has reported a low level
of agreement.
8. Classifying cases within each cluster
The successive goal was to get a deeper understand-
ing of how discriminant functions are related to thevariables within the groups. This information wasobtained from the pooled within group correlations.
By analysing the within structure coe�cients (whichare not reported in the interests of brevity), it can benoticed that they are smaller than the total structure
coe�cients but the rankings from the largest absolutemagnitude to the smallest are similar in both cases(although not identical). For example, routing ¯exi-
bility in function 3 has a total coe�cient of 0.387 anda within coe�cient of 0.5. This is a typical result butnot a necessary condition. These two sets of coe�-cients report on di�erent kinds of structures, so we
should not expect them to lead to the same interpret-ation.For the ®rst two canonical discriminant functions,
however, relations between variables (particularly ma-chine and routing ¯exibility) almost re¯ect those pin-pointed by total structure coe�cients. The
interpretations of discriminant functions sketched pre-viously are, therefore, applicable to within groupsanalysis. In the following paragraph the behavior ofthe ®ve clusters is depicted more analytically.
As far as cluster 1 is concerned, one should note itslimited dispersion (Fig. 3) if few outliers positionedalong the vertical axis (organizational development)
are not considered.Cluster 2 is rather compact, as can be seen in Fig. 3,
especially along function 2. One must not be deceived
from the mean values of machine and routing ¯exi-bility which are due to the combination of high valuesof the former and low values of the latter.
In a sense, ®rms belonging to cluster 2 rank betweenthose that are highly mechanised and those that are
mainly labor-intensive, since they can count on theavailability of advanced manufacturing technologiesand machinery, which are, because of their limited
number, permanently overloaded.Also cluster 3 is fairly condensed, despite the evi-
dence from Euclidean distances analysis. The centroid
is excessively right-shifted due to the presence of out-liers: this implies that the behavior of the most repre-sentative cases is actually even more distant from that
exempli®ed by the centroid (this fact was supported bythe descriptive analysis). It is important to note thatthis cluster has been described as `innovation-oriented'according to both descriptive and discriminant analy-
sis: cluster 3 assumes high but not top values withregard to discriminant function 3 (orientation to inno-vation ) with cluster 1 scoring approximately twice as
much. The reason for this is to be found in the factthat the innovative approach of these ®rms is only par-tial since they seem to privilege demand±pull adjust-
ments of operations (mainly product-related), in otherwords those which are directly perceived by customers,rather than internal ones.
Firms belonging to cluster 4, on the other hand,may be considered to be in an intermediate positionwith regard to function 1 and function 2 since theyshow a massive dispersion around the origin.
Finally, the behavior of cluster 5 may be bestcharacterised in view of the properties of discriminantfunction 1.
9. Summary of results
This study has helped to get a better insight into the
patterns of manufacturing ¯exibility in SMEs. Havinggiven a general description of changes which haveoccurred in the external environment of companies
and the ¯exibility responses they have used to counterthese, it is now possible to take a higher-level perspec-tive and try to sum up the determinants for the di�er-
ences in the behavior of ®rms. First, the pro®le of thecompanies in the sample has been discussed on thebasis of their original membership to di�erent groups.Each group was characterised by a unique combi-
nation of manufacturing ¯exibility levers which wererelated to the basic characteristics of the competitivebase and the environment in which the ®rms are
engaged. These ®ndings have, in other words, sup-ported the hypothesis that ®rms behave in a ®rm-speci®c and situation-speci®c fashion when combining
resources and distinctive capabilities to provide e�ec-tive responses to environmental stimuli. The ®ndingsobtained when the determinants for such di�erent
M. Braglia, A. Petroni / Omega 28 (2000) 195±213206

Fig.3.Clusters'sdispersion.
M. Braglia, A. Petroni / Omega 28 (2000) 195±213 207
behaviors were investigated via discriminant analysiswere much more general. An important ®nding is that
the strongest determinant is operations e�ciency. Itseems as if most of the companies in the industriesconsidered are mainly concerned with reaching cost
di�erentials which cannot be found in workforce ¯exi-bility due to the peculiar characteristics of the Italianlabor market. A further determinant refers to the
degree of maturity of ®rms in terms of managerialcompetence and organisational development. This factsuggests the existence of low-structured `interstitial'
®rms that are probably spin-o�s from major compa-nies and tend to exploit commercial ¯exibility andmarket prompt adaptation rather than operations ¯exi-bility on the shop ¯oor.
The relevance of product innovation search in deter-mining the di�erences in the patterns of manufacturing¯exibility is very modest, and this was rather a sur-
prise. This may be partially due to the fact the vastmajority of the ®rms in the sample are componentsmanufacturers supplying a few customers. Tradition-
ally many of them (except for ®rms in cluster 5) didnot even have, until recently, true product developmentresponsibilities. They usually received detailed draw-
ings from the customers' designers and their main con-cern was to manage shop ¯oor operations.
10. Conclusions
Manufacturing ®rms world-wide are investing in¯exibility to e�ciently and e�ectively adapt to external
forces. Manufacturing ¯exibility allows ®rms to quicklyput into use novel technologies, counter new consumerdemands and deal with legislative and social climates
that may di�er in particular industrial and geographi-cal areas.The perception of the increasing importance of man-
ufacturing ¯exibility and its actual use has focused
attention on the need for measures which indicate towhat extent the related concepts are acknowledged inan organizational context.
The roots of manufacturing ¯exibility performancein an organization is based on its capacity to respondto environmental changes. The environment in which
an organization must operate is fraught with uncer-
tainty and turbulence. The sources of uncertainty and
turbulence are related to changes in customers' require-
ments and tastes, increased competition, technological
change and socio-economic issues. Some of the turbu-
lence is also due to internal factors as ®rm-speci®c
resources, organizational capabilities change and
evolve over time.
In this paper the capacity of an organization to con-
sistently achieve high performance levels has been
linked to its ability to anticipate or respond to such
changes which will centre, in the manufacturing
domain, on the ®rm's ability to modify its use of tangi-
ble a well as intangible resources.
This paper illustrates an attempt to address the issue
of building a taxonomy of ®rm behaviors in terms of
manufacturing ¯exibility choices. For this reason a
questionnaire survey was conducted on 89 small and
medium-sized ®rms which had a threefold aim: investi-
gating the prevailing nature of environmental changes
which require suitable responses, perceptually measur-
ing the relative appropriateness of some opportunely
operationalized manufacturing ¯exibility concepts and,
®nally, building a taxonomy of ®rms which could pro-
vide some indirect insights into the ®rm-speci®c search
patterns for manufacturing ¯exibility.
From the analysis two factors emerge as the most
discriminating among the organizational approaches to
manufacturing ¯exibility. These are, the importance
given to machine as well as to routing ¯exibility and,
to a lesser extent, the perceived relevance of expansion
and product ¯exibility.
Discriminant analysis has helped to re®ne these con-
clusions, bringing to some further factors. The two
most discriminating functions are represented by the
e�ciency of plant operations and the organizational
and managerial development of a ®rm. It follows that
the analysis emphasizes peculiar relationships; on the
one hand, between manufacturing ¯exibility and
machining productivity and, on the other hand,
between ¯exibility and innovation (both technological
and organizational). This leads to the conclusion that
exogenous determinants of ¯exibility, adoption of
innovative technologies, organizational development
and managerial practices interact in a fairly complex
fashion and adapt themselves to a changing competi-
tive environment.
M. Braglia, A. Petroni / Omega 28 (2000) 195±213208

Appendix A
M. Braglia, A. Petroni / Omega 28 (2000) 195±213 209
M. Braglia, A. Petroni / Omega 28 (2000) 195±213210

M. Braglia, A. Petroni / Omega 28 (2000) 195±213 211
M. Braglia, A. Petroni / Omega 28 (2000) 195±213212
References
[1] Gerwin D. Manufacturing ¯exibility: a strategic perspec-
tive. Manage Sci 1993;39:395±410.
[2] Swamidass PM, Newell WT. Manufacturing strategy, en-
vironmental uncertainty and performance: a path ana-
lytic model. Manage Sci 1987;EM-34:85±91.
[3] Slack N. Flexibility as a manufacturing objective. Int J
Operations Production Manage 1983;3:4±13.
[4] Das SK. The measurement of ¯exibility in manufacturing
systems. Int J Flexible Manufacturing Sys 1996;8:67±93.
[5] Suarez FF, Cusumano MA, Fine CH. An empirical
study of ¯exibility in manufacturing. Sloan Manage Rev
1995;37:25±32.
[6] McGraith, Hoole. Manufacturing's new economies of
scale. Harv Business Rev 1992;70:94±102.
[7] Boyer KK, Leong GK. Manufacturing ¯exibility at the
plant level. Omega 1996;24:495±510.
[8] Browne J, Dubois D, Rathmill K, Sethi SP, Stecke KE.
Classi®cation of ¯exible manufacturing systems. The
FMS Mag 1984;2:114±7.
[9] Sarker B, Krishnamurthy K, Kuthethur SG. A survey
and critical review of ¯exibility measures in manufactur-
ing systems. Production Planning Control 1994;5:512±23.
[10] Slack N. The ¯exibility of manufacturing systems. Int J
Operations Production Manage 1987;7:35±45.
[11] Cusumano MA, Fine CH, Suarez FF. An empirical
study of manufacturing ¯exibility in printed circuit board
assembly. Operations Res 1996;44:223±40.
[12] Nelson RR, Winter SG. In: Nelson RR, Winter SG, edi-
tors. An evolutionary theory of economic change.
Cambridge: Harvard University Press, 1982.
[13] Gupta D, Buzacott JA. A framework for understanding
¯exibility of manufacturing systems. J Manufacturing
Sys 1989;8:89±97.
[14] Brill PH, Mandelbaum M. On measures of ¯exibility in
manufacturing systems. Int J Production Res
1989;27:747±56.
[15] Gupta YP, Goyal S. Flexibility of manufacturing sys-
tems: concepts and measurements. Eur J Operational Res
1989;43:119±35.
[16] Sethi AK, Sehti SP. Flexibility in manufacturing: a sur-
vey. Int J Flexible Manufacturing Sys 1990;2:289±328.
[17] Whyrback DC, Wastag G, editors. Global manufacturing
practices. New York: Elsevier, 1993.
[18] Manufacturing features survey. Boston Manufacturing
Roundtable, Boston University School of Management,
1994.
[19] Abdel-Malek L. A methodology to design ¯exible pro-
duction solutions. In: Tenth International Working
Seminar on Production Economics. Igls/Insbruck,
Austria, February. 1998.
[20] Newman WR, Hanna M, Ma�ei MJ. Dealing with the
uncertainties of manufacturing: ¯exibility, bu�ers and in-
tegration. Int J Operations Production Manage
1993;13:19±34.
[21] Upton DM. The management of manufacturing ¯exi-
bility. California Manage Rev 1994;36:72±89.
[22] Saaty P. Fundamentals of decision making and priority
theory with the analytic hierarchy process. Pittsburgh,
PA: RWS Publication, 1994.
M. Braglia, A. Petroni / Omega 28 (2000) 195±213 213