tools for crop water irrigation assessment: two italian examples
TRANSCRIPT

Tools for Crop Water Irrigation Assessment: Two Italian
Examples
Nino P., Lupia F., Altobelli F., Vanino S., Namdarian Iraj
Istituto Nazionale di Economia Agraria (INEA), Via Nomentana 41, 00161 Roma
Abstract. Agriculture is the largest user of water on the planet with a 70% of
all freshwater withdrawals. Today the growing scarcity and competition for
water among agricultural, industrial, commercial and residential sectors are
pushing the water managers to allocate water more efficiently. In this scenario
the use of methodologies and tools for better monitor and schedule the irrigation
water for the agricultural sector are becoming relevant in the decision making
process. In this paper two tools for calculating the crop irrigation requirements
are proposed. The tools determinates, based on the complex relationships of the
system soil-plant-atmosphere, the quantities and timing of water to be granted to
meet the crops needs. The tools, developed by the Italian Institute for
Agricultural Economics, are called Bilancio and MARSALa. Bilancio was
realized for estimating the irrigation needs at parcel level for the Reclamation
and Irrigation Consortia located in Southern Italy. MARSALa was developed for
the estimation of the irrigation water consumption at farm level for the whole
Italian farm universe by using, as a key source of information, the 2010 Italian
Agriculture Census.
Keywords irrigation; crop water requirement, water management.
1 Introduction
The use of water for food production is the largest market share among all other
uses and its demand is continuously increasing with population growth. Agriculture
is the largest consumer of water on the planet with about 70% of all water
withdrawals and in the EU as whole, 24% of abstracted water is used in agriculture
and in particular in some regions of southern Europe agriculture water consumption
rises to more than 80% of the total national abstraction (EEA Report No 2/2009).
Over the last two decades agricultural water use has increased driven both by the fact
that farmers have seldom had to pay for the real cost of the water and for the
Common Agricultural Policy (CAP), having often provided subsides to produce
water-intensive crops with low-efficiency techniques. As for the majority of the
Mediterranean countries, irrigation represents for Italy one of the most relevant
pressures on the environment in terms of use of water due to the occurrence of hot
and dry season causing increased water demand to maintain the optimal growing
conditions for some valuable crops species. Future scenarios are expected to be
worse due to climate change that might intensify problems of water scarcity and
irrigation requirements in the Mediterranean region (IPCC 2007, Goubanova and Li
2006, Rodriguez Diaz et al. 2007). Accurately estimating the irrigation demands (as
______________________________Copyright Éby the paperôs authors. Copying permitted only for private and academic purposes. In: M. Salampasis, A. Matopoulos (eds.): Proceedings of the International Conference on Information and Communication Technologies for Sustainable Agri-production and Environment (HAICTA 2011), Skiathos, 8-11 September, 2011.
851

well as those of the other water uses) is therefore a key requirement for more precise
water management (Maton et al. 2005) and a large scale overview on European water
use can contribute to developing suitable policies and management strategies. So far,
the main policy objectives in relation to water use and water stress at EU level, set
out in the 6th Environment Action Programme (EAP) (1600/2002/EC) and the Water
Framework Directive (WFD, 2000/60/EC), aim at ensuring a sustainable use of water
resources. In the last decade scientific research has carried out several studies of
devising different methodologies and tools for crop water irrigation estimation, based
on a better assessment of spatial and temporal variability of water exchanges between
crop and atmosphere through the process of evapotranspiration (ET). Some methods
are based on direct measurement such as micro-meteorological, used in tree crops or
high vegetation (i.e. Eddy-covariance, Surface Renewal or Scintillometry methods).
However, the complexity of instrumentation and procedures for data analysis led to
the development of simpler methods to be used in operational contexts related to the
Water Resources management, such as remote sensing techniques and soil water
balance models. Due to the strong physical relationship between the spectral response of
cropped surfaces and the corresponding values of evapotranspiration and crop coefficient
Kc, during recent years different methodologies have been sought to estimate crop
evapotranspiration from EO optical data (Richter & Vuolo, 2009). In this context two
different approaches are usually applied. In the first reference evapotranspiration
(ET0), corresponding to the ET of a non-stressed grassed surface, is multiplied by an
empirical crop coefficient (Kc) to estimate the potential crop evapotranspiration
under standard condition (ETp), i.e. in a disease-free environment with adequate
fertilization and sufficient soil water availability (irrigation applied). The value of Kc
is retrieved trough a definition of a linear relationship with simple vegetation indices
i.e. Normalized Difference Vegetation Index NDVI and soil-adjusted vegetation
index SAVI (Cuesta et al., 2005; D’Urso & Calera, 2006). The second procedure is
based on the direct application of the Penman-Monteith equation with canopy
parameters (such as Leaf Area Index, Albedo, and crop height) estimated from
satellite imagery (D’Urso, 2001), in analogy to the direct calculation proposed by
F.A.O (Allen et al., 1998). Soil water balance models covering in detail the processes
of water transport in the soil-plant-atmosphere, are widely used on the evaluations of
the irrigation water volumes.
In this paper two examples of tool developed in Italy for crop water irrigation
assessment are presented. The first one, called Bilancio, was conceived as a tool to be
provided to Land Reclamation and Irrigation Consortia to assess the temporal and
spatial variability of irrigation requirements at district scale by filling in the
hydrological balance in the soil-plant-atmosphere. The second, called MARSALa, is a
multi-model tool developed to compute an estimation of the irrigation water
consumption of the whole Italian farm universe by using as key source of
information the Sixth General Agricultural Census 2010. Since both Models are
based on the soil water balance computation, in the next chapter will given a brief
description on the state of the art in this sector.
852

2 Materials and methods
The water balance of a volume of soil affected by plants’ roots is usually derived
from the law of continuity whereas changes in the amount of water present in the
volume are dependent on water flows at the boundary of the domain.
It usually refers to the following equations:
! !cse TEDUIPW ""#""$% (1)
which allows to calculate the change in the volume of water stored in soil in a
fixed time interval, as the difference between the amount of water entering the
system and that going out at the same time interval. The increase of water in the
system is related to the effective rainfall (Pe), the irrigation water volume (I), which
seeps through the soil surface and the contribution due to the rising water from
underground water (U), the negative terms of the budget instead are represented by
percolation to the underground movement (D), evaporation (Es) from the soil surface
and transpiration (Tc) from the crop, which usually added up to define real
evapotranspiration (ET) of the cultivated area (ET = Es + Tc). There are many
models in literature that can be used to the water management (FAO, 1994.b) and
which can be classified into two types: models that use a static schematization of the
system (Smith, 1992), models based on numerical solution of the equations of motion
of the water in the soil-plant-atmosphere (Belmans et al., 1983; Santini, 1992). In
models of the first type, called static, the soil is generally seen as a reservoir, whose
capacity depends on the depth of the root system and parameters related to
characteristics of the soil profile and water volumes are set to filling up the reservoir-
soil field capacity. The static models, for their simplicity, are widely used in
irrigation practices, but to obtain quantitative estimates require empirical correction
parameters to be determined from time in time with reference to specific local
conditions. The second type of model, called dynamic, describe the continuous
system in which water, under its energetic state, moves into the soil, in part goes to
the roots, through the tissues and the vascular system of plants, reaches the leaves,
evaporates and diffuses through the stomata into the atmosphere. These models refer
to global parameters that take on the radical drawing and widespread throughout the
area explored by the roots and water flow extracted from the roots, which varies
continuously from point to point, is related not only to the characteristics of plants
but also the local values of water content in the soil and transpiration demand.
2.1 Bilancio: a GIS-based tool for crop water irrigation estimation at parcel
level
Bilancio has been developed within the Multiregional Objective 1 Programmes,
founded by the EU, “Technical Assistance to Southern Italy Land Reclamation and
Irrigation Consortia” in collaboration with the University of Naples Federico II. The
structure of the model is schematically represented by three components: (I) the core
of the system is represented by the agrohydrological model Soil Water Atmosphere
Plant (SWAP), (Dam et al., 1997), developed at the Wageningen Agricultural
University (Netherlands). The source code of the model is free available, and has
been adapted to the soil and agrohydrological condition of the Southern Italy
irrigated areas; (II) the Geographic Information System (GIS), which allows to
853
provide georeferenced information to run the SWAP calculation and to display
information output, trough the graphical interface; (III) the database containing the
parameters of the soil, crop and climate. In this model, the irrigation district is
divided into elementary parcel, homogeneous in terms of climate, crop and soil
(minimum set of required data to the user, throughout access the archives of internal
software procedure for the generation of input parameters of the model), and defined
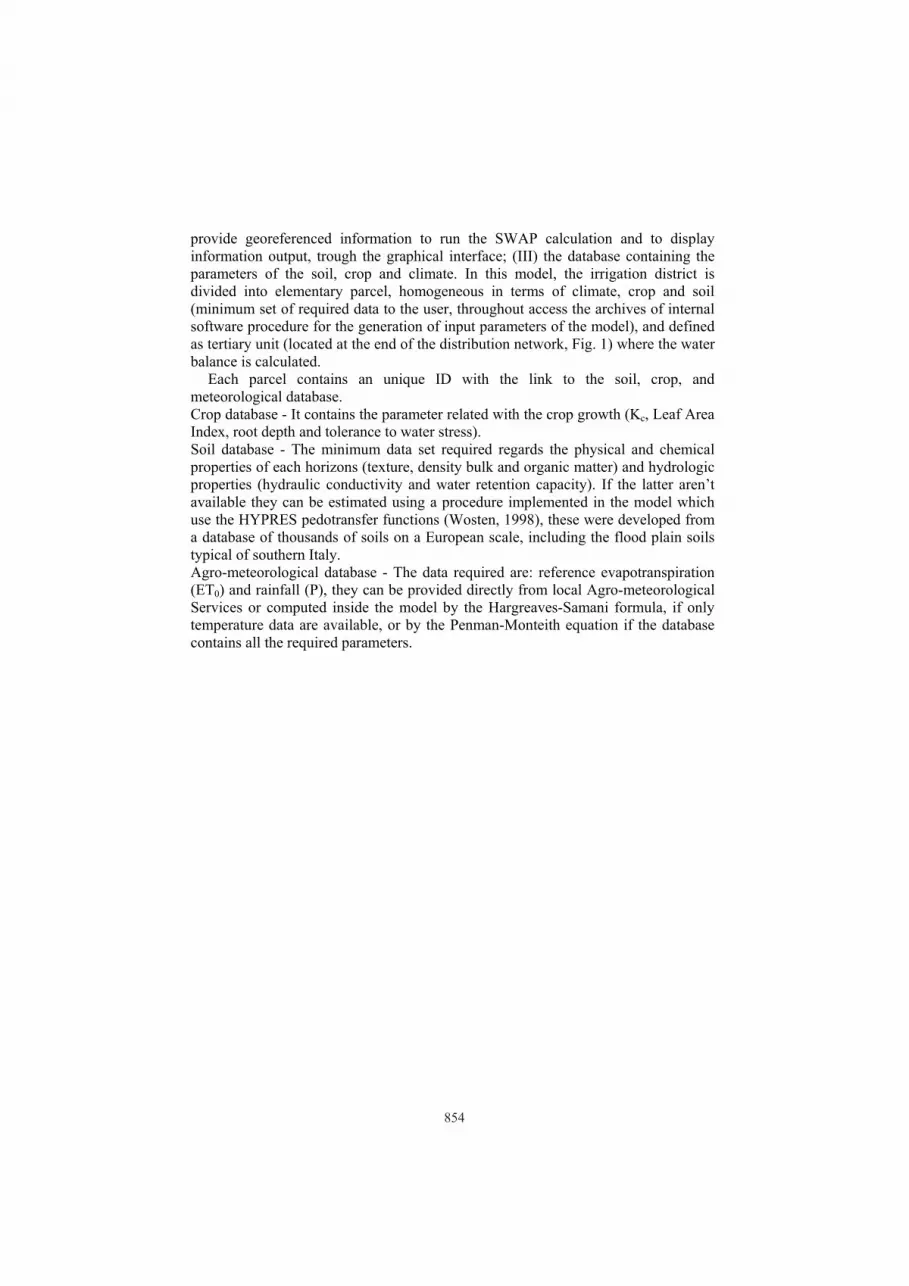
as tertiary unit (located at the end of the distribution network, Fig. 1) where the water
balance is calculated.
Each parcel contains an unique ID with the link to the soil, crop, and
meteorological database.
Crop database - It contains the parameter related with the crop growth (Kc, Leaf Area
Index, root depth and tolerance to water stress).
Soil database - The minimum data set required regards the physical and chemical
properties of each horizons (texture, density bulk and organic matter) and hydrologic
properties (hydraulic conductivity and water retention capacity). If the latter aren’t
available they can be estimated using a procedure implemented in the model which
use the HYPRES pedotransfer functions (Wosten, 1998), these were developed from
a database of thousands of soils on a European scale, including the flood plain soils
typical of southern Italy.
Agro-meteorological database - The data required are: reference evapotranspiration
(ET0) and rainfall (P), they can be provided directly from local Agro-meteorological
Services or computed inside the model by the Hargreaves-Samani formula, if only
temperature data are available, or by the Penman-Monteith equation if the database
contains all the required parameters.
854
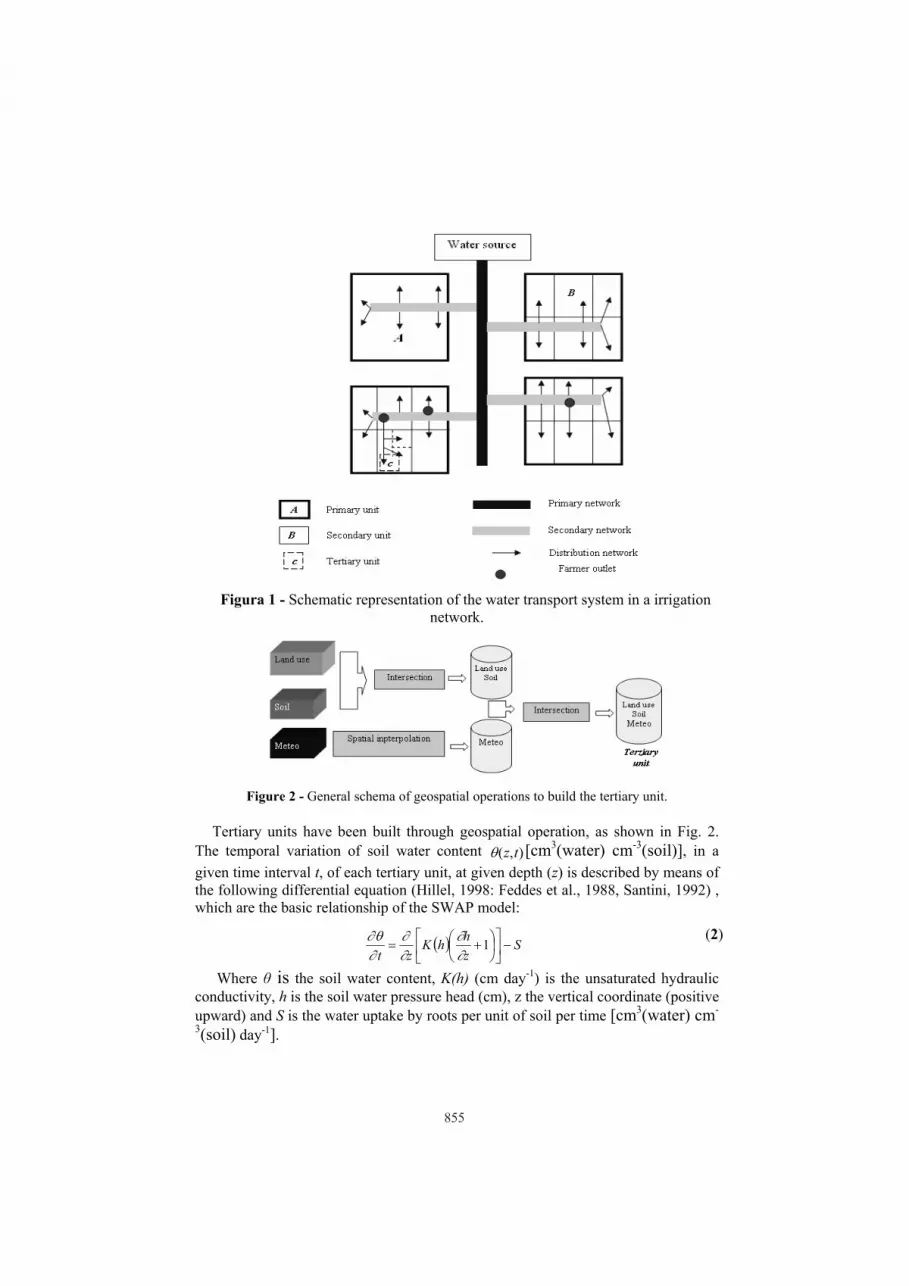
Figura 1 - Schematic representation of the water transport system in a irrigation
network.
Figure 2 - General schema of geospatial operations to build the tertiary unit.
Tertiary units have been built through geospatial operation, as shown in Fig. 2.
The temporal variation of soil water content ),( tz& [cm3(water) cm-3(soil)], in a
given time interval t, of each tertiary unit, at given depth (z) is described by means of
the following differential equation (Hillel, 1998: Feddes et al., 1988, Santini, 1992) ,
which are the basic relationship of the SWAP model:
! Sz
hhK
zt#'
(
)*+
,-.
/01
2 "$ 133
33
3&3 (2)
Where is the soil water content, K(h) (cm day-1) is the unsaturated hydraulic
conductivity, h is the soil water pressure head (cm), z the vertical coordinate (positive
upward) and S is the water uptake by roots per unit of soil per time [cm3(water) cm-
3(soil) day-1].
855
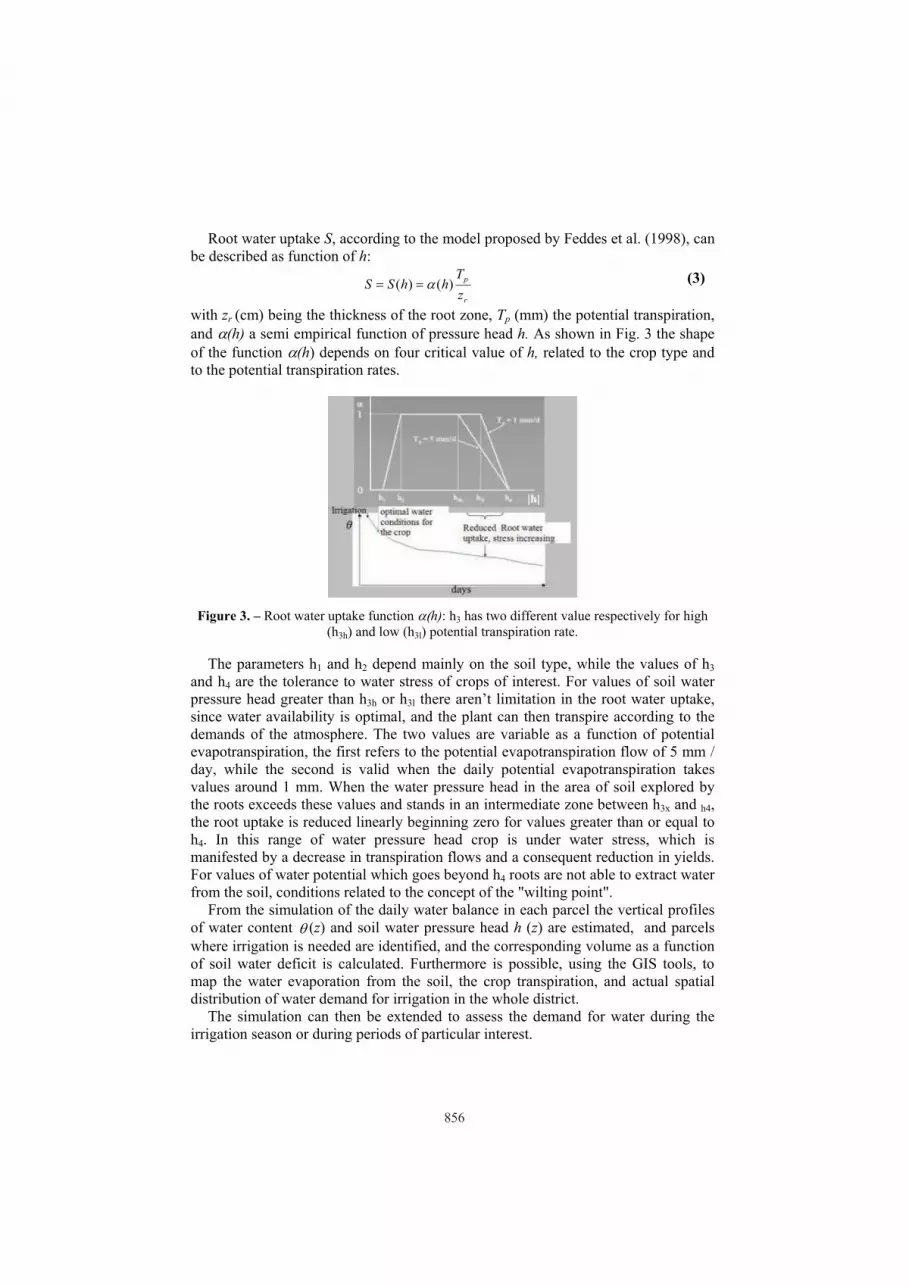
Root water uptake S, according to the model proposed by Feddes et al. (1998), can
be described as function of h:
r
p
z
ThhSS )()( 4$$ (3)
with zr (cm) being the thickness of the root zone, Tp (mm) the potential transpiration,
and 4(h) a semi empirical function of pressure head h. As shown in Fig. 3 the shape
of the function 4(h) depends on four critical value of h, related to the crop type and
to the potential transpiration rates.
Figure 3. – Root water uptake function 4 h): h3 has two different value respectively for high
(h3h) and low (h3l) potential transpiration rate.
The parameters h1 and h2 depend mainly on the soil type, while the values of h3
and h4 are the tolerance to water stress of crops of interest. For values of soil water
pressure head greater than h3h or h3l there aren’t limitation in the root water uptake,
since water availability is optimal, and the plant can then transpire according to the
demands of the atmosphere. The two values are variable as a function of potential
evapotranspiration, the first refers to the potential evapotranspiration flow of 5 mm /
day, while the second is valid when the daily potential evapotranspiration takes
values around 1 mm. When the water pressure head in the area of soil explored by
the roots exceeds these values and stands in an intermediate zone between h3x and h4,
the root uptake is reduced linearly beginning zero for values greater than or equal to
h4. In this range of water pressure head crop is under water stress, which is
manifested by a decrease in transpiration flows and a consequent reduction in yields.
For values of water potential which goes beyond h4 roots are not able to extract water
from the soil, conditions related to the concept of the "wilting point".
From the simulation of the daily water balance in each parcel the vertical profiles
of water content & (z) and soil water pressure head h (z) are estimated, and parcels
where irrigation is needed are identified, and the corresponding volume as a function
of soil water deficit is calculated. Furthermore is possible, using the GIS tools, to
map the water evaporation from the soil, the crop transpiration, and actual spatial
distribution of water demand for irrigation in the whole district.
The simulation can then be extended to assess the demand for water during the
irrigation season or during periods of particular interest.
856

Bilancio has been developed in the form of COM libraries for Windows 32-bit as
an extension of the GIS application Terranova SHARC. The database management
engine used is jet-MS (DAO3.6) version 2.0 that ensure the compatibility with older
versions of Windows. The tool has been delivered as standalone application to a
group of Irrigation and land reclamation consortia located in Southern Italy who
participated to performance evaluation of the system for a whole irrigation season.
2.2 MARSALa: a multi-model tool based on agricultural census data for irrigation
water consumption estimation at farm level.
MARSALa is made up of three integrated models (Fig. 4): Crop Irrigation
Requirements Model (Model A), Irrigation Efficiency Model (Model B) and
Irrigation Strategy Model (Model C). The Models use readily available information
(agricultural census data, administrative statistics, spatial data, etc.) as well as
information collectable through regular surveys and expert expertise.
Figure 4 - Framework of the methodology: typology of required data and models
relationships.
Model A simulates the amount of water required by each crop of the farm and the
relative irrigation dates by computing a daily root zone water balance:
)(Re1 iiiiiii DROETIRZWDRZWD """##$ #
(4)
where RZWDi and RZWDi-1 (mm) are the root zone soil water deficit on days i and i-1, respectively, and Rei (mm), Ii, ETi, ROi and Di (all in mm) are the effective
rainfall, irrigation, crop evapotranspiration, irrigation runoff and drainage,
respectively, on day i. Generally the root zone is full of water (RZWD=0) when the water content is at
field capacity, and it is empty when the water content is at the wilting point. Runoff
of rain water is not directly considered but through the concept of effective rainfall,
while runoff of irrigation water is set as negligible. Drainage of rain water is
computed as the excess of the root zone soil water content over field capacity, on the
857

given day of the water balance. Drainage of irrigation water depends on the applied
water depth in relation to the required depth and the irrigation uniformity, this part is
treated by Model B. The root zone water holding capacity (RZWHC) is the depth of
water (within the root zone) between field capacity and wilting point.
Effective rainfall as well as reference evapotranspiration (ETo, mm), estimated by
Penman-Monteith equation, are derived from the agro-meteorological database.
Crop evapotranspiration (ET, mm) is computed using FAO methodology, based
on the concepts of crop coefficient and reference evapotranspiration (Doorembos and
Pruitt, 1977). The crop coefficients are derived using the dual approach (Wright,
1982) in the form popularized by FAO (Allen et al., 1998). The approach separates
crop transpiration from soil surface evaporation as follows:
oescb ET)KKK(ET "$
(5)
where Kcb is the basal crop coefficient, Ke is the soil evaporation coefficient and Ks
quantifies the reduction in crop transpiration due to soil water deficit.
The variation of Kcb is typically represented based on the values of Kcb at the
initial, middle and final stages of the crop growth cycle and the duration of the initial,
rapid growth, mid season, and late season phases. Ke is obtained by calculating the
amount of energy available at the soil surface as follows:
!cbmaxcre KKKK #$
(6)
where Kr is a dimensionless evaporation reduction coefficient dependent on
topsoil water depletion (Allen et al., 1998) and Kc max is the maximum value of Kc
following rainfall or irrigation. The stress coefficient, Ks, is computed based on the
relative root zone water deficit as:
RZWHC)p(
RZWDRZWHCK
is
##
$1 if RZWDi < (1-p)RZWHC
(7)
1$sK if RZWDi (1-p)RZWHC (8)
where p is the fraction of the RZWHC below which transpiration is reduced.
Irrigation is triggered in the model when the soil water deficit in the root zone
reaches the management allowed depletion, which is then computed by Model B and
C.
Model B takes into account the irrigation application efficiency and the irrigation
drainage losses that are related to the irrigation system and the management factors.
The irrigation system is characterized by its application uniformity, while the
management factors are considered by a management deficit coefficient. If the deficit
coefficient is high, a large fraction of the field will not receive the water required to
maintain full evapotranspiration; contrary, if it is low and the application uniformity
is low as well, then a significant part of the applied irrigation will be lost as drainage,
i.e., the application efficiency will be low. By assuming the frequency distribution of
the applied depth relative to the required depth across the field as a uniform statistical
distribution, for a given required depth may be identified three areas that represents:
the water available for crop consumption, the water lost by percolation and the part
of the root zone receiving any irrigation water.
Therefore, three irrigation performance indicators may be defined: Irrigation
Application Efficiency (Ea), Percolation Coefficient (CP) and Deficit Coefficient
(CD), (Wu, 1988).
858

!CD
XEa
#$
1
(9)
aECP #$1 (10)
!bX
aXCD
2
2#$
(11)
where a and b are determined by the application uniformity and X is the ratio
between required and applied depth. The parameters a and b can be derived by using
the distribution uniformity DU (Warrick, 1983), defined as one minus the ratio
between the average applied depth in the quarter of the field receiving less water and
the average applied depth in the whole field. DU, which is characteristic for each
irrigation system, has been tabulated by analysing experimental researches carried
out in Spain and Italy and by expert judgment (eg. Irrigation system like Furrow or
Basin have on average a DU of 70% while Drip/Micro-irrigation have a DU of 90%).
Ea can be computed by the first equation after deriving X by using the management
deficit coefficient (CD) provided by Model C. The irrigation drainage losses can be
expressed as Ii5Ea where Ii is the irrigation computed knowing the required water
depth estimated by Model A.
Model C concerns the strategy adopted by the farmer in relation to the degree of
stress to which the crop will be subjected and it depends on crop type as well as other
factors such as water availability, distribution system, economic dependence on
irrigated crops, farmer’s educational level, irrigation equipment, size of the farm, etc.
Model C consist of a set of rules organized into a decision tree for defining a value of
the management deficit coefficient (CD) to be used in Model B. The rules are defined
through the analysis of the farm data collected during the calibration campaign and
from experts advise. The decision tree allows to assign a value for CD per each crop
based on a set of information related to farmer irrigation strategy. CD can be greater,
less or equal to p (the fraction of the total available soil water a crop can extract from
the root zone, under no water stress conditions).
Since the tool is expected to be applied for irrigation farm water consumption
estimation for the all possible Italian farms data identification, quality assessment
and collection have been the main issue of the methodology development process. In
fact, the data collection process for the whole country revealed a context where data
are scattered among several institutions (national, regional and local) and with
different standards in terms of data quality, data collection, data storage, scale and
resolution.
Given the context, data were collected with priority to the standardization at
national level and the available resolution, in addition both geographical and
statistical data were reported to the municipal level: the minimum computational
unit. Only the data acquired by the Census have higher resolution being clearly
gathered at farm level. Hereafter all the database, the relative information contained
and the collection procedure are described.
Agro-meteorological database - The national scenario is characterised by a strong
anisotropy of the quality and standard of the available dataset, thus we settled for a
less accurate agro-meteorological database that ensure a complete standardisation
and full coverage at national level. The chosen database, widely exploited by several
research projects, contains a complete series of daily values of precipitation and
859

evapotranspiration (ET0, calculated with the Penman-Monteith formula) estimated
for 544 grid nodes covering the whole Italian territory. The daily values have been
estimated by kriging techniques over a grid geometry with a regular structure where
each node is the centroid of a “meteo cell” with a side length of 30 km. The values
are attributed to each municipality by means of a GIS spatial join function.
Soil database - Soil data availability in Italy shows the same pattern of the agro-
meteorological data in terms of dispersion among local (regional) and national
authorities. In order to realize an homogeneous database, to be used at national level
for the model simulation, we have set off a huge soil data collection activity to make
an inventory of all the available soil maps and data produced by the various Italian
regions. The database contains, for all prevalent soil of each municipality, the
parameters required by Model A: field capacity, wilting point and soil depth that are
evaluated by a weighted average along the soil profile till a maximum depth of 120
cm.
Crop database - The database of crop characteristics is fundamental for crop
irrigation calculation and it has been built by collecting information all the irrigated
crops cultivated in Italy. The main parameters requested for each irrigated crop are:
planting and harvesting date, duration of the growing phases, crop coefficients (Kcb)
for the initial, development, mature and final stage, crop height, root depth and
depletion fraction. Data have been collected from experimental projects, literature
review and FAO-56 book. Since climate in Italy is very different for geographical
reasons, data are acquired for three macro-areas: North, Central and South Italy.
Census database 2010 - Agricultural Census data provides the key source to be
used to feed the three models, official data will be released in 2012 by the Italian
National Institute of Statistics. The data required by the models are: crops acreages
and relative irrigation system, crops location (at municipality level), farmer
educational level, farm technological level and irrigation water supply (e.g. self-
supply by wells/ponds/canals, supply by a public management authority on-
demand/rotation).
Models A, B and C were tested preliminarily for a single crop through a Ms Excel
spreadsheet and then integrated and implemented through a software application
along with a set of routines necessary to extract all the required input data coming
from the census questionnaire as well as all the other databases. Software
implementation was realized through a client-server architecture where the client is a
Ms Windows application written in C# language and devoted to the import, pre-
process and storage the data into a database structure. The server is responsible for
the databases management by an open-source RDBMS (MySQL version 5.1). The
connection and communication between the client and server applications is ensured
by a MySQL connector. The client application is made up of two modules:
6 Module 1- the component acting as data disaggregator by generating the
complete irrigated farm land use by using the data coming from a database
containg the census questionnaire data;
6 Module 2 – the component dealing with the irrigation water consumption
estimation.
860

3 Conclusion
We described two tools developed in Italy to estimate the crop irrigation
requirement by using the so-called soil water balance models.
Bilancio can be considered an useful tool to support the operational activity of the
Reclamation and Irrigation Consortia especially in Southern Italy where water must
be allocated carefully among farmers due to the frequent water shortage phenomena.
In addition the comparison between the water allocated to farmers and the irrigation
estimated can be a useful indicator on irrigation efficiency.
MARSALa can perform estimation at farm level by using the Sixth Italian
Agricultural Census data that will be released in 2012 and it will provide a detailed
picture of the irrigation consumption of the whole Italian farm universe. The figures
that will be produced will be useful to water managers and to support the decision
making process in the coming years.
Both tools can provide simulation of the irrigation needs with a level of accuracy
that depends on the quality and spatial resolution of the input data (crop, soil, and
agro-meteorological data). Further improvements for both tools can be achieved by a
better calibration and validation process by considering a wider set of soil, crop and
climate characteristics as well as different economical and structural farm features.
It is difficult to establish the “cost-benefit” effectiveness of such techniques within
the contex of actual irrigation systems. The implementation of this tools as a real-
time irrigation system could be considered feasible in areas with high value crops and
a high price of irrigation water. Presently, however, irrigation water is not yet fully
considered as an economic good subject to the rules of economic market, even in
areas with serious water scarcity. Nevertheless, in the future we may expect a turn
round of this tendency which will increase the attractiveness of tools in the
management of water resources in irrigated areas (D’Urso, 2001).
References
1. AA.VV.(2006) DEMETER project. Final Report – Part1&Part 2.
2. Allen, R.G., Pereira, L.S, Raes, D., Smith, M (1998) Crop
evapotranspiration. Guidelines for computing crop water requirements. FAO
Irrigation and Drainage Paper No. 56, Rome, Italy.
3. Anyoji, H. y I.P. Wu. (1994) Normal distribution water application for drip
irrigation schedules. Transaction of the ASAE, 37:159-164.
4. Belmans C., Wesseling J.G., Feddes R.A. (1983) Simulation model of the
water balance of a cropped soil: SWATRE. J. Hydrology, 63: 271-286
5. Cuesta A., Montoro A., López-Fuster P., Calera A., Jochum A. (2005)
Metodología operativa para la obtención del coeficiente cultivo desde
imágenes de satèlite. Information Técnica Económica Agraria. ITEA, 101
(3), 212-224.
861

6. D’Urso G. (2001) Simulation and management of on-demand irrigation
system: a combined agro-hydrological approach.”. PhD Dissertation,
Wageningen University, 174pp, ISBN 90-5808-399-3.
7. D’Urso, G. and Calera, A. (2006) Operative approaches to determine crop
water requirements from earth observation data: methodologies and
applications. earth observation for vegetation monitoring and water
management. AIP Conference Proceedings, vol 852, p.p. 14-25.
8. Dam v. J. C., Huygen, J., Wesseling, J. G., Feddes, R. A., Kabat, P., van
Walsum, P. E. V., Groenendijk, P., van Diepen, C. A. (1997) Theory of
SWAP version 2.0. Report 71. Technical Document 45, Wageningen, 167
pp.
9. Doorembos, J., Pruitt, W.O. (1977) Crop water requirements. FAO
Irrigation and Drainage Paper No.24, Rome.
10. EEA Report No 2 (2009) Water resources across Europe-confronting water
scarcity and drought”. ISSN 1725-9177
11. FAO (1994) Irrigation water delivery models. Proceed. F.A.O. Expert
Consultation Rome, 3, Food and Agriculture Organis., Water Report n.2; 312
pp.
12. FAO (1995) Reforming water resources policy - a guide to methods,
processes and practices - FAO irrigation and drainage paper 52. Roma,1995.
ISBN 92-5-103506-7.
13. Feddes, R.A., P. Kabat, P.J.T. van Bakel, J.J.B. Bronswijk and J.
Halbertsma. (1988) Modelling soil water dynamics in the unsaturated zone -
state of the art. J. Hydrol. 100 (1988), 69-111. Also: Technical Bulletins
I.C.W. nr. 78 .
14. Goubanova, K., Li, L. (2006) Extremes in temperature and precipitation
around the Mediterranean in an ensemble of future climate scenario
simulations. Global and Planetary Change,
doi:10.1016/j.globaplacha.2006.11.012.
15. Hillel, D. (1998) Environmental soil physics. Academic Press, London, UK,
771 pp.
16. IPCC, (2007) Climate Change 2007: The Physical Science Basis –
Summary for Policymakers. Contribution of WGI to the 4th Assessment
Report of the IPCC. Geneva.
17. ISTAT (2006) Water resources assessment and water use in agriculture –
Essay n. 18, ISBN 9788845813641
18. Kroes J.G. and van Dam J.C. (2003) Reference Manual SWAP version
3.0.3. Alterra - report 773, Alterra-report 773, ISSN 1566-7197, Alterra,
Green World Research, Wageningen, 211 p.
19. Lupia F., Altobelli F., De Santis F., Mateos L., Namdarian I., Nino P.,
Vanino S. (2010) Use of agricultural census data for the estimation of
irrigation water consumption at farm level. XVIIth World Congress of the
International Commission of Agricultural Engineering (CIGR) Hosted by
the Canadian Society for Bioengineering (CSBE/SCGAB) Québec City,
862
Canada, June 13-17, 2010. Book of Abstract, ISBN 978-2-9811062-1-6,
Depot legal - Biblioteque et Archives nationales du Quebec.
20. Maton, L., Leenhardt, D., Goulard, M., Bergez, J.-E. (2005) Assessing the
irrigation strategies over a wide geographical area from structural data about
farming systems. Agricultural systems 86, 293-311,
doi:10.1016/j.agsy.2004.09.010.
21. Monteith, J. L., Unsworth, M. H. (1990) Principles of environmental
physics. 2ª ed., Edward Arnold, London.
22. Richter K., Vuolo F., D’Urso G. (2009) Estimation of potential
evapotranspiration: empirical versus physical approaches of crop
characteristics. IX Convegno Nazionale dell’Associazione Italiana di
Ingegneria Agraria, Ischia Porto, memoria n. 2-32
23. Rodriguez Diaz, J.A., Weatherhead, E.K., Knox, J.W., Camacho, E. (2007)
Climate change impacts on irrigation water requirements in the
Guadalquivir river basin in Spain. Regional Environmental Change 7, 149-
159.
24. Rosegrant M.W., Ringler C.(1998) Impact on food security and rural
development of transferring water out of agriculture.Water Policy, 567-568.
25. Santini A. (1992) Modelling water dynamics in the soil-plant-atmosphere
system for irrigation problems. Excerpta n.6: 133-166, Milano
26. Warrick, A.W. (1983) Interrelationships of irrigation uniformity terms.
Journal of Irrigation and Drainage Engineering, 109:317-332.
27. Wösten, J.H.M., Lilly, A., Nemes, A. and Le Bas, C., 1998. Using existing
soil data to derive hydraulic parameters for simulation models in
environmental studies and in land use planning. DLO Winand Staring
Centre, Report 157, Wageningen, the Netherlands.
28. Wright, J.L. (1982) New evapotranspiration crop coefficients. J. Irrig. and
Drain. Div., 108, 57-74.
29. Wu, I.P. (1988) Linearized water application function for drip irrigation
schedules. Transactions of the ASAE, 31:1743-1749.
863