titan company (titind) - icici direct
TRANSCRIPT
ICIC
I S
ecurit
ies –
Retail E
quit
y R
esearch
Result
Update
August 5, 2021
CMP: | 1800 Target: | 2110 (17%) Target Period: 12 months
Titan Company (TITIND)
BUY
Strong business model to aid faster recovery…
About the stock: Titan has transformed itself from a watch maker into an enviable
lifestyle company, with jewellery being the leading vertical (82% of revenues).
Robust distribution network comprises 1900+ stores spread across 2.5mn sq. ft.
Titan has consistently displayed its ability to gain market share amid a tough
industry scenario owing to its robust balance sheet (30%+ RoCE and cash
& investments worth | 2000+ crore) and strong brand patronage
Q1FY22 Results: Covid induced lockdowns disrupted the performance for Titan in
Q1FY22. Green-shoots were visible with strong pent-up demand from July onwards.
Revenue (excluding bullion sale) grew 120% YoY to | 3004 crore (~60% of
pre-Covid levels). Reported revenue grew 75% YoY to | 3473 crore
Curtailment of marketing spends and overheads resulted in Titan reporting
EBITDA margin of 3.9% vs. EBITDA loss of | 253 crore in Q1FY21
PAT was at | 18.0 crore vs. net loss of | 294 crore in Q1FY21
What should investors do? Titan has been an exceptional performer in the
discretionary space with stock price appreciating at ~34% CAGR in last five years.
We continue to remain structurally positive and maintain BUY rating
Target Price and Valuation: We value Titan at | 2110 i.e. 60x FY24E EPS
Key triggers for future price performance:
Robust balance sheet and asset light distribution model has enabled it to
outpace peers in terms of store addition (to add ~35 Tanishq stores in FY22)
Thrust on wedding space is bearing fruit with wedding jewellery becoming
a critical growth driver and its share in overall jewellery revenue increasing
meaningfully
Gradual recovery in studded ratio to aid margins, going forward
With share of ~6%, Tanishq’s penetration is still at a very nascent stage in
the Indian jewellery market. This provides immense opportunity for Titan to
enhance its market share. Mandatory gold hallmarking would further
enhance market share gains from unorganised space
Working capital management has been a priority for the company with tight
control on inventory and higher focus on gold on lease replenishment.
Subsequently, the company has substantially improved its cash position
We bake in revenue, earnings CAGR of 20%, 47%, respectively, in FY21-24E
Alternate Stock Idea: Apart from Titan, in our retail coverage we also like Trent
Inherent strength of brands (Westside, Zudio, Star, Zara) and proven
business model position Trent as a key beneficiary of economic unlock
BUY with a target price of | 1,060/share
Particulars
Shareholding pattern
Price Chart
Key risks
(i) Extended lockdown can lower
sales (ii) Delay in expansion of store
network
Research Analyst
Bharat Chhoda
Cheragh Sidhwa
Particular Amount
Market Capitalisation (| Crore) 1,59,801.5
Debt (FY21) (| Crore) 165.0
Cash & investments (FY21) (| Crore) 3,407.3
EV (| Crore) 1,56,559.2
52 week H/L 1858 / 1048
Equity Capital (| Crore) 88.8
Face Value (|) 1
Jun-20 Sep-20 Dec-20 Mar-21 Jun-21
Promoter 52.9 52.9 52.9 52.9 52.9
FII 17.6 18.1 18.6 18.1 18.4
DII 10.8 10.9 11.0 11.1 9.9
Others 18.7 18.2 17.5 17.9 18.8
0
5000
10000
15000
20000
25000
0
500
1000
1500
2000
Aug-1
8
Dec-1
8
Apr-
19
Aug-1
9
Dec-1
9
Apr-
20
Aug-2
0
Dec-2
0
Apr-
21
Aug-2
1
Titan BSE 500
Key Financial Summary
Source: Company, ICICI Direct Research
5 year CAGR FY22E FY23E FY24E 3 year CAGR
(FY16-21) (FY21-24E)
Net Sales 21,051.5 21,644.0 14.0 25,804.4 31,865.0 37,814.5 20.4
EBITDA 2,466.6 1,724.0 13.0 2,985.2 4,039.2 4,825.9 40.9
PAT 1,501.4 973.0 1,941.6 2,716.6 3,129.1 47.6
EPS (|) 16.9 11.0 21.9 30.6 35.2
P/E (x) 106.4 164.2 82.3 58.8 51.1
EV/Sales (x) 7.6 7.2 6.1 4.9 4.2
EV/EBITDA (x) 64.9 90.8 52.3 38.5 32.7
RoCE (%) 28.7 17.6 28.5 32.0 32.0
RoE (%) 22.5 13.0 21.4 24.1 23.0
Financials FY20 FY21
ICICI Securities | Retail Research 2
ICICI Direct Research
Result Update | Titan Company
Key takeaways of recent quarter & conference call highlights
Jewellery division: As guided by the management in its pre-quarterly
update, the jewellery division (excluding gold bullion sale) reported 115%
YoY revenue growth (~63% recovery rate on base of Q1FY20). During the
quarter, the company optimised excess inventory by selling excess raw
gold worth | 424 crore (| 601 crore in Q1FY21). Overall jewellery sales were
at | 3050 crore (up 67% YoY). Studded ratio was at 22% vs. 18% in Q1FY21,
while share of gold coins halved to 7% in Q1FY22. Total store operational
days were at 73%, 10% and 58% for April, May and June, respectively, and
47% for the quarter. With a gradual lifting of restrictions on stores, sales
have bounced back sharply towards Q1 end with good momentum till date.
The management indicated that underlying gross margins (excluding
impact of ineffective hedging and bullion sale) in Q1FY22 were at the best
levels in five quarters. EBIT margins for the jewellery division were at 6.5%
(Q4FY21: 10.7%, Q1FY21: (-)3.0%). Robust performance in challenging
times reaffirms our thesis of long term market share gains for Titan. Expect
revenue recovery to pick up pace from Q3 onwards (festive season) and
build in revenue CAGR of 20% in FY21-24E
Watches & other divisions: Watches division reported 285% YoY growth
(~40% of Q1FY20 base) to | 293 crore. The division witnessed rapid
recovery in walk-ins with re-opening of stores, which was seen in only
jewellery division last year. Total store operational days were at 70%, 24%
and 51% for April, May and June, respectively. Eyewear division reported
revenue growth of 123% YoY (45% of Q1FY20 base) to | 67 crore
Reported gross margins improved 50 bps YoY to 22.4% but the
management indicated that underling gross margins (excluding impact of
ineffective hedging and bullion sale) was significantly better owing to
favourable product mix. Sharp curtailment of expenses (marketing and
other expenses down 51% and 38% QoQ, respectively) resulted in the
company reporting EBITDA margins of 3.9% (I-direct estimate: 3.6%). The
company reported EBITDA of | 137.0 crore. PBT for Q1FY22 was at | 39.0
crore (Q1FY21: loss of | 357 crore). Higher tax rate (53%) resulted in the
company reporting PAT of | 18.0 crore (Q1FY21 loss of | 294 crore)
Q1FY22 Earnings conference call highlights:
Jewellery division:
On demand trends, the first half of July has been better owing to higher
number of wedding days while the second half of July was comparatively
slower. The studded activation in July has seen good traction. Studded mix
at retail level was 25% in Q1FY22 vs. 21% in Q1FY21 and 28% in Q1FY20.
The recovery has been better but has not yet reached pre-Covid levels
Titan’s wholly owned subsidiary Titan Commodity Trading started its
operations and Titan has started hedging gold through its subsidiary. Titan
has incorporated the subsidiary to reduce counter party risk in gold hedging
and also save on costs related to gold hedging
The company indicated that in the last two to three years Tanishq Jewellery
stores have opened in many smaller towns. The sales per store is lower in
smaller towns but the overall productivity and profitability is in line with
majority of the store network. Titan has guided for 35 new store additions
for FY22
On the region specific performance, Tamil Nadu has performed well for the
company (gained market share). The company is doing a lot of localised
activities in Uttar Pradesh, Bihar, Jharkhand and Odisha. Also, Titan is
exploring a couple of other new markets but waiting for normalisation of
trade scenario. In all these regions, the company is looking to provide the
customer with state specific jewellery product design & customisations
ICICI Securities | Retail Research 3
ICICI Direct Research
Result Update | Titan Company
On the competitive intensity front, the competition continues to be high with
varied offers and discounting resorted to by competition. However, the
company is not looking to participate in higher discounting and is likely to
continue its focus on providing better products and customer service
Titan considers compulsory hallmarking of gold to be beneficial for larger
players as smaller players would need to increase their making charges.
Lower difference in making charge between local players and Tanishq
would enhance the desirability of Tanishq products. Also, product design
capabilities and other customer service attributes would increase the affinity
for branded jewellery players
Other segments: The contribution of wearables to the watches division
revenue is less than 5% of watches revenue. Wearables have been growing
faster than watches while the recovery in wearables is also better than
watches
On the eyewear business front, the company is planning a rapid expansion
of store network in seven to eight major cities along with entering new
smaller towns and cities. The branding focus has shifted from eyewear to
eye care
On Taneira (ethnic wear and saree brand), the management indicated that it
has aspirations of scaling the business significantly and is waiting for
normalcy in trade scenario to push growth
Despite various headwinds, Titan has, over the years, withstood challenges and
emerged as a resilient player. Though the near term may present a volatile demand
scenario, we believe Titan is a structural growth story and appears to be a key
beneficiary of the unorganised to organised shift in the Indian jewellery market.
Focus on markets share gains and maintaining balance sheet strength positions Titan
as our preferred pick in the discretionary category. We bake in revenue and earnings
CAGR of 20% and 47%, respectively, in FY21-24E. We reiterate BUY with a revised
target price of | 2110 (60x FY24E EPS, previous TP: | 1800).
ICICI Securities | Retail Research 4
ICICI Direct Research
Result Update | Titan Company
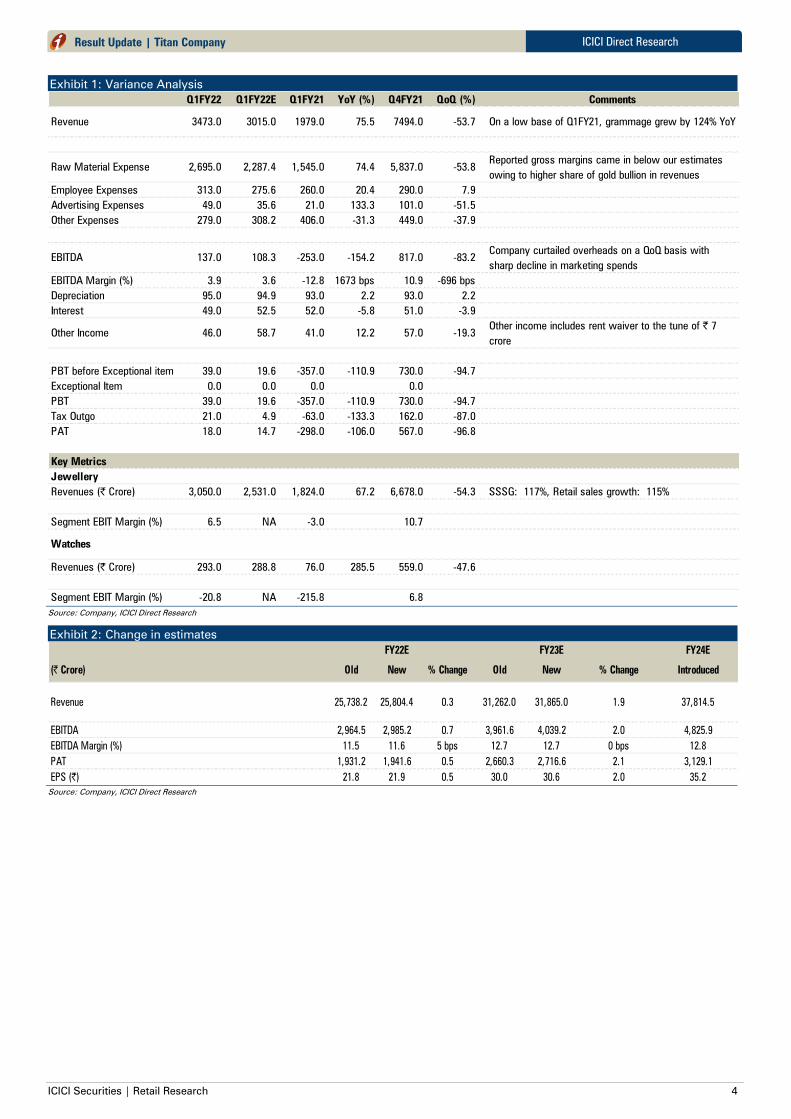
Exhibit 1: Variance Analysis
Source: Company, ICICI Direct Research
Exhibit 2: Change in estimates
Source: Company, ICICI Direct Research
Q1FY22 Q1FY22E Q1FY21 YoY (%) Q4FY21 QoQ (%) Comments
Revenue 3473.0 3015.0 1979.0 75.5 7494.0 -53.7 On a low base of Q1FY21, grammage grew by 124% YoY
Raw Material Expense 2,695.0 2,287.4 1,545.0 74.4 5,837.0 -53.8Reported gross margins came in below our estimates
owing to higher share of gold bullion in revenues
Employee Expenses 313.0 275.6 260.0 20.4 290.0 7.9
Advertising Expenses 49.0 35.6 21.0 133.3 101.0 -51.5
Other Expenses 279.0 308.2 406.0 -31.3 449.0 -37.9
EBITDA 137.0 108.3 -253.0 -154.2 817.0 -83.2Company curtailed overheads on a QoQ basis with
sharp decline in marketing spends
EBITDA Margin (%) 3.9 3.6 -12.8 1673 bps 10.9 -696 bps
Depreciation 95.0 94.9 93.0 2.2 93.0 2.2
Interest 49.0 52.5 52.0 -5.8 51.0 -3.9
Other Income 46.0 58.7 41.0 12.2 57.0 -19.3Other income includes rent waiver to the tune of | 7
crore
PBT before Exceptional item 39.0 19.6 -357.0 -110.9 730.0 -94.7
Exceptional Item 0.0 0.0 0.0 0.0
PBT 39.0 19.6 -357.0 -110.9 730.0 -94.7
Tax Outgo 21.0 4.9 -63.0 -133.3 162.0 -87.0
PAT 18.0 14.7 -298.0 -106.0 567.0 -96.8
Key Metrics
Jewellery
Revenues (| Crore) 3,050.0 2,531.0 1,824.0 67.2 6,678.0 -54.3 SSSG: 117%, Retail sales growth: 115%
Segment EBIT Margin (%) 6.5 NA -3.0 10.7
Watches
Revenues (| Crore) 293.0 288.8 76.0 285.5 559.0 -47.6
Segment EBIT Margin (%) -20.8 NA -215.8 6.8
FY22E FY23E FY24E
(| Crore) Old New % Change Old New % Change Introduced
Revenue 25,738.2 25,804.4 0.3 31,262.0 31,865.0 1.9 37,814.5
EBITDA 2,964.5 2,985.2 0.7 3,961.6 4,039.2 2.0 4,825.9
EBITDA Margin (%) 11.5 11.6 5 bps 12.7 12.7 0 bps 12.8
PAT 1,931.2 1,941.6 0.5 2,660.3 2,716.6 2.1 3,129.1
EPS (|) 21.8 21.9 0.5 30.0 30.6 2.0 35.2
ICICI Securities | Retail Research 5
ICICI Direct Research
Result Update | Titan Company
Financial story in charts
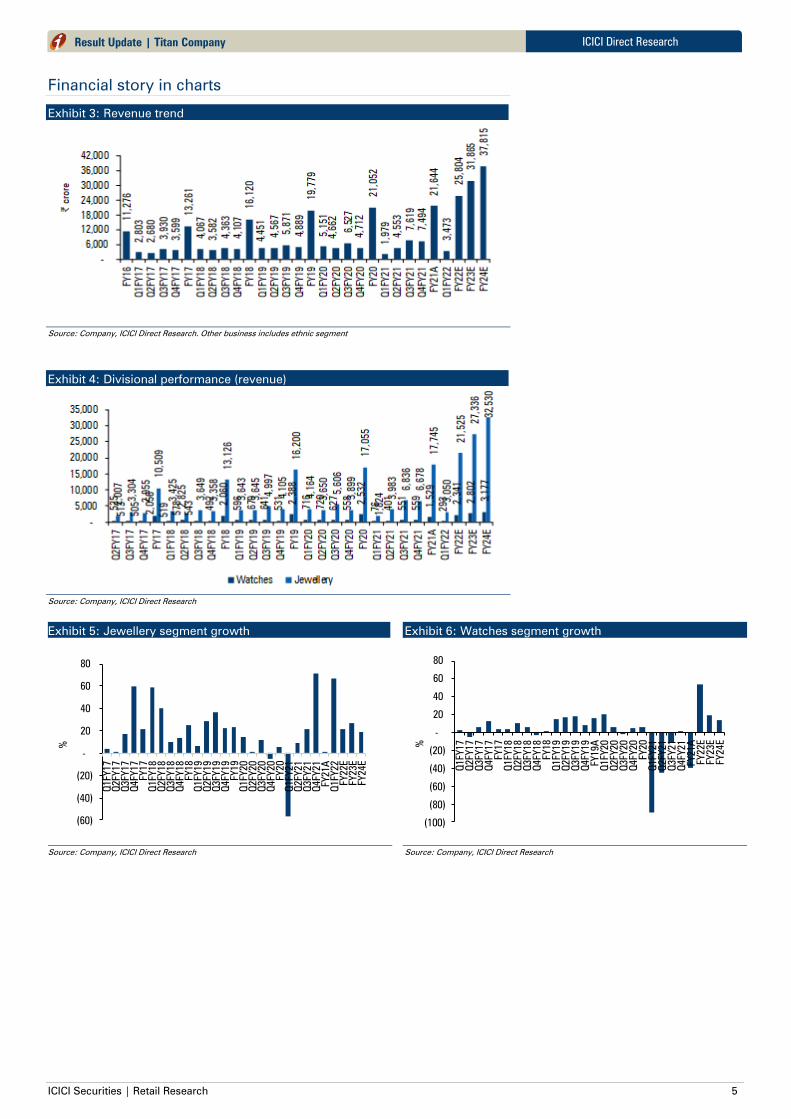
Exhibit 3: Revenue trend
Source: Company, ICICI Direct Research. Other business includes ethnic segment
Exhibit 4: Divisional performance (revenue)
Source: Company, ICICI Direct Research
Exhibit 5: Jewellery segment growth
Source: Company, ICICI Direct Research
Exhibit 6: Watches segment growth
Source: Company, ICICI Direct Research
(60)
(40)
(20)
-
20
40
60
80
Q1FY17
Q2FY17
Q3FY17
Q4FY17
FY17
Q1FY18
Q2FY18
Q3FY18
Q4FY18
FY18
Q1FY19
Q2FY19
Q3FY19
Q4FY19
FY19
Q1FY20
Q2FY20
Q3FY20
Q4FY20
FY20
Q1FY21
Q2FY21
Q3FY21
Q4FY21
FY21A
Q1FY22
FY22E
FY23E
FY24E
%
(100)
(80)
(60)
(40)
(20)
-
20
40
60
80
Q1FY17
Q2FY17
Q3FY17
Q4FY17
FY17
Q1FY18
Q2FY18
Q3FY18
Q4FY18
FY18
Q1FY19
Q2FY19
Q3FY19
Q4FY19
FY19A
Q1FY20
Q2FY20
Q3FY20
Q4FY20
FY20
Q1FY21
Q2FY21
Q3FY21
Q4FY21
FY21A
FY22E
FY23E
FY24E%
ICICI Securities | Retail Research 6
ICICI Direct Research
Result Update | Titan Company
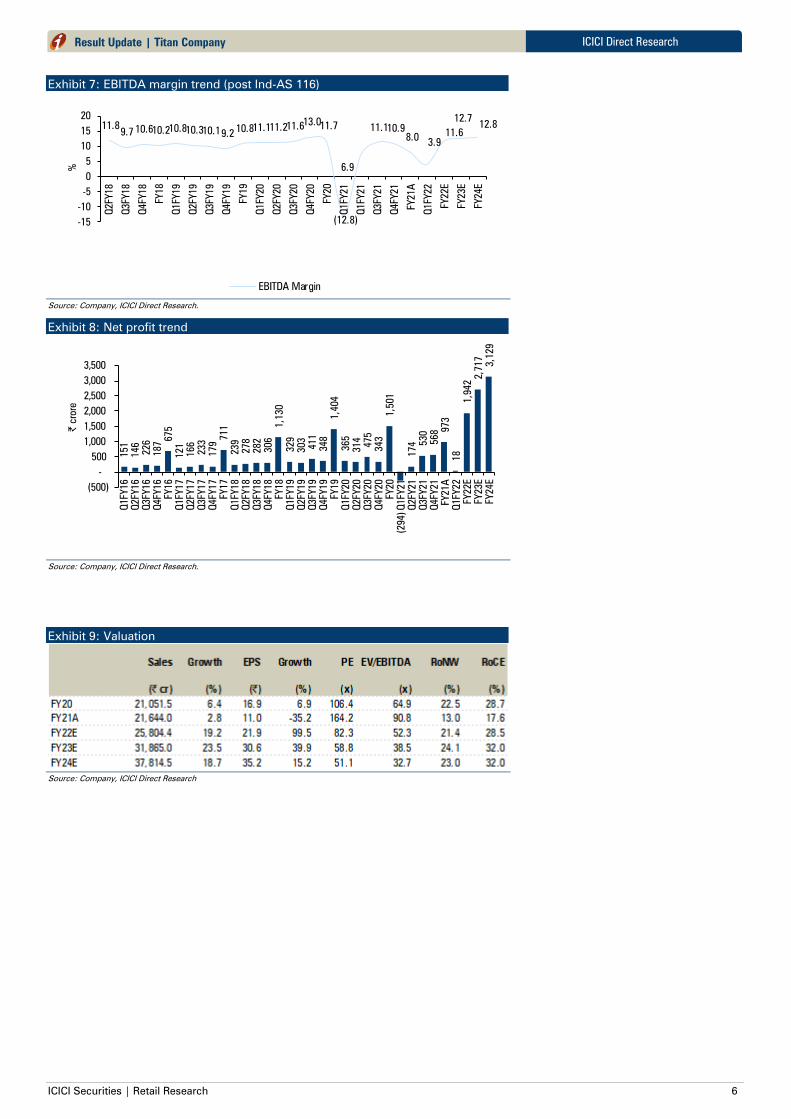
Exhibit 7: EBITDA margin trend (post Ind-AS 116)
Source: Company, ICICI Direct Research.
Exhibit 8: Net profit trend
Source: Company, ICICI Direct Research.
Exhibit 9: Valuation
Source: Company, ICICI Direct Research
11.8 9.7 10.6 10.2 10.8 10.3 10.1 9.2
10.8 11.1 11.2 11.6 13.0
11.7
(12.8)
6.9
11.1 10.9
8.0 3.9
11.6
12.7 12.8
-15
-10
-5
0
5
10
15
20
Q2FY18
Q3FY18
Q4FY18
FY18
Q1FY19
Q2FY19
Q3FY19
Q4FY19
FY19
Q1FY20
Q2FY20
Q3FY20
Q4FY20
FY20
Q1FY21
Q1FY21
Q3FY21
Q4FY21
FY21A
Q1FY22
FY22E
FY23E
FY24E
%
EBITDA Margin
151
146
226
187 675
121
166
233
179 7
11
239
278
282
306
1,130
329
303
411
348
1,404
365
314
475
343
1,501
(294)
174
530
568 973
18
1,942 2
,717
3,129
(500)
-
500
1,000
1,500
2,000
2,500
3,000
3,500
Q1FY16
Q2FY16
Q3FY16
Q4FY16
FY16
Q1FY17
Q2FY17
Q3FY17
Q4FY17
FY17
Q1FY18
Q2FY18
Q3FY18
Q4FY18
FY18
Q1FY19
Q2FY19
Q3FY19
Q4FY19
FY19
Q1FY20
Q2FY20
Q3FY20
Q4FY20
FY20
Q1FY21
Q2FY21
Q3FY21
Q4FY21
FY21A
Q1FY22
FY22E
FY23E
FY24E
| crore
ICICI Securities | Retail Research 7
ICICI Direct Research
Result Update | Titan Company
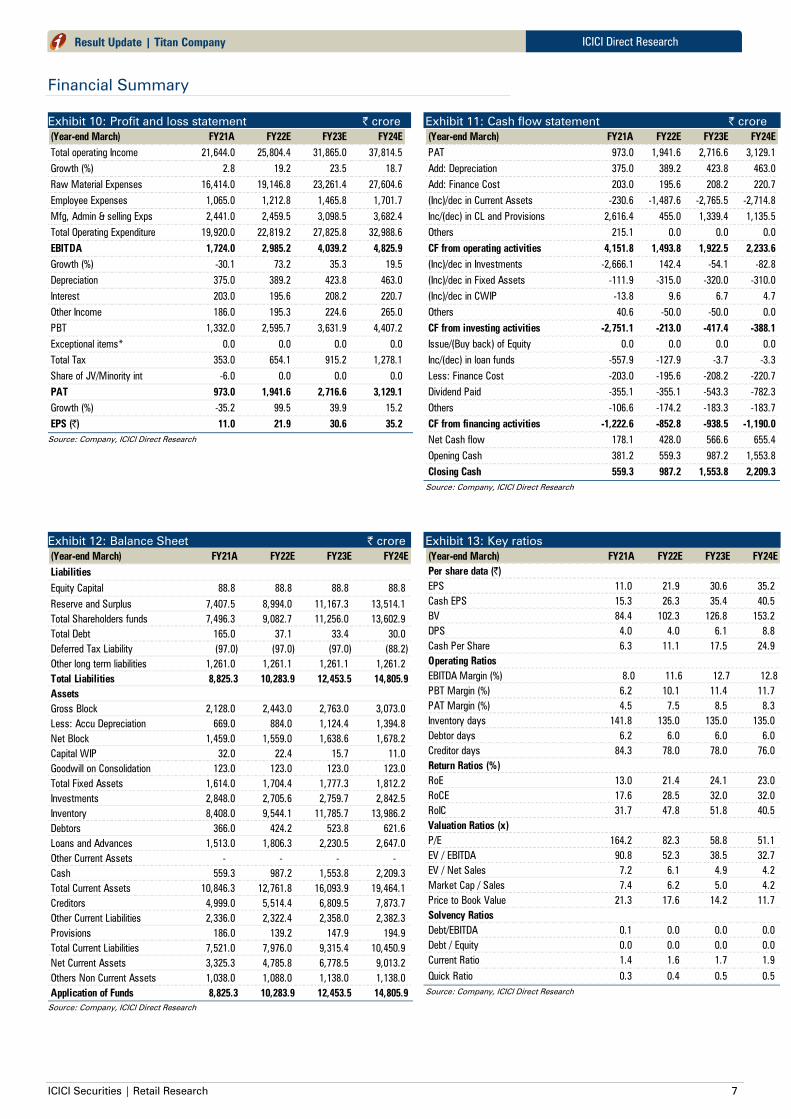
Financial Summary
Exhibit 10: Profit and loss statement | crore
Source: Company, ICICI Direct Research
Exhibit 11: Cash flow statement | crore
Source: Company, ICICI Direct Research
Exhibit 12: Balance Sheet | crore
Source: Company, ICICI Direct Research
Exhibit 13: Key ratios
Source: Company, ICICI Direct Research
(Year-end March) FY21A FY22E FY23E FY24E
Total operating Income 21,644.0 25,804.4 31,865.0 37,814.5
Growth (%) 2.8 19.2 23.5 18.7
Raw Material Expenses 16,414.0 19,146.8 23,261.4 27,604.6
Employee Expenses 1,065.0 1,212.8 1,465.8 1,701.7
Mfg, Admin & selling Exps 2,441.0 2,459.5 3,098.5 3,682.4
Total Operating Expenditure 19,920.0 22,819.2 27,825.8 32,988.6
EBITDA 1,724.0 2,985.2 4,039.2 4,825.9
Growth (%) -30.1 73.2 35.3 19.5
Depreciation 375.0 389.2 423.8 463.0
Interest 203.0 195.6 208.2 220.7
Other Income 186.0 195.3 224.6 265.0
PBT 1,332.0 2,595.7 3,631.9 4,407.2
Exceptional items* 0.0 0.0 0.0 0.0
Total Tax 353.0 654.1 915.2 1,278.1
Share of JV/Minority int -6.0 0.0 0.0 0.0
PAT 973.0 1,941.6 2,716.6 3,129.1
Growth (%) -35.2 99.5 39.9 15.2
EPS (|) 11.0 21.9 30.6 35.2
(Year-end March) FY21A FY22E FY23E FY24E
PAT 973.0 1,941.6 2,716.6 3,129.1
Add: Depreciation 375.0 389.2 423.8 463.0
Add: Finance Cost 203.0 195.6 208.2 220.7
(Inc)/dec in Current Assets -230.6 -1,487.6 -2,765.5 -2,714.8
Inc/(dec) in CL and Provisions 2,616.4 455.0 1,339.4 1,135.5
Others 215.1 0.0 0.0 0.0
CF from operating activities 4,151.8 1,493.8 1,922.5 2,233.6
(Inc)/dec in Investments -2,666.1 142.4 -54.1 -82.8
(Inc)/dec in Fixed Assets -111.9 -315.0 -320.0 -310.0
(Inc)/dec in CWIP -13.8 9.6 6.7 4.7
Others 40.6 -50.0 -50.0 0.0
CF from investing activities -2,751.1 -213.0 -417.4 -388.1
Issue/(Buy back) of Equity 0.0 0.0 0.0 0.0
Inc/(dec) in loan funds -557.9 -127.9 -3.7 -3.3
Less: Finance Cost -203.0 -195.6 -208.2 -220.7
Dividend Paid -355.1 -355.1 -543.3 -782.3
Others -106.6 -174.2 -183.3 -183.7
CF from financing activities -1,222.6 -852.8 -938.5 -1,190.0
Net Cash flow 178.1 428.0 566.6 655.4
Opening Cash 381.2 559.3 987.2 1,553.8
Closing Cash 559.3 987.2 1,553.8 2,209.3
(Year-end March) FY21A FY22E FY23E FY24E
Liabilities
Equity Capital 88.8 88.8 88.8 88.8
Reserve and Surplus 7,407.5 8,994.0 11,167.3 13,514.1
Total Shareholders funds 7,496.3 9,082.7 11,256.0 13,602.9
Total Debt 165.0 37.1 33.4 30.0
Deferred Tax Liability (97.0) (97.0) (97.0) (88.2)
Other long term liabilities 1,261.0 1,261.1 1,261.1 1,261.2
Total Liabilities 8,825.3 10,283.9 12,453.5 14,805.9
Assets
Gross Block 2,128.0 2,443.0 2,763.0 3,073.0
Less: Accu Depreciation 669.0 884.0 1,124.4 1,394.8
Net Block 1,459.0 1,559.0 1,638.6 1,678.2
Capital WIP 32.0 22.4 15.7 11.0
Goodwill on Consolidation 123.0 123.0 123.0 123.0
Total Fixed Assets 1,614.0 1,704.4 1,777.3 1,812.2
Investments 2,848.0 2,705.6 2,759.7 2,842.5
Inventory 8,408.0 9,544.1 11,785.7 13,986.2
Debtors 366.0 424.2 523.8 621.6
Loans and Advances 1,513.0 1,806.3 2,230.5 2,647.0
Other Current Assets - - - -
Cash 559.3 987.2 1,553.8 2,209.3
Total Current Assets 10,846.3 12,761.8 16,093.9 19,464.1
Creditors 4,999.0 5,514.4 6,809.5 7,873.7
Other Current Liabilities 2,336.0 2,322.4 2,358.0 2,382.3
Provisions 186.0 139.2 147.9 194.9
Total Current Liabilities 7,521.0 7,976.0 9,315.4 10,450.9
Net Current Assets 3,325.3 4,785.8 6,778.5 9,013.2
Others Non Current Assets 1,038.0 1,088.0 1,138.0 1,138.0
Application of Funds 8,825.3 10,283.9 12,453.5 14,805.9
(Year-end March) FY21A FY22E FY23E FY24E
Per share data (|)
EPS 11.0 21.9 30.6 35.2
Cash EPS 15.3 26.3 35.4 40.5
BV 84.4 102.3 126.8 153.2
DPS 4.0 4.0 6.1 8.8
Cash Per Share 6.3 11.1 17.5 24.9
Operating Ratios
EBITDA Margin (%) 8.0 11.6 12.7 12.8
PBT Margin (%) 6.2 10.1 11.4 11.7
PAT Margin (%) 4.5 7.5 8.5 8.3
Inventory days 141.8 135.0 135.0 135.0
Debtor days 6.2 6.0 6.0 6.0
Creditor days 84.3 78.0 78.0 76.0
Return Ratios (%)
RoE 13.0 21.4 24.1 23.0
RoCE 17.6 28.5 32.0 32.0
RoIC 31.7 47.8 51.8 40.5
Valuation Ratios (x)
P/E 164.2 82.3 58.8 51.1
EV / EBITDA 90.8 52.3 38.5 32.7
EV / Net Sales 7.2 6.1 4.9 4.2
Market Cap / Sales 7.4 6.2 5.0 4.2
Price to Book Value 21.3 17.6 14.2 11.7
Solvency Ratios
Debt/EBITDA 0.1 0.0 0.0 0.0
Debt / Equity 0.0 0.0 0.0 0.0
Current Ratio 1.4 1.6 1.7 1.9
Quick Ratio 0.3 0.4 0.5 0.5
ICICI Securities | Retail Research 8
ICICI Direct Research
Result Update | Titan Company
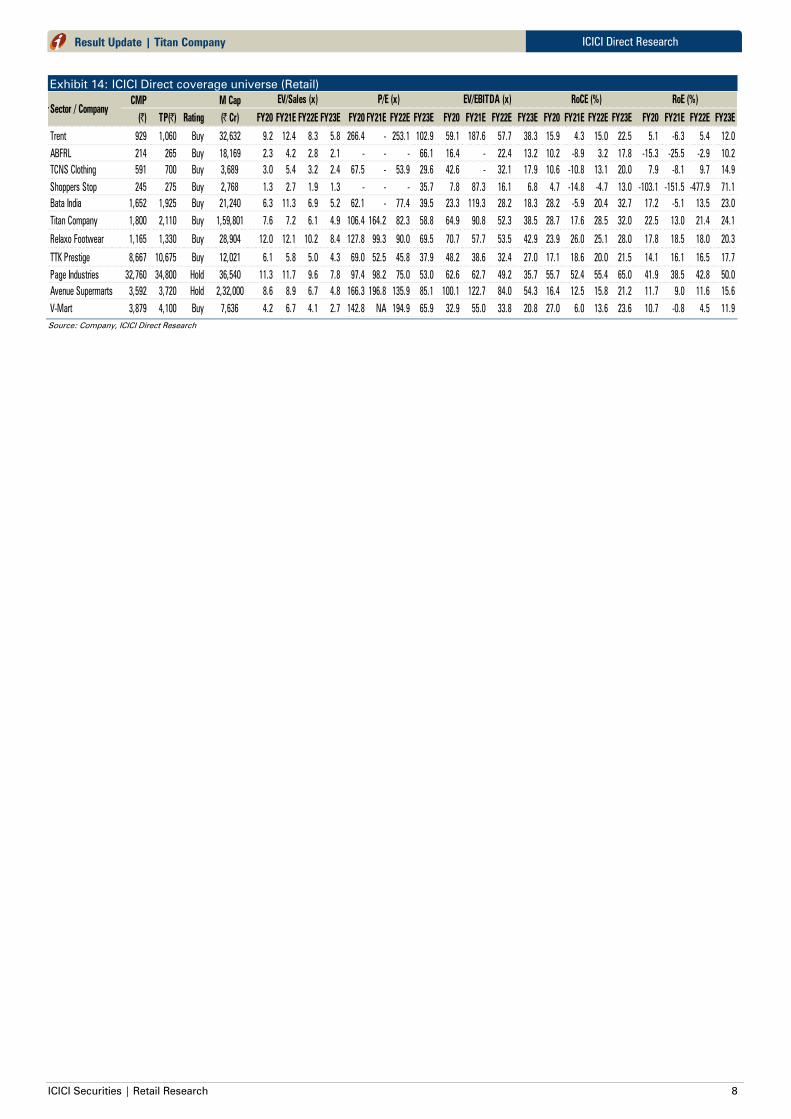
Exhibit 14: ICICI Direct coverage universe (Retail)
Source: Company, ICICI Direct Research
CMP M Cap
(|) TP(|) Rating (| Cr) FY20 FY21E FY22E FY23E FY20 FY21E FY22E FY23E FY20 FY21E FY22E FY23E FY20 FY21E FY22E FY23E FY20 FY21E FY22E FY23E
Trent 929 1,060 Buy 32,632 9.2 12.4 8.3 5.8 266.4 - 253.1 102.9 59.1 187.6 57.7 38.3 15.9 4.3 15.0 22.5 5.1 -6.3 5.4 12.0
ABFRL 214 265 Buy 18,169 2.3 4.2 2.8 2.1 - - - 66.1 16.4 - 22.4 13.2 10.2 -8.9 3.2 17.8 -15.3 -25.5 -2.9 10.2
TCNS Clothing 591 700 Buy 3,689 3.0 5.4 3.2 2.4 67.5 - 53.9 29.6 42.6 - 32.1 17.9 10.6 -10.8 13.1 20.0 7.9 -8.1 9.7 14.9
Shoppers Stop 245 275 Buy 2,768 1.3 2.7 1.9 1.3 - - - 35.7 7.8 87.3 16.1 6.8 4.7 -14.8 -4.7 13.0 -103.1 -151.5 -477.9 71.1
Bata India 1,652 1,925 Buy 21,240 6.3 11.3 6.9 5.2 62.1 - 77.4 39.5 23.3 119.3 28.2 18.3 28.2 -5.9 20.4 32.7 17.2 -5.1 13.5 23.0
Titan Company 1,800 2,110 Buy 1,59,801 7.6 7.2 6.1 4.9 106.4 164.2 82.3 58.8 64.9 90.8 52.3 38.5 28.7 17.6 28.5 32.0 22.5 13.0 21.4 24.1
Relaxo Footwear 1,165 1,330 Buy 28,904 12.0 12.1 10.2 8.4 127.8 99.3 90.0 69.5 70.7 57.7 53.5 42.9 23.9 26.0 25.1 28.0 17.8 18.5 18.0 20.3
TTK Prestige 8,667 10,675 Buy 12,021 6.1 5.8 5.0 4.3 69.0 52.5 45.8 37.9 48.2 38.6 32.4 27.0 17.1 18.6 20.0 21.5 14.1 16.1 16.5 17.7
Page Industries 32,760 34,800 Hold 36,540 11.3 11.7 9.6 7.8 97.4 98.2 75.0 53.0 62.6 62.7 49.2 35.7 55.7 52.4 55.4 65.0 41.9 38.5 42.8 50.0
Avenue Supermarts 3,592 3,720 Hold 2,32,000 8.6 8.9 6.7 4.8 166.3 196.8 135.9 85.1 100.1 122.7 84.0 54.3 16.4 12.5 15.8 21.2 11.7 9.0 11.6 15.6
V-Mart 3,879 4,100 Buy 7,636 4.2 6.7 4.1 2.7 142.8 NA 194.9 65.9 32.9 55.0 33.8 20.8 27.0 6.0 13.6 23.6 10.7 -0.8 4.5 11.9
RoE (%)RoCE (%)
Sector / Company
P/E (x)EV/Sales (x) EV/EBITDA (x)
ICICI Securities | Retail Research 9
ICICI Direct Research
Result Update | Titan Company
RATING RATIONALE
ICICI Direct endeavors to provide objective opinions and recommendations. ICICI Direct assigns ratings to its
stocks according -to their notional target price vs. current market price and then categorizes them as Buy, Hold,
Reduce and Sell. The performance horizon is two years unless specified and the notional target price is defined
as the analysts' valuation for a stock
Buy: >15%
Hold: -5% to 15%;
Reduce: -15% to -5%;
Sell: <-15%
Pankaj Pandey Head – Research [email protected]
ICICI Direct Research Desk,
ICICI Securities Limited,
1st Floor, Akruti Trade Centre,
Road No 7, MIDC,
Andheri (East)
Mumbai – 400 093
ICICI Securities | Retail Research 10
ICICI Direct Research
Result Update | Titan Company
ANALYST CERTIFICATION
I/We, Bharat Chhoda, MBA, Cheragh Sidhwa MBA, Research Analysts, authors and the names subscribed to this report, hereby certify that all of the views expressed in this research report
accurately reflect our views about the subject issuer(s) or securities. We also certify that no part of our compensation was, is, or will be directly or indirectly related to the specific
recommendation(s) or view(s) in this report. It is also confirmed that above mentioned Analysts of this report have not received any compensation from the companies mentioned in the report
in the preceding twelve months and do not serve as an officer, director or employee of the companies mentioned in the report.
Terms & conditions and other disclosures:
ICICI Securities Limited (ICICI Securities) is a full-service, integrated investment banking and is, inter alia, engaged in the business of stock brokering and distribution of financial products.
ICICI Securities is Sebi registered stock broker, merchant banker, investment adviser, portfolio manager and Research Analyst. ICICI Securities is registered with Insurance Regulatory Development Authority of India Limited (IRDAI)
as a composite corporate agent and with PFRDA as a Point of Presence. ICICI Securities Limited Research Analyst SEBI Registration Number – INH000000990. ICICI Securities Limited SEBI Registration is INZ000183631 for stock
broker. ICICI Securities is a subsidiary of ICICI Bank which is India’s largest private sector bank and has its various subsidiaries engaged in businesses of housing finance, asset management, life insurance, general insurance, venture
capital fund management, etc. (“associates”), the details in respect of which are available on www.icicibank.com.
ICICI Securities is one of the leading merchant bankers/ underwriters of securities and participate in virtually all securities trading markets in India. We and our associates might have investment banking and other business relationship
with a significant percentage of companies covered by our Investment Research Department. ICICI Securities and its analysts, persons reporting to analysts and their relatives are generally prohibited from maintaining a financial
interest in the securities or derivatives of any companies that the analysts cover.
Recommendation in reports based on technical and derivative analysis centre on studying charts of a stock's price movement, outstanding positions, trading volume etc. as opposed to focusing on a company's fundamentals and, as
such, may not match with the recommendation in fundamental reports. Investors may visit icicidirect.com to view the Fundamental and Technical Research Reports.
Our proprietary trading and investment businesses may make investment decisions that are inconsistent with the recommendations expressed herein.
ICICI Securities Limited has two independent equity research groups: Institutional Research and Retail Research. This report has been prepared by the Retail Research. The views and opinions expressed in this document may or may
not match or may be contrary with the views, estimates, rating, and target price of the Institutional Research.
The information and opinions in this report have been prepared by ICICI Securities and are subject to change without any notice. The report and information contained herein is strictly confidential and meant solely for the selected
recipient and may not be altered in any way, transmitted to, copied or distributed, in part or in whole, to any other person or to the media or reproduced in any form, without prior written consent of ICICI Securities. While we would
endeavour to update the information herein on a reasonable basis, ICICI Securities is under no obligation to update or keep the information current. Also, there may be regulatory, compliance or other reasons that may prevent ICICI
Securities from doing so. Non-rated securities indicate that rating on a particular security has been suspended temporarily and such suspension is in compliance with applicable regulations and/or ICICI Securities policies, in
circumstances where ICICI Securities might be acting in an advisory capacity to this company, or in certain other circumstances.
This report is based on information obtained from public sources and sources believed to be reliable, but no independent verification has been made nor is its accuracy or completeness guaranteed. This report and information herein
is solely for informational purpose and shall not be used or considered as an offer document or solicitation of offer to buy or sell or subscribe for securities or other financial instruments. Though disseminated to all the customers
simultaneously, not all customers may receive this report at the same time. ICICI Securities will not treat recipients as customers by virtue of their receiving this report. Nothing in this report constitutes investment, legal, accounting
and tax advice or a representation that any investment or strategy is suitable or appropriate to your specific circumstances. The securities discussed and opinions expressed in this report may not be suitable for all investors, who
must make their own investment decisions, based on their own investment objectives, financial positions and needs of specific recipient. This may not be taken in substitution for the exercise of independent judgment by any recipient.
The recipient should independently evaluate the investment risks. The value and return on investment may vary because of changes in interest rates, foreign exchange rates or any other reason. ICICI Securities accepts no liabilities
whatsoever for any loss or damage of any kind arising out of the use of this report. Past performance is not necessarily a guide to future performance. Investors are advised to see Risk Disclosure Document to understand the risks
associated before investing in the securities markets. Actual results may differ materially from those set forth in projections. Forward-looking statements are not predictions and may be subject to change without notice.
ICICI Securities or its associates might have managed or co-managed public offering of securities for the subject company or might have been mandated by the subject company for any other assignment in the past twelve months.
ICICI Securities or its associates might have received any compensation from the companies mentioned in the report during the period preceding twelve months from the date of this report for services in respect of managing or co-
managing public offerings, corporate finance, investment banking or merchant banking, brokerage services or other advisory service in a merger or specific transaction.
ICICI Securities encourages independence in research report preparation and strives to minimize conflict in preparation of research report. ICICI Securities or its associates or its analysts did not receive any compensation or other
benefits from the companies mentioned in the report or third party in connection with preparation of the research report. Accordingly, neither ICICI Securities nor Research Analysts and their relatives have any material conflict of
interest at the time of publication of this report.
Compensation of our Research Analysts is not based on any specific merchant banking, investment banking or brokerage service transactions.
ICICI Securities or its subsidiaries collectively or Research Analysts or their relatives do not own 1% or more of the equity securities of the Company mentioned in the report as of the last day of the month preceding the publication of
the research report.
Since associates of ICICI Securities and ICICI Securities as a entity are engaged in various financial service businesses, they might have financial interests or beneficial ownership in various companies including the subject
company/companies mentioned in this report.
ICICI Securities may have issued other reports that are inconsistent with and reach different conclusion from the information presented in this report.
Neither the Research Analysts nor ICICI Securities have been engaged in market making activity for the companies mentioned in the report.
We submit that no material disciplinary action has been taken on ICICI Securities by any Regulatory Authority impacting Equity Research Analysis activities.
This report is not directed or intended for distribution to, or use by, any person or entity who is a citizen or resident of or located in any locality, state, country or other jurisdiction, where such distribution, publication, availability or
use would be contrary to law, regulation or which would subject ICICI Securities and affiliates to any registration or licensing requirement within such jurisdiction. The securities described herein may or may not be eligible for sale in
all jurisdictions or to certain category of investors. Persons in whose possession this document may come are required to inform themselves of and to observe such restriction.