time-scaling properties in forest-fire sequences observed in gargano area (southern italy
TRANSCRIPT
Ecological Modelling 185 (2005) 531–544
Time-scaling properties in forest-fire sequencesobserved in Gargano area (southern Italy)
Luciano Telescaa, ∗, Giuseppe Amatullia, Rosa Lasaponaraa,Michele Lovalloa, Adriano Santullia, b
a Istituto di Metodologie per l’Analisi Ambientale, CNR, C. da S. Loja, 85050 Tito (PZ), Italyb Istituto di Selvicoltura, Universit`a degli Studi della Basilicata, 85100 Potenza, Italy
Received 14 July 2004; received in revised form 29 December 2004; accepted 3 January 2005
Abstract
Investigating the time dynamics of forest-fires is a challenge in the environmental sciences. Time-scaling scale-invariantapproaches have been used to characterize the temporal distribution of forest-fire sequence detected in Gargano area (southernItaly), which is characterized by high level of wildfire density. Our findings reveal that the point process of the fire sequence canbe considered as a fractal process with a high degree of time-clusterization of the events. The time-clustering phenomenon isvisible from timescales of order of few days. Furthermore, the fire process tends to be less time-clusterized with the increase ofthe burned area.© 2005 Elsevier B.V. All rights reserved.
K
1
fomos
f
rlds ofd in-
-andet
ered,reaktruc-l
0
eywords: Forest-fire; Clustering; Power spectrum; Allan Factor; Fano Factor; Interevent interval histogram
. Introduction
Fire is one of the most severe agents that damageorest resources, which are periodically exposed to theccurrence of wildfires of different intensities. Further-ore, fire hazard has increased due the augmentationf the population, rural exodus, and the human ignitionources (San-Miguel-Ayanz et al., 2002).
∗ Corresponding author. Tel.: +39 0971 427206;ax: +39 0971 427271.
E-mail address:[email protected] (L. Telesca).
The increased fire activity throughout the wo(Central America, Amazonia, Africa, boreal regionNorth America and Eurasia) provides a widespreacrease in greenhouse gases (such as CO2 and CH4) ona global scale (Guido et al., 2004). A number of studies show that forest-fires are a major source of COother air pollutants (Greenberg et al., 1984; Crutzenal., 1985; Hao et al., 1990).
In the Mediterranean regions, fires are consida major cause of land degradation (UNCCD report1994). Every year, on average 45,000 forest-fires bout in the Mediterranean basin causing the destion of about 2.6 million hectares (FAO, 2001). Severa
304-3800/$ – see front matter © 2005 Elsevier B.V. All rights reserved.doi:10.1016/j.ecolmodel.2005.01.009
532 L. Telesca et al. / Ecological Modelling 185 (2005) 531–544
studies (Trabaud and Lepart, 1981; Perez and Moreno,1998; Vila et al., 2001) dealing with the effects offires on the vegetation within the Mediterranean basinfound that fires induce significant alterations in shortas well as long-term vegetation dynamics. Fires leadto permanent changes in the composition of vege-tation community, cause decrease in forests, loss ofbiodiversity, soil degradation, alteration of landscapepatterns and ecosystem functioning thus speeding de-sertification processes up (see, for example,UNCCDreport, 1994). Moreover, recent studies (Cochrane etal., 1999; Vila et al., 2001) found that fires facilitatealien plant invasion, patch homogenization, and cre-ate positive feedbacks in future fire susceptibility, fuelloading, fire spreading and intensity.
Nevertheless, the landscape dynamics in fire-proneecosystems are still scarcely known because of thecomplexity of fire ignition and propagation processesthat involve climate and vegetation patterns, topo-graphic features and human factors. The accurate char-acterization of fire regime is needed for understandingfire distribution patterns in time and space and for quan-tifying fire risk.
Several studies have used the self-organized critical-ity (SOC) concept in order to capture the main featuresof fire dynamics and to model fire behaviour. The SOChas been proposed byBak et al. (1988)to describethe behaviour of extended dynamical systems whichare at a critical equilibrium with no spatial and tem-poral scales others than those linked to the size of thes and-p l( la ofs ancei ion-sm -s
t-fi andffi ak-i unt.A tionw -t .( een
frequency of occurrence and size of burned area of alarge series of wildfires recorded by the Regional ForestService of Liguria (northern Italy) and found that theSOC concept applies well to describe wildfire occur-rences.Song et al. (2001)studied the SOC characteris-tics of actual forest-fires in China and used a forest-firemodel with tree immunity in order to investigate thedeviations observed between the occurrence frequencyof large fires and the power-law relation.
All the previous studies focused only on the prob-lem of fire frequency-size distribution, whose power-law behaviour allowed applying SOC models to firedynamics. A SOC system is characterized not onlyby size-scaling but also by time-scaling, featured bythe appearance of the so-called “1/fα-noise”. There-fore, the temporal characterization of a fire sequence isalso needed in order to have more detailed informationabout its dynamical properties.
Lasaponara et al. (2004)analyzed the time-scalingproperties of the yearly forest-fire sequences occurredin Reggio Calabria (southern Italy) area, which exhibitsstrong degree of time-clusterization.
The present study aims to analyse the time-scalingcharacteristics of fire occurrences as revealed from atime series (from 1997 to 2003) of fire records providedby the Italian National Forestry Service for the Gargano(southern Italy) area, that is classified as highly vulner-able to forest-fires (data provided byFAO, 2001).
2
rys tudya teep-s iallyi -c reasesi rain(G e-g ernc eanc othh tioni byh andv fre-
ystem. The SOC concept is illustrated by the sile model (Bak and Chen, 1990), slide-block modeCarson and Langer, 1989), forest-fire model (Drossend Schwabl, 1992) etc., and can explain the ubiquitycale-invariant phenomena in nature. Scale-invaris mathematically described by a power-law relathipMσ(S) ∝ σ−D, whereM is a measure of a setSwitheasurement unit sizeσ, andD is the fractal dimen
ion.Drossel and Schwabl (1992)developed a fores
re model based on SOC characteristics of forestsorest-fires. Recently,Schenk et al. (2000)investigatednite-size effects in the SOC forest-fire model by tng tree density and fire size distribution into acco
power-law dependence in the fire size distribuas found byMalamud et al. (1998)investigating ac
ual forest-fire data for USA and Australia.Ricotta et al1999)examined the power-law relationship betw
. Study area
An area of 50 km× 30 km was selected in the veensitive zone of the Gargano peninsula. The srea is characterised by uneven relieves and slopes that tend to facilitate fire spreading, especn the presence of wind (Viegas, 1999). Steep slopes inrease the damage caused by fire because of incn the pH of the soil and the erosion produced bySolari and Siccardi, 1998; Garcıa-Cano et al., 1998).argano, the “spur of Italy”, is located in Apulia Rion; it is a large promontory in the Italian eastoast (Fig. 1a). The area has the typical Mediterranlimate with long dry seasons and mild winter. Bigh topographic complexity and geographic posi
nfluence its microclimate, which is characterizedeterogeneous and complex mixing of ecotypesegetation patches. In this area wildfires are very
L. Telesca et al. / Ecological Modelling 185 (2005) 531–544 533
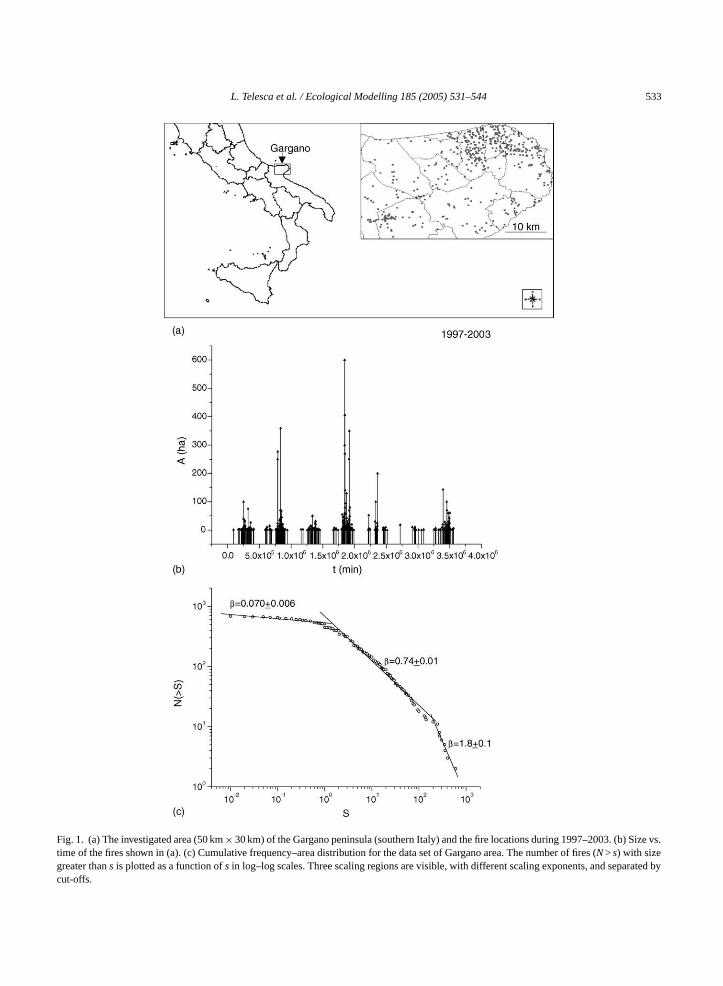
Fig. 1. (a) The investigated area (50 km× 30 km) of the Gargano peninsula (southern Italy) and the fire locations during 1997–2003. (b) Size vs.time of the fires shown in (a). (c) Cumulative frequency–area distribution for the data set of Gargano area. The number of fires (N>s) with sizegreater thans is plotted as a function ofs in log–log scales. Three scaling regions are visible, with different scaling exponents, and separated bycut-offs.
534 L. Telesca et al. / Ecological Modelling 185 (2005) 531–544
quent. The spatial distribution of fires mainly involvestwo distinct parts, in the northeast and southwest ofthe study area, which are characterized by more than1 event km−2 year−1 (Amatulli et al., 2004). The highdensity of wildfires characterizes this area as one of themost severely affected of the Italian territory. More-over, most of the area is included within the GarganoNational Park; therefore, protection and preservationagainst wildfires is necessary.
3. Forest-fire data
Forest-fire data have been extracted by the forest-fire fighting service in Italy. On the Internet sitehttp://www.corpoforestale.it, the reader can find all theinformation regarding the forest-fire archive.
The data consist of 688 fires (occurrence times andburned areas) recorded during seven years of observa-tion (1997–2003).Fig. 1a shows the spatial distributionof the data.Fig. 1b shows the size of fires versus time.The size of burned area ranges between 0.01 ha and600 ha.Fig. 1c shows the number of fires in Garganoarea with size greater thansas a function ofs, plottedin log–log space. By visual inspection, we can identifythree power-law regions. In each region, the estimate ofthe scaling exponent and its error has been performedby estimating the slope of the line that fits by the leastsquare method the curve in the log–log space. The firstregion, ranging from the smallest size to about 1 ha,h n,r g ex-p hel yb edp ev-e twoo rticu-l gioni osttL
cu-m thata stedb ede all
burned area are regularly recorded by the forest ser-vice. This leads to an incomplete data set at smallsizes, which makes the scaling exponent to decreaserespect to the value estimated at intermediate sizes. In-stead, fires of large sizes, due to negative economicand social effects, are reduced by the massive humanintervention. This causes that less than expected largefires occur, thus producing that the scaling exponentincreases.Reed and McKelvey (2002), using the con-cept of extinguishments growth rate (EGR), presenteda four-parameter ‘competing hazards’ model providingthe overall best fit.
In our case, the data set analysed, which consistsof all fires with sizes equal or larger than 0.01 ha, can-not be considered incomplete at small sizes, due to theaccurate method of recording wildfires of the Italianforest-fire fighting service.
In a recent paper,Ricotta et al. (2001)have ob-served that this multiple power-law behaviour, denotedby the presence of different scaling size ranges delim-ited by cut-offs, is due to dynamical changes, linked to“more or less abrupt changes in the landscape-specificprocess–pattern interactions that control wildfire prop-agation, rather than statistical inaccuracies”. Therefore,the appearance of different size ranges with differ-ent scaling exponents can be accounted for differentpower-law dynamics, involving climatic, vegetational,and human factors as well as physical conditions andtopographic features.
4
4
ationo cessd ns int db
um-b teds phe-n velyl 5;T ti-g s thep on
as scaling exponent 0.070± 0.006; the second regioanging between 1 ha and about 140 ha, has scalinonent 0.74± 0.01; the third region, from 140 ha to t
argest size, has scaling exponent 1.8± 0.1. The study Ricotta et al. (2001)shows an analysis of restrictower-law wildfire frequency–area distribution of sral wildfire time series in the Mediterranean, andr three scaling regions have been detected. In pa
ar, our value of scaling exponent in the second res consistent with the estimation performed in almhe same size range byRicotta et al. (1999)regardingiguria (northern Italy) wildfire sequence.
Why do different scaling regions appear in theulative frequency–area distribution? It is obvioussimple power-law distribution of sizes, as suggey Malamud et al. (1998), is too simple to describe thistribution of the sizes over their full range.Ricottat al. (1999)suspected that not all the fires with sm
. Formulation of the statistical methods
.1. Representations of the forest-fire process
A forest-fire sequence can be viewed as a realizf a stochastic point process. A stochastic point proescribes events that occur at some random locatio
ime (Cox and Isham, 1980) and is completely definey the set of the event times.
A point process may be called fractal when a ner of its relevant statistics exhibit scaling with relacaling exponents, that indicate the representedomenon contain clusters of points over a relati
arge set of timescales (Lowen and Teich, 1993, 199eich et al., 1996). The standard method to invesate the presence of clustering in a time series iower spectral density, which furnishes information
L. Telesca et al. / Ecological Modelling 185 (2005) 531–544 535
how the power of the process is concentrated at variousfrequency bands. The power spectral density is calcu-lated by Fourier transforming the data, and thus al-lows detecting periodic, multiperiodic or no-periodicbehaviors. The power spectral density of a processwith scaling properties follows a power-law behaviourS(f) ∝ f−α, with the so-called fractal exponentα mea-suring the strength of the clustering. The clustering be-haviour of a point process leads to a power-law (frac-tal) shape of some of the statistics, used to describeits properties (Thurner et al., 1997), and that allowsestimating the fractal exponentα (Lowen and Teich,1995; Teich et al., 1996), whose numerical value isan index of the presence of clusterization within theprocess (Lowen and Teich, 1993). If the point pro-cess is Poissonian, the event occurrence times are un-correlated; for this memoryless processα ≈ 0. On theother side,α �= 0 is typical of point processes with self-similar behaviour; self-similar meaning that parts ofthe whole can be made to fit to the whole in some wayby scaling (Mandelbrot, 1982). Thus, we can under-stand that the estimation of the fractal exponentα fora fire sequence plays an important role in the generalcharacterization of the mechanism underlying the firephenomenon.
The analysis of the temporal properties of a fire se-quence implies that this sequence is appropriately de-scribed, in order to apply to it statistical methods ableto reveal the presence of clusterization. A discrete-timeprocess can be derived from the stochastic point processi mes . Int medb fe e-s cedca str t-i derst umest thee spikei f thet
sta-t lyze
its time behavior, and, in particular, to recognise timeclustering properties. In the following subsections wewill describe five methods: two of them (coefficientof variation and interevent-interval histogram) are re-lated to the interevent interval representation, while theremaining three (Allan Factor, Fano Factor and count-based periodogram) are related to the counting processrepresentation. These methods have been extensivelyused to analyze the time-clustering properties of earth-quake sequences and have been reviewed inTelesca etal. (2002).
4.2. Methods
Several statistical measures can be used to character-ize the time properties of a forest-fire point process. Weused five different measures: interevent-interval his-togram (IIH), coefficient of variation (CV), Fano Factor(FF), Allan Factor (AF) and count-based periodogram(PG).
Since statistics of all orders are necessary to defineuniquely a stochastic point process, these five mea-sures, being first- and second-order measures, do notprovide complete information about the process. Nev-ertheless, when used in conjunction they are useful forproviding a basic characterization of the process on alltimescales. We describe them.
4.2.1. Coefficient of variation (CV)A commonly used measure to evaluate the cluster-
i t ofv
C
wi com-p -c sn heret teredp an bed rn-i
4tes
t val
n two equivalent ways: (1) using the interevent tieries or (2) forming its relative counting processhe first representation a discrete-time series is fory the ruleτ i = ti+1 − ti , whereti indicates the time ovent numbered by the indexi. In the second reprentation, the time axis is divided into equally spaontiguous counting windows of durationT to producesequence of counts{Nk(T)}, whereNk(T) represent
he number of events falling into thekth window of du-ationT. The durationT of the window is called counng time or timescale. The latter approach consihe fire events as the events of interest and asshat there is an objective clock for the timing ofvents. The former approach emphasizes the inter
ntervals and uses the event number as an index oime.
Both representations allow us applying severalistical techniques to a fire sequence, in order to ana
ng behaviour of a point process is the coefficienariationCV, defined as
V = στ
〈τ〉 , (1)
here〈τ〉 is the mean of the interevent times andστ
s the standard deviation: a Poissonian process (letely random) has aCV = 1, but a clusterized proess is characterized by aCV > 1. This coefficient doeot give information about the timescale ranges w
he process can be reliably characterized as a clusrocess. Nevertheless, a complex phenomenon ceeply known only if the different timescales gove
ng its dynamics are well understood.
.2.2. Interevent-interval histogram (IIH)The interevent-interval histogram (IIH) estima
he probability density function of interevent-inter
536 L. Telesca et al. / Ecological Modelling 185 (2005) 531–544
magnitude, and illustrates the relative frequency of oc-currence of an interevent-interval of sizeτ. The IIH(τ)completely describes the behavior of the point pro-cess only if the interevent intervals are independent andidentically distributed random variables, like in Poissonprocess (Thurner et al., 1997); in fact, for this memory-less process, the occurrence times are uncorrelated, andthe IIH(τ) behaves as a decreasing exponential functionλe−τλ of the interevent-intervalτ, for τ ≥ 0, withλ themean rate of the process. For a fractal (with clusteringproperties) process the IIH(τ) generally has a power-law dependence on the interevent-intervalτ (Thurneret al., 1997).
4.2.3. Fano Factor (FF)The Fano Factor (FF) is defined as the variance of
the number of events in a specified counting time ortimescaleT divided by the mean number of events inthat counting time; that is
FF(T ) = 〈N2k (T )〉 − 〈Nk(T )〉2
〈Nk(T )〉 , (2)
where〈· · ·〉 indicate the average value. In order to eval-uate the presence of scaling, the timescaleT is variedand a relationship FF(T) ∼ T is obtained.
The FF(T) of a fractal point process with 0 <α <1varies as a function of counting timeT as:
F
(T
)α
nta-t ales(t -r overa ,1o rencett ig-ns eg-l et r-lawf aru
4.2.4. Allan Factor (AF)Another measure, related to the variability of suc-
cessive counts, useful to detect the event clustering ina point process, is the Allan Factor (AF) (Allan, 1966),defined as the variance of successive counts for a speci-fied counting timeTdivided by twice the mean numberof events in that counting time
AF(T ) = 〈(Nk+1(T ) − Nk(T ))2〉2〈Nk(T )〉 . (4)
This measure reduces the effect of possible nonsta-tionarity of the point process, because it is defined interms of the difference of successive counts. As for theFF, varying the timescaleT allows producing a rela-tionship between AF(T) andT, useful to detect scalingbehavior in the sequence.
The AF of a fractal point process varies with thecounting timeT with a power-law form:
AF(T ) = 1 +(
T
T1
)α
(5)
with 0 <α < 3 over a large range of counting timesT(Lowen and Teich, 1995); T1 is the fractal onset timefor the AF and is estimated as the crossover timescalebetween Poissonian and scaling behaviors. It is relatedto T0 by (Teich et al., 1997)
Tα0 T−α
1 = 2 − 2α (6)
As for FF, AF assumes values near unity for Poissonp
4,
1 thec esti-m sa ivesi on-c ationo pliest m-bs andt ts oft Gen-e FT)t r
F(T ) = 1 +T0
. (3)
The monotonic power-law increase is represeive of the presence of fluctuations on many timescLowen and Teich, 1995). The scaling exponentα ishe so-called fractal exponent. Ifα > 0 then the repesented phenomenon contains clusters of pointsrelatively large set of timescales (Lowen and Teich
993, 1995; Teich et al., 1996). If α ≈ 0, the forest-fireccurrence process is Poissonian and the occur
imes are uncorrelated. The crossover timescaleT0 ishe fractal onset time, and marks the lower limit for sificant scaling behavior in the FF (Teich et al., 1996),o that forT� T0 the clustering property becomes n
igible at these timescales. Thus,T0 is estimated as thimescale over which the FF increases as a poweunction of the timescaleT. FF assumes values nenity for Poisson processes.
rocesses.
.2.5. Count-based periodogram (PG)The count-based periodogram (PG) (Teich et al.
997), that is the periodogram of the sequence ofounts, is another statistical measure that allowsating the fractal exponentα. This measure performn estimate of the power spectral density, which g
nformation on how the power of the process is centrated at various frequency bands. The calculf the PG by means of a count-based approach im
he division of the total observation period into a nuerN of nonoverlapping windows of lengthTW. Theequence of the counts is then Fourier transformedhe PG is obtained by the squares of the coefficienhe Fourier representation of the series of counts.rally, in order to use the fat Fourier transform (F
he numberNof the windows of durationTW is a powe
L. Telesca et al. / Ecological Modelling 185 (2005) 531–544 537
of two. For point processes with scaling properties thePG decreases as a power-law function of the frequencyf over a significant range of frequencies,S(f) ∝ f−α. Ofcourse, for a finite size fractal real process the powerspectral density behaves as an inverse power-law func-tion in a limited range of frequencies, approaching anasymptotic value at high frequencies, at which the be-haviour of the process can be considered Poissonian.The numerical value ofα is an indicator of the presenceof clusterization in the process (Thurner et al., 1997).If the point process is Poissonian, the occurrence timesare uncorrelated; for this memoryless process, the PG isapproximately flat for any frequency bands andα ≈ 0.On the other side,α �= 0 is typical of point processeswith scaling behavior. This method introduces a biasat higher frequencies, since the fine time resolutioninformation is lost as a result of the minimum count-window size. But, the estimation of the exponentαprin-cipally involves lower frequencies where this bias isnegligible.
4.3. Discussion about the measures
All the analysed measures describe the temporalproperties of the fire event distribution. These statisticsplay the role of detecting the presence of time clus-tering in the time-occurrence sequence of forest-fires.The coefficient of variation represents a first indica-tor of the presence of clustering in a point process.It only discriminates between clusterised and Poisso-n tiona ringb so hatq pro-cat es ini or-m s oft wer-la tua-t enceo th-m es inw
αA are respectively the estimates of the fractal expo-nentα, calculated by the slope of the best line fittingthe log–log FF and AF curves in their linear ranges.Both the measures can supply the estimate of the so-called fractal onset time that represents the crossovertimescale between Poissonian and clusterized behav-ior. The FF and the PG are measures that are sensitiveto nonstationarity in the data, while the AF, dependingon the variance of the differences between successivecounts, can deal nonstationary sequences.
5. Results analysis
Now we analyze the time-scaling properties of thedistribution of the forest-fire sequence occurred inGargano area (southern Italy) from 1997 to 2003.
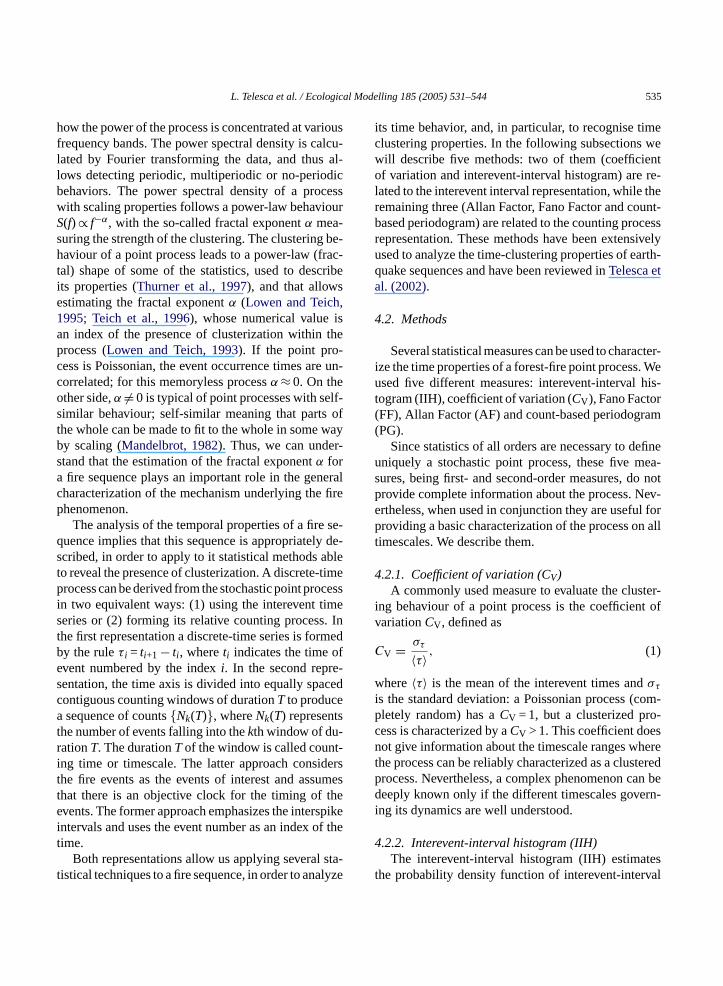
Fig. 2 shows the interevent times of the whole se-quence: the annual clusters are clearly visible and sep-arated by the highest interevent intervals. The coef-ficient of variationCV ≈ 4.2 indicates strong time-clusterization of the events.
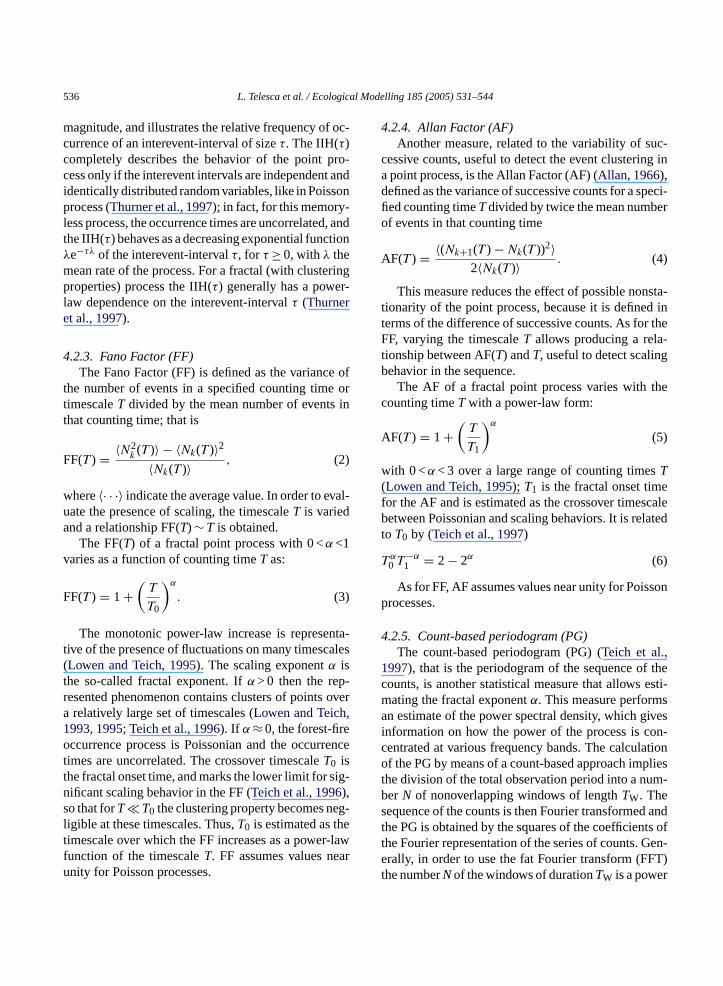
Fig. 3shows the interevent interval histogram (IIH)plotted in log–log scales; the log–log IIH has been fittedwith a linear function for interevent times up to approx-imately 104.7min (∼35 days), furnishing an estimate ofthe fractal exponentαp ≈ 0.76. It is also visible a spikeat around 105.3min (∼4.6 months), corresponding tothe mean duration of the winter season, not character-ized by occurrence of fires.
Fc coeffi-c ep
ian sequences, but it does not convey any informabout what timescales are involved in the clusteehaviour. The fractal exponentα, estimated by meanf the IIH or FF (or AF or PG), is a parameter tuantifies the clustering phenomenon in a pointess. For a fractal point process, the IIH(τ) ∝ τ−(1+αp)
llows estimating the fractal exponentαp, whereαp ishe estimate of the fractal exponentα, calculated by thlope of the best line fitting the log–log IIH curvets scaling range. But the IIH can only provide inf
ation about the underlying process for timescalehe same order of the interevent intervals. The poaw increasing behavior of both FF and AF (Eqs.(3)nd (5)) is representative of the presence of fluc
ions on many timescales, and therefore the presf clusterization. Plotting the FF and AF in bilogariic scales, we can recognize the timescale ranghich FF(T ) ∝ TαF and AF(T ) ∝ TαA , whereαF and
ig. 2. Interevent time series of the data plotted inFig. 1. Annuallusters are separated by the largest interevent intervals. Theient of variationCV ≈ 4.2, calculated by using Eq.(1), indicates thresence of strong time-clusterization of the events.
538 L. Telesca et al. / Ecological Modelling 185 (2005) 531–544
Fig. 3. log–log plot of the interevent interval histogram (IIH) for thedata plotted inFig. 2. For interevent timesτ ranging between about103.4 min (∼1.7 days) to approximately 104.7 min (∼35 days) the IIHshows a power-law behavior with scaling exponentαp = 0.76± 0.18.The scaling exponent and its uncertainty have been calculated fittingby the least square method a straight line to the IIH, plotted in log–logspace, in its linear region. The spike located at around 105.3 min (∼4.6months) corresponds to the mean duration of the winter season, notcharacterized by occurrence of fires.
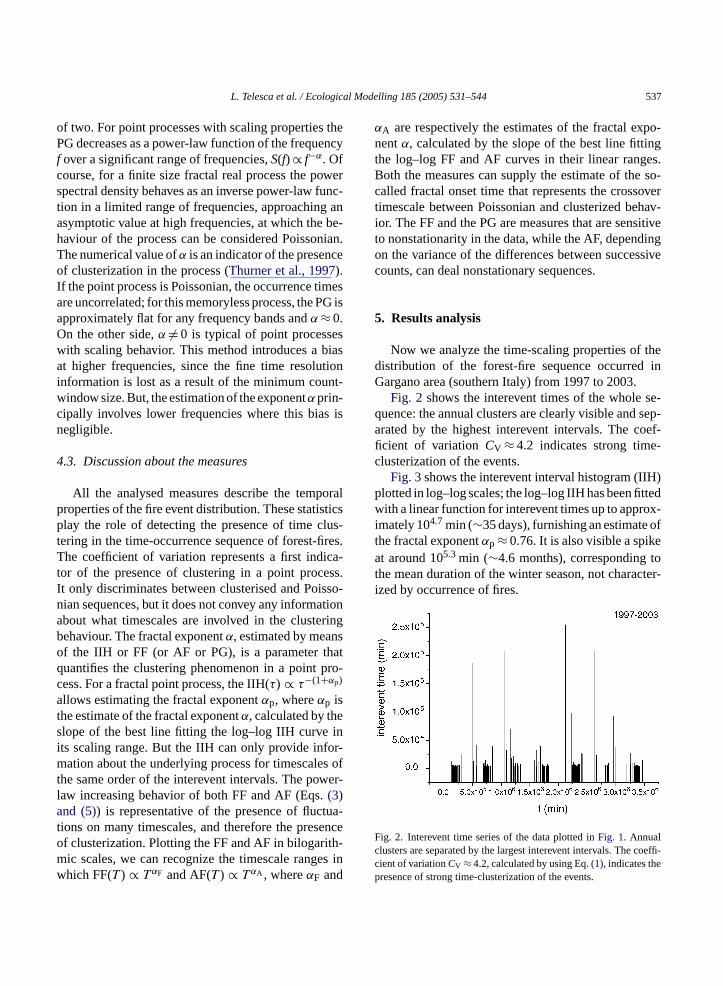
We computed the FF and the AF for timescalesTfrom 30 min toP/10, whereP is the total period of thesequence. The log–log FF (Fig. 4) clearly shows power-law behavior, because it increases linearly from approx-
Fig. 4. log–log plot of the Fano Factor (FF) of the 1997–2003 timeoccurrence sequence of fires in Gargano. The curve is obtained us-ing Eq.(2) for timescalesT ranging between 30 min toP/10, whereP indicates the total period of the sequence. From the timescaleT∼ 103.5 min (∼2 days), the behaviour of the curve is linear, withscaling exponentαFF = 0.676± 0.003. The scaling exponent and itsuncertainty have been calculated fitting by the least square method astraight line to the FF curve in its linear region.
Fig. 5. log–log plot of the Allan Factor (AF) of the 1997–2003 timeoccurrence sequence of fires in Gargano. The curve is obtained us-ing Eq.(4) for timescalesT ranging between 30 min toP/10, whereP indicates the total period of the sequence. From the timescaleT> 103.7 min (∼3.5 days) the curve has a linear increase, with scalingexponentαAF = 0.98± 0.01. The scaling exponent and its uncertaintyhave been calculated fitting by the least square method a straight lineto the AF curve in its linear region.
imately 103.5min (∼2 days). The scaling exponentαFF,estimated as the slope of the line that fits by the leastsquare method the linear region, is approximately 0.68;this indicates the presence of time-correlated structuresin the forest-fire series examined.
Fig. 5 shows the results of AF analysis. Thescaling region, linear in log–log scales, is visiblefrom T> 103.7min (∼3.5 days), with scaling exponentαAF ≈ 0.98. The AF curve is more irregular and rougherthan the FF curve, because the AF is defined as differ-ence of counts.
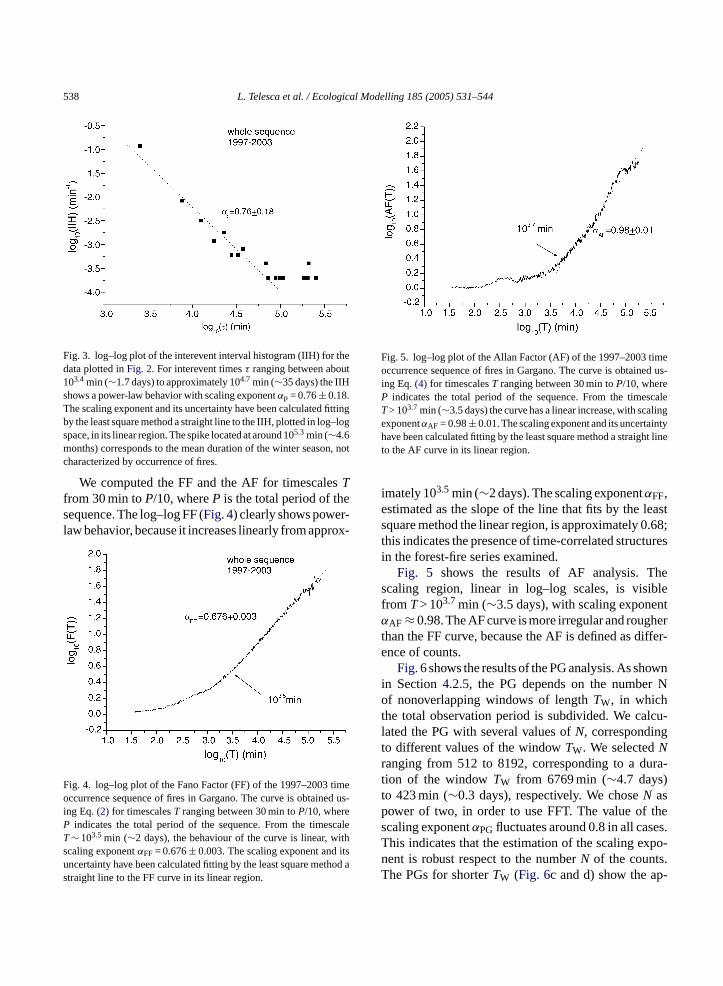
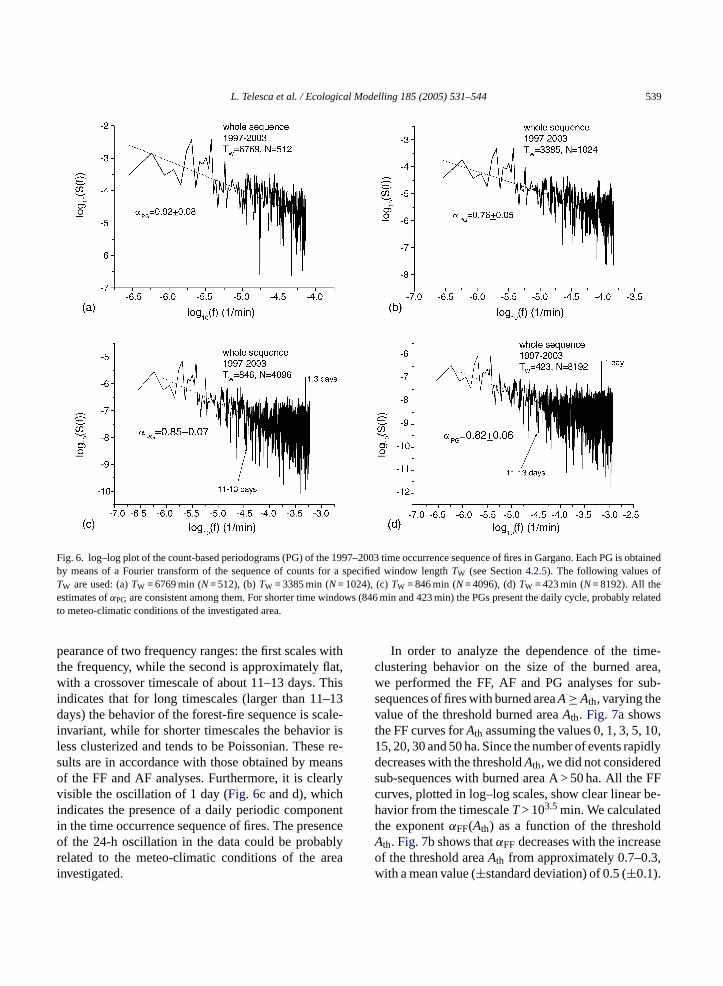
Fig. 6shows the results of the PG analysis. As shownin Section4.2.5, the PG depends on the number Nof nonoverlapping windows of lengthTW, in whichthe total observation period is subdivided. We calcu-lated the PG with several values ofN, correspondingto different values of the windowTW. We selectedNranging from 512 to 8192, corresponding to a dura-tion of the windowTW from 6769 min (∼4.7 days)to 423 min (∼0.3 days), respectively. We choseN aspower of two, in order to use FFT. The value of thescaling exponentαPGfluctuates around 0.8 in all cases.This indicates that the estimation of the scaling expo-nent is robust respect to the numberN of the counts.The PGs for shorterTW (Fig. 6c and d) show the ap-
L. Telesca et al. / Ecological Modelling 185 (2005) 531–544 539
Fig. 6. log–log plot of the count-based periodograms (PG) of the 1997–2003 time occurrence sequence of fires in Gargano. Each PG is obtainedby means of a Fourier transform of the sequence of counts for a specified window lengthTW (see Section4.2.5). The following values ofTW are used: (a)TW = 6769 min (N= 512), (b)TW = 3385 min (N= 1024), (c)TW = 846 min (N= 4096), (d)TW = 423 min (N= 8192). All theestimates ofαPG are consistent among them. For shorter time windows (846 min and 423 min) the PGs present the daily cycle, probably relatedto meteo-climatic conditions of the investigated area.
pearance of two frequency ranges: the first scales withthe frequency, while the second is approximately flat,with a crossover timescale of about 11–13 days. Thisindicates that for long timescales (larger than 11–13days) the behavior of the forest-fire sequence is scale-invariant, while for shorter timescales the behavior isless clusterized and tends to be Poissonian. These re-sults are in accordance with those obtained by meansof the FF and AF analyses. Furthermore, it is clearlyvisible the oscillation of 1 day (Fig. 6c and d), whichindicates the presence of a daily periodic componentin the time occurrence sequence of fires. The presenceof the 24-h oscillation in the data could be probablyrelated to the meteo-climatic conditions of the areainvestigated.
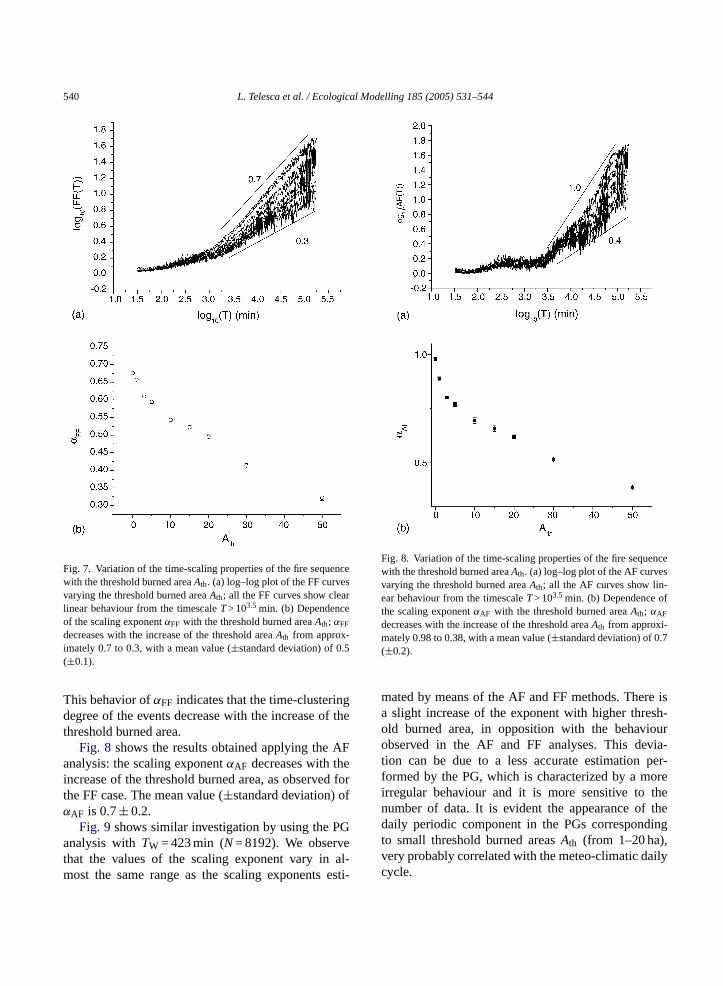
In order to analyze the dependence of the time-clustering behavior on the size of the burned area,we performed the FF, AF and PG analyses for sub-sequences of fires with burned areaA≥ Ath, varying thevalue of the threshold burned areaAth. Fig. 7a showsthe FF curves forAth assuming the values 0, 1, 3, 5, 10,15, 20, 30 and 50 ha. Since the number of events rapidlydecreases with the thresholdAth, we did not consideredsub-sequences with burned area A > 50 ha. All the FFcurves, plotted in log–log scales, show clear linear be-havior from the timescaleT> 103.5min. We calculatedthe exponentαFF(Ath) as a function of the thresholdAth. Fig. 7b shows thatαFF decreases with the increaseof the threshold areaAth from approximately 0.7–0.3,with a mean value (±standard deviation) of 0.5 (±0.1).
540 L. Telesca et al. / Ecological Modelling 185 (2005) 531–544
Fig. 7. Variation of the time-scaling properties of the fire sequencewith the threshold burned areaAth. (a) log–log plot of the FF curvesvarying the threshold burned areaAth; all the FF curves show clearlinear behaviour from the timescaleT> 103.5 min. (b) Dependenceof the scaling exponentαFF with the threshold burned areaAth; αFF
decreases with the increase of the threshold areaAth from approx-imately 0.7 to 0.3, with a mean value (±standard deviation) of 0.5(±0.1).
This behavior ofαFF indicates that the time-clusteringdegree of the events decrease with the increase of thethreshold burned area.
Fig. 8 shows the results obtained applying the AFanalysis: the scaling exponentαAF decreases with theincrease of the threshold burned area, as observed forthe FF case. The mean value (±standard deviation) ofαAF is 0.7± 0.2.
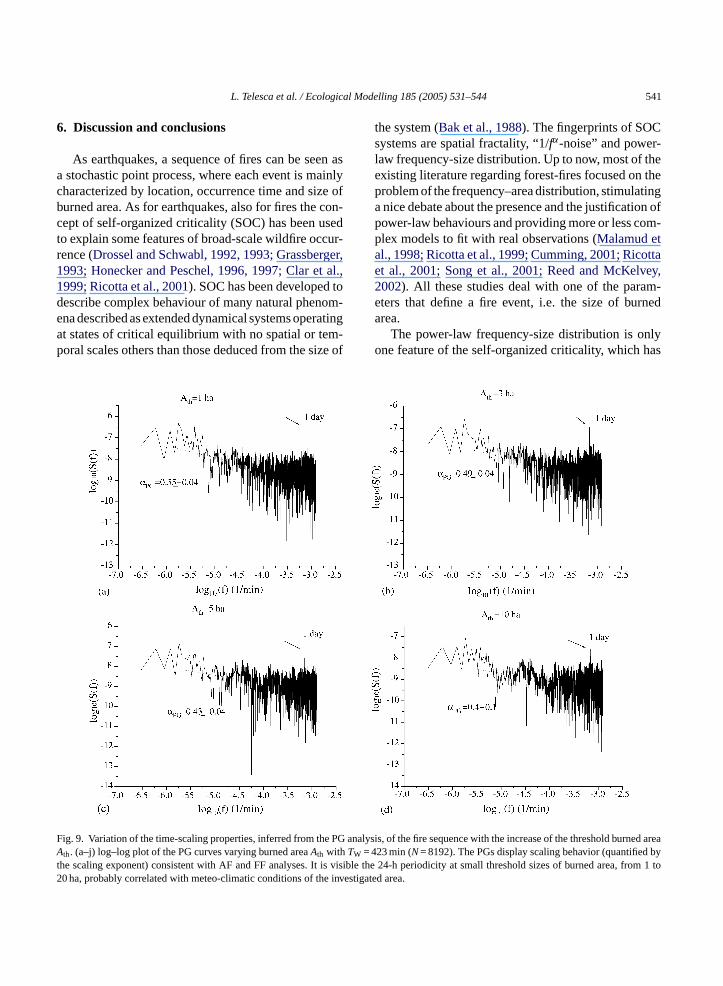
Fig. 9 shows similar investigation by using the PGanalysis withTW = 423 min (N= 8192). We observethat the values of the scaling exponent vary in al-most the same range as the scaling exponents esti-
Fig. 8. Variation of the time-scaling properties of the fire sequencewith the threshold burned areaAth. (a) log–log plot of the AF curvesvarying the threshold burned areaAth; all the AF curves show lin-ear behaviour from the timescaleT> 103.5 min. (b) Dependence ofthe scaling exponentαAF with the threshold burned areaAth; αAF
decreases with the increase of the threshold areaAth from approxi-mately 0.98 to 0.38, with a mean value (±standard deviation) of 0.7(±0.2).
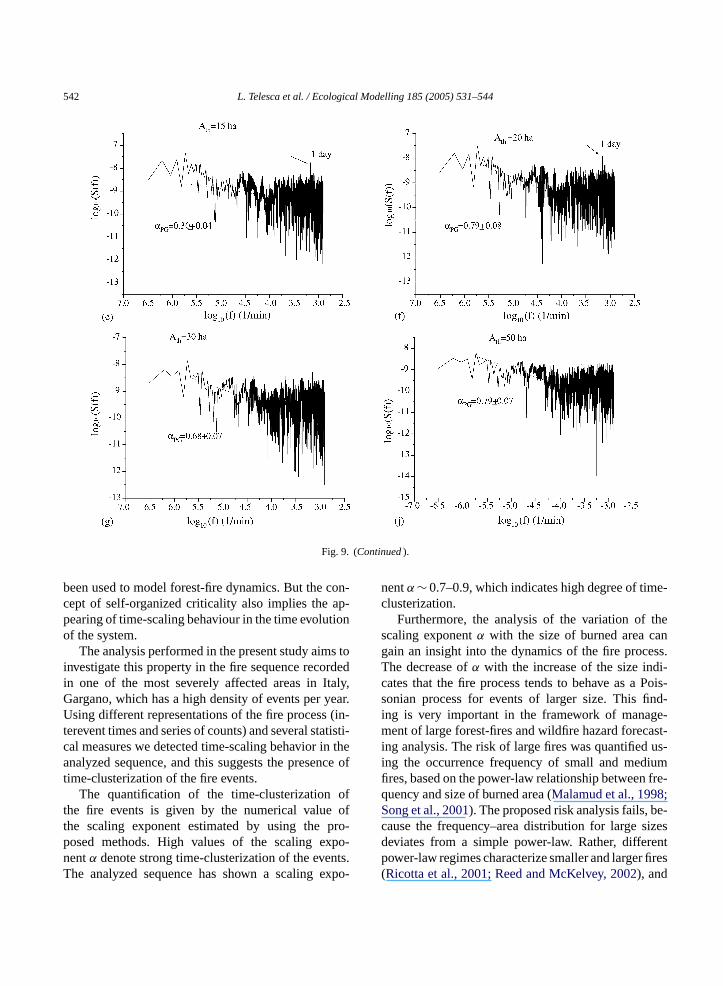
mated by means of the AF and FF methods. There isa slight increase of the exponent with higher thresh-old burned area, in opposition with the behaviourobserved in the AF and FF analyses. This devia-tion can be due to a less accurate estimation per-formed by the PG, which is characterized by a moreirregular behaviour and it is more sensitive to thenumber of data. It is evident the appearance of thedaily periodic component in the PGs correspondingto small threshold burned areasAth (from 1–20 ha),very probably correlated with the meteo-climatic dailycycle.
L. Telesca et al. / Ecological Modelling 185 (2005) 531–544 541
6. Discussion and conclusions
As earthquakes, a sequence of fires can be seen asa stochastic point process, where each event is mainlycharacterized by location, occurrence time and size ofburned area. As for earthquakes, also for fires the con-cept of self-organized criticality (SOC) has been usedto explain some features of broad-scale wildfire occur-rence (Drossel and Schwabl, 1992, 1993; Grassberger,1993; Honecker and Peschel, 1996, 1997; Clar et al.,1999; Ricotta et al., 2001). SOC has been developed todescribe complex behaviour of many natural phenom-ena described as extended dynamical systems operatingat states of critical equilibrium with no spatial or tem-poral scales others than those deduced from the size of
the system (Bak et al., 1988). The fingerprints of SOCsystems are spatial fractality, “1/fα-noise” and power-law frequency-size distribution. Up to now, most of theexisting literature regarding forest-fires focused on theproblem of the frequency–area distribution, stimulatinga nice debate about the presence and the justification ofpower-law behaviours and providing more or less com-plex models to fit with real observations (Malamud etal., 1998; Ricotta et al., 1999; Cumming, 2001; Ricottaet al., 2001; Song et al., 2001; Reed and McKelvey,2002). All these studies deal with one of the param-eters that define a fire event, i.e. the size of burnedarea.
The power-law frequency-size distribution is onlyone feature of the self-organized criticality, which has
FAt2
ig. 9. Variation of the time-scaling properties, inferred from the PG an
th. (a–j) log–log plot of the PG curves varying burned areaAth with TW = 4he scaling exponent) consistent with AF and FF analyses. It is visib0 ha, probably correlated with meteo-climatic conditions of the inves
alysis, of the fire sequence with the increase of the threshold burned area23 min (N= 8192). The PGs display scaling behavior (quantified byle the 24-h periodicity at small threshold sizes of burned area, from 1 totigated area.
542 L. Telesca et al. / Ecological Modelling 185 (2005) 531–544
Fig. 9. (Continued).
been used to model forest-fire dynamics. But the con-cept of self-organized criticality also implies the ap-pearing of time-scaling behaviour in the time evolutionof the system.
The analysis performed in the present study aims toinvestigate this property in the fire sequence recordedin one of the most severely affected areas in Italy,Gargano, which has a high density of events per year.Using different representations of the fire process (in-terevent times and series of counts) and several statisti-cal measures we detected time-scaling behavior in theanalyzed sequence, and this suggests the presence oftime-clusterization of the fire events.
The quantification of the time-clusterization ofthe fire events is given by the numerical value ofthe scaling exponent estimated by using the pro-posed methods. High values of the scaling expo-nentα denote strong time-clusterization of the events.The analyzed sequence has shown a scaling expo-
nentα ∼ 0.7–0.9, which indicates high degree of time-clusterization.
Furthermore, the analysis of the variation of thescaling exponentα with the size of burned area cangain an insight into the dynamics of the fire process.The decrease ofα with the increase of the size indi-cates that the fire process tends to behave as a Pois-sonian process for events of larger size. This find-ing is very important in the framework of manage-ment of large forest-fires and wildfire hazard forecast-ing analysis. The risk of large fires was quantified us-ing the occurrence frequency of small and mediumfires, based on the power-law relationship between fre-quency and size of burned area (Malamud et al., 1998;Song et al., 2001). The proposed risk analysis fails, be-cause the frequency–area distribution for large sizesdeviates from a simple power-law. Rather, differentpower-law regimes characterize smaller and larger fires(Ricotta et al., 2001; Reed and McKelvey, 2002), and
L. Telesca et al. / Ecological Modelling 185 (2005) 531–544 543
a multiple power-law behavior features the cumulativefrequency–area relationship, as stressed in our analy-sis. A more accurate risk analysis of occurrence of largefires can be based on the investigation of the temporalproperties of a fire sequence. In fact, recognizing thatlarge fires tends to follow a Poissonian dynamics can beused as an effective tool for wildfire hazard analysis,by means of the calculation of the probability of oc-currence of large fires, similarly to earthquake hazardanalyses.
It is interesting the detection of the daily frequencyof occurrence of fires, performed by means of the PGmethod. Varying the threshold size of burned area, wefound that this periodicity characterizes only small tomedium fires, while is absent in sequences of large fires.The cause of such periodicity is not well understood,and probably could be put in relation to meteo-climaticconditions of the area investigated. In any case, indi-rectly confirming the indication provided byMalamudet al. (1998), this daily frequent burning of small tomedium fires could prevent the accumulation of com-bustible materials in forests, which is one of the maincauses of very large fires.
Acknowledgements
The authors wish to thank D. Pontani and G.Saragosa of the Italian National Forestry Servicef enf llaR pod ra”(
R
A roc.
A 4.er-co-ain,
B lity.
B ts on
Carson, M., Langer, J.S., 1989. Mechanical model of an earthquakefault. Phys. Rev. A 40, 6470–6484.
Clar, S., Drossel, B., Schenk, K., Schwabl, F., 1999. Self-organizedcriticality in forest-fire models. Physica A 266, 153–159.
Cochrane, M.A., Alencar, A., Schulze, M.D., Souza Jr., C.M., Nep-stad, D.C., Lefebvre, P., Davidson, E.A., 1999. Positive feedbackin the fire dynamic of closely canopy tropical forests. Science284, 1832.
Cox, D.R., Isham, V., 1980. Point Processes. Chapman and Hall,London.
Crutzen, P.J., Delany, A., Greenberg, J., Haagenson, P., Heidt, L.,Lueb, R., Pollock, W., Seiler, W., Wartburg, A., Zimmerman,P., 1985. Tropospheric chemical composition measurements inBrazil during the dry season. J. Atmos. Chem. 2, 233–256.
Cumming, S.G., 2001. A parametric model of fire-size distribution.Can. J. For. Res. 31, 1297–1303.
Drossel, B., Schwabl, F., 1992. Self-organized critical forest-firemodel. Phys. Rev. Lett. 69, 1629–1992.
Drossel, B., Schwabl, F., 1993. Self-organization in a forest-firemodel. Fractals 1, 1022–1029.
FAO, 2001. Global forest fire assessment 1990–2000. ForestResources Assessment Programme, working paper no. 55,http://www.fao.org/forestry/fo/fra/docs/Wp55eng.pdf.
Garcıa-Cano, M.F., Cortina, J., De Luıs, M., Raventos, J., Sanchez,J.R., Gonzalez-Hildalgo, J.C., 1998. Nutrient losses in Mediter-ranean gorse, shurbland affected by fire and high intensity rain-falldkjdot. In: II International Conference on Forest Fire Re-search, ADAI, Coimbra, Portugal, vol. 2, pp. 1345–1359.
Grassberger, P., 1993. On a self-organized critical forest-fire model.J. Phys. A 26, 2081–2089.
Greenberg, J., Zimmerman, P., Heidt, L., Pollock, W., 1984. Hydro-carbon and carbon monoxide emissions from biomass burning inBrazil. J. Geophys. Res. 89, 2201–2207.
Guido, R., Van derr Werf, J.T., Randerson, G., James Collatz, L.,Giglio, P.S., Kasibhatla, A.F., Arellano Jr., S., Olsen, C., Ka-
mis-nce
H l ando-
r theical
H one-
H in the.
L anal-Frac-
L ctal
L ctal
M res:281,
or providing fire data archive. This work has beunded by the MIUR (Ministero dell’Istruzione e deicerca) within the framework of the project “Svilupei distretti industriali di osservazioni della Ter2002–2005).
eferences
llan, D.W., 1966. Statistics of atomic frequency standards. PIEEE 54, 221–230.
matulli, O.G., Lovreglio, R., Perez-Cabello, F., Leone, V., 200Estimating fire ignition points density by the adaptive knel method. In: II International Symposium on Fire Enomics, Planning and Policy: A Global Vision, Cordoba, Sp19–22/05/2004.
ak, P., Tang, C., Wiesenfeld, K., 1988. Self-organized criticaPhys. Rev. A 38, 364–374.
ak, P., Chen, K., 1990. A forest-fire model and some thoughturbulence. Phys. Lett. A 147, 297–300.
sischke, E.S., 2004. Continental-Scale partitioning of fire esions during the 1997–2001 El Nino/La Nina period. Scie303, 73–76.
ao, W.M., Liu, M.-H., Crutzen, P.J., 1990. Estimates of annuaregional fire releases of CO2 and other trace gases to the atmsphere from fires in the tropics based on FAO statistics foperiod 1975–1980. In: Goldammer, J.G. (Ed.), Fires in TropBiota. Springer-Verlag, Berlin, pp. 440–462.
onecker, A., Peschel, I., 1996. Critical properties of thedimensional forest-fire model. Physica A 229, 478–500.
onecker, A., Peschel, I., 1997. Length scales and power lawstwo-dimensional forest-fire model. Physica A 239, 509–530
asaponara, R., Santulli, A., Telesca, L., 2005. Time-clusteringysis of forest-fire sequence in southern Italy. Chaos Solitonstals 24, 139–149.
owen, S.B., Teich, M.C., 1993. Estimating the dimension of a frapoint process. SPIE Chaos Biol. Med. 2036, 64–67.
owen, S.B., Teich, M.C., 1995. Estimation and simulation of frastochastic point processes. Fractals 3, 183–210.
alamud, B.D., Morein, G., Turcotte, D.L., 1998. Forest fian example of self-organized critical behavior. Science1840–1841.
544 L. Telesca et al. / Ecological Modelling 185 (2005) 531–544
Mandelbrot, B.B., 1982. The Fractal Geometry of Nature. FreemanPress, San Francisco.
Perez, B., Moreno, J.M., 1998. Methods for quantying fire severityin shrubland fires. Plant Ecol. 139, 91–101.
Reed, W.J., McKelvey, K.S., 2002. Power-law behaviour and para-metric models for the size-distribution of forest fires. Ecol.Model. 150, 239–254.
Ricotta, C., Avena, G., Marchetti, M., 1999. The flaming sandpile:self-organized criticality and wildfires. Ecol. Model. 119, 73–77.
Ricotta, C., Arianoutsou, M., Dıaz-Delgado, R., Duguy, B., Lloret, F.,Maroudi, E., Mazzoleni, S., Moreno, J.M., Rambal, S., Vallejo,R., Vazquez, A., 2001. Self-organized criticality of wildfires eco-logically revisited. Ecol. Model. 141, 307–311.
San-Miguel-Ayanz, J., Barbosa, P., Schmuck, G., Liberta, G., 2002.Towards a coherent forest fire information system in Europe: theEuropean Forest Fire Information System (EFFIS). In: Viegas(Ed.), Forest Fire Research & Wildland Fire Safety. Millpress,Rotterdam.
Schenk, K., Drossel, B., Clar, S., Schwabl, F., 2000. Finite-size ef-fects in the self-organized critical forest-fire model. Eur. Phys. J.15, 177–185.
Solari, P., Siccardi, F., 1998. Soil degradation and erosion in a smallMediterranean watersheds: non-linear interaction between for-est fire extreme rainfall processes. In: Proceeding of the II Inter-national Conference on Forest Fire Research, ADAI, Coimbra,Portugal, vol. 2, pp. 1333–1344.
Song, W., Weicheng, F., Binghong, W., Jianjun, Z., 2001. Self-organized criticality of forest fire in China. Ecol. Model. 145,61–68.
Teich, M.C., Heneghan, C., Lowen, S.B., Turcott, R.G., 1996.Estimating the fractal exponent of point processes in bio-logical systems using wavelet- and Fourier-transform meth-ods. In: Aldroubi, A., Unser, M. (Eds.), Wavelets inMedicine and Biology. CRC Press, Boca Raton, FL, pp. 383–412.
Teich, M.C., Heneghan, C., Lowen, S.B., Ozaki, T., Kaplan, E., 1997.Fractal character of the neural spike train in the visual system ofthe cat. J. Opt. Soc. Am. A 14, 529–546.
Telesca, L., Cuomo, V., Lapenna, V., Macchiato, M., 2002. On themethods to identify clustering properties in sequences of seismictime-occurrences. J. Seismol. 6, 125–134.
Thurner, S., Lowen, S.B., Feurstein, M.C., Heneghan, C., Fe-ichtinger, H.G., Teich, M.C., 1997. Analysis, synthesis, and es-timation of fractal-rate stochastic point processes. Fractals 5,565–596.
Trabaud, L., Lepart, J., 1981. Changes in the floristics compositionof a Quercus coccifera L. Garrigue in relation to different fireregimes. Vegetatio 46, 105–116.
UNCCD, 1994. United Nations Convention to Combat Desertifica-tion, report, Paris.
Viegas, D.X., 1999. Wind and topography effects on fire behaviour.In: Eftichidis, G., Balabanis, P., Ghazi, A. (Eds.), Wildfiremanagement. ALGOSYSTEM S.A, Athens, Greece, pp. 125–141.
Vila, M., Lloret, F., Ogheri, E., Terradas, J., 2001. Positive fire-grassfeedback in mediterranean. basin shrubland. For. Ecol. Manage.147, 3–14.