time-resolved x-ray absorption spectroscopy: watching atoms dance
TRANSCRIPT

Time-resolved x-ray absorption spectroscopy: Watching atoms dance
This article has been downloaded from IOPscience. Please scroll down to see the full text article.
2009 J. Phys.: Conf. Ser. 190 012052
(http://iopscience.iop.org/1742-6596/190/1/012052)
Download details:
IP Address: 128.178.83.72
The article was downloaded on 07/04/2010 at 15:26
Please note that terms and conditions apply.
The Table of Contents and more related content is available
Home Search Collections Journals About Contact us My IOPscience
Time-resolved x-ray absorption spectroscopy:
Watching atoms dance
Chris J. Milne1, Van-Thai Pham1, Wojciech Gawelda3, Renske M.van der Veen1,2, Amal El Nahhas1, Steven L. Johnson2, Paul Beaud2,Gerhard Ingold2, Frederico Lima1, Dimali A. Vithanage1, MaurizioBenfatto4, Daniel Grolimund2, Camelia Borca2, Maik Kaiser2,Andreas Hauser5, Rafael Abela2, Christian Bressler6, and MajedChergui11Laboratoire de Spectroscopie Ultrarapide, Ecole Polytechnique Federale de Lausanne,Switzerland2 Swiss Light Source, Paul Scherrer Institut, Switzerland3 Laser Processing Group, Instituto de Optica, CSIC, Spain4 Laboratori Nazionali di Frascati, INFN, Italy5 Departement de Chimie Physique, Universite de Geneve, Switzerland6 European XFEL Project Team, Deutsches Elektronen Synchrotron, Germany
E-mail: [email protected], [email protected]
Abstract. The introduction of pump-probe techniques to the field of x-ray absorptionspectroscopy (XAS) has allowed the monitoring of both structural and electronic dynamicsof disordered systems in the condensed phase with unprecedented accuracy, both in time andin space. We present results on the electronically excited high-spin state structure of anFe(II) molecular species, [FeII(bpy)3]2+, in aqueous solution, resolving the Fe-N bond distanceelongation as 0.2 A. In addition an analysis technique using the reduced χ2 goodness of fitbetween FEFF EXAFS simulations and the experimental transient absorption signal in energyspace has been successfully tested as a function of excited state population and chemicalshift, demonstrating its applicability in situations where the fractional excited state populationcannot be determined through other measurements. Finally by using a novel ultrafast hardx-ray ’slicing’ source the question of how the molecule relaxes after optical excitation has beensuccessfully resolved using femtosecond XANES.
1. IntroductionX-ray absorption spectroscopy has proven to be an invaluable tool for measuring atomic-scalestructures with sub-A precision in disordered media. By introducing pump-probe techniquesto the field of XAS [1, 2, 3] it has become possible to monitor both structural and electronicdynamics in systems as wide-ranging as solvated ions after photo-detachment of an electron[4, 5], through to the changes in local nuclear and electronic structure in transition metal-basedmolecular species [6, 7, 8, 9, 10, 11, 12], including the active centre in proteins after liganddetachment through optical excitation [13]. By taking advantage of the native pulsed x-raytiming structure available at 3rd-generation synchrotron sources we have the ability to probespecies in solution on the sub-100 picosecond (ps) timescale which has allowed us to investigatelong-lived electronic excitation in molecules, using the power of EXAFS and XANES to resolve
14th International Conference on X-Ray Absorption Fine Structure (XAFS14) IOP PublishingJournal of Physics: Conference Series 190 (2009) 012052 doi:10.1088/1742-6596/190/1/012052
c© 2009 IOP Publishing Ltd 1

h!
350! 550nm
low-spin high-spin
egt2g
400nm
1MLCT
3MLCT
1A1
5T2
20 fs130 fs
665 ps
Fe-N distance1.97 Å 2.17 Å
cooling ?400nm
1MLCT
3MLCT
1A1
5T2
20 fs130 fs
665 ps
Fe-N distance
?
Figure 1. Spin-crossover transition in [FeII(bpy)3]2+ upon excitation with visible light. Left:molecular structure and spin-state change upon excitation from the low-spin (Fe-N bonding)to the high-spin (Fe-N antibonding) configuration. Right: Energy level diagram summarizinglaser-only optical results.[23]
short-lived atomic and molecular excited states in solution [8, 10, 4, 11]. Recently we have usedthe novel x-ray-laser slicing technique [14], available at very few synchrotrons around the world[15, 16, 17], to observe dynamics on the femtosecond (fs) timescale, the fundamental timescale ofnuclear motion. This has allowed us to observe the energy relaxation pathway of a spin-crossovermolecular system in solution by fs XANES, resolving for the first time the question of how themolecule relaxes to the high-spin state after the initial optical excitation step [18]. A criticalrequirement for the analysis of such signals is the excited state population which is necessaryto quantitatively disentangle the ground-state spectrum from the excited-state spectrum in theexperimental signal [2]. Until recently it was necessary to obtain this information from laser-onlyspectroscopic measurements which, when not readily available, made analysis both more difficultand more inaccurate. By introducing the excitation population percentage as a parameter inthe goodness of fit (χ2) between the experiment and iterative FEFF simulations [19, 20, 21]in energy space it has become possible to obtain very accurately the excited state spectrumwithout any a priori knowledge of the excitation percentage. By applying this technique to ameasurement where the excitation population was measured using other methods it has beenpossible to confirm its applicability and robustness [22], adding another analysis tool to thearsenal of experimental time-resolved x-ray spectroscopists.
2. BackgroundWhen a transition metal ion, such as Fe2+, is placed in an octahedral crystal field its d-orbitalsare split by the ligand-field interaction [24], giving rise to the well-known eg and t2g orbitals.When filling the orbitals with electrons the splitting, or 10Dq, determines whether the systemis in a low-spin (LS) or high-spin (HS) configuration from the electron pairing. Transitionsbetween the LS and HS states can be induced using temperature, pressure or visible light. Insome cases, where the splitting is small, the molecule can be trapped in either the LS or HSstate, allowing static measurements to be made on the system. [FeII(bpy)3]2+ is an exampleof a spin-crossover molecular system where the ground-state is the low-spin configuration, andthe transition to the high-spin state can only be induced with visible light due to the large
14th International Conference on X-Ray Absorption Fine Structure (XAFS14) IOP PublishingJournal of Physics: Conference Series 190 (2009) 012052 doi:10.1088/1742-6596/190/1/012052
2

energy difference between the LS and HS states [25] (see Figure 1). For this particular moleculethe initial excitation is from a singlet ground state (1A1) to a singlet metal-to-ligand chargetransfer state (1MLCT). From fluorescence up-conversion measurements it is possible to resolvethe very fast singlet to triplet energy transfer (1MLCT → 3MLCT) which occurs within 20 fs,quickly followed by a relaxation out of the 3MLCT within 130-150 fs [26]. From this point in theenergy relaxation pathway there is no way of following the dynamics by spectroscopy because allsteps are silent. Ultrafast transient absorption measurements confirm the measurements madeby McCusker and co-workers [25] showing a ground-state recovery of 665 ps as the high-spinstate (5T2) relaxes back to the 1A1 ground state. Two unresolved questions are: 1) what is thestructure of the excited HS state? and 2) what is the relaxation pathway from the 3MLCT tothe HS state? Clearly time-resolved XAS is ideal to resolve structural questions, but can wealso probe the system at shorter timescales and extract meaningful information to address therelaxation pathway?
3. Experimental TechniquesA short description of the techniques used follows. For further details please see references[1, 2, 27, 28] and references therein.
3.1. Beamline detailsAll experiments described here were performed at the MicroXAS beamline at the Swiss LightSource (SLS) which is located at the Paul Scherrer Institut (PSI). The SLS is a 3rd-generation2.4 GeV synchrotron which operates at a ring current of 400 mA and uses top-up mode to ensurea constant flux of x-rays. The beamline consists of an in-vacuum undulator capable of generatingx-rays from 4-20 keV with a flux of approximately 1012 photons/second/0.015% BW (400 mAring current). The photons are collected with a 1 m long Rh-coated, grazing incidence toroidalmirror (M1) capable of vertical collimation and limited horizontal focussing. The beamline isequipped with double-crystal, fixed exit monochromator containing Si(111), Ge(111) and Si(311)crystals to provide a range of x-ray energy resolutions. Immediately before the experimentalendstation are a pair of Kirkpatrick-Baez (KB) micro-focussing mirrors, capable of focussing thex-ray flux down to a 1x1 µm2 focal spot.
3.2. Pump-probe excitation and data acquisitionThe pump-probe technique involves excitation of the sample with a short laser pulse, followedby a variable time delay after which the sample is probed with a short x-ray pulse. The XASsignal is generally measured simultaneously in both transmission and fluorescence using largearea fast avalanche photodiodes in order to be able to electronically select only the x-rays fromthe isolated probe pulse using boxcar integrators. By using a fast data acquisition scheme thatalternates between the XAS signal measured from the excited sample at a specific x-ray energyand laser/x-ray relative delay time, followed 500 µs later by the same XAS measurement of theunexcited sample, it is possible to achieve shot-noise limited measurements where the noise isthus derived solely from the photon statistics of the x-ray source [29]. Where possible an Izero
measurement is performed giving us the ability to normalize out incoming x-ray fluctuations dueto monochromator imperfections and sudden increases in x-ray signal due to top-up injections.In general the transient absorption signals measured are: Ttr = ln (Iunp
tr /Iputr ) for transmission
and Tfluo = (Ipufluo − I
unpfluo)/Izero for fluorescence [28], where pu indicates the pumped or excited
sample while unp indicates the unpumped or ground-state sample.
3.3. Ultrafast optical and x-ray pulsesThe achievable time-resolution of the experiment is generally determined by the cross-correlationof the excitation laser pulse and the probing x-ray pulse. The stability of these sources, in pulse
14th International Conference on X-Ray Absorption Fine Structure (XAFS14) IOP PublishingJournal of Physics: Conference Series 190 (2009) 012052 doi:10.1088/1742-6596/190/1/012052
3

climate-controlled laser hutch
Synchronizedlaser oscillator
500 MHzring RF
“pump” laseramplifier
“slicing” laseramplifier
Modulator
Radiator
electrons
“core” x-rays
“sliced” x-rays
storage ring
slits
mirrormonochromator
KB mirrors
chicane
sam
ple
30 m to sample
50 m to interaction in
modulator
2 mJ at 1 kHz, 100 fs
3 mJ at 2 kHz, 55 fs
Figure 2. Layout of ”pump” laser and ”slicing” laser at the MicroXAS beamline (Swiss LightSource)
energy and in timing jitter, is critically important as we are performing XAS measurementsover days or even weeks. In addition it is also vital to have excellent mechanical and electronicstability of all components in order to achieve the signal-to-noise necessary for our excited-stateanalyses.
Excitation laser The excitation laser source starts with a 100 MHz laser oscillator which issynchronized to the 500 MHz RF signal from the synchrotron ring with <1 ps of timing jitter.This synchronization is maintained with a Femtolock feedback system over the duration of ourexperiments which are generally over several weeks. A portion of the oscillator output is thenregeneratively amplified to produce 100 fs, 800 nm laser pulses with 2 mJ of pulse energy ata repetition rate of 1 kHz. The laser is then transported from the temperature and humiditycontrolled laser hutch to the x-ray experimental hutch through a 30 m long evacuated transferline. These laser pulses can then be converted to the excitation wavelength of interest using eitherdoubling (400 nm), tripling (266 nm) or optical parametric amplification (tuneable between 250- 2000 nm).
Picosecond x-rays The native timing structure of the electron bunches in the Swiss Light Sourceallows for an isolated single bunch to be placed at the end of the fill pattern within an electron-free gap of 170 nanoseconds. This hybrid bunch, also called the camshaft, has a duration ofaround 100 ps depending on the current in the bunch which is usually maintained at 4 mA. Byprecisely controlling the electronic timing between the 500 MHz RF signal of the ring and thesynchronized laser oscillator it is possible to perform pump-probe measurements with <1 ps oftiming jitter between the excitation laser and the probing x-ray pulse. By shifting the phase ofthe oscillator RF synchronization signal it is possible to vary the time delay between laser andx-rays. On average we obtain 103-104 photons/pulse depending on x-ray energy and focussingconditions.
Femtosecond x-rays First proposed in 1996 by Zholents and Zolotorev [14] and demonstratedat the Advanced Light Source by Schoenlein and co-workers in 2000 [15], the x-ray-laser slicingtechnique is now the established method to extract fs x-rays pulses at synchrotrons [15, 16, 17].The technique involves spatial and temporal overlap of an intense fs laser pulse with the hybridelectron bunch in the storage ring within a wiggler (modulator) which is designed to optimizethe electron-laser interaction (see Figure 2). The FEMTO slicing source at the Swiss Light
14th International Conference on X-Ray Absorption Fine Structure (XAFS14) IOP PublishingJournal of Physics: Conference Series 190 (2009) 012052 doi:10.1088/1742-6596/190/1/012052
4

Source [17] starts by using a portion of the same synchronized laser oscillator output as theexcitation laser, which ensures inherent fs synchronization between the pump laser and theprobing ‘sliced’ x-rays. This seed pulse is then regeneratively amplified before passing througha double-pass cryo-cooled Titanium:Sapphire amplifier crystal pumped with two 30 W greenlasers which amplifies the laser pulse up to 3 mJ/pulse at a repetition rate of 2 kHz. Thepulse is then compressed to 55 fs duration (FWHM) using large area gratings before beinggently focussed down to approximately 1 mm2 over the 50 m distance to the interaction pointwithin the modulator in the storage ring. The interaction between the laser electric field andthe electron bunch results in an increased energy spread in the electrons. Immediately afterthe modulator the electrons pass through a dipole chicane which horizontally separates out theenergy-modulated fs electrons from the core 100 ps bunch. Finally the electrons pass through theMicroXAS undulator (radiator) generating x-rays. By inserting a diaphragm at the beginning ofthe beamline most of the ‘core’ x-rays can be blocked, allowing the fs x-rays to proceed throughthe beamline optics. The energy-modulation of the sliced hybrid bunch persists for several hun-dred ring round-trips after the slicing interaction resulting in a small amount of x-rays in eachsliced pulse from the previous modulation. These x-rays, called the ‘halo’, are unavoidable andresult in a ∼100 ps duration pedestal under the fs x-ray pulse. A final set of slits are spatiallyoptimized immediately before the KB focussing mirrors to maximize the contrast between thesliced and halo x-rays. In order to estimate the contribution from the halo to the sliced flux wemeasure the 499th round-trip halo after the slicing interaction, in other words the halo signalimmediately preceding the next slicing event. This measurement can then be subtracted fromthe total flux to obtain the fs flux. The flux of these background x-rays contribute <10% tothe overall x-ray flux in our measurements. As our detectors cannot distinguish between thefs (sliced) and ps (halo) x-rays it is important to be certain that any measured pump-probesignal stems solely from the fs x-rays. In order to ensure the halo x-rays do not contribute tothe measured dynamics the time scans are limited to a short range of a few ps over which anypump-probe contribution from the halo x-rays will be negligible. For longer time scans, wherethe pump-probe delay starts to approach the timescale on which one can measure a signal usingthe 100 ps x-ray pulse (>15 ps), it is possible to change the laser timing to use the previousx-ray pulse as the probe and thus measure the ps signal contribution to the data and subtract it.
The slicing flux is around 105 photons/second/0.1% BW with an x-ray pulse duration of140±30 fs with a timing stability with respect to the excitation laser of <30 fs rms over days ofusage. In general when working under the same conditions as during picosecond experiments theslicing source generates the 3-orders of magnitude drop in photons/pulse one would expect whenextracting a 55 fs slice from a 100 ps electron bunch. In addition to fs XAS measurements thissource has also been used to perform fs x-ray diffraction measurements on bulk single crystalsand thin films [17, 30, 31, 32].
3.4. Sample preparation and measurement detailsIn all cases liquid samples were used. The experiments used a high-speed liquid jet formed byusing a gear pump to flow the sample through a thin slit in a sapphire nozzle, at a velocitysufficient to ensure fresh sample was probed by the x-rays for each shot. When properlyoptimized the laminar flow of the liquid surface was a few mm2 with a thickness of 100 µm,providing a smooth liquid sheet of uniform thickness upon which to perform measurements. Thesamples were recirculated.
Aqueous [FeII(bpy)3]2+ Tris(2,2’-bipyridine)iron(II) chloride hexahydrate was used to prepareaqueous solutions of various concentrations using deionized water. Most measurements wereperformed with either 25 or 50 mM solutions. The sample was excited with 100 fs, 300 µJ
14th International Conference on X-Ray Absorption Fine Structure (XAFS14) IOP PublishingJournal of Physics: Conference Series 190 (2009) 012052 doi:10.1088/1742-6596/190/1/012052
5
1.4
1.2
1.0
0.8
0.6
0.4
0.2
Norm
aliz
ed a
bsor
ptio
n (a
.u.)
7240722072007180716071407120Energy (eV)
B
excited state XAS ground state XAS
0.10
0.05
0.00
-0.05
!A
7240720071607120Energy (eV)
B
1.2
1.0
0.8
0.6
0.4
0.2
0.0
-0.2
Tran
sient
abs
orpt
ion
(a.u
.)
12008004000Time (ps)
transient XAS at 7126 eV XAS fit optical ground-state recovery
1.4
1.2
1.0
0.8
0.6
0.4
0.2
Norm
aliz
ed a
bso
rpti
on (
a.u
.)
7240722072007180716071407120Energy (eV)
excited state XAS
ground state XAS
0.10
0.05
0.00
-0.05
!A
7240720071607120
Energy (eV)
1.2
1.0
0.8
0.6
0.4
0.2
0.0
-0.2
Tra
nsi
ent
abso
rpti
on (
a.u
.)
12008004000Time (ps)
transient XAS at 7126 eV
XAS fit
optical ground-state recovery
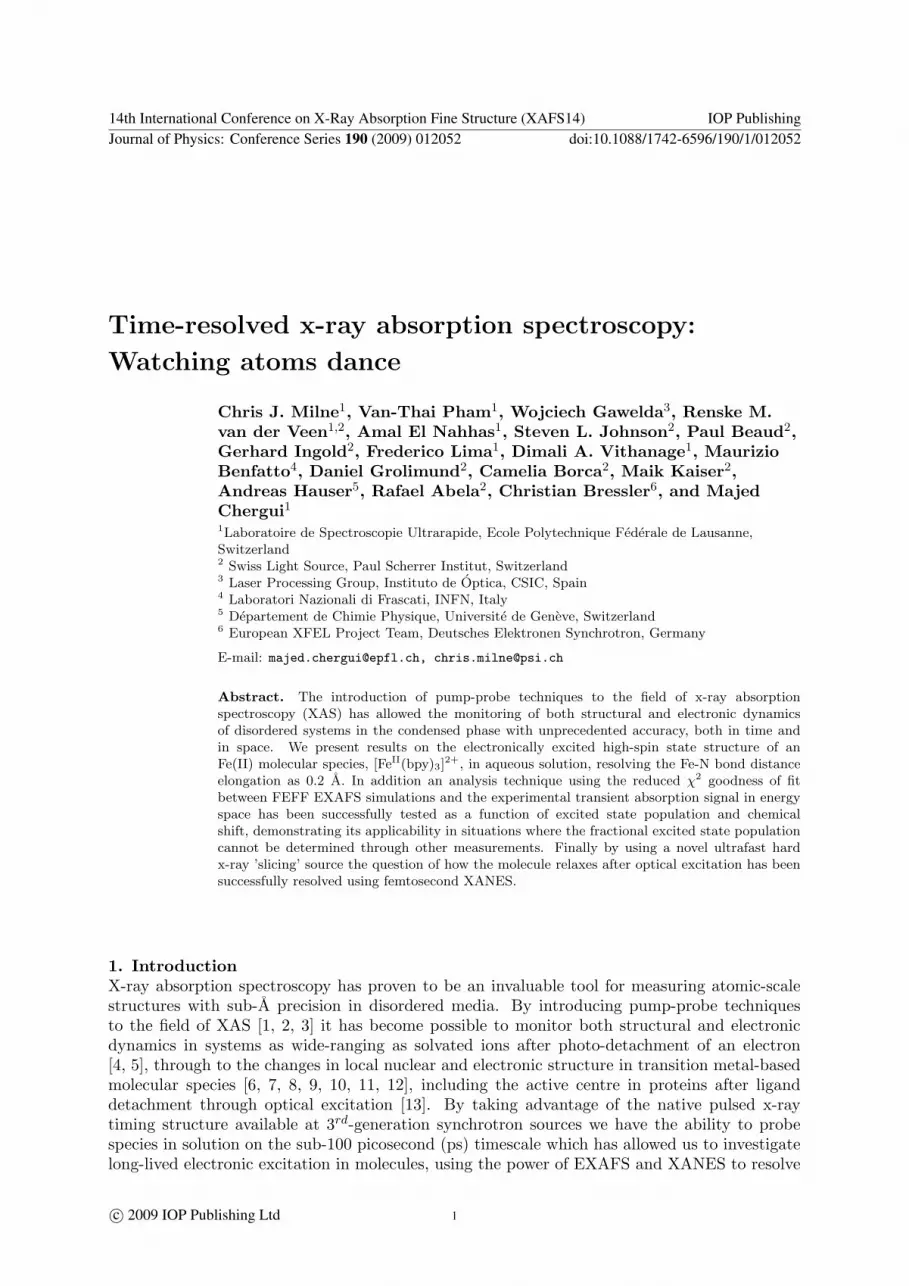
Figure 3. 25 mM aqueous [FeII(bpy)3]2+] ps data measured in both fluorescence andtransmission. Left: XAS for the ground-state (black) and reconstructed excited-state 50 psafter excitation (red markers). The inset shows the transient difference spectrum with an arrowat the ‘B’ feature showing where the time scan is measured. Right: XAS time scan at 7126 eV(red markers) overlaid with the optical ground-state recovery signal (green curve) and a fit tothe XAS signal (blue curve).
pulses of 400 nm light focussed to a spot size of 300 x 300 µm2. The x-rays were tuned to theFe K absorption edge (7.1 keV). The ps measurements [10] were performed with the Si(111)monochromator crystals with an energy resolution of 1 eV. The x-rays were focussed to a spotsize of ∼150 x 150 µm2 spot using both KB mirrors. The fs measurements [18] were performedwith the Ge(111) monochromator crystals, decreasing the energy resolution by a factor of twobut commensurately increasing the number of x-rays per pulse by a factor of two. The x-rayswere focussed using a single vertical KB mirror to 100 µm and horizontally using the M1 mirrorto 250 µm. On average a flux of 10-15 photons/pulse was measured from the slicing source.
4. ResultsThe ps data for a 25 mM aqueous solution of [FeII(bpy)3]2+ is shown in Figure 3. The left sideof Figure 3 shows the ground-state XAS signal and the reconstructed excited-state XAS signal,with the inset showing the transient absorption signal [28]. On the right side of Figure 3 isshown a time scan at the ‘B’ feature (7126 eV, red markers), the energy at which the maximumtransient absorption signal occurs (green arrow in inset). Overlaid with this is the ground-statebleach recovery from laser-only measurements, confirming that what we are seeing is the relax-ation from the HS excited state to the low-spin ground state with a decay time of 665 ps. Byconvolving a monoexponential fit curve with a decay constant of 650 ps with a 100 ps durationGaussian x-ray probe pulse we obtain an excellent fit to the experimental result (blue curve inFigure 3). This indicates that the transient spectrum shown is a measurement of the moleculein the 5T2 state and that the arrival time in this state is <50 ps..
Both MXAN simulations [33] and EXAFS analysis of the ground-state spectrum give an Fe-N bond distance of 2.00 ± 0.02A, in excellent agreement with a crystallographic measurementof 1.967 ± 0.006A[34] and DFT calculation result of 1.99 ± 0.02A[35]. In general the transientenergy spectrum can be defined as ∆A(E, t) =
∑n fn(t) [AESn(E, t)−AGS(E)] where the AES
spectrum at time t will be composed of n different excited-state species. The excited statepopulation at time t for each species requires that the total excitation must match the loss of
14th International Conference on X-Ray Absorption Fine Structure (XAFS14) IOP PublishingJournal of Physics: Conference Series 190 (2009) 012052 doi:10.1088/1742-6596/190/1/012052
6

0.15
0.10
0.05
0.00
-0.05
!A
7180716071407120Energy (eV)
Transient at 300fs
Transient at 50ps
2.5x10⁻³
2.0
1.5
1.0
0.5
0.0
-0.5
!A
150010005000-500Time (fs)
2.5x10⁻³
2.0
1.5
1.0
0.5
0.0
-0.5
!A
840Time (ps)
0.15
0.10
0.05
0.00
-0.05
!A
7180716071407120Energy (eV)
Transient at 300fs
Transient at 50ps
2.5x10⁻³
2.0
1.5
1.0
0.5
0.0
-0.5
!A
150010005000-500Time (fs)
2.5x10⁻³
2.0
1.5
1.0
0.5
0.0
-0.5
!A
840Time (ps)
Figure 4. 50 mM aqueous [FeII(bpy)3]2+] fs data measured in transmission. Left: The transientsignal measured at 50 ps (red markers) and at 300 fs (blue markers) with an arrow at 7126 eVshowing where the time scans were performed. Right: Time scan performed at 7126 eV (bluemarkers) overlaid with a model allowing for an arrival in the high-spin state within 150 fs. Inset:Time scan data out to 10 ps.
ground state species:∑
n fn(t) = fexc(t). In the case of iron tris-bipyridine we expect to havecontributions only from the HS state in the excited-state spectrum at t = 50ps. From laser-onlyoptical measurements of the change in ground-state absorption we can estimate the excitationpopulation to be fexc(50ps) = 22%± 2% [28], allowing us to obtain the excited-state spectrumshown on the left in Figure 3. From this it is possible to extract an Fe-N bond distance elonga-tion of 0.2 A. This represents the first on-the-fly measurement of the structure of a molecularsystem [10].
Turning now to the question of the relaxation cascade down to the HS state and given thatthe intermediate states are optically silent, fs XANES is ideal to determine the arrival time inthe HS state. In addition the quality of the data measured for [FeII(bpy)3]2+ at 50ps shows thatthis molecule is a good candidate for measurement with the FEMTO slicing source. By takingadvantage of the fact that we have a shot-noise limited detection system we can accuratelypredict the data accumulation times to obtain a reasonable signal-to-noise ratio using the slicingflux numbers compared to the ps flux numbers. The optimal conditions for measurement weredetermined to be a concentration of 50 mM, laser excitation conditions identical to those of theps experiment, with the monochromator set to the maximum in the transient energy signal (theB feature at 7126 eV) to perform a time scan. Our multiple-scattering analysis also shows thatthe pre-edge shoulder, or ‘B’ feature, is sensitive to the Fe-N bond distance, with the absorptionincreasing as the bonds elongate. The results of this time scan are shown on the right side ofFigure 4. We clearly see a very fast rise in the signal, reaching a plateau in <300 fs. Thistransient maximum matches the change in absorption at 50 ps, indicating we have reached thesame change in absorption within 300 fs as at 50 ps. We then performed a transient energy scanat 300 fs, the result of which is shown on the left of Figure 4 (blue markers). Overlaid on topis the transient energy signal at 50 ps (red markers). Within the error bars it is clear that thetwo qualitatively and quantitatively match. From this we can conclude that we have reachedthe 5T2 high-spin state within <300 fs. A fit of the time scan (blue trace in Figure 4) using across-correlation of 250 fs for the optical and x-ray pulses shows that the rise time is 150±50 fs.Therefore taking the information from the optical measurements we conclude that the processis a simple 4 step model: 1A1 → 1MLCT → 3MLCT → 5T2, the result of which is shown as
14th International Conference on X-Ray Absorption Fine Structure (XAFS14) IOP PublishingJournal of Physics: Conference Series 190 (2009) 012052 doi:10.1088/1742-6596/190/1/012052
7

Figure 5. Result of residualχ2 analysis described in text foran edge shift of (a) ∆E0= 0 eV,(b) ∆E0= -0.6 eV,(c) ∆E0= -1.2eV,(d) ∆E0= -2.5 eV. The curvesare guides to the eye and connectvalues with the same excitation(f). Red curves (triangles) in(a), (b) and (c) show an examplecalculation for an excitation off=22%. Blue curve in (c) (opensquares) shows the minimum valueachieved for the residual χ2 [22].
the black curve on the right side of Figure 4. What is immediately clear from this model is thatthere is no time for any other states to be involved in the relaxation pathway, indicating thatthe molecule proceeds directly from the 3MLCT state to the high-spin 5T2 state. This resolvesthe question of how [FeII(bpy)3]2+ relaxes to the high-spin state, a question which until now wasthe subject of speculation.
5. AnalysisThe results shown here clearly indicate that we can successfully measure ultrafast transientXAS on both the ps and fs timescales. We have also demonstrated that the tools used for staticXAFS analysis can also be used for our excited state measurements, with several restrictions.Two critical limitations are 1) the a priori knowledge of the excitation population contributingto the transient XAS signal and 2) the potential perturbation of the ionization energy (E0),or chemical shift, in the molecule’s excited state. In addition it would be substantially moreaccurate to take advantage of our sensitive transient absorption measurements in energy-spaceas opposed to the usual technique of back-Fourier transforming from the radial distributionfunction to obtain any structural changes. One approach which has used XAS to measurefemtometer-scale changes due to magnetostriction is the DiffXAS technique of Pettifer, Ruffoniand co-workers [36, 37] where the differential EXAFS signal is fit to a first-order Taylor expansionof the EXAFS equation. This approach works well for small structural changes but cannot begeneralized towards larger changes. The approach we have taken here is to start from a well-characterized ground-state structure and EXAFS spectrum, then using physically and chemicallysensible changes, we modify the system to obtain the excited state. This can then be simulatedusing FEFF to obtain an EXAFS spectrum which can be used to generate a transient absorptionsignal to compare to experiment. The goodness of fit of this simulation to the experiment can bedetermined by calculating the reduced chi squared function but here we introduce other degreesof freedom, namely the excitation percentage (f) and the ionization energy shift for the excited
14th International Conference on X-Ray Absorption Fine Structure (XAFS14) IOP PublishingJournal of Physics: Conference Series 190 (2009) 012052 doi:10.1088/1742-6596/190/1/012052
8

Table 1. Comparison of the Fe-N bond distances obtained from the various simulations
Fe-N(A) Error(A) f(%) ∆E0(eV) Source
0.2 ±0.02 22 -2.8±0.5 EXAFS analysis from [10]0.19 ±0.03 21.5±1.5 -2.5 MXAN analysis with fixed ∆E0 [10]0.2 ±0.04 22 -2.5±0.5 MXAN analysis with fixed f [10]0.203 -0.035, +0.012 22±1 -2.5±0.5 this analysis with f and ∆E0 from Ref.[10]0.2005 -0.0165,+0.0135 17±1 -1.2±0.6 this analysis 90% confidence levels [22]0.203 ±0.008 17±1 -1.2±0.6 this analysis 95% confidence levels [22]
state (∆E0):
χ2r (i, f,∆E0) =
1(N − 1)
N∑j=1
(xj/f −∆Ai
j (∆Ri,∆E0)∆xj/f
)2
(1)
In Equation 1 we take the difference between the experimental result scaled with the excitationpercentage (xj/f) and the simulated transient (∆A) for each point in energy space (j). Thisis then inversely weighted by the error of the experimental measurement also scaled with theexcitation percentage (∆xj/f). This sum then gives a representative number for how well thetwo transient absorption spectra match at a given excitation percentage. Since the simulatedtransient is a function of the energy shift between the ground and excited-state spectra, thereduced χ2 is a function of the structural modifications (∆Ri), the excitation percentage (f)and the energy shift (∆E0).
Before using this procedure generally it is important to establish its accuracy on a test case.As we know reasonably accurately the excitation percentage for the ps EXAFS [FeII(bpy)3]2+
measurement from optical measurements (f = 22% ± 2%) and we have a reasonable value forthe energy shift in the excited state from both MXAN simulation (-2.5 eV) and the transientEXAFS measurement (-2.8 eV±0.5 eV) [10] this is an ideal place to start. The results of thecalculation for several examples are shown in Figure 5. Each point is a χ2 value calculated fora specific excited state structural change, with a specific excitation population and a specificenergy shift. The curves link together groups with the same excitation population. For examplethe red curves in Figure 5 (a), (b), (c) correspond to f = 22%. Each of of the 4 plots showncorrespond to a different value for ∆E0. The structural modifications chosen were to vary theFe-N bond distance while maintaining the structural integrity of the bipyridine ligands. Bysimply applying a blind change in Fe-N coordination sphere distance the result would havebeen a distorted bipyridine molecule, an unlikely occurrence due to the rigidity of the ligandstructure. The result of this analysis procedure is an excitation population of f = 17% ± 1%with an energy shift of ∆E0 = −1.2eV ± 0.6eV, resulting in a change in Fe-N bond distanceof 0.203 ± 0.008A within 95% confidence limits [22]. Further structural refinements, such asligand distortion, are not feasible due to the experimental signal-to-noise. These values for fand ∆E0 are similar to, but not the same as the previous measurement. The excitation yielddifference is due to the fact that the optical measurement was performed with a 100 fs timeresolution while the x-ray experiment was limited to 100 ps. The result of this is clear in thetime scan on the right of Figure 3 where at 50 ps the x-ray signal has not reached its maximumvalue and is about 20% lower then the corresponding optical measurement. The result is a lowerexcitation population at 50 ps then estimated from the laser-only measurement by ∼ 20%, which
14th International Conference on X-Ray Absorption Fine Structure (XAFS14) IOP PublishingJournal of Physics: Conference Series 190 (2009) 012052 doi:10.1088/1742-6596/190/1/012052
9

is approximately the difference between the 22% laser-only value and the 17% excitation obtainedfrom the optimization procedure. The ∆E0 difference is not as easily explained. Subsequentanalysis shows that the Fe-N bond distance obtained is relatively insensitive to the energy shiftused (see Table 1). The reduced χ2 value is, however, very sensitive to changes in f and∆E0, making it perhaps a more accurate method then previous techniques. The value obtainedfrom the reduced χ2 procedure is comparable to the 10Dq splitting of 1.6 eV obtained for[FeII(bpy)3]2+ [38], indicating that -1.2 eV is a reasonable number to expect for the energy shift.From our analysis it is clear that the excited state structure can be obtained as a function of boththe excitation population and the energy shift with reasonable accuracy without any a prioriknowledge. This conclusion has subsequently been successfully tested with a phosphorescent di-platinum complex where no optical excitation population measurement was possible, resultingin an accurate structural analysis of the excited state [11].
6. ConclusionsTime-resolved XAS is a new and growing field that has the potential to revolutionize ourknowledge of structure and dynamics. The ability to probe the local structure of systemsin solution is unique and provides us with an unprecedented view on how molecular systemsbehave on ultrafast timescales. Of paramount importance is the ability to reach the femtosecondregime where the fundamental timescales of nuclear dynamics become accessible. This relevanceis demonstrated by our measurement of the fs XANES spectrum of the spin-crossover complex[FeII(bpy)3]2+ where this technique has resolved the question of how the molecule relaxes fromthe initial excitation through to the high-spin state. One of the key requirements to takingadvantage of these techniques at 4th-generation XFELs, where one second’s worth of x-ray fluxat current x-ray sources will be contained in a single fs pulse, is the ability to simulate and analyzethe experimental signals. Though some progress has been made in this area, for example thereduced χ2 technique mentioned here [22, 11] and the DiffXAS technique [36, 37], there is stilla long way to go before such analysis becomes routine. This is a challenging prospect, but onewhich is worth the effort as the ability to resolve molecular dynamics with sub-A precision hasthe power to advance our understanding across all fields of science.
References[1] Bressler C and Chergui M 2004 Chem Rev 104 1781–1812[2] Bressler C, Abela R and Chergui M 2008 Z Kristallogr 223 307–321[3] Chergui M and Zewail A H 2009 ChemPhysChem 10 28–43[4] Pham V T, Gawelda W, Zaushitsyn Y, Kaiser M, Grolimund D, Johnson S L, Abela R, Bressler C and
Chergui M 2007 J Am Chem Soc 129 1530–1531[5] Elles C G, Shkrob I A, Crowell R A, Arms D A and Landahl E C 2008 J Chem Phys 128 061102[6] Thiel D, Livins P, Stern E and Lewis A 1993 Nature 362 40–43[7] Chen L, Jager W, Jennings G, Gosztola D, Munkholm A and Hessler J 2001 Science 292 262–264[8] Saes M, Bressler C, Abela R, Grolimund D, Johnson S L, Heimann P A and Chergui M 2003 Phys. Rev.
Lett. 90 047403[9] Khalil M, Marcus M A, Smeigh A L, McCusker J, Chong H H W and Schoenlein R W 2006 J Phys Chem A
110 38–44[10] Gawelda W, Pham V T, Benfatto M, Zaushitsyn Y, Kaiser M, Grolimund D, Johnson S L, Abela R, Hauser
A, Bressler C and Chergui M 2007 Phys. Rev. Lett. 98 4[11] van der Veen R, Milne C J, Nahhas A E, Lima F, Pham V T, Best J, Weinstein J, Borca C, Abela R, Bressler
C and Chergui M 2009 Angew. Chem. Int. Ed. 48 2711–2714[12] Huse N, Khalil M, Kim T K, Smeigh A L, Jamula L, Mccusker J K and Schoenlein R W 2009 J. Phys.:
Conf. Ser. 148 012043[13] Wang H, Peng G and Cramer S 2005 J Electron Spectrosc 143 1–7[14] Zholents A and Zolotorev M S 1996 Phys. Rev. Lett. 76 912–915[15] Schoenlein R W, Chattopadhyay S, Chong H H W, Glover T E, Heimann P A, Shank C V, Zholents A A
and Zolotorev M S 2000 Science 287 2237–2240
14th International Conference on X-Ray Absorption Fine Structure (XAFS14) IOP PublishingJournal of Physics: Conference Series 190 (2009) 012052 doi:10.1088/1742-6596/190/1/012052
10

[16] Khan S, Holldack K, Kachel T, Mitzner R and Quast T 2006 Phys. Rev. Lett. 97 074801[17] Beaud P, Johnson S L, Streun A, Abela R, Abramsohn D, Grolimund D, Krasniqi F, Schmidt T, Schlott V
and Ingold G 2007 Phys. Rev. Lett. 99 174801[18] Bressler C, Milne C J, Pham V T, Nahhas A E, Veen R M V D, Gawelda W, Johnson S, Beaud P, Grolimund
D, Kaiser M, Borca C N, Ingold G, Abela R and Chergui M 2009 Science 323 489–492[19] Rehr J and Albers R 2000 Rev Mod Phys 72 621–654[20] Newville M 2001 J Synchrotron Rad 8 322–324[21] Ravel B and Newville M 2005 J Synchrotron Rad 12 537–541[22] Gawelda W, Pham V T, Veen R M V D, Grolimund D, Abela R, Chergui M and Bressler C 2009 J Chem
Phys 130 124520[23] Gawelda W, Johnson M, de Groot F, Abela R, Bressler C and Chergui M 2006 J Am Chem Soc 128 5001–5009[24] Hauser A, Enachescu C, Daku M, Vargas A and Amstutz N 2006 Coordination Chemistry Reviews 250
1642–1652[25] McCusker J, Walda K, Dunn R, Simon J, Magde D and Hendrickson D 1993 J Am Chem Soc 115 298–307[26] Gawelda W, Cannizzo A, Pham V T, van Mourik F, Bressler C and Chergui M 2007 J Am Chem Soc 129
8199–8206[27] Saes M, Bressler C, van Mourik F, Gawelda W, Kaiser M, Chergui M, Bressler C, Grolimund D, Abela R,
Glover T, Heimann P, Schoenlein R, Johnson S, Lindenberg A and Falcone R 2004 Rev Sci Instrum 7524–30
[28] Gawelda W 2006 Time-resolved x-ray absorption spectroscopy of transition metal complexes Ph.D. thesisEcole Polytechnique Federale de Lausanne
[29] Gawelda W, Pham V T, Nahhas A E, Kaiser M, Zaushitsyn Y, Johnson S L, Grolimund D, Abela R, HauserA, Bressler C and Chergui M 2007 AIP Conference Proceedings 882 31–36
[30] Johnson S L, Beaud P, Milne C J, Krasniqi F S, Zijlstra E S, Garcia M E, Kaiser M, Grolimund D, AbelaR and Ingold G 2008 Phys. Rev. Lett. 100 155501
[31] Johnson S L, Beaud P, Vorobeva E, Milne C J, Murray E D, Fahy S and Ingold G 2009 Phys. Rev. Lett. 102175503
[32] Krasniqi F S, Johnson S L, Beaud P, Kaiser M, Grolimund D and Ingold G 2008 Phys. Rev. B 78 174302[33] Benfatto M, Longa S D, Hatada K, Hayakawa K, Gawelda W, Bressler C and Chergui M 2006 J Phys Chem
B 110 14035–14039[34] Dick S 1998 Z Krist-New Cryst St 213 356–356[35] Daku L, Vargas A, Hauser A, Fouqueau A and Casida M 2005 Chemphyschem 6 1393–1410[36] Pettifer R, Mathon O, Pascarelli S, Cooke M and Gibbs M 2005 Nature 435 78–81[37] Ruffoni M P, Pascarelli S, Groessinger R, Turtelli R S, Bormio-Nunes C and Pettifer R F 2008 Phys. Rev.
Lett. 101 147202[38] de Groot F 2005 Coordination Chemistry Reviews 249 31–63
14th International Conference on X-Ray Absorption Fine Structure (XAFS14) IOP PublishingJournal of Physics: Conference Series 190 (2009) 012052 doi:10.1088/1742-6596/190/1/012052
11