time-lapse analysis and mathematical characterization elucidate novel mechanisms underlying muscle...
TRANSCRIPT
Time-Lapse Analysis and Mathematical CharacterizationElucidate Novel Mechanisms Underlying MuscleMorphogenesisChelsi J. Snow1, Michelle Goody1., Meghan W. Kelly1., Emma C. Oster1., Robert Jones1., Andre Khalil2,3,
Clarissa A. Henry1,3*
1 School of Biology and Ecology, University of Maine, Orono, Maine, United States of America, 2 Department of Mathematics and Statistics, University of Maine, Orono,
Maine, United States of America, 3 Institute for Molecular Biophysics, The Jackson Laboratory, Bar Harbor, Maine, United States of America
Abstract
Skeletal muscle morphogenesis transforms short muscle precursor cells into long, multinucleate myotubes that anchor totendons via the myotendinous junction (MTJ). In vertebrates, a great deal is known about muscle specification as well ashow somitic cells, as a cohort, generate the early myotome. However, the cellular mechanisms that generate long musclefibers from short cells and the molecular factors that limit elongation are unknown. We show that zebrafish fast muscle fibermorphogenesis consists of three discrete phases: short precursor cells, intercalation/elongation, and boundary capture/myotube formation. In the first phase, cells exhibit randomly directed protrusive activity. The second phase, intercalation/elongation, proceeds via a two-step process: protrusion extension and filling. This repetition of protrusion extension andfilling continues until both the anterior and posterior ends of the muscle fiber reach the MTJ. Finally, both ends of themuscle fiber anchor to the MTJ (boundary capture) and undergo further morphogenetic changes as they adopt thestereotypical, cylindrical shape of myotubes. We find that the basement membrane protein laminin is required for efficientelongation, proper fiber orientation, and boundary capture. These early muscle defects in the absence of either lamininb1 orlamininc1 contrast with later dystrophic phenotypes in laminina2 mutant embryos, indicating discrete roles for differentlaminin chains during early muscle development. Surprisingly, genetic mosaic analysis suggests that boundary capture is acell-autonomous phenomenon. Taken together, our results define three phases of muscle fiber morphogenesis and showthat the critical second phase of elongation proceeds by a repetitive process of protrusion extension and protrusion filling.Furthermore, we show that laminin is a novel and critical molecular cue mediating fiber orientation and limiting muscle celllength.
Citation: Snow CJ, Goody M, Kelly MW, Oster EC, Jones R, et al. (2008) Time-Lapse Analysis and Mathematical Characterization Elucidate Novel MechanismsUnderlying Muscle Morphogenesis. PLoS Genet 4(10): e1000219. doi:10.1371/journal.pgen.1000219
Editor: Mary Mullins, University of Pennsylvania School of Medicine, United States of America
Received June 3, 2008; Accepted September 9, 2008; Published October 3, 2008
Copyright: � 2008 Snow et al. This is an open-access article distributed under the terms of the Creative Commons Attribution License, which permitsunrestricted use, distribution, and reproduction in any medium, provided the original author and source are credited.
Funding: This research was supported by the Muscular Dystrophy Association and also in part by NIH grant RO1 HD052934-01A1 as well as NIH grant P20 RR-016463 from the INBRE program of the National Center for Research Resources. ECO was supported in part by a summer research fellowship from the Universityof Maine.
Competing Interests: The authors have declared that no competing interests exist.
* E-mail: [email protected]
. These authors contributed equally to this work.
Introduction
Muscle specification and morphogenesis during early develop-
ment are critical for normal muscle physiology. In vertebrates,
most of the musculature is derived from somites [1–3]. Somites are
segmentally reiterated structures delineated by somite boundaries.
As development proceeds, a portion of the somite gives rise to
skeletal muscle fibers that comprise the myotome. The terminal
ends of myotomal muscle fibers attach to somite boundaries,
which then become myotome boundaries. In teleost fishes,
myotome boundaries give rise to the myotendinous junction
(MTJ) [4].
Myotome development is perhaps best understood in amniotes.
Myogenesis in amniotes begins when muscle precursor cells
translocate from the overlying dermomyotome to the myotome
[3]. The first myocytes to translocate come from the dorsomedial
lip, but later in development myocytes translocate from all
dermomyotome borders as well as the central region [5–7].
Time-lapse analysis in the chick embryo has shown that spatial
domains of the somite differ in cell behaviors that generate the
primary myotome [8]. The above studies have elucidated cell
movements that generate the myotome. However, although it is
known that short, mononucleate, muscle precursor cells generate
long, functional multinucleate muscle fibers, it is not known how
this occurs. Interestingly, the early zebrafish and chick myotomes
have been described as containing mononucleate muscle fibers
[8,9]. Our intent in undertaking this study was to utilize the
advantages of the zebrafish system to shed light on early muscle
development in a vertebrate model.
Elucidation of the cellular mechanisms that underlie muscle
fiber development and tendon attachment is critical for a
comprehensive understanding of muscle development. Towards
this end, muscle morphogenesis has been studied in different
model systems. C2C12 myoblasts in culture elongate slightly prior
to differentiation, align with each other, and fuse to generate a
multinucleate myotube [10]. We have called this scenario elliptical
PLoS Genetics | www.plosgenetics.org 1 October 2008 | Volume 4 | Issue 10 | e1000219

growth. In grasshopper embryos, the first muscle cells elongate
between attachment sites prior to fusion. These cells extend many
processes in multiple directions while elongating [11]. We have
termed this scenario branching. Elegant studies in Drosophila have
shown that muscle morphogenesis occurs when myoblasts fuse to
generate long, multinucleate myotubes and identified a number of
proteins required for myoblast fusion [12,13]. Extremely exciting
recent studies have shown that there is some conservation of
molecular mechanisms that mediate muscle cell fusion between
Drosophila and zebrafish [14,15]. Interestingly, however, the
primary myotome in chick and zebrafish is mononucleate [8,9].
This suggests that myoblast fusion does not mediate the earliest
stages of muscle morphogenesis in vertebrates, but occurs after
initial muscle fiber elongation. These distinct mechanisms of
morphogenesis in different systems highlight the fact that a
mechanistic study of muscle fiber morphogenesis in vertebrates has
not yet been undertaken. Identification of discrete morphogenetic
steps that mediate muscle fiber morphogenesis in vertebrates is
necessary to provide a framework for future molecular analyses.
Adhesion of muscle fibers to the basement membrane is critical
for muscle function. The basement membrane attaches muscle
fibers to connective tissue that then attaches to the skeletal system;
this attachment is critical for force transduction from muscle to
bone. One major component of the basement membrane is
laminin. Laminin is a heterotrimeric protein composed of a, b and
c subunits that generate at least 15 different isoforms [16]. The
importance of laminins in muscle physiology is evidenced by the
fact that mutations in lama2 result in muscular dystrophies [17–
20]. Recent work has shown that muscle fibers in zebrafish mutant
for lama2 elongate and attach to the MTJ, but at 48 hours post
fertilization (hpf) fibers detach before death, providing novel
insight into roles for lama2 in muscle disease [21].
Significantly less is known about spatiotemporal mechanisms of
basement membrane assembly during early skeletal muscle
development and whether adhesion to the basement membrane
contributes to morphogenesis. Recent data suggest that the
laminin receptor Integrin a6b1 is necessary for both basement
membrane assembly and normal expression of myogenic regula-
tory factors in cultured mouse explants [22]. However, Integrin
a6b1 binds to multiple laminins with distinct affinities [23] and
roles for individual laminin chains during early muscle develop-
ment in vivo have not been identified. In order to determine
whether the basement membrane is critical during early
development for muscle fiber elongation and attachment, it is
first necessary to understand the cellular basis of muscle fiber
elongation and attachment.
The relative simplicity of zebrafish skeletal muscle, where slow
and fast-twitch fibers are spatially segregated, makes it an ideal
model system to study muscle cell elongation and MTJ
morphogenesis. Morphogenesis of the somite boundary into the
MTJ involves three stages: initial epithelial somite boundary
formation, transition and myotome boundary/MTJ formation
[24]. Transition encompasses the lateral displacement of slow-
twitch muscle fibers and the subsequent elongation and differen-
tiation of fast-twitch fibers [25–28]. The initial myotome forms by
26 hpf and contains long muscle fibers attached to the myotome
boundary/MTJ. At this point, the extracellular matrix (ECM)
proteins Fibronectin, laminin and Periostin concentrate at the
MTJ [29–31]. Morpholino-mediated inhibition of Periostin
disrupts MTJ formation [29,32,33], but discrete and mechanistic
requirements for other ECM proteins and their receptors are not
known. In addition, the precise mechanism by which elongating
muscle fibers attach to the MTJ and cease elongation has not been
elucidated.
The purpose of this study was to rigorously and quantitatively
characterize, for the first time in vertebrate embryos, the cellular
events that generate long myotubes from initially short muscle
precursor cells. We focused on fast-twitch fiber morphogenesis in
zebrafish embryos. Our goal was to develop methods with which
discrete functions for proteins involved in muscle morphogenesis
could be identified. Towards this goal, we utilized time-lapse
analysis, genetic mosaic analysis, and three different mathematical
tools including a powerful wavelet-based image analysis formalism
to provide novel insight into cellular and molecular mechanisms
that underlie muscle fiber elongation and subsequent attachment
to the nascent MTJ.
Results
Three Phases of Fast-Twitch Muscle Cell ElongationAlthough the elongation of somitic cells is critical for actin-
mediated contractility that underlies muscle function, the cellular
and molecular basis of elongation in vertebrates is not well
understood. An understanding of how muscle cells elongate is
critical in order to determine mechanistic roles for genes required
in elongation. We used time-lapse microscopy of zebrafish
embryos labeled with BODIPY-Ceramide to outline cells. This
type of time-lapse analysis, where all cells are labeled, provides an
initial framework with which to focus further investigation into
fast-twitch fiber morphogenesis. Fast-twitch muscle cells can be
identified because, in contrast to slow-twitch muscle fibers, they
are not migrating medially-laterally [25]. The transition from a
somite to a myotome is a dynamic process (Figure 1, Movie S1)
with at least three phases. The first phase is short muscle precursor
cells. Second, muscle fibers elongate by extending narrow
protrusions to intercalate between other cells (Figure 1 A2 at
80 min, blue pseudocolored cell). Elongation ends when cells
adhere to the anterior and posterior boundaries. The third phase is
Author Summary
Despite the importance of muscle fiber development andtendon attachment, this process is incompletely under-stood in vertebrates. One critical step is muscle fiberelongation; muscle precursor cells are short and subse-quent elongation/fusion generates long, multinucleatemuscle fibers. Using a vertebrate model organism, thezebrafish, we find that single round myoblasts elongate tospan the entire width of the myotome prior to fusion.Using rigorous and objective mathematical characteriza-tion techniques, we can further divide muscle develop-ment into three stages: short precursor cells, intercalation/elongation, and boundary capture/myotube formation.The second phase, elongation, occurs via a two-stepmechanism of protrusion extension and filling. Myotubeformation involves boundary capture, where the ends ofmuscle fibers anchor themselves to the myotome bound-ary and stop elongating. We show that the protein lamininis required for boundary capture, normal fiber length, andproper fiber orientation. Genetic mosaic experiments inlaminin-deficient embryos reveal that boundary capture isa cell autonomous phenomenon. Wild-type (normal) cellscapture the boundary appropriately and stop elongatingin laminin-deficient embryos. Although adhesion tolaminin has been implicated in muscular dystrophieswhere the attachment between muscle cells and tendonsfails, no early developmental requirements for laminin infast muscle morphogenesis have been shown until now.
Dynamics of Zebrafish Muscle Morphogenesis
PLoS Genetics | www.plosgenetics.org 2 October 2008 | Volume 4 | Issue 10 | e1000219
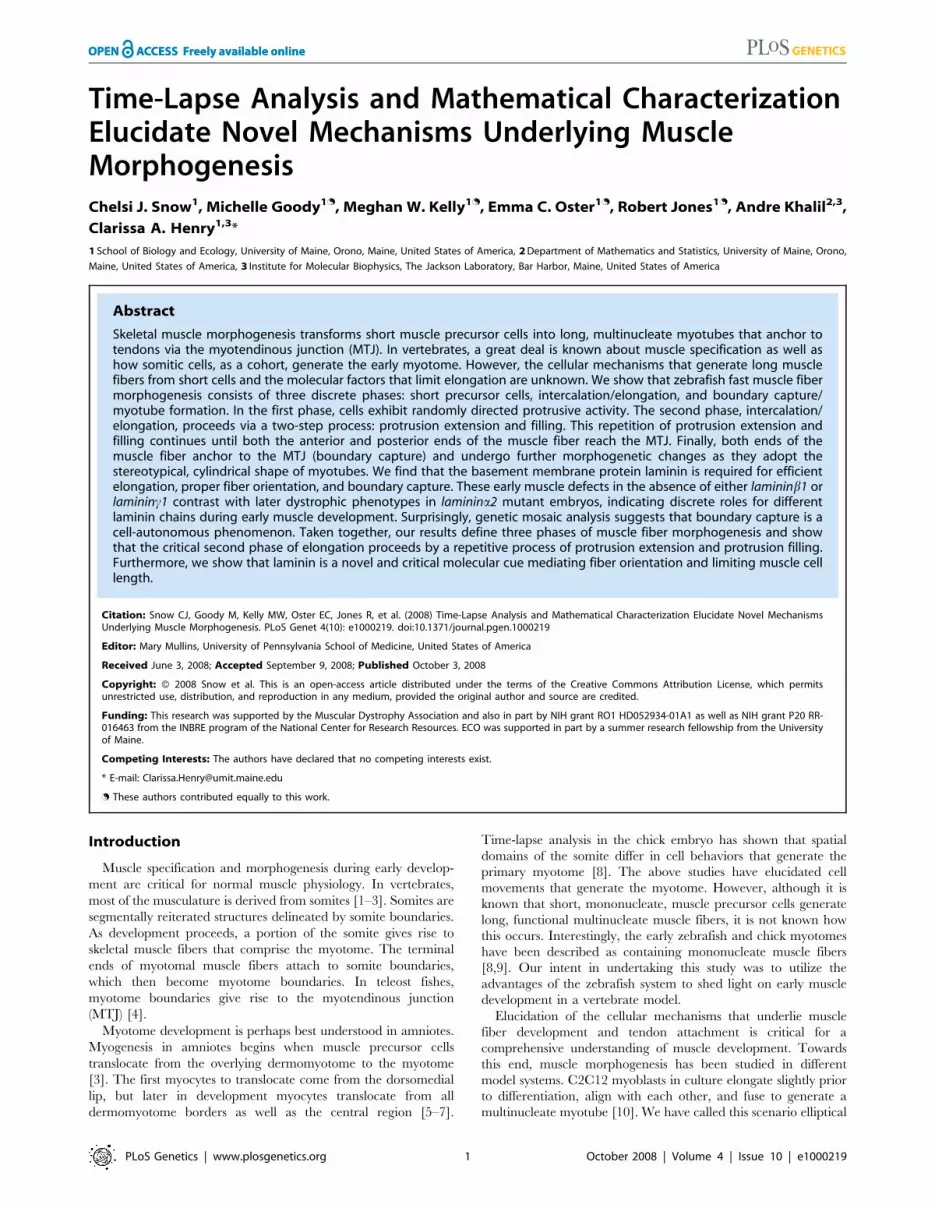
myotube formation. Recently elongated cells are long, but
irregularly shaped (Figure 1 A1 green cell at 0 min, A2 blue cell
at 84–168 min, Movie S1). During myotube formation, long cells
with grooves continue to change shape until they form a more
uniformly shaped tube without grooves (Figure 1 A1 green cell at
208 min). An additional time-lapse is shown in Movie S2.
Figure 1. Myoblasts Intercalate between Each Other as They Elongate. (See also Movies S1 and S2.) A) Cartoon depicts the anterior toposterior progression of myofiber elongation in a 22 somite embryo. A1–A2) Confocal time-lapse sequence showing fast muscle cell elongation in asingle focal plane of a zebrafish embryo vitally labeled with BODIPY-Ceramide. Anterior left, dorsal top, somite number denoted, time elapsedindicated on panels. The colored cells were pseudocolored to facilitate visualization. By 80 min, the blue cell is beginning to intercalate, intercalationis complete by 84 min. During this time, the orange and purple cells are elongating. The green cell transits from a long, but irregularly shaped cell(white arrowhead indicates a groove at 20 min) into a rod-shaped myotube by 124 min. Scale bars: 50 mm.doi:10.1371/journal.pgen.1000219.g001
Dynamics of Zebrafish Muscle Morphogenesis
PLoS Genetics | www.plosgenetics.org 3 October 2008 | Volume 4 | Issue 10 | e1000219
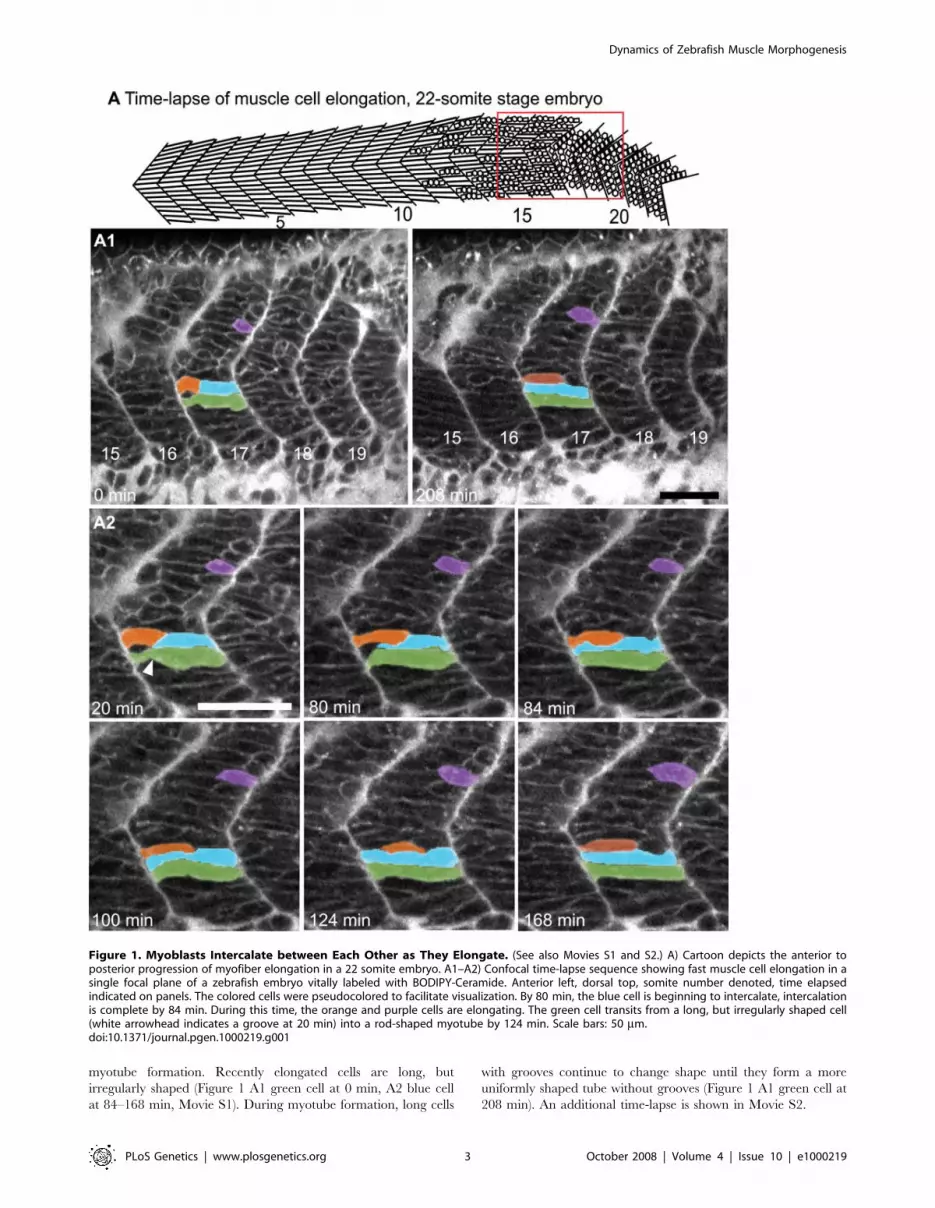
Phase 1: Short Muscle Precursor CellsA three-dimensional quantification of cell morphology is critical
to distinguish between scenarios of muscle cell elongation
(Figure 2A). We transplanted dextran-filled cells into unlabeled
host embryos and three-dimensionally reconstructed the behavior
of labeled cells through time (Figure 2B). For each time point, the
z-series was three-dimensionally projected and the area, perimeter,
and major axis were measured. Thus two-dimensional parameters
(area, perimeter, and major axis) were obtained from three-
dimensional projections of cells. The analysis of labeled cells in an
unlabeled field of cells allows unambiguous determination of
cellular shape dynamics and quantification of morphometric
parameters. We analyzed cell behaviors in two ways: (1) analysis of
the filament index and (2) analysis of the relative dynamics of area
and perimeter changes through time. As shown below, this
approach supports and extends what was observed in BODIPY-
Ceramide labeled embryos.
The filament index is an excellent mathematical parameter that
describes cell morphology. The filament index is a measure that
quantifies the departure of a shape from a circle (see methods). A
circle has a filament index of 1 and a higher filament index indicates
a larger departure from a circular shape. Short muscle precursor cells
have a low filament index (FI) indicating that their morphology is
close to a circle (Figure 2F, G1, FI = 1.660.6, Table 1).
Short muscle precursor cells extend and retract very short
(,2 mm) filopodia-like protrusions in all directions (Figure 2C,
Movie S3). Small changes in the area, perimeter, and length of
muscle precursor cells reflect the dynamic shape changes of
precursor cells (not shown). However, their overall shape and size
remains consistent.
Phase 2: Elongating Fast-Twitch Muscle Precursor CellsElongating cells lengthen towards their attachment site, the
MTJ. Elongating cells have a higher filament index than short
precursor cells (Figure 2F, 2.960.8, Table 1). The filament indices
of elongating cells increase slightly through time (Figure 2G1, G2),
reflecting their departure from a circular shape.
One purpose of this experiment was to distinguish between
possible scenarios of muscle fiber elongation summarized in
Figure 2A. The difference between the fusion and remaining
scenarios is the timing of fusion relative to elongation. In the fusion
scenario, fusion of short myoblasts is the major morphogenetic event
that drives fiber elongation. Fusion of multiple short cells generates a
long, multinucleate myotube in one step as in Drosophila [12]. In the
remaining scenarios, cells elongate prior to fusion. We analyzed
nuclear content of elongating and recently elongated cells and found
that mononucleate fast-twitch cells elongate to the MTJ prior to
fusion (Figure 4F–H, n = 108 cells). Thus, the first fast-twitch fibers
in zebrafish do not fuse prior to elongation.
The remaining scenarios are branching, elliptical growth, and
protrusion (Figure 2A). The difference between the branching
scenario and the elliptical growth/protrusion scenarios is the
amount, size, and direction of protrusive activity. In grasshopper,
the first muscle cells to elongate have extensive protrusions in
many different directions [11]. This is depicted in the branching
scenario (Figure 2A). In contrast, the elliptical growth and
protrusion scenarios depict cells that elongate in a fixed direction.
Both time-lapse analysis and analysis of cell morphology in fixed
embryos indicate that fast-twitch fibers in zebrafish embryos
elongate in a fixed direction and do not exhibit a branching
morphology with multiple protrusions extended in different
directions (Figures 2, 4). Rather, fast-twitch cells extend long
(.4 mm) protrusions along their long axis (Figure 2D, Movie S3).
These results indicate that the branching scenario does not apply
to initial fast-twitch muscle morphogenesis in zebrafish.
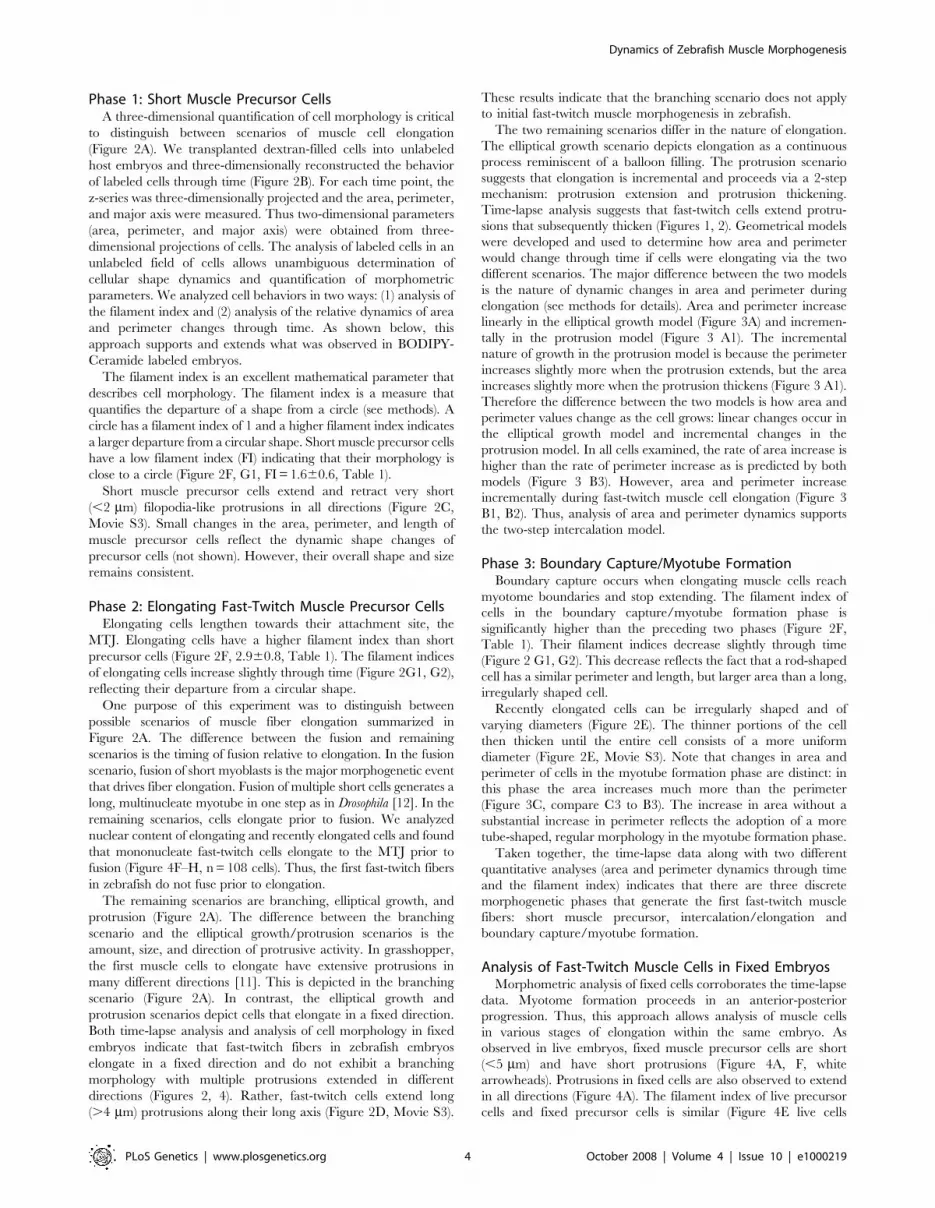
The two remaining scenarios differ in the nature of elongation.
The elliptical growth scenario depicts elongation as a continuous
process reminiscent of a balloon filling. The protrusion scenario
suggests that elongation is incremental and proceeds via a 2-step
mechanism: protrusion extension and protrusion thickening.
Time-lapse analysis suggests that fast-twitch cells extend protru-
sions that subsequently thicken (Figures 1, 2). Geometrical models
were developed and used to determine how area and perimeter
would change through time if cells were elongating via the two
different scenarios. The major difference between the two models
is the nature of dynamic changes in area and perimeter during
elongation (see methods for details). Area and perimeter increase
linearly in the elliptical growth model (Figure 3A) and incremen-
tally in the protrusion model (Figure 3 A1). The incremental
nature of growth in the protrusion model is because the perimeter
increases slightly more when the protrusion extends, but the area
increases slightly more when the protrusion thickens (Figure 3 A1).
Therefore the difference between the two models is how area and
perimeter values change as the cell grows: linear changes occur in
the elliptical growth model and incremental changes in the
protrusion model. In all cells examined, the rate of area increase is
higher than the rate of perimeter increase as is predicted by both
models (Figure 3 B3). However, area and perimeter increase
incrementally during fast-twitch muscle cell elongation (Figure 3
B1, B2). Thus, analysis of area and perimeter dynamics supports
the two-step intercalation model.
Phase 3: Boundary Capture/Myotube FormationBoundary capture occurs when elongating muscle cells reach
myotome boundaries and stop extending. The filament index of
cells in the boundary capture/myotube formation phase is
significantly higher than the preceding two phases (Figure 2F,
Table 1). Their filament indices decrease slightly through time
(Figure 2 G1, G2). This decrease reflects the fact that a rod-shaped
cell has a similar perimeter and length, but larger area than a long,
irregularly shaped cell.
Recently elongated cells can be irregularly shaped and of
varying diameters (Figure 2E). The thinner portions of the cell
then thicken until the entire cell consists of a more uniform
diameter (Figure 2E, Movie S3). Note that changes in area and
perimeter of cells in the myotube formation phase are distinct: in
this phase the area increases much more than the perimeter
(Figure 3C, compare C3 to B3). The increase in area without a
substantial increase in perimeter reflects the adoption of a more
tube-shaped, regular morphology in the myotube formation phase.
Taken together, the time-lapse data along with two different
quantitative analyses (area and perimeter dynamics through time
and the filament index) indicates that there are three discrete
morphogenetic phases that generate the first fast-twitch muscle
fibers: short muscle precursor, intercalation/elongation and
boundary capture/myotube formation.
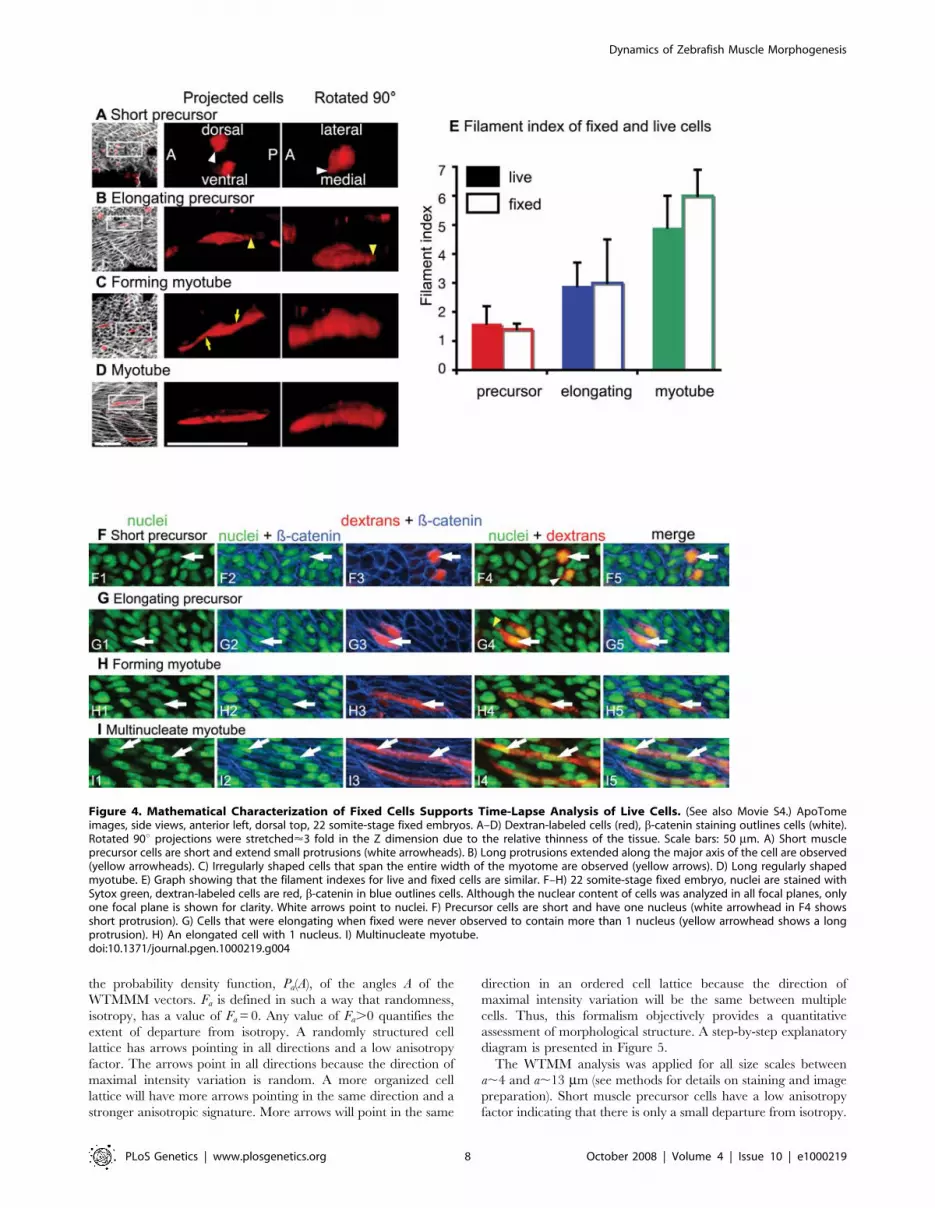
Analysis of Fast-Twitch Muscle Cells in Fixed EmbryosMorphometric analysis of fixed cells corroborates the time-lapse
data. Myotome formation proceeds in an anterior-posterior
progression. Thus, this approach allows analysis of muscle cells
in various stages of elongation within the same embryo. As
observed in live embryos, fixed muscle precursor cells are short
(,5 mm) and have short protrusions (Figure 4A, F, white
arrowheads). Protrusions in fixed cells are also observed to extend
in all directions (Figure 4A). The filament index of live precursor
cells and fixed precursor cells is similar (Figure 4E live cells
Dynamics of Zebrafish Muscle Morphogenesis
PLoS Genetics | www.plosgenetics.org 4 October 2008 | Volume 4 | Issue 10 | e1000219
Figure 2. Three Phases of Muscle Morphogenesis: Short Muscle Precursor Cells, Intercalation/Elongation, and Boundary Capture/Myotube Formation. (See also Movie S3.) Projections of ApoTome micrographs are shown, side views, anterior left, dorsal top. Cells werepseudocolored to facilitate visualization. A) Cartoon depicting possible scenarios for elongation of myofibers. B) Cartoon depiction of the methods
Dynamics of Zebrafish Muscle Morphogenesis
PLoS Genetics | www.plosgenetics.org 5 October 2008 | Volume 4 | Issue 10 | e1000219

1.660.6, fixed cells 1.460.2). The correlation of the length with
perimeter is also similar to live cells (Table 1).
Both the qualitative appearance and the morphometric
properties of fixed cells presumed to have been elongating (those
between 5 mm and 40 mm in fixed embryos) are similar to live
elongating cells. The major axis is very strongly correlated with
perimeter and area in both populations (Table 1). Similar to live
cells, long narrow protrusions are only observed along the major
axis (Figure 4B, G, yellow arrowheads, Movie S4). We also
analyzed the nuclear content of dextran-filled cells during
elongation. A z-series was taken and cells were examined in three
dimensions. No elongating cells contained more than one nucleus
(Figure 4G, n.100 cells).
Cells that were fully elongated but irregularly shaped were
presumed to be in the boundary capture/myotube formation
phase (Figure 4C is a three-dimensional projection of an
irregularly shaped but elongated cell). The filament index of these
cells was also similar to live cells (Figure 4E). Fast-twitch cells in
this phase were mononucleate (Figure 4 H shows one focal plane
of a mononucleate cell that is elongated but irregularly shaped
when examined in three dimensions, Movie S4, n = 108).
Interestingly, all muscle cells that contained multiple nuclei
exhibited a stereotypical tubular shape (n = 57, see Figure 4I).
These data suggest the intriguing possibility that the transition
from an irregularly shaped long cell to a rod-shaped myotube may
involve fusion. Our use of dextran-labeled cells in a field of
unlabeled cells clearly highlights the morphological complexity of
elongating fast-twitch muscle cells and indicates that it is not
possible to unambiguously identify multinucleate cells utilizing a
nuclear marker as well as a marker that denotes all cells (such as
phalloidin). Thus, we do not know the exact timing of muscle cell
fusion or whether fusion contributes to the morphogenesis of
irregularly shaped long fibers into regularly shaped, cylindrical
myotubes. However, it is evident that the first fast-twitch muscle
cells do not fuse in order to elongate.
The filament index of fixed muscle cells, as in live cells, is
significantly different between each phase (data not shown, two-
tailed t-test, p,0.01 for all comparisons). These data support the
time-lapse analyses and provide new tools for analysis of
morphogenetic defects in various mutant/morphant embryos.
Quantification of Anisotropy Indicates that Each Phase ofMuscle Fiber Morphogenesis Is Accompanied by aSignificant Increase in Ordered Structure
The identification of discrete, mathematically distinct phases
provides a paradigm by which muscle morphogenesis in mutant
embryos can be assessed. The above data also indicate that the
morphology of fixed cells is not significantly different than live
cells. However, although obtaining single labeled cells within a
field of unlabeled cells in fixed embryos is easier than time-lapse
analysis, it is not feasible in all model systems. We thus looked for a
different mathematical tool to quantify cellular organization.
Ideally such a tool would allow objective quantification of cellular
structure with an easier experimental preparation such as staining
with phalloidin to outline all cells. Therefore, we adapted and
applied the 2D Wavelet-Transform Modulus Maxima (WTMM)
method [34,35]. This method can be used to quantify the amount
of structure, or order, of objects that do not necessarily have a well
Table 1. Morphometric analysis of muscle cells.
Phase Subcategory N Average slope6SE Major Axis vs. Perimeter R2 Filament Index6SD
Short precursor WT live 12 0.57 1.660.6
WT fixed 31 0.59 1.460.2
Laminin-deficient fixed 8 0.92 1.460.3
Elongating precursor WT live 6 0.9 2.960.8
WT live % change in area 6 2.760.8
WT live % change in perimeter 6 1.860.8
WT fixed 255 0.90
Laminin-deficient fixed 166 0.89 3.061.5
Forming myotube WT live 6 0.31 4.961.1
WT live % change in area 6 1.560.5
WT live % change in perimeter 6 0.260.1
WT fixed 13 0.16 6.060.9
Laminin-deficient fixed 11 0.9 5.162.2
doi:10.1371/journal.pgen.1000219.t001
used. Dextran filled WT cells (red) were transplanted into an unlabeled embryo at the blastula stage, time-lapse data was collected at 20 hpf, then Z-stacks were three dimensionally projected for morphometric analysis. C) Short muscle precursor cells do not undergo large-scale shape changes. A 21somite-stage embryo, approximate location of somite 15 at left. The blue cell extends a filopodia-like protrusion (8 min, white arrow) that is thenretracted (30 min, the blue cell is enlarged in the bottom panels). The protrusion in the green cell (red arrow at 0 min) is also retracted by 30 min. D)Elongating muscle precursor cells extend protrusions along their major axis as they elongate. A 22 somite-stage embryo, somite 18 at left. The yellowcell extends a long, thin protrusion (white arrow) at 18 min that increases in thickness, resulting in a longer cell. The orange cell extends a protrusion(red arrow) at 80 min that becomes thicker by 120 min. E) Myotube formation involves the transition from an irregularly shaped cell to a morehomogenously shaped tube. At 0 min, the blue cell with a white arrow is not yet tube-shaped, i.e. part of the cell is significantly narrower than theother parts (white arrow). Over time, the narrow portion thickens, eventually generating a long tube-shaped myotube (120 min, white arrows inbottom enlarged panels are in the same location in all panels). F) The filament index is significantly different between the three phases (**, p,0.01).G1) The filament index of the three phases through time. G2) Average slopes of linear trendlines from data in G1 (*, p,0.05).doi:10.1371/journal.pgen.1000219.g002
Dynamics of Zebrafish Muscle Morphogenesis
PLoS Genetics | www.plosgenetics.org 6 October 2008 | Volume 4 | Issue 10 | e1000219

defined boundary. We used this approach to quantify the
structural organization of cellular lattices during muscle fiber
elongation. The WTMM analysis filters an image with the
gradient of a smoothing function (i.e. a wavelet) at a given size
scale. Places within the image where the intensity variation is
maximal are given by the wavelet-transform modulus maxima (i.e.
the WTMM). Next, the positions of maximal intensity variation
along these maxima chains are identified. These are the WTMM
maxima, or WTMMM. At these nodes, the direction where the
signal has the sharpest variation is calculated. An arrow that points
upward has an angle of p/2 and an arrow that points down has an
angle of 2p/2. The anisotropy factor Fa is then calculated from
Figure 3. Mathematical Analysis of Area and Perimeter Dynamics. A) Geometric modeling of relative changes in area and perimeter thatwould result if cells elongated as ellipses, as if they were filling like balloons. Both area and perimeter would increase linearly. A1) Geometricmodeling of relative changes in area and perimeter that would result if cells elongated via a two-step process: protrusion extension and filling. Botharea and perimeter would increase incrementally. B) Area and perimeter dynamics during the elongation phase. B1) Percent change of area (solidline) and perimeter (dotted line) through time. Enlarged traces are shown in B2. B3) Average slope of linear trendlines. The area increased more thanthe perimeter in all cells. C) Area and perimeter dynamics during the myotube formation phase. The growth rate of area and perimeter are different inthe myotube formation phase than the elongation phase. As the cell transitions from being irregularly shaped to a more homogenously shapedmyotube, the increase in area represents the filling in of an initially narrow aspect of the cell. Filling in does not dramatically increase the perimeter,but does result in an increase in area.doi:10.1371/journal.pgen.1000219.g003
Dynamics of Zebrafish Muscle Morphogenesis
PLoS Genetics | www.plosgenetics.org 7 October 2008 | Volume 4 | Issue 10 | e1000219
the probability density function, Pa(A), of the angles A of the
WTMMM vectors. Fa is defined in such a way that randomness,
isotropy, has a value of Fa = 0. Any value of Fa.0 quantifies the
extent of departure from isotropy. A randomly structured cell
lattice has arrows pointing in all directions and a low anisotropy
factor. The arrows point in all directions because the direction of
maximal intensity variation is random. A more organized cell
lattice will have more arrows pointing in the same direction and a
stronger anisotropic signature. More arrows will point in the same
direction in an ordered cell lattice because the direction of
maximal intensity variation will be the same between multiple
cells. Thus, this formalism objectively provides a quantitative
assessment of morphological structure. A step-by-step explanatory
diagram is presented in Figure 5.
The WTMM analysis was applied for all size scales between
a,4 and a,13 mm (see methods for details on staining and image
preparation). Short muscle precursor cells have a low anisotropy
factor indicating that there is only a small departure from isotropy.
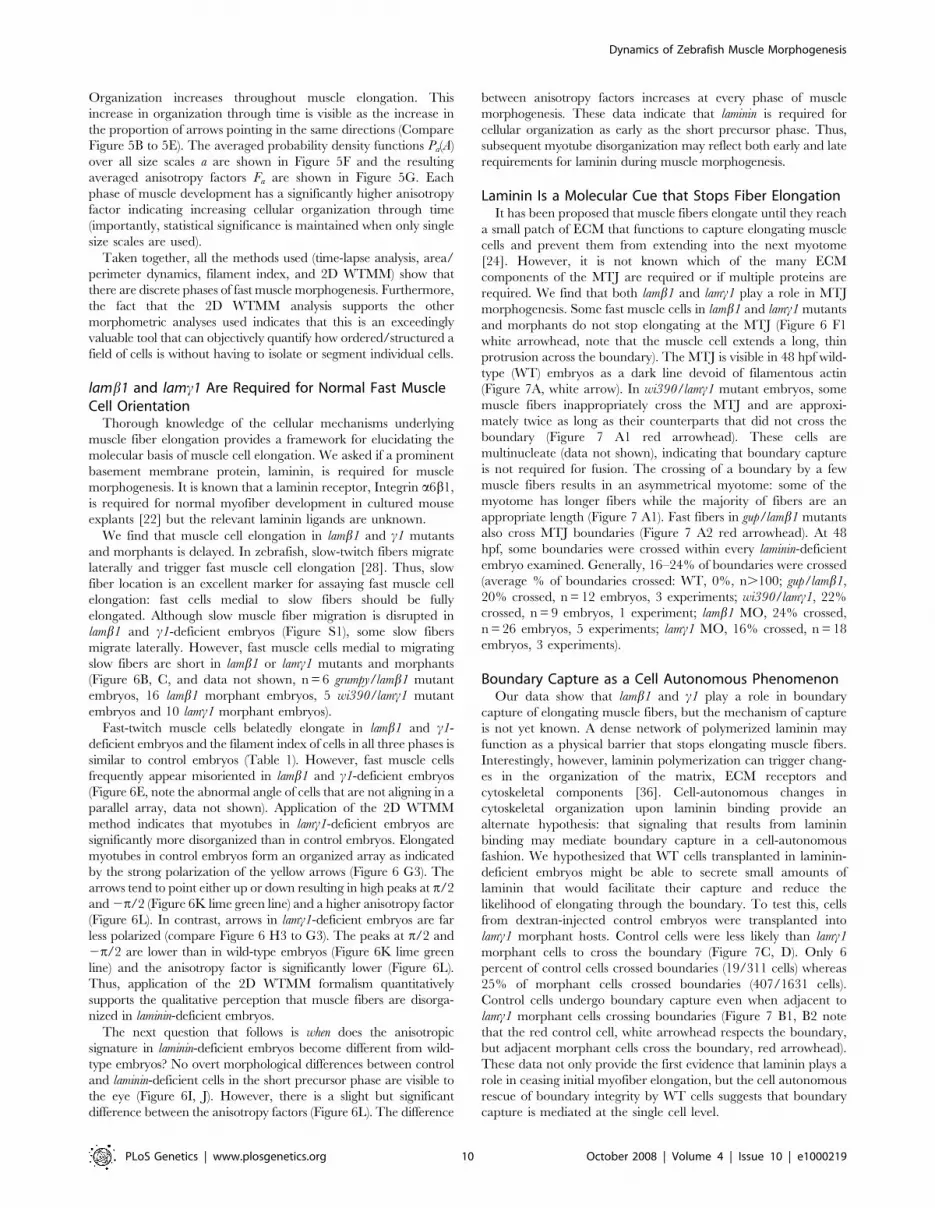
Figure 4. Mathematical Characterization of Fixed Cells Supports Time-Lapse Analysis of Live Cells. (See also Movie S4.) ApoTomeimages, side views, anterior left, dorsal top, 22 somite-stage fixed embryos. A–D) Dextran-labeled cells (red), b-catenin staining outlines cells (white).Rotated 90u projections were stretched<3 fold in the Z dimension due to the relative thinness of the tissue. Scale bars: 50 mm. A) Short muscleprecursor cells are short and extend small protrusions (white arrowheads). B) Long protrusions extended along the major axis of the cell are observed(yellow arrowheads). C) Irregularly shaped cells that span the entire width of the myotome are observed (yellow arrows). D) Long regularly shapedmyotube. E) Graph showing that the filament indexes for live and fixed cells are similar. F–H) 22 somite-stage fixed embryo, nuclei are stained withSytox green, dextran-labeled cells are red, b-catenin in blue outlines cells. Although the nuclear content of cells was analyzed in all focal planes, onlyone focal plane is shown for clarity. White arrows point to nuclei. F) Precursor cells are short and have one nucleus (white arrowhead in F4 showsshort protrusion). G) Cells that were elongating when fixed were never observed to contain more than 1 nucleus (yellow arrowhead shows a longprotrusion). H) An elongated cell with 1 nucleus. I) Multinucleate myotube.doi:10.1371/journal.pgen.1000219.g004
Dynamics of Zebrafish Muscle Morphogenesis
PLoS Genetics | www.plosgenetics.org 8 October 2008 | Volume 4 | Issue 10 | e1000219

Figure 5. The 2D WTMM Method Is Used to Quantify Cellular Structure within a Lattice, and Indicates that Cellular OrganizationIncreases during Muscle Morphogenesis. A) Description of how the 2D WTMM formalism quantifies structure. The starting image is ofelongating muscle precursor cells stained for b-catenin to outline cells. B) Short muscle precursor cells have almost all WTMMM vector arrowspointing in random directions, indicating that there is only a small departure from isotropy (isotropy means randomly structured). C) Organizationincreases as muscle cells begin to elongate. Note more green arrows pointing either up or down in C than B. D) Organization continues to increaseduring the myotube formation phase. E) Organization is readily apparent when myotubes have formed. Note that most of the green arrows arepointing either up or down indicating high levels of organization. F) Averaged Pa(A) for one particular size scale (a,7 mm) for the myotube stage(lime green curve), the forming myotube stage (dark green curve), elongating precursor stage (blue curve), short precursor (red curve) as well as forthe isotropic fBm surfaces analyzed for calibration purposes (black curve fluctuating around p/2). Also shown is the flat 1/2p curve that would beobtained for a purely theoretical isotropic process (flat pointed line at 1/2p). G) The anisotropy factor Fa was averaged over all size scales analyzed. Anindicator of organized structure, it shows significantly distinct values for all stages of developing muscle cells.doi:10.1371/journal.pgen.1000219.g005
Dynamics of Zebrafish Muscle Morphogenesis
PLoS Genetics | www.plosgenetics.org 9 October 2008 | Volume 4 | Issue 10 | e1000219
Organization increases throughout muscle elongation. This
increase in organization through time is visible as the increase in
the proportion of arrows pointing in the same directions (Compare
Figure 5B to 5E). The averaged probability density functions Pa(A)
over all size scales a are shown in Figure 5F and the resulting
averaged anisotropy factors Fa are shown in Figure 5G. Each
phase of muscle development has a significantly higher anisotropy
factor indicating increasing cellular organization through time
(importantly, statistical significance is maintained when only single
size scales are used).
Taken together, all the methods used (time-lapse analysis, area/
perimeter dynamics, filament index, and 2D WTMM) show that
there are discrete phases of fast muscle morphogenesis. Furthermore,
the fact that the 2D WTMM analysis supports the other
morphometric analyses used indicates that this is an exceedingly
valuable tool that can objectively quantify how ordered/structured a
field of cells is without having to isolate or segment individual cells.
lamb1 and lamc1 Are Required for Normal Fast MuscleCell Orientation
Thorough knowledge of the cellular mechanisms underlying
muscle fiber elongation provides a framework for elucidating the
molecular basis of muscle cell elongation. We asked if a prominent
basement membrane protein, laminin, is required for muscle
morphogenesis. It is known that a laminin receptor, Integrin a6b1,
is required for normal myofiber development in cultured mouse
explants [22] but the relevant laminin ligands are unknown.
We find that muscle cell elongation in lamb1 and c1 mutants
and morphants is delayed. In zebrafish, slow-twitch fibers migrate
laterally and trigger fast muscle cell elongation [28]. Thus, slow
fiber location is an excellent marker for assaying fast muscle cell
elongation: fast cells medial to slow fibers should be fully
elongated. Although slow muscle fiber migration is disrupted in
lamb1 and c1-deficient embryos (Figure S1), some slow fibers
migrate laterally. However, fast muscle cells medial to migrating
slow fibers are short in lamb1 or lamc1 mutants and morphants
(Figure 6B, C, and data not shown, n = 6 grumpy/lamb1 mutant
embryos, 16 lamb1 morphant embryos, 5 wi390/lamc1 mutant
embryos and 10 lamc1 morphant embryos).
Fast-twitch muscle cells belatedly elongate in lamb1 and c1-
deficient embryos and the filament index of cells in all three phases is
similar to control embryos (Table 1). However, fast muscle cells
frequently appear misoriented in lamb1 and c1-deficient embryos
(Figure 6E, note the abnormal angle of cells that are not aligning in a
parallel array, data not shown). Application of the 2D WTMM
method indicates that myotubes in lamc1-deficient embryos are
significantly more disorganized than in control embryos. Elongated
myotubes in control embryos form an organized array as indicated
by the strong polarization of the yellow arrows (Figure 6 G3). The
arrows tend to point either up or down resulting in high peaks at p/2
and 2p/2 (Figure 6K lime green line) and a higher anisotropy factor
(Figure 6L). In contrast, arrows in lamc1-deficient embryos are far
less polarized (compare Figure 6 H3 to G3). The peaks at p/2 and
2p/2 are lower than in wild-type embryos (Figure 6K lime green
line) and the anisotropy factor is significantly lower (Figure 6L).
Thus, application of the 2D WTMM formalism quantitatively
supports the qualitative perception that muscle fibers are disorga-
nized in laminin-deficient embryos.
The next question that follows is when does the anisotropic
signature in laminin-deficient embryos become different from wild-
type embryos? No overt morphological differences between control
and laminin-deficient cells in the short precursor phase are visible to
the eye (Figure 6I, J). However, there is a slight but significant
difference between the anisotropy factors (Figure 6L). The difference
between anisotropy factors increases at every phase of muscle
morphogenesis. These data indicate that laminin is required for
cellular organization as early as the short precursor phase. Thus,
subsequent myotube disorganization may reflect both early and late
requirements for laminin during muscle morphogenesis.
Laminin Is a Molecular Cue that Stops Fiber ElongationIt has been proposed that muscle fibers elongate until they reach
a small patch of ECM that functions to capture elongating muscle
cells and prevent them from extending into the next myotome
[24]. However, it is not known which of the many ECM
components of the MTJ are required or if multiple proteins are
required. We find that both lamb1 and lamc1 play a role in MTJ
morphogenesis. Some fast muscle cells in lamb1 and lamc1 mutants
and morphants do not stop elongating at the MTJ (Figure 6 F1
white arrowhead, note that the muscle cell extends a long, thin
protrusion across the boundary). The MTJ is visible in 48 hpf wild-
type (WT) embryos as a dark line devoid of filamentous actin
(Figure 7A, white arrow). In wi390/lamc1 mutant embryos, some
muscle fibers inappropriately cross the MTJ and are approxi-
mately twice as long as their counterparts that did not cross the
boundary (Figure 7 A1 red arrowhead). These cells are
multinucleate (data not shown), indicating that boundary capture
is not required for fusion. The crossing of a boundary by a few
muscle fibers results in an asymmetrical myotome: some of the
myotome has longer fibers while the majority of fibers are an
appropriate length (Figure 7 A1). Fast fibers in gup/lamb1 mutants
also cross MTJ boundaries (Figure 7 A2 red arrowhead). At 48
hpf, some boundaries were crossed within every laminin-deficient
embryo examined. Generally, 16–24% of boundaries were crossed
(average % of boundaries crossed: WT, 0%, n.100; gup/lamb1,
20% crossed, n = 12 embryos, 3 experiments; wi390/lamc1, 22%
crossed, n = 9 embryos, 1 experiment; lamb1 MO, 24% crossed,
n = 26 embryos, 5 experiments; lamc1 MO, 16% crossed, n = 18
embryos, 3 experiments).
Boundary Capture as a Cell Autonomous PhenomenonOur data show that lamb1 and c1 play a role in boundary
capture of elongating muscle fibers, but the mechanism of capture
is not yet known. A dense network of polymerized laminin may
function as a physical barrier that stops elongating muscle fibers.
Interestingly, however, laminin polymerization can trigger chang-
es in the organization of the matrix, ECM receptors and
cytoskeletal components [36]. Cell-autonomous changes in
cytoskeletal organization upon laminin binding provide an
alternate hypothesis: that signaling that results from laminin
binding may mediate boundary capture in a cell-autonomous
fashion. We hypothesized that WT cells transplanted in laminin-
deficient embryos might be able to secrete small amounts of
laminin that would facilitate their capture and reduce the
likelihood of elongating through the boundary. To test this, cells
from dextran-injected control embryos were transplanted into
lamc1 morphant hosts. Control cells were less likely than lamc1
morphant cells to cross the boundary (Figure 7C, D). Only 6
percent of control cells crossed boundaries (19/311 cells) whereas
25% of morphant cells crossed boundaries (407/1631 cells).
Control cells undergo boundary capture even when adjacent to
lamc1 morphant cells crossing boundaries (Figure 7 B1, B2 note
that the red control cell, white arrowhead respects the boundary,
but adjacent morphant cells cross the boundary, red arrowhead).
These data not only provide the first evidence that laminin plays a
role in ceasing initial myofiber elongation, but the cell autonomous
rescue of boundary integrity by WT cells suggests that boundary
capture is mediated at the single cell level.
Dynamics of Zebrafish Muscle Morphogenesis
PLoS Genetics | www.plosgenetics.org 10 October 2008 | Volume 4 | Issue 10 | e1000219

Figure 6. lamininb1 and c1 are Required for Normal Fast Muscle Cell Elongation. Panels A–C are confocal images and D–J are ApoTomemicrographs. Panels A–C are side views, anterior left, dorsal top of 18 somite-stage embryos stained with F59 (white) to denote slow-twitch muscleand phalloidin (red) to outline fast muscle cells. Panels labeled 1 are lateral sections from a z-series and panels labeled 2 are medial sections from thesame z-series. A) In WT embryos, fast-twitch muscle cells medial (A1, white arrow) to migrating slow-twitch fibers (A, green arrow) have elongated. B)Although some slow-twitch fibers do migrate in gup/lamb1 mutant embryos, not all fast muscle precursor cells have elongated (B1 white arrowhead:short cell, B green arrow: slow-twitch muscle fiber that has migrated laterally). C) Not all fast muscle precursor cells medial to migrating slow fibershave elongated in lamc1 morphant embryos (C1 white arrowhead: short cell, C green arrow: slow-twitch muscle fiber that has migrated laterally).Panels D–E are projected views of dextran filled cells (red) and b-catenin that outlines cells (blue). D) Elongated fibers in a WT embryo, note theorganized, parallel array of fibers. E) Elongated fibers in a lamc1-deficient embryo, white arrowhead denotes a fiber that is not parallel. F–F2) Adextran-filled cell in a lamc1 morphant embryo extends a thin protrusion across the MTJ. White arrows denote the MTJ, white arrowhead denotesthin protrusion extending across the MTJ. F59 denotes slow muscle in blue and dextrans are red. Panel F1 is a single focal plane from a z-series,panels F and F2 are projections. Scale bars F: 50 mm, F1: 20 mm. G–H) Cells in the myotube phase are less organized in lamc1 morphant embryos thanin control embryos as shown by more randomly oriented WTMMM vector arrows. Panels numbered 3 are higher magnification views. I–J) Althoughdifferences in cellular structure are not obvious to the eye (compare I1 and J1), lamc1 short precursor cells are less organized than control cells asshown by more randomly oriented WTMMM vector arrows. Panels numbered 3 are higher magnification views. K: The WTMMM vector angle pdfs aredisplayed for all stages (color coded per panel L), the isotropic fBm surfaces (black curve fluctuating around p/2), and the flat 1/2p curve that would
Dynamics of Zebrafish Muscle Morphogenesis
PLoS Genetics | www.plosgenetics.org 11 October 2008 | Volume 4 | Issue 10 | e1000219

Discussion
A mechanistic understanding of the cellular basis of muscle cell
elongation and tendon attachment is critical to elucidate
underlying molecular mechanisms that mediate morphogenesis.
We show here the first quantitative analysis of individual fast muscle
cell elongation in a living vertebrate embryo. Three broad phases
of morphogenesis underlie the transition from a somite comprised
of short muscle precursor cells to a myotome comprised of
elongated muscle fibers. First, short muscle precursor cells exhibit
dynamic protrusive activity, but do not undergo large-scale shape
changes. The second phase, intercalation/elongation, occurs via a
repetitive two-step process of protrusion extension and filling and
requires lamb1 and c1 to proceed efficiently. The third phase
encompasses boundary capture as well as shape changes that
generate a more regularly shaped myotube. Although myotubes
do form in laminin-deficient embryos, they are significantly less
organized than in wild-type embryos. We find that both lamb1 and
c1 are required for boundary capture and thus provide the first
molecular insight into boundary capture at the MTJ. Taken
Figure 7. Laminin Plays a Role in Boundary Capture of Elongating Muscle Fibers. ApoTome micrographs, side views, anterior left, dorsaltop of 48 hpf embryos. A–A2) MTJ boundaries are sometimes crossed in lamb1 and lamc1-deficient embryos. The MTJ in WT embryos is visible as thedark line of no phalloidin staining in between myotomes (A, white arrow). In both lamb1 and c1 mutants, MTJs are observed (A1–A2, white arrows),but sometimes a portion of an MTJ is crossed by a muscle fiber (red arrowheads, A1–A2). Scale bar: 50 mm. B–B2) Cell autonomous rescue ofboundary crossing by control cells in lamc1 morphant embryos. White box in B1 indicates the higher magnification view in B2. Transplanted controlcells do not cross the MTJ boundary (white arrowheads, only 19/311 transplanted control cells crossed MTJ boundaries in lamc1 morphant embryoscompared to 402/1631 morphant cells). The red arrowhead indicates morphant cells that cross boundaries. Scale bars: 20 mm. C–D) Graphs showingboundary crossing by control cells and morphant cells.doi:10.1371/journal.pgen.1000219.g007
be obtained for a purely theoretical isotropic process (flat pointed line at 1/2p). Note the stronger (higher) peaks in control embryos. L) Theanisotropy factor of muscle cells in laminin-deficient embryos is significantly lower than in control embryos at all four stages of musclemorphogenesis (p,0.01). These results indicate that even though differences in organization as far back as the precursor stage are not obviousvisually, they are unequivocally more disorganized than in controls when the anisotropic value is determined.doi:10.1371/journal.pgen.1000219.g006
Dynamics of Zebrafish Muscle Morphogenesis
PLoS Genetics | www.plosgenetics.org 12 October 2008 | Volume 4 | Issue 10 | e1000219

together, these data indicate that muscle morphogenesis is
spatiotemporally complex and involves interactions between
muscle fibers and the basement membrane during elongation
and attachment to the MTJ. It is not yet known if there is some
conservation between morphogenetic mechanisms underlying
early morphogenesis between vertebrates. Given recent data
indicating that the zebrafish somite has a dermomyotome and is
thus more homologous to amniotes as previously thought [37–39],
it is tempting to speculate that the morphogenetic mechanisms
described here may apply to higher vertebrates as well.
Three Phases of Early Fast Muscle MorphogenesisBoth qualitative and quantitative assessments of early muscle
development are critical to facilitate identification of molecular
mechanisms that underlie morphogenesis. We find that the three
phases of early fast muscle morphogenesis are qualitatively and
quantitatively different. These stages are short muscle precursor
cells, elongating muscle cells and myotube formation. Short
muscle precursor cells have a low filament index and extend and
retract short (,2 mm) protrusions in all directions. Elongating fast
muscle cells extend long protrusions along the axis of elongation
and have a higher filament index. Long muscle cells forming
myotubes have an even higher filament index indicating yet a
further departure from a circular shape. Thus, we provide a novel
paradigm whereby morphometric analysis can distinguish different
phases of early muscle development.
Mathematical Modeling and Time-Lapse Analysis Indicatethat a Repetitive Two-Step Mechanism Underlies FastMuscle Cell Elongation
It is not known how the first fast-twitch muscle cells elongate
during vertebrate development. We utilized an experimental
approach to distinguish between potential scenarios (Figure 2A).
C2C12 myoblasts in culture elongate prior to differentiation and fuse
to generate a multinucleate myotube [10] that we termed the
elliptical growth scenario. The first muscle cells to elongate in
grasshopper embryos (muscle pioneers) exhibit a morphology similar
to that of pathfinding neurons [11], we have called this the branching
scenario. During Drosophila embryogenesis, muscle cells elongate via
fusion [12,13] and zebrafish homologues of genes required for
muscle cell fusion in Drosophila are also required for normal muscle
development in zebrafish [14,15]. It has also been proposed that
zebrafish muscle cell elongation may be similar to notochord/neural
plate cell intercalation [24], represented by the protrusion scenario.
Time-lapse analysis indicates that elongating cells extend local
protrusions along their long axis (Figure 8C, D). Protrusions are
extended in the direction of elongation and between other cells.
Protrusions then thicken, resulting in elongation of the cell.
Repetition of protrusion extension/thickening results in an elongated
muscle cell. Mathematical modeling of expected changes in area and
perimeter supports the protrusion model of morphogenesis. Thus,
we show that a novel two-step mechanism underlies elongation of the
first fast muscle fibers in a vertebrate model system, the zebrafish.
Muscle Cell FusionMuscle development is perhaps best understood in Drosophila,
where muscle morphogenesis is accomplished via fusion of founder
cells (FCs) with fusion competent myoblasts (FCMs) [13]. Recent 3-
D imaging has demonstrated that there are two phases of fusion and
suggests that the spatial relationship of FCs and FCMs influences the
frequency of fusion events [12]. Exciting recent studies using
zebrafish suggest that molecular events underlying muscle cell fusion
in vertebrates may be at least partially conserved [14,15,40]. In the
future it will be important to understand the cellular basis of fusion as
well. In this regard, we show that elongating/recently elongated
muscle cells possess complex 3-D shapes. Thus, a comprehensive
analysis of cell behaviors underlying muscle cell fusion during
zebrafish development will require development of multiple markers
that label entire muscle cells such that fusion can unambiguously be
analyzed. Genetic mosaic approaches such as those used previously
[41] will facilitate analysis of both the timing of fusion as well as
identifying what cells fuse.
Attachment to Laminin Is Necessary for Timely FastMuscle Cell Elongation
We show that lamb1 and c1 are required for efficient fast muscle
cell elongation and proper organization. Application of the 2D
WTMM method indicates that even in early stages of muscle
development where organizational differences are not visually
obvious, anisotropic signatures reveal unequivocally the morpho-
logical discrepancies between laminin-deficient and control embry-
os. This emphasizes the strength of the 2D WTMM method. This
novel use of the 2D WTMM method will give researchers an
invaluable tool to rigorously and quantitatively distinguish subtle
differences in cellular morphology and organization.
We do not know why fast muscle cell elongation is delayed in
lamb1 and c1-deficient embryos. Elongation may be delayed
because fast cells are less organized than in controls. It is also
possible that fast cells in lamb1 and c1 mutant/morphant embryos
do not elongate efficiently because slow muscle cells do not
migrate efficiently. Although WT slow fibers can rescue elongation
in mutant embryos that do not have slow muscle fibers [28], it is
unknown if disrupted slow muscle migration and/or morphology
may delay fast muscle cell elongation.
A third model is that adhesion to laminin may play a role in
generation of traction forces that allow muscle cells to elongate.
Muscle cells extend protrusions as they elongate and these
protrusions likely attach to other cells or the ECM. Attachment
would provide a mechanism for cells to stabilize an extended
protrusion and continue elongation. Interestingly, adhesion to
laminin via the Integrin a7b1 receptor promotes migration of
C2C12 and MM14 cells in culture [42]. Elongating fast muscle
cells in zebrafish do not migrate per se, but future studies will
address whether adhesion to laminin during fast muscle cell
elongation in zebrafish promotes efficient protrusion extension and
thickening. These studies would be facilitated by identification of
the relevant laminin receptor (there are multiple laminin receptors)
such that genetic mosaic analysis could readily be used.
Fast muscle cells do belatedly elongate in the absence of
laminin. It is possible, even likely, that elongating muscle cells may
utilize different modes of adhesion to the substrate and/or other
cells. Thus, if one mode of adhesion is disrupted, muscle cell
elongation would be delayed, but not entirely inhibited. Our
results indicating that muscle cell elongation is delayed, rather
than inhibited, are similar to the finding that myofiber formation is
delayed, but recovers in mouse knockouts of the cell-cell adhesion
protein CDO [43]. Taken together, these results suggest that
muscle cells elongate by extension of protrusions that adhere both
to other cells and the ECM. If one mode of adhesion is disrupted,
cells are delayed in their elongation, but utilize the alternative
mode of adhesion to eventually elongate (Figure 8C, D).
Laminin Participates in Boundary Capture of ElongatingMuscle Cells
One fundamental process during embryonic development is
boundary formation. Some of the first work describing boundary
Dynamics of Zebrafish Muscle Morphogenesis
PLoS Genetics | www.plosgenetics.org 13 October 2008 | Volume 4 | Issue 10 | e1000219

formation was done by Jacobson and colleagues [44–46], where
they showed that cells that reach the notoplate/neural plate
boundary remain on the boundary permanently in both axolotl
and newt embryos. This phenomenon was referred to as trapping.
Keller and colleagues have since expanded upon this model and
termed it boundary capture [47]. Recent work demonstrated that
laminin plays a critical role in boundary capture during notochord
morphogenesis in the ascidian Ciona savignyi [48]. We have
Figure 8. Model of Muscle Morphogenesis in WT and laminin Mutant Embryos. A–A1) Cartoon of WT embryo showing the three phases ofmuscle elongation. In the oldest/most anterior somites, myotubes have formed and are attached to the MTJs. The transition region contains cellsintercalating by extending protrusions that are subsequently filled. Muscle precursor cells exhibit protrusive activity in all directions. A1: Magnificationof a somite in panel A showing proteins concentrated at the MTJ and boundary capture of recently elongated cells. B–B1) Cartoon of laminin mutantembryo at the same age as WT embryo in panel A showing the same three phases of muscle morphogenesis, but with a developmental delay. Cells inyellow are aberrantly long and have invaded into neighboring myotomes. B1: Magnification of two somites in panel B that depicts a model of howboundary crossing could occur in laminin mutant embryos. If laminin is absent, there may be randomly spaced locations at the MTJ devoid ofproteins that function in boundary capture. Elongating muscle cells would invade the MTJ at these locations. C) Cartoon model showing the two-stepmechanism of elongating. We show that adhesion to the matrix is required for normal elongation and hypothesize that cells also utilize cell-celladhesion to generate traction forces needed for protrusion extension and filling. D) Model accounting for developmental delay in musclemorphogenesis that occurs in laminin mutants. Cartoon depicting a laminin mutant cell undergoing two-step elongation via protrusion extensionand filling. Lack of the cell-matrix adhesion protein laminin results in less traction and therefore slower extension and/or filling.doi:10.1371/journal.pgen.1000219.g008
Dynamics of Zebrafish Muscle Morphogenesis
PLoS Genetics | www.plosgenetics.org 14 October 2008 | Volume 4 | Issue 10 | e1000219

previously demonstrated that the MTJ captures elongating muscle
fibers, but it was not known what ECM components were relevant
[24]. It was also not known if the cessation of muscle fiber
elongation is cell autonomous or mediated by community effects.
Here we show that laminin is one component of the MTJ that
stops elongating fibers. This result, combined with the work of
Veeman et al., suggests that roles for laminin in boundary capture
may be conserved, at least within chordates. We also show that
wild-type cells in lamc1 morphant embryos have a reduced ability
to cross the MTJ. The fact that wild-type cells are less able to cross
the MTJ, but do not rescue their lamc1-deficient neighbors,
suggests that boundary capture is a cell autonomous process.
These data also suggest that MTJ breakdown in lamb1and c1-
deficient embryos is a local event caused by the failure of
elongating muscle fibers to stop when they reach the MTJ. We do
not currently know why 75% of elongating muscle cells in lamb1
and c1-deficient embryos do stop elongating, but 25% do not. We
hypothesize that the MTJ boundary is not homogenous. In this
scenario, the absence of laminin would leave ‘‘holes’’ in the MTJ
and muscle cells would elongate through these holes (Figure 8B,
B1). Future experiments will be directed towards identifying
additional molecular cues involved in boundary capture.
Methods
Zebrafish HusbandryZebrafish embryos were obtained from natural spawnings of
adult fish kept at 28.5uC on a 16 h light/8 h dark cycle and were
staged according to [49].
ImmunocytochemistryF59 was utilized to visualize slow fibers as previously described
[25,50]. Alexa Fluor 488 and 546 phalloidin and Sytox green were
obtained from Molecular Probes. We used the H2A:GFP
transgenic line of zebrafish to visualize nuclei [51]. A ‘‘scatter’’
label of cells filled with fluoro-ruby dextrans (Molecular Probes)
was obtained by microinjecting embryos at the 512–1000 cell
stage with dextrans into the yolk cell close to the margin.
Antibodies used were: mouse monoclonal anti-myosin (F59)
(Devoto, et al. 1996, generous gift of Frank Stockdale) 1:10, mouse
monoclonal anti-b-catenin (Sigma) 1:500 and Alexa-Fluor 488,
546 and 633 conjugated goat anti-mouse and goat anti-rabbit
secondary antibodies (Invitrogen) 1:200.
ImagingImages were acquired using a Leica SP2 confocal microscope
and a Zeiss ApoTome running on a Zeiss Axio Imager Z1. All
mathematical analyses were done on images acquired on the
Apotome using a 206 lens, NA 0.8, yielding a resolution of
1.5 pixels / mm. Images were linearly processed in Adobe
Photoshop and collated in Adobe Illustrator.
MorpholinosMorpholino-modified antisense oligonucleotides (MOs) were
synthesized by Gene-Tools, LCC. The morpholinos used were
previously described and recapitulate the mutant phenotypes [31].
Time-Lapse AnalysisEmbryos were vitally stained and imaged with the fluorescent,
lipophilic dye BODIPY-Ceramide (Molecular Probes, Eugene, OR)
using the procedures outlined by [52,53]. Time-lapse recordings
were made using a scanning laser confocal microscope (Leica SP2,
Heidelburg, Germany). Time-lapse analysis with transplanted
dextran-filled cells was performed utilizing the Zeiss ApoTome.
MorphometricsTo measure properties of dextran-filled cells, the z-series of the
cell was projected such as to visualize the cell three-dimensionally.
Cells were then segmented with ImageJ and the perimeter, area
and major axis were measured. The major axis as determined by
ImageJ is the longest length of the best fitting ellipse. The filament
index was also calculated [54]:
F~PD
4A
where P, D and A are the perimeter, diameter and area
respectively. For this study, the diameter was taken to be equal
to the major axis. Note that a circle has a filament index F = 1 and
an object having a value of F larger than 1 quantifies its departure
from a circular shape. A two sample T-test was performed using
SYSTAT. * denotes p,0.05 and ** denotes p,0.01.
Mathematical ModelingIn order to quantitatively characterize the morphology of muscle
fiber growth, two geometrical models were developed. For simplicity,
both the elliptical and protrusion models start with a unit circle (with
radius = 1). For both models, when the cell is growing we assume that
it does so only in the major direction and that the semi-minor axis
stays constant, and for mathematical simplicity (and without any loss
of generality), is equal to 1. Therefore, we have
A~pa and P~2p
ffiffiffiffiffiffiffiffiffiffiffiffia2z1
2
r
The growth ratios for the area and perimeter of both models can be
defined analytically. For the elliptical model, the growth ratio for the
area at time t, Aelliptical(t), is equal to the major axis at time t, which
grows continuously:
AAelliptical tð Þ~a tð Þ:
The perimeter growth ratio at time t, Pelliptical(t), is given by
PPelliptical tð Þ~
ffiffiffiffiffiffiffiffiffiffiffiffiffiffiffiffiffia tð Þ2z1
2
s
For the protrusion model, the cell grows in a two-step manner,
expanding a thin protrusion of relatively small area DA and
perimeter DP at time t, and then filling the area until the cell
becomes an ellipse at time t+1. Therefore, the growth ratio for the
area of the protrusion model will depend on whether it is growing a
protrusion or filling that protrusion. For simplicity, we assume that
the cell is growing a protrusion if t is even and it is filling the area
opened by protrusion when t is odd:
AAprotrusion tð Þ~a tð Þ, if t is even or AAprotrusion tð Þ~a t{1ð ÞzDA,
if t is odd
Similarly for the perimeter of the protrusion model cell:
PPprotrusion tð Þ~
ffiffiffiffiffiffiffiffiffiffiffiffiffiffiffiffiffia tð Þ2z1
2
s, if t is even or PPprotrusion tð Þ~
ffiffiffiffiffiffiffiffiffiffiffiffiffiffiffiffiffiffiffiffiffiffiffiffiffia t{1ð Þ2z1
2
szDP, if t is odd:
Dynamics of Zebrafish Muscle Morphogenesis
PLoS Genetics | www.plosgenetics.org 15 October 2008 | Volume 4 | Issue 10 | e1000219
Since DA is relatively small with respect to the area of the whole cell,
the extension of a protrusion will not significantly increase the area of
the cell. Conversely, since DP is relatively large with respect to the
perimeter of the whole cell, the perimeter of the cell will significantly
increase. The evolution of the area and perimeter as a function of
time for both models is shown in Figure 3A, A1.
Characterizing Anisotropy with the 2D WTMM MethodPreparation of images. Embryos were stained with b-catenin
to outline all cells and fixed at 20 hpf. This stage is ideal because
anterior, older somites have formed muscle but posterior somites
have not. Thus, all the phases of muscle morphogenesis are
represented within single embryos. Images representing all phases
were obtained utilizing a Zeiss Axioimager equipped with an
Apotome as mentioned above. Each image and focal plane was
evaluated and the phase (short precursor, etc.) determined. The
phase that was identified represented most cells within a focal plane.
Because muscle cell elongation is an exceedingly dynamic process,
cells within different focal planes within the same z-series are
sometimes at different phases of elongation. Each image was then
cropped into 2566256 pixel sub-images. This cropping is necessary
to eliminate other tissues in the embryos such as residual yolk
platelets and neural tissue. Cropping was also necessary because fast
muscle cells in the dorsal and ventral halves of somites angle slightly
towards the middle. We thus flipped all ventrally derived panels so
that the WTMMM vector angles for dorsal and ventral halves would
not cancel each other out within a single sub-image. At least 10
images for at least 5 different embryos were analyzed for each phase.
The 2D WTMM method is a multifractal image analysis
formalism introduced in [34], where the different dilations of the
analyzing wavelet reveal quantitative roughness information at every
length scale considered. By considering two wavelets that are,
respectively, the partial derivatives with respect to x and y of a 2D
smoothing Gaussian function, the Wavelet Transform is thus the
gradient vector of the analyzed image smoothed by dilated versions
of the Gaussian filter. A very efficient way to perform point-wise
regularity analysis is to use the Wavelet Transform Modulus
Maxima (WTMM) [55,56]. At a given scale a, the WTMM are
defined by the positions where the Wavelet Transform Modulus is
locally maximum in the direction A of the gradient vector. When
analyzing rough surfaces, these WTMM lie on connected chains
called maxima chains [34], as shown in Figure 5, green lines. One only
needs to record the position of the local maxima of the gradient
along the maxima chains together with the angle A at the
corresponding locations. At each scale a, the wavelet analysis thus
reduces to store those WTMM maxima (WTMMM) only (red dots
in Figure 5). They indicate locally the direction where the signal has
the sharpest variation.
An image having an anisotropic signature means that the
intensity variation in the image will differ according to the
direction considered. Such images having an anisotropic signature
can be easily characterized from the directional information
provided by the continuous 2D Wavelet Transform [35]. This is
done by considering, at all size scales a, the probability density
functions (pdfs), Pa(A), of the angles, A, associated to each
WTMMM vector. A flat pdf indicates unprivileged random
directions of sharpest intensity variation (i.e. isotropy), while any
departure from a flat distribution is interpreted as the signature of
anisotropy. For the present study, a strong anisotropic signature is
interpreted as a strongly structured cell lattice.
Anisotropy FactorIn order to obtain quantitative information from the angle pdfs
Pa(A), they are compared to a theoretical flat distribution
representing an ideal isotropic signature (see Figure 5F). The
anisotropy factor, Fa, defined for each value of the scale parameter a,
is given by the area between the curve corresponding to the
observed pdfs and a flat distribution:
Fa~
ðp{p
Pa Að Þ{ 1
2p
��������dA:
Therefore Fa has been defined in such a way that a theoretically
isotropic surface will have a value of Fa = 0, while any value greater
than 0 quantifies a departure from isotropy.
Construction of Simulated Isotropic Surfaces forCalibration Purposes
Following the standard procedures presented in [34,35],
fractional Brownian motion (fBm) isotropic surfaces were gener-
ated. Two-dimensional fBm’s are processes with stationary zero-
mean Gaussian increments that are statistically invariant under
isotropic dilations. They are therefore expected to reproduce quite
faithfully the isotropic scaling invariance properties.
Genetic Mosaic AnalysisWT embryos were injected with 10,000 MW dextrans
(Molecular Probes). Cells were removed at the sphere stage and
placed into hosts that had been injected with lamc1 MOs. Hosts
were grown up until the appropriate stage, stained with phalloidin
and the number of transplanted control cells that crossed MTJ
boundaries was compared with the number of lamc1 morphant
cells that crossed MTJ boundaries.
Supporting Information
Figure S1 Somite Boundary Shape, Slow Muscle Migration and
Fast Muscle Elongation are Disrupted in lamininb1 and c1-
deficient Embryos. All panels are ApoTome images at the 18
somite stage. Side views, anterior left, dorsal top, except panels
numbered 4 that are transverse views, lateral left, medial right.
Panels 2–4 are higher magnification views of the embryos shown
in panels numbered 1. Panels numbered 1 and 2 are single focal
planes from a Z-series and show phalloidin staining that outlines
all cells. Panels numbered 3 and 4 are projections of the entire Z-
series of panels numbered 2. In these panels, F59 expression
denotes slow-twitch muscle fibers. All panels (A1–C1, A2–C2) are
from approximately the same anterior-posterior and medial-lateral
position in control and morphant embryos. A1–C1) WT control
embryos contain robust, chevron shaped boundaries. lamb1 and
lamc1 morphants have rounder, flatter shaped boundaries. Note
that intial somite boundaries, albeit less chevron-shaped, do form
in lamb1 and lamc1 morphant embryos. A2–C2) Whereas fast
muscle cells are elongating in control embryos (A2, white arrow),
fast-twitch muscle cell elongation is disrupted in both lamb1 (B2,
white arrowhead) and lamc1 (C2, white arrowhead) morphant
embryos but some elongation does occur (white arrows). A3–C3/
A4–C4) Myosin organization in slow-twitch muscle fibers is
disrupted in lamb1 and lamc1 morphant embryos. In control
embryos, the projected (panels numbered 3) and rotated transverse
views (panels numbered 4) show organized slow-twitch fibers that
have migrated laterally (muscle pioneers: red asterisk). Slow-twitch
fiber organization, spacing, and migration, are disrupted in lamb1
and lamc1 morphant embryos.
Found at: doi:10.1371/journal.pgen.1000219.s001 (7.8 MB TIF)
Dynamics of Zebrafish Muscle Morphogenesis
PLoS Genetics | www.plosgenetics.org 16 October 2008 | Volume 4 | Issue 10 | e1000219

Movie S1 Time-lapse confocal microscopy using BODIPY-
ceramide to outline cell borders suggests that cells intercalate
during elongation. Side views, anterior left. Colored cells were
tracked in Image J and pseudocolored in Adobe Photoshop. The
purple cell initiates elongation as does the orange cell. The blue
cell elongates through time, extending a thin protrusion between
the orange and green cells eventually reaching the anterior
boundary. The long but irregularly shaped green cell becomes a
rod shaped myotube through time.
Found at: doi:10.1371/journal.pgen.1000219.s002 (2.0 MB
MOV)
Movie S2 Time-lapse analysis of three-dimensional projections
from ApoTome micrographs shows the three phases of morpho-
genesis. Short dextran-filled cells exhibit protrusive activity as they
begin elongating. Elongating cells initially extend long protrusions
that subsequently grow, resulting in the elongation of the cell.
Green arrowheads denote extensions. Cells in the myotube
formation phase are initially irregularly shaped but become rod
shaped myotubes through time.
Found at: doi:10.1371/journal.pgen.1000219.s003 (1.0 MB
MOV)
Movie S3 Three-dimensional shapes of fixed cells in different
phases of morphogenesis. Part 1: A lateral-medial Z-series of a
long yet irregularly shaped dextran-filled cell with one nucleus.
Part 2: Rotation of a three-dimensional projection of a partially
elongated dextran-filled cell in a fixed embryo showing an
extension. Part 3: Rotation of a three-dimensional projection of
myotube in a fixed embryo.
Found at: doi:10.1371/journal.pgen.1000219.s004 (2.7 MB
MOV)
Movie S4 Time-lapse analysis of live cells.
Found at: doi:10.1371/journal.pgen.1000219.s005 (1.5 MB
MOV)
Acknowledgments
We thank Yin Chiu for help with analysis. The authors would like to thank
Tom Gridley for his thoughtful reading of the manuscript as well as the
anonymous reviewers and their excellent suggestions. The authors would
also like to thank Mary Simon, Stephen Devoto, Carol Kim, Scott Collins,
and Alain Arneodo for helpful discussions and Mark Nilan for fish care.
Author Contributions
Conceived and designed the experiments: CAH. Performed the experi-
ments: CJS ECO RJ CAH. Analyzed the data: CJS MG MWK AK CAH.
Contributed reagents/materials/analysis tools: AK. Wrote the paper: CJS
MG MWK AK CAH.
References
1. Hollway G, Currie P (2005) Vertebrate myotome development. Birth Defects
Res C Embryo Today 75: 172–179.
2. Hollway GE, Currie PD (2003) Myotome meanderings. Cellular morphogenesis
and the making of muscle. EMBO Rep 4: 855–860.
3. Buckingham M, Bajard L, Chang T, Daubas P, Hadchouel J, et al. (2003) The
formation of skeletal muscle: from somite to limb. J Anat 202: 59–68.
4. Long JH, Adcock B, Root RG (2002) Force transmission via axial tendons in
undulating fish: a dynamic analysis. Comp Biochem Physiol A Mol Integr
Physiol 133: 911–929.
5. Kahane N, Cinnamon Y, Kalcheim C (1998) The cellular mechanism by which
the dermomyotome contributes to the second wave of myotome development.
Development 125: 4259–4271.
6. Denetclaw WF, Ordahl CP (2000) The growth of the dermomyotome and
formation of early myotome lineages in thoracolumbar somites of chicken
embryos. Development 127: 893–905.
7. Ben-Yair R, Kalcheim C (2005) Lineage analysis of the avian dermomyotome
sheet reveals the existence of single cells with both dermal and muscle progenitor
fates. Development 132: 689–701.
8. Gros J, Scaal M, Marcelle C (2004) A two-step mechanism for myotome
formation in chick. Dev Cell 6: 875–882.
9. Waterman RE (1969) Development of the lateral musculature in the teleost,
Brachydanio rerio: a fine structural study. Am J Anat 125: 457–493.
10. Ohtake Y, Tojo H, Seiki M (2006) Multifunctional roles of MT1-MMP in
myofiber formation and morphostatic maintenance of skeletal muscle. J Cell Sci
119: 3822–3832.
11. Ho RK, Ball EE, Goodman CS (1983) Muscle pioneers: large mesodermal cells
that erect a scaffold for developing muscles and motoneurones in grasshopper
embryos. Nature 301: 66–69.
12. Beckett K, Baylies MK (2007) 3D analysis of founder cell and fusion competent
myoblast arrangements outlines a new model of myoblast fusion. Dev Biol 309:
113–125.
13. Chen EH, Olson EN (2004) Towards a molecular pathway for myoblast fusion
in Drosophila. Trends Cell Biol 14: 452–460.
14. Moore CA, Parkin CA, Bidet Y, Ingham PW (2007) A role for the Myoblast city
homologues Dock1 and Dock5 and the adaptor proteins Crk and Crk-like in
zebrafish myoblast fusion. Development 134: 3145–3153.
15. Srinivas BP, Woo J, Leong WY, Roy S (2007) A conserved molecular pathway
mediates myoblast fusion in insects and vertebrates. Nat Genet 39: 781–786.
16. LeBleu VS, Macdonald B, Kalluri R (2007) Structure and function of basement
membranes. Exp Biol Med (Maywood) 232: 1121–1129.
17. Hoffman EP, Brown RH Jr, Kunkel LM (1987) Dystrophin: the protein product
of the Duchenne muscular dystrophy locus. Cell 51: 919–928.
18. Bonnemann CG, Modi R, Noguchi S, Mizuno Y, Yoshida M, et al. (1995) Beta-
sarcoglycan (A3b) mutations cause autosomal recessive muscular dystrophy with
loss of the sarcoglycan complex. Nat Genet 11: 266–273.
19. Noguchi S, McNally EM, Ben Othmane K, Hagiwara Y, Mizuno Y, et al. (1995)
Mutations in the dystrophin-associated protein gamma-sarcoglycan in chromo-
some 13 muscular dystrophy. Science 270: 819–822.
20. Nigro V, de Sa Moreira E, Piluso G, Vainzof M, Belsito A, et al. (1996)
Autosomal recessive limb-girdle muscular dystrophy, LGMD2F, is caused by a
mutation in the delta-sarcoglycan gene. Nat Genet 14: 195–198.
21. Hall TE, Bryson-Richardson RJ, Berger S, Jacoby AS, Cole NJ, et al. (2007) The
zebrafish candyfloss mutant implicates extracellular matrix adhesion failure in
laminin {alpha}2-deficient congenital muscular dystrophy. Proc Natl Acad
Sci U S A 104: 7092–7097.
22. Bajanca F, Luz M, Raymond K, Martins GG, Sonnenberg A, et al. (2006)
Integrin alpha6beta1-laminin interactions regulate early myotome formation in
the mouse embryo. Development 133: 1635–1644.
23. Nishiuchi R, Murayama O, Fujiwara H, Gu J, Kawakami T, et al. (2003)
Characterization of the ligand-binding specificities of integrin alpha3beta1 and
alpha6beta1 using a panel of purified laminin isoforms containing distinct alpha
chains. J Biochem 134: 497–504.
24. Henry CA, McNulty IM, Durst WA, Munchel SE, Amacher SL (2005)
Interactions between muscle fibers and segment boundaries in zebrafish. Dev
Biol 287: 346–360.
25. Devoto SH, Melancon E, Eisen JS, Westerfield M (1996) Identification of
separate slow and fast muscle precursor cells in vivo, prior to somite formation.
Development 122: 3371–3380.
26. Blagden CS, Currie PD, Ingham PW, Hughes SM (1997) Notochord induction of
zebrafish slow muscle mediated by Sonic hedgehog. Genes Dev 11: 2163–2175.
27. Cortes F, Daggett D, Bryson-Richardson RJ, Neyt C, Maule J, et al. (2003)
Cadherin-mediated differential cell adhesion controls slow muscle cell migration
in the developing zebrafish myotome. Dev Cell 5: 865–876.
28. Henry CA, Amacher SL (2004) Zebrafish slow muscle cell migration induces a
wave of fast muscle morphogenesis. Dev Cell 7: 917–923.
29. Kudo H, Amizuka N, Araki K, Inohaya K, Kudo A (2004) Zebrafish periostin is
required for the adhesion of muscle fiber bundles to the myoseptum and for the
differentiation of muscle fibers. Dev Biol 267: 473–487.
30. Crawford BD, Henry CA, Clason TA, Becker AL, Hille MB (2003) Activity and
distribution of paxillin, focal adhesion kinase, and cadherin indicate cooperative
roles during zebrafish morphogenesis. Mol Biol Cell 14: 3065–3081.
31. Parsons MJ, Pollard SM, Saude L, Feldman B, Coutinho P, et al. (2002)
Zebrafish mutants identify an essential role for laminins in notochord formation.
Development 129: 3137–3146.
32. Julich D, Geisler R, Holley SA (2005) Integrinalpha5 and delta/notch signaling
have complementary spatiotemporal requirements during zebrafish somitogen-
esis. Dev Cell 8: 575–586.
33. Koshida S, Kishimoto Y, Ustumi H, Shimizu T, Furutani-Seiki M, et al. (2005)
Integrinalpha5-dependent fibronectin accumulation for maintenance of somite
boundaries in zebrafish embryos. Dev Cell 8: 587–598.
34. Arneodo A, Decoster N, Roux S (2000) A wavelet-based method for multifractal
image analysis. I. Methodology and test applications on isotropic and anisotropic
random rough surfaces. European Journal of Physics B 15: 567–600.
35. Khalil A, Joncas G, Nekka F, Kestener P, Arneodo A (2006) Morphological
analysis of HI features. II. Wavelet-based multifractal formalism. Astrophysical
Journal Supplement Series 165: 512–550.
Dynamics of Zebrafish Muscle Morphogenesis
PLoS Genetics | www.plosgenetics.org 17 October 2008 | Volume 4 | Issue 10 | e1000219

36. Colognato H, Winkelmann DA, Yurchenco PD (1999) Laminin polymerization
induces a receptor-cytoskeleton network. J Cell Biol 145: 619–631.
37. Stellabotte F, Devoto SH (2007) The teleost dermomyotome. Dev Dyn 236:
2432–2443.
38. Hammond CL, Hinits Y, Osborn DP, Minchin JE, Tettamanti G, et al. (2007)
Signals and myogenic regulatory factors restrict pax3 and pax7 expression to
dermomyotome-like tissue in zebrafish. Dev Biol 302: 504–521.
39. Devoto SH, Stoiber W, Hammond CL, Steinbacher P, Haslett JR, et al. (2006)
Generality of vertebrate developmental patterns: evidence for a dermomyotome
in fish. Evol Dev 8: 101–110.
40. Krauss RS (2007) Evolutionary conservation in myoblast fusion. Nat Genet 39:
704–705.
41. Roy S, Wolff C, Ingham PW (2001) The u-boot mutation identifies a Hedgehog-
regulated myogenic switch for fiber-type diversification in the zebrafish embryo.
Genes Dev 15: 1563–1576.
42. Yao CC, Ziober BL, Sutherland AE, Mendrick DL, Kramer RH (1996)
Laminins promote the locomotion of skeletal myoblasts via the alpha 7 integrin
receptor. J Cell Sci 109 (Pt 13): 3139–3150.
43. Cole F, Zhang W, Geyra A, Kang JS, Krauss RS (2004) Positive regulation of
myogenic bHLH factors and skeletal muscle development by the cell surface
receptor CDO. Dev Cell 7: 843–854.
44. Jacobson AG, Moury JD (1995) Tissue boundaries and cell behavior during
neurulation. Dev Biol 171: 98–110.
45. Jacobson AG, Oster GF, Odell GM, Cheng LY (1986) Neurulation and the
cortical tractor model for epithelial folding. J Embryol Exp Morphol 96: 19–49.
46. Moury JD, Jacobson AG (1989) Neural fold formation at newly created
boundaries between neural plate and epidermis in the axolotl. Dev Biol 133:44–57.
47. Keller R, Davidson L, Edlund A, Elul T, Ezin M, et al. (2000) Mechanisms of
convergence and extension by cell intercalation. Philos Trans R Soc Lond B BiolSci 355: 897–922.
48. Veeman MT, Nakatani Y, Hendrickson C, Ericson V, Lin C, et al. (2008)Chongmague reveals an essential role for laminin-mediated boundary formation
in chordate convergence and extension movements. Development 135: 33–41.
49. Kimmel CB, Ballard WW, Kimmel SR, Ullmann B, Schilling TF (1995) Stagesof embryonic development of the zebrafish. Dev Dyn 203: 253–310.
50. Crow MT, Stockdale FE (1986) Myosin expression and specialization among theearliest muscle fibers of the developing avian limb. Dev Biol 113: 238–254.
51. Pauls S, Geldmacher-Voss B, Campos-Ortega JA (2001) A zebrafish histonevariant H2A.F/Z and a transgenic H2A.F/Z:GFP fusion protein for in vivo
studies of embryonic development. Dev Genes Evol 211: 603–610.
52. Cooper MS, D’Amico LA, Henry CA (1999) Analyzing morphogenetic cellbehaviors in vitally stained zebrafish embryos. Methods Mol Biol 122: 185–204.
53. Cooper MS, D’Amico LA, Henry CA (1999) Confocal microscopic analysis ofmorphogenetic movements. Methods Cell Biol 59: 179–204.
54. Khalil A, Grant JL, Caddle LB, Atzema E, Mills KD, et al. (2007) Chromosome
territories have a highly nonspherical morphology and nonrandom positioning.Chromosome Res 15: 899–916.
55. Mallat S, Hwang WL (1992) IEEE Trans on Information Theory 38: 617.56. Mallat S, Zhong S (1992) IEEE Trans on Patern Analysis and Machine
Intelligence 14: 710.
Dynamics of Zebrafish Muscle Morphogenesis
PLoS Genetics | www.plosgenetics.org 18 October 2008 | Volume 4 | Issue 10 | e1000219