tilt effects on gwr superconducting gravimeters
TRANSCRIPT
T
Ua
b
c
a
KSTG
1
amdaadlsaopnsl
“0
0d
Journal of Geodynamics 48 (2009) 316–324
Contents lists available at ScienceDirect
Journal of Geodynamics
journa l homepage: ht tp : / /www.e lsev ier .com/ locate / jog
ilt effects on GWR superconducting gravimeters
. Riccardia,b,∗, J. Hindererb, J.-P. Boyb,c, Y. Rogisterb
Dipartimento di Scienze della Terra, Università “Federico II” di Napoli, L.go S. Marcellino 10, 80138 Naples, ItalyInstitut de Physique du Globe de Strasbourg (UMR 7516 CNRS-Université de Strasbourg), 5 rue René Descartes, 67084 Strasbourg Cedex, FrancePlanetary Geodynamics Laboratory, Mail Code 698, NASA Goddard Space Flight Center, Greenbelt, MD 20771, USA
r t i c l e i n f o
eywords:uperconducting gravimeterilt output calibrationravity
a b s t r a c t
The superconducting gravimeters (SGs) are the most sensitive and stable gravity sensors currently avail-able. The low drift and high sensitivity of these instruments allow to investigate several geophysicalphenomena inducing small- and long-period gravity changes. In order to study such topics, any kind ofdisturbance of instrumental origin has to be identified and possibly modelled. A critical point in gravitymeasurement is the alignment of the gravimeter to the local vertical. In fact a tilt of the instrument willlead to an apparent gravity change and can affect the instrumental drift. To avoid these drawbacks, SGsare provided with an “active tilt feedback system” (ATFS) designed to keep the meter aligned to the verti-cal. We analyse tilt and environmental parameters collected near Strasbourg, France, since 1997 to studythe source of the tilt changes and check the capability of the ATFS to compensate them. We also present
the outcomes of a calibration test applied to the ATFS output to convert the Tilt Power signals into angles.We find that most of the observed signal has a thermal origin dominated by a strong annual componentof about 200 �rad. Nevertheless, our analysis shows that even the tilt due to different geophysical phe-nomena, other than the thermal ones, can be detected. A clear tidal signal of about 0.05 �rad is detectablethanks to the large data stacking (>11 years). We conclude that (i) the ATFS device compensates the tilthaving a thermal origin or coming from any sources and (ii) no significant tilt changes alter the gravityfreq
signal, except for the high. Introduction
The superconducting gravimeters (SGs) are the most sensitivend stable gravity sensors currently available for ground-basedeasurements. The inherent stability of the SGs enables them to
etect signals from a sampling time of 1 s up to several years withtime-domain accuracy of 1 nm/s2 = 0.1 �Gal or better (Richter et
l., 1995; Rosat et al., 2004) and down to 0.5 nm/s2 in the frequencyomain (Rosat et al., 2004). The SG is a device that uses magnetic
evitation of a superconducting sphere instead of a mechanicalpring as in the case of a classical gravimeter. The sensitivity of SGpproaches one nGal (10−11 m s−2), which corresponds to 10−12
f the surface gravity, and drift rates are as low as a few �Galer year. These features allow us to study many geophysical phe-omena inducing gravity changes over a broad time-scale range,uch as seismic free oscillations, earth tides, ocean and atmosphericoads, post-glacial rebound and seasonal water storage variations
∗ Corresponding author at: Dipartimento di Scienze della Terra, UniversitàFederico II” di Napoli, L.go S. Marcellino 10, 80138 Naples, Italy. Fax: +39815527631/+33 368850291.
E-mail address: [email protected] (U. Riccardi).
264-3707/$ – see front matter © 2009 Elsevier Ltd. All rights reserved.oi:10.1016/j.jog.2009.09.001
uency (>1 mHz) perturbations.© 2009 Elsevier Ltd. All rights reserved.
(Hinderer and Crossley, 2000, 2004). In order to match such topics,any kind of disturbance of instrumental origin has to be modelledand subtracted from the raw gravity signal. It is of central impor-tance in gravity measurement to align the gravimeter to the localvertical. In fact a tilt of the instrument will lead to an apparent grav-ity change and can affect the instrumental drift. This effect coulddeteriorate the quality of the collected data and hide real gravitychanges. In principle, all of the aforementioned geophysical sourcesinduce elasto-gravitational deformation of the Earth, and, there-fore, a tilt of the ground (e.g. Rerolle et al., 2006; Jahr et al., 2006).Also the daily and seasonal temperature variations produce thermalwaves which propagate into the ground and produce the well-known thermo-elastic deformation (Berger, 1975). Besides thesenatural sources, the ambient conditions in the laboratory have tobe taken into account. For instance temperature-related tilt signalsmay be caused by the periodic turning on and off of the air con-ditioning system. Moreover, air drafts on the dewar can producerapid variations in horizontal pressure, while temperature changescause unequal thermal expansion of the dewar walls. Either will
produce tilt by causing the top of the dewar to move slightly. Inorder to avoid all these effects, SGs are provided with an “activetilt feedback system” (ATFS) designed to keep the meter aligned tothe vertical to better than a few �radians (GWR Instruments Inc.,1985).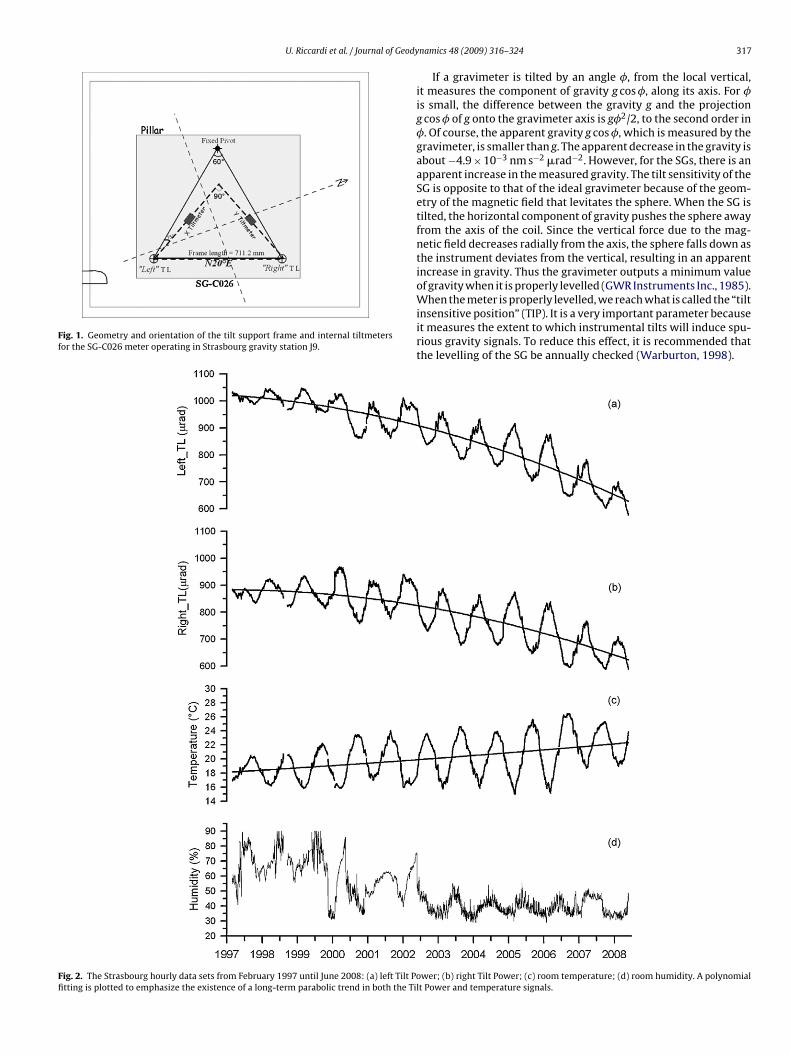
U. Riccardi et al. / Journal of Geody
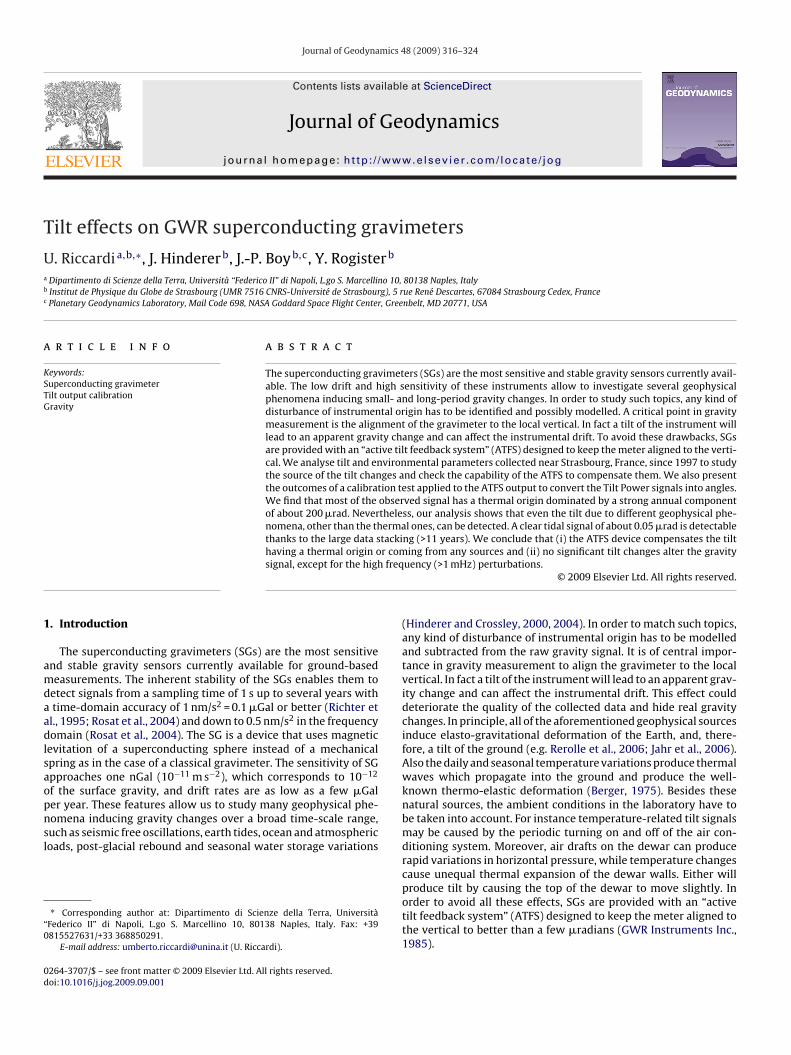
Fig. 1. Geometry and orientation of the tilt support frame and internal tiltmetersfor the SG-C026 meter operating in Strasbourg gravity station J9.
Fig. 2. The Strasbourg hourly data sets from February 1997 until June 2008: (a) left Tilt Pofitting is plotted to emphasize the existence of a long-term parabolic trend in both the Ti
namics 48 (2009) 316–324 317
If a gravimeter is tilted by an angle �, from the local vertical,it measures the component of gravity g cos �, along its axis. For �is small, the difference between the gravity g and the projectiong cos � of g onto the gravimeter axis is g�2/2, to the second order in�. Of course, the apparent gravity g cos �, which is measured by thegravimeter, is smaller than g. The apparent decrease in the gravity isabout −4.9 × 10⁻³ nm s−2 �rad−2. However, for the SGs, there is anapparent increase in the measured gravity. The tilt sensitivity of theSG is opposite to that of the ideal gravimeter because of the geom-etry of the magnetic field that levitates the sphere. When the SG istilted, the horizontal component of gravity pushes the sphere awayfrom the axis of the coil. Since the vertical force due to the mag-netic field decreases radially from the axis, the sphere falls down asthe instrument deviates from the vertical, resulting in an apparentincrease in gravity. Thus the gravimeter outputs a minimum valueof gravity when it is properly levelled (GWR Instruments Inc., 1985).
When the meter is properly levelled, we reach what is called the “tiltinsensitive position” (TIP). It is a very important parameter becauseit measures the extent to which instrumental tilts will induce spu-rious gravity signals. To reduce this effect, it is recommended thatthe levelling of the SG be annually checked (Warburton, 1998).wer; (b) right Tilt Power; (c) room temperature; (d) room humidity. A polynomiallt Power and temperature signals.
318 U. Riccardi et al. / Journal of Geodynamics 48 (2009) 316–324
F eft ani
mgpiUfrikttTaetmrdT
imtittla
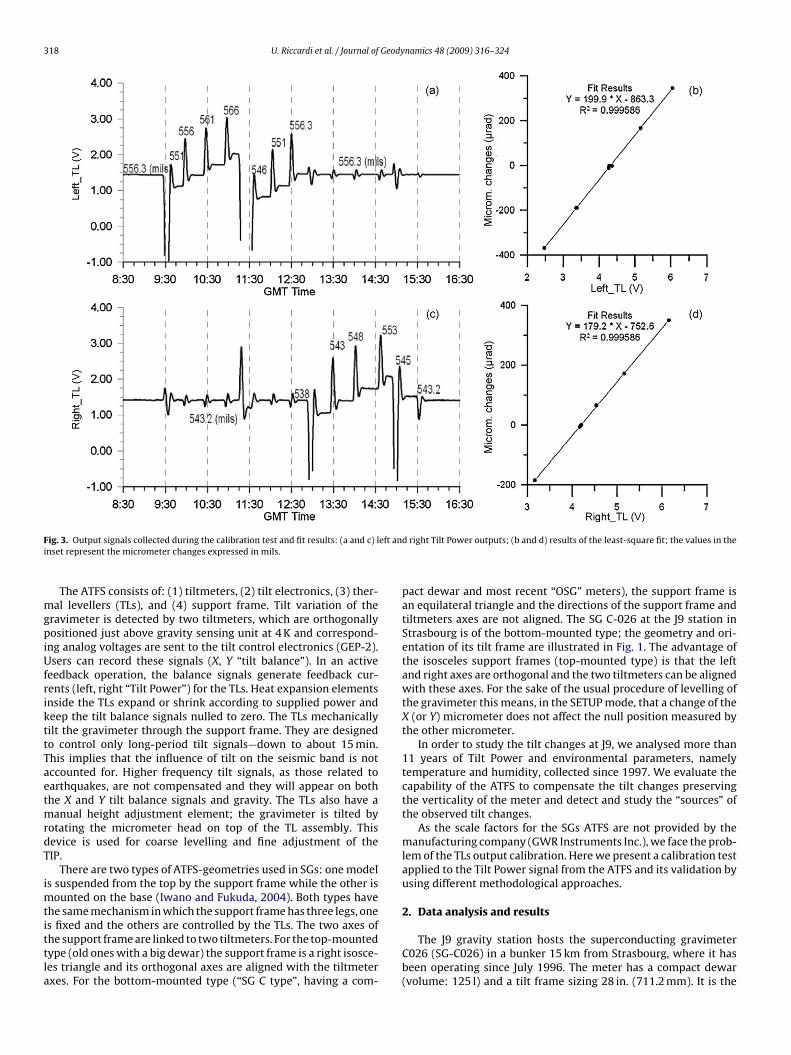
ig. 3. Output signals collected during the calibration test and fit results: (a and c) lnset represent the micrometer changes expressed in mils.
The ATFS consists of: (1) tiltmeters, (2) tilt electronics, (3) ther-al levellers (TLs), and (4) support frame. Tilt variation of the
ravimeter is detected by two tiltmeters, which are orthogonallyositioned just above gravity sensing unit at 4 K and correspond-
ng analog voltages are sent to the tilt control electronics (GEP-2).sers can record these signals (X, Y “tilt balance”). In an active
eedback operation, the balance signals generate feedback cur-ents (left, right “Tilt Power”) for the TLs. Heat expansion elementsnside the TLs expand or shrink according to supplied power andeep the tilt balance signals nulled to zero. The TLs mechanicallyilt the gravimeter through the support frame. They are designedo control only long-period tilt signals—down to about 15 min.his implies that the influence of tilt on the seismic band is notccounted for. Higher frequency tilt signals, as those related toarthquakes, are not compensated and they will appear on bothhe X and Y tilt balance signals and gravity. The TLs also have a
anual height adjustment element; the gravimeter is tilted byotating the micrometer head on top of the TL assembly. Thisevice is used for coarse levelling and fine adjustment of theIP.
There are two types of ATFS-geometries used in SGs: one models suspended from the top by the support frame while the other is
ounted on the base (Iwano and Fukuda, 2004). Both types havehe same mechanism in which the support frame has three legs, one
s fixed and the others are controlled by the TLs. The two axes ofhe support frame are linked to two tiltmeters. For the top-mountedype (old ones with a big dewar) the support frame is a right isosce-es triangle and its orthogonal axes are aligned with the tiltmeterxes. For the bottom-mounted type (“SG C type”, having a com-d right Tilt Power outputs; (b and d) results of the least-square fit; the values in the
pact dewar and most recent “OSG” meters), the support frame isan equilateral triangle and the directions of the support frame andtiltmeters axes are not aligned. The SG C-026 at the J9 station inStrasbourg is of the bottom-mounted type; the geometry and ori-entation of its tilt frame are illustrated in Fig. 1. The advantage ofthe isosceles support frames (top-mounted type) is that the leftand right axes are orthogonal and the two tiltmeters can be alignedwith these axes. For the sake of the usual procedure of levelling ofthe gravimeter this means, in the SETUP mode, that a change of theX (or Y) micrometer does not affect the null position measured bythe other micrometer.
In order to study the tilt changes at J9, we analysed more than11 years of Tilt Power and environmental parameters, namelytemperature and humidity, collected since 1997. We evaluate thecapability of the ATFS to compensate the tilt changes preservingthe verticality of the meter and detect and study the “sources” ofthe observed tilt changes.
As the scale factors for the SGs ATFS are not provided by themanufacturing company (GWR Instruments Inc.), we face the prob-lem of the TLs output calibration. Here we present a calibration testapplied to the Tilt Power signal from the ATFS and its validation byusing different methodological approaches.
2. Data analysis and results
The J9 gravity station hosts the superconducting gravimeterC026 (SG-C026) in a bunker 15 km from Strasbourg, where it hasbeen operating since July 1996. The meter has a compact dewar(volume: 125 l) and a tilt frame sizing 28 in. (711.2 mm). It is the
U. Riccardi et al. / Journal of Geodynamics 48 (2009) 316–324 319
Ft
TRta
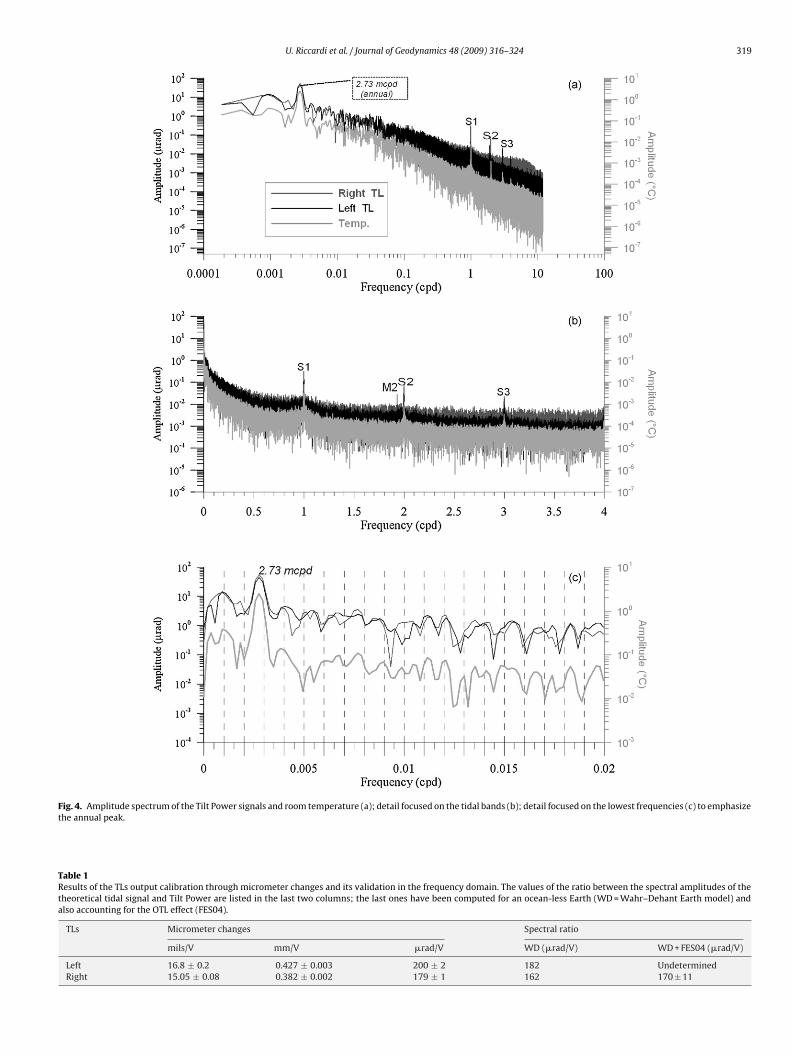
ig. 4. Amplitude spectrum of the Tilt Power signals and room temperature (a); detail focuhe annual peak.
able 1esults of the TLs output calibration through micrometer changes and its validation in thheoretical tidal signal and Tilt Power are listed in the last two columns; the last ones halso accounting for the OTL effect (FES04).
TLs Micrometer changes
mils/V mm/V �
Left 16.8 ± 0.2 0.427 ± 0.003 2Right 15.05 ± 0.08 0.382 ± 0.002 1
sed on the tidal bands (b); detail focused on the lowest frequencies (c) to emphasize
e frequency domain. The values of the ratio between the spectral amplitudes of theve been computed for an ocean-less Earth (WD = Wahr–Dehant Earth model) and
Spectral ratio
rad/V WD (�rad/V) WD + FES04 (�rad/V)
00 ± 2 182 Undetermined79 ± 1 162 170 ± 11
320 U. Riccardi et al. / Journal of Geodynamics 48 (2009) 316–324
ion an
bfgocSlmodivwTaFAtsmtstIm2rv(to
t
1abrsqtt
gdf
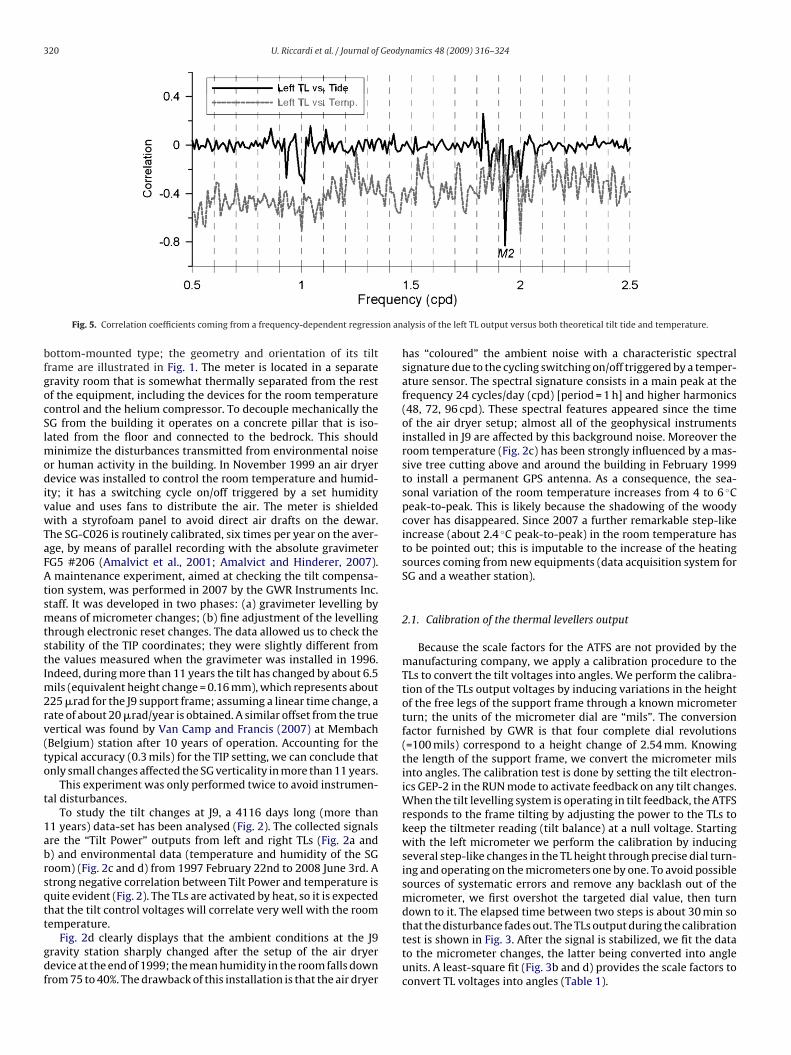
Fig. 5. Correlation coefficients coming from a frequency-dependent regress
ottom-mounted type; the geometry and orientation of its tiltrame are illustrated in Fig. 1. The meter is located in a separateravity room that is somewhat thermally separated from the restf the equipment, including the devices for the room temperatureontrol and the helium compressor. To decouple mechanically theG from the building it operates on a concrete pillar that is iso-ated from the floor and connected to the bedrock. This should
inimize the disturbances transmitted from environmental noiser human activity in the building. In November 1999 an air dryerevice was installed to control the room temperature and humid-
ty; it has a switching cycle on/off triggered by a set humidityalue and uses fans to distribute the air. The meter is shieldedith a styrofoam panel to avoid direct air drafts on the dewar.
he SG-C026 is routinely calibrated, six times per year on the aver-ge, by means of parallel recording with the absolute gravimeterG5 #206 (Amalvict et al., 2001; Amalvict and Hinderer, 2007).maintenance experiment, aimed at checking the tilt compensa-
ion system, was performed in 2007 by the GWR Instruments Inc.taff. It was developed in two phases: (a) gravimeter levelling byeans of micrometer changes; (b) fine adjustment of the levelling
hrough electronic reset changes. The data allowed us to check thetability of the TIP coordinates; they were slightly different fromhe values measured when the gravimeter was installed in 1996.ndeed, during more than 11 years the tilt has changed by about 6.5
ils (equivalent height change = 0.16 mm), which represents about25 �rad for the J9 support frame; assuming a linear time change, aate of about 20 �rad/year is obtained. A similar offset from the trueertical was found by Van Camp and Francis (2007) at MembachBelgium) station after 10 years of operation. Accounting for theypical accuracy (0.3 mils) for the TIP setting, we can conclude thatnly small changes affected the SG verticality in more than 11 years.
This experiment was only performed twice to avoid instrumen-al disturbances.
To study the tilt changes at J9, a 4116 days long (more than1 years) data-set has been analysed (Fig. 2). The collected signalsre the “Tilt Power” outputs from left and right TLs (Fig. 2a and) and environmental data (temperature and humidity of the SGoom) (Fig. 2c and d) from 1997 February 22nd to 2008 June 3rd. Atrong negative correlation between Tilt Power and temperature isuite evident (Fig. 2). The TLs are activated by heat, so it is expectedhat the tilt control voltages will correlate very well with the room
emperature.Fig. 2d clearly displays that the ambient conditions at the J9ravity station sharply changed after the setup of the air dryerevice at the end of 1999; the mean humidity in the room falls downrom 75 to 40%. The drawback of this installation is that the air dryer
alysis of the left TL output versus both theoretical tilt tide and temperature.
has “coloured” the ambient noise with a characteristic spectralsignature due to the cycling switching on/off triggered by a temper-ature sensor. The spectral signature consists in a main peak at thefrequency 24 cycles/day (cpd) [period = 1 h] and higher harmonics(48, 72, 96 cpd). These spectral features appeared since the timeof the air dryer setup; almost all of the geophysical instrumentsinstalled in J9 are affected by this background noise. Moreover theroom temperature (Fig. 2c) has been strongly influenced by a mas-sive tree cutting above and around the building in February 1999to install a permanent GPS antenna. As a consequence, the sea-sonal variation of the room temperature increases from 4 to 6 ◦Cpeak-to-peak. This is likely because the shadowing of the woodycover has disappeared. Since 2007 a further remarkable step-likeincrease (about 2.4 ◦C peak-to-peak) in the room temperature hasto be pointed out; this is imputable to the increase of the heatingsources coming from new equipments (data acquisition system forSG and a weather station).
2.1. Calibration of the thermal levellers output
Because the scale factors for the ATFS are not provided by themanufacturing company, we apply a calibration procedure to theTLs to convert the tilt voltages into angles. We perform the calibra-tion of the TLs output voltages by inducing variations in the heightof the free legs of the support frame through a known micrometerturn; the units of the micrometer dial are “mils”. The conversionfactor furnished by GWR is that four complete dial revolutions(=100 mils) correspond to a height change of 2.54 mm. Knowingthe length of the support frame, we convert the micrometer milsinto angles. The calibration test is done by setting the tilt electron-ics GEP-2 in the RUN mode to activate feedback on any tilt changes.When the tilt levelling system is operating in tilt feedback, the ATFSresponds to the frame tilting by adjusting the power to the TLs tokeep the tiltmeter reading (tilt balance) at a null voltage. Startingwith the left micrometer we perform the calibration by inducingseveral step-like changes in the TL height through precise dial turn-ing and operating on the micrometers one by one. To avoid possiblesources of systematic errors and remove any backlash out of themicrometer, we first overshot the targeted dial value, then turndown to it. The elapsed time between two steps is about 30 min so
that the disturbance fades out. The TLs output during the calibrationtest is shown in Fig. 3. After the signal is stabilized, we fit the datato the micrometer changes, the latter being converted into angleunits. A least-square fit (Fig. 3b and d) provides the scale factors toconvert TL voltages into angles (Table 1).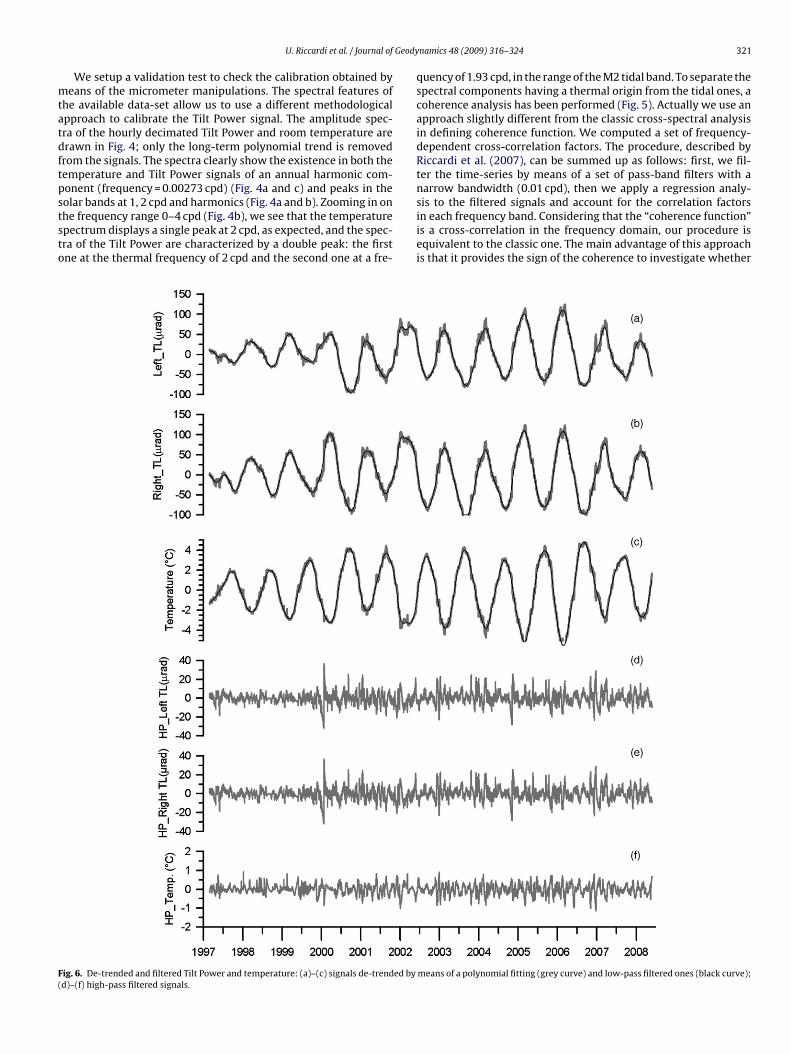
Geody
mtatdftpststo
F(
U. Riccardi et al. / Journal of
We setup a validation test to check the calibration obtained byeans of the micrometer manipulations. The spectral features of
he available data-set allow us to use a different methodologicalpproach to calibrate the Tilt Power signal. The amplitude spec-ra of the hourly decimated Tilt Power and room temperature arerawn in Fig. 4; only the long-term polynomial trend is removedrom the signals. The spectra clearly show the existence in both theemperature and Tilt Power signals of an annual harmonic com-onent (frequency = 0.00273 cpd) (Fig. 4a and c) and peaks in the
olar bands at 1, 2 cpd and harmonics (Fig. 4a and b). Zooming in onhe frequency range 0–4 cpd (Fig. 4b), we see that the temperaturepectrum displays a single peak at 2 cpd, as expected, and the spec-ra of the Tilt Power are characterized by a double peak: the firstne at the thermal frequency of 2 cpd and the second one at a fre-ig. 6. De-trended and filtered Tilt Power and temperature: (a)–(c) signals de-trended byd)–(f) high-pass filtered signals.
namics 48 (2009) 316–324 321
quency of 1.93 cpd, in the range of the M2 tidal band. To separate thespectral components having a thermal origin from the tidal ones, acoherence analysis has been performed (Fig. 5). Actually we use anapproach slightly different from the classic cross-spectral analysisin defining coherence function. We computed a set of frequency-dependent cross-correlation factors. The procedure, described byRiccardi et al. (2007), can be summed up as follows: first, we fil-ter the time-series by means of a set of pass-band filters with anarrow bandwidth (0.01 cpd), then we apply a regression analy-
sis to the filtered signals and account for the correlation factorsin each frequency band. Considering that the “coherence function”is a cross-correlation in the frequency domain, our procedure isequivalent to the classic one. The main advantage of this approachis that it provides the sign of the coherence to investigate whethermeans of a polynomial fitting (grey curve) and low-pass filtered ones (black curve);
3 Geodynamics 48 (2009) 316–324
tspattgsocg(Ohipt
oWt(ftOtitmo
atwE2
2
ttP
Table 2Parameters (� and phase) for M2 tidal wave determined by means of harmonicanalyses on Tilt Power signals; in the last two lines the theoretical values are givenas a reference.
� Phase (◦)
Right TL 0.84 ± 0.09 1.48 ± 6.0Left TL 0.77 ± 0.06 −174.3 ± 4.5
22 U. Riccardi et al. / Journal of
here is an inverse or direct correlation in each frequency band,umming up the information coming from both the amplitude andhase cross-spectrum. We apply this analysis to, first, the Tilt Powernd temperature, and, next, the Tilt Power and theoretical tilt dueo the solid Earth tide. As expected, the correlation between TL andemperature signals is characterized by two features: (i) a back-round level scattering around a mean value −0.5 and (ii) a linepectrum at the harmonics of the day (1, 2 cpd) owing to the effectf the solar heating; there is no line at the M2 frequency. On theontrary, the coherence between the TL and body tide shows a back-round scattering around 0 and a line spectrum at the harmonics0.93, 1, 1.93, and 2 cpd), which include high-amplitude tidal waves1, PSK1, and M2. So, we conclude that the spectral peak at 1.93 cpdas a tidal origin. It is noteworthy that the sensitivity of the ATFS
s good enough to detect the tilt associated to the solid Earth tides,rovided that the time-series of the Tilt Power are sufficiently longo allow a suitable stacking of the “weak” tidal signal.
Consequently, we use the theoretical tides to calibrate the TLutputs. We compute the tilt due to both the body tides, for theahr–Dehant (WD) Earth model (Dehant et al., 1999) and the ocean
ide loading (OTL) (Boy et al., 2003) according to model FES04Letellier, 2004; Lyard et al., 2006). We obtain the scale factorsrom the ratio between the spectral amplitudes of the theoreticalidal signal and Tilt Power: the results are listed in Table 1. As theTL effect is only available for North-South and East-West direc-
ions, we applied this correction exclusively to the right TL, whichs almost East-West oriented (ref. Fig. 1). The results obtained inhe frequency domain match pretty well those collected by the
icrometer manipulations; they deviate less than 10% from eachther.
Still willing to validate the calibration factors, we make a tidalnalysis (Wenzel, 1996) of the Tilt Power signals calibrated by usinghe factors coming from the calibration test. For the M2 tidal wave,e obtain a tidal tilt factor (�) and a phase in agreement with the
arth models (Table 2) (Wenzel, 1996; d’Oreye de Lantremange,003; Jahr et al., 2006).
.2. Analyses of the calibrated Tilt Power signal
In order to get insight into the possible sources of the observedilt changes, we filter out the different components (Fig. 6) ofhe signal to make a better correlation analysis between the Tiltower and temperature in different spectral bands. In fact, the Tilt
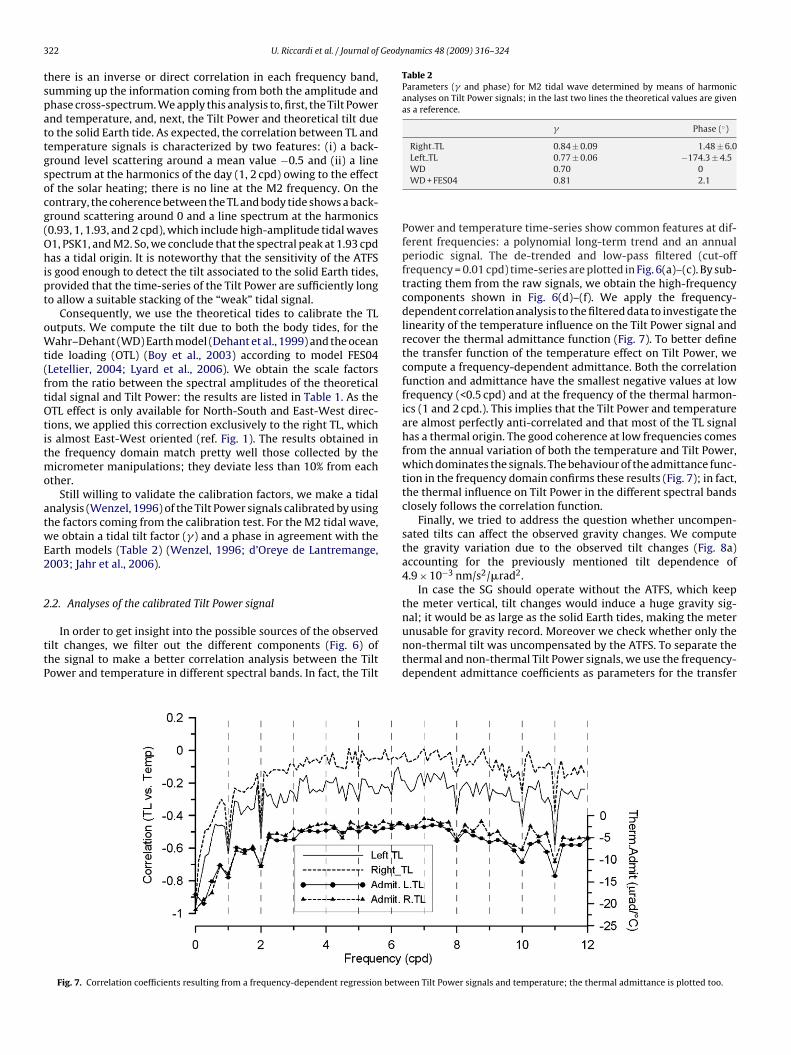
Fig. 7. Correlation coefficients resulting from a frequency-dependent regression betw
WD 0.70 0WD + FES04 0.81 2.1
Power and temperature time-series show common features at dif-ferent frequencies: a polynomial long-term trend and an annualperiodic signal. The de-trended and low-pass filtered (cut-offfrequency = 0.01 cpd) time-series are plotted in Fig. 6(a)–(c). By sub-tracting them from the raw signals, we obtain the high-frequencycomponents shown in Fig. 6(d)–(f). We apply the frequency-dependent correlation analysis to the filtered data to investigate thelinearity of the temperature influence on the Tilt Power signal andrecover the thermal admittance function (Fig. 7). To better definethe transfer function of the temperature effect on Tilt Power, wecompute a frequency-dependent admittance. Both the correlationfunction and admittance have the smallest negative values at lowfrequency (<0.5 cpd) and at the frequency of the thermal harmon-ics (1 and 2 cpd.). This implies that the Tilt Power and temperatureare almost perfectly anti-correlated and that most of the TL signalhas a thermal origin. The good coherence at low frequencies comesfrom the annual variation of both the temperature and Tilt Power,which dominates the signals. The behaviour of the admittance func-tion in the frequency domain confirms these results (Fig. 7); in fact,the thermal influence on Tilt Power in the different spectral bandsclosely follows the correlation function.
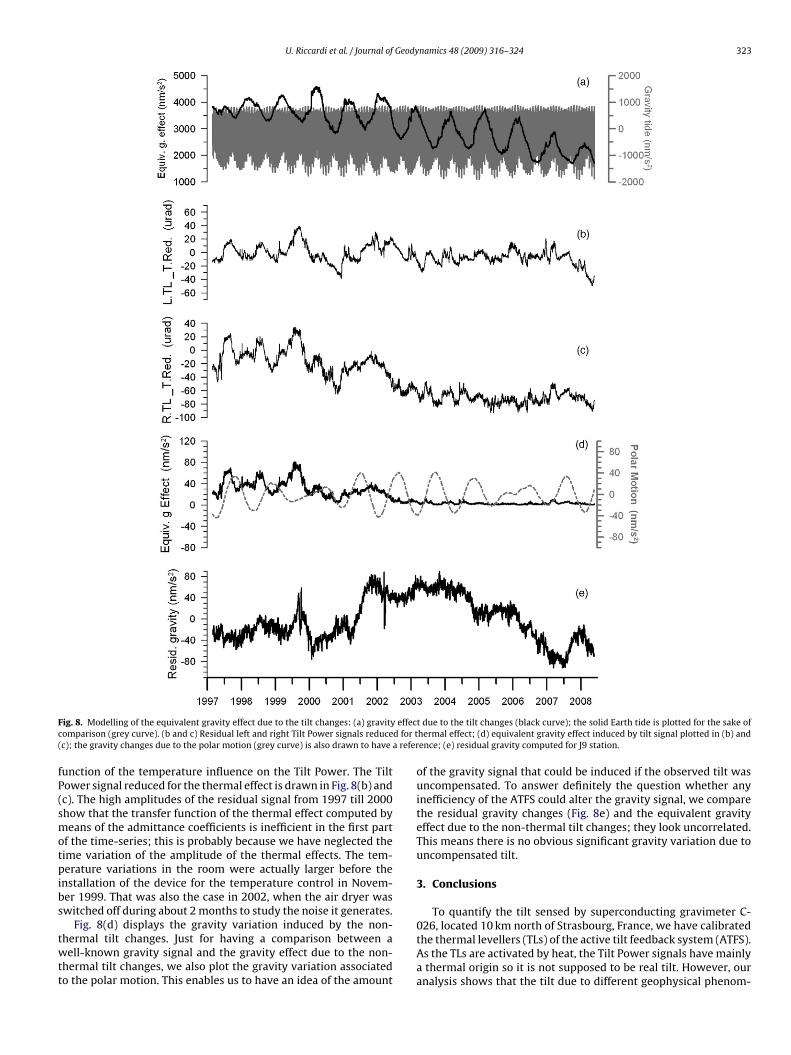
Finally, we tried to address the question whether uncompen-sated tilts can affect the observed gravity changes. We computethe gravity variation due to the observed tilt changes (Fig. 8a)accounting for the previously mentioned tilt dependence of4.9 × 10−3 nm/s2/�rad2.
In case the SG should operate without the ATFS, which keepthe meter vertical, tilt changes would induce a huge gravity sig-nal; it would be as large as the solid Earth tides, making the meter
unusable for gravity record. Moreover we check whether only thenon-thermal tilt was uncompensated by the ATFS. To separate thethermal and non-thermal Tilt Power signals, we use the frequency-dependent admittance coefficients as parameters for the transfereen Tilt Power signals and temperature; the thermal admittance is plotted too.
U. Riccardi et al. / Journal of Geodynamics 48 (2009) 316–324 323
F effecc d for t( a refer
fP(smotpibs
twtt
ig. 8. Modelling of the equivalent gravity effect due to the tilt changes: (a) gravityomparison (grey curve). (b and c) Residual left and right Tilt Power signals reducec); the gravity changes due to the polar motion (grey curve) is also drawn to have
unction of the temperature influence on the Tilt Power. The Tiltower signal reduced for the thermal effect is drawn in Fig. 8(b) andc). The high amplitudes of the residual signal from 1997 till 2000how that the transfer function of the thermal effect computed byeans of the admittance coefficients is inefficient in the first part
f the time-series; this is probably because we have neglected theime variation of the amplitude of the thermal effects. The tem-erature variations in the room were actually larger before the
nstallation of the device for the temperature control in Novem-er 1999. That was also the case in 2002, when the air dryer waswitched off during about 2 months to study the noise it generates.
Fig. 8(d) displays the gravity variation induced by the non-hermal tilt changes. Just for having a comparison between aell-known gravity signal and the gravity effect due to the non-
hermal tilt changes, we also plot the gravity variation associatedo the polar motion. This enables us to have an idea of the amount
t due to the tilt changes (black curve); the solid Earth tide is plotted for the sake ofhermal effect; (d) equivalent gravity effect induced by tilt signal plotted in (b) andence; (e) residual gravity computed for J9 station.
of the gravity signal that could be induced if the observed tilt wasuncompensated. To answer definitely the question whether anyinefficiency of the ATFS could alter the gravity signal, we comparethe residual gravity changes (Fig. 8e) and the equivalent gravityeffect due to the non-thermal tilt changes; they look uncorrelated.This means there is no obvious significant gravity variation due touncompensated tilt.
3. Conclusions
To quantify the tilt sensed by superconducting gravimeter C-
026, located 10 km north of Strasbourg, France, we have calibratedthe thermal levellers (TLs) of the active tilt feedback system (ATFS).As the TLs are activated by heat, the Tilt Power signals have mainlya thermal origin so it is not supposed to be real tilt. However, ouranalysis shows that the tilt due to different geophysical phenom-
3 Geody
esafcttiawhmatgtrwa
h
(
ittnstAocaet
aapst
24 U. Riccardi et al. / Journal of
na, other than the thermal ones, can affect the collected Tilt Powerignals. Actually a clear tidal signal sticks out from the time-series;nyway it is hard to separate in the Tilt Power signal the real tiltrom the pure thermal effect. Three simultaneous sources actuallyontribute to the recorded Tilt Power signals. The biggest one ishe direct reaction of the TL to the room temperature changes; inhat case the TLs behave as thermometers, but with a character-stic phase lag as long as 20 min. Furthermore feedback currentsre generated by the tiltmeters in response to the tilt of the SG,hich could be due to geophysical phenomena, e.g. the body tides;ydrology, ground deformation and to the thermo-elastic defor-ation due to the propagation of thermal waves into the building
nd surrounding ground. In fact the thermal expansion and con-raction in response to daily and seasonal temperature fluctuationsenerate real movements of the building and pillar hosting the SGhat are detected by the tiltmeters and other sensors. Even if theoom temperature did not vary, real tilts up to several microradiansould occur because of the daily heating and cooling of the pillar
nd building.As expected we find that most of the observed Tilt Power signal
as a thermal origin.In summary, we detect:
(i) a long-term trend of about 20 �rad/year,(ii) a strong annual component of about 200 �rad peak-to-peak,iii) a diurnal component having an amplitude of 0.3 �rad,
(iv) a semi-diurnal component of about 0.1 �rad (the harmonicsS3 and S4 are also evident), and
(v) a clear tidal component as large as 0.05 �rad in the semi-diurnal band.
The tidal effects clearly appear thanks to the large data stack-ng (>11 years); moreover they provide us with a tool to validatehe results of the TLs calibration made by means of the microme-er height changes. It is noteworthy that Tilt Power signals containot only the temperature changes, but even low amplitude tidal tiltignals. The tidal signals are likely detected by the tiltmeters insidehe gravity sensing unit and routed to the TLs as feedback currents.nyway it is hard to separate one signal from the other, namely rec-gnizing which device senses the tilt changes. A step ahead wouldonsist in installing an independent tilt sensor, for instance a bi-xial tiltmeter, aligned with the internal SG tiltmeters. This wouldnable us to better discriminate between the thermal signal andhe real tilt.
Thus we can conclude the efficiency of the ATFS device is at
suitable level to guarantee high accuracy gravity measurementsnd inherent time stability. TLs are very sensitive to the room tem-erature, but any changes in temperature or coming from whateverources are correctly balanced, except for the high-frequency per-urbations (period <15 min) so that no significant tilt changes alter
namics 48 (2009) 316–324
the gravity signal. It follows that it is not recommended to let themeter operate without this tilt compensation system, because thetilt changes would remarkably affect the measured local gravity asa whole and the long-term trend signal (drift) too.
Acknowledgements
The authors thank W. Zürn and T. Jahr for their valuable com-ments that significantly improved the paper.
References
Amalvict, M., Hinderer, J., Boy, J.-P., Gegout, P., 2001. A 3 years comparison between asuperconducting gravimeter (GWR C026) and an absolute gravimeter (FG5-206)in Strasbourg (France). J. Geod. Soc. Jpn. 47 (1), 334–340.
Amalvict, M., Hinderer, J., 2007. Is the calibration factor stable in time? Paper pre-sented at First Asian Workshop on SGs, Taiwan, March 2007.
Berger, J., 1975. A note on thermoelastic strain and tilts. J. Geophys. Res. 80, 274–277.Boy, J.-P., Llubes, M., Hinderer, J., Florsch, N., 2003. A comparison of tidal ocean
loading models using superconducting gravimeter data. J. Geophys. Res. 108,2193, doi:10.1029/2002JB002050.
Dehant, V., Defraigne, P., Wahr, J.M., 1999. Tides for a convective Earth. J. Geophys.Res. 104 (B1), 1035–1058.
d’Oreye de Lantremange, N., 2003. Inclinomètre à niveaux hydrostatiques de hauterésolution en géophysique. Thèse présentée en vue de l’obtention du titre deDocteur en Sciences, Université Catholique de Louvain, 340 pp.
GWR Instruments Inc., 1985. Superconducting Gravity Meter Model TT70 CryogenicRefrigeration Operating Manual. San Diego, 179 pp.
Hinderer, J., Crossley, D., 2000. Time variations and inferences on the Earth’s struc-ture and dynamics. Surv. Geophys. 21, 1–45.
Hinderer, J., Crossley, D., 2004. Scientific achievements from the first phase (1997-2003) of the Global Geodynamics Project using a worldwide network ofsuperconducting gravimeters. J. Geodyn. 38, 237–262.
Iwano, S., Fukuda, Y., 2004. Superconducting gravimeter observations with-out a tilt compensation system. Phys. Earth Planet. Inter. 147, 343–351,doi:10.1016/j.pepi.2004.08.001.
Jahr, T., Letz, H., Jentzsch, G., 2006. Monitoring fluid induced deformation of theearth’s crust: a large scale experiment at the KTB location/Germany. J. Geodyn.41, 190–197.
Letellier, T., 2004. Etude des ondes de marée sur les plateux continentaux. Thèsedoctorale, Université de Toulouse III, Ecole Doctorale des Sciences de l’Univers,de l’Environnement et de l’Espace, 237 pp.
Lyard, F., Lefévre, F., Letellier, T., Francis, O., 2006. Modelling the global ocean tides:modern insights from FES2004. Ocean Dyn. 56 (5–6), 394–415.
Rerolle, T., Florsch, N., Llubes, M., Boudin, F., Longuevergne, L., 2006. L’inclinométrie,un nouvel outil pour le suivi temporel des aquifères? C. R. Geosci. 338, 775–786.
Riccardi, U., Hinderer, J., Boy, J., 2007. On the efficiency of barometric arrays toimprove the corrections of atmospheric effects on gravity data. Phys. EarthPlanet. Inter. 161, 224–242.
Richter, B., Wenzel, H.G., Zurn, W., Klopping, F., 1995. From Chandler wobble to freeoscillations: comparison of cryogenic and other instruments in a wide periodrange. Phys. Earth Planet. Inter. 91, 131–148.
Rosat, S., Hinderer, J., Crossley, D., Boy, J.-P., 2004. Performance of superconductinggravimeters from long-period seismology to tides. J. Geodyn. 38, 461–476.
Van Camp, M., Francis, O., 2007. Is the instrumental drift of superconductinggravimeters a linear or exponential function of time? J. Geodyn. 81, 337–344,
doi:10.1007/s00190-006-0110-4.Warburton, R.J., 1998. Optimizing the performance of the SG during theGGP. Presentation at 1st GGP Workshop July 1997 (Bruxelles), online:http://www.eas.slu.edu/GGP/gwrwrk1.html.
Wenzel, H.-G., 1996. The nanogal software: Earth tide data processing packageETERNA 3.30. Bull. d’Inform. Marèes Terrestres 124, 9425–9439.