the vmc survey
TRANSCRIPT
arX
iv:1
105.
5732
v1 [
astr
o-ph
.SR
] 28
May
201
1Astronomy & Astrophysicsmanuscript no. vmcII˙sansfigs c© ESO 2011May 31, 2011
The VMC SurveyII. A multi-wavelength study of LMC planetary nebulae and th eir mimics ⋆
B. Miszalski1,2,3, R. Napiwotzki1, M. -R. L. Cioni1,4⋆⋆, M. A. T. Groenewegen5, J. M. Oliveira6, and A. Udalski7
1 Centre for Astrophysics Research, STRI, University of Hertfordshire, College Lane Campus, Hatfield AL10 9AB, UK2 South African Astronomical Observatory, PO Box 9, Observatory, 7935, South Africa3 Southern African Large Telescope Foundation, PO Box 9, Observatory, 7935, South Africa
e-mail:[email protected] University Observatory Munich, Scheinerstrasse 1, D-81679, Munchen, Germany5 Royal Observatory of Belgium, Ringlaan 3, 1180 Ukkel, Belgium6 School of Physical & Geographical Sciences, Lennard-JonesLaboratories, Keele University, Staffordshire ST5 5BG, UK7 Warsaw University Observatory, Al. Ujazdowskie 4, PL-00-478, Warsaw, Poland
Received -; accepted -
ABSTRACT
The VISTA Magellanic Cloud (VMC) survey is assembling a deep, multi-epoch atlas ofY JKs photometry across the MagellanicClouds. Prior to the VMC survey only the brightest Magellanic Cloud PNe (MCPNe) were accessible at near-infrared (NIR) wave-lengths. It is now possible for the first time to assemble the NIR properties of MCPNe and to identify contaminating non-PNemimics which are best revealed at NIR wavelengths (e.g. HII regions and symbiotic stars). To maintain the unique scientific nichethat MCPNe occupy these contaminants must be removed. Here we conduct a VMC-led, multi-wavelength study of 102 objectspreviously classified as PNe that are located within the firstsix VMC tiles observed. We present images, photometry, lightcurves,diagnostic colour-colour diagrams and spectral energy distributions used to analyse the entire sample. At least five PNe have newlyresolved nebula morphologies, a task previously only possible with theHST. A total 45/67 (67%) of Reid & Parker (RP) cataloguedobjects were reclassified as non-PNe, most of which were located in the vicinity of 30 Doradus. This sample included 16 field stars,5 emission line stars, 19 HII regions, 4 symbiotic star candidates and 1 young stellar object. We discuss possible selection effectsresponsible for their inclusion in the RP catalogue and the implications for binary central star surveys targeting LMC PNe. A totalof five new LMC symbiotic star candidates identified, compared to eight previously known, underlines the important role the VMCsurvey will have in advancing Magellanic symbiotic star studies.
Key words. planetary nebulae: general - stars: AGB and post-AGB - binaries: symbiotic - Magellanic Clouds
1. Introduction
The gaseous shells of Planetary Nebulae (PNe) shine for a brief∼104 yr after being ejected by low-intermediate mass stars dur-ing the asymptotic giant branch (AGB) phase. Most surveys forPNe have so far focused on detecting their strongest [O III] andHα emission lines and they can be routinely detected in theMilky Way and the Magellanic Clouds (Parker et al. 2006; Shaw2006; Stanghellini 2009; Parker & Frew 2011). As these linesare not unique to PNe, catalogues of PN candidates are builtand entries often have an associated PN-likelihood informed byavailable morphological, photometric and spectroscopic proper-ties. With the advent of modern, large-scale, multi-wavelengthsurveys these candidate lists are being subjected to increasinglygreater scrutiny than previously possible. As a result, many pre-vious PNe candidates can now be confidently reclassified asone of many possible other objects or ‘mimics’ (Frew & Parker2010). Classification is now becoming more routine and can con-fidently be performed with a sufficiently large variety of multi-
⋆ Based on observations made with VISTA at Paranal Observatoryunder program ID 179.B-2003 and the Wide Field Imager of the Max-Planck-ESO 2.2m telescope at La Silla Observatory under programs066.B-0553, 68.C-0019(A) and 076.C-0888.⋆⋆ Research Fellow of the Alexander von Humboldt Foundation
wavelength data, reducing and in some cases even eliminatingthe dependence on more time-consuming spectroscopy.
Establishing a verified population of bona-fide MagellanicCloud PNe (MCPNe) has added significance over Galactic PNebecause of their location at a known distance. The nearest largeextragalactic population of PNe are located in the LMC and, un-like the Galactic population, can be assembled to very high com-pleteness thanks to the low reddening and low inclination angle(van der Marel & Cioni 2001). This facilitates population-widestudies that would otherwise be unfeasible or fundamentally bi-ased with Galactic PNe. Particularly dependent on the complete-ness and reliability of the PN population is the [O III] planetarynebula luminosity function (PNLF) which was formulated in theLMC (Jacoby 1980, 1989). Ciardullo (2010) reviewed our cur-rent understanding of the PNLF whose bright-end cut-off actsas a standard candle distance indicator to distant galaxies. Thereare aspects of the PNLF that are poorly understood and studyingin detail its constituent PNe for an entire population is a highpriority (Ciardullo et al. 2010; Cioni et al. 2011). The abilityto reliably identify MCPNe at the intermediate distance of theMagellanic Clouds will also provide essential training beforemore distant galaxies become similarly accessible with largertelescopes (Parker & Shaw 2006). MCPNe may also play a crit-
1

B. Miszalski et al.: The VMC Survey
ical role in measuring the binary fraction of PNe (Shaw et al.2007c) to compare against Galactic estimates (Miszalski etal.2009). If this is to be accomplished any binary non-PN contam-inants such as symbiotic stars must be removed first (see e.g.Miszalski et al. 2009). Further applications of MCPNe are re-viewed by Shaw (2006) and Stanghellini (2009).
Multi-wavelength analyses of PNe in the near-infrared (NIR)and mid-infrared (MIR) are particularly useful for assessing theveracity of PN candidates (e.g. Schmeja & Kimeswenger 2001;Cohen et al. 2007, 2011; Corradi et al. 2008). Hora et al. (2008)commenced a NIR and MIR study of a subset of LMC PNe,but because previous NIR surveys were only deep enough to de-tect the brightest PNe, their main focus was at MIR wavelengthswhere theSpitzerSurveying the Agents of a Galaxy’s Evolution(SAGE, Meixner et al. 2006) survey provides deep enough cov-erage to detect faint PNe. The sample assessed by Hora et al.(2008) consisted of mostly bright PNe found from a variety ofsurveys (Leisy et al. 1997) and did not include the significantnew discoveries from the Hα-selected Reid & Parker (RP) cata-logue of 291 ‘true’, 54 ‘likely’ and 115 ‘possible’ PNe (Reid&Parker 2006a, 2006b; hereafter RP2006a, RP2006b).
The VISTA Magellanic Cloud (VMC) survey1 is obtainingdeepYJKs photometry of the Magellanic Clouds and Bridge atsub-arcsecond resolution (Cioni et al. 2011). The VMC obser-vations therefore offer a unique opportunity to refine the cata-logued population of MCPNe in conjunction with comparableoptical (Zaritsky et al. 2004) and MIR observations (Meixner etal. 2006). Six LMC tiles were observed during the first year ofVMC operations and include a total of 102 objects cataloguedastrue, likely or possible PNe from Leisy et al. (1997), RP2006band Miszalski et al. (2011b). In this first paper on PNe in theVMC survey we expand upon our first results summarised inCioni et al. (2011).
This paper is structured as follows. Sect. 2 describes oursample selection from the available MCPNe catalogues. Sect.3 describes the multi-wavelength observations at our disposal.Sect. 4 presents lightcurves, spectral energy distributions and di-agnostic diagrams which summarise our new classifications ofthe sample. Sect. 5 describes the classifications of a subsetofthe sample in detail and Sect. 6 discusses the range of possibleselection effects encountered during the study and the impact ofour new classifications on searches for binary central stars. Weconclude in Sect. 7.
2. Previous reclassifications and sample selection
As the newest and least studied LMC PNe, the RP sample maybe more susceptible to containing a larger fraction of contami-nating non-PNe than the Leisy et al. (1997) sample. The extentof contamination is not yet known as only a small fraction of RPobjects have been asssesed for non-PNe members (Shaw, Reid &Parker 2007a; Cohen et al. 2009; Van Loon et al. 2010; Woods etal. 2011; Reid & Parker 2010, hereafter RP2010). When a non-PN classification is made in these studies it is usually done sowithout the presentation of images and spectra, making it diffi-cult to independently judge the reliability of the classifications.For this reason we incorporate objects in our sample even if theymay have already been classified or reclassified as non-PNe.
Figure 1 shows the distribution of objects previously cata-logued as PNe and the 6 LMC tiles observed during the firstyear of VMC operations. Table 1 breaks down the distributionof the 102 objects located within the VMC tiles. In total there
1 http://star.herts.ac.uk/∼mcioni/vmc/
Table 1.Tile location of objects in our sample.
Tile (1) (2) (3) Total4 2 2 0 0 24 3 0 0 0 06 6 20 62 3 858 3 4 5 0 98 8 1 0 1 29 3 4 0 0 4Total 31 67 4 102
References. (1) Leisy et al. (1997); (2) Reid & Parker (2006b); (3)Miszalski et al. (2011b).
are 31 objects from Leisy et al. (1997), 67 from RP2006b and 4(three bona-fide and one possible) from Miszalski et al. (2011b).We have nominally added the emission line candidate LM2-39(Lindsay 1963) into the Leisy et al. (1997) sample since it waslisted by RP2006b.
Table 2 lists the names and coordinates of our entire samplealong with the parent VMC tile number, the presence of ESOWFI observations (Sect. 3.1), our new classifications (Sect. 4.2)and remarks based on analysis in subsequent sections. The origi-nal RP2006b classifications are also given with some slight mod-ifications to incorporate the updated classifications in RP2010.The 67 objects from RP2006b are made up of 21 ‘true’, 9 ‘likely’and 37 ‘possible’ PNe, respectively. Five objects in our sample,namely RP218, RP256, RP698, RP833 and RP1923, were omit-ted from Table A2 of RP2010 without explanation, presumablybecause they were deemed not to be PNe. Table 1 of RP2010 re-classified RP641 and RP1933 as HII regions which explains theirabsence from their Table A2. In these cases we have kept theoriginal RP2006b classification in Table 2. RP774 and RP775were both reclassified in Table A2 of RP2010 from ‘true’ to ‘pos-sible’. No other classifications of our sample changed betweenRP2006b and RP2010.
2

B. Miszalski et al.: The VMC Survey
Fig. 1.SHASSA Hαmosaic of the LMC (Gaustad et al. 2001) in a lambert azimuthalequal-area projection overlaid with cataloguedLMC PNe (Leisy et al. 1997, green symbols; RP2006b, red symbols; Miszalski et al. 2011b, light blue symbols). Different symbolscorrespond to true (circles), likely (squares) and possible (dots) PNe. VMC tiles observed in the first year of operations are shownin blue (see Cioni et al. 2011). Complementary survey footprints are also shown includingUBVi photometry from Zaritsky et al.(2004) in cyan,SpitzerMIR photometry from Meixner et al. (2006) in orange (at 8.0µm) andI -band time-series photometry fromUdalski et al. (2008a, 2008b) in grey. Objects with ESO WFI optical observations considered in this work are bounded by yellowboxes (see Sect. 3.1).
The largest contribution to our sample comes from the 66tile which covers the 30 Doradus star-forming region. Objects inthis tile are located within a highly-variable emission-line back-ground that is subject to high levels of interstellar absorption.Identifying emission-line objects in this region is naturally moredifficult and it would not be unexpected if a larger fraction of 66objects were not bona-fide PNe. This adds significant caveatstothe results of our study, however the 66 objects also constitute a
challenging and thorough training set with which to establish ro-bust multi-wavelength classification criteria that may be appliedto other regions as the VMC survey progresses further.
3. Observations
We adopt a multi-wavelength approach to identify non-PNeamongst our sample of 102 objects. A large fraction of the
3

B. Miszalski et al.: The VMC Survey
Table 2.Basic properties and classifications of the sample.
Name RP Coords Tile WFI ID Prop. RP ID RP Prop.LM2-39 243 05 40 14.82−69 28 49.1 66 Y Sy? H,R T b e Not PNMG12 1897 05 01 40.22−66 46 46.0 83 N PN H,S T e Hα onlyMG13 - 05 03 03.23−65 23 02.7 93 N PN S - -MG16 - 05 06 05.17−64 48 49.5 93 N PN R? - -MG17 - 05 06 21.17−64 37 03.8 93 N PN S - -MG18 - 05 07 03.07−65 43 22.6 83 N PN R? - -MG56 657 05 31 44.90−69 43 07.4 66 N PN H,S? T e Hα only in HIIMG60 658 05 33 30.81−69 08 13.3 66 Y PN H,S T c Hα onlyMG65 659 05 35 10.24−69 39 39.1 66 Y PN H,S T e s Hα onlyMG68 267 05 38 19.42−68 58 37.4 66 Y PN H,R,B,U T c Hα onlyMG73 214 05 41 36.75−69 27 09.4 66 Y PN H,R T e poss bpMG75 271 05 42 15.37−68 48 56.7 66 Y† ND,PN H,S T s Hα onlyMG76 215 05 42 23.99−69 53 05.3 66 Y PN WH,S T c s starMG77 272 05 43 47.57−68 38 35.1 66 N PN H,R T e Hα onlyMNC1 - 05 42 46.80−69 20 30.0 66 Y PN H,R - -MNC2 - 05 42 43.97−69 35 34.0 66 Y PN H,R - -MNC3 - 05 41 28.35−69 43 53.0 66 Y PN? H,R - -MNC4 - 06 00 59.20−66 36 15.3 88 N PN H,S - -Mo30 662 05 31 35.20−69 23 46.7 66 N PN H,S T e poss bpMo32 664 05 32 05.35−69 57 26.6 66 N PN H,R T b cMo34 663 05 35 13.91−70 01 19.5 66 N PN H,R T e bpMo36 179 05 38 53.42−69 57 55.1 66 N PN H,S T e compact HαMo37 152 05 39 14.35−70 00 19.1 66 N PN H,S T e f strong HαMo38 - 05 40 32.26−68 44 48.0 66 Y† PN H,S - -Mo39 134 05 42 41.01−70 05 49.3 66 N PN H,R? T c Hα onlyMo42 - 05 55 14.60−66 50 25.1 88 N PN R - -Sa122 650 05 34 24.25−69 34 28.6 66 Y PN H,R T c in HII regionSMP4 - 04 43 21.88−71 30 08.9 42 N PN S - -SMP6 - 04 47 38.97−72 28 20.6 42 N PN S - -SMP27 1894 05 07 54.85−66 57 45.5 83 N PN H,S,DH,R T c halo mainly NSMP30 1552 05 09 10.54−66 53 38.4 83 N PN H,S T c bpSMP35 - 05 10 49.90−65 29 30.7 93 N PN S - -SMP77 646 05 34 06.24−69 26 18.4 66 Y PN H,S T poss ds Poss PNSMP78 647 05 34 21.21−68 58 25.2 66 Y PN H,S T e∼c poss dsSMP82 648 05 35 57.55−69 58 17.0 66 N PN H,S T c compactRP135 135 05 42 37.77−70 04 36.7 66 N Em? WH,S,B T c s pRP142 142 05 39 34.86−70 06 13.1 66 N FD?,NL H,R,B T e Hα onlyRP143 143 05 39 31.25−70 06 15.4 66 N ND,NL H,R,B T irreg bRP162 162 05 43 17.65−69 56 50.5 66 N PN H,S T c ds sRP163 163 05 44 28.78−69 54 44.5 66 N FD,NL WH,R? P c f Hα only diffuseRP178 178 05 40 28.57−69 54 39.0 66 N NL WH?,R?,B T c pRP180 180 05 37 00.55−69 54 32.1 66 N PN WH,S L c dsRP182 182 05 39 04.89−69 50 48.0 66 Y ND,DHII DH,R,U L e diffuse Hα onlyRP187 187 05 42 36.03−69 40 23.9 66 Y ND,DHII DH,R,U P irreg f diffuse Hα onlyRP188 188 05 42 32.73−69 40 23.8 66 Y ND,DHII DH,R,B,U P irreg VLE hiddenRP198 198 05 44 19.12−69 24 41.9 66 N HII H,R,B,U P VLE cRP202 202 05 44 19.15−69 12 07.7 66 Y† FD,PN H,R,B T e Hα onlyRP203 203 05 44 17.36−69 11 01.5 66 Y† ND,DHII DH,R,U T e diffuse Hα onlyRP218 218 05 39 07.21−69 35 14.6 66 Y HII H,R,B,U P c b in HII region VLERP219 219 05 39 02.83−69 35 09.4 66 Y FS S P c p in HII regionRP223 223 05 38 26.22−69 32 51.6 66 Y FS S P c in HII regionRP227 227 05 37 46.82−69 31 55.9 66 Y LPV/Em? WH,S P e in HII regionRP228 228 05 37 06.76−69 27 09.1 66 Y FS S P c f pRP231 231 05 36 49.57−69 23 56.1 66 Y FS S L e f in HII regionRP232 232 05 36 35.13−69 22 28.6 66 Y ND,DHII DH,R,U L irreg f diffuse
ID PN (?): true (possible) PN; NL: neutral; ND/FD: VMC non-/faint-detection; FS: field star no Hα emission; Em: field star with Hα emission;(D)HII: (diffuse) HII region; LPV: long period variable; Sy?: candidate symbiotic star.Prop. H/WH/DH: significant/weak/diffuse Hα emission; R: resolved nebula; S: stellar/unresolved; B: close to bright star; U: unusual morphologyatypical of PNe.RP ID. T/L/P: True/Likely/Possible PN.RP Prop. b: bright; c: circlular; e: elliptical; f: faint; s: small; p: pt. source; irreg: irregular; ds: double star; bp: bipolar. See RP2006b.†WFI observations listed in Table 4. All others have WFI observations taken from the ESO reduced data described in Miszalski et al. (2011b).
4

B. Miszalski et al.: The VMC Survey
Table 3.Basic properties and classifications of the sample (continued).
Name RP Coords Tile WFI ID Prop. RP ID RP Prop.RP234 234 05 36 41.30−69 22 08.9 66 Y ND,DHII DH,R,U P e p fRP240 240 05 40 55.50−69 14 10.0 66 Y FS S P e fRP241 241 05 40 20.70−69 13 01.5 66 Y FS S P c s in HII regionRP242 242 05 40 08.65−68 58 26.8 66 Y LPV/HII H,R,B,U P c b s in HIIRP246 246 05 38 57.25−69 33 57.1 66 Y FS S P c in HII regionRP247 247 05 38 48.22−69 34 07.8 66 Y HII DH,S P c s in HII regionRP250 250 05 44 24.15−69 16 42.1 66 N HII DH,R,B,U P c ds symb or PN+ starRP251 251 05 44 15.74−69 17 22.7 66 N HII S P c b s halo VLERP254 254 05 43 37.77−69 20 10.3 66 Y ND,DHII DH,R,B,U P c p diffuseRP256 256 05 38 51.40−69 44 51.0 66 Y HII H,R,B,U P c f halo VLERP259 259 05 36 48.60−69 26 44.9 66 Y FS S P c sRP264 264 05 43 30.35−69 24 46.6 66 Y Sy? H,R P e s f Hα only VLERP265 265 05 37 00.70−69 21 29.5 66 Y FD,PN H,R,B T e pRP266 266 05 37 27.85−69 08 55.6 66 Y HII H,R,B,U P c in HII regionRP268 268 05 39 30.10−68 58 57.7 66 Y FS S P c ds in HII regionRP277 277 05 41 26.74−68 48 00.9 66 Y† Em WH,S P c f pRP283 283 05 37 48.27−68 39 54.5 66 Y† Em WH,S P c sRP312 312 05 36 19.97−68 55 37.9 66 Y FS S L c b in HII regionRP315 315 05 36 13.27−68 56 19.5 66 Y LPV S P c in HII regionRP641 641 05 37 06.39−69 47 17.9 66 Y HII H,R,B,U P e VLE pRP691 691 05 35 25.96−69 59 22.2 66 N NL S T poss c hiddenRP698 698 05 33 30.52−69 52 27.0 66 Y HII H,R,B,U L poss ds symbiotic-RP700 700 05 31 29.50−69 50 42.4 66 N ND,NL WH,B T e diffuse hiddenRP701 701 05 30 57.41−69 49 00.7 66 N FD,NL H,R,B,U T e 3 stars Hα onlyRP748 748 05 31 47.13−69 45 44.4 66 N NL WH,R T e Hα onlyRP774 774 05 32 39.69−69 30 49.5 66 Y Sy? H,S P c s b some HIIRP775 775 05 32 44.26−69 30 05.9 66 Y HII DH,R,B,U P c b half hidden in HII regionRP776 776 05 32 39.24−69 31 53.9 66 Y Sy? H,S T c s p in HII regionRP789 789 05 32 35.58−69 25 42.1 66 Y PN H,R T c s Hα onlyRP790 790 05 32 33.65−69 24 55.6 66 Y FS S L c sRP791 791 05 33 07.00−69 29 45.9 66 Y Em WH,S L c s f weak HαRP793 793 05 34 41.40−69 26 30.7 66 Y LPV/Mira H,S T p Hα onlyRP828 828 05 33 40.29−69 12 51.2 66 Y FS S P c b some HIIRP833 833 05 31 05.78−69 10 41.5 66 N YSO WH,S,B P p VLERP883 883 05 35 56.89−69 00 44.9 66 Y LPV/Sy? H,S P e p bRP896 896 05 31 34.35−68 52 45.8 66 N PN H,R T c b Hα onlyRP907 907 05 34 48.03−68 48 35.6 66 Y† PN H,S T c b p in HII regionRP908 908 05 33 23.20−68 39 34.1 66 Y† Em WH,S L c p s stars N and SRP913 913 05 32 12.47−68 39 24.6 66 Y† Em WH,S P c VLE s in HII regionRP1018 1018 05 40 55.06−68 39 54.0 66 Y† FS S P p sRP1037 1037 05 37 25.05−69 48 00.1 66 Y PN H,R T c s Hα onlyRP1040 1040 05 37 21.05−70 04 08.4 66 N ND,NL WH? T e f Hα onlyRP1923 1923 05 04 40.45−66 49 49.2 83 N FS S P c fading haloRP1930 1930 04 59 20.54−66 45 59.7 83 N FD?,NL WH? P e f s Hα onlyRP1933 1933 05 04 47.17−66 40 30.8 83 N HII H,R,B,U P e b largeRP1934 1934 05 03 45.66−66 39 17.1 83 N PN WH,S? T e Hα only bpRP1938 1938 05 01 42.33−66 35 56.9 83 N PN WH,R T c s f Hα only
LMC tiles haveUBVi photometry from the Magellanic CloudPhotometric Survey (MCPS, Zaritsky et al. 2004) and MIRSpitzerIRAC and MIPS photometry from SAGE (Meixner et al.2006). We also identify variable sources usingI -band time-seriesphotometry from the OGLE-III microlensing survey (Udalskietal. 2008a, 2008b). Miszalski et al. (2009) first demonstrated thepower of this approach for removing strongly variable non-PNesuch as symbiotic stars towards the Galactic Bulge. The respec-tive survey footprints cover∼65% (MCPS),∼50% (SAGE) and∼30% (OGLE-III) of the total VMC tiled area (see Cioni et al.2011). The region surveyed by RP2006a has complete coveragein all surveys except OGLE-III where the N-E corner is not cov-ered.
Additional observations may also be found in the literature.There isHST coverage of RP218, RP232, RP265 and RP268,though only RP265 had a nebula detection (Shaw et al. 2007a).
A larger number of PNe from the Leisy et al. (1997) samplehave been imaged and resolved with theHST that leaves littledoubt to their PN nature. These include SMP4, SMP6, MG12,MG13, MG16, SMP27, SMP30, MG60, SMP78, SMP82 andMo36 (Shaw et al. 2001, 2006; Stanghellini et al. 2002, 2003).Leisy & Dennefeld (2006) published emission line intensitiesand chemical abundances for MG17, Mo42, Sa122 and all eightSMP objects in our sample.
The following subsections describe the data used to performthe multi-wavelength analysis. Appendix A describes the deriva-tion of VMC and SAGE magnitudes and tabulates all the pho-tometry. Note that magnitudes may include stellar or nebulacon-tributions, or a combination of both. Appendix B presents multi-wavelength images of the sample. Objects were identified usingfinder charts from Leisy et al. (1997) and RP2006b (kindly pro-vided by W. Reid). Note that the large amount of data employed
5

B. Miszalski et al.: The VMC Survey
here will not necessarily be available for all other LMC PNe,especially in the outer most tiles. A key aim in our work is tocharacterise those PNe with the maximal amount of availabledata, such that objects with only VMC data, or some combina-tion of MCPS, VMC or SAGE data, may be characterised basedon that data alone with confidence.
3.1. ESO WFI 30 Doradus imaging
In any study of PNe it helps to have narrow-band imaging withsufficient depth and resolution to detect and resolve the mor-phologies of faint nebulae. The RP2006a survey data are ade-quate for identification, but do not resolve sufficient morphologi-cal detail that can assist in the classification process. Fortunatelya high proportion of our sample located in the 66 tile (49/85objects) have deepB, V, [O III] and Hα imaging taken withthe Wide Field Imager (WFI) of the ESO 2.2-m telescope un-der program ID 076.C-0888.2 We refer the reader to Miszalskiet al. (2011b) for full details of the data products which coveran area of 63× 63 arcmin2 centred near 30 Doradus (αJ2000 =
05h37m54.7s, δJ2000= −69◦21′55′′; see Fig. 1).A search of the ESO archive found similar but unreduced
WFI observations for a further 10 objects obtained under theESO programs 066.B-0553 and 68.C-0019(A). Table 4 liststhe exposures taken with the Halpha/7, OIII/8, MB (medium-band) 604/21 and MB 485/31 filters whose central wave-lengths/FWHMs are 658.8/7.4 nm, 502.4/8.0 nm, 604.3/21.0 nmand 485.8/31.4 nm, respectively. An approximate WCS was ap-plied to the raw frames to allow for raw images to be extractedand stacked when appropriate. No other reduction steps wereap-plied to the data.
3.2. Magellanic Cloud Photometric Survey
Zaritsky et al. (2004) produced a catalogue of deep JohnsonUBV and Gunni photometry for a large fraction of the LMC (seeFig. 1). To extract the photometry for each object we overlaidthe catalogue photometry on the VMC colour-composite imageand selected entries corresponding to the VMC object positions.Table A.1 lists the extracted magnitudes where the ‘Status’col-umn indicates no survey coverage (NC) or a non-detection (ND)which occurs for objects too faint or diffuse. As the images arenot available it is difficult to judge whether the magnitudes in-clude the central star (CSPN), the nebula, or both. A small num-ber of PNe have photometry that is likely to originate from thehot central star as judged by the faintness of the nebula and thevery blueU − B colour (Mo42, MG12, MG13 and MG77), pro-vided there is no strong [O II] contribution toU. Most of thefainter PNe are expected to have evolved CSPN beyond the sur-vey detection limits ofV ∼ 20 mag (e.g. Villaver, Stanghellini& Shaw 2007). In brighter PNe the stronger nebula contributionsoccur inB andV which have the effect of producing redderU−BandB− V colours than expected for isolated CSPN.
3.3. VMC
We refer the reader to Cioni et al. (2011) for full details ofthe VMC data products and their reduction procedures. Thestrongest emission lines in the NIR for PNe include He I 1.083µm in Y, Paβ in J, while Ks contains Brγ, multiple He I andmolecular H2 lines (Hora et al. 1999; Rudy et al. 2001). In the
2 http://archive.eso.org/archive/adp/ADP/30 Doradus
Table 4.Additional ESO WFI archival data.
Name Filter Exp. Observed PID† FWHM(s) (YY-MM-DD) ( ′′)
MG75 Halpha/7 1200 01-12-07 (2) 0.90– MB 485/31 1200 01-12-08 (2) 1.09– OIII/8 1200 01-12-08 (2) 1.04
Mo38 Halpha/7 1200 01-12-07 (2) 1.00– MB 485/31 1200 01-12-08 (2) 1.12– OIII/8 1200 01-12-08 (2) 1.08
RP202 Halpha/7 1200 01-12-07 (2) 0.96– MB 485/31 1200 01-12-08 (2) 1.17– OIII/8 1200 01-12-08 (2) 1.07
RP203 Halpha/7 1200 01-12-07 (2) 1.11– MB 485/31 1200 01-12-08 (2) 0.99– OIII/8 1200 01-12-08 (2) 1.05
RP277 Halpha/7 1200 01-12-07 (2) 0.89– MB 485/31 1200 01-12-08 (2) 1.04– OIII/8 1200 01-12-08 (2) 1.07
RP283 Halpha/7 360 00-10-18 (1) 1.52– MB 604/21 300 00-10-18 (1) 1.89– OIII/8 480 00-10-18 (1) 1.64
RP907 Halpha/7 360 00-10-18 (1) 1.59– MB 604/21 300 00-10-18 (1) 1.94– OIII/8 480 00-10-18 (1) 1.61
RP908 Halpha/7 360 00-10-18 (1) 1.57– MB 604/21 300 00-10-18 (1) 2.00– OIII/8 480 00-10-18 (1) 1.75
RP913 Halpha/7 360 00-10-18 (1) 1.84– MB 604/21 300 00-10-18 (1) 1.91– OIII/8 480 00-10-18 (1) 1.64
RP1018 Halpha/7 1200 01-12-07 (2) 0.98– MB 485/31 1200 01-12-08 (2) 0.99– OIII/8 1200 01-12-08 (2) 1.07
Notes. †ESO Program IDs: (1) 066.B-0553; (2) 68.C-0019(A).
six tiles we have completeYJ observations and a number of ad-ditional Ks epochs whose completion status varies between tiles(see Tab. 4 of Cioni et al. 2011). TheseKs epochs increase theKs depth and provideKs lightcurves over a period of at least 100days. In the respective tiles we have used data observed up to31May 2010 that includesN additionalKs epochs (denotedT KN)as follows:T K5 (4 3 and 42),T K6 (9 3),T K7 (8 3) andT K10(6 6 and 88). Average 5σ depths for a single tile areY = 21.11mag,J = 20.53 mag andKs = 19.22 mag (Tab. 7 of Cioni etal. 2011). Artificial star tests on the stacked observationsfor alltiles give the 5σ depth asY = 22.44 mag,J = 22.16 mag andKs = 21.15 mag with a completeness level of∼57% (Rubeleet al. in preparation). Small variations in the depth will occurlocally depending on the position of objects within a tile andcrowding will also affect the completeness. The calculation ofVMC magnitudes is described in Appendix A.
3.4. SAGE
In the Milky Way SpitzerIRAC photometry and images are avaluable tool in the removal of non-PNe (Cohen et al. 2007,2011) and are well suited to the detection of obscured RGBand AGB stars. No similar LMC studies have been published,however Hora et al. (2008) gave IRAC and MIPS photometryfor non-RP LMC PNe measured from custom-reduced mosaicsthat incorporated observations from both epochs of the SAGEsurvey (Meixner et al. 2006). Here we have largely performedour own aperture photometry following theSpitzerscience cen-ter IRAC and MIPS instrument handbooks with the appropriate
6

B. Miszalski et al.: The VMC Survey
IRAC aperture corrections applied. This was necessary becausethe default catalogues are not optimised for extended sources,though in some cases we adopted catalogue magnitudes for thebrightest objects. Brighter objects in our sample overlap withHora et al. (2008) which serves as an independent check ofour procedure and fills in some gaps in their photometry wheredetections in some bands were sometimes absent. Data prod-ucts used were from the SAGE data release 3 including IRAC0.6′′/pixel mosaics (version 2.1), E12 MIPS24 mosaics and lessoften theSAGELMCcatalogIRACandSAGELMCcatalogMIPS24catalogues. Image cutouts were extracted for each object andaveraged when objects were included in more than one mo-saic sub-frame. Only SMP4 and SMP6 were located outside theSAGE survey (Fig. 1). The calculation of SAGE magnitudes isdescribed in Appendix A.
3.5. OGLE-III I -band and VMC Ks lightcurves
Large-scale photometric monitoring surveys offer a powerfulmeans to identify symbiotic stars which are commonly mistakenfor PNe (Miszalski et al. 2009). Their high level of variabilitymakes them particularly conspicuous in IR and NIR lightcurves(Mikołajewska 2001; Gromadzki et al. 2009). We employed asimilar procedure to that described by Miszalski et al. (2009)to extract OGLE-IIII -band lightcurves for our sample that hadsurvey coverage (Udalski et al. 2008a, 2008b; see Fig. 1) andto search for periodic variability. Objects located outside of theOGLE-III survey footprint are MG13, MG16, MG17, MG18,Mo42, SMP4, SMP6, SMP35, RP1923 and RP1933. VMCKslightcurves are more suited to probing variability of obscuredsymbiotic systems which contain RGB or AGB stars interact-ing with a white dwarf companion. In some symbiotic starsstrong intrinsic reddening created by dust means that variabil-ity may only be seen in the NIR out of the reach of OGLE-III(e.g. Mikołajewska et al. 1999). The sampling of the VMCKs
lightcurves is not suitable for measuring periods, but variabilitywith amplitudes larger than expected for a star of a given mag-nitude can be detected thanks to the scheme developed by Crosset al. (2009) that is implemented in the VSA archive.
4. Results
4.1. Photometric variability
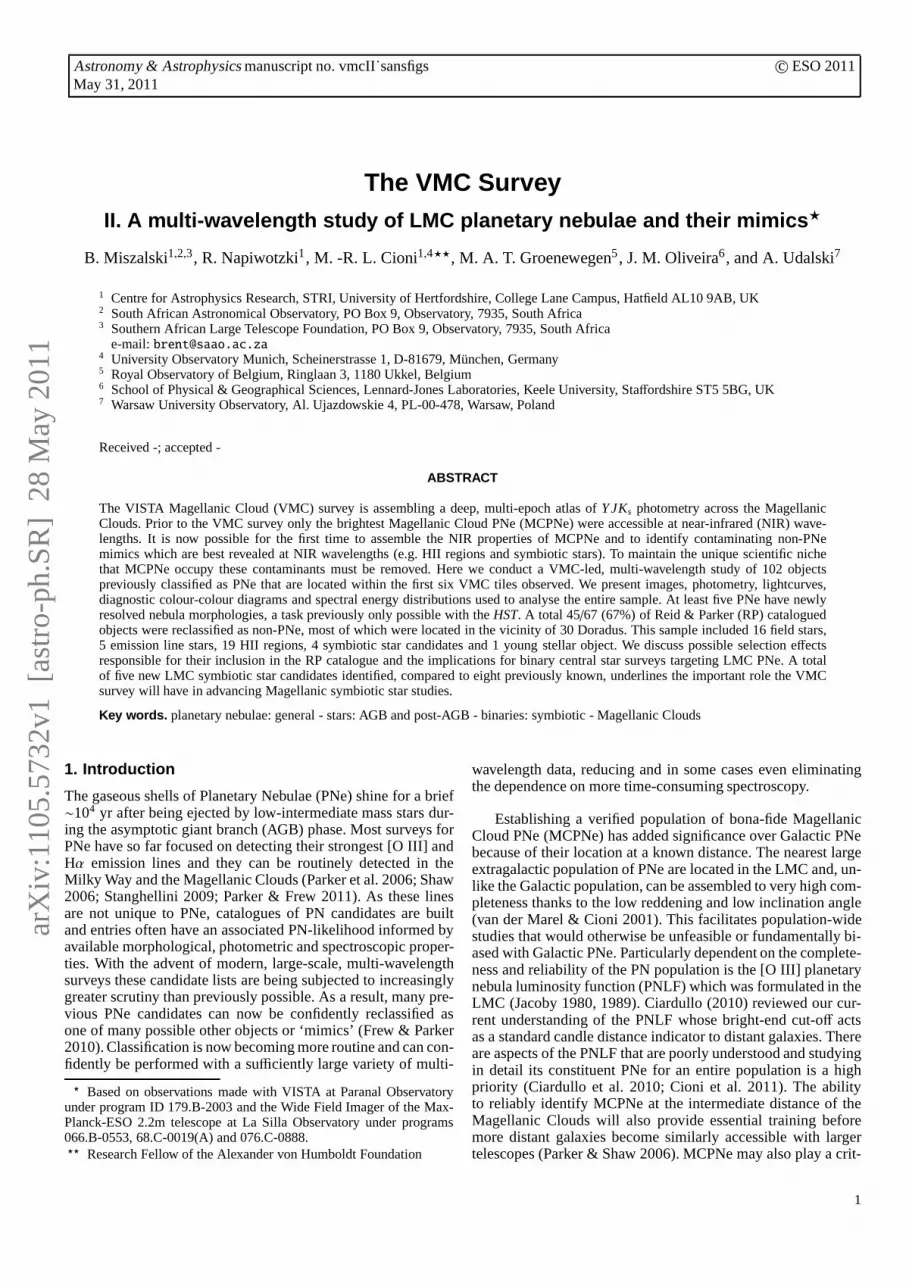
Photometric variability, in combination with corroboratingimaging and photometry, is a particularly strong constraint inthe classification of variable stars in our sample. Overall wefound six periodic variables from OGLE-III (Fig. 2). RP227 andRP793 were previously catalogued by Soszynski et al. (2009)as an OGLE small amplitude red giant and a Mira, respectively.None of the six periodic variables are bona-fide central stars ofPNe (see Tab. 2 and Sect. 5). Only the HII regions RP242 andRP247, and the symbiotic star candidate RP883, are associatedwith Hα emission. Section 6.2 will discuss the influence of theseresults upon the search for binary central stars in the LMC.
Table 5 lists six variables found to have variableKslightcurves which are shown in Fig. 3. We have averaged thenightly data using a weighted mean and used the standard de-viation of magnitudes on each night as the error. Each objecthas 11–31 good observations for which variability statistics werecalculated (Cross et al. 2009). Each medianKs magnitude,Ks,has an associated level of expected rms variability for a non-variable point source,σexp, based on a noise model fitted to theVMC survey data. A measure of the intrinsic variability of the
Fig. 2. OGLE-III I -band lightcurves of periodic variables in oursample.
Table 5.VMC Ks lightcurve variability statistics forσint/σexp ≥
2.5 (Cross et al. 2009).
Name N Ks σexp σint σint/σexp
RP247 29 16.03 0.018 0.050 2.755RP264 14 12.87 0.009 0.024 2.539RP774 31 14.39 0.011 0.074 6.900RP776 31 14.82 0.012 0.035 2.978RP793 11 11.77 0.009 0.145 16.091RP883 31 12.90 0.009 0.053 5.664
source,σint, is also calulated and used to form the ratioσint/σexpwhich is a measure of the standard deviation above the noisefor a given magnitude. A chi-squared statistic is also calculatedwhich is used to determine the probability that a source is vari-able, p, and all objects in Tab. 5 havep = 100%. Objects areconsidered to be variable ifp > 96% andσint/σexp ≥ 3. The ac-tual cutoff used to flag variables fromσint/σexp may be slightlylower or higher depending on how the noise model is built fromthe data and this strategy will be refined as the VMC surveyprogresses (N. Cross, private communication). For this reasonwe have also included two objects withσint/σexp ≥ 2.5 as vari-ables, both of which are OGLE-III variables. Some other objectsof interest may also be variable but have lower, less significantσint/σexp values of 2.08 (LM2-39 and Mo42) and 2.24 (MNC4).As expected the largestKs amplitude of 0.4 mag belongs to theMira RP793 (note there is no evidence to say it is a symbioticsystem, see Sect. 5). In the eclipsing RP247 an eclipse seemstobe responsible for the variability detection, though the limitedamount of data suggests this conclusion should be taken withcaution. In RP264, RP774, RP776 and RP883 we attribute thevariability to a combination of stellar and dust variability in thesesymbiotic star candidates.
7
B. Miszalski et al.: The VMC Survey
Fig. 3.VMC Ks lightcurves of the variables in Tab. 5. Observations taken on the same night were combined using a weighted mean.
Figure 4 shows additional OGLE-III lightcurves for par-ticular objects of interest or non-periodic variables. Four ofthese, LM2-39, RP264, RP774 and RP776, are probable sym-biotic stars, two of which have resolved Hα nebulae, for whichthe variability is small or even negligible in theI -band (e.g.Mikołajewska et al. 1999). Of these four, only RP264 has signif-icant I -band variability for its magnitude (in an average magni-tude vsσ plot). RP774 appears to show semi-regular variationsin the I -band which suggests an RGB star, while LM2-39 andRP776 may show slow variations.
4.2. Classification scheme and spectral energy distributions
The new classifications given in Tab. 2 are based on all the avail-able evidence as discussed in Sect. 5. Where there is insufficientevidence to reclassify an object we have set our classification to
neutral (NL). This mostly arises when detections are eitherweakor absent in the VMC data. We have refrained from identifyingsome diffuse cases when the source in question cannot be a PN,i.e. it is diffuse background HII emission, even though unrelatedstars may appear superposed on the diffuse nebula (e.g. RP232and RP234; see Sect. 5). Objects with Hα emission as well asa significant continuum contribution are classified as emissionline stars.
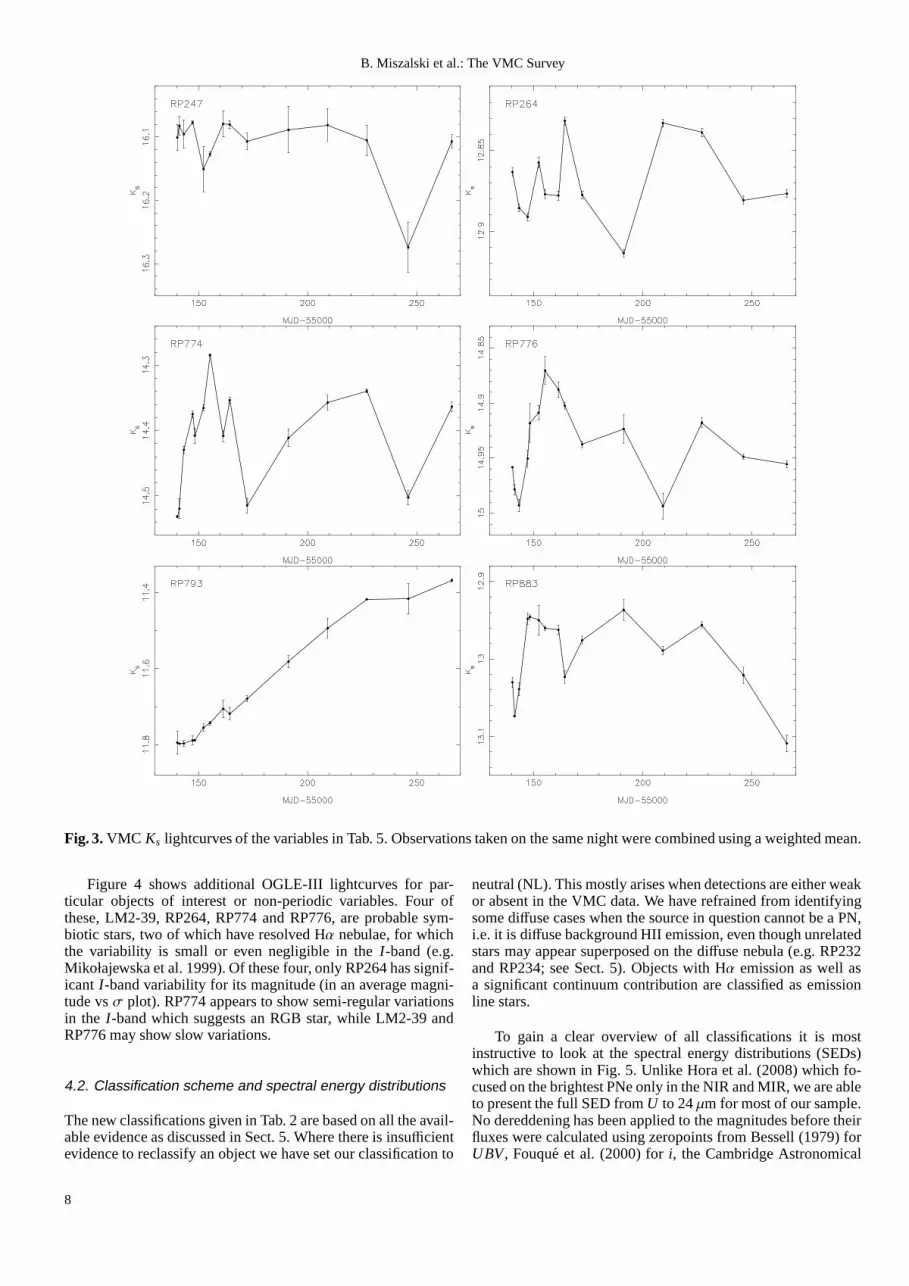
To gain a clear overview of all classifications it is mostinstructive to look at the spectral energy distributions (SEDs)which are shown in Fig. 5. Unlike Hora et al. (2008) which fo-cused on the brightest PNe only in the NIR and MIR, we are ableto present the full SED fromU to 24µm for most of our sample.No dereddening has been applied to the magnitudes before theirfluxes were calculated using zeropoints from Bessell (1979)forUBV, Fouque et al. (2000) fori, the Cambridge Astronomical
8

B. Miszalski et al.: The VMC Survey
Fig. 4.OGLE-III I -band lightcurves for a sample of non-periodic variables.
Survey Unit (CASU) measured Vega to AB conversions3 forYJKs, and those in Sect. A.2 for MIR bands. The VMC con-versions were derived by CASU following Hewett et al. (2006)and assume the effect of the atmospheric transmission profile onthem is very small.
Figure 5 is split into six panels grouping objects accordingto our classifications and two panels contrasting median SEDsnormalised toFJ = 10−4 Jy with 1σ error bars. PNe have ageneralU-shaped SED that is due to a large variety of differentemission and continuum components. In the optical the nebularand central star continuum dominates with a strong contributionfrom [O III] nebula emission atV (see Sect. 3.2). Hot dust isprobed by VMC and SAGE IRAC observations, but these wave-lengths are also influenced by atomic and molecular emissionlines which dominate the SED in fainter PNe. Cool dust is alsocommonly found in PNe and detected at 24µm by SAGE MIPSobservations. HII regions have much cooler ionising O/B starswhich dominate optical and NIR wavelengths producing a sim-ilar median SED to the field stars. These stars are generally notsufficient to produce the hot dust as seen in PNe which leavesonly cool dust dominating the MIR SED at 24µm. The final twopanels contrast HII regions against PNe and field stars. Noteinparticular the significant gap between HII regions and PNe intheMIR. We also show the periodic variables of Fig. 2 (excludingHII regions RP242 and RP247) together with suspected symbi-otic stars and the YSO candidate RP833. These sources are gen-erally much redder than others in the sample with hot dust andhigh circumstellar reddening that suppresses the SED at opticalwavelengths. The field stars form quite a homogeneous group asnone have 24µm detections, while emission line stars are similarwith many being late-type.
4.3. Diagnostic diagrams
With the wealth of optical, NIR and MIR magnitudes availablewe focus here on diagnostic colour-colour diagrams which bestisolate PNe from non-PNe. Figure 6 shows PNe in the VMCcolour-colour plane or ‘ant diagram’ (see Fig. 9 of Cioni et al.2011). PNe mostly lie within a region demarcated by red dotted
3 http://casu.ast.cam.ac.uk/surveys-projects/vista/technical/filter-set
lines in Fig. 6 which is defined by 0.4 ≤ J − Ks ≤ 2.5 [Y − J ≤0.15] andJ−Ks ≥ 2.05 (Y−J−0.17)+0.45 [0.15≤ Y−J ≤ 0.56,J − Ks ≤ 2.5]. A small number of PNe with either hot dust (e.g.MG68) or perhaps stronger Paβ nebular emission (e.g. MNC1and Mo37) have redderY − J colours. Also shown in Fig. 6 aresemi-regular and Mira variables (Soszynski et al. 2009), and arepresentative sample of extended galaxies selected from the 8 8tile with PetrosianKs < 17 mag. The data show PNe are quitewell separated from the majority of other sources in the fields.Symbiotic star candidates have much redderJ − Ks colours perY − J colour than PNe, while RP793 lies in the typical colourspace expected for non-symbiotic Miras.
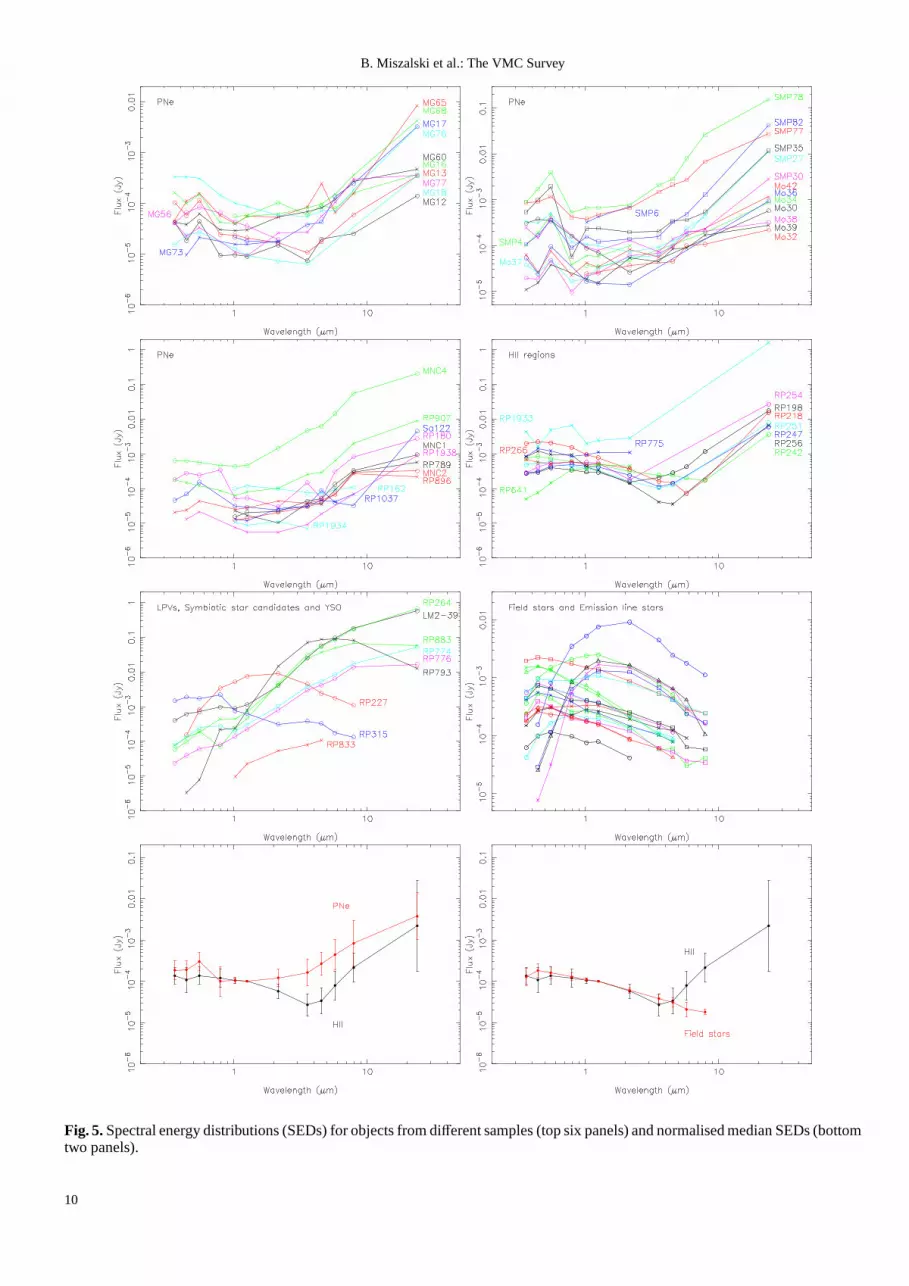
The VMC ant diagram alone appears to be a very useful toolto isolate most PNe. Additional wavelengths can further improvethe isolation of PNe. In theU −B vs J−Ks plane many PNe fallwithin a fairly isolated patch defined by 0.6 ≤ J − Ks ≤ 2.3 and−2 ≤ U − B ≤ −0.7 (Fig. 7). An HII region falls within thispatch (RP1933) but morphology should allow these to be easilyidentified. Similar congregations of bona-fide PNe can also befound in a combination of various VMC and SAGE magnitudesand colours (Figs. 7 and 8). The depth provided by the VMCsurvey allows redderJ− [8.0] andKs− [8.0] colours to be probedthan previously possible and earlier predictions of Hora etal.(2008) are largely verified to this effect. Note the largeKs andMIR luminosities of the symbiotic star candidates which forma well separated group from most PNe. MNC4 and other PNewith hot dust may also fall into this area. We found theJ - [4.5]colour to give the cleanest separation between HII regions (J -[4.5] <∼ 2), PNe (2<∼ J - [4.5] <∼ 4.5) and the obscured RGB orAGB stars of symbiotic stars and Miras (J - [4.5] >∼ 5).
5. Notes on individual objects
LM2-39.— RP2006b remarked this object as a late-type star.The resolved Hα nebula, NIR and MIR colours, and slowI -bandvariations all suggest LM2-39 to be a strong symbiotic star can-didate.
MG13.— We suspect our VMC magnitudes mostly reflectthe CSPN. The knot immediately to NW may be resolved nebulaemission from the enhanced rim of diameter 1.55′′ identified by
9
B. Miszalski et al.: The VMC Survey
Fig. 5.Spectral energy distributions (SEDs) for objects from different samples (top six panels) and normalised median SEDs (bottomtwo panels).
10

B. Miszalski et al.: The VMC Survey
Fig. 6. VMC ant diagram showing the position of objects in our sample. A PN-rich region is bounded by the red dashed lines. Thelower panel zooms into the more crowded region of the upper panel.
11
B. Miszalski et al.: The VMC Survey
Fig. 7.As in Fig. 6 but forU − B vs. J − Ks (top) andJ vs. J - [4.5] (bottom).
12

B. Miszalski et al.: The VMC Survey
Fig. 8.As in Fig. 6 but for [8.0] vs.J - [8.0] (top) andKs vs.Ks - [8.0] (bottom).
13

B. Miszalski et al.: The VMC Survey
Stanghellini et al. (2003). We measure a diameter of 1.95′′ thatis consistent with this value within a VMC pixel.
MG16.— There is a hint of extended emission in the VMCimages as two lobes towards the NE and E. These could be ex-tensions of the faint bipolar lobes detected by Shaw et al. (2006)or alternatively they could be evidence of ISM interaction.
MG68.— The WFI images reveal a highly asymmetric neb-ula that is shaped by strong ISM interaction from the SE (e.g.Wareing et al. 2007). The [O III] emission is concentrated to-wards the SE suggesting the presence of a bow-shock, while Hαemission appears separated into multiple tails before being ob-scured behind a nearby dark cloud. The high spatial variation of[O III] emission may explain the anomalous [O III] flux pub-lished by RP2010 and revised by Miszalski et al. (2011b).
Mo42, MG73 and RP202.— These are all bipolar PNewhose nebulae are resolved for the first time. The VMC imageof Mo42 reveals a central star that is brightest inY and an innerbipolar nebula with point-symmetric extensions that resemblethose in SMP10 (Shaw et al. 2001). In MG73 the WFI imagesresolve the bipolar nebula, while the VMCKs filament detectedtraces the inner torus aligned with PA=0–5◦. The brightest partof RP202 is a ‘waist’ oriented at PA=45◦ and thin extensionsextend either side along PA=0◦. RP2006b suspected MG73 wasbipolar based on their unpublished spectroscopy (see propertiesin Tab. 2). The morphology of Mo42 is consistent with the Type-I (Peimbert & Torres-Peimbert 1983) chemical abundances ofHe/H=11.21 and N/O=+0.34 measured by Leisy & Dennefeld(2006).
SMP27.— Shaw et al. (2001) describeHSTobservations ofthis PN which shows an inner compact nebula (the PN proper)surrounded by an extended arc of emission. Here we have onlymeasured magnitudes for the compact nebula. The arc was laterconfirmed to be an asymmetric shell that extends around thecompact nebula from Hα (RP2006a) and MIR observations(Cohen et al. 2009). We can now add a NIRKs detection tothe list which subtends a diameter of 15.4′′ (3.7 pc across at 49kpc). The shell is often mentioned in the context of AGB haloes(Corradi et al. 2003), extremely faint outer nebulae created byprevious mass-loss episodes on the AGB. However, this inter-pretation is inconsistent with the atypically large diameter andhigh surface brightness of the shell whose peakKs intensity is0.14 that of the inner nebula (most haloes are 10−3–10−4 timesfainter than their inner nebulae). Instead, the shell is most likelyjust ionised ISM as appears to be the case for NGC 3242 andNGC 6751 (Corradi et al. 2003).
SMP30.— The Zaritsky et al. (2004)i magnitude of 14.125±0.013 is erroneously bright and was removed from Table A.1.
RP135.— The NIR and MIR colours of this object suggesta non-PN classification, perhaps an emission line star if there isindeed weak Hα emission.
RP203.— The WFI images reveal the RP2006b identifica-tion to be a knot of diffuse HII. Without a NIR or MIR counter-part it is difficult to classify this object as a PN.
RP232 and RP234.— The WFI images reveal an ionisationstructure in RP232 opposite to that expected for a PN with Hα
in the centre surrounded by [O III]. Both nebulae are part ofextensive background emission in the vicinity of 30 Doradus.Superposed stars near the centre of the purported nebulae aretherefore unrelated and in lower resolution imaging may haveunduly amplified any apparent Hα excess.
RP242.— There is no intrinsic [O III] emission detected inthe WFI image contrary to the spectrum published by RP2006bwhich has [O III] λ5007/Hα = 0.20. This greatly reduces thechance that this object is a PN, but it could also be symptomatic
of a very low metallicity (e.g. Jacoby et al. 2002). Furthermore,RP242 is placed amongst objects lacking hot dust (stars and HIIregions) in the diagnostic colour-colour planes. All our evidencepoints to an HII region with a central ionising O/B binary withP = 200.83 days (Fig. 2). In this sense RP242 seems to be alonger period version of RP247 (see below). Spectroscopy ofthe central stars is required to check our classification. Ifindeeda hot post-AGB star were found to be present, then RP242 wouldhost the first binary central star discovered in the LMC.
RP247.— The OGLE-III lightcurve reveals an eclipsing bi-nary withP = 2.133 days and minima with similar depths indi-cating similarTeff components. Our main reason for reclassify-ing RP247 is the extremely weak Hα emission in the WFI imagecompared to even other HII regions in our sample (e.g. RP254).Furthermore, the similar colours to RP242 and the SED with a24µm detection point to a weak Stromgren sphere surroundinga close O/B binary.
RP254, RP266, RP641andRP698.— The VMC and SAGEdata clearly reveal the dusty environment of these HII regions.Soszynski et al. (2009) found an unrelated semi-regular variable∼7′′ NE of the RP2006b position for RP698 which has a periodof 97.02 days. RP698 itself measures∼10′′ across as an elon-gated enhancement of a larger region of nebulosity visible in theMIR.
RP264.— An elliptical Hα nebula measuring 1.9′′×3.9′′ ap-pears in the WFI data. The very redJ − Ks = 3.42 colour andvery high MIR luminosity points to an obscured AGB star forwhich we detect significant variability in the OGLE-IIII -bandlightcurve (Fig. 4) and the VMCKs lightcurve (Fig. 3). Thecombination of nebula and obscured AGB star make RP264 anexcellent symbiotic star candidate.
RP265.— Is a resolved bipolar nebula in the Hα WFI im-ages that is also seen in broadbandHST observations (Shaw etal. 2007a). Only a weak detection was found in the VMC imagesand severe crowding meant no attempt was made to measure in-tegrated magnitudes. The WFI images did not detect any [O III]emission, but this is not entirely unexpected for bipolar PNe.
RP277, RP283, RP791, RP908 and RP913.— All these ob-jects appear to be emission line stars. A strong continuum com-ponent is found in the NIR alongside a small to moderate Hαexcess in WFI images.
RP691.— This may be a case of superposition with the pur-ported PN lying just North of the star identified in Fig. B.11(Reid & Parker, private communication). No detection in theNIR or MIR of such a PN was found, so we leave the classi-fication of RP691 as neutral. The magnitudes of the bright starare recorded for reference.
RP701.— A diffuse nebula is detected in the VMC imagesbut severe crowding precludes measurement of its properties.
RP774 and RP776.— Both RP774 and RP776 are cata-logued as ‘True’ PNe by RP2006b and Woods et al. (2011) clas-sified RP774 as a YSO. They appear to have significant nebularHα emission in the WFI images and the NIR and MIR proper-ties of both objects suggest either an obscured RGB (or possiblyAGB) star or the presence of hot dust. It is difficult to acceptthe latter explanation given the significantKs variability, unlessthis variability was attributed to line-of-sight dust obscurationevents. This is however unlikely since these events are extremelyrare in PNe and we would have expected to see more dramaticI -band variability if this were the case (Miszalski et al. 2011a).The OGLE-III lightcurve of RP774 in Fig. 4 appears to showlow-amplitude semi-regular variability on the order of∼40–80days and this could be attributed to an RGB star.
14

B. Miszalski et al.: The VMC Survey
Table 6.Objects reclassified as non-PNe from the RP2006b cat-alogue.
Object Type True Likely PossibleHII regions - 1 11Diffuse HII 1 2 4Field stars 1 3 12Emission line stars - 2 3Symbiotic stars 1 - 3YSO - - 1Reclassified/Total 3/21 8/9 34/37Percentage 14% 89% 92%
RP775.— van Loon et al. (2010) classified RP775 as a pos-sible HII region. With the high resolution of the WFI data we cansee the ionised front powered by an embedded massive object.This leaves no doubt that RP775 is an HII region.
RP793.— The very large 0.4 magKs amplitude in the VMClightcurve supports the C-rich Mira classification made in theLPV catalogue of Soszynski et al. (2009). We have replaced theIandV magnitudes in Tab. A.1 with the average OGLE-III valuesof I = 17.63 andV = 21.65 mag (Soszynski et al. 2009). Thevery red optical colours in Tab. A.1 and the extremely weak Hαsource in the WFI image essentially rule out the presence of asymbiotic nebula in RP793.
RP833.— There is no OGLE-IIII -band detection of this ob-ject indicating a very high level of obscuration. It is most likelya YSO based on its NIR colours, the presence of other simi-lar condensations directly to the North and South and the dustyMIR HII environment.
RP883.— As for RP774 and RP776, RP883 appears to havea strong nebular component in the optical combined with NIRand MIR colours typical of an obscured RGB or AGB star. Wefound a period of 176.49 days from the OGLE-III lightcurve af-ter fitting and subtracting the general decline. The significantKs
variability in the VMC lightcurve further supports a classifica-tion as a candidate symbiotic star with the measured period ly-ing at the lower range for symbiotic stars (Mikołajewska 2003;Gromadzki et al. 2009).
RP1933.— Discussed by van Loon et al. (2010) and alsoreclassified by RP2010, the bright extended emission clearlypoints to an HII region powered by a very hot central source(U − B = −1.99).
6. Discussion
6.1. Reclassifications and selection effects
Table 6 summarises the 45 objects we have reclassified as non-PNe from 3 ‘true’, 8 ‘likely’ and 34 ‘possible’ PNe classifiedby RP2006b. Apart from the symbiotic star candidates we havenot added to Tab. 6 any objects with uncertain classifications(those with ‘?’ in Tab. 2). Periodic variables were includedinthe table as field stars except for when they are surrounded byHII regions (e.g. RP242). Out of the non-RP sample only LM2-39 was reclassified as a symbiotic star candidate.
The contamination fraction of 45/67 objects or 67% is ratherhigh. Field stars and non-diffuse HII regions make up the bulkof the contaminants, most of which were designated as possi-ble PNe by RP2006b. Figure 1 shows that most of the RP ob-jects classified as possible PNe are located around 30 Doradus.This suggests that the strong emission-line background in thisarea played a large part in their inclusion in the RP survey. Thedominant background complicates multi-object spectroscopic
followup whose sky subtraction is generally less accurate thanlongslit spectroscopy. The variable spectrograph point-spreadfunction of 2dF prior to the AAOmega spectrograph upgrade(Sharp et al. 2006) and use of only∼40 sky fibres over thelarge 2.1 degree field-of-view (RP2010), may have indeed re-sulted in residual emission lines being mistaken for genuineemission. This could explain the inclusion of some field starssuch as RP1018 for which we cannot identify any Hα emissionin the WFI images. Although this does not seem widespread aswe were able to calibrate the ESO WFI [O III] images basedon spectroscopic [O III] fluxes from RP2010 (Miszalski et al.2011b). In a few cases intrinsic variability (e.g. RP312, RP315)may also have given the false appearance of Hα emission in theRP survey material. However, not all field stars could be ex-plained in this fashion as many have negligibly small OGLE-IIII -band variability.
Perhaps the largest contributing factor towards the high con-tamination fraction is the lower resolution of the RP survey. Theincreased resolution and depth of the multi-wavelength data pre-sented here have resolved some cases of superpositions betweenfield stars and diffuse background HII (e.g. RP232, RP234) andhave been particularly helpful in identifying smaller HII regions.Actual superpositions may also occur between bona-fide PNeand field stars, synonymous with our emission line star classi-fication, but should be rare based on the rarity of real super-positions in the Galactic Bulge PN sample (Miszalski et al. inpreparation).
6.2. Implications for binary central star surveys
There has been some interest in searching for binary centralstarsin the LMC population (Shaw et al. 2007c; Shaw, Rest & Damke2009). Miszalski et al. (2009) used OGLE-III to more than dou-ble the known Galactic population of close binary CSPN but todate no such binaries have been found in the LMC. LMC PNeoffer a potentially very useful platform to measure the binarycentral star fraction for a large population, but the extreme faint-ness of LMC CSPN are a major obstacle to this task (Villaver etal. 2007). A major repercussion of our multi-wavelength analy-sis is that unless an LMC PN can be shown to be a bona-fide PN,then any claims of variability, even if periodic, cannot be usedto claim a binary central star. An interesting example is RP247whose orbital period of 2.13 days (Fig. 2) is not entirely incon-sistent with the observed Galactic period distribution (Miszalskiet al. 2009, 2011c), however the weak trace of Hα emission isinsufficient for a PN classification of this HII region.
There is also a danger that field stars are mistaken for sec-ondary star companions. Shaw et al. (2009) found a large propor-tion of ‘PNe’ with NIR colours of giants. Even though there areonly a few Galactic PNe with bona-fide luminous companions(e.g. Tab. 4 of De Marco 2009), the fraction claimed by Shaw etal. (2009) is anomalously high and readily explained by the highnumbers of field stars and emission line stars revealed in thiswork. Many of these stars will have slowly-variable lightcurves(e.g. RP312 and RP913 in Fig. 4) and periodic lightcurves of anextremely large variety (e.g. Kiss & Bedding 2003). Inspectionof lightcurves in the remaining RP2006b catalogue not analysedin this work has revealed additional examples of variability dueto field star contaminants. As yet we have not found any genuineperiodic variability that can be ascribed to a binary CSPN.
15

B. Miszalski et al.: The VMC Survey
7. Conclusions
We have presented multi-wavelength data for a sample of 102objects previously classified as PNe that were observed duringthe first year of the VMC survey. The six LMC tiles consti-tuting the first VMC observations sample a range of LMC en-vironments, but our results are dominated by the 66 tile cen-tred on 30 Doradus. This complex region serves as an excellenttraining ground for developing multi-wavelength criteriato max-imise the exploitation of the VMC survey for PNe studies and toidentify non-PNe contaminating extant MCPNe catalogues. Themain conclusions are as follows:
– PNe are well-separated from other objects in multiplecolour-colour diagnostic diagrams. Their typical coloursinthe VMC ant diagram are defined by the region 0.4 ≤ J −Ks ≤ 2.5 [Y−J ≤ 0.15] andJ−Ks ≥ 2.05 (Y−J−0.17)+0.45[0.15 ≤ Y − J ≤ 0.56, J − Ks ≤ 2.5] which shares minimaloverlap with galaxies and evolved variable stars. Distinctionbetween a variety of non-PNe was well catered for by theincorporation of MCPS and SAGE photometry.
– A large non-PNe contamination fraction of 67% was identi-fied in the RP subset of our study based on an overall assess-ment of all the multi-wavelength data. This is made up of 3‘true’, 8 ‘likely’ and 34 ‘possible’ PNe from RP2006b. TheRP2006b reclassifications were made up of 16 field stars,5 emission line stars, 19 HII regions, 4 symbiotic star can-didates and 1 YSO candidate. Factors contributing to theseresults may include the complex emission-line backgroundnear 30 Doradus, the lower resolution of RP survey andresidual emission-lines following sky-subtraction.
– Six periodic variables were discovered amongst theRP2006b sample from OGLE-III lightcurves and were re-classified as non-PNe. These discoveries emphasise the im-portance of a clean PN sample before searches for binarycentral stars of LMC PNe are conducted. Furthermore, thelarge proportion of field stars and emission line stars wehave reclassified in the sample disproves previous claimsof a large population of giant secondary companions toLMC PNe (Shaw et al. 2009). The success of incorporat-ing time-series photometry into multi-wavelength studiesofPNe, first employed by Miszalski et al. (2009) and reaffirmedhere, should where possible be incorporated into standard-ised schemes for identifying non-PNe (e.g. Frew & Parker2010).
– The high resolution of the presented imaging has resolvedthe morphologies of some PNe for the first time. These in-clude the bipolar nebulae of MG73, RP202 and RP265 (con-firming prior HST imaging), the asymmetric, bow-shockednebula of MG68, and the exquisite point-symmetric exten-sions to the inner bipolar nebula of Mo42.
– We have identified 5 new symbiotic star candidates in theLMC based primarily on their Hα emission, NIR and MIRcolours, andI -band andKs variability. This is a dramaticboost to only 8 previously catalogued LMC symbiotics(Belczynski et al. 2000; J. Mikołajewska, private commu-nication).
Acknowledgements.We kindly thank Warren Reid and Quentin Parker for shar-ing their finder charts of the RP sample and comments on an early version ofthis paper. BM thanks Eduardo Gonzalez-Solares for helpful discussions con-cerning the VMC data products and Nicholas Cross for discussions regardingvariability of sources in the VSA archive. We also thank J. Emerson, L. Girardiand V. Ivanov for helpful comments and the anonymous refereefor construc-tive comments that helped refine the paper. We thank the UK team responsiblefor the realisation of VISTA, and the ESO team who have been operating and
maintaining this new facility. The VISTA Data Flow System comprising theVISTA pipeline at CASU and the VISTA Science Archive at WFAU has beencrucial in providing us with calibrated data products for this paper, and is sup-ported by the UK Science and Technology Facilities Council.The OGLE projecthas received funding from the European Research Council under the EuropeanCommunity’s Seventh Framework Programme (FP7/2007-2013)/ ERC grantagreement no. 246678. This research has made use of SAOImageDS9, devel-oped by Smithsonian Astrophysical Observatory.
References
Belczynski, K., Mikołajewska, J., Munari, U., Ivison, R. J., & Friedjung, M.2000, A&AS, 146, 407
Bessell, M. S. 1979, PASP, 91, 589Ciardullo, R. 2010, PASA, 27, 149Cioni, M.-R., et al. 2011, A&A, 527, A116Cohen, M., et al. 2007, ApJ, 669, 343Cohen, M., Hora, J., Parker Q., & Reid, W. 2009, The Magellanic System: Stars,
Gas, and Galaxies, eds. J.Th. van Loon & J.M. Oliveira, IAUS 256 (CUP),PDF-7
Cohen, M., Parker, Q. A., Green, A. J., Miszalski, B., Frew, D. J., & Murphy, T.2011, MNRAS, 413, 514
Corradi, R. L. M., Schonberner, D., Steffen, M., & Perinotto, M. 2003, MNRAS,340, 417
Corradi, R. L. M., et al. 2008, A&A, 480, 409Cross, N. J. G., Collins, R. S., Hambly, N. C., Blake, R. P., Read, M. A., Sutorius,
E. T. W., Mann, R. G., & Williams, P. M. 2009, MNRAS, 399, 1730De Marco, O. 2009, PASP, 121, 316Fouque, P., et al. 2000, A&AS, 141, 313Frew, D. J., & Parker, Q. A. 2010, PASA, 27, 129Gaustad, J. E., McCullough, P. R., Rosing, W., & Van Buren, D.2001, PASP,
113, 1326Gromadzki, M., Mikołajewska, J., Whitelock, P., & Marang, F. 2009, Acta
Astronomica, 59, 169Hewett, P. C., Warren, S. J., Leggett, S. K., & Hodgkin, S. T. 2006, MNRAS,
367, 454Hora, J. L., Latter, W. B., & Deutsch, L. K. 1999, ApJS, 124, 195Hora, J. L., et al. 2008, AJ, 135, 726Irwin, M. J., et al. 2004, SPIE, 5493, 411Jacoby, G. H. 1980, ApJS, 42, 1Jacoby, G. H. 1989, ApJ, 339, 39Jacoby, G. H., Feldmeier, J. J., Claver, C. F., Garnavich, P.M., Noriega-Crespo,
A., Bond, H. E., & Quinn, J. 2002, AJ, 124, 3340Joye, W. A., & Mandel, E. 2003, Astronomical Data Analysis Software and
Systems XII, 295, 489Kiss, L. L., & Bedding, T. R. 2003, MNRAS, 343, L79Leisy, P., Dennefeld, M., Alard, C., & Guibert, J. 1997, A&AS, 121, 407Leisy, P., & Dennefeld, M. 2006, A&A, 456, 451Lindsay, E. M. 1963, Irish Astronomical Journal, 6, 127Meixner, M., et al. 2006, AJ, 132, 2268Mikołajewska, J., Brandi, E., Hack, W., Whitelock, P. A., Barba, R., Garcia, L.,
& Marang, F. 1999, MNRAS, 305, 190Mikołajewska, J. 2001, IAU Colloq. 183: Small Telescope Astronomy on Global
Scales, 246, 167Mikołajewska, J. 2003, Astronomical Society of the Pacific Conference Series,
303, 9Miszalski, B., Acker, A., Moffat, A. F. J., Parker, Q. A., & Udalski, A. 2009,
A&A, 496, 813Miszalski, B., et al. 2011a, A&A, 528, A39Miszalski, B., Napiwotzki, R., Cioni, M.-R., & Nie, J. 2011b, A&A, 529, A77Miszalski, B., Corradi, R. L. M., Jones, D., Santander-Garcıa, M., Rodrıguez-
Gil, P., & Rubio-Dıez, M. M. 2011c, Asymmetric Planetary Nebulae V,arXiv:1009.2890
Parker, Q. A., Acker, A., Frew, D. J., & Reid, W. A. 2006, Planetary Nebulae inour Galaxy and Beyond, 234, 1
Parker, Q. A., & Shaw, R. 2006, Planetary Nebulae Beyond the Milky Way, 365Parker, Q. A., & Frew, D. J. 2011, Asymmetric Planetary Nebulae V,
arXiv:1011.0857Reid, W. A., & Parker, Q. A. 2006a, MNRAS, 365, 401 (RP2006a)Reid, W. A., & Parker, Q. A. 2006b, MNRAS, 373, 521 (RP2006b)Reid, W. A., & Parker, Q. A. 2010, MNRAS, 405, 1349 (RP2010)Rudy, R. J., Lynch, D. K., Mazuk, S., Puetter, R. C., & Dearborn, D. S. P. 2001,
AJ, 121, 362Schmeja, S., & Kimeswenger, S. 2001, A&A, 377, L18Sharp, R., et al. 2006, Proc. SPIE, 6269E, 14Shaw, R. A., Stanghellini, L., Mutchler, M., Balick, B., & Blades, J. C. 2001,
ApJ, 548, 727
16
B. Miszalski et al.: The VMC Survey
Shaw, R. A. 2006, Planetary Nebulae in our Galaxy and Beyond,234, 305Shaw, R. A., Stanghellini, L., Villaver, E., & Mutchler, M. 2006, ApJS, 167, 201Shaw, R. A., Reid, W. A., & Parker, Q. A. 2007a, PASP, 119, 19Shaw, R. A., Rest, A., Damke, G., Smith, R. C., Reid, W. A., & Parker, Q. A.
2007b, ApJL, 669, L25Shaw, R. A., Rest, A., Damke, G., & Smith, R. C. 2007c, Asymmetrical
Planetary Nebulae IVShaw R.A., Rest A., & Damke G. 2009, The Magellanic System: Stars, Gas, and
Galaxies, eds. J.Th. van Loon & J.M. Oliveira, IAUS 256 (CUP), PDF-41Soszynski, I., et al. 2009, Acta Astron., 59, 239Stanghellini, L., Shaw, R. A., Mutchler, M., Palen, S., Balick, B., & Blades, J. C.
2002, ApJ, 575, 178Stanghellini, L., Shaw, R. A., Balick, B., Mutchler, M., Blades, J. C., & Villaver,
E. 2003, ApJ, 596, 997Stanghellini, L. 2009, IAU Symposium, 256, 421Udalski, A., et al. 2008a, Acta Astron., 58, 89Udalski, A., Szymanski, M. K., Soszynski, I., & Poleski, R. 2008b, Acta Astron.,
58, 69van der Marel, R. P., & Cioni, M.-R. L. 2001, AJ, 122, 1807van Loon, J. T., et al. 2010, AJ, 139, 68Villaver, E., Stanghellini, L., & Shaw, R. A. 2007, ApJ, 656,831Wareing, C. J., Zijlstra, A. A., & O’Brien, T. J. 2007, MNRAS,382, 1233Woods, P. M., et al. 2011, MNRAS, 411, 1597Zaritsky, D., Harris, J., Thompson, I. B., & Grebel, E. K. 2004, AJ, 128, 1606
17

B. Miszalski et al.: The VMC Survey
Appendix A: Photometry
A.1. VMC
The mixture of stellar and extended sources in our samplerequired different approaches to obtaining their magnitudes.As a first step we created a stacked image per waveband(0.339′′/pixel) for each object by averaging individual paw-printobservations (Irwin et al. 2004). As described above, the depthin these images is uniform across all tiles with some small varia-tion. The catalogue photometry hosted by the VISTA ScienceArchive (VSA) is adopted when themergedClass flag indi-cates a stellar or probably stellar object. In these instances weadopt the catalogued magnitudes calculated with a small aper-ture of diameter 2.0′′ (AperMag3) which is corrected for fluxoutside the aperture assuming a stellar profile. This is appro-priate for compact, unresolved PNe and of course for stars. Forsome extended objects we can make use of uncorrected magni-tudes (NoAperCorr) calculated using apertures of diameter2.0′′
(AperMag3), 2.8′′(AperMag4) or 5.7′′ (AperMag6), where theaperture is visually selected to enclose the most object flux. TheVSA magnitudes are based on the previously mentioned level ofT KN completeness.
When catalogue magnitudes were not available for fainterextended sources we have performed our own aperture photom-etry on our stacked image cutouts. A specially developed pluginfor ds9 (Joye & Mandel 2003) served as a wrapper for theds9funtools programfuncnts4 which calculates the total number ofcounts within a givends9 region (e.g. a circle). A circular aper-ture of maximal radius is chosen for each object along with mul-tiple nearby sky apertures of the same radius. The magnitudeswere then calculated using:
m= NZP− 2.5 log10 [(O− S)/T] (A.1)
whereS is the average of the total sky counts in all sky apertures,O is the total counts in the object aperture,T is the normalisedexposure time (5 s forKs, 10 s forJ and 20 s forY) and NZPis the nightly photometric zeropoint. We assigned a 1σ error of0.20 mag based on the comparison between our measurementsand the catalogued photometry. As no errors were given by theVSA for NoAperCorr magnitudes we also assigned them theseerrors. Some fields were too crowded for aperture photometryand we have remarked in Tab. 2 where this occurred. In one casean elliptical aperture seemed most suitable (RP789). No aperturecorrections were applied to our aperture photometry.
A.2. SAGE
To perform the aperture photometry we developed a similards9plugin as for the VMC aperture photometry that would allowfor the efficient calculation of all magnitudes per object oncethe IRAC and MIPS images were loaded alongside the VMCcolour-composite image for guidance. The total number of skysubtracted counts per object were converted to Jy followingtheinstrument handbooks and converted to magnitudes using thezeropoints given in the accompanying SAGE data release docu-mentation, i.e. 280.9, 179.7, 115.0, 64.13 and 7.14 Jy for the 3.6,4.5, 5.8, 8.0 and 24.0µm bands, respectively. Table A.5 containsthe measured magnitudes for which we have assigned 1σ errorsof 0.25, 0.25, 0.30, 0.35 and 0.40 mag, respectively, based on acomparison with Hora et al. (2008) and catalogue magnitudes.These errors are larger than the 0.1–0.2 mag estimated by Hora
4 http://hea-www.harvard.edu/RD/funtools/ds9.html
et al. (2008) and more realistically reflect the inherent difficultyin selecting optimal object and sky apertures under sometimesvery challenging circumstances. This is particularly trueat 8.0µm where diffuse PAH emission in the field creates a highly vari-able background. An excellent example is Mo38 which has neg-ligible background at shorter wavelengths. If our sky aperture isplaced in a background minimum SE of the PN we reproduce[8.0]=12.9 mag of Hora et al. (2008). However, a placement im-mediately West of the PN on a similar background level as thePN results in [8.0]=13.7 mag – a difference of 0.8 mag! In thecase of a few bright objects we used the catalogued magnitudesand their errors. Very extended HII regions were not measured.
18

B. Miszalski et al.: The VMC Survey
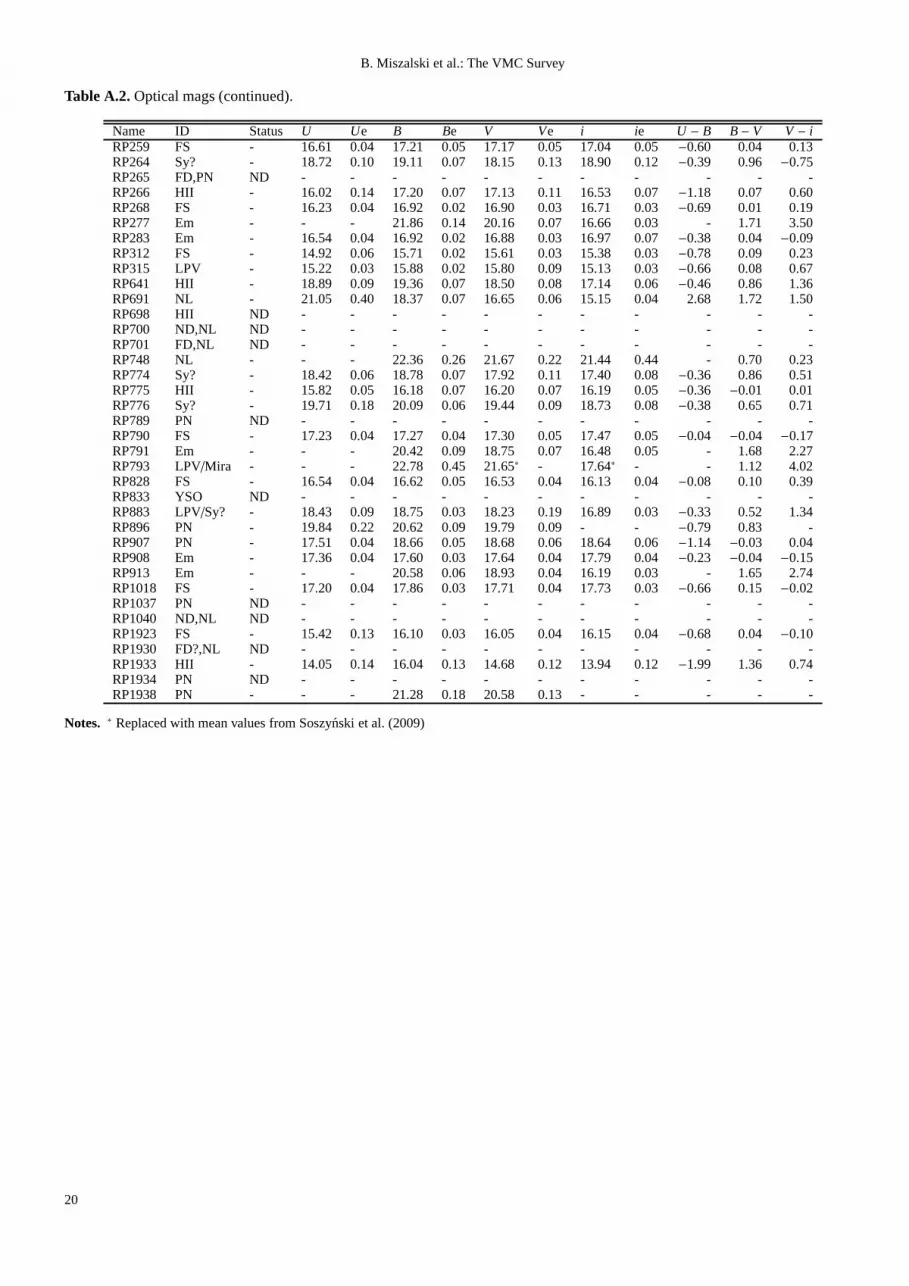
Table A.1.Optical magnitudes from Zaritsky et al. (2004).
Name ID Status U Ue B Be V Ve i ie U − B B− V V− iLM2-39 Sy? - 16.64 0.04 17.11 0.04 16.76 0.04 16.03 0.04−0.47 0.35 0.72MG12 PN - 19.09 0.15 20.90 0.10 19.78 0.08 21.05 0.22−1.81 1.11 −1.27MG13 PN - 18.11 0.16 19.67 0.11 18.75 0.04 20.04 0.13−1.56 0.92 −1.28MG16 PN NC - - - - - - - - - - -MG17 PN NC - - - - - - - - - - -MG18 PN - 20.18 0.18 20.65 0.14 20.32 0.09 - - −0.47 0.32 -MG56 PN - 19.11 0.17 19.50 0.19 19.09 0.08 18.97 0.12−0.40 0.41 0.12MG60 PN - 19.07 0.10 20.12 0.07 19.41 0.05 19.78 0.09−1.05 0.72 −0.37MG65 PN - 18.98 0.09 18.96 0.07 18.40 0.07 19.10 0.12 0.02 0.55−0.70MG68 PN - 17.62 0.13 19.07 0.10 18.44 0.08 19.41 0.10−1.45 0.63 −0.97MG73 PN - - - 21.62 0.16 20.57 0.18 - - - 1.05 -MG75 ND,PN ND - - - - - - - - - - -MG76 PN - 16.84 0.11 17.76 0.04 17.69 0.05 18.08 0.12−0.92 0.07 −0.39MG77 PN - 19.13 0.14 20.68 0.16 20.10 0.12 - - −1.56 0.58 -MNC1 PN ND - - - - - - - - - - -MNC2 PN ND - - - - - - - - - - -MNC3 PN? ND - - - - - - - - - - -MNC4 PN - 16.13 0.37 17.05 0.02 17.03 0.03 16.85 0.04−0.92 0.02 0.18Mo30 PN - 16.93 0.04 17.62 0.05 17.55 0.13 17.98 0.06−0.69 0.07 −0.43Mo32 PN ND - - - - - - - - - - -Mo34 PN ND - - - - - - - - - - -Mo36 PN - 18.82 0.11 20.62 0.16 18.96 0.16 - - −1.80 1.66 -Mo37 PN - 19.21 0.10 20.59 0.07 19.71 0.05 20.43 0.19−1.39 0.88 −0.72Mo38 PN - 19.92 0.13 20.91 0.09 19.71 0.05 21.03 0.29−0.99 1.20 −1.32Mo39 PN - 20.55 0.29 21.11 0.09 19.97 0.07 - - −0.56 1.14 -Mo42 PN - 18.64 0.10 20.54 0.26 19.19 0.11 20.13 0.10−1.90 1.35 −0.95Sa122 PN - 18.98 0.20 19.46 0.09 18.43 0.18 - - −0.48 1.03 -SMP4 PN - 18.12 0.06 18.37 0.04 17.22 0.03 19.54 0.07−0.25 1.16 −2.32SMP6 PN NC - - - - - - - - - - -SMP27 PN - 16.84 0.04 17.84 0.12 17.13 0.03 18.30 0.09−1.00 0.71 −1.17SMP30 PN - 17.17 0.06 18.65 0.05 17.37 0.05 - - −1.48 1.29 -SMP35 PN - 16.33 0.20 16.58 0.04 15.67 0.07 19.11 0.34−0.25 0.91 −3.44SMP77 PN - 15.78 0.04 16.68 0.10 16.23 0.04 16.95 0.10−0.90 0.45 −0.71SMP78 PN - 15.75 0.03 15.98 0.03 14.90 0.02 16.69 0.03−0.23 1.08 −1.79SMP82 PN - 18.07 0.06 18.50 0.04 17.50 0.05 18.62 0.06−0.43 1.00 −1.12RP135 Em? - 18.68 0.08 19.09 0.06 18.76 0.10 18.53 0.12−0.42 0.33 0.23RP142 FD?,NL ND - - - - - - - - - - -RP143 ND,NL ND - - - - - - - - - - -RP162 PN ND - - - - - - - - - - -RP163 FD,NL ND - - - - - - - - - - -RP178 NL ND - - - - - - - - - - -RP180 PN - 17.49 0.09 17.96 0.10 17.94 0.05 17.17 0.16−0.46 0.02 0.77RP182 ND,DHII ND - - - - - - - - - - -RP187 ND,DHII ND - - - - - - - - - - -RP188 ND,DHII ND - - - - - - - - - - -RP198 HII - 17.07 0.06 17.90 0.11 17.41 0.07 17.15 0.05−0.84 0.49 0.26RP202 FD,PN ND - - - - - - - - - - -RP203 ND,DHII ND - - - - - - - - - - -RP218 HII - 14.91 0.04 15.69 0.03 15.60 0.04 15.53 0.07−0.79 0.09 0.07RP219 FS - 17.52 0.09 18.04 0.04 18.02 0.25 17.67 0.05−0.52 0.02 0.35RP223 FS - 16.76 0.04 16.60 0.07 15.96 0.03 15.21 0.04 0.16 0.64 0.75RP227 LPV/Em? - - - 18.61 0.04 16.64 0.05 14.65 0.02 - 1.97 1.98RP228 FS - 19.09 0.11 19.08 0.05 18.37 0.06 17.55 0.05 0.02 0.71 0.82RP231 FS - 16.29 0.04 16.83 0.07 16.85 0.08 16.74 0.05−0.54 −0.02 0.11RP232 ND,DHII ND - - - - - - - - - - -RP234 ND,DHII ND - - - - - - - - - - -RP240 FS - 17.72 0.05 17.99 0.06 17.71 0.03 17.61 0.06−0.28 0.28 0.10RP241 FS - 17.52 0.06 17.97 0.04 17.66 0.05 17.23 0.05−0.45 0.32 0.43RP242 LPV/HII - 15.98 0.04 16.75 0.02 16.76 0.03 16.55 0.04−0.77 −0.01 0.21RP246 FS - 15.22 0.03 16.09 0.04 16.10 0.03 16.22 0.04−0.87 −0.01 −0.13RP247 HII - 17.04 0.05 17.82 0.08 17.29 0.04 16.77 0.04−0.78 0.53 0.52RP250 HII ND - - - - - - - - - - -RP251 HII - 16.43 0.04 17.21 0.05 16.95 0.05 16.90 0.05−0.78 0.26 0.05RP254 ND,DHII - 17.01 0.04 17.52 0.09 17.08 0.06 16.62 0.07−0.51 0.44 0.46RP256 HII - 15.85 0.04 16.39 0.03 16.44 0.03 16.06 0.09−0.54 −0.05 0.39
19
B. Miszalski et al.: The VMC Survey
Table A.2.Optical mags (continued).
Name ID Status U Ue B Be V Ve i ie U − B B− V V− iRP259 FS - 16.61 0.04 17.21 0.05 17.17 0.05 17.04 0.05−0.60 0.04 0.13RP264 Sy? - 18.72 0.10 19.11 0.07 18.15 0.13 18.90 0.12−0.39 0.96 −0.75RP265 FD,PN ND - - - - - - - - - - -RP266 HII - 16.02 0.14 17.20 0.07 17.13 0.11 16.53 0.07−1.18 0.07 0.60RP268 FS - 16.23 0.04 16.92 0.02 16.90 0.03 16.71 0.03−0.69 0.01 0.19RP277 Em - - - 21.86 0.14 20.16 0.07 16.66 0.03 - 1.71 3.50RP283 Em - 16.54 0.04 16.92 0.02 16.88 0.03 16.97 0.07−0.38 0.04 −0.09RP312 FS - 14.92 0.06 15.71 0.02 15.61 0.03 15.38 0.03−0.78 0.09 0.23RP315 LPV - 15.22 0.03 15.88 0.02 15.80 0.09 15.13 0.03−0.66 0.08 0.67RP641 HII - 18.89 0.09 19.36 0.07 18.50 0.08 17.14 0.06−0.46 0.86 1.36RP691 NL - 21.05 0.40 18.37 0.07 16.65 0.06 15.15 0.04 2.68 1.72 1.50RP698 HII ND - - - - - - - - - - -RP700 ND,NL ND - - - - - - - - - - -RP701 FD,NL ND - - - - - - - - - - -RP748 NL - - - 22.36 0.26 21.67 0.22 21.44 0.44 - 0.70 0.23RP774 Sy? - 18.42 0.06 18.78 0.07 17.92 0.11 17.40 0.08−0.36 0.86 0.51RP775 HII - 15.82 0.05 16.18 0.07 16.20 0.07 16.19 0.05−0.36 −0.01 0.01RP776 Sy? - 19.71 0.18 20.09 0.06 19.44 0.09 18.73 0.08−0.38 0.65 0.71RP789 PN ND - - - - - - - - - - -RP790 FS - 17.23 0.04 17.27 0.04 17.30 0.05 17.47 0.05−0.04 −0.04 −0.17RP791 Em - - - 20.42 0.09 18.75 0.07 16.48 0.05 - 1.68 2.27RP793 LPV/Mira - - - 22.78 0.45 21.65∗ - 17.64∗ - - 1.12 4.02RP828 FS - 16.54 0.04 16.62 0.05 16.53 0.04 16.13 0.04−0.08 0.10 0.39RP833 YSO ND - - - - - - - - - - -RP883 LPV/Sy? - 18.43 0.09 18.75 0.03 18.23 0.19 16.89 0.03−0.33 0.52 1.34RP896 PN - 19.84 0.22 20.62 0.09 19.79 0.09 - - −0.79 0.83 -RP907 PN - 17.51 0.04 18.66 0.05 18.68 0.06 18.64 0.06−1.14 −0.03 0.04RP908 Em - 17.36 0.04 17.60 0.03 17.64 0.04 17.79 0.04−0.23 −0.04 −0.15RP913 Em - - - 20.58 0.06 18.93 0.04 16.19 0.03 - 1.65 2.74RP1018 FS - 17.20 0.04 17.86 0.03 17.71 0.04 17.73 0.03−0.66 0.15 −0.02RP1037 PN ND - - - - - - - - - - -RP1040 ND,NL ND - - - - - - - - - - -RP1923 FS - 15.42 0.13 16.10 0.03 16.05 0.04 16.15 0.04−0.68 0.04 −0.10RP1930 FD?,NL ND - - - - - - - - - - -RP1933 HII - 14.05 0.14 16.04 0.13 14.68 0.12 13.94 0.12−1.99 1.36 0.74RP1934 PN ND - - - - - - - - - - -RP1938 PN - - - 21.28 0.18 20.58 0.13 - - - - -
Notes. ∗ Replaced with mean values from Soszynski et al. (2009)
20

B. Miszalski et al.: The VMC Survey
Table A.3.VMC magnitudes.
Name ID Class Aperture Y Ye J Je Ks Kse J − Ks Y− JLM2-39 Sy? −1 AperMag3 15.90 0.01 15.31 0.01 13.04 0.01 2.28 0.58MG12 PN 1 NoAperCorr3 20.82 0.20 20.57 0.20 19.11 0.20 1.45 0.26MG13 PN 1 NoAperCorr4 19.86 0.20 19.66 0.20 19.01 0.20 0.65 0.20MG16 PN 1 NoAperCorr6 18.90 0.20 18.57 0.20 17.04 0.20 1.53 0.33MG17 PN −1 AperMag3 19.95 0.05 19.82 0.07 18.97 0.09 0.85 0.13MG18 PN 1 NoAperCorr4 20.53 0.20 20.53 0.20 19.89 0.20 0.64 0.01MG56 PN 1 NoAperCorr3 19.21 0.20 19.07 0.20 18.83 0.20 0.24 0.15MG60 PN 1 NoAperCorr4 19.63 0.20 19.26 0.20 17.74 0.20 1.53 0.36MG65 PN 1 2.5′′ 19.29 0.20 18.58 0.20 17.73 0.20 0.85 0.71MG68 PN 1 NoAperCorr4 19.27 0.20 18.59 0.20 17.58 0.20 1.01 0.68MG73 PN - 2.1′′ 20.28 0.20 19.97 0.20 18.91 0.20 1.06 0.31MG75 ND,PN - - - - - - - - - -MG76 PN −1 AperMag3 18.29 0.03 18.12 0.04 17.67 0.04 0.45 0.17MG77 PN - 3.3′′ 20.68 0.20 20.53 0.20 18.51 0.20 2.02 0.15MNC1 PN - 2.8′′ 20.30 0.20 19.66 0.20 18.74 0.20 0.92 0.64MNC2 PN 1 2.4′′ 20.55 0.20 20.11 0.20 18.75 0.20 1.36 0.44MNC3 PN? - - - - - - - - - -MNC4 PN −1 AperMag3 16.68 0.01 16.31 0.01 14.15 0.01 2.16 0.36Mo30 PN 1 NoAperCorr3 18.43 0.20 18.36 0.20 18.52 0.20−0.17 0.08Mo32 PN - 2.3′′ 19.82 0.20 19.41 0.20 18.14 0.20 1.27 0.41Mo34 PN - 1.8′′ 19.37 0.20 19.13 0.20 17.85 0.20 1.28 0.24Mo36 PN - 1.5′′ 20.26 0.20 20.04 0.20 19.19 0.20 0.85 0.22Mo37 PN 1 3.2′′ 20.09 0.20 19.18 0.20 17.68 0.20 1.50 0.91Mo38 PN 1 3.3′′ 19.96 0.20 19.47 0.20 17.60 0.20 1.87 0.49Mo39 PN 1 NoAperCorr4 20.11 0.20 20.02 0.20 17.74 0.20 2.27 0.09Mo42 PN 1 NoAperCorr6 19.23 0.20 19.13 0.20 17.27 0.20 1.85 0.11Sa122 PN - 2.5′′ 19.54 0.20 19.31 0.20 18.58 0.20 0.73 0.23SMP4 PN 1 NoAperCorr6 18.83 0.20 18.56 0.20 17.06 0.20 1.51 0.26SMP6 PN −1 AperMag3 17.00 0.01 16.39 0.01 14.94 0.01 1.45 0.61SMP27 PN −1 AperMag3 18.22 0.02 17.99 0.02 17.42 0.03 0.57 0.23SMP30 PN 1 NoAperCorr6 18.36 0.20 18.22 0.20 16.80 0.20 1.42 0.14SMP35 PN 1 NoAperCorr6 17.36 0.20 17.02 0.20 16.32 0.20 0.71 0.34SMP77 PN −1 AperMag3 16.83 0.01 16.27 0.01 15.01 0.01 1.25 0.56SMP78 PN −1 AperMag3 16.22 0.01 15.90 0.01 14.85 0.01 1.05 0.32SMP82 PN −1 AperMag3 17.81 0.03 17.75 0.04 16.70 0.03 1.05 0.05RP135 Em? 1 AperMag3 18.60 0.04 18.23 0.04 18.03 0.06 0.20 0.36RP142 FD?,NL - - - - - - - - - -RP143 ND,NL - - - - - - - - - -RP162 PN 1 NoAperCorr4 18.29 0.20 17.79 0.20 17.07 0.20 0.72 0.50RP163 FD,NL - - - - - - - - - -RP178 NL - - - - - - - - - -RP180 PN - 1.4′′ 19.03 0.20 18.64 0.20 18.38 0.20 0.26 0.39RP182 ND,DHII - - - - - - - - - -RP187 ND,DHII - - - - - - - - - -RP188 ND,DHII - - - - - - - - - -RP198 HII 1 AperMag3 17.08 0.01 16.81 0.01 16.59 0.02 0.22 0.27RP202 FD,PN - - - - - - - - - -RP203 ND,DHII - - - - - - - - - -RP218 HII −1 AperMag3 15.83 0.01 15.73 0.01 15.66 0.01 0.07 0.10RP219 FS −1 AperMag3 17.68 0.02 17.49 0.02 17.21 0.03 0.28 0.19RP223 FS −1 AperMag3 14.84 0.01 14.49 0.01 14.08 0.01 0.40 0.35RP227 LPV/Em? −1 AperMag3 13.99 0.01 13.27 0.01 12.17 0.01 1.09 0.72RP228 FS −2 AperMag3 17.53 0.02 17.22 0.02 16.76 0.02 0.46 0.31RP231 FS −1 AperMag3 16.79 0.01 16.53 0.01 16.19 0.01 0.35 0.25RP232 ND,DHII - - - - - - - - - -RP234 ND,DHII - - - - - - - - - -RP240 FS −1 AperMag3 17.16 0.01 16.91 0.01 16.35 0.01 0.56 0.26RP241 FS 1 AperMag3 16.99 0.01 16.68 0.01 16.19 0.01 0.49 0.31RP242 LPV/HII −1 AperMag3 16.52 0.01 16.24 0.01 15.81 0.01 0.42 0.28RP246 FS −1 AperMag3 16.30 0.01 16.24 0.01 16.32 0.02−0.07 0.05RP247 HII −1 AperMag3 16.69 0.01 16.41 0.01 16.12 0.01 0.28 0.28RP250 HII - - - - - - - - - -RP251 HII −1 AperMag3 16.85 0.01 16.67 0.01 16.51 0.01 0.17 0.18RP254 ND,DHII −1 AperMag3 16.38 0.01 16.12 0.01 16.45 0.01−0.33 0.26RP256 HII −1 AperMag3 16.71 0.01 16.65 0.01 16.68 0.02−0.03 0.06
21

B. Miszalski et al.: The VMC Survey
Table A.4.VMC magnitudes (continued).
Name ID Class Aperture Y Ye J Je Ks Kse J − Ks Y− JRP259 FS −1 AperMag3 17.21 0.01 17.00 0.02 16.66 0.02 0.34 0.22RP264 Sy? 1 AperMag3 17.32 0.01 16.30 0.01 12.88 0.01 3.42 1.03RP265 FD,PN - - - - - - - - - -RP266 HII 1 AperMag3 16.57 0.01 16.17 0.01 15.59 0.01 0.58 0.40RP268 FS −1 AperMag3 16.76 0.01 16.55 0.01 16.26 0.01 0.30 0.21RP277 Em −1 AperMag3 15.61 0.01 14.91 0.01 14.12 0.01 0.79 0.70RP283 Em −1 AperMag3 16.78 0.01 16.57 0.01 16.07 0.01 0.50 0.21RP312 FS −1 AperMag3 15.36 0.01 15.11 0.01 14.72 0.01 0.39 0.25RP315 LPV −1 AperMag3 16.09 0.01 15.97 0.01 15.82 0.01 0.14 0.12RP641 HII 1 AperMag3 16.84 0.01 16.24 0.01 15.42 0.01 0.82 0.59RP691 NL −1 AperMag3 14.50 0.01 13.86 0.01 12.86 0.01 1.00 0.65RP698 HII - - - - - - - - - -RP700 ND,NL - - - - - - - - - -RP701 FD,NL - - - - - - - - - -RP748 NL - 2.6′′ 20.06 0.20 19.55 0.20 18.73 0.20 0.82 0.51RP774 Sy? 1 NoAperCorr4 17.55 0.20 16.75 0.20 14.52 0.20 2.230.79RP775 HII 1 NoAperCorr6 15.83 0.20 15.34 0.20 14.46 0.20 0.880.48RP776 Sy? 1 NoAperCorr6 17.92 0.20 17.09 0.20 14.80 0.20 2.290.83RP789 PN - ell(1.68,3.64)′′ 19.90 0.20 19.92 0.20 19.51 0.20 0.41−0.02RP790 FS −1 AperMag3 17.23 0.01 17.07 0.02 16.72 0.02 0.35 0.15RP791 Em −1 AperMag3 15.79 0.01 15.18 0.01 14.33 0.01 0.85 0.61RP793 LPV/Mira −1 AperMag3 17.34 0.01 15.72 0.01 11.64 0.01 4.08 1.62RP828 FS −1 AperMag3 15.74 0.01 15.38 0.01 14.81 0.01 0.58 0.36RP833 YSO 1 2.4′′ 20.83 0.20 19.56 0.20 17.73 0.20 1.83 1.27RP883 LPV/Sy? −1 AperMag3 16.66 0.01 15.81 0.01 13.01 0.01 2.80 0.85RP896 PN 1 3.8′′ 19.79 0.20 19.34 0.20 17.98 0.20 1.36 0.45RP907 PN −1 AperMag3 18.77 0.04 18.21 0.03 17.05 0.02 1.16 0.56RP908 Em −1 AperMag3 17.66 0.01 17.41 0.02 16.87 0.02 0.54 0.24RP913 Em −1 AperMag3 15.36 0.01 14.74 0.01 14.02 0.01 0.72 0.62RP1018 FS −1 AperMag3 17.65 0.01 17.48 0.01 17.25 0.02 0.23 0.18RP1037 PN 1 2.7′′ 20.47 0.20 20.28 0.20 18.50 0.20 1.78 0.19RP1040 ND,NL - - - - - - - - - -RP1923 FS −1 AperMag3 16.13 0.01 16.16 0.01 16.11 0.01 0.05−0.02RP1930 FD?,NL - - - - - - - - - -RP1933 HII 1 NoAperCorr6 15.01 0.20 14.50 0.20 13.41 0.20 1.09 0.51RP1934 PN 1 NoAperCorr4 20.69 0.20 20.62 0.20 19.45 0.20 1.170.07RP1938 PN - 2.5′′ 21.11 0.20 21.09 0.20 20.21 0.20 0.88 0.02
22

B. Miszalski et al.: The VMC Survey
Table A.5.SAGE MIR magnitudes.
Name ID IRAC MIPS J − Ks [3.6] [3.6]e [4.5] [4.5]e [5.8] [5.8]e [8.0] [8.0]e [24] [24]eLM2-39 Sy? CAT CAT 2.28 10.11 0.05 8.76 0.03 7.71 0.02 6.39 0.03 2.75 0.01MG12 PN AP AP 1.45 18.94 0.25 17.39 0.25 - - 16.02 0.35 11.77 0.40MG13 PN AP AP 0.65 18.53 0.25 17.53 0.25 - - 15.09 0.35 10.79 0.40MG16 PN AP AP 1.53 16.68 0.25 15.75 0.25 15.40 0.30 13.99 0.35 10.73 0.40MG17 PN AP AP 0.85 17.17 0.25 16.55 0.25 14.81 0.30 13.55 0.35 8.36 0.40MG18 PN AP AP 0.64 19.08 0.25 - - - - - - 10.79 0.40MG56 PN ND ND 0.24 - - - - - - - - - -MG60 PN AP AP 1.53 16.53 0.25 15.87 0.25 14.97 0.30 13.42 0.35 10.45 0.40MG65 PN AP AP 0.85 16.29 0.25 14.67 0.25 15.61 0.30 14.04 0.35 7.33 0.40MG68 PN AP AP 1.01 16.35 0.25 15.69 0.25 14.71 0.30 13.13 0.35 8.09 0.40MG73 PN ND ND 1.06 - - - - - - - - - -MG75 ND,PN ND ND - - - - - - - - - - -MG76 PN AP AP 0.45 16.76 0.25 16.01 0.25 15.52 0.30 13.84 0.35 8.36 0.40MG77 PN AP AP 2.02 17.53 0.25 16.27 0.25 15.10 0.30 13.33 0.35 10.77 0.40MNC1 PN AP AP 0.92 17.02 0.25 16.37 0.25 14.85 0.30 13.22 0.35 9.68 0.40MNC2 PN AP AP 1.36 17.43 0.25 16.65 0.25 15.55 0.30 13.34 0.35 10.86 0.40MNC3 PN? ND ND - - - - - - - - - - -MNC4 PN AP CAT 2.16 11.94 0.25 11.15 0.25 9.76 0.30 7.68 0.35 3.85 0.01Mo30 PN ND AP −0.17 - - - - - - - - 10.24 0.40Mo32 PN AP AP 1.27 - - 16.51 0.25 15.16 0.30 14.45 0.35 11.30 0.40Mo34 PN AP AP 1.28 - - - - - - 13.81 0.35 9.79 0.40Mo36 PN ND AP 0.85 - - - - - - - - 9.70 0.40Mo37 PN AP ND? 1.50 16.68 0.25 15.62 0.25 14.20 0.30 12.97 0.35 - -Mo38 PN AP AP 1.87 16.55 0.25 15.69 0.25 14.40 0.30 13.73 0.35 10.85 0.40Mo39 PN AP AP 2.27 17.01 0.25 15.83 0.25 15.30 0.30 13.96 0.35 11.02 0.40Mo42 PN AP AP 1.85 16.75 0.25 15.68 0.25 14.61 0.30 13.60 0.35 9.48 0.40Sa122 PN AP AP 0.73 17.37 0.25 15.78 0.25 16.17 0.30 15.75 0.357.99 0.40SMP4 PN NC NC 1.51 - - - - - - - - - -SMP6 PN NC NC 1.45 - - - - - - - - - -SMP27 PN AP AP 0.57 16.22 0.25 15.36 0.25 14.60 0.30 12.80 0.357.03 0.40SMP30 PN AP AP 1.42 16.46 0.25 15.27 0.25 14.46 0.30 13.64 0.358.51 0.40SMP35 PN AP AP 0.71 15.34 0.25 14.29 0.25 13.75 0.30 12.70 0.356.96 0.40SMP77 PN AP AP 1.25 13.19 0.25 12.32 0.25 11.57 0.30 9.94 0.35 6.05 0.40SMP78 PN AP AP 1.05 12.82 0.25 12.01 0.25 10.39 0.30 8.47 0.35 4.18 0.40SMP82 PN AP AP 1.05 15.65 0.25 14.36 0.25 13.44 0.30 11.74 0.355.57 0.40RP135 Em? ND ND 0.20 - - - - - - - - - -RP142 FD?,NL ND ND - - - - - - - - - - -RP143 ND,NL ND ND - - - - - - - - - - -RP162 PN AP ND 0.72 16.42 0.25 15.99 0.25 15.23 0.30 14.44 0.35 - -RP163 FD,NL ND ND - - - - - - - - - - -RP178 NL AP AP - - - 16.40 0.25 16.27 0.30 14.71 0.35 10.62 0.40RP180 PN CAT AP 0.26 15.70 0.07 16.36 0.16 13.94 0.06 12.24 0.06 8.55 0.40RP182 ND,DHII ND ND - - - - - - - - - - -RP187 ND,DHII ND ND - - - - - - - - - - -RP188 ND,DHII ND ND - - - - - - - - - - -RP198 HII AP AP 0.22 15.35 0.25 14.49 0.25 13.57 0.30 11.85 0.35 6.53 0.40RP202 FD,PN ND ND - - - - - - - - - - -RP203 ND,DHII ND ND - - - - - - - - - - -RP218 HII AP AP 0.07 15.61 0.25 15.24 0.25 15.50 0.30 13.90 0.35 6.67 0.40RP219 FS ND ND 0.28 - - - - - - - - - -RP223 FS CAT ND 0.40 13.92 0.04 13.88 0.05 14.22 0.11 - - - -RP227 LPV/Em? CAT ND 1.09 12.00 0.04 12.18 0.04 12.03 0.04 11.91 0.04 - -RP228 FS CAT ND 0.46 16.04 0.07 15.83 0.05 - - - - - -RP231 FS CAT ND 0.35 15.66 0.05 15.49 0.06 - - - - - -RP232 ND,DHII ND ND - - - - - - - - - - -RP234 ND,DHII ND ND - - - - - - - - - - -RP240 FS AP ND 0.56 15.80 0.25 15.41 0.25 15.26 0.30 - - - -RP241 FS ND ND 0.49 - - - - - - - - - -RP242 LPV/HII AP AP 0.42 15.15 0.25 14.66 0.25 14.39 0.30 13.92 0.35 8.230.40RP246 FS ND ND −0.07 - - - - - - - - - -RP247 HII CAT AP 0.28 16.00 0.09 15.27 0.11 - - - - 7.70 0.40RP250 HII ND ND - - - - - - - - - - -RP251 HII AP AP 0.17 16.06 0.25 15.37 0.25 - - - - 7.39 0.40RP254 ND,DHII EX AP −0.33 - - - - - - - - 6.06 0.40RP256 HII AP AP −0.03 17.09 0.25 16.76 0.25 - - - - 7.58 0.40
23
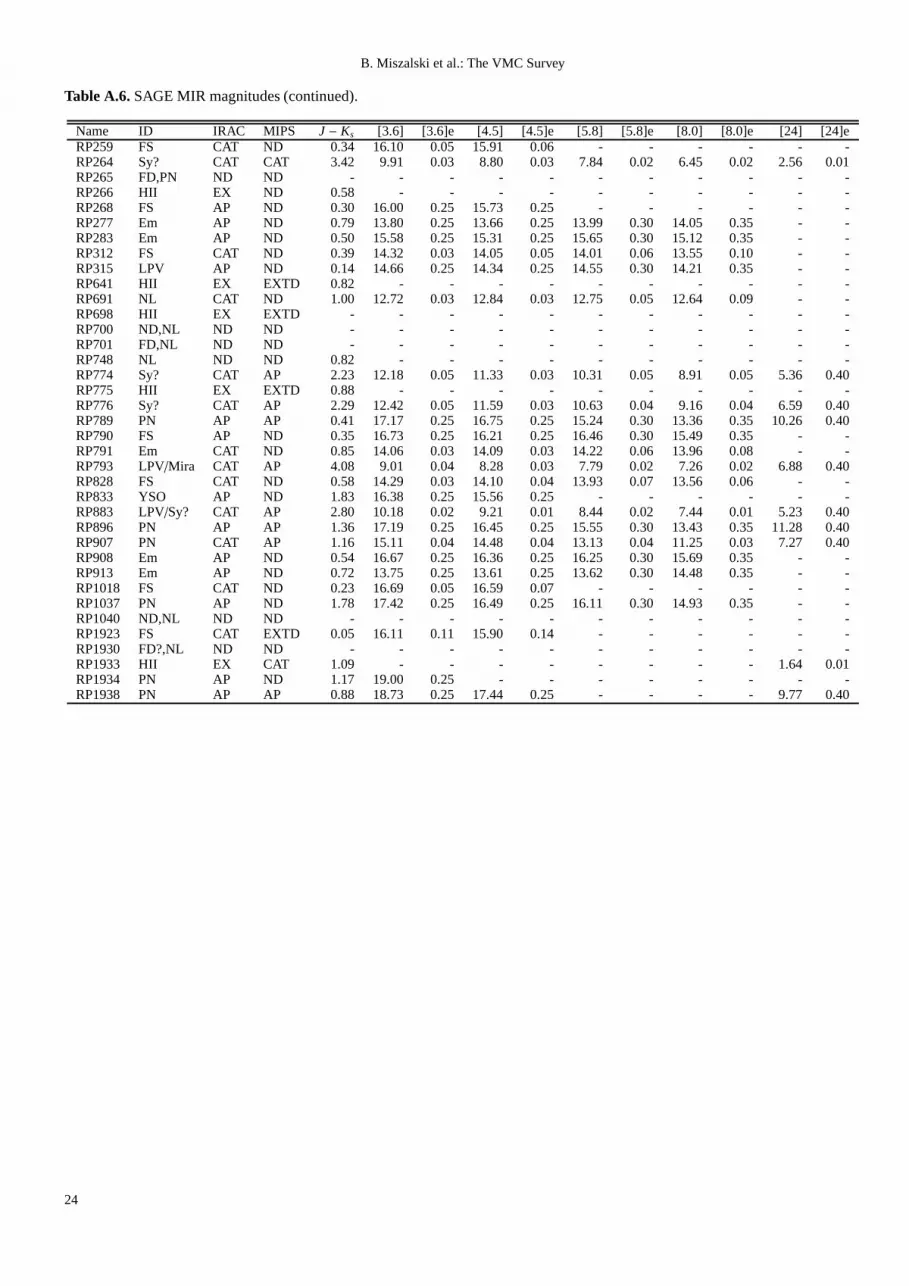
B. Miszalski et al.: The VMC Survey
Table A.6.SAGE MIR magnitudes (continued).
Name ID IRAC MIPS J − Ks [3.6] [3.6]e [4.5] [4.5]e [5.8] [5.8]e [8.0] [8.0]e [24] [24]eRP259 FS CAT ND 0.34 16.10 0.05 15.91 0.06 - - - - - -RP264 Sy? CAT CAT 3.42 9.91 0.03 8.80 0.03 7.84 0.02 6.45 0.02 2.56 0.01RP265 FD,PN ND ND - - - - - - - - - - -RP266 HII EX ND 0.58 - - - - - - - - - -RP268 FS AP ND 0.30 16.00 0.25 15.73 0.25 - - - - - -RP277 Em AP ND 0.79 13.80 0.25 13.66 0.25 13.99 0.30 14.05 0.35 - -RP283 Em AP ND 0.50 15.58 0.25 15.31 0.25 15.65 0.30 15.12 0.35 - -RP312 FS CAT ND 0.39 14.32 0.03 14.05 0.05 14.01 0.06 13.55 0.10 - -RP315 LPV AP ND 0.14 14.66 0.25 14.34 0.25 14.55 0.30 14.21 0.35 - -RP641 HII EX EXTD 0.82 - - - - - - - - - -RP691 NL CAT ND 1.00 12.72 0.03 12.84 0.03 12.75 0.05 12.64 0.09 - -RP698 HII EX EXTD - - - - - - - - - - -RP700 ND,NL ND ND - - - - - - - - - - -RP701 FD,NL ND ND - - - - - - - - - - -RP748 NL ND ND 0.82 - - - - - - - - - -RP774 Sy? CAT AP 2.23 12.18 0.05 11.33 0.03 10.31 0.05 8.91 0.05 5.36 0.40RP775 HII EX EXTD 0.88 - - - - - - - - - -RP776 Sy? CAT AP 2.29 12.42 0.05 11.59 0.03 10.63 0.04 9.16 0.04 6.59 0.40RP789 PN AP AP 0.41 17.17 0.25 16.75 0.25 15.24 0.30 13.36 0.3510.26 0.40RP790 FS AP ND 0.35 16.73 0.25 16.21 0.25 16.46 0.30 15.49 0.35 - -RP791 Em CAT ND 0.85 14.06 0.03 14.09 0.03 14.22 0.06 13.96 0.08 - -RP793 LPV/Mira CAT AP 4.08 9.01 0.04 8.28 0.03 7.79 0.02 7.26 0.02 6.88 0.40RP828 FS CAT ND 0.58 14.29 0.03 14.10 0.04 13.93 0.07 13.56 0.06 - -RP833 YSO AP ND 1.83 16.38 0.25 15.56 0.25 - - - - - -RP883 LPV/Sy? CAT AP 2.80 10.18 0.02 9.21 0.01 8.44 0.02 7.44 0.01 5.23 0.40RP896 PN AP AP 1.36 17.19 0.25 16.45 0.25 15.55 0.30 13.43 0.3511.28 0.40RP907 PN CAT AP 1.16 15.11 0.04 14.48 0.04 13.13 0.04 11.25 0.03 7.27 0.40RP908 Em AP ND 0.54 16.67 0.25 16.36 0.25 16.25 0.30 15.69 0.35 - -RP913 Em AP ND 0.72 13.75 0.25 13.61 0.25 13.62 0.30 14.48 0.35 - -RP1018 FS CAT ND 0.23 16.69 0.05 16.59 0.07 - - - - - -RP1037 PN AP ND 1.78 17.42 0.25 16.49 0.25 16.11 0.30 14.93 0.35 - -RP1040 ND,NL ND ND - - - - - - - - - - -RP1923 FS CAT EXTD 0.05 16.11 0.11 15.90 0.14 - - - - - -RP1930 FD?,NL ND ND - - - - - - - - - - -RP1933 HII EX CAT 1.09 - - - - - - - - 1.64 0.01RP1934 PN AP ND 1.17 19.00 0.25 - - - - - - - -RP1938 PN AP AP 0.88 18.73 0.25 17.44 0.25 - - - - 9.77 0.40
24

B. Miszalski et al.: The VMC Survey
Appendix B: Images
We present colour-composite images for our sample in two setsof figures. Figures B.1–B.10 contain the VMC images madefrom stackedKs (red),J (green) andY (blue) images, WFI im-ages made from either Hα (red), [O III] (green) andB (blue) im-ages or for objects in Tab. 4 Hα (red), MB 485/31 or MB 604/21(green) and [O III] (blue), andSpitzerSAGE images made from[5.8] (red), [4.5] (green) and [3.6] (blue) images. FiguresB.11–B.14 contain VMC and SAGE images for objects lacking ESOWFI coverage.
In each set of figures the objects are ordered following Tab.2. VMC images include circles with the RP2006b measured Hαradius. Depending on the ratio of Hα to [O III] emission, PNemay appear red as in RP265 (no [O III] indicative of a coolCSPN), yellow as in MG60 (Hα/[O III] ∼1) or green as in SMP78([O III] >Hα). Exceptions include MG76, where [O III] was re-placed byV due to missing coverage, and objects in Tab. 4, inwhich case PNe may appear red (Hα only) or pink ([O III] andHα).
25

B. Miszalski et al.: The VMC Survey
Fig. B.1. (left column) VMC Ks (red),J (green) andY (blue) colour-composite; (middle column)SpitzerSAGE [5.8] (red), [4.5](green) and [3.6] (blue); (right column) Optical Hα (red), [O III] (green) andB (blue) excluding MG76 and objects in Tab. 4 whichare Hα (red), continuum (green) and [O III] (blue). Each image is 30×30 arcsec2 with North up and East to left.
Fig. B.2.Figure B.1 (continued).
Fig. B.3.Figure B.2 (continued).
Fig. B.4.Figure B.3 (continued).
Fig. B.5.Figure B.4 (continued).
Fig. B.6.Figure B.5 (continued).
Fig. B.7.Figure B.6 (continued).
Fig. B.8.Figure B.7 (continued).
Fig. B.9.Figure B.8 (continued).
Fig. B.10.Figure B.9 (continued).
26

B. Miszalski et al.: The VMC Survey
Fig. B.11. Similar to Fig. B.1 but for objects without WFI coverage in two sets of two columns: (left columns) VMC colour-composite; (right columns) SAGE colour-composite. SMP 4 and SMP 6 have no SAGE coverage.
Fig. B.12.Figure B.11 (continued).
Fig. B.13.Figure B.12 (continued).
Fig. B.14.Figure B.13 (continued).
27