the use of hydrogen peroxide for preservation
TRANSCRIPT
THE USE OF HYDROGEN PEROXIDE FOR PRESERVATION OF RAW MILK
By Suzan Hamid Elamin
B.Sc. (Agric.) University of Khartoum
(September 2001)
A dissertation Submitted to the University of Khartoum in Partial Fulfillment of the Requirement for the
Degree of Master of Science in Food Science and Technology
Supervisor Dr. Nabila El Amir Yousif
Department of Food Science and Technology Faculty of Agriculture
University of Khartoum
May 2005

II
DEDICATION
To my Family with Love
III
ACKNOWLEDGEMENT
I am very proud to have the opportunity to express my thanks in
the first to Allah who blessed me and gave me the power to complete
this work.
Also I would like to express my gratitude's to my Supervisor Dr.
Nabila El Amir Yousif for her advice and guidance throughout the
research process and for her help during preparation of this
dissertation.
Also I would like to express my gratitude to members of the Food
Science and Technology Department and my special thanks to all
friends who assisted me in any way.
IV
ABSTRACT
This investigation was carried out to study the effect of hydrogen
peroxide on lengthening the shelf-life of raw milk. The milk samples
were obtained from the University of Khartoum Farm, Shambat
Farm and the Animal Production Research Centre Farm. The milk
samples were preserved using hydrogen peroxide (H2O2)
concentrations of 0.01 to 0.06% (30% w/v) . One sample was kept
without H2O2 and used as control sample, at room temperature
20±7oC
The titratable acidity, fat content, protein content, beside ascorbic
acid, potassium iodide test and methylene blue test were measured
for all samples before preservation and then regularly at 6 hours
interval for 24 hours.
Results indicated an insignificant (P≤0.0.1) development in the
acidity (expressed as lactic acid percentage) of samples treated with
H2O2 at concentrations of 0.04 to 0.06%. After 6 hours of storage
the milk samples treated with 0.02 and 0.03% H2O2 showed a
gradual increase in lactic acid, while 0.01% H2O2 treated milk
samples gave result, similar to the control.
Hydrogen peroxide treatment has slightly affected the protein
content of milk. The results, however, showed the higher
concentrations of hydrogen peroxide (0.04%, 0.05% and 0.06%)
V
significantly (P≤0.0.1) decreased the protein content compared to
the
other samples. Hydrogen peroxide treatment also has a destructive
effect on ascorbic acid.
The results indicated that fat of milk was not affected by hydrogen
peroxide treatment of milk. Also the results indicated that colour
reduction time of methylene blue of untreated milk samples were
shorter than H2O2 treated milk samples.
It can be concluded from these results that H2O2 added to milk at
a rate of 0.05% is a good preservative for raw milk and for up to 24
hour during transportation from production areas to consumption
areas without being subjected to deterioration under ambient
temperature prevailing in the sudan.
VI
بسم اهللا الرحمن الرحيم
خالصة اإلطروحة
في إطالة مدة حفظ (H2O2)أجري هذا البحث لدراسة أثر فوق أكسيد الهيدروجين
الحليب الخام من مرزعة جامعـة الخرطـوم ، م وقد أخذت عينات عينات الحليب الخا
.مزرعة شمبات ومزرعة مركز أبحاث اإلنتاج الحيواني
إلى % 0.06إلى % 0.01أضيفت مستويات مختلفة من فوق أكسيد الهيدروجين من
. 7oC±20على درجة حرارة الغرفة العينات أعاله
الحموضة الكلية ونسبة الـدهن ونـسبة في هذه الدراسة أجريت إختبارات لكل من
وإختبار البوتاسيوم وإختبار زمـن إختـزال صـبغة ) ج(البروتين باإلضافة لفيتامين
. ساعة لكل العينات24وقد أجريت اإلختبارات كل سته ساعات لمدة . الميثلين األزرق
فوق أظهرت الدراسة نتائج معنوية بالنسبة للحموضة حيث وجد أنه كلما زاد تركيز
أكسيد الهيدروجين قلت الزيادة في الحموضة وقد كان األثر واضـحاً فـي المـستويات
% 0.03و % 0.02وأما المستويات المنخفـضة %) 0.04، %0.05، %0.06(العالية
أمـا بالنـسبة . ساعات من بداية الحفظ 6فقد أظهرت زيادة متدرجة في الحموضة بعد
نتائج مشابهة للعينة التي لم يضف لها فـوق فقد أظهرت % 0.01للعينات األقل تركيز
).العينة الشاهد ( أكسيد الهيدروجين
أظهرت الدراسة أن فوق أكسيد الهيدروجين له تأثير معنوي على نسبة البروتين في
لها تـأثير % ) 0.04، % 0.05، % 0.06الحليب وأشارت النتائج أن التراكيز العالية
.ن في الحليبمعنوي في تقليل نسبة البروتي
إنخفاضاً معنوياً في العينات المعاملة بفوق أكسيد الهيـدروجين ) ج(إنخفض فتيامين
).ج(سيد الهيدروجين يحطم فيتامين كوأشارت النتائج أن فوق أ
VII
أظهرت الدراسة أن دهن الحليب ال يتأثر بإضافة فوق أكسيد الهيـدروجين وكـذلك
ثلين األزرق بالنسبة للعينات الخالية من فـوق أشارت النتائج أن زمن إختزال صبغة المي
.أكسيد الهيدروجين أقل من العينات المعاملة يفوق أكسيد الهيدروجين
فوق أكسيد الهيدروجين لحفظ الحليب % 0.05أوصت الدراسة بإستعمال التركيزات
ساعة أثناء ترحيل الحليب من مناطق اإلنتاج إلى منـاطق اإلسـتهالك تحـت 24لمدة
.ف المناخية السائدة في السودان الظرو
VIII
CONTENTS
SUBJECT PAGEDedication ………………………………………………………………..... I Acknowledgement………………………………………………………..... II Abstract ………………………………………………………………......... III Arabic abstract……………………………………………………………... V Content………………………………………………………………........... VII List of Table………………………………………………………………... IX List of Figure………………………………………………………………. XI CHAPTER ONE : INTRODUCTION……………………………………. 1 CHAPTER TWO : LITERATURE REVIEW…………………………....... 3 2-1 Importance of Mik …………………………....................................... 3 2-2 Chemical Composition of Milk……………………………………...... 4 2-3 Milk Production………………………………………………………. 5 2-3-1 Traditional Sector…………………………………………………… 5 2-3-2 Semi-Traditional Sector…………………………………….............. 5 2-3-3 The Urban Sector…………………………………………………… 6 2-4 Sources of Milk Contamination……………………………………...... 6 2-5 Types of Bacteria Found in Milk…………………………………….... 8 2-6 Control of Contamination in Milk……………………………………... 9 2-7 Treatments and Methods of Milk Preservation ……………………….. 11 2-7-1 Cooling………………………………………………………............ 11 2-7-2 Boiling ……………………………………………………….......... 12 2-7-3 Pasteurization ………………………………………………………. 13 2-7-4 Sterilization ………………………………………………………..... 14 2-7-5 Chemical Preservation………………………………………............ 14 2-7-5-1 The Use of H2O2 in Milk Preservation………………….............. 15 2-7-5-2 Physical and Chemical Properties of H2O2…………………......... 17 2-7-5-3 Concentration of H2O2……………………………………............ 17 2-7-5-4 Effect of Hydrogen Peroxide on the Protein……………………. 18 2-7-5-5 Effect of Hydrogen Peroxide on the Ascorbic Acid……………... 19 2-7-5-6 Effect of Hydrogen Peroxide on the Milk Fat…………………… 20 2-7-5-7 Effect of H2O2 on the Methylene Blue Reduction Test…………. 20 CHAPTER THREE : MATERIALS AND METHODS 21 3-1 Source of Raw Milk……………………………………....................... 21 3-2 Methods ………………………………………………………………. 21 3-3 Chemicals and Reagents……………………………………................. 21 3-3-1 Hydrogen Peroxide……………………………………..................... 21
IX
SUBJECT PAGE3-3-2 Potassium Iodide……………………………………......................... 22 3-4 Hydrogen Peroxide Concentration……………………………………. 22 3-5 Chemical Tests………………………………………………………… 22 3-5-1 Acidity……………………………………………………................. 22 3-5-2 Protein Content……………………………………………………... 23 3-5-3 Fat Content…………………………………………………….......... 24 3-5-4 Residual Hydrogen Peroxide Test …………………........................ 24 3-5-5 Ascorbic acid content ……………………….................................. 24 3-6 Biochemical Test……………………………………………………… 25 3-6-1 The Methylene Blue Reduction Test……………………………….. 25 3-7 Statistical Analysis……………………………………………………. 26 CHAPTER FOUR : RESULTS AND DISCUSSION 27 4-1 Acidity…………………………………………………….................... 27 4-2 Protein Content……………………………………………………..... 29 4-3 Ascorbic Acid Content………………………………………………. 34 4-4 Fat Content……………………………………………………............ 38 4-5 Methylene Blue Reduction Test………………………………………. 45 4-6 Residual H2O2 Test ………………………………………………….. 46 Conclusion and Recommendation ………………………………………… 55 References ……………………………………………………………….. 56
LIST OF TABLES
TABLE PAGE1. Composition of cow's milk …………………………………... 4
X
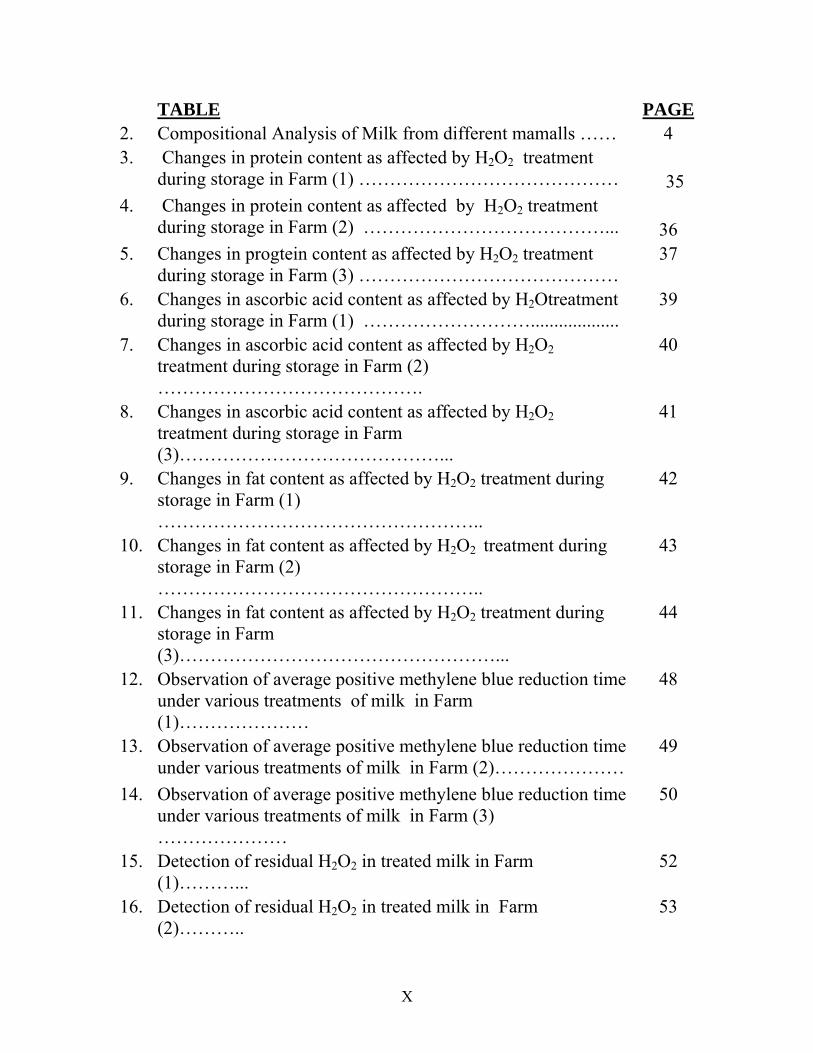
TABLE PAGE2. Compositional Analysis of Milk from different mamalls …… 4 3. Changes in protein content as affected by H2O2 treatment
during storage in Farm (1) …………………………………… 35
4. Changes in protein content as affected by H2O2 treatment during storage in Farm (2) …………………………………...
36
5. Changes in progtein content as affected by H2O2 treatment during storage in Farm (3) ……………………………………
37
6. Changes in ascorbic acid content as affected by H2Otreatment during storage in Farm (1) ………………………...................
39
7. Changes in ascorbic acid content as affected by H2O2 treatment during storage in Farm (2) …………………………………….
40
8. Changes in ascorbic acid content as affected by H2O2 treatment during storage in Farm (3)……………………………………...
41
9. Changes in fat content as affected by H2O2 treatment during storage in Farm (1) ……………………………………………..
42
10. Changes in fat content as affected by H2O2 treatment during storage in Farm (2) ……………………………………………..
43
11. Changes in fat content as affected by H2O2 treatment during storage in Farm (3)……………………………………………...
44
12. Observation of average positive methylene blue reduction time under various treatments of milk in Farm (1)…………………
48
13. Observation of average positive methylene blue reduction time under various treatments of milk in Farm (2)…………………
49
14. Observation of average positive methylene blue reduction time under various treatments of milk in Farm (3) …………………
50
15. Detection of residual H2O2 in treated milk in Farm (1)………...
52
16. Detection of residual H2O2 in treated milk in Farm (2)………..
53
XI
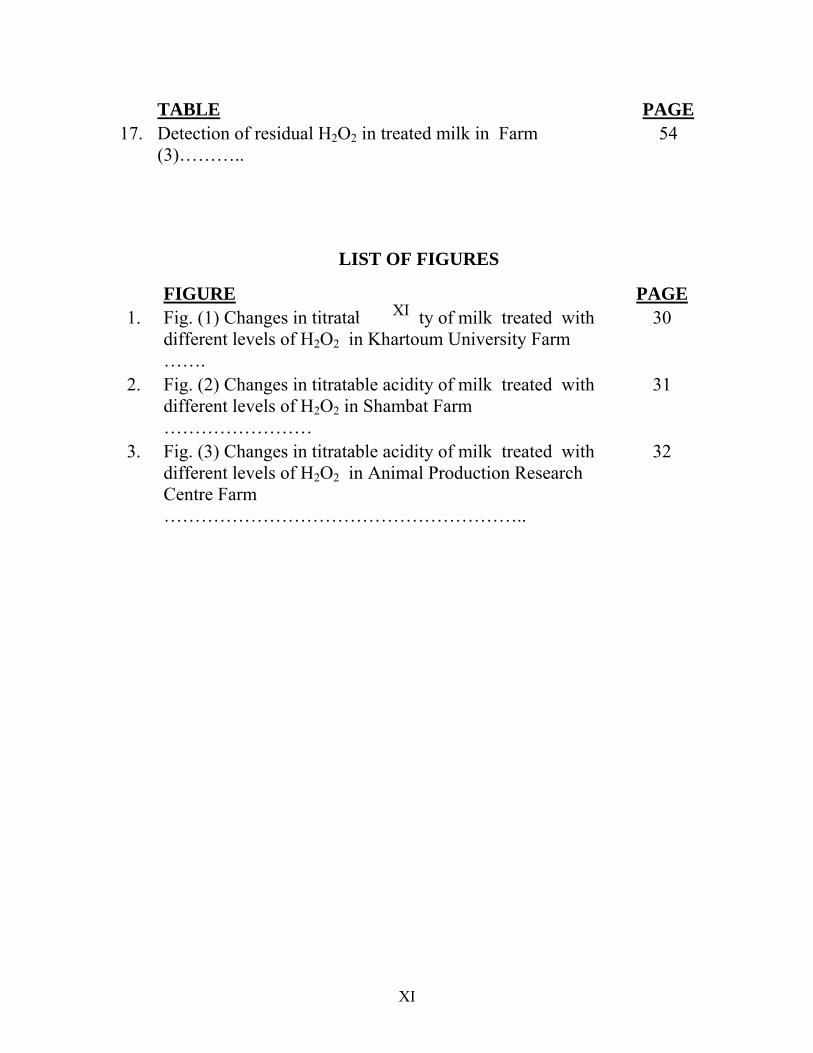
TABLE PAGE17. Detection of residual H2O2 in treated milk in Farm
(3)……….. 54
LIST OF FIGURES
FIGURE PAGE 1. Fig. (1) Changes in titratable acidity of milk treated with
different levels of H2O2 in Khartoum University Farm …….
30
2. Fig. (2) Changes in titratable acidity of milk treated with different levels of H2O2 in Shambat Farm ……………………
31
3. Fig. (3) Changes in titratable acidity of milk treated with different levels of H2O2 in Animal Production Research Centre Farm …………………………………………………..
32
XI
INTRODUCTION
Sudan's milk production for the year 2001 is estimated (FAO, 2002) at just over 7 million tons (MT) of which 37% was available for human consumption, about 60% of production was suckled by the young stock while about 3% went to waste, mainly because of high ambient temperatures and inefficient handling Elsewhere, individual farmers make their own arrangements for delivery and transport of their milk, (FAO, 2002).
To transport milk, farmers use donkeys, donkey-tracted carts and pick-up trucks depending upon availability, cost and the distances involved. Typically, donkeys are used for distances up to 5-7 kilometers (kms); donkey, carts for longer distances of 15 to 20 kms, and pick-up trucks for longer distances. There are no refrigerated or cooled transportation facilities which are necessary in a hot climate like that of the Sudan. As a result, after several hours, the milk goes bad. It is estimated that in remote areas milk losses due to poor transportation and distribution facilities, could be as high as 10% (FAO, 2002). In Sudan, apart from the Gezira Co-operative milk shed, there is no organized system for milk collection and transportation.
Such problems are compounded by presence of bad roads and the bacterial growth in raw milk resulting from absence of sanitary methods of milk production and subsequent handling. Refrigeration, suggested to overcome these problems (Luck, 1956), the first methods are usually economically not feasible with chemical preservation being the method of choice.
2
Hydrogen peroxide is non-toxic preservative, and can easily be
removed without any residue. It is also cheap and it decomposes to
oxygen and water by the added catalase produced by milk normal
microflora (Dirar, 1975). (FAO, 1957) recommended the use of
hydrogen peroxide in low concentrations (0.01 – 0.08%), in warm
climates in less developed countries.
By using hydrogen peroxide as a preservative large quantities of
milk produced in the production areas can be transported to industrial
areas and thereby reducing the losses due to poor transportation.
Objectives :
This study is an attempt to check the possibility of using H2O2 for
preserving milk at ambient temperature prevailing in Sudan.
3
LITERATURE REVIEW
2.1 Importance of Milk :
Milk is a fluid secreted by female mammals to provide food for their offspring from the time of birth until they are able to feed for themselves. (Foley, et .al. 1974). Federal definition of U.S.A. " Milk is the fresh, clean lacteal secretion obtained by the complete milking of one or more healthy cows, properly fed and kept excluding that obtained with fifteen days before and ten days after calving and containing not less than 8.5% solids not fat and not less than 3.25% of milk fat "(Rai and Phil 1980).
Milk is as ancient as mankind itself, as it is the substance created to feed the mammalian infant. All species of mammals from man to whales, produce milk for this purpose (Douglas, 1995). Milk and milk products provide significant amount of protein and most micronutrients, including calcium, B. group vitamin (particularly riboflavin and B12 but also thiamin, niacin, B6), vitamin A, iodine, Magnesium, phosphorus, potassium and zinc. (Anita, 2001). Milk and dairy foods can increase the nutrient density of the diet and play a pivotal role in ensuring that dietary intake are nutritionally adequate. They can also help to improve bone and dental health and possibly protect against hypertension and colon cancer (Anita, 2001). Milk is the only food that provides a well balanced array of essential nutrients including protein, fat, carbohydrates, vitamins and minerals in the form which is palatables, digestible and sanitary.
4
Milk thus deserves recognition as whole meal and "perfect food". Man consumes milk from different sources such as cows, goats, sheeps, mares and reindeer (Kordylas, 1990).
2.2 Chemical Composition of Milk :
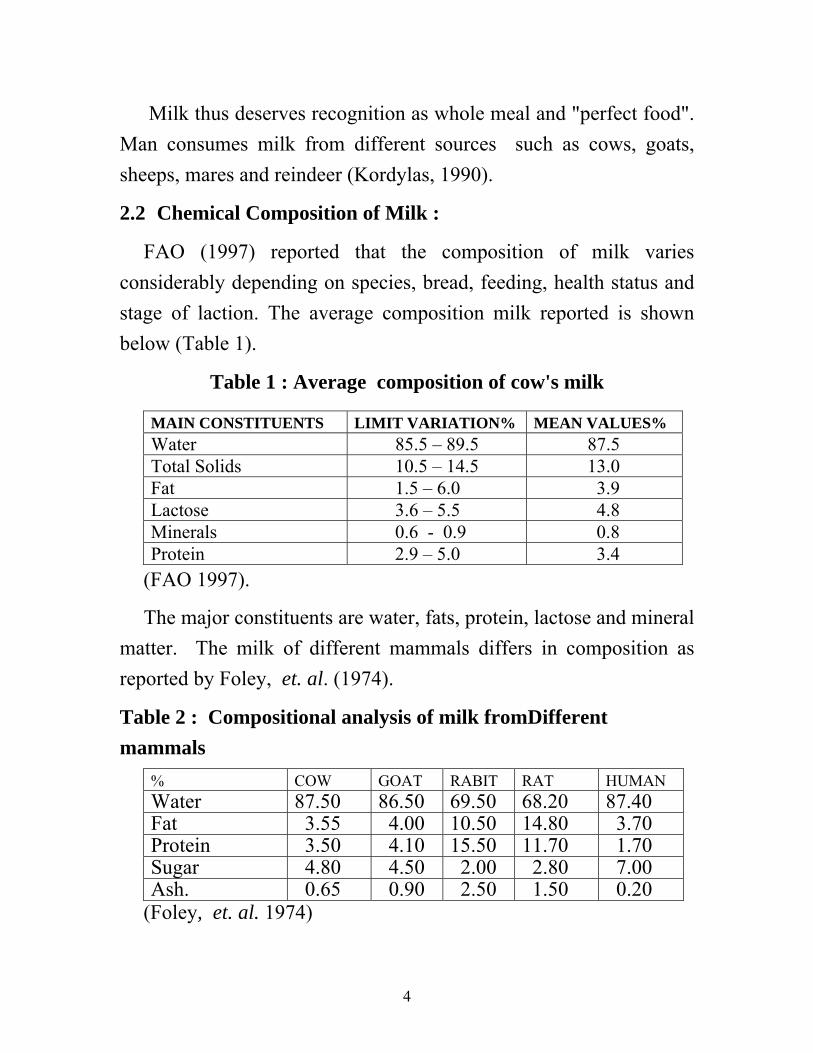
FAO (1997) reported that the composition of milk varies considerably depending on species, bread, feeding, health status and stage of laction. The average composition milk reported is shown below (Table 1).
Table 1 : Average composition of cow's milk
MAIN CONSTITUENTS LIMIT VARIATION% MEAN VALUES% Water 85.5 – 89.5 87.5 Total Solids 10.5 – 14.5 13.0 Fat 1.5 – 6.0 3.9 Lactose 3.6 – 5.5 4.8 Minerals 0.6 - 0.9 0.8 Protein 2.9 – 5.0 3.4
(FAO 1997).
The major constituents are water, fats, protein, lactose and mineral matter. The milk of different mammals differs in composition as reported by Foley, et. al. (1974).
Table 2 : Compositional analysis of milk fromDifferent mammals
% COW GOAT RABIT RAT HUMAN Water 87.50 86.50 69.50 68.20 87.40 Fat 3.55 4.00 10.50 14.80 3.70 Protein 3.50 4.10 15.50 11.70 1.70 Sugar 4.80 4.50 2.00 2.80 7.00 Ash. 0.65 0.90 2.50 1.50 0.20
(Foley, et. al. 1974)
5
2.3 Milk Production :
In Africa milk is produced in most agricultural systems. It is either sold fresh, consumed as fermented milk or manufactured into products such as butter and cheese, (O'connor, 1995). In developing countries, most milk is produced by a large number of small holders with small quantities of milk (Barabas, 1994). Ali (1988) cited that dairy farming is practiced on a limited scale in Sudan. Few dairy farms are established in the vicinity of big towns. Dirar (1975) reported that in Sudan milk is produced on scattered farms usually in small quantities.
Sudan currently produces 7.1 million ton of milk per year, most milk comes from indigenous cattle Zebu and up to 90% of milk animals are found with in the range – based nomadic and transhumant areas (FAO, 2002).
The milk production is concentrated into three main sectors namely the traditional sector (nomads), the semi traditional sector and the urban sector (Hassan, 1985).
2.3.1 Traditional Sector :
Nomads own more than 90% of animals and their production is characterized by fluctuation from higher yield to very low yield depending upon availability of pasture (Babiker, 1987).
2.3.2 Semi-Traditional Sector :
In this sector the animal owners are found around towns to supply people with cow's and goat's milk throught the year (Tag Eldin, 1985).
6
The Urban Sector :
This contains modern dairy plants which exist in the capital Khartoum. They do exist close to the major population centers, but farm from milk producing areas (Alla Gabo, 1986). Three broad cattle production systems are operated in Khartoum namely :
1. the intensive production systems where farmers follow modern dairy management practices.
2. the extensive range land-based system which is by far the largest systems and contribute 60%.
3. the crop livestock integrated systems which contribute the rest (around 30%) of milk production . (FAO, 2002).
2.4 Sources of milk contamination :
Milk is synthesized in specialized cells of the mammary gland and is virtually sterile when secreted into alveoli of the udder (Tolle, 1980). Beyond this stage of milk production, microbial contamination can generally occur, from three main sources, from with in the udder, from the exterior of the udder and from the surface of milk handling and storage equipment (Bramley and Mckinnon, 1990). The milk secreted into an uninfected cow's udder is sterile invariable it becomes contaminated during milk, cooling and storage (FAO, 1989). The health and hygiene of the cow, the environment in which the cow is housed and milk and the procedures used in cleaning and sanitizing the milking and storage equipment are all influencing the level of microbial contamination of raw milk. Equally important are temperature and length of time storage which allow microbial contaminant to multiply
7
and increase in numbers (Bramley and Mckinnon, 1990). Raw milk as it leaves the udder of healthy cows normally contains very low number of microorganisms and generally will contain less than 1000 total bacteria per ml (Kurweil and Busse, 1973). In healthy cows, the teat cistern, teat canal and the teat apex may be colonized by a variety of microorganisms though microbial contamination from with in the udder of healthy animals is not considered to contribute significantly to the total numbers of microorganisms in the bulk milk (Kurweil and Busse, 1973). The detection of coli form bacteria and pathogens in milk indicates a possible contamination of bacteria either from the udder, milk utensils or water supply used (Bonfon, et. al. 2003). The number of bacteria in aseptically drawn milk varies from animal to animal and even from different quarters in the same animal. On average aspetically drawn milk from healthy udders contains between 500 and 1000 bacteria per ml. (O'connor, 1995) . Cow with mastitis has the potential to shed large number of microorganism into the milk supply (Bramley and Mckinnon, 1990). Mastitis organisms found to most often influence the total bulk milk count Streptococcus spp., most notably S. agalactiae and S. urberis (Jeffrey, and Wilson, 1987). Contamination of mastitis milk with fresh clean milk may be one of the reasons for high microbial load of bulk milk (Jeffery and Wilson, 1987). Teats and udders of cows inevitably become soiled while they are laying in stalls or when allowed in muddy barnyard used bedding has been shown to harbor large numbers of microorganisms. Total counts often exceed 108 – 1010 per gram. (Hogan, et al. 1989). Organisms associated with bedding materials that contaminated the surface of teats and udders include Streptococci,
8
staphylococci, spore formers and coliforms (Bramley and Mckinnon, 1990). The degree of cleanliness of the milking system probably influences the total bulk milk bacteria count (Olson and Mocquat, 1980). Milk residue left on equipment contact surfaces supports the growth of a variety of microorganisms (Bramley and Mckinnon 1990). Less efficient cleaning, using lower temperatures and/or the absence of sanitizers tends to select for faster growing principallhy gran-negative vs (Coliforms and Pseudomonoads) and lactic Streptococci (Thoas, 1974). Fresh milk drawn from a healthy cow normally contains a low microbial load (less than 1000/ml) but the loads may increase up to 100 fold or more once it is stored at normal temperature (Richter, et al. 1992). Keeping milk in clean containers at refrigerated temperature immediately after milking process may delay the increase of initial microbial load and prevent multiplication of microorganism in milk between milking at the farm and transportation processing plant (Adesium, 1994). Keeping fresh milk at an elevant temperature together with unhygienic practices in the milking process may result in microbiologically inferior quality (chye et , al 1994).
2.5 Types of bacteria found in milk :
Milk is a complex fluid containing a mixture of carbohydrates, protein, fat and minerals in a different physio-chemical status and forms. Its comprehensive nutritional properties and high moisture content make it an excellent medium for supporting microbial growth (FAO, 1997). Milk provides a favorable environment for the growth of microorganisms (O'Connor, 1995). Microbes can enter milk via the cow, air, feeds, milk handling equipment and milker. Bacteria types
9
commonly associated with milk are Psuedomonas, Brucella, Enterobacteriaceae, Staphylococci, Staphylococcus aureus, Streptococcus agalacteiae, S. thermophilus, lactococci, L. Laclis, L. Lates – diacetylactis, L. cremoris, Leuconostoc lactis, Bacillus cereus, Lactobacillus, L. Lactis, L. Bulgarious and Mycobacterium tuberculosis (O'Connor, 1995).
Vasavada (1987) reported that many disease such as tuberculosis brucellosis, diphtheria, scarlet fever and gastroenteritis are transmissible through milk and milk products.
Pathogens that have involved in food borne outbreaks associated with the consumption of milk include Listera, monocytogenes, salmonella, campylobacter, Staphytococcus aureus, B. cereus and CI botulimum (Ryser, 1998) Recently, E. Coli 0157:H7 has become a serious threat to the dairy industry with several outbreaks reported in developed countries ranging from milkd diarrhea to potentially fatal hemolytic uremic syndrome, hemorrhagic colitis and thrombotic thromboctyopaenic purpura. (Coia, et. al. 2001).
2.6 Control of Contamination in Milk :
The sources of entry of microorganisms in milk are interior of udder, exterior of udder, atmosphere, utensils and milker. Therefore, in order to obtain milk free from microbes, the hands of milkers and the teats should be washed by antiseptic solutions. The utensils in which milking is carried on should be sterilized before use, the milking should be done in a clean atmosphere and the utensil should be plugged with cotton wool after milking (Rai and Phil 1980). The
10
exterior of the udder can be a major source of bacteria contamination to milk. Cleaning and removal of soil, bedding material and manure from the udder and flanks of the cow before milking is necessary to prevent the entry of many types of bacteria into the milk (O'connor, 1995).
The degree of cleanliness of the milking system probably influence the total bulk milk bacteria count (Olson and Mocquat 1980). The key words in controlling bacteria in milk are cleanliness, sanitation and cooling. Cleanliness applies to the cow, cow environment, milking area, personnel involved in milk and the milk storage area. Sanitation applies to the milking system and bulk tank. Cooling refers to temperature of milk after it leaves the cow and how quickly it is cooled (Bodman and Rice, 2004). To produce a clean milk from healthy cows, O'connor, (1995) suggested an important points to be followed and these are : (i) the udder should be washed with clean water before milking, (ii) A strip cup should be used to check for mastitis in each quarter before milking start, (iii) The body of the cow should be free of soil, dirt and manure and contamination of milk from external sources, (iv) milkers and milk handlers should be in good health and their hands should be clean, (v) The milking barn should have a good floor that is easy to clean and drain, there should be good ventilation and lighting and (vi) Cooling milk is essential to prevent an increase in bacterial numbers and spoilage of milk.
11
Treatments and Methods of Milk Preservation
Milk is a medium very favorable for growth of microorganisms. In order to keep it for a longer time, it needs careful handling therefore, the most common methods of preservation of milk are those which aim to reducing the number of microorganisms in milk either by the action of heat or by the use of chemicals (Rai and Phil, 1980).
The most common methods of milk preservation that are used today were described by Fraizeir and Westoff (1981), these include :
(i) Use of heat such as pasteurization, ultra pasteurization (sterilization), boiling and steam under pressure.
(ii) Use of low temperatures such as refrigerated storage (cooling) and freezing.
(iii) Drying.
(iv) Condensed products.
(v) Use of irradiations.
(vi) Use of sound waves and electric currents.
(vii) Developed preservation (fermentation).
(viii) Use of chemicals preservative.
Milk preservation methods commonly used in dairy industry include :-
2.7.1. Cooling :
To prevent growth of bacteria in milk and to maintain its quality for domestic consumption or during transport to the processing plant,
12
it is essential to cool the fresh milk as quickly as possible (O'connor, 1995). Refrigeration does not reduce bacteria numbers it only slows down their growth (O'connor, 1995). Milk is held at refrigeration temperature during storage on the farm, in the truck or tank and during transportation to plant. (Frazier and Westhoff, 1981). Increase in total counts bacteria during prolonged storage of raw milk (milk < 7oC) is caused by multiplication of its psychrotrophic flora (Law, 1979). The storage and handling of milk at refrigeration temperatures is selective for psychrotrophic bacteria which have considerable spoilage potential (Law,1979). The grade A pasteurized milk ordinance of United States Public health service stipulates that grade A raw milk for pasteurization shall be cooled to 10oC or less with in 2 hr after being drawn and kept that cold unlit processed (Frazier and westhoff, 1981). Majewski (1975) reported that milk cooled immediately and stored for 24 hr at 4oC had lower mesophilic, Psychrotrophic, Caseolytic and lipolytic counts and lower Coli-aerogens titres than non cooled. Ibrahim (1970) showed that poor sanitation aggravated by high temperature can be expected to result in high bacteria counts in milk.
2.7.2 Boiling :
Boiling of raw milk is usually practiced in developing countries. The objectives of boiling is to destroy microorganisms, increase shelf life of milk and better processing in areas where there is seasonal surplus. The best methods for boiling milk with the minimum nutrient loss is to bring it quickly to the boiling, stirring constantly then immediately cooling it (Kin, 1972). A more sophisticated alternative is to place heat proof jars of milk in deep vessels
13
containing water above the fill line of the milk. The water heated until the milk temperature reaches 72oC, and held for 15 – 30 and held for 15 – 30 minutes. Milk is then cooled quickly with ice or cold water (Payne, 1990). Frazier and westoff (1981) reported that boiling destroys all microorganisms except the spores of bacteria.
2.7.3 Pasteurization :
Practically, pasteurization, a heat treatment method, is sufficient to kill almost pathogenic and most spoilage microorganisms of milk (Herschoerfer, 1973). Pasteurization is heating of milk or other dairy products to a temperature which destroys all the pathogenic microorganisms without seriously affecting the composition of milk or milk products to at least 62OC for 30 minutes or to at least 71oC for 15 second (Rai and Phil 1980). Pasteurization make milk safe with negligible effect on flavor and only very slight effect on nutritive value (Payne, 1990). The efficiency of milk pasteurization depends upon the temperature of pasteurization, the holding time, the total numbers of bacteria and the proportion of the total microbial load that are spore' farmers (Frazier and Westoff, 1981).
Pasteurization eliminates pathogens without causing significant physicochemical change in milk (Havranek and Hadziosmanovic, 1966). O'connor (1995) reported that the process kills many fermentative organisms as well as pathogens but putrefactive microorganisms survive pasteurization. Although pasteurized milk has storage stability of two to three days, subsequent deterioration is caused by the putrefactive organism. Pasteurization has a little affect on the nutritive value of milk as the major nutrients are not altered.
14
There is an insignificant loss of vitamin C and B group vitamins (O'connor, 1995).
2.7.4 Sterilization :
Sterilization involves heating sealed bottles or metal containers of homogenized milk for up to 120oC for 20 – 30 minutes usually using saturated steam under pressure (Kon, 1972).
In sterilization, milk is subjected to severe heat treatment that ensures almost complete destruction of the microbial population. The product is then said to be commercially sterile . The milk is subjected to above 100oC for 15 – 40 minutes. The product has a much longer keeps for several months without refrigeration if un opened (Payne, 1990).
2.7.5. Chemical Preservation :
One way of preserving food or lengthening its shelf-life is to use certain chemical additives that can protect the food from microbial spoilage by regarding growth of microbes, by destroying the cells, or by doing both together (Collins, 1967).
Collins (1967) defined a potentially useful milk preservative as a "compound that, in small quantities, inhibits undesirable organisms but is utilized by the intended consumer, or at least, does not harm him". The definition of a good chemical preservative for milk as stated in the FAO (1957) report goes as follows, "An ideal preservative for milk may be defined as any substance which when added to milk enables the physical properties and chemical composition of milk to remain unaffected by microbial or other
15
spoilage so that the milk retains its original wholesomeness and nutritional value".
2.7.5.1 The Use of Hydrogen Peroxide (H2O2) in Milk Preservation :
The use of H2O2 for preserving milk in warm countries has gained the attention of the FAO and WHO of the United Nations. A panel of experts sponsored by FAO (Report 1957) has recommended the use of H2O2 under any one of certain circumstances. These include :
1. where in a technically less developed country the production and collection of milk is as yet insufficiently well organized.
2. where in a warm country milk is produced on scattered farms usually in small quantities and has to be bulked and transported over considerable distances before reaching a cooling or pasteurizing center.
3. where in a warm country atmospheric temperatures are so high at certain seasons of the year as to cause very rapid bacterial multiplication and spoilage of milk.
4. where in a warm country roads and transportation are as such as will not allow milk to reach the consuming area within a sufficiently short time.
5. where, no refrigeration is available.
Some authors reported that among the various preservatives that have been employed for increasing the keeping quality of milk hydrogen peroxide has been found to offer the greatest possibilities of
16
practical application under commercials conditions of handling milk on account of its comparative in harmlessness on one hand and its high bactericidal power on the other (Nambudripad, et. al. 1952). Luck (1956) reported that a good milk preservative must have the following properties :-
1. It must be easily destructible in the factory before using the milk for human consumption or for industrial purpose.
2. It must not react with any of the constituent parts of the milk.
3. After destruction the remaining substance must be non-poisonous, odorless and tasteless.
Hydrogen peroxide fulfill all these demands. Dirar (1975) reported that tropical countries are faced with difficulty of keeping raw sweet milk for a reasonable length of time. The quick souring of milk is simply due to the high ambient temperatures, bad roads and high bacterial counts of raw milk resulting from insanitary method of milk production of the three means, namely refrigeration, double pasteurization and chemical preservation suggested to combact this problem, the first two method are usually economically unfeasible, this leaves chemical choice, of all the many milk preservatives tested hydrogen peroxide is the best one. The first person to suggest the use of hydrogen peroxide for the preservation of raw milk in the Sudan was Ibrahim (1970). Chu, et al. (1975) reported that the effect of H2O2 on the bacteriological contents of milk has been reported by several investigators namely : Luck (1956), Roundy (1958), Amin and Olson (1967) and Nagib and Hussein (1972).
17
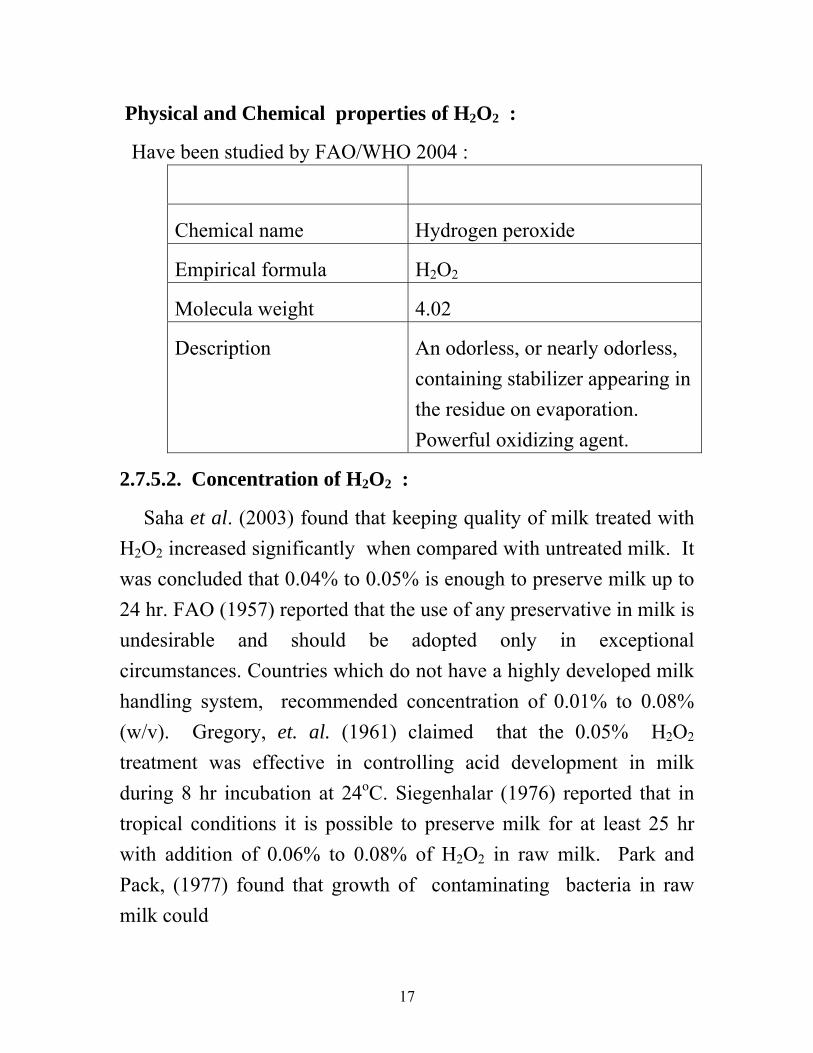
Physical and Chemical properties of H2O2 :
Have been studied by FAO/WHO 2004 :
Chemical name Hydrogen peroxide
Empirical formula H2O2
Molecula weight 4.02
Description An odorless, or nearly odorless, containing stabilizer appearing in the residue on evaporation. Powerful oxidizing agent.
2.7.5.2. Concentration of H2O2 :
Saha et al. (2003) found that keeping quality of milk treated with H2O2 increased significantly when compared with untreated milk. It was concluded that 0.04% to 0.05% is enough to preserve milk up to 24 hr. FAO (1957) reported that the use of any preservative in milk is undesirable and should be adopted only in exceptional circumstances. Countries which do not have a highly developed milk handling system, recommended concentration of 0.01% to 0.08% (w/v). Gregory, et. al. (1961) claimed that the 0.05% H2O2 treatment was effective in controlling acid development in milk during 8 hr incubation at 24oC. Siegenhalar (1976) reported that in tropical conditions it is possible to preserve milk for at least 25 hr with addition of 0.06% to 0.08% of H2O2 in raw milk. Park and Pack, (1977) found that growth of contaminating bacteria in raw milk could
18
be checked for at least 8, 12 or 16 hours by treatment with 0.01, 0.02
or 0.03% H2O2 respectively. The bactericidal efficiency of H2O2
depends on its concentration and on the temperature and duration of
the treatment. (Gregory et. al. 1961). Dirar (1977), found that the
hydrogen peroxide treated milk (0.06%, 0.08%) were good fresh on
the other hand untreated milk developed high acidity and were,
therefore unacceptable. Chu et al. (1975) found that the use of
0.01%, 0.02%, 0.03%, 0.04% and 0.05% H2O2 at 35oC for 30
minutes reduced the total bacterial count by 63.49%, 88.73%,
94.76%, 95.23% and 99.92% respectively. VonRuden, et. al. (1967)
reported that effectiveness of H2O2 in treating milk depends on
concentrations of treatment and resistance of different bacterial
species present. The FAO experts (Report, 1957) have
recommended the use of hydrogen peroxide concentration of
between 0.01% and 0.08% for preserving raw milk.
2.7.5.3. Effect of Hydrogen Peroxide on The protein :
Gregory et. al. (l961) found that treatment of milk with 0.05%
(w/v) H2O2 for 8 hour at 24oC had no significant effect on the B
complex vitamins or on the fat – soluble vitamins and only slightly
reduced the nutritive value of the protein. Also Gregory et.
al.(1961) reported that the prolonged treatment and high
concentrations of H2O2 bring about changes in the milk protein.
Fish and Michelsen (1967) found that K – casein and B –
Lactoglobulin did not make a complex when treated with hydrogen
19
peroxide prior to heating, but it did not completely prevent the
interaction. Individual milk protein solutions treated with 1%
hydrogen peroxide either slowed down its electrophoretic mobility,
migrated faster or remained unchanged (Grindrod and Nickorson,
1966). Also they found that treatment with 1% H2O2 of individual
whey protein solutions slowed down the electrophoretic mobility of
B-Lactoglabulins, speeded up that of bovine serum albumine and
did not affect that of - Laclalbumin. Gaafar (1992) found that
hydrogen peroxide treated milk at 0.05%, 0.1 and 0.2% for
24 hours, significantly decreased the methionine content of milk protein. At 0.1% for 24 hours hydrogen peroxide markedly lowered the modified protein efficiency ratio and biological value of milk protein. Mohieldin (1995) found that a slight reduction in the nutritive value of the protein was obtained in the high hydrogen peroxide concentrations (0.07 and 0.08%).
2.7.5.5. Effect of Hydrogen Peroxide on Ascorbic Acid :
The ascorbic acid oxidation varies inversely with the quantity of H2O2 added milk (Luck, 1956). Gregory et. al. (l961) found that (0.05% w/v) H2O2 treatment during 8 hours incubation at 24oC had no significant effect on the levels of biotin, nicotinic acid, riboflavin, thiamine but had destructive effect on ascorbic acid in milk. The vitamins of milk are damaged very little by treatment with H2O2 only ascorbic acid is seriously influenced (Luck, 1956).
20
2.7.5.6. Effect of Hydrogen Peroxide on the Milk fat :
Raj and Singhal (1990) found that addition of 0.1%, 0.2%, 0.3% or 0.4% H2O2 to milk produced an initial decrease of 0.05 – 0.1% in fat determined by Gerber method, but levels returned to those of control as the hydrogen peroxide was decomposed. Cock (1963) reported that pH, lactose and fat of milk are not affected by hydrogen peroxide treatment of milk.
2.7.5.7. Effect of H2O2 on the Methylene Blue Reduction Test :
The length of time milk take sto decolorise methylene blue is a good measure of its bacterial content and hence of its hygienic quality (O'connor, 1995). Saha, el at (2003) reported that methylene blue reduction test was conducted to get an idea about the bacterial population in milk. Saha, et al. (2003) found that colour reduction time of methylene blue test was 8, 10, 11, 12, 12, 14 and 15 hours for untreated, 001, 0.02, 0.03, 0.04, 0.05 and 0.06% H2O2 treated milk respectively. Also he found that color reduction time of untreated milk was lower than H2O2 treated milk. Hossain et al (1989) reported that color reduction time for untreated milk samples were less than H2O2 treated milk samples.
21
CHAPTER THREE MATERIALS AND METHODS
3.1 Source of Raw Milk : Milk samples were collected from three different sources ; namely University of Khartoum Farm (Farm 1), Shambat Farm (Farm 2) and Animal Production Research Centre Farm (Farm 3).
Fresh milk samples were collected from university of Khartoum and Shambat Farm one hour after-milking. However, milk samples obtained from Animal Production Research Centre were collected 3 hours after milking. Samples were collected in sterile plastic containers and were packed in an ice box and brought to the laboratory for analysis.
3.2 Methods : In the laboratory the collected milk samples, after thorough
mixing were divided into seven equal parts. Out of the seven parts, one part was kept as untreated milk (control) and six portions were treated with 0.01, 0.02, 0.03, 0.04, 0.05 and 0.06% of hydrogen peroxide (30% w/v) at room temperature 20±7oC.
3.3 Chemicals and Reagents : 3.3.1 Hydrogen Peroxide :
Hydrogen peroxide (30% w/v) was obtained from Merck 30% E Merck, D-6100 Darmstadt F-R, Germany.
22
3.3.2 Potassium Iodide :
Forty percent (40%) solution was prepared for the residual hydrogen peroxide test.
3.4 Hydrogen Peroxide Concentration : The required concentration of hydrogen peroxide was prepared as
described by Dirar (1967). The required concentration of hydrogen peroxide were all prepared by dilution on the basis that the commercial preparation contained 30% H2O2 for example, if 0.02 final hydrogen peroxide concentration was needed the following procedure was used – one ml of the 30% commercial solution was added to 9 ml. of distilled water to give a 3% solution, one ml of latter was added to 2 ml of distilled water to give a 1% H2O2 solution of this solution, 2 ml solution was taken, using a sterile pipette and added to 100 ml. of milk under aseptic conditions to give the required final concentration of 0.02 H2O2.
3.5 Chemical Tests : 3.5.1 Acidity :
The acidity of fresh and treated with H2O2 milk samples was determined according to commercial testing and product control in the Dairy Industry (1974). Ten milliliters of milk were measured into a white porcelain dish and five drops of phenolphthalein indicator were then added. This was titrated against N/9 sodium hydroxide until a faint pink colour lasting for not less than 30 seconds was obtained. The titration figure was divided by 10 to give the acidity of the sample expressed as percent lactic acid.
23
3.5.2 Protein Content :
The protein content of milk was determined by the Kjedahl method according to the AOAC method (1990). In a Kjedahl flask 10 ml milk sample were placed followed by addition of two Kjedahl tablets (each tablets contain l gm Na2So4 and the equivalent of 0.1 mg Hg). Twenty five milliliters of concentrated sulfuric acid (density 1.815 gm/ml at 20oC) were added to the flask and mixture was then digested on a heater until a clean solution was obtained (3 hours), the flasks were removed and left to cool. The digested sample was poured in a volumetric flask (100 ml) and diluted to 100 ml with distilled water. Five milliliters were taken and neutralized using 10 ml of 40% NaOH. The distillate was received in a conical flask containing 25 ml of 2% boric acid and 3 drops of indicator (bromocrsol green + methyl red). The distillation was continued until the volume in the flask was 75 ml. The flask was then removed from the distillator, and the distillate was titrated against 0.lN HCl unitl the end point was obtained (pink color). Protein content was calculated as follows :
Nitrogen (%) = T X 0.01 X 20 X 0.014 Weight of Sample Protein (%) = Nitrogen (%) X 6.38 Where :
T = Titration figure 0.1 = Normality of Hcl 0.014 = Atomic weight of nitrogen/1000 20 = Dilution factor 6.38 = Conversion factor of N to protein.
24
3.5.3 Fat Content :
Fat content was determined by Gerber method according to the AOAC method (1990) : Ten milliliters sulfuric acid (density 1.815 gm/ml at 20oC) were poured into clean dry Gerber tubes, then 10.94 ml milk were added followed by addition of 1 ml amyl alcohol, and distilled water at 20oC. The contents of the tube were thoroughly mixed till no white particle were seen. The tubes were then centrifuged at 1100 revolutions per minutes (rpm) for 5 minutes. The tubes were transferred to a water bath at 65oC for 3 minutes after which the fat content was immediately read.
3.5.4 Residual Hydrogen Peroxide Test :
A test for residual hydrogen peroxide was carried out by adding 0.5 milliliters of freshly prepared 40% potassium lodide solution to 5 ml of treated milk samples. A positive result was indicated by development of yellow color. This test was adopted from method described by loane (1969).
3.5.5 Ascorbic Acid :
Ascorbic acid content of milk was determined by using 2,6 – dichlorophenol – indophenol titration method of Ruck (1963). Thirty ml of clear filtrate of milk sample was first blended with a reasonable amount of 0.4% oxalic acid for 2 minutes and then filtered. The volume of filtrate was made up to 250 ml using 0.4% oxalic acid. An amount of 20 ml of filtrate was titrated with 2,6 – dichlorophenol – indophenol dye to a faint pink colour. The ascorbic acid content was calculated according to the following formula :
25
Pure ascorbic acid (0.05 grams) was dissolved in 60 ml of 20% metaphosphoric acid and diluted to 250 ml. Ten milliliters of ascorbic acid solution were titrated against 2,6 – dichlorophenol – indophenol solution until faint pink color persisted for 15 seconds. The result was expressed as mg/100 ml.
Ascorbic acid = titration figure X dye strength X 100 (mg/100 ml) Factor
Factor = Sample wt. (30 ml) X sample vol. for titration Total vol. of sample (250 ml)
Dye Strength = 1 Titre
2.6 Biochemicals Test :
3.6.1. The Methylene Blue Reduction Test :
The methylene blue reduction test was determined according to Rural Dairy Technology (1995) method.
Apparatus :
• A water bath set at 37 – 38 C.
• Test tubes graduated at the 10 ml mark. The tubes were plugged with cotton and sterilized before use.
• A supply of 1 ml pipettes were also plugged with cotton and sterilized.
• The rubber stoppers for closing the tubes were sterilized before use by immersing in boiling water for minutes.
26
• A methylene blue solution was made up from standard methylene blue milk testing tablets.
Procedure :
The milk was mixed thoroughly. The sample was taken with a clean sterile dipper and the test tube was filled to the 10 ml mark. The test tube was stoppered with a sterile rubber stopper. The test tube was placed in the test rack. One ml of the methylene blue solution was added to each tube. The rubber stopper was replaced with aseptic precautions. Each tube was inverted twice so as to mix the milk and solution thoroughly, and the tubes were placed in the water bath at a temperature of 37 – 38oC.A note of the time at which the tubes were put into the water bath was made. The samples were examined after 30 mintes. Decolourised samples were removed from the water bath. Partly decolourised samples were not disturbed. At half-hourly intervals decolourised samples were examined again and were repeated as above.
3.7 Statistical Analysis :
Data were analysed according to the standard statistical procedure (Gomez and Gomez 1984). Analysis of variance was carried out for each parameter as for a completely randomized design. The means were separated using the Least Significant Difference (LSD).
27
CHAPTER FOUR
RESULTS AND DISCUSSION
4.1. Titratable acidity :
Fig. (1) shows development in acidity of samples collected from Farm
(1) and stored at room temperature 20±7oC. Fig. (1) samples collected
from Farm (1) shows the acidity against time- the results indicated that
the acidity positively (P ≤ 0.01) corrected with time. Milk samples
preserved with 0.06% treated samples showed no mentionable change
in titratable acidity, while a slight increase in the acidity of the 0.05%
treated samples obtained after 24 hours of storage. The acidity of the
samples treated with 0.04% H2O2 increased slightly after 18 hours of
storage maintained
a maximum titratable acidity after 24 hours of storage. After 6 hours of
incubation the samples treated with 0.03% and 0.02% H2O2 showed a
gradual increase in lactic, while the control and 0.01% concentration
maintained the highest value of titratable acidity expresses as lactic
percent.
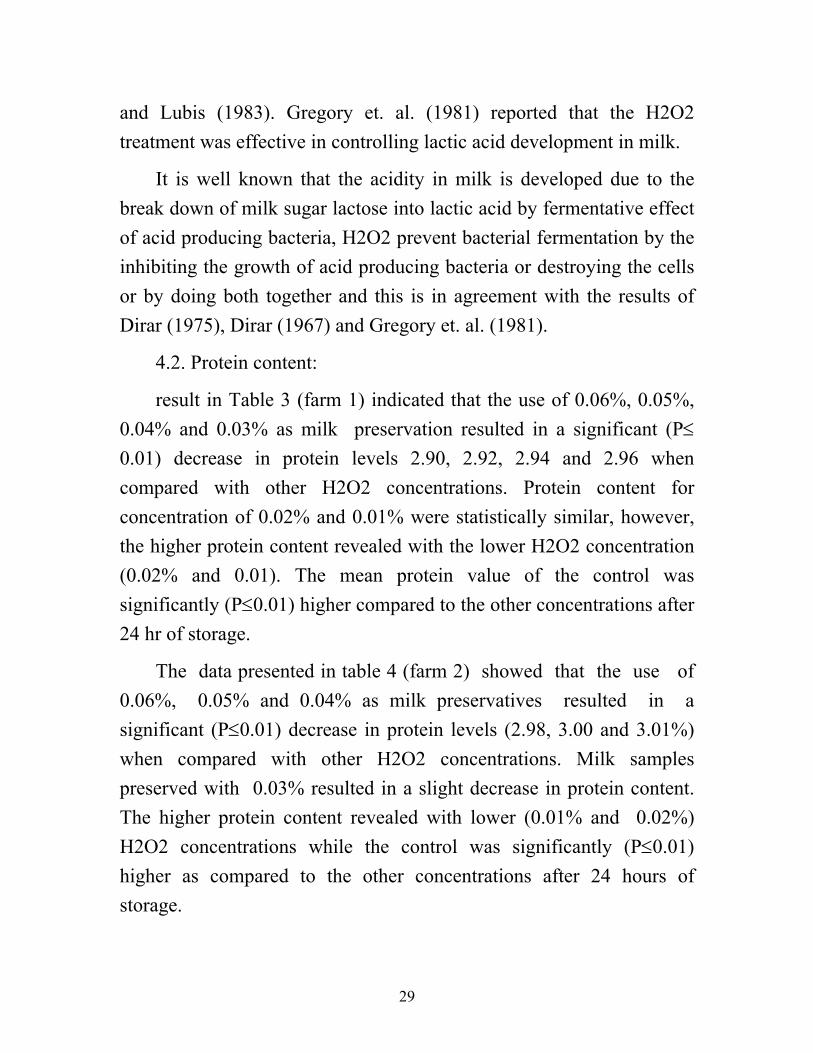
Fig. (2) shows changes in titratable acidity of samples from farm (2) the results indicated that after 24 hours of storage the 0.06% H2O2 treated samples showed no mentionable change in titratable acidity, while a slight increase in the acidity of the 0.05% H2O2 treated samples obtained after 24 hours of storage. Milk samples treated with 0.04% H2O2 increased markedly after 18 hours on incubation. After 6 hours of storage the samples treated with 0.03% and 0.02% H2O2

28
showed a gradual increase in lactic acid, while the control and 0.01% H2O2 concentration showed the highest value of titratable acidity.
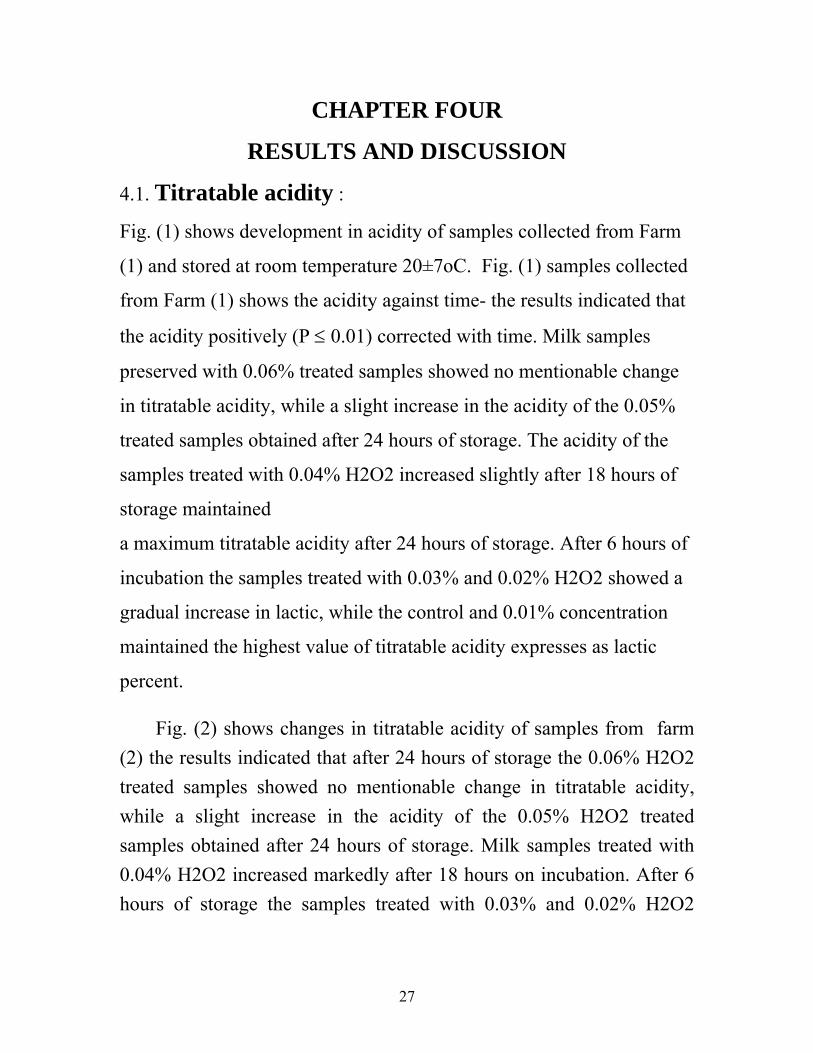
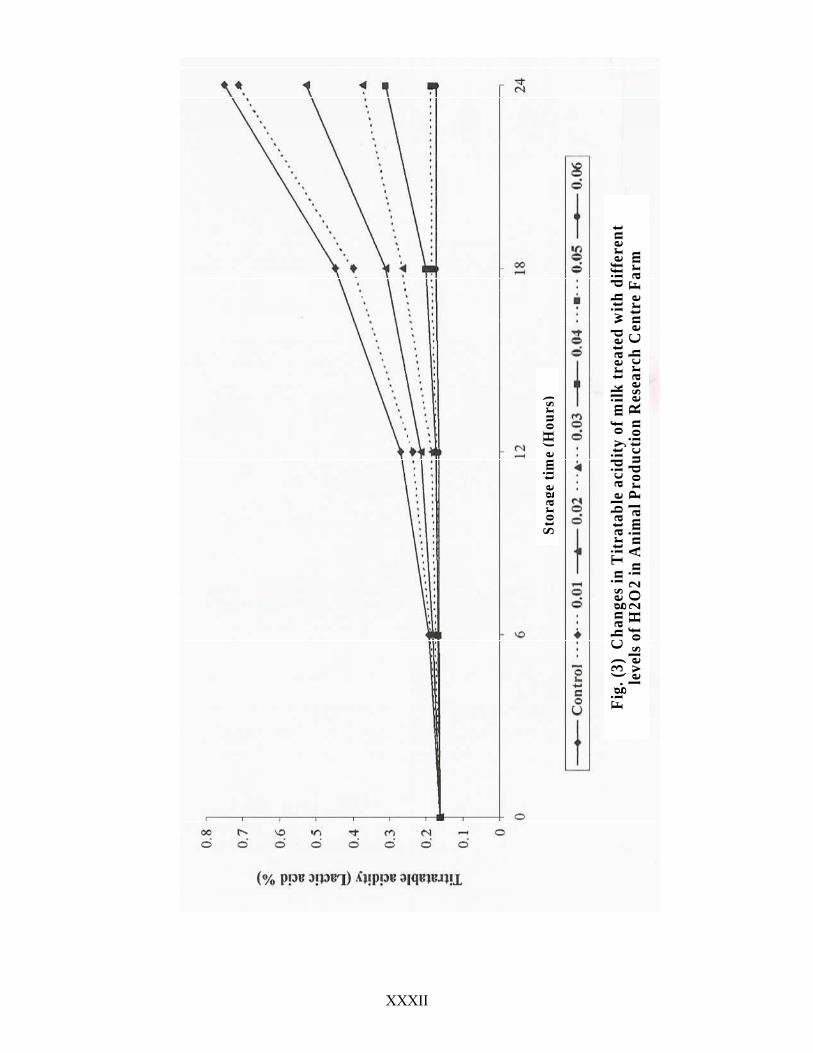
Fig. (3) shows changes in titratable acidity of samples from Farm (3) results show that the acidity was positively correlated with time. Milk samples preserved with 0.06% H2O2 resulted in a slight increase in titratable acidity however, after 24 hours of storage they show lactic acid comparable to the original raw milk. After six hours of storage 0.02% H2O2 treated samples recorded a slight increase and 0.01% treated samples and control recorded high titratable acidity levels.
Significant difference (P≤ 0.01) was found with the acidity of different types of milk samples. The results of acidity test are in agreement with several research workers. Siegnhalar (1976) reported that, in tropical condition it is possible to preserve milk for at least 24 hours with addition of 0.06% to 0.08% of H2O2 in raw milk. From another experiment park and pack (1977) reported that growth of contaminating bacteria in raw milk could be checked for at least 8, 12 or 16 hours by treatment with 0.01, 0.02 or 0.03% H2O2 respectively.
The initial acidity levels of the raw milk used in this study were 0.17, 0.17 and 0.16% for farms 1, 2, and 3 respectively. These value however, are considered similar to values reported by Mohi Eldien (1996) who reported 0.17, 0.15, 0.16 and 0.19% but a slighty higher than those reported by Radhakrishnan and Srinivason (1951) who reported 0.013 and 0.15%. Lubis (1983) observed that when hydrogen peroxide was added at 0.05% the titratable acidity in milk after 24 hours was 0.14%.
In general the present results showed that lactic acid percentage decrease with the increase of hydrogen peroxide concentration, which is in agreement with observation of Mohi Eldien, (1995) Dirar (1975)
29
and Lubis (1983). Gregory et. al. (1981) reported that the H2O2 treatment was effective in controlling lactic acid development in milk.
It is well known that the acidity in milk is developed due to the break down of milk sugar lactose into lactic acid by fermentative effect of acid producing bacteria, H2O2 prevent bacterial fermentation by the inhibiting the growth of acid producing bacteria or destroying the cells or by doing both together and this is in agreement with the results of Dirar (1975), Dirar (1967) and Gregory et. al. (1981).
4.2. Protein content:
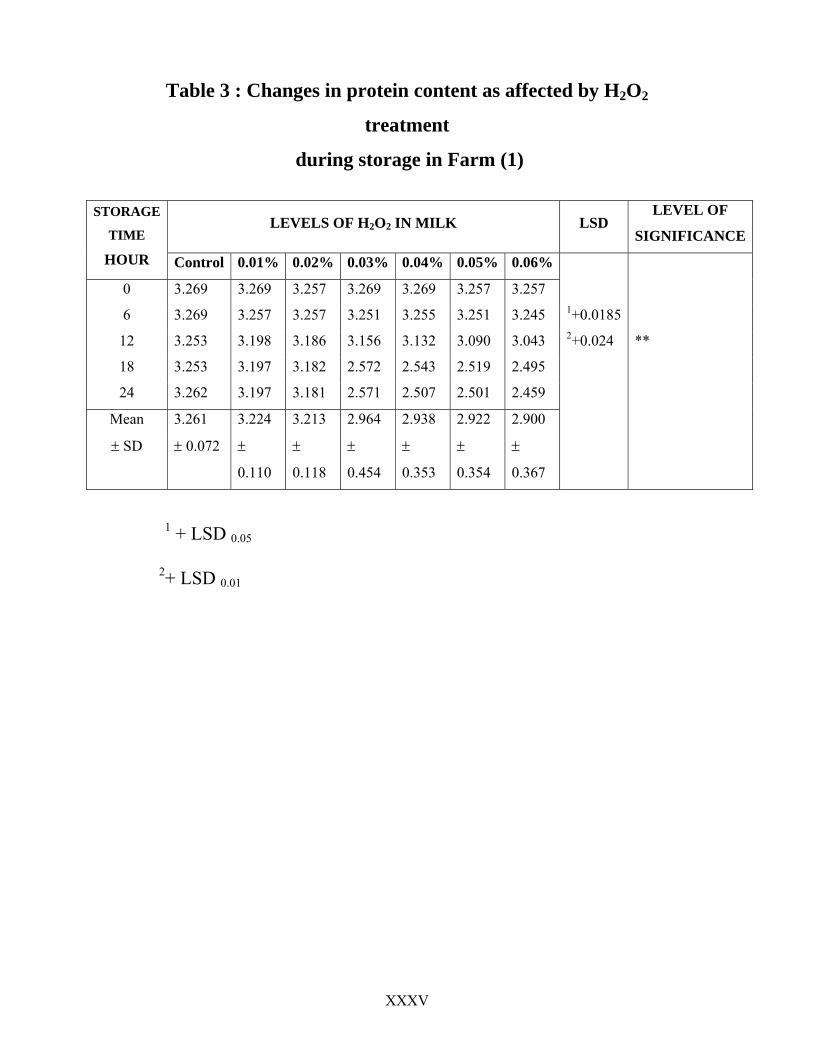
result in Table 3 (farm 1) indicated that the use of 0.06%, 0.05%, 0.04% and 0.03% as milk preservation resulted in a significant (P≤ 0.01) decrease in protein levels 2.90, 2.92, 2.94 and 2.96 when compared with other H2O2 concentrations. Protein content for concentration of 0.02% and 0.01% were statistically similar, however, the higher protein content revealed with the lower H2O2 concentration (0.02% and 0.01). The mean protein value of the control was significantly (P≤0.01) higher compared to the other concentrations after 24 hr of storage.
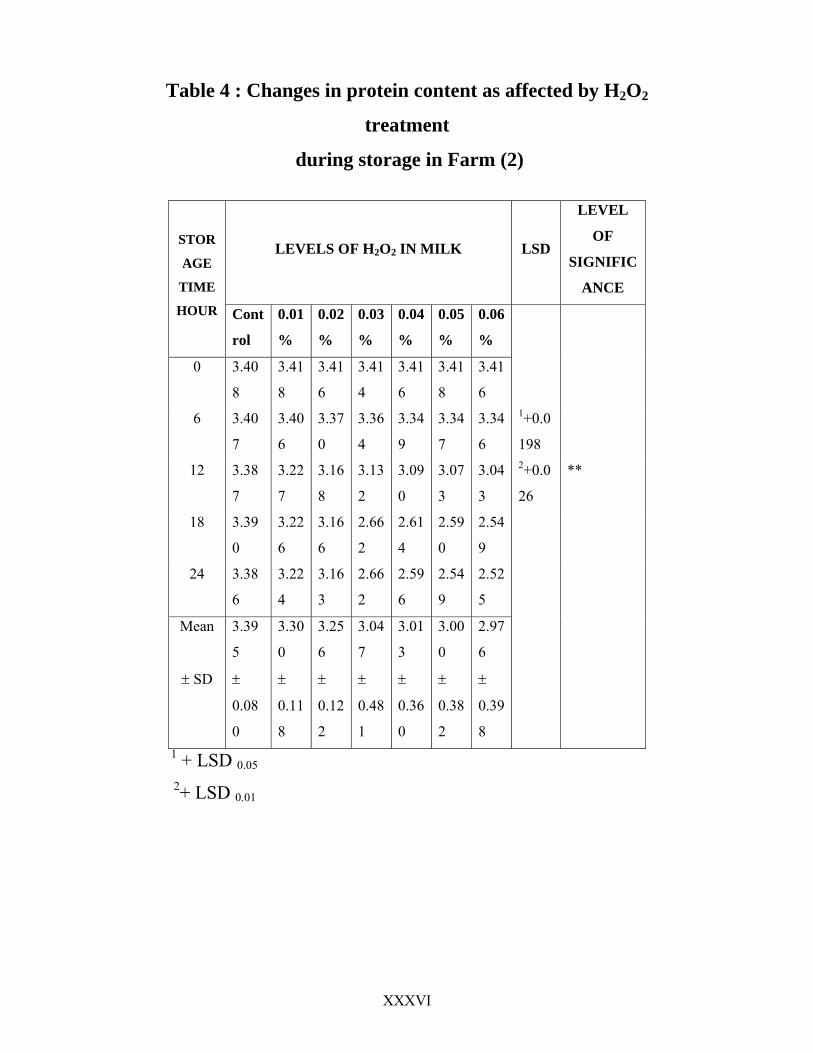
The data presented in table 4 (farm 2) showed that the use of 0.06%, 0.05% and 0.04% as milk preservatives resulted in a significant (P≤0.01) decrease in protein levels (2.98, 3.00 and 3.01%) when compared with other H2O2 concentrations. Milk samples preserved with 0.03% resulted in a slight decrease in protein content. The higher protein content revealed with lower (0.01% and 0.02%) H2O2 concentrations while the control was significantly (P≤0.01) higher as compared to the other concentrations after 24 hours of storage.
XXXI
XXXII
Fig.
(3)
Cha
nges
in T
itrat
able
aci
dity
of m
ilk tr
eate
d w
ith d
iffer
ent
leve
ls o
f H2O
2 in
Ani
mal
Pro
duct
ion
Res
earc
h C
entr
e Fa
rm
Stor
age
time
(Hou
rs)
XXXIII
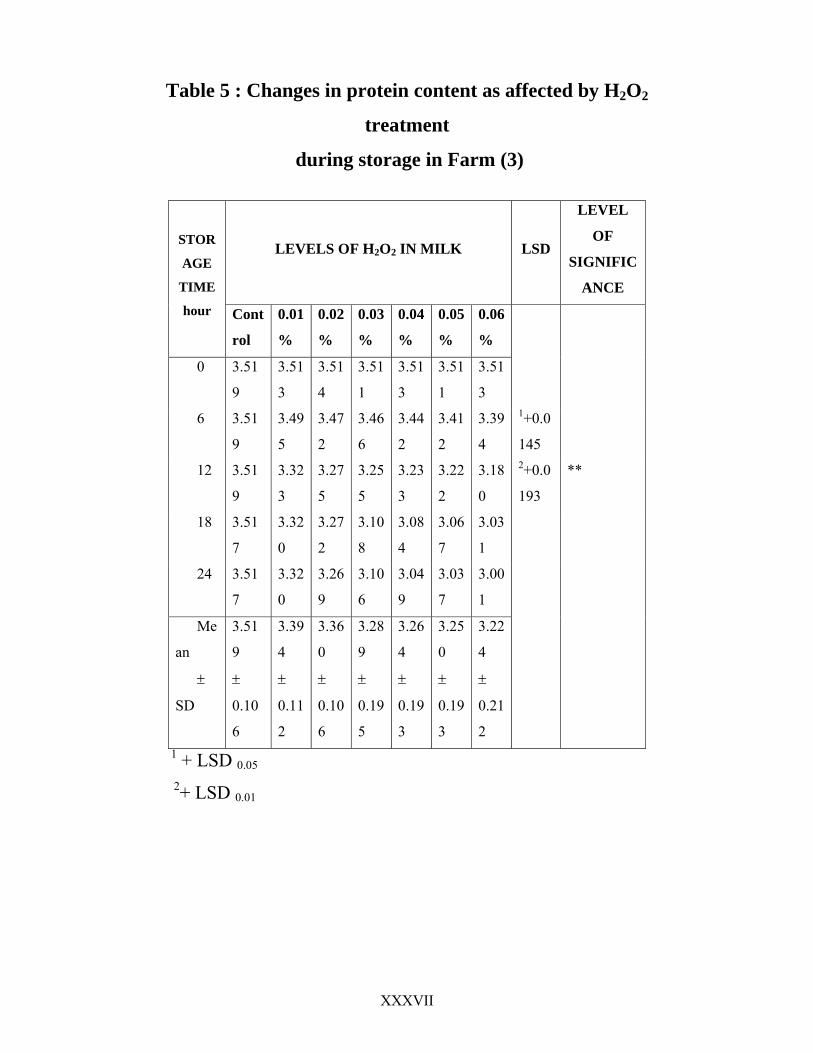
Results in Table 5 (Farm 3) indicated that the use of 0.06%, 0.05% and 0.04% preservatives resulted in a significant (P≤0.01) decrease in protein content. A slight decrease in the protein content was obtained the 0.03% and 0.02% H2O2 concentrations, however, the higher protein content revealed with lower (0.01%) H2O2 concentration. The mean protein content of the control was significantly (P≤0.01) higher as compared to the other concentration after 24 hours of storage.
The results showed that a slight reduction in the protein content of milk was obtained using the high hydrogen peroxide concentrations (0.04%, 0.05%, 0.06%). This results is in an agreement with Gaafar (1992), who found that hydrogen peroxide treated milk at 0.05%, 0.1% and 0.2% for 24 hours, significantly decreased the methionine content of milk protein. Mohi Eldien (1995) reported that a slight reduction in the nutritive value of the protein was obtained in the high H2O2 concentration (0.07% and 0.08% H2O2). Dirar (1967) reported that 0.01, 0.03 and 0.05% H2O2 treated samples showed either insignificant effect of the hydrogen peroxide treatment on the protein value or aslight decrease in the protein value. Gregory, et. al. (1961) found that treatment of milk with 0.05% (w/v) H2O2 for 8hr at 24°C had no significant effect on the B-complex vitamin or on the fat-soluble vitamins and only a slight reduction in nutritive value of the protein. Also found that prolonged treatment and high concentrations of H2O2 bring about changes in the milk protein. Fish and Michelson (1967) reported that K-casien and B-Lactoglobulin did not make a complex when treated with hydrogen peroxide prior to heating – but it did not completely prevent the interaction.
XXXIV
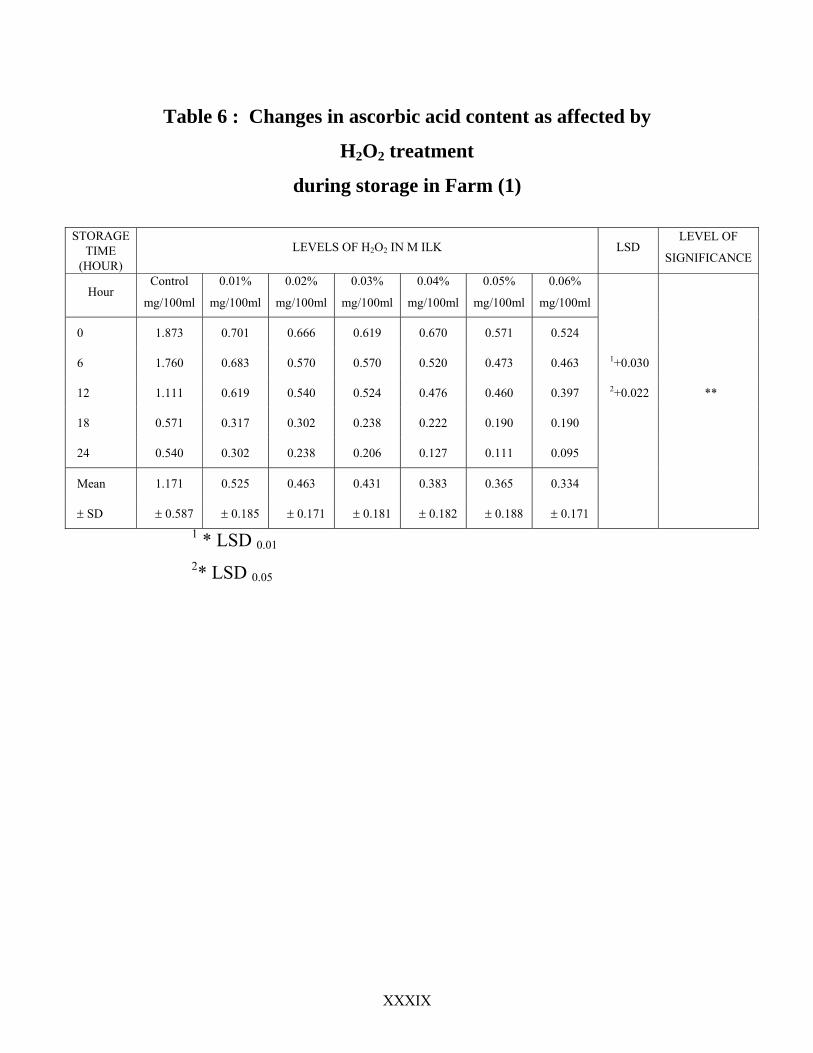
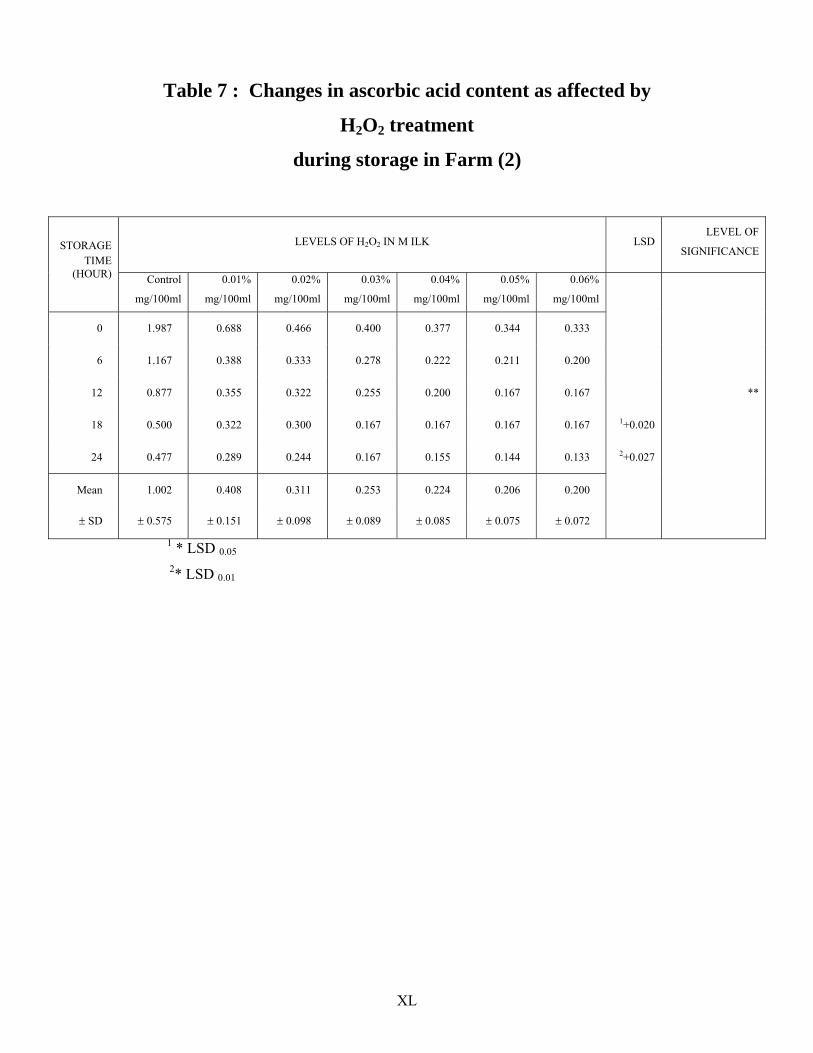
4.3. Ascorbic Acid Content: results in Table 6 (Farm 1) indicated that the use of H2O2 as preservative resulted in a significant (P≤0.01) decrease in ascorbic acid content when compared with the control. The average ascorbic acid content of untreated, as well as milk samples treated with 0.01, 0.02, 0.03, 0.04 0.05 and 0.06%H2O2 were 1.17, 0.53, 0.46, 0.43, 0.38, 0.37 and 0.33 mg/100 ml respectively after 24 hr of storage. The higher ascorbic acid content revealed with lower (0.01%) H2O2 concentration. The mean ascorbic acid content of the control was significantly (P≤0.01) higher as compared to the other concentration. Results in Table 7 (Farm 2) showed that the average ascorbic acid of untreated as well as milk samples treated with 0.01, 0.02, 0.03, 0.04 0.05 and 0.06%H2O2 were 1.00, 0.41, 0.31, 0.25, 0.22, 0.21 and 0.20 mg/100 ml respectively after 24 hours of storage. The higher ascorbic acid content revealed with the lower (0.01%) H2O2 concentration as compared with the control.
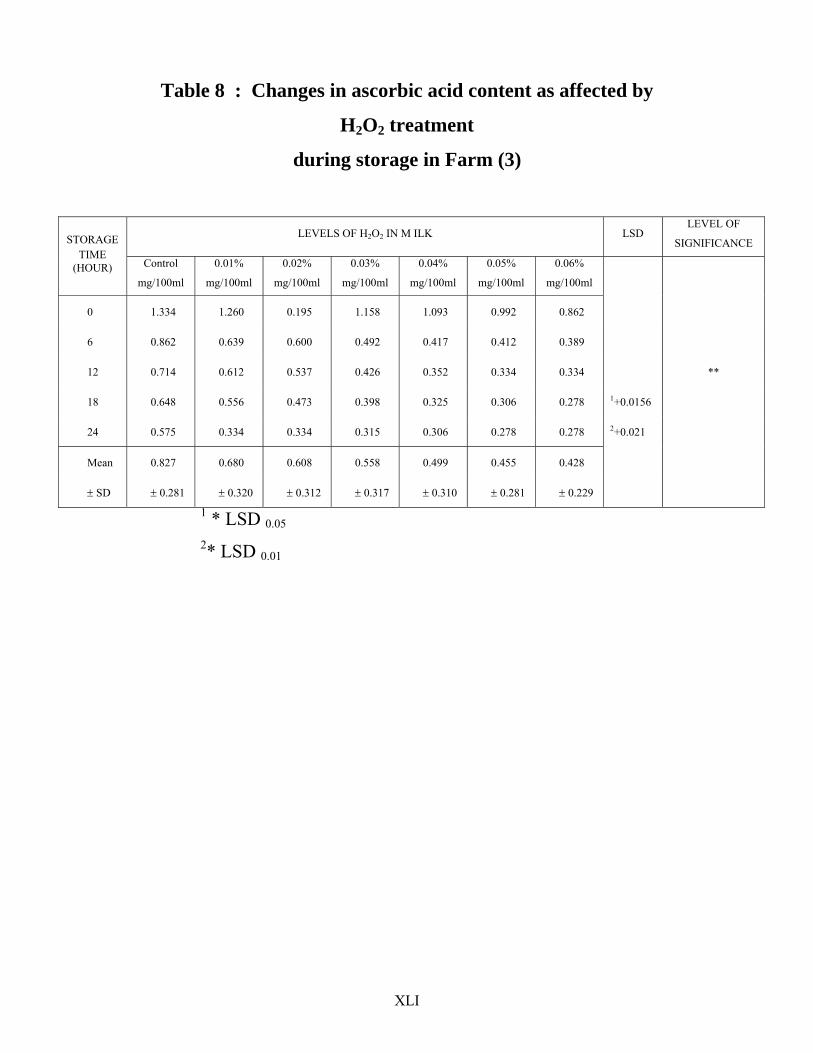
The data presented in Table 8 (Farm 3) showed that highly significant (P≤0.01) difference was obtained in the treated milk samples as compared to the control. The average ascorbic acid content of untreated as well as milk samples treated with 0.01, 0.02, 0.03, 0.04 0.05 and 0.06%H2O2 were 0.83, 0.68, 0.60, 0.56, 0.50, 0.46 and 0.43 mg/100ml respectively. The results showed that the control had the highest mean ascorbic acid content while 0.06% H2O2 had the lowest mean after 24 hours of storage.
XXXV
Table 3 : Changes in protein content as affected by H2O2
treatment
during storage in Farm (1)
LEVELS OF H2O2 IN MILK LSD LEVEL OF
SIGNIFICANCE
STORAGE
TIME
HOUR Control 0.01% 0.02% 0.03% 0.04% 0.05% 0.06%
0 3.269 3.269 3.257 3.269 3.269 3.257 3.257
6 3.269 3.257 3.257 3.251 3.255 3.251 3.245 1+0.0185
12 3.253 3.198 3.186 3.156 3.132 3.090 3.043 2+0.024 **
18 3.253 3.197 3.182 2.572 2.543 2.519 2.495
24 3.262 3.197 3.181 2.571 2.507 2.501 2.459
Mean 3.261 3.224 3.213 2.964 2.938 2.922 2.900
± SD ± 0.072 ±
0.110
±
0.118
±
0.454
±
0.353
±
0.354
±
0.367
1 + LSD 0.05
2+ LSD 0.01
XXXVI
Table 4 : Changes in protein content as affected by H2O2
treatment
during storage in Farm (2)
LEVELS OF H2O2 IN MILK LSD
LEVEL
OF
SIGNIFIC
ANCE
STOR
AGE
TIME
HOUR Cont
rol
0.01
%
0.02
%
0.03
%
0.04
%
0.05
%
0.06
%
0 3.40
8
3.41
8
3.41
6
3.41
4
3.41
6
3.41
8
3.41
6
6 3.40
7
3.40
6
3.37
0
3.36
4
3.34
9
3.34
7
3.34
6
1+0.0
198
12 3.38
7
3.22
7
3.16
8
3.13
2
3.09
0
3.07
3
3.04
3
2+0.0
26
**
18 3.39
0
3.22
6
3.16
6
2.66
2
2.61
4
2.59
0
2.54
9
24 3.38
6
3.22
4
3.16
3
2.66
2
2.59
6
2.54
9
2.52
5
Mean 3.39
5
3.30
0
3.25
6
3.04
7
3.01
3
3.00
0
2.97
6
± SD ±
0.08
0
±
0.11
8
±
0.12
2
±
0.48
1
±
0.36
0
±
0.38
2
±
0.39
8
1 + LSD 0.05 2+ LSD 0.01
XXXVII
Table 5 : Changes in protein content as affected by H2O2
treatment
during storage in Farm (3)
LEVELS OF H2O2 IN MILK LSD
LEVEL
OF
SIGNIFIC
ANCE
STOR
AGE
TIME
hour Cont
rol
0.01
%
0.02
%
0.03
%
0.04
%
0.05
%
0.06
%
0 3.51
9
3.51
3
3.51
4
3.51
1
3.51
3
3.51
1
3.51
3
6 3.51
9
3.49
5
3.47
2
3.46
6
3.44
2
3.41
2
3.39
4
1+0.0
145
12 3.51
9
3.32
3
3.27
5
3.25
5
3.23
3
3.22
2
3.18
0
2+0.0
193
**
18 3.51
7
3.32
0
3.27
2
3.10
8
3.08
4
3.06
7
3.03
1
24 3.51
7
3.32
0
3.26
9
3.10
6
3.04
9
3.03
7
3.00
1
Me
an
3.51
9
3.39
4
3.36
0
3.28
9
3.26
4
3.25
0
3.22
4
±
SD
±
0.10
6
±
0.11
2
±
0.10
6
±
0.19
5
±
0.19
3
±
0.19
3
±
0.21
2
1 + LSD 0.05 2+ LSD 0.01
XXXVIII
Results showed that the H2O2 had a destructive effect on
ascorbic acid. Also results indicated that the use of H2O2 as a
preservatives resulted in a significant (P≤ 0.01) decrease in ascorbic
acid content which agrees with the findings of Luck (1956) who
found that the ascorbic acid oxidation varies inversely with the
quantity of H2O2 added to milk. Gregory et. al. (1961) found that
0.05% (w/v) H2O2 treatment during 8 hours incubation at 24°C had
no significant effect on the levels of biotin, nicotinic acid, riboflavin,
thiamine or pyridoxal but had destructive effect on ascorbic acid in
milk. Weinstein and Trout (1951) reported that 0.028 ml. of 30%
hydrogen peroxide solution oxidized the naturally occurring vitamin
C in milk in 30 minutes. Luck (1956) reported that the vitamins of
milk are damaged very little by treatment with H2O2 only ascorbic
acid is seriously influenced. Krukowsky (1949) found that ascorbic
acid was oxidized rapidly and completely by hydrogen peroxide in
milk heated to 61.1°C . It was also found that the peroxidase of milk
and also copper ions helped in this reaction which converted
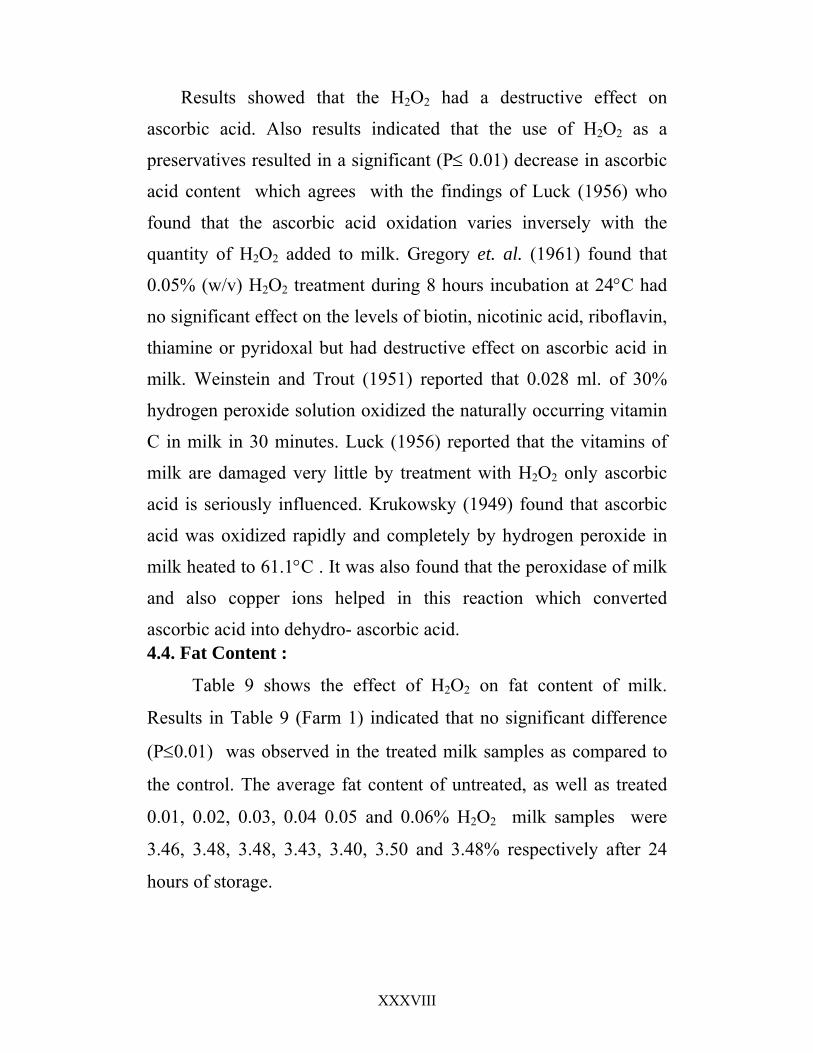
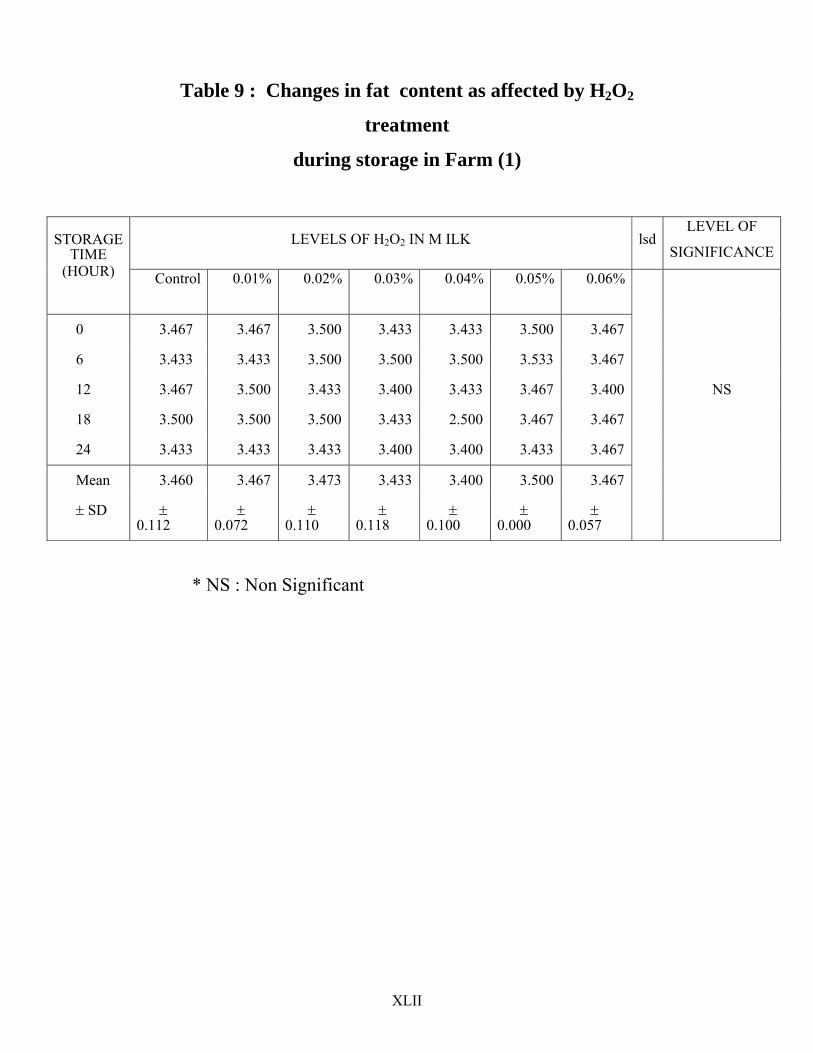
ascorbic acid into dehydro- ascorbic acid. 4.4. Fat Content :
Table 9 shows the effect of H2O2 on fat content of milk.
Results in Table 9 (Farm 1) indicated that no significant difference
(P≤0.01) was observed in the treated milk samples as compared to
the control. The average fat content of untreated, as well as treated
0.01, 0.02, 0.03, 0.04 0.05 and 0.06% H2O2 milk samples were
3.46, 3.48, 3.48, 3.43, 3.40, 3.50 and 3.48% respectively after 24
hours of storage.
XXXIX
Table 6 : Changes in ascorbic acid content as affected by
H2O2 treatment
during storage in Farm (1)
STORAGE TIME
(HOUR) LEVELS OF H2O2 IN M ILK LSD
LEVEL OF
SIGNIFICANCE
Hour Control
mg/100ml
0.01%
mg/100ml
0.02%
mg/100ml
0.03%
mg/100ml
0.04%
mg/100ml
0.05%
mg/100ml
0.06%
mg/100ml
0 1.873 0.701 0.666 0.619 0.670 0.571 0.524
6 1.760 0.683 0.570 0.570 0.520 0.473 0.463 1+0.030
12 1.111 0.619 0.540 0.524 0.476 0.460 0.397 2+0.022 **
18 0.571 0.317 0.302 0.238 0.222 0.190 0.190
24 0.540 0.302 0.238 0.206 0.127 0.111 0.095
Mean 1.171 0.525 0.463 0.431 0.383 0.365 0.334
± SD ± 0.587 ± 0.185 ± 0.171 ± 0.181 ± 0.182 ± 0.188 ± 0.171 1 * LSD 0.01 2* LSD 0.05
XL
Table 7 : Changes in ascorbic acid content as affected by
H2O2 treatment
during storage in Farm (2)
LEVELS OF H2O2 IN M ILK LSD LEVEL OF
SIGNIFICANCE
STORAGE
TIME (HOUR)
Control
mg/100ml
0.01%
mg/100ml
0.02%
mg/100ml
0.03%
mg/100ml
0.04%
mg/100ml
0.05%
mg/100ml
0.06%
mg/100ml
0 1.987 0.688 0.466 0.400 0.377 0.344 0.333
6 1.167 0.388 0.333 0.278 0.222 0.211 0.200
12 0.877 0.355 0.322 0.255 0.200 0.167 0.167 **
18 0.500 0.322 0.300 0.167 0.167 0.167 0.167 1+0.020
24 0.477 0.289 0.244 0.167 0.155 0.144 0.133 2+0.027
Mean 1.002 0.408 0.311 0.253 0.224 0.206 0.200
± SD ± 0.575 ± 0.151 ± 0.098 ± 0.089 ± 0.085 ± 0.075 ± 0.072
1 * LSD 0.05 2* LSD 0.01
XLI
Table 8 : Changes in ascorbic acid content as affected by
H2O2 treatment
during storage in Farm (3)
LEVELS OF H2O2 IN M ILK LSD LEVEL OF
SIGNIFICANCE STORAGE TIME
(HOUR) Control
mg/100ml
0.01%
mg/100ml
0.02%
mg/100ml
0.03%
mg/100ml
0.04%
mg/100ml
0.05%
mg/100ml
0.06%
mg/100ml
0 1.334 1.260 0.195 1.158 1.093 0.992 0.862
6 0.862 0.639 0.600 0.492 0.417 0.412 0.389
12 0.714 0.612 0.537 0.426 0.352 0.334 0.334 **
18 0.648 0.556 0.473 0.398 0.325 0.306 0.278 1+0.0156
24 0.575 0.334 0.334 0.315 0.306 0.278 0.278 2+0.021
Mean 0.827 0.680 0.608 0.558 0.499 0.455 0.428
± SD ± 0.281 ± 0.320 ± 0.312 ± 0.317 ± 0.310 ± 0.281 ± 0.229
1 * LSD 0.05 2* LSD 0.01
XLII
Table 9 : Changes in fat content as affected by H2O2
treatment
during storage in Farm (1)
LEVELS OF H2O2 IN M ILK lsdLEVEL OF
SIGNIFICANCE
STORAGE
TIME (HOUR)
Control 0.01% 0.02% 0.03% 0.04% 0.05% 0.06%
0 3.467 3.467 3.500 3.433 3.433 3.500 3.467
6 3.433 3.433 3.500 3.500 3.500 3.533 3.467
12 3.467 3.500 3.433 3.400 3.433 3.467 3.400 NS
18 3.500 3.500 3.500 3.433 2.500 3.467 3.467
24 3.433 3.433 3.433 3.400 3.400 3.433 3.467
Mean 3.460 3.467 3.473 3.433 3.400 3.500 3.467
± SD ± 0.112
± 0.072
± 0.110
± 0.118
± 0.100
± 0.000
± 0.057
* NS : Non Significant
XLIII
Table 10 : Changes in fat content as affected by H2O2
treatment
during storage in Farm (2)
• NS : Non Significant
LEVELS OF H2O2 IN M ILK LSD LEVEL OF SIGNIFICANCE
STORAGE TIME
(HOUR) Control 0.01% 0.02% 0.03% 0.04% 0.05% 0.06%
0 3.733 3.800 3.800 3.700 3.667 3.633 3.633
6 3.776 3.633 3.633 3.700 3.700 3.567 3.633
12 3.733 3.567 3.600 3.600 3.600 3.533 3.633 NS
18 3.767 3.767 3.667 3.667 3.667 3.700 3.633
24 3.733 3.700 3.667 3.700 3.700 3.667 3.733
Mean 3.747 3.693 3.673 3.673 3.640 3.620 3.653
± SD ± 0.064 ± 0.122
± 0.080
± 0.122
± 0.063
± 0.094
± 0.0916
XLIV
Table 11 : Changes in fat content as affected by treatment
during storage in Farm (3)
LEVELS OF H2O2 IN M ILK LSDLEVEL
OF SIGNIFICANCE
STORAGE TIME
(HOUR) Control 0.01
% 0.02
% 0.03
% 0.04
% 0.05
% 0.06
%
0 4.067 4.233 4.200 4.100 4.033 4.000 4.100
6 4.067 4.167 4.100 4.100 4.000 4.167 4.033
12 4.167 4.000 4.067 4.000 4.133 4.100 4.067 NS
18 4.100 4.167 4.067 4.200 4.033 4.167 4.233
24 4.100 4.000 4.187 4.067 4.100 4.100 4.167
Mean 4.100 4.113 4.120 4.093 4.060 4.107 4.120
± SD ± 0.065 ± 0.106
± 0.094
± 0.088
± 0.063
± 0.103
± 0.108
XLV
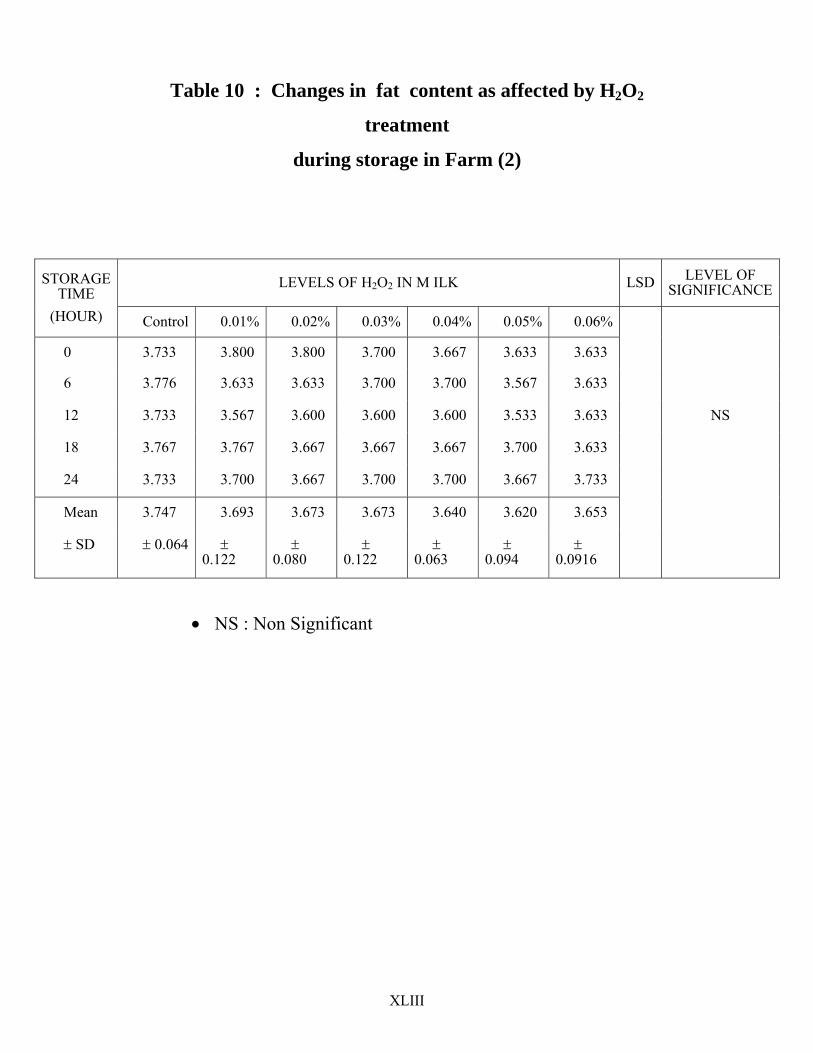
The data presented in Table 10 (Farm 2) shows that the hydrogen peroxide treated milk samples were statistically similar as compared to the control. The average Fat content of untreated as well as milk samples treated with 0.01, 0.02, 0.03, 0.04, 0.05 and 0.06% H2O2 were 3.75, 3.69, 3.67, 3.64, 3.62 and 3.65% respectively after 24 hours of storage.
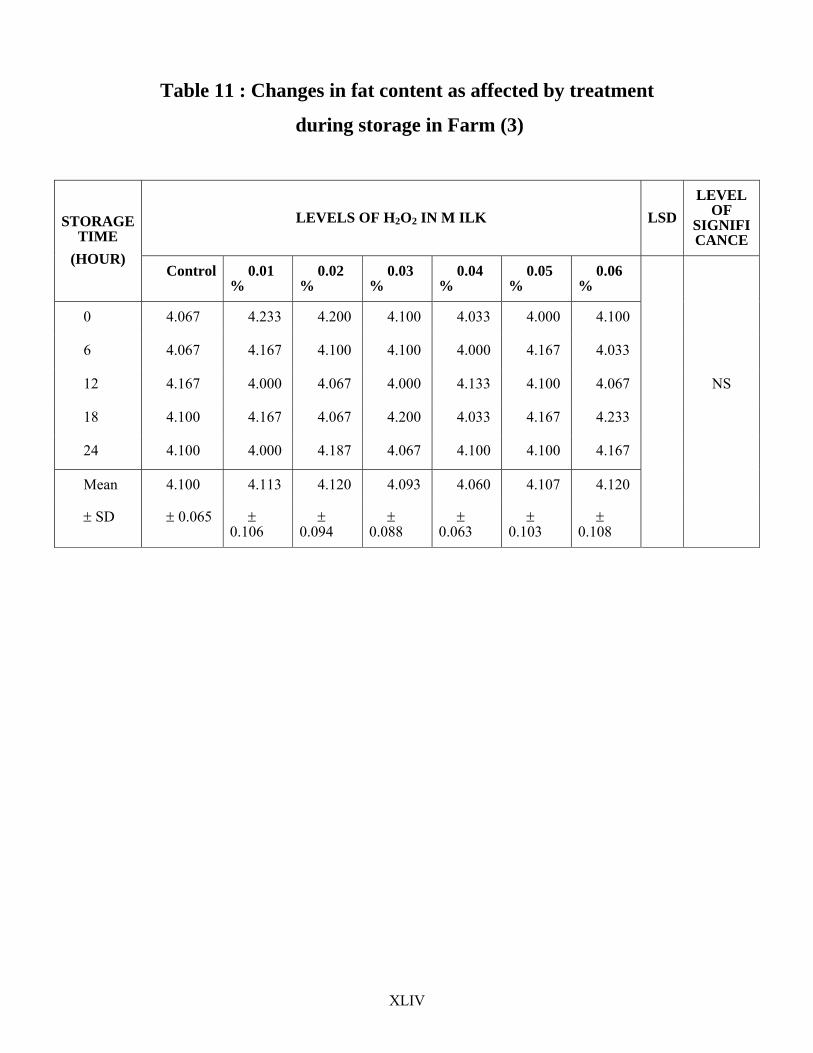
Results in Table 11 (Farm 3) shows that no significant difference was obtained in the treated milk samples as compared to the control in the fat content after 24 hours of incubation. Results indicated that fat of milk are not affected by hydrogen peroxide treatment of milk. The results of this experiment are in agreement with the findings of Cook (1963) who found that pH, lactose and fat of milk are not affected by hydrogen peroxide treatment of milk. Raj and Singhal (1990) reported that addition of 0.1, 0.2, 0.3, or 0.4% H2O2 to milk produce an initial decrease of 0.05 – 0.1% in fat determined by Gerber method, but levels returned to those of the control as the H2O2 was decomposed.
4.5 Methylene Blue Reduction Test:
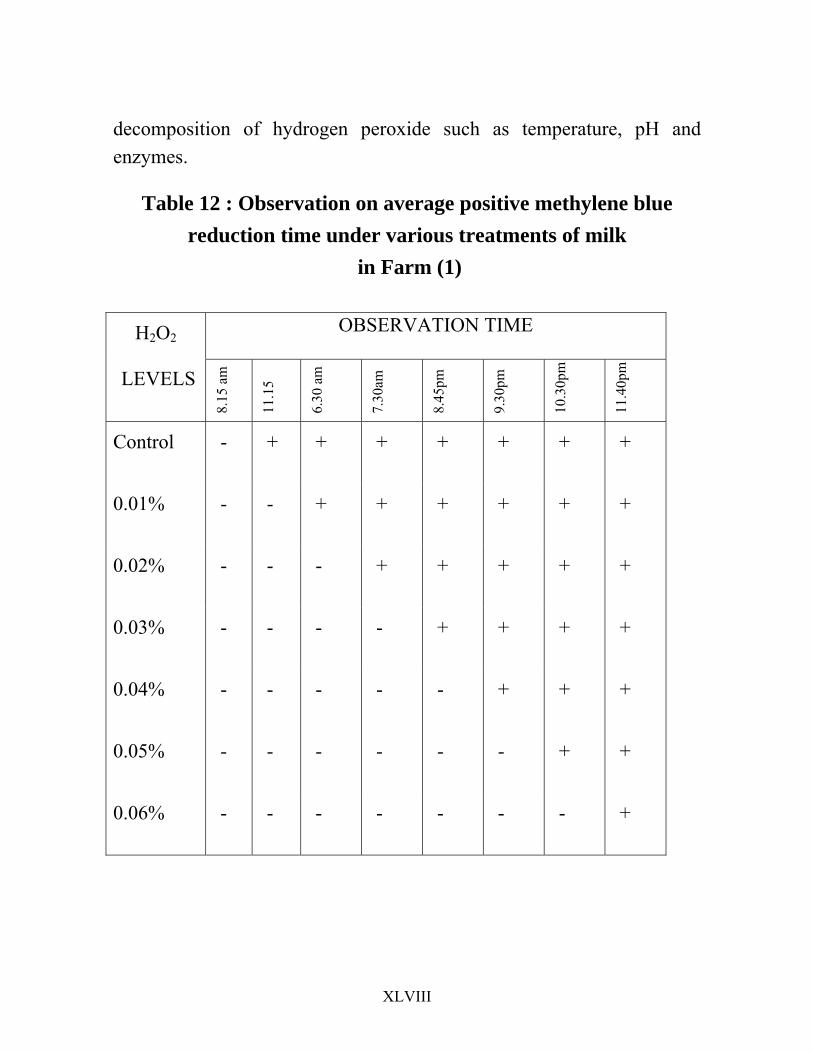
The results of methylene blue reduction test are shown in Tables 12, 13 and 14 for Farms 1, 2 and 3 respectively. From table 12 it is evident that color reduction time of methylene blue test 3 hours, 10 hours and fifteen minutes, 11 hours and fifteen minutes, 12 hours and 30 minutes, 13 hours and fifteen minutes, 14 hours and 15 minutes and 15 hours and 25 minutes for untreated, 0.01, 0.02, 0.03, 0.04 0.05 and 0.06%H2O2 treated milk respectively for Farm (1).
XLVI
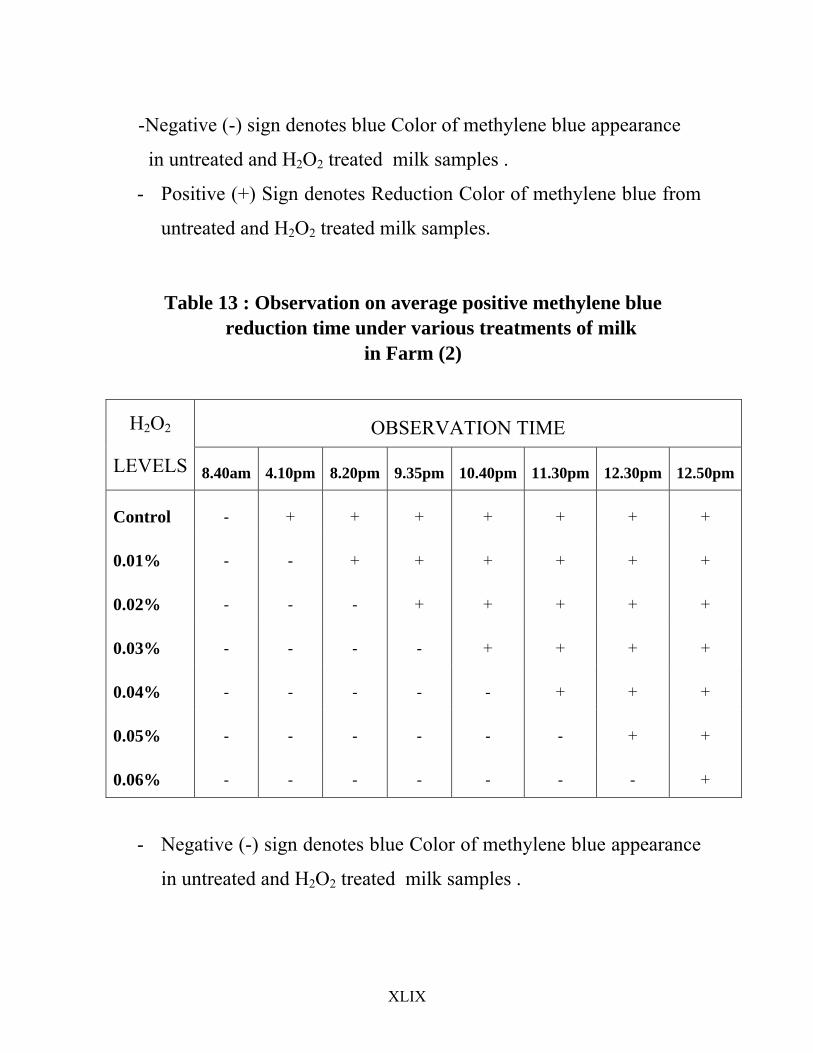
Results in Table 13 (Farm 2) showed that color reduction time of methylene blue test was 7 hours and 30 minutes, 11 hours and 40 minutes, 12 hours and 55 minutes 14 hours, 14 hours and 50 minutes, 15 hours and 50 minutes, 16 hours and 10 minutes for untreated, 0.01, 0.02, 0.03, 0.04, 0.05 and 0.06% H2O2 treated milk samples respectively.
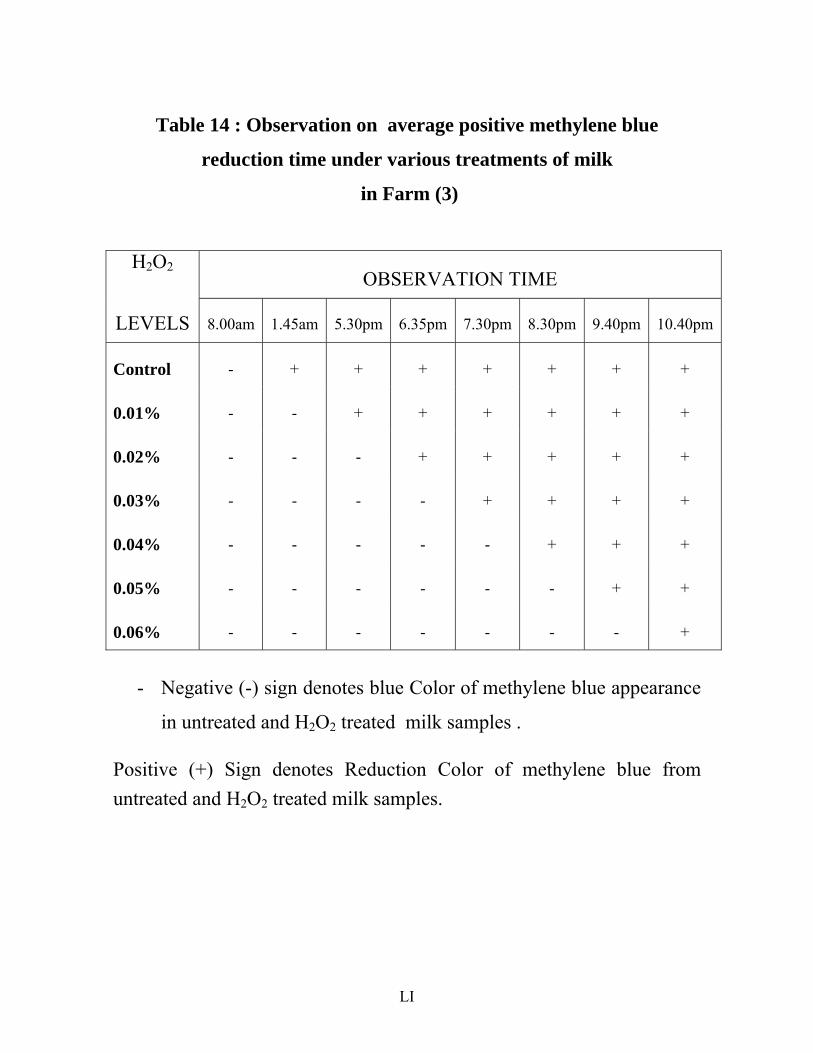
In Table 14 (Farm 3), it is evident that color reduction time of methylene blue test was 5 hours and 45 minutes, 9 hours and 30 minutes, 10 hours and 35 minutes, 11 hours and 30 minutes, 12 hours and 30 minutes, 13 hours and 40 minutes, and 14 hours and 40 minutes for untreated, 0.01, 0.02, 0.03, 0.04, 0.05 and 0.06% H2O2 treated milk samples respectively.
Results indicated that color reduction time of methylene blue for untreated milk samples were shorter than H2O2 treated milk samples. The results of this experiment are in agreement with the findings of Saha, et. al. (2003) who found that color reduction time of methylene blue test was 8, 10, 11, 12, 12, 14 and 14 hours for untreated, 0.01, 0.02, 0.03, 0.04 0.05 and 0.06% H2O2 treated milk respectively. Hossein, et al (1989) found that colour reduction time of metylene blue for H2O2 treated milk samples were more than untreated milk samples.
4.6 Residual H2O2 Test :
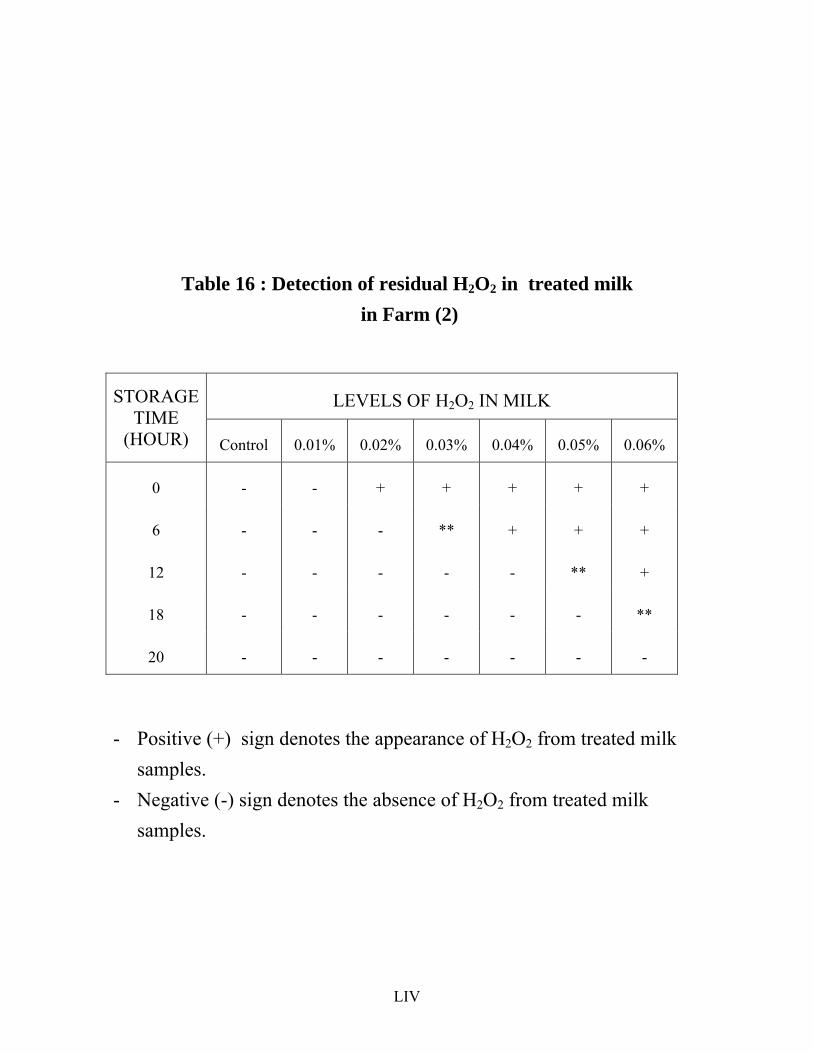
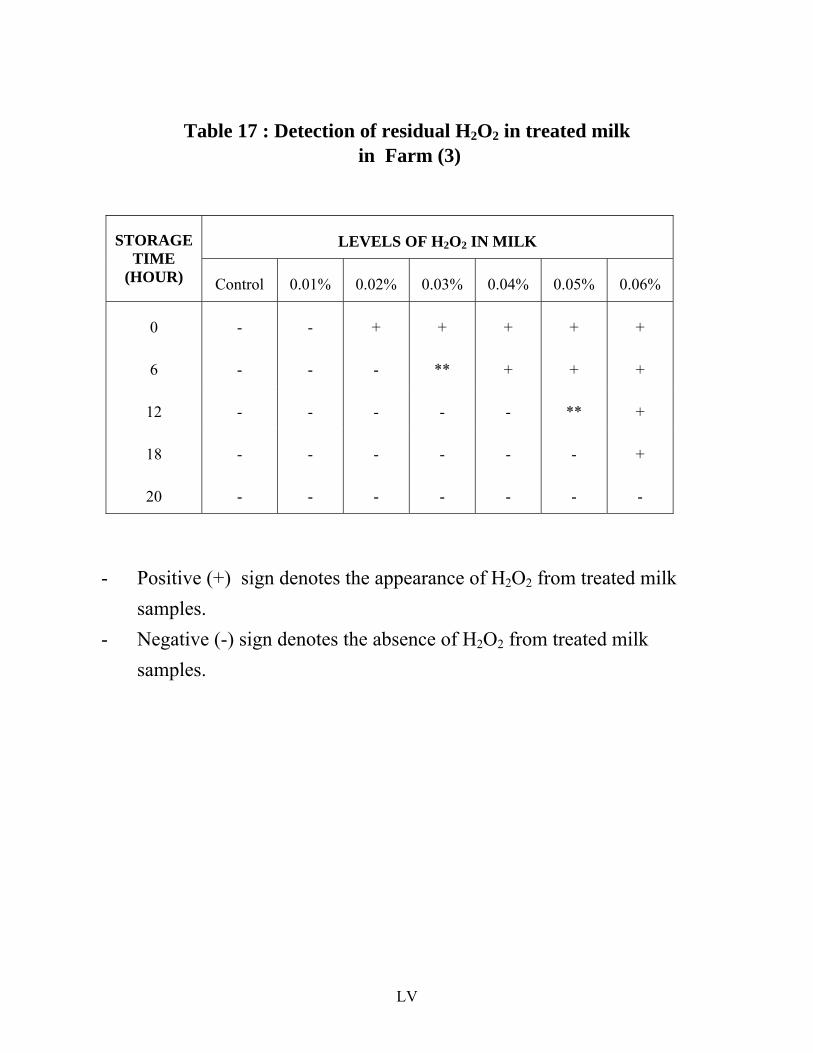
The data on K1 test were given in Table 15, 16 and 17 for Farms 1, 2 and 3 respectively. The results indicated that at zero time of storage, hydrogen peroxide could not be detected in the control and 0.01% H2O2 treated samples, whereby in the other treated samples hydrogen peroxide was present. After 6 hours of storage the
XLVII
results showed that hydrogen peroxide disappeared from the 0.02% H2O2 treated milk samples for Farms 1, 2 and 3, while hydrogen peroxide disappeared from 0.03% H2O2 treated samples after 12 hours for farms 1, 2 and 3. Hydrogen peroxide disappeared from the 0.04% and 0.05% H2O2 treated milk samples after 12 and 18 hours respectively for farms 1, 2 and 3. Hydrogen peroxide disappeared from the 0.06% H2O2 treated milk samples after 24 hours for farms 1, 2 and 3.
The FAO (1957) experts and some authorities in the field (Cook, 1963, Patil, 1980) agreed to the requirement that hydrogen peroxide must be removed from the treated dairy product before the product reaches consumer. Patil (1980) showed that the reduction in the residual hydrogen peroxide content was greatest when the milk was boiled after the addition of hydrogen peroxide. Luck (1956) reported that H2O2 is one of the ideal preservatives because it can be destroyed easily, quickly and completely through addition of catalase (the enzyme which split H2O2) and there is no residual toxic effect after a destruction of hydrogen peroxide. Ibrahim (1970) reported that hydrogen peroxide is added to fresh milk to reduce the bacterial load, excess of hydrogen peroxide can later be removed from milk by the addition of the enzyme catalase. Dirar. (1975) reported that hydrogen peroxide can easily be decomposed to water and oxygen by the action of catalase added or by the catalase naturally found in raw milk.
Santha and Ganguli (1975) reported that different types of milk appear to decompose hydrogen peroxide at different rates, cows milk seemed to decompose hydrogen peroxide faster than buffalo milk and this could be attributed to the higher levels of catalase enzymes in cows milk than buffalo milk. Dirar (1967) reported that many factors are involved in the
XLVIII
decomposition of hydrogen peroxide such as temperature, pH and enzymes.
Table 12 : Observation on average positive methylene blue reduction time under various treatments of milk
in Farm (1)
OBSERVATION TIME H2O2
LEVELS
8.15
am
11.1
5
6.30
am
7.30
am
8.45
pm
9.30
pm
10.3
0pm
11.4
0pm
Control - + + + + + + +
0.01% - - + + + + + +
0.02% - - - + + + + +
0.03% - - - - + + + +
0.04% - - - - - + + +
0.05% - - - - - - + +
0.06% - - - - - - - +
XLIX
- Negative (-) sign denotes blue Color of methylene blue appearance
in untreated and H2O2 treated milk samples .
- Positive (+) Sign denotes Reduction Color of methylene blue from
untreated and H2O2 treated milk samples.
Table 13 : Observation on average positive methylene blue
reduction time under various treatments of milk in Farm (2)
OBSERVATION TIME H2O2
LEVELS 8.40am 4.10pm 8.20pm 9.35pm 10.40pm 11.30pm 12.30pm 12.50pm
Control - + + + + + + +
0.01% - - + + + + + +
0.02% - - - + + + + +
0.03% - - - - + + + +
0.04% - - - - - + + +
0.05% - - - - - - + +
0.06% - - - - - - - +
- Negative (-) sign denotes blue Color of methylene blue appearance
in untreated and H2O2 treated milk samples .

L
- Positive (+) Sign denotes Reduction Color of methylene blue from
untreated and H2O2 treated milk samples.
LI
Table 14 : Observation on average positive methylene blue
reduction time under various treatments of milk
in Farm (3)
OBSERVATION TIME H2O2
LEVELS 8.00am 1.45am 5.30pm 6.35pm 7.30pm 8.30pm 9.40pm 10.40pm
Control - + + + + + + +
0.01% - - + + + + + +
0.02% - - - + + + + +
0.03% - - - - + + + +
0.04% - - - - - + + +
0.05% - - - - - - + +
0.06% - - - - - - - +
- Negative (-) sign denotes blue Color of methylene blue appearance
in untreated and H2O2 treated milk samples .
Positive (+) Sign denotes Reduction Color of methylene blue from untreated and H2O2 treated milk samples.
LII
Hydrogen peroxide concentration 0.05% was chosen in this study as being suitable to preserve milk samples up to 24 hours during transportation from production area to consumption area under ambient temperature (20±7oC) prevailing in the Sudan. This level preserve milk up to 24 hours without the need to add catalase to remove the residual hydrogen peroxide. These results agreed with the findings of Mohi Eldein (1995) who reported that hydrogen peroxide concentrations 0.03% to 0.05% are suitable for controlling the bacterial flora of milk during transportation from farm to consumption area. Gregory et. al. (1961) recommended the level of 0.05% H2O2 for milk preservation during transportation in hot climate. The FAO (1957) experts report had recommended the use of hydrogen peroxide concentration between 0.01% to 0.08% (w/v) for preserving raw milk. Dirar (1975) report that hydrogen peroxide is an effective preservative of raw milk and that milk preserved with hydrogen peroxide compared well with fresh milk, the concentration of 0.06% H2O2 is recommended for preserving raw milk for 9 hours. Saha ea al. (2003) reported that the keeping quality of milk treated with H2O2 increased significantly when compared with untreated milk. It was concluded that 0.04% to 0.05% H2O2 is enough to preserve milk up to 24 hours.
From the results of the above mentioned parameters it is now clear that H2O2 is effective to inhibit the growth of bacteria in raw milk and can be used as a preservative of milk under climatic condition of Sudan. Addition of 0.05% H2O2 to raw milk is enough to preserve it for up to 24 hours.

LIII
Table 15 : Detection of residual H2O2 in treated milk in Farm (1)
LEVELS OF H2O2 IN MILK STORAGE TIME (HOUR) Control 0.01% 0.02% 0.03% 0.04% 0.05% 0.06%
0 - - + + + + +
6 - - - ** + + +
12 - - - - - ** +
18 - - - - - - +
20 - - - - - - -
- Positive (+) sign denotes the appearance of H2O2 from treated milk samples.
- Negative (-) sign denotes the absence of H2O2 from treated milk samples.
LIV
Table 16 : Detection of residual H2O2 in treated milk in Farm (2)
LEVELS OF H2O2 IN MILK STORAGE TIME
(HOUR) Control 0.01% 0.02% 0.03% 0.04% 0.05% 0.06%
0 - - + + + + +
6 - - - ** + + +
12 - - - - - ** +
18 - - - - - - **
20 - - - - - - -
- Positive (+) sign denotes the appearance of H2O2 from treated milk samples.
- Negative (-) sign denotes the absence of H2O2 from treated milk samples.
LV
Table 17 : Detection of residual H2O2 in treated milk in Farm (3)
LEVELS OF H2O2 IN MILK STORAGE TIME
(HOUR) Control 0.01% 0.02% 0.03% 0.04% 0.05% 0.06%
0 - - + + + + +
6 - - - ** + + +
12 - - - - - ** +
18 - - - - - - +
20 - - - - - - -
- Positive (+) sign denotes the appearance of H2O2 from treated milk samples.
- Negative (-) sign denotes the absence of H2O2 from treated milk samples.
LVI
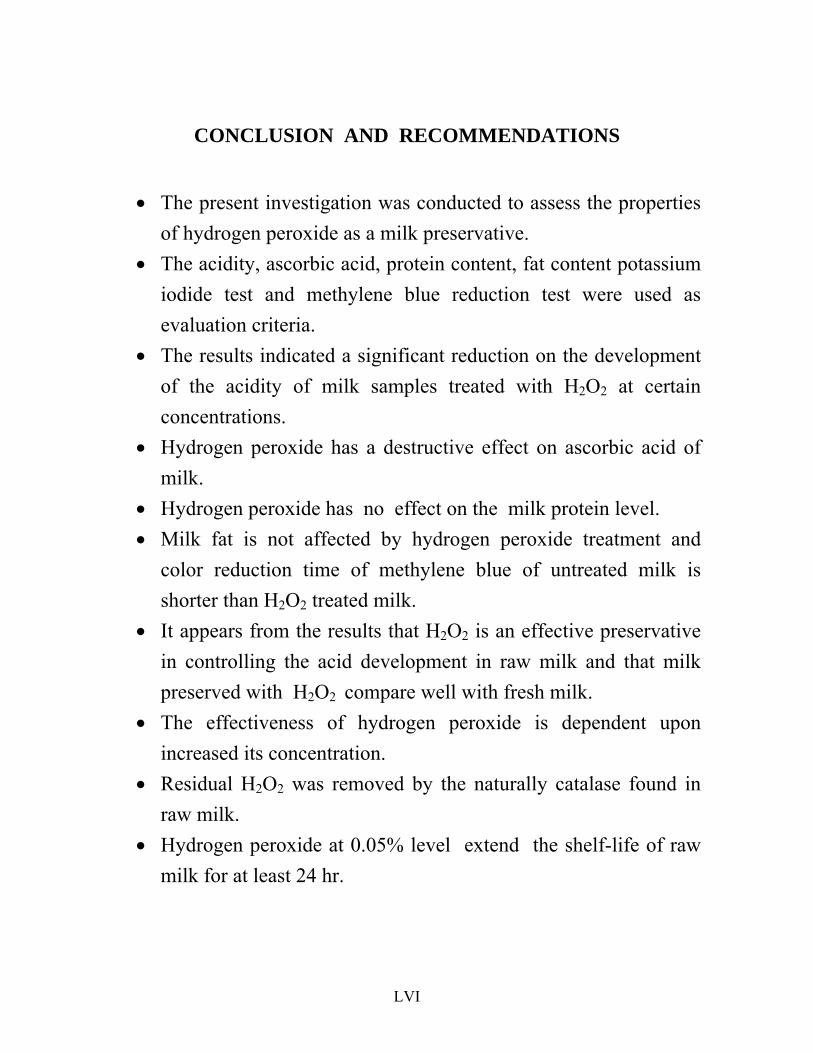
CONCLUSION AND RECOMMENDATIONS
• The present investigation was conducted to assess the properties
of hydrogen peroxide as a milk preservative. • The acidity, ascorbic acid, protein content, fat content potassium
iodide test and methylene blue reduction test were used as evaluation criteria.
• The results indicated a significant reduction on the development of the acidity of milk samples treated with H2O2 at certain concentrations.
• Hydrogen peroxide has a destructive effect on ascorbic acid of milk.
• Hydrogen peroxide has no effect on the milk protein level. • Milk fat is not affected by hydrogen peroxide treatment and
color reduction time of methylene blue of untreated milk is shorter than H2O2 treated milk.
• It appears from the results that H2O2 is an effective preservative in controlling the acid development in raw milk and that milk preserved with H2O2 compare well with fresh milk.
• The effectiveness of hydrogen peroxide is dependent upon increased its concentration.
• Residual H2O2 was removed by the naturally catalase found in raw milk.
• Hydrogen peroxide at 0.05% level extend the shelf-life of raw milk for at least 24 hr.
LVII
REFERENCES
Adesiyum, A.A. (1994). Bacteriological quality and associated public health risk of preprocessed Bovine milk in Trinidad. Int. J. food microbial. 21:253-261.
Ali, A.M. (1988). The pasteurization efficiency of milk. M. Sc. Thesis, University of Khartoum.
AllaGobo, H.I. (1986). Study on quality and microbiology of Gibna Baida. M. Sc. Thesis, University of Khartoum.
Anita, S.W. (2001). The role of milk in the British diet. International J. of Dairy Technology. 54:130.
AOAC (1990). Association of official Analytical Chemists. Official methods of analysis, 15thed. Washington, U.S.A
Babiker, M.E.A. (1987). Technological studies on Sudanese while cheese (Gibna beyda). M.Sc. Thesis. Animal production instit. University of Khartoum.
Bachmann, M. (1975). Practical experience of milk cooling on the farm and milk collection directly from farms. Dairy Sci. Abst. (1976), 38 (7): 468.
Barabas, J. (1994). Milk hygiene with particular reference to milk handling and preservation. Proc. Regional work shop on Raw milk handling and preservation, University of Alexandria, Egypt.
Bodman, G.R. and Rice, D.N. (2004). Bacteria in milk Source and control. Published by Cooperative Extension, Institute of
LVIII
Agriculture and natural resources, University of Nebraska. Pp 12.
Bonfon, B.; Wasem, A.; Troae, A.N; France, A. ; Spillmann, H.; Simble, C.F.; Alfayoukh, I.O.; Nicalit, J.; Farah, Z. and Zinsslage, J. (2003). Microbiological quality of Cows’ milk taken at different intervals from the udder to the selling point in Bamako, (Mali). Food control 147, pp 495-500.
Bramley, A. J. and Mckinnon, C. H. (1990). The microbiology of raw milk In : Dairy Microbiology vol. (1). Robinson, R. K. (ed) Elservier Science publishers, London. Pp 163-208.
Chu, H.D.; Leader, J. G. and Gilbert, S. G. (1975). Immobilized catalase reaction for use peroxide sterilization of dairy products. J. Food Sci, 40: 641-643.
Chye, F. Y.; Aminah, A. and Mohdkan, A. (1994). Microbiological quality of milk produced by three types of milking methods In: proceeding of fifth ASEAN. Food conference, Kuala Lumpur, Malysia, 26-29 July.
Coia, J.E.; Johnston, Y.; Steers, N. J. and Hanson, M. F. (2001). Asurvey of prevelance of Escherichia Coli 0157 in raw meat, raw Cows’ milk and raw cheese in South - East Scotland. Int. J. Food microbial. 66: 63-69.
Collins, E.B. (1967). Use of preservative in milk and dairy products. J. Dairy Sci. 50:599
LIX
Cook, D.J. (1963). Hydrogen peroxide and the worlds, dairy industry 53:37.
Cowan, S.T. and Steel, K.J. (1974). Manual for identification of medical bacteria, 2nd ed., London, Cambridge University Press.
Dirar, H. A. (1975). The use of H2O2 preservation of raw milk. Sudan J. Food Sci. Technol. 7:66-74.
Dirar, H. A. (1967). The use of H2O2 in controlling Pseudomonas fragi in Milk. M. Sc. Thesis, University of Khartoum.
Douglas, G. (1995). Milk history, consumption, production and composition In: Introduction to Dairy Science and technology-professor Douglas Goff, Dairy Science and Technology Education, University of Guslph, Canada, www. Food Sci. uoguelph. Ca/dairy edu/home. Html.
FAO/WHO Expert Committee on food Additives (JECFA). (2004). FAO Nutrition meeting report. Series No. 4A, B. C. Who/Food Add. 167:29.
FAO (2002). FAO Investment Centre (FAO-IC) mission which visited Sudan from 05 May-07 June to assist the government of Sudan in carrying out a socio-economic and marketing study on the dairy subsector.
FAO (1997). Report on Application of membrance and Separation technology to food processing in developing countries.
LX
Proceeding of the Expert Consultation Held in FAO, Rome. From 21-24 October (1996).
FAO (1989). Milking, milk production hygiene and udder health. FAO Animal production, Rome. Health paper 78.
FAO (1957). Report on the meeting of experts on the use of H2O2 and other preservative in milk. FAO/57/11/8655 inter taken. September.
Fish, N. L. and Miekelson, R. (1967). Effect of H2O2 treatment in heat induced interaction of K-Casien and β Lactoglobulin. J. Dairy Sci. 50 (9): 1360-1363.
Foley, J.; Buckley, J. and Murphy, F. M. (1974). Commerial testing and product control in the dairy industry, 1st ed. University College Cork.
Frazier, W. C. and westhoff, D. C. (1981). Food microbiology. 3rd , MC Gram- Hill publishing Company.
Gaafar, A. M. (1992). Effect of H2O2 on the denaturation of whey protein in heated milk. Egyptian J. Food Sci., 20 (3):453-458.
Gehringer, G. (1980). Multiplication of bacteria during farm Storage In: Factor influencing the bacteriological quality of raw milk. International Dairy federation Bulletin, Document 120.
Gomez, K. A. and Gomes, A. A. (1984). Statistical procedures for Agricultural Research. 2nd ed. John Wiley and Sons Inc. New York.
LXI
Gregory, M. E; Henry, K. M. and Kon, S. K. (1961). The effect of H2O2 on the nutritive value of milk. J. Dairy Res. 28:177-182.
Grindrod, J. and Nickorson, T. A. (1966). Change in milk protein treated with H2O2. J. Dairy Sci. 50:142 - 146.
Hassan, M.H. (1985). Factors affecting composition and production of milk in Sudan. Paper presented at work shop of improvement of dairy industry in Sudan, Khartoum (in Arabic).
Havranek, J. L. and Hadziosmonovic, M. (1996). Shelf-life as a requirement for the quality of milk products. Faculty of Agriculture, Zagreb, Croatia. 46 (3): 197-206.
Herschdoerfer, S.M. (1973). Food Science and Technology Quality Control of Food Industry. U.S. 3rd ed. Published by Academic press, New York.
Hogen , J.S. ; Smith, K.L. ; Hoblet, K.H.; Todhunter, D.A. ; Schoenberger, P.S.; Hueston, W.D.; Printechard, D.E.; Bowman, G.L.; Heider, L.E.; Brockett, B.L. and Conrad, H.R. (1989). Bacterial counts in bedding materials used on nine commercial dairies. J. Dairy Sci. 72:250-255.
Hossain, M. S. ; Islam, M. N. ; Mannan, A. K. M. and Husain, S. M. I. (1989). Studies on the preservation of milk with H2O2 . Bang. J. Animal Sci. 18:76-80.
Ibrahim, A. E. (1970). Chemical preservation of milk in Sudan. Sudan J. of Food Sci. and Technol. 2 (1): 31-32.
LXII
Jeffrey, D.C. and Wilson, J. (1987). Effect of mastitis related bacteria on the total bacteria Counts of bulk milk Supplies. J. Soc. Dairy Technol. 40 (2): 23-26.
Kon, S.K. (1972). Milk and Milk products in human nutrition. FAO Nutritional Studies, No 27. FAO, Rome. Cited In: Introduction to Animal Husbandry by Payne W. J. A. 4th ed. (1990).
Kordylas, M. (1990). Processing and preservation of tropical and
subtropical food. Printed in Hong Kong. Published by educated low
priced books Pp 309.
Krukowsky, V. N. (1949). Ascorbic acid oxidation in milk by
preformed H2O2 . J. Dairy Sci. 32:163.
Kurweil, R. and Busse, M. (1973). Total counts bacteria and
microflora of freshly drawn milk. Milch Wissenschaft 28:427.
Low, B.R. (1979). Review of progress of dairy Science enzymes of
psychrotrophic bacteria and their effect on milk and milk
products. J. Dairy Res., 46:573-580.
Loane, P. C. (1969). A rapid test for determining the quality of raw
refrigerated milk. Aust. J. Dairy Technol., 24 (2):66-68.
Luck, H. (1956). The use of hydrogen peroxide as a dairy preservative.
Dairy Sci. Abst. 18: 363.
LXIII
Majewski, T. (1975). Effect of milking and storage condition on the
psychrotropic and mesophilic microflora of milk Dairy Sci. Abst,
38 (6): 360.
Mohy Eldien, S. A. (1995). Preservation of raw milk by hydrogen
peroxide. M. Sc. Thesis, University of Khartoum.
Nambudripad, V. K. N. Laxminarayana, N and Lya, K. K. (1952). Use
of H2O2 for preservation of milk. In : Bactericidal efficiency of
H2O2 . Indian J. Dairy Sci. 5:135-146.
Nickerson, J.T. and Sinskey, A. J. (1974). Microbiology of foods and
food processing. 2nd ed. American elsevier.
O’connor, C.B. (1995). Rural Dairy Technology. International livestock Research institute, Addis ababa, Ethiopia.
Olson, J.C.J. and Mocquat, G. (1980). Milk and Milk Product in : Microbial Ecology of Foods. Vol. 11. Academic press, New York.
Park, I.S. and pack, M.Y. (1977). H2O2 catalase treatment for temporary preservation of milk on small scale dairy farms. Korean J. Appl. Microbial. Bio-Eng., 5:133-141.
Payne, A.J.W. (1990). Introduction to Animal Husbandry in Tropic. 4th ed. Produced by long man Singapora.
Radhakrishnan, B.G. and Srinivason, B.M. (1951). Processing of milk for storage and transport. Indian J. Dairy Sci., 4:81-86.
LXIV
Raj, D. and Singhal, O.P. (1990). Effect of potassium dichromate, mercure chloride and H2O2 on the Gerber fat test. Indian J. Dairy Sci., 43 (3): 364-368.
Rai, M. M. and phil, D. M. (1980). Dairy chemistry and Animal Nutrition. 3rd ed. CAMPUS Agriculture College IN DORE.
Richter, R.L.; Ledfored, R.A. and Murphy, S.C. (1992). Milk and milk products In: Vanderzant, C. and Splittstoesser, D.F. (1992). Compendium methods for the microbiological examination of food. 3rd ed. American Public Health Association, Washington, pp 837-838.
Ruck, J.A. (1963). Publication 1154, Canada, Department of Agriculture (Quoted from Saeed, A.R. (1974). Physical and Biochemical Studies of factors influencing Quality of Mango fruit nectens. Ph.D. Thesis, U. of K).
Ryser, E. T. (1998). Public health concerns In: Math, E. H. and Steel, J. L. (1998). Applied Dairy Microbiology Marcel Dekker, Inc. New York. Pp 263-403.
Saha, B. K.; Ali, M. Y.; Chajraborty, M.; Islam, Z. and Hira, A. K. (2003). Study on the preservation of raw milk with hydrogen peroxide for rural dairy farms. Pakistan, J. of Nutrition. 2(1):36-42.
Santha, I. M. and Ganguli, N. C. (1975). Preservation of Milk with H2O2. Inidian J. Dairy Sci. 28: 140 – 145.
LXV
Siengenhalar, H. (1976). Hydrogen peroxide as a temporary preservation for liquid milk. A world Anim. Rev. , 3:31-34.
Tag-Eldien, H. A. (1985). Schemes for improvement of milk production in Sudan. Paper presented at work-shop for improvement of dairy industry in Sudan-Khartoum (in Arabic).
Thomas, S. B. (1974). The microflora of bulk collected milk. Part I.
Dairy Ind. Int. 39 : 237.
Tolle, A. (1980). The microflora of the udder In : Factors influencing the bacteriological quality of raw milk. International Dairy Federation Bulletin , Document 120 P4.
Vasavada, C. P. (1987). Problems of pathogenic bacteria in the dairy industry. American Dairy Sci. ASSOC., 82ND Annual Meeting, Pp.56.
Von Ruden, K. I; Amin, V. M. and Olson, N. F. (1967). Variability in resistance of coagulase positive Staphylococcus to H2O2 . J. Dairy Sci. , 50:488-492.
Weinstein, B. R. and Trout, G. (1951). The Solar- Activated flavour of Homogenized milk. In : The role f oxidation and the effectiveness of certain treatment. J. Dairy Sci. 34:559.

LXVI