the university of - nottingham
TRANSCRIPT
The University ofNottingham
Department of Civil Engineering
Hysteretic response of an innovative blind
bolted endplate connection to concrete
filled tubular columns
by
ZHIYUWANG
Thesis submitted to the University of Nottingham for
the degree of Doctor of Philosophy
January 2012

IMAGING SERVICES NORTHBoston Spa, WetherbyWest Yorkshire, lS23 7BQwww.bl.uk
MISSING PAGE/PAGESHAVE NO CONTENT

IMAGING SERVICESNORTHBoston Spa, Wetherby
West Yorkshire, lS23 7BQwww.bl.uk
ORIGINAL COpy TIGHTLYBOUND'

IMAGING SERVICES NORTHBoston Spa, WetherbyWest Yorkshire, LS23 7BQwww.bl.uk
BEST COpy AVAILABLE.
VARIABLE PRINT QUALITY
ABSTRACT
Concrete filled steel tubular (CFT) columns can employ the advantages of
both materials: steel and concrete. Connection to such columns, however, is
problematic. This is especially so if the required connection is both bolted and
moment-resisting.
To address this issue, a novel blind-bolted and moment-resisting connection to
CFT column has been developed. This connection uses an innovative blind-
bolt, introduced in previous research at the University of Nottingham and is
termed the Extended Hollobolt (EHB). The EHB has been developed to
provide sufficient tensile resistance and stiffness for the connection to develop
resistance to moment. Previous research work has studied the performance of
this connection under monotonic loading. The performance of such connection
under cyclic loading, however, is not yet investigated. The work presented in
this thesis addresses this gap in knowledge.
This thesis reports on a series of full scale testing of joints consisting of beam
endplates connected to CFT columns using this blind bolt. The test
connections were constructed with relatively thick endplate so as to isolate the
CFT column and the blind bolt as the relatively weak elements in the
connection system. This study focuses on the behaviour of the connections
, with principal failure modes attributed by the blind bolt and the CFT column.
The experiments were conducted to obtain insights into the hysteretic
moment-rotation relationship, available ductility & energy dissipation capacity,
observe typical failure modes, and develop relevant understandings of the
ii
Extended Hollobolt-endplate connection subjected to cyclic loading. The
selected connection details were chosen to examine the influential parameters
of the joint hysteretic moment-rotation behaviour.
From the experimental results, two representative failure modes, bolt fracture
and column face bending failure, were observed and categorized in relation to.
the connection configuration. The connection behaviour are described and
compared with respect to the influences of bolt grade.. cyclic loading
procedure, tube wall thickness and concrete grade.
Based on the experimental hysteretic moment-rotation relationships, an
evaluation of the cyclic characteristics and an analysis' of the cumulative
damage were carried out for the two representative connection categories. The
joint hysteretic moment-rotation response was assessed in term of
degradations of strength, stiffness, ductility, and energy dissipation. The use of
damage levels and stages in the interpretation of damage evolutions for the
connection behaviour is also described in this thesis. The findings of
cumulative damage analysis suggest that the energy based cumulative damage
index outweighs the other indices in characterizing the progressive damage
process of the connections in this study. This is especially the case for those
related to hysteresis loops at repeated cycles of each loading amplitude.
Following the experimental study. 3D nonlinear finite element models of the
connections were developed to analyse the mechanical response of the
connection. The comparison of the numerical and experimental moment-
rotation envelope curve is discussed with respect to related geometric and
material parameters. The connection failure modes and displacement :iii

distributions were further examined as a supplement to the experimental
findings that were necessarily limited by instrumentations.
This work also presents mathematical models for the hysteretic moment-
rotation relationships simulating the loading, unloading and reloading
segments of the hysteresis loops. Characterizing parameters were introduced
to, allow for the softening slope, linear segment slope, and degradations of
. strength and energy dissipation.
This study concluded that the proposed finite element model simulates well
the beh~viour of the connection with good prediction of the moment-rotation
envelope curves and of the failure mode. It is also concluded that the proposed
mathematical models define well the non-linear loading and unloading paths
with reasonable accuracy. It is finally claimed that the Extended-Hollobolt
endplate connection provides a stable improvement in strength and stiffness
under cyclic loading compared with other similar connections.
iv

v

LISTS OF CONTENTS
ABSTRACT ii
LISTS OF CONTENTS vi
LISTS OF TABLES xii
LISTS OF FIGURES : xiiii
NOTATIONS xx
ABBREVIATIONS ......................................................................•............... xxiii
TRADEMARKS xxii
ACKNOWLEDGEMENT ................................•......................................... xxiiii
DECLARATION xxivv
CHAPTER 1 1
1.1 BACKGROUND 1
1.2 JUSTIFICATION FOR THIS RESEARCH 5
1.3 RESEARCH QUESTIONS 9
1.4 RESEARCH AIM AND OBJECTIVES 10
1.5 RESEARCH METHODOLOGIES ; 10
1.6 OUTLINE OF CONTENTS 11
CHAPTER 2 15
2.1 INTRODUCTION 15
. 2.2 PREVIOUS STUDIES ON TENSILE BEHAVIOUR OF BLIND BOLTED
CONNECTIONS 15
2.3 PREVIOUS STUDIES ON MONOTONIC BEHAVIOUR OF BLIND BOLTED
BEAM TO COLUMN MOMENT CONNECTIONS 28
vi
2.4 PREVIOUS STUDIES ON CYCLIC BEHAVIOUR OF BOLTED ENDPLATE
BEAM TO COLUMN CONNECTIONS •••••••••••.•••••••••••••••.••••••••••••••••.••••••••••••.•••••••• 39
2.5 PREVIOUS NUMERICAL STUDIES OF BLIND BOLTED CONNECTIONS .... 55
2.6 PREVIOUS ANALYTICAL MODEL STUDIES OF BEAM- TO-COLUMN JOINTS
56
2.7 CONCLUSION AND NEEDS FOR FURTHER RESEARCH ••.••••••••••••••••••••••• 58
CHAPTER 3 ~ 62
3.1 INTRODUCTION ••••••••••••••••••••••••••••••••••••••••••.••••••••••••••••••••••••••••••••••.••• 62
3.2 TESTING PROGRAM •••••••••.•••.•••.•.•••••••••...•••••••••••••••••••••.••••• :•••••••••••••••63
3.2.1 Connection details 63
3.2.2 Material properties 67
3.2.3 Fabrication a/test specimens 71
3.2.4 Test set-up ·· 73
3.2.5 Instrumentation :..; 79
3.2.6 Quasi-static cyclic loading procedure and control system 88
3.3 MEASUREMENT OF JOINT ROTATION AND MOMENT 91
3.3.1 Joint rotation measurement 91
3.3.2 Joint moment measurement 93
3.4 DETERMINATION OF YIELD POINT FROM FORCE-DISPLACEMENT
CURVES 96
3.5 CONCLUDING REMARKS 99
CHAPTER 4 100
4.1 INTRODUCTION : 100
4.2 FAILURE MODES 100
4.3 HYSTERETIC MOMENT-ROTATION RELATIONSHIPS 114
vii
4.3.1 General moment-rotation behaviour 114
4.3.2 Effect of blind bolt grade 123
4.3.3 Effect of cyclic loading procedure 124
4.3.4 Effect of tube wall thickness 125
4.3.5 Effect of concrete grade 126
4.4 STRAIN PROFILES OF RELEVANT CONNECTION COMPONENTS ••••...... 127
4.4.1 Strain profile of steel beam and endplate 128
4.4.2 Strain profile of tube sidewall face and connecting face 133
4.4.3 Strain profile of blind bolt ' 138
4.5 CONCLUDING REMARKS •••: 140
Cl-{APTER 5 142
5.1 INTRODUCTION 142
5.2 CYCLIC CHARACTERIZING PARAMETER ANALYSIS 143
5.2.1 Resistance ratio J 45
5.2.2 Energy dissipation ratio J48
5.2.3 Stiffness deterioration ratio 150
5.3 ASSESSMENT OF CONNECTION DUCTILITY 152
5.4 CUMULATIVE DAMAGE MODEL ANALYSIS 154
5.4.1 Basic procedures in the definition of damage model J54
5.4.2 Damage indices 158
5.4.3 Damage model analysis of experimental results 166
5.5 CONCLUDING REMARKS 179
Cl-{APTER 6 182
6.1 INTRODUCTION 182
6.2 GENERAL DESCRIPTION OF FINITE ELEMENT MODEL 184
viii
6.2.1 Element type 184
6.2.2 Concrete failure criteria and modelling 190
6.2.3 Material model 193 .
6.2.4 Boundary condition and modelling techniques 197
6.2.5 Finite element model illustration 199
6.2.6 Loading condition and solution 204
6.3 FINITE ELEMENT ANALYSIS RESULTS 206
6.3.1 Blind bolt preload 207 .
6.3.2 Stress distribution and failure modes identification 209
6.3.3 Comparison of strain results ·219
6.3.4 Comparison of moment-rotation curves 223
6.3.5 Comparison of tube deformation results 228
6.3.6 Summary of FE modelling results 235
6.4 PARAMETER VARIATION ANALYSES 235
6.4.1 Influence of concrete grade 236
6.4.2 Influence of tube wall thickness 238
6.4.3 Discussion on combined influence of concrete grade' and tube
wall thickness 239
6.5 CONCLUDING REMARKS 241
CHAPTER 7 244
7.1 INTRODUCTION 244
7.2 MATHEMATICAL REPRESENTATIONS OF MOMENT-ROTATION
ENVELOPE 245
7.2.1 Eurocode 3 based trilinear r~presentation 246
7.2.2 Power representation 248
. ix
7.2.3 Exponential representation 251
7.3 RELATED MATERIAL CYCLIC MODELS FOR CONNECTION COMPONENTS
253
7.4 DEVELOPMENT OF HYSTERETIC MOMENT-ROTATION MODEL ••••••••••255
7.4.1 Basic envelope curve 255
7.4.2 Hysteretic moment-rotatio,n models 256
7.5 VALIDATION OF PROPOSED HYSTERETIC MOMENT-ROTATION MODEL
273
7.6 CONCLUDING REMARKS 277
CHAPTER 8 280
8.1 CONCLUSIONS FROM CURRENT RESEARCH PROGRAMME 280
8.2 RECOMMENDATIONS AND FUTURE WORK 284
REFERENCES 288
PUBLICATIONS 304
APPENDIX A Rotation measurements in reported cyclic loading tests 306
APPENDIX B Bolt shank tensile test ; 311
APPENDIX C General yield and failure criteria for finite element analysis 312
APPENDIX D Cyclic material models of steel and concrete 318
D I. MATERIAL CYCLIC MODEL OF STEEL 318
02. MATERIAL CYCLIC MODEL OF CONCRETE 320
x
LISTS OF TABLES
Table 1.1 Classification of connection components in terms of ductility anddissipative capacity (Faella et ai, 2000) 8
Table 2.1 Typical blind fasteners (Corus Tubes library, 2005) 16
Table 2.2 Representative experimental studies on blind bolted T-stubconnection subjected to tensile loading 19
Table 2.3 Representative experimental studies on blind bolted beam to columnmoment connections subjected to monotonic loading 29
Table 2.4 Representative experimental studies on bolted endplate momentconnections subjected t~ cyclic loading .42
Table 2.5 Representative experimental studies on bolted endplate momentconnections subjected to low cyclic fatigue loading 52
Table 3.1 Details of the test connections 65
Table 3.2 Details ofSHS and beam section 66
Table 3.3 Geometric details ofa sample MI6 Extended Hollobolt 67
Table 3.4 Material properties of connection components 69
Table 3.5 Concrete mixture proportions and curing condition 71
Table 3.6 Concrete infill compressive strengths (N/mm2) 71
Table 3.7 Summary of electrical resistance strain gauges used in the tests 81
Table 3.8 Summary of representative yield point determination methods 96
Table 4.1 Connection categories, test failure modes and yield rotation &moment 117
Table 4.2 Test moment & rotation at maximum moment & peak rotation 117
Table 4.3 Test initial and secant stitTnesses 118
Table 5.1 Summary of cyclic characterizing parameter expressions 145
Table 5.2 Classification of damage level and related index (Park et al.1985) 157
Table 5.3 Observed damage stages for connection category I(weak blind bolt& strong CFT column) 173
Table 5.4 Observed damage stages for connection category II (strong blindbolt & weak CFT column) 174
Tabl.e6.1 Comparison of experimental and numerical maximum moment ...223
xi

Table 6.2 Comparison of experimental and numerical initial stiffness 224
Table 6.3 Ratios of experimental and numerical results 224
Table 6.4 Model limitations 243
Table 7.1 Parameters for mathematical representations 250
Table 7.2 Summary of test calibration parameters 274
xii
LISTS OF FIGURES
Figure 1.1 Components of an Extended Hollobolt 3
Figure 2.1 Representative tensile test of blind bolted (Lindapter Hollobolt) T-stub assembly (Barnett, 2001) 19
Figure 2.2 Representative tensile test of blind bolted (Lindapter Hollobolt) T-stub to SHS column without concrete infill (Barnett, 2001) 20
Figure 2.3 Representative tensile and compression test of blind bolted (AjaxOne-side) T-stub to SHS column without concrete infill (Lee et al, 2010) .... 22
Figure 2.4 Representative tensile test of blind bolted (Standard bolt, LindapterHollobolt, Extended Hollobolt) T-stub to CFT column (Ellison & Tizani,2004) 23
Figure 2.5 Load-displacement relationship of tensile pull-out tests (Ellison &Tizani, 2004) 23
Figure 2.6 Representative tensile test of blind bolted (Ajax One-side withcogged extensions) T-stub to CFT column (Gardner and Goldsworthy,2006) 25
Figure 2.7 Cyclic loading history used in Gardner & Goldsworthy's test(2005) 25
Figure 2.8 Representative tensile test of blind bolted (Ajax One-side withcogged extensions) T-stub to CFT column (Yao et al, 2008) 28
Figure 2.9 Representative test of blind-bolted (Lindapter Hollobolt) beam-to-column moment connections under monotonic loading (Loh et aI, 2006) 32
Figure 2.10 Representative test set-up for blind-bolted (Lindapter Hollobolt)beam-to-column moment connections under monotonic loading (Wang et ai,2009) 33
Figure 2.11 Representative' test of blind-bolted (Extended Hollobolt) beam-to-column moment connections under monotonic loading (AI-Mughairi,2009) 35
Figure 2.12 Representative test of blind-bolted (Lindapter Hollobolt) beam-to-column angle connections under monotonic loading (Elghazouli et al,2009) 38
Figure 2.13 Representative test of blind-bolted (Ajax One-side) beam-to-column moment connections under monotonic loading (Lee et al, 2011) ...... 38
Figure 2.14 Representative test of bolted (standard bolt) endplate beam tocolumn connections under cyclic loading (Nogueiro et al, 2006) :50
xiii
Figure 2.15 Representative test of bolted (standard bolt) endplate beam tocolumn connections u!lder cyclic loading (Shi et aI, 2007) 50
Figure 2.16 Cyclic loading histories for cyclic loading and low-cycle fatiguetests (Note: references are given in text) 53
Figure 3.1 Illustration of joint configuration and loading arrangement. 63
Figure 3.2 Illustration of blind bolt tightening sequences 72
Figure 3.3 Tightened blind bolts in SHS column ; 72
Figure 3.4 Illustration of a representative test set-up 75
Figure 3.5 Photograph ofa representative test set-up 76
Figure 3.6 Photograph of loading arrangement 78
Figure 3.7 Illustration of reaction buttress designed for actuator 78
Figure 3.8 Illustration of representative test instrumentations 80
Figure 3.9 Representative strain gauged blind bolt before tightening 81
Figure 3.10 Photograph of strain gauge pattern on tube connecting face 84
Figure 3.11 Photograph of strain gauge pattern on tube sidewall face 84
Figure 3.12 Photograph of potentio-meter arrangement on tube connectingface 85
Figure 3.13 Photograph ofLVDT arrangement on steel beam 85
Figure 3.14 Calibration of the load cell fitted into actuator 87
Figure 3.15 Data logger and computer link system 87
Figure 3.16 Illustration of cyclic loading procedures 89
Figure 3.17 Display of Servocon loading controller 90
Figure 3.18 Schematic graph of joint rotation relationships 93
Figure 3.19 Illustration of geometric relationship of linkage system and steelbeam 94
Figure 3.20 Illustration of force transfer relationship of linkage system andsteel beam , 95
Figure 3.21 Illustration of representative yield point determinationmethods 98
Figure 4.1 Representative deformation mode of connection category 1....•• 102
Figure 4.2 Representative deformation mode of connection category II.. .... 103
xiv
Figure 4.3 Bolt shank failure mode 104
Figure 4.4 Representative yielding propagation on CFT column faces forconnection category 1. 105
Figure 4.5 Representative yielding propagation on tube for connectioncategory II (Specimen: BBEC-5-8.S-50-LII) ; 106
Figure 4.6 Representative yielding propagation on tube for connectioncategory II (Specimen: BBEC-6.3-8.8-25-LII) .107
Figure 4.7 Representative failure mode of concrete infill after striping awaylocal tube faces (Specimen: BBEC-6.3-S.S-50-LII) 108
Figure 4.8 Representative failure mode of concrete infill after striping awaylocal tube faces (Specimen: BBEC-6.3-S.S-25-LII) .109
Figure 4.9 Photograph series for joint response of specimen BBEC-S-IO.9-50-LI (connection category J) ..................•................•..................... .112
Figure 4.10 Photograph series for joint response of specimen BBEC-5-S.S-50-LII (connection category II) .113
Figure 4.11 Comparison of calculated moments based on the LVDrmeasurement and theoretical prediction ...............•.......................... .115
Figure 4.12 Comparison of moment-rotation relationships of specimen BBEC-6.3-S.S-25-LII based on the measurement of LVDT-DB1 and DB2 116
Figure 4.13 Hysteretic moment-rotation curves for test specimens .121
Figure 4.14 Comparison of hysteretic moment-rotation relationships ofspecimens BBEC-8-8.8-50-LI and BBEC-8-l0.9-50-LI.. .123
Figure 4.15 Comparison of hysteretic moment-rotation relationships ofspecimens BBEC-8-1 0.9-50-LI and BBEC-S-l 0.9-50-LII 124
Figure 4.16 Comparison of hysteretic moment-rotation relationships ofspecimens BBEC-5-8.S-50-LII, BBEC-6.3-8.S-50-LII and BBEC-8-S.S-50-LI. 125
Figure 4.17 Comparison of hysteretic moment-rotation relationships ofspecimens BBEC-6.3-8.8-25-LII and BBEC-6.3-S.S-50-LII 126
Figure 4.1S Representative beam & endplate strain profile of BBEC-6.3-S.8-50-LII (connection category J) .129
Figure 4.19 Representative beam & endplate strain profile of BBEC-6.3-8.S-25-LII (connection category II) .. ·······.· ; 132
Figure 4.20 Representative tube strain profile of BBEC-8-10.9-50-LI(connection category I) ; 135
xv
Figure 4.21 Representative tube strain profile of BBEC-5-8.8-50-LII(connection category II) 136
Figure 4.22 Representative bolt strain profile of BBEC-8-10.9-S0-LI(connection category I) 139
Figure 4.23 Representative bolt strain profile of BBEC-5-8.8-50-LII(connection category II) ; 140
Figure 5.1 Basic parameters of an idealized hysteretic cycle (ATC-24, 1992;ECCS, 1986) 144
Figure 5.2 Relationships of resistance ratio versus partial ductility ratio .... .147
Figure 5.3 Relationships of energy dissipation ratio versus partial ductilityratio for connection category 1. ; 148
Figure 5.4 Relationships of energy dissipation ratio versus partial ductilityratio for connection category 11 149
Figure 5.5 Relationships of stiffness degradation ratio versus partial ductilityratio 151
Figure 5.6 An example of comparing ductility classified indices versus testhysteretic moment-rotation relationships 153
Figure 5.7 Relationship of damage index and damage parameter 155
Figure 5.8 Illustration of PHC and FHC in Kraetzig damage index 163
Figure 5.9 Damage model evaluations for specimen BBEC-8-8.8-50-LI. 168
Figure 5.10 Damage model evaluations for specimen BBEC-8-10.9-50-LI..168
Figure 5.11 Damage model evaluations for specimen BBEC-S-8.8-50-LII ..171
Figure 5.12· Damage model evaluations for specimen BBEC-6.3-8.8-25-LII 171
Figure 5.13 Comparison of observed damage stages and Park & Ang damagelevels for connection category 1 176
Figure 5.14 Comparison of observed damage stages and Park & Ang damagelevels for connection category 11 177
Figure 5.15 Comparisons of damage index ratio versus partial ductility ratiorelationships .. 1,.". It ••• II ••• t •••• II I" ••••• ,, ••••••••• II. II. It II"" •••• II II ••• II I" .179
Figure 6.1 Typical procedure for finite element analysis .183
Figure 6.2 Schematic of SHELL 181 (ANSYS@Academic Research,2009) 185
Figure 6.3 Schematic of SOLID65 (ANSYS@Academic Research, 2009) ..186
xvi
Figure 6.4 Schematic ofSOLID185 (ANSYS@Academic Research; 2009) 187
Figure 6.5 Schematic ofBEAM188 (ANSYS@Academic Research, 2009) 188
Figure 6.6 Schematic of contact pair (ANSYS@Academic Research,2009) 188
Figure 6.7 Schematic of PRETS179 (ANSYS@Academic Research, 2009)and preload action in blind bolted connection 190
Figure. 6.8 Concrete cracking condition adopted in ANSYS(ANSYS@Academic Research. 2009) .191
Figure 6.9 Failure surface in principal stress space in nearly biaxial stress state(ANSYS@Academic Research, 2009) 193
Figure 6.10 Actual and true stress-strain relationship for tubular columns 195
Figure 6.11 Actual and true stress-strain relationship for beam and endplate(Al-Mughairi, 2009) .195
Figure 6.12 Actual and true stress-strain relationship for blind bolts (AI-Mughairi, 2009) .195
Figure 6.13 Stress-strain relationship of concrete with varying grades 197
Figure 6.14 Typical finite element meshes for blind bolt assembly 200
Figure 6.15 Typical finite element model with partitioned components 202
Figure 6.16 Finite element models of blind bolts anchored in concreteinfill. 203
Figure 6.17 Stress contours of tube connecting face, endplate and blind bolt(bolt preload phase) 208
Figure 6.18 Strain contours of overall connection and concrete infill (boltpreload· phase)
................................................................................. 208
Figure 6.19 Comparison of strains obtained from experiments, finite elementanalysis and literature report (Al-Mughairi, 2009) 209
Figure 6.20 Von Mises stress contours of test connections 212
Figure 6.21 Von Mises stress contours of blind bolts 213
Figure 6.22 Von Mises stress contours of tube sidewall and connectingfaces 217
Figure 6.23 Von Mises stress contours of concrete infill 218
Figure 6.24 Comparison of experimental and numerical moment versus straincurves for tube connecting face of specimen BBEC-8-1 O.9-50-LI. 220
xvii
Figure 6.25 Comparison of experimental and numerical moment-strain curvesfor blind bolts 222
Figure 6.26 Sensitivity analysis- No. elements of tube wall (T) & concrete(C) 224
Figure 6.27 Comparison of test and numerical moment-rotation curves 226
Figure 6.28 Illustration of representative path at the first bolt row 229
Figure 6.29 Comparison of tube UX displacements along assigned path at thefirst bolt row 230
Figure 6.30 Comparison of maximum deformation of tube connecting face atthe first bolt row 232
Figure 6.31 Comparison of tube UX displacement along assigned path at thefirst bolt row 234
Figure 6.32 Comparison of numerical results for varying concrete grades ...237
Figure 6.33 Comparison of numerical results for varying tube wallthickness: 238
Figure 6.34 Numerical results of maximum moment capacity with varying'tube wall thickness and concrete strength ~ 240
Figure 6.35 Comparison of monotonic moment-rotation relationships ofsimilar connections with varying tube wall thickness (AI-Mughairi, 2009) ..241
Figure 7.1 Trilinear representation of moment-rotation curve suggested byEurocode 3 (2005) 247
Figure 7.2 Comparison of trilinear representations and test envelope curves(Test No.1 & No.4) 248
Figure 7.3 Illustration of representative moment-rotation curves 249
Figure 7.4 Comparison of power representations and test envelope curves(Test No.1 & No.4) 250
Figure 7.5 Comparison of finite element model based power representationsfor the curve with or without softening branch (Test No.4) 251
Figure 7.6 Comparison of representative exponential representations and testenvelope curves (Test No.1 & No.4) .252
Figure 7.7 Comparison of exponential representations for the curve with orwithout descending branch (Test No.4) 253
Figure 7.8 Illustration of linear assembling method of connectioncomponents , 254
Figure 7.9 Envelope curves for hysteretic moment-rotation models 255
xviii
Figure 7.10 Hysteretic moment-rotation model for the connection category1. ; 260
Figure 7.11 Strength degradation ratio and energy degradation ratio versuspartial ductility ratio for the connection category 1(Note: test data are obtainedfrom related experiments) 263
.Figure 7.12 Hysteretic moment-rotation model for the connection category11 267
Figure 7.13 Relation between KO.i and ,u'i for the connection category 11..... 269
Figure 7.14 Strength degradation ratio and energy degradation ratio versuspartial ductility ratio for the connection category 11.. 270
Figure 7.15' Hysteretic moment-rotation experimental and numerical curvesfor the connection category 1. 275
Figure 7.16 Hysteretic moment-rotation experimental and numerical curvesfor the connection category II 276
xix
NOTATIONS
Special symbols adopted are not summarized below, but their explanations are
included in the text
41r,Oy~00~OcOxd&Ocd
~u
Oed
Oul,i
~As,h
Oo/&Ooi(.:lIJp)i+. (.:l Op)i-
(.:l Opm)i+.(.:l Opm)i-(.:lOt)i+.(JOt)i_AwALb
BacTr,r;FJFRd,b & 6Rd,b
FRd,c
Itle'It
yielding displacementcalculated displacement value for damage indexplastic deformationthreshold displacement value and critical displacementvalue of basic damage parametersmaximum response deformationjoint yielding forcejoint yielding rotationjoint rotationoverall rotationbeam deformationcolumn rotationrotation corresponding to the moment first reachingmaximum load level and final part ofthe curve endsrespectivelyreloading rotation at loading stage 2rotation corresponding to the point on the envelope curveRotation for this linear segmentcalibration parameter suggested in Eurocode 3strain hardening coefficient for hardening modulusRotation at beginning of excursion i+& i-Un-deteriorated plastic deformation range of excursion i+&i-Measured plastic rotation range of excursion i+& i-Total rotation range for excursion i+& i-area of the beam webstrength constant for cyclic model of bolt in tensiondistance along the beam from the column flange face toloading pointhorizontal movement of the hydraulic actuatorhorizontal force from hydraulic actuator.Linkage transferred force normal to beam flangeLinkage transferred force tangent to beam flangeLinkage axial forcedesign resistance and its associated displacement for boltdesign resistance ofthe eFT column facesultimate, uniaxial tensile strengthuniaxial compressive strengthultimate compressive strength for a state of biaxialcompression superimposed on hydrostatic stress state
xx
c
s;E +/-& E +1-
pI fi
Es,bEs,cdEEcninsiNNfi
a,b¢>and c~Ai&Afi
IID(.,,)
0"1, 0"2, 0"3
0""" (J'y, (J'z, T"y'
Txz, Tzy
(J'"P' (J'yp, (J'ZP
(J'e
(J't&Et
(J'en&Een
(J't• •
(J' r&E r(J't &(J'cy y
EO
Ecm & £loc
JlM & JluJlid&,1dd&dc
experimental constant in general fatigue based linearcumulative damage indexenergy dissipated at ith cycleenergy dissipated in primary cycles and follower cyclesrespecti ve IyYoung's modulus of the bolt materialinitial tangent modulus of elasticityincremental absorbed hysteretic energyelastic modulus of concretecycle number for damage modelnumber of cycles at the i-th displacement amplitudeshape factor for curve correlationaverage number of cycles to failure at the i-th displacementamplitudescaling exponent controlling the smoothness of the transitionof excursion branchcalibrating parameters for damage indices calculationangle ofintemal friction and cohesion respectivelycalibrating parameter for cyclic loadingdisplacement amplitudes corresponding to nsi and Nflrespectivelysecond invariants of the deviatoric stress tensor for yieldcriteria analysissecond invariants of the deviatoric stress tensordamage indices described in Chapter IVprincipal stressesstress tensor components
stresses on failure surface in principal stress space relating toconcrete material modelyield stresstrue stress & strainengineering stress & straintrue stress & strainresidual stress and strain respectivelyyield stresses for tension and compression loadingrespectivelyconcrete strain corresponding to the peak compressivestrengthunloading strain on the envelope curve and the strain atwhich stress drops to O.21c' respectivelyductility ratios corresponding to OM and Du respectivelypartial ductility ratio .plastic strain increment tensorductility component and energy component for damageindicesplastic multiplier which defines the amount of plasticstraining
xxi

Q
~FS
consecutive stiffness deterioration and energy dissipationreduction factor when E is greater than Eo
function of stress termed the plastic potential whichdetermines the direction of plastic strainingshear transfer coefficient in concrete material modela function of the principal stress state «(Txp, (Typ, O'zp)failure surface expressed in terms of principal stresses andfive input parameters
ABBREVIATIONS
CFT
AISC
ECCS
FEMA
SHS
BBEC
ND
ADLVDTDCLDCMDCHPHCFHCFE}
FE2
concrete filled steel tube (tubular)
American Institute of Steel Construction
European Convention for Constructional Steelwork
US Federal Emergency Management Agency
square hollow sectionblind bolted endplate connection
nominal geometric details
actual geometric detailsLinear Variable Differential Transformer
low ductility class
medium ductility classhigh ductility classprimary half cyclefollower half cyclefinite element model with solid elementsfinite element model with solid & beam elements
TRADEMARKS
Huck High Strength Blind Bolt (HSBB) and Huck Blind OversizedMechanically Locked Bolt (BOM) are trademarks of Huck International, USAFlowdrill is a trademarks ofFlowdrill B.V, The NetherlandsAjax One-side is a trademarks of Ajax Fasteners, Australia
Lindapter Hollobolt is a trademarks of Lindapter International, UK
xxii

ACKNOWLEDGEMENT
First I would like to thank my supervisor, Dr. Walid Tizani, for his thoughtful
guidance, patience, and constructive criticism throughout the course of this
study. I would also like to acknowledge helpful suggestions provided by Dr.
John Owen, and Dr. Iman Hajirasouliha for experimental work and Prof. Carlo
Sansour for numerical modelling.
There are some special thanks extended to the technical staff who helped in
the development of the project, notably Mr. Gordon Hardy who helped with
coordination for the fabrication of reaction buttress and debugging testing
equipments, Mr. James Bellis and Mr. Bal Loyla who constructed the test rig
and installed instrumentations for the experimental work. Also, sincere
gratitude is extended to, Mr. Michael Langford, Mr. Nigel Rook, Mr. Damien
Goy, and Mr. Andrew Maddison, for their general assistance,
This research work is supported with resources from Tata Steel (formally
Corus) and Lindapter International. The helpful advice and support of Mr
Trevor Mustard and Mr Andrew Orton of Tata Steel and of Mr Neil Gill of
Lindapter are gratefully acknowledged.
Financial support from 'UK/China Scholarship for Excellence' programme
that sponsored me for this project is gratefully acknowledged. I would also
like to thank Prof. Qingyuan Wang of Sichuan University for his support.
My deepest appreciation and love are extended to my family members for
their kind concern and warm encouragement.
xxiii

DECLARATION
I declare that, except where cited in the text, all work contained within this
thesis is my own original work, under the direction of my supervisors and the
industrial sponsors. The work presented herein was perfo~ed at the,
University of Nottingham between September 2008 and January 2012. This
thesis has not been submitted to any institution other than the University of
Nottingham for the degree of Doctor of Philosophy.
xxiv

xxv

Chapter 1:Introduction
CHAPTERl
INTRODUCTION
1.1 Background
In this research, there are three related structural engineering issues: the use of
concrete filled steel tubular (CFT) columns, the use of blind bolts for moment
resisting beam to column connection system under monotonic and cyclic
loading conditions. A brief description of these three issues will be presented
below.
In the building industry, steel moment resisting frames (also called moment
frames) are gaining popularity for the clear span and architectural freedom
they provide. The open section and closed section columns are mostly used in
the frame system. The use of circular and rectangular hollow sections as
typical closed sections has attracted more attentions in recent years due to high.
strength to weight ratio and lower fire protecting costs (AISC Steel
Construction Manual, 2005). The concrete infill into the closed section
columns as CFT columns greatly enhances the load carrying capacity as
compared with bare steel columns. The merits of steel and concrete are
favourably employed as the concrete infill effectively prevents local buckling
of the steel hollow section tube and the confinement of the hollow section tube.
The available stiffness and compressive strength of the concrete are also
improved. Moreover, the material costs of composite sections will be reduced
through the use of reduced column size. Additionally, the presence of the
concrete infill acts as a heat sink enhancing the fire resistance of the composite
1
Chapter 1:Introduction
section. Hence, the CFT columns combine the advantages of the ductility of
steel hollow section tube and the compressive strength of concrete infill. In
steel moment resisting frames, CFT columns have been considered in design
as vertical structural elements with a high strength to weight ratio. The
excellent monotonic resistance ofCFT column under biaxial bending and axial
force has been recognized in reported experimental studies (Tsai et al,2003).
The beam to column connections in steel moment resisting frames tend to
introduce welding and bolting configurations, favoured by industry and
academia in different regions. With regard to the moment resisting frames
with open section column, most American and Japanese investigations were
concerned about the welded connections (AISC Steel Construction Manual,
2005), while the typical European practices prefer shop welding and on site
bolting to site welding so as to avoid welding errors and minimize labour costs.
The good practice of bolted connection in the construction with open section
columns has encountered a problem in extending its further use to hollow
section columns due to the lack of free access, unless the connections are
located in the vicinity of the open end of a closed section member. This
problem was well recognized in the late 1990s. As a solution, blind bolts have
been developed to be used in applications where access for installation is from
one side of the connection only, as in the case of connecting the endplate of a
beam to a hollow section (Tabsh et 01, 1997; Barnett, 2001).
More recently, an innovative blind bolt have been developed on the basis of
the Lindapter Hollobolt at the University of Nottingham (Tizani & Ridley-
Ellis, 2003). The configuration of this blind bolt is featured by extended bolt
2
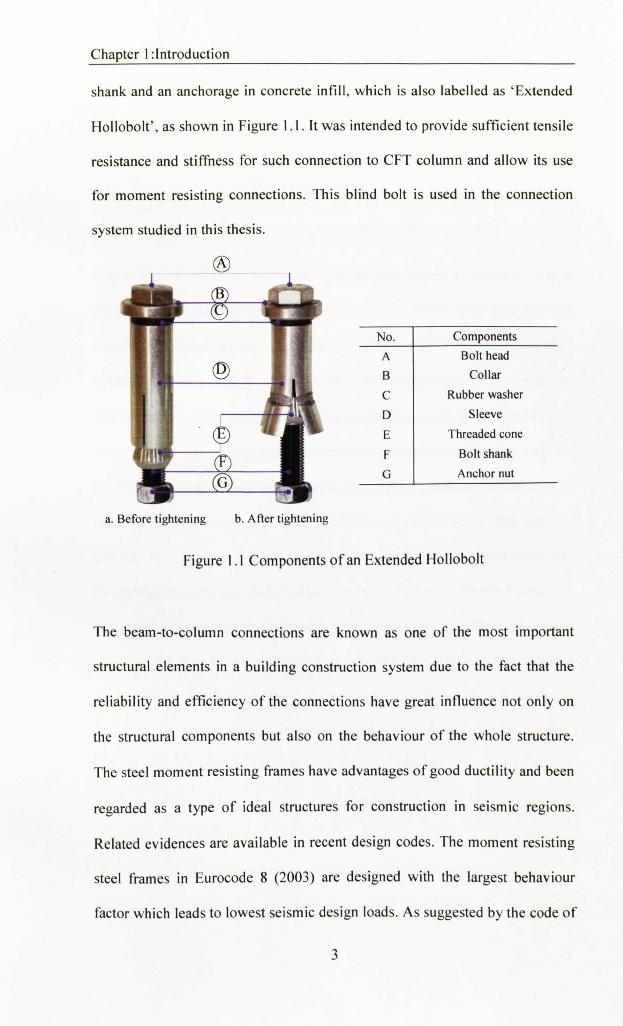
Chapter 1:Introduction
shank and an anchorage in concrete infill, which is also labelled as 'Extended
Hollobolt', as shown in Figure 1.1. It was intended to provide sufficient tensile
resistance and stiffness for such connection to CFT column and allow its use
for moment resisting connections. This blind bolt is used in the connection
system studied in this thesis.
a. Before tightening b. After tightening
No. Components
A Bolt head
B Collar
C Rubber washer
D Sleeve
E Threaded cone
F Bolt shank
G Anchor nut
Figure 1.1 Components of an Extended Hollobolt
The beam-to-column connections are known as one of the most important
structural elements in a building construction system due to the fact that the
reliability and efficiency of the connections have great influence not only on
the structural components but also on the behaviour of the whole structure.
The steel moment resisting frames have advantages of good ductility and been
regarded as a type of ideal structures for construction in seismic regions.
Related evidences are available in recent design codes. The moment resisting
steel frames in Eurocode 8 (2003) are designed with the largest behaviour
factor which leads to lowest seismic design loads. As suggested by the code of
3

Chapter 1:Introduction
AISC (2005), the structural elements of steel moment resisting frames are
required to exhibit sufficient resistance against lateral load, with expected
plastic hinges development at critical sections. The corresponding connection
details are designed to move the plastic hinge on the beam a short distance
away from the beam-to-column connection.
A post earthquake survey during the 1980s and 19905 reveals serious damages
of previously what is thought to be well-designed moment resisting steel
frames with fully welded beam to column connections, although the seismic
resistance and behaviour of these frames were highly regarded hitherto
(Mazzolani, 2000). Also, several post earthquake reports have also shown that
the most vulnerable points of moment resisting frames are welded components
in moment connections, which are unsusceptible to the fragile behaviour
(Dubina, 2002). As a consequence, the seismic design of moments resisting
connections have been adjusted and updated to reduce structural seismic
damages. Following the Northridge (1994) and Kobe (1995) earthquakes, an
issue in the code of AISC (2005) is the introduction of pre-qualified moment
connections in the design of moments resisting steel frames as to avoid beam-
to-column connections becoming vulnerable points under cyclic loading. With
regard to the concern of structural energy dissipation, the concept of dissipated
structure has been introduced into Eurocode 8 (2003) to take into account the
inelastic material behaviour in predefined zones. As a solution for the poor
seismic performance of flange-welded moment connections (previously
widely used in America), endplate moment connections have been regarded as
an alternative connection of interests to engineers and researchers. Since the
4

Chapter 1:Introduction
late 1990s, attempts have been made by US Federal Emergency Management
Agency (FEMA355E) to develop a database of behaviour curves and design
guides for bolted endplate connection (Mahin et al, 2002).
The excellent performance of CFT columns in moment resisting frames under
cyclic loading has been tested and confirmed by researchers (Beutel et al,
2002; Tsai et al, 2003). Most moment resisting connections to CFT columns
refer to typical configurations of welded connections with internal and
external diaphragm plates so as to transfer the cyclic loads from the girders
directly to the tube wall or to the tube wall and concrete core simultaneously,
as documented in a CIDECT publication (2004). To extend the use of blind
bolts for moment resisting connections, there are recent investigations reported
referring to extended endplate connections to hollow section column without
concrete infill (Lee et ai, 2010) and extended/flush endplate connections to
CFT column (Wang & Han, 2009; AI-Mughairi, 2009). It is not possible,
however, to comment further on the behaviour of these connections subjected
to cyclic loading as there are limited reports available in the literature.
1.2 Justification for this research
This study attempts to investigate the cyclic behaviour of an innovative blind
bolted endplate connection to CFT column by focusing on the constituent
components of the blind bolt and the CFT column. The practical relevanceI
will be the understanding of such connection under cyclic loading as a basis
for seismic design.
5

Chapter 1:Introduction
The application of bolted simple beam to hollow section column connections
has been documented in design book published by the Steel Construction
Institute & the British Constructional Steelwork Association Limited (2005)
and Corus Tube Library Publication (2009). The simple connections using
blind bolts have already been used in design to resist and transmit shear and
- axial loads in beams. With regard to their use in moment resisting connections,
there are limited reports about their related behaviours. ~s a part of a series of
investigations on this innovative blind bolted endplate connection to CFT
column, the present study was based on a thorough review of previous work
related to the monotonic behaviour of the connection. This provides a basic
understanding of the connection in this study and experimental plan reported
here. In this study, the blind bolts are connected with a flush endplate
constituting a typical flush endplate connection. The flush endplate
connections are widely used in the UK for their ease in construction. The
moment resisting behaviour of this innovative blind bolted endplate
connection to CFT column has been investigated monotonically in previous
research (Al-Mughairi, 2009) in which the connection is classified as rigid or
semi-rigid based on Bjorhovde's classification. As a follow-up study, a similar
geometric configuration of the connection was adopted in the present
experiment. The failure mode of this innovative blind bolt in tension is firstly
highlighted in this study.
As mentioned earlier, the pre-qualified moment connections are required by
AISC (2005) in the design of moments resisting steel frames. This philosophy
is based on the viewpoint that the behaviour of connections under severe
6
Chapter 1:Introduction
cyclic loading cannot be reliably predicted by analytical means alone. The
laboratory testing of the connections under cyclic loads is further needed to
evaluate the performance of the connections for seismic design. This point
justifies the significance of the use of quasi-static cyclic loading test in this
study for the cyclic behaviour of this innovative blind bolted endplate
connection to CFT column.
By assembling the contributions of individual components the recognized
component method (Jaspart et 01, 1995) provides a practicable simplified
mechanical model representing the characteristics of bolted connections.
Based on characterizing force-deformation curves, the component method can
be further introduced for the evaluation of the ductility of each component,
which may be classified into three main groups: high ductility, limited
ductility, and brittle (Simoes da Silva L et 01, 2000). The cyclic behaviour of
the connection is determined by the' constituent components performed
plastically. The dissipative and non-dissipative components are usually
distinguished for further assessment (Faella et al, 2000).
The components of a traditional bolted endplate connection to open section (I
or H section) column are classified in terms of ductility group and dissipative
capacity, as indicated in Table 1.1. With regard to ductile and dissipative
components, it can be seen that they almost related to the plate elements where
plastic yielding occurs. In order to develop an understanding of the ductile
behaviour of this innovative blind bolted endplate connection to CFT column,
it was felt that it is necessary to incorporate similar evidences into
consideration. It is noted that the components of endplate and CFT column
7
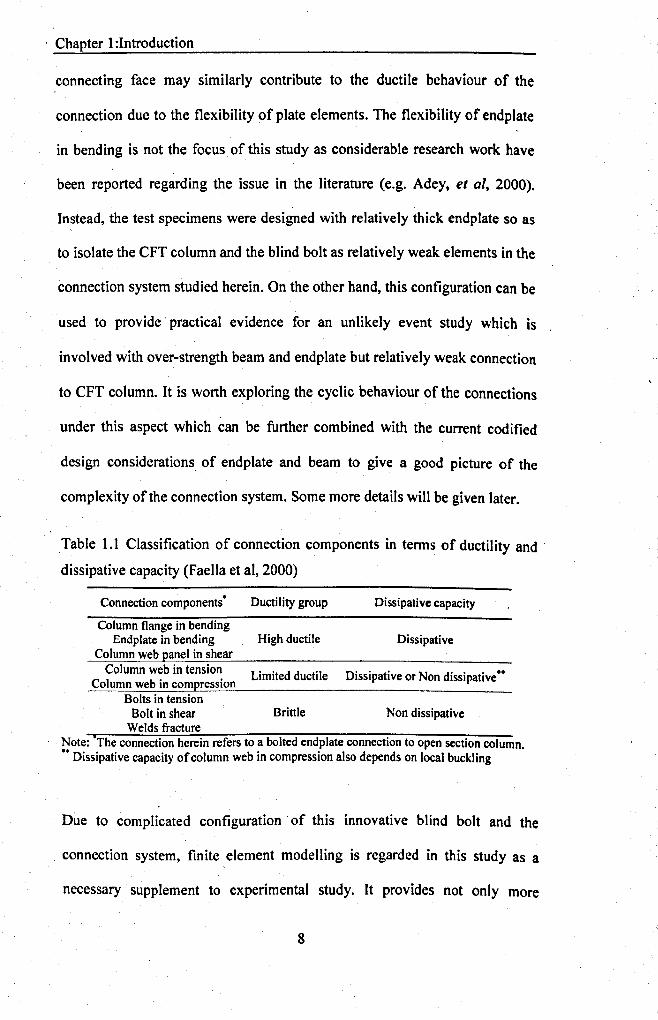
Chapter 1:Introduction
connecting face may similarly contribute to the ductile behaviour of the
connection due to the flexibility of plate elements. The flexibility of endplate
in bending is not the focus of this study as considerable research work have
been reported regarding the issue in the literature (e.g. Adey, et 01, 2000).
Instead, the test specimens were designed with relatively thick endplate so as
to isolate the CFT column and the blind bolt as relatively weak elements in the
connection system studied herein. On the other hand, this configuration can be
used to provide practical evidence for an unlikely event study which is
involved with over-strength beam and endplate but relatively weak connection
to CFT column. It is worth exploring the cyclic behaviour of the connections
under this aspect which can be further combined with the current codified
design considerations of endplate and beam to give a good picture of the
complexity of the connection system. Some more details will be given later.
Table 1.1 Classification of connection components in terms of ductility and
dissipative capacity (Faella et aI, 2000)
Connection components" Ductility group Dissipative capacity
Column flange in bendingEndplate in bending High ductile Dissipative
Column web panel in shearColumn web in tension Limited ductile D" t' N di . ••issipa ive or on rssipativeColumn web in compression
Bolts in tensionBolt in shear Brittle Non dissipativeWelds fracture
Note: The connection herein refers to a bolted endplate connection to open section column .•• Dissipative capacity of column web in compression also depends on local buckling
Due to complicated configuration of this innovative blind bolt and the
connection system, finite element modelling is regarded in this study as a
necessary supplement to experimental study. It provides not only more
8
Chapter 1:Introduction
evidences for local stress distribution but also moment-rotation response. For
example, the bolt shank in tension is more prone to fracture at the section
between the bolt head and threaded cone, where are difficult to access for
instrumentation in physical test. In th~s case, finite element modelling can be
used as an advantageous way to capture the stress distribution at this location
and associate with moment-rotation relationship. Also, the powerful,
parametric study will enable a full understanding of the connection behaviour
within a given range. The experimental study and finite element analysis in
this study can be added together to the body of knowledge of understanding
the cyclic characteristics of this innovative blind bolted endplate connection to
CFTcolumn.
1.3 Research questions
Although the behaviour of the standard bolted endplate connections under
monotonic loading has been understood and applied to the study of blind
bolted connections, it is not possible to comment further on the cyclic
behaviour of this innovative blind bolted endplate connection to CFT column
due to a significant gap of knowledge. As an attempt to provide basic
understanding contributes to fill that gap, this research programme outlined in
this thesis is intended to answer two fundamental questions:
• What are the cyclic characteristics of this innovative blind bolted endplate
connection to CFT column?
• How can we simulate the hysteretic moment-rotation relationship of this
innovative blind bolted endplate connection to CFT column and provide
comments on main influencing parameters for the hysteretic behaviour of
such connection?
9
Chapter 1:Introduction
1.4 Research aim and objectives
The intention of this research program is to test an innovative blind bolted
endplate connection to CFT column under cyclic loading with the aims of
obtaining insights into the hysteretic moment-rotation relationship, available
ductility & energy dissipation capacity, observing typical failure modes,
developing relevant understandings for the hysteretic behaviour of this
connection.
The overall objectives of this research are highlighted as follows:
• To evaluate the hysteretic performance of the connection system in terms
of strength & stiffness degradation, ductility and energy dissipation
capacity.
• To examine the progressive damage evolution of the connection systems
by introducing cumulative damage models ..
• To develop a validated finite element model to trace the distinct local
damage of the connection and undertake parametric study to allow for the
dependence of connection behaviour on the relevant geometric and
material variables.
• To establish a mathematical model for the prediction for the hysteretic
moment-rotation relationship of the connections under cyclic loading.
1.5 Research methodologies
The objectives of this research will be achieved through following steps:
• Literature review to examine previous investigations in the related areas
and Commentfurther on the most beneficial aspects to direct the study.
• Full-scale experimental quasi-static cyclic loading test to get data of the
moment & rotation capacities and failure modes of the connection for the10

Chapter 1:Introduction
first objective of this study. The hysteretic moment-rotation relationship
to be analysed for the second objective of this study, Le. evaluate the
cyclic characterizing parameters and the evolution of progressive damage
during inelastic range of cyclic loading. The highlighted failure modes to
be discussed covering the connection categories of strong blind bolt &
weak CFT column and weak blind bolt & strong CFT column.
..3D nonlinear finite element modelling to simulate the experimental
. response in further details which serve for the third objective of this
study. The finite element model to be validated against the experimental
moment-rotation envelope curves under positive and negative bending
moments .. Parametric study to investigate the main geometric and
mechanical variables influencing the behaviour of this innovative blind
bolted endplate connection to CFT column.
• Mathematical models to be developed and incorporated into the hysteretic
moment-rotation models for the representation of hysteretic loops for the
fourth objective of this study.
1.6 Outline of contents
This thesis consists of seven chapters including current chapter as the
introduction. A brief description of these chapters is presented as follows.
Chapter 1: This chapter outlines research background, justification, research
questions, research aims & objectives and research methodology.
Chapter 2: This chapter contains a literature review of three closely related
topics, including the tensile behaviour of blind bolted connections, the11
Chapter 1:Introduction
monotonic behaviour of blind bolted beam to column moment connections and
the cyclic behaviour of bolted endplate beam to column connections. It
includes current advances of experimental studies in these areas. As a
conclusion remark of this chapter, the efforts needed for further understanding
are highlighted for this innovative blind bolted endplate connection studied
herein.
Chapter 3: This chapter presents the details of experiment in this study. It
covers the objectives and design of the testing programme. The general
configuration of tested specimens, material properties, test apparatus and
instrumentation are presented. The quasi-static cyclic loading procedure is
described with a brief overview of the yield point determination methods.
Chapter 4: This chapter presents the experimental results including failure
modes, and hysteretic moment-rotation relationship. Using codified cyclic
characterizing parameters, the cyclic characteristics of the connection system
is evaluated in terms of ductility, energy dissipation, resistance and stiffness.
Chapter 5: This chapter demonstrates the use of cumulative damage models in
evaluating the progressive damage modes of this innovative blind bolted
endplate connection to CFT column. This analysis is presented based on the
experimental data outlined in Chapter 4.
Chapter 6: This chapter describes 3D nonlinear finite element modelling of
this innovative blind bolted endplate connection to CFT column. Related
modelling theories and techniques are reviewed. Following the validation of
finite element results with experimental data, the local damage of the
12
Chapter 1:Introduction
connection are further clarified based on the analysis of stress distribution
which in tum provides further evidences for the failure modes indicated in
Chapter 4 and Chapter 5. The parametric study is presented based on the
validated finite element model. It provides further comments on the influences
of tube wall thickness and concrete strength on the moment-rotation response
of the connections.
Chapter 7: This chapter discusses further modelling of hysteretic moment-
rotation relationship. Based on the moment-rotation envelopes predicted by
finite element analysis, the mathematical models are adopted to represent
hysteretic loops of the curves.
Chapter 8: This chapter highlights the main conclusions obtained from
experimental study and finite element analysis. It also provides general
comments and recommendations for the application and further research of
this innovative blind bolted endplate connection to CFT column under cyclic
loading.
13

Chapter 2:Literature review
CHAPTER2
LITERATURE REVIEW
2.1 Introduction
. In this research, an innovative blind bolt and CFT column were incorporated
in the bolted endplate connection system to resist moment. The present chapter
is organized along distinct lines of focus and describes the previous
experimental researches relevant to this connection system. The respective
focus areas in the literature review are' directed to provide general
u~derstanding of the behaviour of the connection component or assembly. A
brief overview of the focus and related methodology of each study is presented.
The results obtained from previous investigations are not completely listed but
selected to shed light on how the connection assembly and associated system
are investigated. This chapter also includes recent work of a series of
investigations on the behaviour of this innovative blind bolt. This chapter
concludes with comments highlighting the needs for further research of this
topic.
2.2 Previous studies on tensile behaviour of blind bolted
connections
Several types of blind fastener have been developed commercially and
adopted for beam-to-column connections, including the Huck High Strength
Blind Bolt (HSBB) and Huck Blind Oversized Mechanically Locked Bolt
(BOM) (Huck. International-USA), the Flowdrill (Flowdrill B.v-The
Netherlands), the Ajax One-side (Ajax Fasteners-Australia) and the Lindapter
15
Chapter 2: Literature review
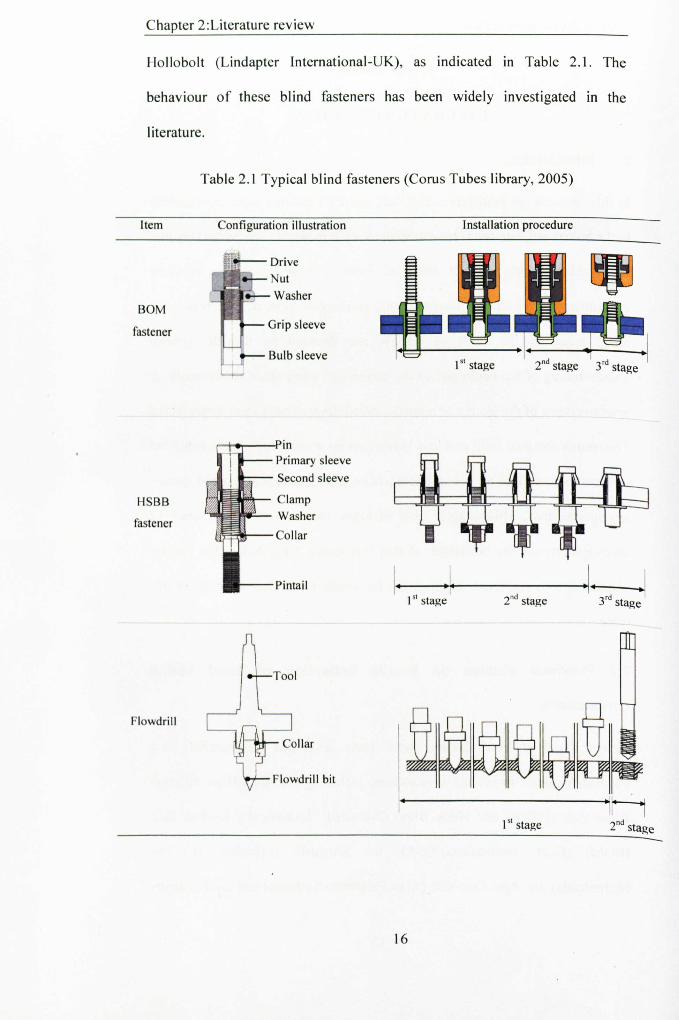
Hollobolt (Lindapter International-UK), as indicated In Table 2.1. The
behaviour of these blind fasteners has been widely investigated In the
literature.
Table 2.1 Typical blind fasteners (Corus Tubes library, 2005)
Item Configuration illustration Installation procedure
BOM
fastener
HSBBfastener
Flowdrill
ettii--DriveNutWasher
Second sleeve
+-1-SI-st-a-ge~-------2n-d-s-ta-g-e----~·3rdstag~
Flowdrill bit
1si stage
16
Chapter 2:Literature review
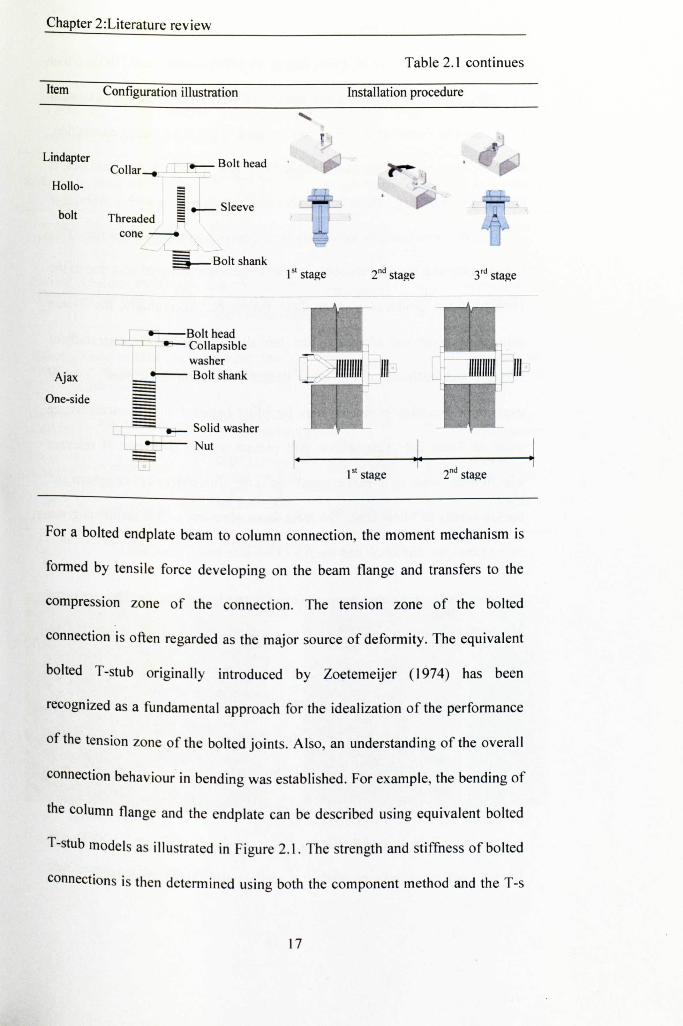
Table 2.1 continues
Item Configuration illustration Installation procedure
LindapterCollar -0· Bolt head
T==§§ _ SleeveThreaded I R
cone __
L-....-J ___.c
ca Bolt shank
Hollo-
bolt
Ajax
One-side
1st stage 2nd stage 3rd stage
1st stage 2nd stage
17
For a bolted endplate beam to column connection, the moment mechanism is
formed by tensile force developing on the beam flange and transfers to the
compression zone of the connection. The tension zone of the bolted
connection is often regarded as the major source of deformity. The equivalent
bolted T-stub originally introduced by Zoetemeijer (1974) has been
recognized as a fundamental approach for the idealization of the performance
of the tension zone of the bolted joints. Also, an understanding of the overall
connection behaviour in bending was established. For example, the bending of
the column flange and the endplate can be described using equivalent bolted
T-stub models as illustrated in Figure 2.l. The strength and stiffness of bolted
connections is then determined using both the component method and the T-s
Chapter 2:Literature review
tub models (Agerskov et ai, 1976, Vee et ai, 1986; Jaspart et ai, 1995; Shi et
ai, 1996). Also, this simplified analytical method has been adopted in modem
codes, such as Eurocode 3 (2005). With regard to the blind bolted connection,
most concerns were given to its tensile behaviour. Although the blind bolt is
susceptible to undergo shear action, this configuration of assembly with large
cross-section area could be inherently strong enough to resist such action. This
is especially true for the Hollobolt, whose large cross sectional area due to the
flaring sleeves produces a great shear resistance. Accordingly, the T-stub
connection model was adopted in literature above for the preliminary study of
strength and stiffness of the blind bolted connection in tension. Typical
experimental studies in recent years for blind bolted T-stub connections are
listed in Table 2.2. This section will present a brief overview of relevant
experimental work on T-stub connections at the University of Nottingham and
the University of Melbourne. The main focus of review in this section is given
to the Lindapter Hollobolt and the Ajax One-side based blind bolts.
Barnett (2001) conducted an early experimental study at the University of
Nottingham on blind bolted T-stub assemblies, as shown in Figure 2.1. The
ultimate performance and failure modes of different types of the blind bolts
were observed and compared. The reported stiffness of the connections with
the Lindapter Hollobolt was lower than those with the standard bolt. It was
observed early ductile shearing of the flaring sleeve caused axial bolt
deflection prior to the preload being overcome and then this ductile shearing
continued until fracture of the flaring sleeve, as shown in Figure 2.1(b). Due to
limited number of tests, no analytical models were given to characterize the
18
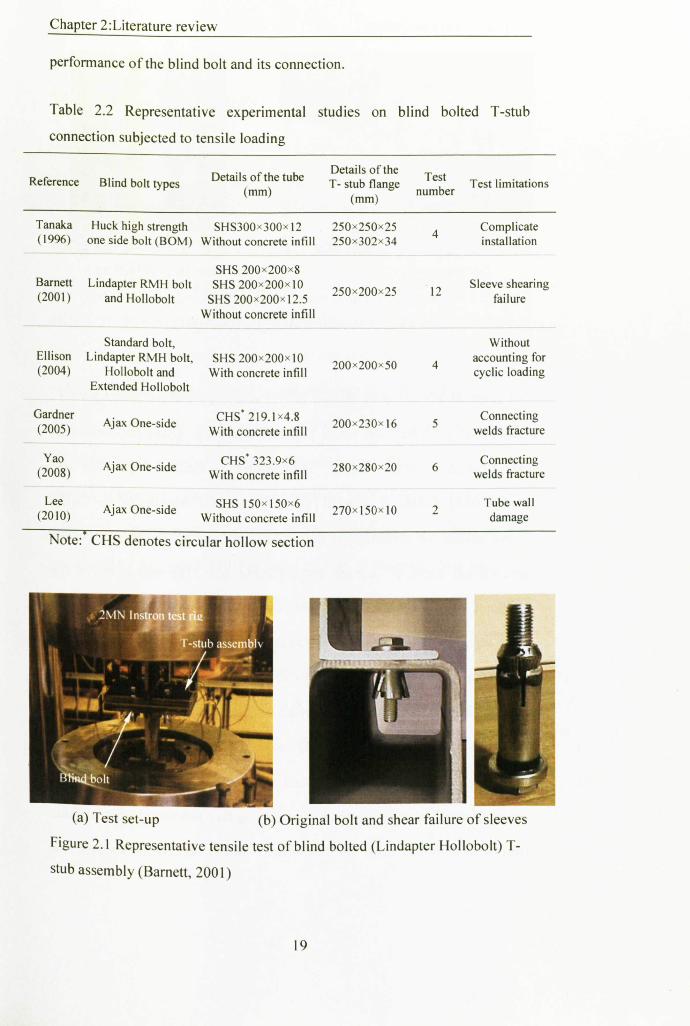
Chapter 2:Literature review
performance ofthe blind bolt and its connection.
Table 2.2 Representative experimental studies on blind bolted T-stub
connection subjected to tensile loading
Reference Test limitationsBlind bolt types Details of the tube(mm)
Details of theT - stub flange
(mm)
Testnumber
Tanaka(1996) 4
Barnett(2001 )
Ellison(2004)
Gardner(200S)
Yao(2008)
Lee(2010)
Huck high strength SHS300x300x 12one side bolt (BOM) Without concrete intill
Lindapter RMH boltand Hollobolt
SHS 200x200x8SHS 200x200xlOSHS 200x200x l2.S
Without concrete intill
2S0x2S0x25250x302x34
Complicateinstallation
Standard bolt,Lindapter RMH bolt,
Hollobolt andExtended Hollobolt
SHS 200x200x 10With concrete intill
2S0x200x2S 12Sleeve shearing
failure
Ajax One-side CHS' 219.1x4.8With concrete intill
200x200x50
Withoutaccounting forcyclic loading
Ajax One-side CHS' 323.9x6With concrete intill
4
200x230x16Connecting
welds fracture
Ajax One-side SHS 1S0x 150x6Without concrete intill
5
280x280x20 6Connecting
welds fracture
270xlSOxi0Tube walldamage
2
Note: CHS denotes circular hollow section
(a) Test set-up (b) Original bolt and shear failure of sleeves
Figure 2.1 Representative tensile test of blind bolted (Lindapter Hollobolt) T-
stub assembly (Barnett, 200 I)
19
Chapter 2:Literature review
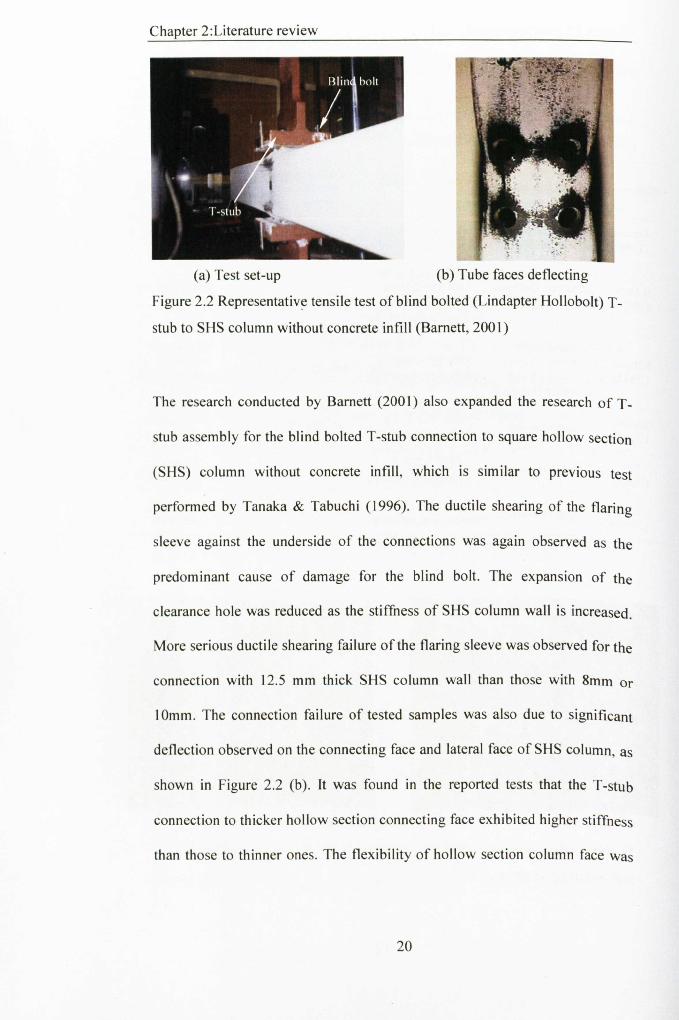
(a) Test set-up (b) Tube faces deflecting
Figure 2.2 Representative tensile test of blind bolted (Lindapter Hollobolt) T-
stub to SHS column without concrete infill (Barnett, 2001)
The research conducted by Barnett (2001) also expanded the research of T-
stub assembly for the blind bolted T-stub connection to square hollow section
(SHS) column without concrete infill, which is similar to previous test
performed by Tanaka & Tabuchi (1996). The ductile shearing of the flaring
sleeve against the underside of the connections was again observed as the
predominant cause of damage for the blind bolt. The expansion of the
clearance hole was reduced as the stiffness of SHS column wall is increased.
More serious ductile shearing failure of the flaring sleeve was observed for the
connection with 12.5 mm thick SHS column wall than those with 8mm Or
10mm. The connection failure of tested samples was also due to significant
deflection observed on the connecting face and lateral face of SHS column, as
shown in Figure 2.2 (b). It was found in the reported tests that the T-stub
connection to thicker hollow section connecting face exhibited higher stiffness
than those to thinner ones. The flexibility of hollow section column face was
20
Chapter 2:Literature review
recognized as a limiting factor for the use of the blind bolted connection to
hollow section column as moment resisting connections.
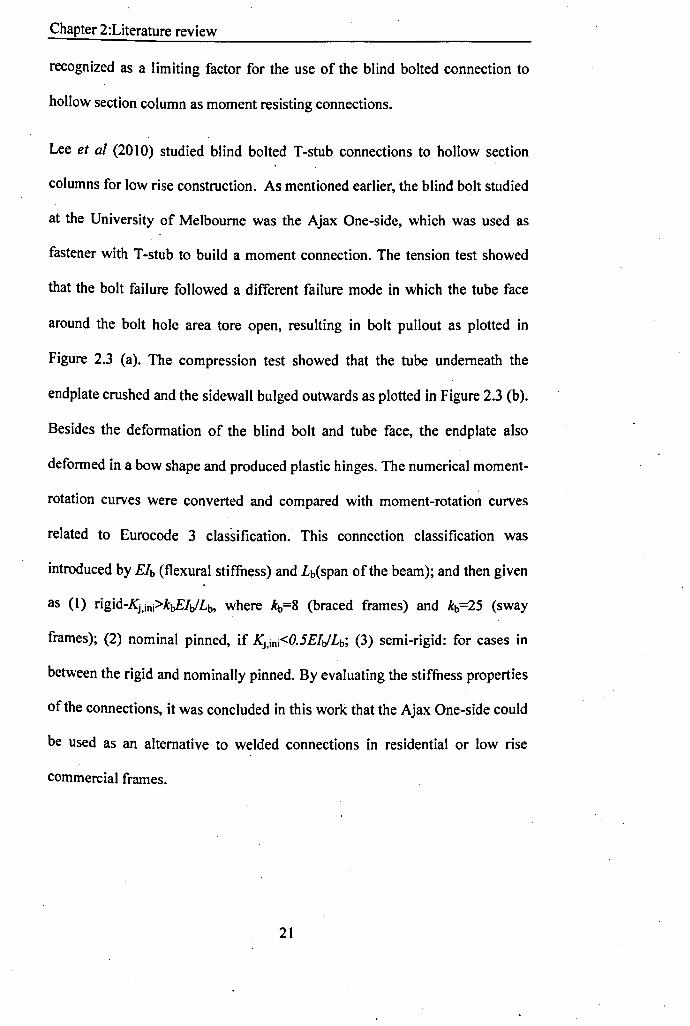
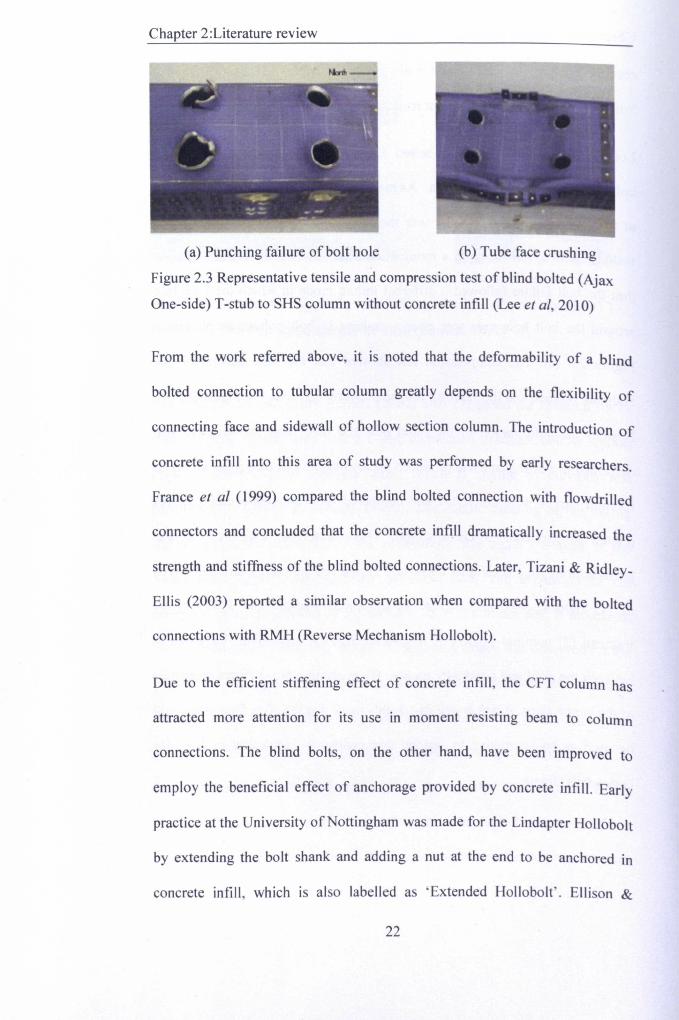
Lee et al (2010) studied blind bolted T-stub connections to hollow section
columns for low rise construction. As mentioned earlier, the blind bolt studied
at the University of Melbourne was the Ajax One-side, which was used as
fastener with T-stub to build a moment connection. The tension test showed
that the bolt failure followed a different failure mode in which the tube face
around the bolt hole area tore open, resulting in bolt pullout as plotted in
Figure 2.3 (a). The compression test showed that the tube underneath the
endplate crushed and the sidewall bulged outwards as plotted in Figure 2.3 (b).
Besides the deformation of the blind bolt and tube face, the endplate also
deformed in a bow shape and produced plastic hinges. The numerical moment-
rotation curves were converted and compared with moment-rotation curves
related to Eurocode 3 classification. This connection classification was
introduced by Elb (flexural stiffness) and Lb(span of the beam); and then given
as (I) rigid-Kj,ini>k~ItlLb, where kb=8 (braced frames) and kb=25 (sway
frames); (2) nominal pinned, if Kj,ini<O.5Elt/Lb; (3) semi-rigid: for cases in
between the rigid and nominally pinned. By evaluating the stiffness properties
of the connections, it was concluded in this work that the Ajax One-side could
be used as an alternative to welded connections in residential or low rise
commercial frames.
21
Chapter 2:Literature review
(a) Punching failure of bolt hole (b) Tube face crushing
Figure 2.3 Representative tensile and compression test of blind bolted (Ajax
One-side) T-stub to SHS column without concrete infill (Lee et aI, 2010)
From the work referred above, it is noted that the deformability of a blind
bolted connection to tubular column greatly depends on the flexibility of
connecting face and sidewall of hollow section column. The introduction of
concrete infill into this area of study was performed by early researchers.
France et al (1999) compared the blind bolted connection with flowdrilled
connectors and concluded that the concrete infill dramatically increased the
strength and stiffness of the blind bolted connections. Later, Tizani & Ridley,
Ellis (2003) reported a similar observation when compared with the bolted
connections with RMH (Reverse Mechanism Hollobolt).
Due to the efficient stiffening effect of concrete infill, the CFT column has
attracted more attention for its use in moment resisting beam to column
connections. The blind bolts, on the other hand, have been improved to
employ the beneficial effect of anchorage provided by concrete infill. Early
practice at the University of Nottingham was made for the Lindapter Hollobolt
by extending the bolt shank and adding a nut at the end to be anchored in
concrete infill, which is also labelled as 'Extended Hollobolt'. Ellison &
22
Chapter 2:Literature review
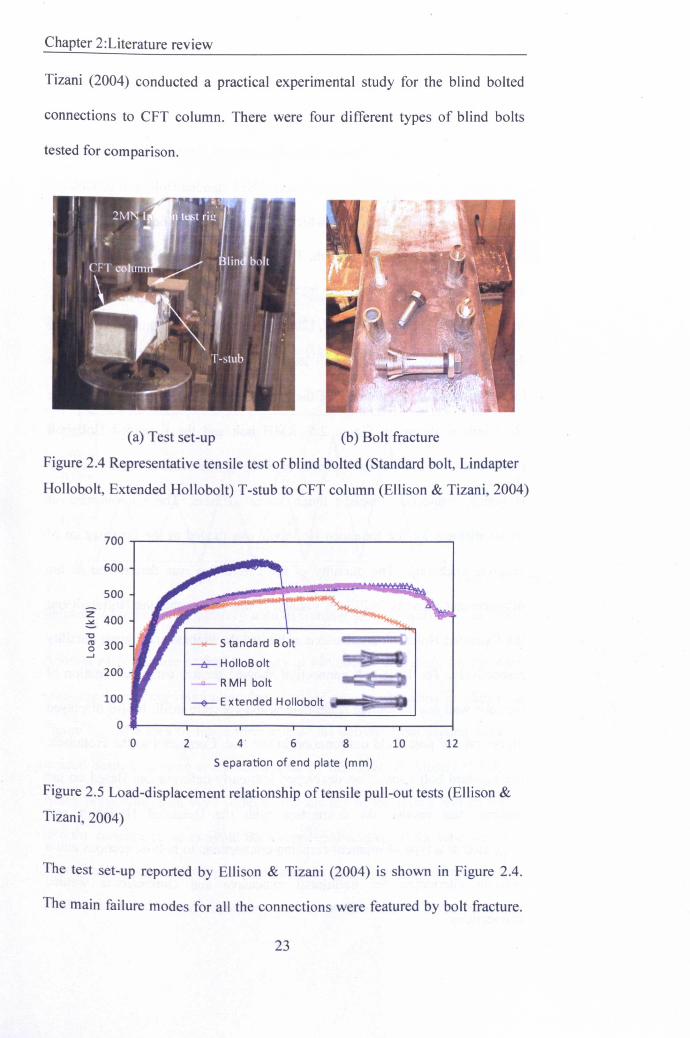
Tizani (2004) conducted a practical experimental study for the blind bolted
connections to CFT column. There were four different types of blind bolts
tested for comparison.
(a) Test set-up (b) Bolt fracture
Figure 2.4 Representative tensile test of blind bolted (Standard bolt, Lindapter
Hollobolt, Extended Hollobolt) T-stub to CFT column (Ellison & Tizani, 2004)
700
600
500
~ 400"0I1l 3000-'
200
100
00
-er- HolloBolt
_.,_ RMH bolt
-+- Extended Hollobolt ",.-ii.ii;;;;;a
4 122 6 8 10Sepa ration of end plate (mm)
Figure 2.5 Load-displacement relationship of tensile pull-out tests (Ellison &
Tizani,2004)
The test set-up reported by Ellison & Tizani (2004) is shown in Figure 2.4.
The main failure modes for all the connections were featured by bolt fracture.
23
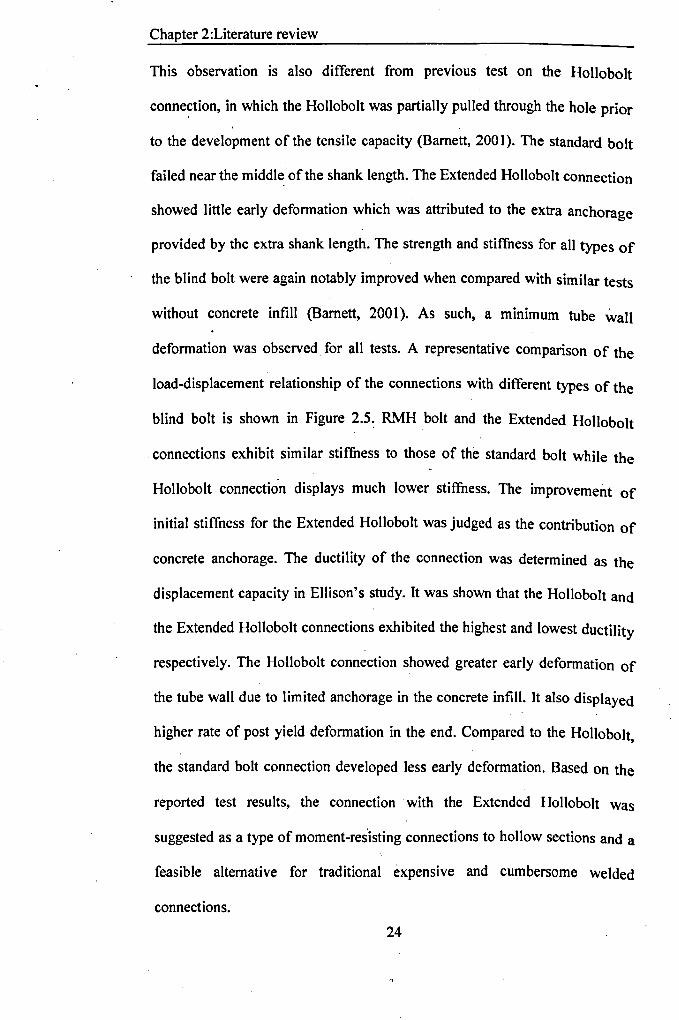
Chapter 2:Literature review
This observation is also different from previous test on the Hollobolt
connection, in which the Hollobolt was partially pulled through the hole prior
to the development of the tensile capacity (Barnett, 2001). The standard bolt
failed near the middle of the shank length. The Extended Hollobolt connection
showed little early deformation which was attributed to the extra anchorage
provided by the extra shank length. The strength and stiffness for all types of
the blind bolt were again notably improved when compared with similar tests
without concrete infill (Barnett, 2001). As such, a minimum tube wall
deformation was observed for all tests. A representative comparison of the
load-displacement relationship of the connections with different types of the
blind bolt is shown in Figure 2.5: RMH bolt and the Extended HolloboIt
connections exhibit similar stiffness to those of the standard bolt while the
Hollobolt connection displays much lower stiffness. The improvement of
initial stiffness for the Extended Hollobolt was judged as the contribution of
concrete anchorage. The ductility of the connection was determined as the
displacement capacity in Ellison's study. It was shown that the Hollobolt and
the Extended Hollobolt connections exhibited the highest and lowest ductility
respectively. The Hollobolt connection showed greater early deformation of
the tube wall due to limited anchorage in the concrete infill. It also displayed
higher rate of post yield deformation in the end. Compared to the Hollobolt,
the standard bolt connection developed less early deformation. Based on the
reported test results, the connection with the Extended Hollobolt was
suggested as a type of moment-resisting connections to hollow sections and a
feasible alternative for traditional expensive and cumbersome welded
connections.
24
Chapter 2:Literature review
tube lJi endplatewall
splitwasher r washer
tmmsmms 1Tl. ' .. Ti!!'I~nbuOtlt coggedf~ extensionnut
tubewall
r end plate
splitwasher
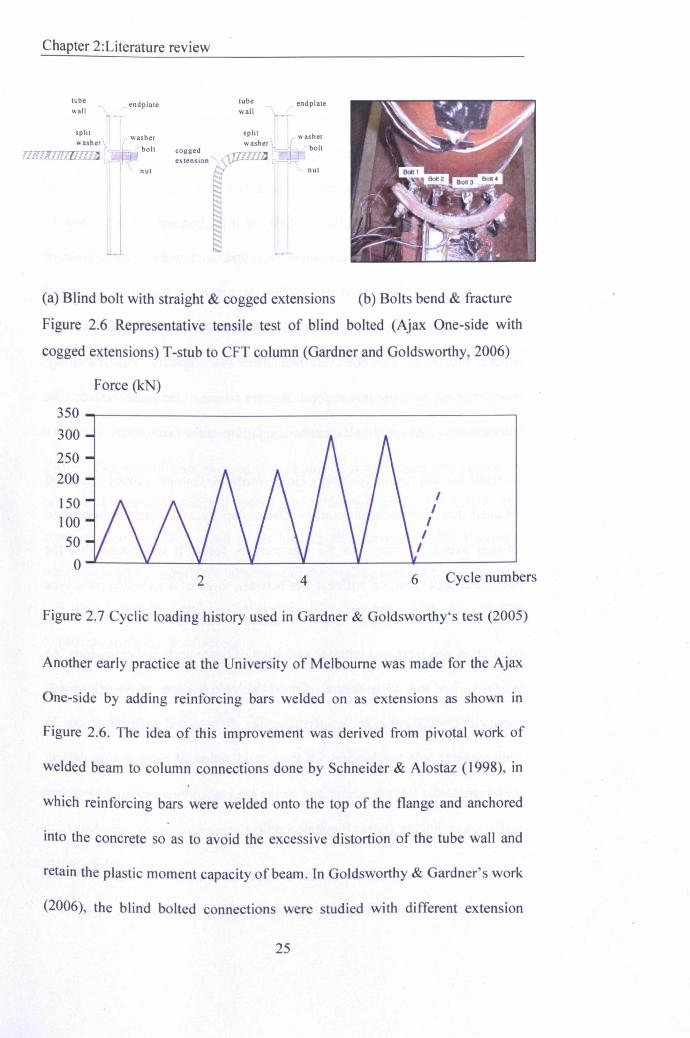
(a) Blind bolt with straight & cogged extensions (b) Bolts bend & fracture
Figure 2.6 Representative tensile test of blind bolted (Ajax One-side with
cogged extensions) T-stub to CFT column (Gardner and Goldsworthy, 2006)
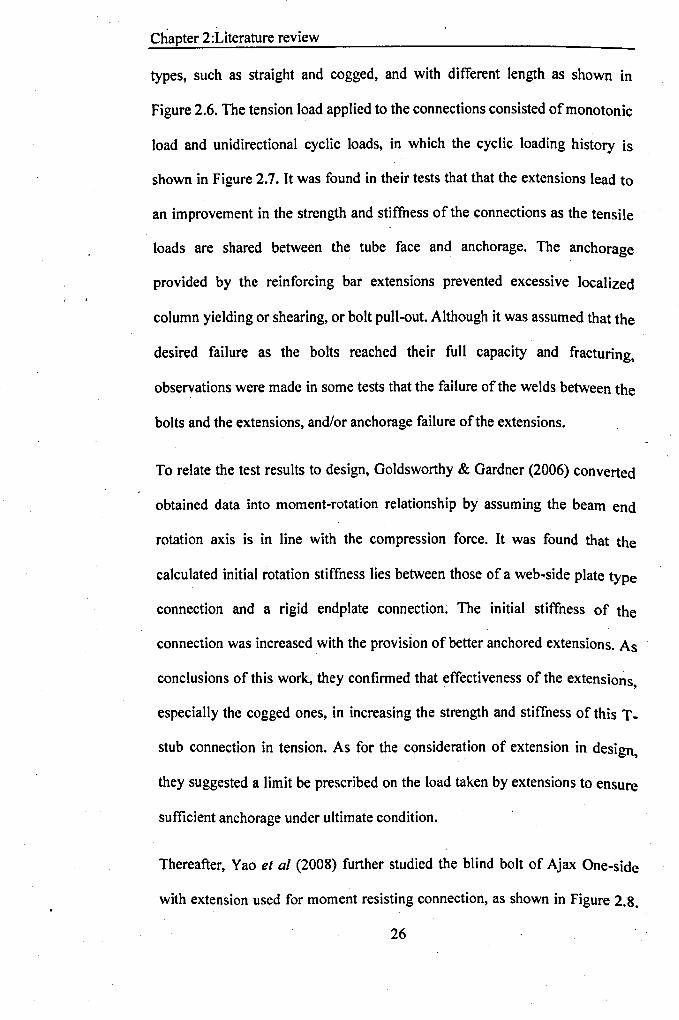
Force (kN)
350~------------------------------------------,30025020015010050O~----X_--~L----L----~----L-----~--------~
IIIII
2 4 6 Cycle numbers
Figure 2.7 Cyclic loading history used in Gardner & Goldsworthy's test (2005)
Another early practice at the University of Melbourne was made for the Ajax
One-side by adding reinforcing bars welded on as extensions as shown in
Figure 2.6. The idea of this improvement was derived from pivotal work of
welded beam to column connections done by Schneider & Alostaz (1998), in
which reinforcing bars were welded onto the top of the flange and anchored
into the concrete so as to avoid the excessive distortion of the tube wall and
retain the plastic moment capacity of beam. TnGoldsworthy & Gardner's work
(2006), the blind bolted connections were studied with different extension
25
Chapter 2:Literature review
types, such as straight and cogged, and with different length as shown in
Figure 2.6. The tension load applied to the connections consisted of monotonic
load and unidirectional cyclic loads, in which the cyclic loading history is
shown in Figure 2.7. It was found in their tests that that the extensions lead to
an improvement in the strength and stiffness of the connections as the tensile
loads are shared between the tube face and anchorage. The anchorage
provided by the reinforcing bar extensions prevented excessive localized
column yielding or shearing, or bolt pull-out. Although it was assumed that the
desired failure as the bolts reached their full capacity and fracturing,
observations were made in some tests that the failure of the welds between the
bolts and the extensions, and/or anchorage failure of the extensions.
To relate the test results to design, Goldsworthy & Gardner (2006) converted
obtained data into moment-rotation relationship by assuming the beam end
rotation axis is in line with the compression force. It was found that the
calculated initial rotation stiffness lies between those of a web-side plate type
connection and a rigid endplate connection. The initial stiffness of the
connection was increased with the provision of better anchored extensions. As
conclusions of this work, they confirmed that effectiveness of the extensions, ,
especially the cogged ones, in increasing the strength and stiffness of this T-
stub connection in tension. As for the consideration of extension in design,
they suggested a limit be prescribed on the load taken by extensions to ensure
sufficient anchorage under ultimate condition.
Thereafter, Yao et at (2008) further studied the blind bolt of Ajax One-side
with extension used for moment resisting connection, as shown in Figure 2.8.
26
Chapter 2:Literature review
The tests consisted of a large scale T-stub connection with full instrumentation
tested to failure in tension and some pullout tests to study the anchorage
behaviour of cogged bars. The test was considered under monotonic and cyclic
loading, in,which the cyclic loading history was similar ~othe test reported by
Gardner & Goldsworthy (2005) but referred with more cycles. Again, it was
shown in their test that the addition of the cogged extension to the blind bolt
increased the tensile strength and stiffness of the T-stub connection. It was
, estimated that 65%of the tension was carried by the cogged extensions and
35% was taken by hoop stress within the steel tube wall at the load level of
500kN. The failure mode at the maximum load was again the fracture of the
welds between the bolt head and' cogged extension at the middle bolt of the top
T-stub. The pullout tests showed that failure of cogged bars was caused by
breaking of the bar outside the steel tube other than a~chorage failure. The
comparison of monotonic and cyclic loading tests showed similar envelopes
which implied no significant influences of the loading history. It was deduced
that from load slip of pull out test that the tube with 6mm thickness was able
to provide sufficient confinement.
The tensile response of the blind bolted T-stub connection was later simulated
by a finite element model. The cogged bar were divided by two parts: the
straight portion and the cogged portion as the interaction between reinforcing
bar and, the surrounding concrete was modelled. These two parts were
modelled with couple elements & bond element and a single spring element
respectively.
27
Chapter 2:Literature review
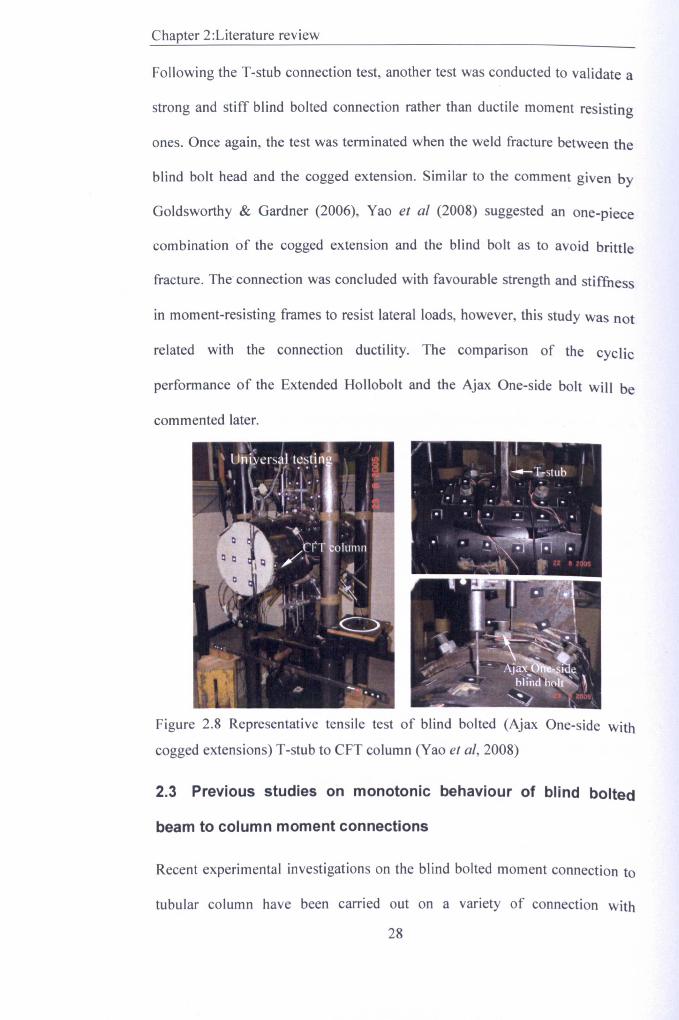
Following the T-stub connection test, another test was conducted to validate a
strong and stiff blind bolted connection rather than ductile moment resisting
ones. Once again, the test was terminated when the weld fracture between the
blind bolt head and the cogged extension. Similar to the comment given by
Goldsworthy & Gardner (2006), Yao et al (2008) suggested an one-piece
combination of the cogged extension and the blind bolt as to avoid brittle
fracture. The connection was concluded with favourable strength and stiffuess
in moment-resisting frames to resist lateral loads, however, this study was not
related with the connection ductility. The comparison of the cyclic
performance of the Extended Hollobolt and the Ajax One-side bolt will be
commented later.
Figure 2.8 Representative tensile test of blind bolted (Ajax One-side with
cogged extensions) T-stub to CFT column (Yao et ai, 2008)
2.3 Previous studies on monotonic behaviour of blind bolted
beam to column moment connections
Recent experimental investigations on the blind bolted moment connection to
tubular column have been carried out on a variety of connection with
28
Chapter 2:Literature review
configuration parameters of tube shape, concrete infill and blind bolt, as listed
in Table 2.3. Similar to the experimental studies on T-stub connections, the
research work at early stage concerns the blind bolted beam-to-column
connections with hollow section columns without concrete infill and later
expanded for the connections with CFT columns.
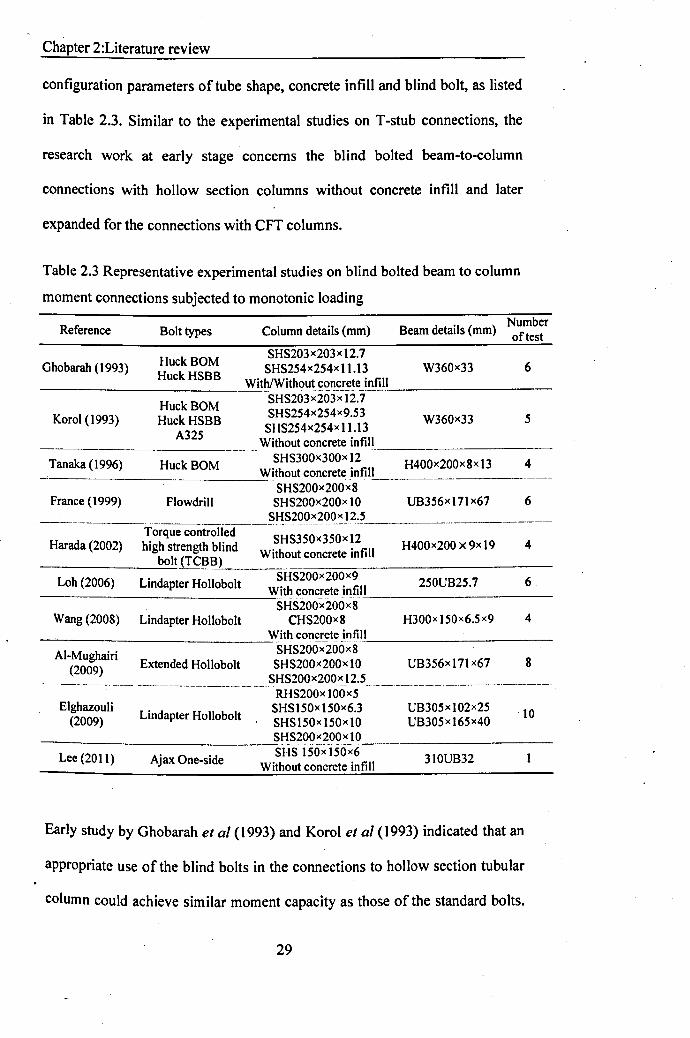
Table 2.3 Representative experimental studies on blind bolted beam to column
moment connections subjected to monotonic loading
Reference Bolt types Column details (mm)Number
Beam details (mm) of test
Ghobarah (1993)SHS203x203x 12.7SHS254x254x 11.13 W360x33 6HuckBOM
Huck HSBB_____ ~ W:_:__:_:it~th~~!_~~'!~!_t:te_!nfil~I _Huck BOM SHS203x203x12.7
SHS254x254x9.53Huck HSBB SHS254x254x 11.13
__________ A_3_2_S Without concrete infill- SHS300x300x12 --Without concrete infill---------------
SHS200x200x8Flowdrill SHS200x200x 10 UB356x 171x67
_____ " ~HS200x2~Ox 12.L _Torque controlled SHS350x350x 12
Harada (2002) high strength blind Without concrete infill____________ ~bo=lt(TC=B=B)~ =
SHS200x200x9Loh (2006) Lindapter Hollobolt With concrete infill
_"- -"--"-~----------SHS200x200x8CHS200x8
___________ ~With concrete infil~1 _Al-Mughairi SHS200x200x8
Extended Hollobolt SHS200x200xl0 UB356xl71x67____~~_00_9~ SHS200x200x 12.S _
RHS200xl00xSSHS1S0x IS0x6.3SHS 150x 150x 10
_____________ ___':SH_S20Qx2-OQx10 _SHS 150xlS0x6
Korol (1993) W360x33 .5
Tanaka (1996) HuckBOM H400x200x8x 13 4
France (1999) 6
H400x200 X 9x 19 4
250UB2S.7 6
Wang (2008) Lindapter Hollobolt H300x 150x6.Sx9 4
8
Eighazouli(2009) Lindapter Hollobolt
UB305xl02x25UB30Sx16.5x40 10
Lee (2011) Ajax One-side Without concrete infill 310UB32
Early study by Ghobarah et al (1993) and Korol et al (1993) indicated that an
appropriate use of the blind bolts in the connections to hollow section tubular
column could achieve similar moment capacity as those of the standard bolts.
29

Chapter 2:Literature review
Also, the moment capacity of the blind bolted connection can be improved by
changing the bolt pitch and endplate thickness so as to reduce the blind bolt
bending and the prying action. An basic analytical model was given by
Ghobarah et al (1993) to evaluate the initial stiffness and plastic moment
capacity of the blind connections to SHS column with and without column
infill. This study proved that initial stiffness of the blind bolted moment
connections increases with the effect of concrete infill. The prediction of
connection's moment-rotation relationship was shown at various load levels.
France et al (1999) investigated the moment behaviour of flowdrill
connections to tubular columns without and with concrete infill with the aim
to assess the joint's semi-rigid behaviour and acceptability of the flowdrill
connector as a method for onsite bolting of beam to the column connections.
The related parameters examined in the experiment referred to tube wall
thickness, material properties, and endplate thickness. The moment tests of the
connections with no concre~e filled tubular column showed that the majority
of the joint rotation occurred due to flexural action of the tube walls and the
flowdrill connector was not sufficient to restrain the column face when in
tension. The sidewall buckled outwards in the compression zone with yielding
across the full width of tube sidewall. However, an uncertainty was expressed
if this extensive yielding influenced the response of the joint connected to the
adjacent face of the column. When compared the moment behaviour of the
connections, the depth of the connections was suggested as more efficient than
that the tube wall thickness in achieving strong and stiff joint. The results from
experimental studies showed flowdrill connector was able to achieve full
30
Chapter 2:Literature review
strength for moderately thick endplate connections of flush endplate details.
The later studies on the connections with tubular columns with concrete infill
indicated that the concrete provided sufficient stiffness at the comers of the
tubular column to prevent any inward deformation of the lateral face (France
et al, 1999). There were not any visible deformations of the column in the
compression zone. The strengthening effect of concrete infill caused the axis
of rotation of the joint shifting towards the compression of the flange of the
beam. As a result of the joint response, the increased initial stiffness and post
yield stiffness were observed for such connections to tubular columns with
concrete infill than those without concrete infill. However, the ductility of the
connection was reduced with the concrete infill.
Harada et al (2002) studied the cyclic behaviour of a type of blind bolted
connections using split-T to rectangular hollow section column. The blind
bolts used in reported tests were torque controlled high strength blind bolt
(TCBB). The performance of the connection was assessed by experimental
load-deformation relationship curves, which showed stable spindle-shaped
hysteresis loops. This type of connection was concluded with capacity of
possessing sufficient deformation capacity.
Loh et al (2006) tested cruciform blind bolted (Lindapter Hollobolt) composite
connections to CFT column under hogging bending, as shown in Figure 2.9 (a).
This study aimed to simulate the internal regions of a semi-continuous frame.
Comparative studies were taken for bare steel joints and composite joints with
concrete slab, in which the latter type was explored by examining the
influence of shear connections and reinforcement on the joint behaviour. The
31
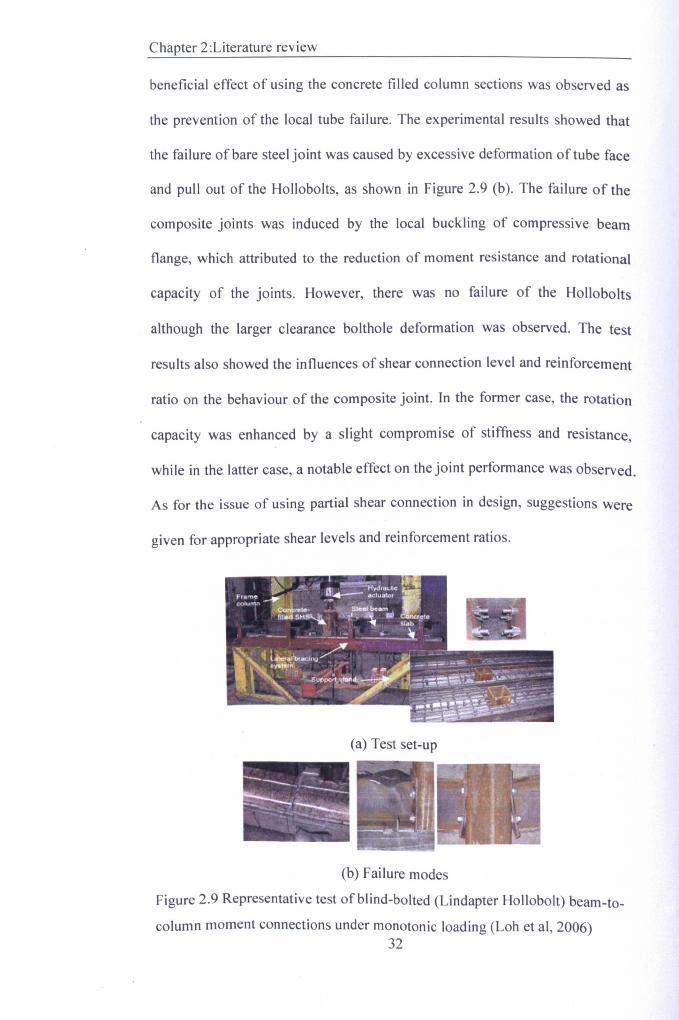
Chapter 2:Literature review
beneficial effect of using the concrete filled column sections was observed as
the prevention of the local tube failure. The experimental results showed that
the failure of bare steel joint was caused by excessive deformation of tube face
and pull out of the Hollobolts, as shown in Figure 2.9 (b). The failure of the
composite joints was induced by the local buckling of compressive beam
flange, which attributed to the reduction of moment resistance and rotational
capacity of the joints. However, there was no failure of the Hollobolts
although the larger clearance bolthole deformation was observed. The test
results also showed the influences of shear connection level and reinforcement
ratio on the behaviour of the composite joint. In the former case, the rotation
capacity was enhanced by a slight compromise of stiffness and resistance,
while in the latter case, a notable effect on the joint performance was observed.
As for the issue of using partial shear connection in design, suggestions were
given for appropriate shear levels and reinforcement ratios.
(a) Test set-up
(b) Failure modes
Figure 2.9 Representative test of blind-bolted (Lindapter Hollobolt) beam-to-
column moment connections under monotonic loading (Loh et ai, 2006)32
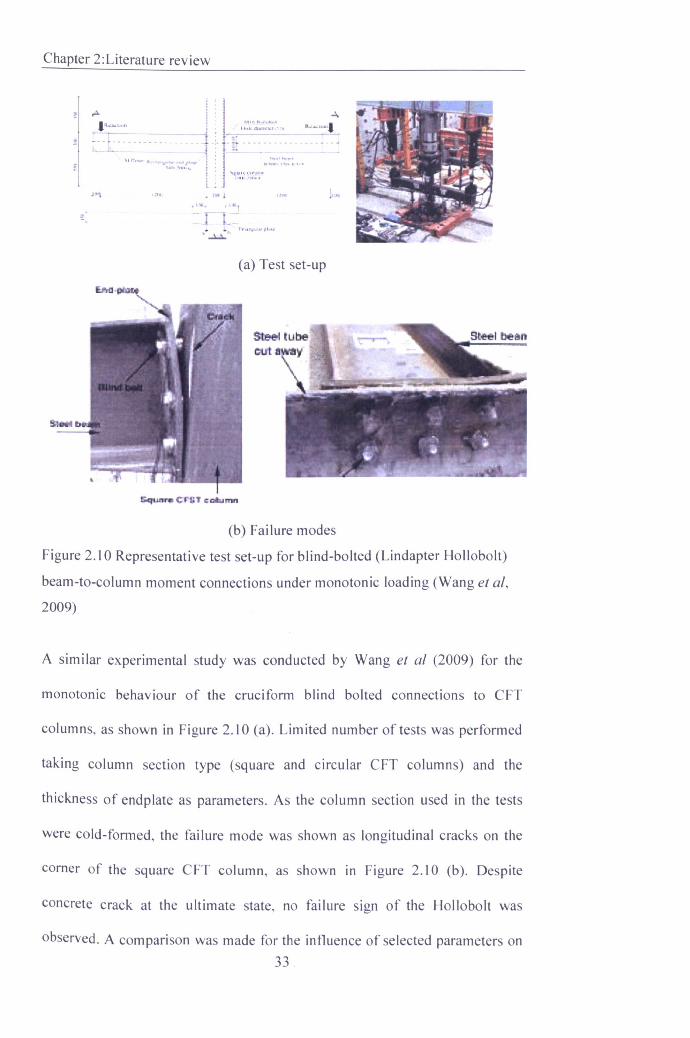
Chapter 2:Literature review
I ',A i :_llt~'~':b'(l : .
! ~_--L-"""""~':Hr:"._ a •. """::"" ~~I_ I :,_.....,... I:
i:
,:-:~t>~~~::~"lk.o.;I"_"~"- - - - - - .-~- - - . - - - ... - -
~,..,,_ ...
~L'U, . ~J
(a) Test set-up
~lft .. 4; lOT cc"""n
(b) Failure modes
Figure 2.10 Representative test set-up for blind-bolted (Lindapter Hollobolt)
beam-to-column moment connections under monotonic loading (Wang et al,
2009)
A similar experimental study was conducted by Wang et al (2009) for the
monotonic behaviour of the cruciform blind bolted connections to eFT
columns, as shown in Figure 2.10 (a). Limited number of tests was performed
taking column section type (square and circular eFT columns) and the
thickness of endplate as parameters. As the column section used in the tests
were cold-formed, the failure mode was shown as longitudinal cracks on the
comer of the square eFT column, as shown in Figure 2.10 (b). Despite
concrete crack at the ultimate state, no failure sign of the Hollobolt was
observed. A comparison was made for the influence of selected parameters on
33

Chapter 2:Literature review
the strength and stiffness of the connections. The thickness of endplate was
observed having an effect on the connection behaviour, i.e., the increased
thickness of endplate produces increased strength and stiffness but decreased
rotation capacity of the connections. The connection performance was
assessed on the basis of moment-rotation relationship. According to the
Eurocode 3 classification, it was concluded that this type of connection
behaved in a partial strength and semi-rigid manner with reasonable strength.and stiffness.
AI-Mughairi (2009) investigated the monotonic behaviour of the blind bolted
endplate connection to CFT column using the Extended Hollobolt, as shown in
Figure 2.11 (a). As already mentioned in the first chapter, this work is a pilot
study on the beam to column moment resisting behaviour of this innovative
blind bolted endplate connection in this study. Hence, it was intended to
present a little more details about experimental set-up and analysis herein as a
basic reference for present study. This experimental work aimed to study the
suitability of the use of the Extended Hollobolt for a moment resisting
connection. The parameters in this report include concrete strength, tube
thickness, bolt pitch and endplate type. The I-beam connected was designed
with larger capacity than the connection. As such, thick endplate with
sufficient strong welds was used to avoid any plastic deformation so that the
blind bolt failed in the end. The monotonic load was applied 1m away from
the connection with load control. It was observed in the reported test that the
failure mode for all the connections was the bolt fracture in tension rather than
pullout. From the strain gauge reading on the bolt and related experimental
34
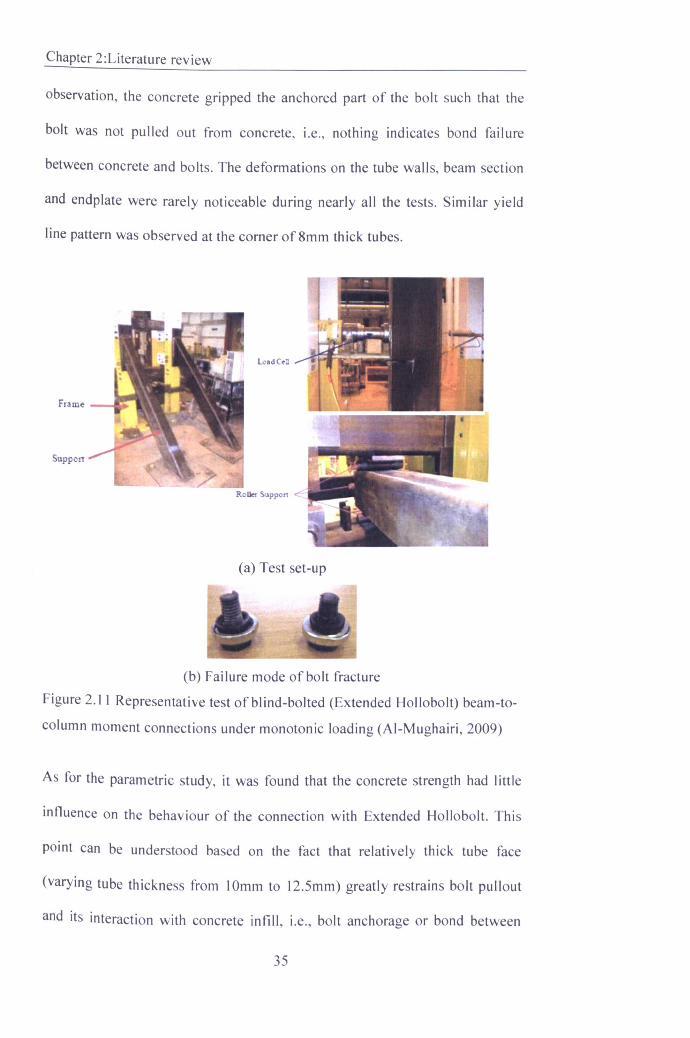
Chapter 2:Literature review
observation, the concrete gripped the anchored part of the bolt such that the
bolt was not pulled out from concrete, i.e., nothing indicates bond failure
between concrete and bolts. The deformations on the tube walls, beam section
and endplate were rarely noticeable during nearly all the tests. Similar yield
line pattern was observed at the comer of 8mm thick tubes.
Frame
SUppOIl
Roller Support
(a) Test set-up
(b) Failure mode of bolt fracture
Figure 2.1 1 Representative test of blind-bolted (Extended Hollobolt) beam-to-
column moment connections under monotonic loading (Al-Mughairi, 2009)
As for the parametric study, it was found that the concrete strength had little
influence on the behaviour of the connection with Extended Hollobolt. This
point can be understood based on the fact that relatively thick tube face
(varying tube thickness from 10mm to 12.5mm) greatly restrains bolt pullout
and its interaction with concrete infill, i.e., bolt anchorage or bond between
35
Chapter 2:Literature review
bolt and concrete. The non-negligible influence of tube thickness on the
connection behaviour was confinned in this report. It was found that the
increase of bolt pitch leads to an increase of moment capacity and ductility of
the connection. As for the endplate configuration, it was reported the extended
endplate thickness had more significant effect on the increase of connection·
capacity than tube wall thickness.
The rigidity of the connection was analysed using secant stiffness and related
classifications. The secant stiffness was estimated from Eurocode 3 method
and beam line analysis to specify. the connections among the categories of
rigid, semi-rigid and flexible. By using the classifications suggested by
Eurocode 3 and Bjorhovde, it was concluded that the connections with given.beam ranges (length and section) can be classified as rigid or semi-rigid (AI-
Mughairi, 2009). This classification system is based on the stiffness criteria
which can be referred to review work conducted by Chen (2000). This
indicated those connections within the category of semi-rigid or rigid
connection. The ultimate limit state study showed tested connections were
neither f~ll strength nor flexible. By changing the beam section and length, it
was found that full strength connections were achieved.
The 3D finite element models in the report were developed to validate against
test results with a great confidence. The bolt preload was found to be a
significant factor in determining the behaviour of the connections. It was also
reported the parametric study of the effects of relevant parameters on the
monotonic behaviour of the connections, including tube thickness, bolt pitch,
and bolt gauge. The stiffness of the connections was more affected by tube
36
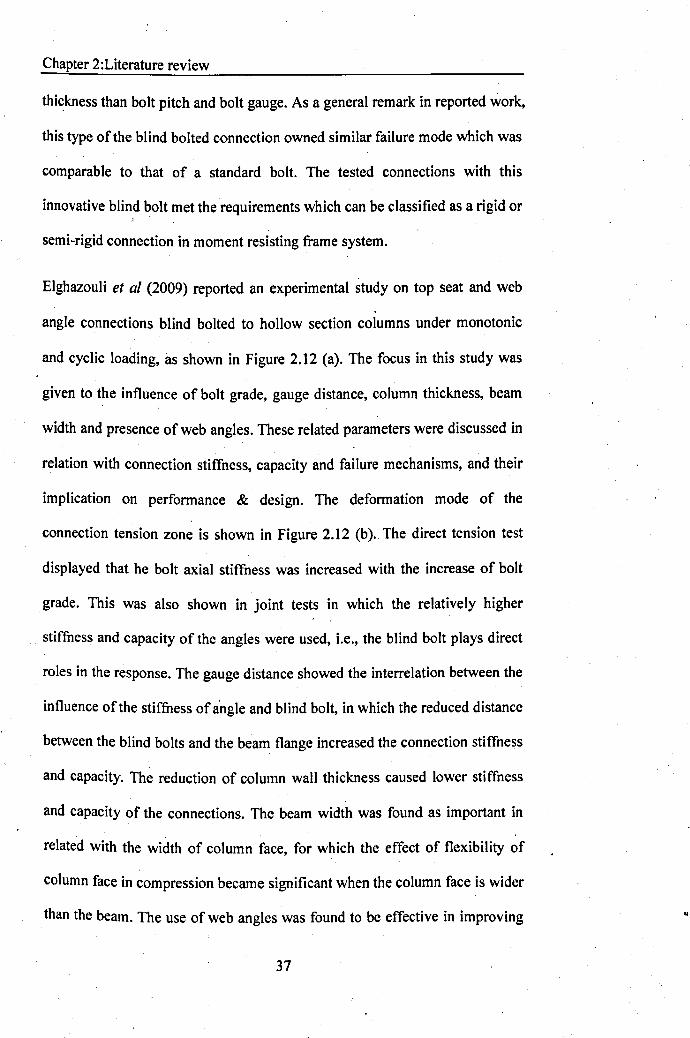
Chapter 2:Literature review
thickness than bolt pitch and bolt gauge. As a general remark in reported work,
this type of the blind bolted connection owned similar failure mode which was
comparable to that of a standard bolt. The tested connections with this
innovative blind bolt met the requirements which can be classified as a rigid or
semi-rigid connection in moment resisting frame system.
EIghazouli et at (2009) reported an experimental study on top seat and web
angle connections blind bolted to hollow section columns under monotonic
and cyclic loading, as shown in Figure 2.12 (a). The focus in this study was
given to the influence of bolt grade, gauge distance, column thickness, beam
width and presence of web angles. These related parameters were discussed in
relation with connection stiffness, capacity and failure mechanisms, and their
implication on performance & design. The deformation mode of the
connection tension zone is shown in Figure 2.12 (b). The direct tension test
displayed that he bolt axial stiffness was increased with the increase of bolt
grade. This was also shown in joint tests in which the relatively higher
stiffness and capacity of the angles were used, i.e., the blind bolt plays direct
roles in the response. The gauge distance showed the interrelation between the
influence of the stiffness of angle and blind bolt, in which the reduced distance
between the blind bolts and the beam flange increased the connection stiffness
and capacity. The reduction of column wall thickness caused lower stiffness
and capacity of the connections. The beam width was found as important in
related with the width of column face, for which the effect of flexibility of
column face in compression became significant when the column face is wider
than the beam. The use of web angles was found to be effective in improving ..
37
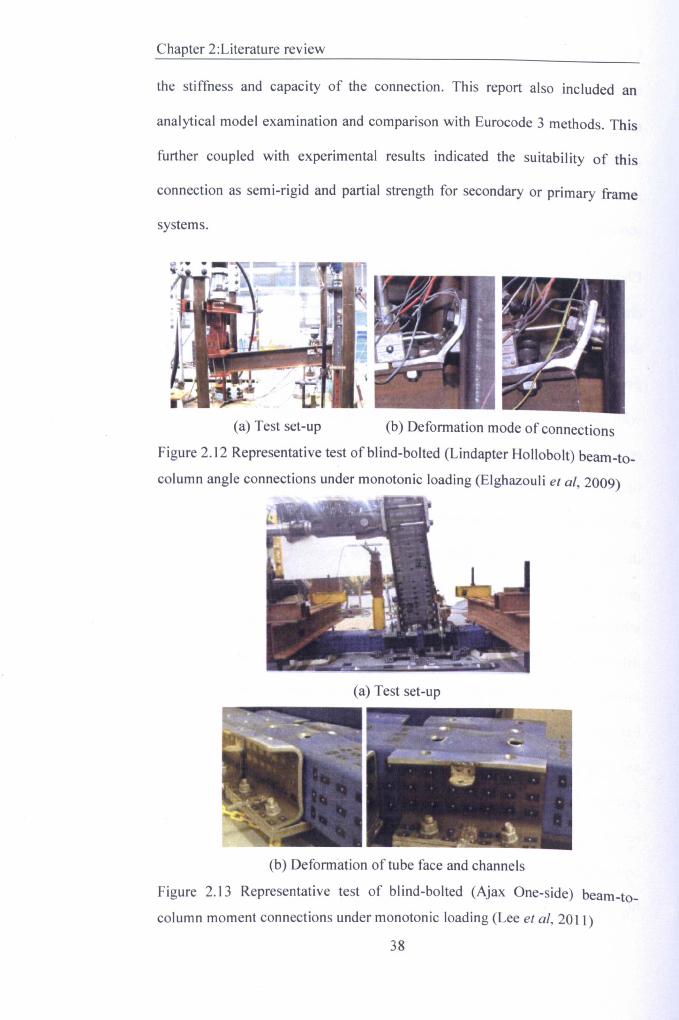
Chapter 2:Literature review
the stiffness and capacity of the connection. This report also included an
analytical model examination and comparison with Eurocode 3 methods. This
further coupled with experimental results indicated the suitability of this
connection as semi-rigid and partial strength for secondary or primary frame
systems.
(a) Test set-up (b) Deformation mode of connections
Figure 2.12 Representative test of blind-bolted (Lindapter Hollobolt) beam-to-
column angle connections under monotonic loading (Elghazouli et al, 2009)
(a) Test set-up
(b) Deformation of tube face and channels
Figure 2.13 Representative test of bl ind-bolted (Ajax One-side) beam-to-
column moment connections under monotonic loading (Lee et al, 2011)
38
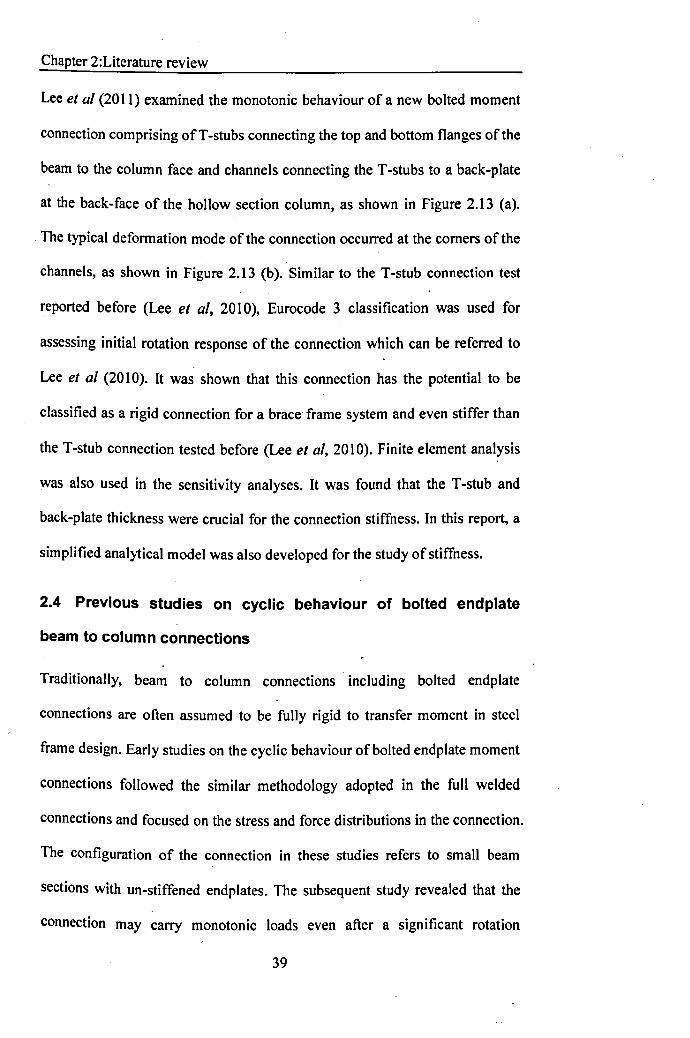
Chapter 2:Literature review
Lee et al (2011) examined the monotonic behaviour of a new bolted moment
connection comprising ofT-stubs connecting the top and bottom flanges of the
beam to the column face and channels connecting the T-stubs to a back-plate
at the back-face of the hollow section column, as shown in Figure 2.13 (a).
The typical deformation mode of the connection occurred at the comers of the
channels, as shown in Figure 2.13 (b). Similar to the T-stub connection test
reported before (Lee et al, 2010), Eurocode 3 classification was used for
assessing initial rotation response of the connection which can be referred to
Lee et al (2010). It was shown that this connection has the potential to be
classified as a rigid connection for a brace frame system and even stiffer than
the T-stub connection tested before (Lee et al, 2010). Finite element analysis
was also used in the sensitivity analyses. It was found that the T-stub and
back-plate thickness were crucial for the connection stiffness. In this report, a
simplified analytical model was also developed for the study of stiffness.
2.4 Previous studies on cyclic behaviour of bolted endplate
beam to column connections
Traditionally, beam to column connections including bolted endplate
connections are often assumed to be fully rigid to transfer moment in steel
frame design. Early studies on the cyclic behaviour of bolted endplate moment
connections followed the similar methodology adopted in the full welded
connections and focused on the stress and force distributions in the connection.
The configuration of the connection in these studies refers to small beam
sections with uri-stiffened endplates. The subsequent study revealed that the
connection may carry monotonic loads even after a significant rotation
39
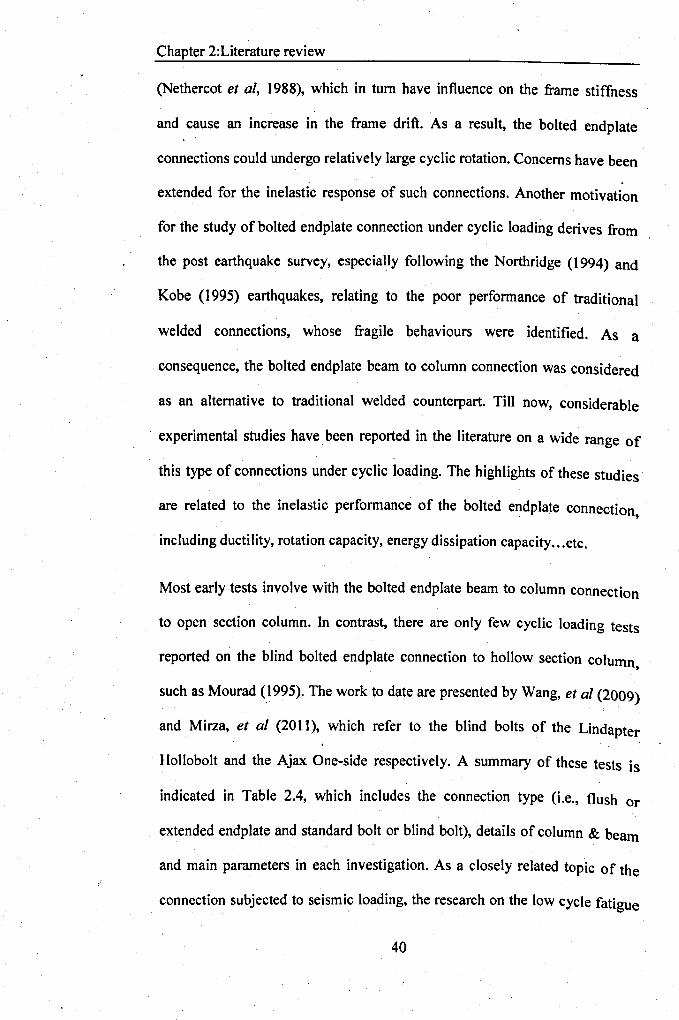
Chapter 2:Literature review
(Nethercot et ai, 1988), which in turn have influence on the frame stiffness
and cause an increase in the frame drift. As a result, the bolted endplate
connections could undergo relatively large cyclic rotation. Concerns have been
extended for the inelastic response of such connections. Another motivation
for the study of bolted endplate connection under cyclic loading derives from
the post earthquake survey, especially following the Northridge (1994) and
Kobe (1995) earthquakes, relating to the poor performance of traditional
welded connections, whose fragile behaviours were identified. As a
consequence, the bolted endplate beam to column connection was considered
as an alternative to traditional welded counterpart. Till now, considerable
. experimental studies have been reported in the literature on a wide range of
this type of connections under cyclic loading. The highlights of these studies
are related to the inelastic performance of the bolted endplate connection ,
including ductility, rotation capacity, energy dissipation capacity ... etc.
Most early tests involve with the bolted endplate beam to column connection
to open section column. In contrast, there are only few cyclic loading tests
reported on the blind bolted endplate connection to hollow section column ,
such as Mourad (1995). The work to date are presented by Wang, et al (2009)
and Mirza, et al (2011), which refer to the blind bolts of the Lindapter
Hollobolt and the Ajax One-side respectively. A summary of these tests is
indicated in Table 2.4, which includes the connection type (i.e., flush or
extended endplate and standard bolt or blind bolt), details of column & beam
and main parameters in each investigation. As a closely related topic of the
connection subjected to seismic loading, the research on the low cycle fatigue
40

Chapter 2: Literature review
behaviour of the bolted endplate moment connection is also briefly outlined at
the end of this section. The representative cyclic loading history used in these
tests is compared with codified procedures, such as ECCS (1986) and ATC-24
(1992).
41
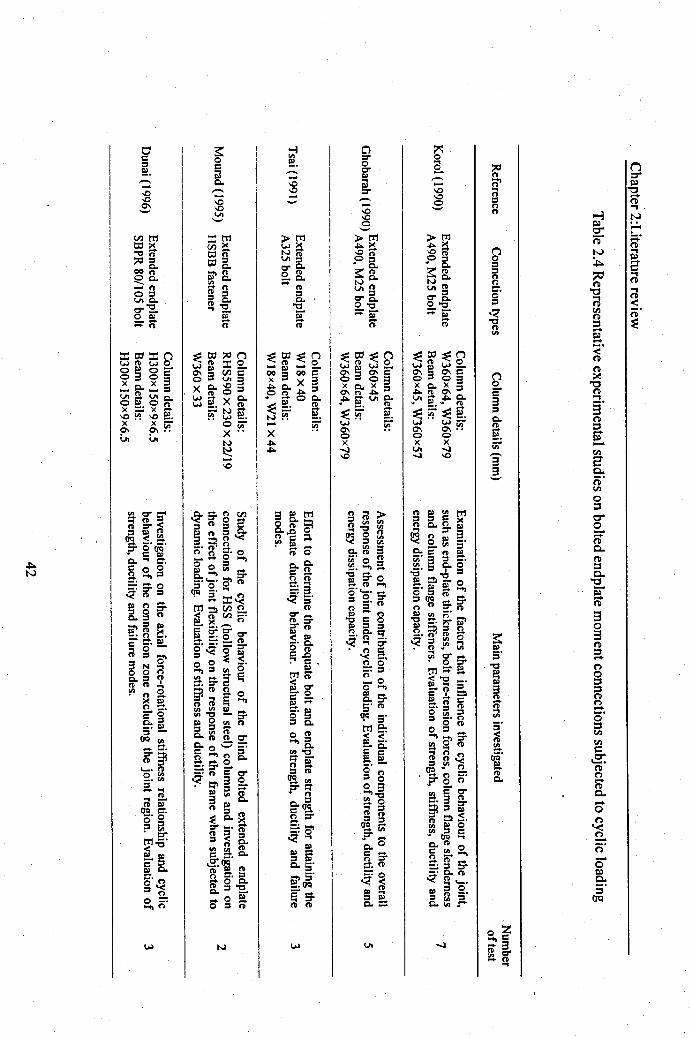
>tT1\,0.)><~gerQ.o ~-Q.-~::s
Q."0
~
a=-o[
3':3._,
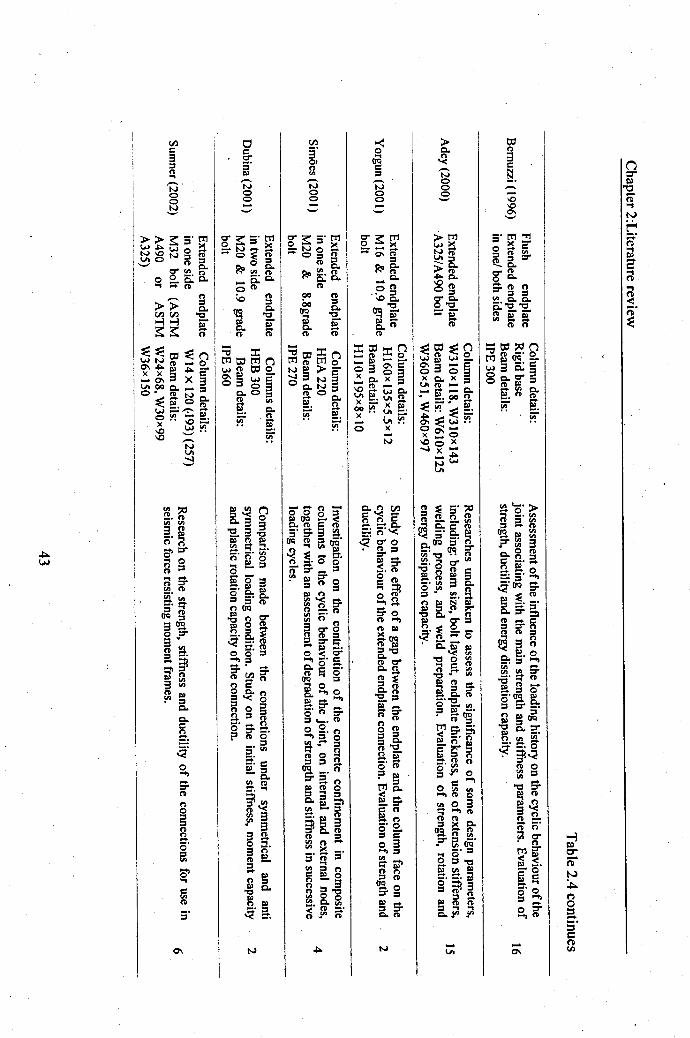
Cl§.s·II>,-..Noo-._,
N
til
~~'",-..Noo-._,i;:I
Noo-._,>c.~.-.Nooo._,
N -v. -0'1
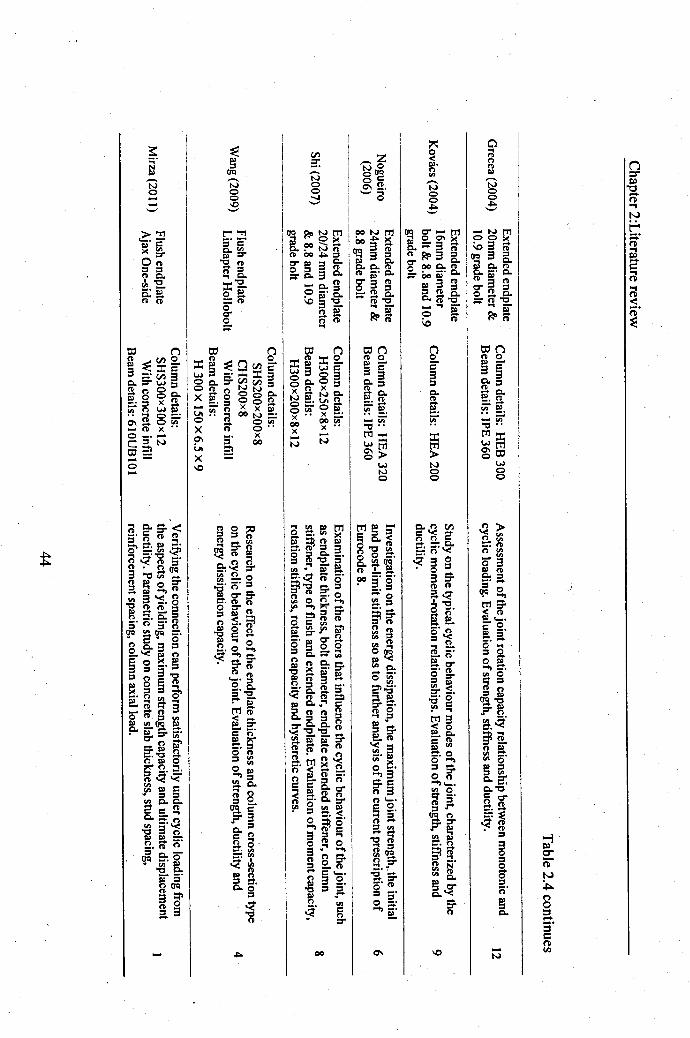
3:~..-.No--'-"
.-.zNOoa.§On0\ _.'-' ...o
tTl§;'~ Co <~ '0 14o 0 _.Col4(JQn I ~--00 _. _ •
. 2. g-0l4:;,
§ii"~ g'" no ..,el~.....e:o '"'"a'-6.~a::r _.n 0.., :;,~ .:;, -~ ::r_n~3;;;.~o _.....,3g.c::n 3n '-.c:: 0=I _.n sasa~'On.., :;,fA OSseg·lf:;, _.o S:...., _.
~
00
~Noo
-N
Chapter 2:Literature review
An early study conducted by Korol, et al (1990) revealed that proper design
and detailing of bolted endplate connections could produce sufficient energy
dissipation without substantial loss of strength or stiffuess. Both endplate and
column flange as important structural components in the connection system
have great influences on the connection failure under cyclic loading. It was
reported that the bolt force deterioration induced by thin endplate could allow
reduced connection stiffness. It was suggested the adequacy of column (open
section) flange should be checked beforehand, even if the column stiffeners
are considered, to avoid excessive yielding of column flange which would
further lead to low cycle fatigue.
The experiments reported by Ghobarah, et al (1990) and Tsai, et al (1991)
demonstrated that well designed bolted endplate connections can be
considered suitable for moment-resisting frames in severe seismic service.
They did not recommend un-stiffened column flange for seismic design of
bolted endplate connections. To avoid significant failures of the bolt and
endplates during cyclic loading, the connections were advised capable of
sustaining the moment of 1.3Mp. in which Mp is the plastic moment of the
beam. They also presented design recommendations for bolts used in these
connections as a supplement for AISC codes.
Mourad, et al (1995) continued Ghobarah's research on the bolted extended
endplate connections (using HSBB fasteners) to hollow section columns in
moment resisting steel frame. The beam yielding was avoided in the pre-
design of the test to examine the behaviour of the connections under cyclic .
loading. This assumption was achieved in their tests. The nonlinear frame
analysis showed that the flexibility of such connections increased lateral
45
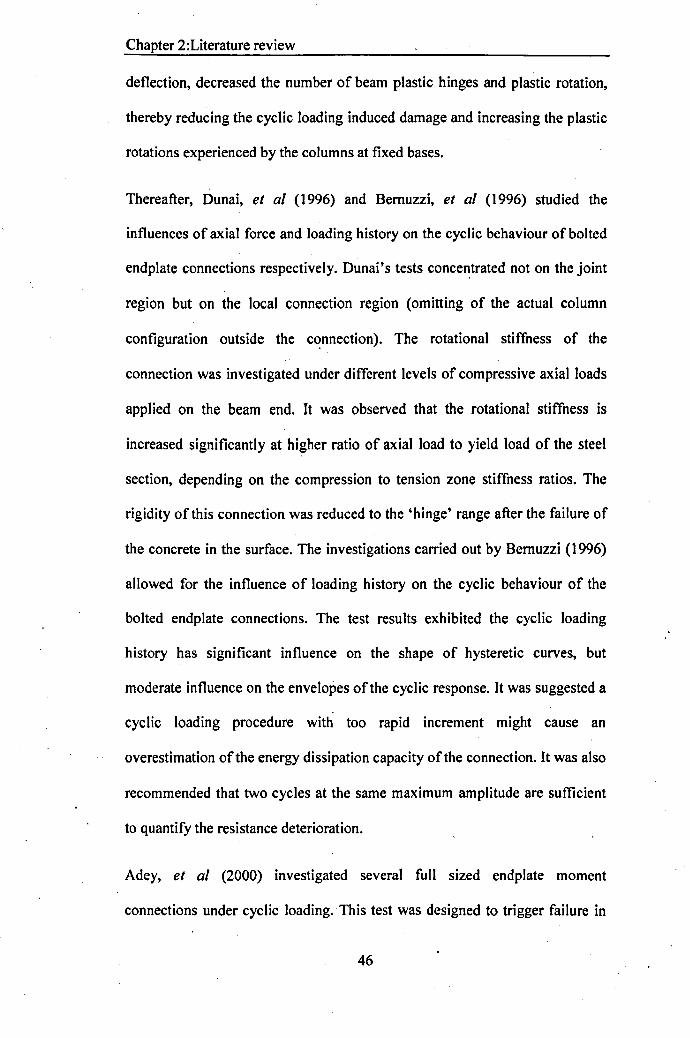
Chapter 2:Literature review
deflection, decreased the number of beam plastic hinges and plastic rotation,
thereby reducing the cyclic loading induced damage and increasing the plastic
rotations experienced by the columns at fixed bases.
Thereafter, Dunai, et al (1996) and Bemuzzi, et al (1996) studied the
influences of axial force and loading history on the cyclic behaviour of bolted
endplate connections respectively. Dunai's tests conce~trated not on the joint
region but on the local connection region (omitting of the actual column
configuration outside the connection). The rotational stiffness of the
connection was investigated under different levels of compressive axial loads
applied on the beam end. It was observed that the rotational stiffness is
increased significantly at higher ratio of axial load to yield load of the steel
section, depending on the compression to tension zone stiffness ratios. The
rigidity of this connection was reduced to the 'hinge' range after the failure of
the concrete in the surface. The investigations carried out by Bemuzzi (1996)
allowed for the influence of loading history on the cyclic behaviour of the
bolted endplate connections. The test results exhibited the cyclic loading
history has significant influence on the shape of hysteretic curves, but
moderate influence on the envelopes of the cyclic response. It was suggested a
cyclic loading procedure with too rapid increment might cause an
overestimation of the energy dissipation capacity of the connection. It was also
recommended that two cycles at the same maximum amplitude are sufficient
to quantify the resistance deterioration.
Adey, et al (2000) investigated several full sized endplate moment
connections under cyclic loading. This test was designed to trigger failure in
46
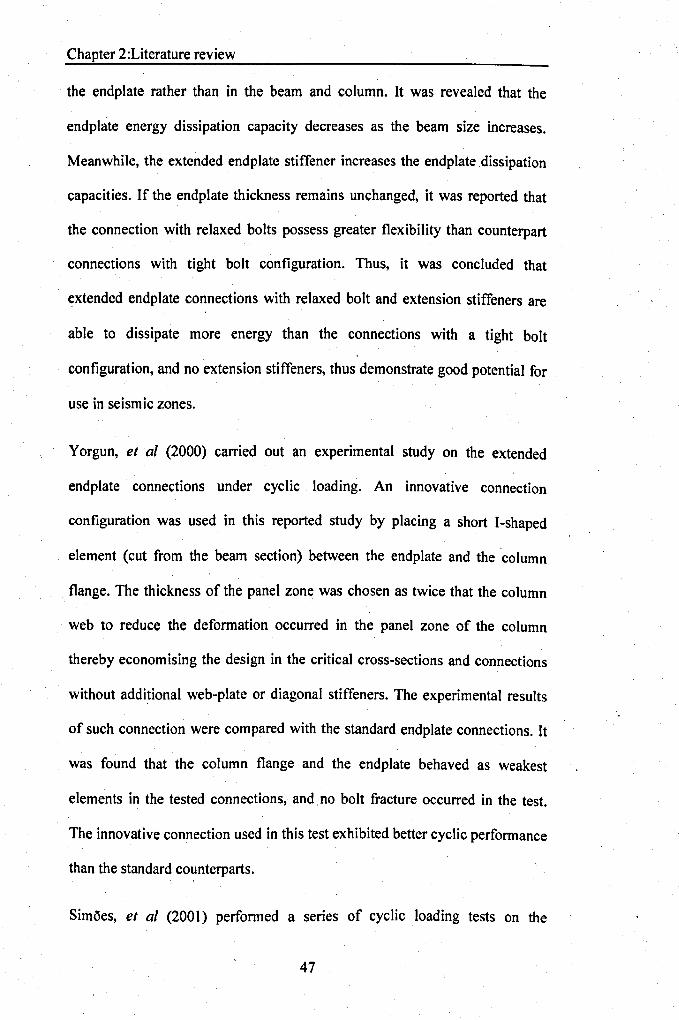
Chapter 2:Literature review
the endplate rather than in the beam and column. It was revealed that the
endplate energy dissipation capacity decreases as the beam size increases.
Meanwhile, the extended endplate stiffener increases the endplate .dissipation
capacities. If the endplate thickness remains unchanged, it was reported that
the connection with relaxed bolts possess greater flexibility than counterpart
connections with tight bolt configuration. Thus, it was concluded that
extended endplate connections with relaxed bolt and extension stiffeners are
able to dissipate more energy than the connections with a tight bolt
configuration, and no extension stiffeners, thus demonstrate good potential for
use in seismic zones.
Yorgun, et al (2000) carried out an experimental study on the extended
endplate connections under cyclic loading. An innovative connection
configuration was used in this reported study by placing a short l-shaped
element (cut from the beam section) between the endplate and the 'column
flange. The thickness of the panel zone was chosen as twice that the column
web to reduce the deformation occurred in the panel zone of the column
thereby economising the design in the critical cross-sections and connections
without additional web-plate or diagonal stiffeners. The experimental results
of such connection were compared with the standard endplate connections. It
was found that the column flange and the endplate behaved as weakest
elements in the tested connections, and. no bolt fracture occurred in the test.
The innovative connection used in this test exhibited better cyclic performance
than the standard counterparts.
Simoes, et al (2001) performed a series of cyclic loading tests on the
47
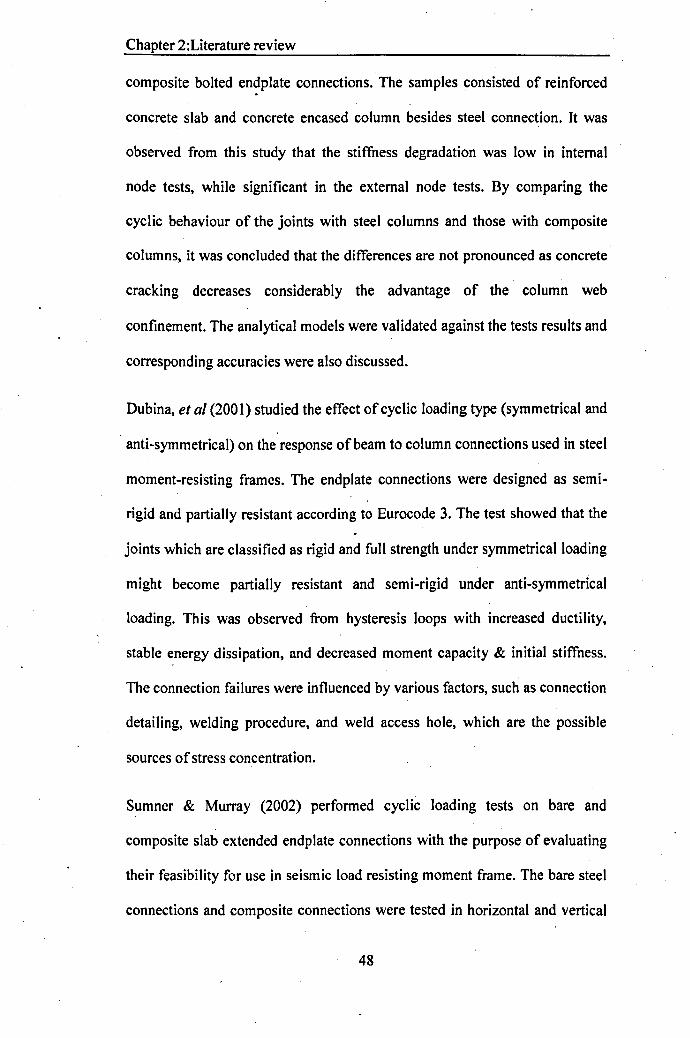
Chapter 2:Literature review
composite bolted endplate connections. The samples consisted of reinforced
concrete slab and concrete encased column besides steel connection. It was
observed from this study that the stiffness degradation was low in internal
node tests, while significant in the external node tests. By comparing the
cyclic behaviour of the joints with steel columns and those with composite
columns, it was concluded that the differences are not pronounced as concrete
cracking decreases considerably the advantage of the column web
confinement. The analytical models were validated against the tests results and
corresponding accuracies were also discussed.
Dubina, et al (2001) studied the effect of cyclic loading type (symmetrical and
anti-symmetrical) on the response of beam to column connections used in steel
moment-resisting frames. The endplate connections were designed as semi-
rigid and partially resistant according to Eurocode 3. The test showed that the
joints which are classified as rigid and full strength under symmetrical loading
might become partially resistant and semi-rigid under anti-symmetrical
loading. This was observed from hysteresis loops with increased ductility,
stable energy dissipation, and decreased moment capacity & initial stiffness.
The connection failures were influenced by various factors, such as connection
detailing, welding procedure, and weld access hole, which are the possible
sources of stress concentration.
Sumner & Murray (2002) performed cyclic loading tests on bare and
composite slab extended endplate connections with the purpose of evaluating
their feasibility for use in seismic load resisting moment frame. The bare steel
connections and composite connections were tested in horizontal and vertical
48
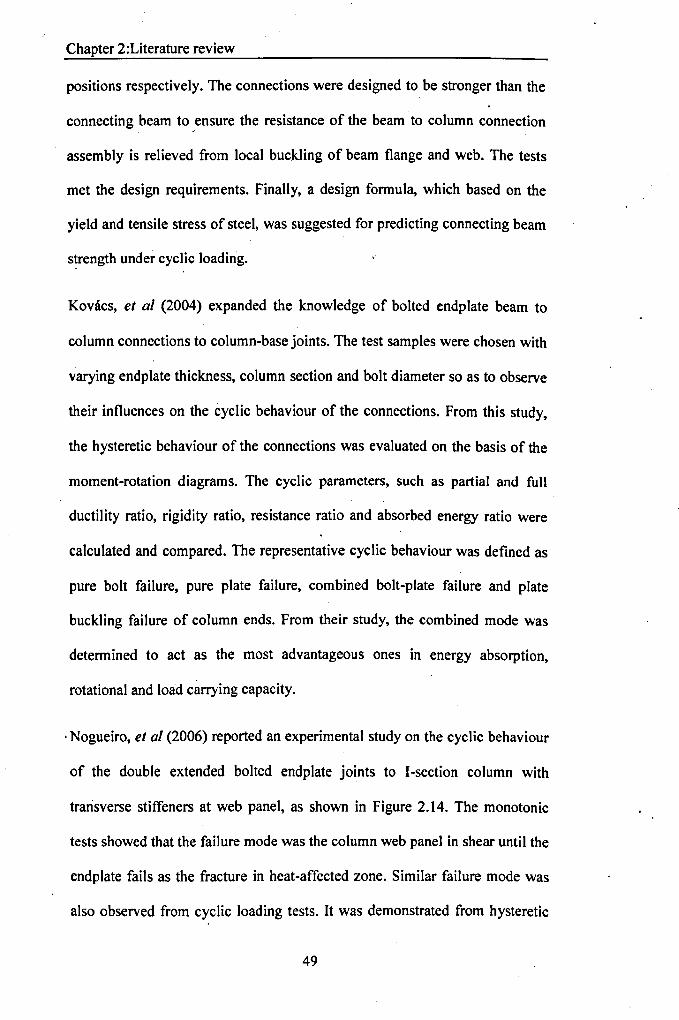
Chapter 2:Literature review
positions respectively. The connections were designed to be stronger than the
connecting beam to ensure the resistance of the beam to column connection
assembly is relieved from local buckling of beam flange and web. The tests
met the design requirements. Finally, a design formula, which based on the
yield and tensile stress of steel, was suggested for predicting connecting beam
strength under cyclic loading.
Kovacs, et al (2004) expanded the knowledge of bolted endplate beam to
column connections to column-base joints. The test samples were chosen with
varying endplate thickness, column section and bolt diameter so as to observe
their influences on the cyclic behaviour of the connections. From this study,
the hysteretic behaviour of the connections was evaluated on the basis of the
moment-rotation diagrams. The cyclic parameters, such as partial and full
ductility ratio, rigidity ratio, resistance ratio and absorbed energy ratio were
calculated and compared. The representative cyclic behaviour was defined as
pure bolt failure, pure plate failure, combined bolt-plate failure and plate
buckling failure of column ends. From their study, the combined mode was
determined to act as the most advantageous ones in energy absorption,
rotational and load carrying capacity .
.Nogueiro, et al (2006) reported an experimental study on the cyclic behaviour
of the double extended bolted endplate joints to I-section column with
transverse stiffeners at web panel, as shown in Figure 2.14. The monotonic
tests showed that the failure mode was the column web panel in shear until the
endplate fails as the fracture in heat-affected zone. Similar failure mode was
also observed from cyclic loading tests. It was demonstrated from hysteretic
49
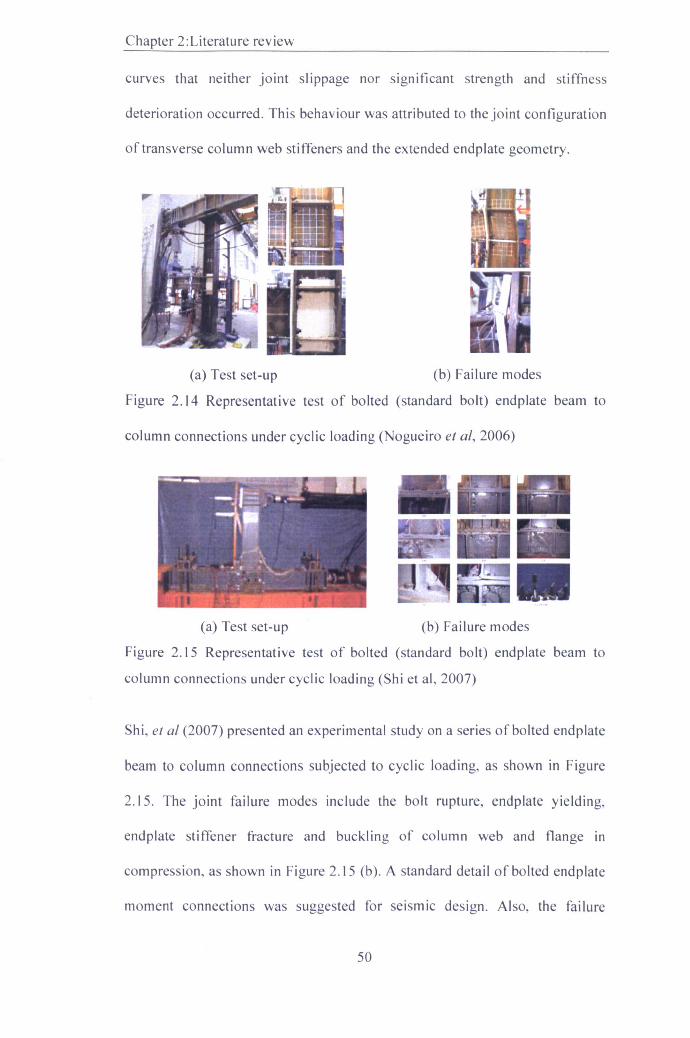
Chapter 2:Literature review
curves that neither joint slippage nor significant strength and stiffness
deterioration occurred. This behaviour was attributed to the joint configuration
of transverse column web stiffeners and the extended endplate geometry.
(a) Test set-up (b) Failure modes
Figure 2.14 Representative test of bolted (standard bolt) end plate beam to
column connections under cyclic loading (Nogueiro et ai, 2006)
(a) Test set-up (b) Failure modes
Figure 2.15 Representative test of bolted (standard bolt) endplate beam to
column connections under cyclic loading (Shi et ai, 2007)
Shi, et al (2007) presented an experimental study on a series of bolted endplate
beam to column connections subjected to cyclic loading, as shown in Figure
2.15. The joint failure modes include the bolt rupture, endplate yielding,
endplate stiffener fracture and buckling of column web and flange in
compression, as shown in Figure 2.15 (b). A standard detail of bolted endplate
moment connections was suggested for seismic design. Also, the failure
50
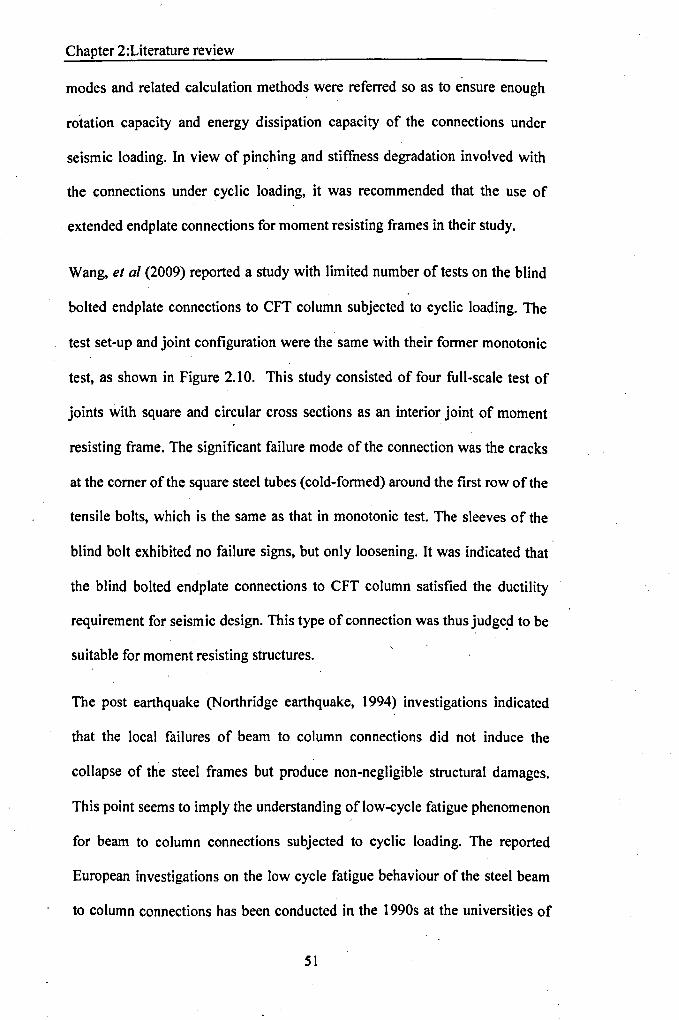
Chapter 2:Literature review
modes and related calculation methods were referred so as to ensure enough
rotation capacity and energy dissipation capacity of the connections under
seismic loading. In view of pinching and stiffness degradation involved with
the connections under cyclic loading, it was recommended that the use of
extended endplate connections for moment resisting frames in their study.
Wang, et al (2009) reported a study with limited number of tests on the blind
bolted endplate connections to CFT column subjected to cyclic loading. The
test set-up and joint configuration were the same with their former monotonic
test, as shown in Figure 2.10. This study consisted of four full-scale test of
joints with square and circular cross sections as an interior joint of moment
resisting frame. The significant failure mode of the connection was the cracks
at the corner of the square steel tubes (cold-formed) around the first row of the
tensile bolts, which is the same as that in monotonic test. The sleeves of the
blind bolt exhibited no failure signs, but only loosening. It was indicated that
the blind bolted endplate connections to CFT column satisfied the ductility
requirement for seismic design. This type of connection was thus judged to be
suitable for moment resisting structures.
The post earthquake (Northridge earthquake, 1994) investigations indicated
that the local failures of beam to column connections did not induce the
collapse of the steel frames but produce non-negligible structural damages.
This point seems to imply the understanding of low-cycle fatigue phenomenon
for beam to column connections subjected to cyclic loading. The reported
European investigations on the low cycle fatigue behaviour of the steel beam
to column connections has been conducted in the 1990s at the universities of
51
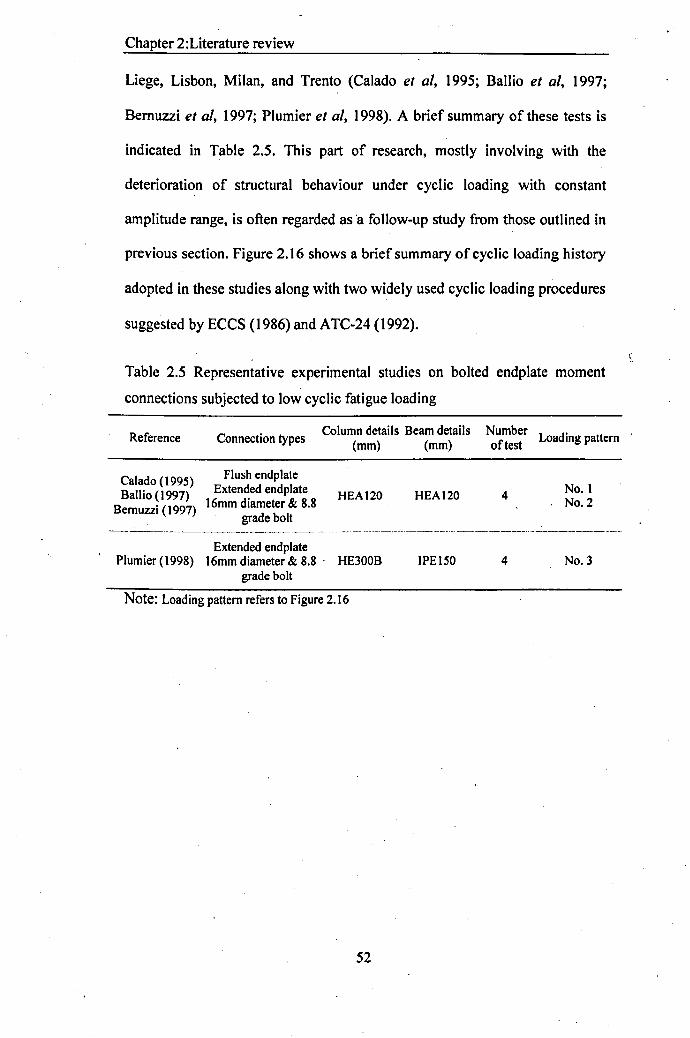
Chapter 2:Literature review
Liege, Lisbon, Milan, and Trento (Calado et al, 1995; Ballio et al, 1997;
Bemuzzi et al, 1997; Plumier et al, 1998). A brief summary of these tests is
indicated in Table 2.5. This part of research, mostly involving with the
deterioration of structural behaviour under cyclic loading with constant
amplitude range, is often regarded as 'a follow-up study from those outlined in
previous section. Figure 2.16 shows a brief summary of cyclic loading history
adopted in these studies along with two widely used cyclic loading procedures
suggested by ECCS (1986) and ATC-24 (1992).
\,Table 2.5 Representative experimental studies on bolted endplate moment
connections subjected to low cyclic fatigue loading
Reference Connection typesColumn details Beam details Number
(mm) (mm) of test Loading pattern
Calado (1995)Ballio ( 1997)
Bernuzzi (1997)
Flush endplateExtended endplate
16mm diameter & 8.8grade bolt
HEA120 HEA120 4 No.1No.2
Extended endplatePlumier (1998) 16mm diameter & 8.8' HE300B
grade boltIPE150 4 No.3
Note: Loading pattern refers to Figure 2.16
52
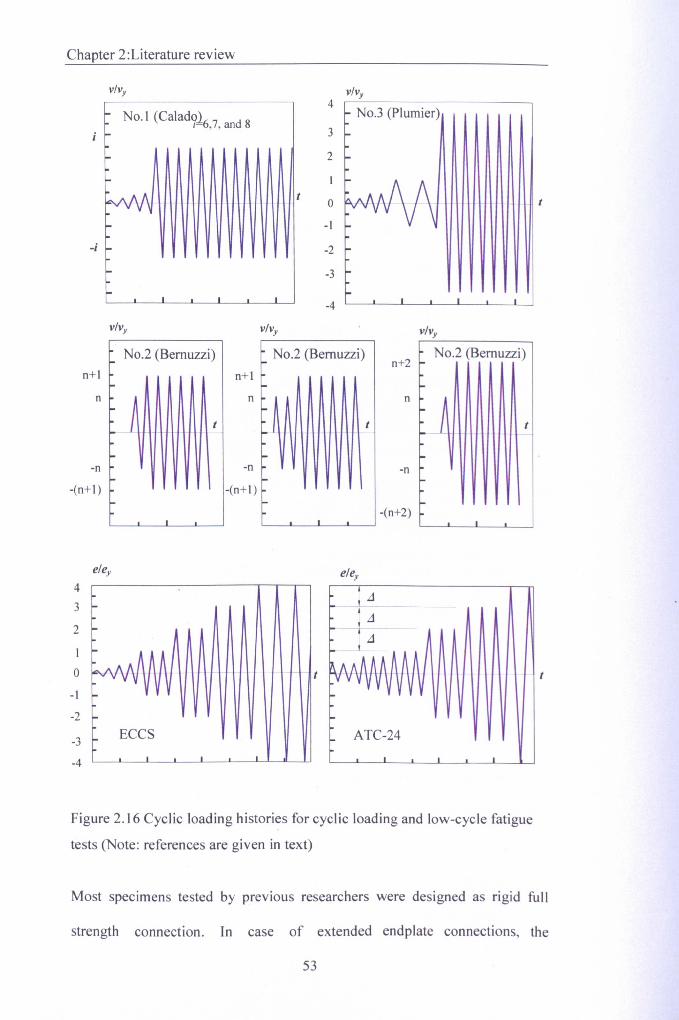
Chapter 2:Literature review
n+l
-(n+ 1)
43 I-
-2
-3 I-
-4
V/Vy V/Vy4
No.3 (Plumier)3 -2 -
t0
~
- - t
-I-2
No.1 (ealad926,7, and 8--~/\AA
v v'l
-i I-
-3
I • I I I-4
V/Vy V/Vy V/Vy
No.2 (Bemuzzi)No.2 (Bemuzzi)I-
No.2 (Bemuzzi)n+2
n+l
n U tr--
I--n l-
I-
I--(n+2)
t
--n -n
-(n+ 1)
I
ele, ele,
t
Eees ATe-24
Figure 2.16 Cyclic loading histories for cyclic loading and low-cycle fatigue
tests (Note: references are given in text)
Most specimens tested by previous researchers were designed as rigid full
strength connection. In case of extended endplate connections, the
53
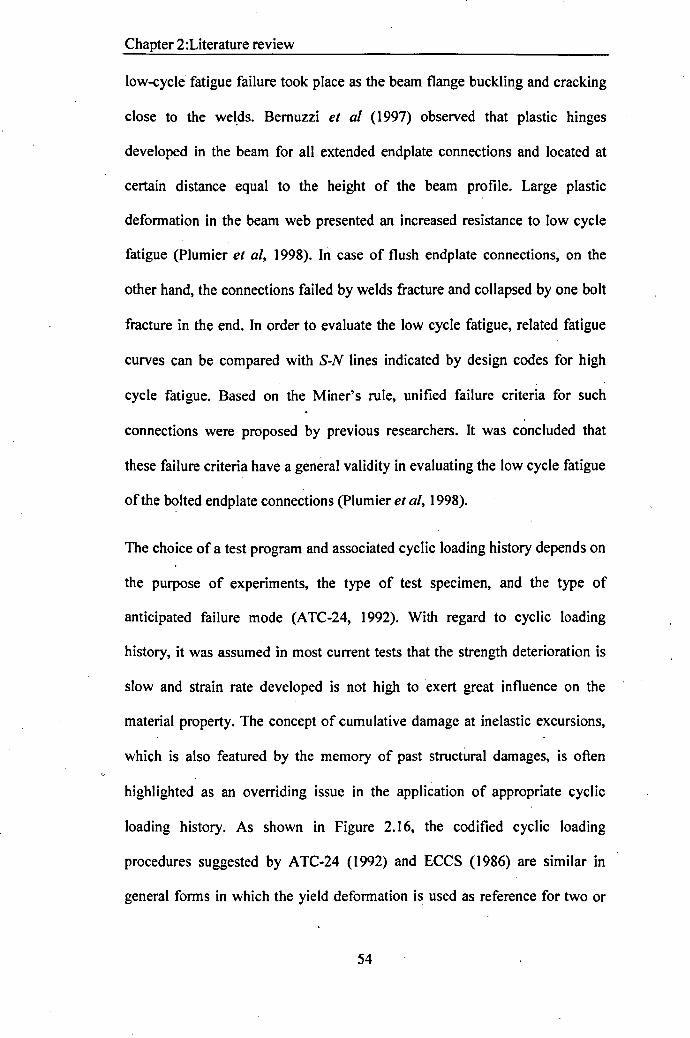
Chapter 2:Literature review
low-cycle fatigue failure took place as the beam flange buckling and cracking
close to the welds, Bernuzzi et al (1997) observed that plastic hinges
developed in the beam for all extended endplate connections and located at
certain distance equal to the height of the beam profile. Large plastic
deformation in the beam web presented an increased resistance to low cycle
fatigue (Plumier et ai, 1998). In case of flush endplate connections, on the
other hand, the connections failed by welds fracture and collapsed by one bolt
fracture in the end. In order to evaluate the low cycle fatigue, related fatigue
curves can be compared with S-N lines indicated by design codes for high
cycle fatigue. Based on the Miner's rule, unified failure criteria for such
connections were proposed by previous researchers. It was concluded that
these failure criteria have a general validity in evaluating the low cycle fatigue
of the bolted endplate connections (Plumier et al, 1998).
The choice of a test program and associated cyclic loading history depends on
the purpose of experiments, the type of test specimen, and the type of
anticipated failure mode (ATC-24, 1992). With regard to cyclic loading
history, it was assumed in most current tests that the strength deterioration is
slow and strain rate developed is not high to exert great influence on the
material property. The concept of cumulative damage at inelastic excursions,
which is also featured by the memory of past structural damages, is often
highlighted as an overriding issue in the application of appropriate cyclic
loading history. As shown in Figure 2.16, the codified cyclic loading
procedures suggested by ATC-24 (1992) and ECCS (1986) are similar in
general forms in which the yield deformation is used as reference for two or
54
Chapter 2:Literature review
three cycles at each amplitude of stepwise increasing (multiple steps)
deformation cycles in the inelastic range. On the other hand, the loading
histories used for low cycle fatigue test contain most cycles at a given
deformation amplitude. It appears that the procedures for low cycle fatigue
indicate main outcomes in the resistance deterioration while the codified
procedures allow for tested structure achieving its potential strength and
providing implicit information related ductility level and energy dissipation. In
the present study, the ECCS (1986) cyclic loading procedure was adopted and
modified for quasi-static cyclic loading test, which will be indicated in
Chapter 3. The cumulative damage evaluation of this innovative blind bolted
endplate connection to CFT column will be described in Chapter 5 as a further
analysis of the test data.
2.5 Previous numerical studies of blind bolted connections
Use of finite element modelling for the behaviour of bolted endplate
connection can be dated back to 1970s (Krishnamurthy & Graddy, 1976).
Earlier analyses mostly focused on the elastic behaviour of the connections
through simplified 2D or 3D models (Abolmaali et al, 1984). Thereafter, the
advance of computer technology leads to more sophisticated modelling of the
joint behaviour, such as the incorporation of inelastic material behaviour and
contact condition between connection components (Gebbeken et al, 1994;
Bahaari & Sherbourne, 1996; Choi & Chung, 1996; Bose et al; 1997). Also,
the modelling of bolt preload condition in the estimation of the moment-
rotation behaviour of the connection was reported (Bursi & Jaspart, 1998;
Sumner, 2003; Shi et al, 2008). Although considerable work described in the
55
Chapter 2:Literature review
literature related to the modelling the traditional bolted endplate connection to
open section column, there are only limited number of reports referring to the
modelling of the blind bolted connections. In contrast to the standard bolts, in
fact, more complicated configuration and boundary condition are inevitably
introduced for the blind bolts. Lee et al (2011) presented a 3D finite element
model for a blind bolted moment connection to unfilled hollow section column
using Ajar ONES IDE blind bolts. Yao et al (2008) proposed a numerical blind
bolt model with solid element plus spring element for Ajar ONESIDE blind
bolts and cogged extensions respectively in their study of the tensile behaviour
of blind bolted T-stub connections to concrete filled circular columns. As for
the blind bolted connections studied herein, however, there are no detailed
reports available in the literature regarding related modelling approaches for
them. The attempts of modelling the connection behaviour in this study will be
presented in Chapter 6.
2.6 Previous analytical model studies of beam-to-column Joints
Based on the available literature, several sophisticated mathematical
representations for the prediction of the monotonic joint behaviour have been
proposed (Abdalla et al, 1995). To characterize the joint moment-rotation
relationships in this study, the test moment-rotation envelope curve for the
representative tests are modelled using various representations, such as
polynomial representation (Frye & Morris, 1975), three-parameter power
representation (Richard & Abbott, 1975; Colson & Louveau, 1983; Kishi &
Chen, 1990), and exponential representation (Yee et al, 1986; Lui & Chen,
1986; Wu & Chen, 1990).
56
Chapter 2:Literature review
The hysteretic moment-rotation curves are often used for representing the
cyclic response of beam-to-column joints with the aid of mathematical models.
These models are based on the curve fitting thereby correlating with the
experimental curves as the range of application agrees with the structural
details tested (Faella et al, 2008). Various mathematical models for hysteretic
behaviour of beam-to-column joints and components have been developed. As
the hysteretic loops under repeated and reversed loading are assumed to be
stable and reproducible, the static monotonic moment-rotation curves are used
and extended to the cyclic loading analysis (Chui & Chan, 1996). For example,
the Ramberg-Osgood model was early adopted by Mazzolani (Mazzolani,
1988) in the simulation of the hysteretic behaviour of the connection with
slippage. A literature review and an application of such models together with
the Richard-Abbott model were provided by Chui & Chan (1996) and SimOes
& Silva (2001). Bemuzzi (1998) extended the tri-linear representation
suggested by Eurocode 3 (2005) to the case of beam-to-column joints under
cyclic loading in which the unloading and reloading phases are based on the
Massing assumption. Deng et al (2000) proposed a nonlinear hysteretic
connection element for the simulation of extended endplate connection. This
model was formulated by introducing a multilinear cyclic skeleton followed
by curvilinear cyclic relationship as well as degradation and pinching schemes.
More recently, Ibarra et al (2005) developed relatively simple hysteretic
models that include the strength and stiffness degradations for high inelastic
systems. Based on the mathematical models available in the literature, this
study also indicates analytical simulation of moment-rotation hysteresis loops
57
Chapter 2:Literature review
in Chapter 7.
2.7 Conclusion and needs for further research
From above literature review, it is indicated that the use of blind bolt for
moment resisting connections has been under investigation, especially for its
relevant behaviour under tension. However, very limited investigations have
been carried out on the cyclic behaviour of such connections. As a closely
related topic, in contrast, considerable work have been carried out on the
cyclic behaviour of bolted endplate connections to open section columns using
standard bolts.
The key findings obtained from previous studies relevant to the present study
may be summarized as follows:
• Early tensile tests of blind bolts showed that the Hollobolt is likely to be
partially pulled through the bolt hole with ductile shearing of the flaring
sleeves. When the hollow section column is introduced into the bolted
connection assembly, a significant deformation can be expected for the
compression region of the connection with tube sidewall bulged
outwards.
• For the blind bolted connection to hollow section column, the reduction of
column wall thickness leads to lower stiffness and capacity of the
connection. The relation of beam endplate width with the width of
column face plays an important role in developing joint behaviour, for
which the effect of flexibility of column face in compression became
significant when the column face is wider than the beam endplate.
58

Chapter 2:Literature review
• The introduction of concrete infill into the blind bolted connections to
hollow section column greatly enhances the strength and stiffness of the
hollow section column. The Extended Hollobolt as an innovative blind
bolt adopted in this study furthermore employs the beneficial effect of
anchorage provided by concrete infill thereby improving the tensile
strength of the connection assembly in contrast with the Hollobolt
counterpart.
• The monotonic loading test showed that this innovative blind bolted
endplate connection to CFT column can be used as a type of rigid or
semi-rigid beam to column connection. The ultimate limit state study
showed that tested connections were neither full strength nor flexible, and
furthermore, the stiffness of this innovative blind bolted endplate beam to
column connections was greatly affected by tube thickness and bolt pitch.
• An adequate design and detailing of bolted endplate connections could
achieve good energy dissipation without substantial loss of strength or
stiffness. Endplate in bending as a ductile component can be employed to
achieve energy dissipative bolted endplate connection.
Despite the understandings generated from recent investigations reviewed
above, the knowledge gap is still significant for the understanding of the cyclic
behaviour of this innovative blind bolted endplate connection to CFT column
with unavailable data existing on the mechanical characteristics and hysteretic
moment-rotation relationship of the connections. There are still further
research work remain to be done in this field. Some of these works are
introduced below as the main contributions of the present study. The rest of
59
Chapter 2:Literature review
work will be outlined in the last chapter as suggestions for future work.
• Although the concrete anchorage effect of a similar blind bolt (i.e., Ajax
One-side) with extension has been studied under several loading and
unloading cycles (Goldsworthy & Gardner, 2006; Yao et al 2008), it is .
not sufficient to import reported observations for the connection with this
innovative blind bolt (Extended Hollobolt). This is because the extension
welded to Ajax One-side often posed undesired weld fracture under cyclic
loading as reported in the literature. In contrast, it appears this weakness
may be effectively avoided for this innovative blind bolt studied herein
which is featured by one pieced bolt shank as the extension part. The
failure modes of the connection with this innovative blind bolt are to be
understood through cyclic loading tests.
• From theoretical point of view, the CFT column face as a plate element in
flexible deformation represents a ductile component in the study of the
blind bolted, endplate connection to CFT column. Wang et al (2009)
reported an investigation of similar connection system using the,
Hollobolt, however, the cold-formed steel tubes produced early cracks at
the tube comer which limited the flexibility of CFT column face. The
contribution of the CFT column face with hot-rolled tube section and
associated interaction with the concrete infill to the ductile performance
of this innovative blind bolted endplate connection is to be investigated.
• The CFT column and the blind bolt have combined effects on the
connection behaviour. The understanding of their roles in the cyclic
characteristics of this innovative blind bolted end plate connection to CFT,
60

Chapter 2:Literature review
column is to be further accounted for.
• The failure modes of this innovative blind bolted endplate connection will
be clarified through gaining the evidences from the stress & strain
distributions and related observations. As a supplement for experimental
instrumentations, finite element models are to be developed and related
. parametric study is to be conducted for this understanding.
• The hysteretic moment-rotation curves are often used for representing the
cyclic response of beam-to-column joints with the aid of mathematical
models. Allowing for different degrees of complexity of the connection
system, the hysteretic models are to be proposed in this study for the
moment-rotation relationship of this innovative blind bolted endplate
connection.
61
Chapter 3: Experimental study-test preparation
CHAPTER3
EXPERIMENTAL STUDY-TEST PREPARATION
3.1 Introduction,
The need for further experimental study on the cyclic behaviour of this
innovative blind bolted endplate connection to CFT column has been
identified from background literature. To achieve the research objectives
introduced in Chapter I, an experimental program consisting of six full-scale
blind bolted connection tests was conducted. The purpose of this test
programme was to investigate the moment behaviour of multiple bolt-rowed
beam to column connection under quasi-static cyclic loading.
This chapter will be presented as follows. First, the test program is outlined
including the connection details, material properties, specimen details, test set-
up, instrumentation and cyclic loading procedure. Second, the joint rotation
measurement method is presented based on the instrumentation adopted in the
experiment. As the yield displacement determination approaches vary with the
test programs and connection configurations, it was decided to clarify this
issue through a brief discussion and then present an appropriate method for
this study. The content in this chapter will join the following chapter and
constitutes the overall description of experimental study in this research'
programme ..
62
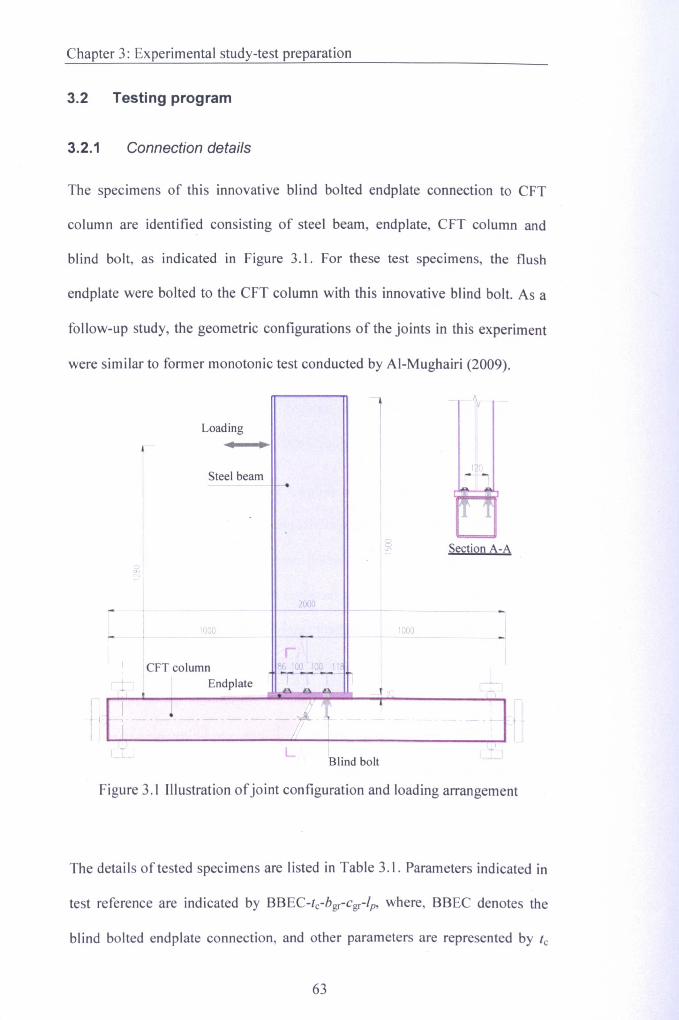
Chapter 3: Experimental study-test preparation
3.2 Testing program
3.2.1 Connection details
The specimens of this innovative blind bolted endplate connection to CFT
column are identified consisting of steel beam, endplate, CFT column and
blind bolt, as indicated in Figure 3.1. For these test specimens, the flush
endplate were bolted to the CFT column with this innovative blind bolt. As a
follow-up study, the geometric configurations of the joints in this experiment
were similar to former monotonic test conducted by Al-Mughairi (2009).
Loading
Steel beam
1000
CFTcolumnEndplate
r T0", 10 I 'V\ ' I,-r ~-r-
•
21)110
_jv-
170- ..,
~ Section A-A
r 1000
...,
1+1
,-)
tI r
L~lind bolt
1i..;~L
Figure 3.1 Illustration of joint configuration and loading arrangement
The details of tested specimens are listed in Table 3.1. Parameters indicated in
test reference are indicated by BBEC-te-bgr-cgr-Ip, where, BBEC denotes the
blind bolted endplate connection, and other parameters are represented by Ie
63
Chapter 3: Experimental study-test preparation
(tube wall thickness), bgr (blind bolt grade), egr (Concrete grade), and lp
(Loading procedure). For instance, Test 4 in Table 3.1, which is referred as
BBEC-5-8.8-50-LII, stands for a tested specimen with CFT column of
expected concrete strength of 50N/mm2 and 5 mm thick tube connected using
8.8 Grade blind bolt and tested using cyclic loading procedure type II. The
description of the material and loading procedure will be given in Section
3.2.2 and 3.2.6 respectively.
Steel beam with UB 356x171x67 section and 25mm thick endplate were used
for all test joints. This configuration was determined to provide sufficient
capacity and stiffness of the beam & endplate and eliminate their failure and
significant likelihood to influence the connection behaviour. That is
eliminating the failure modes of steel beam and endplate in bending, fracture
of beam to endplate welds, local beam flange and web in buckling. As .
mentioned in Chapter 1, it was intended to investigate the cyclic behaviour of
the connection in the case of strong beam & endplate with under-strength
blind bolt & CFT column. Consequently, the configurations of SHS column
section and blind bolt were varied as indicated in Table 3.1. The beam flange
and web were connected with fillet welds. Through careful calculation
including the safety factor, the size of fillet legs was taken as 12mm along the
beam flange and web (AI-Mughairi, 2009). Given the use for cyclic loading,
the surfaces of the welds were patiently ground smooth to eliminate possible
minute discontinuities which may cause local stress concentration.
64
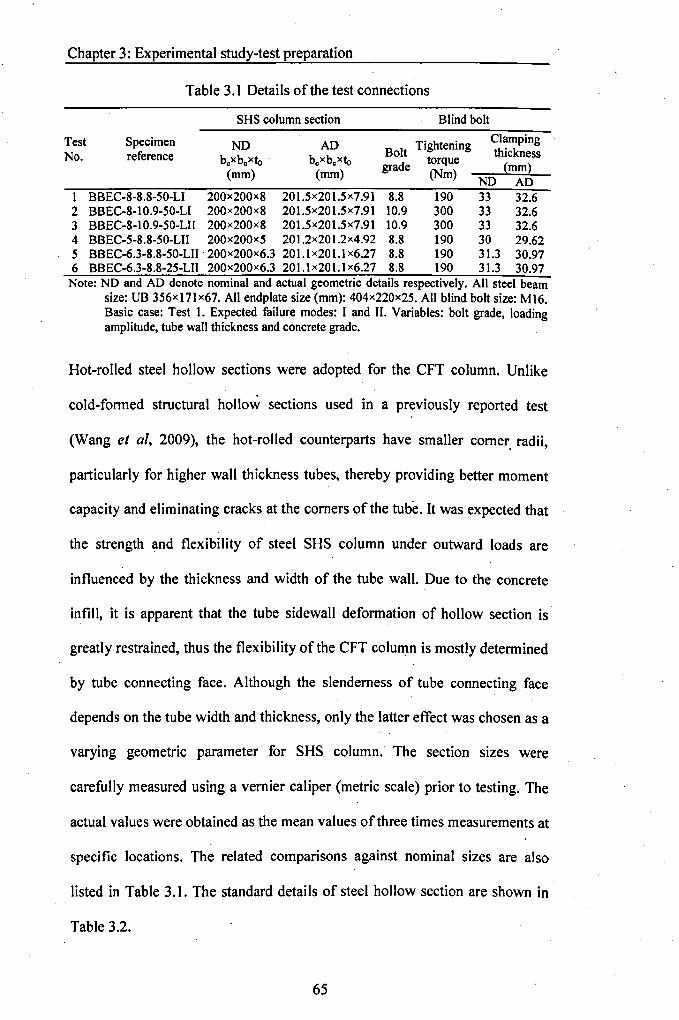
Chapter 3: Experimental study-test preparation
Table 3.1 Details of the test connections
SHS column section Blind bolt
Test Specimen ND AD Tightening ClampingNo. reference b.xb.xto . b.xb.xto Bolt torque thickness
(mm) (mm) grade (Nm) ~mm2ND AD
1 BBEC-S-S.S-50-LI 200x200xS 201.5x201.5x7.91 S.S 190 33 32.62 BBEC-S-IO.9-50-LI 200x200xS 201.5x201.5x7.91 10.9 300 33 32.63 BBEC-S-I0.9-50-LII 200x200xS 201.5x201.5x7.91 10.9 300 33 32.64 BBEC-5-8.8-50-LII 200x200x5 201.2x201.2x4.92 8.8 190 30 29.625 BBEC-6.3-S.S-50-LII 200x200x6.3 201.1 x20 1.1x6.27 8.8 190 31.3 30.976 BBEC-6.3-8.8-25-LII 200x200x6.3 201.1x201.1 x6.27 8.S 190 31.3 30.97Note: ND and AD denote nominal and actual geometric details respectively. All steel beam
size: UB 356x17Ix67. All endplate size (mm): 404x220x25. All blind bolt size: MI6.Basic case: Test 1. Expected failure modes: I and II. Variables: bolt grade, loadingamplitude, tube wall thickness and concrete grade.
Hot-rolled steel hollow sections were adopted for the CFT column. Unlike
cold-formed structural hollow sections used in a previously reported test
(Wang et ai, 2009), the hot-rolled counterparts have smaller comer. radii,
particularly for higher wall thickness tubes, thereby providing better moment
capacity and eliminating cracks at the comers of the tube. It was expected that
the strength and flexibility of steel SHS column under outward loads are
influenced by the thickness and width of the tube wall. Due to the concrete
infill, it is apparent that the tube sidewall deformation of hollow section is
greatly restrained, thus the flexibility of the CFT column is mostly determined
by tube connecting face. Although the slenderness of tube connecting face
depends on the tube width and thickness, only the latter effect was chosen as a
varying geometric parameter for SHS column. The section sizes were
carefully measured using a vernier caliper (metric scale) prior to testing. The
actual values were obtained as the mean values of three times measurements at
specific locations. The related comparisons against nominal sizes are also
listed in Table 3.1. The standard details of steel hollow section are shown in
Table 3.2.
65
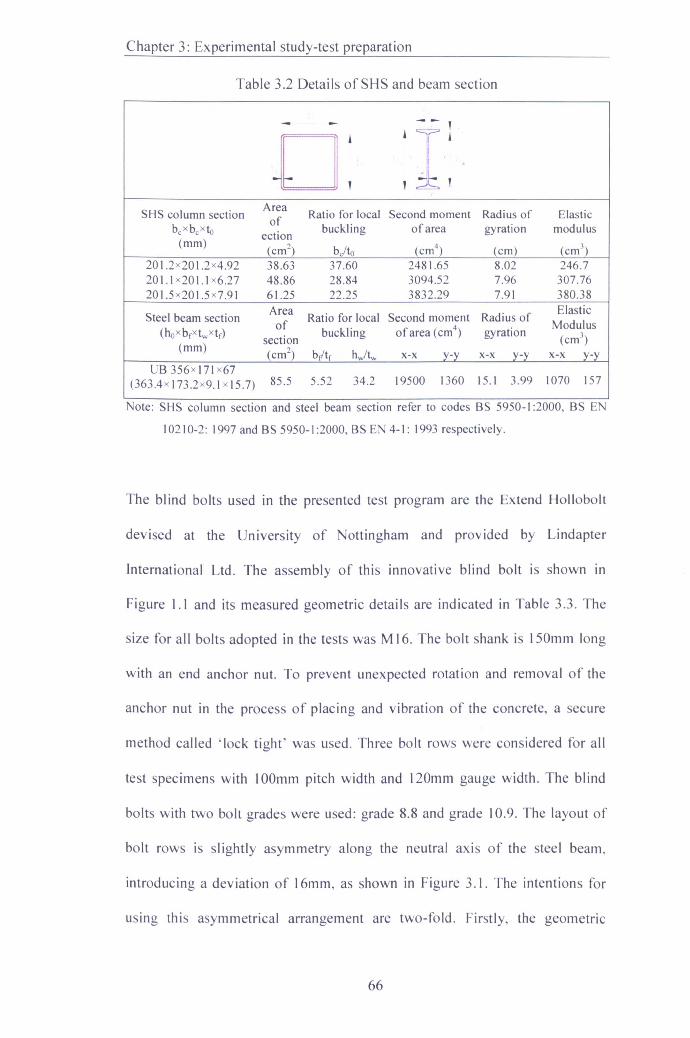
Chapter 3: Experimental study-test preparation
Table 3.2 Details of SHS and beam section
- -- - -- ,
0 , ,I ,, ,, , ,
SHS column sectionArea
Ratio for local Second moment Radius of Elasticof
bexbexto ectionbuckling of area gyration modulus
(mm)(crrr') be/to (cm") (cm) (crrr')
20 1.2x20 1.2x4.92 38.63 37.60 2481.65 8.02 246.7201.1 x201.1 x6.27 48.86 28.84 3094.52 7.96 307.7620 1.5x20 1.5x7.91 61.25 22.25 3832.29 7.91 380.38
Steel beam sectionArea
Ratio for local Second moment Radius ofElastic
(hox brxtwxtr)of
buckling of area (ern") gyrationModulus
section (ern")(mm)
(ern") br'tr hJlw x-x y-y x-x y-y x-x y-yUS 356xl71x67
(363.4x 173.2x9.1 -rs. 7) 85.5 5.52 34.2 19500 1360 15.1 3.99 1070 157
Note: SHS column section and steel beam section refer to codes SS 5950-1 :2000, SS EN
10210-2: 1997 and SS 5950-1:2000, SS EN 4-1: 1993 respectively.
The blind bolts used in the presented test program are the Extend Hollobolt
devised at the University of Nottingham and provided by Lindapter
International Ltd. The assembly of this innovative blind bolt is shown in
Figure 1.1 and its measured geometric details are indicated in Table 3.3. The
size for all bolts adopted in the tests was M 16. The bolt shank is )SOmm long
with an end anchor nut. To prevent unexpected rotation and removal of the
anchor nut in the process of placing and vibration of the concrete, a secure
method called 'lock tight' was used. Three bolt rows were considered for all
test specimens with lOtlmm pitch width and 120mm gauge width. The blind
bolts with two bolt grades were used: grade 8.8 and grade 10.9. The layout of
bolt rows is slightly asymmetry along the neutral axis of the steel beam,
introducing a deviation of 16mm, as shown in Figure 3.1. The intentions for
using this asymmetrical arrangement are two-fold. Firstly, the geometric
66
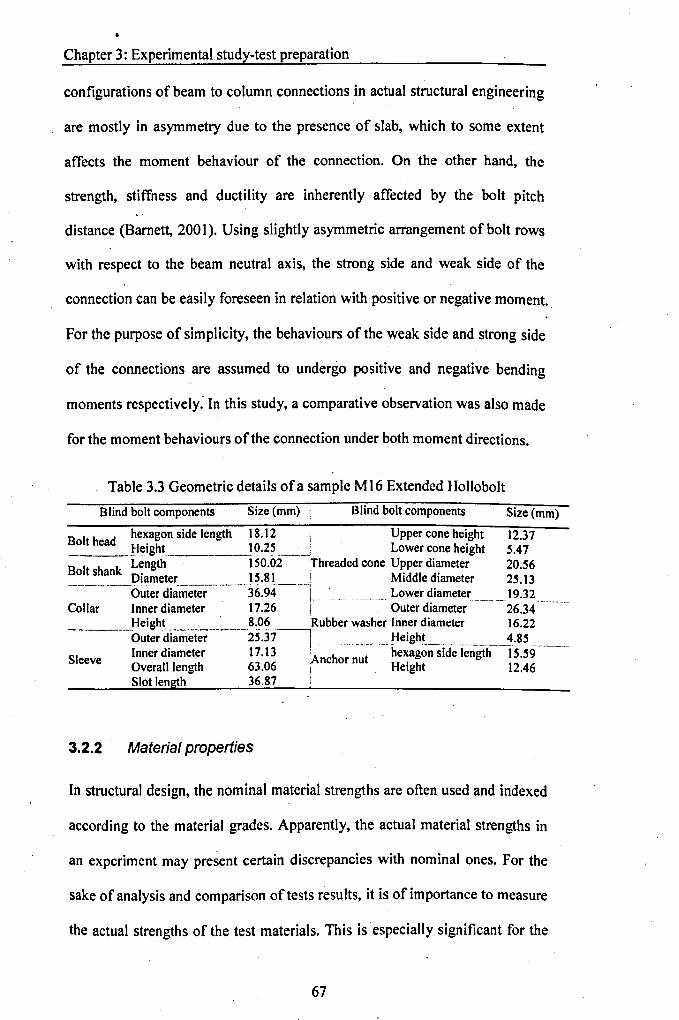
Chapter 3: Experimental study-test preparation
configurations of beam to column connections in actual structural engineering
are mostly in asymmetry due to the presence of slab, which to some extent
affects the moment behaviour of the connection. On the other hand, the
strength, stiffness and ductility are inherently affected by the bolt pitch
distance (Barnett, 2001). Using slightly asymmetric arrangement of bolt rows
with respect to the beam neutral axis, the strong side and weak side of the
connection can be easily foreseen in relation with positive or negative moment.
For the purpose of simplicity, the behaviours of the weak side and strong side
of the connections are assumed to undergo positive and negative bending
moments respectively: In this study, a comparative observation was also made
for the moment behaviours of the connection under both moment directions.
Table 3.3 Geometric details of a sample M16 Extended Hollobolt
Blind bolt components Size (mm) I Blind bolt components Size (mm)
B It h d hexagon side length 18.12 I Upper cone height 12.37. 0 ea .H~ight. !0.25__j Lower cone height 5.47B It h k Length 150.02 . Threaded cone Upper diameter 20.56o s an Diameter 15.81. Middle diameter 25.13
--'--'--Outer diame~--j6.94-1. .__ __..__. Lower diameter 19.32Collar Inner diameter 17.26 i Outer diameter 26.34__. _!Ii:ight. 8.06 Rubber washer Inner diameter 16.22
Outer diameter 25.37--l . Height 4.85 _Inner diameter 17.13 'A' h t hexagon side length 15.59nc or nu .Overall length 63.06 I HeIght 12.46Slot length 36.87 i
Sleeve
3.2.2 Material properties
In structural design, the nominal material strengths are often used and indexed
according to the material grades. Apparently, the actual material strengths in
an experiment may present certain discrepancies with nominal ones. For the
sake of analysis and comparison oftests results, it is of importance to measure
the actual strengths of the test materials. This is especially significant for the
67
Chapter 3: Experimental study-test preparation
connection featured by the tensile behaviour. For this purpose, the material
properties of the steel beam, SHS column and bolt shank were all tested
according to the relevant standards such as BS 5950-1 (2000), BS EN 10210-2
(1997) and BS 4-1 (1993). As several structural components in the present
tests were shared from the same batch of the materials used for former
monotonic tests, the material properties of these components were referred
from previous reports (Al-Mughairi, 2009; Fang, 2010). The test material
properties described herein only include Young's modulus and strength values.
Related stress-strain relationships will be presented in Chapter 6 in contrast
with those adopted for finite element models.
To determine' the fundamental properties of the steel of SHS columns, a series
of tensile coupon tests were carried out. The tensile coupons were designed
according to EN 10002-1:2001, as indicated in Table 3.4. Then, the coupon
pieces were cut from the same SHS tube used for actual connection tests and
shaped with flats at the ends. The 8mm thick hollow section tubes used in the
connection tests were in the same batch used for the monotonic tests carried
out by AI-Mughairi (2009). The tensile coupon tests were conducted using
ZwickIRoell 1484 computer controlled universal test machine. The overall
length of the coupon pieces was loaded including the parallel length portion
and the transition between the gripped a~d parallel portions. The loading was
controlled with the rate of 20mm/min, and continued until the tensile failure
happened. The test were monitored and data recorded using ZwickIRoell PC
version 5.50a software, which has basic data processing features in exporting
Young's modulus, maximum and ultimate tensile forces. The stress producing
0.2% residual strain was used to define the material yield strength.
68
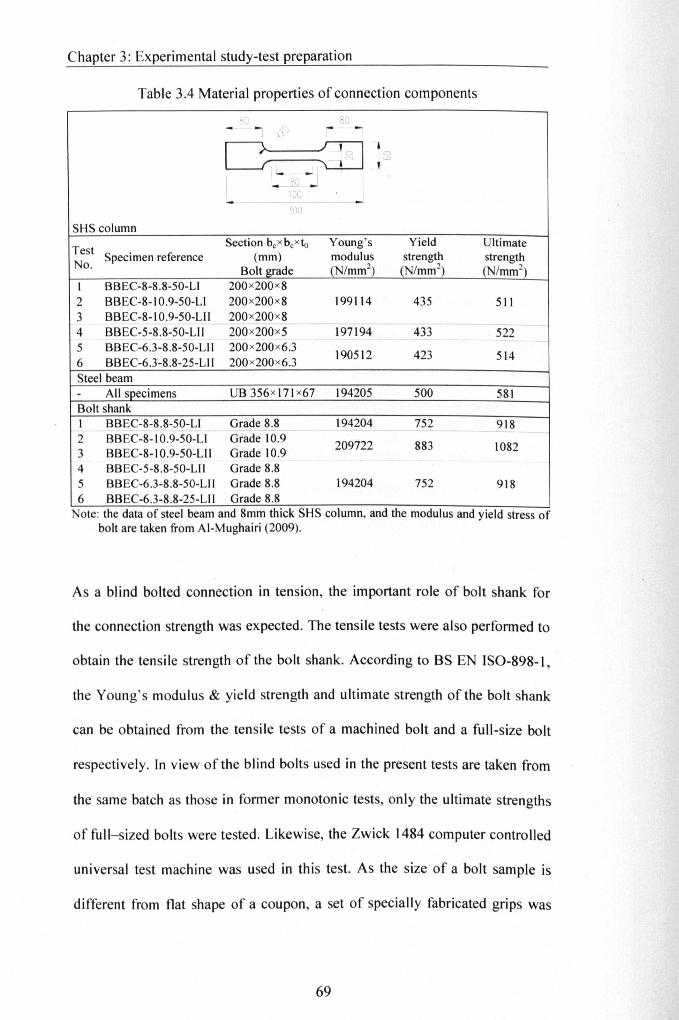
Chapter 3: Experimental study-test preparation
Table 3.4 Material properties of connection components
80 80r-1 ?-.{J ~I
~lo cc
c-~J ' -L _:0 __ - J300
SHS column
TestSection bcxbcxto Young's Yield Ultimate
Specimen reference (mm) modulus strength strengthNo. Bolt grade (Nzmnr') (Nzmrrr') (N/mm2)1 BBEC-8-8.8-S0-L1 200x200x82 BBEC-8-IO.9-S0-L1 200x200x8 199114 435 5113 BBEC-8-10.9-50-L11 200x200x8 - -4 BBEC-5-8.8-50-L11 200x200x5 197194 433 522S BBEC-6.3-8.8-S0-L11 200x200x6.3
190512 423 5146 BBEC-6.3-8.8-2S-L11 200x200x6.3Steel beam- All specimens UB 356x171x67 194205 SOO S81Bolt shank1 BBEC-8-8.8-S0-L1 Grade 8.8 194204 7S2 9182 BBEC-8-10.9-S0-L1 Grade 10.9 209722 883 10823 BBEC-8-1 0.9-50-L1 [ Grade [0.94 BBEC-S-8.8-S0-L11 Grade 8.8S BBEC-6.3-8.8-S0-L11 Grade 8.8 194204 7S2 9186 BBEC-6.3-8.8-2S-L1 [ Grade 8.8
Note: the data of steel beam and 8mm thick SHS column, and the modulus and Yield stress ofbolt are taken from AI-Mughairi (2009).
As a blind bolted connection in tension, the important role of bolt shank for
the connection strength was expected. The tensile tests were also performed to
obtain the tensi Ie strength of the bolt shank. According to BS EN ISO-898-1,
the Young's modulus & yield strength and ultimate strength of the bolt shank
can be obtained from the tensile tests of a machined bolt and a full-size bolt
respectively. In view of the blind bolts used in the present tests are taken from
the same batch as those in former monotonic tests, only the ultimate strengths
of full-sized bolts were tested. Likewise, the Zwick 1484 computer controlled
universal test machine was used in this test. As the size of a bolt sample is
different from flat shape of a coupon, a set of specially fabricated grips was
69
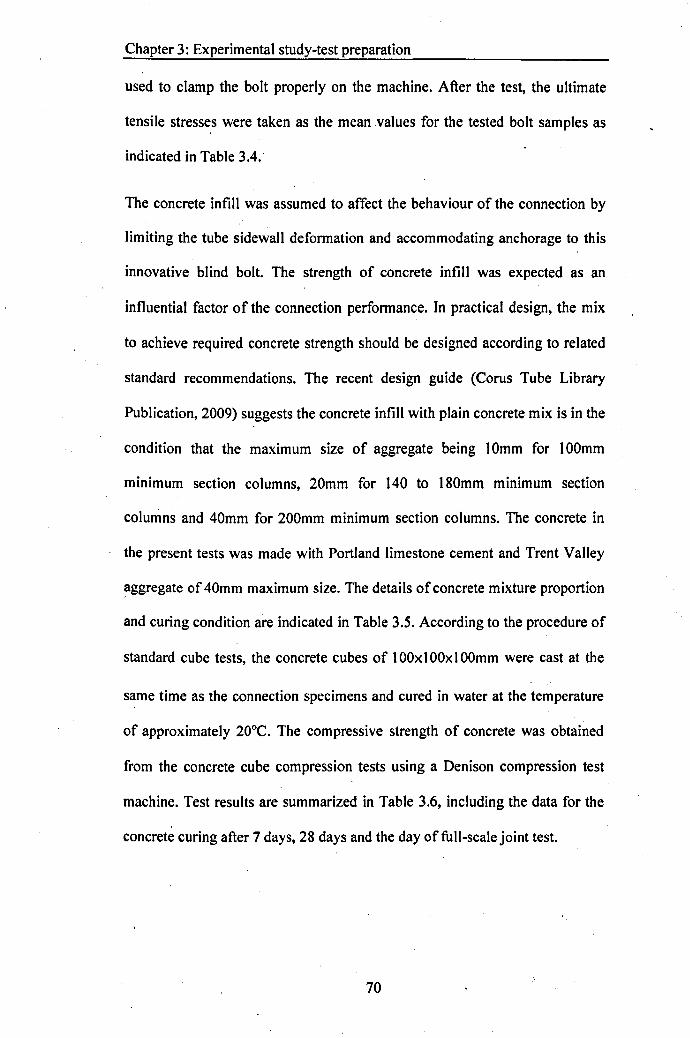
Chapter 3: Experimental study-test preparation
used to clamp the bolt properly on the machine. After the test, the ultimate
tensile stresses were taken as the mean values for the tested bolt samples as
indicated in Table 3.4.
The concrete infill was assumed to affect the behaviour of the connection by
limiting the tube sidewall deformation and accommodating anchorage to this
innovative blind bolt. The strength of concrete infill was expected as an
influential factor of the connection performance. In practical design, the mix
to achieve required concrete strength should be designed according to related
standard recommendations. The recent design guide (Corus Tube Library
Publication, 2009) suggests the concrete infill with plain concrete mix is in the
condition that the maximum size of aggregate being 10mm for 100mm
minimum section columns, 20mm for 140 to 180mm minimum section
columns and 40mm for 200mm minimum section columns. The concrete in
the present tests was made with Portland limestone cement and Trent Valley
aggregate of 40mm maximum size. The details of concrete mixture proportion
and curing condition are indicated in Table 3.5. According to the procedure of
standard cube tests, the concrete cubes of 1OOx 1OOx IOOmmwere cast at the
same time as the connection specimens and cured in water at the temperature
of approximately 20°C. The compressive strength of concrete was obtained
from the concrete cube compression tests using a Denison compression test
machine. Test results are summarized in Table 3.6, including the data for the
concrete curing after 7 days, 28 days and the day of full-scale joint test.
70
Chapter 3: Experimental study-test preparation
Table 3.5 Concrete mixture proportions and curing condition
Mix ratioConcrete mixture proportions
Material DescriptionsTest No.1 Test No.6to No.5
CementCoarse aggregateFine aggregateWater
12.351.650.43
13.633.330.74
Portland limestone cementTrent Valley aggregate maximum 40mm2mm river sandTap water
Curing condition:Cured with room temperature 20°C; cubic compressive strength at 28 days.
Table 3.6 Concrete infill compressive strengths (N/mm2)
Test No. Specimen reference2S days
123456
BBEC-S-S.S-50-LJBBEC-S-IO.9-50-LIBBEC-S-IO.9-50-LIIBBEC-5-S.S-50-LIIBBEC-6.3-8.S-50-LIIBBEC-6.3-8.S-25-LII
Compressive strengths (N/mmz)7 days Test days47.0343.1546.6045.7349.3017.77
53.2047.4051.5549.1352.7520.77
53.5052.3554.7356.3356.5026.23
3.2.3 Fabrication of test specimens
The test specimens were fabricated starting from steel components assembling
to concrete casting. As the welding between the steel beam and endplate was
performed in the workshop, the assembly work here refers to the bolt
tightening in the laboratory. The beam, endplate was lifted using crane and
aligned above the bolt holes located tube connecting face to ensure the blind
bolts placed through the bolt holes of endplate and SHS column. Thereafter,
the blind bolts were initially tightened with a spanner and then at later stage
with a torque wrench in accordance to the required torque values given in
Table 3.1. Given the contact surfaces between the endplate and the SHS
column face may not be exactly flat, the blind bolts were tightened using side
interval orders. As shown in Figure 3.2, the top left bolt above the beam web
was tightened first (label 1) and then the bottom middle below the beam web
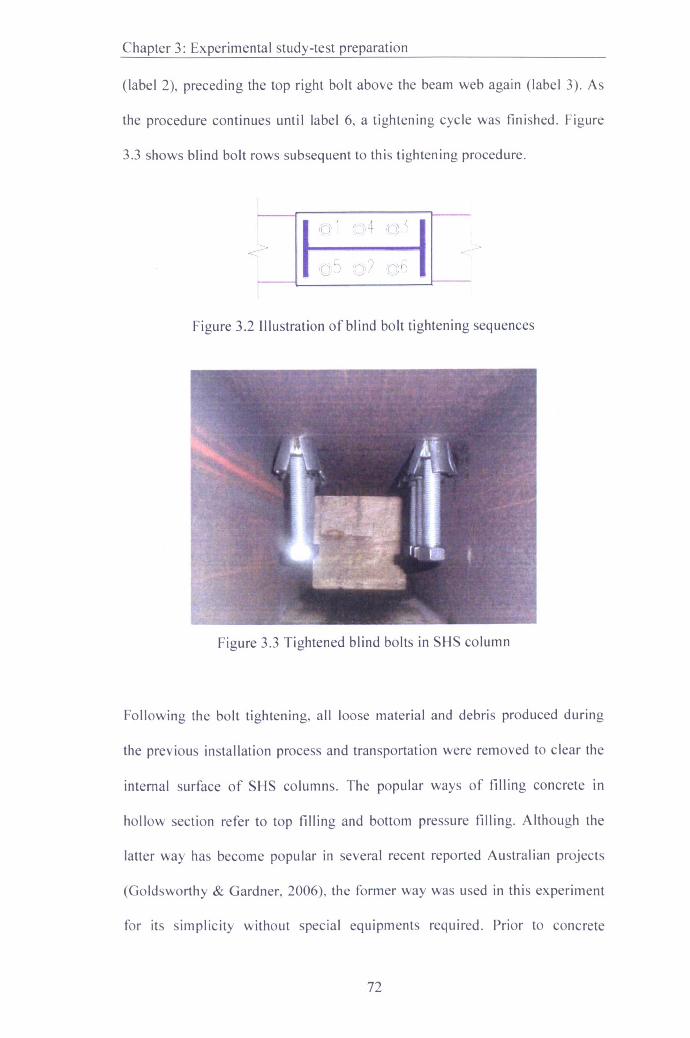
Chapter 3: Experimental study-test preparation
(label 2), preceding the top right bolt above the beam web again (label 3). As
the procedure continues until label 6, a tightening cycle was finished. Figure
3.3 shows blind bolt rows subsequent to this tightening procedure.
I ~1 C04 'D) ~II
~re}] 0'1 g~
Figure 3.2 Illustration of blind bolt tightening sequences
Figure 3.3 Tightened blind bolts in SHS column
Following the bolt tightening, all loose material and debris produced during
the previous installation process and transportation were removed to clear the
internal surface of SHS columns. The popular ways of filling concrete in
hollow section refer to top filling and bottom pressure filling. Although the
latter way has become popular in several recent reported Australian projects
(Goldsworthy & Gardner, 2006), the former way was used in this experiment
for its simplicity without special equipments required. Prior to concrete
72
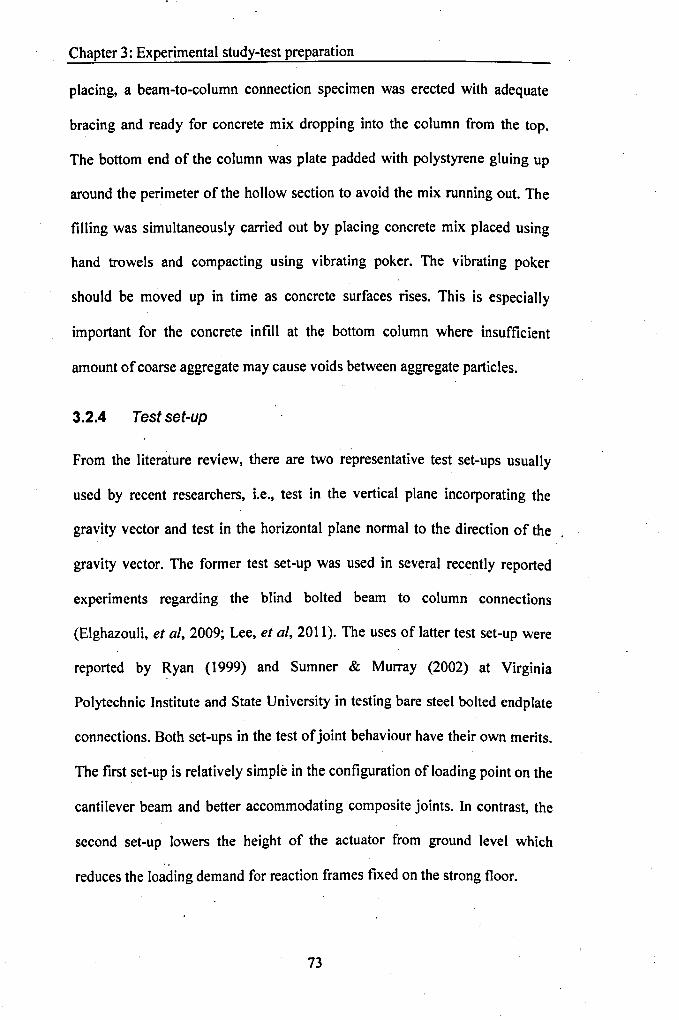
Chapter 3: Experimental study-test preparation
placing, a beam-to-column connection specimen was erected with adequate
bracing and ready for concrete mix dropping into the column from the top.
The bottom end of the column was plate padded with polystyrene gluing up
around the perimeter of the hollow section to avoid the mix running out. The
filling was simultaneously carried out by placing concrete mix placed using
hand trowels and compacting using vibrating poker. The vibrating poker
should be moved up in time as concrete surfaces rises. This is especially
important for the concrete infill at the bottom column where insufficient
amount of coarse aggregate may cause voids between aggregate particles.
3.2.4 Test set-up
From the literature review, there are two representative test set-ups usually
used by recent researchers, i.e., test in the vertical plane incorporating the
gravity vector and test in the horizontal plane normal to the direction of the
gravity vector. The former test set-up was used in several recently reported
experiments regarding the blind bolted beam to column connections
(Elghazouli, et al, 2009; Lee, et ai, 2011). The uses of latter test set-up were
reported by Ryan (1999) and Sumner & Murray (2002) at Virginia
Polytechnic Institute and State University in testing bare steel bolted endplate
connections. Both set-ups in the test of joint behaviour have their own merits.
The first set-up is relatively simple in the configuration of loading point on the
cantilever beam and better accommodating composite joints. In contrast, the
second set-up lowers the height of the actuator from ground level which
reduces the loading demand for reaction frames fixed on the strong floor.
73
Chapter 3: Experimental study-test preparation
To make good use of available apparatus in the department's laboratory, the
beam to column connection specimens in the present study were tested in the
horizontal plane normal to the direction of the gravity vector. A representative
test-up in the present experimental study is shown in Figure 3.4. The main
point in the design of test set-up was the intention of minimizing the stress and
deformation in the test frame members and connections. Another
consideration in the test apparatus was the floor anchoring pattern in the
laboratory, in which the anchor points distributed in square grid with a centre-
to-centre unit distance of 460 mm. The M24 anchor bolts were available at
each anchor point. The layout of Lateral & end blocks (g), reaction buttress (c)
and frame columns (i) are pre-designed with sufficient precision to
accommodate the grid of anchor points.
74
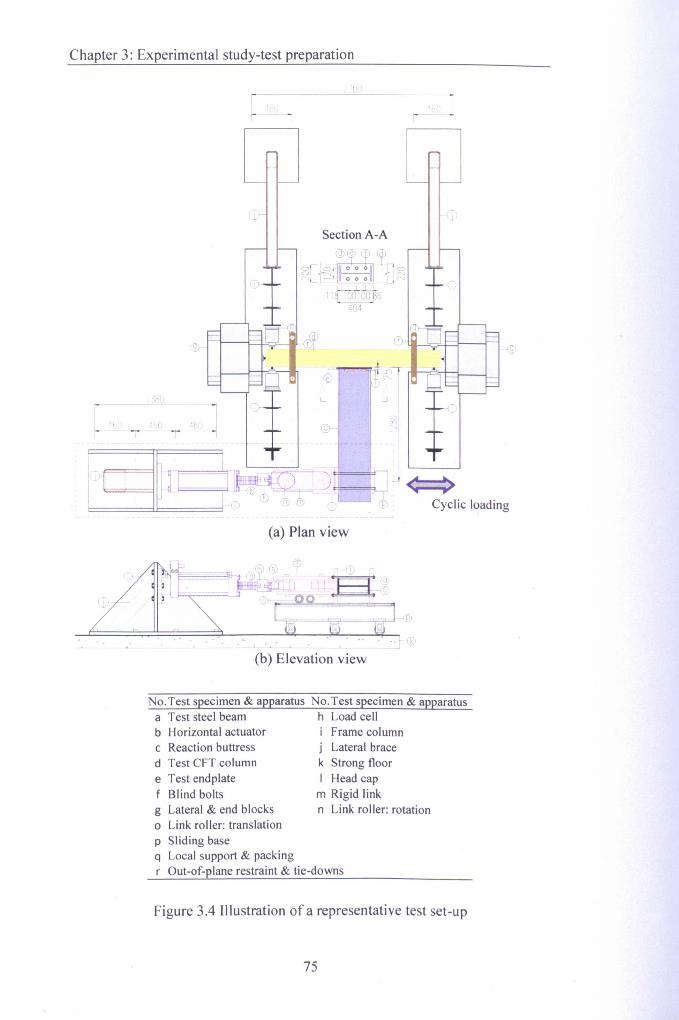
Chapter 3: Experimental study-test preparation
'I' '
1:,'11- J~lll==1 ~~~-)9F===lF~~< >. ::j~ ~<r) <1"1,& <1 £: ' Cyclic loading,=====::::LI::=====' _ J
Section A-A
lI
(a) Plan view
I,
..... ~~ ~ _----.J
(b) Elevation viewI"•.
No. Test specimen & apparatus No. Test specimen & apparatusa Test steel beam h Load cellb Horizontal actuator Frame columnc Reaction buttress j Lateral braced Test eFT column k Strong floore Test endplate I Head cap
Blind bolts m Rigid linkg Lateral & end blocks n Link roller: rotationo Link roller: translationp Sliding baseq Local support & packingr Out-of-plane restraint & tie-downs
Figure 3.4 Illustration of a representative test set-up
75
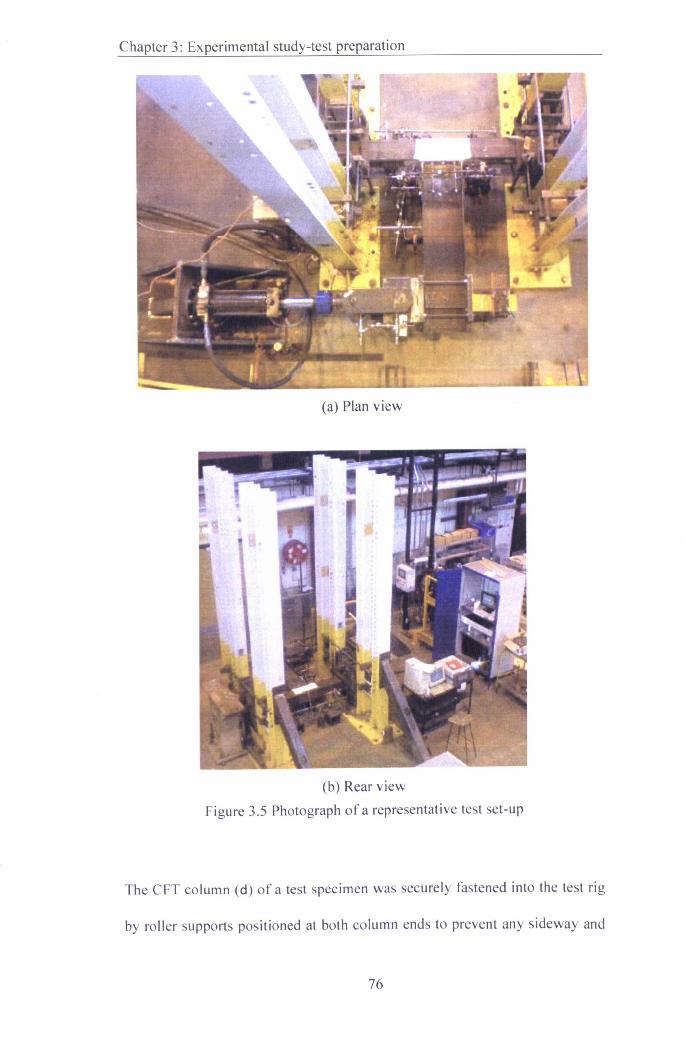
Chapter 3: Experimental study-test preparation
(a) Plan view
(b) Rear view
Figure 3.5 Photograph of a representative test set-up
The CFT column (d) of a test specimen was securely fastened into the test rig
by roller supports positioned at both column ends to prevent any sideway and
76
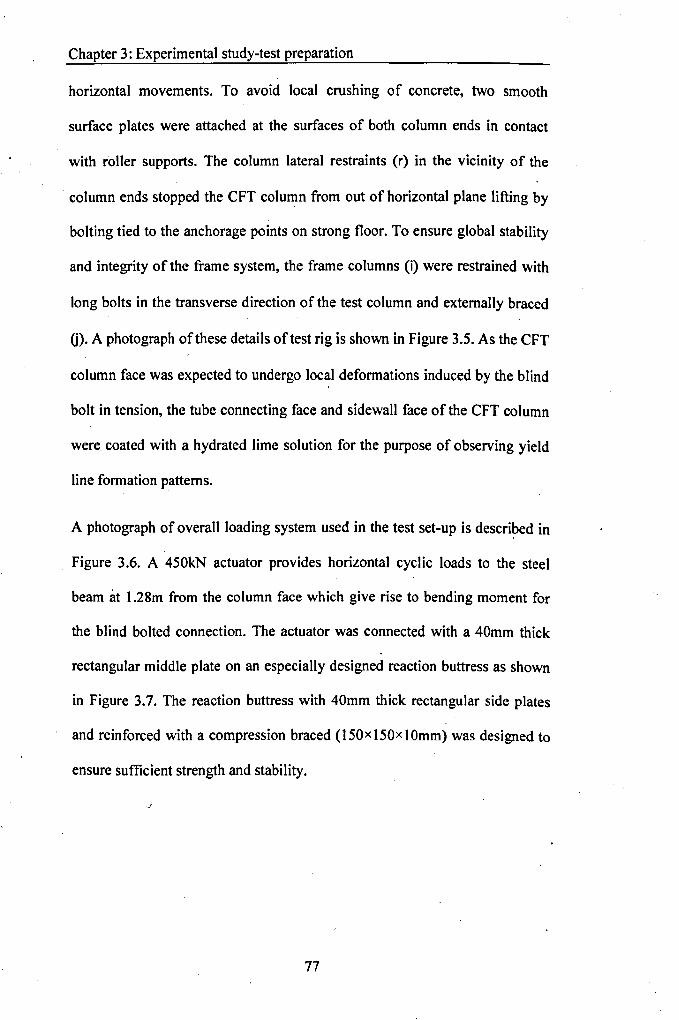
Chapter 3: Experimental study-test preparation
horizontal movements. To avoid local crushing of concrete, two smooth
surface plates were attached at the surfaces of both column ends in contact
with roller supports. The column lateral restraints (r) in the vicinity of the
column ends stopped the CFT column from out of horizontal plane lifting by
bolting tied to the anchorage points on strong floor. To ensure global stability
and integrity of the frame system, the frame columns (i) were restrained with
long bolts in the transverse direction of the test column and externally braced
0). A photograph of these details oftest rig is shown in Figure 3.5. As the CFT
column face was expected to undergo local deformations induced by the blind
bolt in tension, the tube connecting face and sidewall face of the CFT column
were coated with a hydrated lime solution for the purpose of observing yield
line formation patterns.
A photograph of overall loading system used in the test set-up is described in
Figure 3.6. A 450kN actuator provides horizontal cyclic loads to the steel
beam at I.28m from the column face which give rise to bending moment for
the blind bolted connection. The actuator was connected with a 40mm thick
rectangular middle plate on an especially designed reaction buttress as shown
in Figure 3.7. The reaction buttress with 40mm thick rectangular side plates
and reinforced with a compression braced (l50x150x10mm) was designed to
ensure sufficient strength and stability.
77
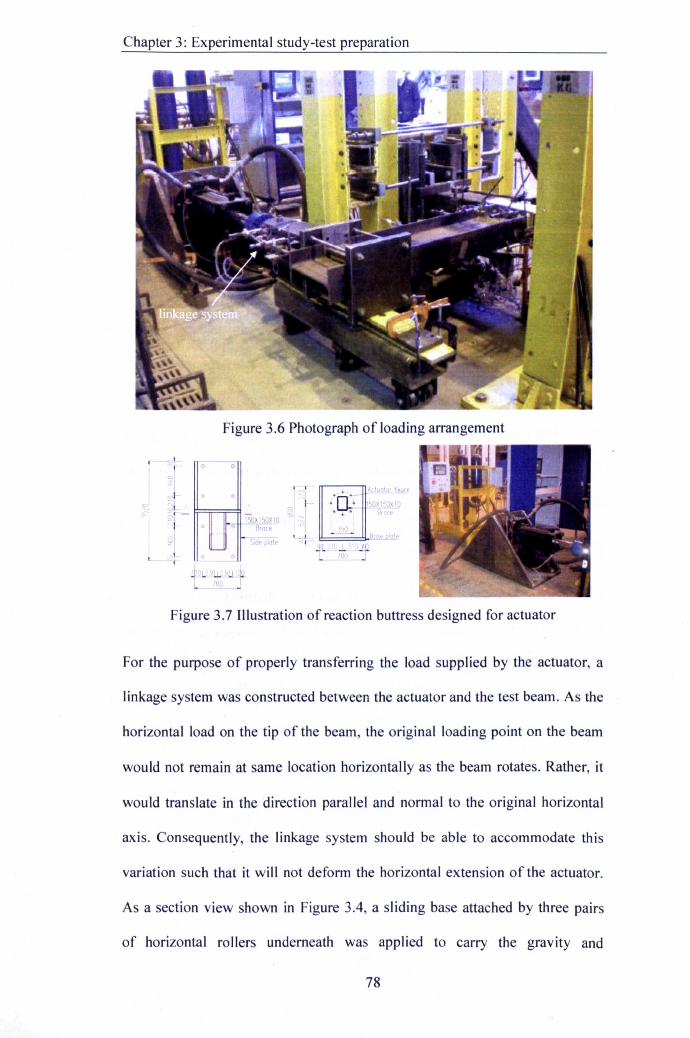
Chapter 3: Experimental study-test preparation
Figure 3.6 Photograph of loading arrangement
A luolll~,
c - '~~XIOc; Bract>" -;.;
Bose _mot,:.
"-t"'\ If, ~a
Figure 3.7 Illustration of reaction buttress designed for actuator
For the purpose of properly transferring the load supplied by the actuator, a
linkage system was constructed between the actuator and the test beam. As the
horizontal load on the tip of the beam, the original loading point on the beam
would not remain at same location horizontally as the beam rotates. Rather, it
would translate in the direction parallel and normal to the original horizontal
axis. Consequently, the linkage system should be able to accommodate this
variation such that it will not deform the horizontal extension of the actuator.
As a section view shown in Figure 3.4, a sliding base attached by three pairs
of horizontal rollers underneath was applied to carry the gravity and
78
Chapter 3: Experimental study-test preparation
accommodate the global movement of the test beam and the linkage system.
To ensure the test beam moving back and forth, a head cap supported by the
sliding base was used to clamp the free end of the beam. A rose joint (i.e., rod
end bearing or heim joint) at the end of the extension of the actuator was
connected with the head cap (I) using a couple of rigid links (m). To avoid any
load produced by the gravity of the rigid links, two small horizontal rollers (0)
were also considered together with the rigid link couple for the purpose of
carrying the local translation and rotation of the test beam and the linkage
,system respectively. Additionally, the lubrication was used for compressed
components within this linkage system to eliminate friction between
constituent parts. Whist the load is transferred to the test beam, two plates
were tightly padded between the beam flanges in contact with the head cap as
stiffeners.
3.2.5 lnstrumentetion :
In order to obtain the load, displacement, and strain distributions that feature
the response of the connection, a range of instrumentation was used to monitor
the response of the specimens during the test procedure. A representative
layout of the instrumentation adopted in the test is shown in Figure 3.8,
including strain gauges, potentiometers and LVDTs for steel beam, bolted
endplate, and steel tube. The details of instrumentation will be described
below.
79
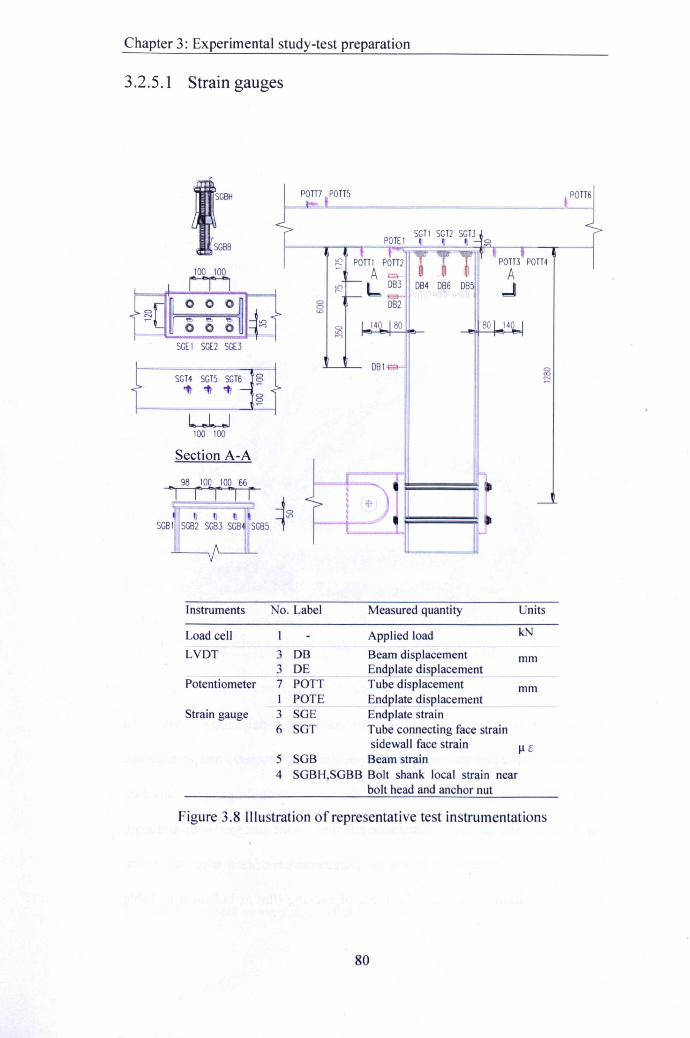
Chapter 3: Experimental study-test preparation
3.2.5.1 Strain gauges
ISGBH
1f,GBS
SGEI SGE2 SGE3
SGT4 SGT5 SGT6"t- "t- "t- o
S'
LUlOO lOO
Section A-A
98 icc ico 66I I I
SCS5 4:71t t tSCSI. SCS2 SGB3 SCB'
'-
pom POTTS
:t2
.nr-
00<0
0.n,...,
Instruments No. Label Measured quantity Units
Load cell Applied load kN
LVDT 3 DB Beam displacement mm3 DE Endplate displacement
Potentiometer 7 POTT Tube displacement mmPOTE Endplate displacement
Strain gauge 3 SGE Endplate strain6 SGT Tube connecting face strain
sidewall face strain ~E5 SGB Beam strain4 SGBH,SGBB Bolt shank local strain near
bolt head and anchor nut
Figure 3.8 Illustration of representative test instrumentations
80
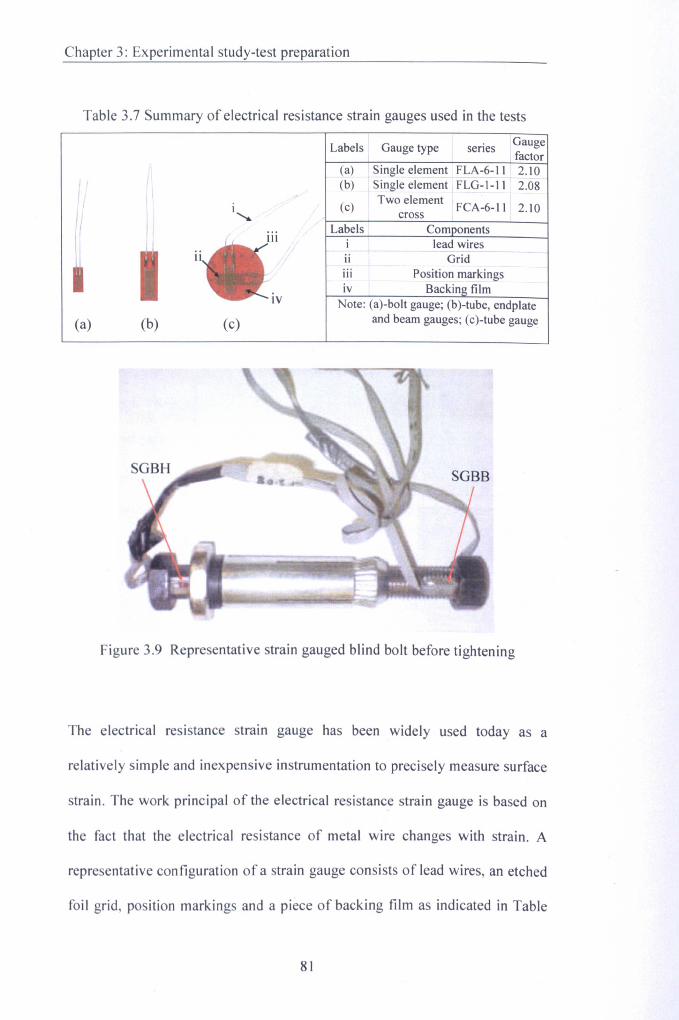
Chapter 3: Experimental study-test preparation
Table 3.7 Summary of electrical resistance strain gauges used in the tests
Labels Gauge type series Gaugefactor
(a) Single element FLA-6-1l 2.10/' (b) Single element FLG-I-l1 2.08
i.......... (c) Two element FCA-6-11 2.10II crossI Labels Com onentsI lead wires
ii Gridiii Position markingsiv Backin film
iv Note: (a)-bolt gauge; (b)-tube, endplate
(a) (b) Cc) and beam gauges; (c)-tube gauge
Figure 3.9 Representative strain gauged blind bolt before tightening
The electrical resistance strain gauge has been widely used today as a
relatively simple and inexpensive instrumentation to precisely measure surface
strain. The work principal of the electrical resistance strain gauge is based on
the fact that the electrical resistance of metal wire changes with strain. A
representative configuration of a strain gauge consists of lead wires, an etched
foil grid, position markings and a piece of backing film as indicated in Table
81
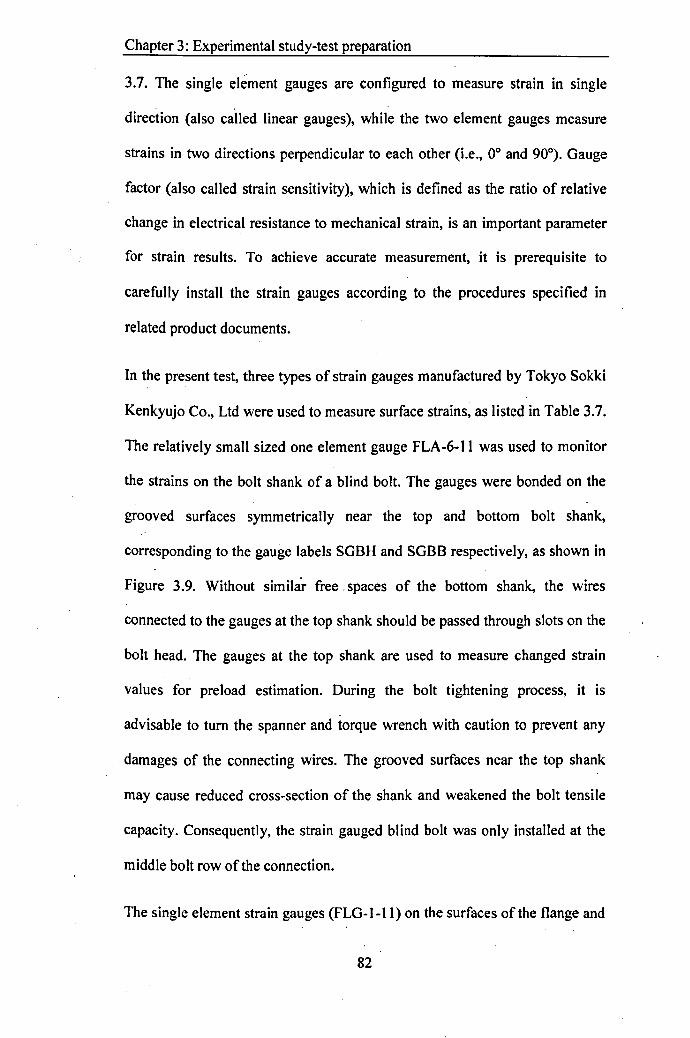
Chapter 3: Experimental study-test preparation
3.7. The single element gauges are configured to measure strain in single
direction (also c~lIed linear gauges), while the two element gauges measure
strains in two directions perpendicular to each other (i.e., 0° and 90°). Gauge
factor (also called strain sensitivity), which is defined as the ratio of relative
change in electrical resistance to mechanical strain, is an important parameter
for strain results. To achieve accurate measurement, it is prerequisite to
carefully install the strain gauges according to the procedures specified in
related product documents.
In the present test, three types of strain gauges manufactured by Tokyo Sokki
Kenkyujo Co., Ltd were used to measure surface strains, as listed in Table 3.7.
The relatively small sized one element gauge FLA-6-11 was used to monitor
the strains on the bolt shank of a blind bolt. The gauges were bonded on the
grooved surfaces symmetrically near the top and bottom bolt shank,
corresponding to the gauge labels SOBH and SOBB respectively, as shown in
Figure 3.9. Without similar free, spaces of the bottom shank, the wires
connected to the gauges at the top shank should be passed through slots on the
bolt head. The gauges at the top shank are used to measure changed strain
values for preload estimation. During the bolt tightening process, it is
advisable to tum the spanner and torque wrench with caution to prevent any
damages of the connecting wires. The grooved surfaces near the top shank
may cause reduced cross-section of the shank and weakened the bolt tensile
capacity. Consequently, the strain gauged blind bolt was only installed at the
middle bolt row of the connection.
The single element strain gauges (FLO-I-II) on the surfaces of the flange and
82
Chapter 3: Experimental study-test preparation
web of steel beam and endplate were used to monitor strains and check if the
beam and endplate were inelastic state as assumed in the pre-design of the
connection. As shown in Figure 3.8, there are five gauges in line on the steel
beam: two on the upper and lower flanges, and three on the web corresponding
to each bolt row. The arrangement on the endplate also consists of three
gauges located in line at each bolt row.
The strain distributions on the column were of interest for both tube
connecting face and sidewall face. To allow for the strains in the directions
parallel and perpendicular to the bolt row, two elements cross gauges (FCA-6-
11) were mounted on the tube connecting face as shown in Figure 3.10. The
endplate in contact with the connecting face of the tube has three circular
grooves underneath which in place accommodate strain gauges in the middle
of each bolt row. The slots connecting to the grooves were also made through
the endplate so that the wires could pass through properly. Due to limit spaces
involved with the grooves and related gauges, it is worth checking the gauges
with caution before and after bolting the endplate during the test preparation.
The strain gauges to monitor the strains on the tube sidewall surfaces were
placed 30mm away from the connecting face level and related with the each
bolt row. It was felt the un-necessity to measure the strains deeper down the .
tube sidewall face due to very small strains at the middle of the tube sidewall
face as formerly reported by Al-Mughairi (2009). Moreover, only the single
element gauge was adopted for this measurement on the tube sidewall face as
shown in Figure 3.11.
83
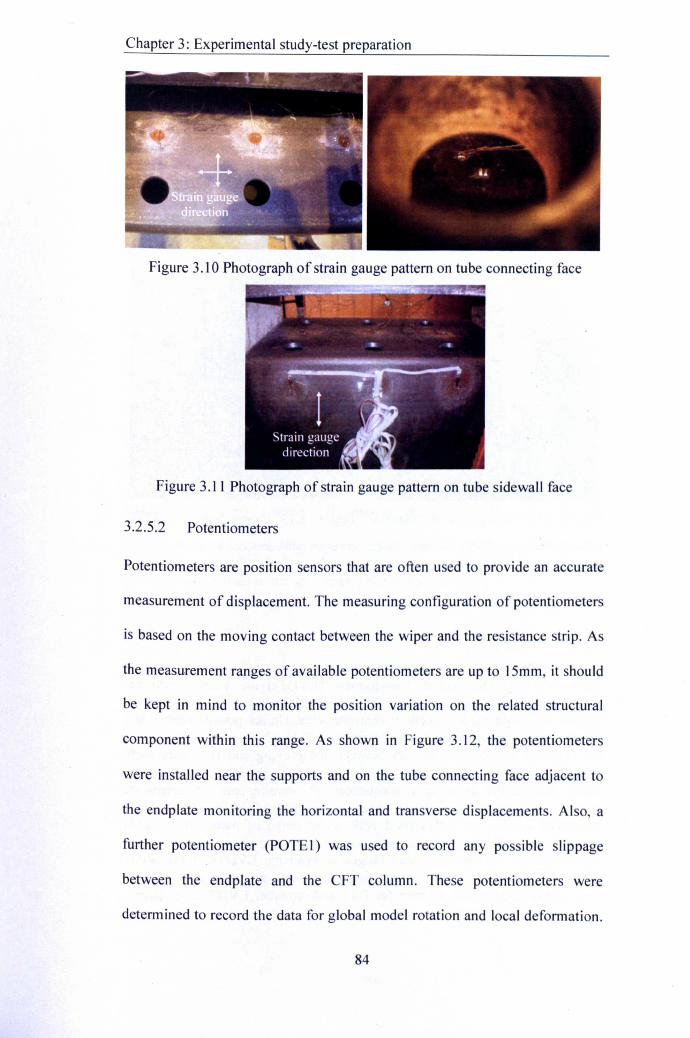
Chapter 3: Experimental study-test preparation
Figure 3.10 Photograph of strain gauge pattern on tube connecting face
Figure 3.11 Photograph of strain gauge pattern on tube sidewall face
3.2.5.2 Potentiometers
Potentiometers are position sensors that are often used to provide an accurate
measurement of displacement. The measuring configuration of potentiometers
is based on the moving contact between the wiper and the resistance strip. As
the measurement ranges of available potentiometers are up to l5mm, it should
be kept in mind to monitor the position variation on the related structural
component within this range. As shown in Figure 3.12, the potentiometers
were installed near the supports and on the tube connecting face adjacent to
the endplate monitoring the horizontal and transverse displacements. Also, a
further potentiometer (POTE 1) was used to record any possible slippage
between the endplate and the CFT column. These potentiometers were
determined to record the data for global model rotation and local deformation.
84
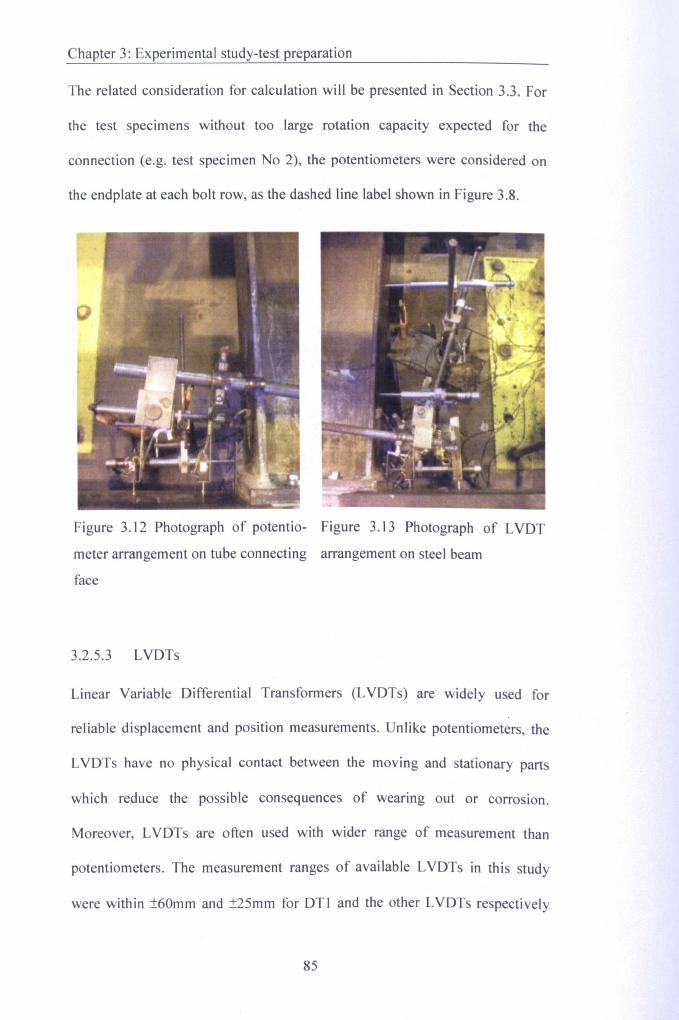
Chapter 3: Experimental study-test preparation
The related consideration for calculation will be presented in Section 3.3. For
the test specimens without too large rotation capacity expected for the
connection (e.g. test specimen No 2), the potentiometers were considered on
the endplate at each bolt row, as the dashed line label shown in Figure 3.8.
Figure 3.12 Photograph of potentio- Figure 3.13 Photograph of LVDT
meter arrangement on tube connecting arrangement on steel beam
face
3.2.5.3 LVDTs
Linear Variable Differential Transformers (LVDTs) are widely used for
reliable displacement and position measurements. Unlike potentiometers, the
LVDTs have no physical contact between the moving and stationary parts
which reduce the possible consequences of wearing out or corrosion.
Moreover, LVDTs are often used with wider range of measurement than
potentiometers. The measurement ranges of available LVDTs in this study
were within ±60mm and ±25mm for DTI and the other LVDTs respectively
85
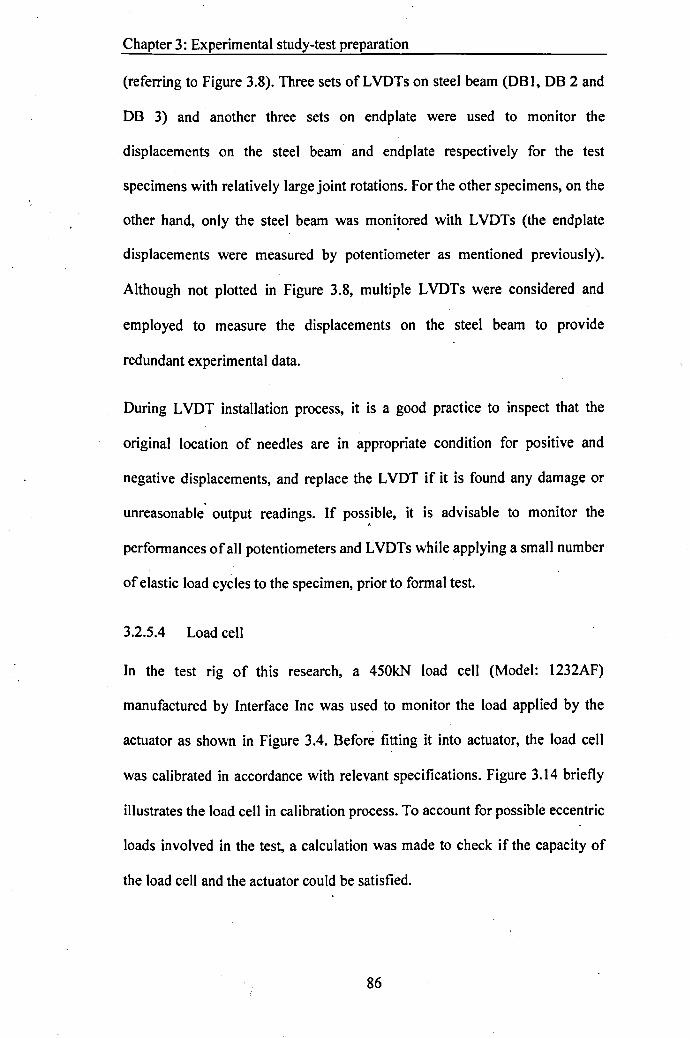
Chapter 3: Experimental study-test preparation
(referring to Figure 3.8). Three sets of LVDTs on steel beam (OBI, DB 2 and
DB 3) and another three sets on endplate were used to monitor the
displacements on the steel beam and endplate respectively for the test
specimens with relatively large joint rotations. For the other specimens, on the
other hand, only the steel beam was monitored with LVDTs (the endplate
displacements were measured by potentiometer as mentioned previously).
Although not plotted in Figure 3.8, multiple LVDTs were considered and
employed to measure the displacements on the steel beam to provide
redundant experimental data.
During LVDT installation process, it is a good practice to inspect that the
original location of needles are in appropriate condition for positive and
negative displacements, and replace the LVDT if it is found any damage or
unreasonable' output readings. If possible, it is advisable to monitor the,
performances of all potentiometers and LVDTs while applying a small number
of elastic load cycles to the specimen, prior to formal test.
3.2.5.4 Load cell
In the test rig of this research, a 450kN load cell (Model: 1232AF)
manufactured by Interface Inc was used to monitor the load applied by the
actuator as shown in Figure 3.4. Before fitting it into actuator, the load cell
was calibrated in accordance with relevant specifications. Figure 3.14 briefly
illustrates the load cell in calibration process. To account for possible eccentric
loads involved in the test, a calculation was made to check if the capacity of
the load cell and the actuator could be satisfied.
86
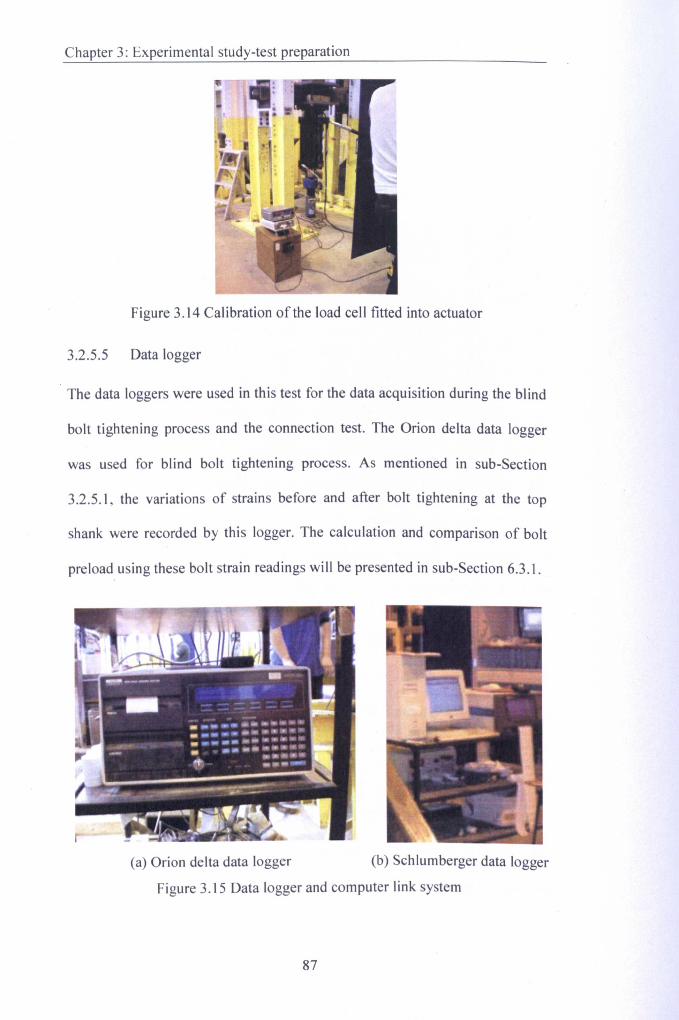
Chapter 3: Experimental study-test preparation
Figure 3.14 Calibration of the load cell fitted into actuator
3.2.5.5 Data logger
The data loggers were used in this test for the data acquisition during the blind
bolt tightening process and the connection test. The Orion delta data logger
was used for blind bolt tightening process. As mentioned in sub-Section
3.2.5.1, the variations of strains before and after bolt tightening at the top
shank were recorded by this logger. The calculation and comparison of bolt
preload using these bolt strain readings will be presented in sub-Section 6.3.1.
(a) Orion delta data logger
Figure 3.15 Data logger and computer link system
(b) Schlumberger data logger
87
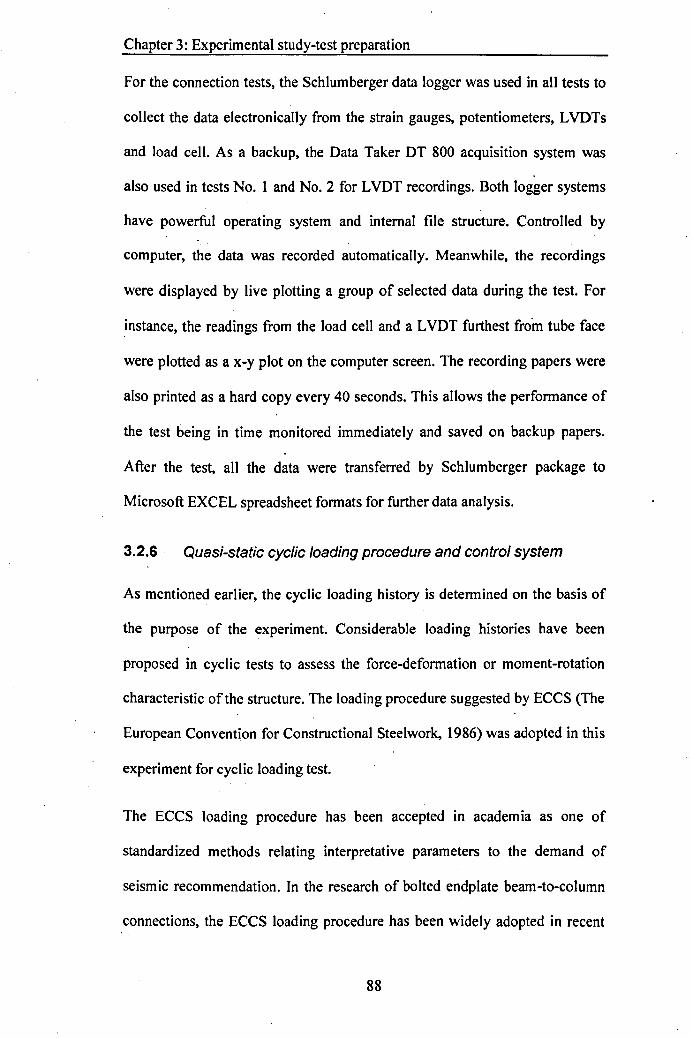
Chapter 3: Experimental study-test preparation
For the connection tests, the Schlumberger data logger was used in all tests to
collect the data electronically from the strain gauges, potentiometers, LVDTs
and load cell. As a backup, the Data Taker DT 800 acquisition system was
also used in tests No. 1 and No.2 for LVDT recordings. Both logger systems
have powerful operating system and internal file structure. Controlled by
computer, the data was recorded automatically. Meanwhile, the recordings
were displayed by live plotting a group of selected data during the test. For
instance, the readings from the load cell and a LVDT furthest from tube face
were plotted as a x-y plot on the computer screen. The recording papers were
also printed as a hard copy every 40 seconds. This allows the performance of
the test being in time monitored immediately and saved on backup papers.
After the test, all the data were transferred by Schlumberger package to
Microsoft EXCEL spreadsheet formats for further data analysis.
3.2.6 Quasi-static cyclic loading procedure and control system
As mentioned earlier, the cyclic loading history is determined on the basis of
the purpose of the experiment. Considerable loading histories have been
proposed in cyclic tests to assess the force-deformation or moment-rotation
characteristic of the structure. The loading procedure suggested by ECCS (The
European Convention for Constructional Steelwork, 1986) was adopted in this
experiment for cyclic loading test.
The ECCS loading procedure has been accepted in academia as one of
standardized methods relating interpretative parameters to the demand of
seismic recommendation. In the research of bolted endplate beam-to-column
connections, the ECCS loading procedure has been widely adopted in recent
88
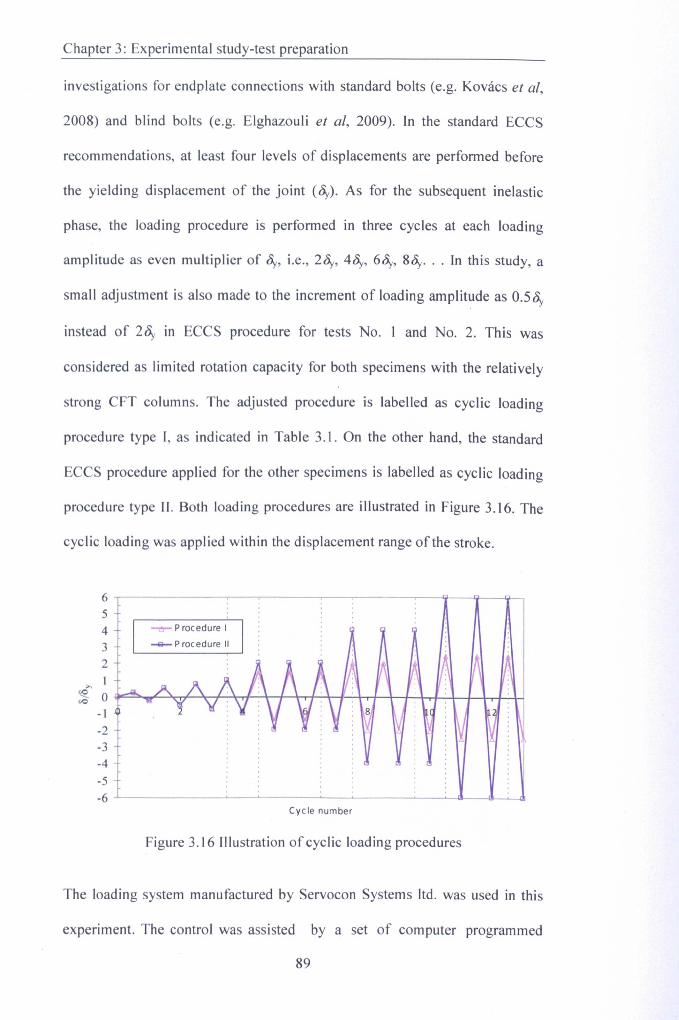
Chapter 3: Experimental study-test preparation
investigations for endplate connections with standard bolts (e.g. Kovacs et ai,
2008) and blind bolts (e.g. Elghazouli et ai, 2009). In the standard ECCS
recommendations, at least four levels of displacements are performed before
the yielding displacement of the joint (Oy). As for the subsequent inelastic
phase, the loading procedure is performed in three cycles at each loading
amplitude as even multiplier of Oy, i.e., 2Oy, 4Oy, 6Oy, 8Oy ... In this study, a
small adjustment is also made to the increment of loading amplitude as O.5Oy
instead of 20y in ECCS procedure for tests No. I and No.2. This was
considered as limited rotation capacity for both specimens with the relatively
strong CFT columns. The adjusted procedure is labelled as cyclic loading
procedure type T, as indicated in Table 3.1. On the other hand, the standard
ECCS procedure applied for the other specimens is labelled as cyclic loading
procedure type II. Both loading procedures are illustrated in Figure 3.16. The
cyclic loading was applied within the displacement range of the stroke.
654 __ Procedure I
3 __ Procedure II
2
>. I~ 000
-I 8
-2-3-4-5-6
Cycle number
Figure 3.16 Illustration of cyclic loading procedures
The loading system manufactured by Servocon Systems ltd. was used in this
experiment. The control was assisted by a set of computer programmed
89
Chapter 3: Experimental study-test preparation
system to coordinate the movement of the hydraulic actuator, the load data
acquisition and the instant display of selected data. Figure 3.17 shows a
representative display of the system input screen. This screen presents basic
information of load and displacement recorded by the system on the right. The
primary input information is displayed in the middle screen including the
load/displacement target for each loading process, the loading rate per second,
and the hold time after each loading. Using this input, the control system
imposes the required cyclic loading procedure on the hydraulic actuator.
Figure 3.17 Display of Servo con loading controller
90
Chapter 3: Experimental study-test preparation
3.3 Measurement of Joint rotation and moment
Due to the complexity of the joint system and test apparatus used in the test, it
was difficult to obtain the joint rotation and moment from the instrumentation
at a given measuring point. Rather, the measurements of joint rotation and
moment are based on the geometric relationships related to the instrumentation
on the joint as well as the test apparatus. This section describes the
measurements of joint rotation and moment, which were used to analyse the
data recorded through the test.
3.3.1 Joint rotation measurement
The approaches for joint rotation measurement reported in the literature
(referring to Appendix A) vary in terms of joint configurations (single sided or
double sided configuration) and loading patterns (symmetrical or
unsymmetrical loading). It is noted that the joint rotation measurements in
most of these studies refer to the rotation due to the beam displacement as the
main rotation source. There are still some other studies in which the relative
deformation between the column flange and endplate was recorded to
calculate the joint rotation (referring to Shi et ai, 2007). Due to unavailable
. space inside the CFT column for instrumentation, only the former approach
was considered in the present study. Given the contribution of joint
components to the rotation, from the theoretical point of view, the overall
rotation, 00' consists of three components, i.e., the beam deformation induced
rotation (bending and shearing effects), ~, the joint rotation, ~, and the
column rotation, Oc, as shown in Figure 3.18.
91
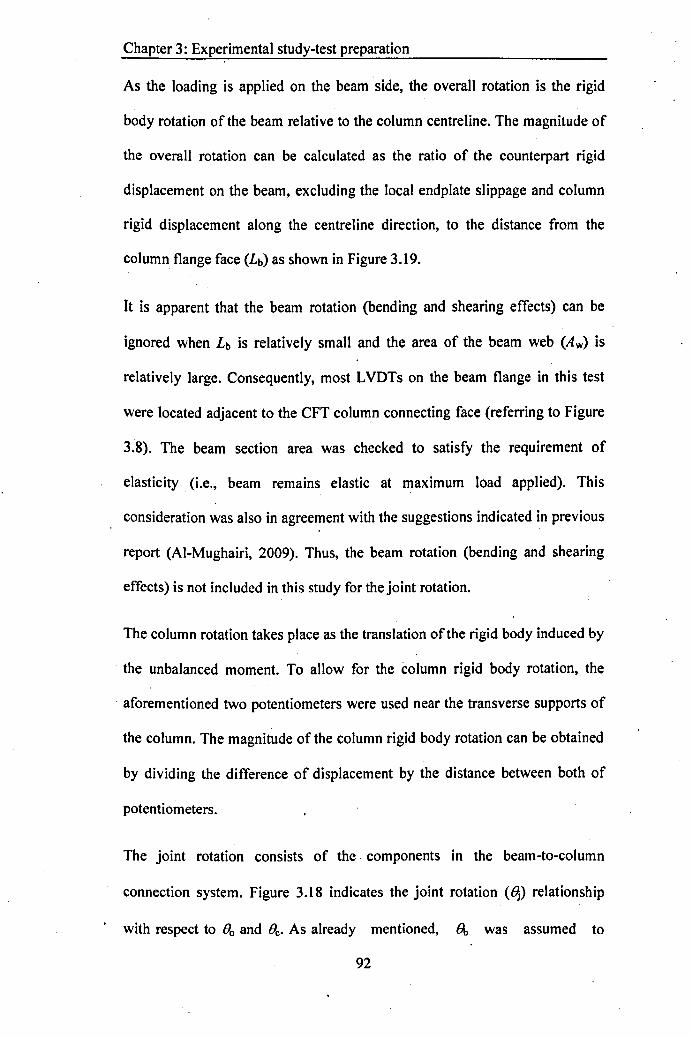
Chapter 3: Experimental study-test preparation
As the loading is applied on the beam side, the overall rotation is the rigid
body rotation of the beam relative to the column centreline. The magnitude of
the overall rotation can be calculated as the ratio of the counterpart rigid
displacement on the beam, excluding the local endplate slippage and column
rigid displacement along the centreline direction, to the distance from the
column flange face (Lb) as shown in Figure 3.19.
It is apparent that the beam rotation (bending and shearing effects) can be
ignored when Lb is relatively small and the area of the beam web (Aw) is
relatively large. Consequently, most LVDTs on the beam flange in this test
were located adjacent to the CFT column connecting face (referring to Figure
3~8). The beam section area was checked to satisfy the requirement of
elasticity (i.e., beam remains elastic at maximum load applied). This
consideration was also in agreement with the suggestions indicated in previous
report (AI-Mughairi, 2009). Thus, the beam rotation (bending and shearing
effects) is not included in this study for the joint rotation.
The column rotation takes place as the translation of the rigid body induced by
the unbalanced moment. To allow for the column rigid body rotation, the
aforementioned two potentiometers were used near the transverse supports of
the column. The magnitude of the column rigid body rotation can be obtained
by dividing the difference of displacement by the distance between both of
potentiometers.
The joint rotation consists of the components in the beam-to-column
connection system. Figure 3.18 indicates the joint rotation (~) relationship
with respect to Ba and Bc. As already mentioned, ~ was assumed to
92

Chapter 3: Experimental study-test preparation
benegligible such that the joint rotation can be calculated as:
8 = 8 -8Joe Equation 3.1
The related relationship is schematised in Figure 3.18.
Column _-
Endplate
Beam
Figure 3.18 Schematic graph of joint rotation relationships
3.3.2 Joint moment measurement
The moment of a joint with a cantilever beam is generally obtained by the
product of the applied force normal to the beam flange and the loading point
lever arm. Due to the introduction of the linkage system, the forces applied on
the steel beam were taken into account by appropriate conversion of the
horizontal force provided by the hydraulic actuator (1), as shown in Figure
3.19.
Figure 3.19 shows a schematic graph of transforming geometric relationship
of the linkage system and the steel beam. Assuming that the rigid links have
no self-deformations, the horizontal movement of the hydraulic actuator (oac)
produces the beam rotation as well as the rigid links spinning around link
roller (Point: D) which result in the rotation angles ~ and 'Y respectively.
Based on the theoretical trigonometric relationship, 'Y can be obtained from the
93
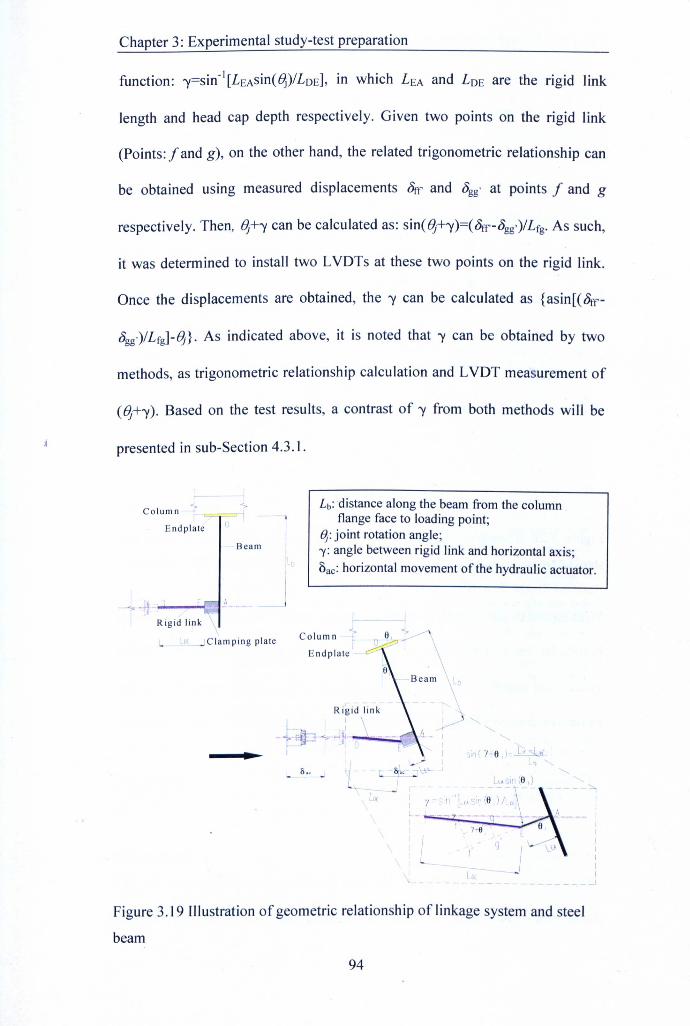
Chapter 3: Experimental study-test preparation
function: 'Y=sin-I[LEAsin(~)/LDEJ, in which LEA and LDE are the rigid link
length and head cap depth respectively. Given two points on the rigid link
(Points: f and g), on the other hand, the related trigonometric relationship can
be obtained using measured displacements Orr and Ogg' at points f and g
respectively. Then, ~+'Y can be calculated as: sin(~+'Y)=(off-ogg')/Lfg. As such,
it was determined to install two LVDTs at these two points on the rigid link.
Once the displacements are obtained, the 'Y can be calculated as {asin[(Orr-
Ogg')/Lfg]-~}. As indicated above, it is noted that 'Y can be obtained by two
methods, as trigonometric relationship calculation and LVDT measurement of
(~+'Y). Based on the test results, a contrast of v from both methods will be
presented in sub-Section 4.3.1.
COlumn-t: t-Endplate 0
Beam
L LDE_jClamping plate
Lb:distance along the beam from the columnflange face to loading point;
~: joint rotation angle;-y: angle between rigid link and horizontal axis;oac: horizontal movement of the hydraulic actuator.
Column -tEndplate ~
sin ( He ,1=Ji.:s6:-r,
-Beam Lb
r -Rigid link
-lr,t":"+ I_J \ ------r ,~ .... r '~I D EI I
L ~'-I c&~\:l."_
_J ,-LD[ : y Sill '[Lr.Sin(e,)/L"
l
L" 5111 (e ,)
lE
.: JI
II
I -. I
{- LD[ - I...J
Figure 3.19 Illustration of geometric relationship of linkage system and steel
beam
94
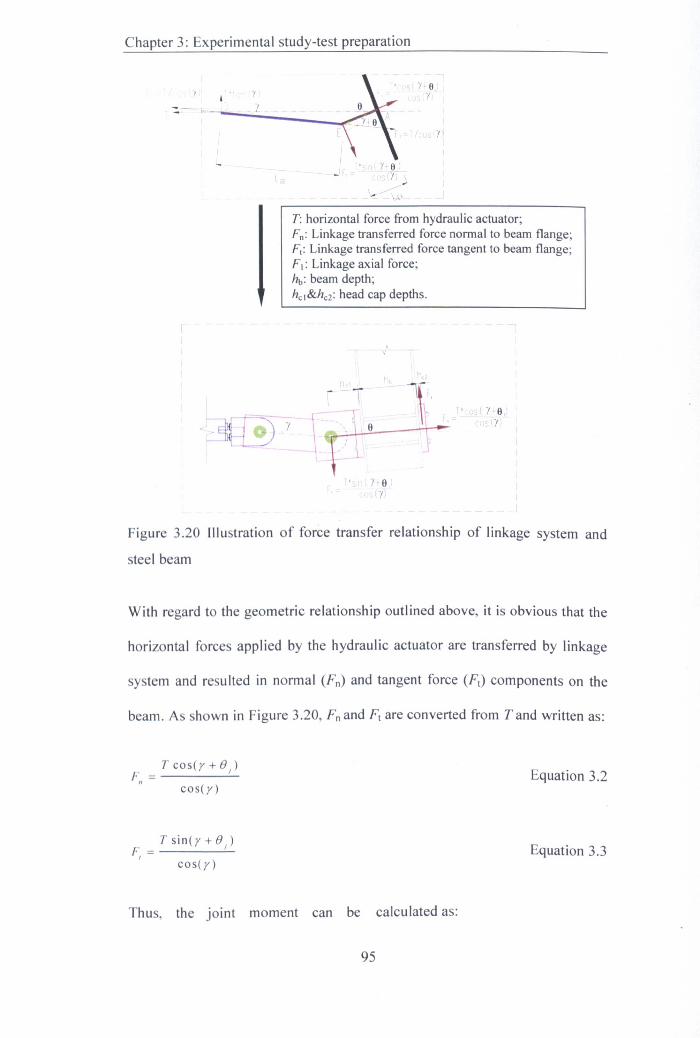
Chapter 3: Experimental study-test preparation
'(I
Ir 5 n
[. os nor
-_ '" y
D[
T: horizontal force from hydraulic actuator;Fn: Linkage transferred force normal to beam flange;F: Linkage transferred force tangent to beam flange;F1: Linkage axial force;hb: beam depth;hc1&hc2: head cap depths.
" noIf
Figure 3.20 Illustration of force transfer relationship of linkage system and
steel beam
With regard to the geometric relationship outlined above, it is obvious that the
horizontal forces applied by the hydraulic actuator are transferred by linkage
system and resulted in normal (Fn) and tangent force (Ft) components on the
beam. As shown in Figure 3.20, Fn and F, are converted from Tand written as:
T cos(y + ()j)
cos(y)Equation 3.2
Tsin(y+() )F = j Equation 3.3, cos(y)
Thus, the joint moment can be calculated as:
95
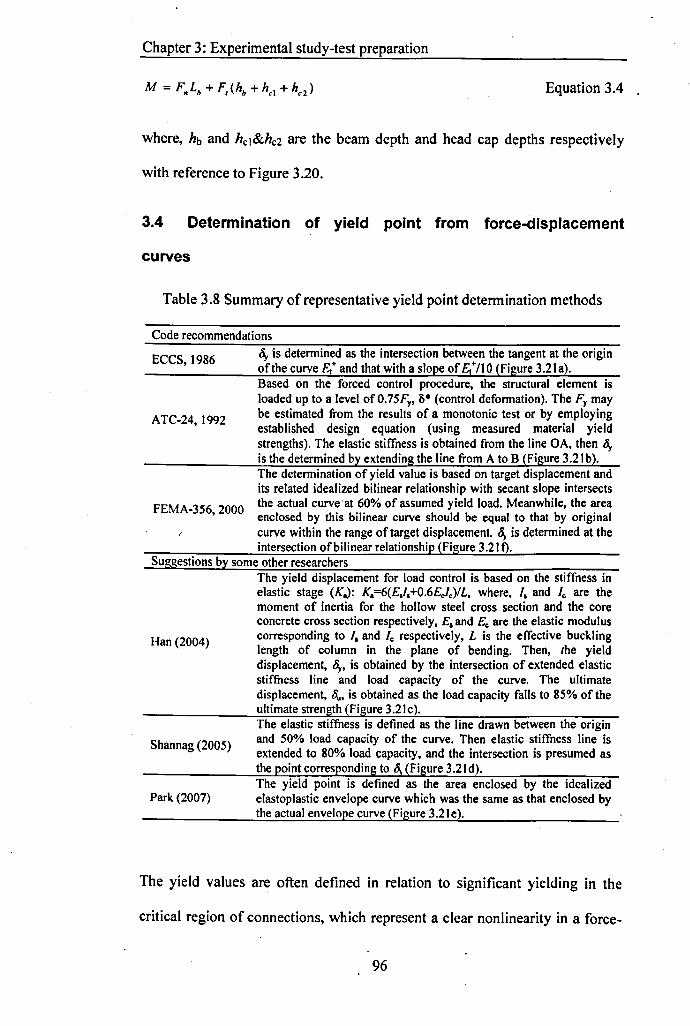
Chapter 3: Experimental study-test preparation
Equation 3.4 .
where, hb and hc1&hc2 are the beam depth and head cap depths respectively
with reference to Figure 3.20.
3.4 Determination of yield point from force-displacement
curves
Table 3.8 Summary of representative yield point determination methods
Code recommendations
ECCS,1986 ~ is determined as the intersection between the tangent at the originof the curve Et and that with a slope of EtllO (Figure 3.2Ia).
ATC-24, 1992
Based on the forced control procedure, the structural element isloaded up to a level ofO.75Fy, 8* (control deformation). The Fy maybe estimated from the results of a monotonic test or by employingestablished design equation (using measured material yieldstrengths). The elastic stiffness is obtained from the line OA, then ~is the determined by extending the line from A to B (Figure 3.21b).The determination of yield value is based on target displacement andits related idealized bilinear relationship with secant slope intersects
FEMA-356,2000 the actual curveat 60% of assumed yield load. Meanwhile, the areaenclosed by this bilinear curve should be equal to that by originalcurve within the range of target displacement. ~ is determined at theintersection of bilinear relationship (Figure 3.21f).
Suggestions by some other researchers
Han (2004)
The yield displacement for load control is based on the stiffness inelastic stage (K.): K.=6(EJ.+0.6EJe)/L, where, I, and Ie are themoment of inertia for the hollow steel cross section and the coreconcrete cross section respectively, E, and Ee are the elastic moduluscorresponding to I. and Ie respectively, L is the effective bucklinglength of column in the plane of bending. Then, rhe yielddisplacement, ~, is obtained by the intersection of extended elasticstiffness line and load capacity of the curve. The ultimatedisplacement, ~, is obtained as the load capacity falls to 85% of theultimate strength (Figure 3.2Ic).
Shannag (2005)
The elastic stiffness is defined as the line drawn between the originand 50% load capacity of the curve. Then elastic stiffness line isextended to 80% load capacity, and the intersection is presumed asthe point corresponding to §y (Figure 3.21d).
Park (2007)The yield point is defined as the area enclosed by the idealizedelastoplastic envelope curve which was the same as that enclosed bythe actual envelope curve (Figure 3.2Ie).
The yield values are often defined in relation to significant yielding in the
critical region of connections, which represent a clear nonlinearity in a force-
96
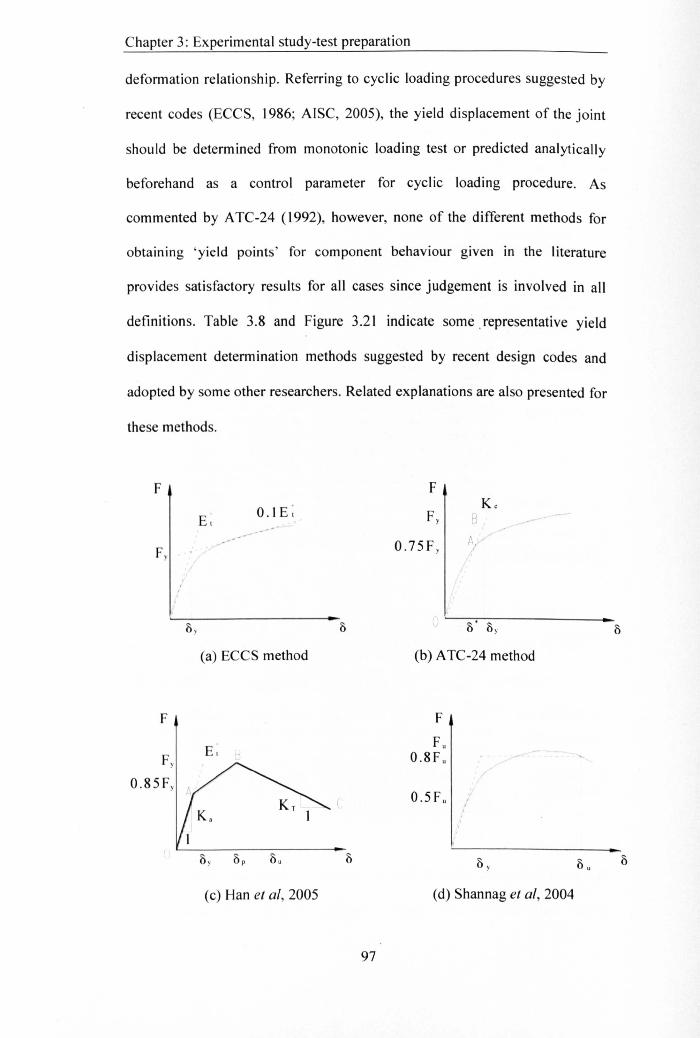
Chapter 3: Experimental study-test preparation
deformation relationship. Referring to cyclic loading procedures suggested by
recent codes (ECCS, 1986; AISC, 2005), the yield displacement of the joint
should be determined from monotonic loading test or predicted analytically
beforehand as a control parameter for cyclic loading procedure. As
commented by ATC-24 (1992), however, none of the different methods for
obtaining 'yield points' for component behaviour given in the literature
provides satisfactory results for all cases since judgement is involved in all
definitions. Table 3.8 and Figure 3.21 indicate some, representative yield
displacement determination methods suggested by recent design codes and
adopted by some other researchers. Related explanations are also presented for
these methods.
F F
0.1 E; KeE; Fy B ,
,- .0.75Fy A;
Fy 1/
(a) ECCS method (b) ATC-24 method
F F
FuFy 0.8F u
0.85Fy0.5 F u
(c) Han et al, 2005 (d) Shan nag et al, 2004
97
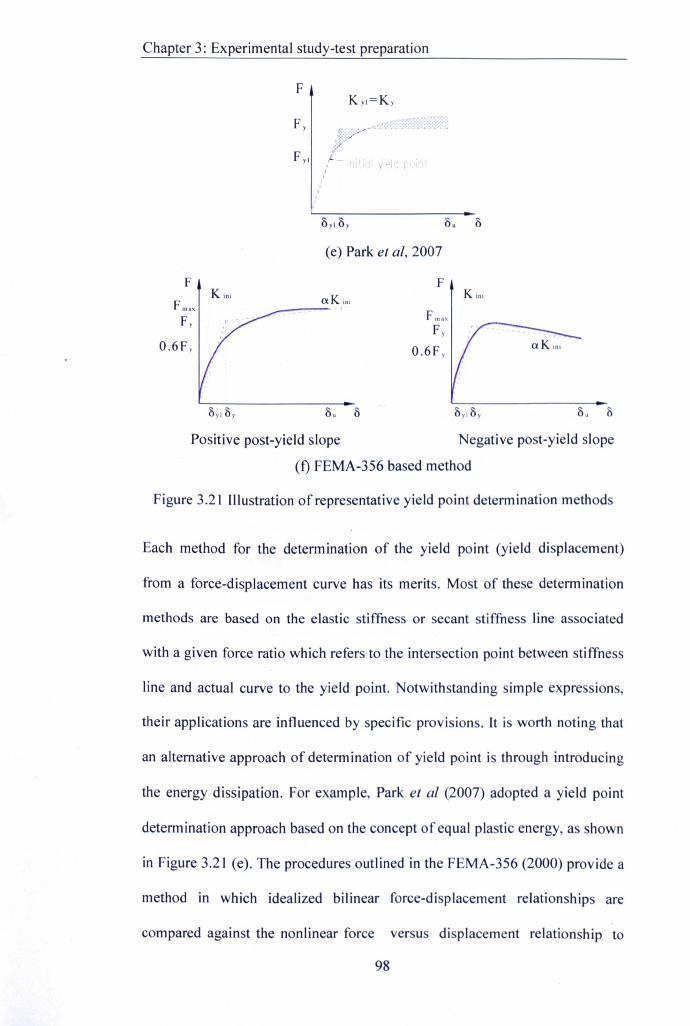
Chapter 3: Experimental study-test preparation
F
r,
OylOy 0. 0
(e) Park et ai, 2007
F Fx.,aKin! KLn!Fmox
Fy F rna"
FyO.6Fy O.6F y
Positive post-yield slope Negative post-yield slope
(f) FEMA-356 based method
Figure 3.21 llIustration of representative yield point determ ination methods
Each method for the determination of the yield point (yield displacement)
from a force-displacement curve has its merits. Most of these determination
methods are based on the elastic stiffness or secant stiffness line associated
with a given force ratio which refers to the intersection point between stiffness
line and actual curve to the yield point. Notwithstanding simple expressions,
their applications are influenced by specific provisions. It is worth noting that
an alternative approach of determination of yield point is through introducing
the energy dissipation. For example, Park et al (2007) adopted a yield point
determination approach based on the concept of equal plastic energy, as shown
in Figure 3.21 (e). The procedures outlined in the FEMA-356 (2000) provide a
method in which idealized bilinear force-displacement relationships are
compared against the nonlinear force versus displacement relationship to
98
Chapter 3: Experimental study-test preparation
estimate the effective lateral stiffness and yield strength of a building.
Moreover, the bilinear relationships are plotted to fit the actual curves with
positive and negative post-yield slopes (aK'ini). As outlined in Table 3.8, this
method seems to provide a compromise of the considerations of secant
stiffness, i.e., the secant stiffness linear up to 60% of assumed yield force, and
energy dissipation, i.e., the requirements of approximate area balances
between line segments above and below the actual curve. In the present study,
the yield force and yield displacement of the connections were determined
using this method suggested by FEMA-356 (2000).
3.5 Concluding remarks
The experiment preparation of this research programme has been described in
this chapter. The design intension of the test specimens has been introduced
and discussed in details. Relevant information of specimen fabrication, test
set-up, instrumentation, and loading procedure has been presented in this
chapter. The yield displacement determination approach adopted for this study
has been described and discussed. The work mentioned above have a close
relation with the experimental data processing in this study. The test results
will be given and discussed in the following chapter.
99
Chapter 4: Experimental study-test results
CHAPTER4
EXPERIMENTAL STUDY-TEST RESULTS
- 4.1 Introduction
In conjunction with the previous chapter, it is the purpose of this chapter to
evaluate the results obtained from full-scale beam-to-column connection tests.
The approaches mentioned in the previous chapter are taken for post-
processing test data. The verifications of test design assumption are also
presented.
The results will be presented in this chapter as in the following order. First,
two representative failure modes of the connections are outlined together with
the test observations recorded in the experiments. Second, the hysteretic
moment-rotation relationships are described in relation with the relevant
influential parameters which were considered as the bolt grade, cyclic loading
procedure, tube wall thickness and concrete grade. Third, relevant discussions
are made for these influences on the hysteretic moment-rotation relationships
of this innovative blind bolted endplate connection to CFT column. Fourth, the
representative strain profiles of the connection components including the steel
beam, tube sidewall face & connecting face, and bolt shank are described.
Finally, concluding remarks are presented.
4.2 Failure modes
As mentioned earlier, the connection specimens were designed in this study to
isolate the CFT column and the blind bolt as relatively weak components and
eliminate the plastic deformation of the steel beam and endplate. The
100
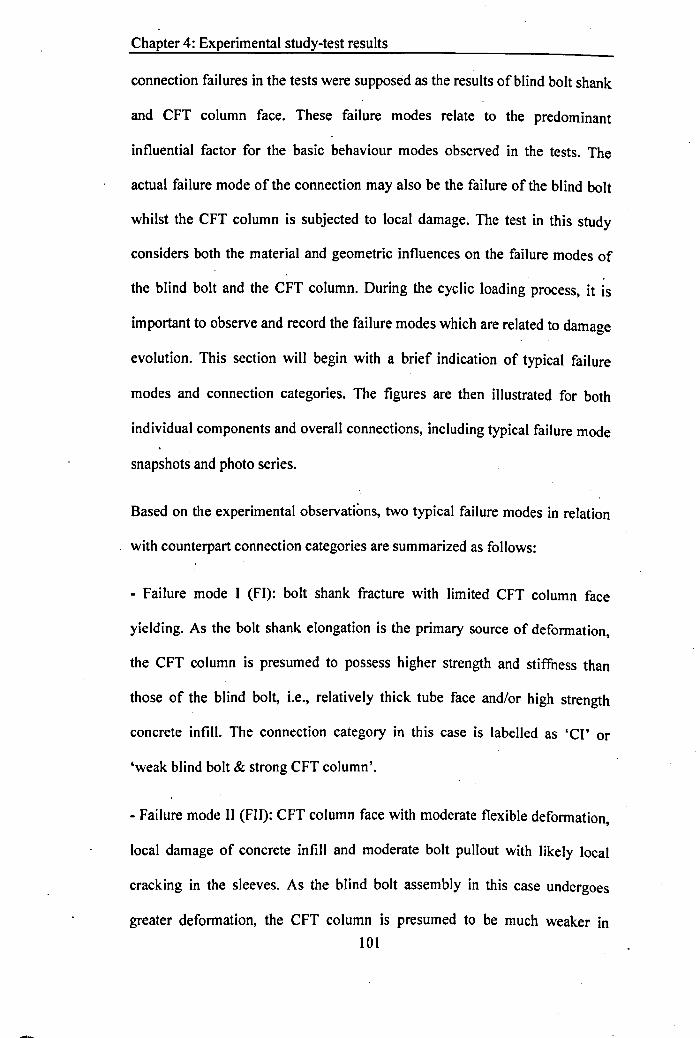
Chapter 4: Experimental study-test results
connection failures in the tests were supposed as the results of blind bolt shank
and CFT column face. These failure modes relate to the predominant
influential factor for the basic behaviour modes observed in the tests. The
actual failure mode of the connection may also be the failure of the blind bolt
whilst the CFT column is subjected to local damage. The test in this study
considers both the material and geometric influences on the failure modes of
the blind bolt and the CFT column. During the cyclic loading process, it is
important to observe and record the failure modes which are related to damage
evolution. This section will begin with a brief indication of typical failure
modes and connection categories. The figures are then illustrated for both
individual components and overall connections, including typical failure mode
snapshots and photo series.
Based on the experimental observations, two typical failure modes in relation
with counterpart connection categories are summarized as follows:
- Failure mode I (FI): bolt shank fracture with limited CFT column face
yielding. As the bolt shank elongation is the primary source of deformation,
the CFT column is presumed to possess higher strength and stiffness than
those of the blind bolt, i.e., relatively thick tube face and/or high strength
concrete infill. The connection category in this case is labelled as 'Cl' or
'weak blind bolt & strong CFT column'.
- Failure mode II (FlI): CFT column face with moderate flexible deformation,
local damage of concrete infill and moderate bolt pullout with likely local
cracking in the sleeves. As the blind bolt assembly in this case undergoes
greater deformation, the CFT column is presumed to be much weaker in101
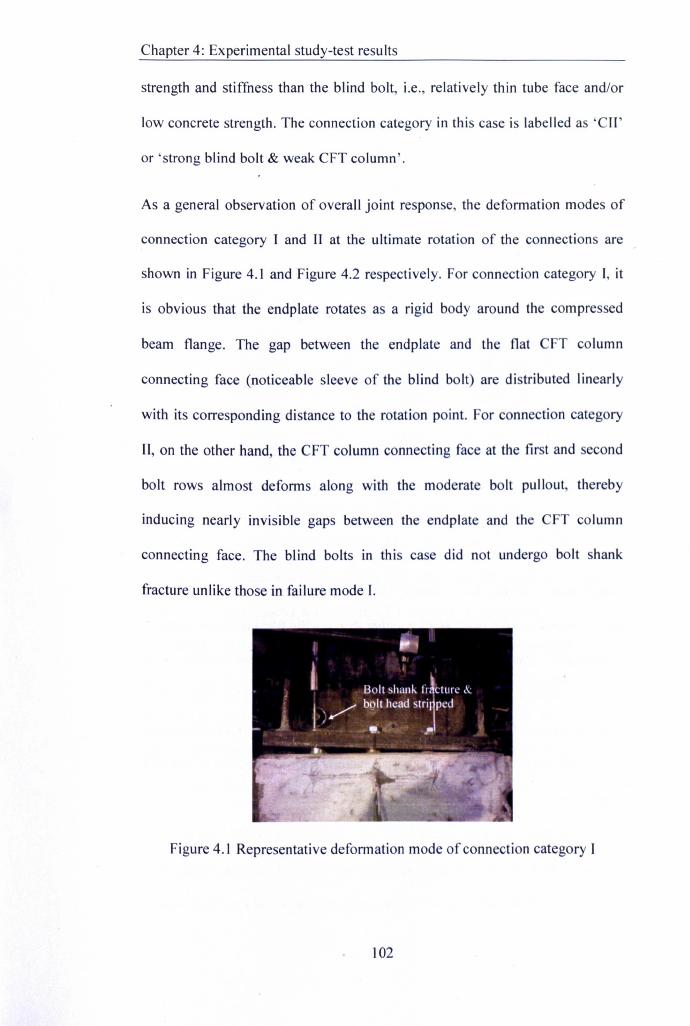
Chapter 4: Experimental study-test results
strength and stiffness than the blind bolt, i.e., relatively thin tube face and/or
low concrete strength. The connection category in this case is labelled as 'Cll '
or 'strong blind bolt & weak CFT column'.
As a general observation of overall joint response, the deformation modes of
connection category I and II at the ultimate rotation of the connections are
shown in Figure 4.1 and Figure 4.2 respectively. For connection category I, it
is obvious that the endplate rotates as a rigid body around the compressed
beam flange. The gap between the endplate and the flat CFT column
connecting face (noticeable sleeve of the blind bolt) are distributed linearly
with its corresponding distance to the rotation point. For connection category
II, on the other hand, the CFT column connecting face at the first and second
bolt rows almost deforms along with the moderate bolt pullout, thereby
inducing nearly invisible gaps between the endplate and the CFT column
connecting face. The blind bolts in this case did not undergo bolt shank
fracture unlike those in failure mode r.
Figure 4.1 Representative deformation mode of connection category 1
102
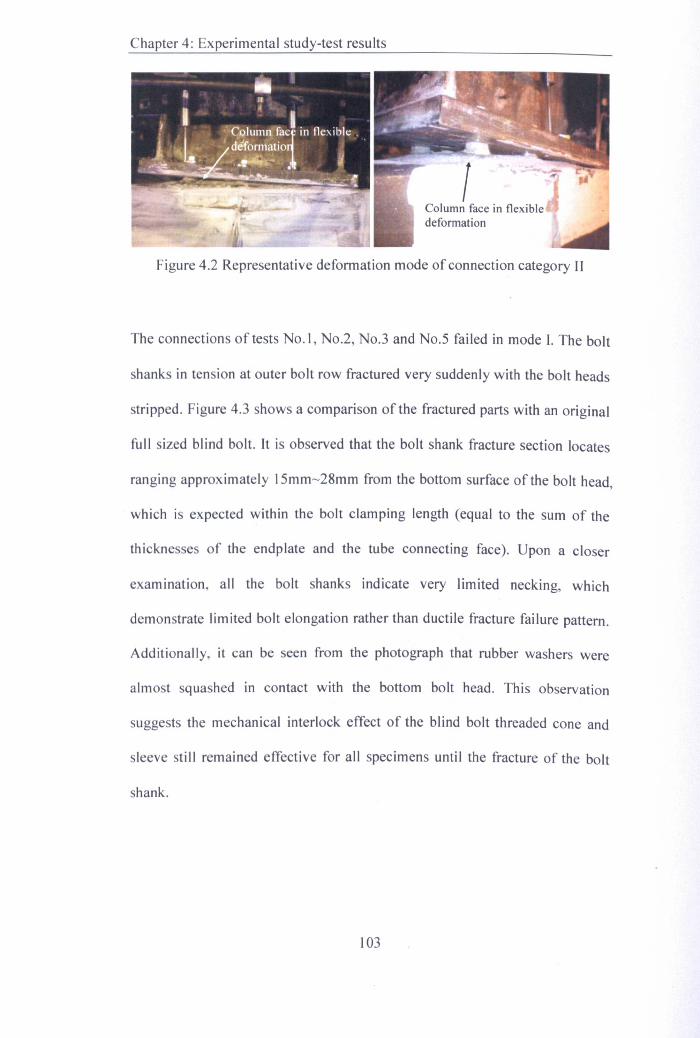
Chapter 4: Experimental study-test results
deformation
Figure 4.2 Representative deformation mode of connection category II
The connections of tests No.1, No.2, No.3 and No.5 failed in mode I. The bolt
shanks in tension at outer bolt row fractured very suddenly with the bolt heads
stripped. Figure 4.3 shows a comparison of the fractured parts with an original
full sized blind bolt. It is observed that the bolt shank fracture section locates
ranging approximately 15mm-28mm from the bottom surface of the bolt head,
which is expected within the bolt clamping length (equal to the sum of the
thicknesses of the endplate and the tube connecting face). Upon a closer
examination, all the bolt shanks indicate very limited necking, which
demonstrate limited bolt elongation rather than ductile fracture failure pattern.
Additionally, it can be seen from the photograph that rubber washers were
almost squashed in contact with the bottom bolt head. This observation
suggests the mechanical interlock effect of the blind bolt threaded cone and
sleeve still remained effective for all specimens until the fracture of the bolt
shank.
103
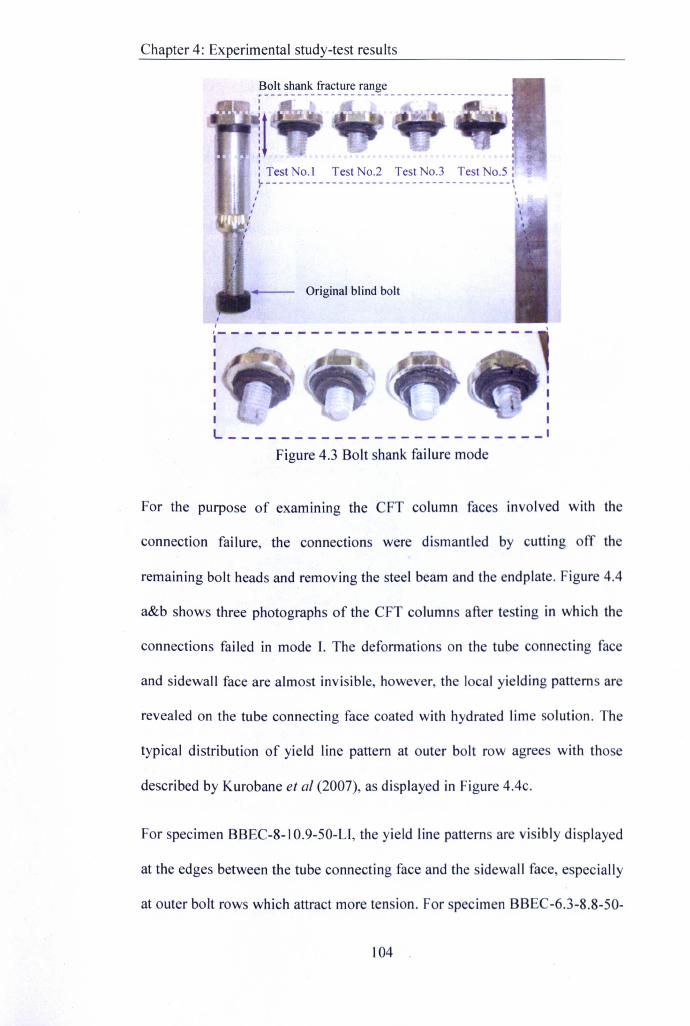
Chapter 4: Experimental study-test results
~~l~ ~~~~k_!r~~~U!:!~~~': _I
I
I
: Test No.1 Test No.2 Test No.3 Test No.5 :L II I
I
Original blind bolt
I
I,------------------------III
I IL I
Figure 4.3 Bolt shank failure mode
For the purpose of examining the CFT column faces involved with the
connection failure, the connections were dismantled by cutting off the
remaining bolt heads and removing the steel beam and the endplate. Figure 4.4
a&b shows three photographs of the CFT columns after testing in which the
connections failed in mode I. The deformations on the tube connecting face
and sidewall face are almost invisible, however, the local yielding patterns are
revealed on the tube connecting face coated with hydrated lime solution. The
typical distribution of yield line pattern at outer bolt row agrees with those
described by Kurobane et al (2007), as displayed in Figure 4.4c.
For specimen BBEC-8-1 0.9-50-L1, the yield line patterns are visibly displayed
at the edges between the tube connecting face and the sidewall face, especially
at outer bolt rows which attract more tension. For specimen BBEC-6.3-8.8-50-
104
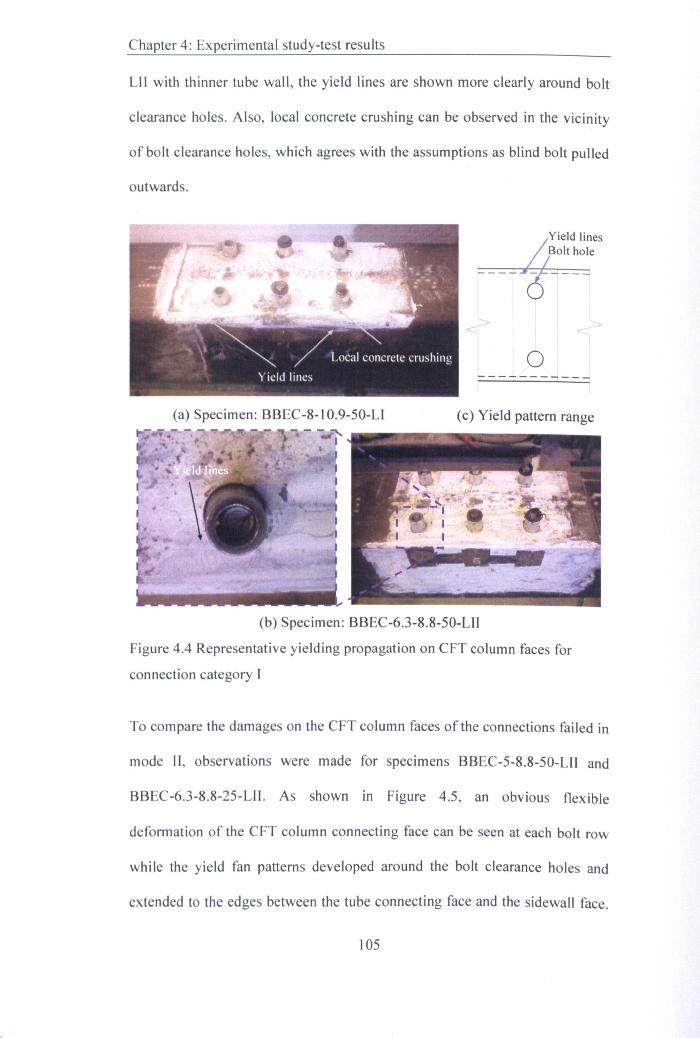
Chapter 4: Experimental study-test results
LII with thinner tube wall, the yield lines are shown more clearly around bolt
clearance holes. Also, local concrete crushing can be observed in the vicinity
of bolt clearance holes, which agrees with the assumptions as blind bolt pulled
outwards.
tlL ? _(a) Specimen: BBEC-S-l 0.9-50-LI
I(c) Yield pattern range
(b) Specimen: BBEC-6.3-8.8-50-LII
Figure 4.4 Representative yielding propagation on eFT column faces for
connection category I
To compare the damages on the CFT column faces of the connections failed in
mode II, observations were made for specimens BBEC-5-S.8-50-LII and
BBEC-6.3-S.8-25-UI. As shown in Figure 4.5, an obvious flexible
deformation of the CFT column connecting face can be seen at each bolt row
while the yield fan patterns developed around the bolt clearance holes and
extended to the edges between the tube connecting face and the sidewall face.
105
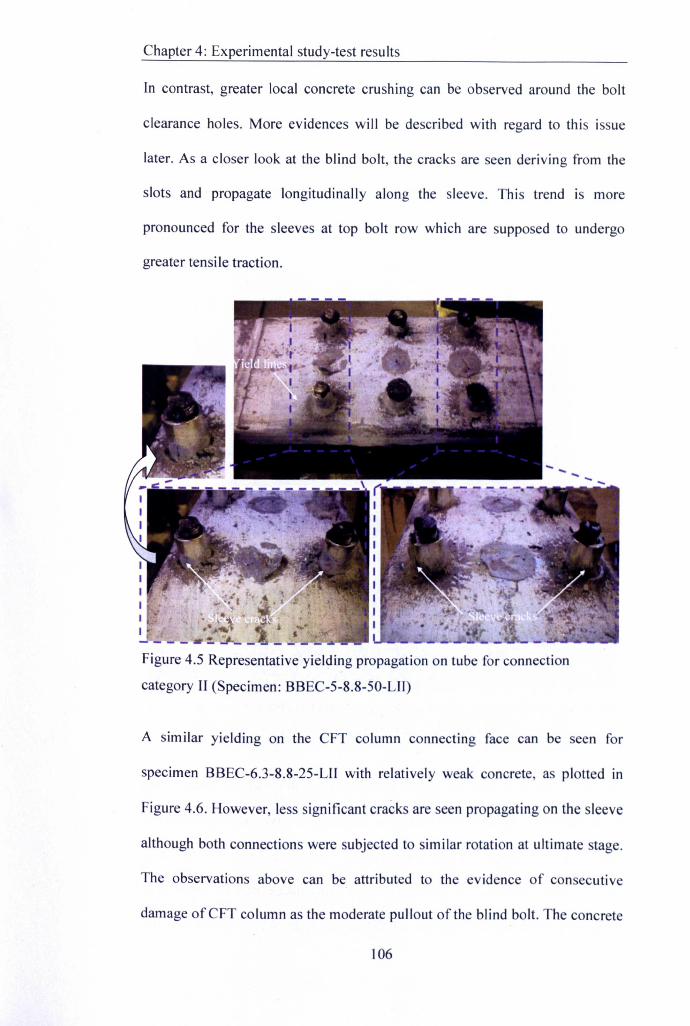
Chapter 4: Experimental study-test results
In contrast, greater local concrete crushing can be observed around the bolt
clearance holes. More evidences will be described with regard to this issue
later. As a closer look at the blind bolt, the cracks are seen deriving from the
slots and propagate longitudinally along the sleeve. This trend is more
pronounced for the sleeves at top bolt row which are supposed to undergo
greater tensile traction.
Figure 4.5 Representative yielding propagation on tube for connection
category II (Specimen: BBEC-5-8.B-SO-LII)
A similar yielding on the CFT column connecting face can be seen for
specimen BBEC-6.3-B.B-2S-LII with relatively weak concrete, as plotted in
Figure 4.6. However, less significant cracks are seen propagating on the sleeve
although both connections were subjected to similar rotation at ultimate stage.
The observations above can be attributed to the evidence of consecutive
damage ofCFT column as the moderate pullout of the blind bolt. The concrete
106
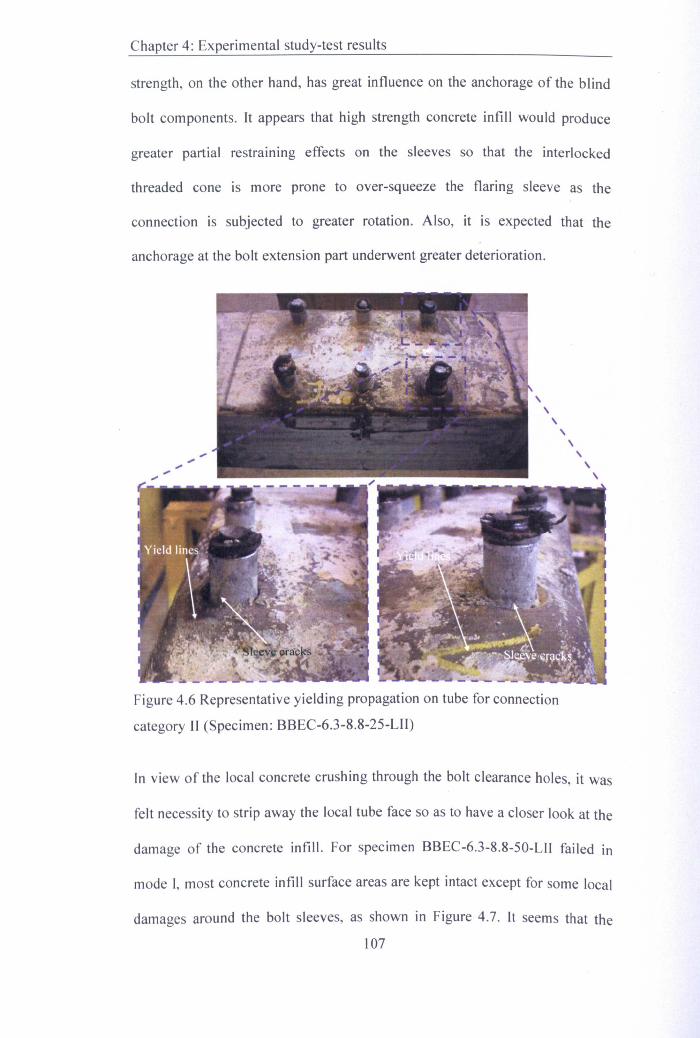
Chapter 4: Experimental study-test results
strength, on the other hand, has great influence on the anchorage of the blind
bolt components. It appears that high strength concrete infill would produce
greater partial restraining effects on the sleeves so that the interlocked
threaded cone is more prone to over-squeeze the flaring sleeve as the
connection is subjected to greater rotation. Also, it is expected that the
anchorage at the bolt extension part underwent greater deterioration.
\,\\\\\\
Figure 4.6 Representative yielding propagation on tube for connection
category II (Specimen: BBEC-6.3-8.8-25-LII)
In view of the local concrete crushing through the bolt clearance holes, it was
felt necessity to strip away the local tube face so as to have a closer look at the
damage of the concrete infill. For specimen BBEC-6.3-8.8-50-LII failed in
mode I, most concrete infill surface areas are kept intact except for some local
damages around the bolt sleeves, as shown in Figure 4.7. It seems that the
107
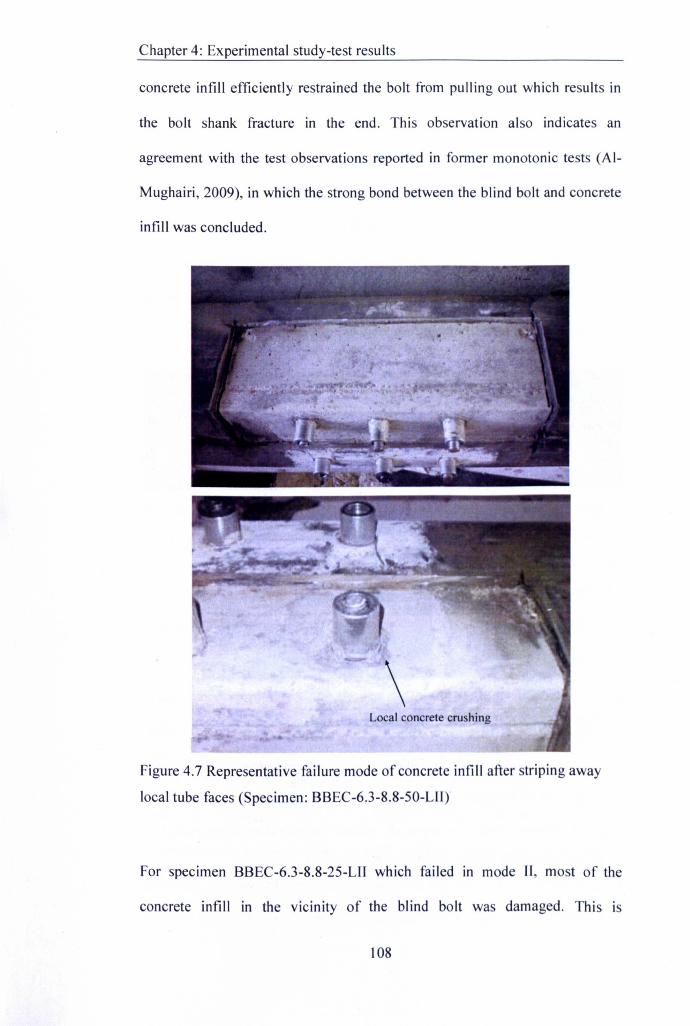
Chapter 4: Experimental study-test results
concrete infill efficiently restrained the bolt from pulling out which results in
the bolt shank fracture in the end. This observation also indicates an
agreement with the test observations reported in former monotonic tests (AI-
Mughairi, 2009), in which the strong bond between the blind bolt and concrete
infill was concluded.
\Local concrete crushing
Figure 4.7 Representative failure mode of concrete infill after striping away
local tube faces (Specimen: BBEC-6.3-8.8-S0-LlI)
For specimen BBEC-6.3-8.8-2S-LII which failed in mode II, most of the
concrete infill in the vicinity of the blind bolt was damaged. This is
108
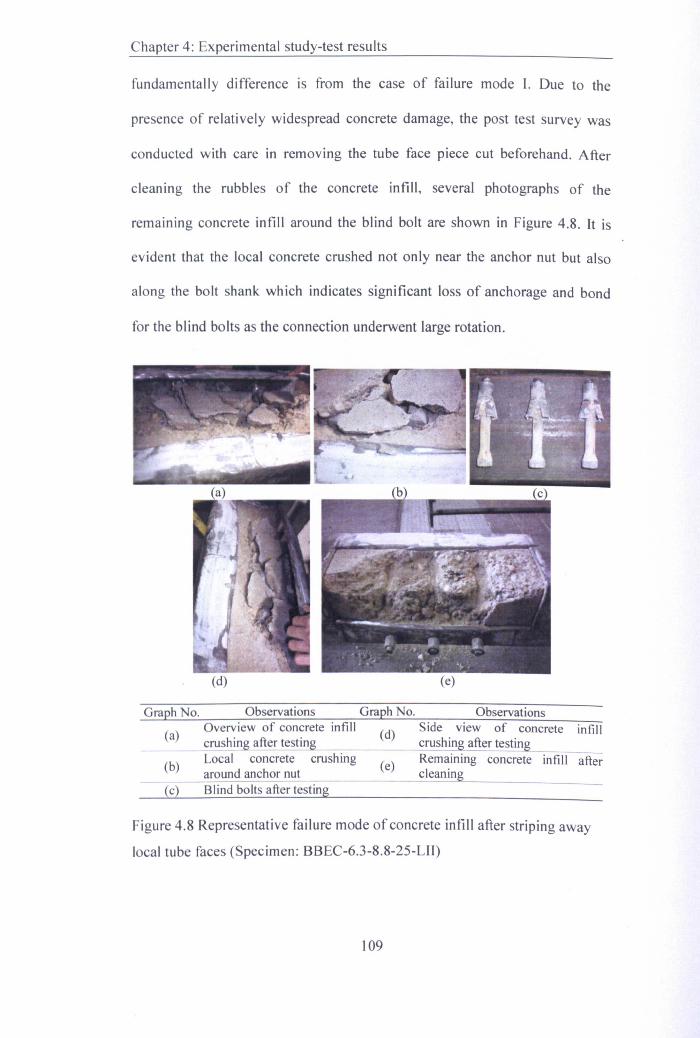
Chapter 4: Experimental study-test results
fundamentally difference is from the case of failure mode I. Due to the
presence of relatively widespread concrete damage, the post test survey was
conducted with care in removing the tube face piece cut beforehand. After
cleaning the rubbles of the concrete infill, several photographs of the
remaining concrete infill around the blind bolt are shown in Figure 4.8. It is
evident that the local concrete crushed not only near the anchor nut but also
along the bolt shank which indicates significant loss of anchorage and bond
for the blind bolts as the connection underwent large rotation.
Graph No. Observations Graph No.Overview of concrete infill (d) Side
(a) crush in after testinLocal concrete crushingaround anchor nut
infill
(b) (e) Remainingcleaning
after
(c) Blind bolts after testing
Figure 4.8 Representative failure mode of concrete infill after striping away
local tube faces (Specimen: BBEC-6.3-8.8-25-LII)
109

Chapter 4: Experimental study-test results
The inspection also shows that the concrete infill in contact with tube sidewall
face cracked into several pieces rather than that in contact with tube
connecting face: This implies that the crushing of concrete infill along
longitudinal direction of the CFT column is more severe than that in transverse
direction, which can be explained by the fact that the blind bolts are controlled
by. the endplate rotation around the transverse rotation axis. The examination
was also made on the blind bolts after removing from the damaged concrete
infill. Other than damage to the local sleeves, no noticeable damages are seen
at the interlocked assembly parts of the blind bolt. This observation agrees
with previous remarks that in the failure mode II relatively large extent of
cracking occurring at the concrete infill with moderate bolt pullout. Moreover,
it seems that the anchorage part of the bolt shank as well as the anchor nut
remains intact after the cyclic loading. This implies no significant damage at
the blind bolt in the anchorage portion.
As this blind bolted endplate connection to CFT column is featured by
cumulative failure development, the photograph series of specimens BBEC-8-
10.9-50-LI and BBEC-5-8.8-50-LII have also been recorded for the joint
response under progressive cyclic loading. A further analysis relating to the
cumulative damage model will be described in chapter 5. The photograph
series plotted herein represent failure modes I and II as follows:
Specimen BBEC-8-10.9-50-LI: this specimen failed in mode I. Due to the
overheating of the pump system at early stage of loading, the cyclic loading
procedure was paused for system adjustment and resumed from the positive
moment direction. As shown in Figure 4.9, the endplate bottom face is in
110

Chapter 4: Experimental study-test results
alignment with the CFT column face during initial loading cycles. Also, the
deformation of blind bolts is not significant. As the rotation becomes
increasingly greater than the yielding rotation capacity of the connection, the
endplate rotates as a rigid body with the blind bolt shank elongation. Finally,
the failure of the connection is observed as a sudden fracture of the bolt shank
at the outer bolt row under negative moment. This failure mode is expected
due to larger lever arm distances from the rotation axis of the connection
under negative moment than that under positive moment, i.e., the failed blind
bolts are subjected to greater tensile force in this case.
Specimen BBEC-5-8.8-50-LII: this specimen failed in mode II. As the
presence of great rotation at the connection, two photographs are displayed at
each point to feature the global view of the connection and localized view of
outer bolt row in tension, as shown in Figure 4.10. Prior to the yielding of the
connection, the rotational response of the connection are seen to be similar
with that of the specimen BBEC-8-10.9-50-LI. A noticeable deformation can
be seen since the connection was loaded at 8-10 cycles. Thereafter, the
rotation of the connection is featured by the consecutive deformation of the
connecting face of the CFT column as well as moderate blind bolt pullout. At
ultimate loading, it is observed that the endplate undergoes significant rotation
while the tube connecting face deforms outwards with moderate blind bolt
pullout.
111
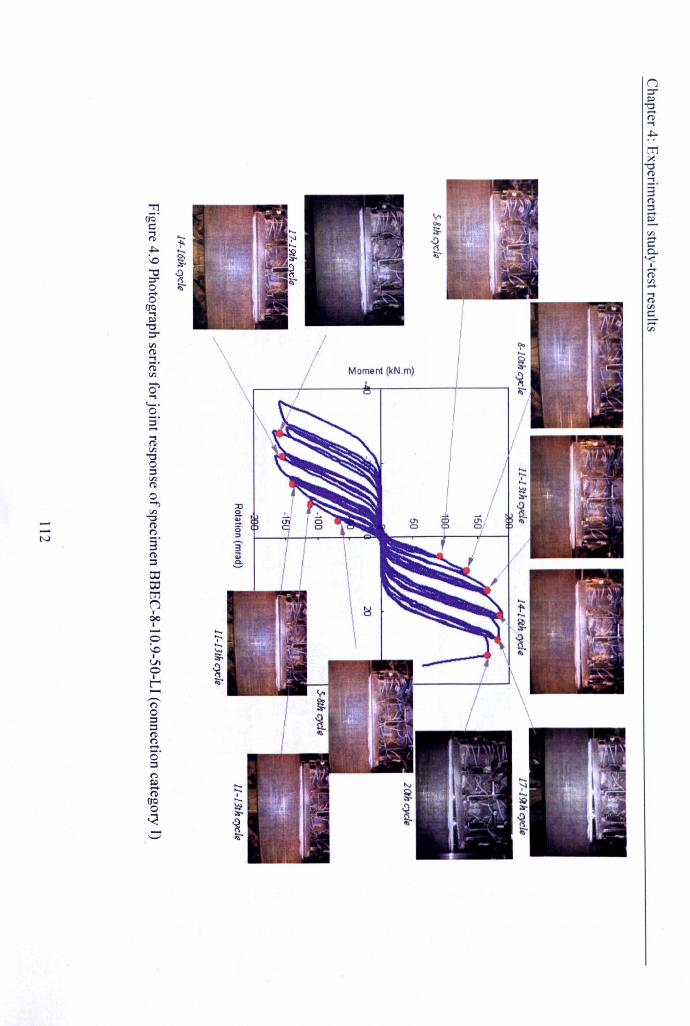
n::r~"0.-+('1)..,,J:>.
m;><"0
'Tj
('1)
oq'
..,
s:::
3'
..,
('1)
('1) '-
:l
;l:>- i'
.-+
'-
~
\0 0-~
'"
" ~
I:
::r
0...
0 .,...-
'<:
0
I.-+
(IQ
('1)
..,VJ
~
.-+
"0
..,
e-
('1)
'"
'"
s:::
('1)
;::::;
..,iii'
'"
'"Ql..,,-,0:;'.......,('1)
'""00:l
'"('1)0....,'""0- ('1)
No3'('1)
:l
o:lo:lmoI00I
s>'-';-
\0 '-I ""VI
;;.0 ~Ir- .,........,-.._rl0==('1)rl.-+
0':lrl~.-+('1)(IQ0~......._
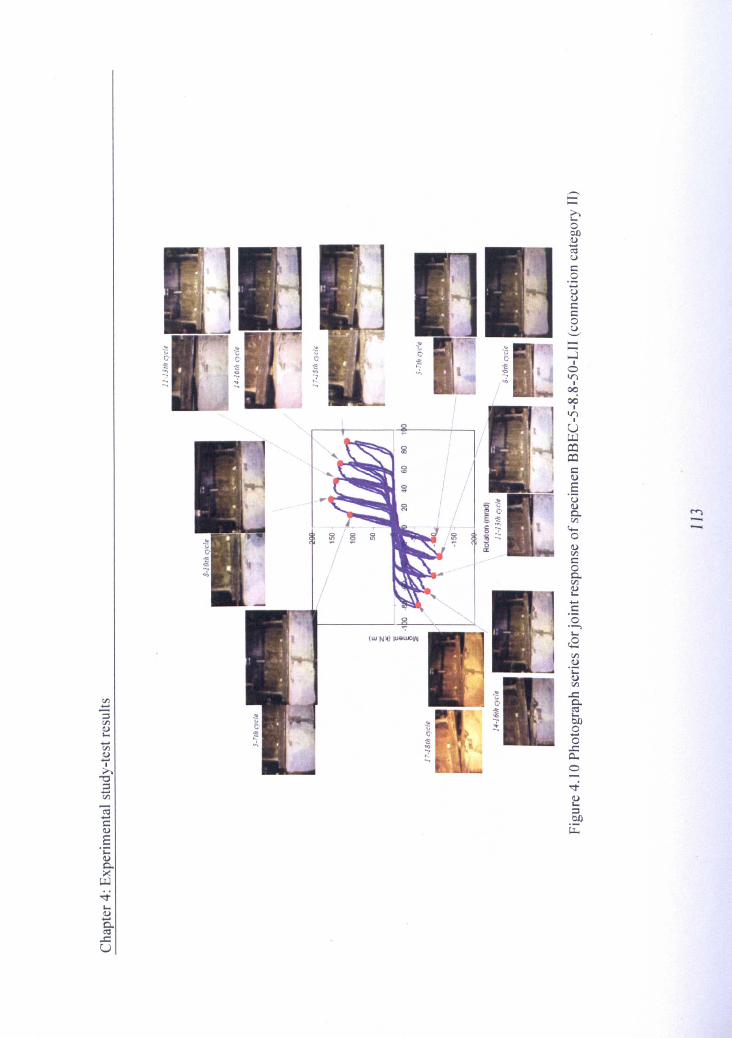
----c000~~~o:::0''::'o~::::::0o'-'--.....J
-;; I
'" 0~ <n
I0000I
V)I
U~COCO:::~.5o~0.. CV)
tn'-'-'0~tn:::00..tn~,_~:::0'--',_..stn~·c~tn
l!l..:::0..
;; ~,_tn I:lO~ 0,_ ~...... 0tn ..:::~ 0.........I 0>-.-0 ..,,:Eltn ~~
,_:l...... .::!l:::~ ~
E·c~0..>(Cl.l
-e-,_~......0..~..:::U
Chapter 4: Experimental study-test results
4.3 Hysteretic moment-rotation relationships
4.3.1 General moment-rotation behaviour
The moment-rotation relationship is the principle means of evaluating and
characterising the behaviour of beam-to-column connections. Based on the
hysteretic moment-rotation relationships, the main characteristics of the
. connection, such as resistance, rotation capacity, and stiffness, can be
evaluated. In this study, the moment-rotation relationships served as a basis
for further assessment of cyclic characteristics and cumulative damage of this
blind bolted endplate connection to CFT column.
The moment and rotation of the connections are calculated from
corresponding load and' displacement data obtained from the test
instrumentations. The calculated results should allow for the geometric and
mechanical characteristics of the test system as discussed previously in
Section 3.3. The test results of moment-rotation relationships are summarized
in Tables 4.1-4.3, which indicate the moment, rotation and stiffness of
hysteresis envelope curves at yield point, maximum moment point and peak
rotation point. The hysteresis envelope herein is taken as the curve of a
generalized relationship that envelopes resp~nse data obtained from cyclic
loading of a structural component or assembly (Deierlein et ai, 2010). Related
failure modes of the connections are also included as a contrast within each
group.
To examine the geometric relationship of linkage system and steel beam
outlined in Section 3.3.2, a comparison was made for the calculated moment
114
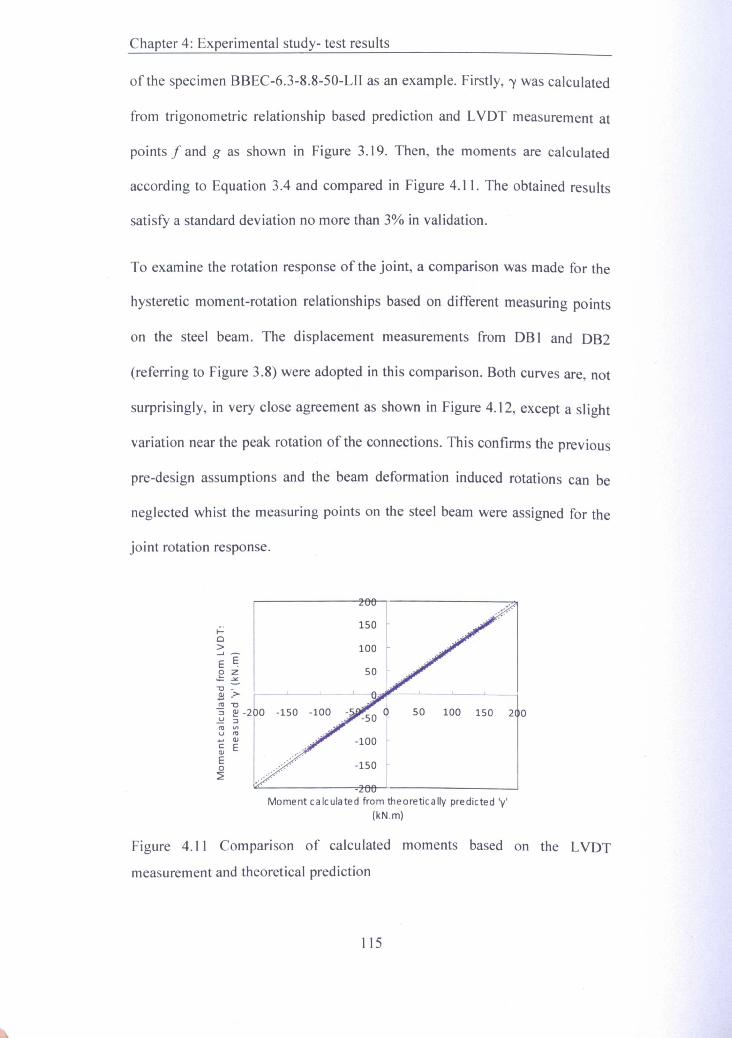
Chapter 4: Experimental study- test results
of the specimen BBEC-6.3-8.8-50-LII as an example. Firstly, "y was calculated
from trigonometric relationship based prediction and LVDT measurement at
points f and g as shown in Figure 3.19. Then, the moments are calculated
according to Equation 3.4 and compared in Figure 4.11. The obtained results
satisfy a standard deviation no more than 3% in validation.
To examine the rotation response of the joint, a comparison was made for the
hysteretic moment-rotation relationships based on different measuring points
on the steel beam. The displacement measurements from DB I and DB2
(referring to Figure 3.8) were adopted in this comparison. Both curves are, not
surprisingly, in very close agreement as shown in Figure 4.12, except a slight
variation near the peak rotation of the connections. This confirms the previous
pre-design assumptions and the beam deformation induced rotations can be
neglected whist the measuring points on the steel beam were assigned for the
joint rotation response.
-150
Moment calculated from theoretically predicted 'v'(kN.m)
Figure 4.11 Comparison of calculated moments based on the LVDT
measurement and theoretical prediction
115
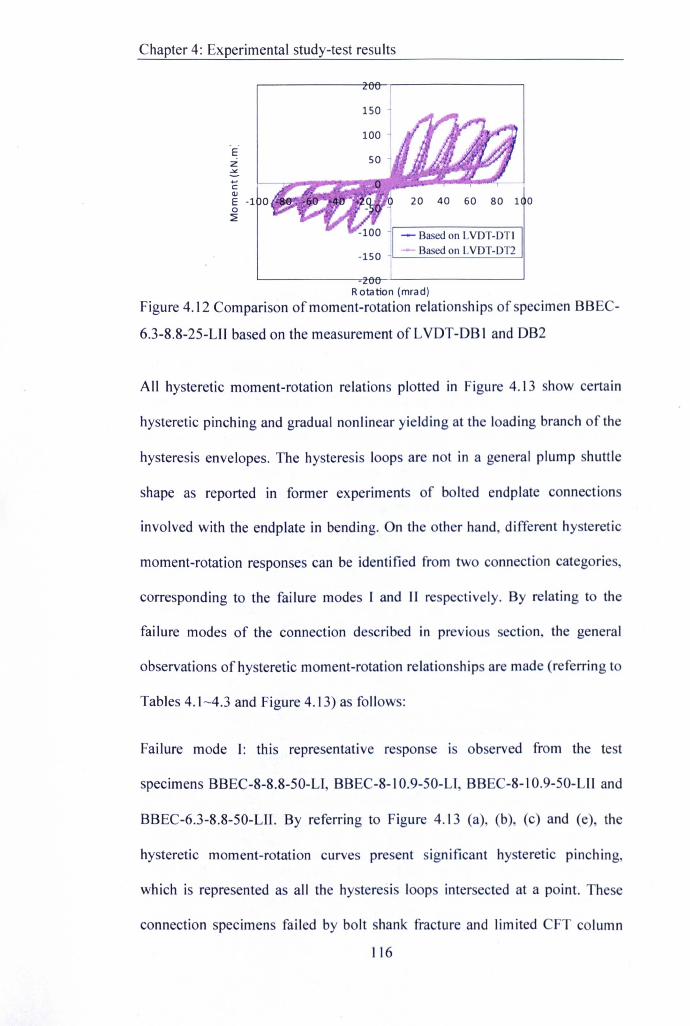
Chapter 4: Experimental study-test results
Ez::::.
40 60 80 1 0
- Based on LVDT-DTI-- Based on LVDT-DT2-150
Rotation (mrad)
Figure 4.12 Comparison of moment-rotation relationships of specimen BBEC-
6.3-8.8-25-UI based on the measurement ofLVDT-DBI and DB2
All hysteretic moment-rotation relations plotted in Figure 4.13 show certain
hysteretic pinching and gradual nonlinear yielding at the loading branch of the
hysteresis envelopes. The hysteresis loops are not in a general plump shuttle
shape as reported in former experiments of bolted endplate connections
involved with the endplate in bending. On the other hand, different hysteretic
moment-rotation responses can be identified from two connection categories,
corresponding to the failure modes I and II respectively. By relating to the
failure modes of the connection described in previous section, the general
observations of hysteretic moment-rotation relationships are made (referring to
Tables 4.1 ~4.3 and Figure 4.13) as follows:
Failure mode I: this representative response is observed from the test
specimens BBEC-8-8.8-50-Ll, BBEC-8-10.9-50-LI, BBEC-8-10.9-50-LII and
BBEC-6.3-8.8-50-LIl. By referring to Figure 4.13 (a), (b), (c) and (e), the
hysteretic moment-rotation curves present significant hysteretic pinching,
which is represented as all the hysteresis loops intersected at a point. These
connection specimens failed by bolt shank fracture and limited CFT column
116
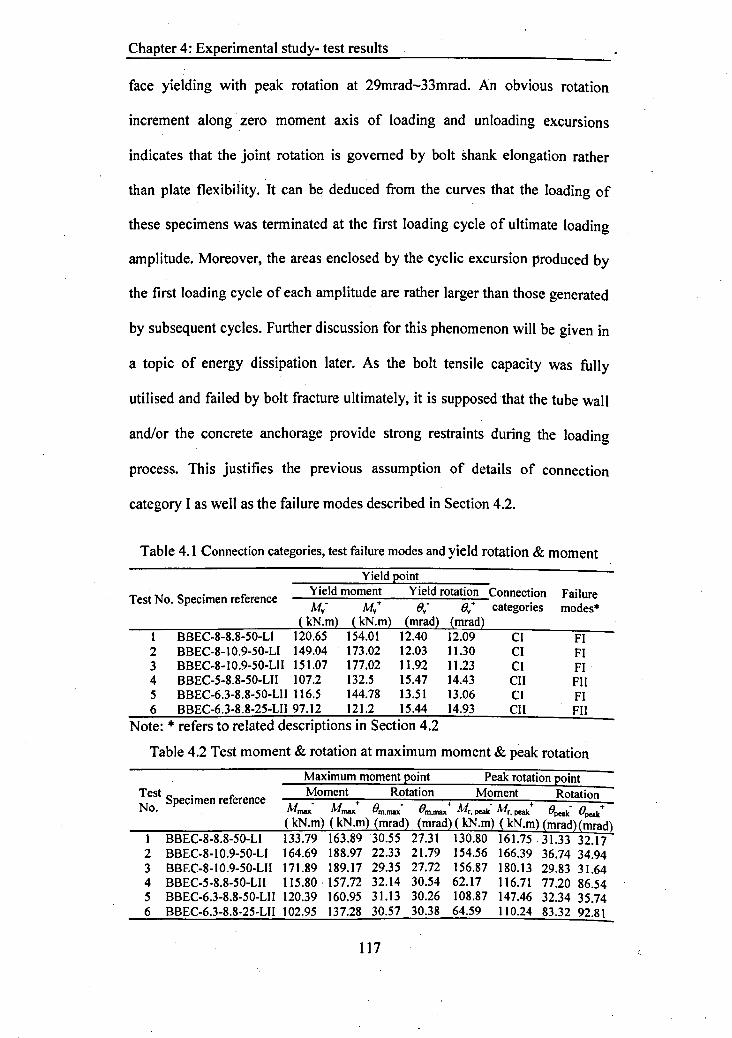
Chapter 4: Experimental study- test results
face yielding with peak rotation at 29mrad-33mrad. An obvious rotation
increment along' zero moment axis of loading and unloading excursions
indicates that the joint rotation is governed by bolt shank elongation rather
than plate flexibility, 'It can be deduced from the curves that the loading of
these specimens was terminated at the first loading cycle of ultimate loading
amplitude. Moreover, the areas enclosed by the cyclic excursion produced by
the first loading cycle of each amplitude are rather larger than those generated
by subsequent cycles. Further discussion for this phenomenon will be given in
a topic of energy dissipation later. As the bolt tensile capacity was fully
utilised and failed by bolt fracture ultimately, it is supposed that the tube wall
and/or the concrete anchorage provide strong restraints during the loading
process. This justifies the previous assumption of details of connection
category I as well as the failure modes described in Section 4.2.
Table 4.1 Connection categories, test failure modes and yield rotation & moment
Yield Eoint
Test No. Specimen referenceYield moment Yield rotation Connection FailureM- M+ 8,,- 0.+ categories modes=v v v
( kN_m) (kN.m) (mrad) (mrad)I BBEC-8-8.8-50-LI 120.65 154.01 12.40 12.09 Cl FI2 BBEC-8-10.9-50-LI 149.04 173.02 12.03 11.30 Cl FI3 BBEC-8-10.9-50-LII 151.07 177.02 11.92 11.23 Cl FI4 BBEC-5-8.S-50-LlI 107.2 132.5 15.47 14.43 CII FII5 BBEC-6.3-8.8-50-LII 116.5 144.78 13.51 13.06 Cl FI6 BBEC-6.3-S.S-25-LII 97.12 121.2 15.44 14.93 CII FII
Note: • refers to related descriptions in Section 4.2
Table 4.2 Test moment & rotation at maximum moment & peak rotation
Maximum moment Eoint Peak rotation point
NTestSpecimen reference Moment Rotation Moment Rotation
M . M + 0. . - 0. +M 'M + (J. +O. max max m.max m.max r, peak r, peak peak- 8peak
( kN.m) (kN.m) (mrad) (mrad) (kN.m) ( kN.m) (mrad)(mradlI BBEC-S-S.S-50-LI 133.79 163.S9 30.55 27.31 130.80 161.75.31.33 32.172 BBEC-S-IO.9-50-LI 164.69 188.97 22.33 21.79 154.56 166.39 36.74 34.943 BBEC-S-IO.9-50-LII 171.S9 189.17 29.35 27.72 156.87 IS0.13 29.S3 31.644 BBEC-5-S.S-50-LII 115.S0 . 157.72 32.14 30.54 62.17 116.71 77.20 S6.545 BBEC-6.3-S.S-50-LlI 120.39 160.95 31.13 30.26 10S.S7 147.46 32.34 35.746 BBEC-6.3-S.8-25-LII 102.95 137.28 30.57 30.38 64.59 110.24 83.32 92.81
117
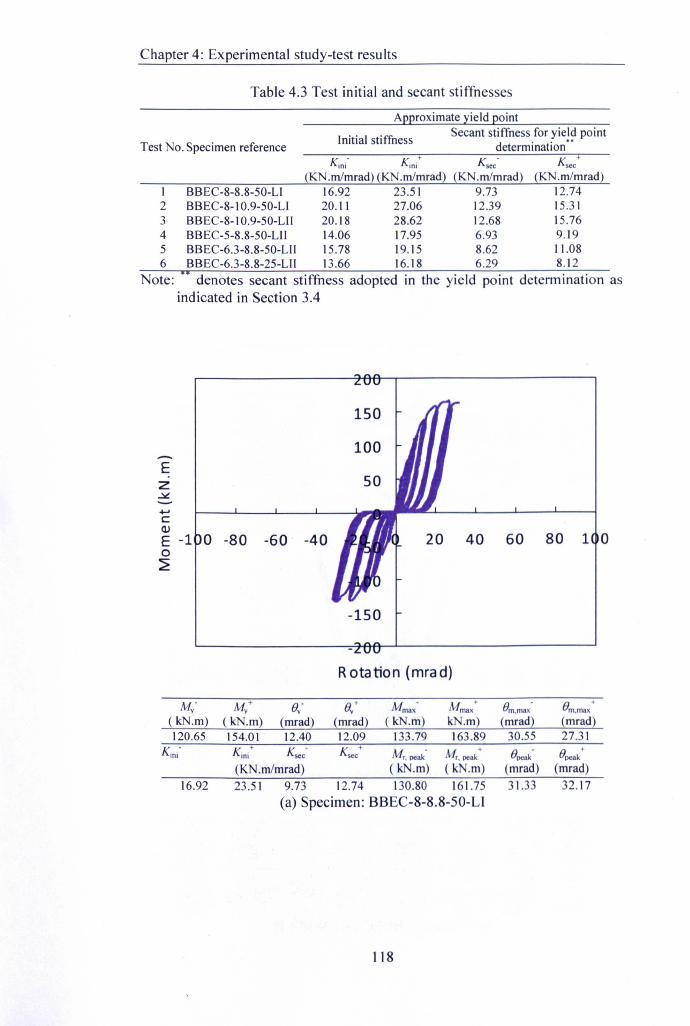
Chapter 4: Experimental study-test results
Table 4.3 Test initial and secant stiffnesses
Approximate yield point
Initial stiffness Secant stiffness for yield pointdetermination ..Test No. Specimen reference
Kini• Kini+ Ksec·
(KN.m1mrad) (KN.mlmrad) (KN.m1mrad)Ksec+
(KN.m/mrad)123456
16.92 23.51 9.7320.11 27.06 12.3920.18 28.62 12.6814.06 17.95 6.9315.78 19.15 8.6213.66 16.18 6.29
12.7415.3115.769.1911.088.12
BBEC-8-8.8-50-LJBBEC-8-10.9-50-LJBBEC-8-10.9-50-LJlBBEC-5-8.8-50-LIIBBEC-6.3-8.8-50-LIIBBEC-6.3-8.8-25-LJ1
Note: denotes secant stiffness adopted in the yield point determination asindicated in Section 3.4
Ez~.......cQ)
E -1 0 -80 -60 -40o~
40 60 80 1 0
-150
Rotation (mra d)
M· M+ e: e.+ Mm.,; Mmax+ em•max em•max+
V V V V
( kN.m) ( kN.m) {rnrad) {mrad} ( kN.m) kN.m) {mrad~ {mrad~120.65 154.D1 12.40 12.09 133.79 163.89 30.55 27.31
Kini• Kini+ Ksec· Ksec+
Mr. peak Mr. peak+
epeak.
epeak+
(KN.mlmrad) ( kN.m) ( kN.m) (mrad) (mrad)16.92 23.51 9.73 12.74 130.80 161.75 31.33 32.17
(a) Specimen: BBEC-8-8.8-50-Ll
118
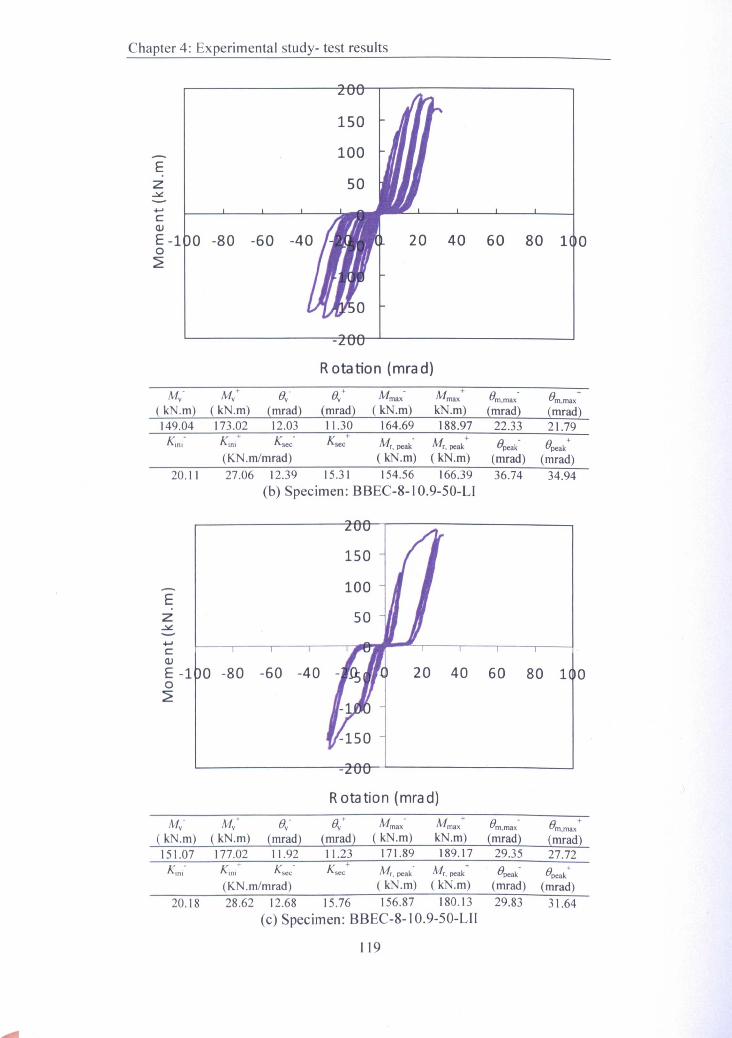
Chapter 4: Experimental study- test results
Ez..::.!
40 60 80 1 0
.....CQ.J
E -1o~
Rotation (mrad)M- M+ e,- e,+ u.: Mmax
+Bm.max- Bm.max
+v v v v
( kN.m) ( kN.m) {mrad2 {mrad2 ( kN.m) kN.m) {mrad} {mrad}149.04 173.02 12.03 11.30 164.69 188.97 22.33 21.79«; x.: x.; x.;+ Mr. peak+ +Mr. peak Bpeak· Bpeak
(KN.m/mrad) ( kN.m) ( kN.m) (mrad) (mrad)20.11 27.06 12.39 15.31 154.56 166.39 36.74 34.94
(b) Specimen: BBEC-8-1 O.9-50-LI
40 60 80 1 0
Ez..::.!
.....CQ.J
E -1 0 -80 -60 -40o~
Rotation (mrad)M· M+ e,. e,+ u.; u.:+
Bm•max- Bm•max+
v v v v( kN.m) ( kN.m) {mrad} {mrad} ( kN.m) kN.m) {mrad} {mrad}151.07 177.02 11.92 11.23 171.89 189.17 29.35 27.72s.: Kini+ x.; x.; + Mr. peak Mr. peak
+ Bpeak·+
Bpeak(KN.m1mrad) ( kN.m) ( kN.m) (mrad) (mrad)
20.18 28.62 12.68 15.76 156.87 180.13 29.83 31.64(C) Specimen: BBEC-8-10.9-50-LJl
119
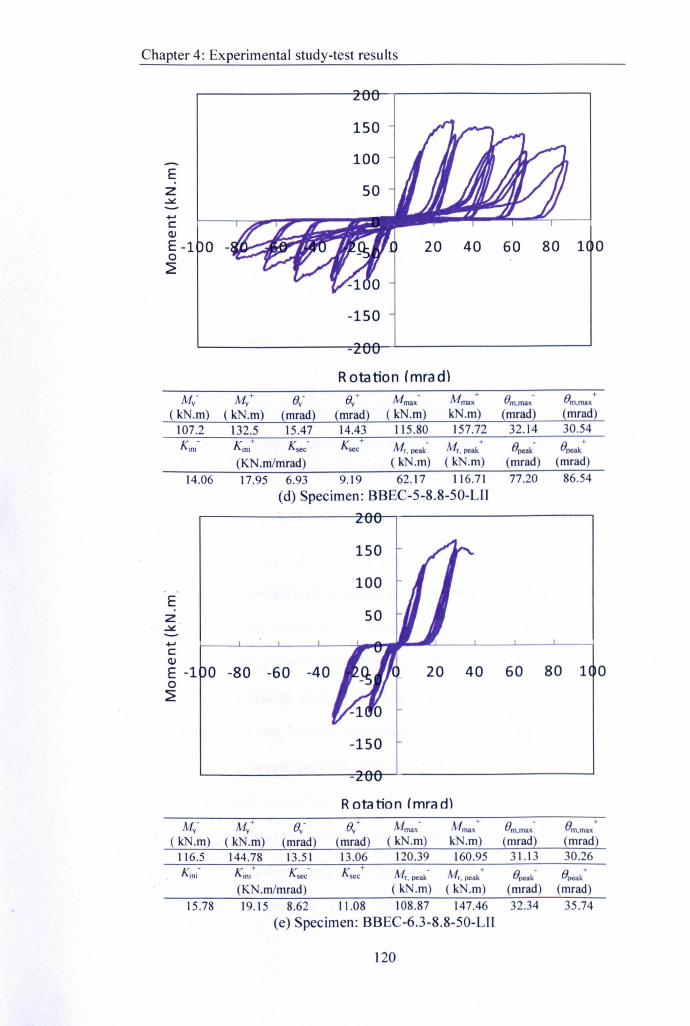
Chapter 4: Experimental study-test results
Ez~+-'c:QJ
E -1 0 1 00~
Rotation (mradlM- M+ 8,- (J.+ Mmax- u.:+ 8m.max- 8m•max
+y y y y
( kN.m) ( kN.m) {mrad) (mrad) ( kN.m) kN.m) {mrad) (mrad)107.2 132.5 15.47 14.43 115.80 157.72 32.14 30.54Kini- Kini+ Ksec- Ksec
+Mr. peak Mr. peak+ Opeak- Bpeak
+
(KN.mlmrad) ( kN.m) ( kN.m) (mrad) (mrad)14.06 17.95 6.93 9.19 62.17 116.71 77.20 86.54
(d) Specimen: BBEC-5-8.8-50-L11
+-'c:QJE -1 0 -80 -60 -40os
Ez~
60 80 1 0
Rotation (rnra dlM- M+ (J.- (J.+ Mmax- u.:+ Om.ma; Om.max
+y y y y
( kN.m) ( kN.m) (mrad) (mrad) ( kN.m) kN.m) {mrad2 (mrad)116.5 144.78 13.51 13.06 120.39 160.95 31.13 30.26Kini- Kini+ «.; «:+ Mr. peak- Mr. peak+ +
Opeak- Opeak
(KN.mlmrad) ( kN.m) ( kN.m) (mrad) (mrad)15.78 19.15 8.62 11.08 108.87 147.46 32.34 35.74
(e) Specimen: BBEC-6.3-8.8-50-UI
-150
120
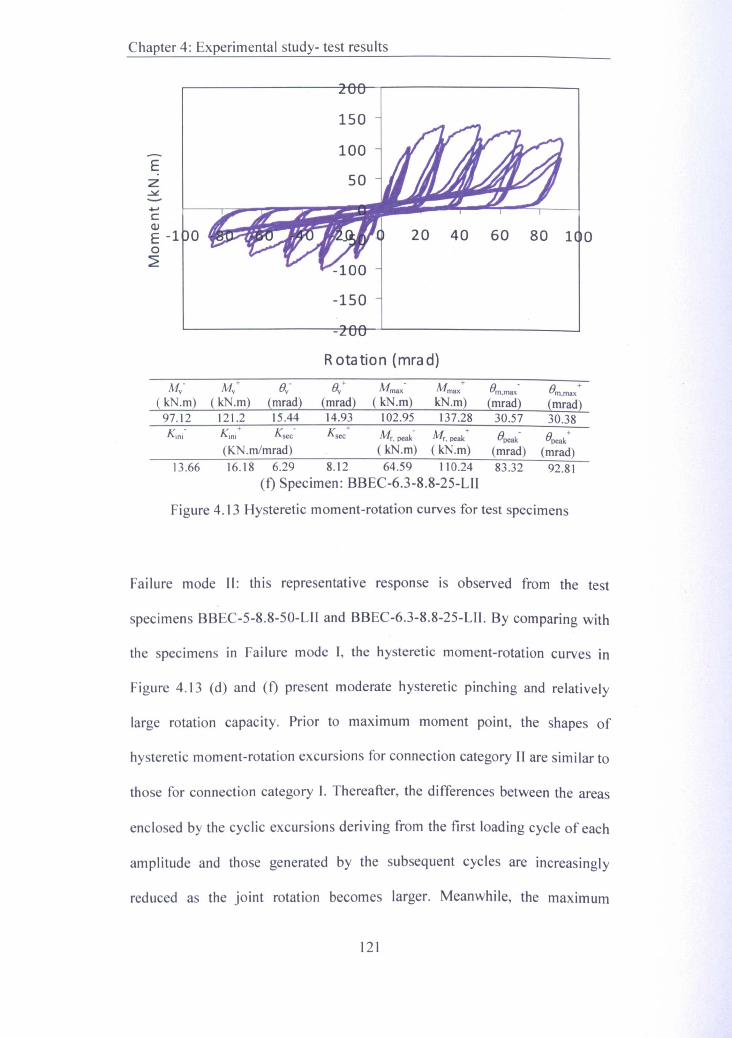
Chapter 4: Experimental study- test results
Ez..:.t.
......cQ)
E -1 0o~
-150
1 0
Rotation (mra d)
M- M+ 8,- 8,+ Mma,- Mmax + 8m_max
-8m.max
+v v v v
( kN.m) ( kN.m~ {mrad} {mrad) ( kN.m) kN.m) {mrad} {mrad)97.12 121.2 15.44 14.93 102.95 137.28 30.57 30.38Kmi- K
lnl+ Ksec «;+ Mr. peak- Mr. peak+ +8peak- 8peak
(KN.mlmrad) (kN.m) ( kN.m) (mrad) (mrad)13.66 16.18 6.29 8.12 64.59 110.24 83.32 92.81
(t) Specimen: BBEC-6.3-8.8-25-LII
Figure 4.13 Hysteretic moment-rotation curves for test specimens
Failure mode II: this representative response is observed from the test
specimens BBEC-5-8.S-50-LlI and BBEC-6.3-S.8-25-LII. By comparing with
the specimens in Failure mode I, the hysteretic moment-rotation curves in
Figure 4.13 (d) and (t) present moderate hysteretic pinching and relatively
large rotation capacity. Prior to maximum moment point, the shapes of
hysteretic moment-rotation excursions for connection category II are similar to
those for connection category 1. Thereafter, the differences between the areas
enclosed by the cyclic excursions deriving from the first loading cycle of each
amplitude and those generated by the subsequent cycles are increasingly
reduced as the joint rotation becomes larger. Meanwhile, the maximum
121
Chapter 4: Experimental study-test results
moments of the excursions within given loading amplitude are reduced
significantly from the first cycle to the subsequent cycles which can be
explained as the result of consecutive concrete deterioration. It is also
observed that the unloading cyclic excursions in the specimens of connection
category II have a short branch along the zero moment axis (horizontal
branch). but deviate with small inclined angle from the horizontal afterwards
(inclined branch). Based on the experimental observation, the short horizontal
branch and further longer inclined branch can be attributed to the
consequences of bolt shank elongation and the CFT column face flexible
deformation respectively. For this reason, the brittle fracture of the bolt shank
is avoided with an adding contribution of the tube connecting face in bending.
Notwithstanding that, it is worthy of note that the local crack in the sleeves
with bolt pullout could take place at this stage.
To further study the influences of material, geometric configuration and
loading procedure on the cyclic responses of this blind bolted endplate
connection to CFT column, a series of comparisons were made for the
experimental hysteretic moment-rotation relationships and counterpart
envelope curves. Based on the experimental observations, related comments
and explanations for these influences on the cyclic behaviour of the
connections will be presented as below.
122
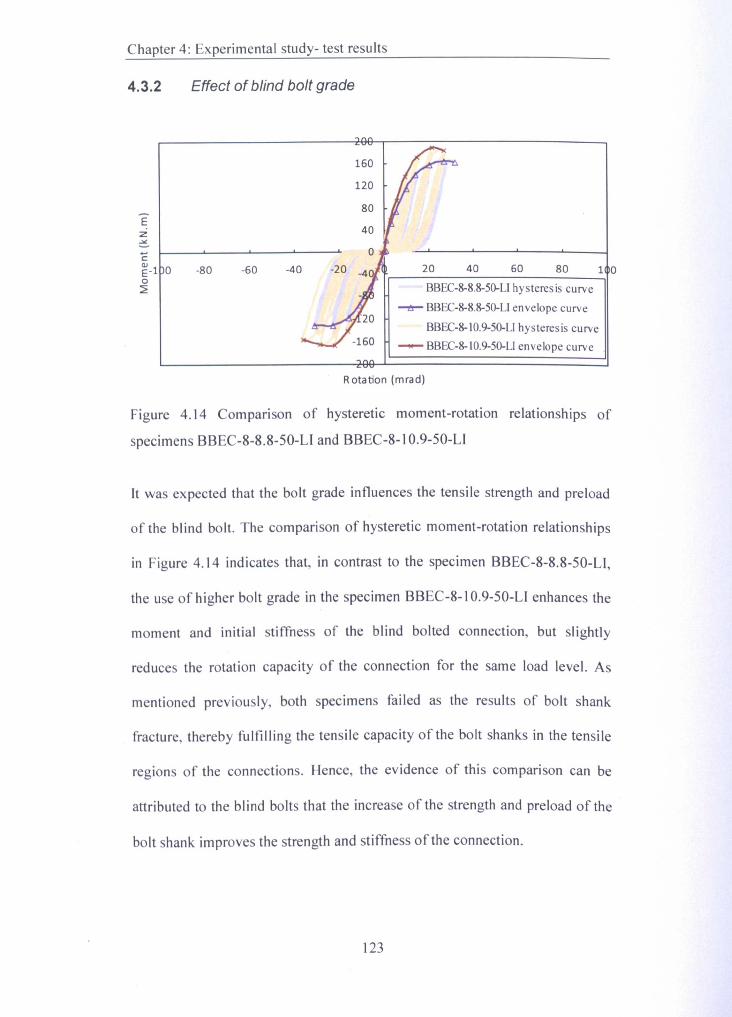
Chapter 4: Experimental study- test results
4.3.2 Effect of blind bolt grade
-80 -40
+-'C
e-1 0o~
-60 -20 20 40 60 80 1 0
Ez.><
BBEC-8-8.8-50-U hysteresis curve-,!r- BBEC-8-8.8-50-Ll envelope curve
BBEC-8-10.9-50-U hysteresis curve- BBEC-8-10.9-50-U envelope curve
Rotation (mrad)
Figure 4.14 Comparison of hysteretic moment-rotation relationships of
specimens BBEC-S-S.S-50-Ll and BBEC-8-1 O_9-50-LI
It was expected that the bolt grade influences the tensile strength and preload
of the blind bolt. The comparison of hysteretic moment-rotation relationships
in Figure 4.14 indicates that, in contrast to the specimen BBEC-S-8.S-50-LI,
the use of higher bolt grade in the specimen BBEC-8-IO.9-50-LI enhances the
moment and initial stiffness of the blind bolted connection, but slightly
reduces the rotation capacity of the connection for the same load level. As
mentioned previously, both specimens failed as the results of bolt shank
fracture, thereby fulfilling the tensile capacity of the bolt shanks in the tensile
regions of the connections. Hence, the evidence of this comparison can be
attributed to the blind bolts that the increase of the strength and preload of the
bolt shank improves the strength and stiffness of the connection.
123
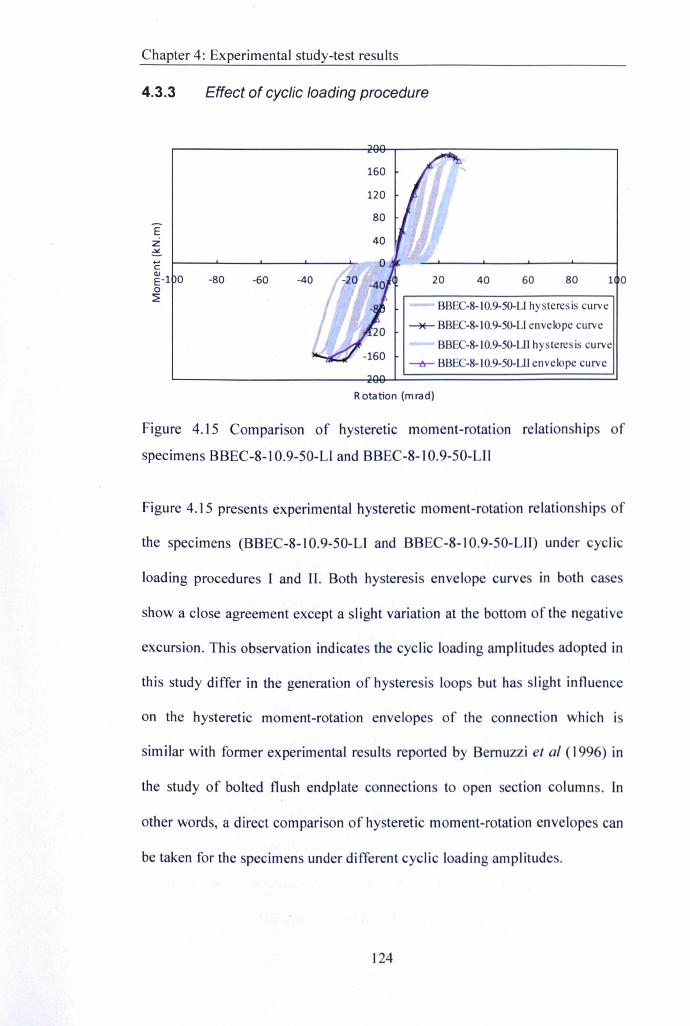
Chapter 4: Experimental study-test results
4.3.3 Effect of cyclic loading procedure
-80 -60 -40
Ez~....c::
E-l 0o~
40 60 80 1 0
BBEC-S-IO.9-50-LI hysteresis curve~ BBEC·S·IO.9-50-LI envelope curve
BBEC·S-IO.9-50-LII hysteresis curve-tr- BBEC·S-IO.9-50-LlI envelope curve
Rotation (mrad)
Figure 4.15 Comparison of hysteretic moment-rotation relationships of
specimens BBEC-8-10.9-50-L1 and BBEC-8-IO.9-50-L11
Figure 4.15 presents experimental hysteretic moment-rotation relationships of
the specimens (BBEC-8-IO.9-50-L1 and BBEC-8-10.9-50-LII) under cyclic
loading procedures I and II. Both hysteresis envelope curves in both cases
show a close agreement except a si ight variation at the bottom of the negative
excursion. This observation indicates the cyclic loading amplitudes adopted in
this study differ in the generation of hysteresis loops but has slight influence
on the hysteretic moment-rotation envelopes of the connection which is
sim ilar with former experimental results reported by Bernuzzi et al (1996) in
the study of bolted flush endplate connections to open section columns. In
other words, a direct comparison of hysteretic moment-rotation envelopes can
be taken for the specimens under different cyclic loading amplitudes.
124
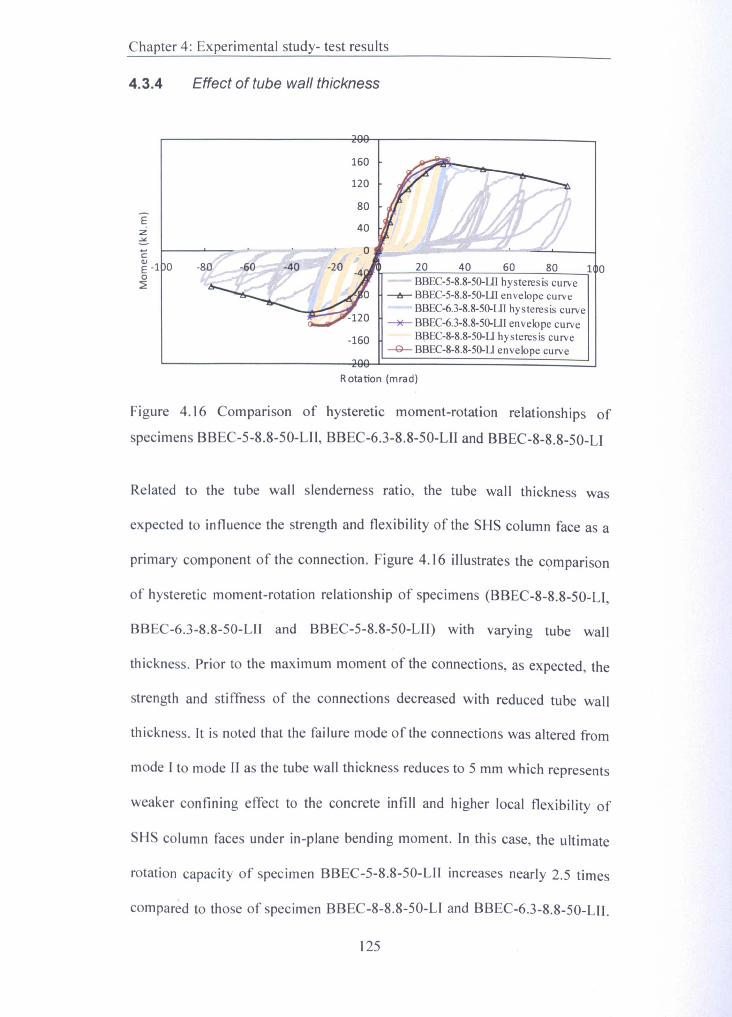
Chapter 4: Experimental study- test results
4.3.4 Effect of tube wall thickness
160
120
Ez~cE -1 0o~
-40 -20 ~ __ ~2~0~ __ ~40~ __ ~6~0__ ~8~0 __ -;1 0-80- BBEC-5-S.S-50-LIIhysteresis curve
~ BBEC-5-S.S-50-Lllenvelope curveBBEC-6.3-S.S-50-LIIhysteresis curve
~ BBEC-6.3-S.S-50-LIIenvelope curveB~EC-S-S.S-50-LIhysteres is curve
--G- BBEC-S-S.S-50-LIenvelope curve-160
Rotation (mrad)
Figure 4.16 Comparison of hysteretic moment-rotation relationships of
specimens BBEC-5-S.S-50-LII, BBEC-6.3-S.S-50-LII and BBEC-S-8.S-50-LI
Related to the tube wall slenderness ratio, the tube wall thickness was
expected to influence the strength and flexibility of the SHS column face as a
primary component of the connection. Figure 4.16 illustrates the comparison
of hysteretic moment-rotation relationship of specimens (BBEC-S-S.S-50-LI,
BBEC-6.3-S.8-50-LlI and BBEC-5-8.S-50-LII) with varying tube wall
thickness. Prior to the maximum moment of the connections, as expected, the
strength and stiffness of the connections decreased with reduced tube wall
thickness. It is noted that the failure mode of the connections was altered from
mode I to mode II as the tube wall thickness reduces to 5 mm which represents
weaker confining effect to the concrete infill and higher local flexibility of
SHS column faces under in-plane bending moment. In this case, the ultimate
rotation capacity of specimen BBEC-5-S.8-50-L11 increases nearly 2.5 times
compared to those of specimen BBEC-S-S.S-50-LI and BBEC-6.3-S.8-50-UI.
125
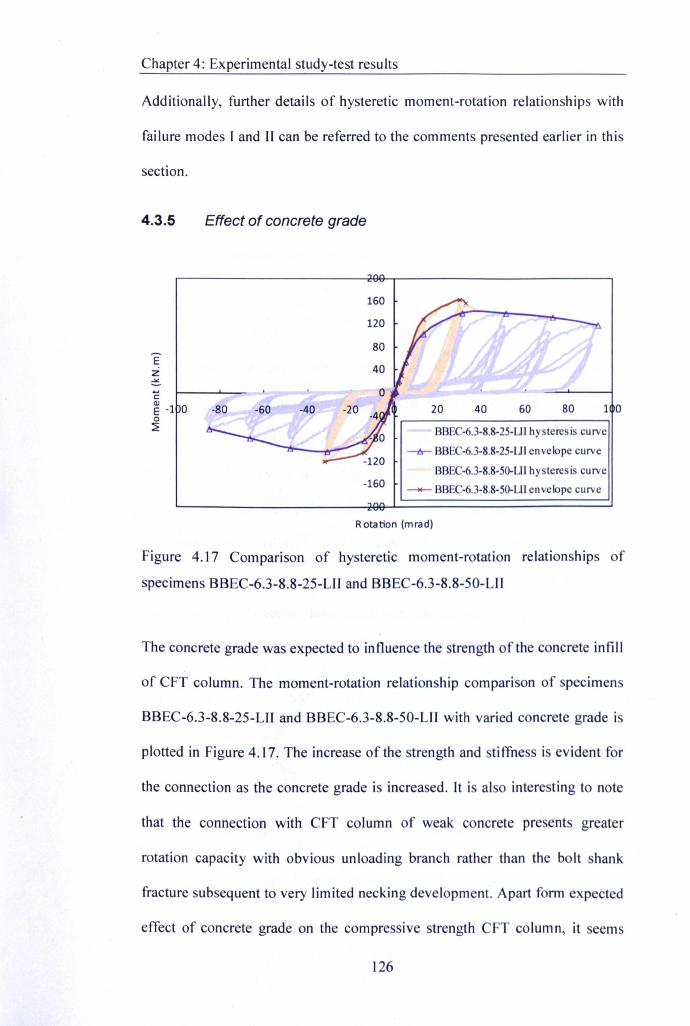
Chapter 4: Experimental study-test results
Additionally, further details of hysteretic moment-rotation relationships with
failure modes [ and IIcan be referred to the comments presented earlier in this
section.
4.3.5 Effect of concrete grade
...co
E -1 0o~
160
120
-80 -60 -40 -20 20 40 60 1 0
E:Z..><
BBEC-6.3-8.8-25-LIJ hysteresis curve-6- BBEC-6.3-8.8-25-L11envelope curve
BBEC-6.3-8.8-50-LIJ hysteresis curvc- BBEC-6.3-8.8-50-LI1envelope curve-160
Rotation (mrad)
Figure 4.17 Comparison of hysteretic moment-rotation relationships of
specimens BBEC-6.3-8.8-2S-LlI and BBEC-6.3-8.8-S0-LII
The concrete grade was expected to influence the strength of the concrete infill
of CFT column. The moment-rotation relationship comparison of specimens
BBEC-6.3-8.8-2S-LII and BBEC-6.3-8.8-S0-LII with varied concrete grade is
plotted in Figure 4.17. The increase of the strength and stiffness is evident for
the connection as the concrete grade is increased. It is also interesting to note
that the connection with CFT column of weak concrete presents greater
rotation capacity with obvious unloading branch rather than the bolt shank
fracture subsequent to very limited necking development. Apart form expected
effect of concrete grade on the compressive strength CFT column, it seems
126
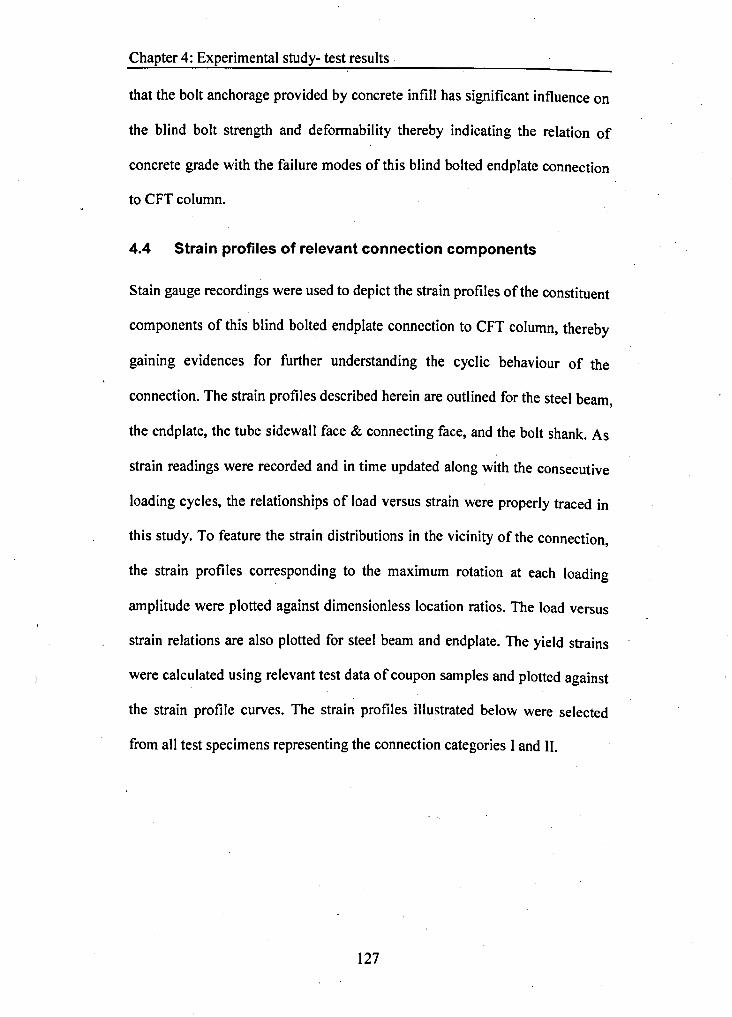
Chapter 4: Experimental study- test results
that the bolt anchorage provided by concrete infill has significant influence on
the blind bolt strength and deformability thereby indicating the relation of
concrete grade with the failure modes of this blind bolted endplate connection
to CFT column.
4.4 Strain profiles of relevant connection components
Stain gauge recordings were used to depict the strain profiles of the constituent
components of this blind bolted endplate connection to CFT column, thereby
gaining evidences for further understanding the cyclic behaviour of the
connection. The strain profiles described herein are outlined for the steel beam,
the endplate, the tube sidewall face & connecting face, and the bolt shank. As
strain readings were recorded and in time updated along with the consecutive
loading cycles, the relationships of load versus strain were properly traced in
this study. To feature the strain distributions in the vicinity of the connection,
the strain profiles corresponding to the maximum rotation at each loading
amplitude were plotted against dimensionless location ratios. The load versus
strain relations are also plotted for steel beam and end plate. The yield strains
were calculated using relevant test data of coupon samples and plotted against
the strain profile curves. The strain profiles illustrated below were selected
from all test specimens representing the connection categories I and II.
127
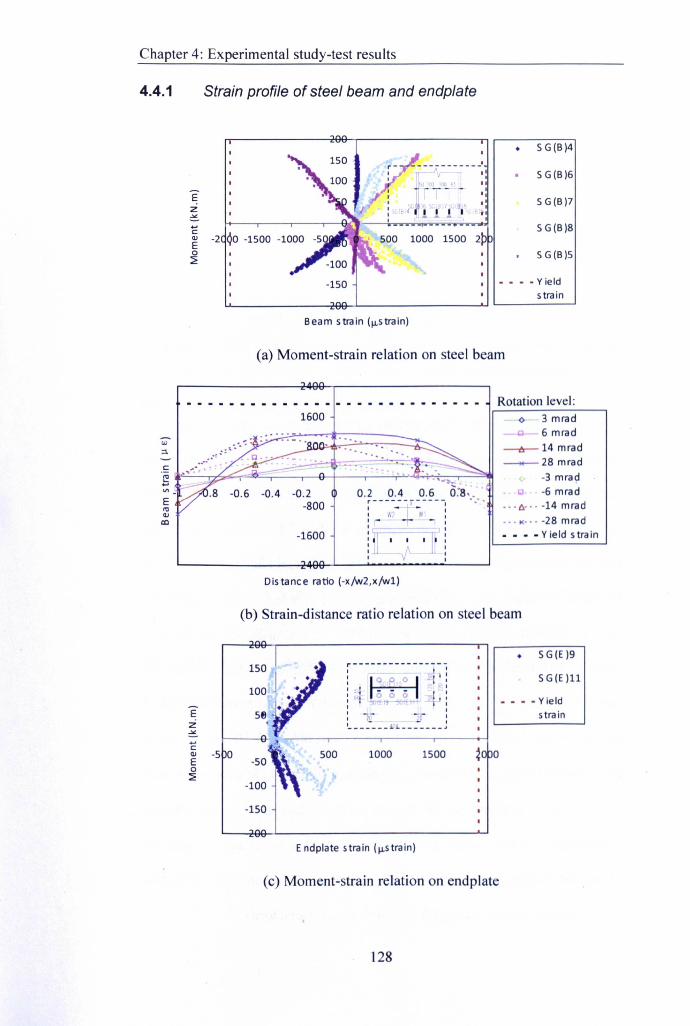
Chapter 4: Experimental study-test results
4.4.1 Strain profile of steel beam and endplate
....c:E -2 ¢o -1500o~
Ez
-150
Beam strain (f,l.strain)
(a) Moment-strain relation on steel beam
1600
E'"OJco
c:g ~~-n~~~~~--'-~4----'--~~~~~~~~OJ> 0.2 0.4
r------X'-----.
: W?- WI I:r iIIIII
-1600
EZ~....cE -5 0o~
Distance ratio (-x/w2,x/w1)
(b) Strain-distance ratio relation on steel beam
1S0V·100 ••
•58..t-------i:h
1000 1500500
Endplate strain (f,l.strain)
(c) Moment-strain relation on endplate
128
- - - - Yieldstrain
• SG(B)4
SG(B)6
SG(B)7
SG(B)8
S G(B)S
Rotation level:o 3 mrad~ 6 mrad
--tr-14 mrad__ 28 mrad
-3 mradIJ -6 mrad
---l:J.--- -14 mrad---I(----28mrad- ••• Yield strain
• SG(E)9
S G(E)l1
• - - - Yieldstra in
~O 0

Chapter 4: Experimental study- test results
">,(\(\
GJ- -6 mrad
1600 o 3 mrad----i+-- 6 m rad--&--14 mrad__ 28 mrad
-3 mrad
800
Rotation level:
-O_B -0.6 -0.4 -0.2-BOO
0.2 0.4 0.6 O.B,-----------,I ~ I
, W2 I WI 'I r==-r==-l I:1 0 0 0 rt _ _ _ I
: 0 0 0 I:
00_6, __ • -14 mrad
00 .>Coo• -28 mrad
- - - - Yield strain-1600
Distance ratio (-x/w2,x/w1)
(d) Strain-distance ratio relation on endplate
Figure 4.18 Representative beam & endplate strain profile of BBEC-6.3-8.8-
50- L11(connection category I)
As mentioned earlier, the strain gauges on the steel beam and endplate were
used to examine the contribution of these components to the joint response.
The single strain gauges for steel beam were mounted at 50mm from welded
surface of the endplate. This arrangement was considered according to the
classical beam bending theory to allow for the maximum longitudinal strain on
the cantilever beam. The strain results are plotted in moment-strain and strain-
distance ratio relations. The comparison of the strain distributions on the steel
beam of BBEC-6.3-S.S-50-LlI and BBEC-6.3-S.8-25-LII, which feature the
connection category I and II respectively, shows that maximum beam strains
during the full loading history are no more than 60% and 50% of the yield
strain level (1922~l E) respectively, as shown in Figure 4.18(a&b) and Figure
4.19 (a&b). It implies that the beams in both cases are not the obvious
contributors for the overall joint deformation. This result agrees with the
connection design assumptions that the beams in both connection categories
were in elastic state as the connections underwent cyclic loads.
129
Chapter 4: Experimental study-test results
The moment-strain relations are shown in Figure 4.18(a) and Figure 4.19(a).
The strain distribution on the steel beam is expected as follows. Whist the
outer and middle bolt rows are in tension, the corresponding steel beam web
regions are obviously strained. It can be seen that similar strain gauge readings
of SG(B)6&SG(B)7 and SG(B)7&SG(B)8 are around 1000Jlstrain when the
joints are subjected to negative and positive bending moments respectively. In
contrast, the strains of the steel beam web near the compression flange are
much lower (roughly between 350-:550Jlstrain). As for the beam flange, the
compression counterparts have significant negative strain recordings while the
opposite counterparts are slightly strained, such as SG(B)4 and SG(B)5 for
negative bending moments.
The comparison between Figure 4.l8(a&b) and Figure 4.l9(a&b) shows that .
the maximum beam strains under tension and compression measured for the
specimens of connection category I are higher than those of the connection
category II. This is in agreement with the moment ratios of the connection to
that of the beam, Le. 0.29 and 0.25 for specimens BBEC-6.3-8.8-50-LII and
BBEC-6.3-8.8-25-LII respectively (the bending moment of the beam is
transmitted by the tension flange).
130
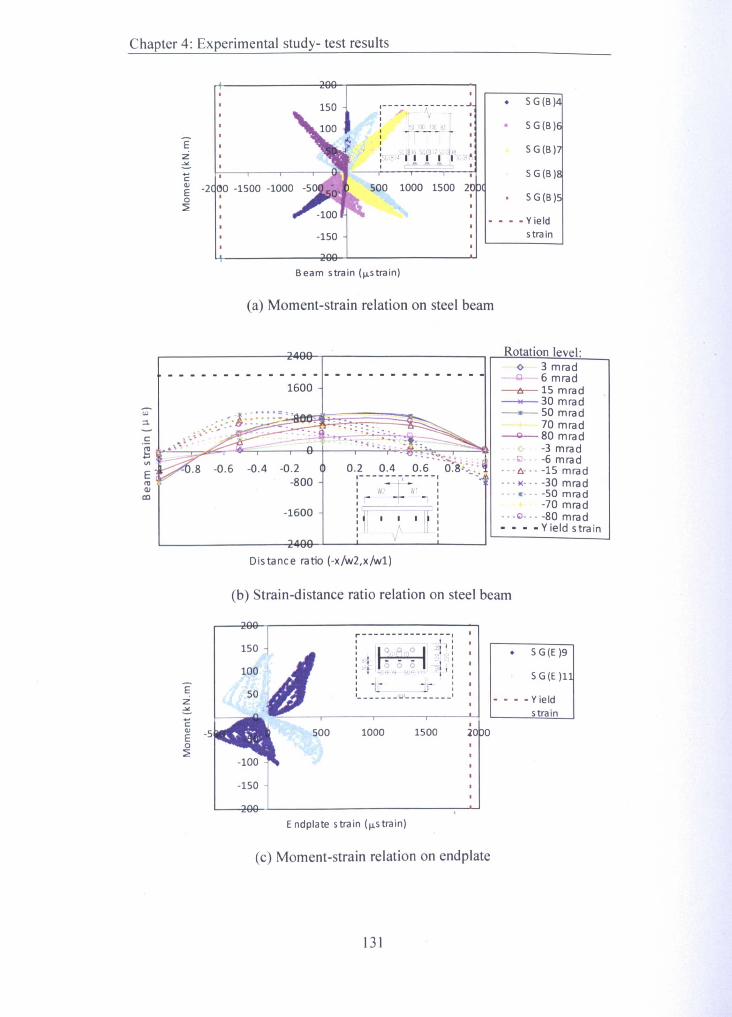
Chapter 4: Experimental study- test results
E
20I
150
....c:E -2 DO-1500 -1000o I
~
Beam strain (....strain)
(a) Moment-strain relation on steel beam
1600
.. ,. ,,_:_:=,= .::-:&: : :~:: :~: : '~;S:;.:F.:::~:::==:-.. ~~£ ,..... . ... ,';:"'~~~~~~~~~---r~~----~~~~~~~~~~~VI
EIII ..Q)cc
-1600
Distance ratio (-x/w2,x/w1)
• SG(B)
5 G(B)
SG(B)
5 G(B)5
- - - - Yieldstrain
Rotation level:c 3 mrad
---Q-6 mrad-tr--15 mrad---30 mrad----- SO mrad--+- - 70 mrad--Q-- 80 mrad
-3 mrad• !;J.. -6 mrad
"'1.>.'" -15 mrad'-·K··· -30mrad··· ..···-50mrad
-70 mrad... (;)... -80 mrad- - - - Yield strain
(b) Strain-distance ratio relation on steel beam
EZ~....cClJ
Eo~
~---------------II , I
I I~A 0 11 II -e, ~'Q c: ~l
:~I- --0 dO:I - t ·......,tt h" ",,_,+--t-I<-. -"-T" I:.1_ -4-:I L Jl I1 o\,;l4 I
1000 1500
Endplate strain (lLstrain)
(c) Moment-strain relation on endplate
131
- - - - Yieldstrain
• 5 G (E)9
5 G(E )11
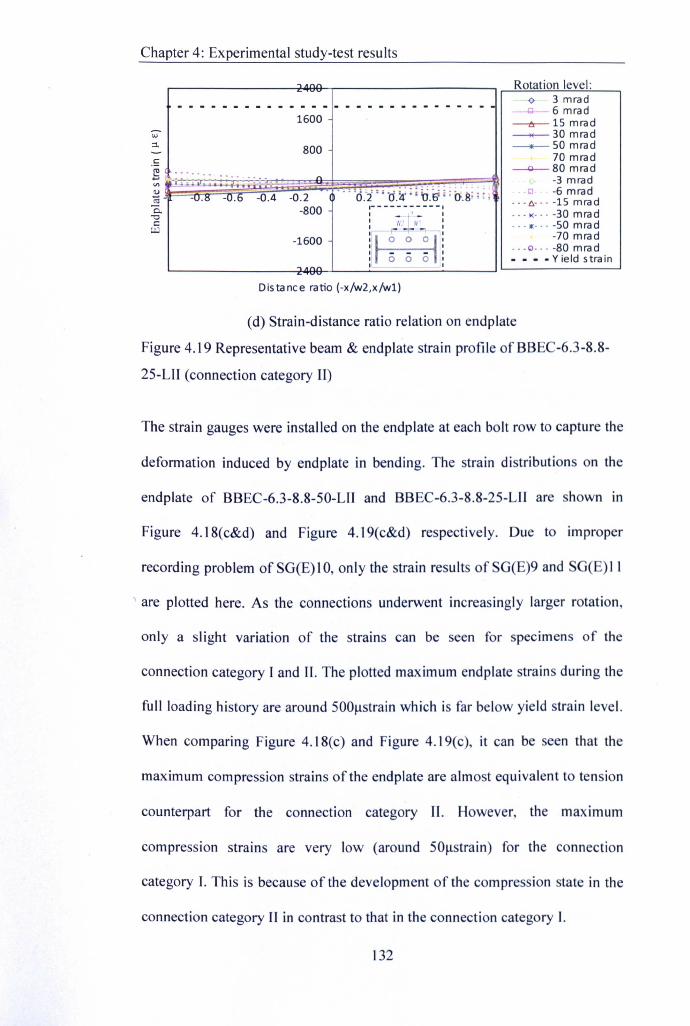
Chapter 4: Experimental study-test results
.., ",,.. o a Ion eve:o 3 mrad- - - - - - - - - - - - - - - - - - - - - - - - - - - - - --Q...-6 mrad
1600 -tr-15mrad__ 30 mrad
800_____ 50 mrad
t 70 mrad~~.... - ~80mrad
.-.- --.- ,.. -3 mrad1--- - -- ,-:-
- -, '0_'2" 'd_a:;: ~_!# ~: b-_k;;: ~- --I;) -6 mrad
OU.IS -u_6 -0.4 -0_2-"6- -- -15 mrad
-800 1- - --- -- - ---,,-w2t'wl
, ---1(--- -30 mrad, ,- - - 11:- - - -SOmrad, ,
-1600 d 0 0 ~ III t -70 mrad---Q--- -80 mrad
0 0 o " - - - - Yield strain"'A"''''
, ~,
Rtf
Dis ta ne e ratio (-x/w2,x/w1)
(d) Strain-distance ratio relation on endplate
Figure 4.19 Representative beam & endplate strain profile of BBEC-6.3-8.8-
2S-LII (connection category II)
The strain gauges were installed on the endplate at each bolt row to capture the
deformation induced by endplate in bending. The strain distributions on the
endplate of BBEC-6.3-8.8-S0-L1I and BBEC-6.3-8.8-2S-LII are shown in
Figure 4.18(c&d) and Figure 4.19(c&d) respectively. Due to improper
recording problem of SG(E) 10, only the strain results of SG(E)9 and SG(E) 11
, are plotted here. As the connections underwent increasingly larger rotation,
only a slight variation of the strains can be seen for specimens of the
connection category I and II. The plotted maximum endplate strains during the
full loading history are around SOOllstrain which is far below yield strain level.
When comparing Figure 4.18(c) and Figure 4.19(c), it can be seen that the
maximum compression strains of the endplate are almost equivalent to tension
counterpart for the connection category II. However, the maximum
compression strains are very low (around 50llstrain) for the connection
category I. This is because of the development of the compression state in the
connection category II in contrast to that in the connection category I.
132
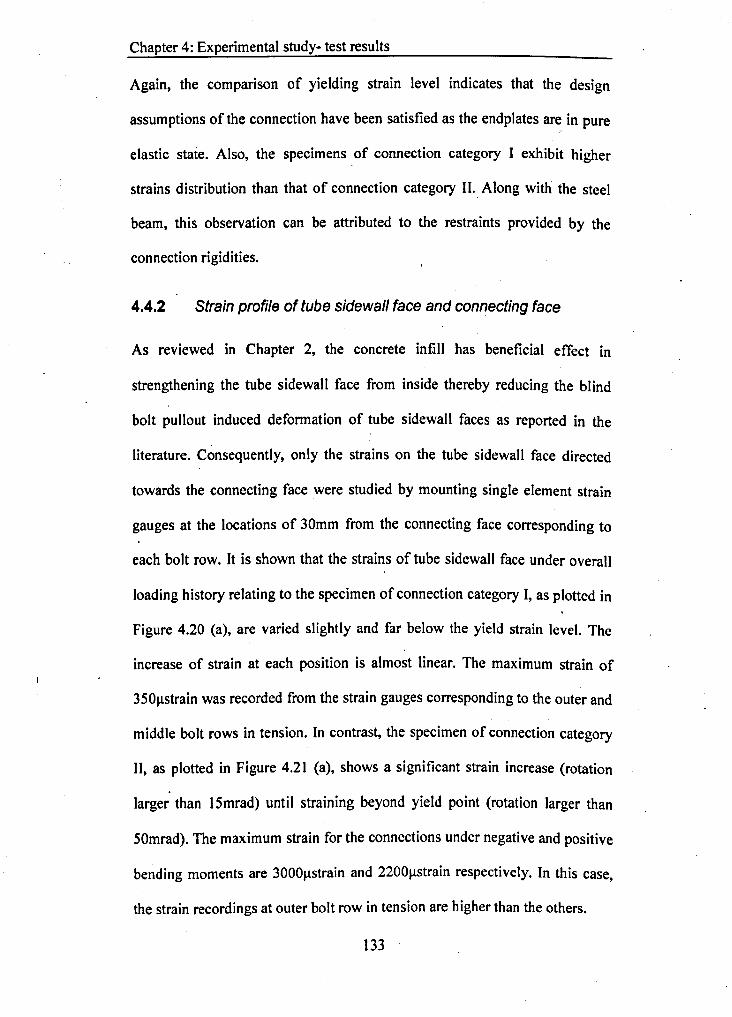
Chapter 4: Experimental study- test results
Again, the comparison of yielding strain level indicates that the design
assumptions of the connection have been satisfied as the endplates are in pure
elastic state. Also, the specimens of connection category I exhibit higher
strains distribution than that of connection category II.. Along with the steel
beam, this observation can be attributed to the restraints provided by the
connection rigidities.
4.4.2 Strain profile of tube sidewall face and connecting face
As reviewed in Chapter 2, the concrete infill has beneficial effect in
strengthening the tube sidewall face from inside thereby reducing the blind
bolt pullout induced deformation of tube sidewall faces as reported in the
literature. Consequently, only the strains on the tube sidewall face directed
towards the connecting face were studied by mounting single element strain
gauges at the locations of 30mm from the connecting face corresponding to
each bolt row. It is shown that the strains of tube sidewall face under overall
loading history relating to the specimen of connection category I, as plotted in
Figure 4.20 (a), are varied slightly and far below the yield strain level. The
increase of strain at each position is almost linear. The maximum strain of
350J.lstrainwas recorded from the strain gauges corresponding to the outer and
middle bolt rows in tension. In contrast, the specimen of connection category
II, as plotted in Figure 4.21 (a), shows a significant strain increase (rotation
larger than 15mrad) until straining beyond yield point (rotation larger than
50mrad). The maximum strain for the connections under negative and positive
bending moments are 3000J.lstrain and 2200J.lstrain respectively. In this case,
the strain recordings at outer bolt row in tension are higher than the others.
133
Chapter 4: Experimental study-test results
As the CFT column face is subjected to the tensile traction of the blind bolt,
the connecting face at the each bolt row is supposed to be significantly
strained. Accordingly, the two elements cross strain gauges were mounted at
these locations for relevant measurements. Figure 4.20 (b) arid Figure 4.21 (b)
show that the longitudinal strain distribution on the tube connecting face for
BBEC-S-} 0.9-50-LI and' BBEC-5-S.S-50-LII, which feature the connection
categories I and II respectively. For each loading cycle, the surface strain
magnitude distributes with ascending curve from compression to tensile
regions. The maximum strain occurs when the rotation and/or bending
moment of the connection reaches the maximum, i.e. 2200flstrain and
3300llstrain for the connection categories I and II respectively.
The specimen BBEC-S-10.9-50-LI represents a consistently increased
longitudinal strain between three parallel bolt rows, slightly exceeding the
yield strain level at the rotation beyond 20 mrad. In comparison, the specimen
BBEC-5-S.S-50-LII under greater rotation action shows relatively higher
strains, in which the maximum value is nearly twice the yield level. The strain
development in the middle bolt row for the connection category II is much
higher than that for the connection category I. This is especially the case as the
strain reading ranging between 2500llstrain and 2S00llstrain when the
connection rotates greater than 30mrad. The explanation for this observation
can be related to the significant flexible deformation of the tube connecting
face under relatively large bending moment. As a result, the tube face regions
between the middle and outer bolt rows in tension are significantly strained.
}34
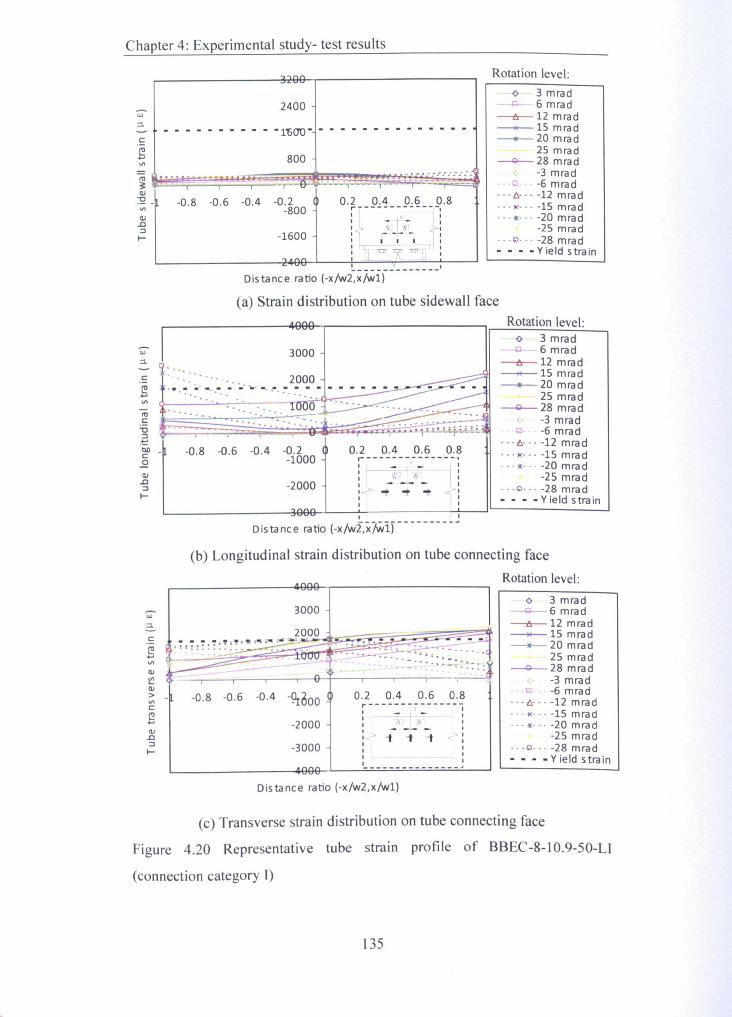
Chapter 4: Experimental study- test results
., .... 1"\'"
2400
- - - - - - - - - - -1'60'0- - - - - - - - - - - - - - -800
.... a! ••. : •• : ......._..: ..
,-'Q-:Ji '_'---'-.,- -T .- -0.8 -0.6 -0.4 -0.2 0.2 0.4 0.6 0.8
-800 rr--------]:-1600
:f w,I'wl :I r---i II I 1 I I
~.~~ : ";J =_(\': ~ :I
=
Distance ratio (-x/wD7iJi)---------
(a) Strain distribution on tube sidewall face
Rotation level:o 3 mrad
--Q- 6 mrad--ts--12mrad--15 mrad__ 20 mrad- ~-- 25 mrad
--0-- 28 mrad-3 mrad
.J;] -6 mrad..• 1::. -12 mrad... " -15 mrad... lI: -20 mrad
-25 mrad... <;> ... -28 mrad- - - - Yield strain
Rotation level:
3000
". ".
to
.s'0:::l.~tID _c.EQl.c:::l~
-0.8 -0.6 -0.4 -0.2-1000
0.2 0,4 0.6 0.81---------------,I _ Y _ I
: I W2 f WI I :!~ .: ~ -- ~:: I I:
-2000
I I
Distance ratio (-x/wi,x/Wiy---------J
o 3 mrad--0--6 mrad--ts--12 mrad--15 mrad__ 20 mrad
--+_. 25 mrad--0-- 28 mrad
-3 mradQ -6 mrad
... 6,.•. -12 mrad••• 1( ••• -15 mrad···lI: ... -20mrad
-25 mrad... <;> ••• -28 mrad- - - - Yield strain
(b) Longitudinal strain distribution on tube connecting face
c
3000
2000____ "~ .... I~;_;.r~----~ - -_!!..L'"':::::: ..:. ~.~ : .. ~.. -.. .. -::rUi;N I ..-~-.", -" ....(~ . . ~ ···::::·~··::·::I:·::·::~
e....Ql
~Ql>VIC
e....Ql.c:::l~
0.2 0.4 0.6 0.8-0.8 -0.6 -0.4 -9r600 ,..---------------I x I
:1 w-iw1 ~:I, - - - •:<'> I t of <'>:I I II I
I ---------~
-2000
-3000
""'"Distance ratio (-x/w2,x/w1)
Rotation level:o 3 mrad
--0--6 mrad--ts--12 mrad__ 15 mrad--20 mrad
25 mrad--0-- 28 mrad
-3 mradQ. -6 mrad
"'6, -12 mrad... 1( -15 mrad... lI:••• -20 mrad
-25 mrad···0··. -28 mrad- - - - Yield strain
(c) Transverse strain distribution on tube connecting face
Figure 4.20 Representative tube strain profile of BBEC-8-10.9-50-LI
(connection category I)
135
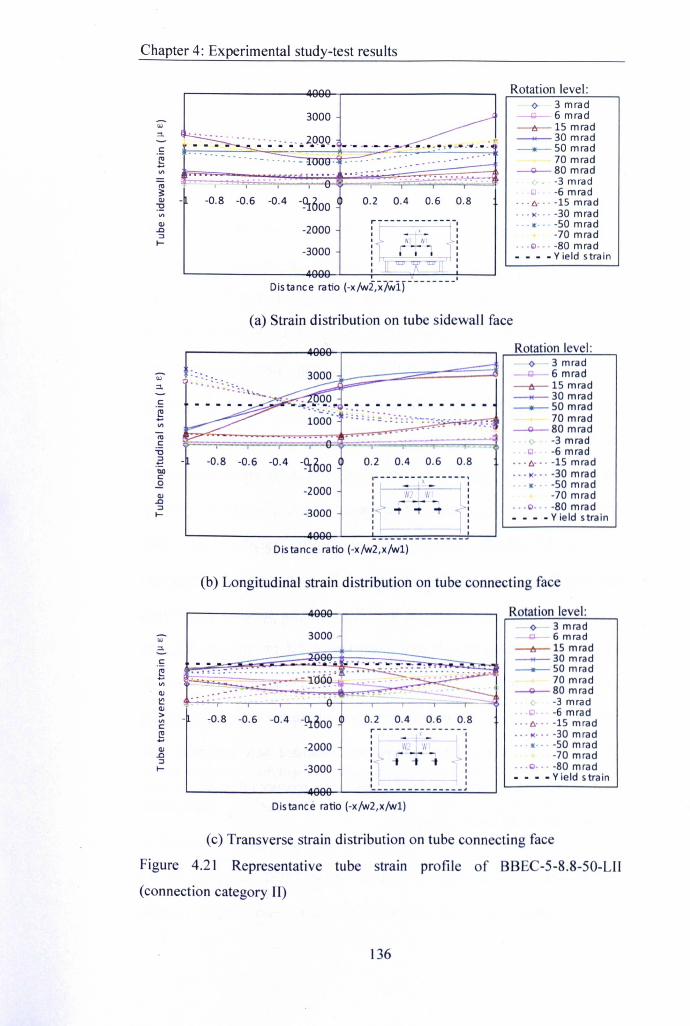
Chapter 4: Experimental study-test results
=
Rotation level:o 3 mrad
-Q-- 6 mrad--tr- 15 mrad__ 30 mrad____ 50 mrad---+- 70 mrad~SOmrad
, -3 mradc -6 mrad
···/:,···-1smrad... K··· -30 mrad... ,.... -SO mrad
-70 mrad... 0.·· -80 mrad- - - - Yield strain
-O.S -0.6 -0.4 -~600 0.2 0.4 0.6 0.8
Rotation level:o 3 mrad
-Q- 6 mrad--tr-ls mrad__ 30 mrad___ SO mrad
• 70 mrad~SOmrad
-3 mradQ -6 mrad
... /:,... -15 mrad
.·.K···-30mrad
... ,... -so mrad-70 mrad
., .0.·· -so mrad- - - - Yield strain
(b) Longitudinal strain distribution on tube connecting face
136
Rotation level:o 3 mrad~ 6 mrad
--tr-1s mrad__ 30 mrad____ SO mrad
70 mrad~SOmrad
-3 mradQ -6 mrad
... /:,... -15 mrad
... K··· -30 mrad
.. ,.... -50 mrad-70 mrad
., ·0··· -so mrad- - - -Yield strain
-2000
-3000
(c) Transverse strain distribution on tube connecting face
Figure 4.21 Representative tube strain profile of BBEC-5-S.8-50-LII
(connection category Il)
--------------,Distance ratio (-x/w2,x/w1)
(a) Strain distribution on tube sidewall face
W:1.
c:
gII>
-O.S -0.6 -0.4 -~600 0.2 0.4 0.6 O.S
-2000
-3000
Distance ratio (-x/w2,x/wl)
11\1\1\
0.2 0.4 0.6 0.8
f f - - -~~t 'w~- - - -j-1it of - I ~i1 I
: 1_ j
3000
;~:. ~.-:~"..'.:~~~~q~:... -;.
-0.8 -0.6 -0.4 -~600
-2000
-3000
"""Distance ratio (-x/w2,x/wl)
Chapter 4: Experimental study- test results
The transverse strain distribution on the tube is illustrated in Figure 4.20 (c)
and Figure 4.21 (c). It can be seen that a linear increase of strain related to
distance ratio when the rotation level is below 15mrad for both connections.
For specimen BBEC-5-8.8-50-LII, the maximum transverse strain values of
the overall cycles exceeding the yield strain' level are much lower than
longitudinal ones, i.e. 2200J-lstrain-3300J-lstrain. It appears that strains
developed at the middle bolt row of the specimen BBEC-5-8.8-50-LII are
higher within the gauge arrangement than those of BBEC-8-1 0.9-50-LI as the
rotation increases to 30mrad. After that, a significant strain development can. {
be seen at the middle bolt row when comparing the outer bolt row in tension,
i.e. 2300J-lstrainand 1400J-lstrainfor the middle and outer bolt row locations
respectively. This observation suggests progressive strain development as the
tube connecting face is subjected to consecutive flexible deformation. In
contrast, the transverse strains for the locations corresponding to the middle
and outer bolt row in tension become close as the connections are subjected to
maximum rotation, i.e. 1700J-lstrainand 2200J-lstrainfor middle and outer bolt
row locations respectively. It seems that tensile deformations on the tube
connecting face at middle bolt row has a significant accumulative effect at
overall cycles while those at outer bolt rows only serves for a half cycle (in
tension). As the bolt pullout induced bolt clearance hole expansion and
bending outward, however, the local compression produced through this way
compensates for the tensile strain.
137
Chapter 4: Experimental study-test results
4.4.3 Strain profile of blind bolt
The gauged bolt was installed only at the middle bolt row with moderate
tensile loading as to avoid the presence of premature tensile fracture at the .. .
grooved shank section. The strain development on the blind bolt was recorded
by strain gauges mounting symmetrically near the top and bottom shank. Each
bolt strain was taken as the mean value of both strain gauge readings at related
cross-section. The top shank strain gauges (SGBH) were used to record the
strains at two stages, i.e., tightening of the blind bolt with preload and full-
scale quasi-static cyclic loading test. The strain results of bolt preload are not
described here, but will be indicated in Chapter 6. The bottom shank strain
gauges (SGBB), on the other hand, were adopted to monitor the strain
development on the shank with the anchorage of concrete infill. Likewise, the
test results of the specimens BBEC-8-10.9-S0-LI and BBEC-S-8.S-S0-LII
were selected to feature the connection category I and II respectively. To
illustrate the response of the blind bolt, the bolt force was introduced and
calculated in accordance of design methods in which an assumption is made
that the force depends on the distances to the rotation centre for each bolt row
o; h, h), i.e. bolt force Bt=O.SM,j(ll+ h+ h), where, u; is bending moment of
the connection.
Visual inspection of Figure 4.22 and Figure 4.23 indicates that the strain
development at the top shank of the specimen BBEC-S-IO.9-S0-LI
(connection category I) is very limited across the yield strain level, while that
of the specimen BBEC-S-S.S-SO-LII (connection category II) displays
relatively larger strain distribution beyond the yield strain level. As for the
138
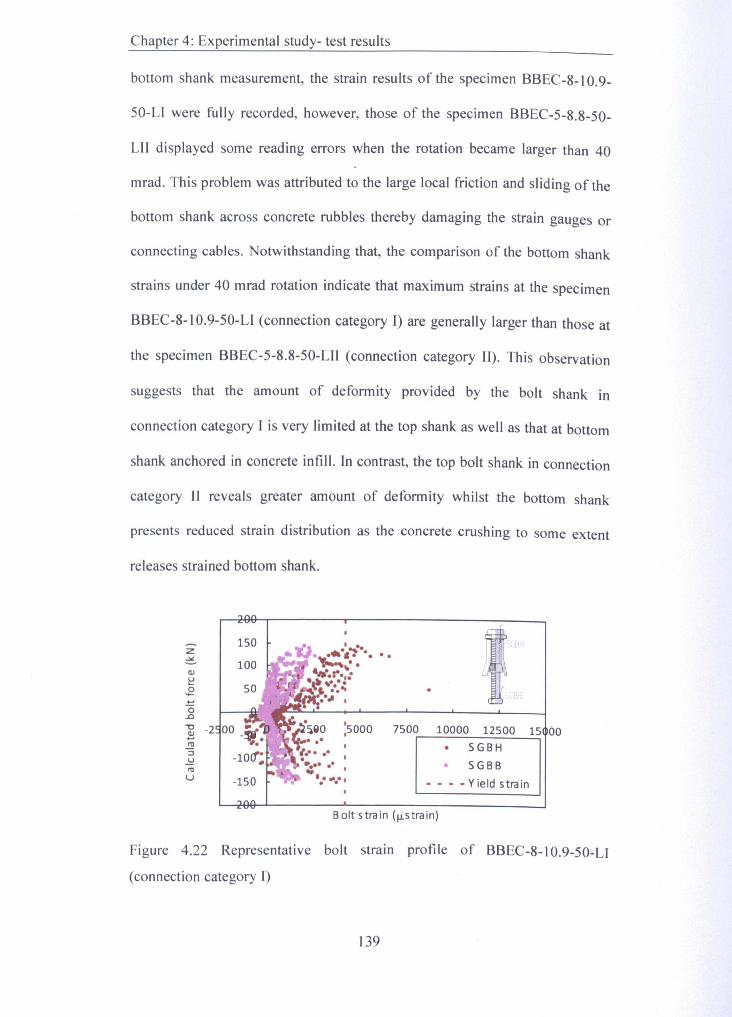
Chapter 4: Experimental study- test results
bottom shank measurement, the strain results of the specimen BBEC-8-10.9-
50-LI were fully recorded, however, those of the specimen BBEC-5-8.8-50-
LII displayed some reading errors when the rotation became larger than 40
mrad. This problem was attributed to the large local friction and sliding of the
bottom shank across concrete rubbles thereby damaging the strain gauges or
connecting cables. Notwithstanding that, the comparison of the bottom shank
strains under 40 mrad rotation indicate that maximum strains at the specimen
BBEC-8-10.9-50-LI (connection category I) are generally larger than those at
the specimen BBEC-5-8.8-50-LII (connection category II). This observation
suggests that the amount of deformity provided by the bolt shank in
connection category I is very limited at the top shank as well as that at bottom
shank anchored in concrete intill. In contrast, the top bolt shank in connection
category II reveals greater amount of deformity whilst the bottom shank
presents reduced strain distribution as the concrete crushing to some extent
releases strained bottom shank.
150
Q)
~.E...(5.0
] -2...ttl:;~ttlU
:5000 7500 10000 12500 15 00• S GBH
• SGBB- - - - Yield strain
Bolt stra in (us tra in)
Figure 4.22 Representative bolt strain profile of BBEC-8-10.9-50-LI
(connection category I)
139
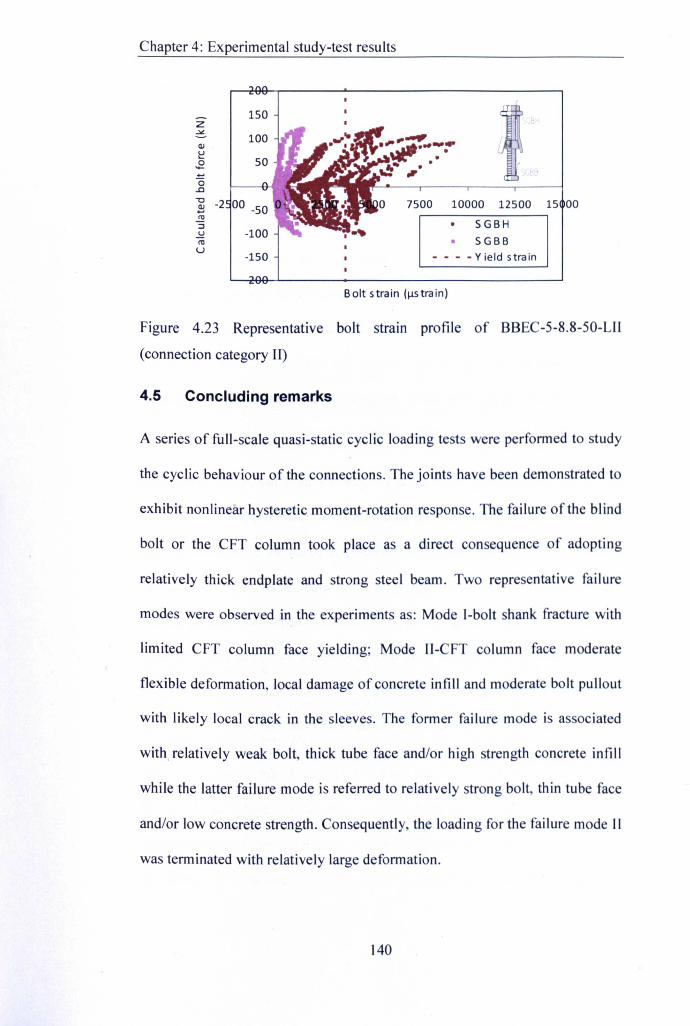
Chapter 4: Experimental study-test results
150z~QJ
~0.........."0..c"0QJ......!!!::t~ttlU
7500 10000 12500 15• SGBH
SGBB- - - - Yield strain
Bolt strain (us traln)
Figure 4.23 Representative bolt strain profile of BBEC-5-8.8-50-LIr
(connection category H)
4.5 Concluding remarks
A series of full-scale quasi-static cyclic loading tests were performed to study
the cyclic behaviour of the connections. The joints have been demonstrated to
exhibit nonlinear hysteretic moment-rotation response. The failure of the blind
bolt or the CFT column took place as a direct consequence of adopting
relatively thick endplate and strong steel beam. Two representative failure
modes were observed in the experiments as: Mode I-bolt shank fracture with
limited CFT column face yielding; Mode Ir-CFT column face moderate
flexible deformation, local damage of concrete infill and moderate bolt pullout
with likely local crack in the sleeves. The former failure mode is associated
with, relatively weak bolt, thick tube face and/or high strength concrete infill
while the latter failure mode is referred to relatively strong bolt, thin tube face
and/or low concrete strength. Consequently, the loading for the failure mode II
was terminated with relatively large deformation.
140
Chapter 4: Experimental study- test results
For the overall test series, the influences of bolt grade, cyclic loading
procedure, tube wall thickness and concrete grade on the hysteretic moment-
rotation relationship have been described and compared in terms of failure
modes, strength, stiffness, and rotation capacity. It has been demonstrated that:
the use of higher bolt grade increases the moment and initial stiffuess of the
connections, but slightly reduces counterpart rotation capacity; the cyclic
loading procedures with different loading amplitude in this study has slight,
influence on the moment-rotation relationship; the decreased tube wall
thickness and concrete grade may reduce the strength and stiffness of the
connections and, on the other hand, change the connection failure from mode I
to mode II which leads to significantly increased ultimate rotation.
The strain profiles of the connection components have been used to examine
the test design assumptions and gain further evidences for the connection
behaviour. Comparison of strain profiles related to the specimens of the
connection category I and category II indicated that two distinct strain
distributions on the counterpart connection components. The test hysteretic
moment-rotation relationships were used to evaluate the cyclic characteristics
and cumulative damage of the connections, which will be described in Chapter
5. The test results were also used to validate the finite element models which
will be presented in Chapter 6.
141

Chapter 5: Cyclic characterizing parameter & cumulative damage analysis
CHAPTERS
CYCLIC CHARACTERIZING PARAMETER &
CUMULATIVE DAMAGE ANALYSIS
5.1 Introduction
The test results of hysteretic moment-rotation relationship presented in
Chapter 4 will be further examined in this chapter in terms of cyclic
characterizing parameter and cumulative damage analysis.
To study the structural performance under cyclic loading, a series of
parameters has been suggested in the recent codes of ECCS (1986) and ATC-
24 (1992) for quantitative evaluation of the cyclic test results. These\
parameters relate to the issues of resistance characteristics, stiffness
characteristics, deformation ductility, and energy dissipation (absorption)
capacity. The use of these parameters will serve to meet the research
objectives and is also in line with other beam-to-column tests reported in the
literature (Dunai & Fukumoto, 1996).
In the performance-based seismic design, it is known that the reliable
evaluation of structural damage becomes a key issue. The damage evaluation
provides a better way in contrast to elastic analysis methods to limit the
damage under seismic loads. The damage of a structure incorporates three
levels, i.e., structure, substructure and members, which can be quantified by
different types of damage indices. The damage indices can also be used for the
assessment of subsequent loss of structural performance and rehabilitation or
142

Chapter 5: Cyclic characterizing parameter & cumulative damage analysis
retrofitting programs. The test moment-rotation relationships along with
representative failure modes were used in this cumulative damage analysis.
5.2 Cyclic characterizing parameter analysis
The values of cyclic performance quantities can be determined separately and
jointly from positive and negative excursions of cyclic curves. According to
ECCS (1986) and ATC-24 (1992), several basic parameters of an idealized
hysteretic cycle are illustrated in Figure 5.1 and expressions for related cyclic
characterizing parameters adopted in this study are indicated in Table 5.1,
including those for resistance & rotation characteristics, ductility, energy
dissipation capacity and stiffness characteristics. The moment and rotation at
yield point, i.e., yield moment and yield rotation, were calculated based on the
recommendation of FEMA-356 (2000) instead of ECCS (1986) and ATC-24
(1992), as discussed in Section 3.4.
For seismic design, it is of foremost importance to stress the concept of
ductility, which is defined as the ability of the structure to undergo large
plastic deformation without significant loss of strength (Mazzolani, 2000). The
partial ductility ratio, which is defined as the ratio of the maximum rotation to
the yield rotation of a positive or negative excursion, is often taken as a basic
variable to plot against the other cyclic characterizing parameters. This is.because the rotation is often used as a basic quantity of the progress of cyclic
loading. Additionally, it is worth noting that characterizing cyclic behaviours
are mostly used to feature the structural behaviour in the inelastic range. These
parameters may be involved with unrealistic expression in the elastic range, so
143
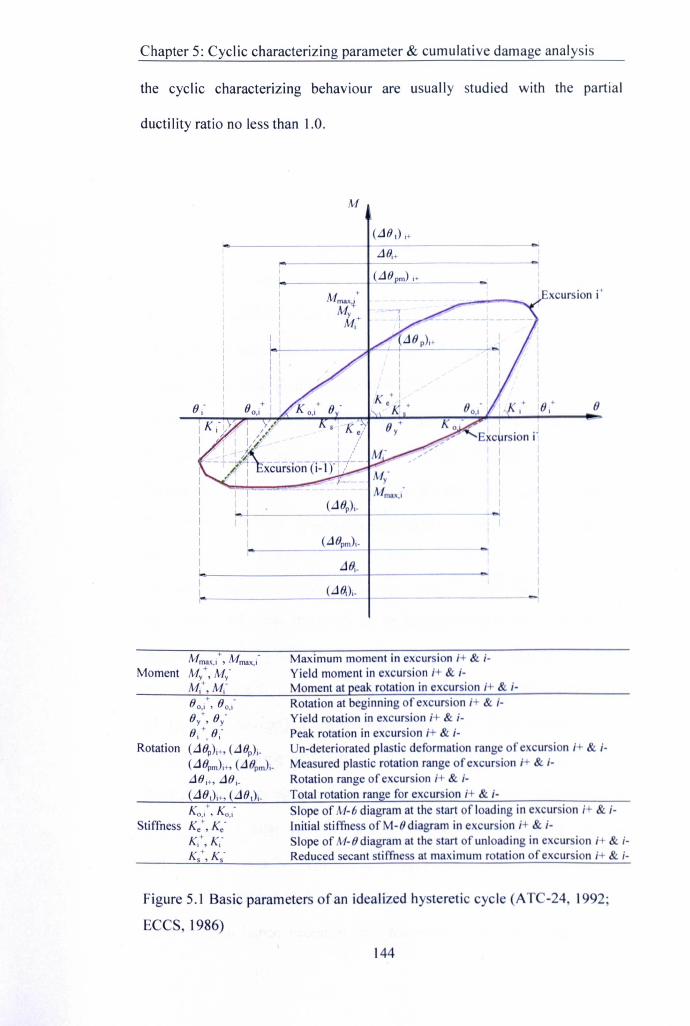
Chapter 5: Cyclic characterizing parameter & cumulative damage analysis
the cyclic characterizing behaviour are usually studied with the partial
ductility ratio no less than 1.0.
M
. .+xcursron I
8
Mmax,i+, Mmax,i-
Moment My'. My-Mi+,M,-
Maximum moment in excur ion i & i-Yield moment in excursion i+ & i-Moment at peak rotation in excursion i+ & i-
00/,00,,-
O/,Oy-o, '. o;
Rotation (.d Op)i+, (.d Op),_(.d Opm)i+,(L1Opm),_.dOi+, .dO,_(.d 8,)i+. (.d 8 ,),_
Rotation at beginning of excursion i+ & i-Yield rotation in excursion i+& i-Peak rotation in excursion i+ & i-Un-deteriorated plastic deformation range of excur ion i+ & i-Measured plastic rotation range of excursion i & i-Rotation range of excursion i+& i-Total rotation range for excursion i+& i-
Ko,+, s.:Stiffness Ke+, Ke-'
Kt,K,-K/,Ks-
Slope of M-6 diagram at the start of loading in excursion i & i-Initial stiffuess ofM-Odiagram in excursion i & i-Slope of M-Odiagram at the start of unloading in excursion i+& i-Reduced secant stiffness at maximum rotation of excursion i+& i-
Figure 5.1 Basic parameters of an idealized hysteretic cycle (AT -24, 1992;
ECCS, 1986)
144
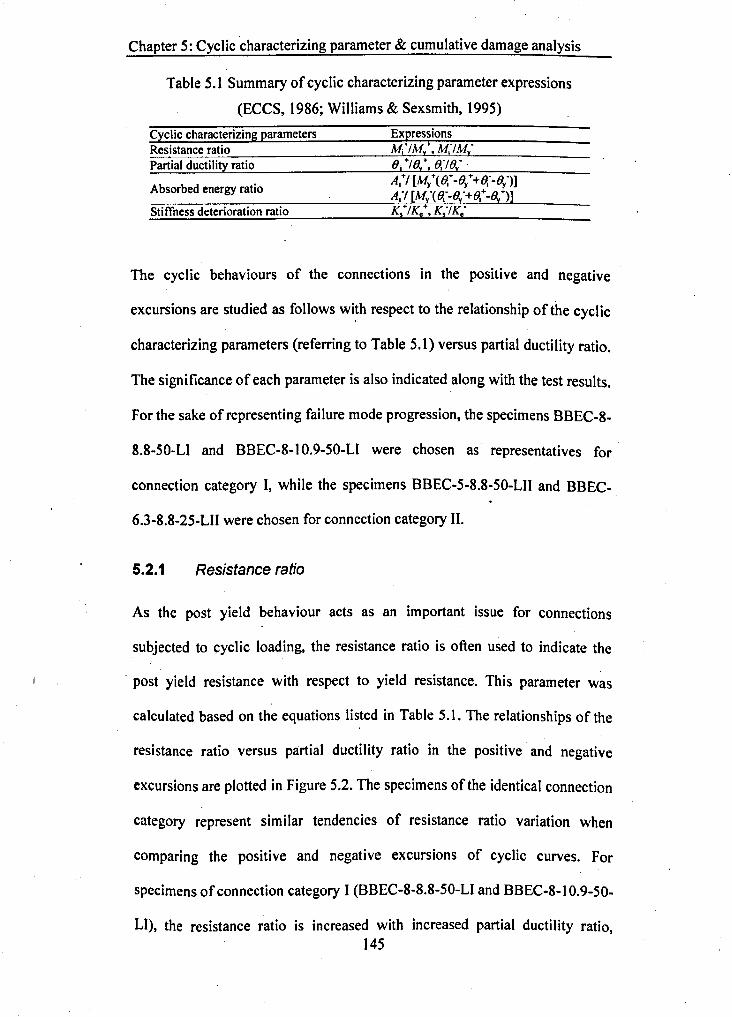
Chapter 5: Cyclic characterizing parameter & cumulative damage analysis
Table 5.1 Summary of cyclic characterizing parameter expressions
(ECCS, 1986; Williams & Sexsmith, 1995)
Cyclic characterizing parametersM; 1M. ,M;lM.Resistance ratio
Partial ductility ratio
Absorbed energy ratioAtl [My +( et -By++o.--By -)]Ai"1 [My"( o.--Oy-+o.+ -8/)]
Stiffness deterioration ratio K/IK/, K;/K;
The cyclic behaviours of the connections in the positive and negative
excursions are studied as follows wi~hrespect to the relationship of the cyclic
characterizing parameters (referring to Table S.l) versus partial ductility ratio.
The significance of each parameter is also indicated along with the test results.
For the sake of representing failure mode progression, the specimens BBEC-8-
8.8-S0-LI and BBEC-8-10.9-S0-LI were chosen as representatives for
connection category I, while the specimens BBEC-5-8.8-S0-LII and BBEC-
6.3-8.8-2S-LII were chosen for connection category II.
5.2.1 Resistance ratio
As the post yield behaviour acts as an important issue for connections
subjected to cyclic loading, the resistance ratio is often used to indicate the
. post yield resistance with respect to yield resistance. This parameter was
calculated based on the equations listed in Table 5.1. The relationships of the
resistance ratio versus partial ductility ratio in the positive and negative
excursions are plotted in Figure S.2. The specimens of the identical connection
category represent similar tendencies of resistance ratio variation when
comparing the positive and negative excursions of cyclic curves. For
specimens of connection category I(BBEC-8-8.8-S0-LI and BBEC-8-1 0.9-S0-
LI), the resistance ratio is increased with increased partial ductility ratio,14S
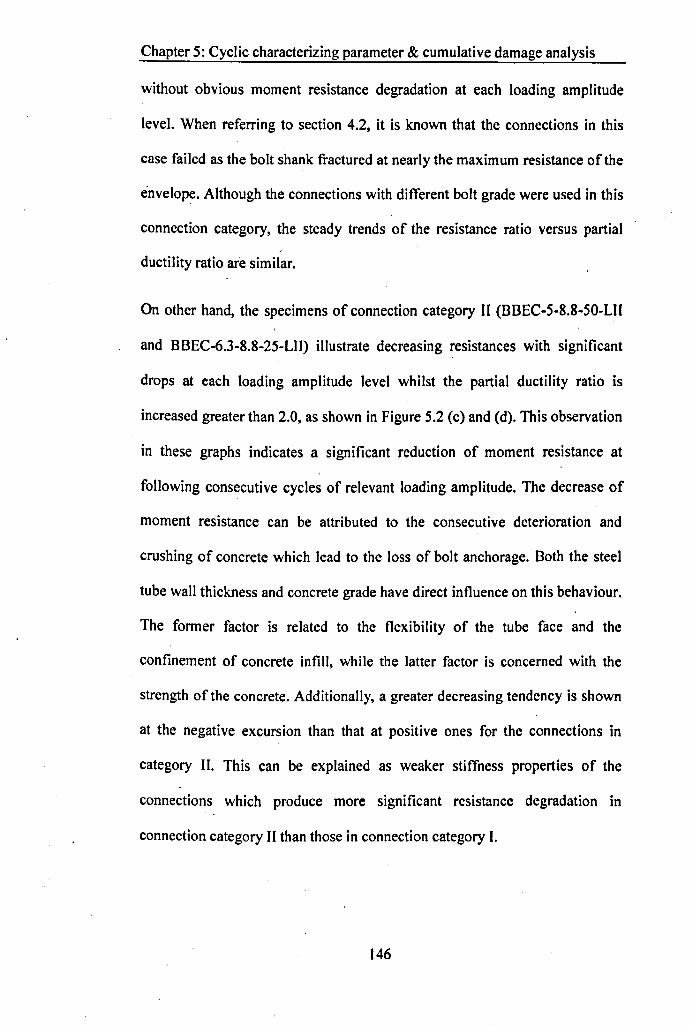
Chapter 5: Cyclic characterizing parameter & cumulative damage analysis
without obvious moment resistance degradation at each loading amplitude
level. When referring to section 4.2, it is known that the connections in this
case failed as the bolt shank fractured at nearly the maximum resistance of the
envelope. Although the connections with different bolt grade were used in this
connection category, the steady trends of the resistance ratio versus partial
ductility ratio are similar.
On other hand, the specimens of connection category II (BBEC-5-8.8-50-LII
and BBEC-6.3-8.8-25-LII) illustrate decreasing resistances with significant
drops at each loading amplitude level whilst the partial ductility ratio is
increased greater than 2.0, as shown in Figure 5.2 (c) and (d). This observation
in these graphs indicates a significant reduction of moment resistance at
following consecutive cycles of relevant loading amplitude. The decrease of
moment resistance can be attributed to the consecutive deterioration and
crushing of concrete which lead to the loss of bolt anchorage. Both the steel
tube wall thickness and concrete grade have direct influence on this behaviour.
The former factor is related to the flexibility of the tube face and the
confinement of concrete infill, while the latter factor is concerned with the
strength of the concrete. Additionally, a greater decreasing tendency is shown
at the negative excursion than that at positive ones for the connections in
category II. This can be explained as weaker stiffness properties of the
connections which produce more significant resistance degradation in
connection category IIthan those in connection category I.
146
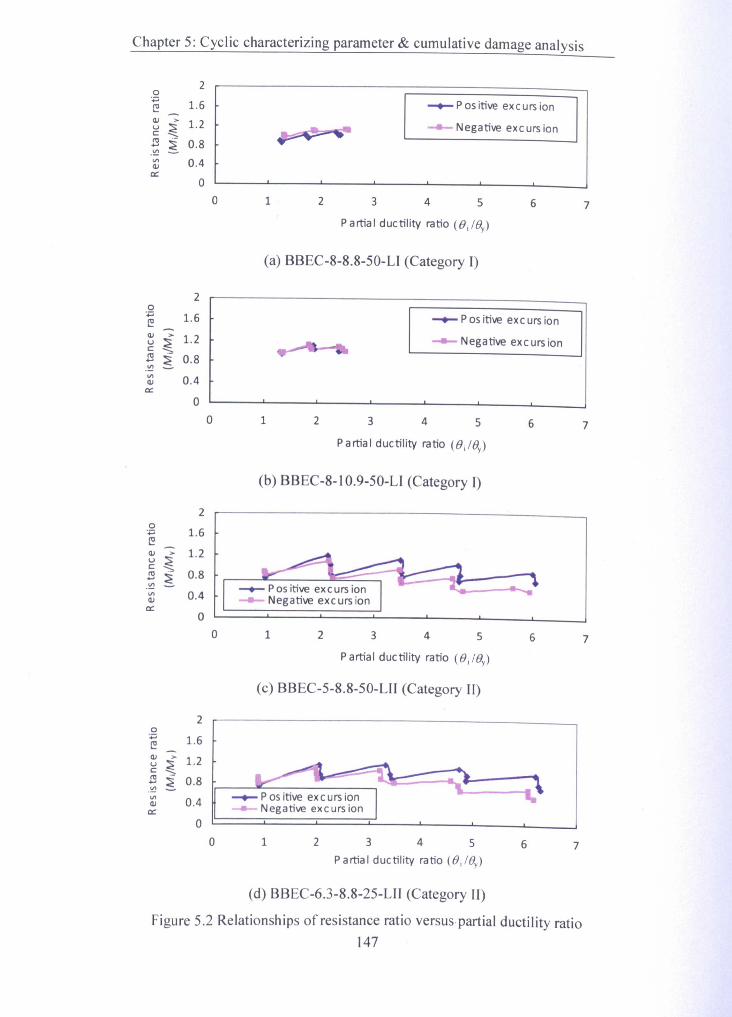
Chapter S: Cyclic characterizing parameter & cumulative damage analysis
20.~ 1.6e(1) >- 1.2u ~CI1l ~ 0.8....!!!Vl 0.4(1)
0:: 0
20+=' 1.6e(1) >- 1.2u
~CI1l
~ 0.8....!!!Vl 0.4(1)0::
00
-+- Pos itive excurs ion
- -- - Negative excurs ion... ~ ..o 1 2 3 4 5 6 7
Partial ductility ratio (OJ/Oy)
(a) BBEC-8-8.8-S0-U (Category I)
-+- Pos itive exc urs ion
-Negative excursion
1 2 3 4 5 6 7
Partial ductility ratio (O)Oy)
(b) BBEC-8-1 O.9-S0-L1 (Category J)
20 1.6.~e(1) >- 1.2u ~CI1l ~ 0.8....!!!Vl 0.4(1)
0:: 00 1 2 3 4 5 6 7
Partial ductility ratio (O;lOy)
(c) BBEC-S-8.8-S0-L1I (Category II)
20+=' 1.6e(1) >- 1.2u ~CI1l ~ 0.8....!!!Vl 0.4(1)
0::
00 1 2 3 4 5 6 7
Partial ductility ratio (Ol/Oy)
(d) BBEC-6.3-8.8-2S-L1I (Category II)
Figure S.2 Relationships of resistance ratio versus, partial ductility ratio147
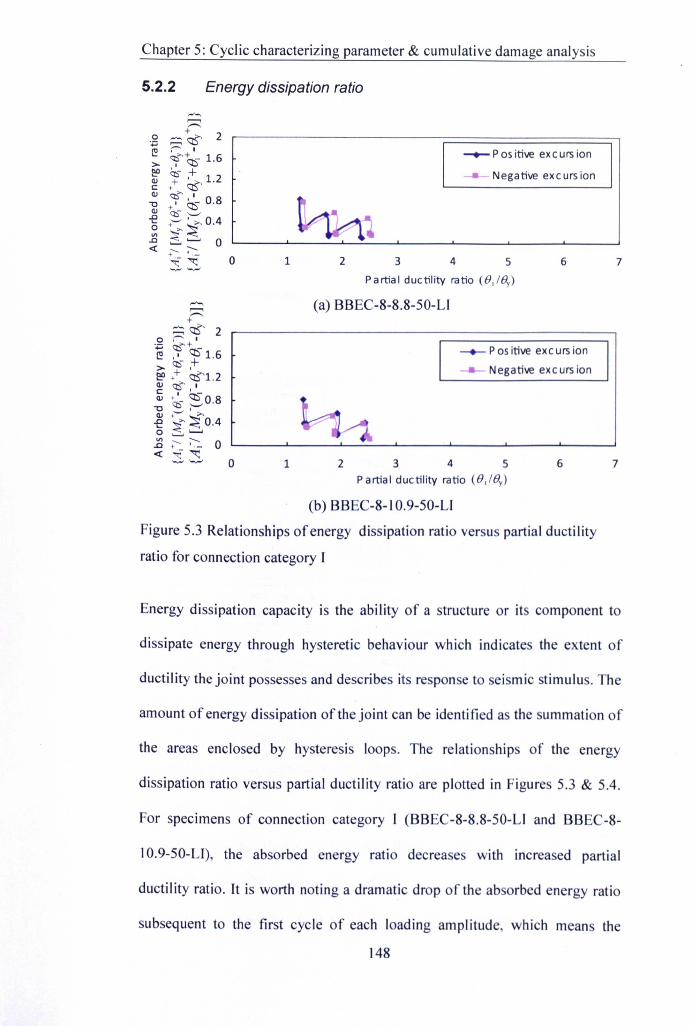
Chapter S: Cyclic characterizing parameter & cumulative damage analysis
5.2.2 Energy dissipation ratio
-,........,,,-...+ 20 ;:::;q5"':.::;
e r: I
>- ~"~ 1.62_0 Q:,-+OJ ++ ~ 1.2c:OJ <;b" I
-.:l +0 C:!s" 0.8OJ Q:) <;»-e +--:~:>, 0.40III ~._. 0.0
<! ----;--.+~ ~ 0-- .__,
-
-+- Pas itive excurs ion
-Negative excursion
1 2 3 4 5 6 7
Partial ductility ratio (Bo IBy)
(a) BBEC-8-8.8-S0-L1
~ Pos itive excurs ion
Negative excursion
o 1 2 3 4 5 6 7Partial ductility ratio (BoIBy)
(b) BBEC-8-1 O.9-S0-LJ
Figure S.3 Relationships of energy dissipation ratio versus partial ductility
ratio for connection category I
Energy dissipation capacity is the ability of a structure or its component to
dissipate energy through hysteretic behaviour which indicates the extent of
ductility the joint possesses and describes its response to seismic stimulus. The
amount of energy dissipation of the joint can be identified as the summation of
the areas enclosed by hysteresis loops. The relationships of the energy
dissipation ratio versus partial ductility ratio are plotted in Figures S.3 & S.4.
For specimens of connection category I (BBEC-8-8.8-S0-LI and BBEC-8-
10.9-S0-L1), the absorbed energy ratio decreases with increased partial
ductil ity ratio. It is worth noting a dramatic drop of the absorbed energy ratio
subsequent to the first cycle of each loading amplitude, which means the
148
Chapter 5: Cyclic characterizing parameter & cumulative damage analysis
dissipated energy reduces significantly during the repeated cycles. For
example, the reductions in the positive excursion of the cyclic curve for
specimen BBEC-8-8.8-50-L1 are seen as approximately from 0.83 to 0.26,
from 0.55 to 0.14, and from 0.42 to 0.10. Direct evidence can also be traced
back to the hysteretic moment-rotation curves plotted in sub-Section 4.3.1, in
which the hysteresis loop becomes rather narrow after the first cycle of each
loading amplitude level. It seems that this tendency continues until the end of
the test.
--.......,r:.g ~ ClS" 2e ~+'- 1.6> , c::tS2.D~+Q) + :_" 1.2c+ '0Q}'J:S"I'0 .: C:ts'0.8Q)<:ti---e +-' ~>, 0.4~ ~"<.0 ::........... °<t i- :':
33
-+- Pos itive excurs ion
-Negative excursion
° 1 2 3 4 5 6 7
Partial ductility ratio (ei ley)
(c) BBEC-5-8.8-50-L1I (Category II)
-+-Positive excursion
- Negative exc ursion
° 2 31 4 5 6 7Partial ductility ratio (ei/By)
(d) BBEC-6.3-8.8-25-L11 (Category 11)
Figure 5.4 Relationships of energy dissipation ratio versus partial ductility
ratio for connection category II
Along with increased partial ductility ratio, in contrast, the specimens of
connection category II (BBEC-5-8.8-50-L11 and BBEC-6.3-8.8-25-UI)
demonstrate reduced amount of such reduction at follower consecutive cycles
149
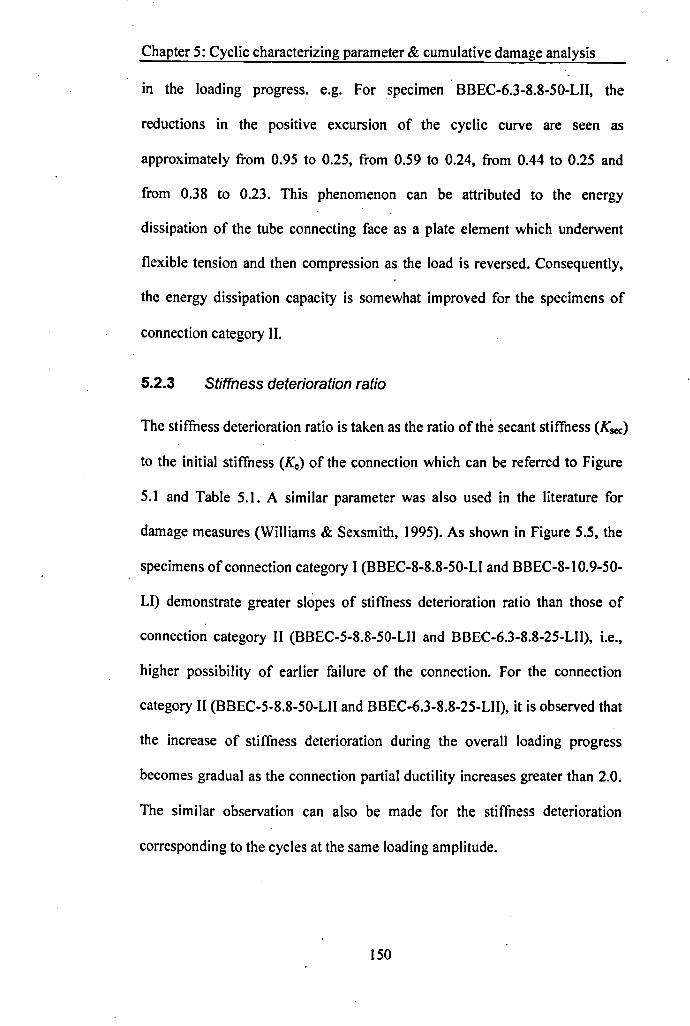
Chapter 5: Cyclic characterizing parameter & cumulative damage analysis
in the loading progress. e.g. For specimen BBEC-6.3-8.8-50-LII, the
reductions in the positive excursion of the cyclic curve are seen as
approximately from 0.95 to 0.25, from 0.59 to 0.24, from 0.44 to 0.25 and
from 0.38 to 0.23. This phenomenon can be attributed to the energy
dissipation of the tube connecting face as a plate element which underwent
flexible tension and then compression as the load is reversed. Consequently,
the energy dissipation capacity is somewhat improved for the specimens of
connection category II.
5.2.3 Stiffness deterioration ratio
The stiffness deterioration ratio is taken as the ratio of the secant stiffness (Ksec)
to the initial stiffness (Kc) of the connection which can be referred to Figure
5.1 and Table 5.1. A similar parameter was also used in the literature for
damage measures (Williams & Sexsmith, 1995). As shown in Figure 5.5, the
specimens of connection category I (BBEC-8-8.8-50-LI and BBEC-8-1 0.9-50-
LI) demonstrate greater slopes of stiffness deterioration ratio than those of
connection category II (BBEC-5-8.8-50-LII and BBEC-6.3-8.8-25-LII), i.e.,
higher possibility of earlier failure of the connection. For the connection
category II (BBEC-5-8.8-50-LII and BBEC-6.3-8.8-25-LII), it is observed that
the increase of stiffness deterioration during the overall loading progress
becomes gradual as the connection partial ductility increases greater than 2.0.
The similar observation can also be made for the stiffness deterioration
corresponding to the cycles at the same loading amplitude.
150
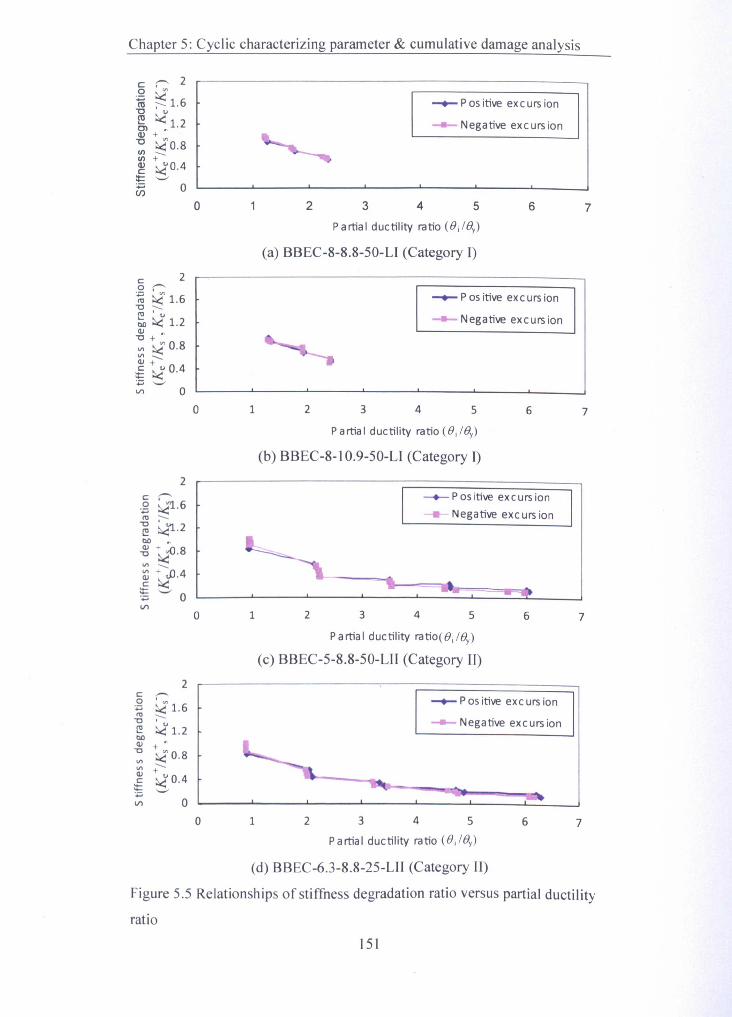
Chapter S: Cyclic characterizing parameter & cumulative damage analysis
c: ,-... 2~ ~ 1.6"0 '0)
19, ~ 1.2Q) + '""0 ~ 0.8Ul __
Ul +~ ~0.4:t:'-'~ 0
c 2o ,-...~ ~1.6"0 __
~ '0)
1>0 ~ 1.2QJ ~"0+VI ~ 0.8VI __
QJ+
~ ~0.4'.z:; <;»
Vl 0
c ,-....g ~"1.6III ;--
] ~'>J..21>0 ~
~ +~.o.8VI __
Q) + Jl.4c ~;S '-' 0Vl
c ,-...s ~ 1.6~ ~~ ~ 1.2QJ + '"~ ~ 0.8~ ;-c ~0.4~ '-'
'" oVl
-+-Positive excursion
-oil- Negative excurs ion
o 2 73 4 5 6
Partial ductility ratio (B;lBy)
(a) BBEC-8-8.8-50-LI (Category I)
-+- Pos itive exc urs ion
-oil- Negative excurs ion
o 2 731 4 5 6
Partial ductility ratio (Bj/By)
(b) BBEC-8-1 O.9-S0-LI (Category I)
2-+- Pos itive ex curs ion
--- Negative exc urs ion
o 1 2 73 4 5 6
Partial ductility ratio(B;lBy)
(c) BBEC-S-8.8-S0-L1I (Category II)
2-+- Pas itive exc urs ion
-oil- Negative excursion
,-'o 2 3 74 51 6
Partial ductility ratio (fJj/By)
(d) BBEC-6.3-8.8-2S-LII (Category II)
Figure 5.S Relationships of stiffness degradation ratio versus partial ductility
ratio
lSI

Chapter 5: Cyclic characterizing parameter & cumulative damage analysis
5.3 Assessment of connection ductility
The ductility issues of structural member and connection have attracted
sufficient attention in recent seismic design of moment resisting frames. In
Eurocode 8 (2003), a fundamental distinction is made between full strength
connections and semi-rigid (and/or) partial strength connections. The related
requirements are described as follows:
• The beam-to-column 'connection should be designed for the required
degree of over-strength provided that the beam is designed as the
dissipative component in the structure.
• Dissipative semi-rigid (and/or) partial strength connections are permitted
provided that the subsequent conditions are satisfied: the connections
have a rotation capacity consistent with global deformations; members
framing into the connections are demonstrated to be stable at ultimate
state; the effect of connections deformation on global drift is taken into
account.
Eurocode 8 has also introduced three levels of ductility along with relevant
design concepts, such as low ductility class (DCL), medium ductility class
(DCM) and high ductility class (DCH). The rotation capacity of the plastic
hinges is required for the connection design as: no less than 35 mrad for
structures of high ductility class (DCH) and 25 mrad for structures of medium
ductility class (DCM) with behaviour factor, q, larger than 2.0, which reflects
that plastic deformation capacity of a structure. Although not explicitly
indicated in Eurocode 8, the brittle failure of bolted flush endplate connections
for less than 20 mrad rotation capacity was suggested by Bose & Hughes
152
Chapter 5: Cyclic characterizing parameter & cumulative damage analysis
(1995) and later adopted by Thomson & Broderick (2002). On the other hand,
the rotation capacity of the plastic hinge includes not only the plastic hinge
beam rotation but also deformation of the connection (Fardis et al, 2005). The
latter contribution needs to be accounted for in semi-rigid and partial strength
connections.
Suggested by EC8
DCH:.-:
Ductile:
Suggested by EC8
1(\:IDC 1 DCH..... :----..I. : Ductile
Brittle I IDCM ~1....--------- ..·1 ,;---. :I I • Ductile:
I I
Suggested by Bose &Hughes (1995)
.-.Ductile.
E~c:<I)
Eox
16012080
- BB EC-8-8.8-S0-L I
BBE C-8-10.9-S0-LI
10 ~ I 30 : 4
Rotation (mrad)
Figure 5.6 An example of comparing ductility classified indices versus test
hysteretic moment-rotation relationships
The connection ductility in this study was further analysed by comparing
experimental hysteretic moment-rotation relationships with suggested ductility
classes mentioned above. An exemplified comparison of the specimens
BBEC-8-8.8-50-L1 and BBEC-8-10.9-50-L1 is shown in Figure 5.6, which
features connection category I. It is apparent that more than 25 mrad rotation
can be provided by the connections in category Iwhich may have potential to
satisfy the connections in the frame classified as ductility class (OCM) with153
Chapter 5: Cyclic characterizing parameter & cumulative damage analysis
q>2. Using similar comparison, the specimens of connection category II are
more likely to behave with more than 35 mrad rotation without significant
strength and stiffuess deterioration which may satisfy the connections in
frames of ductility class (DCH). It is noted that the connections tested in this
study relate to relatively thick endplate, i.e., the ductility contribution of
endplate is ignored; otherwise further improved ductility may be obtained for
the connections. However, this is beyond the scope of this work described
herein.
5.4 Cumulative damage model analysis
Based on a specific damage rule, the operator that calculates damage index is
defined as a damage model. So far great efforts have been made by
contemporary researchers using damage indices based approaches for
structural damage assessment. It should be pointed out that these approaches
are not restricted to specific research topics of structural members and frames,
but can be expanded to the research on beam to column connections, as
reported in recent literature (e.g., Castiglioni et al. 2009). This approach was
also adopted in this study for evaluating and comparing the behaviour of the
connections by applying these damage indices and analysing the test results
with respect to observed experimental failure modes.
5.4.1 Basic procedures in the definition of damage model
For the purpose of defining damage or collapse of a structural component, it is
necessary to use damage parameters related to structural performance under
cyclic loads in the inelastic domain. Powell & Allahabadi (1988) suggested
154
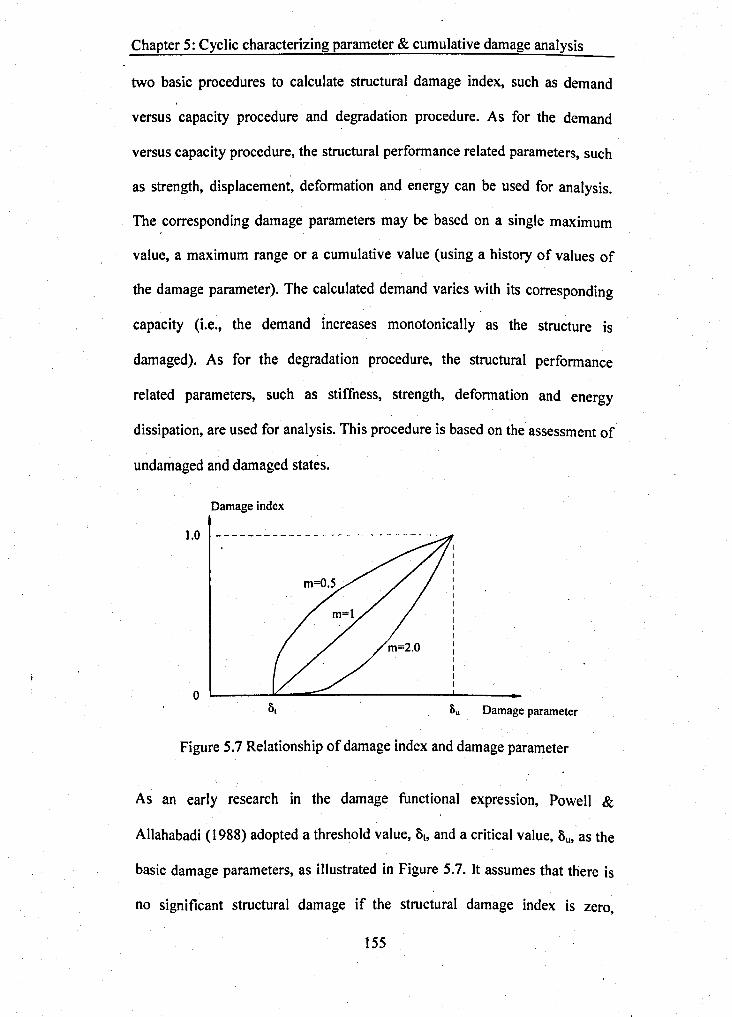
Chapter 5: Cyclic characterizing parameter & cumulative damage analysis
two basic procedures to calculate structural damage index, such as demand
versus capacity procedure and degradation procedure. As for the demand
versus capacity procedure, the structural performance related parameters, such
as strength, displacement, deformation and energy can be used for analysis.
The corresponding damage parameters may be based on a single maximum
value, a maximum range or a cumulative value (using a history of values of
the damage parameter). The calculated demand varies with its corresponding
capacity (i.e., the demand increases monotonically as the structure is
damaged). As for the degradation procedure, the structural performance
related parameters, such as stiffness, strength, deformation and energy
dissipation, are used for analysis. This procedure is based on the assessment or'
undamaged and damaged states.
Damage index
1.0
8u Damage parametero
Figure 5.7 Relationship of damage index and damage parameter
As an early research in the damage functional expression, Powell &
Allahabadi (1988) adopted a threshold value, Bb and a critical value, Bu, as the
basic damage parameters, as illustrated in Figure 5.7. It assumes that there is
no significant structural damage if the structural damage index is zero,
155
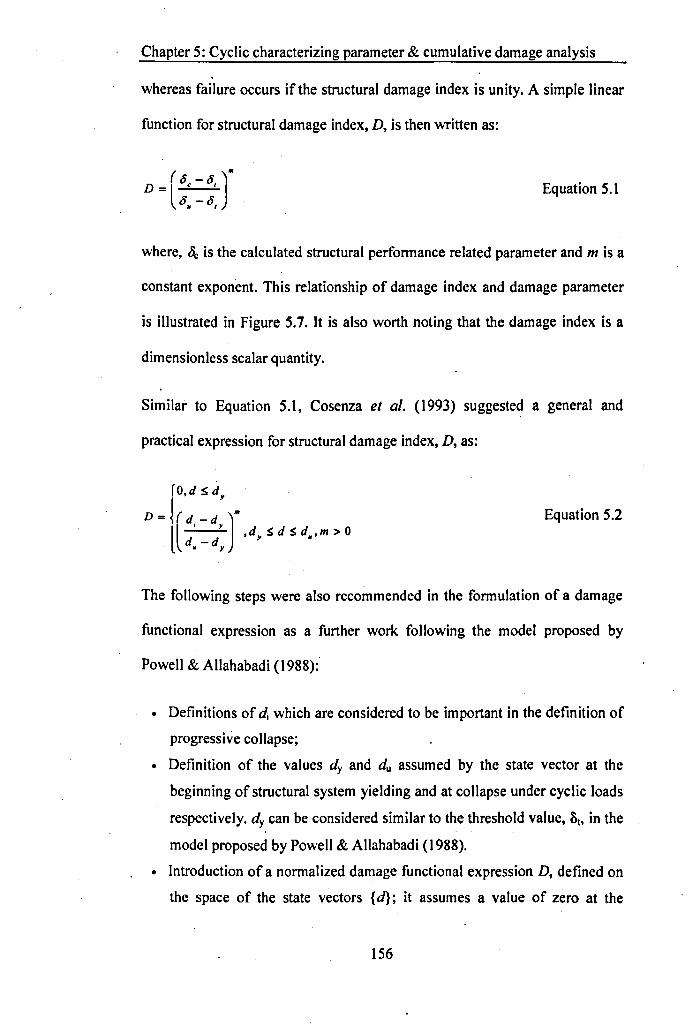
Chapter 5: Cyclic characterizing parameter & cumulative damage analysis
whereas failure occurs if the structural damage index is unity. A simple linear
function for structural damage index, D, is then written as:
Equation 5.1
where, be is the calculated structural performance related parameter and m is a
constant exponent. This relationship of damage index and damage parameter
is illustrated in Figure 5.7. It is also worth noting that the damage index is a
dimensionless scalar quantity.
Similar to Equation 5.1, Cosenza et al. (1993) suggested a general and
practical expression for structural damage index, D, as:
Equation 5.2
The following steps were also recommended in the formulation of a damage
functional expression as a further work following the model proposed by
Powell & Allahabadi (1988):'
• Definitions of d, which are considered to be important in the definition of
progressive collapse;
• Definition of the values dy and du assumed by the state vector at the
beginning of structural system yielding and at collapse under cyclic loads
respectively. dy can be considered similar to the threshold value, &t. in themodel proposed by Powell & Allahabadi (1988).
• Introduction of a normalized damage functional expression D, defined on
the space of the state vectors {d}; it assumes a value of zero at the
156

Chapter 5: Cyclic characterizing parameter & cumulative damage analysis
beginning of yielding and a value of 1.0 at failure. Also, the function
should increase as damage increases;
• Evaluation of the value assumed by the functional expression, with
reference to the structure examined and for the seismic events expected;
the seismic verification will be satisfied if the result satisfies D<1.
As already mentioned that a damage model refers to the calculation of the
damage index through a specific damage rule, it is categorized based on the
loading type and failure mechanism (Williams & Sexsmith, 1995). The non-
cumulative damage model is load path independent and often calculated using
the peak value of the performance as the basic variable which is normalized by
the nominal capacity of the structural component. The envelope of structural
response is usually used in the calculation of non-cumulative damage indices.
Although it is simple for calculation, the non-cumulative damage model only
presents an approximate measurement of the level of damage undergone
during inelastic loading and is unable to account for the damage due to cyclic
loading. The cumulative damage model and combined damage model, on the
other hand, are regarded as operators that calculate the damage indices using
damage rules related to cumulative damage. such as Park and Ang model.
Cumulative energy dissipation, plastic displacement and deformation are
usually used for cumulative damage indices. The generally adopted damage
indices will be reviewed in the following subsection.
Table 5.2 Classification of damage level and related index (Park et al. 1985)
Damage levels Damage indices Referred observation of RC StructureI. No or slightII. MinorIII. ModerateIV. SevereV. Collapse
0-0.10.1-0.250.25-0.40.4-1.0>1.0
Sporadic concrete crackingSlight concrete cracking and crushingConcrete extensive cracking and spallingConcrete crushing. reinforcement buckingLoss of load carrying capacity
157
Chapter 5: Cyclic characterizing parameter & cumulative damage analysis
Using damage indices, it is possible to feature the structural damage
mechanism and describe the evolution of structural damage states. Park et al.
(1985) proposed a damage level classification relating to damage index. The
structural damage level consists of five categories: slight. minor, moderate,
severe, and collapse. The relation of damage level versus damage index is
indicated in Table 5.2. Although the classification is based on the empirical
experimental observations, the comparison against the ranges of damage
indices has been adopted in the recent studies for beam to column connections
(Altoontash et al. 2005) and moment resisting frames (Palazzo et al. 2004). As
such, this classification will be further adopted in sub-Section 5.4.3 in the
damage model analysis of experimental results.
5.4.2 Damage indices
Previous researchers have proposed a number of damage models for structural
response related to three levels including structure, substructure and
components. Although different failure criteria are involved in the structural
response, it may be possible to use damage indices in a general form to carry
out damage assessment. The damage indices reviewed herein are based on the
characteristics of fatigue, energy and combined energy & ductility.
5.4.2.1 General fatigue based linear cumulative damage index
The Palmgren-Miner linear damage theory (Miner's rule) has been widely
used to evaluate the cumulative damage and remaining fatigue life of a
structure subjected to cyclic loading with constant or varying amplitudes.
Miner's rule (Miner, 1945) states that, if there are k different stress amplitudes
158
Chapter 5: Cyclic characterizing parameter & cumulative damage analysis
each relating to ni cycles, and N, the number of cycles to failure of a constant
stress Si, then the failure occurs when:
t .
~ n,~-=C1.1 N,
Equation 5.3
where, C is the experimental constant. In general, this constant is assumed to
be equal to 1.0 when failure occurs. The application of Miner's rule for the
study of beam to column connections has been reported by Ballio et al. (1995)
and Castiglioni et al. (2009). As for cyclic loading test with non-constant
displacement amplitudes, the expression for Miner rule (general fatigue) based
damage index is written as:
~ n,/l,DGM=~-
• I_I N flllflEquation 5.4
where, k is further modified as the number of displacement amplitudes. ns;is .
the number of cycles at the i-th displacement amplitude. Nfl is the average
number of cycles to failure at the i-th displacement amplitude. Ai and J;, are
the displacement amplitudes corresponding to n« and Nfl respectively.
5.4.2.2 Low cycle fatigue based cumulative damage index
The parameters of plastic displacement and ductility are widely used to
evaluate the low cycle fatigue damage by early researchers. Krawinkler &
Zohrei (1982) adopted the simple Coffin-Manson model together with linear
damage accumulation to account for the low cycle fatigue damage. The
damage index is expressed with plastic deformation range as a variable:
159
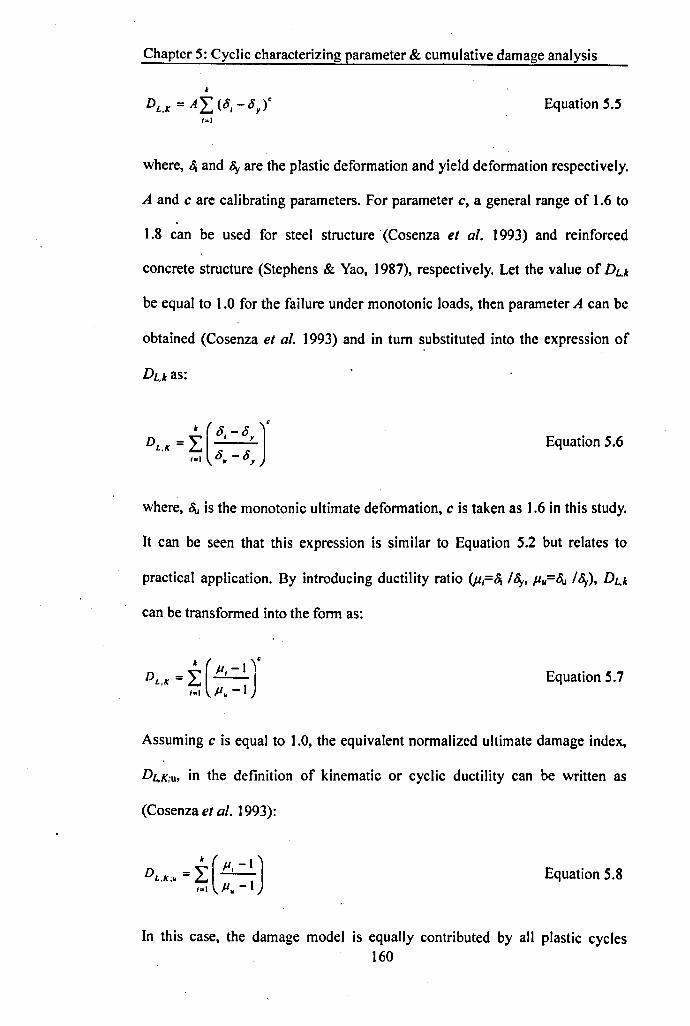
Chapter 5: Cyclic characterizing parameter & cumulative damage analysis
k
DL•K = AL (01 -o,t'~I
Equation 5.5
where, ~ and By are the plastic deformation and yield deformation respectively.
A and c are calibrating parameters. For parameter c, a general range of 1.6 to
1.8 can be used for steel structure· (Cosenza et al. 1993) and reinforced
concrete structure (Stephens & Yao, 1987), respectively. Let the value of Du
be equal to 1.0 for the failure under monotonic loads, then parameter A can be
obtained (Cosenza et al. 1993) and in turn substituted into the expression of
Du as:
• (0 - 0 JCD - I YL.K - L 0 -0
I-I N ,
Equation 5.6
where, tt is the monotonic ultimate deformation, c is taken as 1.6 in this study.
It can be seen that this expression is similar to Equation 5.2 but relates to
practical application. By introducing ductility ratio (P,=~ /By, jlu=tt Illy),Du
can be transformed into the form as:
k ( )CD - '" iii -ILIC-£..,.• lal Ii.-I
Equation 5.7
Assuming c is equal to 1.0, the equivalent normalized ultimate damage index,
DL.K;u, in the definition of kinematic or cyclic ductility can be written as
(Cosenza et al. 1993):
D = ~ (.&2)L.IC;. £..,. _ 1lsI liN
Equation 5.8
In this case, the damage model is equally contributed by all plastic cycles160

Chapter 5: Cyclic characterizing parameter & cumulative damage analysis
except ultimate ones.· Based on the experimental results presented by
Krawinkler & Zohrei (1982), Kumar & Usami (1996) suggested a greater
value than unity which is more appropriate to feature the contribution of larger
plastic deformation.
The low cycle fatigue based damage index has an advantage in its application
incorporating plastic deformation range as a basic variable, which can be
easily assessed by experimental study. Apart from envelope characteristics,
however, it seems impossible to capture some detailed cyclic characteristics,
such as the shape of hysteresis loop and strength deterioration.
5.4.2.3 Energy based cumulative damage index
One of the most important properties in evaluating the structural hysteretic
performance is energy dissipation, which approximately incorporates the
strength and plastic deformation of hysteresis loops. This provides certain
merits as compared with low cycle fatigue based index which is primarily. .
related to plastic deformation range. The energy based cumulative damage
index used by early researchers (Banon et al. 1981, Darwin & Nmai 1986) is
simply expressed as the normalization of energy dissipated (Ej) with respect to
the elastic energy stored (the product of yield force, Fy, and yield deformation,
8y). The damage index, ~.D, is given as:
• ED _",_IE,D - ~ F 8
I-I ,yEquation 5.9
This equation also supplies a simple comparison of evaluated. energy
dissipation with design capacity.
161
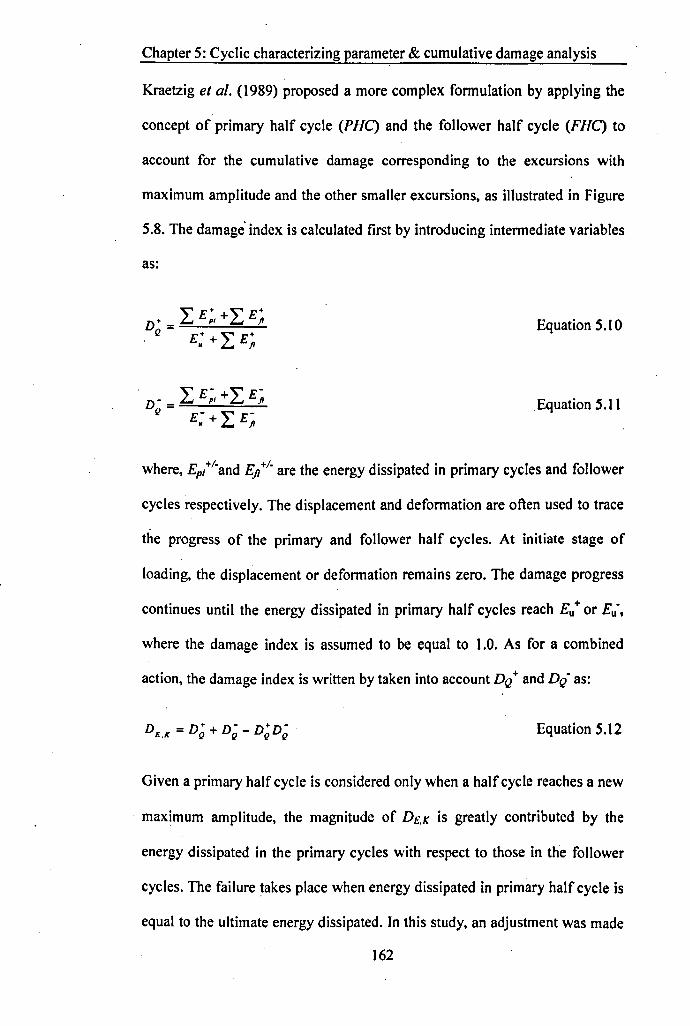
Chapter 5: Cyclic characterizing parameter & cumulative damage analysis
Kraetzig et al. (1989) proposed a more complex formulation by applying the
concept of primary half cycle (PHC) and the follower half cycle (FHC) to
account for the cumulative damage corresponding to the excursions with
maximum amplitude and the other smaller excursions, as illustrated in Figure
5.8. The damage' index is calculated first by introducing intermediate variables
as:
Equation 5.10
Equation 5.11
where, Ep//"and Efl+/" are the energy dissipated in primary cycles and follower
cycles respectively. The displacement and deformation are often used to trace
the progress of the primary and follower half cycles. At initiate stage of
loading, the displacement or deformation remains zero. The damage progress
continues until the energy dissipated in primary half cycles reach Eu+ or Eu",
where the damage index is assumed to be equal to 1.0. As for a combined
action, the damage index is written by taken into account DO + and DO" as:
Equation 5.12
Given a primary half cycle is considered only when a half cycle reaches a new
maximum amplitude, the magnitude of DE.K is greatly contributed by the
energy dissipated in the primary cycles with respect to those in the follower
cycles. The failure takes place when energy dissipated in primary half cycle is
equal to the ultimate energy dissipated. In this study, an adjustment was made
162
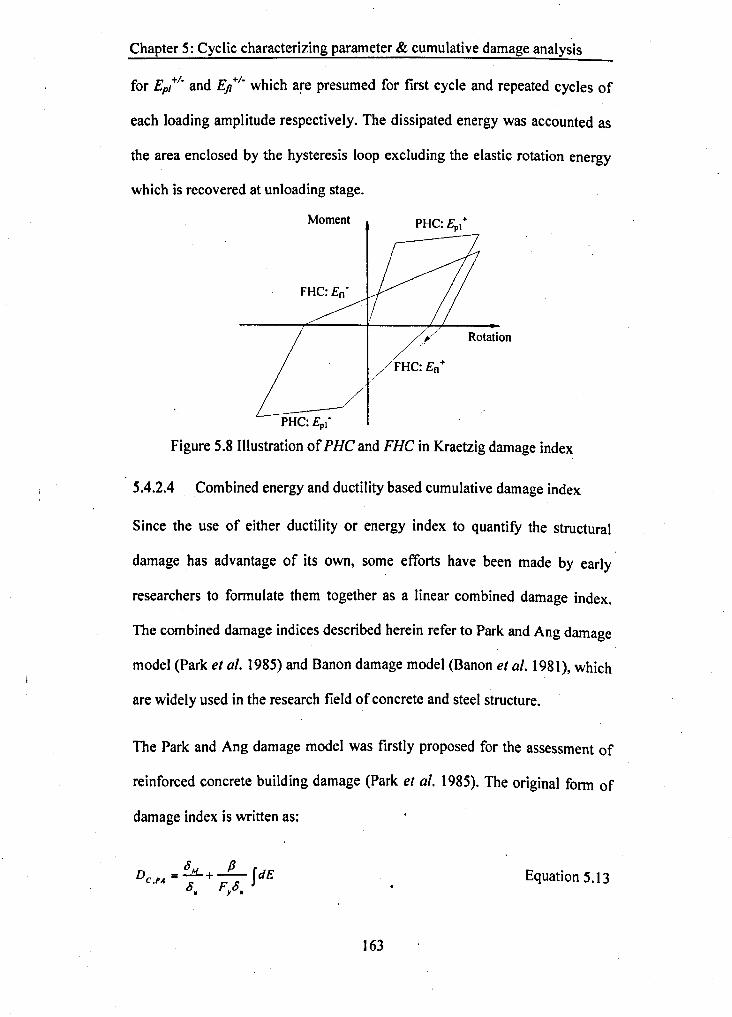
Chapter 5: Cyclic characterizing parameter & cumulative damage analysis
for Ep;+/. and Efl +/. which are presumed for first cycle and repeated cycles of
each loading amplitude respectively. The dissipated energy was accounted as
the area enclosed by the hysteresis loop excluding the elastic rotation energy
which is recovered at unloading stage.
Moment
/,/FHC:En+
Rotation
PHC: Ep1•
Figure 5.8 Illustration of PHC and FHC in Kraetzig damage index
/
5.4.2.4 Combined energy and ductility based cumulative damage index
Since the use of either ductility or energy index to quantify the structural
damage has advantage of its own, some efforts have been made by early
researchers to formulate them together as a linear combined damage index.
The combined damage indices described herein refer to Park and Ang damage
model (Park et al. 1985) and Banon damage model (Banon et al. 1981), which
are widely used in the research field of concrete and steel structure.
The Park and Ang damage model was firstly proposed for the assessment of
reinforced concrete building damage (Park et al. 1985). The original form of
damage index is written as:
OM P IdD =-+-- EC,PA s rs
• Y·
Equation 5.13
163
Chapter 5: Cyclic characterizing parameter & cumulative damage analysis
where, 41 is the maximum response deformation. dE is the incremental
absorbed hysteretic energy. f3 is a calibrating parameter for cyclic loading. Fy
is the yield load. The range of f3 between -0.3 to 1.2, with a median of about
0.15 is suggested for concrete structure (Cosenza & Manfredi, 2000), while
,8=0.025 can be used for steel structure (Castiglioni et al. 2009). It is noted
that this damage index is regarded as ductility based provided that f3 is small.
Introducing ductility variable, this equation can be further transformed by
dividing 8y at its upper and lower parts and then becomes: .
Equation 5.14
where, PM and Ilu are the ductility ratios corresponding to ~M and 8u
respectively. Using Park and Ang damage model for this analysis, a similar
expression is written as:
1 r k· 1Dc.fA. = -l/.ll.m .. + PL (/.I ; .• -I)J
/.I. I_I
Equation 5.15
E/.It =1+-1-
oJ F 0y y
where, Pi.~ax is the ductility ratios similar to PM for ith cycle. It is worthy of
note that the combination of ductility and energy in this way is linear which
may cause difficulties in the analysis of highly nonlinear problem.
Banon et al. (1981) proposed another combined index in the analysis of RC
elements and structures. This combined index was thereafter used by Cosenza
et al. (1993) and Castiglioni et al. (2009) in their researches of concrete and
164
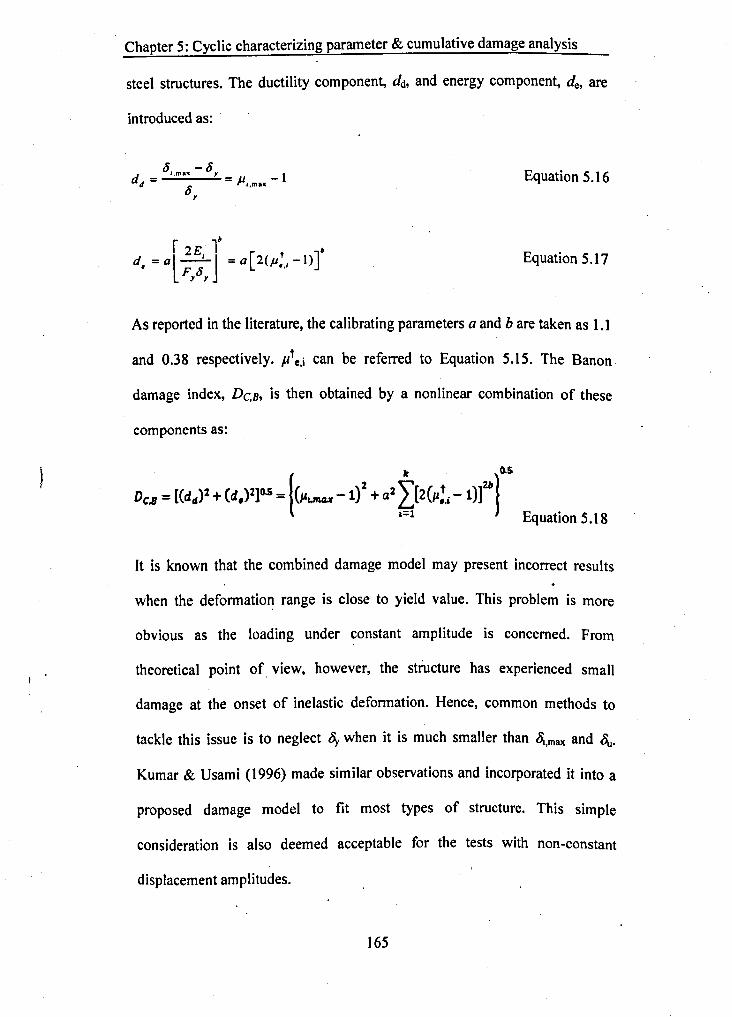
Chapter S: Cyclic characterizing parameter & cumulative damage analysis
steel structures. The ductility component, ds; and energy component, de, are
introduced as:
6"mn - 6,d- -11-1d - 6 - rl,max
y
Equation 5.16
Equation S.17
As reported in the literature, the calibrating parameters a and b are taken as 1.1
and 0.38 respectively. pte,i can be referred to Equation S.lS. The Banon
damage index, DC,B, is then obtained by a nonlinear combination of these
components as:
k ~s
Dc.. = [(d.l' +(d.l')05 = {v....... -1)' +.' ~[2V.!J- 1)]"1Equation S.18
It is known that the combined damage model may present incorrect results
when the deformation range is close to yield value. This problem is more
obvious as the loading under constant amplitude is concerned. From
theoretical point of view, however, the structure has experienced small
damage at the onset of inelastic deformation. Hence, common methods to
tackle this issue is to neglect 8y when it is much smaller than ~,max and ~.
Kumar & Usami (1996) made similar observations and incorporated it into a
proposed damage model to fit most types of structure. This simple
consideration is also deemed acceptable for the tests with non-constant
displacement amplitudes.
16S
Chapter 5: Cyclic characterizing parameter & cumulative damage analysis
5.4.3 Damage model analysis of experimental results
The study of structural damage evolution progress with reference to each
performance level is beneficial for better understanding the response of the
connection under cyclic loading. To feature the typical progress, the tested
specimens were categorized with due consideration of the failure modes
observed in the tests. The damage indices outlined in previous subsection were
adopted for the damage model analysis of the experimental results.
5.4.3.1 Tested specimen selection and damage definition
As reported in Chapter 3, the laboratory tests on 6 specimens are classified by
two connection categories: (I) weak blind bolt & strong CFT column, and (II)
strong blind bolt & weak CFT column. There are three primary considerations
in the selection of tested specimens for damage analysis. First, it is possible to
represent the typical damage modes of two categories of the connection.
Second, the structural properties and numbers of loading cycles should be well
recorded to establish related relationship of structural damage. Third, the
assumed failure point of the tested specimen should be able to feature the local
damage evolution and associate with the structural capacity parameters for
structural damage definition.
The test results of the specimens BBEC-S-S.S-50-LJ and BBEC-S-I0.9-50-LJ
were selected to represent the failure with ultimate damage due to the brittle
fracture of the bolt shank. The ultimate failure phenomenon is instantaneous
with sudden drop of loading capacity preceded by the arrival of peak moment.
Under this circumstance, the structural failure is obvious. In the other cases,
166
Chapter 5: Cyclic characterizing parameter & cumulative damage analysis
the test results of the specimens BBEC-5-8.8-50-LII and BBEC-6.3-8.8-25-LII
were chosen to account for gradual failure mode. After peak moment, the
connections went through continuous cycles and sustained degraded moments.
The decrease of load carrying capacity is often adopted as the failure criteria
to assume the failure of the connection. In this study, it is assumed that the
maximum strength reduction of 300/0-40% of the observed peak load as the
severe failure of the connection. Although the connection may still be able to
undergo some loads, it is better to assume the connection attain the failure
state. In practice, the local failure observation at this stage might be apparent,
e.g., the great losses of concrete anchorage, local concrete crushing, and
excessive deformation around bolt hole on the tube connecting face and local
bolt pullout.
5.4.3.2 Damage analysis and comparison of test specimens
Using damage indices outlined in Section 5.4.2, the relationships of
progressive damage indices and loading cycle are shown from Figure 5.9 to
Figure 5.12. For low cycle fatigue based damage model (Krawinkler & Zohrei,
1982), the calibrating exponent parameter (c) were taken as 1.0 and 1.6 for
comparison, corresponding to the labels of 'Krawinkler I' (K 1) and
'Krawinkler 1.6' (K 1.6) respectively. The normalized value of damage index
was taken as the ratio of the results calculated by damage functional
expressions at deterioration state to those at ultimate state. When the damage
index ratio reaches 1.0, the failure of the connection is assumed to occur. For
the purpose of relating structural performance level to physical damage, the
damage level classification proposed by Park et al. (1985) was also used as a
167
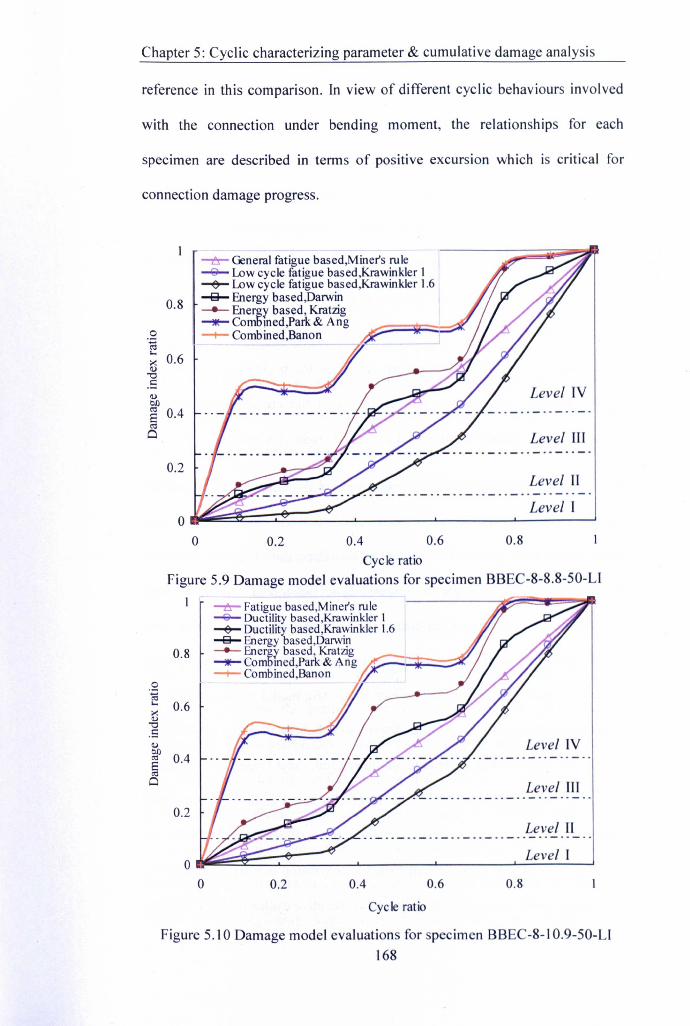
Chapter 5: Cyclic characterizing parameter & cumulative damage analysis
reference in this comparison. In view of different cyclic behaviours involved
with the connection under bending moment, the relationships for each
specimen are described in terms of positive excursion which is critical for
connection damage progress.
0.2
-t!- General fatigue based,Miner's rule-e- Lowcycle fatigue based,krawinkler I--e- Lowcycle fatigue based,Krawinkler 1.6~ Energy based,Darwin_._ Energy based, Kratzig~Comb!Oed,Park& Ang
, --+- Combined,Banon
0.8o.~~ 0.6'0s::1.)
~E 0.4oj
Cl
Level IV
Level II
o 0.2 0.4 0.6 0.8Cycle ratio
Figure 5.9 Damage model evaluations for specimen BBEC-8-8.8-50-L11
0.2
~ Fatigue based,Miner's rule~ Ductility based,Krawinkler1--e- Ductilitybased,Krawinkler1.6-S- Energybased,Darwin_._ Energybased, Kratzig~ Combined.Park & Ang ~--+- Combined,Banon 1/
0.8
.gC<l,_ 0.6~"0.51.)
~ 0.4C<lCl
Level IV
Level H
o 0.2 0.4 0.6 0.8Cycle ratio
Figure 5.10 Damage model evaluations for specimen BBEC-8-1 O.9-50-LJ168

Chapter 5: Cyclic characterizing parameter & cumulative damage analysis
Visual inspection of Figure 5.9 to Figure 5.12 indicates an obvious stepwise
increasing style for the energy based damage models and the combined
models. This seems to display in similar manner with ECCS loading procedure,
in which the displacement amplitude is increased step by step. For the
combined models, the damage index ratios predicted by Banon are slightly
larger than those by Park & Ang. When comparing the prediction of combined
models with the energy based models, it is interesting to observe that the
combined models, taking into account the contribution of ductility, indicate
much higher prediction of damage especially at the beginning stage of the
loading process. The damage indices curves of the energy based Kratzig
model lie between Darwin model and combined models for all cases.
With regard to the damage model, the slope of the curve is often used to
indicate the deterioration of the connection, i.e., the larger slope of the damage
index variation the greater deterioration of the connection. It can be seen that
the slopes between the points corresponding to the end of a given loading
amplitude and the onset of a following loading amplitude are moderately close
for the group of combined models and the group of energy based models
(except for some discrepancies involved in Kratzig model in the case of the
connection category II), i.e., similar deterioration behaviour of the connections.
Within the same loading amplitude, on other hand, most slopes of the curves,
except the beginning range, related to the energy based models are obviously
higher than those referring to the combined models. When compared with the
combined model, this suggests that energy deterioration is better evaluated by
the energy based models for the follower consecutive cycles of given loading
169
Chapter 5: Cyclic characterizing parameter & cumulative damage analysis
amplitude. The energy based Darwin model prediction in most cases lie
between the general fatigue based model and the combined models. By
contrast, the energy based Kratzig model presents larger predictions of
damage than Darwin model. In the cases plotted in Figure 5.11 and Figure
5.12, an even higher prediction of damage can be seen for the Kratzig model
as the cycle ratio is greater than 0.5 as compared with the combined models.
The comparison of general fatigue and low cycle fatigue based models against
the models discussed above show approximately linear and multi-linear
increases respectively for most range of the predicted curves without obvious
steps as the loading progressed into repeated cycles. For the general fatigue
based model, the curves demonstrate a stable increase and distribute fairly
close to the cater-comer across from origin to the endpoint of the graph. In
comparison, the curves predicted by the low cycle fatigue based damage
models are below those predicted by all the other models. This suggests that
they might not well take into account the variation during the follower
consecutive cycles due to the neglect of energy dissipation.
The calibrating exponent in the low cycle fatigue based damage model is seen
to greatly influence the predicted damage index ratio, i.e., the predicted
damage index ratio increases with decreased calibrating exponent values. It is
also evident from the figures that the predicted deterioration of the connection
varies 'with the calibrating exponent. Comparing the curve slope predicted by
the low cycle fatigue based models, the deteriorations of the connection
predicted by the Krawinkler 1.6 model are lower than that of the Krawinkler 1
model at the beginning stage of the loading process (Cycle ratio<0.5).
170
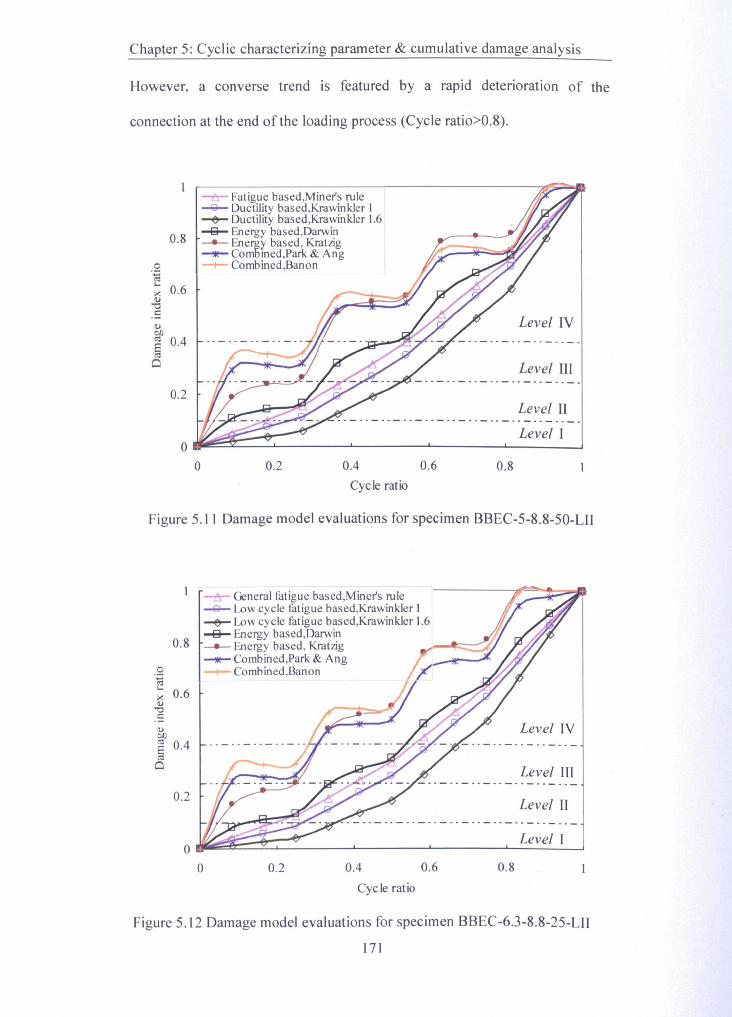
Chapter 5: Cyclic characterizing parameter & cumulative damage analysis
However, a converse trend is featured by a rapid deterioration of the
connection at the end of the loading process (Cycle ratio>O.8).
o.~~ 0.6"0.5
-tr Fatigue based.Miner's rule~ Ductility based,Krawinkler I,-+- Ductility based,Krawinkler 1.6-e- Energy based,Darwin
0.8 __ Energy based, Kratzig....... Combined.Park & Ang--+- Combined,Banon
Level IV
Level III
0.2Level II
o 0.2 0.4
Cycle ratio
0.6 0.8
Figure 5.11 Damage model evaluations for specimen BBEC-5-8.8-50-LII
0.2
-tr- General fatigue based.Miner's rule~ Low cycle fatigue based,Krawinkler I-+- Low cycle fatigue based,Krawinkler 1.6-e- Energy based,Darwin-- Energy based, Kratzig....... Combined,Park & Ang--+- Combined,Banon
0.8
o.~~ 0.6~c4)
~§ 0.4Cl
Level IV
o 0.2 0.4 0.6 0.8
Cycle ratio
Figure 5.12 Damage model evaluations for specimen BBEC-6.3-8.8-25-LII
171
Chapter 5: Cyclic characterizing parameter & cumulative damage analysis
In order to have a closer look at the use of the damage model in evaluating the
progressive damage, it was felt that the necessity to further the comparative
study of different connection categories. For the connection category I (Weak
blind bolt & strong CFT column), the comparison of Figure 5.9 and Figure
5.10 shows similar variations of damage indices for both cases, although a
slight difference is indicated for the energy based damage indices. For the
connection category II (Strong blind bolt & weak CFT column), it can be seen
that the connections with CFT columns of weak tube face (Figure 5.11)
present a slightly higher damage indices than those with lower concrete grade
(Figure 5.12) as the cycle ratio ranges from 0 to 0.5. This trend is reversed for
the curves with cycle ratio ranging from 0.7 to 1.0. Moreover, the damage
indices curves predicted by the energy based and combined damage indices
(Park & Ang, Banon) are more susceptible to change than those predicted by
the other indices. This implies that the contribution of energy dissipation to the
connection damage might be significantly influenced by altering concrete
strength and tube face thickness.
When further comparing the damage indices between th~ connections of the
two categories, it can be deduced that the combined damage indices (Park &
Ang, Banon) would represent higher initial damage for the connection
category I than those for the connection category II. For instance, the
connections with cycle ratio ranging between 0.1 to 0.3 resulted in damage
index value around 0.5 for category I (referring to Figure 5.9a) compared with
a damage index value nearly 0.3 for category II (referring to Figure 5.12a). As
for the energy based Darwin damage index, it can be seen that the curves for
172
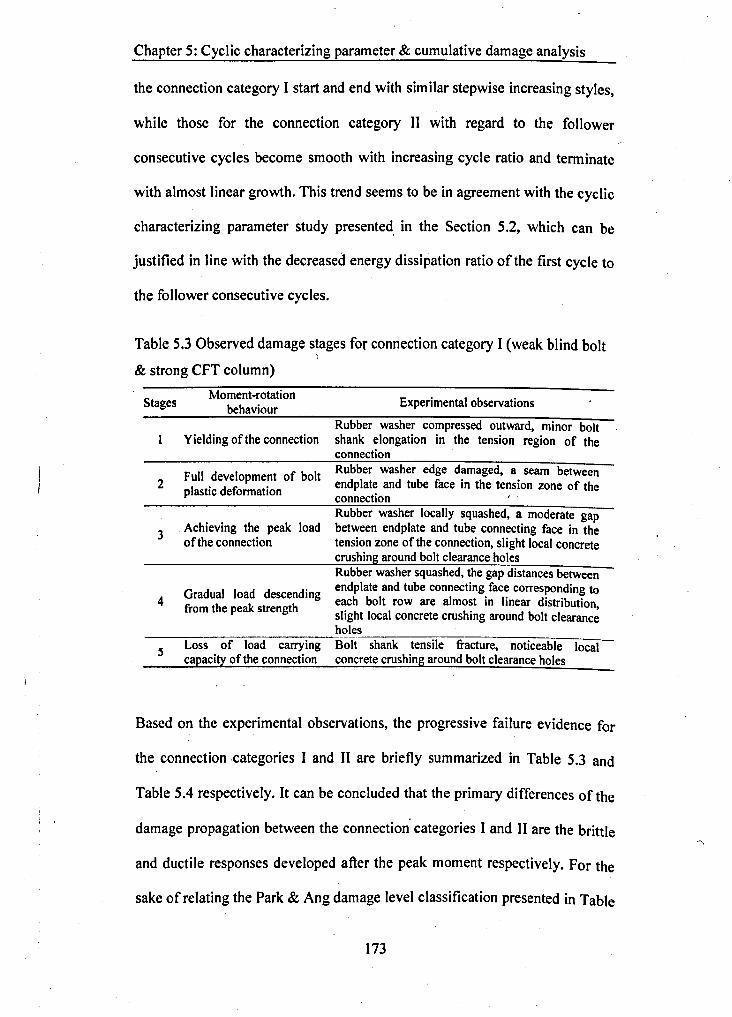
Chapter 5: Cyclic characterizing parameter & cumulative damage analysis
the connection category I start and end with similar stepwise increasing styles,
while those for the connection category II with regard to the follower
consecutive cycles become smooth with increasing cycle ratio and terminate
with almost linear growth. This trend seems to be in agreement with the cyclic
characterizing parameter study presented, in the Section 5.2, which can be
justified in line with the decreased energy dissipation ratio of the first cycle to
the follower consecutive cycles.
Table 5.3 Observed damage stages for connection category I (weak blind bolt.,& strong CFT column)
StagesMoment-rotation
behaviour Experimental observations
Yielding of the connectionRubber washer compressed outward, minor boltshank elongation in the tension region of theconnection
2 Full development of boltplastic deformation
Rubber washer edge damaged, a seam betweenendplate and tube face in the tension zone of theconnection
3 Achieving the peak loadof the connection
Rubber washer locally squashed, a moderate gapbetween endplate and tube connecting face in thetension zone of the connection, slight local concretecrushing around bolt clearance holesRubber washer squashed, the gap distances betweenendplate and tube connecting face corresponding toeach bolt row are almost in linear distribution,slight local concrete crushing around bolt clearanceholes
--s---L-o-s-s--o~f~lo-a~d--ca-rry~in-g--=Bolt'~s~h~an~k~t~e~ns~il~e-'fr~a~c~tm~e~,~n~o~tic-e-a~bl~e~lo-c-a71-capacity of the connection concrete crushing around bolt clearance holes
4 Gradual load descendingfrom the peak strength
Based on the experimental observations, the progressive failure evidence for
the connection categories I and II are briefly summarized in Table 5.3 and
Table 5.4 respectively. It can be concluded that the primary differences ofthe
damage propagation between the connection' categories I and II are the brittle
and ductile responses developed after the peak moment respectively. For the
sake of relating the Park & Ang damage level classification presented in Table
173
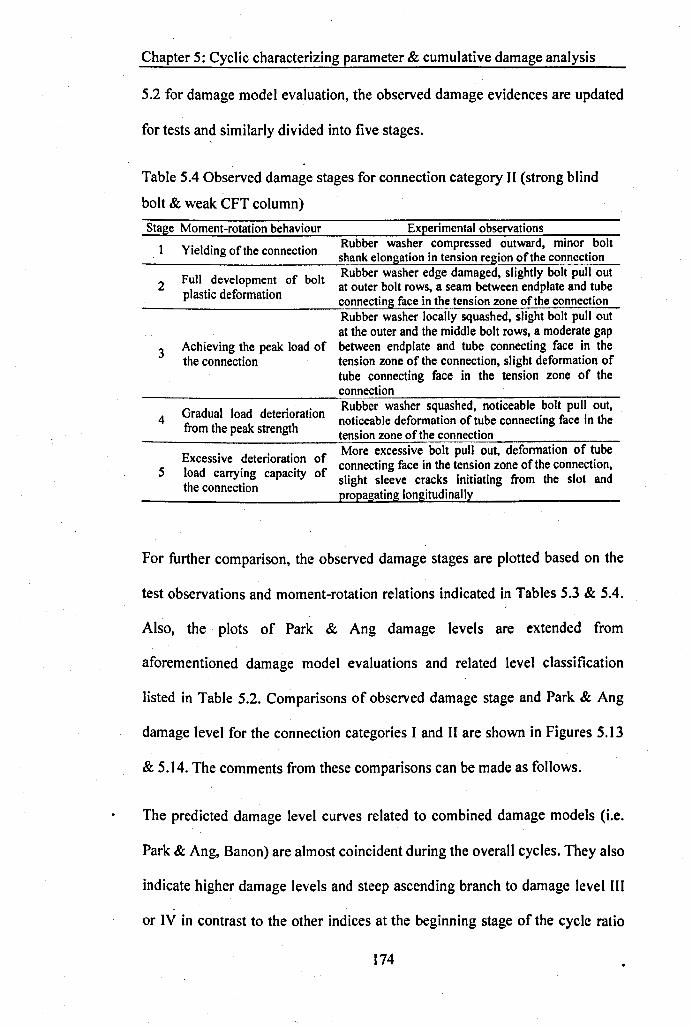
Chapter 5: Cyclic characterizing parameter & cumulative damage analysis
5.2 for damage model evaluation, the observed damage evidences are updated
for tests and similarly divided into five stages.
Table 5.4 Observed damage stages for connection category II (strong blind
bolt & weak CFT column)
Stage Moment-rotation behaviour Experimental observations
2 Full development of boltplastic deformation
Rubber washer compressed outward, minor boltshank elongation in tension region of the connectionRubber washer edge damaged, slightly bolt pull outat outer bolt rows, a seam between endpiate and tubeconnecting face in the tension zone of the connection
1 Yielding of the connection
3 Achieving the peak load ofthe connection
Rubber washer locally squashed, slight bolt pull outat the outer and the middle bolt rows, a moderate gapbetween endplate and tube connecting face in thetension zone of the connection, slight deformation oftube connecting face in the tension zone of theconnection
4 Gradual load deteriorationfrom the peak strength
Rubber washer squashed, noticeable bolt pull out,noticeable deformation of tube connecting face in thetension zone of the connection
5Excessive deterioration ofload carrying capacity ofthe connection
More excessive bolt pull out, deformation of tubeconnecting face in the tension zone of the connection,slight sleeve cracks initiating from the slot andpropagating longitudinally
For further comparison, the observed damage stages are plotted based on the
test observations and moment-rotation relations indicated in Tables 5.3 & 5.4.
Also, the plots of Park & Ang damage levels are extended from
aforementioned damage model evaluations and related level classification
listed in Table 5.2. Comparisons of observed damage stage and Park & Ang
damage level for the connection categories I and II are shown in Figures 5.13
& 5.14. The comments from these comparisons can be made as follows.
The predicted damage level curves related to combined damage models (Le.
Park & Ang, Banon) are almost coincident during the overall cycles. They also
indicate higher damage levels and steep ascending branch to damage level III
or IV in contrast to the other indices at the beginning stage of the cycle ratio
174

Chapter 5: Cyclic characterizing parameter & cumulative damage analysis
range. From the theoretical point of view, this can be explained by the fact that
a relatively small energy contribution was allowed for in the combined
damage models which implies somewhat overestimated predicted damage
levels with respect to experimental observations. Conversely, the low cycle
fatigue based models with no consideration of energy characteristics present
relatively underestimated prediction of damage level in the most cycle ratio
range. The damage level prediction in this group is also influenced by
predefined calibration exponent, 'c', i.e. the predicted results of 'Krawinkler
1.6' model are much lower than those of the 'Krawinkler l' model. By
contrast, the energy based models (Darwin and Kratzig models) are seen to
exhibit moderate progressive damage which correlate better with damage
stages observed in the tests, such as the energy based Darwin model for the
connection category I (except cycle ratio range 0.56-0.89) and the energy
based Kratzig model for the connection category II (except cycle ratio range
0.18-0.36). Consequently, to feature the damage levels of such connections
under cyclic loading, it is suggested to properly take into account the energy
characteristics in the formulation of damage indices related. This is especially
useful in accurately capturing slight and moderate damages of the connections .
although the severe damage level at the final stage could be unsurprisingly
predicted by most referred damage models. Otherwise, the predicted damage
levels could overestimate or underestimate actual damage levels observed in
the experimental tests.
175
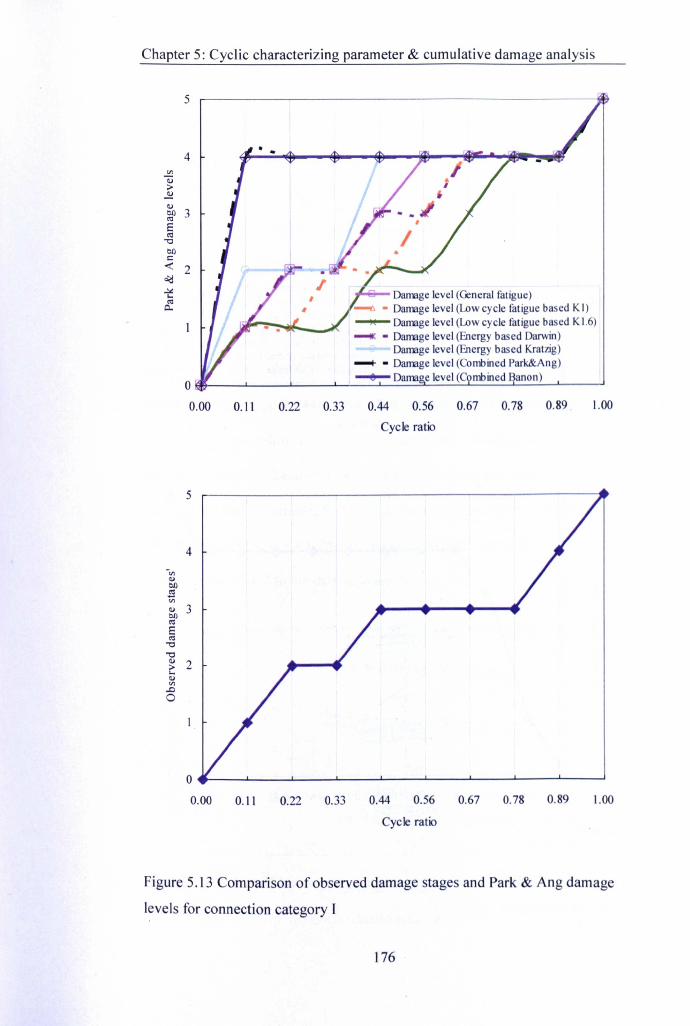
Chapter 5: Cyclic characterizing parameter & cumulative damage analysis
5
4
Damage level (General fatigue)......-. - Damage level (Low cycle fatigue based KI).-ow- Damage level (Low cycle fatigue based K 1.6)--II: - Damage level (Energy based Darwin)
Damage level (Energy based Kratzig)--+- - Damage level (Combined Park&Ang)
O~ ~ ~ ~ __ ~L-=D=ama~~e~le_ve~I~~~mb~in~e=d~B=an~o~n~)~ -J
0.00 0.11 0.22 0.33 0.44 0.56 0.67 0.78 0.89 1.00
Cycle ratio
5
4-tIl.,01)
~'"., 301)«lE«l"0"0.,
2>....,'"..00
O~--~----~--~----~--~----~--~----~--~0.00 0.11 0.22 0.33 0.44 0.56 0.67 0.78 0.89 1.00
Cycle ratio
Figure 5.13 Comparison of observed damage stages and Park & Ang damage
levels for connection category [
176
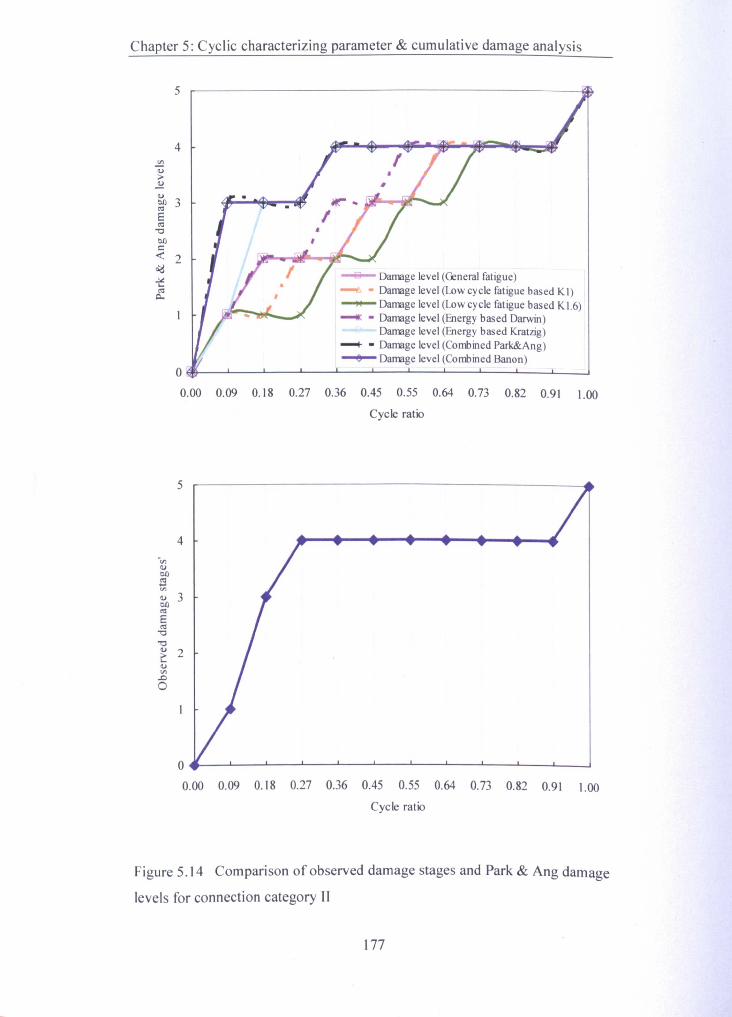
Chapter 5: Cyclic characterizing parameter & cumulative damage analysis
5
4
---iiI- Damage level (General fatigue)---to - Damage level (Low cycle fatigue based Kl)~ Damage level (Low cycle fatigue based K1.6)......: - Damage level (Energy based Darwin)
Damage level (Energy based Kratzig)--+ - Damage level (Combined Park&Ang)--e-- Damage level (Combined Banon)
O~--~--~--~--~--~--~--~--~---L---L __~0.00 0.09 0.18 0.27 0.36 0.45 0.55 0.64 0.73 0.82 0.91 1.00
Cycle ratio
5
4-ell
11)bIl.'Sell
11) 3bIl
'"E'""0"011) 21:11)ell.0
0
O~--~--~--~--~--~--~--~--~--~--~--~0.00 0.09 0.18 0.27 0.36 0.45 0.55 0.64 0.73 0.82 0.91 1.00
Cycle ratio
Figure 5.14 Comparison of observed damage stages and Park & Ang damage
levels for connection category II
177
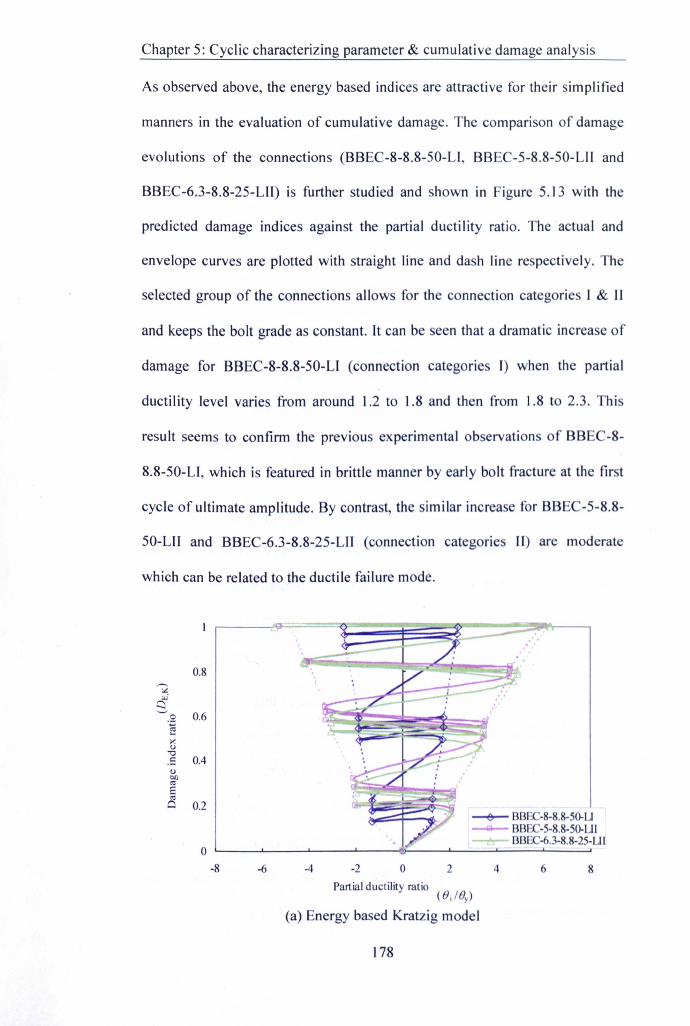
Chapter 5: Cyclic characterizing parameter & cumulative damage analysis
As observed above, the energy based indices are attractive for their simplified
manners in the evaluation of cumulative damage. The comparison of damage
evolutions of the connections (BBEC-8-8.8-50-LI, BBEC-5-8.8-50-UI and
BBEC-6.3-8.8-25-LII) is further studied and shown in Figure 5.13 with the
predicted damage indices against the partial ductility ratio. The actual and
envelope curves are plotted with straight line and dash line respectively. The
selected group of the connections allows for the connection categories I & II
and keeps the bolt grade as constant. It can be seen that a dramatic increase of
damage for BBEC-8-8.8-50-U (connection categories I) when the partial
ductility level varies from around 1.2 to 1.8 and then from 1.8 to 2.3. This
result seems to confirm the previous experimental observations of BBEC-8-
8.8-50-U, which is featured in brittle manner by early bolt fracture at the first
cycle of ultimate amplitude. By contrast, the similar increase for BBEC-5-8.8-
50-UI and BBEC-6.3-8.8-25-UI (connection categories II) are moderate
which can be related to the ductile failure mode.
~ BBEC-S-S.S-50-U- BBEC-S-S.S-50-UI---- BBEC-6.3-S.S-25-LH
O.S,-,
'"OJ"e_0.6.g
s~0
"c: 0.40eo'"E'"Q 0.2
0-S -6 -4 -2 0 2 4 6 8
Partial ductility ratio(B,IBy)
(a) Energy based Kratzig model
178
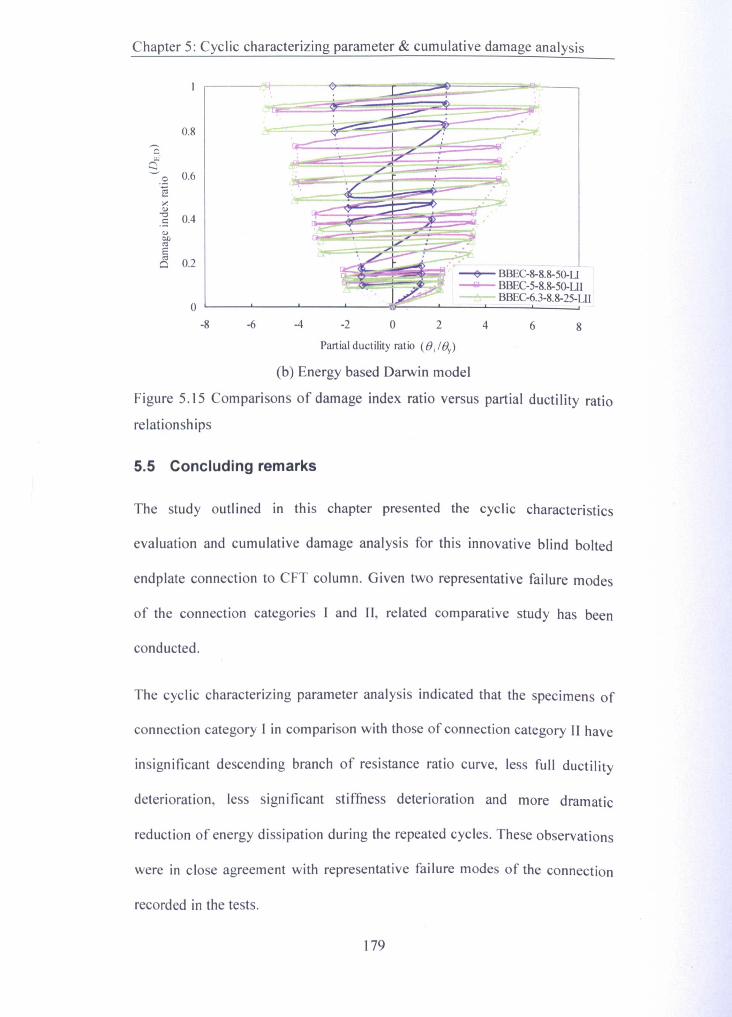
Chapter S: Cyclic characterizing parameter & cumulative damage analysis
--+- BBEC-S-S.S-50-U-- BBEC-5-8.8-50-W
BBEC-6.3-8.8-2S-LU
O.S'0wS
0 0.6.~)(
'""0 0.40:
<UOt)t<SEt<S 0.2Cl
0-8 -6 -4 -2 0 2 4 6 8
Partial ductility ratio (8, /ey)
(b) Energy based Darwin model
Figure S.IS Comparisons of damage index ratio versus partial ductility ratio
relationships
5.5 Concluding remarks
The study outlined in this chapter presented the cyclic characteristics
evaluation and cumulative damage analysis for this innovative blind bolted
endplate connection to CFT column. Given two representative failure modes
of the connection categories I and II, related comparative study has been
conducted.
The cyclic characterizing parameter analysis indicated that the specimens of
connection category I in comparison with those of connection category II have
insignificant descending branch of resistance ratio curve, less full ductility
deterioration, less significant stiffness deterioration and more dramatic
reduction of energy dissipation during the repeated cycles. These observations
were in close agreement with representative failure modes of the connection
recorded in the tests.
179

Chapter 5: Cyclic characterizing parameter & cumulative damage analysis
The observation in the comparison of hysteretic moment-rotation relationships
with codified ductility levels has shown that the test specimens of connection
category I and connection category II could satisfy the connections in the
frame classified as medium ductility class (OCM) with behaviour factor (q)
larger than 2.0 and the high ductility class (DCH) respectively.
Finally, the analysis of the experimental data was analysed using damage
indices which are based on the characteristics of fatigue, energy and combined
energy & ductility. Related : comparative study was conducted with
consideration of different damage evolutions for the connection categories I
and II. It seemed that the energy based cumulative damage index is better than
the other indices in featuring the progressive damage process of the
connection. Given the failure modes of the connection during the inelastic
range of cyclic loading, the relevant experimental observations were also
summarized in terms of damage stages and compared with the general Park &
Ang damage level classification. It has been demonstrated that the use of
damage levels & stages in relation to the general fatigue based model, the low
cycle fatigue based models and the energy based models for the analysis of
cyclic behaviour of the connections. Additionally, the energy based damage
model was analysed by using partial ductility ratio. The presented results were
seemed to well represent the failure modes development observed in the
experiments.
The cyclic characteristics evaluation and cumulative damage model analysis in
this study were limited to the cyclic loading procedure as non-constant
displacement amplitudes (as specified in ECCS recommendation). The failure
180

Chapter 5: Cyclic characterizing parameter & cumulative damage analysis
modes are also restricted to those of the connection categories I and II of this
type of the connection.
181

Chapter 6: Finite element modelling
CHAPTER6
FINITE ELEMENT MODELLING
6.1 Introduction
The preceding chapter outlined an analysis of the connection behaviours using
cyclic characterizing parameters and damage models. Although the outcomes
provided by experimental approach ar~ direct indications of the connection
behaviour, they are limited in terms of the number and range of geometric and
material parameters studied. It is also difficult to conduct costly and time-
consuming experimental parametric studies. Moreover, the data that can be .
measured in experiments are necessarily limited by possible instrumentations.
For example, it is not possible to measure with ease data relating to the flaring
sleeves interlocking or to the anchored nut in the concrete. Fortunately, the
recent development in finite· element modelling technology has made it
possible to simulate the behaviour of complex engineering problems. In other
words, the finite element modelling with reasonable accuracy acts an efficient
tool to supplement experimental study. Also, using finite element modelling
for parametric study is a powerful means in developing the understanding of
the structural behaviour Of the connection.
Finite element modelling in this study was carried out using the ANSYS
software (ANSYS version 12.1, 2009) which has been widely adopted for
structural analysis by both academia and industry. This program provides
powerful linear and nonlinear structural capabilities with a wide range of
options regarding material, element and solution controls for high-quality and
182
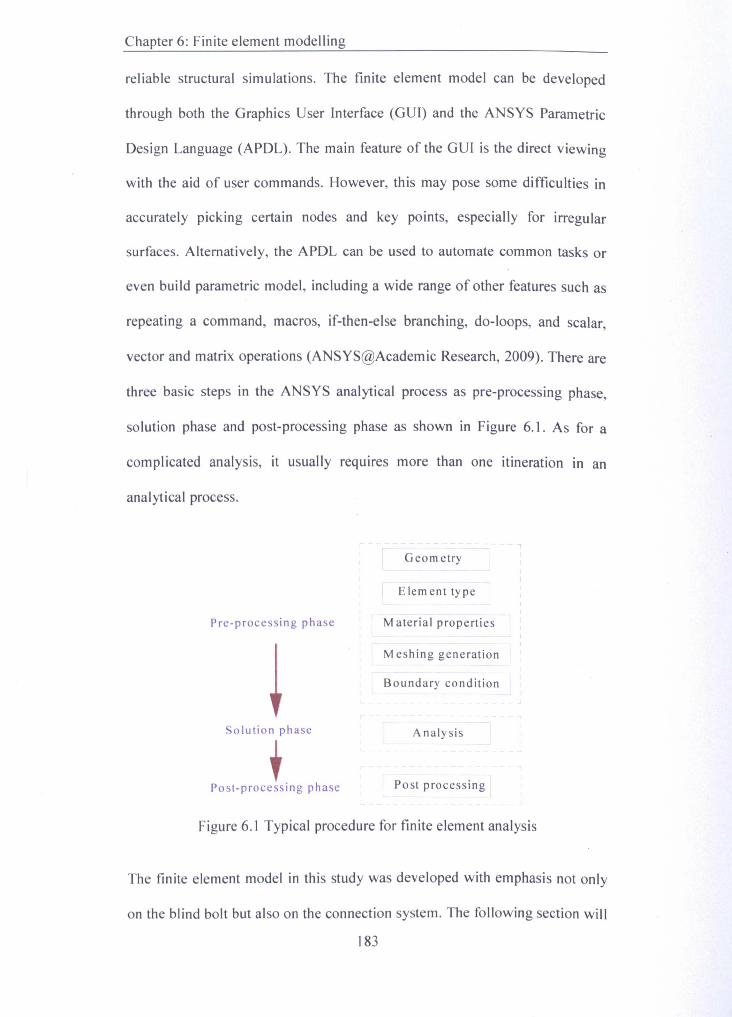
Chapter 6: Finite element modelling
reliable structural simulations. The finite element model can be developed
through both the Graphics User Interface (GUI) and the ANSYS Parametric
Design Language (APOL). The main feature of the GUI is the direct viewing
with the aid of user commands. However, this may pose some difficulties in
accurately picking certain nodes and key points, especially for irregular
surfaces. Alternatively, the APDL can be used to automate common tasks or
even build parametric model, including a wide range of other features such as
repeating a command, macros, if-then-else branching, do-loops, and scalar,
vector and matrix operations (ANSYS@Academic Research, 2009). There are
three basic steps in the ANSYS analytical process as pre-processing phase,
solution phase and post-processing phase as shown in Figure 6.1. As for a
complicated analysis, it usually requires more than one itineration in an
analytical process.
G eom etry
Element type
Pre-processing phase M aterial properties
M eshing generation
Boundary condition
Solution phase
+Post-processing phase
Analysis
Post processing
Figure 6.1 Typical procedure for finite element analysis
The finite element model in this study was developed with emphasis not only
on the blind bolt but also on the connection system. The following section will
183
Chapter 6: Finite element modelling
present a step-by-step procedure of the development of finite element model.
In Section 6.2, the general description of the material model and related
element type in ANSYS is presented. Then the boundary condition and
loading case are outlined. The solution control method is also described for
finite element analysis. Following the general description of the finite element
model, the use of advanced analysis techniques to facilitate the simulation of
the finite element model is indicated. The validation of the finite element
model with experimental results is described in Section 6.3 including the
comparison of moment-rotation relationship and strain distribution of the
connection. The failure modes of the connection are then depicted and traced
with the stress contours finite element model. The parametric study is
presented in Section 6.4, including the comparison of geometric and
mechanical influential parameters in the finite element analysis. The
comparative study of the adopted modelling techniques is also outlined.
Finally, a brief summary and discussion about the finite element analysis for
the cyclic behaviour of the connection are presented in Section 6.5.
6.2 General description of finite element model
6.2.1 Element type
) The element type is often considered to fit the geometry of the model. Two
dimensional and three dimensional elements were adopted first in this study
for finite element analysis. Shell elements are two-dimensional element that
typically used for the structures where the thickness is negligible compared to
its length and width. Solid elements are three-dimensional element that
184
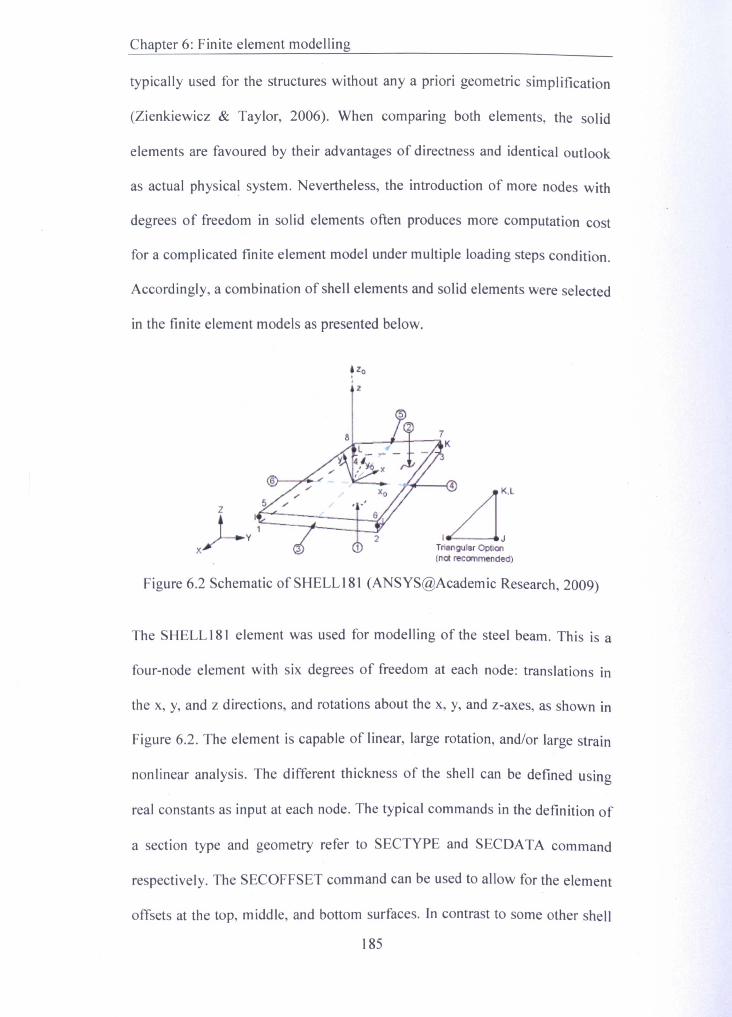
Chapter 6: Finite element modelling
typically used for the structures without any a priori geometric simplification
(Zienkiewicz & Taylor, 2006). When comparing both elements, the solid
elements are favoured by their advantages of directness and identical outlook
as actual physical system. Nevertheless, the introduction of more nodes with
degrees of freedom in solid elements often produces more computation cost
for a complicated finite element model under multiple loading steps condition.
Accordingly, a combination of shell elements and solid elements were selected
in the finite element models as presented below.
Tnangular Option(not recanmended)
Figure 6.2 Schematic of SHELL 181 (ANSYS@Academic Research, 2009)
The SHELL 181 element was used for modelling of the steel beam. This is a
four-node element with six degrees of freedom at each node: translations in
the x, y, and z directions, and rotations about the x, y, and z-axes, as shown in
Figure 6.2. The element is capable of linear, large rotation, and/or large strain
nonlinear analysis. The different thickness of the shell can be defined using
real constants as input at each node. The typical commands in the definition of
a section type and geometry refer to SECTYPE and SECDATA command
respectively. The SECOFFSET command can be used to allow for the element
offsets at the top, middle, and bottom surfaces. In contrast to some other shell
185
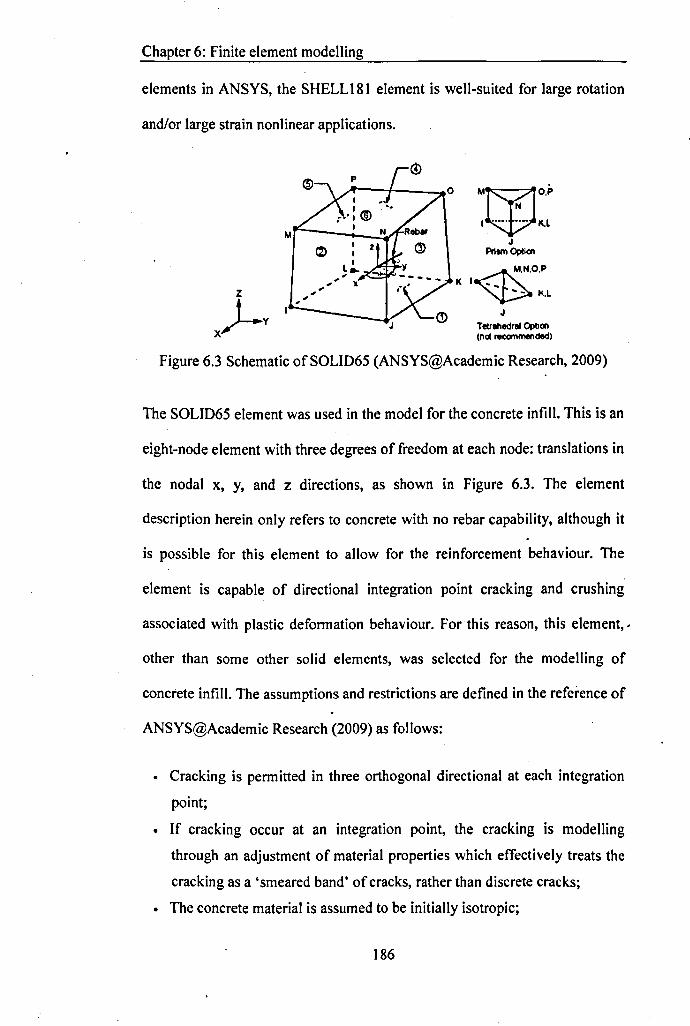
Chapter 6: Finite element modelling
elements in ANSYS, the SHELL181 element is well-suited for large rotation
and/or large strain nonlinear applications.
MT?10'P
I~K.LJ
PrIsm OpIla'I
MNO,PK I
IC.,L
JTetrahedral OplJa'I(nat rac:ommended)
Figure 6.3 Schematic ofSOLID65 (ANSYS@Academic Research, 2009)
The SOLID65 element was used in the model for the concrete infill. This is an
eight-node element with three degrees of freedom at each node: translations in
the nodal x, y, and z directions, as shown in Figure 6.3. The element
description herein only refers to concrete with no rebar capability, although it
is possible for this element to allow for the reinforcement behaviour. The
element is capable of directional integration point cracking and crushing
associated with plastic deformation behaviour. Forthis reason, this element..
other than some other solid elements, was selected for the modelling of
concrete infill. The assumptions and restrictions are defined in the reference of
ANSYS@Academic Research (2009) as follows:
• Cracking is permitted in three orthogonal directional at each integration
point;
• If cracking occur at an integration point, the cracking is modelling
through an adjustment of material properties which effectively treats the
cracking as a 'smeared band' of cracks, rather than discrete cracks;
• The concrete material is assumed to be initially isotropic;
186
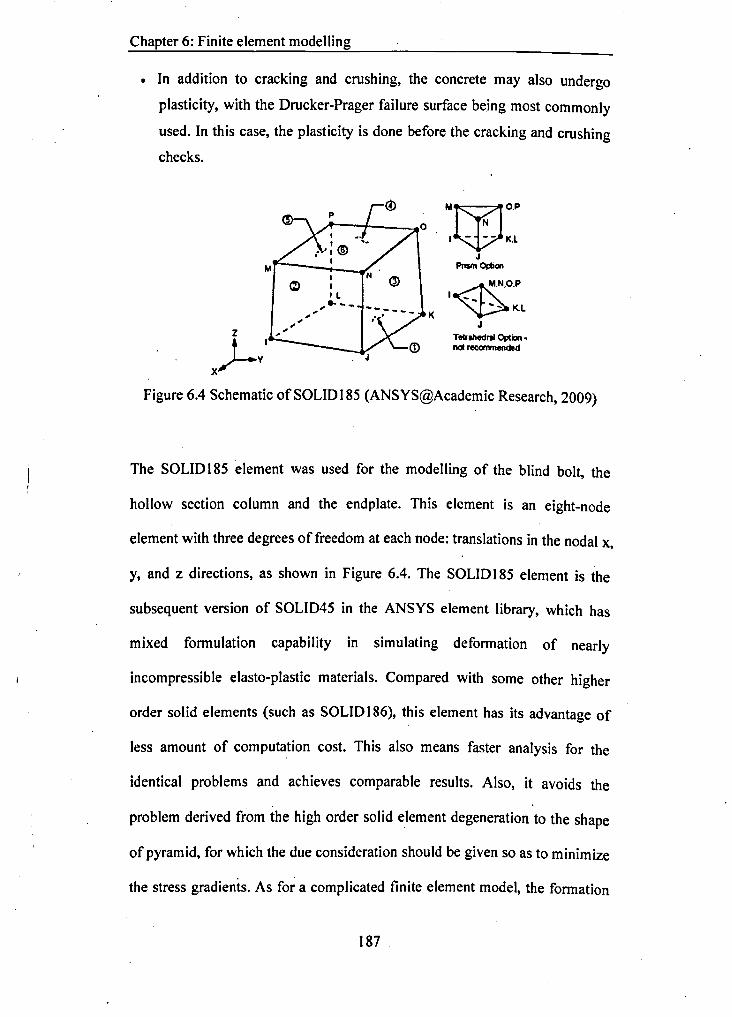
Chapter 6: Finite element modelling
• In addition to cracking and crushing, the concrete may also undergo
plasticity, with the Drucker-Prager failure surface being most commonly
used. In this case, the plasticity is done before the cracking and crushing
checks.
K
Mfy.10'P',0~L
JPnsm~on
I~N,O,P
~~LJ
Tecr-"edl'll Option •!lOt recamnended
Figure 6.4 Schematic of SOLID 185 (ANSYS@Academic Research, 2009)
The SOLID 185 element was used for the modelling of the blind bolt, the
hollow section column and the endplate. This element is an eight-node
element with three degrees of freedom at each node: translations in the nodal x,
y, and z directions, as shown in Figure 6.4. The SOLID185 element is the
subsequent version of SOLID45 in the ANSYS element library, which has
mixed formulation capability in simulating deformation of nearly
incompressible elasto-plastic materials. Compared with some other higher
order solid elements (such as SOLIDI86), this element has its advantage of
less amount of computation cost. This also means faster analysis for the
identical problems and achieves comparable results. Also, it avoids the
problem derived from the high order solid element degeneration to the shape
of pyramid, for which the due consideration should be given so as to minimize
the stress gradients. As fo~a complicated finite element model, the formation
187
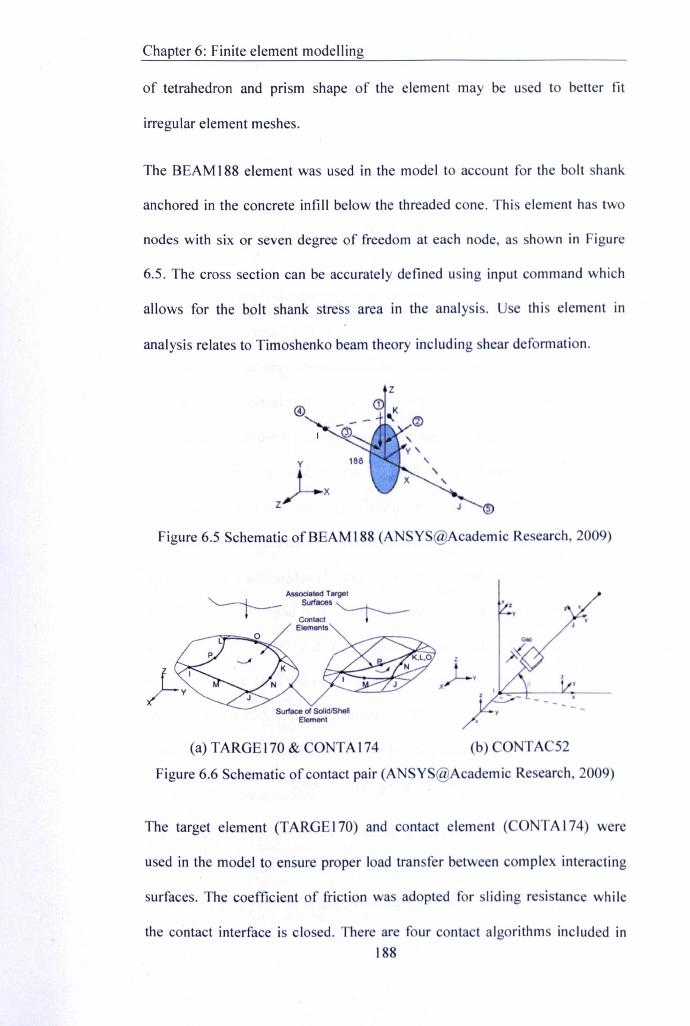
Chapter 6: Finite element modelling
of tetrahedron and prism shape of the element may be used to better fit
irregular element meshes.
The BEAM 188 element was used in the model to account for the bolt shank
anchored in the concrete infill below the threaded cone. This element has two
nodes with six or seven degree of freedom at each node, as shown in Figure
6.5. The cross section can be accurately defined using input command which
allows for the bolt shank stress area in the analysis. Use this element in
analysis relates to Timoshenko beam theory including shear deformation.
J-xz
Figure 6.5 Schematic of BEAM 188 (ANSY Academ ic Re earch, 2009)
Assoeated Target'---t-- Surfaces "-t-...._ ~Contact 1-Elements
Surface or SoIldlShellElement
(a)TARGEI70&CONTAI74 (b)C N A 52
Figure 6.6 Schematic of contact pair (AN Y Academic Re earch,2009)
The target element (TARGE 170) and contact element ( ONTA 174) were
used in the model to ensure proper load transfer between complex interacting
surfaces. The coefficient of friction was adopted for sliding resistance while
the contact interface is closed. There are four contact algorithms included in188
Chapter 6: Finite element modelling
the contact analysis as: pure penalty method, augmented LagrangIan method,
pure Lagrange multiplier method and pure Lagrange multiplier on contact
normal & penalty on frictional direction method (ANSYS@Academic
Research, 2009). As shown in Figure 6.6 (a), this target surface is discretized
by a set of target elements and then paired with its associated contact surface.
A contact pair is intended for general rigid-flexible and flexible-flexible
contact analysis. A real constant set is shared by target and associated contact
elements. The contact pair allows for small sliding interaction between a
deformable and a rigid body, one of which is defined as master surface and the
other as slave surface. For the sake of a smooth distribution of the contact
stress along the interface, an appropriate mesh density is required. The contact
pairs shown in Figure 6.6 in the solid element models are identified between
the following surfacesiI l) bottom surface of the bolt head and top surface of
the flat part of the sleeves, (2) endplate surface and tube connecting face, (3)
concrete and anchored part of the sleeves, and (4) concrete and anchored bolt "
shank & nut below the threaded cone. For the solid & beam element model, on
the other hand, 3D point to point contact element, CONTAC52, was used to
connect the nodes of bolt shank below the threaded cone and concrete in
contact. This element is defined by normal stiffness (KN) and stic~ing
stiffness (KS) along with related initial gap or interference (GAP) and element
status (START)(ANSYS@Academic Research, 2009).
The PRETS 179 element was used in the model for the blind bolt preload. This
is a two-node element with one translation degrees of freedom, as ~hown in
Figure 6.7. The PRETS 179 element has advantage in its allowance for directly
189
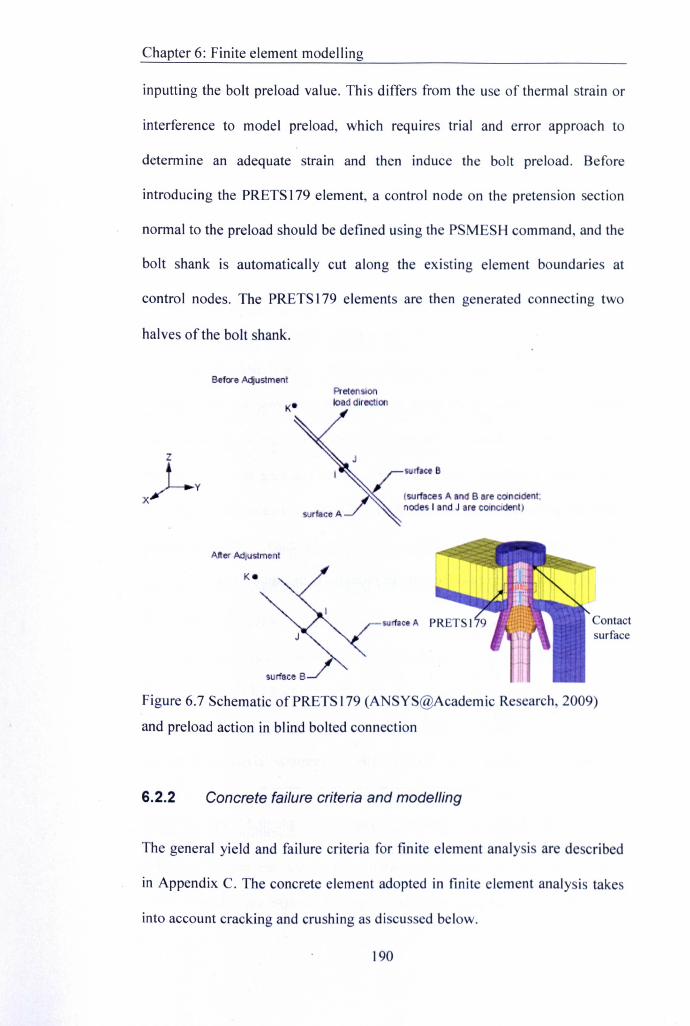
Chapter 6: Finite element modelling
inputting the bolt preload value. This differs from the use of thermal strain or
interference to model preload, which requires trial and error approach to
determine an adequate strain and then induce the bolt preload. Before
introducing the PRETS 179 element, a control node on the pretension section
normal to the preload should be defined using the PSMESH command, and the
bolt shank is automatically cut along the existing element boundaries at
control nodes. The PRETS 179 elements are then generated connecting two
halves of the bolt shank.
Before AdjustmentPretMSlOOloaddrec on
J-vX
wrfac B
(surfaces A nd B lire coincident:node~ I and J are concident)
After Adjustment
Figure 6.7 Schematic of PRETS 179 (ANSYS@Academic Research, 2009)
and preload action in blind bolted connection
6.2.2 Concrete failure criteria and modelling
The general yield and failure criteria for finite element analysis are de cribed
in Appendix C. The concrete element adopted in finite element analysis takes
into account cracking and crushing as discussed below.
190
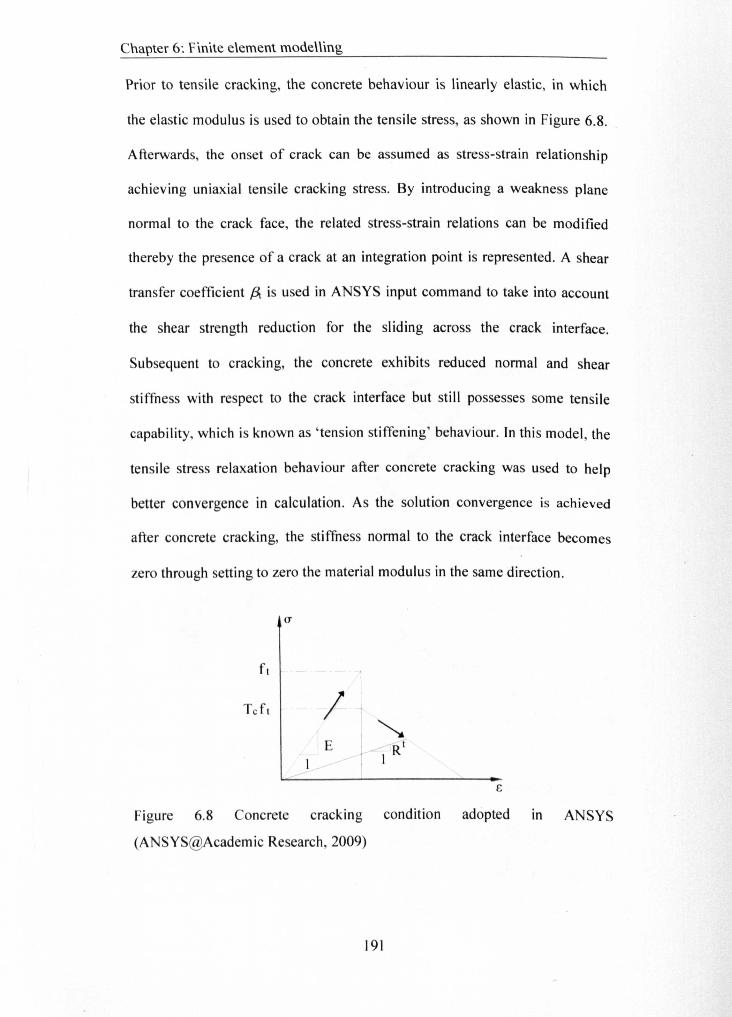
Chapter 6: Finite e\ement mode\\\ng
Prior to tensile cracking, the concrete behaviour is linearly elastic, in which
the elastic modulus is used to obtain the tensile stress, as shown in Figure 6.8.
Afterwards, the onset of crack can be assumed as stress-strain relationship
achieving uniaxial tensile cracking stress. By introducing a weakness plane
normal to the crack face, the related stress-strain relations can be modified
thereby the presence of a crack at an integration point is represented. A shear
transfer coefficient f3.. is used in ANSYS input command to take into account
the shear strength reduction for the sliding across the crack interface.
Subsequent to cracking, the concrete exhibits reduced normal and shear
stiffness with respect to the crack interface but still possesses some tensile
capability, which is known as 'tension stiffening' behaviour. Tnthis model, the
tensile stress relaxation behaviour after concrete cracking was used to help
better convergence in calculation. As the solution convergence is achieved
after concrete cracking, the stiffness normal to the crack interface becomes
zero through setting to zero the material modulus in the same direction.
ft
Figure 6.8 Concrete cracking condition adopted in ANSYS
(ANSYS@Academic Research, 2009)
191
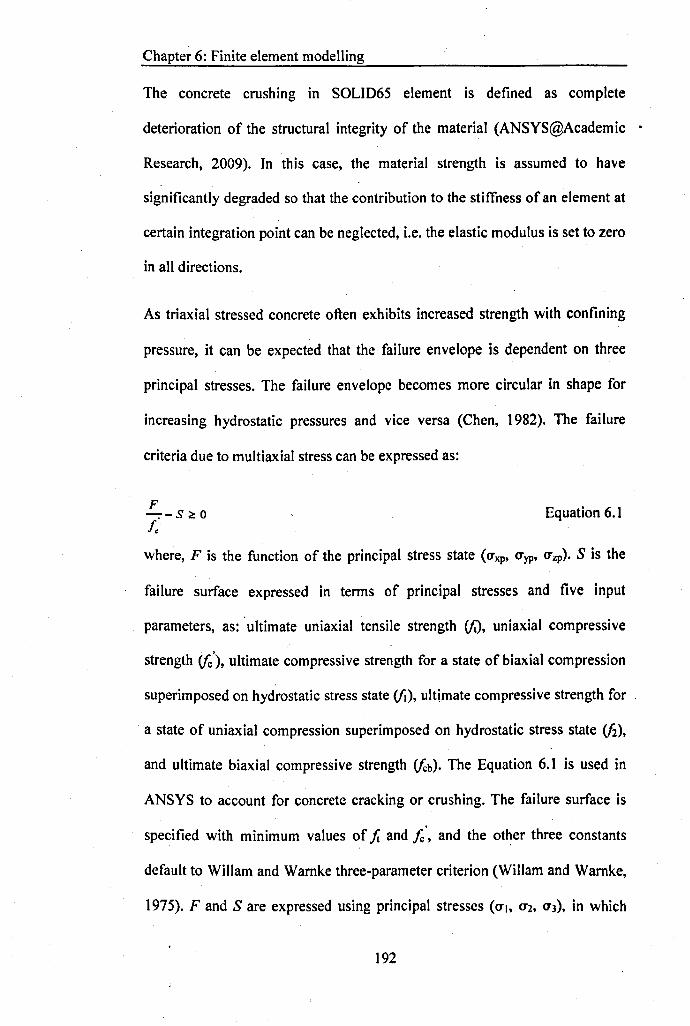
Chapter 6: Finite element modelling
The concrete crushing in SOLID65 element is defined as complete
deterioration of the structural integrity of the material (ANSYS@Academic .
Research, 2009). In this case, the material strength is assumed to have
significantly degraded so that the contribution to the stiffness of an element at
certain integration point can be neglected, i.e. the elastic modulus is set to zero
in all directions.
As triaxial stressed concrete often exhibits increased strength with confining
pressure, it can be expected that the failure envelope is dependent on three
principal stresses. The failure envelope becomes more circular in shape for
increasing hydrostatic pressures and vice versa (Chen, 1982). The failure
criteria due to multiaxial stress can be expressed as:
F-, -s ~0f.
Equation 6.1
where, F is the function of the principal stress state (O'xp. O'yp' O'zp). S is the
failure surface expressed in terms of principal stresses and five input
parameters, as: 'ultimate uniaxial tensile strength (fJ, uniaxial compressive
strength (!c), ultimate compressive strength for a state of biaxial compression
superimposed on hydrostatic stress state (Ii), ultimate compressive strength for
a state of uniaxial compression superimposed on hydrostatic stress state (fi).
and ultimate biaxial compressive strength (!cb). The Equation 6.1 is used in
ANSYS to account for concrete cracking or crushing. The failure surface is
specified with minimum values of It and i; and the ot~er three constants
default to Willam and Warnke three-parameter criterion (Willam and Warnke,
1975). F and S are expressed using principal stresses (0'1, 0'2, 0'3), in which
192
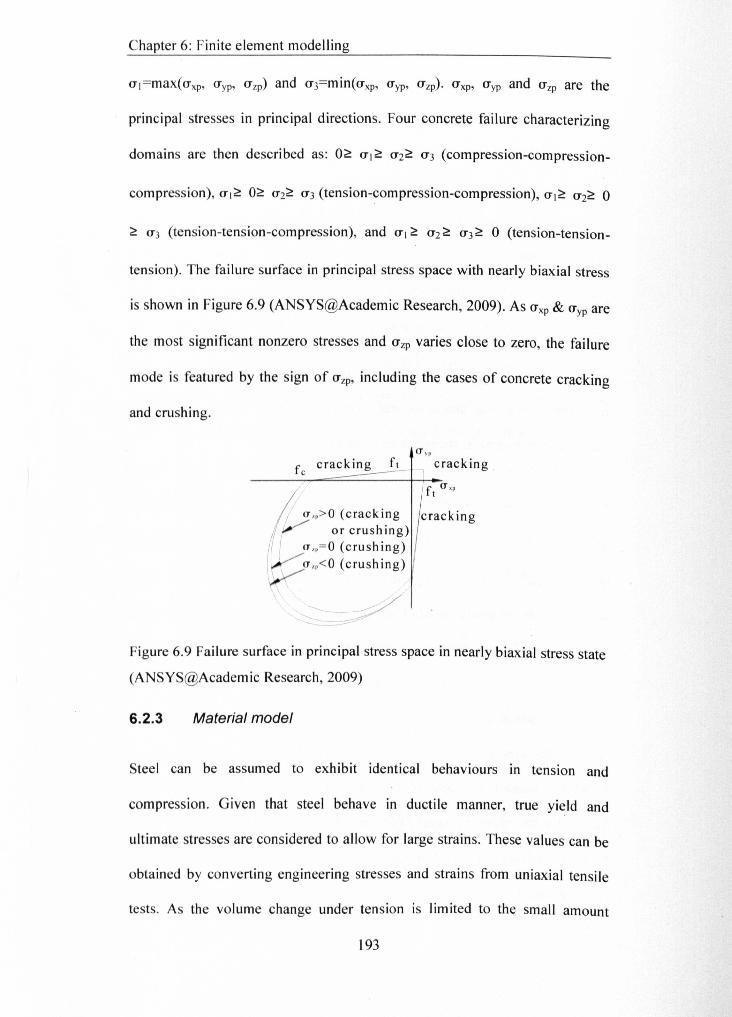
Chapter 6: Finite element modelling
principal stresses in principal directions. Four concrete failure characterizing
domains are then described as: O~ <T]~ <Tz~ <T3 (compression-compression-
compression), <T]~ O~ <Tz~ <T3 (tension-compression-compression), <T]~ <Tz~ 0
~ <T3 (tension-tension-compression), and <T] ~ <Tz ~ <T3 ~ 0 (tension-tension-
tension). The failure surface in principal stress space with nearly biaxial stress
is shown in Figure 6.9 (ANSYS@Academic Research, 2009). As <Txp & <Typ are
the most significant nonzero stresses and <Tzp varies close to zero, the failure
mode is featured by the sign of <Tzp, including the cases of concrete cracking
and crushing.
aypfl cracking---- l
ft a"
a,,>O (cracking crackingor crushing)
a ,,=0 (crush ing)a,,<O (crushing)
Figure 6.9 Failure surface in principal stress space in nearly biaxial stress state
(ANSYS@Academic Research, 2009)
6.2.3 Material model
Steel can be assumed to exhibit identical behaviours In tension and
compression. Given that steel behave in ductile manner, true yield and
ultimate stresses are considered to allow for large strains. These values can be
obtained by converting engineering stresses and strains from uniaxial tensile
tests. As the volume change under tension is limited to the small amount
193
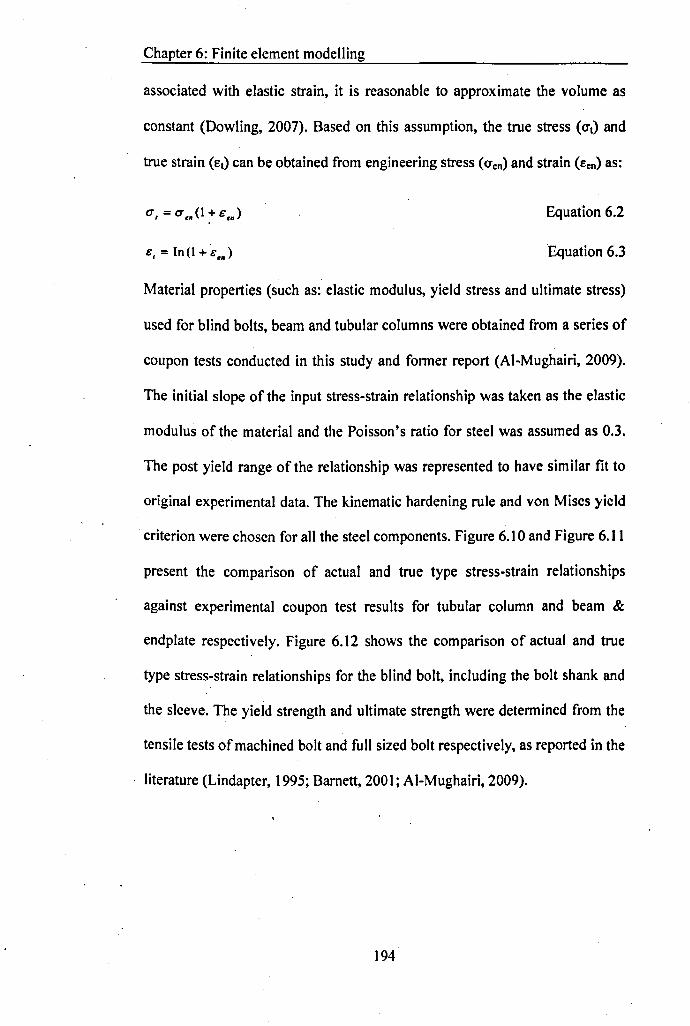
Chapter 6: Finite element modelling
associated with elastic strain, it is reasonable to approximate the volume as
constant (Dowling, 2007). Based on this assumption, the true stress (O't) and
true strain (Et) can be obtained from engineering stress (O'en) and strain (Een) as:
(i, = (i.n(l + £.n) Equation 6.2
Equation 6.3
Material properties (such as: elastic modulus, yield stress and ultimate stress)
used for blind bolts, beam and tubular columns were obtained from a series of
coupon tests conducted in this study and former report (Al-Mughairi, 2009).
The initial slope of the input stress-strain relationship was taken as the elastic
modulus of the material and the Poisson's ratio for steel was assumed as 0.3.
The post yield range of the relationship was represented to have similar fit to
original experimental data. The kinematic hardening rule and von Mises yield
criterion were chosen for all the steel components. Figure 6.10 and Figure 6.11
present the comparison of actual and true type stress-strain relationships
against experimental coupon test results for tubular column and beam &
endplate respectively. Figure 6.12 shows the comparison of actual and true
type stress-strain relationships for the blind bolt, including the bolt shank and
the sleeve. The yield strength and ultimate strength were determined from the
tensile tests of machined bolt and full sized bolt respectively, as reported in the
literature (Lindapter, 1995; Barnett, 2001; Al-Mughairl, 2009).
194
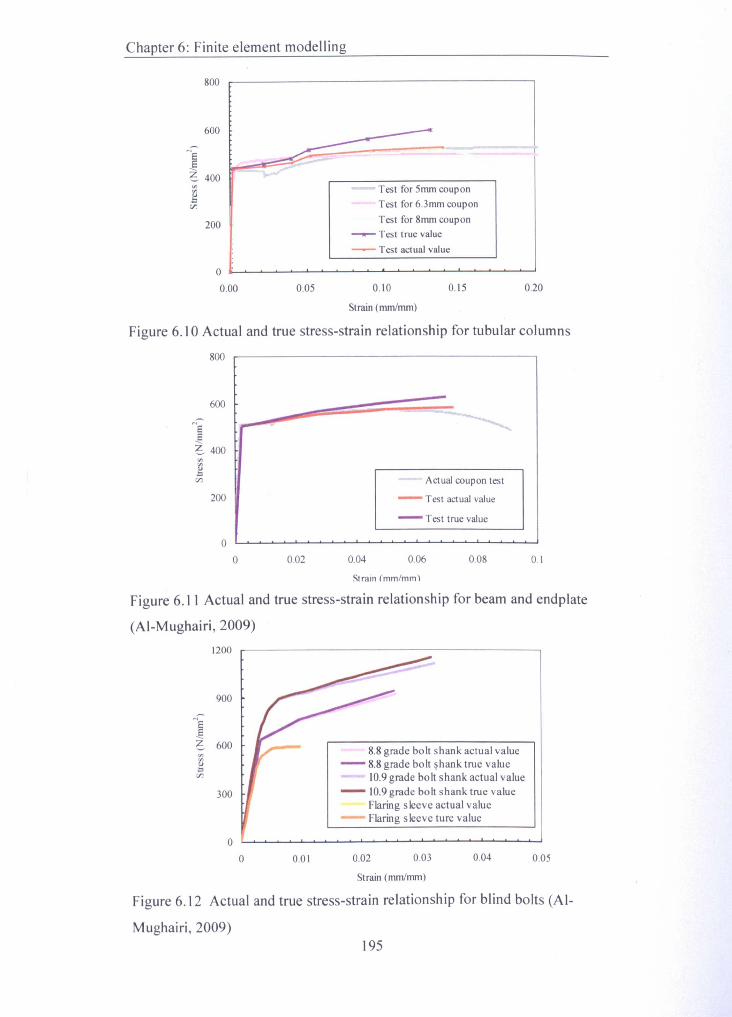
Chapter 6: Finite element modelling
800
600
lb 400
200
Test for 5mm couponTest for 6.3mm coupon
Test for 8mm coupon- Test true value
- Test actual value
0.20
Figure 6.10 Actual and true stress-strain relationship for tubular columns
800
o0.00 0.10 0.15
0.1
Figure 6.11 Actual and true stress-strain relationship for beam and endplate
(AI-Mughairi,2009)
jb 600'"~if)
0.05
0.05
Figure 6.12 Actual and true stress-strain relationship for blind bolts (AI-
Mughairi, 2009)
Strain (mmlmm)
200
- Test true value
Actual coupon test
- Test actual value
oo 0.04 0.06 0.080.02
Strain (mm/mm)
1200
900
300
8.8 grade bolt shank actual value- 8.8 grade bolt hank true value
10.9 grade bolt shank actual value- 10.9 grade bolt shank true value-- Flaring sleeve actual value- Flaring sleeve ture value
oo 0.02 0.03 0.040.01
Strain (mm/mm)
195
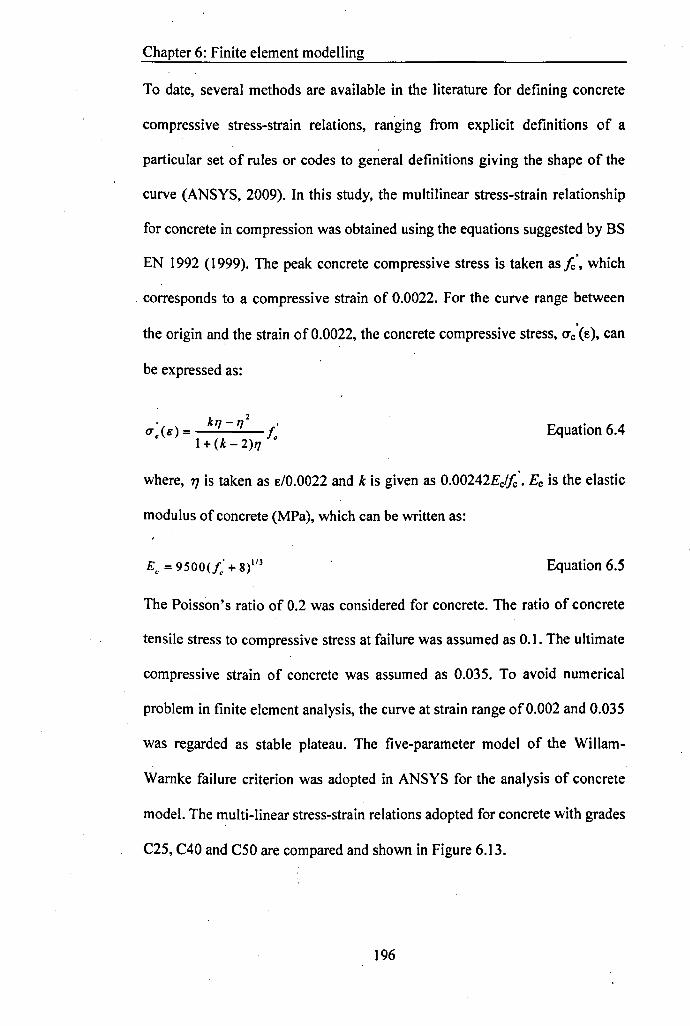
Chapter 6: Finite element modelling
To date, several methods are available in the literature for defining concrete
compressive stress-strain relations, ranging from explicit definitions of a
particular set of rules or codes to general definitions giving the shape of the
curve (ANSYS, 2009). In this study, the multilinear stress-strain relationship
for concrete in compression was obtained using the equations suggested by BS
EN 1992 (1999). The peak concrete compressive stress is taken asic', which
. corresponds to a compressive strain of 0.0022. For the curve range between
the origin and the strain of 0.0022, the concrete compressive stress, O'c'(e), can
be expressed as:
Equation 6.4
where, 1] is taken as E/O.0022 and k is given as 0.00242EJIc'. Ec is the elastic
modulus of concrete (MPa), which can be written as:
Equation 6.5
The Poisson's ratio of 0.2 was considered for concrete. The ratio of concrete
tensile stress to compressive stress at failure was assumed as 0.1, The ultimate
compressive strain of concrete was assumed as 0.035. To avoid numerical
problem in finite element analysis, the curve at strain range of 0.002 and 0.035
was regarded as stable plateau. The five-parameter model of the Willam-
Warnke failure criterion was adopted in ANSYS for the analysis of concrete
model. The multi-linear stress-strain relations adopted for concrete with grades
C25, C40 and C50 are compared and shown in Figure 6.13.
196
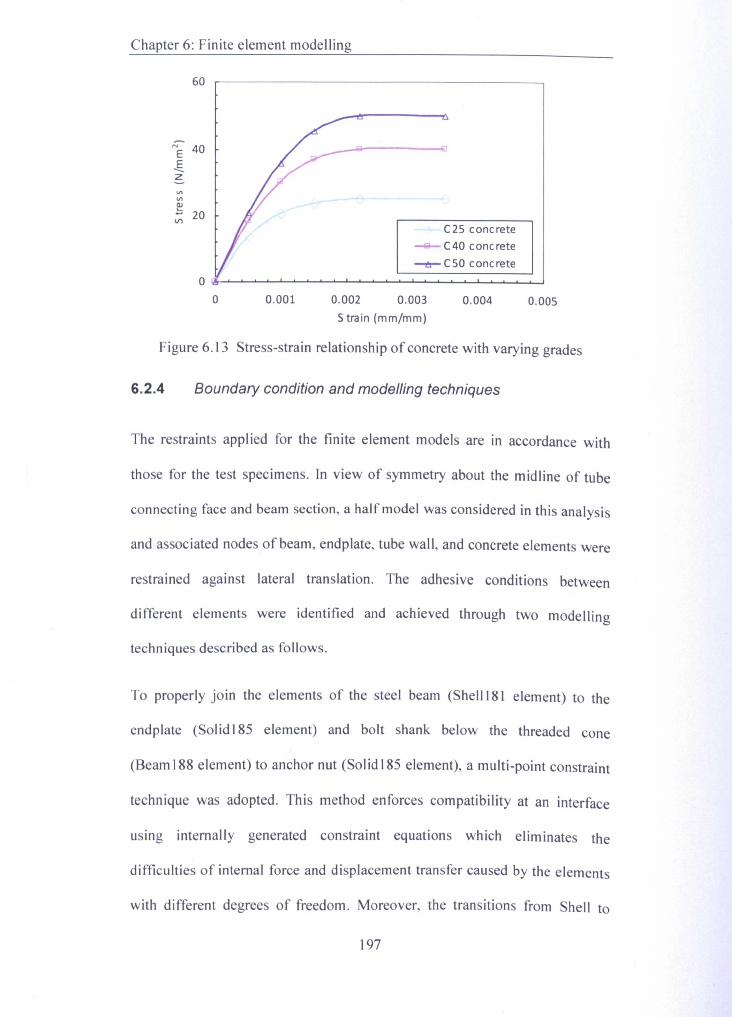
Chapter 6: Finite element modelling
60
C2S concrete-C40 concrete-e-C50 concrete
0.003 0.004 0.0055 train (mm/mm)
Figure 6.13 Stress-strain relationship of concrete with varying grades
6.2.4 Boundary condition and modelling techniques
The restraints applied for the finite element models are in accordance with
those for the test specimens. In view of symmetry about the midline of tube
connecting face and beam section, a half model was considered in this analysis
and associated nodes of beam, endplate, tube wall, and concrete elements were
restrained against lateral translation. The adhesive conditions between
different elements were identified and achieved through two modelling
techniques described as follows.
To properly join the elements of the steel beam (Shelll81 element) to the
end plate (Solid 185 element) and bolt shank below the threaded cone
(Beam 188 element) to anchor nut (Solid 185 element), a multi-point constraint
technique was adopted. This method enforces compatibility at an interface
using internally generated constraint equations which eliminates the
difficulties of internal force and displacement transfer caused by the elements
with different degrees of freedom. Moreover, the transitions from Shell to
197
Chapter 6: Finite element modelling
Solid and Beam to Solid can be realized without special requirements of nodes
alignment and contact stiffness input. The internal multi-point constraints are
generated automatically, which improves the solution efficiency over
traditional bonded contact and constraint equation methods. In the developed
finite element models, the multi-point constraints were created for Shell-Solid
and Beam-Solid assemblies.
The contact between the steel components and concrete has been outlined in
sub-Section 6.2.1. The constraint condition, however, varies as to whether the
concrete infill is taken into account or not. At the initial stage of bolt
pretension, it is well recognized that only the steel components of the blind
bolt, endplate and unfilled hollow section column rather than concrete are
involved in the load transfer. Thereafter, the concrete infill in CFT column
will produce anchorage effect for the blind bolt which influences the
behaviour of the joints under bending moment. Notwithstanding that, it must
be pointed out the difficulty in combing such two stages in finite element
analytical process from pre-processing to solution phases. This is because the
elements are established only in the pre-processing phase from which a
problem arises in incorporating the elements of concrete infill after the
analysis of bolt pretension. To solve this problem, an advanced analysis
technique called element birth and death option has been introduced to
deactivate and activate the concrete elements in both stages corresponding to
two load steps thereby properly representing the contributions of concrete
infill in the connection system.
198

Chapter 6: Finite element modelling
The element death option referred by this method is not the removal but
deactivation of the killed elements by multiplying the stiffness of those
elements bya reduction factor, which is defaulted as le-6 in ANSYS. The
deactivated elements in this manner still present in element lists but their
strains are set to zero when they are killed. It is worthy of note that the nodes
attached to the deactivated elements may float in their response which may
cause ill-conditioning solution equations, Consequently, it is advisable to exert
artificial restrains on the degrees of freedom of these nodes in the relevant
elements. As for subsequent element birth option, on the other hand, the
previously killed elements are reactivated in the model and their stiffnesses
. return to original values. Furthermore, aforementioned artificial constraints
generated at the nodes of deactivated elements should be removed in the
element reactivation.
6.2.5 Finite element model illustration
The geometric configuration and mesh generation constitutes one of the most
important parts in the finite element modelling. The finite element models of
this innovative blind bolted endplate connection to CFT column consists of
several components including a steel beam, an endplate, a CFT column, and
. blind bolt assemblies. Taking advantage of the symmetry, only a half model
was developed in this analysis. The recent finite element analysis of standard
bolted endplate connection has become sophisticated, however, problems arise
here due to irregular geometric configurations of this innovative blind bolt.
This situation becomes even more complicated when the anchorage of blind
bolt with concrete infill is introduced. For this reason, it was determined that
199
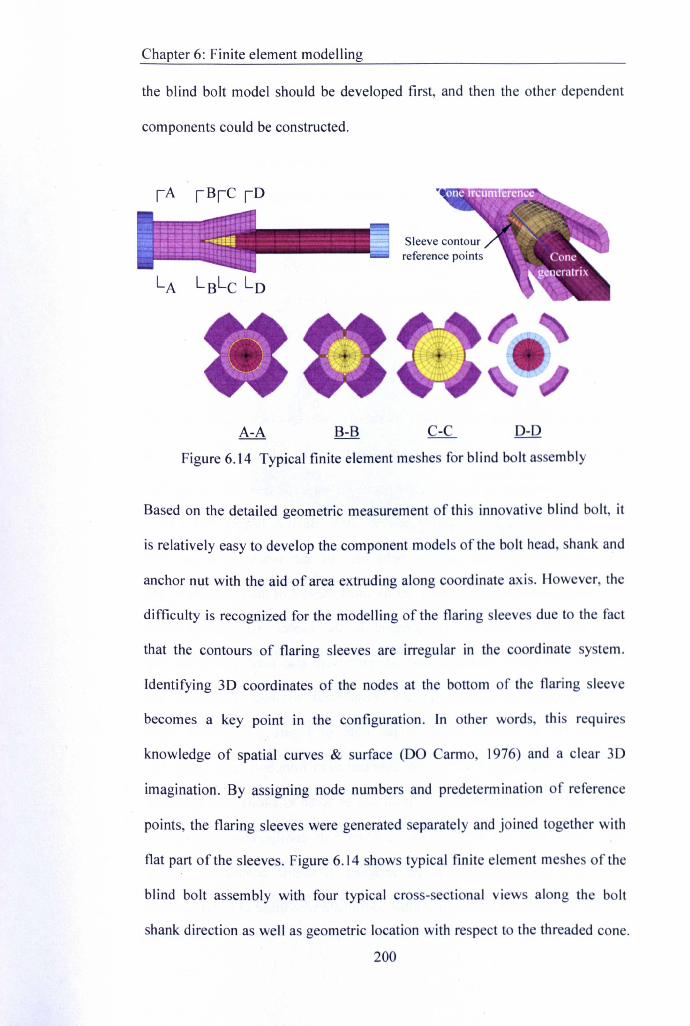
Chapter 6: Finite element modelling
the blind bolt model should be developed first, and then the other dependent
components could be constructed.
reference points
Figure 6.14 Typical finite element meshes for blind bolt assembly
Based on the detailed geometric measurement of this innovative blind bolt, it
is relatively easy to develop the component models of the bolt head, shank and
anchor nut with the aid of area extruding along coordinate axis. However, the
difficulty is recognized for the modelling of the flaring leeves due to the fact
that the contours of flaring sleeves are irregular in the coordinate system.
Identifying 3D coordinates of the nodes at the bottom of the flaring sleeve
becomes a key point in the configuration. In other words, this requires
knowledge of spatial curves & surface (DO Carmo, 1976) and a clear 3D
imagination. By assigning node numbers and predetermination of reference
points, the flaring sleeves were generated separately and joined together with
flat part of the sleeves. Figure 6.14 shows typical finite element meshes of the
blind bolt assembly with four typical cross-sectional views along the bolt
shank direction as well as geometric location with respect to the threaded cone.
200
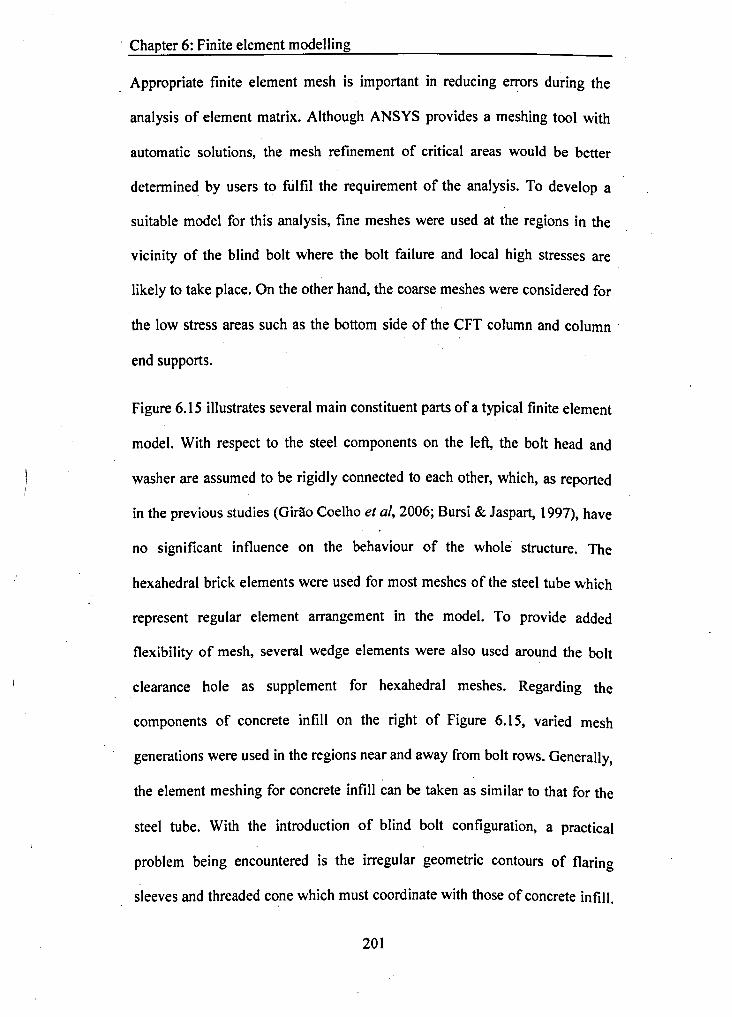
· Chapter 6: Finite element modelling
Appropriate finite element mesh is important in reducing errors during the
analysis of element matrix. Although ANSYS provides a meshing tool with
automatic solutions, the mesh refinement of critical areas would be better
determined by users to fulfil the requirement of the analysis. To develop a
suitable model for this analysis, fine meshes were used at the regions in the
vicinity of the blind bolt where the bolt failure and local high stresses are
likely to take place. On the other hand, the coarse meshes were considered for
the low stress areas such as the bottom side of the CFT column and column .
end supports.
Figure 6.15 illustrates several main constituent parts of a typical finite element
model. With respect to the steel components on the left, the bolt head and
washer are assumed to be rigidly connected to each other, which, as reported
in the previous studies (Girao Coelho et al, 2006; Bursi & Jaspart, 1997), have
no significant influence on the behaviour of the whole structure. The
hexahedral brick elements were used for most meshes of the steel tube which
represent regular element arrangement in the model. To provide added
flexibility of mesh, several wedge elements were also used around the bolt
clearance hole as supplement for hexahedral meshes. Regarding the
components of concrete infill on the right of Figure 6.15, varied mesh
generations were used in the regions near and away from bolt rows. Generally,
the element meshing for concrete infill can be taken as similar to that for the
steel tube. With the introduction of blind bolt configuration, a practical
problem being encountered is the irregular geometric contours of flaring
sleeves and threaded cone which must coordinate with those of concrete infill,
201
Chapter 6: Finite element modelling
Due to difficult 3D view identification and element pickup, it is impossible to
refine the mesh using mesh tool as mentioned earlier. Alternatively, the nodes
and elements were established with the aid of APDL code which incorporates
common commands such as 'Do-loop' and 'If-then' in programming.
SHS tube
Concrete intill
Figure 6.15 Typical finite element model with partitioned component
The model of concrete infill in contact with the blind bolt wa modelled with
the solid wedge and hexahedral brick elements. Note that the OLlD65
element in the case of large strain and deflection may be accompanied with
unconverged or incorrect results when the cracking and crushing nonlinearities
are presented simultaneously (ANSYS@Academic Research, 2009).
Moreover, the dramatic reduction of stiffness of cracking element in large
scale would cause convergence becoming rather difficult. Additionally, the
solid wedge elements may pose some problem in regions of relatively high
stress gradients. For this reason, the meshes for the concrete infill was adjusted
202
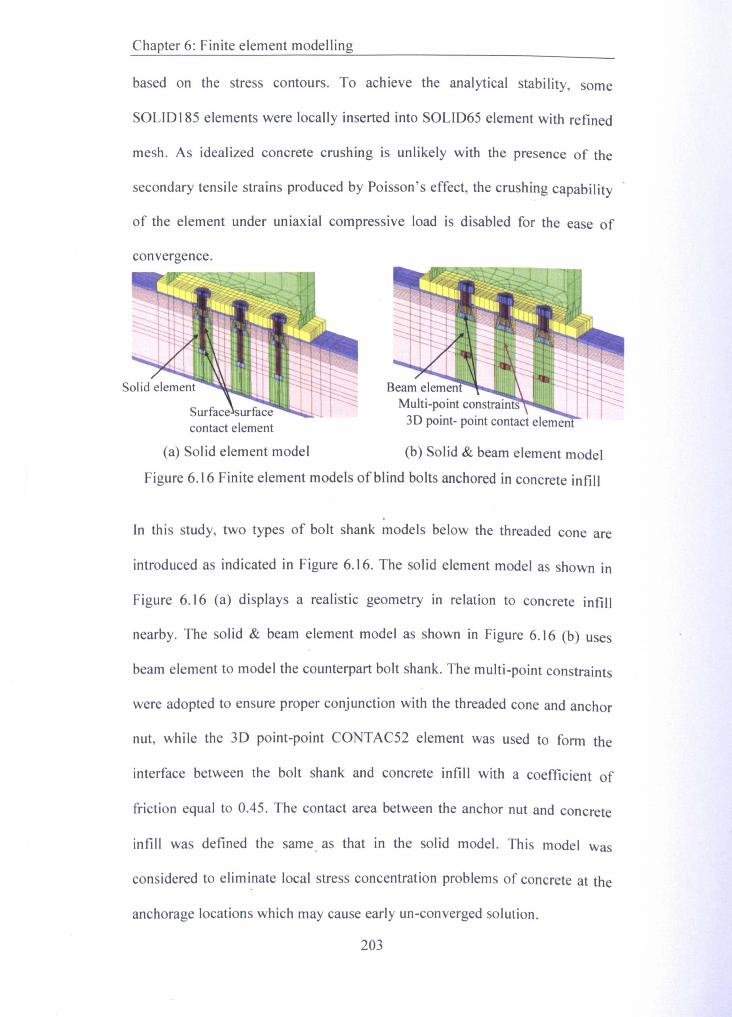
Chapter 6: Finite element modelling
based on the stress contours. To achieve the analytical stability, some
SOLID185 elements were locally inserted into SOLlD65 element with refined
mesh. As idealized concrete crushing is unlikely with the presence of the
secondary tensile strains produced by Poisson's effect, the crushing capability
of the element under uniaxial compressive load is disabled for the ease of
convergence.
contact element
(a) Solid element model
Beam eMulti-point3D point- point contact f'1f'mPlnt
Figure 6.16 Finite element models of blind bolts anchored in concrete infill
(b) Solid & beam element model
In this study, two types of bolt shank models below the threaded cone are
introduced as indicated in Figure 6.16. The solid element model as shown in
Figure 6.16 (a) displays a realistic geometry in relation to concrete infill
nearby. The solid & beam element model as shown in Figure 6.16 (b) uses
beam element to model the counterpart bolt shank. The multi-point constraints
were adopted to ensure proper conjunction with the threaded cone and anchor
nut, while the 3D point-point CONTAC52 element was used to form the
interface between the bolt shank and concrete infill with a coefficient of
friction equal to 0.45. The contact area between the anchor nut and concrete
infill was defined the same, as that in the solid model. This model was
considered to eliminate local stress concentration problems of concrete at the
anchorage locations which may cause early un-converged solution.
203
Chapter 6: Finite element modelling
6.2.6 Loading condition and solution
The finite element models were first loaded by placing the blind bolt in
pretension (also called preload or prestress). The bolt preload value in the unit
of force was input with the SLOAD command for predefined PRETS 179
elements connecting two halves of the bolt shank. After this part of solution,
the bolt shank between the bolt head and threaded cone was preloaded along
with the endplate and CFT column face in compression.
The second load step was executed by imposing vertical concentrated load
incrementally to the tip of the beam. The displacement control was considered
similar to that in experiment to overcome convergence problems. The finite
element models were loaded monotonically under bending moments and the
resultant moment-rotation relationships were compared with experimental
envelope curves. This approach has been justified for the case of composite
beam-to-column joints under quasi-static cyclic loading as reported in the
recent literature (Vasdravellis et al. 2008, Kovacs et al. 20 I0).
Regarding the solution phase of the finite element analysis, the element
solutions are related to the calculation at integration points in which the
simultaneous equations are solved by different methods. The commonly used
solvers for linear and nonlinear problems consist of two techniques: direct
elimination solver and iterative solver. The former uses equations reordered by
alternating diagonal planes while the latter takes two-line successive over
relaxation. The sparse direct solvers primarily adopted in this analysis is based
on direct elimination equations, where the solution is obtained through an
interactive process that successively refines an initial guess to a solution that is204 .
Chapter 6: Finite element modelling
within an acceptable tolerance of the exact solution (ANSYS Version 12.1,
2009).
The standard Newton-Raphson algorithm for nonlinear solution conversion
was adopted in the finite element analysis. The load is subdivided into a series
of sub-load incremer:tts which can be applied over several load steps. The
number of iterations is taken as an important influential parameter in this
verification. In the case of full Newton-Raphson option, the stiffness matrix is
updated at each iteration. Regarding the introduction of element birth and
death into this analysis, the option with adaptive descent activated is adopted
to yield good results as suggested by ANSYS (ANSYS Version 12.1,2009).
As the loads are applied incrementally, load step option may be used to
represent the actual loading during the test. The solution for each load step is
achieved by solving several sub-steps until the convergence criteria are
satisfied. The predetermination of the numbers of sub-steps often poses a
problem as too few and too many sub-steps may lead to un-converged results
and time-consuming analysis respectively. This point becomes an important
issue especially when the concrete cracking is encountered in this analysis. In
this case, care should be taken to apply the load slowly in smaller increment.
As a solution, ANSYS provides an alternate automatic time step option in
solution control and the size of the subsequent time step is predicted based on
four factors:
• Number of equilibrium iterations used in the last time step;
• Predictions for nonlinear element status change;
• Size of the plastic strain increment;
205
Chapter 6: Finite element modelling
• Size of the creep strain increment.
This option was selected in the finite element analysis, it was noted that
resizing the numbers of sub-steps produces an efficient solution.
Regarding convergence criteria, the L2-norm of force tolerance equal to 0.5%
is adopted in ANSYS automatic solution control. The default force
convergence is checked by comparing the square root sum of the squares of
the force imbalances against the product of tolerance. For nonlinear analyses,
it is noticed that the displacement control method is more efficient than load
control in the plastic deformation phase, in which the increase of load
increment may produce significant increase in the displacement counterpart.
The displacement convergence checking was also added into the convergence
criteria of modelling. This consideration was observed to improve the
convergence of the finite element analysis.
6.3 Finite element analysis results
The finite element models were developed based on the geometric features of
the connection tested in the experiment. The analyses were carried out in order
to investigate the connection behaviour as a cross validation of the
experimental observations. The evidences gained from finite element analysis
are regarded as an useful indication of the local failure mode developed inside
the tube which is difficult to obtain in physical measurement.
The validation results of the finite element models are presented in this section.
First, the results of bolt preload modelling are described in comparison with
the strains measured from the tests and reported in the literature. The206
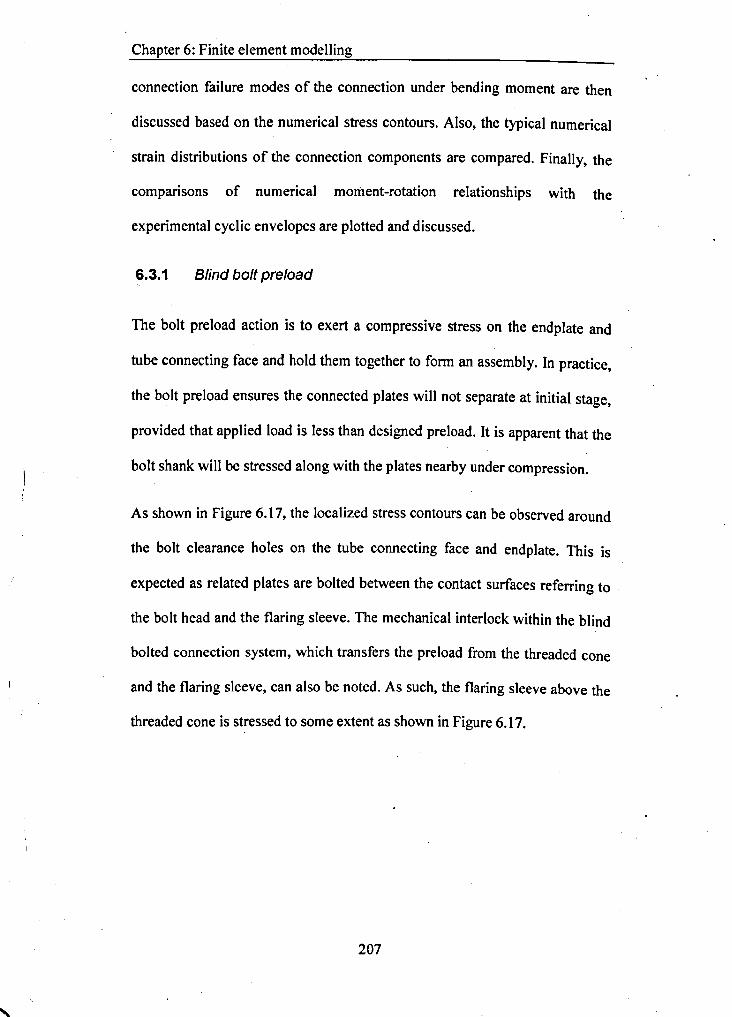
Chapter 6: Finite element modelling
connection failure modes of the connection under bending moment are then
discussed based on the numerical stress contours. Also, the typical numerical
strain distributions of the connection components are compared. Finally, the
comparisons of numerical moment-rotation relationships with the
experimental cyclic envelopes are plotted and discussed.
6.3.1 Blind bolt preload
The bolt preload action is to exert a compressive stress on the endplate and
tube connecting face and hold them together to form an assembly. In practice,
the bolt preload ensures the connected plates will not separate at initial stage,
provided that applied load is less than designed preload. It is apparent that the
bolt shank will be stressed along with the plates nearby under compression.
As shown in Figure 6.17, the localized stress contours can be observed around
the bolt clearance holes on the tube connecting face and endplate. This is
expected as related plates are bolted between the contact surfaces referring to
the bolt head and the flaring sleeve. The mechanical interlock within the blind
bolted connection system, which transfers the preload from the threaded cone
and the flaring sleeve, can also be noted. As such, the flaring sleeve above the
threaded cone is stressed to some extent as shown in Figure 6.17.
207
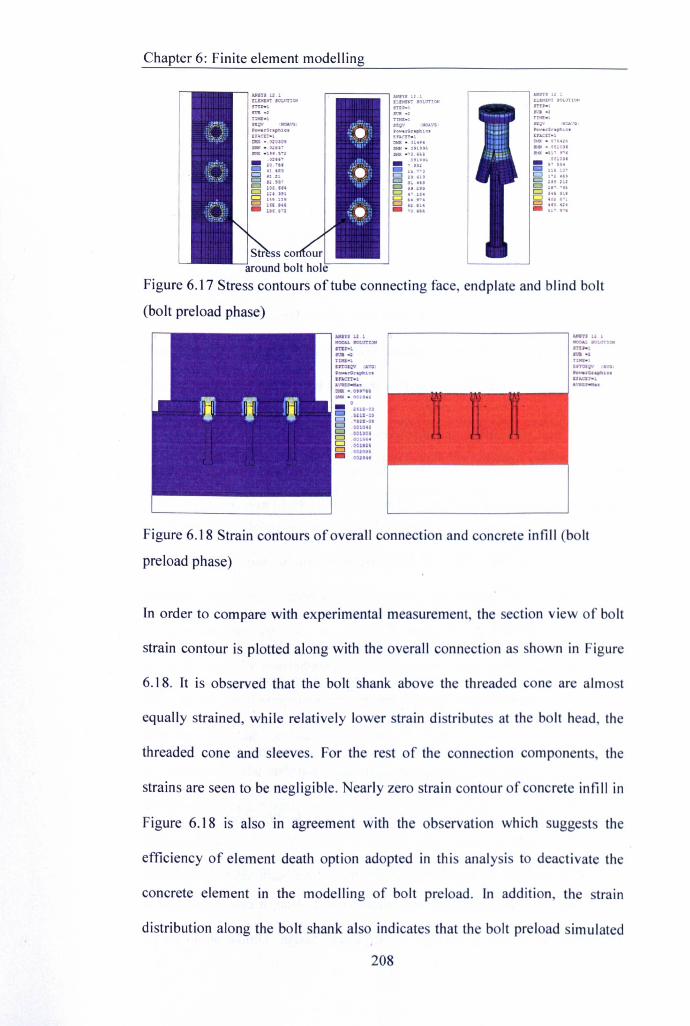
Chapter 6: Finite element modelling
boltholl<------..J
Figure 6.17 Stress contours of tube connecting face, endplate and blind bolt
(bolt preload phase)
"",.,tn.-!'I~ .c:A'""'.~""'1C:.lJAC'n·1OHII" 01lUtmor .. 001CIt
r-------------, AnTS U I~ _~ ..UTla-
on •......r.rTOIvY ..~"_rcU~IC'u..ca,...!
~ , '. ''''~':'.\ ~ .. J1 I ': ~ "',
'~".. .. • ~ I \ , .' T' l' l,.. • -' .1',
." :,.1' ,
. .'.. :~, :r,~/.~· ... ~ ,'::...."1' ..1 ! "'~""':''';'11''''::'''
.. :... <....lo ,~ •••• .t l u .. ~' '"" ~ :. 'ot'
Figure 6.18 Strain contours of overall connection and concrete infill (bolt
preload phase)
In order to compare with experimental measurement, the section view of bolt
strain contour is plotted along with the overall connection as shown in igure
6.18. It is observed that the bolt shank above the threaded cone are almost
equally strained, while relatively lower strain di tributes at the bolt head, the
threaded cone and sleeves. For the rest of the connection component, the
strains are seen to be negligible. Nearly zero strain contour of concrete infi II in
Figure 6.18 is also in agreement with the observation which suggests the
efficiency of element death option adopted in this analysis to deactivate the
concrete element in the modelling of bolt preload. In addition, the train
distribution along the bolt shank also indicates that the bolt preload simulated
208
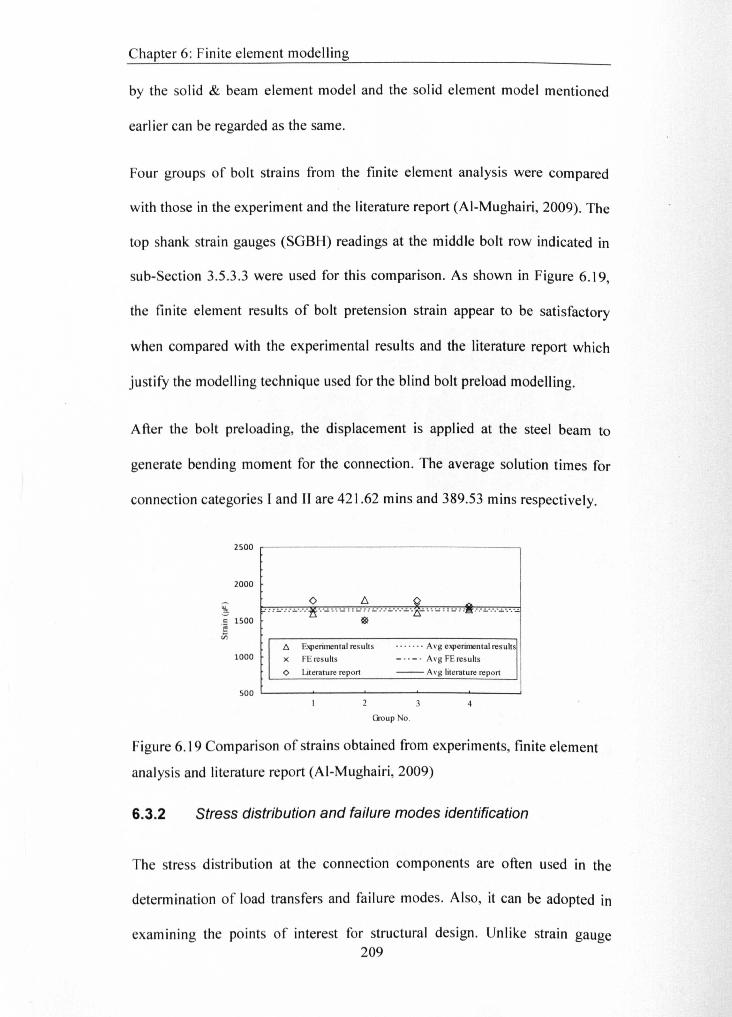
Chapter 6: Finite element modelling
by the solid & beam element model and the solid element model mentioned
earlier can be regarded as the same.
Four groups of bolt strains from the finite element analysis were compared
with those in the experiment and the literature report (AI-Mughairi, 2009). The
top shank strain gauges (SGBH) readings at the middle bolt row indicated in
sub-Section 3.5.3.3 were used for this comparison. As shown in Figure 6.19,
the finite element results of bolt pretension strain appear to be satisfactory
when compared with the experimental results and the literature report which
justify the modelling technique used for the blind bolt preload modelling.
After the bolt preloading, the displacement is applied at the steel beam to
generate bending moment for the connection. The average solution times for
connection categories I and II are 421.62 mins and 389.53 mins respectively.
2500 ,.-------------------,
6. Experimental results - - - - - - - A vg experimental results1000 X FE results ----- AvgFEresults
2000
o l:::. 0~ - : : ,_-----"------..,.,----'-" - -" '-'" ,_-----"------ - --c:s.- ,,- - "'-' "8:: -------------I1500 ~ l8!Cl)
<:> Literature report -- A vg literature report
500 L- __ ~ __ -'--__ __.____ _.___ ___J
Group No.
Figure 6.19 Comparison of strains obtained from experiments, finite element
analysis and literature report (AI-Mughairi, 2009)
6.3.2 Stress distribution and failure modes identification
The stress distribution at the connection components are often used in the
determination of load transfers and failure modes. Also, it can be adopted in
examining the points of interest for structural design. Unlike strain gauge209
Chapter 6: Finite element modelling
measurement limited by certain location in the test set-up, the numerical stress
contour of the finite element model provides wide range of stress distribution.
The stress results obtained from the finite element analysis will be described in
this sub-section referring to: overall connection, blind bolt, tube sidewall face
& connecting face and concrete infill. The test specimens BBEC-S-IO.9-50-LI
and BBEC-5-S.S-50-LII were selected in the finite element analysis to
represent the test specimens failed in modes I and II.
The comparison of numerical stress contours for specimens BBEC-S-l 0.9-50-
LI and BBEC-5-S.8-50-LII are shown in Figure 6.20. The stresses are related
to the connections loaded at maximum load condition under bending moments.
Visual inspection of these plots indicates that the stresses induced by the
bending moment are distributed on the connection components. The stresses in
the beam and endplate are mostly in the elastic condition and relatively low in
contrast with those in the blind bolt and the tube. The negative bending
moment are seen to produce wider stress distribution in the connection
components than positive ones. This is expected due to larger lever arm
distances from the rotation axis of the connection under negative moment than
those under positive moment. The small flexure of the endplate is evident to
observe from the contours of deformed shape as well as low stresses
distribution on the endplate. The stress contours at the beam web near the
flange indicates the compression stresses were developed on the beam flange
and endplate. In fact, this effect would be significant when the width of the
endplate is larger than that of the tube connecting face; otherwise, the tube
210
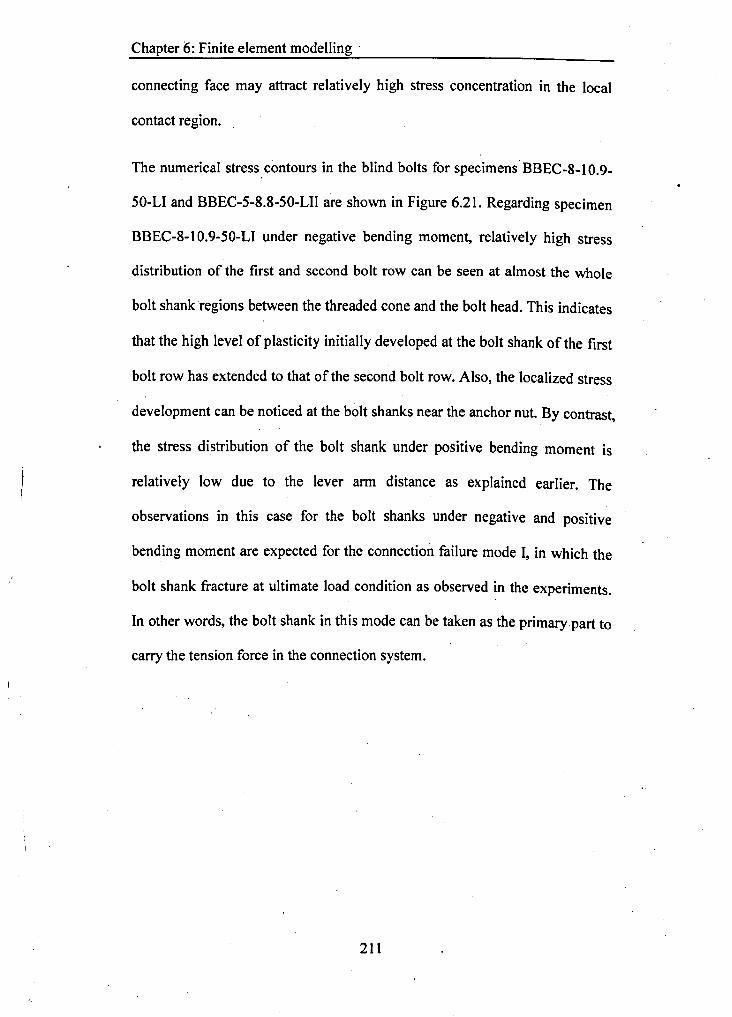
Chapter 6: Finite element modelling .
connecting face may attract relatively high stress concentration in the local
contact region.
The numerical stress contours in the blind bolts for specimensBBEC-S-I0.9_
50-LI and BBEC-5-S.S-50-LII are shown in Figure 6.21. Regarding specimen
BBEC-S-I0.9-50-LI under negative bending moment, relatively high stress
distribution of the first and second bolt row can be seen at almost the whole
bolt shank regions between the threaded cone and the bolt head. This indicates
that the high level of plasticity initially developed at the bolt shank of the first
bolt row has extended to that of the second bolt row. Also, the localized stress
development can be noticed at the bolt shanks near the anchor nut. By contrast,
the stress distribution of the bolt shank under positive bending moment is
relatively low due to the lever arm distance as explained earlier. The
observations in this case for the bolt shanks under negative and positive
bending moment are expected for the connection failure mode I, in which the
bolt shank fracture at ultimate load condition as observed in the experiments.
In other words, the bolt shank in this mode can be taken as the primary part to
carry the tension force in the connection system.
211
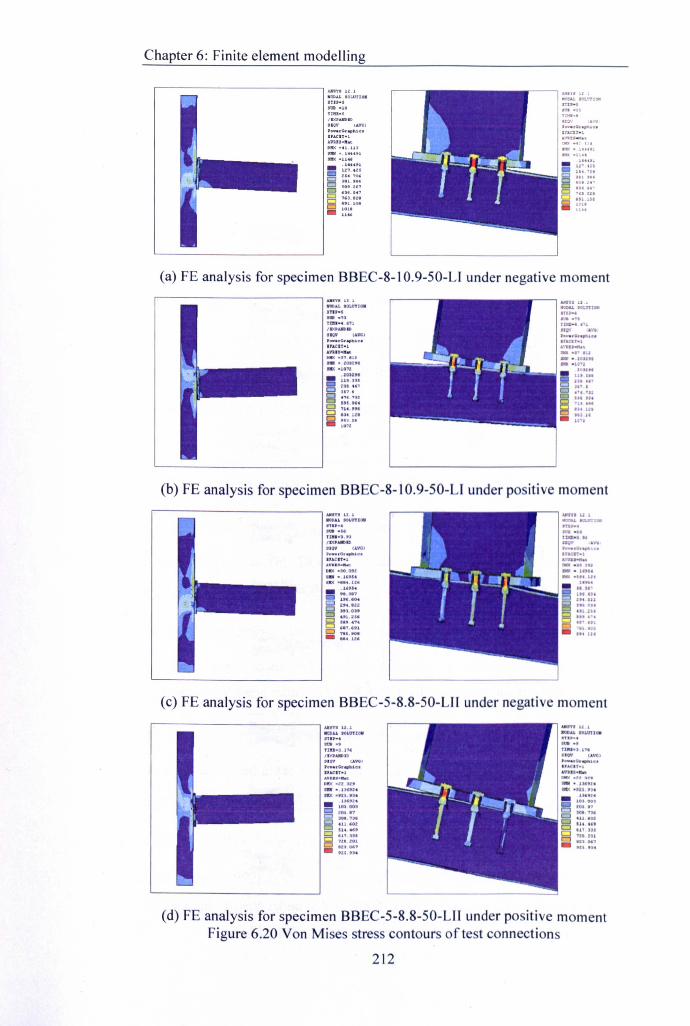
Chapter 6: Finite element modelling
ilOD.I.L SOLUTIO.n..·,stJI·10TIIll_a
'IXJlAllDIOnov ("'VIOl:::;~~htC.111)(_114 •
. uu.91-1t7.US
E5 ::~.::ClClClCl- cu.U?
?n.'.u
,----------------'J.JtIIT1I If 1WDAL SOLUTION
(a) FE analysis for specimen BBEC-8-1 0.9-50-U under negative moment
.WI·?)
Tnll-' "1100'utl~IIQV 'AYCHh .... C.... Mc.1",cn-1
U'IU.n II'In.1'4.'U
"'tu'Ut tUtH I••
'Hifle'!
(b) FE analysis for specimen BBEC-8-1 0.9-50-U under po itive moment,---------------..., ....n. n.1
woo.u nLU'TIOIf".,......"tta,-"n/1X,.uI()CnQII IAVC)I>o".rG • ."IU.C'uun·l"11 ••• ·" .....010(.30.0'(
tnu.. ,.,Ut u,It •• u.,1"."l.UU;4'4", tU'111,9;1.
'''11'
(c) FE analysis for specimen BBEC-5-8.8-50-LII under negative moment
.urn'II.1IfOOA.L .OLUTIOIf
Ill'·'"".,/IX'A,JIDm
...... " .... I:o.lc:.lu.cn_lAVU'·_DfIX-Uu:.aar -.I'''U1ft)( ·'U .•U U"l.4- unl4 101 ~l
103 0031 lOt"
Clra, 17 Jot ",.lO'. n, tU .01
CJ <ttl ,at 'U tU
CJ $14."" U'J,'"111,'" .,,0101
Cl ?LOlOl '1'1 GC?CJ IU DC? 'U Ut- ,u.•,.
(d) FE analysis for specimen BBEC-5-8.8-50-LII under positive momentFigure 6.20 Von Mises stress contours of test connections
212
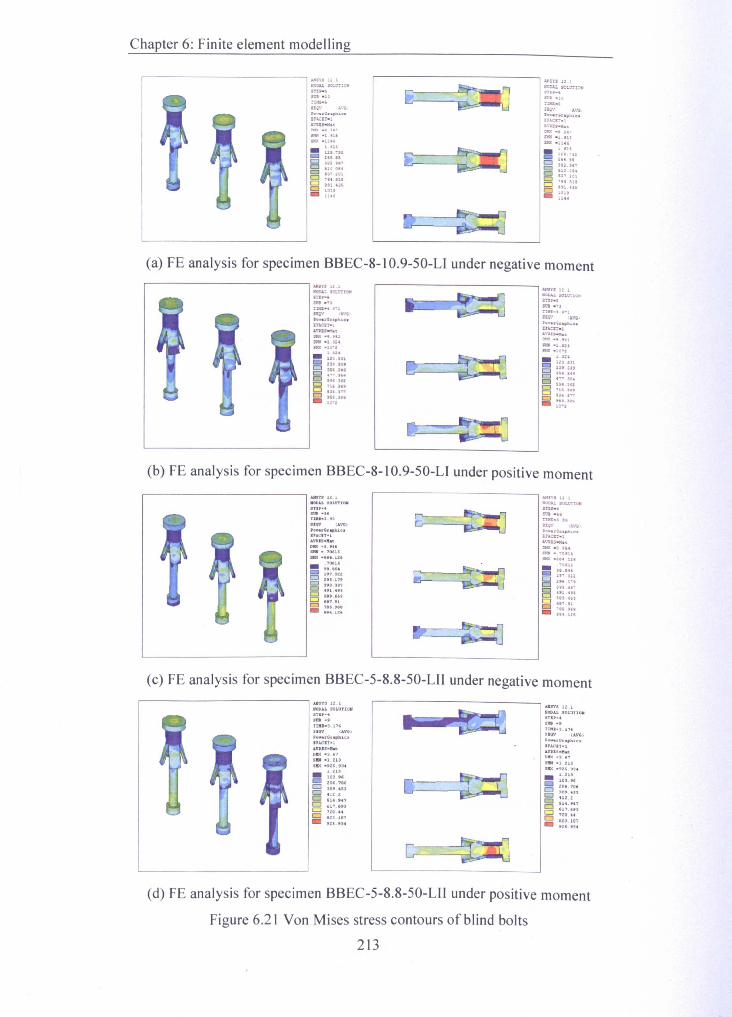
Chapter 6: Finite element modelling
,---------------- JJfn. 12.1
RODA!. iOU/Tl0M"'~,SW-l0'fIla""
"'"P"w.~C.,...... ".sr."CU'·l.a.vn$~n
llISYlL2.1
~~~.so:mte>NSUI·lOIL'!i .. SSI~\I' lA-VGD".... "Gl: ..p1l1C;.".\CIT_lAVUiattatllKl(·e if1S)QI"l.'USHX -llU
~ !~:~~,~CJ ~:~.::.,§ :!~.~~~B ;:~!!!- i~!:
(a) FE analysis for specimen BBEC-8-1 O.9-50-LI under negative moment,---------------_ AH:n' 11.1
.oc.t.LtOLtrtI(Ilf"'....fUt."73
loa-".'"''11;11' A\'"~ ... ~nph.ie:.IfAct'f'oolA\'7.!S~t
AN"I 1~.1IIIOt'I.U, S01?.r.-lQN
IOU .....'5Qt."J"uw·, .~llilli' (l!J1;',"0_1'.;.,.,*,10aIncn_l.I.\I1llS""Ioto. ..
tICC"-f"41hOI -:'10;(.!KX .. l"~a_ ;2!i~HB !!:~!:8 :;:.~:;El ~!:~~;_ ~~!lU~
(b) FE analysis for specimen BBEC-8-1 o.9-50-LI under positive moment
ITI'_,WI-"Ttlll·3.nIIQV (AVC)......uC ...,Me.'rAen-L
"""11:' l~ 1MOO.1.L I1)LUTtOHsnp..~."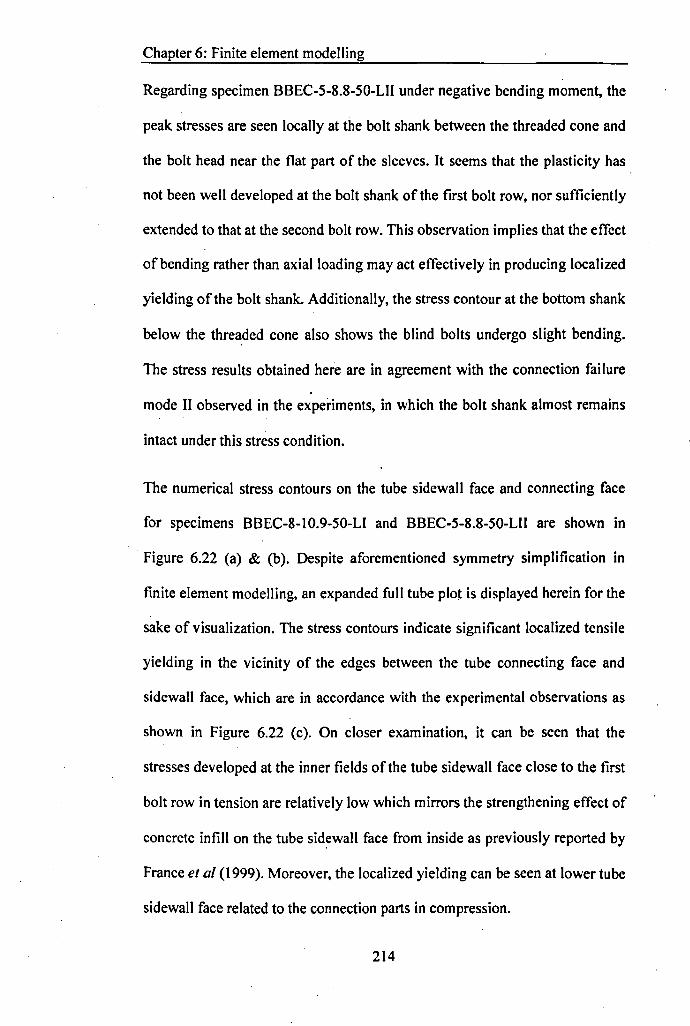
Chapter 6: Finite element modelling
Regarding specimen BBEC-5-S.S-50-LII under negative bending moment, the
peak stresses are seen locally at the bolt shank between the threaded cone and
the bolt head near the flat part of the sleeves. It seems that the plasticity has
not been well developed at the bolt shank of the first bolt row, nor sufficiently
extended to that at the second bolt row. This observation implies that the effect
of bending rather than axial loading may act effectively in producing localized
yielding of the bolt shank. Additionally, the stress contour at the bottom shank
below the threaded cone also shows the blind bolts undergo slight bending.
The stress results obtained here are in agreement with the connection failure
mode II observed in the experiments, in which the bolt shank almost remains
intact under this stress condition.
The numerical stress contours on the tube sidewall face and connecting face
for specimens BBEC-S-I0.9-50-LI and BBEC-5-S.S-50-LII are shown in
Figure 6.22 (a) & (b). Despite aforementioned symmetry simplification in
finite element modelling, an expanded full tube plot is displayed herein for the
sake of visualization. The stress contours indicate significant localized tensile
yielding in the vicinity of the edges between the tube connecting face and
sidewall face, which are in accordance with the experimental observations as
shown in Figure 6.22 (c). On closer examination, it can be seen that the
stresses developed at the inner fields of the tube sidewall face close to the first
bolt row in tension are relatively low which mirrors the strengthening effect of
concrete infill on the tube sidewall face from inside as previously reported by
France et al (1999). Moreover, the localized yielding can be seen at lower tube
sidewall face related to the connection parts in compression.
214
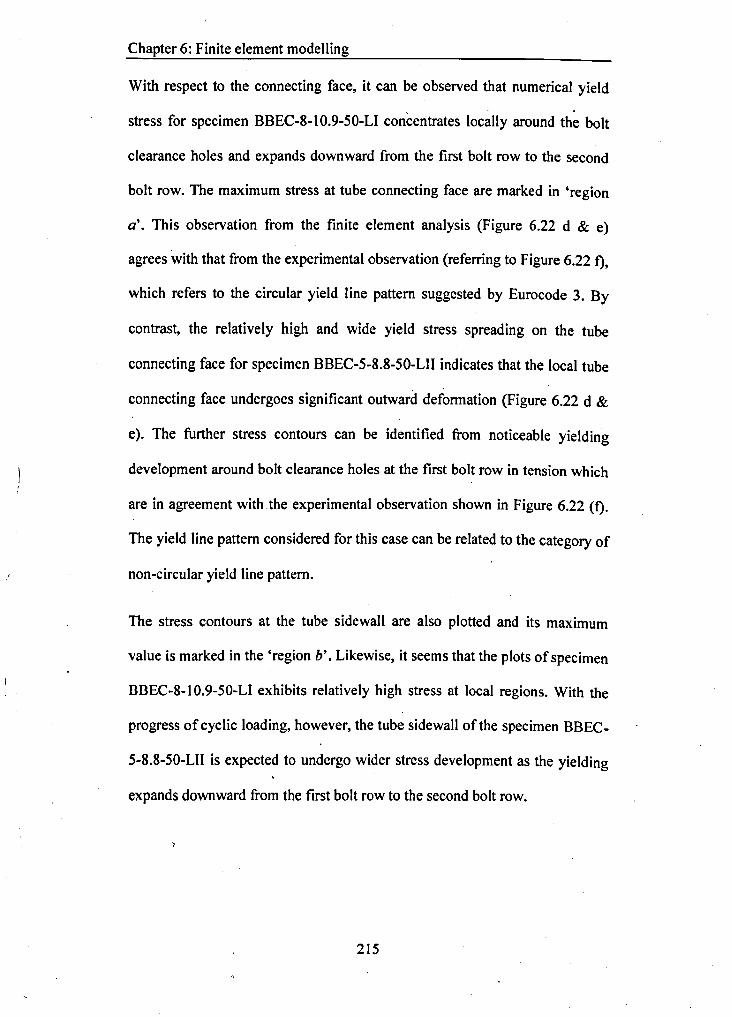
Chapter 6: Finite element modelling
With respect to the connecting face, it can be observed that numerical yield
stress for specimen BBEC-S-IO.9-50-LI concentrates locally around the bolt
clearance holes and expands downward from the first bolt row to the second
bolt row. The maximum stress at tube connecting face are marked in 'region
a'. This observation from the finite element analysis (Figure 6.22 d & e)
agrees with that from the experimental observation (referring to Figure 6.22 f),
which refers to the circular yield line pattern suggested by Eurocode 3. By
contrast, the relatively high and wide yield stress spreading on the tube
connecting face for specimen BBEC-5-S.S-50-LII indicates that the local tube
connecting face undergoes significant outward deformation (Figure 6.22 d &
e). The further stress contours can be identified from noticeable yielding
development around bolt clearance holes at the first bolt row in tension which
are in agreement with the experimental observation shown in Figure 6.22 (f).
The yield line pattern considered for this case can be related to the category of
non-circular yield line pattern.
The stress contours at the tube sidewall are also plotted and its maximum
value is marked in the 'region b', Likewise, it seems that the plots of specimen
BBEC-S-I0.9-50-LI exhibits relatively high stress at local regions. With the
progress of cyclic loading, however, the tube sidewall of the specimen BBEC-
5-S.S-50-LII is expected to undergo wider stress development as the yielding
expands downward from the first bolt row to the second bolt row.
215
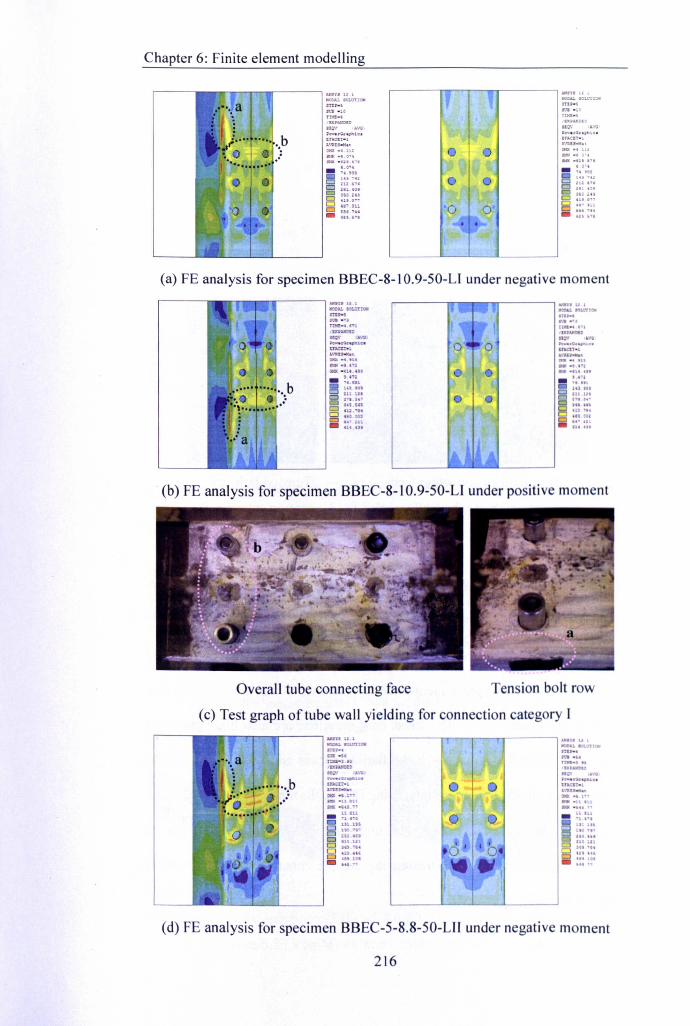
Chapter 6: Finite element modelling
..~r--r--.r--------'~n.12\II(ltIU .owTIOMsnp.,S'UlI ·~orUPAlmIDII.QIV ~AVCI:=!~L~)'WI.$-ooK&~001. .. t,U2
s:oJt_n.,",s.e-e--,.to.
tu,.,,u .',Ut n.Ug :41
(a) FE analysis for specimen BBEC-8-1 O.9-50-LJ under negative moment....n U",lII:)CAl 1OU1t"*"u-.~··l lUI ..~~T!x[·' ''"1 tnll .. I"lU.tu:1l~ IIU,uID&"D"CV ,,~ .. ..."_'~'P1a"
tn.ar.l.
'2!IlII:.,,1.,elM ., t?l... ·(H.4U- '.".
b "'.'1 "Ul
Cl~.sNt 14) U.U~ ~..
Cl 2-".' .,. H~
ClIU.ln 'U Inn:.·" U~ , ..
Cl IUI)O' "0001Cl u~.nl- UI n"
(b) FE analysis for specimen BBEC-8-IO.9-50-LJ under positive moment
Overall tube connecting face Tension bolt row
(c) Test graph of tube wall yielding for connection category Irl .............,.....--....-------, All:n'S H.t
~ IOLUTIQII.,....sw .."t:a-l.U'lC.tJDt~
.---------~----~~-~--------- IIIf"'1 U 1
1KJCI'J..ot.t,'UClI
"'''4a.5.Tt'Itl.j,.JUtA.II::'O...,,"
-~eptU ...l!'lrn'o!.)....us~u.,.-Hi _11111$Kt ~u ••
ClClc:J "lOUt
8~::::iii Ut.I')' Cl•
(d) FE analysis for specimen BBEC-5-8.8-50-LII under negative moment
216
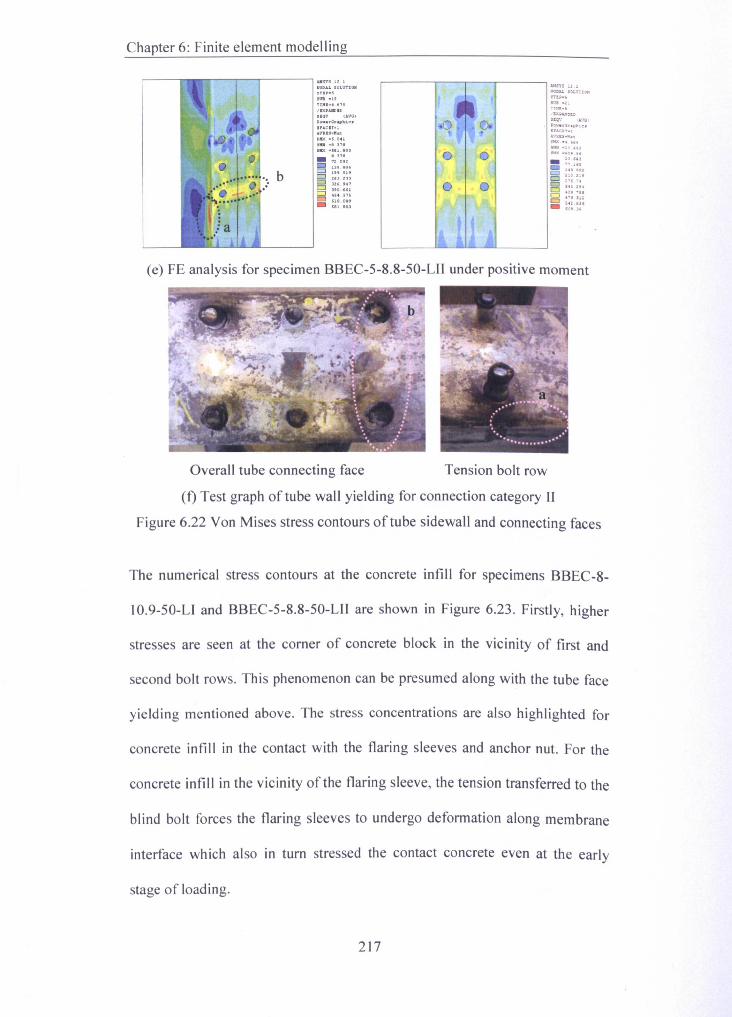
Chapter 6: Finite element modelling
------,,----.----, AJl'SYS 12.1ilODAL SOLUTIO)!!5TI'·SsUII_n
b
Jlo... ~araph.1e.IU,CIT-lAVJ.IS-!fKDIO(_5.0oUIKJf_S.3?eIII)( _511 •• 03
- ~Z~~:Z~l:U.'Oi~ !::.:~:o 3U.947CJ 190.£U~ :!~:~::
(e) FE analysis for specimen BBEC-5-8.8-50-LIT under positive moment
,---..--,.-----,-----, AN''!5 !l.1
NOD.u. S"o.t.tJtlONSTEP ••lUI -21
Q o
o o
u.P»I:lto5!:QV .1\1':;15·o'.·ut;ra~i~.t.n.C1:'fwl.lWl5~.nt!'!X .~ U4bIN -lO.\UPIX ...to,. ,t;_10."1~ ~:~1::2c::::J llO.2U
B!::;:4040'''1''iii :~!~!~
Overall tube connecting face
(f) Test graph of tube wall yielding for connection category II
Figure 6.22 Von Mises stress contours of tube sidewall and connecting faces
Tension bolt row
The numerical stress contours at the concrete infill for specimens BBEC-8-
IO.9-50-LJ and BBEC-5-8.8-50-LlI are shown in Figure 6.23. Firstly, higher
stresses are seen at the corner of concrete block in the vicinity of first and
second bolt rows. This phenomenon can be presumed along with the tube face
yielding mentioned above. The stress concentrations are also highlighted for
concrete infill in the contact with the flaring sleeves and anchor nut. For the
concrete infill in the vicinity of the flaring sleeve, the tension transferred to the
blind bolt forces the flaring sleeves to undergo deformation along membrane
interface which also in turn stressed the contact concrete even at the early
stage of loading.
217
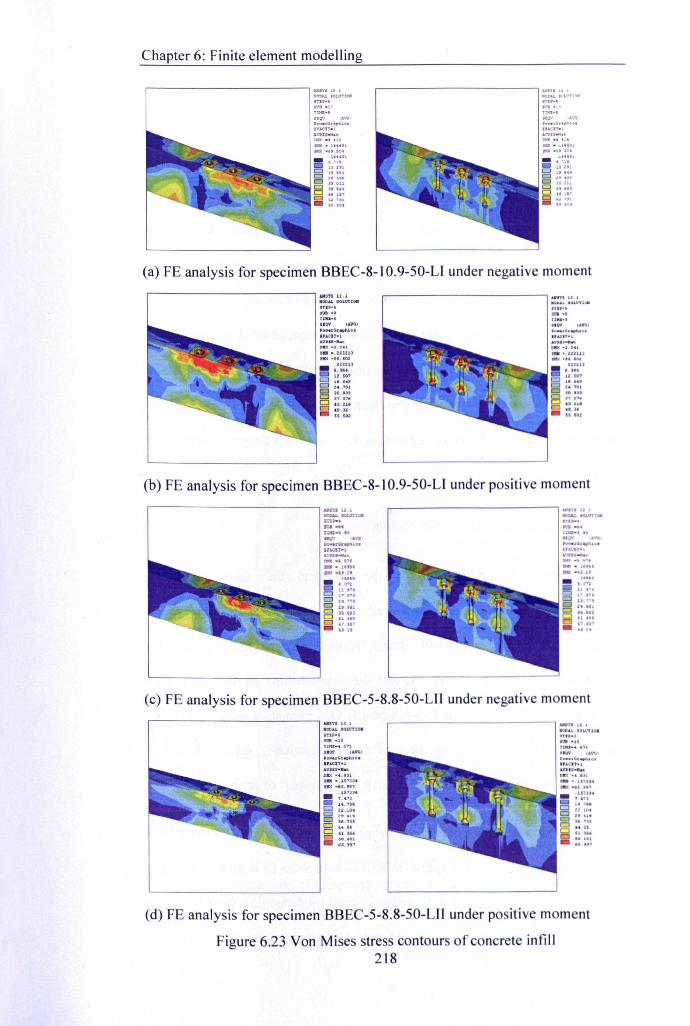
Chapter 6: Finite element modelling
ANIYll1.1NOtIM. 'OWTIOtl'
'IS"""nIB -10
rna-'"0"'_"Cr.",,!c:.lual_l
IJ'IX"U J04.144.,1i.lll13 19111 .54H U'
U 01.1n ••"" U7u"a,sUJ04
1I00U. I01.OTIOII
IT'I'.'l1n"lOYOU-'..OVfo".~".hlC'.,Icn_ll'nll uDot _, H.IDOl- HHtl~.".I"f
.HUIl
- ,,~1t~ aUl
B ~::~~§ nn.
~:!;:!
(a) FE analysis for specimen BBEC-S-IO.9-50-U under negative moment
(b) FE analysis for specimen BBEC-S-I O.9-50-U under positive moment
sn;p..4
1Il'-UlJlQ;-l."nq\! U.\'IOl":IYfrlO&'_1clt:rloCl' ..lA'.IU: • ...,...trtQ; .. ",.
SKK .. ::.ft104s:u .uu- 1'15.
ID'"0 H,"'.0 1" .~c0 ..""0 ., til0 n ",c:::J 41 ...0 n ,•.,-
,-----------------, utn. u,IION.LI(ltn:'tClil" .m ..u,.., n"'"'
1-'"U,lU
at"n.'"u ..,n.'"
(c) FE analysis for specimen BBEC-5-S.S-50-LII under negative moment
.011 ..... SOLUTIOtl""''1'1111'00" IOIo\ITIO.
ITIP-' I",..,SUI "J.' .UI""Tl"'-4.Gn; nlU_, .,.110'1 IA-VGl 110'1 CAVOIPo .... .,C.,.p.lu.c. • ..... C.~ ••.. .u:IT-l IUCU·t",VlIS.pt.t .VJ.II.~l>fIX "",131 010(·, UtSmr ... 1S?31.- 7.'11
.1IlU'
51 .&.to.?'11 14'"0 n: 1040 e•. u, 1'.41'0 'I.llS :I'"U0 .4010 Ill ..Cl .s1.'U II Ul- ".n7 U""
(d) FE analysis for specimen BBEC-5-S.S-50-LII under positive moment
Figure 6.23 Von Mises stress contours of concrete intill218
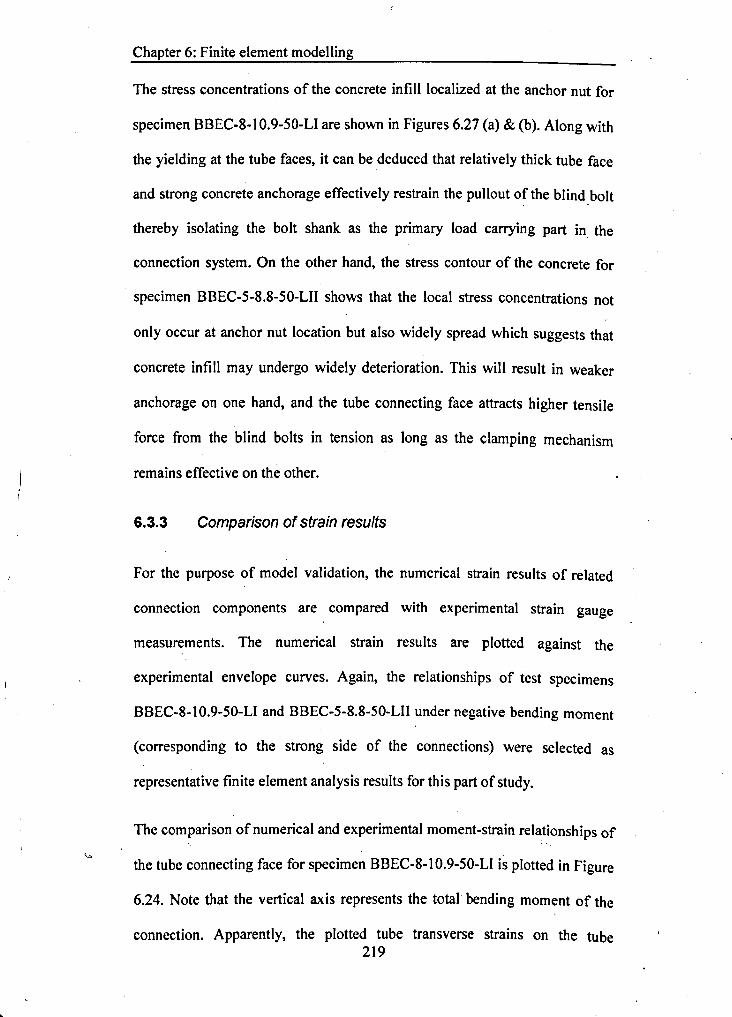
Chapter 6: Finite element modelling
The stress concentrations of the concrete infill localized at the anchor nut for
specimen BBEC-S-IO.9-50-U are shown in Figures 6.27 (a) & (b). Along with
the yielding at the tube faces, it can be deduced that relatively thick tube face
and strong concrete anchorage effectively restrain the pullout of the blindbolt
thereby isolating the bolt shank as the primary load carrying part in the
connection system. On the other hand, the stress contour of the concrete for
specimen BBEC-5-S.S-50-LII shows that the local stress concentrations not
only occur at anchor nut location but also widely spread which suggests that
concrete infill may undergo widely deterioration. This will result in weaker
anchorage on one hand, and the tube connecting face attracts higher tensile
force from the blind bolts in tension as long as the clamping mechanism
remains effective on the other.
6.3.3 Comparison of strain results
For the purpose of model validation, the numerical strain results of related
connection components are compared with experimental strain gauge
measurements. The numerical strain results are plotted against the
experimental envelope curves. Again, the relationships of test specimens
BBEC-S-I0.9-50-LI and BBEC-5-S.S-S0-LII under negative bending moment
(corresponding to the strong side of the connections) were selected as
representative finite element analysis results for this part of study.
The comparison of numerical and experimental moment-strain relationships of
the tube connecting face for specimen BBEC-S-IO.9-50-LI is plotted in Figure
6.24. Note that the vertical axis represents the total bending moment of the
connection. Apparently, the plotted tube transverse strains on the tube219
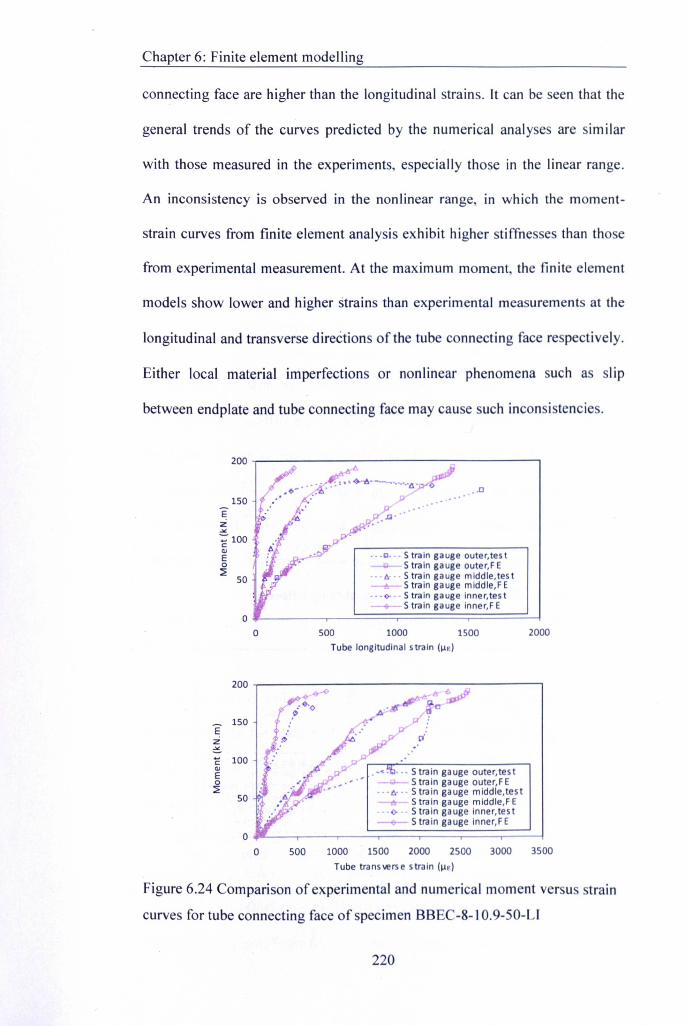
Chapter 6: Finite element modelling
connecting face are higher than the longitudinal strains. lt can be seen that the
general trends of the curves predicted by the numerical analyses are similar
with those measured in the experiments, especially those in the linear range.
An inconsistency is observed in the nonlinear range, in which the moment-
strain curves from finite element analysis exhibit higher stiffnesses than those
from experimental measurement. At the maximum moment, the finite element
models show lower and higher strains than experimental measurements at the
longitudinal and transverse directions of the tube connecting face respectively.
Either local material imperfections or nonlinear phenomena such as slip
between endplate and tube connecting face may cause such inconsistencies.
200
150E:i....:;100cOJE0~ 50
00
...' .:,.'~'-6'-"-"""d/.:..,o~::;.. .G.-~ •• "'-'- •••••• 0
.~ .. ""'" , .. go o"''''~''-Q- Strain gauge outer,F E
---6'" Strain gauge mlddle,test-t.- Strain gauge mlddle,F E
---<>---Strain gauge Inner,test__ Strain gauge Inner,F E
500 1000 lS00 2000Tube longitudinal strain (~e)
clODOJEo~
200~-----------------------------------.
~ ~.: " I!~:...'• p'
.'.....----------------,
.-~- .-- Strain gauge outer,test_ Stra in gauge outer, FE
--. 6-- - Strain gauge middle, tes t-tr Strain gauge middle,F E
- ()- 5 train gauge inner,test-+ 5 train gauge Inner,FEO~--~--~~==~==~==~==~
150Ez~
50
o 500 1000 1500 2000 2500 3000 3500Tube transverse strain (~E)
Figure 6.24 Comparison of experimental and numerical moment versus strain
curves for tube connecting face of specimen BBEC-8-1 0.9-50-LI
220
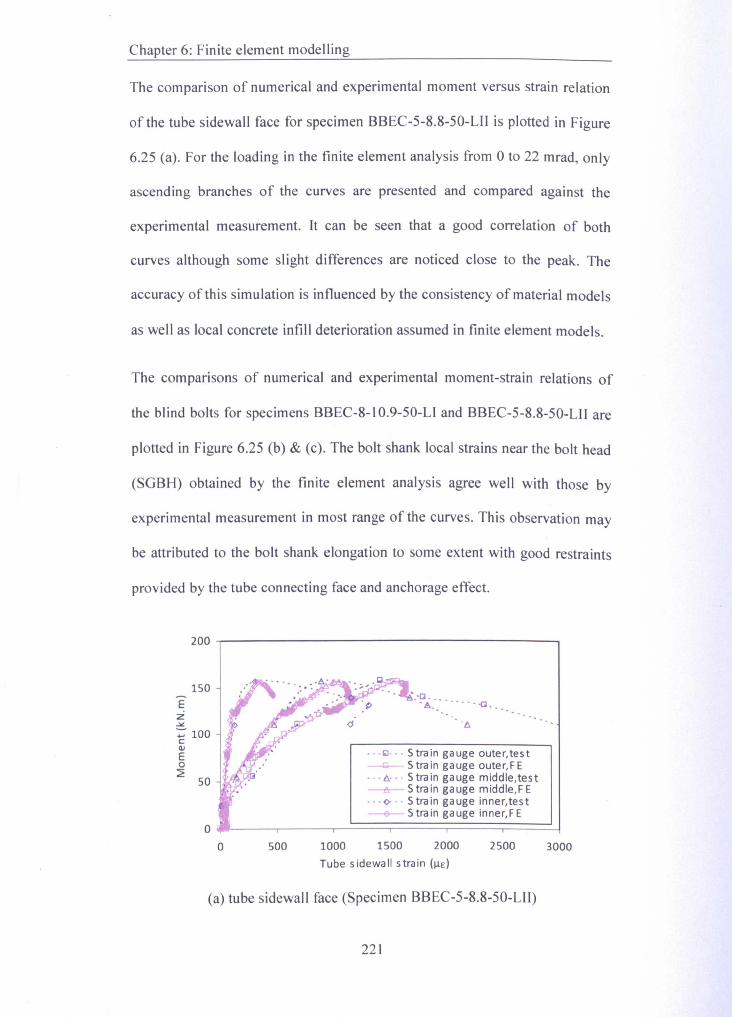
Chapter 6: Finite element modelling
The comparison of numerical and experimental moment versus strain relation
of the tube sidewall face for specimen BBEC-5-8.8-50-LII is plotted in Figure
6.25 (a). For the loading in the finite element analysis from 0 to 22 mrad, only
ascending branches of the curves are presented and compared against the
experimental measurement. It can be seen that a good correlation of both
curves although some slight differences are noticed close to the peak. The
accuracy of this simulation is influenced by the consistency of material models
as well as local concrete infill deterioration assumed in finite element models.
The comparisons of numerical and experimental moment-strain relations of
the blind bolts for specimens BBEC-8-1 O.9-50-LJ and BBEC-5-8.8-50-LII are
plotted in Figure 6.25 (b) & (c). The bolt shank local strains near the bolt head
(SGBH) obtained by the finite element analysis agree well with those by
experimental measurement in most range of the curves. This observation may
be attributed to the boIt shank elongation to some extent with good restraints
provided by the tube connecting face and anchorage effect.
200
150EZ~:: 100cQ)
E0:2 50
00
'''~A:'--------a _
-6
- - -(;J- - - Strain gauge outer,test--Q.- Strain gauge outer,FE---/),--- Strain gauge middle,test--0-- Stra in gauge middle, FE- - - (>- - - Stra in gauge inner,tes t~Strain gauge inner,FE
500 1000 1500 2000 2500 3000Tube sidewall strain (1lE!
(a) tube sidewall face (Specimen BBEC-5-8.8-50-LII)
221
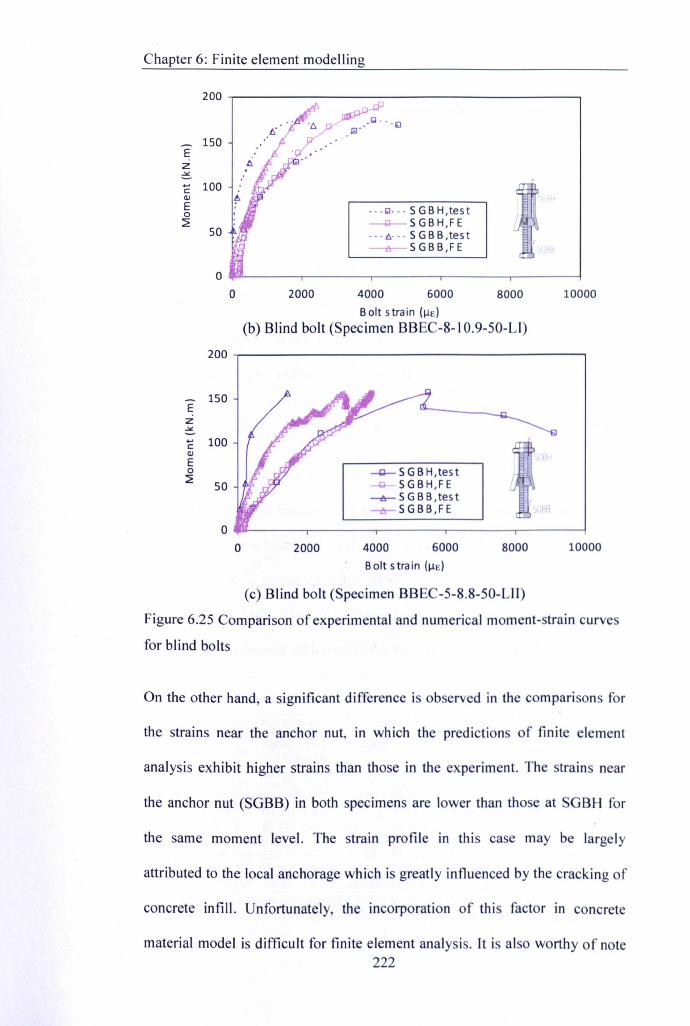
Chapter 6: Finite element modelling
150EZ-".... 100cOJ il1
E ... ~... SGBH,test0~ --Q.-SGBH,FESO ••• t:;••• SGBB,tes t
--o--SGBB,FE 8~
00 2000 4000 6000 8000 10000
Bolt strain (ue)(b) Blind bolt (Specimen BBEC-8-l O.9-50-L1)
200
150EZ-"... 100cOJ f3HE0 -Q-SGBH,test~ SO -Q- SGBH,FE
--.!r-SGBB,test-o-SGBB,FE )1.88
00 ·2000 4000 6000 8000 10000
Bolt stra in (!lE)
(c) Blind bolt (Specimen BBEC-5-8.8-50-L1I)
Figure 6.25 Comparison of experimental and numerical moment-strain curve
for blind bolts
On the other hand, a significant difference is observed in the com pari on for
the strains near the anchor nut, in which the predictions of finite element
analysis exhibit higher strains than those in the experiment. The trains near
the anchor nut (SGBB) in both specimens are lower than those at GBH for
the same moment level. The strain profile in this case may be largely
attributed to the local anchorage which is greatly influenced by the cracking of
concrete intill. Unfortunately, the incorporation of this factor in concrete
material model is difficult for finite element analysis. It is also worthy of note222
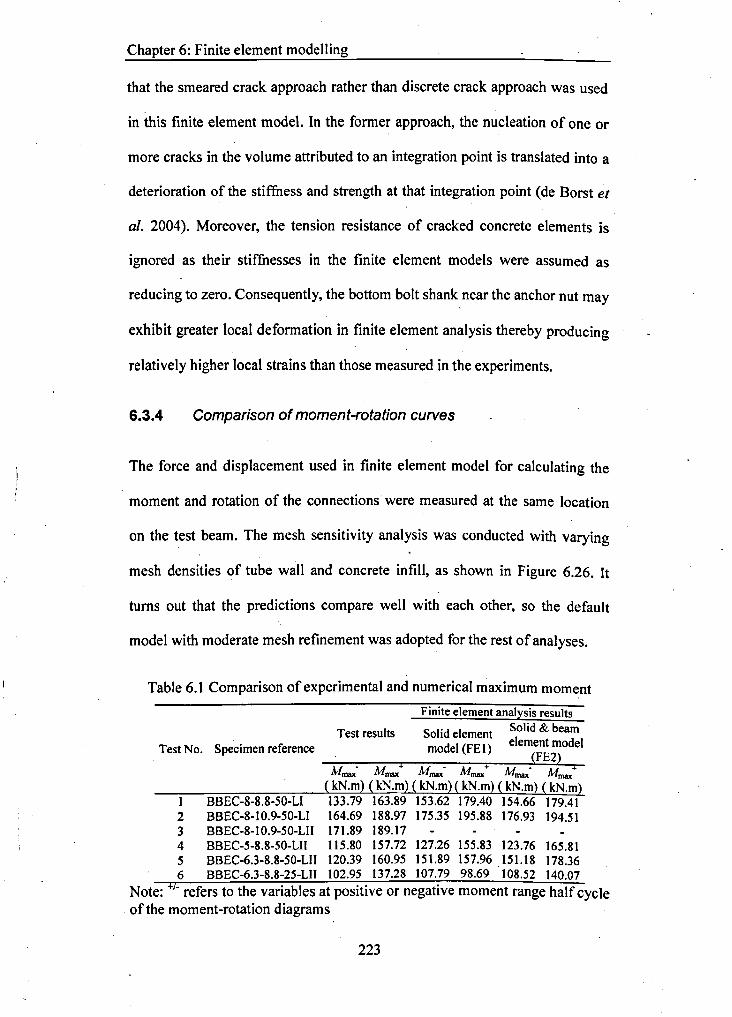
Chapter 6: Finite element modelling
that the smeared crack approach rather than discrete crack approach was used
in this finite element model. In the former approach, the nucleation of one or
more cracks in the volume attributed to an integration point is translated into a
deterioration of the stiffness and strength at that integration point (de Borst et
al. 2004). Moreover, the tension resistance of cracked concrete elements is
ignored as their stiffnesses in the finite element models were assumed as
reducing to zero. Consequently, the bottom bolt shank near the anchor nut may
exhibit greater local deformation in finite element analysis thereby producing
relatively higher local strains than those measured in the experiments.
6.3.4 Comparison of moment-rotation curves
The force and displacement used in finite element model for calculating the
moment and rotation of the connections were measured at the same location
on the test beam. The mesh sensitivity analysis was conducted with varying
mesh densities of tube wall and concrete infill, as shown in Figure 6.26. It
turns out that the predictions compare well with each other, so the default
model with moderate mesh refinement was adopted for the rest of analyses.
Table 6.1 Comparison of experimental and numerical maximum moment
Test results
Finite element analysis results
S I·d I t Solid & beamOle emend I (FE1) element model
mo e (FE2)Test No. Specimen referenceM. . M. + Mo . M. + M. . M. +max max max max max max
( kN.m) ( kN.m) ( kN.m) ( kN.m) ( kN.m) ( kN.m)1 BBEC-S-S.S-50-LI 133.79 163.S9 153.62 179.40 154.66 179.412 BBEC-S-I0.9-50-LI 164.69 ISS.97 175.35 195.SS 176.93 194.513 BBEC-S-I0.9-50-LII 171.S9 IS9.174 BBEC-5-S.S-50-LII 115.S0 157.72 127.26 155.S3 123.76 165.815 BBEC-6.3-S.S-S0-LII 120.39 160.95 151.S9 157.96151.1S 17S.366 BBEC-6.3-S.8-25-LII 102.95 137.28 107.79 98.69 108.52 140.07
Note: +1- refers to the variables at positive or negative moment range half cycleof the moment-rotation diagrams
223
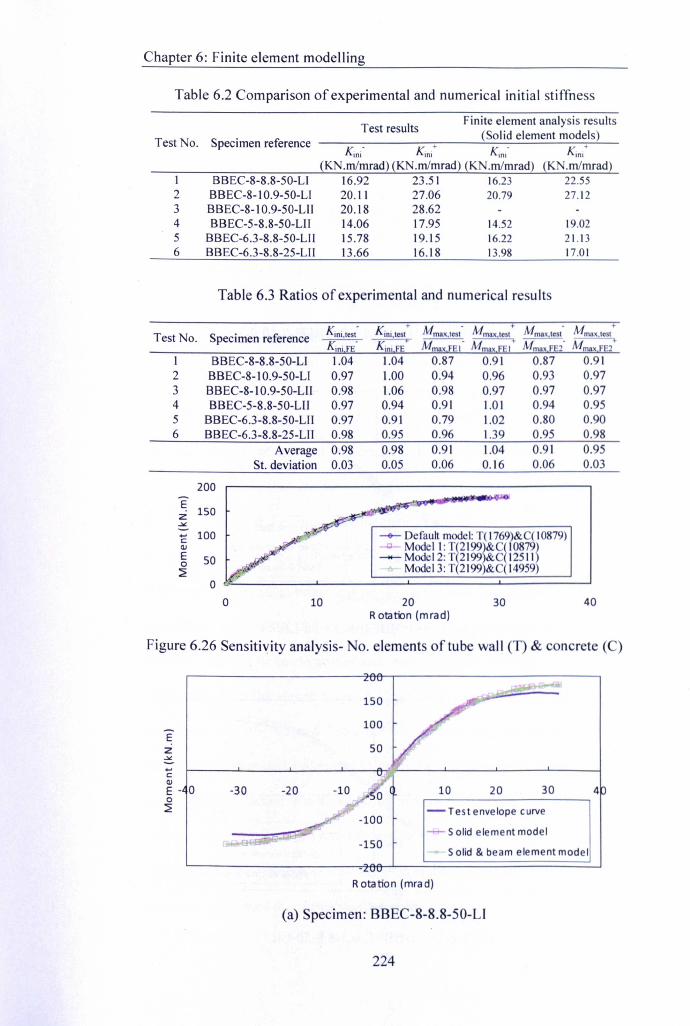
Chapter 6: Finite element modelling
Table 6.2 Comparison of experimental and numerical initial stiffness
Test results Finite element analysis results
Test No. Specimen reference(Solid element models)
x; Kini+ «; «:(KN.mlmrad) (KN.mlmrad) (KN.mlmrad) (KN.mlmrad~
I BBEC-8-8.8-S0-LI 16.92 23.51 16.23 22.552 BBEC-8-10.9-S0-LI 20.11 27.06 20.79 27.123 BBEC-8-10.9-50-LII 20.18 28.624 BBEC-5-8.8-50-LII 14.06 17.95 14.52 19.025 BBEC-6.3-8.8-50-LI I 15.78 19.15 16.22 21.136 BBEC-6.3-8.8-25-LI I 13.66 16.18 13.98 17.01
Table 6.3 Ratios of experimental and numerical results
Kini.test' Kini.test+
Mmax.,est' Mmax.test Mmax.test' Mma.,te'tTest No. Specimen referenceKiniFE' Kini FE MmaxFEI' Mm.xFEI Mma. FE2' Mm ax FE2
T
1 BBEC-8-8.8-50-LI 1.04 1.04 0.87 0.91 0.S7 0.912 BBEC-S-IO.9-50-LI 0.97 1.00 0.94 0.96 0.93 0.973 BBEC-S-IO.9-50-LlI 0.98 1.06 0.98 0.97 0.97 0.974 BBEC-5-8.8-50-LI I 0.97 0.94 0.91 1.01 0.94 0.955 BBEC-6.3-8.8-50-LlI 0.97 0.91 0.79 1.02 0.80 0.906 BBEC-6.3-8.8-25-LlI 0.98 0.95 0.96 1.39 0.95 0.98
Average 0.98 0.98 0.91 1.04 0.91 0.95St. deviation 0.03 0.05 0.06 0.16 0.06 0.03
200E 150Z,:,,:,
.... 100 -- Default model:T(1769)&C(10879)c:OJ
...Q- Model I: T~2199rC~ 10879~E 50 -- Model2: T 2199& 125110 Model3: T 2199 & 14959::::-i
00 10 20 30 40
Rotation (mrad)
Figure 6.26 Sensitivity analysis- No. elements of tube wall (T) & concrete ( )
Ez-"'-....c:OJE - 0o::::-i
-30 -20 -10
-Test envelope curve
-Solid elementmodel
Solid & beam element model
Rotation (mrad)
(a) Specimen: BBEC-8-8.8-50-LI
224
4
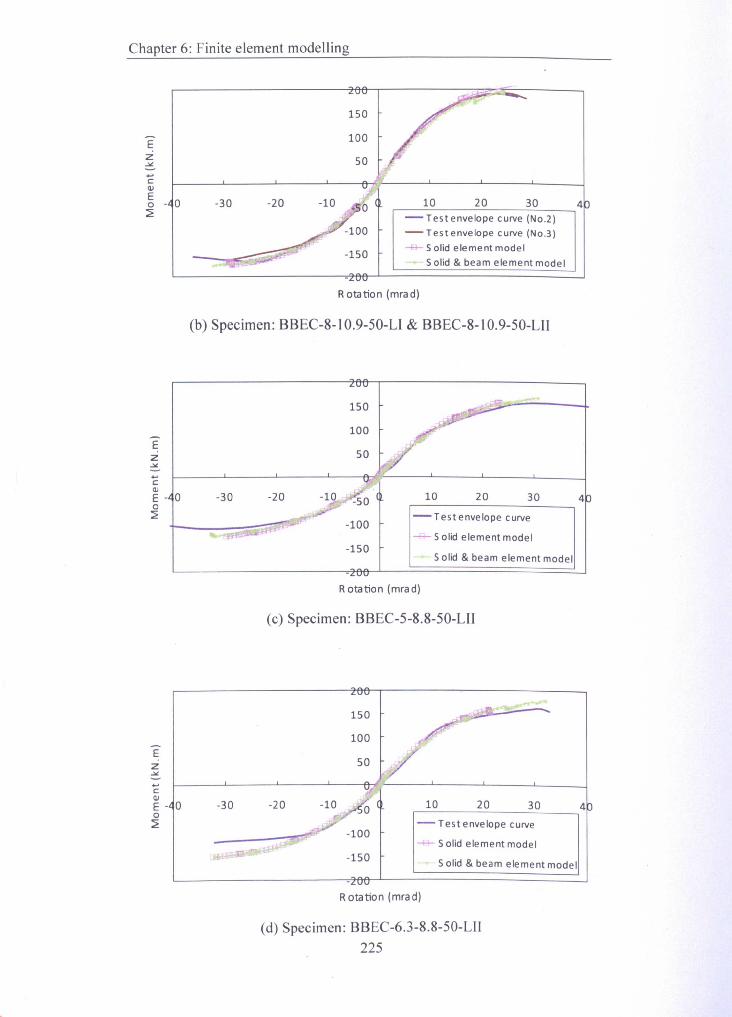
Chapter 6: Finite element modelling
Ez.><.....cC1l
~ - 0~
-30 -20 r-__~10~__ ~2~0~ __ ~3~0 ~4-Test envelope curve (No.2)-Test envelope curve (No.3)-s- Solid element model
Solid & beam element model-150...
Rotation (mra d)
(b) Specimen: BBEC-8-10.9-50-LI & BBEC-8-10.9-50-LII
Ez.><
Solid & beam element model
30
100150
.....cC1lE - 0o~
-20 10 20-30 4,-------------------~-Test envelope curve
.....,_Solid element model-100-150
Rotation (mrad)
(c) Specimen: BBEC-5-8.8-50-LII
LUU
150 ~""",/Tr10050 /~ ..
0
~
10 20 30 4p-Testenvelope curve
00-++- Solid element model
1,*,1] -150 5 olid & beam element model
-LVV
Ez,:,,!,
.....cC1lE -o~
Rotation (mrad)
(d) Specimen: BBEC-6.3-8.8-50-LII225
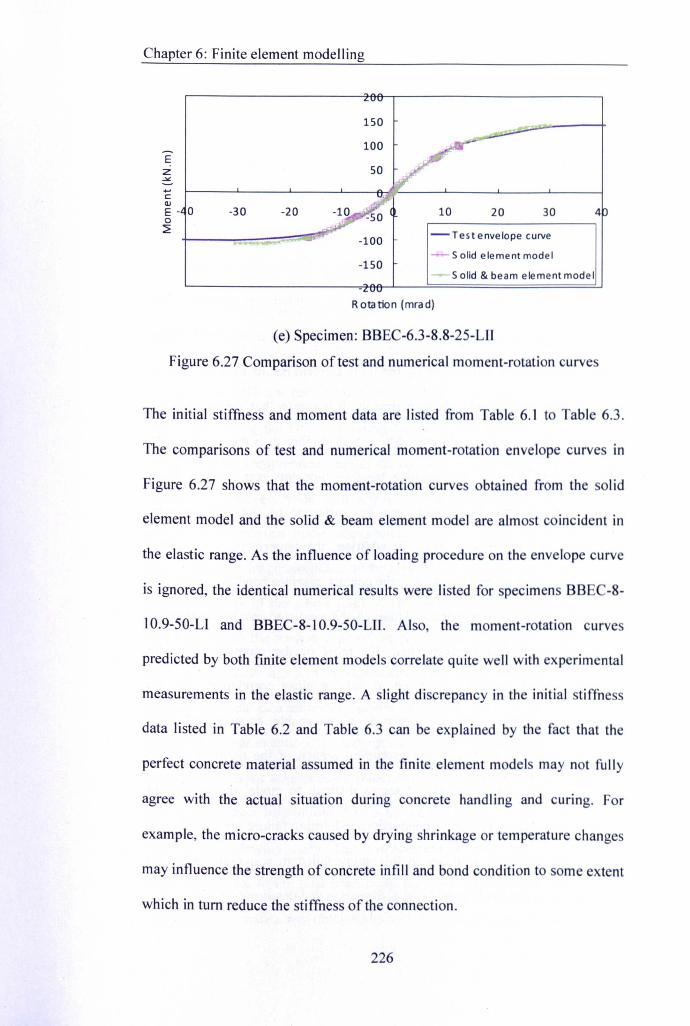
Chapter 6: Finite element modelling
...c:QJ
E - 0o~
-20 10 20 30 4-30
150
100Ez.><
-100 -Test envelope curve
-t+-Solid element model-150
Solid & beam element model
Rotation (mrad)
(e) Specimen: BBEC-6.3-8.8-2S-LII
Figure 6.27 Comparison of test and numerical moment-rotation curves
The initial stiffness and moment data are listed from Table 6.1 to Table 6.3.
The comparisons of test and numerical moment-rotation envelope curves in
Figure 6.27 shows that the moment-rotation curves obtained from the solid
element model and the solid & beam element model are almost coincident in
the elastic range. As the influence of loading procedure on the envelope curve
is ignored, the identical numerical results were listed for specimens BB -8-
10.9-S0-U and BBEC-8-10.9-50-LIl. Also, the moment-rotation curve
predicted by both finite element models correlate quite well with experimental
measurements in the elastic range. A slight discrepancy in the initial stiffne s
data listed in Table 6.2 and Table 6.3 can be explained by the fact that the
perfect concrete material assumed in the finite element models may not fully
agree with the actual situation during concrete handling and curing. For
example, the micro-cracks caused by drying shrinkage or temperature changes
may influence the strength of concrete infill and bond condition to some extent
which in tum reduce the stiffness of the connection.
226
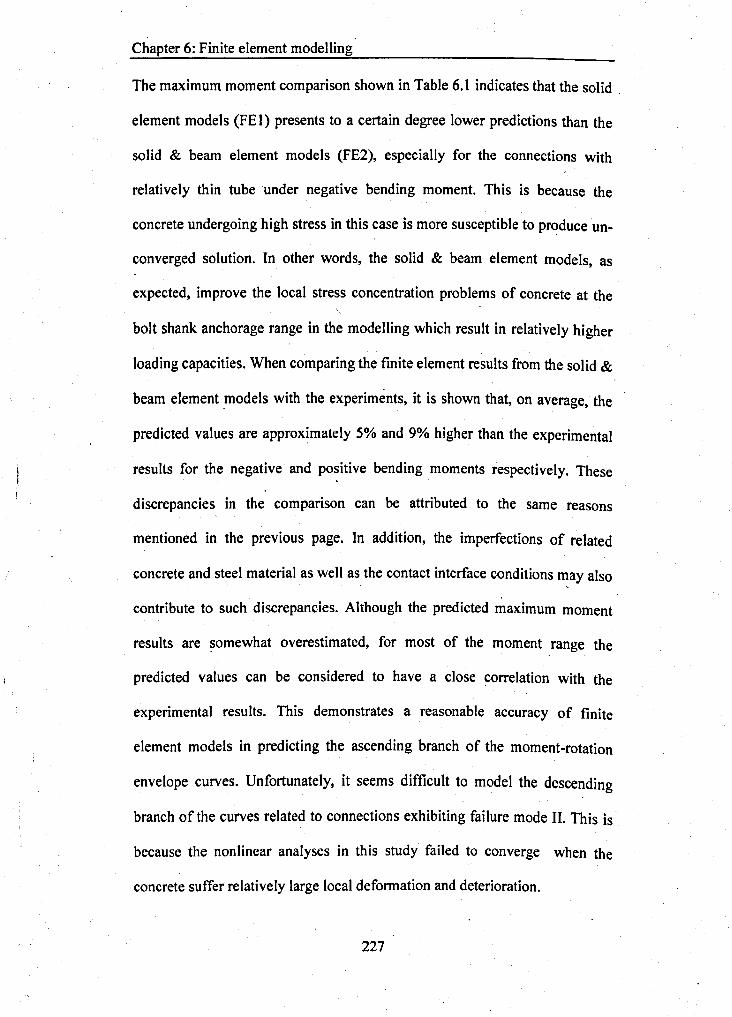
Chapter 6: Finite element modelling
The maximum moment comparison shown in Table 6.1 indicates that the solid .
element models (FE 1) presents to a certain degree lower predictions than the
solid & beam element models (FE2), especially for the connections with
relatively thin tube under negative bending moment. This is because the
concrete undergoing high stress in this case is more susceptible to produce un-
converged solution. In other words, the solid & beam element models, as
expected, improve the local stress concentration problems of concrete at the
bolt shank anchorage range in the modelling which result in relatively higher
loading capacities. When comparing the finite element results from the solid &
beam element models with the experiments, it is shown that, on average, the
predicted values are approximately 5% and 9% higher than the experimental
results for the negative and positive bending moments respectively. These
discrepancies in the comparison can be attributed to the same reasons
mentioned in the previous page. In addition, the imperfections of related
concrete and steel material as well as the contact interface conditions may also
contribute to such discrepancies. Although the predicted maximum moment
results are somewhat overestimated, for most of the moment range the
predicted values can be considered to have a close correlation with the
experimental results. This demonstrates a reasonable accuracy of finite
element models in predicting the ascending branch of the moment-rotation
envelope curves. Unfortunately, it seems difficult to model the descending
branch of the curves related to connections exhibiting failure mode II. This is
because the nonlinear analyses in this study failed to converge when the
concrete sutTerrelatively large local deformation and deterioration.
227
Chapter 6: Finite element modelling
6.3.5 Comparison of tube deformation results
The flexibility of CFT column has been identified to influence the stiffness of
the connections. The experiments in this study have incorporated the tube wall
thickness and the concrete strength as important influential factors in the
connection performance. Due to the limitation of the instrumentation in the
experiment, however, it is unlikely that all the information regarding the
deformity of the tube is recorded. The numerical approach using finite element
analysis was, therefore, adopted to further understanding in such cases.
The concrete infill has been recognized (France et al, 1999) to have positive
role in preventing the tube connecting face and tube sidewall face buckling
outwards in the compression zone of the connection. Moreover, given that the
endplate is relatively wide with respect to the tube wall, the local inward
bearing of the endplate on the tube connecting face is small. Consequently, the
tension zone of the connections can be regarded as the most important source
of deformability of the whole joint. A typical deformation illustration at the
first bolt row in the tension zone of the connection is shown in Figure 6.28.
Tube deformation along a representative path from the tube centreline,
through the bolt clearance hole centre and then down to the lower tube
sidewall face was examined. Five ranges are identified in this path as shown in
Figure 6.28. For the sake of result illustration, the actual curved path along the
tube cross section was unfolded to a horizontal line for a distance variable
used in the following study. The displacements in UX and UZ denote the
directions normal to the tube connecting face and sidewall face respectively.
The displacement data was obtained using linear interpolation for related node
228
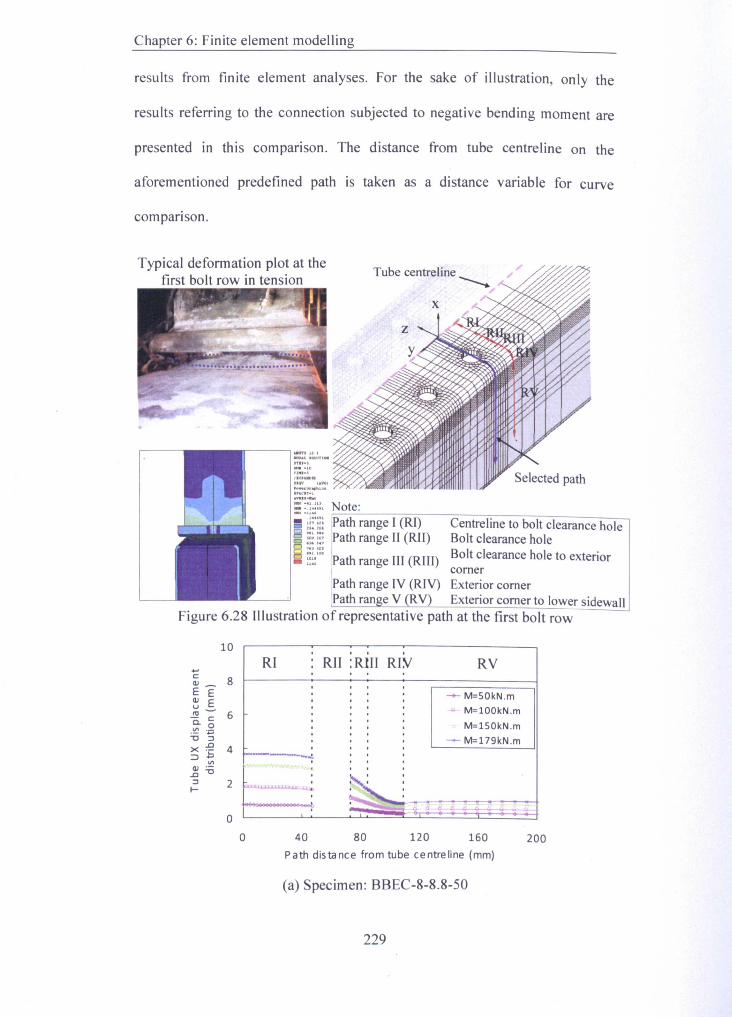
Chapter 6: Finite element modelling
results from finite element analyses. For the sake of illustration, only the
results referring to the connection subjected to negative bending moment are
presented in this comparison. The distance from tube centreline on the
aforementioned predefined path is taken as a distance variable for curve
comparison.
Typical deformation plot at thefirst bolt row in tension
- :::'::: ath range I (RI) Centreline to bolt clearance hole§ ~2::: Path range II (RH) Bolt clearance hole8 ?u.u I B It I h IIii ~:::'"Path range III (RIIJ) 0 c earance 0 e to exterior
I cornerath range IV (RIV) Exterior cornerath ran e V RV) Exterior corner to lower sidewall
Figure 6.28 Illustration of representative path at the first bolt row
Note:
'._~Gr""'1<I."~n·l
10 , ,RI RH :RUI RIY RV
, , -+- M=SOkN.m, ,
" M=100kN.m, , ,M=lS0kN.m
~ M=179kN.m, ,+ ,
1'=< ..............., , , ,,
~ .<>
oo 40 80 120 160 200
Path distance from tube centreline (mm)
(a) Specimen: BBEC-8-8.8-50
229
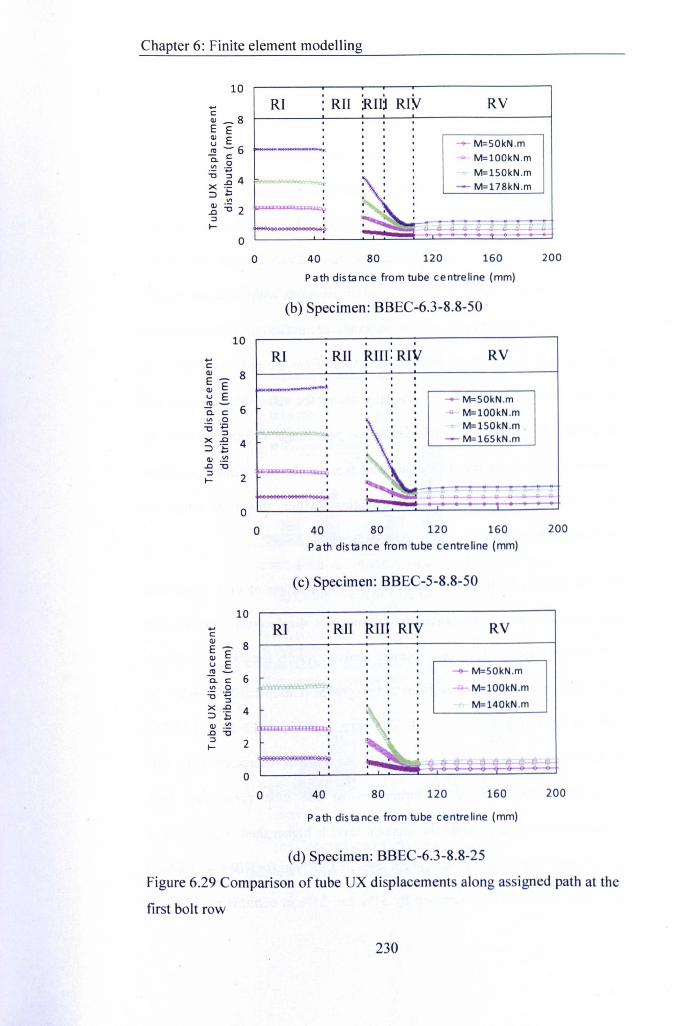
Chapter 6: Finite element modelling
....c
E - 8QJ Eu E~ ";;' 6VI 0:.0;XoD:::>"E 4OJ .~oD "tJ::It-
10 · .RI · RH :Rm RIY RV· · ·· · -+- M=50kN.m·· ~ M=100kN.m
· · . . M=150kN.m¥ot .~\ S;l' ~ M=17SkN.m· ·· ··- :.~~ a 8 ~'--'-t. g _.,
g'r t i:i Cl"200
oo 40 SO 120 160
200
Path distance from tube centreline (mm)
(b) Specimen: BBEC-6.3-8.8-S0
10
200
(d) Specimen: BBEC-6.3-S.S-2S
Figure 6.29 Comparison of tube UX displacements along assigned path at the
first bolt row
: RH RIll: RIVI • I •
RVRI
M=SOkN.m... M=100kN.m
M=lS0kN.m~M=165kN.m
2
oo 40 80 120 160
Path distance from tube centreline (mm)
(c) Specimen: BBEC-S-8.8-S0
10
RI :RH RJIJRIV RV
~M=50kN.m
;:;.. M=100kN.m
M=140kN.m
2
oo 40 80 160120
Path distance from tube centreline (mm)
230
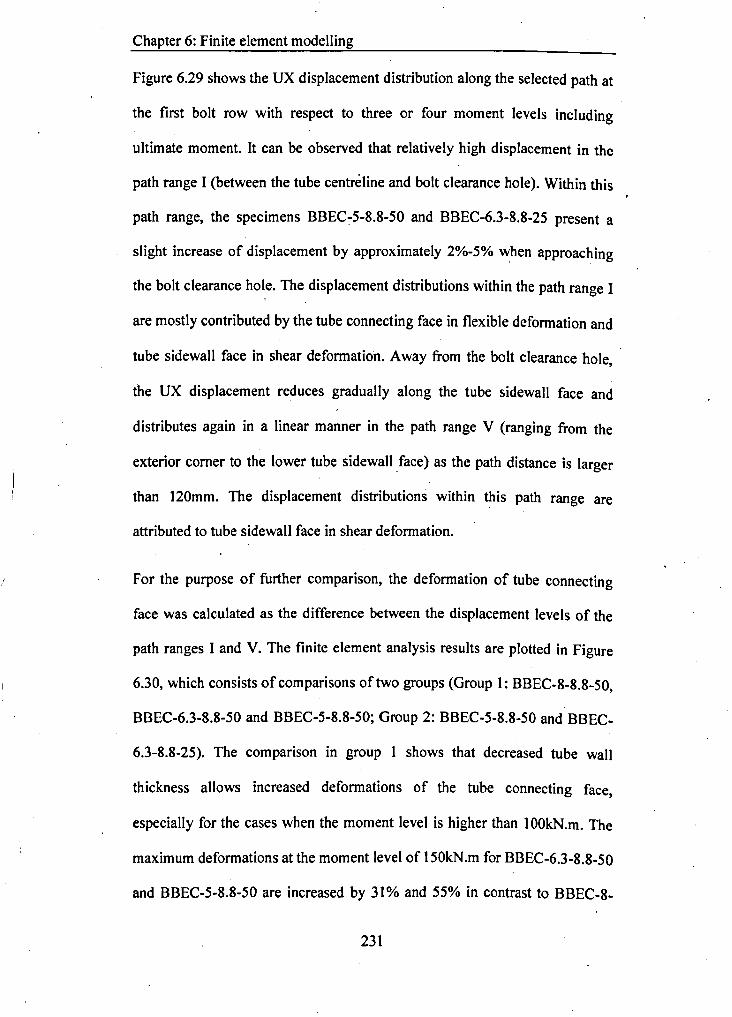
Chapter 6: Finite element modelling
Figure 6.29 shows the UX displacement distribution along the selected path at
the first bolt row with respect to three or four moment levels including
ultimate moment. It can be observed that relatively high displacement in the
path range I (between the tube centreline and bolt clearance hole). Within this
path range, the specimens BBEC~5-S.S-50 and BBEC-6.3-S.S-25 present a
slight increase of displacement by approximately 2%-5% ~hen approaching
the bolt clearance hole. The displacement distributions within the path range I
are mostly contributed by the tube connecting face in flexible deformation and
tube sidewall face in shear deformation. Away from the bolt clearance hole,
the UX displacement reduces gradually along the tube sidewall face and
distributes again in a linear manner in the path range V (ranging from the
exterior comer to the lower tube sidewall face) as the path distance is larger
than 120mm. The displacement distributions within this path range are
attributed to tube sidewall face in shear deformation.
For the purpose of further comparison, the deformation of tube connecting
face was calculated as the difference between the displacement levels of the
path ranges I and V. The finite element analysis results are plotted in Figure
6.30, which consists of comparisons of two groups (Group 1: BBEC-8-8.8-50,
BBEC-6.3-8.S-50 and BBEC-5-S.8-50; Group 2: BBEC-5-8.S-50 and BBEC-
6.3-8.8-25). The comparison in group 1 shows that decreased tube wall
thickness allows increased deformations of the tube connecting face,
especially for the cases when the moment level is higher than 100kN.m. The
maximum deformations at the moment level of 150kN.m for BBEC-6.3-8.8-50
and BBEC-5-S.8-50 are increased by 31% and 55% in contrast to BBEC-8-
231
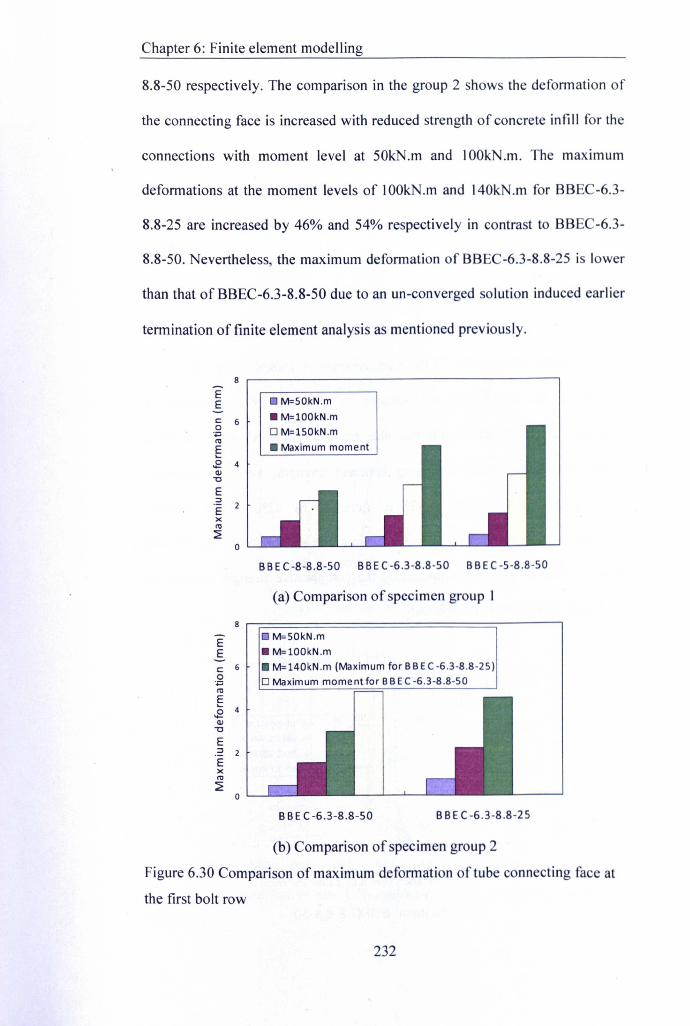
Chapter 6: Finite element modelling
8.8-50 respectively. The comparison in the group 2 shows the deformation of
the connecting face is increased with reduced strength of concrete infill for the
connections with moment level at 50kN.m and 1OOkN.m. The maximum
deformations at the moment levels of 100kN.m and 140kN.m for BBEC-6.3-
8.8-25 are increased by 46% and 54% respectively in contrast to BBEC-6.3-
8.8-50. Nevertheless, the maximum deformation of BBEC-6.3-8.S-25 is lower
than that of BBEC-6.3-S.8-50 due to an un-converged solution induced earlier
termination of finite element analysis as mentioned previously.
8 ,-------------------------------------,
EE o M=50kN.m
• M=100kN.mo M=150kN.m• Maximum moment
c 6o'pI1l
E"-.E 4Q)
-cE.:!ExI1l
~o
BBEC-8-8.8-50 BBEC-6.3-8.8-50 BBEC-5-8.8-50
(a) Comparison of specimen group I
8 ~========================~----~EE
Cl M=50kN.m• M=100kN.m• M= 140kN.m (Maximum for BB EC-6.3-8.8-25o Maximum moment for BB EC -6.3-8.8-50
ExI1l
~
c: 6o:;:::;I1l
E.E 4Q)
-cE.::! 2
BBEC-6.3-8.8-50 BBEC-6.3-8.8-25
(b) Comparison of specimen group 2
Figure 6.30 Comparison of maximum deformation of tube connecting face at
the first bolt row
232
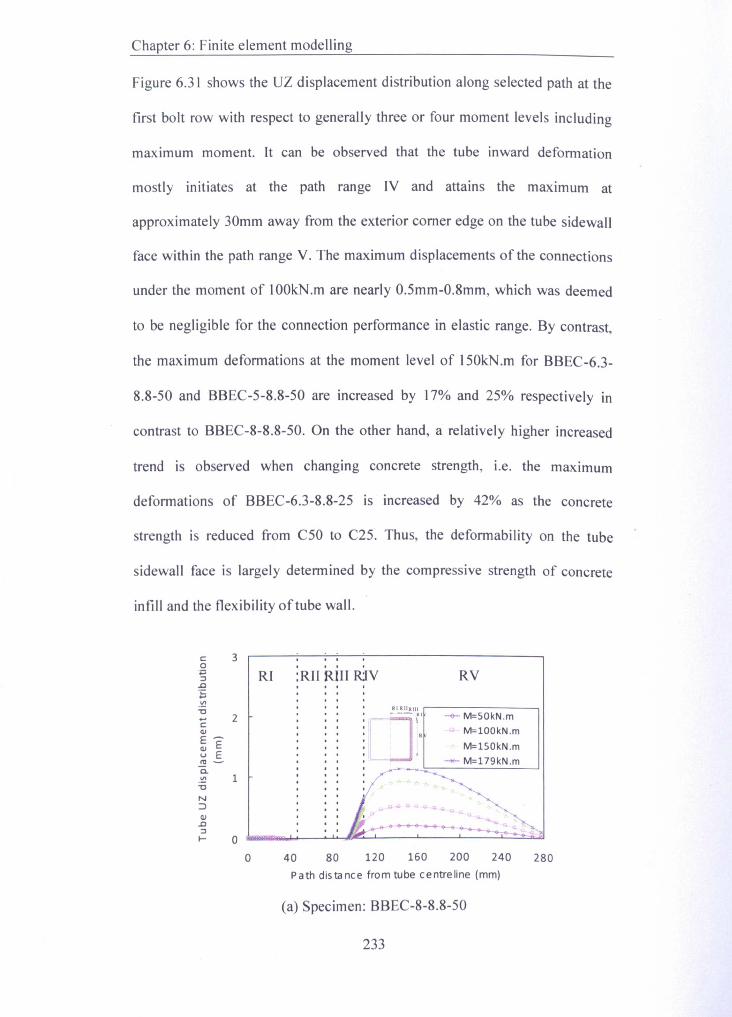
Chapter 6: Finite element modelling
Figure 6.31 shows the UZ displacement distribution along selected path at the
first bolt row with respect to generally three or four moment levels including
maximum moment. It can be observed that the tube inward deformation
mostly initiates at the path range IV and attains the maximum at
approximately 30mm away from the exterior comer edge on the tube sidewall
face within the path range V. The maximum displacements of the connections
under the moment of 100kN.m are nearly 0.5mm-0.8mm, which was deemed
to be negligible for the connection performance in elastic range. By contrast,
the maximum deformations at the moment level of 150kN.m for BBEC-6.3-
8.8-50 and BBEC-5-8.8-50 are increased by 17% and 25% respectively in
contrast to BBEC-8-8.8-50. On the other hand, a relatively higher increased
trend is observed when changing concrete strength, i.e. the maximum
deformations of BBEC-6.3-8.8-25 is increased by 42% as the concrete
strength is reduced from C50 to C25. Thus, the deformability on the tube
sidewall face is largely determined by the compressive strength of concrete
infill and the flexibility of tube wall.
3co'&:l:l~'S.!!!-0...C(1)E-(1) Eu E.!!!~0.
.!!!-0
N::>(1)~:lf-
RI. .:RII RIll R:lV RV
-+- M=50kN.m" M=100kN.m
M=lS0kN.m~ M=179kN.m
2
1
o 40 80 120 160 200 240 280
Path distance from tube centreline (mm)
(a) Specimen: BBEC-8-8.8-50
233
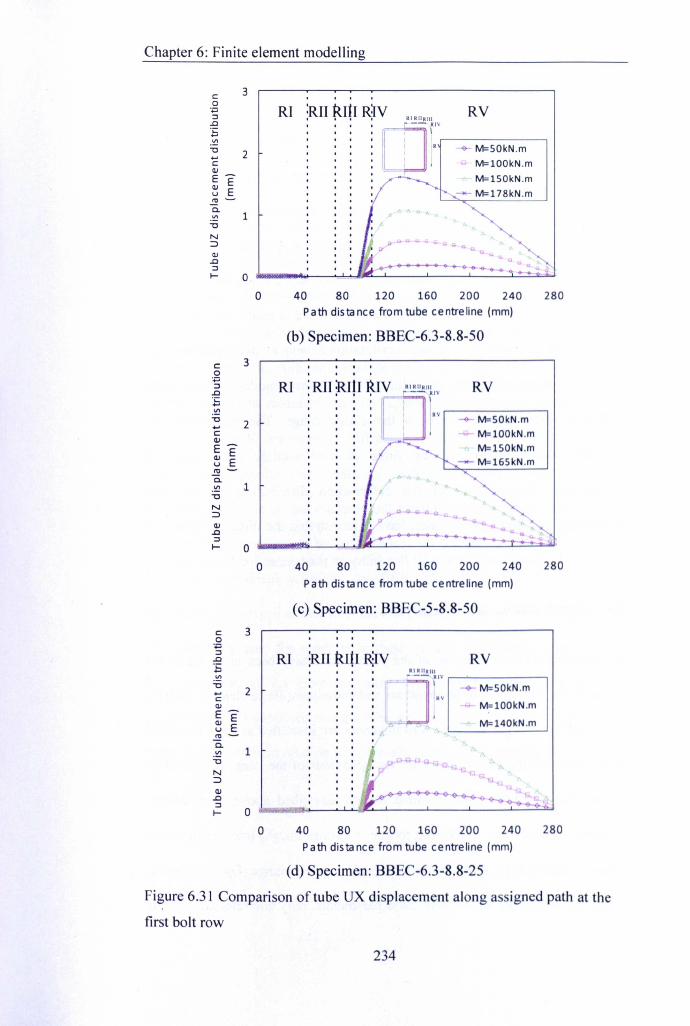
Chapter 6: Finite element modelling
c::o''':;::s.n·s.~"1:l....cQJE-QJ Eu E.!!!~c.
r::o5.nE.~"1:l....cQJE-QJ Eu E.!!!~c..~ 1"1:lN:::>QJ.n::st-
c::o''':;::s.noS.!!!"1:l....c::QJE-QJ Eu E.!!!~c..!!!"1:l
N:::>QJ.n::st-
3
2
1
o
3
2
o
3
2
1
o
RVRI :RlI RItI R)V RI RIIRIII'mr -(>- M=50kN.mM=lOOkN.mM=lSOkN.m
0"
o 28040 80 120 160 200 240Path distance from tube centreline (mm)
(b) Specimen: BBEC-6.3-S.S-50
RI RV
M=50kN.mM=100kN.mM=150kN.m
o 80 120 240 280160 20040Path distance from tube centreline (mm)
(c) Specimen: BBEC-S-S.S-SO
RI ~I1 tUfl ~JV RV
M=50kN.m
M=100kN.m
M=140kN.m
Q.
o 40 240 28080 120 160 200
Path distance from tube centreline (mm)
(d) Specimen: BBEC-6.3-S.8-2S
Figure 6.31 Comparison of tube UX displacement along assigned path at the
first bolt row
234
Chapter 6: Finite element modelling
6.3.6 Summary of FE modelling results
This section outlines the results from the finite element analysis and related
comparisons with the experiments. The modelling of bolt preload was
conducted using element death and pretension approaches. The numerical
strain results from the bolt preload modelling agree with the experimental
results. The numerical stress contours of overall test connections and their
constituent components were compared and discussed in relation to the failure
modes of the connections. The moment-rotation envelope curves predicted by
the solid element model and the solid & beam element model correlate quite
well with experimental results in the elastic range. The brief outcome,
accuracy and limitation of the finite element models were discussed
accordingly. The analysis of the deformation distribution on the tube
connecting face and sidewall face, have demonstrated the direct influence of
the concrete strength and tube wall flexibility on the connection behaviour.
6.4 Parameter variation analyses
The moment-rotation response of the connections have been analysed so far
based on the experimental observations and subsequent finite element analysis ..
The concrete strength and tube wall thickness are identified as the parameters
which have significant influence on the behaviour of the connection studied
herein. Based on the finite element models described above, a parameter
variation analyses was introduced to gain a further insight into the moment-
rotation relationships of the connections within a given range. For the purpose
of comparison of the variation of these parameters, only one selected variable
235
Chapter 6: Finite element modelling
was changed at a time. The maximum moment and rotation results were
analysed by taking into account these parameters
6.4.1 Influence of concrete grade
As mentioned in the previous section, the concrete strength influences the
deformations of the tube connecting face and sidewall face. To have a closer
examination, the connections with the concrete grade of C40 were added for
the comparative study described in this section. The comparisons of the
numerical results for different concrete grades are shown in Figure 6.32. It is
evident that the increases of moment capacity when changing concrete grade
from C25 to C40 are more significant than those from C40 to CSO. This
observation suggests that relatively high grade concrete generally has
moderate influence on the moment and rotation capacity of the connections.
By contrast, this influence becomes significant for the case of concrete grade
C25. The numerical solutions for BBEC-6.3-8.8-2S and BBEC-S-8.8-25
become un-converged earlier than that for BBEC-5-S.8-50 which suggests the
solid elements used for concrete in these models most likely undergo large
local deterioration. As more and more local concrete failed with the load
progressing, it is supposed that the tube wall becomes the main component to
carry the moment and rotation for the connections with relatively strong bolt.
236
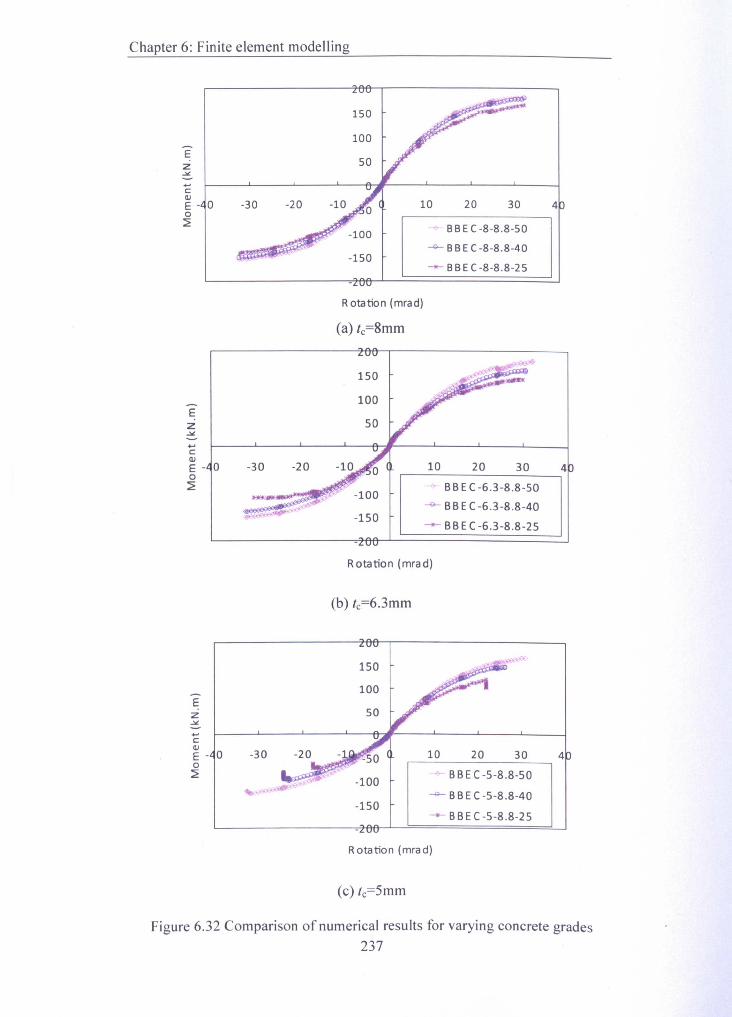
Chapter 6: Finite element modelling
150
100Ez-""....cQ)E - 0 -3~ -20 10 20 30 40~ ~. BBE(-8-8.8-50
-0- BBE(-8-8.8-40-150
-- BBE (-8-8.8-25
Rotation (mrad)
(a) tc=8mm
150
100Ez-""....CQJE - 0 -30 -20 10 20 30 40~ ~ BBE(-6.3-8.8-50
-0- BB EC-6.3-8.8-40-150
-- BBEC-6.3-8.8-25
Rotation (mrad)
(b) tc=6.3mm
150
100Ez-""....CQJ
E - 0 -3~0~
,-_1_0 20 3_0__ ~4
.'J- BBEC-5-8.8-50
-0- BBEC-5-8.8-40
-- BBEC-S-8.8-2S
Figure 6.32 Comparison of numerical results for varying concrete grades237
-150
Rotation (mrad)
(c) tc=5mm
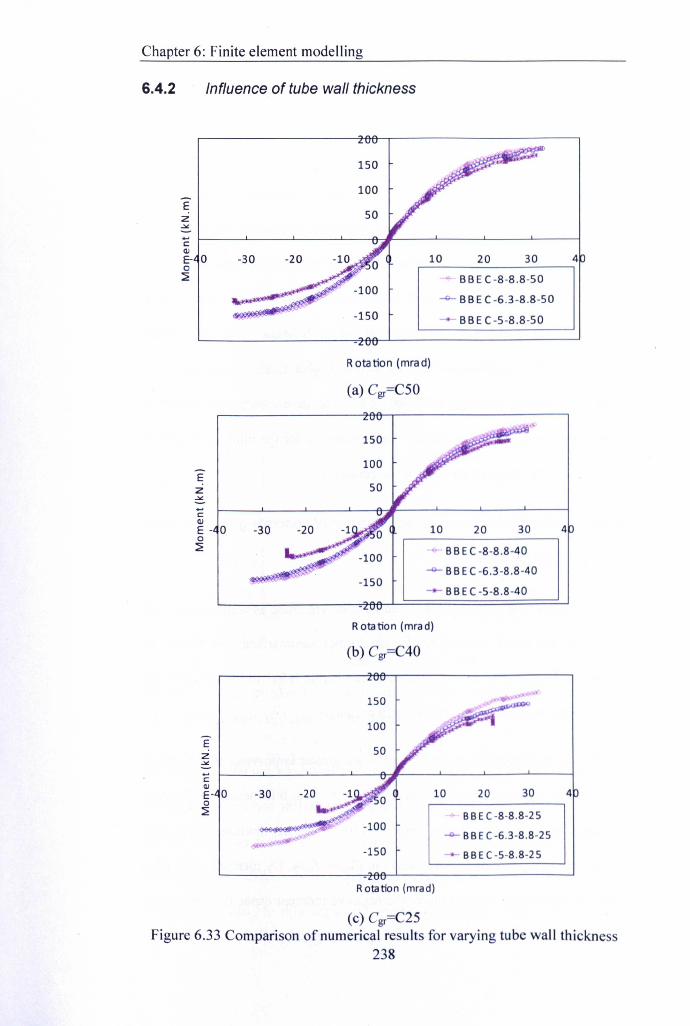
Chapter 6: Finite element modelling
6.4.2 Influence of tube wall thickness
150
100Ez-'".....c:QJ
E- O -30 -20 10 20 30 40~ -+ BB EC-8-8.8-50
--- BB EC-6.3-8.8-50-150 --- BB EC-5-8.8-50
Rotation (mrad)
(a) Cgr=C50
150
100Ez-'".....cQJ
E - 0 -30 -20 10 20 30 40~ BBEC-8-8.8-40
--- BB EC-6.3-8.8-40-150
BB EC-5-8.8-40
Rotation (mrad)
(b) Cgr=C40
150
100Ez~....cQJ
30E- O -30 10 20 40~ BBEC-8-8.8-25
~'flll1"'" -- BBEC-6.3-8.8-25-150 BBEC-S-8.8-2S
Rotation (mrad)
(c) Cgr=C25Figure 6.33 Comparison of numerical results for varying tube wall thickness
238

Chapter 6: Finite element modelling
The comparisons of numerical results for different tube wall thicknesses are
shown in Figure 6.33. Three tube wall thicknesses, i.e., 5mm, 6.3mm, and
8mm, are plotted for each concrete grade group for comparison. It can be seen
in all cases that when the tube wall was reduced to 5mm, lower moment
capacity has resulted. This trend is more pronounced for the connections with
relatively low concrete grade. The numerical finite element solutions also
resulted in lower resistance-solutions un-~onverged at earlier steps. This
observation suggests that reduced tube wall thickness leads to weaker
confining effects of concrete infill as well as higher flexibility of tube wall
thereby increasing the local deformation of concrete elements. On the other
hand, low strength concrete causes weak anchorage for the blind bolts, which
also reduces the moment capacity of the connections.
6.4.3 Discussion on combined influence of concrete grade and tube
wall thickness
As the moment capacity are influenced by concrete grade as well as tube wall
thickness, the finite element results are further summarized and plotted in
Figure 6.34. Likewise, the moment described herein refers to the case that the
connections underwent maximum negative moment.
For the moment capacity, it can be seen that a greater improvement of moment
capacity for most cases with the increase of tube wall thickness from 5mm to
6.3mm than those larger than 6.3mm. This trend is rather obvious for the case
of the concrete grade of C25 as shown in Figure 6.34. By increasing the tube
wall thickness from 5mm to 8mm, the negative moment capacity is enhanced
by 38.2% for the connections with C25 concrete grade while by 22.4% and by'239
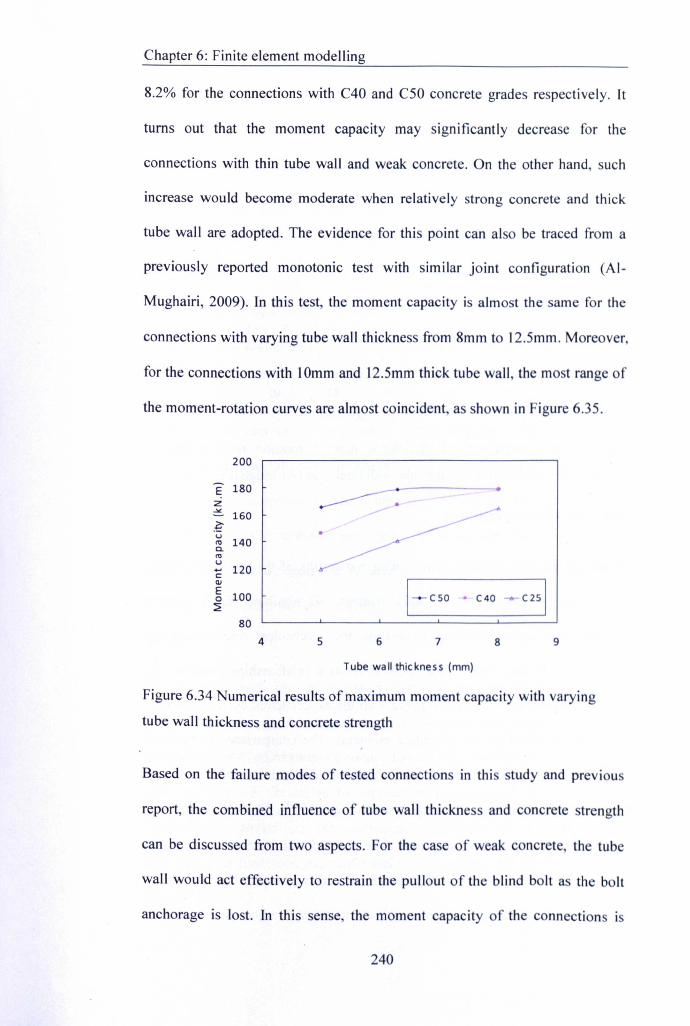
Chapter 6: Finite element modelling
8.2% for the connections with C40 and C50 concrete grades respectively. It
turns out that the moment capacity may significantly decrease for the
connections with thin tube wall and weak concrete. On the other hand, such
increase would become moderate when relatively strong concrete and thick
tube wall are adopted. The evidence for this point can also be traced from a
previously reported monotonic test with similar joint configuration (AI-
Mughairi, 2009). In this test, the moment capacity is almost the same for the
connections with varying tube wall thickness from 8mm to 12.5mm. Moreover,
for the connections with 10mm and 12.5mm thick tube wall, the most range of
the moment-rotation curves are almost coincident, as shown in Figure 6.35.
200
E 1802->< 160.~u 140ItIc.ItIU..... 120<:(I)
E 1000~
804 5
CSO • C40 C2S1
6 7 8 9
Tube wall thickness (mm)
Figure 6.34 Numerical results of maximum moment capacity with varying
tube wall thickness and concrete strength
Based on the failure modes of tested connections in thi study and previou
report, the combined influence of tube wall thickness and concrete strength
can be discussed from two aspects. For the case of weak concrete, the tube
wall would act effectively to restrain the pullout of the blind bolt as the bolt
anchorage is lost. In this sense, the moment capacity of the connections is
240
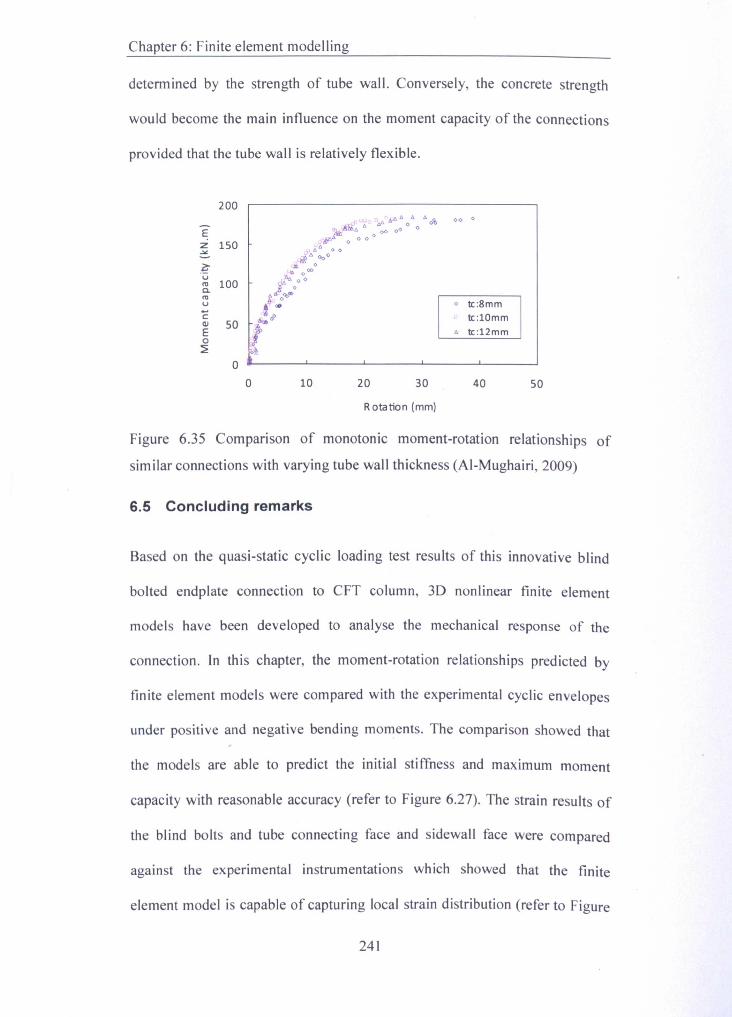
Chapter 6: Finite element modelling
determined by the strength of tube wall. Conversely, the concrete strength
would become the main influence on the moment capacity of the connections
provided that the tube wall is relatively flexible.
200
o tc:8mmtc:10mm
~ tc:12mm
ura 100c.
00 0
Ez 150-><
.~
rauCQ)
Eo
::::i!:
oo 10 20 30 40 50
Rotation (mm)
Figure 6.35 Comparison of monotonic moment-rotation relationships of
similar connections with varying tube wall thickness (AI-Mughairi, 2009)
S.5 Concluding remarks
Based on the quasi-static cyclic loading test results of this innovative blind
bolted endplate connection to CFT column, 3D nonlinear finite element
models have been developed to analyse the mechanical response of the
connection. In this chapter, the moment-rotation relationships predicted by
finite element models were compared with the experimental cyclic envelopes
under positive and negative bending moments. The comparison showed that
the models are able to predict the initial stiffness and maximum moment
capacity with reasonable accuracy (refer to Figure 6.27). The strain results of
the blind bolts and tube connecting face and sidewall face were compared
against the experimental instrumentations which showed that the finite
element model is capable of capturing local strain distribution (refer to Figure
241
Chapter 6: Finite element modelling
6.24- Figure 6.26). From above analysis, it is concluded that this connection
can be simulated numerically in this study.
The validated finite element model was used to draw a comparison of the
failure modes of the connection components observed in the tests. Related
stress contours of the connection were described and discussed for further
understanding of the connection response. The displacement distributions of
the tube connecting face and sidewall face were also traced by finite element
models which provide a useful supplement for the test recording in the study
of tube flexibility.
Parametric analyses were conducted to further investigate the influences of
concrete grade and tube wall thickness on the moment capacity and rotation
capacity of the connections. The results showed that the increase of either
parameter affects moment-rotation response especially when the concrete
grade or tube wall thickness is in relatively low value. The combined influence
of both parameters on the moment capacity of the connections is also
discussed.
The general conclusion to be drawn from the analyses is that this finite
element model is capable of predicting the moment-rotation behaviour of this
innovative blind bolted endplate connection to eFT column. It offers a reliable
and cost-effective alternative to supplement experimental observation and
measurement. Based on the numerical predictions of moment-rotation
envelopes, the hysteretic moment-rotation relationship will be developed in
Chapter 7.
242
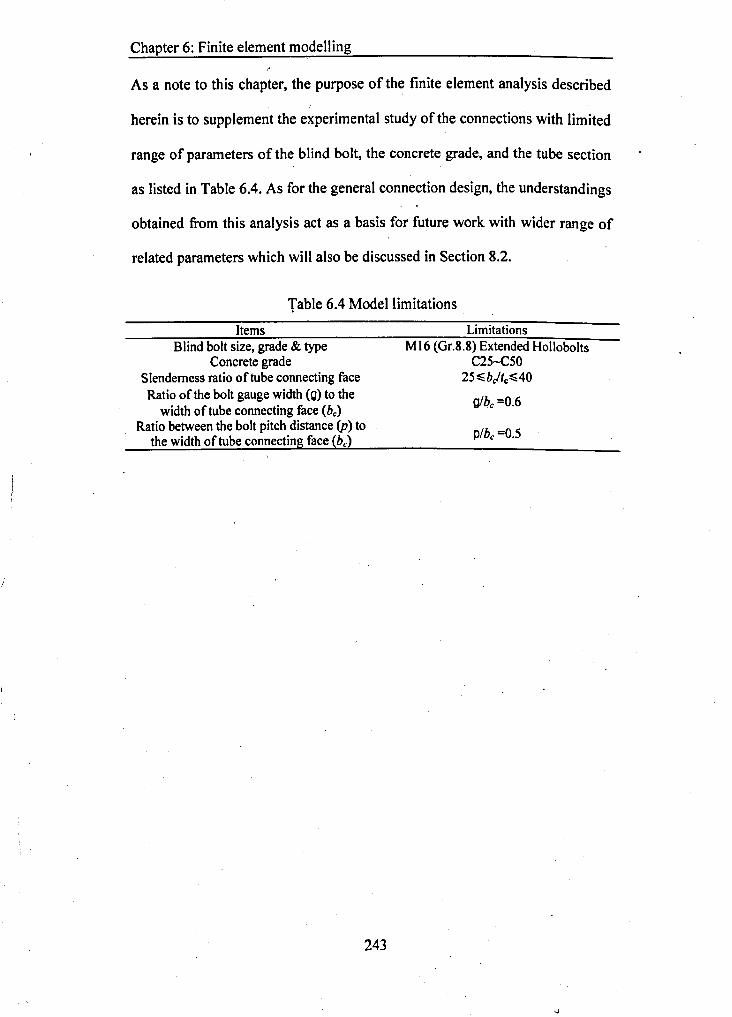
Chapter 6: Finite element modelling
As a note to this chapter, the purpose of the finite element analysis described
herein is to supplement the experimental study of the connections with limited
range of parameters of the blind bolt, the concrete grade, and the tube section
as listed in Table 6.4. As for the general connection design, the understandings
obtained from this analysis act as a basis for future work with wider range of
related parameters which will also be discussed in Section 8.2.
Table 6.4 Model limitations
Items LimitationsBlind bolt size, grade & type
Concrete gradeSlenderness ratio of tube connecting faceRatio of the bolt gauge width (g) to the
width of tube connecting face (be)Ratio between the bolt pitch distance (P) to
the width of tube connecting face (be)
MI6 (Gr.8.8) Extended HolloboltsC2S-CSO
2S~bjtc~40
gibe =0.6
p/be =O.S
243
Chapter 7: Joint hysteretic moment-rotation relationship modelling
·CHAPTER 7
JOINT HYSTERETIC MOMENT-ROTATION
RELATIONSHIP MODELLING
7.1 Introduction
The discussion of the finite element model in the preceding chapter has
provided a satisfactory prediction of the ascending branch of test moment-
rotation envelope curves. To simulate the hysteretic moment-rotation
relationship of the test connections, analytical models based on the relevant
mathematical representations will be presented in this chapter. The descending
branch of envelope curve, along with the loading, unloading and reloading
segments of hysteresis loop will be incorporated in analytical models with
respect to related geometric and material parameters.
Modelling the joint moment-rotation relationship depends on the behaviour of
constituent joint components. In the case of practical design. for the joints
under monotonic loading, the simple component model based analysis
eliminates much of the variability arising from the connections. The so-called
component method in Eurocode 3 refers to using such simplified mechanical
models composed of extensional springs and rigid links to evaluate the joint
. behaviour by assembling the contributions of individual components. In this
study, the components in aforementioned joint tension zone were highlighted
and related cyclic models are outlined prior to the analysis of joint hysteretic
moment-rotation relationship._,
244

· Chapter 7: Joint hysteretic moment-rotation relationship modelling
Although mathematical representations are widely used in former studies of
joint monotonic behaviour, appropriate hysteretic models incorporating
loading and unloading excursions are stilI needed to simulate the hysteretic
moment-rotation relationship of this innovative blind bolted endplate
connection to CFT column. The characteristics of strength, stiffness and
energy dissipation were incorporated into the hysteretic models in this study.
The results of the finite element analysis, which incorporated the information
of joint geometric and mechanical properties, were used to provide basic
parameters, such as initial stiffness, yield strength and rotation, for the
mathematical representations.
This chapter will be structured as follows. The description of three typical
mathematical representations is presented in Section 7.2. Their use in the
prediction oftest envelope curves are also described and discussed. The cyclic
material model is outlined in Section 7.3 in which related experiments are
referred. The hysteretic moment-rotation models for the tests are presented in
Section 7.4 which includes the description for the excursion corresponding to
the loading and unloading branches of the envelope curve. The simulation of
test hysteretic moment-rotation curves is presented in Section 7.5. Finally, a
brief summary and di.scussion about adopted hysteretic models for the joint
behaviour modelling is outlined in Section 7.6.
7.2 Mathematical representations of moment-rotation envelope
To account for the nonlinear moment-rotation curve of the connection, two\
types of mathematical representation are identified. The first type is related to
pure curve fitting formulations, and related parameters do not necessarily have245
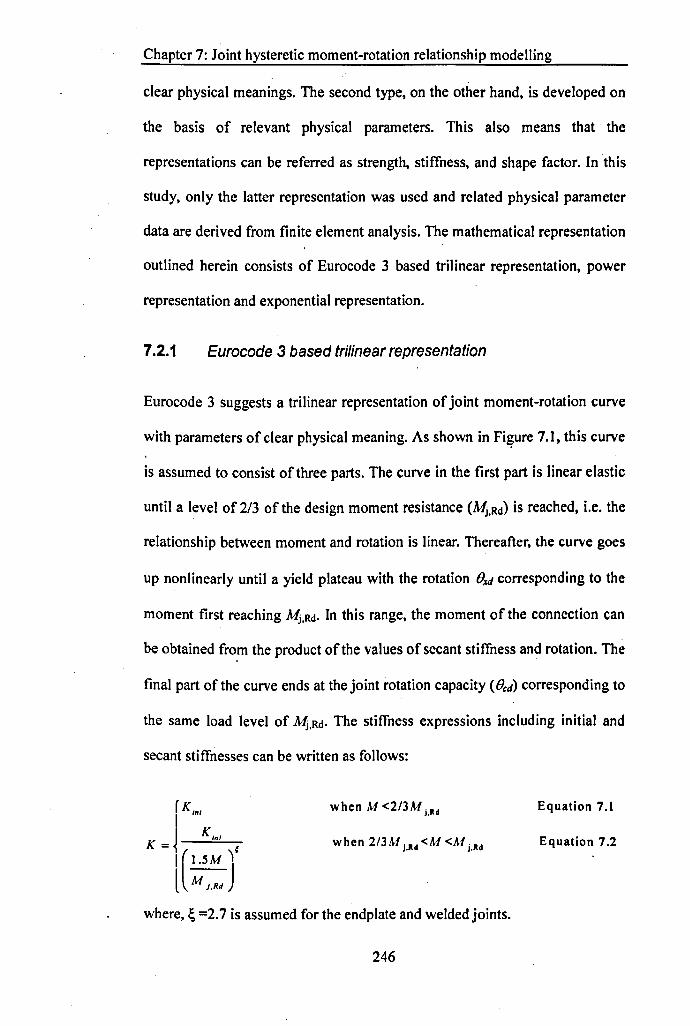
Chapter 7: Joint hysteretic moment-rotation relationship modelling
clear physical meanings. The second type, on the other hand, is developed on
the basis of relevant physical parameters. This also means that the
representations can be referred as strength, stiffness, and shape factor. In 'this
study, only the latter representation was used and related physical parameter
data are derived from finite element analysis. The mathematical representation
outlined herein consists of Eurocode 3 based trilinear representation, power
representation and exponential representation.
7.2.1 Eurocode 3 based trilinear representation
Eurocode 3 suggests a trilinear representation of joint moment-rotation curve
with parameters of clear physical meaning. As shown in Fi~ure 7.1, this curve
is assumed to consist of three parts. The curve in the first part is linear elastic
until a level of 2/3 of the design moment resistance (~.Rd) is reached, Le. the
relationship between moment and rotation is linear. Thereafter, the curve goes
up nonlinearly until a yield plateau with the rotation O~dcorresponding to the
moment first reaching MJ.Rd. In this range, the moment of the connection can
be obtained from the product of the values of secant stiffness and rotation. The
final part of the curve ends at the joint rotation capacity (Oed) corresponding to
the same load level of MJ.Rd. The stiffness expressions including initial and
secant stiffnesses can be written as follows:
r«:K = j Kin, ~
Il(1.5M I)l M 1.Rd
when M <213M i,lId Equation 7.1
Equation 7.2
where, ~ =2.7 is assumed for the endplate and welded joints.
246

Chapter 7: Joint hysteretic moment-rotation relationship modelling
MA
Mj,Rd l
2/3Mj,Rd
Figure 7.1 Trilinear representation of moment-rotation curve suggested by
Eurocode 3 (2005)
It is observed that the moment-rotation curve can be plotted provided that Kini
and Mj,Rd are available for this representation. This representation was adopted
by early researchers in the comparison of test moment-rotation curves
(Weynand et al, 1995). In this study, these two parameters are obtained from
finite element analysis results, and the calculated curve is then compared with
test envelope curve, as shown in Figure 7.2. An agreement can be seen at the
initial phase of the curve, however, the difference is noticeable regarding the
curve starting from the post-yielding point. This indicates that the strain
hardening effects are not taken into account by this representation as the
rotation varies between 8xd and 8cd.
247
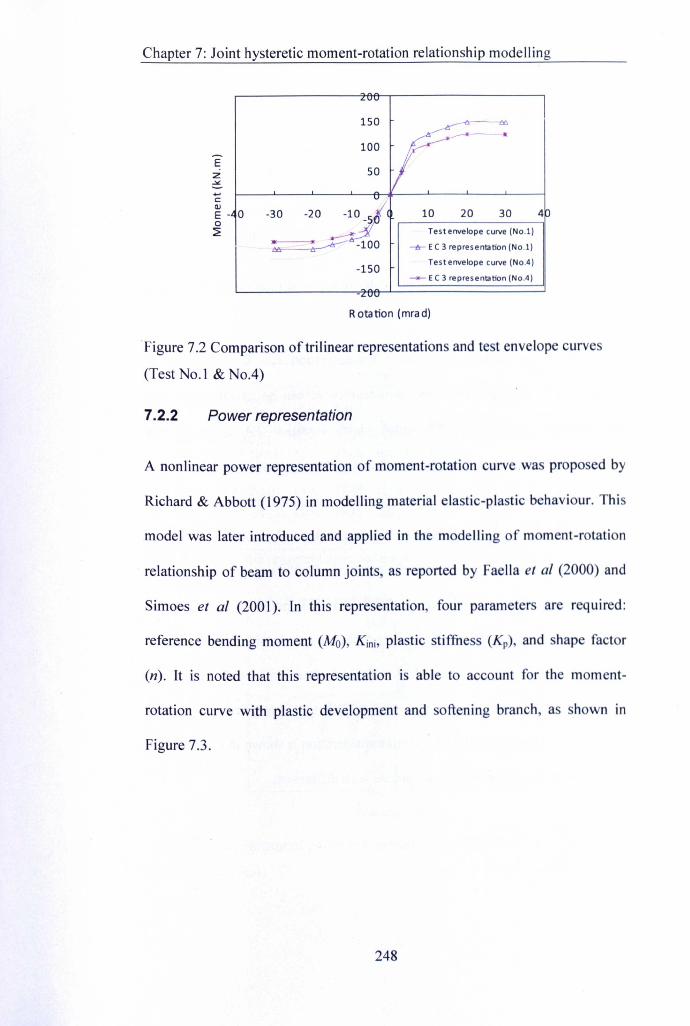
Chapter 7: Joint hysteretic moment-rotation relationship modelling
Ez-""....c:cvE - 00~
10 20 30 4
Test envelope curve (No.1)
-!r- EC3 representation (No.1)
Test envelope curve (No.4)
_.,_ EC3 representation (NoA)-150
Rota tion (mra d)
Figure 7.2 Comparison of trilinear representations and test envelope curves
(Test No.1 & No.4)
7.2.2 Power representation
A nonlinear power representation of moment-rotation curve was proposed by
Richard & Abbott (1975) in modelling material elastic-plastic behaviour. This
model was later introduced and applied in the modelling of moment-rotation
relationship of beam to column joints, as reported by Faella et al (2000) and
Simoes et al (2001). In this representation, four parameters are required:
reference bending moment (Mo), Kini, plastic stiffness (Kp), and shape factor
(n). It is noted that this representation is able to account for the moment-
rotation curve with plastic development and softening branch, a shown in
Figure 7.3.
248
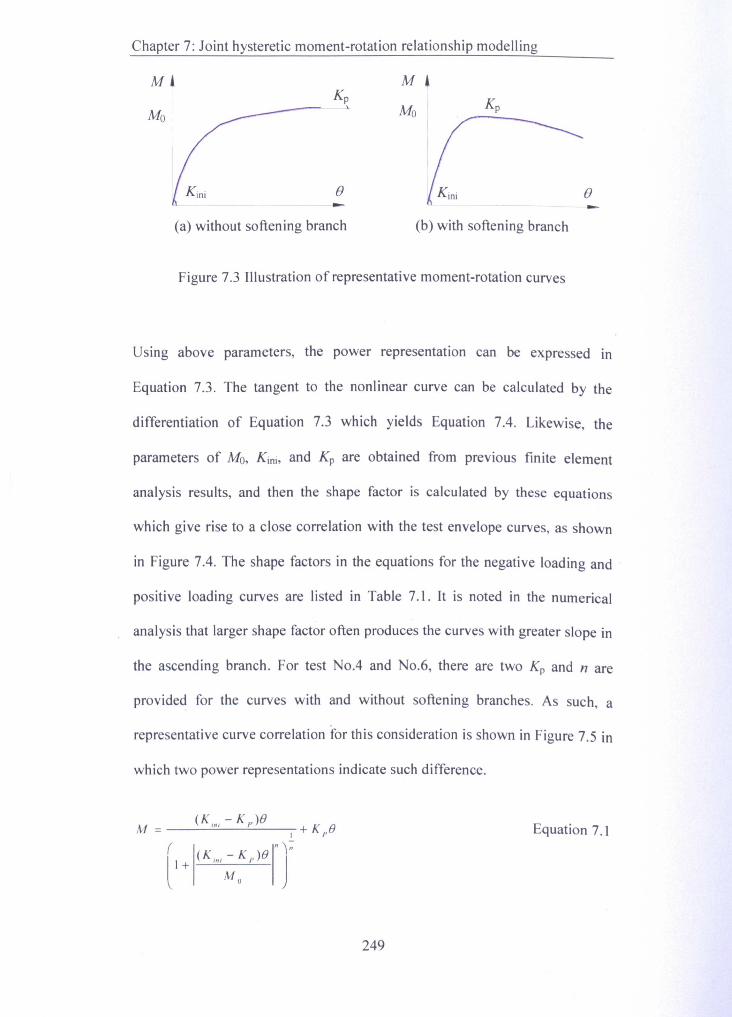
Chapter 7: Joint hysteretic moment-rotation relationship modelling
M' M •Kp Kp--+ MoMoIII
e e-- -(a) without softening branch (b) with softening branch
Figure 7.3 Illustration of representative moment-rotation curves
Using above parameters, the power representation can be expressed in
Equation 7.3. The tangent to the nonlinear curve can be calculated by the
differentiation of Equation 7.3 which yields Equation 7.4. Likewise, the
parameters of Me; Kini, and Kp are obtained from previous finite element
analysis results, and then the shape factor is calculated by these equations
which give rise to a close correlation with the test envelope curves, as shown
in Figure 7.4. The shape factors in the equations for the negative loading and
positive loading curves are listed in Table 7.1. It is noted in the numerical
analysis that larger shape factor often produces the curves with greater slope in
the ascending branch. For test No.4 and No.6, there are two Kp and n are
provided for the curves with and without softening branches. As such, a
representative curve correlation for this consideration is shown in Figure 7.5 in
which two power representations indicate such difference.
Equation 7.1
249
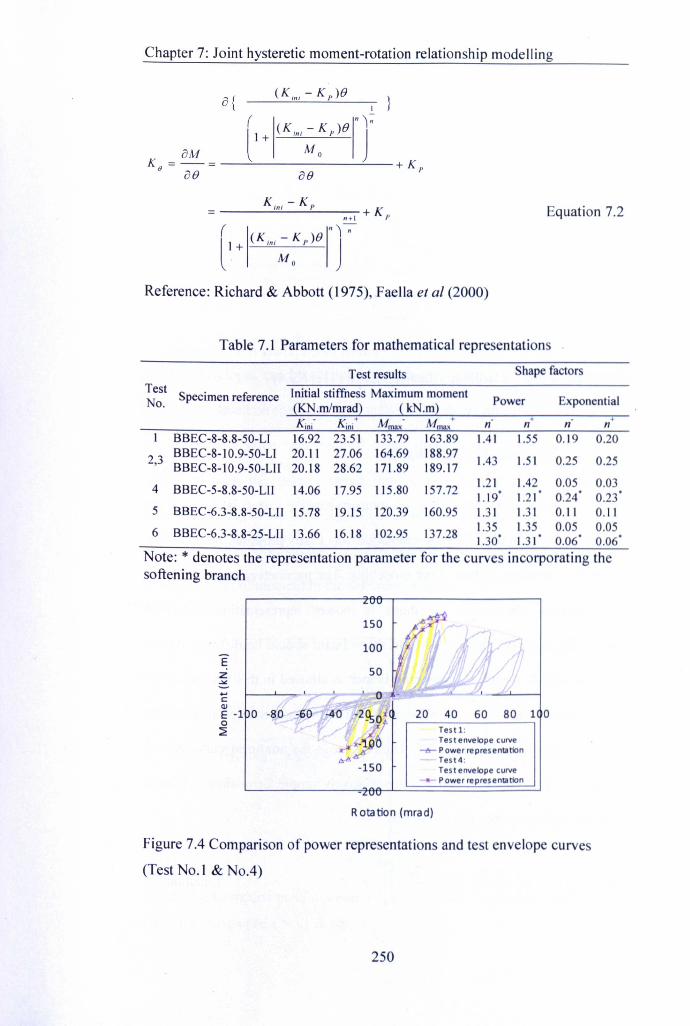
Chapter 7: Joint hysteretic moment-rotation relationship modelling
Reference: Richard & Abbott (1975), Faella et af (2000)
Table 7.1 Parameters for mathematical representations
Equation 7.2
Test results Shape factorsTest
Specimen reference Initial stiffness Maximum momentNo. {KN.mlmrad} {kN.m} Power Exponential
«; Kint Mm.; Mm ax+ + +n n n n
BBEC-S-S.S-50-L1 16.92 23.51 133.79 163.89 1.41 1.55 0.19 0.20
2,3 BBEC-S-10.9-50-L1 20.11 27.06 164.69 ISS.97 1.43 1.51 0.25 0.25BBEC-S-J 0.9-50-LII 20.IS 2S.62 171.S9 IS9.17
4 BBEC-5-S.S-50-L11 14.06 17.95 115.S0 157.72 1.21 1.42 0.05 0.031.19' 1.21' 0.24' 0.23'
5 BBEC-6.3-S.8-50-L11 15.7S 19.15 120.39 160.95 1.31 1.31 0.11 0.11
6 BBEC-6.3-S.S-25-L1 [ 13.66 16.18 102.95 137.2S 1.35 1.35 0.05 0.051.30' 1.31' 0.06' 0.06'
Note: * denotes the representation parameter for the curve incorporating thesoftening branch
Ez..:.t.
1----'--'-
150
....CCl)
E -1 0 -80o~
,60 -40 20 40 60
.__. Testl:Testenvelope curve
-&- Power representationTest4:
-150 Testenvelope curvePower representation
Rotation (mrad)
80 1 0
Figure 7.4 Comparison of power representations and test envelope curves
(Test No.1 & No.4)
250
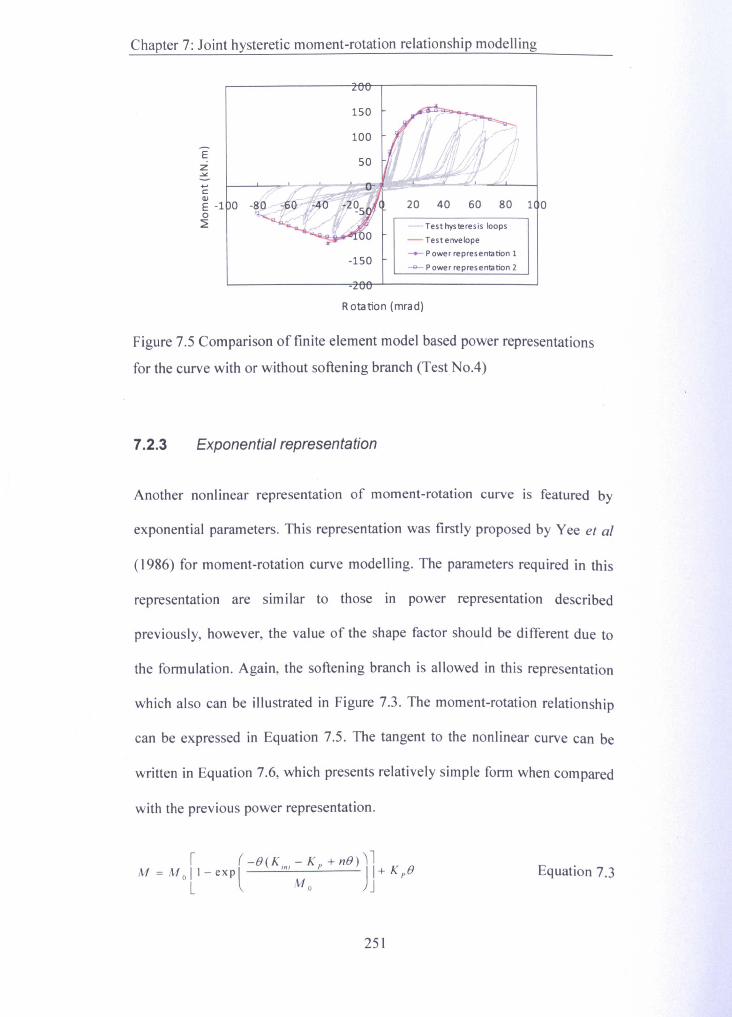
Chapter 7: Joint hysteretic moment-rotation relationship modelling
EZ~..cQ)
E -1 00~
20 40 60 80 1 0
-Test hysteresis loops
- Test envelope
-- P ower representation 1
.....,_ P ower representation 2-150
Rotation (mrad)
Figure 7.5 Comparison of finite element model based power representations
for the curve with or without softening branch (Test No.4)
7.2.3 Exponential representation
Another nonlinear representation of moment-rotation curve is featured by
exponential parameters. This representation was firstly proposed by Vee et al
(1986) for moment-rotation curve modelling. The parameters required in this
representation are similar to those in power representation described
previously, however, the value of the shape factor should be different due to
the formulation. Again, the softening branch is allowed in this representation
which also can be illustrated in Figure 7.3. The moment-rotation relationship
can be expressed in Equation 7.5. The tangent to the nonlinear curve can be
written in Equation 7.6, which presents relatively simple form when compared
with the previous power representation.
I (-O(K . - K + nO) IIM = Moll - exp l In, P j 1+ K pO
L Mo JEquation 7.3
251
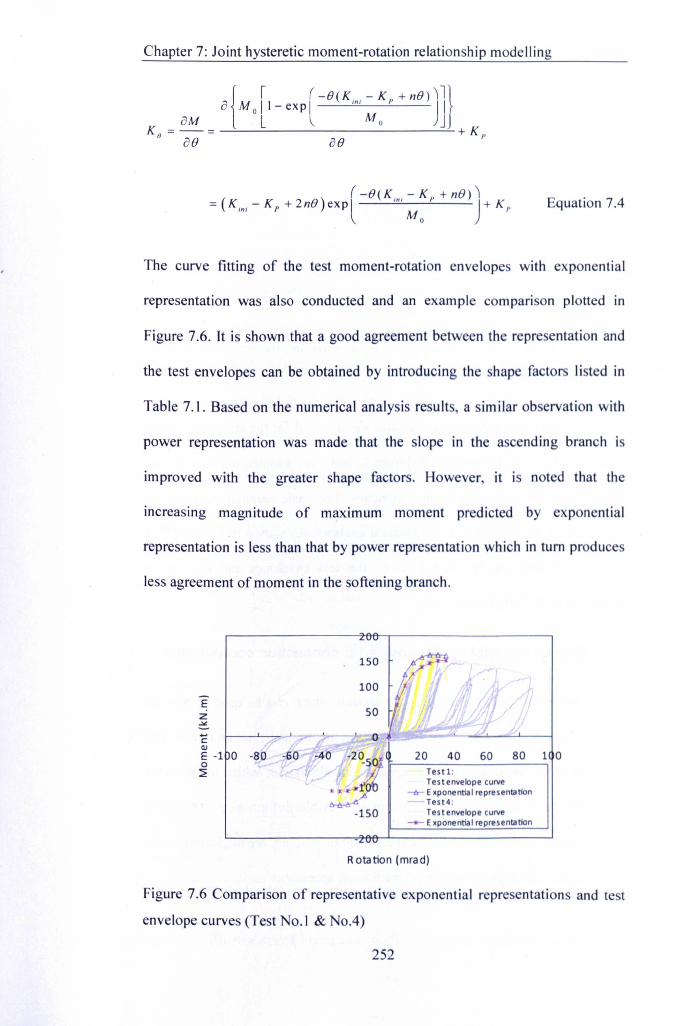
Chapter 7: Joint hysteretic moment-rotation relationship modelling
1I (-B(K -Kp+nB)1l)a Moll-exPl 1nl jl
aM L Mo JK =-= + K
8 aB aB I'
Equation 7.4
The curve fitting of the test moment-rotation envelopes with exponential
representation was also conducted and an example comparison plotted in
Figure 7.6. It is shown that a good agreement between the representation and
the test envelopes can be obtained by introducing the shape factors listed in
Table 7.1. Based on the numerical analysis results, a similar ob ervation with
power representation was made that the slope in the ascending branch i
improved with the greater shape factors. However, it is noted that the
increasing magnitude of maximum moment predicted by exponential
representation is less than that by power representation which in turn produce
less agreement of moment in the softening branch.
Ez.:.t.
cOJ »r IE -1 0 -80 -60o~
20 40 60 80 1 0._. Testl:
Test envelope curve__ Exponential representation
Test4:-150 Testenvelope curve
Exponential representation
Rotation (mrad)
Figure 7.6 Comparison of representative exponential representations and test
envelope curves (Test No.1 & No.4)
252
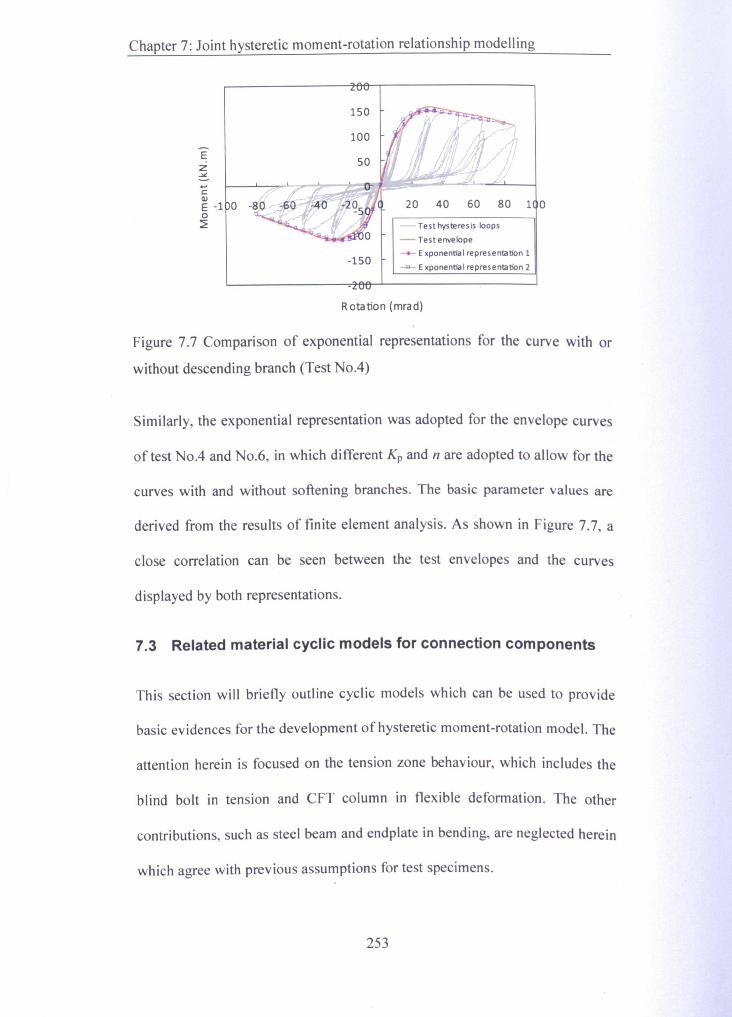
Chapter 7: Joint hysteretic moment-rotation relationship modelling
Ez-'".....<:QJ
E -1 00::;!
20 40 60 80 1 0
- Test hysll!resis loops
- Test envelope_,._ Exponential representation 1
_.._ Exponential representation 2-150
Rotation (mrad)
Figure 7.7 Comparison of exponential representations for the curve with or
without descending branch (Test No.4)
Similarly, the exponential representation was adopted for the envelope curves
of test No.4 and No.6, in which different Kp and n are adopted to allow for the
curves with and without softening branches. The basic parameter values are
derived from the results of finite element analysis. As shown in Figure 7.7, a
close correlation can be seen between the test envelopes and the curves
displayed by both representations.
7.3 Related material cyclic models for connection components
This section will briefly outline cyclic models which can be used to provide
basic evidences for the development of hysteretic moment-rotation model. The
attention herein is focused on the tension zone behaviour, which includes the
blind bolt in tension and CFT column in flexible deformation. The other
contributions, such as steel beam and endplate in bending, are neglected herein
which agree with previous assumptions for test specimens.
253
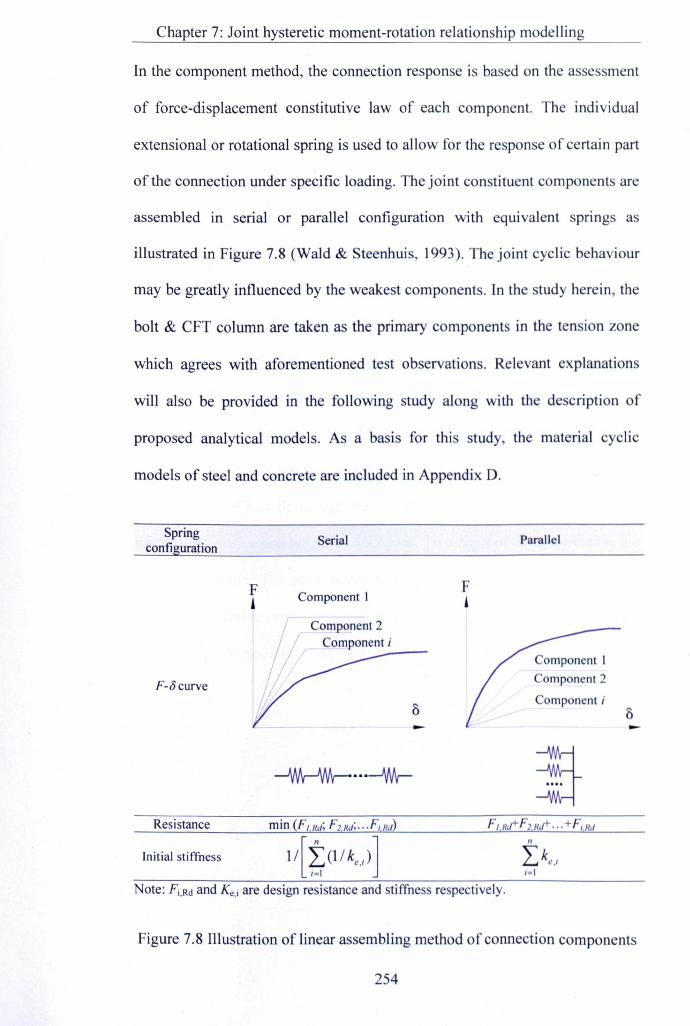
Chapter 7: Joint hysteretic moment-rotation relationship modelling
In the component method, the connection response is based on the assessment
of force-displacement constitutive law of each component. The individual
extensional or rotational spring is used to allow for the response of certain part
of the connection under specific loading. The joint constituent components are
assembled in serial or parallel configuration with equivalent springs as
illustrated in Figure 7.8 (Wald & Steenhuis, 1993). The joint cyclic behaviour
may be greatly influenced by the weakest components. In the study herein, the
bolt & CFT column are taken as the primary components in the tension zone
which agrees with aforementioned test observations. Relevant explanations
will also be provided in the following study along with the description of
proposed analytical models. As a basis for this study, the material cyclic
models of steel and concrete are included in Appendix D.
Springconfiguration Serial Parallel
F, Component IF•
F-8curve
Component 2Component i
/ ~--omponent i
- -
Resistance
Initial stiffness
Note: Fj,Rd and Ke,j are design resistance and stiffness respectively.
Figure 7.8 Illustration of linear assembling method of connection components
254
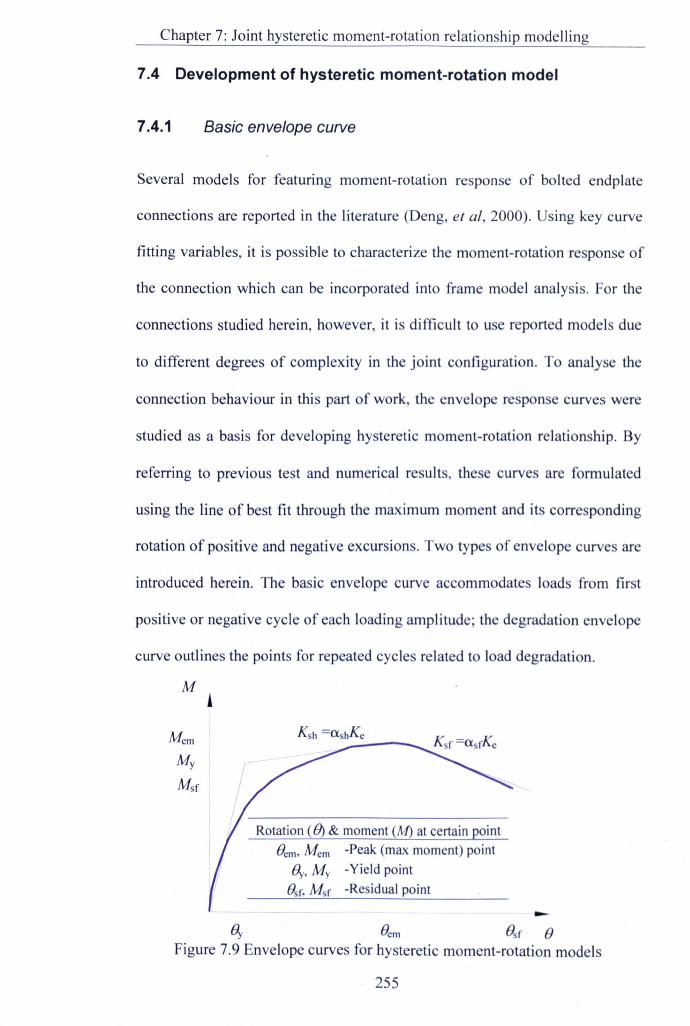
Chapter 7: Joint hysteretic moment-rotation relationship modelling
7.4 Development of hysteretic moment-rotation model
7.4.1 Basic envelope curve
Several models for featuring moment-rotation response of bolted endplate
connections are reported in the literature (Deng, et ai, 2000). Using key curve
fitting variables, it is possible to characterize the moment-rotation response of
the connection which can be incorporated into frame model analysis. For the
connections studied herein, however, it is difficult to use reported models due
to different degrees of complexity in the joint configuration. To analy e the
connection behaviour in this part of work, the envelope response curves were
studied as a basis for developing hysteretic moment-rotation relationship. By
referring to previous test and numerical results, the e curves are formulated
using the line of best fit through the maximum moment and it corre p nding
rotation of positive and negative excursion . Two type of envel pe urve are
introduced herein. The basic envelope curve accommodates loads from fir t
positive or negative cycle of each loading amplitude; the degradati n env lope
curve outlines the points for repeated cycles related to load d gradati n.
M
u.;My
Msf
Rotation CB) & moment CM) at certain pointBern. Mem -Peak (max moment) point
By. My -Yield pointBsf. Msf -Residual point -By Bern Bsf B
Figure 7.9 Envelope curves for hysteretic moment-rotation models
255
Chapter 7: Joint hysteretic moment-rotation relationship modelling
A representative envelope curve for hysteretic moment-rotation model is
illustrated in Figure 7.9. Prior to the peak (maximum moment) point (Oem,
Mem), the strain hardening stiffness (Ksh) is calculated as Us~e. The moment at
the rotation range between By and Bem can be formulated by Ksh and B. If the
deterioration is taken into account subsequent to the peak point, the linear
descending branch is represented by the softening stiffness K«which is equal
to asfKe. Apparently, the value of Ksf should be negative. Based on the linear
relationship in the softening branch, the moment can then be calculated as:
(M 'f - M.", )(0 - 0.",)M = +M ,.
0" - 0,,,,Equation 7.7
.The parameters of ash and Usf can be obtained from experimental data or
analytical model. In this study, the moment-rotation relationships derived from
the finite element models mentioned in Chapter 6 were adopted for envelope
curve at the rotation range between By and Oem. The softening branch is then
predicted using asf obtained from experimental moment-rotation relationship
as referred to Chapter 4. The finite element model based envelope curve
serves as a basic step to be further associated with hysteretic model analysis.
7.4.2 Hystereticmoment-rotationmodels
Referring to the observed cyclic response of the connections, hysteretic
models were developed for loading and unloading branches in order to
simulate the moment-rotation relationship analytically. It was noted that the
test hysteresis loops may not be simplified with the excursions in linear
relationship. Rather, the hysteresis loops have to be divided into several
256
Chapter 7: Joint hysteretic moment-rotation relationship modelling
segments to represent the nonlinear behaviour of the connection. In order to
mathematically describe these segments, several power and exponential
functions were adopted and compared with the test curves in Chapter 4.
Implementation of these functions requires several variables restored in the
previous hysteresis loops. The strength and energy dissipation deterioration
were also taken into account in these models. The hysteretic models for the
connection were identified for different behaviours of the connections in
categories I & II and will be presented separately below.
7.4.2.1 Hysteretic model for connection category I
As mentioned previously in Section 4.5, the connections in category I are
featured by relatively strong CFT column and consequently failed by bolt.
fracture and developed the full bolt tensile strength. Given the primary
contribution of the blind bolt to the response of the connection, the hysteretic
model was expected to be similar to that for the bolt in tension. However, it is
worthy of note that actual connection behaviour in this category is affected by
the mechanical interlock effect between the flaring sleeve, the threaded cone ,
and the deformation of bolt clearance hole on the tube connecting face as well
as local concrete deterioration. The shapes of the unloading curves and
reloading curves tend to become nonlinear when approaching the zero moment
axis in the hysteretic moment-rotation relationship. On the other hand, the
connection capacities are weakened when subjected to consecutive inelastic
deformation and cyclic loading. This is especially significant for the foregOing
test evidence of dramatic reduction of the energy dissipation (see Figure 4.13
a-c,e) in the repeated cycles subsequent to the first ones of each loading
257
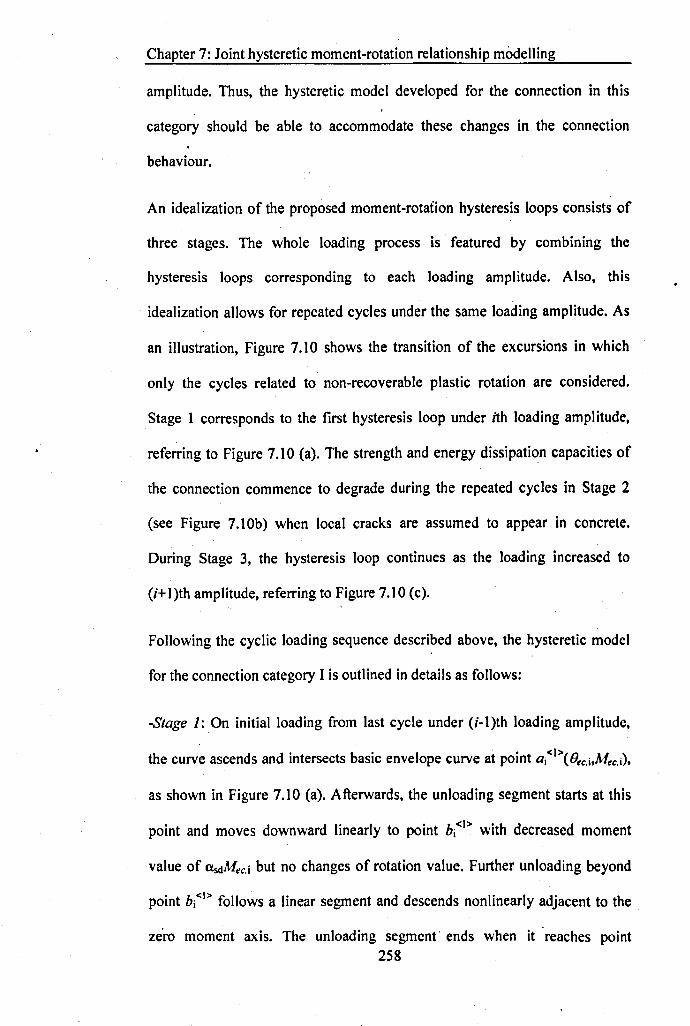
Chapter 7: Joint hysteretic moment-rotation relationship modelling
amplitude. Thus, the hysteretic model developed for the connection in this
category should be able to accommodate these changes in the connection
behaviour.
An idealization of the proposed moment-rotation hysteresis loops consists of
three stages. The whole loading process is featured by combining the
hysteresis loops corresponding to each loading amplitude. Also, this
. idealization allows for repeated cycles under the same loading amplitude. As
an illustration, Figure 7.10 shows the transition of the excursions in which
only the cycles related to non-recoverable plastic rotation are considered.
Stage 1 corresponds to the first hysteresis loop under ith loading amplitude,
referring to Figure 7.10 (a). The strength and energy dissipation capacities of
the connection commence to degrade during the repeated cycles in Stage 2
(see Figure 7.10b) when local cracks are assumed to appear in concrete.
During Stage 3, the hysteresis loop continues as the loading increased to
(i+1)th amplitude, referring to Figure 7.10 (c).
Following the cyclic loading sequence described above, the hysteretic model
for the connection category I is outlined in details as follows:
-Stage 1:On initial loading from last cycle under (i-l)th loading amplitude,
the curve ascends and intersects basic envelope curve at point aj<I>(Oec,i,Mec,i)'
as shown in Figure 7.10 (a). Afterwards, the unloading segment starts at this
point and moves downward linearly to point bj<l> with decreased moment
value of (XsdMec,i but no changes of rotation value. Further unloading beyond
point btl> follows a linear segment and descends nonlinearly adjacent to the
zero moment axis. The unloading segment ends when it 'reaches point258
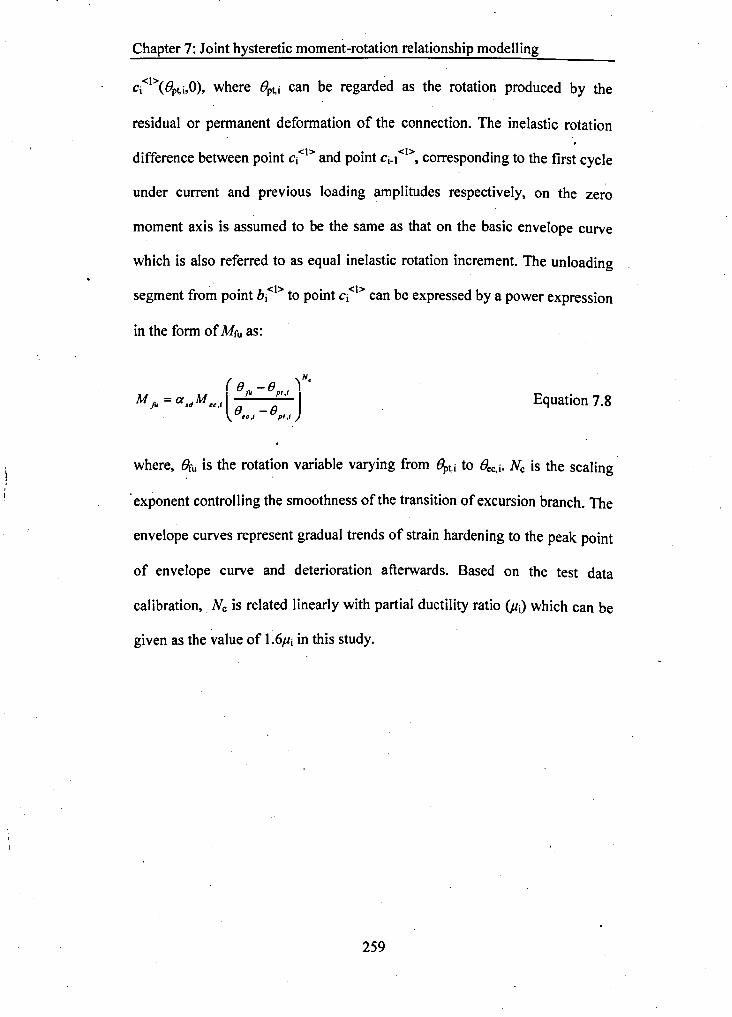
Chapter 7: Joint hysteretic moment-rotation relationship modelling
Cj<I>(Bpt,i,O), where Bpt,i can be regarded as the rotation produced by the
residual or permanent deformation of the connection. The inelastic rotation
diff b . <1> d nol <1> di h fiI terence etween point Ci an point Ci·l ,correspon 109 to t e rrst cycle
under current and previous loading amplitudes respectively, on the zero
moment axis is assumed to be the same as that on the basic envelope curve
which is also referred to as equal inelastic rotation increment. The unloading
fi " . b <1> • <1> b d bsegment rom point i to point Ci can e expresse y a power expression
in the form of Mfu as:
. ( 8fo - 8 t f ~N,
M =a M l P, Jfo .d ",f 8 -8ec,J pl,1
Equation 7.8
where, ~fu is the rotation variable varying from Bpt,i to Bec,i. Ne is the scaling
.exponent controlling the smoothness of the transition of excursion branch. The
envelope curves represent gradual trends of strain hardening to the peak point
of envelope curve and deterioration afterwards. Based on the test data
calibration, Ne is related linearly with partial ductility ratio (Pi) which can be
given as the value of 1.6pi in this study.
259
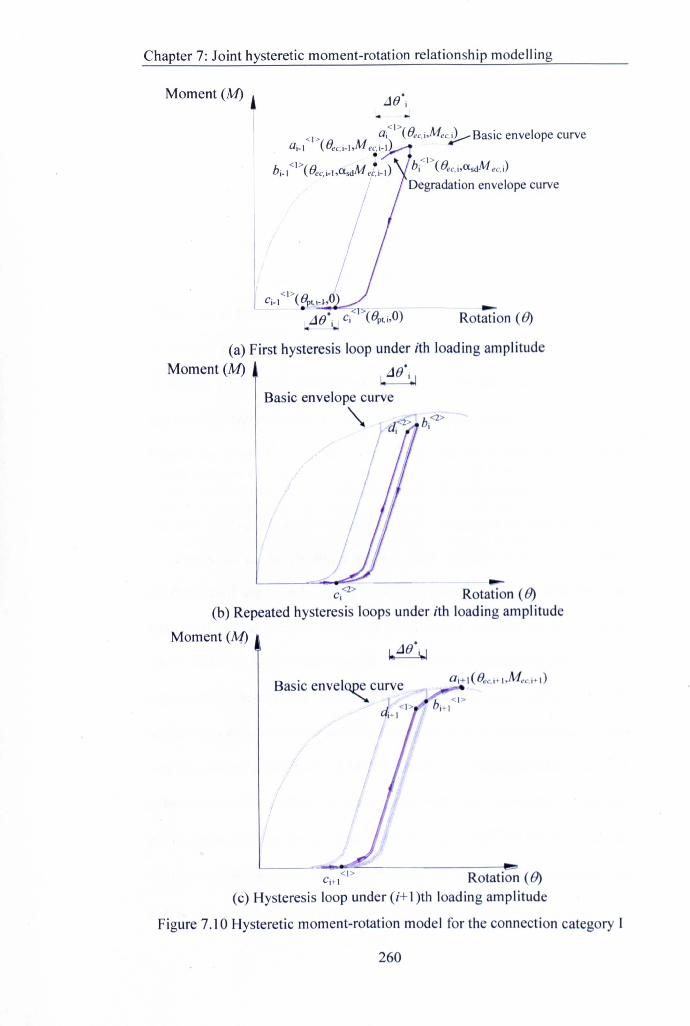
Chapter 7: Joint hysteretic moment-rotation relationship modelling
Moment (M) .::l0·;k
<I> Q;<I>(Oec,;,Mec~ Basic envelope curveQ;-I ( Oec,;_hM ec, ;- d•
b <1>(Ll '" M I ) "b;<I>(O,c,;,(lsdM ec,;);- I Oec, i-hu.sd et: ;-1
, Degradation envelope curve
-Rotation (B)
(a) First hysteresis loop under ith loading amplitudeMoment (M) .::l0·
~Basic envelope curve-,
-C;<2> Rotation (B)(b) Repeated hysteresis loops under ith loading amplitude
Moment (M)
Basic envel~ curve<I>
;+1
Rotation (B)(c) Hysteresis loop under (i+I)th loading amplitude
Figure 7,10 Hysteretic moment-rotation model for the connection category I
260
Chapter 7: Joint hysteretic moment-rotation relationship modelling\
Following the unloading segment to point ct1>, no presence of negative
moment is considered in the moment-rotation relationship. This is because the
compression effect is primarily carried by the compression zone of the CFT
column with limited contribution of deformed plate elements in bearing.
-Stage 2: The manners of reloading and unloading in the repeated cycles under
ith loading amplitude are similar to those in the first cycle, but the degradation
of strength and energy dissipation should be taken into account in the model.
For this reason, the aforementioned degradation envelope 'curve is established
as a contour of dropped peak points. Due to relatively strong CFT column in
this connection category, a slight reduction of the initial loading stiffness can
be assumed in Stage 2. As the repeated cycle continues, a family of dropped
peak points can be presumed for the second, third, fourth ... cycles. Basically, it
is expected that the magnitude of strength degradation is increased with the
increased number of cycles at each loading amplitude which corresponds to
the drop of the peak point of hysteresis loops. To observe the locus of these
points, more cycles at each loading amplitude are actually needed in the test
loading history which is, however, beyond the scope of this study.
Notwithstanding that, the trends of reduction of strength and energy
dissipation during three cycles at each amplitude have been demonstrated in
the test results as described in Chapter 4. For the purpose of simplicity, these
dropped peak points are idealized to coincide with previous unloading
segment at point bi<l>(Oec,i, (X~ec,i) on the degradation envelope curve. £rsd is
the strength degradation ratio as the fraction of the moment in the first cycle of
each loading amplitude. By relating lrsd to Pi, as shown in Figure 7.11 (a), a
261

Chapter 7: Joint hysteretic moment-rotation relationship modelling
power function based on the curve fitting of experimental data can be
expressed as:
a = 0 977 -0.023"I . Pt Equation 7.9
The energy dissipation degradation ratio, red, is also introduced as the fraction
of the dissipated energy in the first cycle of a loading amplitude. Likewise, a
simplification was used for the energy dissipation in the consecutive cycles.
As illustrated in Figure 7.11 (b), a curve fitting using power functions can be
written as:
O 462 -O.Hr,d =. Pt Equation 7.10
The parameters asd and red are calculated with the equations above each time
when the reloading & unloading segments cross the degradation envelope
curve and hysteretic loops corresponding to the repeated cycles are formed.
As shown in Figure 7.10 (b). the reloading in Stage 2 starts at point cj<2>and
continues up to point dj<2>. This segment ends when it intersects point bj<2> at
the degradation envelope curve. For the purpose of simplicity, point bj<2> is
assumed to be at the same location of point bt1>(Bec.j, (lsdMec,j). Afterwards, the
unloading path subsequent to reloading is directed from point bj<2> to Cj<2>. The
mathematical expressions for reloading and unloading segments of this stage
are similar to the unloading segment for the first cycle under ith loading
amplitude except the further consideration of degradations of strength and
energy dissipation.
262
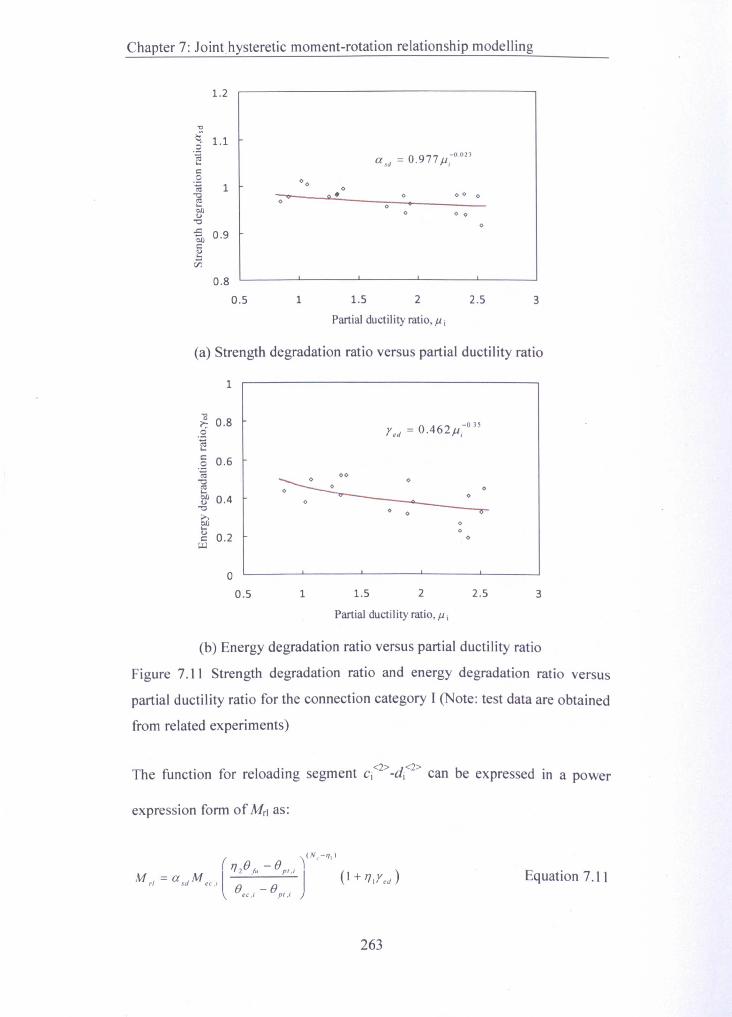
Chapter 7: Jointhysteretic moment-rotation relationship modelling
1.2
"C
ts: 1.10.~...c:0.~ 1"'g...OJ)u"0
.s 0.9OJ)c:u...~
0.80.5
a sa = 0.977 Ji,-O.023
oo. o 00 0
o
oo 0 0
1 1.5 2 2.5 3
(a) Strength degradation ratio versus partial ductility ratio
1!?; 0.8o'!.2 0.6<il]~ 0.4"0
~g 0.2~
Partial ductility ratio, J1 i
1
o
O 462 -0.35red =. u,
00o o
3
(b) Energy degradation ratio versus partial ductility ratio
Figure 7.11 Strength degradation ratio and energy degradation ratio versus
partial ductility ratio for the connection category I (Note: test data are obtained
from related experiments)
oo
o
The function for reloading segment Cj<2> _dj<2> can be expressed in a power
oooo
o0.5 21.5 2.51
Partial ductility ratio, J1 i
expression form of Mrl as:
(\(N'-~I)
,,() -() IM - a M .l 2 fi' pr.i j (I + )
rl - sa ec .r () _ () ", YedftC,1 pl,1
263
Equation 7.11
Chapter 7: Joint hysteretic moment-rotation relationship modelling
And, the function unloading segment bi<2> -Ci<2> can be given by:
Equation 7.12
where, 7]1 and TJ2 are the test calibrated parameters. Oru and ~ are the rotation
variables varying from point Ci<2> to point di<2> and the point bi<2> to point Cj<2>
respectively. The scaling exponents for both equations are controlled by Ne
and 7]1.
-Stage 3: After unloading of nth cycle under ith loading amplitude, the
reloading is directed towards a new cycle under (i+1)th loading amplitude. As
shown in Figure 7.10 (c), the segment from point Ci+I<I> to point dj+I<I>
follows the similar manner in Stage 2 which can be given by Equation 7.11.
Prior to the arrival at point ai+I(Oec,i+!' Mec,i+l) on the envelope curve, likewise,
the intersection point at the degradation envelope curve is updated by point
b <I>i+1 •
7.4.2.2 Hysteretic model for connection category II
The hysteretic behaviour of the connections in category II are characterized
not only by the plastic elongation of the bolt shank but also by the flexible
deformation of tube face. It was felt that more complex contribution of CFT
column to the hysteretic moment-rotation model of the connection should be
taken into account in this case. The energy dissipation analysis in Chapter 4
indicates that the flexibility of the tube face may cause deteriorated
confinement of CFT column which in tum produces greater concrete
deterioration and decreases the moment capacity of the connection. On the
264
Chapter 7: Joint hysteretic moment-rotation relationship modelling
other hand, the tube connecting face as a plate element in flexible deformation
improves the energy dissipation capacity of the connection when comparing
with relatively independent tensile action of the bolt shank for the connection
category I. This behaviour represents larger area enclosed by corresponding
hysteresis loops. During the reversed loading, the deformed' tube face in the
tension zone, of the connection will undergo compression thereby allowing
certain extension of unloading branch of the hysteresis loop below the zero
moment axis. Based on the observations from the test results, the hysteretic
model for the connection category II was considered with appropriate
mathematical expressions which differ from those for the connection category
I.
According to the cyclic loading sequence, three stages are incorporated in the
idealized hysteretic moment-rotation relations which are presented in a similar
manner as in previous sub-Section shown in Figure 7.10. Stage 1 represents
the first hysteresis loop under ith loading amplitude. Due to the damage of
concrete infill, compressive deformation of the deformed tube face will Occur
in this stage. Stage 2 indicates that the strength and energy dissipation
capacities of the connection reduce significantly during repeated cycles and
subsequent to Stage 1. Finally, the hysteresis loops step forward to Stage 3
which relates to (i+ 1)th loading amplitude. The hysteretic models for the
connection category II are outlined below:
-Stage 1: The loading segment starting from point ei<I>(O, MO,I) in this case is
similar to that for the connection category I except the change of stiffness at
point gi<I>(Oec,i-I.M,i) (here called the turning point) with the same rotation as
265
Chapter 7: Joint hysteretic moment-rotation relationship modelling
the peak point on the basic envelope curve under (i-l }th loading amplitude.
Thereafter, the loading segment ends at point at1=>: on the basic envelope curve,
as shown in Figure 7.12 (a).
In order to account for the changing shape before and after the turning point
gi<I>, an exponential function and a linear function were considered. The
exponential function for the first nonlinear loading segment, ei<l>-/il>-gi<I>,
can be expressed as:
, (~)xe(M ec ,,-M O,I)Ofll· ,""'-'_1 '
M ]/1 = . e + M 0,1
B,e" "Equation 7.13
The function for the second linear loading segment, gj<l>-ai<I>, can be given by:
Equation 7.14
where, Xc is the test calibrated parameter. Bm and BI12are the rotation variables
corresponding to the ranges from point ei<l> to point gi<I>(i.e., from 0 to Bed-I)
d f . <I> . <1>(. f Ll n) 'I M .an rom pomt gi to pomt ai I.e., rom Uec,i-l to Uec,i respective y. 0,1 IS
the moment on zero rotation axis at the beginningof the loading path, which is
known from the previous negative unloading excursion under (i-I }th loading
amplitude.
The segment atl> _Cj<I>represents the unloading path until the zero moment
axis is reached. Likewise, the rotation (Opt,i)at point Ci<l>can be regarded as
the rotation produced by the residual or permanent deformation of the
266
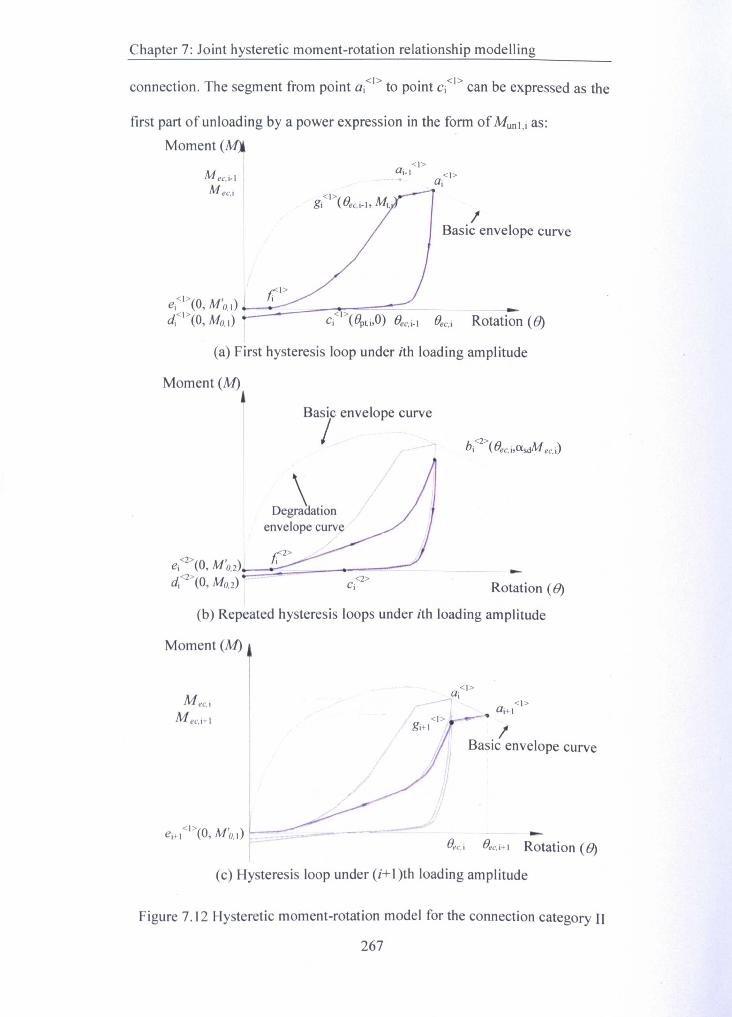
Chapter 7: Joint hysteretic moment-rotation relationship modelling
. Th l':' <I> • <I> bconnection. e segment rrorn pomt aj to pomt Cj can e expressed as the
first part of unloading by a power expression in the form of MUnI,j as:
Moment (M)
Mec.i-I
Mec.i
<I>Qi-I <I>
ai<1>( {]gi Uec.i-!. Mt.'
IBasic envelope curve
(a) First hysteresis loop under ith loading amplitude
Moment (M)~
I
I
Basic envelope curve
I _/1
D,g~tiO"envelope curve
ei<2>(O, M'O.2)t:::=::::::::::__ -::::':'-=--di<2>(O, MO.2) Ci<2>
I(b) Repeated hysteresis loops under ith loading amplitude
--Rotation (B)
Moment (M)
u.;u:».
<I>a'-,' <I>
,. Qi+1
IBasic envelope curve
II;I-'~=--- --
/
8ec.i 8ec.i+1 Rotation (B)
(c) Hysteresis loop under (i+ I )th loading amplitude
Figure 7.12 Hysteretic moment-rotation model for the connection category II
267
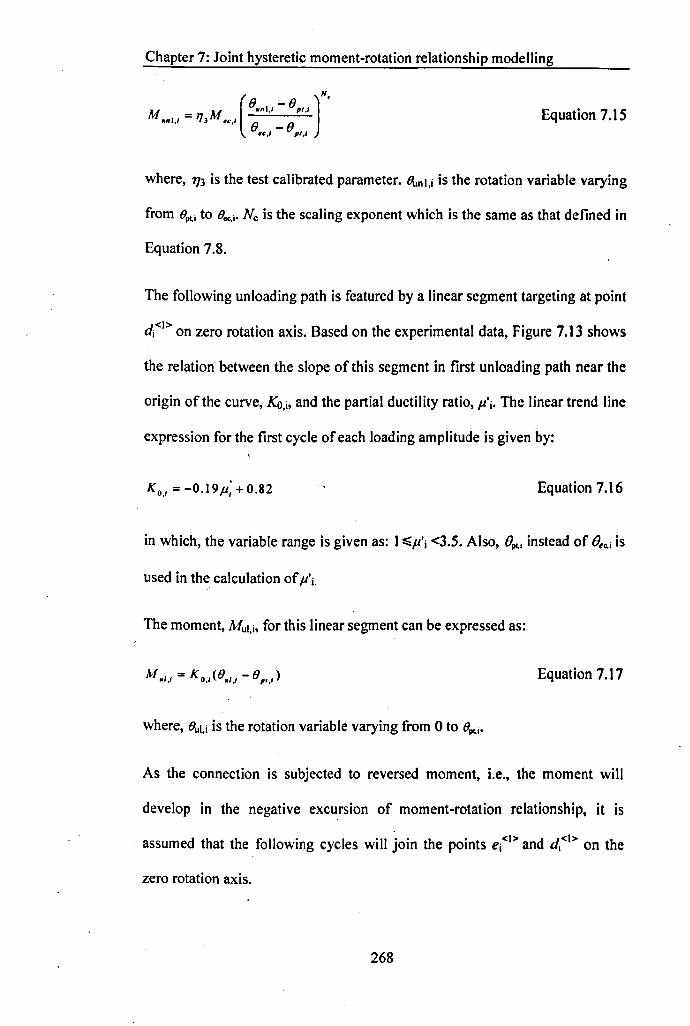
Chapter 7: Joint hysteretic moment-rotation relationship modelling
((J -(J ~N.
M = 1] M l..1,1 pl,1 J•• 1,1 3 <C,I (J _ (J
<C,I pl,1
Equation 7.15
where, 1]3 is the test calibrated parameter. eunl,i is the rotation variable varying
from Bp~i to Bee,i' Ne is the scaling exponent which is the same as that defined in
Equation 7.8.
The following unloading path is featured by a linear segment targeting at point
dj<l> on zero rotation axis. Based on the experimental data, Figure 7.13 shows
the relation between the slope of this segment in first unloading path near the
origin of the curve, KO,i, and the partial ductility ratio, p'io The linear trend line
expression for the first cycle of each loading amplitude is given by:
KO•I = -0.19,u; +0.82 Equation 7.16
in which, the variable range is given as: 1~P'i <3.5. Also, B~; instead of Bec,; is
used in the calculation of P'io
The moment, Mul,i, for this linear segment can be expressed as:
Equation 7.17
where, eul,i is the rotation variable varying from 0 to B~I'
As the connection is subjected to reversed moment, i.e., the moment will
develop in the negative excursion of moment-rotation relationship, it is
assumed that the following cycles will join the points ej<l> and dl<l> on the
zero rotation axis.
268
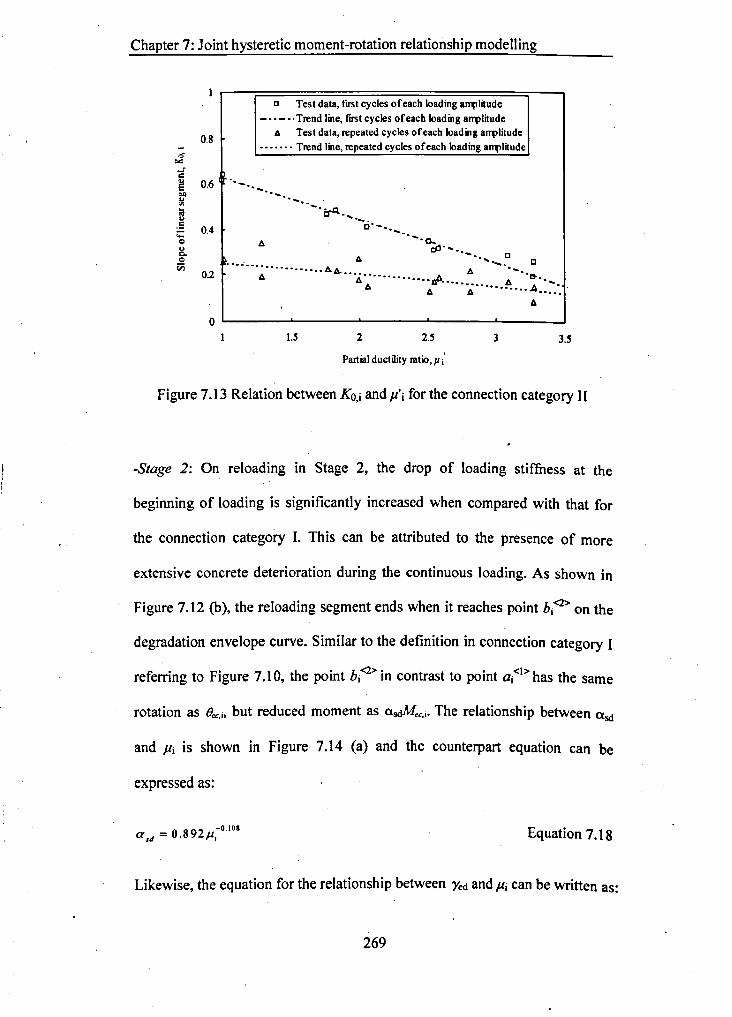
Chapter 7: Joint hysteretic moment-rotation relationship modelling
0.2
._ ..-.-- .......... i:r'I-., .....
C-_e.- .• -.0....
cjj ................ 6. '.,._D D
•••••••••••••• 6..6............ 6.. ' ......6.. 6. •••••••• t;.A. I> e-,
6. I> ····6···········A ..::·.·6.
D Test data, first cycles of each loading al1lllitude_ •. -" Trend line, first cycles of each loading arrplitude
6. Test data, repeated cycles of each loading arrplitude••••••. Trend line, repeated cycles of each loading al1lllitude
0.8-<5~iECDOJ'":;;u.5;;::ouCoo<i5
0.6
0.4
Partial ductility ratio, Jl i'
Figure 7.13 Relation between KO,i and p'i for the connection category II
-Stage 2: On reloading in Stage 2, the drop of loading stiffness at the
beginning of loading is significantly increased when compared with that for
the connection category I. This can be attributed to the presence of more
extensive concrete deterioration during the continuous loading. As shown in
Figure 7.12 (b), the reloading segment ends when it reaches point bj<2> on the
degradation envelope curve. Similar to the definition in connection category I
referring to Figure 7.10, the point bj<2> in contrast to point ai<l> has the same
rotation as Bee•i• but reduced moment as asdM.C.i' The relationship between Usd
and Pi is shown in Figure 7.14 (a) and the counterpart equation can be
expressed as:
=0892 -0.108aId • Pi Equation 7.18
Likewise, the equation for the relationship between red and Pi can be written as:
269
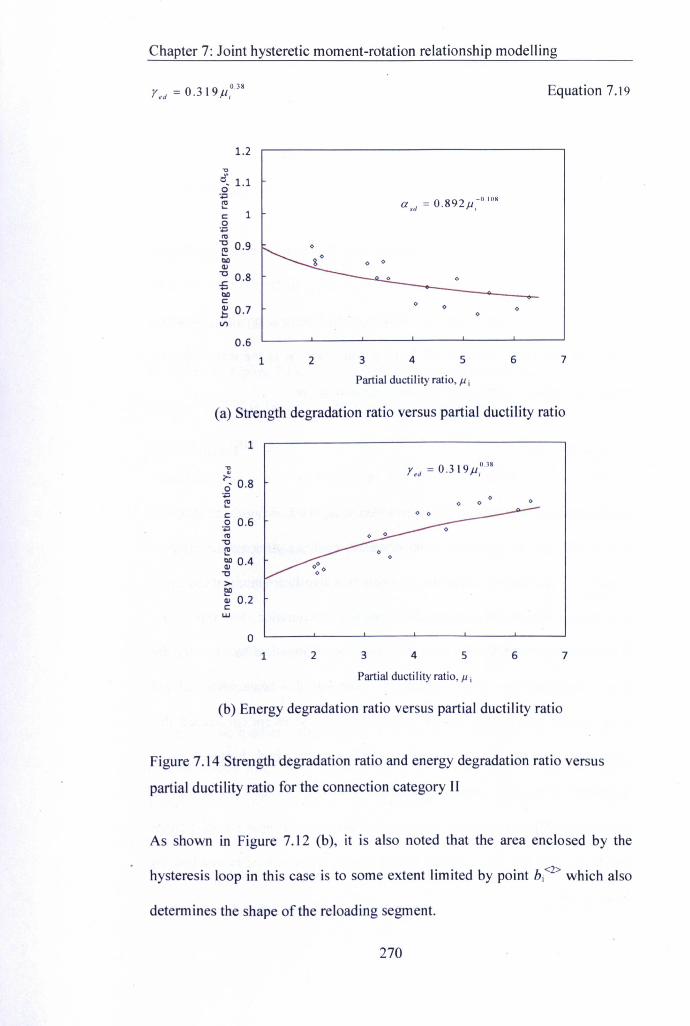
Chapter 7: Joint hysteretic moment-rotation relationship modelling
Yed = 0.31911,°38
J_ 1.1o+='ec: 1o+='
'";; 0.9"-tIDQ)
~ 0.8...tIDc:~ 0.7Vl
1.2
a = 0.892 -0.10'sd Jij
Equation 7.19
o
o
7
(a) Strength degradation ratio versus partial ductility ratio
-e~...0' 0.8+='ec:,g 0.6
'""e~ 0.4
">~Q) 0.2cw
o e
6 7
e
0.6
(b) Energy degradation ratio versus partial ducti Iity ratio
1 2 3 5 6
Figure 7.14 Strength degradation ratio and energy degradation ratio versus
partial ductility ratio for the connection category If
4
Partial ductility ratio, 11 i
1
As shown in Figure 7. t 2 (b), it is also noted that the area enclosed by the
Y." = O.319Jl,O.38
hysteresis loop in this case is to some extent limited by point bi<2> which also
o1 2 53 4
Partial ductility ratio, 11 i
determines the shape of the reloading segment.
270
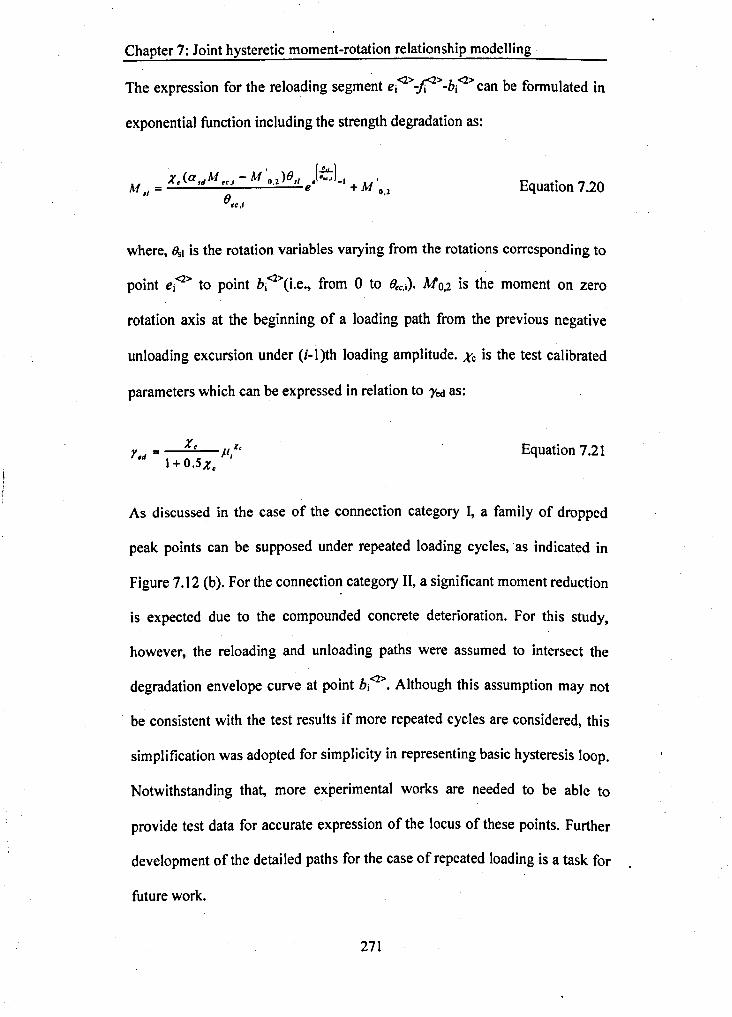
Chapter 7: Joint hysteretic moment-rotation relationship modelling
The expression for the reloading segment ej<2>-.fi2> _bj<2>can be formulated in
exponential function including the strength degradation as:
, (.!&..]z.(a,dM ec ,,-M o,z)B,1 ,BK, -1 M'
M II = e + 0,2
B,.,IEquation 7.20
where, Bsi is the rotation variables varying from the rotations corresponding to
point ej<l> to point bj<2>(Le., from 0 to Bec,i)' Mo,2 is the moment on zero
rotation axis at the beginning of a loading path from the previous negative
unloading excursion under (i-l)th loading amplitude. Xc is the test calibrated
parameters which can be expressed in relation to Yed as:
X. s,r,d = P,1+ O.Sz.
Equation 7.21
As discussed in the case of the connection category I, a family of dropped
peak points can be supposed under repeated loading cycles, 'as indicated in
Figure 7.12 (b). For the connection category II, a significant moment reduction
is expected due to the compounded concrete deterioration. For this study,
however, the reloading and unloading paths were assumed to intersect the
degradation envelope curve at point bj<2>. Although this assumption may not
. be consistent with the test results if more repeated cycles are considered, this
simplification was adopted for simplicity in representing basic hysteresis loop.
Notwithstanding that, more experimental works are needed to be able to
provide test data for accurate expression of the locus of these points. Further
development of the detailed paths for the case of repeated loading is a task for
future work.
271
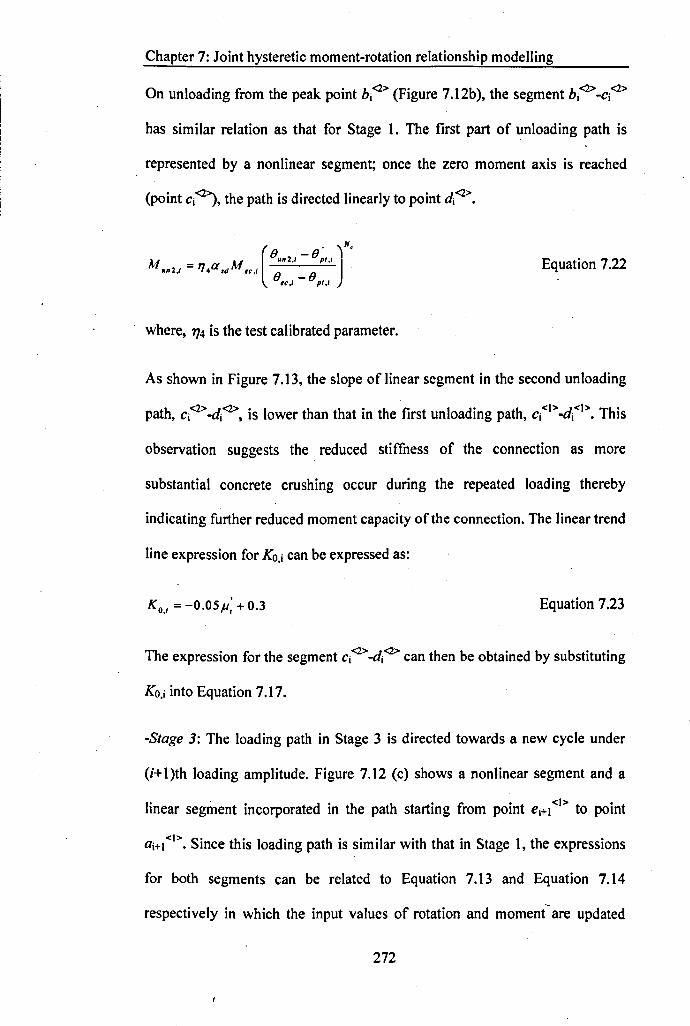
Chapter 7: Joint hysteretic moment-rotation relationship modelling
On unloading from the peak point bj<2> (Figure 7.l2b), the segment bj<2>_cj<2>
has similar relation as that for Stage I. The first part of unloading path is
represented by a nonlinear segment; once the zero moment axis is reached
{point Cj<2}, the path is directed linearly to point dj<2>.
(0 -0' IN.M - a M on2.1 PI.1
on2.1 - 1]4 ,d ... 1 0 _ 0le,l pl,1
Equation 7.22
where, TJ4 is the test calibrated parameter.
As shown in Figure 7.13, the slope of linear segment in the second unloading
path, cj<2>_dj<2>, is lower than that in the first unloading path, cj<I>-dj<I>. This
observation suggests the reduced stiffness of the connection as more
substantial concrete crushing occur during the repeated loading thereby
indicating further reduced moment capacity of the connection. The linear trend
line expression for KO.j can be expressed as:
KO•1 = -0.05,u; + 0:3 Equation 7.23
The expression for the segment cj<2>_dj<2> can then be obtained by substituting
KO.j into Equation 7.17.
-Stage 3: The loading path in Stage 3 is directed towards a new cycle under
{i+l)th loading amplitude. Figure 7.12 (c) shows a nonlinear segment and a
linear segment incorporated in the path starting from point ei+tl> to point
ai+tl>. Since this loading path is similar with that in Stage 1, the expressions
for both segments can be related to Equation 7.13 and Equation 7.14
respectively in which the input values of rotation and moment are updated
272
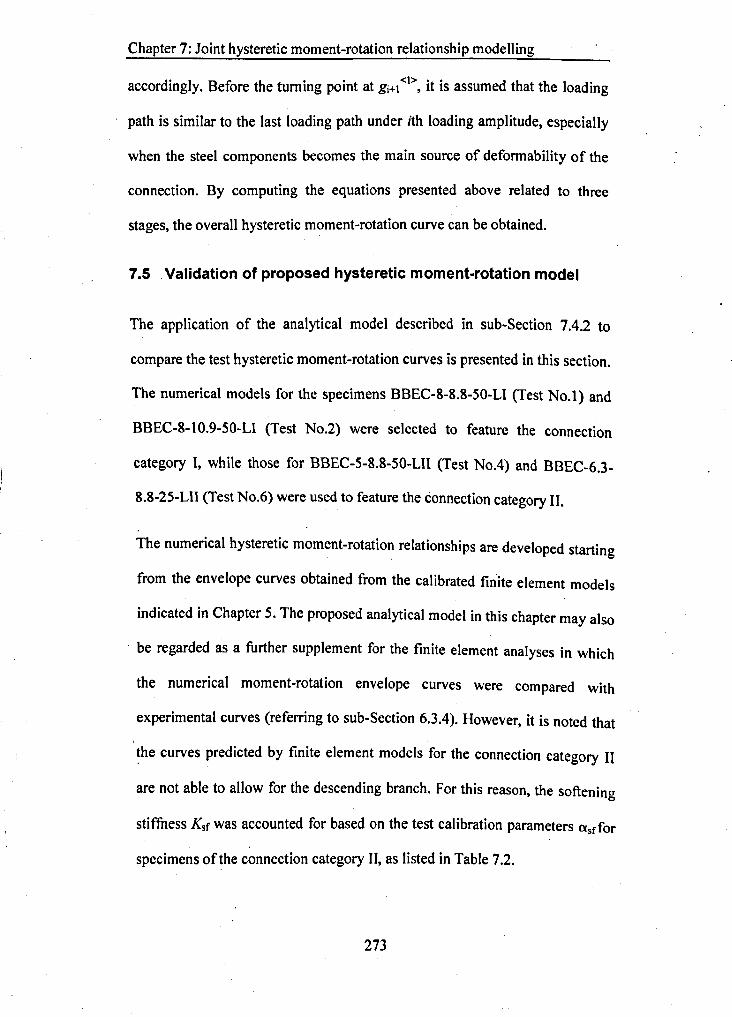
Chapter 7: Joint hysteretic moment-rotation relationship modelling
accordingly. Before the turning point at gi+l <1>, it is assumed that the loading
path is similar to the last loading path under ith loading amplitude, especially
when the steel components becomes the main source of deformability of the
connection. By computing the equations presented above related to three
stages, the overall hysteretic moment-rotation curve can be obtained.
7.5 .Validation of proposed hysteretic moment-rotation model
The application of the analytical model described in sub-Section 7.4.2 to
compare the test hysteretic moment-rotation curves is presented in this section.
The numerical models for the specimens BBEC-8-8.8-S0-LI (Test No.1) and
BBEC-8-10.9-S0-LI (Test No.2) were selected to feature the connection
category I, while those for BBEC-S-8.8-S0-LII (Test No.4) and BBEC-6.3-
8.8-2S-LII (Test No.6) were used to feature the connection category II.
The numerical hysteretic moment-rotation relationships are developed starting
from the envelope curves obtained from the calibrated finite element models
indicated in Chapter 5. The proposed analytical model in this chapter may also
. be regarded as a further supplement for the finite element analyses in which
the numerical moment-rotation envelope curves were compared with
experimental curves (referring to sub-Section 6.3.4). However, it is noted that
~he curves predicted by finite element models for the connection category II
are not able to allow for the descending branch. For this reason, the softening
stiffness Ksf was accounted for based on the test calibration parameters «sffor
specimens of the connection category II, as listed in Table 7.2.
273
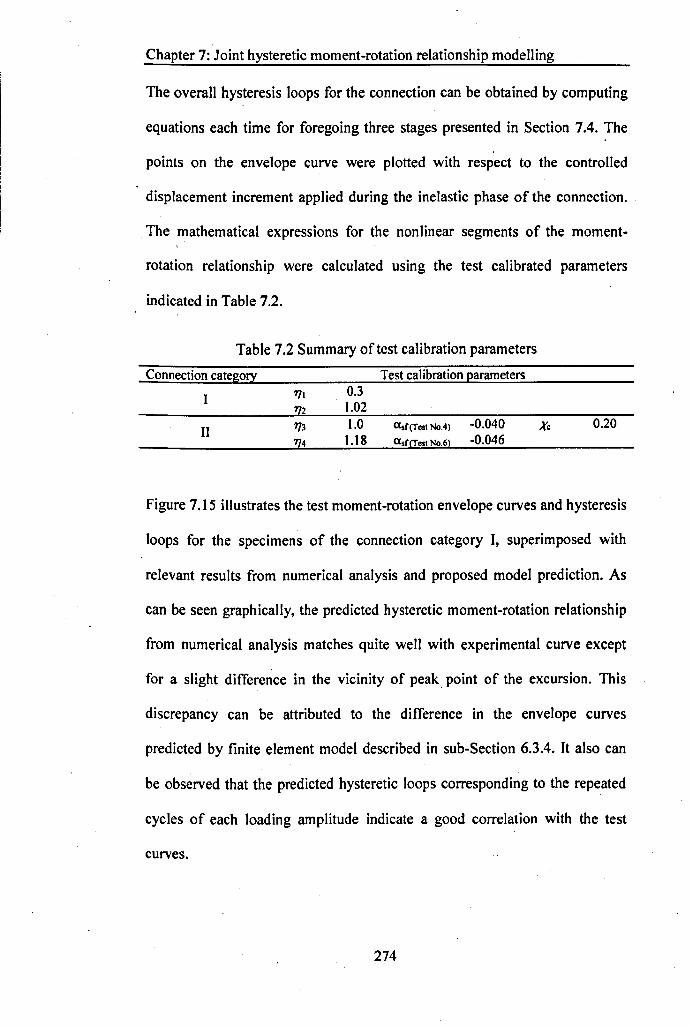
Chapter 7: Joint hysteretic moment-rotation relationship modelling
The overall hysteresis loops for the connection can be obtained by computing
equations each time for foregoing three stages presented in Section 7.4. The
points on the envelope curve were plotted with respect to the controlled
displacement increment applied during the inelastic phase of the connection.
The mathematical expressions for the nonlinear segments of the moment-
rotation relationship were calculated using the test calibrated parameters
indicated in Table 7.2.
Table 7.2 Summary of test calibration parameters
Connection category Test calibration parameters
I 111 0.32 1.02
II 1]3 1.0 Clsf(Tcst No.4) -0.040 Xc 0.20114 1.18 <lsf(Test No.6) -0.046
Figure 7.15 illustrates the test moment-rotation envelope curves and hysteresis
loops for the specimens of the connection category I, superimposed with
relevant results from numerical analysis and proposed model prediction. As
can be seen graphically, the predicted hysteretic moment-rotation relationship
from numerical analysis matches quite well with experimental curve except
for a slight differe~ce in the vicinity of peak point of the excursion. This
discrepancy can be attributed to the difference in the envelope curves
predicted by finite element model described in sub-Section 6.3.4. It also can
be observed that the predicted hysteretic loops corresponding to the repeated
cycles of each loading amplitude indicate a good correlation with the test
curves.
274
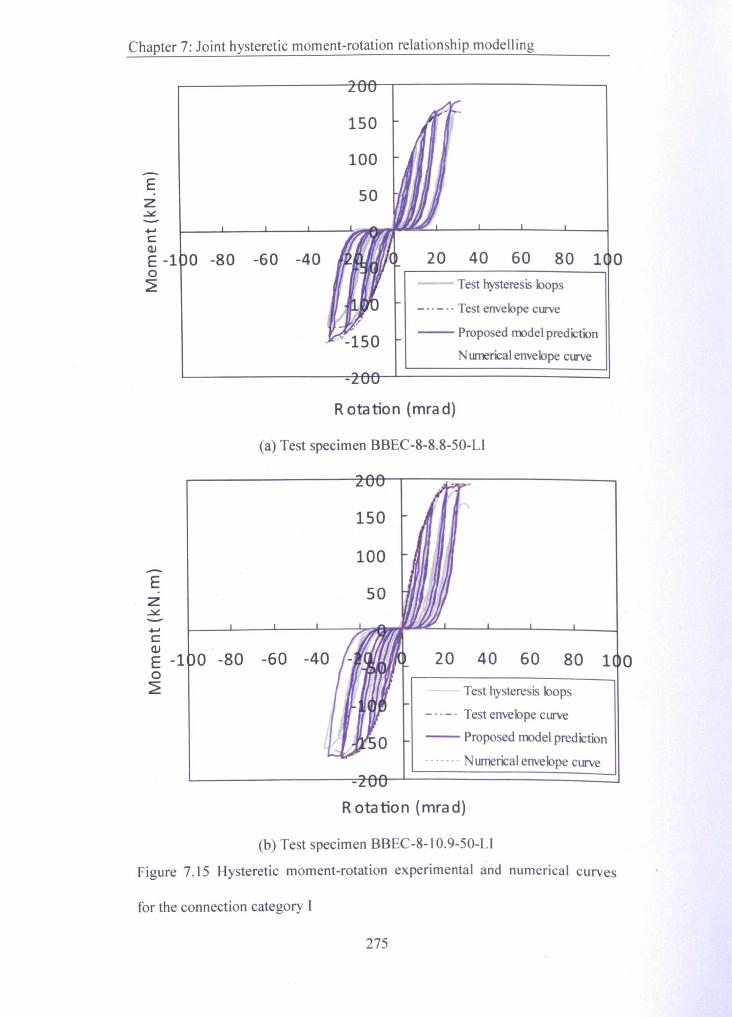
Chapter 7: Joint hysteretic moment-rotation relationship modelling
Ez~
50
20 40 60 80 1 0
150
100
....c:OJE -1 0 -80 -60 -40o~ Test hysteresis loops
- .. - .. Test envelope curve
-- Proposed model prediction
Numerical envelope curve
Rotation (mra d)
(a) Test specimen BBEC-8-8.8-50-LJ
-Ez~
50
150
100
....c:OJE -1 0 -80 -60o~
20 40 60 80 1 0
Test hysteresis loops
- .. _. Test envelope curve
- Proposed model prediction
....... Numerical envelope curve
Rotation (mra d)
(b) Test specimen BBEC-8-1 O.9-50-L1
Figure 7.15 Hysteretic moment-rotation experimental and numerical curves
for the connection category [
275
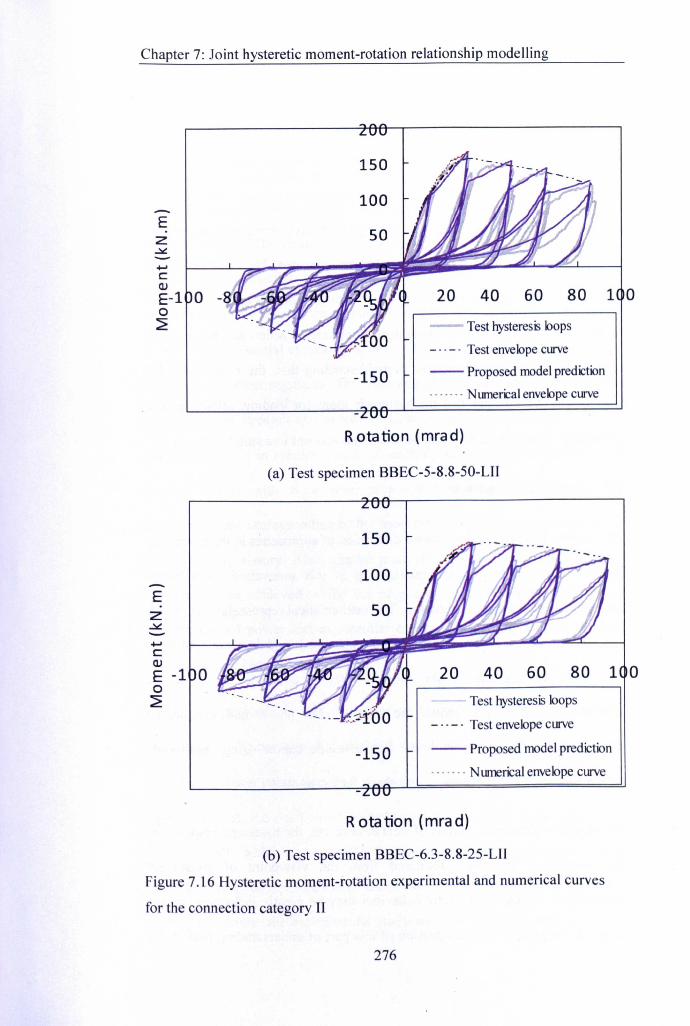
Chapter 7: Joint hysteretic moment-rotation relationship modelling
Ez.::.t:.+-'c:OJE-l 00~
Ez.::.t:.
+-'c:OJE -1 00~
150
100
50
20 40 60 80 1 0
- Test hysteresis loops_ .. _. Test envelope curve
-150 -- Proposed model prediction....... N umercal envelope curve
Rotation (mrad)
(a) Test specimen BBEC-5-8.8-50-UI
150
100
50
20 40 60 80 1 0
Test hysteresis loops
- .. _. Test envelope curve
-- Proposed model prediction
....... Numerical envelope curve-150
Rota tion (mra d)
(b) Test specimen BBEC-6.3-8.8-25-L11
Figure 7.16 Hysteretic moment-rotation experimental and numerical curves
for the connection category II
276
Chapter 7: Joint hysteretic moment-rotation relationship modelling
Figure 7.16 presents the test envelopes and hysteretic moment-rotation
relationships for the specimens of the connection category II together with the
analytical predictions of the proposed model. It can be seen that the analytical
models yield good predictions ofthe most range of the test hysteretic moment-
rotation relationship. In fact, the closely correlated envelope curve acts
beneficially in the good prediction of the test response. The observed slight
overestimation of the moment during the reloading segments may be attributed
to the local concrete behaviour induced nonlinearity which can not be well
represented by numerical models. Notwithstanding that, the comparison for
both specimens indicates that the hysteresis loops f~r loading, reloading, and
unloading of the connections can be taken into account in a suitable manner.
7.6 Concluding remarks
This chapter has provided a detailed discussion of approaches in the modelling
of hysteretic moment-rotation relationship of this innovative blind bolted
endplate connection to CFT column. The mathematical representations, which
are widely used for analytical model and mechanical models, were applied in
this study to characterize the moment-rotation envelope curve of the
connection. It has been shown the efficiency of power and exponential
expressions in fitting the nonlinear test envelope curves using appropriate
parameters of plastic stiffness, kp and shape factor, n.
By introducing material models of steel & concrete, the hysteretic response of
the connection has been discussed from the viewpoint of constituent
components. As the joint cyclic behaviour may be greatly influenced by the
weakest component, the introduction of this part of understanding provided a277
. Chapter 7: Joint hysteretic moment-rotation relationship modelling
. useful basis for the further analysis of the overall joint behaviour under cyclic
loading.
More efforts have been concentrated on the development of hysteretic
moment-rotation models on the basis of the envelope curves from finite
element models. The relatively simple mathematical functions were used to
characterize the loading, unloading and reloading segments of the hysteretic
moment-rotation curves of the connection categories I and II. This contains the
power and exponential expressions for the nonlinear segments while the linear
functions for linear segments. The softening slope, linear segment slope, and
degradation of strength and energy dissipation have been allowed for in the
proposed models in relation to partial ductility ratios. A good correlation of
the test curves with those from proposed model was presented for the
hysteresis loops corresponding to the most ranges of first and repeated cycles
of the loading history. Also, similar promising predictions of test hysteresis
loops could be achieved whilst the proposed model was established using
aforementioned power and exponential expressions instead of finite element
analysis for the basic envelope curve.
The model proposed in this study has its limitations. Further experimental
work needs to be performed to establish consistent methods in the evaluation
of test calibration parameters (11h 1]2, 113, 114, Xc, elsf, KO,i, llsd, red). As for the
repeated cycles, the position of dropped peak points of the curve was traced
experimentally which can be used to feature the strength degradation. Due to
limited numbers of repeated cycles under each loading amplitude in the ECCS
loading procedure, the experimental study was not able to provide sufficient
278

Chapter 7: Joint hysteretic moment-rotation relationship modelling
data to determine the locus of these points. A more accurate prediction of this
locus which incorporates stability limit may further improve the accuracy of
the proposed model, especially for the hysteresis loops under repeated loading
cycles.
279
Chapter 8: Conclusions and future work
CHAPTERS
CONCLUSIONS AND FUTURE WORK
This thesis has presented the results of a series of full scale joint tests in which
open section beams were connected to CFT columns through blind bolted
endplates. The connector adopted for these connections is an innovative blind
bolt called the Extended Hollobolt which is based on the Lindapter Hollobolt.
This chapter summarizes the key findings of this research programme
presented in this thesis. Recommendations and further work are outlined in
Section 8.2.
8.1 Conclusions from current research programme
Based upon the experimental and analytical investigations conducted, the
following conclusions and observations can be extracted from this research
programme:
• The full-scale quasi-static cyclic loading tests have shown two
representative failure modes: modes I and II. For failure mode I, the bolt
shank fractured ultimately with limited CFT column face yielding. For
failure mode II, the CFT column face deformed in moderate flexible
manner with local damage of concrete infill and slight bolt pullout with
likely local crack in the sleeves. The former failure mode is associated
with the bolt as a relatively weak component; in contrast, the latter failure
mode is referred to relatively strong bolt with tube face in flexible
deformation and excessive concrete crushing. As such,. the connections
280
Chapter 8: Conclusions and future work
were classified as two categories corresponding to the failure modes
mentioned above. The material and geometric parameters, such as bolt
grade, tube wall thickness and concrete grade, were shown in this study to
have influence on the joint failure modes.
• The experimental observation demonstrated that this innovative blind bolt
can be successfully applied in the bolted endplate connections to eFT
column subjected to cyclic loads. The tests on the blind bolted
connections have indicated that the additional anchorage part of the
Extended Hollobolt remains almost intact during the cyclic loading which
may provide .stable improvement of strength and stiffness of the
connection as long as the surrounded concrete maintains certain load
carrying capacity. This observation also implies the merit of this blind
bolted connection over some other blind bolts developed in Australia (i.e.,
the extensions welded to the Ajax One-side blind bolts) which posed
undesired weld fracture under cyclic loading as reported in the literature.
• The moment-rotation curve presented certain nonlinear characteristics at
very beginning of loading. The hysteresis loops for test specimens showed
obvious pinching. The connections, which were subjected to loading
procedures with varying displacement increments, demonstrated different
shapes of hysteresis loops but almost enclosed by similar envelope curves.
• The connections failed in mode I (bolt shank fracture with limited CFT
column face yielding) have less ductility that those in failure mode II, Le.
approximately 28-32 mrad and 86-92 mrad for connection categories I
and II under negative loading respectively. Based on the ductility
requirements suggested by Eurocode 8 for dissipative semi-rigid (and/or)
281
Chapter 8: Conclusions and future work
partial strength connections and ductility classification in accommodating
plastic hinge rotation, it is concluded that test connections in category I
can provide more than 25 mrad rotation required for the connections in
frames of medium ductility class (OCM) with behaviour factor (q) greater
than 2.0. On the other hand, the test connection in category II are more
likely to have more than 35 mrad rotation required for the connections in
frames of high ductility class (DCH).
• It was evident that the bolt grade, tube wall thickness and concrete grade
have positive influences on the basic joint moment-rotation behaviours,
which are represented by initial stiffness, yield rotation & moment, and
maximum rotation & moment. For category II connections, the resistant
ratio and full ductility ratio showed more significant drops than those for
the connections of category I.As for energy dissipation, throughout all the
loading progress the category I connection demonstrated a dramatic drop
of energy dissipation ratio subsequent to the first cycle of each loading
amplitude, which suggests greater reduction of energy dissipation
capacity during the repeated cycles of each loading amplitude. In contrast,
a similar trend was shown at the beginning of the inelastic cycles for the
connections of category II, but this drop is reduced as the rotations
increased.
• The damage indices incorporated into a cumulative damage model
analysis have been found to provide an approximation of the damage
progression of the connection. The energy based cumulative damage
index was noticed to represent a more reasonable evaluation of the
observed progressive damage process of the connections. By introducing
282
Chapter 8: Conclusions and future work
the general Park & Ang damage level classification, the hysteretic
progress of the connection was further analysed in terms of damage stages
which seemed to result in a good agreement with the test observations.
• 3D nonlinear finite element models that incorporate advanced modelling
technique have been demonstrated to adequately predict the moment-
rotation behaviour of this connection within the limitation of parameters
chosen. The numerical predictions of bolt preload and strain distribution
of connection components showed good agreement with test data for two
connection categories. The stress distributions indicated that the bolt
shank in failure mode I is the primary part to carry the tension loads with
limited plasticity spreading on the tube walls. On the other hand, the stress
distributions suggested the concrete strength and tube wall flexibility play
an important role in failure mode II. Through a parameter variation
analysis, a comparison and discussion is made for the moment-rotation
envelope curves of a limited range of tube wall thickness and concrete
strength. These results showed that by increasing the tube wall thickness
from Smm to 8mm, the negative moment capacity is enhanced by 38.2%
for the connections with C2S concrete grade while by 22.4% and by 8.2%
for the connections with concrete grades ofC40 and C50 respectively.
• A hysteretic moment-rotation model, incorporating power and exponential
expressions to define the loading, unloading and reloading segments of
the hysteresis loops, has been developed. It has been shown that the
softening slope. linear segment slope. and degradation of strength and
energy dissipation can be allowed for by introducing test calibration
parameters (1]10 1]2. 1]3. 1]4. Xc, ll'sf, KO.i. ll'sd. Yed) in relation with partial283
Chapter 8: Conclusions and future work
ductility ratio. The accuracy of the model has been demonstrated to be
reasonable for specimens in the connection categories I and II.
• The conclusions of this study reported herein indicate that the objectives
of this research have been satisfied primarily in terms of experimental
study based evaluation, finite element modelling and hysteretic moment-
rotation model study. The understanding of the progressive damage
evolution of these Extended-Hollobolt endplate connections, which
mainly relate to the blind bolt and eFT column, provides a basis for
further evaluating a range of such connections subjected to cyclic loading.
Moreover, incorporated with the contribution of beam endplate, the
developed hysteretic model for the hysteretic moment-rotation response of
the connection could be further applicable for the seismic performance
assessment of steel frames, where the semi-rigid connections are
constituent part of the dissipative system. Additionally, for this type of
connection with over-strength beam and endplate the ductile performance
could be improved whilst relatively thin tube wall and/or weak concrete
infill (e.g. less than 6.3mm and/or C40 in this study) are used.
8.2 Recommendations and future work
The work conducted in this program is based on the full scale experimental
investigation and finite element analysis of the joint performance. Some
additional items are recommended to further develop the understanding of the
hysteretic behaviour of this innovative blind boIted endplate connection to
CFT columns.
284
Chapter 8: Conclusions and future work
• Further investigation of the hysteretic moment-rotation response of the
connection with varying anchorage condition of the blind bolts. The
connections studied in this research project were based on the blind bolts
of the same geometric configuration with the bolt shank length of 150mm.
If the blind bolts are perfectly anchored (i.e. capable of developing the full
bolt tensile resistance), it is supposed that the bolt shank will ultimately
fracture corresponding to the failure mode I. In this case, further
improvement of bolt anchorage capacity has little effect on the further
increasing the strength and ductility of the connection. Conversely, the
reduction and gradual loss of anchorage may lead to some other
components instead of the blind bolts to achieve ultimate capacity. This
has already been demonstrated by the different failure modes of
specimens BBEC-6.3-8.8-25-LII and BBEC-6.3-8.8-50-LII with the
change of the failure mode ~hen the bolt anchorage was weaken by
reducing the strength of the concrete infill. More material and geometric
parameters of the blind bolt and SHS section can be considered in the
further study to improve the understanding of the cyclic behaviour of the
connections, such as the bond condition between anchored bolt and
concrete infill.
• Additional tests with varying loading procedure. An important area to
consider is the consecutive failure mode of the connections under a given
loading amplitude level. This failure mode is unique as it appears to be
related to the normal ultimate capacity as well as low cycle fatigue of the
connection components. Such observation was made in the tests of this
study mainly for the specimens in failure mode II with significant strength'
285
Chapter 8: Conclusions and future work
degradation during the repeated loading cycles. This evidence was
considered in the proposed hysteretic moment-rotation models as
indicated in Chapter 6, however, the ECCS procedure for the tests only
allows three cycles (i.e., two repeated cycles following the first cycle) at
each loading amplitude which provide very limited data for this part of
study. It is therefore recommended to apply a modified loading procedure
for future tests to reduce the numbers of the amplitude levels but
incorporates more cycles at each amplitude. The test using the suggested
modified procedure may clarify the locus of decreased peak points
referring to the repeated loading cycles which will in tum lead to a greater
understanding and improvement of the proposed hysteretic models.
• Further full scale joint testing. The endplate thickness in the study was
adopted as 25mm to exclude the endplate flexure for all test specimens. If
thinner endplate is used, subsequent reference to Eurocode 3 can be taken
in normal joint design to determine the flexure strength and stiffness of
the endplate in relation with the component method as indicated in Figure
7.8. On the other hand, the endplate flexure will be added as a dissipative
component into the joint hysteretic moment-rotation behaviour. A
counterpart experimental study is needed to provide some insights of the
improvement of energy dissipation capacity of such joint configuration. A
further test programme can also be extended to the more complex issues
of cruciform blind bolted connections and composite connections with
concrete slabs. These issues have been investigated in the literature for the
connections with open section beams welded to tubular columns. The
introduction of this innovative blind bolt into those connections will
286

Chapter 8: Conclusions and future work
provide useful data for its further application in the steelwork frame
system. Based on such future test data, further development of the joint
hysteretic models would also be required for the joint configurations
mentioned above.
• Application of numerical modelling. The tensile behaviour of this
innovative blind bolt was previously determined numerically based on the
T-stub assembly model before the starting of this research programme. It
demonstrated the good application of finite element model as a cost
effective way of investigating the load transfer mechanism and related
joint response based on a parametric study. In contrast, the computational
cost and convergence problem were highlighted for the joint model in the
finite element analysis due to the consideration of complicated joint
configuration as well as the incorporation of concrete model. For this.
reason, the finite element models would also be restricted for small range
parametric study especially when some more components were introduced
into this connection system. It is therefore recommended that a further
development of the finite element models using improved material models
and advanced modelling techniques so as to accurately simulate the
moment-rotation hysteresis loops of the connection in a more efficient
manner.
287
References
REFERENCES
1. American Institute of Steel Construction Inc. (AISC), 2005: SteelConstruction Mariual. 13 Edition, AISC, Chicago, US
2. Tsai KC, Weng YT, LIN ML., Pseudo dynamic tests of a full-scaleCFTIBRB composite frame: displacement based seismic design andresponse evaluations. In: Proceeding of the International Workshop onSteel and Concrete Composite Constructions, Taiwan, 2003: 165-176
3. Tabsh SW, Mourad S., Resistance factors for blind bolts in direct tension.
Engineering Structures, Vo1.12(19), 1997: 995-10004. SHS Jointing. Corus Tubes library publication online. 14 Jun 06, [cite 10
Jun 2009]. Available from:http://www.corusgroup.com/fi le_source/Staticf'iles/Business _Un its/Corus
_Tubes/CT 46-SHS%20Jointing%20 14-06-06.pdf5. Design Guide for SHS Concrete Filled Columns. Corus Tubes library, 11
Apr OS, publication online [cite 10 Jun 2009]. Available from:http://www.corusgroup.com/file_source/StaticFileslBusiness%20Units/Corus%20Tubes/CT26-Design%20Guide%20for'1020SHS%20CFC%20 11-04-
05.pdf6. Huck BOM, Alcoa Fastening systems, 2007, publication online [cite 12
July 2009]. Available from:http://www.alcoa.com/com_transportlenlproductslproduct.asp?country_id
=999&market_id=30&market_ cat_id=379&cat_id=5 57&prod_id=8847. Flowdrill & Hollo-Bolt. Corus Tubes library publication online. 13 Feb
2003, [cite 10 Jun 2009]. Available from:http://www.corusgroup.com/file_source/StaticFileslBusiness%20Units/Co
rus%20TubesITD384-Flowdrill%20&%20HoII0-Bolt%2013-02-03.pdf8; Type HB Hollo-Bolt, Lindapter, 2008. Download online, exact date
unknown, publication online [cite 10 Jun 2009]. Available from:http://www.lindapter.comlProducts/Cavity_Fixings/2IType_HB_H0110-Bolt.pdf
9. One side structural fastener, AJAX Engineered Fasteners, 1999, publication
online [cite 12 July 2009]. Available from:
288
References
http://www.ajaxfast.com.auiindex.asp?d=5A4C5A 717251477C70080F08
0108
10. Kurobane Y, Packer JA, Wardenier J, Yeomans N., Design Guide for
Structural Hollow Section Column Connections. CIDECT and Verlag
TUVRheinland GmbH, Koln, Germany, 2004.
11. Ghobarah A, Mourad S, Korol RM., Behaviour of blind bolted moment
connection for HSS columns. Tubular Structures V, Proceedings of the
Fifth International Symposium, Nottingham, UK, 1993: 125-132.
12. Mazzolani FM., Moment resistant connections of steel frames in seismic
areas. E&FN SPON Press. 2000: 95-96
13. CEN, Eurocode 8, prEN-1993-1-8, Part 8: General rules, seismic actions
and rules for buildings Eurocode 8: Design of structures for earthquake
resistance. Stage 49 draft, CEN, European Committee for Standardization,
Brussels, Belgium, 2003
14. American Institute of Steel Construction (AISC). Seismic provisions for
structural steel buildings. American Institute of Steel Construction,
Chicago, 2005
15. Dubina D, Stratan A., Behaviour of welded connections of moment
resisting beam-to-column joints. Engineering Structures, 24(11), 2002:
1431-1440
16. SAC, 1997. Protocol for fabrication, Inspection, testing and documentation
of beam-column connection tests and other experimental specimens.
report No. SACIBC-97/02, SAC Joint Venture
17. Mahina S, Malleyb J, Hamburgerc R., Overview of the FEMAISAC
program for reduction of earthquake hazards in steel moment frame
structures. Journal of Constructional Steel Research, 58(5), 2002: 511-528
18. Joints in Steel Construction: Simple Connections, The Steel Construction
. Institute & The British Constructional Steelwork Association Limited,2005
19. Arthur GA., Investigation of the failure mechanism and moment capacity
prediction in a ten bolt flush end plate moment connection. University of
Akron, USA, in partial fulfillment of the requirements for Master of
Science degree. 2010
289
References
20. Lee J, Goldsworthy HM, Gad EF., Blind bolt T-stub connections to
unfilled hollow section columns in low rise structures. Journal of
Constructional Steel Research, 66(8-9), 2010: 981-992
21. AI-Mughairi A, Tizani W, Owen J., Connection to Concrete Filled Hollow
.Section using Extended Hollobolt (Moment Connection Tests).
Proceedings of the 9th International Conference on Steel Concrete
Composite and Hybrid Structures. Leeds, UK. 2009: 599-604 .
22. AI-Mughairi A., The behaviour of moment resisting connection to
concrete filled hollow sections using extended hollobolts. University of
Nottingham, United Kingdom, in partial fulfillment of the requirements
for Ph.D. degree. 2009
23. Jaspart JP, Steenhuis M, Weinand K., The stiffness model of revised
Annex J of Eurocode 3. In: Proceedings of 3rd international workshop on
connection in steel structure, Pergamon, 1995: 115-26
24. Simoes da Silva L, Calado L, Simoes R, Girao Coelho A., Evaluation of
Ductility in Steel and Composite Beam-to-Column Joints: Analytical
Evaluation. In: Leon R, Easterling WS, editors. Connections in steel
structures IV. Proceedings of the Fourth International Workshop on
Connections, Roanoke, VA, USA, October 22-25. 2000; 223-233
25. Faella C, Piluso V, Rizzano G., Structural steel semirigid connections:
theory, design and software. CRC Press, 2000
26. Adey BT, Grondin GY, Cheng JJR., Cyclic loading of end plate moment
connections. Canadian Journal of Civil Engineering, 4(27), 2000: 683-701
27. Zoetemeijer P., A design method for the tension side of statically loaded
bolted beam-to-column connections. Heron, 20(1), 1974:1-59
28. Agerskov H., High-strength bolted connections subject to prying. Journal
of Structural Engineering, ASCE, 102(ST1), 1976: 162-75
29. Yee YL, Melchers RE., Moment-rotation curves for bolted connections.
Journal of Structural Engineering, ASCE, 112(3), 1986: 615-635
30. Jaspart JP, Steenhuis M, Weinand K., The stiffness model of Revised
Annex J of Eurocode 3. Proc., 3rd lnt. Workshop on Connection in Steel
Struct., Pergamon 1995: 115-126
290
References
31. Shi YJ, Chan SL, Wong YL., Modeling for moment-rotation
characteristics for end- plate connections. Journal of Structural
Engineering, ASCE, 122(11), 1996: 1300-1306
32. prEN 1993-1-8: 2005. Eurocode 3: Design of Steel Structures, Part 1.8:
Design of joints, European Standard, CEN, Brussels, 2005
33. Barnett TC., The behaviour of a blind bolt for moment resisting
connections in hollow steel sections. University of Nottingham, United
Kingdom, in partial fulfillment of the requirements for Ph.D degree, 2001
34. Tanaka T, Tabuchi M., Experimental study on endplate to SHS column
connections reinforced by increasing wall thickness with one site bolts.
Tubular Structures VII, Farkas & Jamai(eds), Balkema, Rotterdam. 1996:
253-260
35. Lee J, Goldsworthy HM, Gad EF., Blind bolted T-stub connections to
unfilled hollow section columns in low rise structures. Journal of
Constructional Steel Research, 66(8-9), 2010: 981-92.
36. France JE, Davison JB, Kirby PA., Strength and rotational stiffness of
simple connections to tubular connections using flowdrill connector.
Journal of Constructional Steel Research, 50(1), 1999: 1-14
37. France JE, Davison JB, Kirby PA., Strength and rotational stiffuess of
endplate connections to concrete filled tubular columns with flowdrilled
connectors. Journal of Constructional Steel Research, 50(1), 1999: 15-34
38. France JE, Davison JB, Kirby PA., Strength and rotational response of
moment connections to tubular columns using flowdrill connectors.
Journal of Constructional Steel Research, 50(1), 1999: 35-48
39. Tizani W, Ridley-Ellis D., The performance of a new blind bolt for
moment-resisting connections. In: Jaurrieta MA, Alonso A, Chica JA., eds.
Proceedings of the 10th International Symposium on Tubular Structures:
Tubular Structures X, Madrid, Spain, Rotterdan, A.A. Balkema, 2003:
395-401
40. Ellison S, Tizani W., Behaviour of blind bolted connections to concrete
filled hollow sections. The Structual Engineer, November, 2004: 16-17
291
References
41. Schneider SP, Alostaz YM., Experimental behavior of connections to
concrete-filled steel tubes. Journal of Constructional Steel Research, 45(3),
1998: 321-352
42. Goldsworthy H, Gardner AP., Feasibility study for blindbolted
connections to concrete-filled circular steel tubular columns. Structural
Engineering and Mechanics, 24(4), 2006: 463-478
43. Gardner AP, Goldsworthy HM., Experimental investigation ofthe stiffness
of critical components in a moment-resisting composite connection.
Journal of Constructional Steel Research, 61(5), 2005: 709-726
44. Ghobarah A, Mourad S, Korol RM., Behaviour of blind bolted moment
connection for HSS columns. Tubular Structures V, Proceedings of the
Fifth International Symposium, Nottingham, UK, 1993: 125-132
45. Korol RM, Ghobarah A, Mourad S., Blind bolting W-shape beams to HSS
columns. Journal of Structural Engineering, ASCE, 119(12), 1993: 3463-
3481I
46. Harada Y, Arakaki T, Morita K., Structural behaviour of RHS column-to-
H beam connection with high strength bolts. International Journal of Steel
Structures, 2, 2002: 111-121
47. Loh HY, Uy B, Bradford MA., The"effects of partial shear connection in
composite flush end plate joints Part I-experimental study. Journal of
Constructional Steel Research, 62(4),2006: 378-390
48. Loh HY, Uy B, Bradford MA., The effects of partial shear connection in
composite flush end plate joints Part II-Analytical study and design
appraisal. Journal of Constructional Steel Research, 62(4), 2006: 391-412
49. Wang JF, Han LH, Uy 8., Behaviour of flush end plate joints to concrete-
filled steel tubular columns. Journal of Constructional Steel Research,
65(8-9), 2009: 1644-1663.
50. Elghazouli AY, Malaga-Chuquitaype C, Castro JM, Orton AH.,
Experimental monotonic and cyclic behaviour of blind-bolted angle
connections. Engineering Structures, 31(11), 2009: 2540-2533
51. Lee J, Goldsworthy HM, Gad EF., Blind bolted moment connection to
unfilled hollow section columns using extended T-stub with back face
support. Engineering Structures, 33(5), 2011: 1710-1722
292
References
52. Nethercot DA, Davison JB, Kirby PA., Connection flexibility and beam
design in non-sway frames. Journal of Structural Engineering, ASCE,
3(25), 1988: 99-108
53. Korol RM, Ghobarah A, Osman A., Extended endplate connections under
cyclic loading: Behaviour and design. Journal of Constructional Steel
Research, 16(4), 1990: 253-279
54. Ghobarah A, Osman A, Korol RM., Behavior of extended endplate
connections under cyclic loading. Engineering Structures, 12( I), 1990: 1-
27
55. Tsai KC, Popov EP., Cyclic behavior of endplate moment connections.
Journal of Structural Engineering, 116(11), 1990: 2917-2930
56. Mourad S, Ghobarah A, Korol RM., Dynamic response of hollow section
frames with bolted moment connections. Engineering Structures, 10(17),
1995: 737-748
57. Dunai I, Fukumoto Y., Behaviour of steel-to-concrete connections under
combined axial force and cyclic bending. Journal of Constructional Steel
Research,36(2), 1996: 121-147
58. Bernuzzi C, Zandonini R, Zanon P., Experimental analysis and modelling
of semi-rigid steel joints under cyclic reversal loading. Journal of
Constructional Steel Research, 38(2), 1996: 95-123
59. Adey BT, Grondin GY, Cheng HR., Cyclic loading of end plate moment
connections. Canadian Journal of Civil Engineering, 4(27), 2000: 683-701
60. Yorgun C, Bayramoglu G., Cyclic tests for welded-plate sections with
end-plate connections. Journal of Constructional Steel Research, 57(12),
2001: 1309-1320
61. Simoes R, Silva LS., Cyclic behaviour of end-plate beam-to-column
composite joints. Steel and Composite Structures, 1(3),2001: 355-376
62. Dubina D, Ciutina A, Stratan A., Cyclic tests of double-sided beam-to-
column joints. Journal of Structural Engineering, ASCE, 127(2), 2001:
129-136
63. Sumner EA, Murray TM., Behavior of extended end-plate moment
connections subject to cyclic loading. Journal of Structural Engineering,
ASCE, 128(4),2002: 501-508
293
References
64. Grecea D, Stratan A, Ciutina A, Dubina D., Rotation capacity of MR
beam-to-column joints under cyclic loading. In: Connections in Steel
Structures V - Amsterdam - June 3-4, 2004: 141-154
65, Kovacs N, Cal ado L, Dunai L., Behaviour of bolted composite joints:
experimental study. Journal of Constructional Steel Research, 60, 2004:
725-738
66. Nogueiro P., Simoes da Silva L, Bento R, Simoes R., Experimental
behaviour of standardised European end-plate beam-to-column steel joints
under arbitrary cyclic loading. International Colloquium of Stability and
Ductility of Steel Structures.Lisbon, Portugal, 2006(6-6-8)
67. Shi G, Shi Y, Wang Y., Behaviour of end-plate moment connections under
earthquake loading. Engineering Structures, Vol. 29, No. I, 2007: 703-
716
68. Wang JF, Han LH., Hysteretic behaviour of flush end plate joints tor
concrete-filled steel tubular columns. Journal of Constructional Steel
Research (2009), 65(8-9), 2009: 1644-1663
69. Mirza 0, Uy B., Behaviour of composite beam-column flush end-plate
conriections subjected to low-probability, high-consequence loading.
Engineering Structures, 33(2), 2011: 647-662
70. Calado L, Castiglioni CA., Low cycle fatigue testing of semi-rigid beam-
to-column connections. Connections in Steel Structures III, edited by
Bjorhovde, Colson and Zandonini, Pergamon, New York, 1995: 371 -380
71. Ballio G, Cal ado L, Castiglioni CA., Low cycle fatigue behaviour of
structural steel members and connections. Fatigue and Fracture of
Engineering Materials and Structures, 20(8), 1997: 1129-1146
72. Bernuzzi C, Calado L, Castiglioni CA., Ductility and load carrying
capacity prediction of steel beam-to-column connections under cyclic
reversal loading. Journal of Earthquake Engineering, 1(2), 1997: 401-432
73. Plumier A, Agatino MR, Castellani A, Castiglioni CA, Chesi C.,
Resistance of steel connections to low-cycle fatigue. Proceeding of 11th
European Conference on Earthquake Engineering, ,1998: 317-335
294
References
74. Krawinkler H., Loading histories for cyclic tests in support of performance
assessment of structural components. The 3rd International Conference on
Advances in Experimental Structural Engineering, San Francisco, 2009
75. BS 5950-1: 2000. Structural use of steelwork in building Part 1: Code of
practice fro design - Rolled and welded sections. 2000
76. BS EN 10210-2:1997. Hot finished structural hollow sections of non-alloy
and fine grain structural steels. Tolerances, dimensions and sectional
properties. 1997
77. BS 4-1:1993. Structural steel sections Part 1: specification for hot-rolled
sections. 1993
78. ECCS. Technical Committee 1-structutal safety and loadings-technical
working group 1.3-seismic design, recommended testing procedure for
assessing the behaviour of structural steel elements under cyclic loads,
1986
79. EN 10002-1, Metallic materials - Tensile testing, Part 1: Method oftest at
ambient temperature. London: British Standards Institution, 2001
80. EN ISO 898-1, Mechanical properties of fasteners made of carbon steel
and alloy steel - Part 1: Bolts, screws and studs (ISO 898-1: 1999)"
81. Hicks SJ, Newman GM, Edwards M, Orton A., Design manual for SHS
concrete filled columns. British Steel Tubes & Pipes, 2002
82. Ryan JC., Evaluation of extended end-plate moment connections under
seismic loading. Virginia Polytechnic Institute and State University, USA,
in partial fulfilment of the requirements for Master of Science degree,
1999
83. Kovacs N, Calado L, Dunai L., Experimental and analytical studies on the
cyclic behaviour of end-plate joints of composite structural elements.
Journal of Constructional Steel Research, 64(2), 2008: 202-213
84. Guidelines for Cyclic Testing of Components of Steel Structures, ATC
Applied Technology Council, ATC-24, 1992
85. FEMA 356, Prestandard and Commentary for the Seismic Rehabilitation
of Buildings, Federal Emergency Management Agency, November 2000
295
References
86. Han LH, Yang YF., Cyclic Performance of Concrete-Filled Steel CHSColumns under Flexural Loading. Journal of Constructional Steel
Research, 61(4), 2005: 423-45287. Shannag MJ, Abu-Dyya N, Abu-Farsakh G., Lateral load response of high
perfonnence fibre reinforced concrete beam-column joints. Journal ofConstruction and Building Materials, 2005(19): 500-508
88. Park HG, Kwack JH, Jeon SW, Kim WK, Choi IR., Frame steel plate wallbehavior under cyclic lateral loading. Journal of Structural Engineering,
ASCE, 133(3),2007: 378-38889. Deierlein GG, Reinhorn AM, Willford MR., Nonlinear structural analysis
for seismic design-A guide for practicing engineers, National Institute ofStandards and Technology (NIST), U.S Department of Commerce, 2010
90. Bose B, Hughes AF., Verifying the performance of standard ductile
connections for semi-continuous steel frames. Proceedings of theInstitution of Civil Engineers, Structures and Buildings, 110, 1995: 441-
457.91. Thomson AW, Broderick BM., Earthquake resistance of flush end-plate
steel joints for moment frames. Proceedings of the Institution of Civil
Engineers Structures & Buildings, 152, Issue 2, 2002: 157-165.92. Fardis M, Carvalho A, Elnashai A. Faccioli E, Pinto P, Plumier A.,
Designers Guide to EN 1998-1 and EN 1998-5, Designers Guide to EN1998-1 and EN 1998-5. Eurocode 8: Design of Structures for EarthquakeResistance. General Rules, Seismic Action and Rules for Buildings,Foundations and Retaining Structures. 2005.
93. Powell GH, Allahabadi R., Seismic damage prediction by deterministicmethods: Concepts and procedures, Earthquake Engineering & Structural
Dynamics. 16(5), 1988: 719-734.
94. Castiglioni CA, Pucinotti., Failure criteria and cumulative damage models
for steel components under cyclic loading. Journal of Constructional Steel
Research. 65(4), 2009: 751-765.95. Cosenza E, Manfredi G., Ramasco R., The use of damage functionals in
earthquake engineering: a comparison between different methods .. Earthquake Engineering & Structural Dynamics. 22( 10), 1993: 855-868.
296
References
96. Cosenza E, Manfredi G., Damage indices and damage measures. Progress
in Structural Engineering and Materials, 2(1), 2000: 50-59
97. Williams MS, Sexsmith RG., Seismic Damage Indices for Concrete
Structures: A State of the Art Review. Earthquake Spectra, 11(2), 1995:
319-349
98. Miner MA., Cumulative damage in fatigue. Journal of Applied Mechanics,
12(3), 1945: 159-164.
99. Ballio G, Castiglioni CA., Unified approach for the design of steel
structures under low and high cycle fatigue. Journal of Constructional
Steel Research. 34(1), 1995: 75-101.
100. Krawinkler H, Zohrei M., Cumulative damage in steel structures
subjected to earthquake ground motions. Computers and Structures. 16( 1-
4), 1982: 531-541
101. Stephens JE, Yao ' JTP., Damage assessment using response
measurements. Journal of Structural Engineering, American Society of
Civil Engineers, 113(4), 1987: 787-801
102. Banon H, Biggs JM, Irvine HM., Seismic damage in reinforced concrete
frames. Journal of Structural Engineering, American Society of Civil
Engineers, 107(9), 1981: 1713-1729
103. Banon H, Veneziano D., Seismic safety of reinforced concrete members
and structures, Earthquake Engineering & Structural Dynamics. 10(2),
1982: 179-193
104. Darwin D, Nmai CK., Energy dissipation in RC beams under cyclic load.
Journal of Structural Engineering, American Society of Civil Engineers,
112(8), 1986: 1829-1846
105. Kraetzig WB, Meyer IF, Meskouris K., Damage evolution in reinforced
concrete members under cyclic loading. Proceedings of ICOSSAR 89,
the 5th International Conference on Structural Safety and Reliability, Part
I,August 7, 1989 - August 11, 1989: 795-802
106. park YJ, Ang AHS, Wen YK., Seismic damage analysis of reinforced
concrete buildings. Journal of Structural Engineering, American Society
of Civil Engineers, 111(4), 1985: 740-757
297
References
107. Kumar S,Usami T., An evolutionary-degrading hysteretic model for thin-
walled steel structures. Engineering Structures, 18(7), 1996: 504-514 '
,108. Altoontash A., Simulation and damage models for performance
assessment of reinforced concrete beam-column joints. Standford
University, United States, in partial fulfilment of the requirements for
Ph.D. degree. 2005
109. Palazzo B, Petti L, De Iuliis M., Reduction factors for performance based
seismic design of structures. Proceedings of the 13th World Conference
on Earthquake Engineering, 2004: 2286
110. Amziane S, Dube JF., Global RC structural damage index based on the
assessment of local material damage. Journal of Advanced Concrete
Technology, 6(3), 2008: 459-468
111. ANSYS@Academic Research, Release 12.1, Help System, Structural
Analysis Guide, ANSYS, Inc., 2009.112. ANSYS Parametric Design Language Guide, ANSYS, Inc., Canonsburg,
PA,2009
113. Zienkiewicz OC, Taylor RL., The finite element method for solid and
structural mechanics. Elsevier Ltd. 2006
114. Kazimi SMA., Solid Mechanics. Tata McGraw-Hili. 1982
115. Chen WF. Han DJ., Plasticity for structural engineering. Springer-Verlag
Publications, New York. 1988
116. Chen WF, Saleeb AF., Constitutive equations for engineering materials-
elasticity and modelling. Elsevier Ltd. 1994
117. Singh PN, Jha PK., Mechanics of Solids. John Wiley & Sons Inc. 1981
118. Lubliner J, Oliver J, Oller S, Onate E., A plastic-damage model for
concrete. International Journal of Solids and Structures, 25(3), 1989: 299-
326
119. Chen WF., Plasticity in Reinforced Concrete. McGraw-Hili, New York,
1982
120. William KJ, Warnke EP., Constitutive models for the triaxial behaviour
of concrete. Proceedings of the International Association for Bridge and
Structural Engineering, 19, 1975: 1-30
298
References
121. Dowling NE., Mechanical behaviour of materials, engineering methods
for deformation, fracture, and fatigue. New Jersey: Pearson Education,
Inc.,2007
122. Ho11ofastand Ho11obolt,Lindapter International, \.1K, 1995.
124. Pike D., Manual for the design of concrete building structures to
Eurocode 2. Institution of Structural Engineers, 2006
125. BS EN 1992, Eurocode 2: Design of concrete structures, Part 1-1-
General rules and rules for buildings. BSI, 1999.
126. Vasdravellis G, Valente M, Castiglioni CA., Behavior of exterior partial-
strength composite beam-to-column connections: Experimental study and
numerical simulations. Journal of constructional steel research, 65(1),
2009: 23-35
127. Kovacs N, Dunai L, Calado L., Prediction of the cyclic behaviour of
moment resistant beam-to-column joints of composite structural elements.
SDSS'Rio 2010 stability and ductility of steel structures, Rio de Janeiro,
Brazil, September 8-10, 20 I0
128. DO Carmo M., Differential Geometry of Curves and Surfaces. Prentice-
Hall,1976
129. Girao Coelho AM, Simoes Da Silva L, Bijlaard F., Characterization of
the nonlinear behaviour of single bolted T-stub connections. Proceedings
of the 5th International Workshop on connections, Connections in Steel
Structures, Behaviour, strength and design, Amsterdam, Netherlands ,2004
130. Bursi OS, Jaspart JP., Benchmarks for finite element modelling of bolted
steel connections. Journal of Constructional Steel Research, 43(1-3),
1997: 17-42
131. de Borst R, Remmers JJC, Needleman A, Abelian M-A., Discrete vs
smeared crack models for concrete fracture: bridging the gap.
International Journal for Numerical and Analytical Methods in
Geomechanics, 28(78), 2004: 583-607
132. Abdalla KM, Chen WF, Kishi N., Expanded Database of Semi-rigid Steel
Connections. Computers and Structures, 56(4), 1995: 553-564
299
References
133. Frye MJ, Morris GA., Analysis of flexibly connected steel frames.
Canadian Journal of Civil Engineers, 2(4), 1975: 280-291
134. Jones SW, Kirby PA, Nethercot DA., Effect of semi-rigid connections on
steel column strength. Journal of Constructional Steel Research, ICl),
1980: 38-46
135. Colson A, Louveau JM., Connections incidence on the inelastic
behaviour of steel structures. Proceedings of the Euromech Colloquium,
October, 1983: 174
136. Kishi N, Chen WF., Moment-rotation relations of semi-rigid connections
with angles. Journal of Structural Engineering, ASCE, 116(7), 1990:
1813-1834
137. Lui EM, Chen WF., Analysis and behaviour of flexibly jointed frames.
Engineering Structures, 8(2), 1986: 107-118
138. Wu FS, Chen WF., A design model for semi-rigid connections.
Engineering Structures, 12(2), 1990: 88-97
139. Richard RM, Abbott BJ., Versatile elastic-plastic stress-strain formula.
Journal of the Engineering Mechanics Division, ASCE, 101(4), 1975:
511-515
140. Ang KM, Morris GA., Analysis of three-dimensional frame with flexible
beam-column connections. Canadian Journal of Civil Engineering, 11,
1984: 245-254
141. Weynand K, Jaspart JP, Steenhuis M., The stiffness model of revised
Annex J of Eurocode 3. Connections in Steel Structures III behaviour
strength and design, Proceedings of the 3rd International workshop on
connections, Trento, Italy, May, 1995: 441-452
142. Wald F, Steenhuis M., The Beam-to-Column Bolted Joint Stiffness
according Eurocode 3, in Proceedings of the State of the Art, Workshop
1992-COSTCl, Strasbourg, 1993: 503-516
143. Dowling NE. Mechanical behaviour of materials. Engineering methods
for deformation, fracture, and fatigue, New Jersey: Pearson Education,
Inc,2007.
300
References /
144. Bjorhovde R, Colson A, Brozzetti J., Classification system for beam-to-
column connections. Journal of Structural Engineering, ASCE, 11, 1990:
3059-3076
145. Sinha BP, Gerstle KH, Tulin LG., Stress-strain relations for concrete
under cyclic loading, ACI Structural Journal, 61, 1964: 195-211
146. Karsan ID, Jirsa JO., Behavior of concrete under compressive loadings.
Journal of Structural Engineering, ASCE, 95(12), 1969: 2543-2563
147. Blakely RWG, Park R., Prestressed concrete sections with cyclic flexure.
Journal of Structural Engineering, ASCE, 99(8), 1973: 1717-1742
148. Darwin D, Pecknold DA., Analysis of cyclic loading of plane RIC
structures. Computer& Structures, 7(1),1977: 137-147
149. Yankelevsky DZ, Reinhardt HW., Model for cyclic compressive
behaviour of concrete. Journal of Structural Engineering, ASCE, 113(2),
1987: 228-240.
150. Mander JB, Priestley MJN, Park R., Theoretical stress-strain model for
confined concrete. Journal of Structural Engineering, ASCE, 114(8),
1988: 1804-1826.
151. Bahn BY, Hsu CT., Stress-strain behaviour of concrete under cyclic
loading. ACI Materials Journal, 95(2), 1998: 178-193.
152. Sima J, Climent Motins., Cyclic constitutive model for concrete.
Engineering Structures, 30(3), 2008: 695-706.
153. De Stefano M, De Luca A, Astaneh A., Modelling of Cyclic Moment-
Rotation Response of Double-Angle Connections. Journal of Structural
Engineering, ASCE, 120(1), 1994: 212-229~
154. Fang LB., The behaviour of SHS and T-stubs under cyclic loading.
University of Nottingham, United Kingdom, in partial fulfilment of the
requirements for MSC degree. 2010
155. Deng CO, Bursi OS, Zandonini R, A hysteretic connection element and
its applications. Computers and Structures, 78(1-3),2000: 93-110
156. ANSYS, Concrete suite-theory manual v12, ANSYS Inc., Canonsburg,
2009.
301
References
157. Krishnamurthy N, Graddy DE.,Correlation between 2D and 3D FE
analysis of steel bolted end-plate connections. Computer & Structures, (4-
5/6), 1976: 381-389.
158. Abolmaali A, Kukreti AR, Murray TM., Finite element analysis of two
tension bolt flush endplate connections. Research report No.
FSELIMBMA 84-0 I, Structural Engineering Laboratory, School of Civil
Engineering and Environmental Science, University of Oklahoma,
Norman, Oklahoma, 1984.
159. Gebbeken N, Rothert H, Binder B., On the numerical analysis of endplate
connections. Journal of Constructional Steel Research, 30(1), 1994:
17TC196.
160. Bahaari MR, Sherbourne AN., 3D simulation of bolted connections to
unstiffened columns: part 2: extended endplate connections. Journal of
Constructional Steel Research, 40(3), 1996: t 89··C224.161. Choi CK, Chung GT., Refined three-dimensional finite element model
for end-plate connections. Journal of Structural Engineering, ASCE,
122(11), 1996: 130TC 1316.
162. Bose B, Wang ZM, Sarkar S., Finite element analysis of unstiffened flush
end-plate steel-bolted joints. Journal of Structural Engineering, ASCE,
123(12), 1997: 1614··C1621.
163. Bursi OS, Jaspart JP., Basic Issues in the finite element simulation of
extended end plate connections. Computers & Structures, 69, 1998: 36 t .:
382.
164. Sumner EA., Unified design of extended endplate moment connections
subject to cyclic loading. Virginia Polytechnic Institute and State
University, USA, in partial fulfilment of the requirements for Ph.D.
degree. 2003.
165. Shi G, Shi Y, Wang Y, Bradford MA., Numerical simulation of steel
pretensioned bolted endplate connections of different types and details.
Engineering Structures, Vol. 30, No.1, 2008: 2677-2686.
166. Mazzolani FM., Mathematical Model for Semi-Rigid Joints Under Cyclic
Loads, in R. Bjorhovde et al. (eds) Connections in Steel Structures:
302
References
Behaviour, Strength and Design, Elsevier Applied Science Publishers,
London, 1988: 112-120.
167. Chui PPT, Chan SL., Transient response of moment-resistant steel frames
with flexible and hysteretic joints. Journal of Constructional Steel
Research, 39(3), 1996: 221··C243.
168. Bernuzzi C., Prediction of the behaviour of top-and-seat cleated steel
beam-to-column connections under cyclic reversal loading. Journal of
Earthquake Engineering, 2(1). 1998: 25-58.
169. Ibarra LF, Medina RA, Krawinkler H., Hysteretic models that incorporate
strength and stiffness deterioration. Earthquake Engineering and
Structural Dynamics, 2005(34): 1489-1511.
170. Chen WF., Practical Analysis for Semi-Rigid Frame Design. 2000: World
Scientific Publishing Co. Pte. Ltd.
303
Publications
PUBLICATIONS
Wang lY, Tizani W, Wang QY. FE analysis of the influence of column axial
load on the cyclic behavior of bolted endplate joint. In: Proceedings,
ICOSSAR2009, 10th International Conference on Structural Safety and
Reliability, Osaka, Japan, September 13-17,2009, eds. Furuta, Frangopol
& Shinozuka, Taylor & Francis Group, London, 200?: 2250-2257, CD.
Zhiyu Wang. Investigation on moment resisting connection to hollow section-
using modified blind bolts. In: Proceedings, YRC2009, 11th Young
Researcher's Conference, London, UK, 18th, March, 2009, The Institution
of Structural Engineers (IStructE), 2009: 49
Wang Zhiyu, Tizani Walid. Modelling techniques of composite joints under
cyclic loading. In Computing in Civil and Building Engineering,
Proceedings of the International Conference, W. TIZANI (Editor), 30
June-2 July, Nottingham, UK, Nottingham, University Press, Paper 254,
2010:507
Pitrakkos Theodoros, Tizani Walid, Wang Zhiyu. Pull-out behaviour of
anchored blind-bolt: a component based approach. In Computing in Civil
and Building Engineering, Proceedings of the International Conference,
W. TIZANI (Editor), 30 June-2 July, Nottingham, UK, Nottingham
University Press, Paper 255,2010: 509
Wang lY, Tizani W, Wang QY. Strength and initial stiffness of a blind-bolt
connection based on the T-stub model, Engineering Structures, 32(9),
2010: 2505-2517.
Wang ZY, Tizani W, Wang QY. Study on the initial stiffness of blind bolted
T-stub connections. In: Proc. 13th. International Symposium on Tubular
Structures, HongKong, 2010: 53-61.
Zhiyu Wang. Assessment of cyclic structural performance of an innovative
blind bolted connection to concrete filled steel tubular column. In:
Proceedings, YRC20 11, 2011 Young Researcher's Conference, London,
304

Publications
UK, 17th, March, 2011, The Institution of Structural Engineers (IStructE),
< 2011: 62
305

o§~.

wo-....I
CI.lc3::so...,__IVoo-'-"
-<o~::s,__IVoo.-'-"0'\330.~.~...Re
trl~::s0.o0.o::s0.'0
ri
>~.....ftIV::sUlo.--0>0.~o'C!::s00.a"'Oo --~.... ft
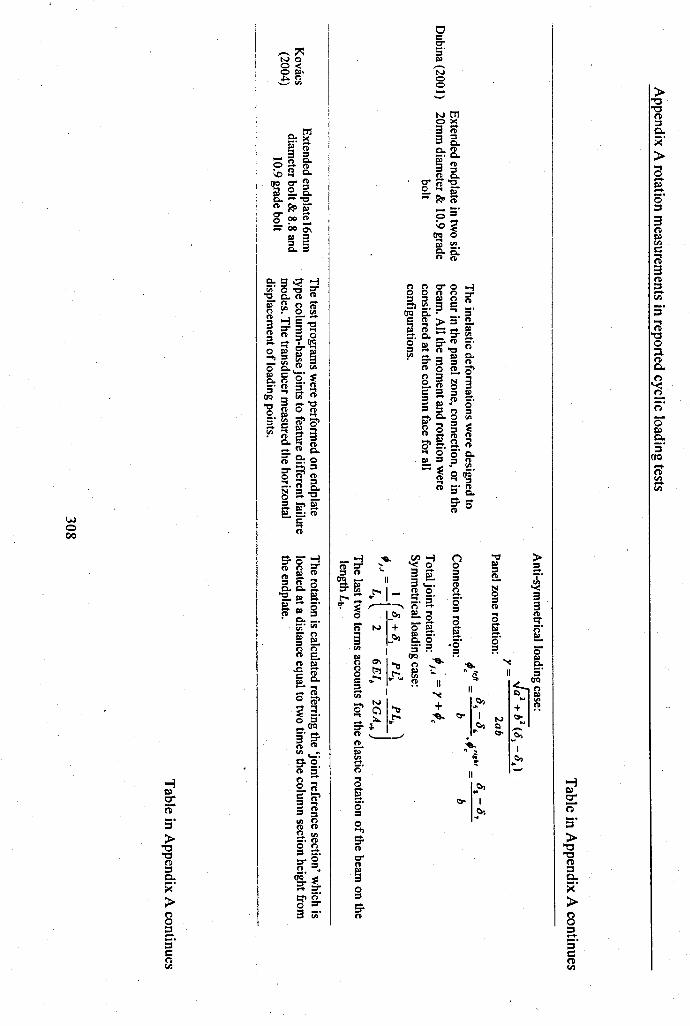
woCO
tn"""i o ~-e 0 0 ~3 [ ::I3,-. ::I a.~~ 0 II N:;- _. 0_. ::I o· ::In - ClIII .. ::I-0 (3
..-- 0~ §.. g. g:Q.O o·_. ::I ·0::I •• F! ?(IQ
n ... ....el ';: .-~ II
~"'I
II
+ ~J:~~ NQc:r.....,
1II
c:r t~
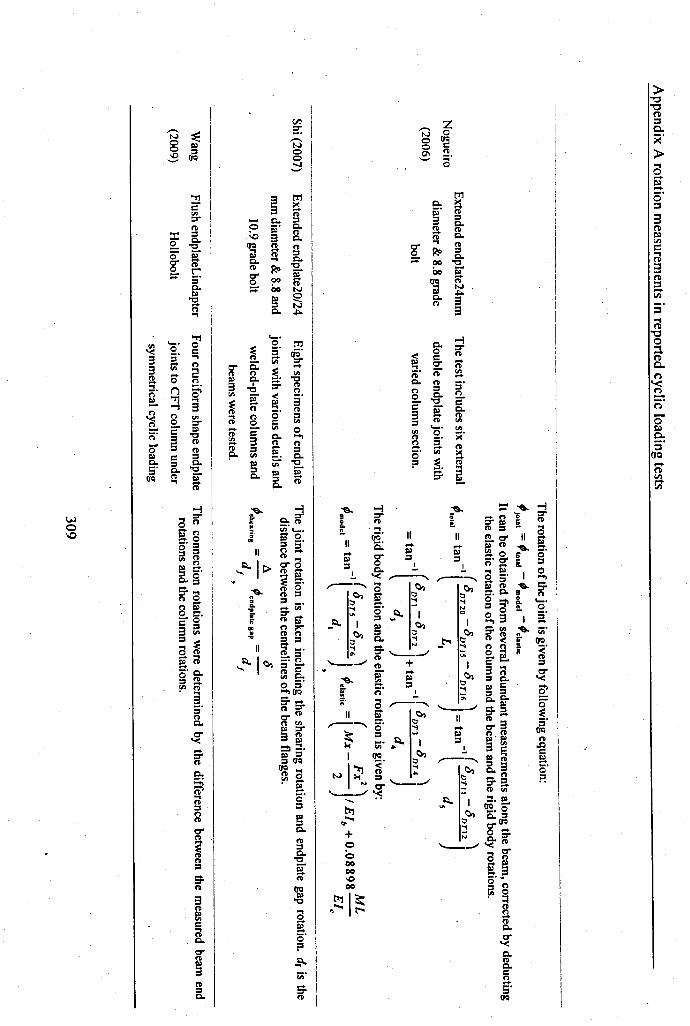
.....o~.0-q-l
,-..Noo~
tTl
~::sCoCl>CoCl>
5.00 "0
00 ~~ NCo "'"Cl> 3
3
Coiii'3~
Cl>n ::so .§-2' -3 ~::s ._.
os
~.......+o<=>0000\Q00
.~I~
._.o~:
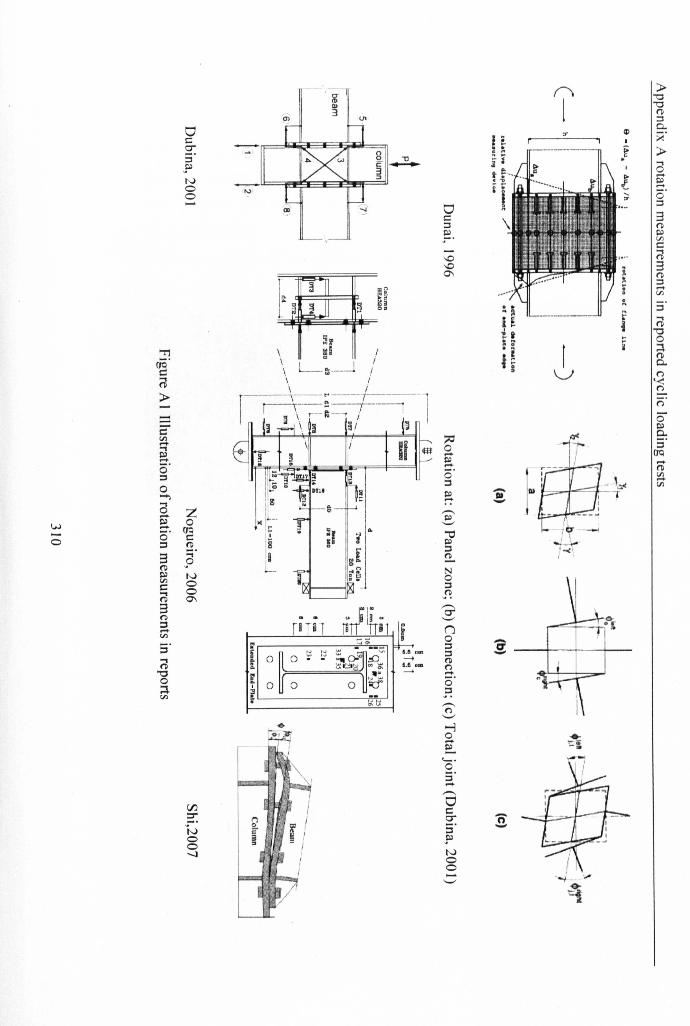
'T'JciCi'c:....(1)
>==2"Cl:>.........~......o·:::s0.....,....0 Z
w s- o.-+ fTQ
0 o· c::::s (1)
3::;.
(1)~o
~ IVCl:>c: 0.... 0(1) 0\3(1)
::s.....Cl:>
S'....(1)
"00~Cl:>
I ~ nl~~!..l ~I I
~f\ ~5 I
P Till JLfI.lS nm-4fI.ft 0111_.
I I B 1i ~'"
'0 '0 ~o:~ ~0 0 w ,~
go =D.. IL ~I~"'" ee ~
E 0 0I-.J·~
~0 ~
~D:
os:::::s~.
oo:::s:::s(1)o.....o·?,-,.o'-'-lo....III._.2.:::s.....,-,.cc::sr:::s~IVoo-'-'
r-. »I
"0"0(1):::s0..~'
»..,0.....~0':::s3(1)~Cl:>e....(1)
3(1):::s.....Cl:>..~~ f::s,~ ....(1)
1!. "0
= i 0. It~(1)0..
V (")
'<(")
(")
0"~
m0.S'
fTQ.....(1)
Dj 1.,..Cl:>- .....Cl:>
DI ,- II-
I~ ~. ..j
/=<l
a-
n-i
I'-f.- -'_"~j[
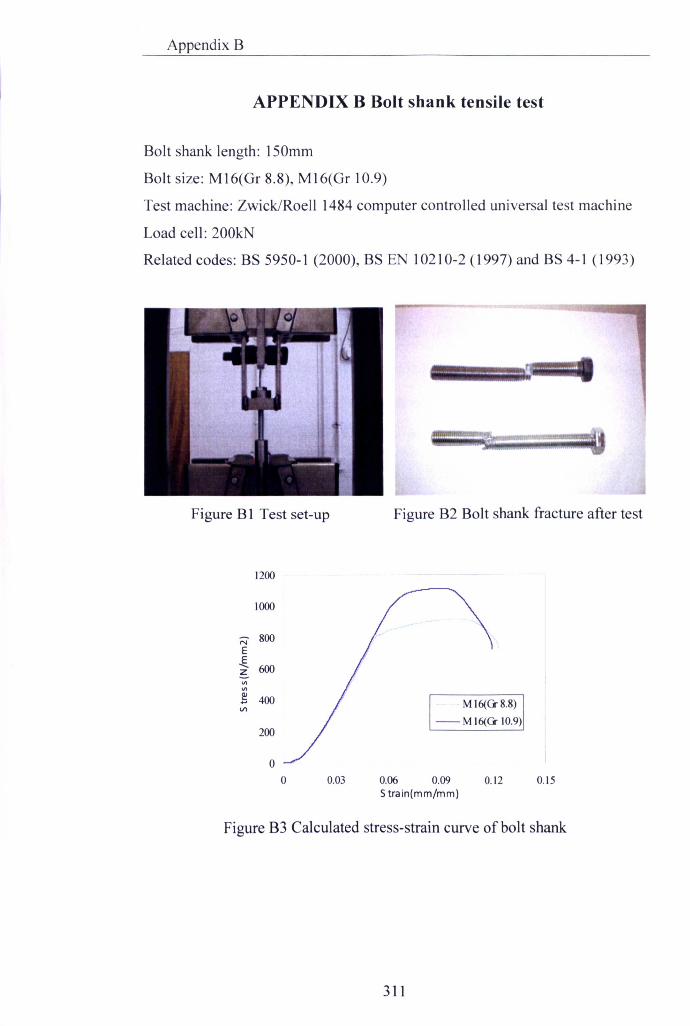
Appendix B
APPENDIX B Bolt shank tensile test
Bolt shank length: 150mm
Bolt size: M16(Gr 8.8), M16(Gr 10.9)
Test machine: Zwick/Roell 1484 computer controlled universal test machine
Load cell: 200kN
Related codes: BS 5950-1 (2000), BS EN 10210-2 (1997) and BS 4-1 (1993)
~..---..-.--
Figure B1 Test set-up Figure B2 Bolt shank fracture after test
1200
1000
N SOOE~ 600~VIVI
~ 400...III
200
00
M 16(Q-S.S)- M 16(Q- 10.9)
0.03 0.06 0.09 0.12S train(mm/mm)
0.15
Figure B3 Calculated stress-strain curve of bolt shank
311

Appendix C General yield and failure criteria for finite element analysis
APPENDIX C General yield and failure criteria for finite
element analysis
In general, the plasticity theory to predict the inelastic behaviour of metals
consists of three main concepts: a yield criterion (predicting the onset of
material inelastic response), a plastic flow rule (correlating the plastic strain
increments to stress increments under inelastic loading) and a hardening rule
(describing the changes of the yield surface due to plastic strains). Although
the brittle material is often known for different physical properties, the metal
plasticity theory based approaches are often used to model irreversible damage
under loads exceeding the elastic limit. The following subsection presents a
brief summary of theoretical basis in ANSYS related to the material yield and
failure criteria for finite element analysis.
The material yield criteria have been well documented in most solid
mechanics books (Kazimi et ai, 1982; Chen et ai, 1988). An emphasis herein
is given to the von Mises criterion and Drucker-Prager criterion. In the case of
multi-axial loading' condition, the material yielding is induced by the
combination of the stress components, including the hydrostatic pressure and
the deviatoric stress. Assuming the yield is independent of the hydrostatic
pressure and the solid is isotropic, yield only depend on the second invariants
of the deviatoric stress tensor, J2, which can be expressed in terms of the
principal stresses (0"1, 0"2, 0"3) as:
Equation Cl
or in terms ofthe stress tensor components (o"x, O"y, O"z, Txy, Txz, Tzy) as:
312

Appendix C General yield and failure criteria for finite element analysis
Equation C2
As physical interpretation of the von Mises yield criterion, the yielding begins
when the elastic energy of distortion reaches a critical value (Hencky, 1924)
and the octahedral shear stress reaches a critical value (Nadai, 1937),
corresponding to the maximum distortion strain energy criterion and the
maximum octahedral shear stress criterion respectively. The yield equation for
the von Mises condition can be expressed in a simple form as:
Equation C3
where, k is a critical value of the octahedral shear stress, which can be defined
as 3°·5times lower than the yield stress, CJ'e, from uni-axial tension test. The
von Mises yield condition can be expressed in a concise manner as follows:
Equation C4
or
Equation C5
The use of von Mises yield criteria has been extended to the study of concrete
under compressive stresses. As discussed in the book by Chen et al (1988), the
von Mises yield criteria based one-parameter models are generally used in
early finite element analyses. Due to relatively weak tensile capacity of
concrete, the criteria are usually supplemented by the maximum principal
stress surface or tension cut-offsurface. The typical yield surface of von Mises
yield criteria is shown in Figure Cl.
313
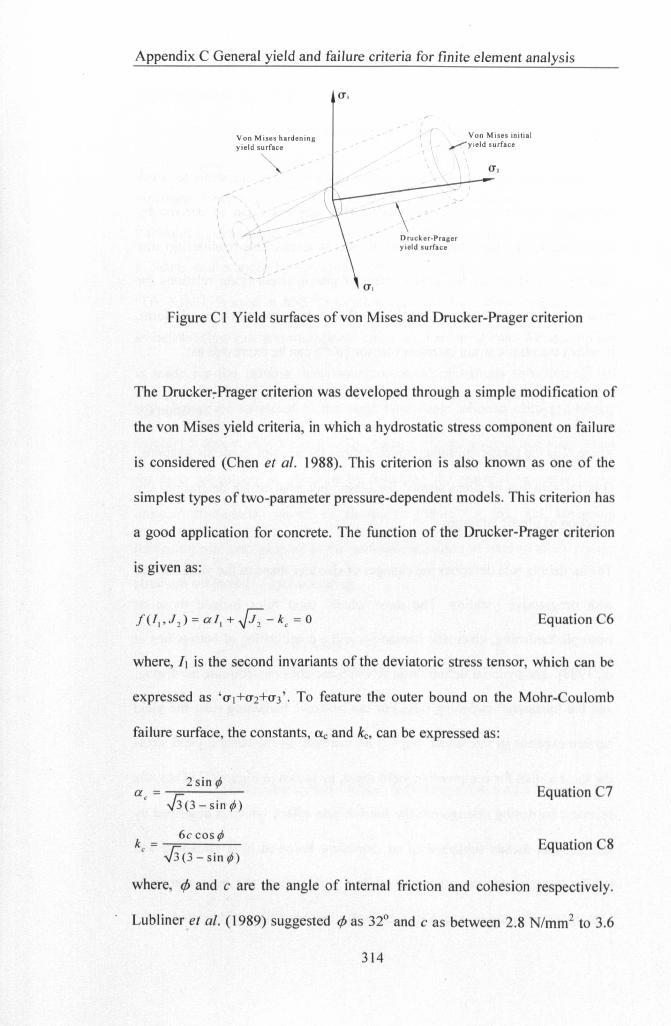
Appendix C General yield and failure criteria for finite element analysis
Von Mises hardeningyield surface-.
1 1 Von Mises initial'. \ ,.......yi.ld surface
\\
).-..4-.\--
\
\I
Drucker-Prageryield surface
II\
Figure Cl Yield surfaces of von Mises and Drucker-Prager criterion
The Drucker-Prager criterion was developed through a simple modification of
the von Mises yield criteria, in which a hydrostatic stress component on failure
is considered (Chen et al. 1988). This criterion is also known as one of the
simplest types of two-parameter pressure-dependent models. This criterion has
a good application for concrete. The function of the Drucker-Prager criterion
is given as:
Equation C6
where, II is the second invariants of the deviatoric stress tensor, which can be
expressed as '<1,+<12+<13'. To feature the outer bound on the Mohr-Coulomb
failure surface, the constants, ne and kc, can be expressed as:
2 sin f/Ja = --;::::-----
o J)(3-sinf/J)Equation C7
k = 6c cos¢c J)(3-sin¢)
Equation C8
where, if> and c are the angle of internal friction and cohesion respectively.
Lubliner et al. (1989) suggested if> as 32° and c as between 2.8 N/mm2 to 3.6
314
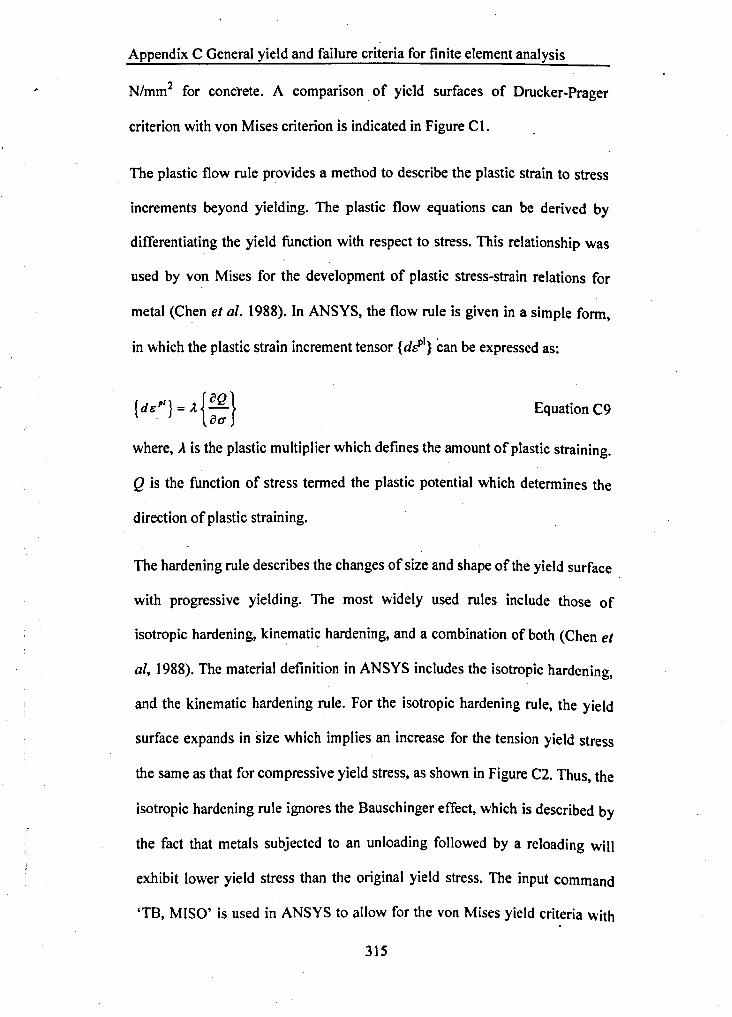
Appendix C General yield and failure criteria for finite element analysis
N/mm2 for concrete. A comparison of yield surfaces of Drucker-Prager
criterion with von Mises criterion is indicated in Figure Cl.
The plastic flow rule provides a method to describe the plastic strain to stress
increments beyond yielding. The plastic flow equations can be derived by
differentiating the yield function with respect to stress. This relationship was
used by von Mises for the development of plastic stress-strain relations for
metal (Chen et al. 1988). In ANSYS, the flow rule is given in a simple form,
in which the plastic strain increment tensor {dC'l} can be expressed as:
{deP'} = A{DQ}. DU
Equation C9
where, A is the plastic multiplier which defines the amount of plastic straining.
Q is the function of stress termed the plastic potential which determines the
direction of plastic straining.
The hardening rule describes the changes of size and shape of the yield surface
with progressive yielding. The most widely used rules include those of
isotropic hardening, kinematic hardening, and a combination of both (Chen et
ai, 1988). The material definition in ANSYS includes the isotropic hardening,
and the kinematic hardening rule. For the isotropic hardening rule, the yield
surface expands in size which implies an increase for the tension yield stress
the same as that for compressive yield stress, as shown in Figure C2. Thus, the
isotropic hardening rule ignores the Bauschinger effect, which is described by
the fact that metals subjected to an unloading followed by a reloading will
exhibit lower yield stress than the original yield stress. The input command
'TB, MISO' is used in ANSYS to allow for the von Mises yield criteria with
315
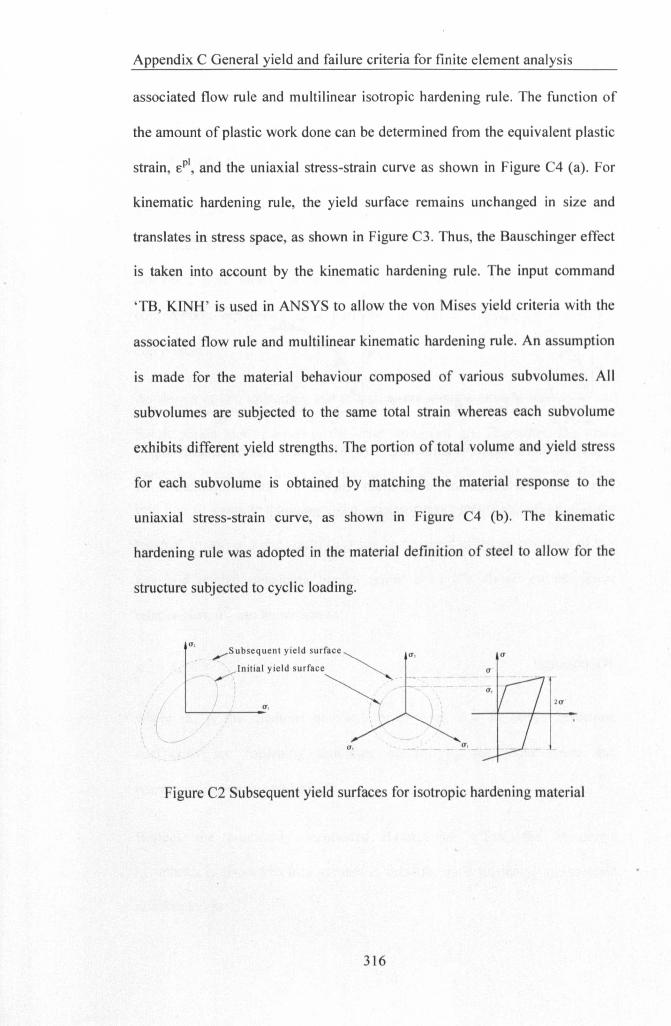
Appendix C General yield and failure criteria for finite element analysis
associated flow rule and multilinear isotropic hardening rule. The function of
the amount of plastic work done can be determined from the equivalent plastic
strain, cPl, and the uniaxial stress-strain curve as shown in Figure C4 (a). For
kinematic hardening rule, the yield surface remains unchanged in size and
translates in stress space, as shown in Figure C3. Thus, the Bauschinger effect
is taken into account by the kinematic hardening rule. The input command
'TB, KINH' is used in ANSYS to allow the von Mises yield criteria with the
associated flow rule and multilinear kinematic hardening rule. An assumption
is made for the material behaviour composed of various subvolumes. All
subvolumes are subjected to the same total strain whereas each subvolume
exhibits different yield strengths. The portion of total volume and yield stress
for each subvolume is obtained by matching the material response to the
uniaxial stress-strain curve, as shown in Figure C4 (b). The kinematic
hardening rule was adopted in the material definition of steel to allow for the
structure subjected to cyclic loading .
.,......Subsequent yield surface
Initial yield surface~r:) '
cr, cr
Figure C2 Subsequent yield surfaces for isotropic hardening material
316
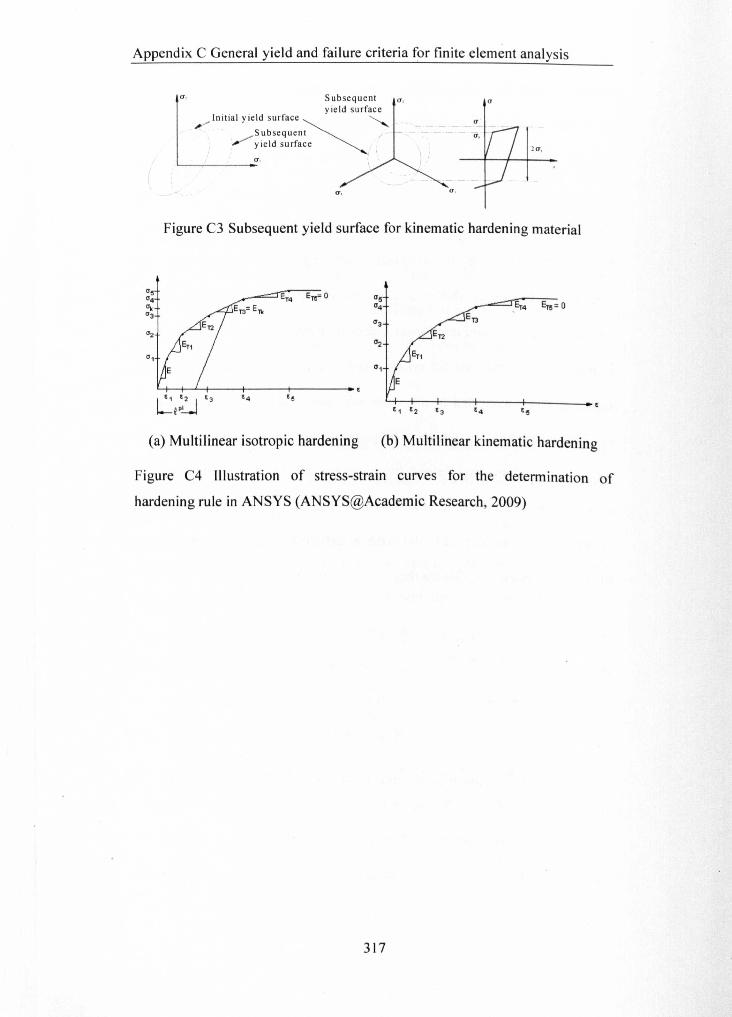
Appendix C General yield and failure criteria for finite element analysis
a, Subsequent a,Yield surface
/lnltlal Yield surface ~~Subsequent ,-
.............y ie ld surfaceI , ) :a,
Cl
z c,
a..
Figure C3 Subsequent yield surface for kinematic hardening material
"e Er4 Ere= 0 "e"4 Er4 Ere= 0"" "4"3
"3"2 ET2
(12
","1
L~ '3 '4 'e~PI " '2 '3 '4 "e
(a) Multilinear isotropic hardening (b) Multilinear kinematic hardening
Figure C4 £llustration of stress-strain curves for the detennination of
hardening rule in ANSYS (ANSYS@Academic Research, 2009)
317
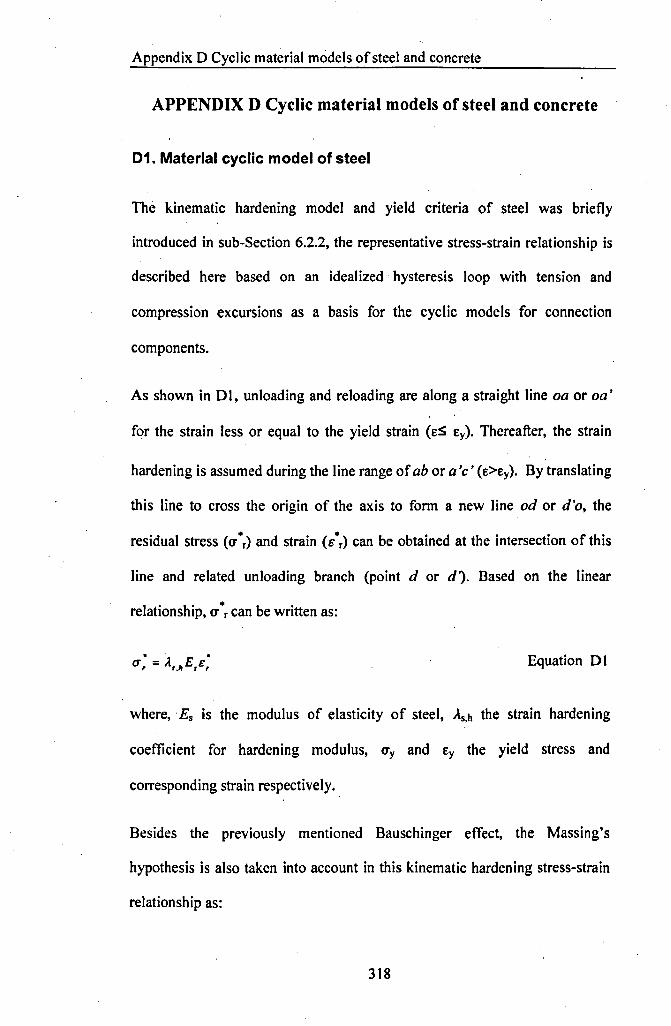
Appendix 0 Cyclic material models of steel and concrete
APPENDIX D Cyclic material models of steel and concrete
01. Material cyclic model of steel
The kinematic hardening model and yield criteria of steel was briefly
introduced in sub-Section 6.2.2, the representative stress-strain relationship is
described here based on an idealized hysteresis loop with tension and
compression excursions as a basis for the cyclic models for connection
components.
As shown in 01, unloading and reloading are along a straight line oa or oa'
for the strain less or equal to the yield strain (ES Ey). Thereafter, the strain
hardening is assumed during the line range of ab or a'e' (E>Ey). By translating
this line to cross the origin of the axis to form a new line od or d '0, the
residual stress (0'·r)and strain (/r) can be obtained at the intersection of this
line and related unloading branch (point d or d). Based on the linear
relationship, 0' '"r can be written as:
Equation 01
where,Es is the modulus of elasticity of steel, AS.h the strain hardening
coefficient for hardening modulus, ay and Ey the yield stress and
corresponding strain respectively.
Besides the previously mentioned Bauschinger effect, the Massing's
hypothesis is also taken into account in this kinematic hardening stress-strain
relationship as:
318
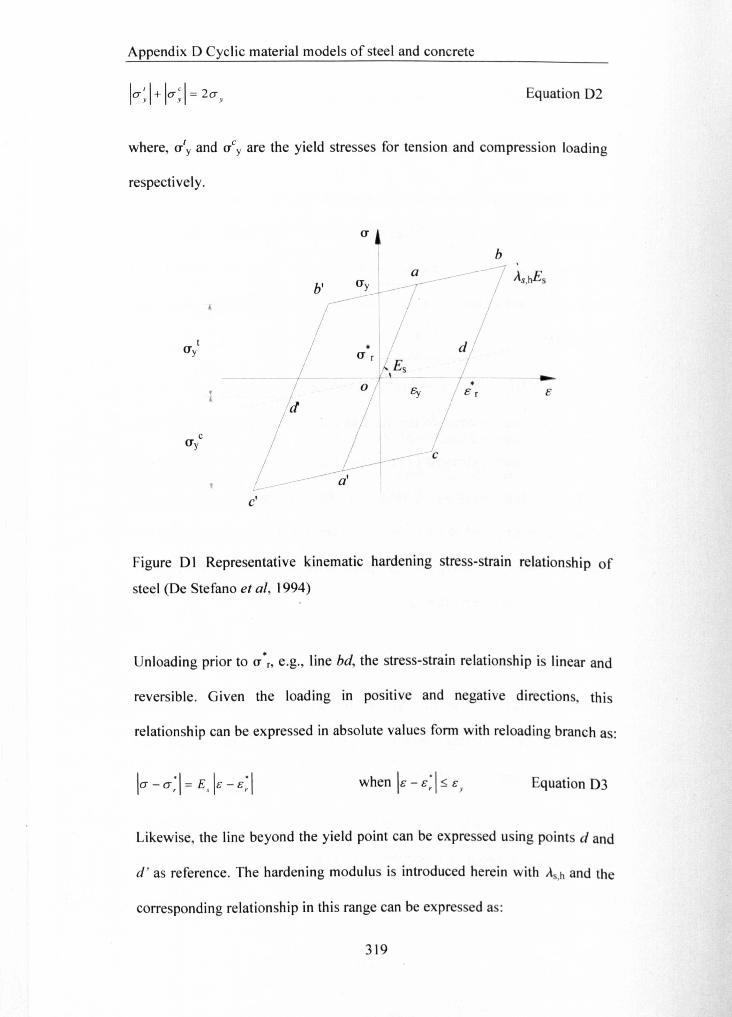
Appendix D Cyclic material models of steel and concrete
Equation 02
where, aty and aCyare the yield stresses for tension and com press ion load ing
respectively.
a
b
tay
-•Br B
cay
C'
Figure D1 Representative kinematic hardening stress-strain relationship of
steel (De Stefano et al, 1994)
Unloading prior to aor, e.g., line bd, the stress-strain relationship is linear and
reversible. Given the loading in positive and negative directions, this
relationship can be expressed in absolute values form with reloading branch as:
la -a:1 = E, 1£-£:1 when 1£- e 'I ~ er y Equation 03
Likewise, the line beyond the yield point can be expressed using points d and
d' as reference. The hardening modulus is introduced herein with As,h and the
corresponding relationship in this range can be expressed as:
319
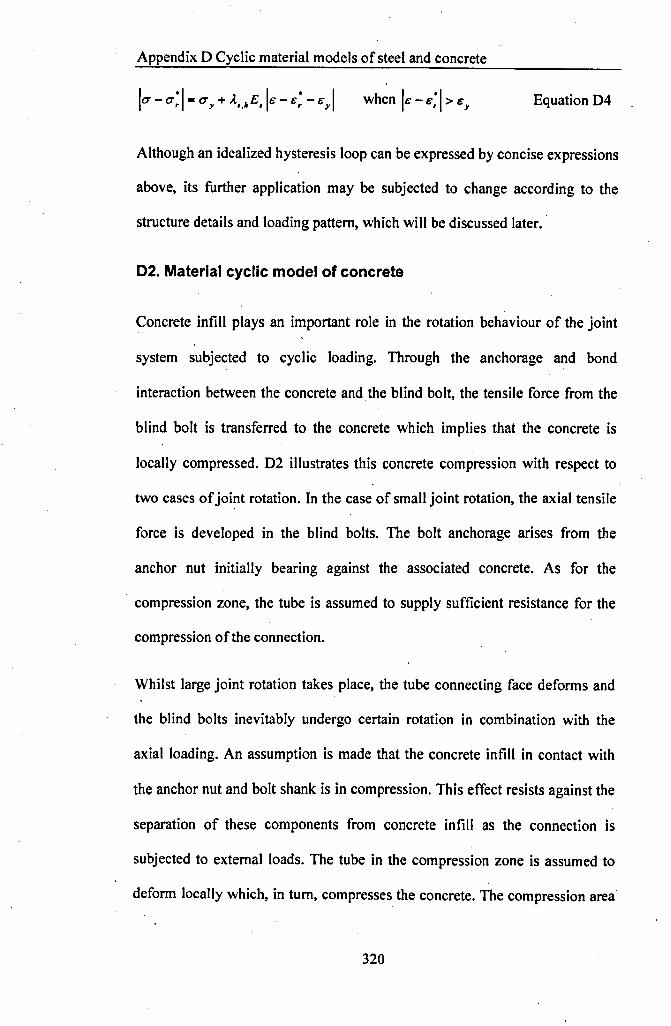
Appendix 0 Cyclic material models of steel and concrete
Equation 04
Although an idealized hysteresis loop can be expressed by concise expressions
above, its further application may be subjected to change according to the
structure details and loading pattern, which will be discussed later..
02. Material cyclic model of concrete
Concrete infill plays an important role in the rotation behaviour of the joint
system subjected to cyclic loading. Through the anchorage and bond
interaction between the concrete and the blind bolt, the tensile force from the
blind bolt is transferred to the concrete which implies that the concrete is
locally compressed. D2 illustrates this concrete compression with respect to
two cases of joint rotation. In the case of small joint rotation, the axial tensile
force is developed in the blind bolts. The bolt anchorage arises from the
anchor nut initially bearing against the associated concrete. As for the
. compression zone, the tube is assumed to supply sufficient resistance for the
compression of the connection.
Whilst large joint rotation takes place, the tube connecting face deforms and
the blind bolts inevitably undergo certain rotation in combination with the
axial loading. An assumption is made that the concrete infill in contact with
the anchor nut and bolt shank is in compression. This effect resists against the
separation of these components from concrete infill as the connection is
subjected to external loads. The tube in the compression zone is assumed to
deform locally which, in tum, compresses the concrete. The compression area
320
Appendix 0 Cyclic material models of steel and concrete
can also be considered with force transferring via a I to I dispersion though
the stiff endplate to the tube connecting face.
Stiff compression
Initial bearing
Front compression
(a) Small joint rotation case (b) Large joint rotation case
Figure 02 Assumed concrete compression with joint rotation
The cyclic stress-strain model of concrete has been investigated by many
researchers (Sinha et aI, 1964; Karsan & Jirsa, 1969; Blakeley & Park, 1973;
Yankelevsky & Reinhardt, 1987; Mander et aI, 1988; Bahn & Hsu, 1998·,
Sima & Climent-Molins, 2008). It was felt that the general knowledge of
loading and unloading relationships of these models could be extended in this
study to allow for the contribution of the concrete to the response of the
connection.
Based on the uniaxial reversed-cyclic loading tests, simplifications have been
made in early concrete models to use similar monotonic stress-strain curves
for envelope curves. As shown in 03, the experimental curve reported by
Sinha et al (1964) illustrates the locus of common points which control the
concrete degradation under loading cycles. There are two limits related to
common points. The reloading portion of any cycle crosses the unloading
portion may be defined as a stability limit. As the loads increase above this
321

Appendix D Cyclic material models of steel and concrete
limit and peak stress maintained between cycles, further permanent stain may
accumulate. On the other hand, the maximum stress at which a reloading curve
intersect the original unloading curve may be taken as common limit. With
these two limits, the common point can be adjusted with regard to the
envelope curve to control the cycle numbers leading to failure. Besides these
common points, Darwin & Pecknold (1977) suggested the locus of turning
points which control the energy dissipation, i.e., the lower the turning point,
. the greater the energy dissipated at a cycle.
A simplified concrete model proposed by Blakeley & Park (1973) is adopted
here to form the hysteretic stress-strain curve. As shown in 03, all the loading
and unloading branches are plotted by a series of straight lines. If the
maximum concrete strain, E, is less than strain corresponding to peak stress
(fc~, Eo. then the unloading and reloading is assumed to take place in linear
relationship with a slope equal to the modulus of elasticity, Ec (e.g., straight
line ed). This also means that no stiffness deterioration and energy dissipation.
The tensile loading is incorporated in this curve from point d to pointf if there
is no presence of concrete crack, otherwise, the stress will return to point d
before a new cycle for compression.
If E is greater than Eo. consecutive stiffness deterioration and energy
dissipation is accounted for by the introduction of the reduction factor, Ar,
varying from 0.1 to 0.8 as:
A.I = 0.8 _ 0.7(&cm - &0) ~ 0.1&20. - &0
Equation 05
322
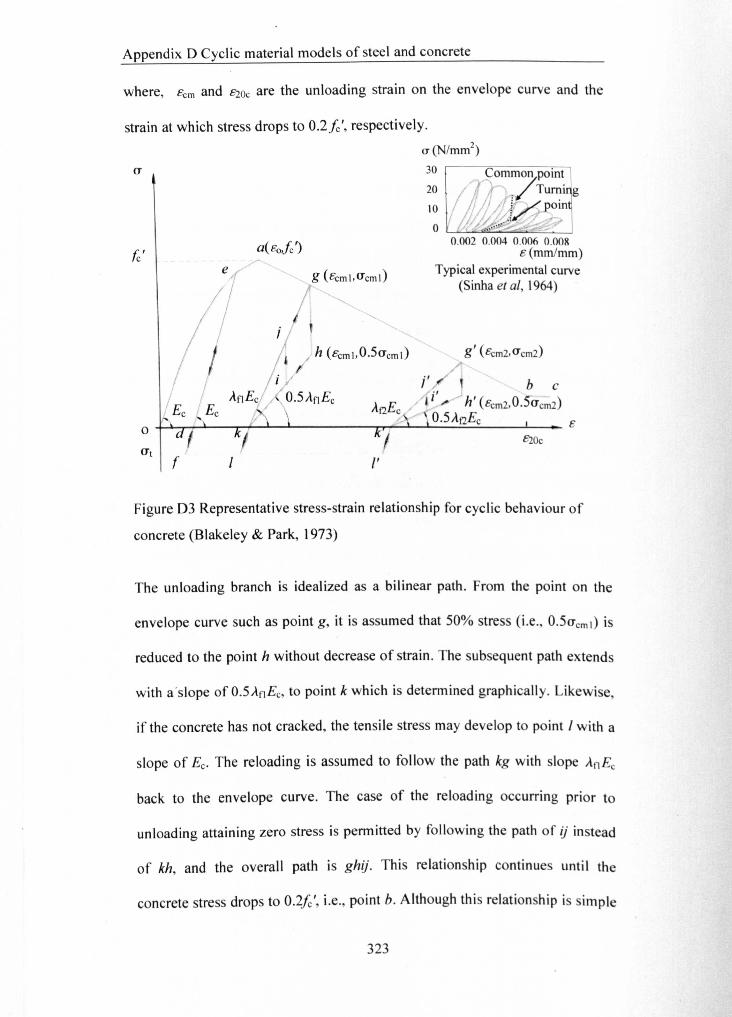
Appendix D Cyclic material models of steel and concrete
where, Sern and S20c are the unloading strain on the envelope curve and the
strain at which stress drops to O.2!c', respectively.
a (N/mm2)
o 30 ,-----,-----,--,
2010
o '-"'-'-""~"O;::O'=_.:E::::::::....__.J
fe'0.002 0.004 0.006 O.OO!!
s(mm/mm)Typical experimental curve
(Sinha et aI, 1964)
t:'20ccrt
['
Figure D3 Representative stress-strain relationship for cyclic behaviour of
concrete (Blakeley & Park, 1973)
The unloading branch is idealized as a bilinear path. From the point on the
envelope curve such as point g, it is assumed that 50% stress (i.e., O.5crern r) is
reduced to the point h without decrease of strain. The subsequent path extends
with aslope of O.5AflEc, to point k which is determined graphically. Likewise,
if the concrete has not cracked, the tensile stress may develop to point I with a
slope of Ec. The reloading is assumed to follow the path kg with slope AfiEc
back to the envelope curve. The case of the reloading occurring prior to
unloading attaining zero stress is permitted by following the path of ij instead
of kh, and the overall path is ghij. This relationship continues until the
concrete stress drops to O.2!c', i.e., point b. Although this relationship is simple
323

Appendix D Cyclic material models of steel and concrete
in expression, its good applicability not only for concrete but also for the case
with adding effect of steel or reinforcement which was also reported in the
literature.
324