the transcription factor batf operates as an essential differentiation checkpoint in early effector...
TRANSCRIPT

The transcription factor BATF operates as an essentialdifferentiation checkpoint in early effector CD8+ T cells
Makoto Kurachi1,2,*, R. Anthony Barnitz3,*, Nir Yosef5, Pamela M. Odorizzi1,2, Michael A.Dilorio3, Madeleine E. Lemieux6, Kathleen Yates3, Jernej Godec3, Martin G. Klatt3, AvivRegev5,7, E. John Wherry1,2,#, and W. Nicholas Haining3,4,5,#
1Department of Microbiology University of Pennsylvania Perelman School Medicine, Philadelphia,PA, USA
2Institute for Immunology, University of Pennsylvania Perelman School Medicine, Philadelphia,PA, USA
3Department of Pediatric Oncology, Dana-Farber Cancer Institute Children’s Hospital, HarvardMedical School, Boston, MA, USA
4Division of Hematology/Oncology, Children’s Hospital, Harvard Medical School, Boston, MA,USA
5Broad Institute of MIT and Harvard, 7 Cambridge Center, Cambridge, MA, USA
6Bioinfo, Plantagenet, Ontario, Canada
7Howard Hughes Medical Institute, Department of Biology, Massachusetts Institute ofTechnology, Cambridge, MA, USA
Abstract
The transcription factor BATF is required for interleukin 17 (IL-17)-producing helper T cell
(TH17) and follicular helper T cell (TFH) differentiation. Here, we show that BATF also has a
fundamental role in regulating effector CD8+ T cell differentiation. BATF-deficient CD8+ T cells
show profound defects in effector expansion and undergo proliferative and metabolic catastrophe
early after antigen encounter. BATF, together with IRF4 and Jun proteins, binds to and promotes
early expression of genes encoding lineage-specific transcription-factors (T-bet and Blimp-1) and
cytokine receptors, while paradoxically repressing genes encoding effector molecules (IFN-γ and
granzyme B). Thus, BATF amplifies TCR-dependent transcription factor expression and augments
#These authors contributed equally. Address correspondence to E.J.W. ([email protected]) or W.N.H.([email protected]).*These authors contributed equally.Author contributionsM.K. and P.O. performed the experiments in the animal models; R.A.B, M.A.D., K.Y., J. G. and M.G.K. performed the geneexpression and ChIP experiments; N.Y. and M.E.L. designed and performed analytic experiments; A.R., W.N.H. and E.J.W. designedthe analytic experiments; W.N.H and E.J.W conceived the project; M.K., R.A.B., E.J.W. and W.N.H. wrote the paper.
Accession CodesData have been deposited in Gene Expression Omnibus (GEO) with the following accession codes: GSE54191 (ChIP-Seq) andGSE54215 (gene expression).
Competing financial interestsThe authors declare no competing interests.
NIH Public AccessAuthor ManuscriptNat Immunol. Author manuscript; available in PMC 2014 October 01.
Published in final edited form as:Nat Immunol. 2014 April ; 15(4): 373–383. doi:10.1038/ni.2834.
NIH
-PA
Author M
anuscriptN
IH-P
A A
uthor Manuscript
NIH
-PA
Author M
anuscript

inflammatory signal propagation but restrains effector gene expression. This checkpoint prevents
irreversible commitment to an effector fate until a critical threshold of downstream transcriptional
activity has been achieved.
Upon activation by antigen, costimulation and inflammation, naive CD8+ T cells initiate a
program of clonal expansion and differentiation resulting in wide-spread changes in
expression of genes involved in cell-cycle, metabolism, effector function, apoptosis, and
homing1, 2, 3, 4. This large-scale transcriptional reprogramming results in irreversible and
heritable alterations in the function of the cell and in the fate of its progeny.
Several transcription factors (TFs) including T-bet, Eomes, Runx3, Id2 and Blimp-1 are
known to regulate the expression of genes essential for CD8+ effector T cells such as IFN-γand perforin5, 6, 7. However, CD8+ T cells that lack T-bet, Eomes, Id2 or Blimp-1 acquire
many features of normal effector T cells and are competent to form T cell
memory8, 9, 10, 11, 12, 13. One interpretation of these relatively mild defects in single
transcription factor (TF)-deficient settings is that functional redundancy exists between TFs
known to be involved in CD8+ effector differentiation. Alternatively, or in addition, other
TFs may exist that are upstream and/or more fundamental to the regulation of CD8+ T cell
differentiation.
Basic leucine zipper transcription factor ATF-like (BATF) is a bZIP transcription factor that
plays an important role in regulating differentiation and function in many lymphocyte
lineages14, 15, 16, 17, 18. In the CD8+ T cell lineage, increased expression of BATF in
exhausted CD8+ T cells suppresses their effector function19. In the CD4+ T cell lineage,
BATF is required for the differentiation of interleukin 17 (IL-17)-producing helper T cells
(TH17)14, where it binds co-operatively with the transcription factor IRF420, 21, 22 and its
dimerization partners c-Jun, JunB and JunD18. BATF is also important for the development
of follicular helper T cells (TFH) by regulating the transcription factors Bcl-6 and c-
Maf15, 16. In addition, BATF is required for class-switch recombination in B cells and to
regulate activation-induced cytidine deaminase16 as well as DNA damage checkpoint in
hematopoietic stem cell (HSC) self-renewal23. Chromatin immunoprecipitation and high-
throughput sequencing (ChIP-Seq) studies in TH17 cells suggest that BATF may play a
critical role in regulating the expression of many lineage-specific genes in concert with other
TFs, possibly by functioning as a ‘pioneer factor’ that nucleates transcriptional complexes at
key regulatory regions22. The role of BATF in effector CD8+ T cell differentiation, in
contrast, is not fully understood.
Here, we show that BATF is a central regulator of early effector CD8+ T cell differentiation.
CD8+ T cells that lack BATF have a profound inability to undergo normal naive to effector
differentiation and proliferative expansion. ChIP-Seq and transcriptional profiling studies
showed that BATF bound to and/or promoted expression of key transcriptional regulators of
effector differentiation (T-bet, Blimp-1, Runx3), cytokine receptors and their signal
transducers (e.g. IFNAR, IL-12R, IL-2R, STATs). However, BATF also repressed many of
the genes encoding effector molecules downstream of these transcription factors and
cytokine signaling pathways (IFN-γ and granzyme B). The absence of BATF resulted in a
near complete collapse in effector CD8+ T cell differentiation shortly after activation and
Kurachi et al. Page 2
Nat Immunol. Author manuscript; available in PMC 2014 October 01.
NIH
-PA
Author M
anuscriptN
IH-P
A A
uthor Manuscript
NIH
-PA
Author M
anuscript

this collapse was associated with major defects in cellular metabolism, proliferation, and
survival pathways. The dual role of BATF in upregulating effector transcription factors
while restraining effector molecule expression may provide a regulatory circuit that sets the
threshold for commitment to an effector CD8+ T cell fate.
Results
BATF is required for CD8+ T cell effector differentiation
BATF expression is upregulated in effector CD8+ T cells responding to lymphocytic
choriomeningitis virus (LCMV) infection and remains elevated in memory CD8+ T cells
compared to naive CD8+ T cells 19. We therefore asked whether BATF played a role in
regulating the CD8+ T cell response in vivo. We infected BATF knockout (Batf−/−), BATF
heterozygous (Batf+/−), and wild-type mice with the Armstrong (Arm) strain of LCMV that
initiates an acute infection and tracked the resulting CD8+ T cell response to the LCMV
gp33 epitope using tetramers. We found significantly fewer LCMV Db gp33-specific CD8+
T cells in Batf−/− mice compared with Batf+/− or wild-type mice (Fig. 1a and b) at th e peak
of the effector response (day 8 post-infection [d8 p.i.], **P<0.01) as well as at later time
points (d15, d22 and d40 p.i.). This finding was not due to altered distribution as we found a
similar decrease in cell numbers in the spleen and other organs (Fig. 1c and data not shown).
The phenotype of naive CD8+ T cells in Baft−/− mice appeared similar to wild-type cells
(data not shown), and thymic development has been reported to be unperturbed in the
absence of Batf14. These results suggested a defect in the activation and differentiation of
effector CD8+ T cells without BATF.
Batf−/− effector CD8+ T cells displayed a CD27loCXCR3loKLRG1hiCD127lo phenotype
(Supplementary Fig. 1a), and sustained higher granzyme B protein expression in the
memory phase (Supplementary Fig. 1b), which taken together is consistent with a more
activated and/or terminally differentiated phenotype3, 7. However, protein expression of both
T-bet and Eomes was decreased in Batf−/− CD8+ T cells (Supplementary Fig. 1c),
suggesting that the increase in KLRG1+ effector or memory Batf−/− CD8+ T cells was not
simply due to a sustained increase in T-bet and/or Eomes10. The defect in effector T cell
generation following LCMV infection was not limited to CD8+ T cells. We found that the
virus-specific CD4+ T cell response was also severely diminished in Batf−/− animals
(Supplementary Fig.1d-g). These defects in primary T cell responses resulted in a major
defect in viral control as mice lacking BATF failed to contain LCMV Arm replication in
vivo (Fig. 1d). Thus, loss of BATF resulted in severely defective effector CD8+ and CD4+ T
cell clonal proliferation and altered effector differentiation.
BATF is required in a CD8+ T cell-intrinsic fashion
BATF is involved in multiple immune cell lineages17 and it is unclear whether the effector
CD8+ T cell defects described above were due to an intrinsic role of BATF or secondary
effects of failed viral control. To directly test whether the requirement for BATF in effector
CD8+ T cell differentiation was cell intrinsic, congenically distinct Batf−/− and wild-type
P14 CD8+ T cells (specific for the LCMV gp33 epitope presented on H-2Db) were
adoptively transferred at 1:1 ratio into naive wild-type recipients. One day later, the mice
Kurachi et al. Page 3
Nat Immunol. Author manuscript; available in PMC 2014 October 01.
NIH
-PA
Author M
anuscriptN
IH-P
A A
uthor Manuscript
NIH
-PA
Author M
anuscript

were infected with LCMV Arm. The naive Batf−/− and wild-type P14 CD8+ cells were
phenotypically similar at transfer (Supplementary Fig. 2a). However, by d8 p.i., the number
of Batf−/− P14 effector CD8+ T cells was profoundly decreased (up to 400 fold) compared
with wild-type P14 cells (Fig. 2a). The ratio of Batf−/− to wild-type P14 cells was relatively
stable following the effector phase (d8 p.i.) through long-term memory (d200+ p.i.),
suggesting that the critical requirement for BATF was in initial effector differentiation and
clonal proliferation (Fig. 2b). We excluded rejection of Batf−/− CD8+ T cells as a cause for
the cell loss by transferring Batf−/− and wild-type P14 cells into lympho-replete hosts in the
absence of infection and found equivalent persistence of both types of cells over 40 days
(Supplementary Fig. 2b). The decrease in Batf−/− P14 effector CD8+ T cell clonal
proliferation was not a result of competition with wild-type P14 cells or skewed tissue
distribution because individual adoptive transfer of wild-type versus Batf−/− P14 cells into
separate recipient mice gave similar results, and the reduced frequency of Batf−/− P14 cells
was consistent in multiple lymphoid and non-lymphoid organs at both the effector and
memory phase (Supplementary Fig. 3a-c). In addition, the response of Batf+/- P14 cells was
nearly identical to wild-type P14 cells, suggesting that sufficient expression of BATF for an
optimal CD8+ T cell response can be achieved in the absence of one allele of Batf
(Supplementary Fig. 3a and b).
We observed a similar defect in effector CD8+ T cell differentiation for Batf−/− P14 cells in
Listeria monocytogenes infection or immunization with peptide-pulsed dendritic cells
(Supplementary Fig. 4), indicating that the requirement for BATF in effector CD8+ T cell
differentiation is not limited to LCMV infection. The difference in Batf−/− P14 cell
responses between LCMV versus LM infection or DC immunization may be due to the
greater signal strength and/or antigen dose during LCMV infection, consistent with recent
observations on the role of IRF4 in regulating interpretation of TCR signal strength24. In
addition, modulating inflammation did not overcome loss of BATF suggesting that the
phenotype was either independent or upstream of inflammatory signaling (Supplementary
Fig. 4d-f). Thus, the defects in effector CD8+ T cell responses in the absence of BATF were
cell intrinsic and profound.
We next examined the phenotype and function of effector CD8+ T cells generated in the
absence of BATF in the mixed P14 chimeras. We found that Batf−/− effector CD8+ T cells
showed a higher frequency of CD127hiKLRG1lo memory precursors10 compared to their
wild-type counterparts (Fig. 2c), suggesting that the KLRG1hi phenotype upon direct
infection of Batf−/− mice was due to prolonged viral infection and/or CD8+ T cell extrinsic
effects (Fig. 1d and Supplementary Fig. 1a). However, while Batf−/− and wild-type effector
P14 cells showed similar granzyme B expression, the few Batf−/− effector P14 cells
remaining at d8 p.i. produced less IFN-γ, TNF, and IL-2 upon restimulation (Fig. 2d)3,
suggesting altered functionality of effector CD8+ T cells lacking BATF. To examine the
underlying mechanisms that account for the altered differentiation of the surviving Batf−/−
P14 cells, we analyzed T-bet, Eomes and IRF4 expression. At d8 p.i., virus-specific effector
CD8+ T cells displayed lower amounts of Eomes and increased IRF4 in the absence of
BATF while they maintained comparable expression of T-bet (Fig. 2e), though because of
the low number of Batf−/− effector CD8 T cells it is unclear whether this phenotype is a
Kurachi et al. Page 4
Nat Immunol. Author manuscript; available in PMC 2014 October 01.
NIH
-PA
Author M
anuscriptN
IH-P
A A
uthor Manuscript
NIH
-PA
Author M
anuscript

function of the selection of the few aberrantly activated survivors. The general effects of
Batf deficiency on gene expression in the majority of cells may be difficult to assess in this
small surviving minority.
Next, we tested whether BATF was required for a secondary effector CD8+ T cell response.
Primary Batf−/− and wild-type memory P14 cells were generated in separate hosts. At d51
p.i., Batf−/− and wild-type memory CD8+ T cells were purified and equal numbers of each
genotype were co-transferred into secondary hosts. These recipient mice were then infected
with either Listeria (LMgp33) or LCMV Arm. On d7 after re-challenge, the secondary
effector response of Batf−/− CD8+ T cells was markedly reduced compared to wild-type
cells (Fig. 2f). Thus, while some Batf−/− CD8+ T cells can apparently enter the memory pool
after primary infection and Batf−/− memory P14 cells retain a wild-type phenotype
(Supplementary Fig. 3d), Batf−/− memory CD8+ T cells are also highly defective in
secondary effector differentiation. BATF is therefore required for primary and secondary
effector CD8+ T cell differentiation.
Restoring BATF rescues Batf−/− effector differentiation
We next tested whether the defects in effector differentiation in BATF-deficient CD8+ T
cells could be reversed by re-introducing BATF. We used retroviral (RV) transduction in
Batf−/− and wild-type P14 CD8+ T cells to express BATF and transferred the transduced
cells into infection-matched recipients (Supplementary Fig. 5). Re-introducing BATF into
Batf−/− cells restored the magnitude of the effector CD8+ T cell response and corrected
differentiation such as the skewed ratio of memory precursors to short lived effector cells10
(Fig. 3a-d). In contrast, overexpression of BATF in wild-type CD8+ T cells did not change
the number, phenotype or function of CD8+ T cells, suggesting that in wild-type effector
CD8+ T cells, BATF expression was not limiting. We found that Batf−/− cells were strongly
dependent on RV-expressed BATF, as the BATF-transduced Batf−/− cells had a major
advantage in persistence compared with the non-transduced Batf−/− cells (Fig. 3c). Thus, the
defect in effector differentiation in Batf−/− CD8+ T cells can be overcome by restoring
BATF expression. These results further support an intrinsic role of BATF in the CD8+ T cell
effector response.
BATF, IRF4, and Jun proteins co-bind target genes
To determine the mechanisms for the profound effect of loss of BATF on effector
differentiation, we assembled a map of TF-DNA interactions using ChIP-seq with antibodies
against BATF, IRF4, c-Jun, JunD, and JunB in effector CD8+ T cells generated in vitro.
These in vitro effector CD8+ T cells show a similar global transcriptional profile to effectors
generated in vivo during LCMV infection (Supplementary Fig. 6). To define the chromatin
state of TF-bound regions, we also performed ChIP-seq with antibodies to five histone
modifications: histone H3 lysine 4 monomethylation (H3K4me1), primarily associated with
enhancers; H3K4me3, associated with promoters; H3 lysine 27 acetylation (H3K27ac),
found in active regulatory regions; H3K36me3, found in transcriptionally active regions;
and H3K27me3, a modification found in Polycomb-repressed regions25.
Kurachi et al. Page 5
Nat Immunol. Author manuscript; available in PMC 2014 October 01.
NIH
-PA
Author M
anuscriptN
IH-P
A A
uthor Manuscript
NIH
-PA
Author M
anuscript

We identified high-confidence binding regions for each TF (Fig. 4a and c; and
Supplementary Fig. 7a). Examining the chromatin state of the TF-bound regions, we found
that all five TFs exhibited a high fraction of peaks in active cis regulatory regions, with a
strong preference for enhancers over promoters, and very little binding in Polycomb-
repressed chromatin (Supplementary Table 1 and Fig. 4b).
A global analysis of BATF- and IRF4-bound genes in effector CD8+ T cells revealed a
highly significant overlap of regions bound by the two TFs (Fig. 4c), which almost
exclusively bound in close proximity (Fig. 4d). Fully 80% of BATF-bound regions had an
IRF4-bound region within 1 kb (Fig. 4c and d). However, there was no strong predilection
for which Jun family member associated with BATF-bound regions, and each was
significantly associated with BATF (Supplementary Fig. 7a). Co-binding with BATF
significantly increased the binding density of IRF4 (compared to IRF4-only regions), but co-
binding of BATF and IRF4 had no effect on the DNA binding of BATF (Supplementary
Fig. 7b and c), suggesting that for IRF4, co-binding with BATF may potentiate TF-DNA
interaction strength.
We performed a de novo motif analysis of regions bound by BATF and IRF4, or those
bound by either BATF or IRF4 alone. The combined BATF-IRF4 sites were highly enriched
for both types of the previously described AP-1 ISRE composite element (AICE)20, 21, 22
(Fig. 4e). In contrast, BATF-only peaks were enriched for only the AP-1 binding motif.
However, the IRF4-only peaks also enriched for AP-1 and AICE motifs, perhaps suggesting
that IRF4 may cooperatively bind DNA with other members of the AP-1 family in effector
CD8+ T cells (Fig. 4e). We also found that regions bound by BATF in effector CD8+ T cells
and in TH17 cells show an unexpected degree of similarity given the disparate natures of the
two cell types (Supplementary Table 2). Thus, BATF together with its dimerization partners
c-Jun, JunB, and JunD binds extensively in effector CD8+ T cells, largely in combination
with IRF4, at motifs enriched for AICEs.
BATF and IRF4 dynamically regulate effector genes
We identified BATF ‘target genes’ as those with BATF-bound regions within a window
spanning the gene and extending 5kb in both 5' and 3' directions. Inspection of these BATF
target genes revealed a large number of genes with functions critical for CD8+ T cell
effector differentiation (Table 1). BATF bound to regulatory regions in the genes encoding
many TFs with previously known roles in regulating effector CD8+ T cell differentiation,
including Tbx219, 10, Eomes8, 9, Prdm112,11, and Id213. BATF targets included genes
involved in T cell receptor (TCR) signaling (Cd28, Cd3d, Csk) as well as genes controlling
the response to inflammation, such as multiple Stats, Il12rb1, Il12rb2, Il18rap, Ifngr2, Il6st,
Ifnar1, Ifnar2, and Il1r1. BATF also bound to genes that are required for effector function
(e.g. Gzmb, Ifng, Il2), homing (e.g. Sell, Selp, Ccr9), apoptosis (e.g. Bcl2, Bcl2l1, Mcl1), and
metabolism (e.g. Gsk3a, Rptor, Rps6ka1), suggesting a major role for BATF in regulating
critical effector CD8+ T cell genes.
We analyzed our previously published gene expression data from naive, effector and
memory CD8+ T cells2 and determined whether BATF target genes were overrepresented
among genes differentially expressed during effector and memory differentiation. BATF
Kurachi et al. Page 6
Nat Immunol. Author manuscript; available in PMC 2014 October 01.
NIH
-PA
Author M
anuscriptN
IH-P
A A
uthor Manuscript
NIH
-PA
Author M
anuscript

target genes represented 11 - 17% of all genes that were differentially expressed between
naive vs. effector or naive vs. memory CD8+ T cells (data not shown), a highly significant
over-representation in the transcriptional program of effector/memory differentiation (Fig.
5a). The greatest enrichment in BATF target genes was in those differentially expressed
between naive CD8+ T cells and any subsequent time-point in effector/memory
differentiation (Fig. 5a). This was consistent with early upregulation of BATF and with the
profound requirement for BATF in the naive to effector transition (Fig. 2a and b). Thus,
BATF binds to a set of functionally critical genes that are dynamically regulated during
effector and memory differentiation.
Combinations of TFs regulate temporal gene expression
Because BATF binds to regulatory regions in combination with IRF4, JunB, cJun and JunD,
we tested whether the kinetics of BATF target-gene expression during effector/memory
differentiation varied depending on whether BATF target-genes were also bound by IRF4 or
Jun family members. We first mapped genome-wide combinatorial binding patterns of all
five TFs studied, by merging TF binding regions for BATF, IRF4, c-Jun, JunB, and JunD
that were in close proximity to each other to define seven clusters of regions bound by
combinations of TFs (Fig. 5b). The majority of BATF-bound regions were co-bound by
IRF4 and one of the Jun family members (region clusters 3 - 5). However, some regions
were associated only with BATF (cluster 1) or only IRF4 (cluster 2). Several clusters
(clusters 6 and 7) were also identified consisting of regions bound by Jun family members
independent of BATF, possibly representing targets of canonical AP-1 complexes.
Next, we separately identified three broad temporal patterns of gene expression (Fig. 5c)
during effector/memory CD8+ T cell differentiation. The first pattern (Pattern A) showed a
gradual upregulation during differentiation and was enriched for genes classified by Gene
Ontology26 as involved in lymphocyte activation (P=1.4e-2 by hypergeometric test) and
migration (P=1.83e-2). A second (Pattern B) included genes transiently upregulated in
effectors, and was enriched for genes involved in mitosis (P=7.14e-9) and cell cycle
regulation (P=9.9e-9). Finally, a third pattern (Pattern C) included genes initially
downregulated in effectors but with gradually recrudescent expression in memory CD8+ T
cells and was enriched for genes involved in lymphocyte co-stimulation (P=3.01e-4) and
lymphocyte differentiation (P=1.33e-3).
We then tested whether the genes bound by specific combinations of TFs defined in Fig. 5b
were associated with particular temporal patterns of gene expression defined in Fig. 5c.
Genes bound by BATF or IRF4 alone (clusters 1 and 2 from Fig. 5b) were not significantly
enriched in any temporal pattern (Fig. 5d). However, genes bound by BATF and IRF4 with
or without Jun family members (clusters 3 and 4) were significantly enriched in gene
expression pattern A and C – i.e. those genes involved in T cell activation and
differentiation. In contrast, BATF and IRF4 with or without Jun target genes were
significantly depleted in pattern B – i.e. proliferation-associated genes that were transiently
upregulated in effectors but returned to baseline levels during the memory phase. Genes
bound by Jun family members without BATF or IRF (cluster 7) showed a reciprocal pattern,
with significant enrichment in pattern B and depletion from patterns A and C, consistent
Kurachi et al. Page 7
Nat Immunol. Author manuscript; available in PMC 2014 October 01.
NIH
-PA
Author M
anuscriptN
IH-P
A A
uthor Manuscript
NIH
-PA
Author M
anuscript

with a role for canonical AP-1 regulation of immediate early genes and those involved in
proliferation27. Thus, BATF-bound genes were restricted to a specific temporal sequence by
the co-binding of other TFs. Genes co-bound by BATF, IRF4, with or without Jun family
TFs remained differentially expressed after naive T cells differentiate into effectors (patterns
A and C). In contrast, genes that were transiently upregulated and then revert to the low-
level expression (pattern B) tended not to include BATF target genes, but were instead
enriched for AP-1 target genes. Thus, the kinetics of gene expression during effector and
memory CD8+ T cell differentiation was temporally regulated by different combinations of
BATF, IRF4 and Jun binding events.
Loss of BATF perturbs the expression of a network of TFs
To identify genes whose expression was altered by BATF loss, we compared the gene
expression profiles of naive Batf−/− and wild-type CD8+ T cells and effectors of each
genotype generated after in vitro activation for three days (Fig. 6a). We found that the
profiles of Batf−/− and wild-type effector CD8+ T cells showed marked differences (Fig.
6a). In contrast, the expression profiles of naive wild-type or Batf−/− CD8+ T cells were
more closely related, consistent with the phenotypic analyses (Supplementary Fig. 2a). As
expected, BATF target genes where highly enriched for genes perturbed by BATF loss
(P=9.1e-22).
Inspection of the list of genes perturbed by BATF loss revealed two striking features. First,
we found that genes involved in effector function (e.g. Prf1 and Ifng) were significantly
increased in expression in Batf−/− effectors, suggesting that BATF inhibits the expression of
these genes (Fig. 6b). Second, we found that the expression of a striking number of TFs was
perturbed by loss of BATF (Fig. 6b and c). To visualize the network of TFs with which
BATF interacts, we combined our BATF ChIP-Seq data, expression profiles of Batf−/−
CD8+ T cells, and published data of TF binding patterns (see Methods) to create an
interaction network. The network analysis revealed a dense set of interconnected
relationships between BATF and a large set of TFs mediated by direct binding, mutual
regulation, and shared target genes (Fig. 6c and Supplementary Fig. 8). Many of these
interacting TFs were up- or down-regulated in BATF-deficient effectors, suggesting that
they were directly regulated by BATF (Fig. 6c). Other TFs bound by BATF did not change
in expression in BATF-deficient effectors (Supplementary Fig. 8, shown in gray color in
outer circle) suggesting that BATF regulated their expression at a different time point or that
their expression was regulated by BATF in combination with other TFs. Many of the TFs
that were perturbed by BATF loss have known, critical roles in effector CD8+ T cell
differentiation. We identified a lack of induction or downregulation of Id3, T-bet (encoded
by Tbx21), Blimp-1 (encoded by Prdm1) and Runx3 in Batf−/− effectors at early time points
after activation, suggesting that BATF reinforces effector CD8+ T cell differentiation by
inducing the expression of these TFs. BATF loss increased Eomes expression, potentially
pointing to a role for BATF in ensuring the reciprocal expression of T-bet and Eomes that
we have recently observed in CD8+ T cells28. We found that Batf−/− effector CD8+ T cells
showed increased expression of IRF4 and cJun which suggests that BATF may provide
negative feedback on the expression of these binding partners.
Kurachi et al. Page 8
Nat Immunol. Author manuscript; available in PMC 2014 October 01.
NIH
-PA
Author M
anuscriptN
IH-P
A A
uthor Manuscript
NIH
-PA
Author M
anuscript

BATF is required early during effector differentiation
The binding of BATF to a broad set of genes critical to effector CD8+T cell differentiation
suggests that BATF may play an essential role at the earliest stages of effector
differentiation to specify the key properties of effector CD8+ T cells. To test this idea we
tracked effector CD8+ T cell differentiation during the first 96 hours after LCMV infection
in Batf−/− and wild-type P14 CD8+ T cells. Wild-type CD8+ T cells started to proliferate by
d2 p.i. and entered an exponential proliferation state (Fig. 7a and b). In contrast, although
Batf−/− P14 cells also initiated proliferation with similar kinetics (Fig. 7a), they showed a
dramatic collapse in cell number at d4 p.i., suggesting a key role for BATF in coordinating
the earliest events in the naive to effector transition for CD8+ T cells. Batf−/− CD8+ T
effector cells exhibited higher caspase activity (FLICA) and CD95 (Fas) expression and
lower Bcl-2 expression (Fig. 7c and Supplementary Fig. 9a), suggesting increased cell death
as a cause for the collapse during proliferative expansion. It should be noted that a small
number of cells appear to survive this collapse in clonal expansion at d4 p.i. and these cells
may give rise to the small number of effector CD8 T cells observed at d8 p.i. (see Figs. 1
and 2).
To test whether BATF binding could occur at this early stage of effector CD8+ T cell
differentiation, we analyzed the time-course of BATF:DNA interactions at four regions in
representative target genes using ChIP-PCR (Supplementary Fig. 9b). BATF bound to all 4
genes examined starting at d1, indicating that binding of BATF to genes involved in effector
CD8+ T cell differentiation can take place at the earliest stages (i.e. within 24 hrs) after
activation.
One key feature of the naive to effector transition for CD8+ T cells is a switch from a mainly
catabolic metabolism for naive T cells to the anabolic or glycolytic metabolic program
required to support exponential proliferation and synthesis of biomass that accompanies
blastogenesis and rapid division as well as production of effector molecules. We
hypothesized that activated CD8+ T cell fail to make these metabolic changes in the absence
of BATF. Indeed, at d3 p.i., prior to the proliferative collapse, Batf−/− P14 cells displayed
reduced cell size (FSC) (Fig. 7a). Moreover, Batf−/− CD8+ T cells showed decreased
expression of key nutrient transporters or receptors (CD71 and CD98), altered reactive
oxygen production (as determined by lower CellROX Deep Red staining) consistent with
mitochondrial changes and lower phosphorylation of the S6 ribosomal protein downstream
of mTOR (Fig. 7d), indicating a role for BATF in metabolic reprogramming that
accompanies effector CD8+ T cell differentiation.
Despite these profound defects, Batf−/− P14 cells initially upregulated CD25 and CD69
expression to a degree similar to wild-type P14 cells, suggesting that TCR-dependent early
activation events were preserved in the absence of BATF (Supplementary Fig. 9c).
However, Batf−/− P14 cells showed impaired upregulation of T-bet (Fig. 7e) and failed to
up-regulate CD212 (IL12Rβ1) and CD218a (IL18Rα). The defect in CD212 (IL12Rβ1) and
CD218a (IL18Rα) protein expression at d2 p.i. preceded the defect in T-bet protein
expression at d3 p.i. (Fig. 7e and f). Thus, BATF likely controls T-bet expression at these
early time points both through a direct regulatory effect on the gene and, potentially, through
Kurachi et al. Page 9
Nat Immunol. Author manuscript; available in PMC 2014 October 01.
NIH
-PA
Author M
anuscriptN
IH-P
A A
uthor Manuscript
NIH
-PA
Author M
anuscript

an indirect effect via inflammatory cytokines such as IL-12 that are known inducers of T-
bet7, 10. At later time points, T-bet expression in the few surviving Batf−/− cells present at
d8 p.i. (see Fig. 1) may be driven by an altered inflammatory environment. In addition,
Batf−/− cells also failed to upregulate co-stimulatory molecules such as CD30 and CD134
(OX-40) (Supplementary Fig. 9d). These results indicate that BATF plays an essential role
in integrating signals 1, 2 and 3 of T cell activation.
Despite the failure to efficiently induce upstream effector transcription factors and cytokine
receptors, downstream effector genes were paradoxically upregulated in the absence of
BATF early after activation. At d3 p.i. Batf−/− cells displayed inappropriately high
expression of CD69 and CD62L (Fig. 7g and Supplementary Fig. 9c). This difference was
not due to altered proliferation kinetics of Batf−/− P14 effectors as expression levels of
CD62L and CD69 in successive generations of proliferating effectors were different
between Batf−/− and wild-type early effectors (Supplementary Fig. 9e). In addition, Batf−/−
cells produced more IFN-γ and granzyme B (Fig. 7h), both direct targets of BATF (Fig. 4f
and 6b), with similar trends for other effector cytokines such as TNF and MIP-1α(Supplementary Fig. 9f). These observations indicate that while BATF is necessary to
induce key positive regulators of effector CD8+ T cell differentiation including TFs and
cytokine receptors, BATF also represses the downstream effector gene targets. These results
suggest that BATF is a critical component of a feed-forward transcriptional circuit that
coordinates the gene expression program of effector CD8+ T cells differentiation
(Supplementary Fig. 10). A key feature of this model is dual induction of upstream
regulators of effector CD8+ T cell differentiation (e.g. TF and cytokine receptor genes) and
repression of downstream effector gene targets (e.g. IFN-γ, granzyme B) ensuring that
effector CD8+ T cell differentiation is not ‘locked in’ until a sufficient threshold of upstream
signals is achieved to overcome this latter BATF repression.
Discussion
Several studies have found that BATF regulates TH17 and TFH cell differentiation14, 16, 17,
but its role in CD8+ T cells remains poorly understood. BATF represses effector function in
exhausted CD8+ T cells19 and regulates metabolism and/or epigenetics in CD8+ T cells via
Sirt129. Here, we show that BATF orchestrates the developmental transition from naive to
effector states in CD8+ T cells. Our data identify BATF as a checkpoint in a transcriptional
circuit that ensures proper coordination of effector CD8+ T cell differentiation. In this
circuit, BATF serves two distinct and critical functions. First, it directly upregulates critical
TFs associated with the acquisition of effector functions including T-bet, Runx3 and
Blimp-1, as well as cytokine receptors and STAT TFs that sense inflammation and reinforce
effector differentiation. Second, BATF binds to and/or represses the expression of
downstream effector molecules, such as IFN-γ, perforin and granzyme B. Without BATF,
the coordinated sequence of molecular events that occur during effector CD8+ T cell
differentiation is disrupted, and effector CD8+ T cells reach a differentiation crisis marked
by metabolic and proliferative catastrophe within 3 - 5 days of antigen encounter.
Several TFs regulate effector CD8+ T cell differentiation7. Naive CD8 T cells lacking either
T-bet9, 10, Blimp-111, Id213 or Runx330 show defects in the magnitude of the effector
Kurachi et al. Page 10
Nat Immunol. Author manuscript; available in PMC 2014 October 01.
NIH
-PA
Author M
anuscriptN
IH-P
A A
uthor Manuscript
NIH
-PA
Author M
anuscript

response, as well as reduced cytotoxic potential or IFN-γ expression. However, the
mechanism that coordinates the upregulation of this set of TFs has been unclear. We find
that BATF directly or indirectly regulates a dense network of transcription factors, including
many TFs known to be required for effector CD8+ T cell differentiation. In the absence of
BATF, the early upregulation of its target genes, T-bet, Runx3 and Blimp-1 is impaired,
indicating that BATF may function upstream of each of these TFs to regulate their
appropriate temporal induction during effector CD8+ T cell differentiation. In addition to
directly upregulating these effector TFs, BATF also binds to and/or upregulates Ifnar1,
Ifnar2, Il12rb1, and Il12rb2, inflammatory cytokine receptors that positively reinforce
expression of Tbx21 and effector genes10. Thus, BATF integrates Signal 1 (TCR-mediated
activation) and Signal 3 (inflammatory cytokine sensing) of T cell activation to ensure
commitment to an effector fate.
It may seem counter-intuitive that BATF both positively regulates effector TFs while
negatively regulating downstream effector molecules, such IFN-γ, perforin and granzyme
B. However in bacteria, yeast, and cell lines, circuits involving opposing actions on
downstream genes (termed incoherent feed-forward loops) are a common3132, 33. BATF
positively regulates lineage-specific TFs as well as the inflammatory cytokine receptors
(Ifnar1, Ifnar2, Il12rb1, and Il12rb2) that are known to reinforce Tbx21 and other effector
genes10. The negative arm represses effector molecules (IFN-γ, perforin and granzyme B)
thus forming an incoherent feed-forward loop. Such loops can serve as ‘persistence
detectors’ that suppress an inappropriate response to a transient or subthreshold burst of
stimulation, and delay downstream gene expression until a full-fledged stimulus occurs33.
The simultaneous repression of effector genes by BATF ensures that the full effector
program is ‘locked in’ only when the positive regulatory arms have reached a critical
threshold to overcome the downstream inhibition mediated by BATF at effector genes. The
essentiality of this coordinated deployment of effector functions is demonstrated by the early
and profound collapse of effector CD8+ T cell differentiation in the absence of BATF.
BATF expression is increased in exhausted T cells during chronic viral infections in humans
and mice19. In this setting, the primary function of BATF seems to be to repress effector
genes such as IFN-γ. The dual role we describe for BATF in early T cell activation,
however, suggests that it may be possible to distinguish the distinct effects of BATF on
inducing a differentiation program (as BATF does in effector differentiation) from effects on
modulating gene expression once that program is established (as it does in exhausted CD8+
T cells). Such an interpretation would suggest that once CD8+ T cells progress past the point
of initial effector differentiation, BATF tunes functionality depending on the strength and/or
duration of TCR stimulation. Future studies temporally removing BATF at different stages
of infection should reveal further insights into the potential context-specific functions of
BATF.
Two previous studies demonstrated that IRF4 is regulated in a TCR signal-strength
dependent fashion and is required for effector CD8+ T cell differentiation24, 34. Consistent
with these findings, we show that BATF and IRF4 co-operate to regulate effector CD8+ T
cell differentiation. The regions bound by BATF and IRF4 overlap extensively and the two
TFs bind in close proximity at regions enriched for the composite AICE motif largely
Kurachi et al. Page 11
Nat Immunol. Author manuscript; available in PMC 2014 October 01.
NIH
-PA
Author M
anuscriptN
IH-P
A A
uthor Manuscript
NIH
-PA
Author M
anuscript

consistent with recent data from studies of Th17 cells20, 35, 21, 22. We show that BATF and
IRF4 co-binding is functionally co-operative: only genes bound by both TFs (but not those
bound only by one) are dynamically regulated during effector differentiation suggesting that
the association of both TFs is required to execute the differentiation program. Although
BATF is also upregulated in response to TCR signaling19, we show that availability of
BATF was not limiting in wild-type CD8+ T cells because overexpression of BATF did not
further enhance effector differentiation. Moreover, loss of only a single allele of Batf
demonstrated that sufficient BATF protein was available for effector CD8+ T cell
differentiation even in the heterozygous setting. Thus, the role of IRF4 may be to contribute
a signal-strength sensing component to the activity of the BATF-IRF4 complex24. Such
TCR-signal-induced upregulation of IRF4 is balanced by negative regulation of IRF4 by
BATF, providing a feedback mechanism that limits the effect of this TF complex and
prevents overstimulation during effector CD8+ T cell activation.
Why do BATF deficient effector cells die? BATF deficient effectors are able to enter cell
cycle, but fail to increase in number. This phenotype is reminiscent of CD8+ T cells that are
unable to sense inflammatory cytokines such as IFN-I36. However, we found that
modulation of inflammation did not alter the response of BATF-deficient CD8+ T cells,
perhaps because these cells fail to express appropriate levels of cytokine receptors. During
effector differentiation, CD8+ T cells must undergo a metabolic reprogramming, shifting to
an anabolic program that accompanies massive proliferation and increase in biomass4.
Batf−/− CD8+ T cells fail to manifest several important components of this metabolic shift
including increase in cell size, upregulation of nutrient transporters, optimal mTOR
activation and mitochondrial function. These changes could be due to disruption of
downstream genes involved in regulating metabolism, as has been reported for IRF424 and
BATF29. Alternatively or in addition, dysregulation of a large network of TFs, cytokine
receptors, and effector genes in the absence of BATF may be perceived as a developmental
catastrophe, triggering an apoptotic response preceded by disordered metabolism. Future
work should address whether enforced expression of specific, individual BATF target genes
could rescue the defect in effector differentiation. However, given the broad range of critical
genes regulated by BATF, it may be that no single gene is capable of restoring normal
effector differentiation in the absence of BATF.
Several questions regarding the role of BATF in regulating effector differentiation remain.
BATF is required for differentiation of TH17 and TFH cells14, 16. Our data examining
effector CD8+ T cells now reveal that BATF orchestrates the transition from naive to
effector CD8+ T cells and suggest that BATF has a broad role across many lymphocyte
lineages. It remains unclear, however, how BATF can be required for diverse differentiation
programs in different cells. BATF functions as a ‘pioneer factor’ in TH17 cells, increasing
chromatin accessibility to allow subsequent binding by other TFs22. BATF may therefore
lay ‘foundation’ of open regulatory regions on top of which additional layers of regulation
are added through the combined action of stimulus-specific TFs such as STATs37 and
effector TFs such as T-bet and Blimp-1. Future studies will be required to define the ‘parts
list’ of TFs that contribute to each lineage, and to determine how their layered,
combinatorial binding with BATF-IRF4 shapes the identity of developing effector cells.
Kurachi et al. Page 12
Nat Immunol. Author manuscript; available in PMC 2014 October 01.
NIH
-PA
Author M
anuscriptN
IH-P
A A
uthor Manuscript
NIH
-PA
Author M
anuscript

Online Methods
Mouse
C57Bl/6 background Batf−/− mice were purchased from the Jackson laboratory14. C57Bl/6
(CD45.2+) and congenic (CD45.1+) mice were from the National Cancer Institute. For some
of the experiments, they were crossed to P14 TCR transgenic mice. Male mice were used at
between 5 and 10 weeks of age. All animal work was in accordance with the Institute
Animal Care and Use Guidelines for the University of Pennsylvania.
Infection and immunization
LCMV strains were produced and titers were measured as described38. Mice were infected
by intraperitoneal injection of LCMV Armstrong strain (2 × 10⁵ plaque-forming units). In
some experiments, mice were infected by intravenous injection of Listeria monocytogenes
expressing LCMV gp33 epitope (LMgp33; 1 × 10⁴ colony-forming units or immunized by
intravenous injection of bone marrow derived dendritic cells labeled with gp33 peptide
(DCgp33; 1 × 10⁶ cells)39.
Adoptive transfer and isolation of lymphocytes
For adoptive transfer of naive cells, CD8+ T cells were isolated from spleens of naive
Batf−/− or wild-type P14 mice by CD8 negative selection (Miltenyi Biotec). The indicated
number (1 × 10³–106) of 1:1 mixed, or single P14 cells, were transferred into nonirradiated
naive recipient mice. For proliferation assays, P14 cells were labeled with 10μM CFSE or
Cell Trace Violet (Invitrogen) before transfer. For flow cytometry analysis after infection,
major lymphoid and non-lymphoid organs were removed on the days indicated, and single
cell suspensions were prepared as previously described39. RBCs in the cell suspensions were
lysed using ammonium chloride. To transfer memory P14 cells, Batf−/− and wild-type
memory P14 cells were generated in the two groups of mice. Spleen cells containing P14
cells were isolated, mixed and transferred into new recipient mice.
Retrovirus production and transduction
Batf cDNA was cloned into the MIG retrovirus38. Empty MIG or BATF-expressing MIG
was produced in 293T cells by the calcium-phosphate methods. For retrovirus transduction,
naive Batf−/− and wild-type P14 cells were isolated from spleen cells and enriched by CD8
negative selection. After 24 hours activation with anti-CD3 (2C11; 1μg/ml) and anti-CD28
(37.51; 0.5μg/ml) antibodies in the presence of recombinant human IL-2 (100 U/ml), P14
cells were transduced with retrovirus supernatant containing polybrene (1 μg/ml) by spin
infection (2000g for 60 min at 30°C). After 4 hours incubation, RV-transduced P14 cells
were adoptively transferred into recipient mice that were infected with LCMV Arm one day
before.
Antibodies and flow cytometry
The following fluorochrome-conjugated antibodies were used: TCR Vα2 (B20.1), CD8a
(53-6.7), CD25 (PC61.5), CD27 (LG.3A10), CD29 (HMβ1-1) CD43 (1B11), CD45.1 (A20),
CD45.2 (104), CD62L (MEL14), , CD69 (H1.2F3), CD71 (R17217), CD122 (5H4 and TM-
Kurachi et al. Page 13
Nat Immunol. Author manuscript; available in PMC 2014 October 01.
NIH
-PA
Author M
anuscriptN
IH-P
A A
uthor Manuscript
NIH
-PA
Author M
anuscript

β1), CD127 (A7R34), CD132 (TUGm2), CD183 (CXCR3; 173), CD218a (BG/IL18RA),
Ly6C (HK1.4), KLRG1 (2F1), , T-bet (4B10), IL-2 (JES6-5H4) from Biolegend; CD30
(mCD30.1), CD44 (IM7), CD95 (15A7), CD134 (OX-86), Eomes (Dan11mag), IRF4 (3E4),
IFN-γ (XMG1.2) , TNF (MP6-XT22), BATF (MBM7C7) from eBioscience; Bcl-2 (3F11),
CD162 (PSGL1; 2PH1), CD212 (114) from BD Phamingen; Granzyme B (GB12) from
Invitrogen; MIP1α(39624) from R&D; Phospho-S6 (Ser235/236) (91B2) from Cell
Signaling Technology. MHC class I H-2Db gp33 tetramers were described previously38.
MHC class II I-Ab gp66 tetramers were obtained from the National Institute of Health
Tetramer Core. Aqua live dead staining (Invitrogen) was used for exclusion of dead cells.
Assessment of caspase activity and reactive oxygen species production was performed using
FLICA Poly Caspases Assay kit (Immunochemistry Technologies) and CellROX assay kit
(Invitrogen). For intracellular cytokine staining, single cell suspension was incubated with or
without 1 μM gp33 peptide in the presence of brefeldin A and IL-2 (100 U/ml) for 5 h at
37°C and stained using the Cytofix/Cytoperm kit (BD). For intracellular transcription factor
staining, Foxp3 staining kit (eBioscience) was used according to manufacturer’s instruction.
Samples were analyzed on an LSRII (BD) and data were analyzed with FlowJo software
(Tree Star).
In vitro Stimulation and Differentiation
Primary wild-type and Batf−/− P14 CD8+ T cells were isolated using CD8 negative selection
magnetic-activated cell sorting (MACS) kits (Miltenyi) and cultured in RPMI 1640
supplemented with 10% fetal bovine serum, 10 mM HEPES, 50 U/ml of Penicillin, 50 μg/ml
of Streptomycin, and 50 μM β-mercaptoethanol. Naive cells were stimulated with plate-
bound anti-CD3 (4 μg/ml, clone 2C11, BD Pharmingen) and anti-CD28 (4 μg/ml, clone
37.51, BD Pharmingen) in the presence of recombinant human IL-2 (100 U/ml, R&D
Systems) for 3 days to generate in vitro effector cells.
Chromatin immunoprecipitation
In vitro effector CD8+ T cells were fixed with 1% formaldehyde for 10 min at 37°C. The
cells were then washed twice in ice cold PBS, and the cell pellets were flash frozen and
stored at −80°C. For each transcription factor ChIP, 10 or 20×106 cells were used, and
1.5×10⁶ cells were used for each histone ChIP. The fixed cells were resuspended in 120 μl
of lysis buffer (0.5% SDS, 50 mM Tris, pH 8, 10 mM EDTA, 1x Complete protease
inhibitor (Roche)) per 5×10⁶ cells (or a minimum 120 μl of lysis buffer for less than 5×10⁶
cells), and the chromatin was sheared using a Covaris E210 Ultrasonicator (Covaris, Inc.)
and Covaris microTUBEs. Each microTUBE (120 μl of lysate) was sonicated with 6
treatments of 60 sec each with the following settings: Intensity of 5, Duty Cycle of 10 %,
and 200 Cycles per Burst. This sonication sheared the chromatin into fragments of 150-600
bp, with the majority of DNA fragments being 200-250 bp in length. The sonicated lysates
were collected and centrifuged for 10 min at 4°C. Supernatants were collected and 4 parts of
dilution buffer (1.25% Triton X-100, 12.5 mM Tris, pH 8, 187.5 mM NaCl, 1x Complete
protease inhibitor) were added. Immunoprecipitation was performed overnight using
Dynabeads Protein G (Life Technologies) pre-bound to 5 μg of specific antibodies. The
following antibodies were used for ChIP: anti-BATF (PAB4003, Lot #004, Brookwood
Biomedical), anti-IRF4 (M-17) (sc-6059, Lot #C2712), anti-cJun (N) (sc-45, Lot #K3010),
Kurachi et al. Page 14
Nat Immunol. Author manuscript; available in PMC 2014 October 01.
NIH
-PA
Author M
anuscriptN
IH-P
A A
uthor Manuscript
NIH
-PA
Author M
anuscript

anti-JunB (210) (sc-73, Lot #D2610), anti-JunD (329) (sc-74, Lot #I1510, Santa Cruz), anti-
Total H3 (ab1791, Lot #GR82485), anti-H3K4me1 (ab8895, Lot #GR61280), anti-
H3K4me3 (ab8580, Lot #GR33084), anti-H3K27ac (ab4729, Lot #GR52136), anti-
H3K36me3 (ab9050, Lot #GR36719, Abcam), anti-H3K27me3 (07-449, Lot #2064519,
Millipore), and Normal Rabbit IgG (Control IgG) (10500C, Lot #939223A, Life
Technologies). Precipitated immune complexes were then washed once with Low Salt
Buffer (0.1% SDS, 1% Triton X-100, 20m M Tris, pH 8, 2 mM EDTA, 150 mM NaCl, 1x
Complete protease inhibitor), once with High Salt Buffer (0.1% SDS, 1% Triton X-100,
20m M Tris, pH 8, 2 mM EDTA, 500 mM NaCl, 1x Complete protease inhibitor), twice
with LiCl Buffer (0.7% Sodium Deoxycholate (NaDOC), 1% NP-40, 20m M Tris, pH 8, 1
mM EDTA, 500 mM LiCl, 1x Complete protease inhibitor), and once with TE buffer (with
protease inhibitor) for 5 min each. The ChIP immune complexes were then eluted from the
beads twice in elution buffer (1% SDS, 0.1 M NaHCO3) with constant agitation for 30 min.
The eluates were pooled and incubated at 65°C overnight to reverse the formaldehyde cross-
links. The eluates were then treated with 200 μg of RNase A (Qiagen) and 40 μg of
Proteinase K (Life Technologies) for 2 hr at 37°C. ChIP DNA fragments were purified using
a MinElute Reaction Cleanup kit (Qiagen).
High-throughput Sequencing
ChIP DNA was prepared for high-throughput Illumina sequencing using the NEBNext
ChIP-Seq Library Master Mix Set for Illumina kit (New England Biolabs, Inc.) and the
NEBNext Multiplex Oligos for Illumina (Index Primers 1-12) kit (New England Biolabs,
Inc.) according to a modified manufacturer’s protocol. For each ChIP or input sample, 10-50
ng of DNA was used to prepare a sequencing library. The DNA fragments were end-
repaired, dA-tailed, and ligated to Illumina adaptors according to the kit instructions. DNA
fragments of 150-600 bp in length were then selected using Pippin Prep 2% Agarose Gel
Cassettes and the Pippin Prep DNA Size Selection System (Sage Science, Inc.). After each
step, the DNA was purified using either a MinElute Reaction Cleanup Kit or a QIAquick
PCR Purification Kit (Qiagen), depending on the desired volume for the next step in the
library preparation. The ChIP DNA was then amplified with 12 PCR cycles using the
NEBNext Multiplex Oligos. Amplified DNA was purified using a 1:1 ratio of DNA to
Agencourt AMPure XP beads (Beckman Coulter). The multiplexed DNA libraries were
sequenced on the Illumina HiSeq2000. Reads were aligned to the mouse NCBI37/mm9
reference genome using bowtie40, sorted with samtools41, and deduplicated with picard
(http://picard.sourceforge.net/). SPP42 was used for the generation of visualization tracks for
ChIP reads corrected for background (input, IgG or total H3, as appropriate).
ChIP-Seq Informatics
SPP and MACS243 were both used for peak finding. Regions from both peak callers were
combined with mergeBed44. Quality rating for the merged regions was assigned based on
the maximum significance from either source. Independent samples of BATF and IRF4 were
generated and sequenced along with their matched input, which were compared to our
original samples and their matched inputs, as recommended in the ENCODE ChIP-seq
guidelines45. We confirmed This sonication sheared the chromatin into fragments of
150-600 bp, with the majority of DNA fragments being 200-250 bp in length. The
Kurachi et al. Page 15
Nat Immunol. Author manuscript; available in PMC 2014 October 01.
NIH
-PA
Author M
anuscriptN
IH-P
A A
uthor Manuscript
NIH
-PA
Author M
anuscript

reproducibility of the ChIP-seq datasets using the IDR as recommended in the on-line
documentation (https://sites.google.com/site/anshulkundaje/projects/idr) on peaks called by
SPP 42 at FDR < 0.5. At this threshold, SPP reported between 30,000 and 300,000 peaks,
depending on the exact combination of sample and input, most of which are expected to be
noise. CRMs were identified as in Ciofani et al.22 except that we used region boundaries for
merging rather than summit positions, allowing up to 100 bases between regions. CRMs
overlapping repeat-masked sequences (UCSC repeatMasker regions downloaded 8
December 2012) by 67% were removed with intersectBed −v44. Counts per million for each
CRM were determined on deduplicated samples from which "unknown scaffold" alignments
had been removed by explicitly retaining only named chromosomes with samtools view41.
Sequences containing overlapping high-confidence BATF and IRF4 binding sites were
submitted on-line to the MEME-ChIP server (version 4.9.0)46 for motif detection using
default parameters but with the maximum motif width set at 30. Gene Ontology (GO)
annotations were downloaded from NCBI Gene (9 January 2013) and used to assign
functional categories to differentially expressed genes and to CRM-associated genes.
Gene expression analysis
Affymetrix Mouse Gene 1.0 ST arrays and associated annotations were downloaded from
the NCBI Gene Expression Omnibus (GSE30431 and GPL6246 - December 2012 revision,
respectively). Intensities were corrected for background, normalized and log2-converted
using R and the rma function of the Bioconductor affy package47, 48, 49, 50. We focused on
probe sets annotated to RefSeq genes whose expression was above the overall median
expression level in at least 2 samples and which had an interquartile range across all samples
> 1.2-fold. Comparisons were carried out pair-wise across time points and P value
adjustments were made independently for each comparison.
For the analysis of wild-type and Batf−/− naive and in vitro effector CD8+ T cells, the cells
were lysed in RLT Buffer, and total RNA was isolated using an RNeasy Mini Kit (Qiagen).
After fragmentation and biotinylation, cDNA was hybridized to the Affymetrix Mouse430_2
microarray.
Cluster analysis
We identified three patterns of gene expression during effector/memory CD8 T cell
differentiation in our previously published dataset2 (Fig. 5c) using the k-means algorithm.
The value of k was determined automatically as the minimum value that provides within
cluster similarity (average correlation with centroid) over a cutoff of 0.8. We computed the
overlap between the resultant temporal clusters and the various binding patterns by using a
hypergeometric score (estimating the overlap between the respective gene sets). To define
gene sets associated with a certain binding pattern, we associate each CRM with its nearest
gene.
Defining the BATF-centric network
Key transcriptional interactions involving BATF were computed based on profiles of
protein-DNA binding activity and mRNA expression changes under various perturbations.
Kurachi et al. Page 16
Nat Immunol. Author manuscript; available in PMC 2014 October 01.
NIH
-PA
Author M
anuscriptN
IH-P
A A
uthor Manuscript
NIH
-PA
Author M
anuscript

To identify BATF-outgoing edges we used the knockout and ChIP-seq data collected in this
study. BATF-incoming edges were obtained from51, 52, 53, 54, 55, 56 for physical interactions
and 14, 57, 58, 59, 60, 61, 62, 63 for functional effects (using a 1.5 fold change cutoff), as
described in64. TF that share a significant amount of target genes with BATF were identified
using a hypergeometric test with a cutoff of 1e-5.
Statistics
All mice and samples that had entered experiments were analyzed. No pre-experiment
statistical methods, randomization or blinding were used in animal experiments. Sample-size
choice and assumption of normality were based on similar analyses in published studies. A
unpaired Student’s t-test (two-tailed) was done to assess statistical significance in flow
cytometry data. Prism 5 (GraphPad Software) was used to calculate statistics. Results were
considered significant at P < 0.05.
Supplementary Material
Refer to Web version on PubMed Central for supplementary material.
Acknowledgments
We thank M. Ali for animal care; K. Mansfield and J. Kurachi for technical assistance; the DFCI Center for CancerComputational Biology Sequencing Core for Illumina sequencing services and advice, and members of the Hainingand Wherry labs for their helpful discussion. Supported by AI091493 to W.N.H., AI083022, AI095608,HHSN266200500030C to E.J.W. and AI082630 to W.N.H and E.J.W.; Presidential Early Career Award for Scienceand Engineering (PECASE) to W.N.H.; The Ministry of Education, Culture, Sports, Science and Technology(MEXT) of Japan KAKENHI Grants-in-Aid for Young Scientists (B) 22790453 and Uehara Memorial Foundationof Japan to M.K.; The German National Academic Foundation to M.G.K.
References
1. Kaech SM, Wherry EJ, Ahmed R. Effector and memory T-cell differentiation: implications forvaccine development. Nat Rev Immunol. 2002; 2(4):251–262. [PubMed: 12001996]
2. Doering TA, Crawford A, Angelosanto JM, Paley MA, Ziegler CG, Wherry EJ. Network analysisreveals centrally connected genes and pathways involved in CD8+ T cell exhaustion versusmemory. Immunity. 2012; 37(6):1130–1144. [PubMed: 23159438]
3. Kaech SM, Wherry EJ. Heterogeneity and cell-fate decisions in effector and memory CD8+ T celldifferentiation during viral infection. Immunity. 2007; 27(3):393–405. [PubMed: 17892848]
4. van der Windt GJ, Pearce EL. Metabolic switching and fuel choice during T-cell differentiation andmemory development. Immunol Rev. 2012; 249(1):27–42. [PubMed: 22889213]
5. Rutishauser RL, Kaech SM. Generating diversity: transcriptional regulation of effector and memoryCD8 T-cell differentiation. Immunol Rev. 2010; 235(1):219–233. [PubMed: 20536566]
6. Belz GT, Kallies A. Effector and memory CD8+ T cell differentiation: toward a molecularunderstanding of fate determination. Curr Opin Immunol. 2010; 22(3):279–285. [PubMed:20434894]
7. Kaech SM, Cui W. Transcriptional control of effector and memory CD8+ T cell differentiation. NatRev Immunol. 2012; 12(11):749–761. [PubMed: 23080391]
8. Pearce EL, Mullen AC, Martins GA, Krawczyk CM, Hutchins AS, Zediak VP, et al. Control ofeffector CD8+ T cell function by the transcription factor Eomesodermin. Science. 2003; 302(5647):1041–1043. [PubMed: 14605368]
9. Intlekofer AM, Takemoto N, Wherry EJ, Longworth SA, Northrup JT, Palanivel VR, et al. Effectorand memory CD8+ T cell fate coupled by T-bet and eomesodermin. Nat Immunol. 2005; 6(12):1236–1244. [PubMed: 16273099]
Kurachi et al. Page 17
Nat Immunol. Author manuscript; available in PMC 2014 October 01.
NIH
-PA
Author M
anuscriptN
IH-P
A A
uthor Manuscript
NIH
-PA
Author M
anuscript

10. Joshi NS, Cui W, Chandele A, Lee HK, Urso DR, Hagman J, et al. Inflammation directs memoryprecursor and short-lived effector CD8(+) T cell fates via the graded expression of T-bettranscription factor. Immunity. 2007; 27(2):281–295. [PubMed: 17723218]
11. Rutishauser RL, Martins GA, Kalachikov S, Chandele A, Parish IA, Meffre E, et al.Transcriptional repressor Blimp-1 promotes CD8(+) T cell terminal differentiation and repressesthe acquisition of central memory T cell properties. Immunity. 2009; 31(2):296–308. [PubMed:19664941]
12. Kallies A, Xin A, Belz GT, Nutt SL. Blimp-1 transcription factor is required for the differentiationof effector CD8(+) T cells and memory responses. Immunity. 2009; 31(2):283–295. [PubMed:19664942]
13. Cannarile MA, Lind NA, Rivera R, Sheridan AD, Camfield KA, Wu BB, et al. Transcriptionalregulator Id2 mediates CD8+ T cell immunity. Nat Immunol. 2006; 7(12):1317–1325. [PubMed:17086188]
14. Schraml BU, Hildner K, Ise W, Lee WL, Smith WA, Solomon B, et al. The AP-1 transcriptionfactor Batf controls T(H)17 differentiation. Nature. 2009; 460(7253):405–409. [PubMed:19578362]
15. Betz BC, Jordan-Williams KL, Wang C, Kang SG, Liao J, Logan MR, et al. Batf coordinatesmultiple aspects of B and T cell function required for normal antibody responses. J Exp Med.2010; 207(5):933–942. [PubMed: 20421391]
16. Ise W, Kohyama M, Schraml BU, Zhang T, Schwer B, Basu U, et al. The transcription factorBATF controls the global regulators of class-switch recombination in both B cells and T cells. NatImmunol. 2011; 12(6):536–543. [PubMed: 21572431]
17. Murphy TL, Tussiwand R, Murphy KM. Specificity through cooperation: BATF-IRF interactionscontrol immune-regulatory networks. Nat Rev Immunol. 2013; 13(7):499–509. [PubMed:23787991]
18. Grigoryan G, Reinke AW, Keating AE. Design of protein-interaction specificity gives selectivebZIP-binding peptides. Nature. 2009; 458(7240):859–864. [PubMed: 19370028]
19. Quigley M, Pereyra F, Nilsson B, Porichis F, Fonseca C, Eichbaum Q, et al. Transcriptionalanalysis of HIV-specific CD8+ T cells shows that PD-1 inhibits T cell function by upregulatingBATF. Nat Med. 2010; 16(10):1147–1151. [PubMed: 20890291]
20. Glasmacher E, Agrawal S, Chang AB, Murphy TL, Zeng W, Vander Lugt B, et al. A genomicregulatory element that directs assembly and function of immune-specific AP-1-IRF complexes.Science. 2012; 338(6109):975–980. [PubMed: 22983707]
21. Li P, Spolski R, Liao W, Wang L, Murphy TL, Murphy KM, et al. BATF-JUN is critical for IRF4-mediated transcription in T cells. Nature. 2012; 490(7421):543–546. [PubMed: 22992523]
22. Ciofani M, Madar A, Galan C, Sellars M, Mace K, Pauli F, et al. A validated regulatory networkfor Th17 cell specification. Cell. 2012; 151(2):289–303. [PubMed: 23021777]
23. Wang J, Sun Q, Morita Y, Jiang H, Groß A, Lechel A, et al. A differentiation checkpoint limitshematopoietic stem cell self-renewal in response to DNA damage. Cell. 2012; 148(5):1001–1014.[PubMed: 22385964]
24. Man K, Miasari M, Shi W, Xin A, Henstridge DC, Preston S, et al. The transcription factor IRF4 isessential for TCR affinity-mediated metabolic programming and clonal expansion of T cells. NatImmunol. 2013; 14(11):1155–1165. [PubMed: 24056747]
25. Ernst J, Kheradpour P, Mikkelsen TS, Shoresh N, Ward LD, Epstein CB, et al. Mapping andanalysis of chromatin state dynamics in nine human cell types. Nature. 2011; 473(7345):43–49.[PubMed: 21441907]
26. Ashburner M, Ball CA, Blake JA, Botstein D, Butler H, Cherry JM, et al. Gene ontology: tool forthe unification of biology. The Gene Ontology Consortium. Nat Genet. 2000; 25(1):25–29.[PubMed: 10802651]
27. Lau LF, Nathans D. Expression of a set of growth-related immediate early genes in BALB/c 3T3cells: coordinate regulation with c-fos or c-myc. Proc Natl Acad Sci U S A. 1987; 84(5):1182–1186. [PubMed: 3469660]
Kurachi et al. Page 18
Nat Immunol. Author manuscript; available in PMC 2014 October 01.
NIH
-PA
Author M
anuscriptN
IH-P
A A
uthor Manuscript
NIH
-PA
Author M
anuscript

28. Paley MA, Kroy DC, Odorizzi PM, Johnnidis JB, Dolfi DV, Barnett BE, et al. Progenitor andterminal subsets of CD8+ T cells cooperate to contain chronic viral infection. Science. 2012;338(6111):1220–1225. [PubMed: 23197535]
29. Kuroda S, Yamazaki M, Abe M, Sakimura K, Takayanagi H, Iwai Y. Basic leucine zippertranscription factor, ATF-like (BATF) regulates epigenetically and energetically effector CD8 T-cell differentiation via Sirt1 expression. Proc Natl Acad Sci U S A. 2011; 108(36):14885–14889.[PubMed: 21873234]
30. Cruz-Guilloty F, Pipkin ME, Djuretic IM, Levanon D, Lotem J, Lichtenheld MG, et al. Runx3 andT-box proteins cooperate to establish the transcriptional program of effector CTLs. J Exp Med.2009; 206(1):51–59. [PubMed: 19139168]
31. Yosef N, Regev A. Impulse control: temporal dynamics in gene transcription. Cell. 2011; 144(6):886–896. [PubMed: 21414481]
32. Mangan S, Itzkovitz S, Zaslaver A, Alon U. The incoherent feed-forward loop accelerates theresponse-time of the gal system of Escherichia coli. J Mol Biol. 2006; 356(5):1073–1081.[PubMed: 16406067]
33. Mangan S, Alon U. Structure and function of the feed-forward loop network motif. Proc Natl AcadSci U S A. 2003; 100(21):11980–11985. [PubMed: 14530388]
34. Yao S, Buzo Bruno F, Pham D, Jiang L, Taparowsky Elizabeth J, Kaplan Mark H, et al. InterferonRegulatory Factor 4 Sustains CD8+ T Cell Expansion and Effector Differentiation. Immunity.2013; 39(5):833–845. [PubMed: 24211184]
35. Tussiwand R, Lee WL, Murphy TL, Mashayekhi M, Wumesh KC, Albring JC, et al.Compensatory dendritic cell development mediated by BATF-IRF interactions. Nature. 2012;490(7421):502–507. [PubMed: 22992524]
36. Kolumam GA, Thomas S, Thompson LJ, Sprent J, Murali-Krishna K. Type I interferons actdirectly on CD8 T cells to allow clonal expansion and memory formation in response to viralinfection. J Exp Med. 2005; 202(5):637–650. [PubMed: 16129706]
37. Vahedi G, Takahashi H, Nakayamada S, Sun HW, Sartorelli V, Kanno Y, et al. STATs shape theactive enhancer landscape of T cell populations. Cell. 2012; 151(5):981–993. [PubMed:23178119]
38. Kao C, Oestreich KJ, Paley MA, Crawford A, Angelosanto JM, Ali MA, et al. Transcription factorT-bet represses expression of the inhibitory receptor PD-1 and sustains virus-specific CD8+ T cellresponses during chronic infection. Nat Immunol. 2011; 12(7):663–671. [PubMed: 21623380]
39. Kurachi M, Kurachi J, Suenaga F, Tsukui T, Abe J, Ueha S, et al. Chemokine receptor CXCR3facilitates CD8(+) T cell differentiation into short-lived effector cells leading to memorydegeneration. J Exp Med. 2011; 208(8):1605–1620. [PubMed: 21788406]
40. Langmead B, Trapnell C, Pop M, Salzberg SL. Ultrafast and memory-efficient alignment of shortDNA sequences to the human genome. Genome Biol. 2009; 10(3):R25. [PubMed: 19261174]
41. Li H, Handsaker B, Wysoker A, Fennell T, Ruan J, Homer N, et al. The Sequence Alignment/Mapformat and SAMtools. Bioinformatics. 2009; 25(16):2078–2079. [PubMed: 19505943]
42. Kharchenko PV, Tolstorukov MY, Park PJ. Design and analysis of ChIP-seq experiments forDNA-binding proteins. Nat Biotechnol. 2008; 26(12):1351–1359. [PubMed: 19029915]
43. Zhang Y, Liu T, Meyer CA, Eeckhoute J, Johnson DS, Bernstein BE, et al. Model-based analysisof ChIP-Seq (MACS). Genome Biol. 2008; 9(9):R137. [PubMed: 18798982]
44. Quinlan AR, Hall IM. BEDTools: a flexible suite of utilities for comparing genomic features.Bioinformatics. 2010; 26(6):841–842. [PubMed: 20110278]
45. Landt SG, Marinov GK, Kundaje A, Kheradpour P, Pauli F, Batzoglou S, et al. ChIP-seqguidelines and practices of the ENCODE and modENCODE consortia. Genome Res. 2012; 22(9):1813–1831. [PubMed: 22955991]
46. Machanick P, Bailey TL. MEME-ChIP: motif analysis of large DNA datasets. Bioinformatics.2011; 27(12):1696–1697. [PubMed: 21486936]
47. Team RDC. R: A language and environment for statistical computing. R Foundation for StatisticalComputing; Vienna, Austria: 2009.
48. Irizarry RA, Bolstad BM, Collin F, Cope LM, Hobbs B, Speed TP. Summaries of AffymetrixGeneChip probe level data. Nucleic Acids Res. 2003; 31(4):e15. [PubMed: 12582260]
Kurachi et al. Page 19
Nat Immunol. Author manuscript; available in PMC 2014 October 01.
NIH
-PA
Author M
anuscriptN
IH-P
A A
uthor Manuscript
NIH
-PA
Author M
anuscript

49. Bolstad BM, Irizarry RA, Astrand M, Speed TP. A comparison of normalization methods for highdensity oligonucleotide array data based on variance and bias. Bioinformatics. 2003; 19(2):185–193. [PubMed: 12538238]
50. Irizarry RA, Hobbs B, Collin F, Beazer-Barclay YD, Antonellis KJ, Scherf U, et al. Exploration,normalization, and summaries of high density oligonucleotide array probe level data. Biostatistics.2003; 4(2):249–264. [PubMed: 12925520]
51. Linhart C, Halperin Y, Shamir R. Transcription factor and microRNA motif discovery: theAmadeus platform and a compendium of metazoan target sets. Genome Res. 2008; 18(7):1180–1189. [PubMed: 18411406]
52. Zheng G, Tu K, Yang Q, Xiong Y, Wei C, Xie L, et al. ITFP: an integrated platform of mammaliantranscription factors. Bioinformatics. 2008; 24(20):2416–2417. [PubMed: 18713790]
53. Wilson NK, Foster SD, Wang X, Knezevic K, Schutte J, Kaimakis P, et al. Combinatorialtranscriptional control in blood stem/progenitor cells: genome-wide analysis of ten majortranscriptional regulators. Cell stem cell. 2010; 7(4):532–544. [PubMed: 20887958]
54. Lachmann A, Xu H, Krishnan J, Berger SI, Mazloom AR, Ma'ayan A. ChEA: transcription factorregulation inferred from integrating genome-wide ChIP-X experiments. Bioinformatics. 2010;26(19):2438–2444. [PubMed: 20709693]
55. Liberzon A, Subramanian A, Pinchback R, Thorvaldsdottir H, Tamayo P, Mesirov JP. Molecularsignatures database (MSigDB) 3 . Bioinformatics. 2011; 27(12):1739–1740. [PubMed: 21546393]
56. Jiang C, Xuan Z, Zhao F, Zhang MQ. TRED: a transcriptional regulatory element database, newentries and other development. Nucleic Acids Res. 2007; 35:D137–140. Database issue. [PubMed:17202159]
57. Awasthi A, Carrier Y, Peron JP, Bettelli E, Kamanaka M, Flavell RA, et al. A dominant functionfor interleukin 27 in generating interleukin 10-producing anti-inflammatory T cells. Nat Immunol.2007; 8(12):1380–1389. [PubMed: 17994022]
58. Xiao S, Jin H, Korn T, Liu SM, Oukka M, Lim B, et al. Retinoic acid increases Foxp3+ regulatoryT cells and inhibits development of Th17 cells by enhancing TGF-beta-driven Smad3 signalingand inhibiting IL-6 and IL-23 receptor expression. J Immunol. 2008; 181(4):2277–2284. [PubMed:18684916]
59. Amit I, Garber M, Chevrier N, Leite AP, Donner Y, Eisenhaure T, et al. Unbiased reconstructionof a mammalian transcriptional network mediating pathogen responses. Science. 2009; 326(5950):257–263. [PubMed: 19729616]
60. Jux B, Kadow S, Esser C. Langerhans cell maturation and contact hypersensitivity are impaired inaryl hydrocarbon receptor-null mice. J Immunol. 2009; 182(11):6709–6717. [PubMed: 19454665]
61. Durant L, Watford WT, Ramos HL, Laurence A, Vahedi G, Wei L, et al. Diverse targets of thetranscription factor STAT3 contribute to T cell pathogenicity and homeostasis. Immunity. 2010;32(5):605–615. [PubMed: 20493732]
62. Yang XP, Ghoreschi K, Steward-Tharp SM, Rodriguez-Canales J, Zhu J, Grainger JR, et al.Opposing regulation of the locus encoding IL-17 through direct, reciprocal actions of STAT3 andSTAT5. Nat Immunol. 2011; 12(3):247–254. [PubMed: 21278738]
63. Shi LZ, Wang R, Huang G, Vogel P, Neale G, Green DR, et al. HIF1alpha-dependent glycolyticpathway orchestrates a metabolic checkpoint for the differentiation of TH17 and Treg cells. J ExpMed. 2011; 208(7):1367–1376. [PubMed: 21708926]
64. Yosef N, Shalek AK, Gaublomme JT, Jin H, Lee Y, Awasthi A, et al. Dynamic regulatory networkcontrolling TH17 cell differentiation. Nature. 2013; 496(7446):461–468. [PubMed: 23467089]
Kurachi et al. Page 20
Nat Immunol. Author manuscript; available in PMC 2014 October 01.
NIH
-PA
Author M
anuscriptN
IH-P
A A
uthor Manuscript
NIH
-PA
Author M
anuscript
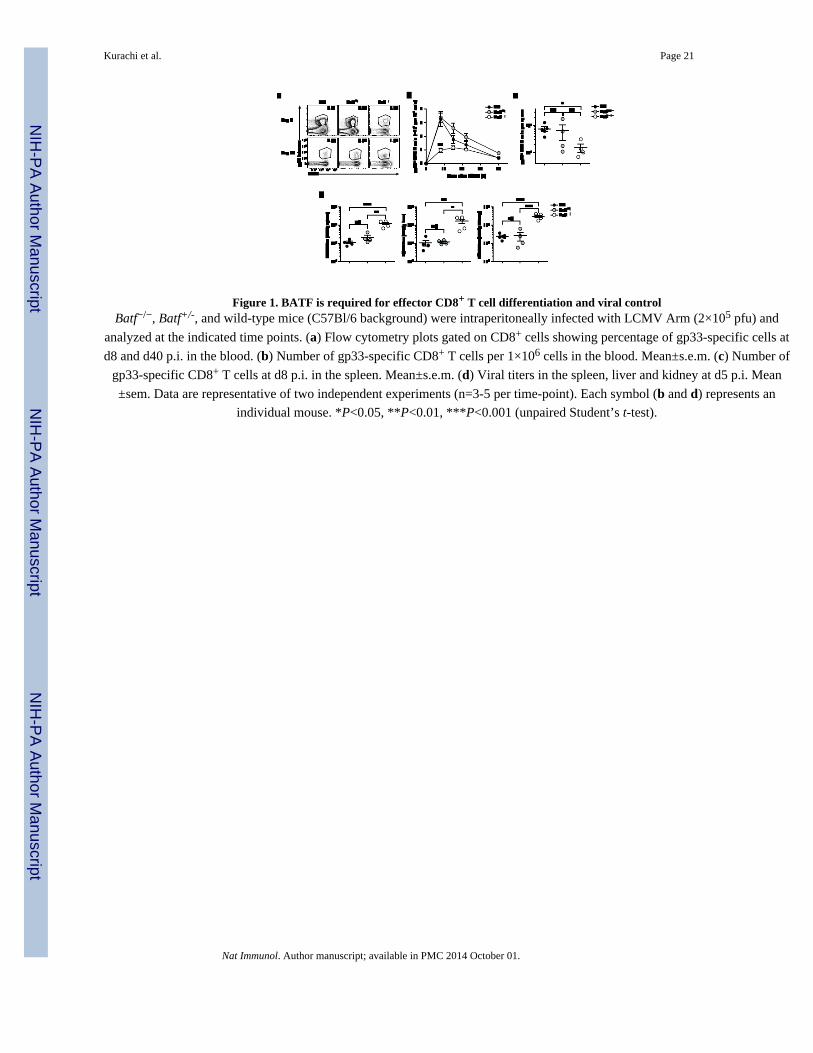
Figure 1. BATF is required for effector CD8+ T cell differentiation and viral controlBatf−/−, Batf+/-, and wild-type mice (C57Bl/6 background) were intraperitoneally infected with LCMV Arm (2×10⁵ pfu) and
analyzed at the indicated time points. (a) Flow cytometry plots gated on CD8+ cells showing percentage of gp33-specific cells at
d8 and d40 p.i. in the blood. (b) Number of gp33-specific CD8+ T cells per 1×10⁶ cells in the blood. Mean±s.e.m. (c) Number of
gp33-specific CD8+ T cells at d8 p.i. in the spleen. Mean±s.e.m. (d) Viral titers in the spleen, liver and kidney at d5 p.i. Mean
±sem. Data are representative of two independent experiments (n=3-5 per time-point). Each symbol (b and d) represents an
individual mouse. *P<0.05, **P<0.01, ***P<0.001 (unpaired Student’s t-test).
Kurachi et al. Page 21
Nat Immunol. Author manuscript; available in PMC 2014 October 01.
NIH
-PA
Author M
anuscriptN
IH-P
A A
uthor Manuscript
NIH
-PA
Author M
anuscript

Figure 2. BATF acts cell-intrinsically to regulate CD8+ T cell effector differentiationCongenically different Batf−/− and wild-type P14 cells (total 5×10² ~ 1×10⁴ cells) were mixed at 1:1 ratio and adoptively
transferred to naive recipients. The recipient mice were intraperitoneally infected with LCMV Arm (2×10⁵ pfu) and analyzed at
indicated time-points. (a) Flow cytometry plots gated on P14 cells showing percentage of wild-type (upper, CD45.1+CD45.2+)
and Batf−/− (lower, CD45.1+) at adoptive transfer and d7 and d224 in the spleen. (b) Number of Batf−/− and wild-type P14 cells
per 1×10⁶ cells in the blood. (c - e) Plots gated on wild-type or Batf−/− P14 cells showing CD127 and KLRG1 expression at d8
and d44 (c), and cytokine production and granzyme B expression at d8 (b), and expression level of transcription factors at d8
(e). (e) Numbers in the plots indicate MFI (mean±2s.d.). (f) Requirement of BATF for secondary response. Wild-type
(CD45.1+CD45.2+) and Batf−/− (CD45.2+) memory P14 cells were generated in separate hosts (CD45.1+) and isolated from
spleen at d51 after primary infection. Equal numbers of wild type and Batf−/− memory P14 cells were mixed (total 7×10³ cells)
and adoptively transferred into secondary hosts (CD45.1+). One day later recipient mice were infected with LCMV Arm (2×10⁵
pfu) or LM-gp33 (1×10⁴ cfu), and analyzed at d7 p.i. Data are representative of three (a-e) and two (f) independent experiments
(n=3-5 per time point).
Kurachi et al. Page 22
Nat Immunol. Author manuscript; available in PMC 2014 October 01.
NIH
-PA
Author M
anuscriptN
IH-P
A A
uthor Manuscript
NIH
-PA
Author M
anuscript

Figure 3. BATF overexpression rescues effector differentiation in Batf−/− effector CD8+ T cellsCD45.1+ Batf−/− and wild-type P14 cells were transduced with Batf overexpressing retrovirus (Batf RV) or empty retrovirus
(Empty RV) one day after stimulation with anti-CD3 and anti-CD28 antibodies in vitro. Transduced P14 cells (1×10⁴ cells) were
transferred into time-matched CD45.2+ mice (one day after LCMV Arm infection). (a) Plots gated on CD8+ cells show the
frequency of GFP+ P14 cells at d8 p.i. in the blood. Numbers in the plots indicate percent of P14 cells among total CD8+ T cells
(upper left, black gate) and percent of GFP+ cells among total P14 cells (upper right, green gate). (b) Number of P14 cells per
1×10⁶ cells in the blood. Mean±s.e.m. (c) Frequency of GFP+ cells among the transferred P14 cells in (b), tracked longitudinally
in peripheral blood from mice infected with Arm. Mean±s.e.m. (d) Expression of CD127 and KLRG1 on GFP+ donor P14 cells
at d8 p.i. Numbers in the plots indicate percent of each quadrant gate. Data are from four independent experiments (n=4-5 per
time point).
Kurachi et al. Page 23
Nat Immunol. Author manuscript; available in PMC 2014 October 01.
NIH
-PA
Author M
anuscriptN
IH-P
A A
uthor Manuscript
NIH
-PA
Author M
anuscript

Figure 4. BATF and IRF4 co-bind in effector CD8+ T cellsChIP-Seq analysis of wild-type effector CD8+ T cells. (a) ChIP-Seq binding tracks for BATF (Red), IRF4 (Blue), Jun
transcription factors (orange), and modified histones (gray) at representative genes (Il2ra, Prdm1, Il12rb2). (b) Bar graphs
indicating the percentage of TF peaks within active enhancers (left), active promoters (middle), and Polycomb repressed (right)
chromatin states for each TF. (c) Venn diagram of the number of genes bound by BATF and IRF4. P<2×10⁻¹⁶. Significance was
assessed with a binomial probability test. (d) Distribution analysis of the combined BATF and IRF4 regions. The histogram
shows the distribution of midpoint distances between a BATF site and the nearest IRF4 site in a 1 kb window. (e) De novo motif
analysis of the combined BATF and IRF4 regions, BATF-only regions, and IRF4-only regions.
Kurachi et al. Page 24
Nat Immunol. Author manuscript; available in PMC 2014 October 01.
NIH
-PA
Author M
anuscriptN
IH-P
A A
uthor Manuscript
NIH
-PA
Author M
anuscript

Figure 5. Temporal regulation of gene expression during effector CD8+ T cell differentiation by combinatorial binding of BATF, IRF4and Jun
(a) Overlap of BATF target genes with genes up- or down-regulated during effector CD8+ T cell differentiation (FDR < 0.25
and fold change > 2 or < −2). Significance between each pair-wise combination tested with a hypergeometric test, and 1-
(Log10 )P value indicated by color scale. (b) Clustered heat-map of regions bound by combinations of TFs (red, bound; grey,
unbound), and the seven resulting combinations of TF binding indicated by the legend on the right. (c) k-means clustering of
gene expression in P14 CD8+ T cells following LCMV Arm infection measured at indicated time-points. (d) Overlap between
clusters of genes bound by combinations of TFs from (b) and temporal patterns of gene expression from (c). Each bar denotes
whether a TF region cluster exhibits significant depletion (negative values) or enrichment (positive values) within the genes of
the indicated temporal pattern. Significance, measured by the hypergeometric test, for each TF cluster genes in Pattern A (left),
Pattern B (middle), and Pattern C (right).
Kurachi et al. Page 25
Nat Immunol. Author manuscript; available in PMC 2014 October 01.
NIH
-PA
Author M
anuscriptN
IH-P
A A
uthor Manuscript
NIH
-PA
Author M
anuscript

Figure 6. Loss of BATF perturbs a network of transcription factors(a) Consensus clustering of gene expression in naive and in vitro generated effector CD8+ T cells using wild-type or Batf−/−
CD8+ T cells. (b) Heatmap of genes differentially expressed (FDR < 0.25) in wild-type and Batf−/− CD8+ T cells. BATF target
genes are marked by the grey bars to the right of the heatmap. (c) BATF-centric interaction network of TFs. Incoming or
outgoing connections are indicated by arrow direction; differential expression of TFs in Batf−/− effector CD8 T cells is indicated
by color of node and edge (Red for increased expression in Batf−/− cells and Blue for decreased expression in Batf−/− cells); and
presence of shared target genes indicated by thick node outline.
Kurachi et al. Page 26
Nat Immunol. Author manuscript; available in PMC 2014 October 01.
NIH
-PA
Author M
anuscriptN
IH-P
A A
uthor Manuscript
NIH
-PA
Author M
anuscript

Figure 7. Loss of BATF perturbs the earliest stages of effector CD8+ T cell differentiationBatf−/− (CD45.2+) and wild-type (CD45.1+CD45.2+) P14 cells were mixed at a 1:1 ratio and transferred to CD45.1+ mice (total
1~2×10⁶ cells) after labeling with CFSE or Cell Trace Violet (CTV). The recipient mice were infected with LCMV Arm (2×10⁵
pfu). (a) Proliferation was assessed by CTV dilution and longitudinal cell size (FSC) of Batf−/− and wild-type P14 cells was
examined. Y-axis in CTV histogram was adjusted to the same scale to reflect relative number of both P14 cell types at a given
time point. Numbers in the plots indicate percent of Batf−/− and wild-type cells among total P14 cells. (b) Number of P14 cells
per spleen. Mean±s.e.m. *p=0.0212 (unpaired Student’s t-test). (c) Measurement of caspase activity by FLICA staining at d3.
Numbers in the histogram indicate percent FLICA positive. Mean±s.e.m. (d) Expression of nutrient transporters,
phosphorylation of the S6 ribosomal protein and reactive oxygen species production. (e) Fold increase of T-bet expression in
Batf−/− and wild-type P14 cells at 4 hrs after in vitro anti-CD3 and anti-CD28 stimulation, determined by Affymetrix chip (left),
and T-bet protein level at d3 in vivo (right). (f-h) Expression of cytokine receptors (f), CD62L and CD69 at d3 (g), and IFN-γproduction upon in vitro restimulation (d2) and granzyme B expression ex vivo (d3) (h). Time points for analysis are shown in
histogram (d, e, f and h). Data are representative of four independent experiments (n=3-5 per time point).
Kurachi et al. Page 27
Nat Immunol. Author manuscript; available in PMC 2014 October 01.
NIH
-PA
Author M
anuscriptN
IH-P
A A
uthor Manuscript
NIH
-PA
Author M
anuscript

NIH
-PA
Author M
anuscriptN
IH-P
A A
uthor Manuscript
NIH
-PA
Author M
anuscript
Kurachi et al. Page 28
Table 1
BATF target genes.
TranscriptionFactor
T CellActivation
CytokineSignaling
EffectorFunction
Homing Apoptosis Metabolism
Tbx21 Cd28 ll12rb2 Gzmb Cd44 Bcl2l1 Gpi1
Eomes Ctla4 ll18rap lfng Cxcr3 Casp3 Hk2
Prdm1 Lag3 ll2ra ll18 Ccr1 Bcl2 Acly
Rora Cd86 ll2rb Ccl3 Ccr2 Mcl1 Cs
Runx1 Tnfrsf8 ll10 Ccl5 Adam17 Fas Dlst
Runx2 Tnfrsf9 Casp1 lfna2 Adam19 BCl2l11 Suclg2
Hif1a Cd274 ll6st lfnab Sell Bmf Rptor
Fosl2 Havcr2 lfngr2 ll2 Sele Gsk3a
Atf3 Cd3d Tgfbr2 Ccr7 Rpl13
Atf4 Cd3g ll21r Ccr9 Rps6ka1
Tcf7 Cd247 lfnar2 Ccl20 Ogdh
Bcl6 Cd276 Tgfbr3 Selp Phkb
Lef1 Cd27 ll12rb1 Ccr4 Rpl23a
Ikzf2 Btla lfnar1 Ccr6 Rps3
Stat3 Tnfrsf4 ll21 Cxcr6 Rpl24
Stat4 Csk ll23r Adam22 Rps9
Stat5b ll1r1 Rpl35
lkzf1 ll1r2 Rps19
Nat Immunol. Author manuscript; available in PMC 2014 October 01.