the study on master plan for energy conservation and
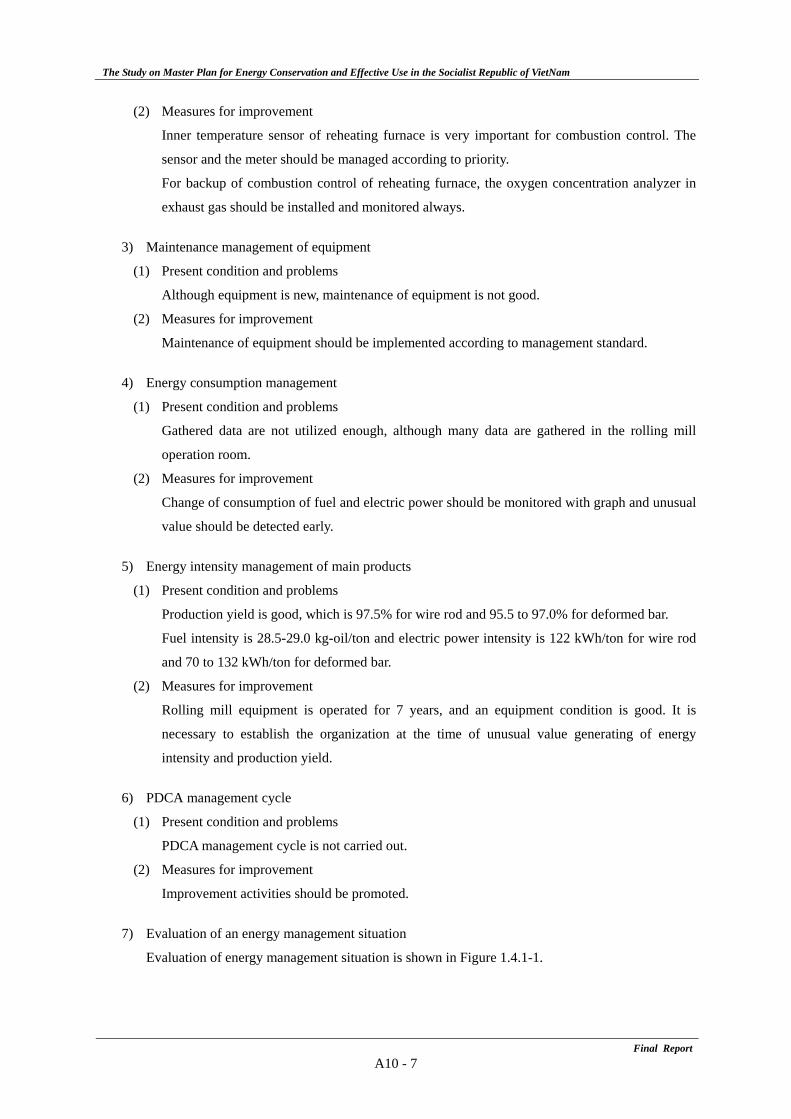
TRANSCRIPT
Ministry of Industry and Trade No.
Socialist Republic of Viet Nam
The Study on Master Plan for
Energy Conservation and Effective Use in
the Socialist Republic of Viet Nam
Final Report (Annex)
December 2009
JAPAN INTERNATIONAL COOPERATION AGENCY
ELECTRIC POWER DEVELOPMENT CO., LTD.
09-075 JR IDD
The Study on Master Plan for Energy Conservation and Effective Use in the Socialist Republic of Vietnam
Final Report- i -
Table of Contents
Annex 1 Energy Use Situation Notification form in Japan
Annex 2 Periodic Report form in Japan
Annex 3 Middle- and Long- Term Plan form in Japan
Annex 4 Completion Examination & Lecture Subjects for Energy Manager Training Course in 2007 (Japan)
Annex 5 Contents of Textbook of Training Course for Energy Management Officer in Japan
Annex 6 Punishment in Energy Conservation Law in Japan
Annex 7 EE&C Award in Japan
Annex 8 Conversion Factor of Electricity to Primary Energy
Annex 9 Energy Intensity and Elasticity
Annex 10 On-site Survey Report (Industry)
Annex 11 On-site Survey Presentation Materials (Building)
Annex 12 Curriculum of EE&C Training in Japan
ANNEX 1
ENERGY USE SITUATION NOTIFICATION FORM IN JAPAN

Form 1 (Pertaining to Article 5)
* Date received * Date processed
Energy use situation notification Messer
Date: Address: Name: (Official stamp)
This report is presented in compliance with the provisions of Item 2 of Article 7 of the Law Concerning the Rational Use of Energy.
Name of factory Address of factory Business the factory is
engaged in
Sum total Fuel and heat Electricity
Consumption of energy
Fiscal year
kL-oe (kilo litter oil
equivalent)
kL-oe
(kilo litter oil equivalent)
MWh Remarks
Designation number of Designated Energy
Management Factory
[Remarks]
1. The size of the form shall be the Japanese Industrial Standard A4.
2. Report shall be handwritten clearly in ink in printed style, or typed.
3. There shall be no entry in the column marked with (*) in this form.
4. Enter the classified name and number in the column of “business the factory is engaged in” according to the detailed classification of Japan Standardized Industrial Classification on the business conducted in the factory. Enter the number given by Minister of Economy, Trade and Industry and Minister of Environment in the column of specific emission factory number in the beginning of report.
5. In the calculation of energy consumption, if a calculation method of heat value of fuel to generate heat is used instead of the conversion factor specified in Annex Table 2, provide with the data used as a basis for the calculation method.
6. If the energy consumption is not to correspond to Item 2 of Article 2 after the following fiscal year,
A1 - 1

A1 - 2
enter the corresponding matter and reason in the column of remarks.
7. In the case that the factory is already appointed as Type 2 Designated Energy Management Factory, enter the designation number of Designated Energy Management Factory of the factory in the column of “Designation number of Designated Energy Management Factory.”
Contact to person in charge of notification
Address Name of factory Department and Section Name of person Phone Facsimile

ANNEX 2
PERIODIC REPORT FORM IN JAPAN
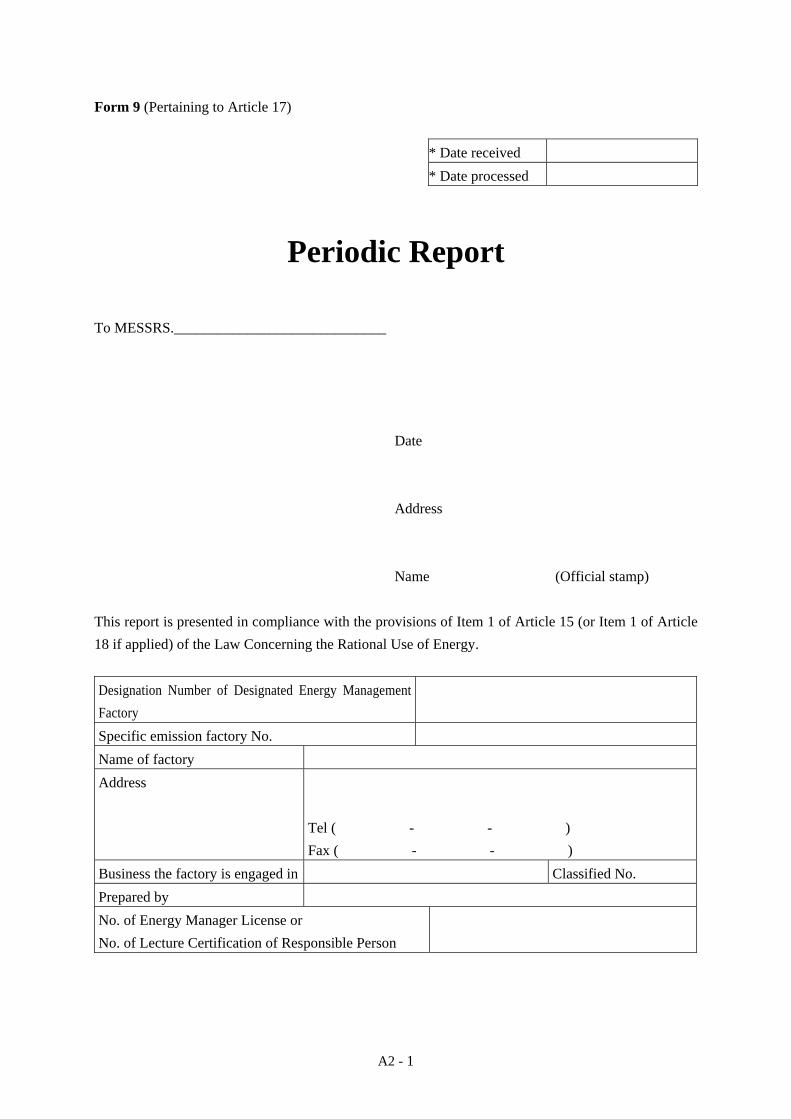
Form 9 (Pertaining to Article 17)
* Date received * Date processed
Periodic Report To MESSRS._____________________________
Date Address Name (Official stamp)
This report is presented in compliance with the provisions of Item 1 of Article 15 (or Item 1 of Article 18 if applied) of the Law Concerning the Rational Use of Energy. Designation Number of Designated Energy Management Factory
Specific emission factory No. Name of factory Address
Tel ( - - ) Fax ( - - )
Business the factory is engaged in Classified No. Prepared by No. of Energy Manager License or No. of Lecture Certification of Responsible Person
A2 - 1
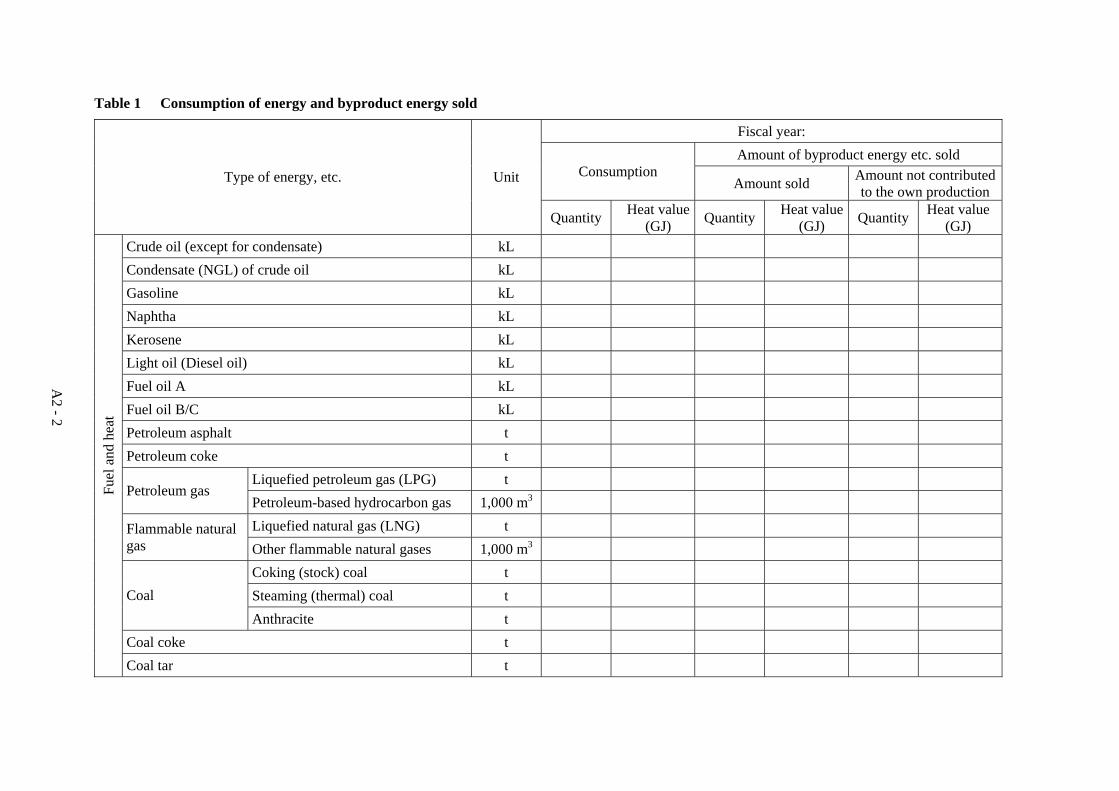
Table 1 Consumption of energy and byproduct energy sold
Fiscal year: Amount of byproduct energy etc. sold
Consumption Amount sold Amount not contributed
to the own production Type of energy, etc. Unit
Quantity Heat value (GJ) Quantity Heat value
(GJ) Quantity Heat value (GJ)
Crude oil (except for condensate) kL Condensate (NGL) of crude oil kL Gasoline kL Naphtha kL Kerosene kL Light oil (Diesel oil) kL Fuel oil A kL Fuel oil B/C kL Petroleum asphalt t Petroleum coke t
Liquefied petroleum gas (LPG) t Petroleum gas
Petroleum-based hydrocarbon gas 1,000 m3 Liquefied natural gas (LNG) t Flammable natural
gas Other flammable natural gases 1,000 m3 Coking (stock) coal t Steaming (thermal) coal t Coal Anthracite t
Coal coke t
Fuel
and
hea
t
Coal tar t
A2 - 2
A2 - 3
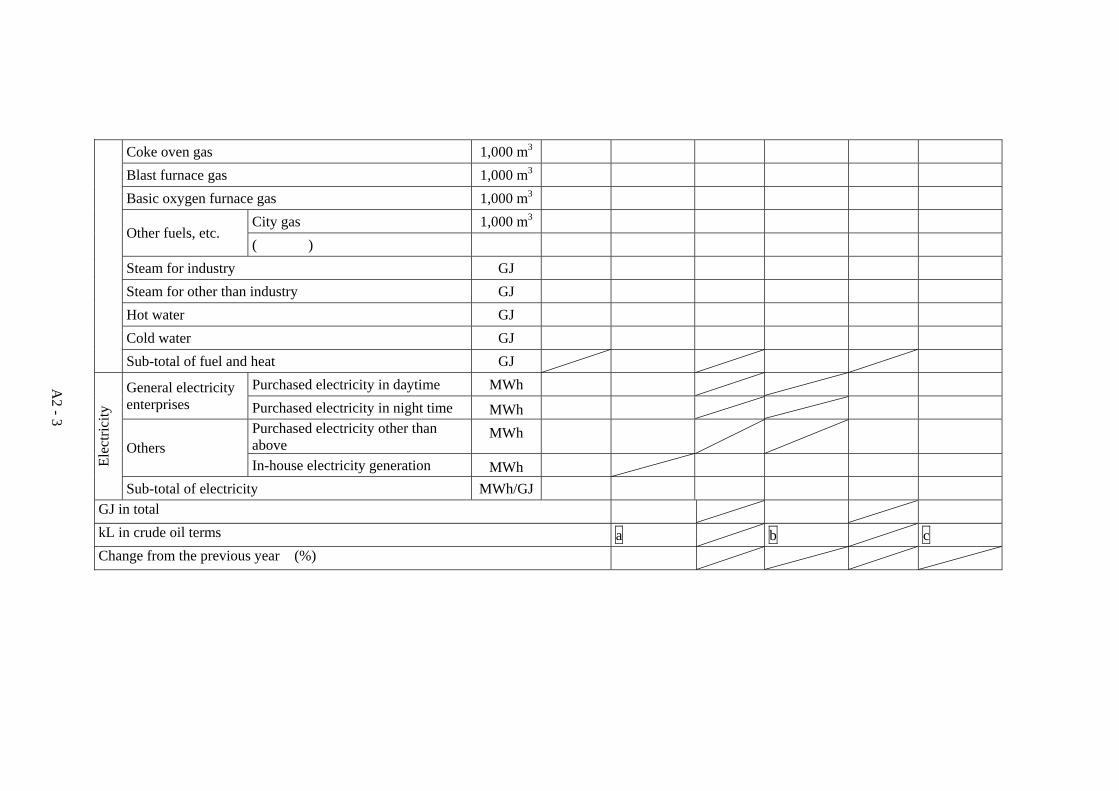
Coke oven gas 1,000 m3 Blast furnace gas 1,000 m3 Basic oxygen furnace gas 1,000 m3
City gas 1,000 m3 Other fuels, etc.
( ) Steam for industry GJ Steam for other than industry GJ Hot water GJ Cold water GJ
Sub-total of fuel and heat GJ Purchased electricity in daytime MWh General electricity
enterprises Purchased electricity in night time MWh Purchased electricity other than above
MWh Others
In-house electricity generation MWh Elec
trici
ty
Sub-total of electricity MWh/GJ GJ in total kL in crude oil terms a b c Change from the previous year (%)

Table 2 Outline, operating conditions, new installations, modifications, or removal of equipment pertaining to rational use of energy and principal equipment that consumes energy
Name of equipment Outline of equipment Operating conditionsNew installation, modification or
removal
Equi
pmen
t per
tain
ing
to ra
tiona
l use
of
ene
rgy
Prin
cipa
l equ
ipm
ent o
ther
than
the
abov
e th
at
cons
ume
ener
gy
Table 3 Production volume etc.
Fiscal year: Change from previous year (%)
Production volume, floor area or other value which has close relation with consumption of energy ( )
d
A2 - 4
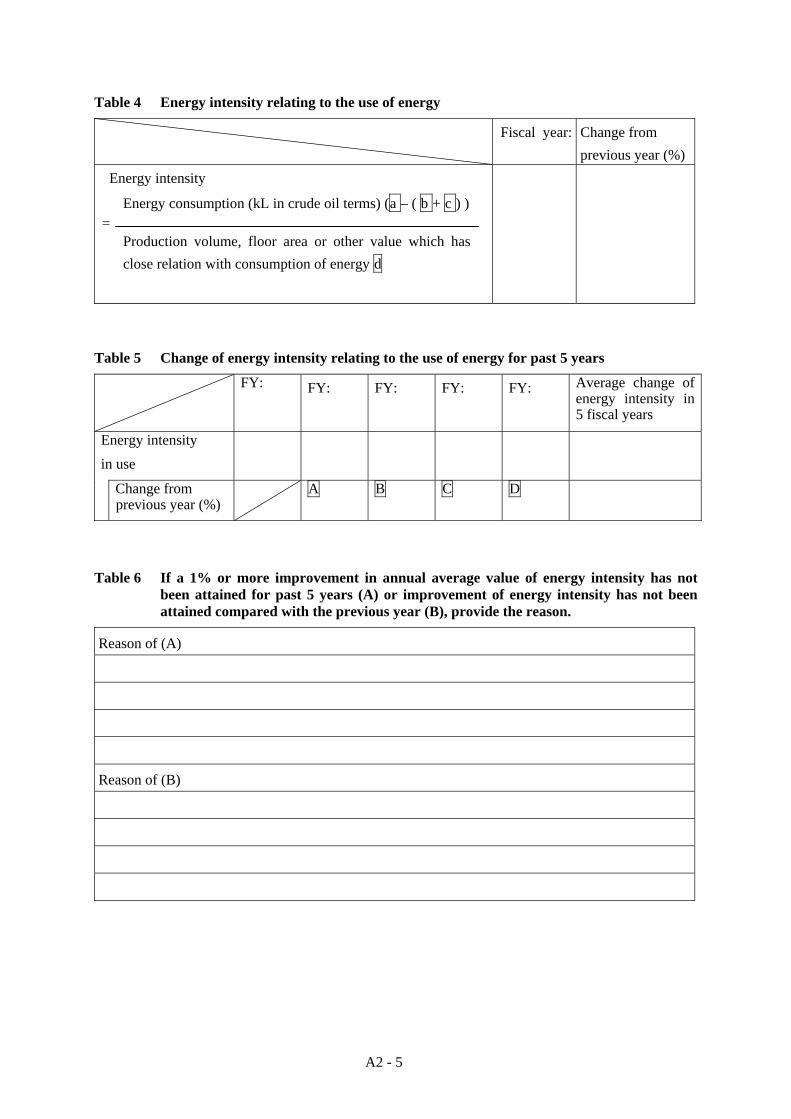
Table 4 Energy intensity relating to the use of energy
Fiscal year:
Change from previous year (%)
Energy intensity =
Production volume, floor area or other value which has close relation with consumption of energy d
Energy consumption (kL in crude oil terms) (a – ( b + c ) )
Table 5 Change of energy intensity relating to the use of energy for past 5 years
FY: FY: FY: FY: FY: Average change of energy intensity in 5 fiscal years
Energy intensity in use
Change from previous year (%)
A B C D
Table 6 If a 1% or more improvement in annual average value of energy intensity has not been attained for past 5 years (A) or improvement of energy intensity has not been attained compared with the previous year (B), provide the reason.
Reason of (A)
Reason of (B)
A2 - 5
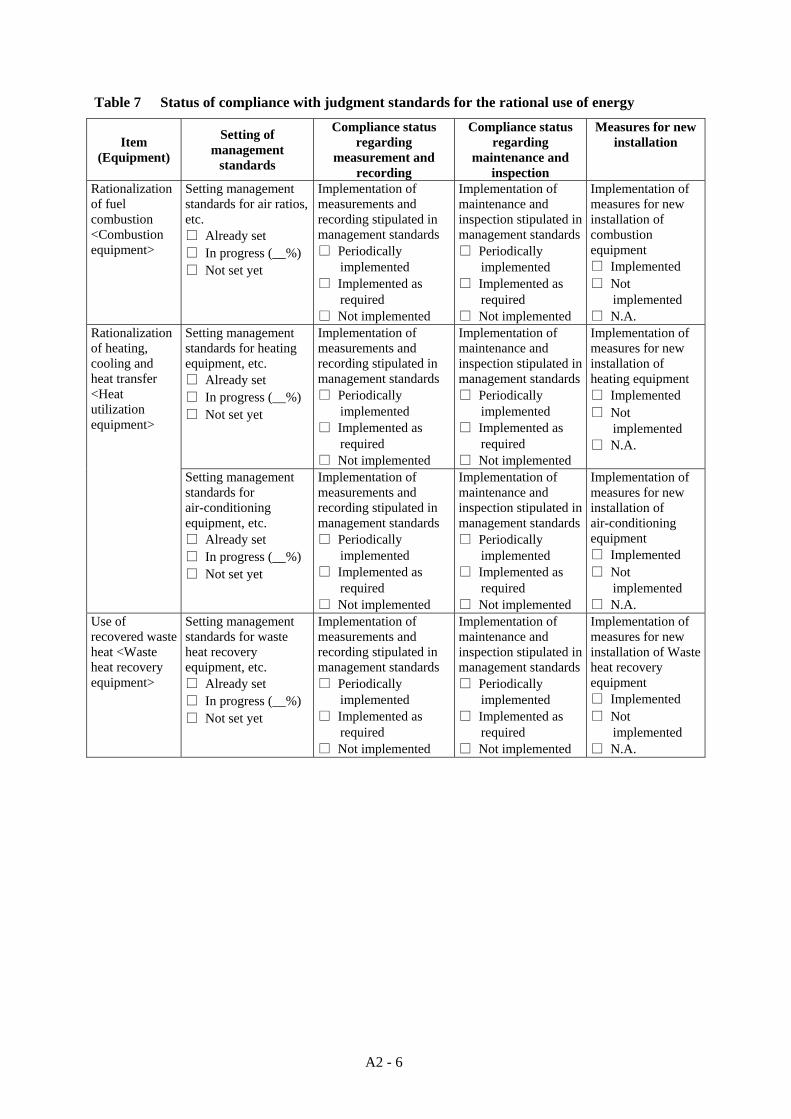
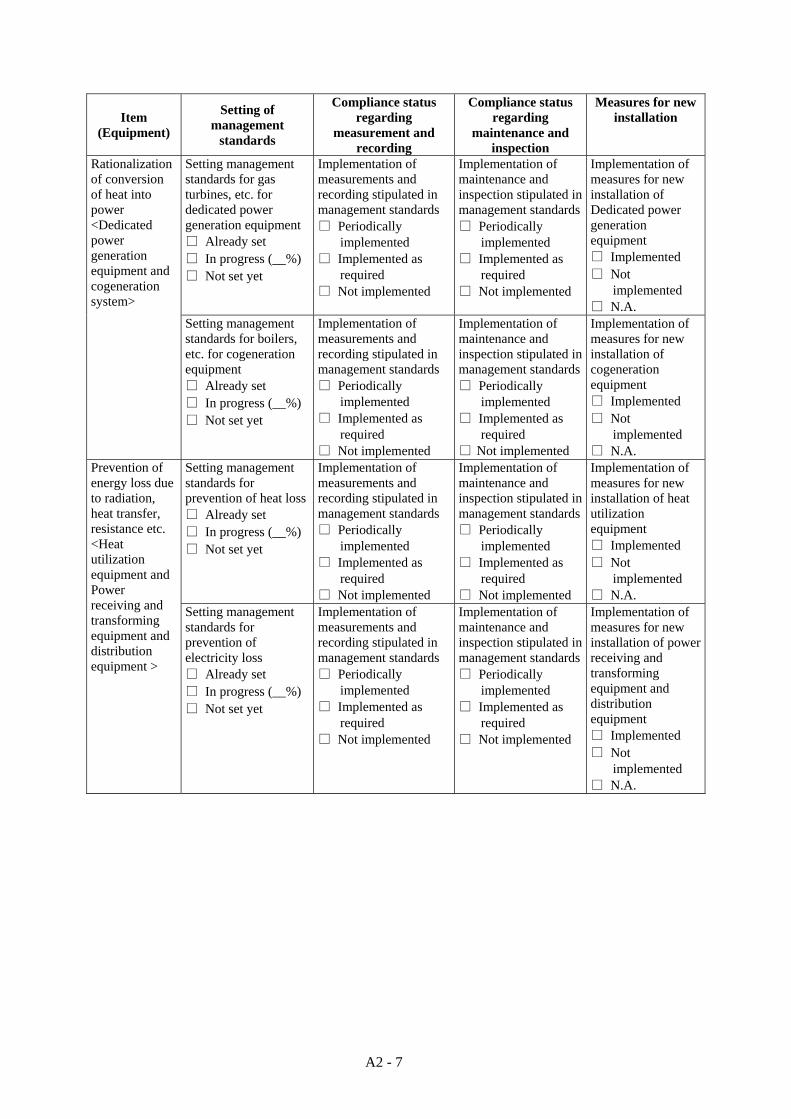
Table 7 Status of compliance with judgment standards for the rational use of energy
Item (Equipment)
Setting of management
standards
Compliance status regarding
measurement and recording
Compliance status regarding
maintenance and inspection
Measures for new installation
Rationalization of fuel combustion <Combustion equipment>
Setting management standards for air ratios, etc. □ Already set □ In progress (__%) □ Not set yet
Implementation of measurements and recording stipulated in management standards □ Periodically
implemented □ Implemented as
required □ Not implemented
Implementation of maintenance and inspection stipulated in management standards □ Periodically
implemented □ Implemented as
required □ Not implemented
Implementation of measures for new installation of combustion equipment □ Implemented □ Not
implemented □ N.A.
Setting management standards for heating equipment, etc. □ Already set □ In progress (__%) □ Not set yet
Implementation of measurements and recording stipulated in management standards □ Periodically
implemented □ Implemented as
required □ Not implemented
Implementation of maintenance and inspection stipulated in management standards □ Periodically
implemented □ Implemented as
required □ Not implemented
Implementation of measures for new installation of heating equipment □ Implemented □ Not
implemented □ N.A.
Rationalization of heating, cooling and heat transfer <Heat utilization equipment>
Setting management standards for air-conditioning equipment, etc. □ Already set □ In progress (__%) □ Not set yet
Implementation of measurements and recording stipulated in management standards □ Periodically
implemented □ Implemented as
required □ Not implemented
Implementation of maintenance and inspection stipulated in management standards □ Periodically
implemented □ Implemented as
required □ Not implemented
Implementation of measures for new installation of air-conditioning equipment □ Implemented □ Not
implemented □ N.A.
Use of recovered waste heat <Waste heat recovery equipment>
Setting management standards for waste heat recovery equipment, etc. □ Already set □ In progress (__%) □ Not set yet
Implementation of measurements and recording stipulated in management standards □ Periodically
implemented □ Implemented as
required □ Not implemented
Implementation of maintenance and inspection stipulated in management standards □ Periodically
implemented □ Implemented as
required □ Not implemented
Implementation of measures for new installation of Waste heat recovery equipment □ Implemented □ Not
implemented □ N.A.
A2 - 6
Item (Equipment)
Setting of management
standards
Compliance status regarding
measurement and recording
Compliance status regarding
maintenance and inspection
Measures for new installation
Setting management standards for gas turbines, etc. for dedicated power generation equipment □ Already set □ In progress (__%) □ Not set yet
Implementation of measurements and recording stipulated in management standards □ Periodically
implemented □ Implemented as
required □ Not implemented
Implementation of maintenance and inspection stipulated in management standards □ Periodically
implemented □ Implemented as
required □ Not implemented
Implementation of measures for new installation of Dedicated power generation equipment □ Implemented □ Not
implemented □ N.A.
Rationalization of conversion of heat into power <Dedicated power generation equipment and cogeneration system>
Setting management standards for boilers, etc. for cogeneration equipment □ Already set □ In progress (__%) □ Not set yet
Implementation of measurements and recording stipulated in management standards □ Periodically
implemented □ Implemented as
required □ Not implemented
Implementation of maintenance and inspection stipulated in management standards □ Periodically
implemented □ Implemented as
required □ Not implemented
Implementation of measures for new installation of cogeneration equipment □ Implemented □ Not
implemented □ N.A.
Setting management standards for prevention of heat loss □ Already set □ In progress (__%) □ Not set yet
Implementation of measurements and recording stipulated in management standards □ Periodically
implemented □ Implemented as
required □ Not implemented
Implementation of maintenance and inspection stipulated in management standards □ Periodically
implemented □ Implemented as
required □ Not implemented
Implementation of measures for new installation of heat utilization equipment □ Implemented □ Not
implemented □ N.A.
Prevention of energy loss due to radiation, heat transfer, resistance etc. <Heat utilization equipment and Power receiving and transforming equipment and distribution equipment >
Setting management standards for prevention of electricity loss □ Already set □ In progress (__%) □ Not set yet
Implementation of measurements and recording stipulated in management standards □ Periodically
implemented □ Implemented as
required □ Not implemented
Implementation of maintenance and inspection stipulated in management standards □ Periodically
implemented □ Implemented as
required □ Not implemented
Implementation of measures for new installation of power receiving and transforming equipment and distribution equipment □ Implemented □ Not
implemented □ N.A.
A2 - 7

Item (Equipment)
Setting of management
standards
Compliance status regarding
measurement and recording
Compliance status regarding
maintenance and inspection
Measures for new installation
Setting management standards for electric power consuming equipment, such as electrical power application equipment, electric heating equipment and electrolytic equipment □ Already set □ In progress (__%) □ Not set yet
Implementation of measurements and recording stipulated in management standards □ Periodically
implemented □ Implemented as
required □ Not implemented
Implementation of maintenance and inspection stipulated in management standards □ Periodically
implemented □ Implemented as
required □ Not implemented
Implementation of measures for new installation of electrical power application equipment □ Implemented □ Not
implemented □ N.A.
Rationalization of electricity conversion into power, heat, etc. <Electricity consuming equipment>
Setting management standards for lighting equipment □ Already set □ In progress (__%) □ Not set yet
Implementation of measurements and recording stipulated in management standards □ Periodically
implemented □ Implemented as
required □ Not implemented
Implementation of maintenance and inspection stipulated in management standards □ Periodically
implemented □ Implemented as
required □ Not implemented
Implementation of measures for new installation of lighting equipment □ Implemented □ Not
implemented □ N.A.
Table 8 Other measures taken for rational use of energy
Outline of measures Head (Responsible person) of the energy conservation promotion organization
(Position) (Name)
A2 - 8
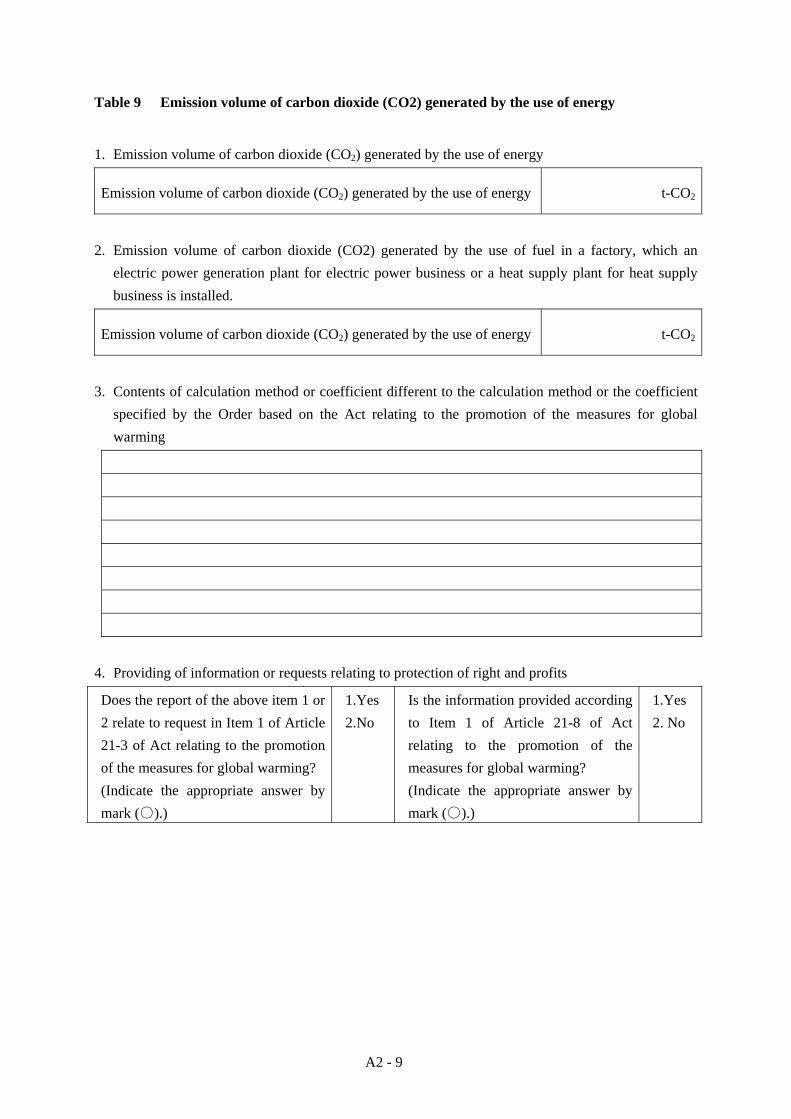
Table 9 Emission volume of carbon dioxide (CO2) generated by the use of energy
1. Emission volume of carbon dioxide (CO2) generated by the use of energy
Emission volume of carbon dioxide (CO2) generated by the use of energy t-CO2
2. Emission volume of carbon dioxide (CO2) generated by the use of fuel in a factory, which an
electric power generation plant for electric power business or a heat supply plant for heat supply business is installed.
Emission volume of carbon dioxide (CO2) generated by the use of energy t-CO2
3. Contents of calculation method or coefficient different to the calculation method or the coefficient
specified by the Order based on the Act relating to the promotion of the measures for global warming
4. Providing of information or requests relating to protection of right and profits
Does the report of the above item 1 or 2 relate to request in Item 1 of Article 21-3 of Act relating to the promotion of the measures for global warming? (Indicate the appropriate answer by mark (○).)
1.Yes 2.No
Is the information provided according to Item 1 of Article 21-8 of Act relating to the promotion of the measures for global warming? (Indicate the appropriate answer by mark (○).)
1.Yes 2. No
A2 - 9
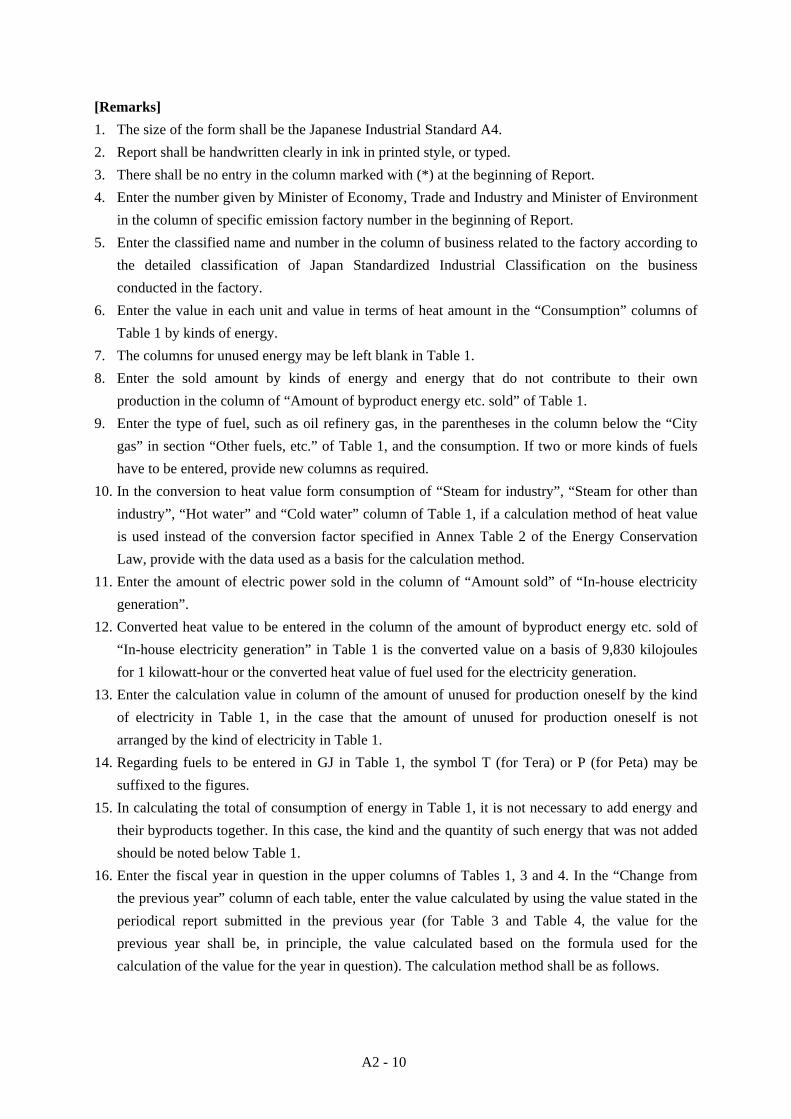
[Remarks] 1. The size of the form shall be the Japanese Industrial Standard A4. 2. Report shall be handwritten clearly in ink in printed style, or typed. 3. There shall be no entry in the column marked with (*) at the beginning of Report. 4. Enter the number given by Minister of Economy, Trade and Industry and Minister of Environment
in the column of specific emission factory number in the beginning of Report. 5. Enter the classified name and number in the column of business related to the factory according to
the detailed classification of Japan Standardized Industrial Classification on the business conducted in the factory.
6. Enter the value in each unit and value in terms of heat amount in the “Consumption” columns of Table 1 by kinds of energy.
7. The columns for unused energy may be left blank in Table 1. 8. Enter the sold amount by kinds of energy and energy that do not contribute to their own
production in the column of “Amount of byproduct energy etc. sold” of Table 1. 9. Enter the type of fuel, such as oil refinery gas, in the parentheses in the column below the “City
gas” in section “Other fuels, etc.” of Table 1, and the consumption. If two or more kinds of fuels have to be entered, provide new columns as required.
10. In the conversion to heat value form consumption of “Steam for industry”, “Steam for other than industry”, “Hot water” and “Cold water” column of Table 1, if a calculation method of heat value is used instead of the conversion factor specified in Annex Table 2 of the Energy Conservation Law, provide with the data used as a basis for the calculation method.
11. Enter the amount of electric power sold in the column of “Amount sold” of “In-house electricity generation”.
12. Converted heat value to be entered in the column of the amount of byproduct energy etc. sold of “In-house electricity generation” in Table 1 is the converted value on a basis of 9,830 kilojoules for 1 kilowatt-hour or the converted heat value of fuel used for the electricity generation.
13. Enter the calculation value in column of the amount of unused for production oneself by the kind of electricity in Table 1, in the case that the amount of unused for production oneself is not arranged by the kind of electricity in Table 1.
14. Regarding fuels to be entered in GJ in Table 1, the symbol T (for Tera) or P (for Peta) may be suffixed to the figures.
15. In calculating the total of consumption of energy in Table 1, it is not necessary to add energy and their byproducts together. In this case, the kind and the quantity of such energy that was not added should be noted below Table 1.
16. Enter the fiscal year in question in the upper columns of Tables 1, 3 and 4. In the “Change from the previous year” column of each table, enter the value calculated by using the value stated in the periodical report submitted in the previous year (for Table 3 and Table 4, the value for the previous year shall be, in principle, the value calculated based on the formula used for the calculation of the value for the year in question). The calculation method shall be as follows.
A2 - 10
A2 - 11
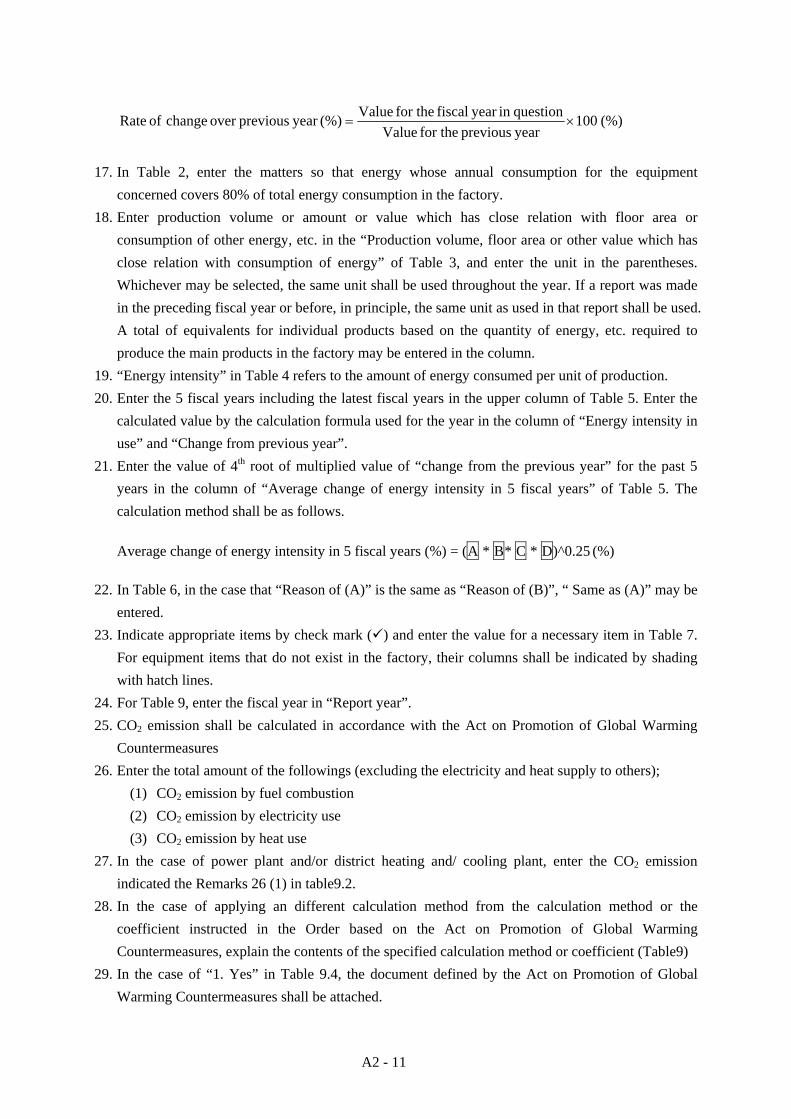
(%)100year previous for the Valuequestionin year fiscal for the Value(%)year previousover change of Rate ×=
17. In Table 2, enter the matters so that energy whose annual consumption for the equipment
concerned covers 80% of total energy consumption in the factory. 18. Enter production volume or amount or value which has close relation with floor area or
consumption of other energy, etc. in the “Production volume, floor area or other value which has close relation with consumption of energy” of Table 3, and enter the unit in the parentheses. Whichever may be selected, the same unit shall be used throughout the year. If a report was made in the preceding fiscal year or before, in principle, the same unit as used in that report shall be used. A total of equivalents for individual products based on the quantity of energy, etc. required to produce the main products in the factory may be entered in the column.
19. “Energy intensity” in Table 4 refers to the amount of energy consumed per unit of production. 20. Enter the 5 fiscal years including the latest fiscal years in the upper column of Table 5. Enter the
calculated value by the calculation formula used for the year in the column of “Energy intensity in use” and “Change from previous year”.
21. Enter the value of 4th root of multiplied value of “change from the previous year” for the past 5 years in the column of “Average change of energy intensity in 5 fiscal years” of Table 5. The calculation method shall be as follows.
Average change of energy intensity in 5 fiscal years (%) = (A * B* C * D)^0.25 (%)
22. In Table 6, in the case that “Reason of (A)” is the same as “Reason of (B)”, “ Same as (A)” may be
entered. 23. Indicate appropriate items by check mark ( ) and enter the value for a necessary item in Table 7.
For equipment items that do not exist in the factory, their columns shall be indicated by shading with hatch lines.
24. For Table 9, enter the fiscal year in “Report year”. 25. CO2 emission shall be calculated in accordance with the Act on Promotion of Global Warming
Countermeasures 26. Enter the total amount of the followings (excluding the electricity and heat supply to others);
(1) CO2 emission by fuel combustion (2) CO2 emission by electricity use (3) CO2 emission by heat use
27. In the case of power plant and/or district heating and/ cooling plant, enter the CO2 emission indicated the Remarks 26 (1) in table9.2.
28. In the case of applying an different calculation method from the calculation method or the coefficient instructed in the Order based on the Act on Promotion of Global Warming Countermeasures, explain the contents of the specified calculation method or coefficient (Table9)
29. In the case of “1. Yes” in Table 9.4, the document defined by the Act on Promotion of Global Warming Countermeasures shall be attached.

ANNEX 3
MIDDLE- AND LONG-TERM PLAN FORM IN JAPAN

Form 7 (Pertaining to Article 15) * Date received * Date processed
Middle- and Long-Term Plan To Messers
Date Address Name
This report is presented in compliance with the provisions of Item 1 of Article 14 of the Law concerning the Rational Use of Energy. Designated Number of Designated
Energy Management Factory
Name of factory
Address
Tel ( - - )
Business the factory is engaged in
A3 - 1

I Plan Period
Fiscal year to Fiscal year II The Contents of plan, and the expected effects of rationalization of energy use
Process
Contents of plan
Expected effects of rationalization of energy use
III Comparison with Previous Year Plan
Process A plan to have been deleted Reason
Process A plan to have been added Reason
A3 - 2
A3 - 3
IV The other matters relevant to Plan
[Remarks]
1. The size of the form shall be the Japanese Industrial Standard A4.
2. Plan shall be handwritten clearly in ink in printed style, or typed.
3. There shall be no entry in the column marked with (*) at the beginning of Plan.
4. Enter the classified name and number in the column of business related to the factory according to the detailed classification of Japan Standardized Industrial Classification on the business conducted in the factory.
5. Enter the name and quantity of equipment, system and technology etc. by the process unit in the column of “Contents of plan” of Item II. But if it is difficult to write the contents of plan by the process unit, enter the name of principal equipment in the column of “Process”, and enter the plan by equipment.
6. Enter “kL” of crude oil equivalent of the expected effects of energy use rationalization expected by the implementation of the improvement plan in the column of “Expected effects of energy use rationalization” of Item II.
7. Enter the contents compared with the previous year of Item II in Item III. In addition, if the corresponding process is plurality, enter the contents in newly prepared column.
8. When the higher ranked plans (the project relevant to two or more factories, the whole plan Type-1 specified entrepreneur, etc.) relevant to the plan entered in the column of II, enter the positioning of the factory concerned in the contents of a plan and plan etc. in Item IV. Moreover, when entry is difficult only in this column, attach the related data.
ANNEX 4
COMPLETION EXAMINATION AND LECTURE SUBJECTS FOR ENERGY MANAGER TRAINING COURSE IN 2007 (JAPAN)

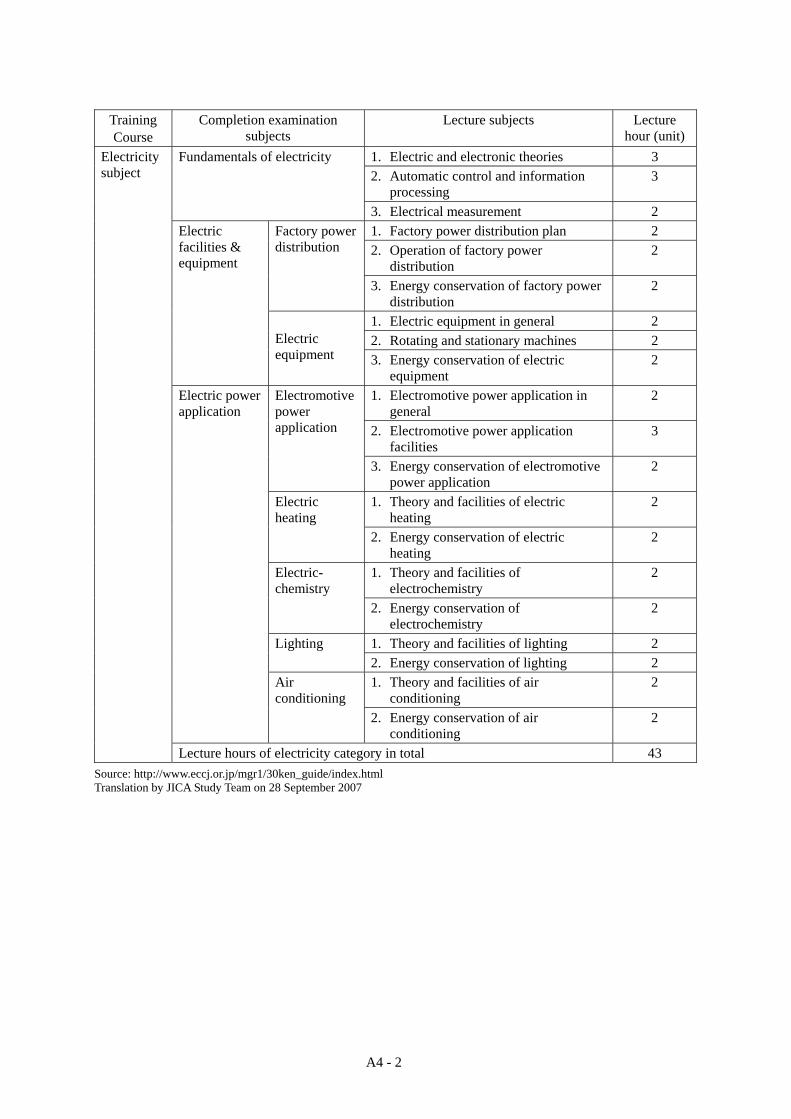
Completion Examination and Lecture Subjects for Energy Manager Training Course in 2007 A trainee is required to choose a training course of “Compulsory subject + Heat subject” or “Compulsory subject + Electricity subject” and receive the lecture for 52 units in total for 6 days. 1 unit of lecture hour is 40 minutes. Completion examination is taken from 9:30 to 17:30 on 7th day.
Training Course
Completion examination subjects
Lecture subjects Lecture hour (unit)
1. Compendium on energy management 7 Compendium on energy management and laws 2. Laws & orders concerning rational
use of energy 2
Compulsory subject
Lecture hours of compulsory category in total 9
Training Course
Completion examination subjects
Lecture subjects Lecture hour (unit)
1. Fundamentals of thermodynamics 8 2. Fundamentals of fluidics 5
Fundamentals of heat & fluid flows
3. Fundamentals of heat transfer engineering
5
1. Combustion and combustion control 4
Heat subject
Fuel and combustion 2. Combustion calculation 3
1. Measurement and control 5 2. Boiler, steam transport and storage
unit, steam motor, internal combustion engine, gas turbine
4 Heat utilization facilities and their management
3. Heat exchanger and heat recovery unit, freezing and air conditioning equipment
3
4. Industrial furnace and thermal facilities materials
3
5. Distillation・evaporation・condensation unit, drying unit, dry distillation and gasification unit
3
Lecture hours of heat category in total 43
A4 - 1
A4 - 2
Training Course
Completion examination subjects
Lecture subjects Lecture hour (unit)
1. Electric and electronic theories 3 2. Automatic control and information
processing 3
Fundamentals of electricity
3. Electrical measurement 2 1. Factory power distribution plan 2 2. Operation of factory power
distribution 2
Factory power distribution
3. Energy conservation of factory power distribution
2
1. Electric equipment in general 2 2. Rotating and stationary machines 2
Electric facilities & equipment
Electric equipment 3. Energy conservation of electric
equipment 2
1. Electromotive power application in general
2
2. Electromotive power application facilities
3
Electromotive power application
3. Energy conservation of electromotive power application
2
1. Theory and facilities of electric heating
2 Electric heating
2. Energy conservation of electric heating
2
1. Theory and facilities of electrochemistry
2 Electric- chemistry
2. Energy conservation of electrochemistry
2
1. Theory and facilities of lighting 2 Lighting 2. Energy conservation of lighting 2 1. Theory and facilities of air
conditioning 2
Electric power application
Air conditioning
2. Energy conservation of air conditioning
2
Electricity subject
Lecture hours of electricity category in total 43 Source: http://www.eccj.or.jp/mgr1/30ken_guide/index.html Translation by JICA Study Team on 28 September 2007
ANNEX 5
CONTENTS OF TEXTBOOK OF TRAINING COURSE FOR ENERGY MANAGEMENT
OFFICER IN JAPAN
Contents of Textbook of Training Course for Energy Management Officer in Japan
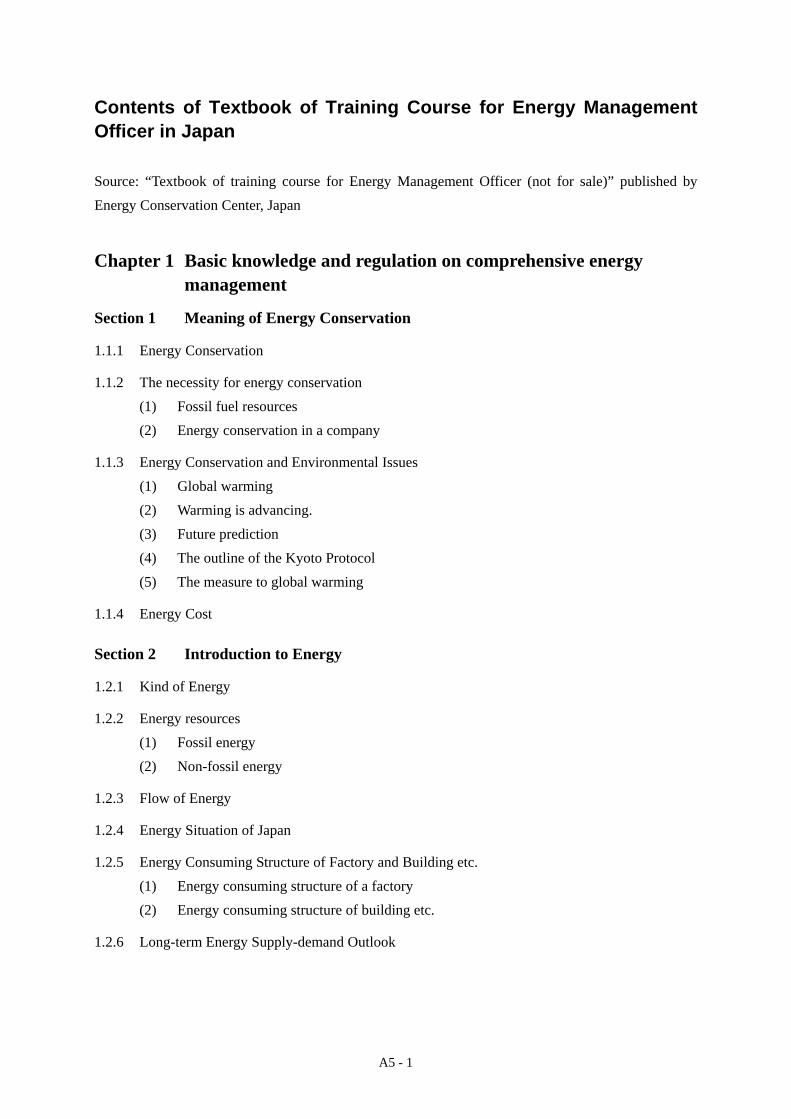
Source: “Textbook of training course for Energy Management Officer (not for sale)” published by Energy Conservation Center, Japan Chapter 1 Basic knowledge and regulation on comprehensive energy
management
Section 1 Meaning of Energy Conservation
1.1.1 Energy Conservation
1.1.2 The necessity for energy conservation (1) Fossil fuel resources (2) Energy conservation in a company
1.1.3 Energy Conservation and Environmental Issues (1) Global warming (2) Warming is advancing. (3) Future prediction (4) The outline of the Kyoto Protocol (5) The measure to global warming
1.1.4 Energy Cost Section 2 Introduction to Energy
1.2.1 Kind of Energy
1.2.2 Energy resources (1) Fossil energy (2) Non-fossil energy
1.2.3 Flow of Energy
1.2.4 Energy Situation of Japan
1.2.5 Energy Consuming Structure of Factory and Building etc. (1) Energy consuming structure of a factory (2) Energy consuming structure of building etc.
1.2.6 Long-term Energy Supply-demand Outlook
A5 - 1
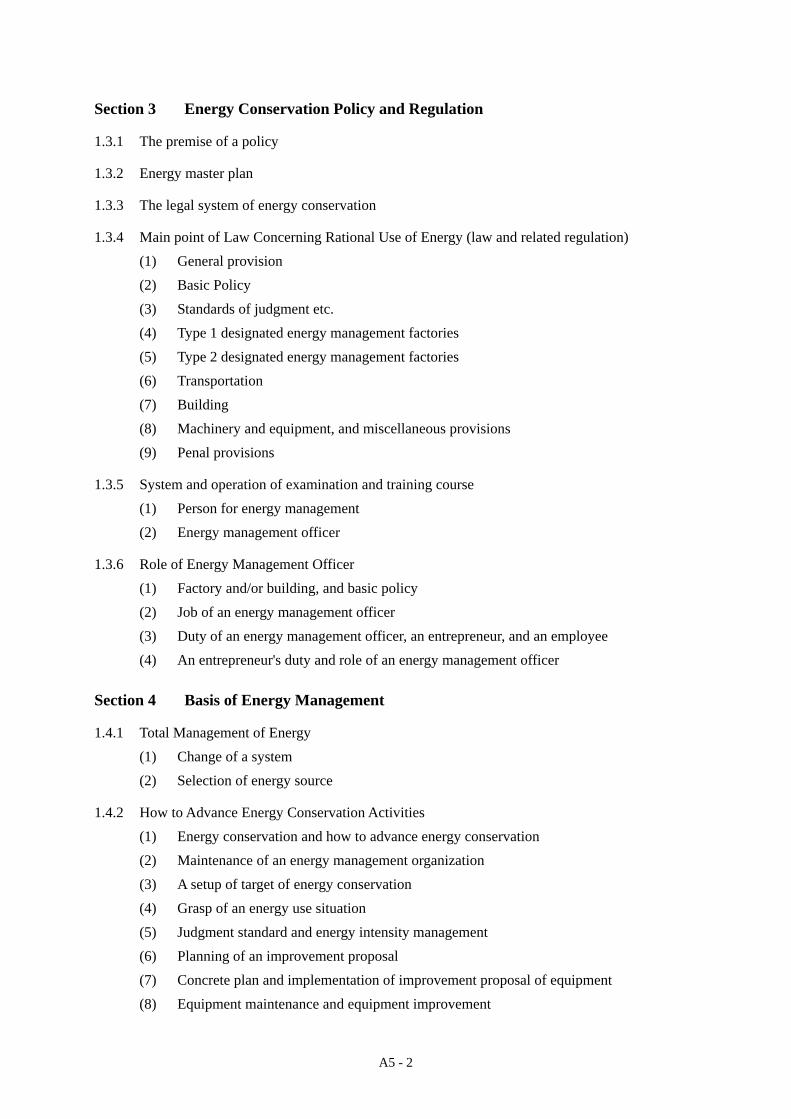
Section 3 Energy Conservation Policy and Regulation
1.3.1 The premise of a policy
1.3.2 Energy master plan
1.3.3 The legal system of energy conservation
1.3.4 Main point of Law Concerning Rational Use of Energy (law and related regulation) (1) General provision (2) Basic Policy (3) Standards of judgment etc. (4) Type 1 designated energy management factories (5) Type 2 designated energy management factories (6) Transportation (7) Building (8) Machinery and equipment, and miscellaneous provisions (9) Penal provisions
1.3.5 System and operation of examination and training course (1) Person for energy management (2) Energy management officer
1.3.6 Role of Energy Management Officer (1) Factory and/or building, and basic policy (2) Job of an energy management officer (3) Duty of an energy management officer, an entrepreneur, and an employee (4) An entrepreneur's duty and role of an energy management officer
Section 4 Basis of Energy Management
1.4.1 Total Management of Energy (1) Change of a system (2) Selection of energy source
1.4.2 How to Advance Energy Conservation Activities (1) Energy conservation and how to advance energy conservation (2) Maintenance of an energy management organization (3) A setup of target of energy conservation (4) Grasp of an energy use situation (5) Judgment standard and energy intensity management (6) Planning of an improvement proposal (7) Concrete plan and implementation of improvement proposal of equipment (8) Equipment maintenance and equipment improvement
A5 - 2
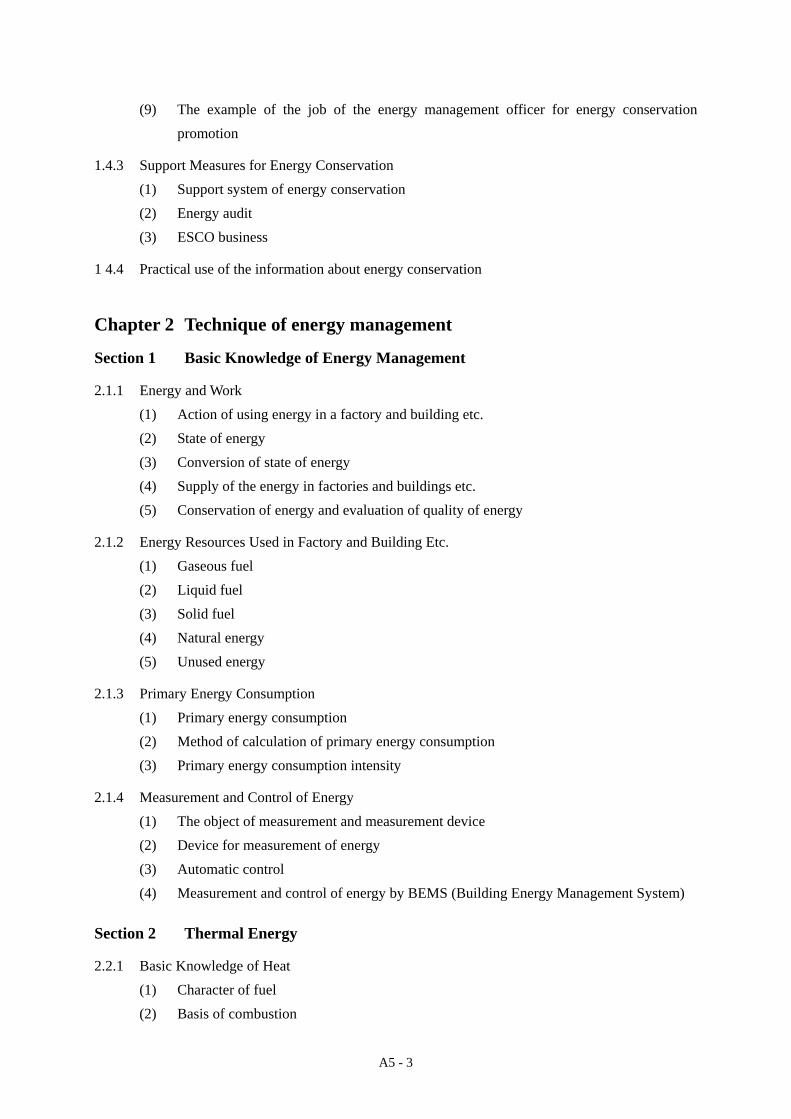
(9) The example of the job of the energy management officer for energy conservation promotion
1.4.3 Support Measures for Energy Conservation (1) Support system of energy conservation (2) Energy audit (3) ESCO business
1 4.4 Practical use of the information about energy conservation Chapter 2 Technique of energy management
Section 1 Basic Knowledge of Energy Management
2.1.1 Energy and Work (1) Action of using energy in a factory and building etc. (2) State of energy (3) Conversion of state of energy (4) Supply of the energy in factories and buildings etc. (5) Conservation of energy and evaluation of quality of energy
2.1.2 Energy Resources Used in Factory and Building Etc. (1) Gaseous fuel (2) Liquid fuel (3) Solid fuel (4) Natural energy (5) Unused energy
2.1.3 Primary Energy Consumption (1) Primary energy consumption (2) Method of calculation of primary energy consumption (3) Primary energy consumption intensity
2.1.4 Measurement and Control of Energy (1) The object of measurement and measurement device (2) Device for measurement of energy (3) Automatic control (4) Measurement and control of energy by BEMS (Building Energy Management System)
Section 2 Thermal Energy
2.2.1 Basic Knowledge of Heat (1) Character of fuel (2) Basis of combustion
A5 - 3
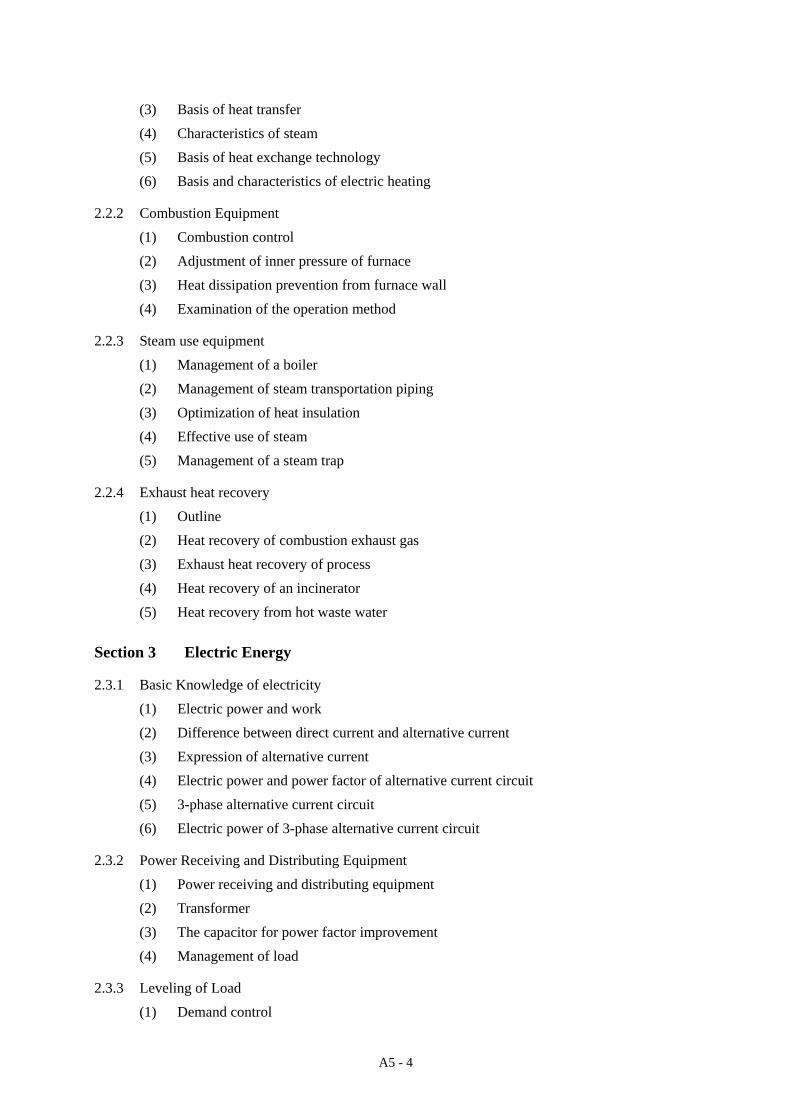
(3) Basis of heat transfer (4) Characteristics of steam (5) Basis of heat exchange technology (6) Basis and characteristics of electric heating
2.2.2 Combustion Equipment (1) Combustion control (2) Adjustment of inner pressure of furnace (3) Heat dissipation prevention from furnace wall (4) Examination of the operation method
2.2.3 Steam use equipment (1) Management of a boiler (2) Management of steam transportation piping (3) Optimization of heat insulation (4) Effective use of steam (5) Management of a steam trap
2.2.4 Exhaust heat recovery (1) Outline (2) Heat recovery of combustion exhaust gas (3) Exhaust heat recovery of process (4) Heat recovery of an incinerator (5) Heat recovery from hot waste water
Section 3 Electric Energy
2.3.1 Basic Knowledge of electricity (1) Electric power and work (2) Difference between direct current and alternative current (3) Expression of alternative current (4) Electric power and power factor of alternative current circuit (5) 3-phase alternative current circuit (6) Electric power of 3-phase alternative current circuit
2.3.2 Power Receiving and Distributing Equipment (1) Power receiving and distributing equipment (2) Transformer (3) The capacitor for power factor improvement (4) Management of load
2.3.3 Leveling of Load (1) Demand control
A5 - 4
(2) Thermal accumulating system (3) Electric power storage system
2.3.4 Electric Motor (1) Slip of induction machine (2) Characteristic of induction machine (3) Inverter (4) Energy conservation technique
2.3.5 Fluid Apparatus (1) A fan and a pump
2.3.6 Lighting (1) Basis of lighting (2) Requirements for energy conservation lighting (3) Energy consuming structure and examination item for energy conservation of lighting
equipment (4) Energy conservation technique
Section 4 Basic Knowledge of Air-conditioning
2.4.1 Basic Knowledge of Air Conditioner (1) Air conditioning system (2) Design conditions of an air conditioner (3) Kind and calculating method of heat load of air-conditioning system (4) Basic composition of an air conditioner (5) A classification and kind of air-conditioning system (6) The flow of the thermal energy in an air conditioner (7) Thermal storage type air-conditioning system (8) The evaluation index of air conditioner
Chapter 3 Service of energy management in a factory
Section 1 Energy Consumption Equipment in Factory
3.1.1 Energy Supply System (1) Outline (2) Fuel equipment (3) Power receiving and distributing system (4) Cogeneration
3.1.2 Industrial Furnace (1) Outline
A5 - 5
(2) Regenerative burner (thermal storage type burner) (3) Low air ratio combustion (4) Burner control (5) Management of an operation situation (6) Heat pattern improvement (7) Reduction of heat loss of furnace (8) Exhaust heat recovery
3.1.3 Drying Equipment (1) Outline (2) Change of drying system (3) Change of heat source (4) Change of process, medium and material (5) Operation management (6) Reduction of heat loss of furnace (7) Exhaust heat recovery
3.1.4 Boiler and Steam Use Equipment
3.1.5 Air Conditioner (1) Object and the purpose of air-conditioning (2) Characteristics of air-conditioning (3) Energy conservation of air-conditioning
3.1.6 Fluid Apparatus and Equipment (1) Air compressor (compressor) (2) Fan (fan and blower) (3) Oil hydraulic equipment (4) Vacuum pump (5) Pump (6) Water system
3.1.7 Electric Power Application Equipment (Excluding fluid equipment and transportation equipment)
3.1.8 Electric Heating (1) Characteristics of electric heating (2) Kind of electric heating (3) Technique of energy conservation
3.1.9 Lighting
3.1.10 Conveyance Equipment (1) Crane
A5 - 6
(2) Belt conveyor (3) Elevator
3.1.11 Check list for energy management (factory) Section 2 Management Standard and Report Document
3.2.1 Judgment Standard and Management Standard in Factory (1) A standard portion and a target portion (2) 6 fields and 4 management items of standard portion (3) Standard values and target values of 6 management items (4) Equipment and management standard
3.2.2 Preparation of Management Standard in Factory (1) Outline and composition of energy management standard (2) Item to be set as management standard (3) Composition and contents to be specified for management standard (4) Preparation of the energy flow diagram and management of energy consumption of the
whole factory (5) Identity of management standard and application of other standards (6) The consideration matter in the case of setup and operation of management standard (7) Important meaning and education of management standard
3 2.3 Notification and reporting of the factory by Law Concerning Rational Use of Energy (1) Submission of “Notification of energy use situation notification” (2) Submission of "Notification of assignment (death or dismiss) of Energy management
officer” (3) Periodical report (4) medium- and long-term plan
Chapter 4 Service of the energy management in building etc.
Section 1 Energy Consumption Equipment in Building etc.
4.1.1 Energy Management of Building to be aimed at Energy Conservation (1) Importance of energy management (2) Effective use of energy and resources, and useless loss (3) Actual condition of consumption of energy and resources
4.1.2 Energy Management of Air Conditioner (1) Energy management of air-conditioning individual equipment (2) Energy management as the whole air-conditioning system (3) Energy conservation in design, operation and renewal of an air conditioner
A5 - 7
A5 - 8
(4) Check list for energy-conservation of air conditioner (5) Energy conservation management and trial calculation example of effect
4.1.3 Energy management of electric equipment (1) Energy management of main equipment (2) Energy conservation management and trial calculation example of effect
4.1.4 Energy management of water supply quipment (1) Energy management of main equipment (2) Check list for energy-conservation of water supply equipment (3) Energy conservation management and trial calculation example of effect
4.1.5 Energy Management of Conveyance Equipment (1) Elevator (2) Escalator
4.1.6 Analysis and evaluation technique of energy consumption
4.1.7 Check list of energy management building etc. Section 2 Management Standard and Report Document
4.2.1 Judgment Standard and Management Standard in Building etc. (1) Standard portion and target portion (2) 6 fields and 4 management items of standard portion (3) Standard values and target values of 6 management items (4) Equipment and management standard
4.2.2 Preparation of Management Standard of Building etc. (1) Outline of management standard (2) Judgment standard and management standard (3) Composition of management standard (4) Contents of management standard (5) Grasping of actual condition of energy consuming (6) Analysis of record and data
4.2.3 Notification and reporting of Buildings by Law Concerning Rational Use of Energy (1) Submission of “Notification of energy use situation notification” (2) Submission of "Notification of assignment (death or dismiss) of Energy management
officer” (3) Periodical report (4) medium- and long-term plan
ANNEX 6
PUNISHMENT IN ENERGY CONSERVATION LAW IN JAPAN
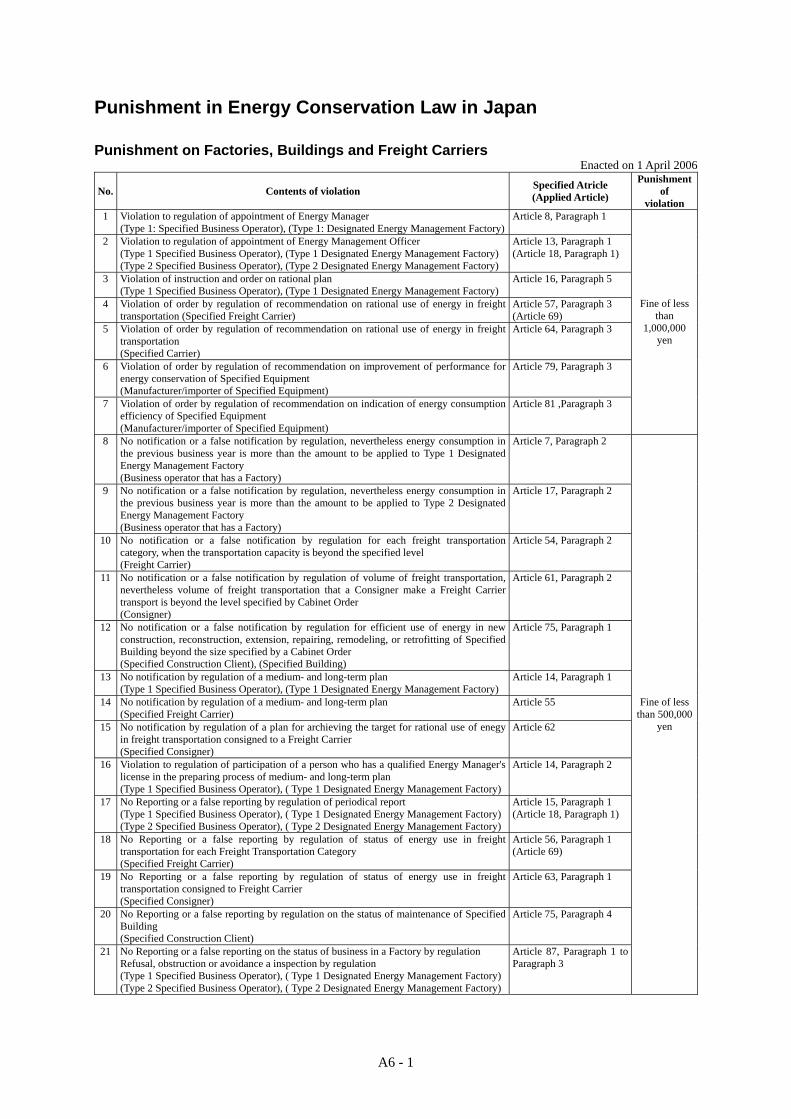
Punishment in Energy Conservation Law in Japan
Punishment on Factories, Buildings and Freight Carriers Enacted on 1 April 2006
No. Contents of violation Specified Atricle (Applied Article)
Punishment of
violation 1 Violation to regulation of appointment of Energy Manager
(Type 1: Specified Business Operator), (Type 1: Designated Energy Management Factory)Article 8, Paragraph 1
2 Violation to regulation of appointment of Energy Management Officer (Type 1 Specified Business Operator), (Type 1 Designated Energy Management Factory)(Type 2 Specified Business Operator), (Type 2 Designated Energy Management Factory)
Article 13, Paragraph 1 (Article 18, Paragraph 1)
3 Violation of instruction and order on rational plan (Type 1 Specified Business Operator), (Type 1 Designated Energy Management Factory)
Article 16, Paragraph 5
4 Violation of order by regulation of recommendation on rational use of energy in freight transportation (Specified Freight Carrier)
Article 57, Paragraph 3 (Article 69)
5 Violation of order by regulation of recommendation on rational use of energy in freight transportation (Specified Carrier)
Article 64, Paragraph 3
6 Violation of order by regulation of recommendation on improvement of performance for energy conservation of Specified Equipment (Manufacturer/importer of Specified Equipment)
Article 79, Paragraph 3
7 Violation of order by regulation of recommendation on indication of energy consumption efficiency of Specified Equipment (Manufacturer/importer of Specified Equipment)
Article 81 ,Paragraph 3
Fine of less than
1,000,000 yen
8 No notification or a false notification by regulation, nevertheless energy consumption in the previous business year is more than the amount to be applied to Type 1 Designated Energy Management Factory (Business operator that has a Factory)
Article 7, Paragraph 2
9 No notification or a false notification by regulation, nevertheless energy consumption in the previous business year is more than the amount to be applied to Type 2 Designated Energy Management Factory (Business operator that has a Factory)
Article 17, Paragraph 2
10 No notification or a false notification by regulation for each freight transportation category, when the transportation capacity is beyond the specified level (Freight Carrier)
Article 54, Paragraph 2
11 No notification or a false notification by regulation of volume of freight transportation, nevertheless volume of freight transportation that a Consigner make a Freight Carrier transport is beyond the level specified by Cabinet Order (Consigner)
Article 61, Paragraph 2
12 No notification or a false notification by regulation for efficient use of energy in new construction, reconstruction, extension, repairing, remodeling, or retrofitting of Specified Building beyond the size specified by a Cabinet Order (Specified Construction Client), (Specified Building)
Article 75, Paragraph 1
13 No notification by regulation of a medium- and long-term plan (Type 1 Specified Business Operator), (Type 1 Designated Energy Management Factory)
Article 14, Paragraph 1
14 No notification by regulation of a medium- and long-term plan (Specified Freight Carrier)
Article 55
15 No notification by regulation of a plan for archieving the target for rational use of enegy in freight transportation consigned to a Freight Carrier (Specified Consigner)
Article 62
16 Violation to regulation of participation of a person who has a qualified Energy Manager's license in the preparing process of medium- and long-term plan (Type 1 Specified Business Operator), ( Type 1 Designated Energy Management Factory)
Article 14, Paragraph 2
17 No Reporting or a false reporting by regulation of periodical report (Type 1 Specified Business Operator), ( Type 1 Designated Energy Management Factory)(Type 2 Specified Business Operator), ( Type 2 Designated Energy Management Factory)
Article 15, Paragraph 1 (Article 18, Paragraph 1)
18 No Reporting or a false reporting by regulation of status of energy use in freight transportation for each Freight Transportation Category (Specified Freight Carrier)
Article 56, Paragraph 1 (Article 69)
19 No Reporting or a false reporting by regulation of status of energy use in freight transportation consigned to Freight Carrier (Specified Consigner)
Article 63, Paragraph 1
20 No Reporting or a false reporting by regulation on the status of maintenance of Specified Building (Specified Construction Client)
Article 75, Paragraph 4
21 No Reporting or a false reporting on the status of business in a Factory by regulation Refusal, obstruction or avoidance a inspection by regulation (Type 1 Specified Business Operator), ( Type 1 Designated Energy Management Factory)(Type 2 Specified Business Operator), ( Type 2 Designated Energy Management Factory)
Article 87, Paragraph 1 to Paragraph 3
Fine of less than 500,000
yen
A6 - 1
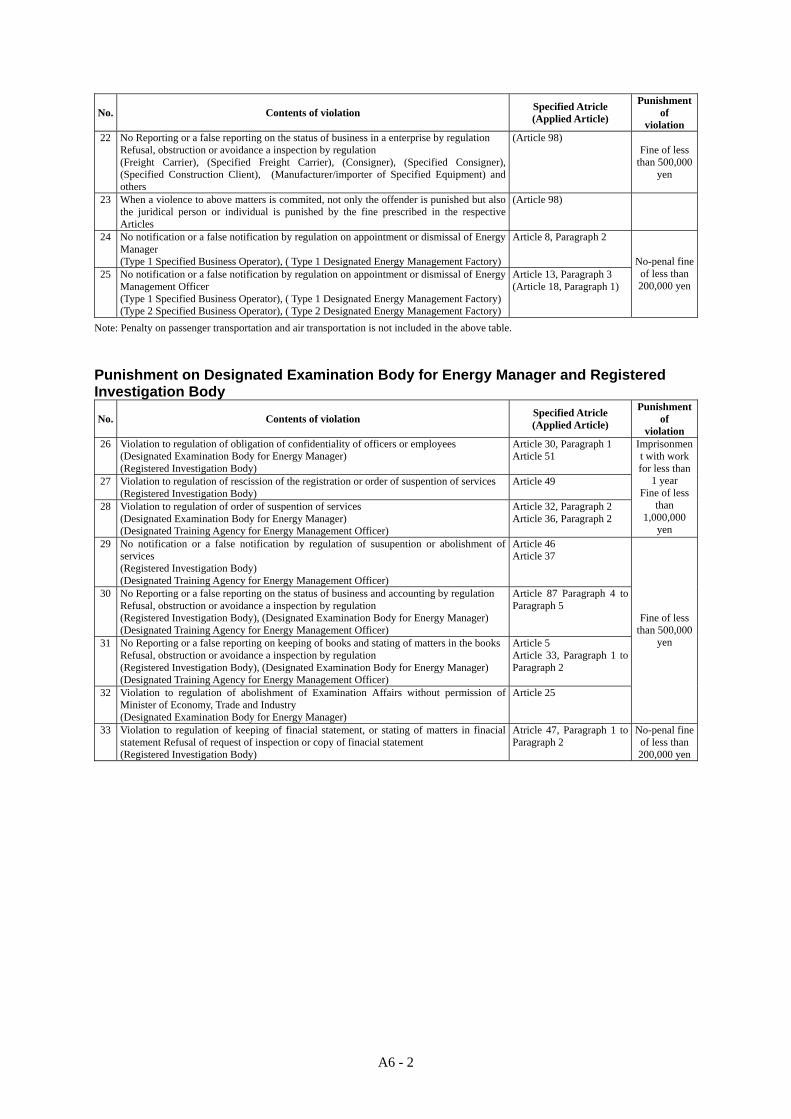
A6 - 2
No. Contents of violation Specified Atricle (Applied Article)
Punishment of
violation 22 No Reporting or a false reporting on the status of business in a enterprise by regulation
Refusal, obstruction or avoidance a inspection by regulation (Freight Carrier), (Specified Freight Carrier), (Consigner), (Specified Consigner), (Specified Construction Client), (Manufacturer/importer of Specified Equipment) and others
(Article 98) Fine of less
than 500,000 yen
23 When a violence to above matters is commited, not only the offender is punished but also the juridical person or individual is punished by the fine prescribed in the respective Articles
(Article 98)
24 No notification or a false notification by regulation on appointment or dismissal of Energy Manager (Type 1 Specified Business Operator), ( Type 1 Designated Energy Management Factory)
Article 8, Paragraph 2
25 No notification or a false notification by regulation on appointment or dismissal of Energy Management Officer (Type 1 Specified Business Operator), ( Type 1 Designated Energy Management Factory)(Type 2 Specified Business Operator), ( Type 2 Designated Energy Management Factory)
Article 13, Paragraph 3 (Article 18, Paragraph 1)
No-penal fine of less than 200,000 yen
Note: Penalty on passenger transportation and air transportation is not included in the above table. Punishment on Designated Examination Body for Energy Manager and Registered Investigation Body
No. Contents of violation Specified Atricle (Applied Article)
Punishment of
violation 26 Violation to regulation of obligation of confidentiality of officers or employees
(Designated Examination Body for Energy Manager) (Registered Investigation Body)
Article 30, Paragraph 1 Article 51
27 Violation to regulation of rescission of the registration or order of suspention of services (Registered Investigation Body)
Article 49
28 Violation to regulation of order of suspention of services (Designated Examination Body for Energy Manager) (Designated Training Agency for Energy Management Officer)
Article 32, Paragraph 2 Article 36, Paragraph 2
Imprisonment with work for less than
1 year Fine of less
than 1,000,000
yen 29 No notification or a false notification by regulation of susupention or abolishment of
services (Registered Investigation Body) (Designated Training Agency for Energy Management Officer)
Article 46 Article 37
30 No Reporting or a false reporting on the status of business and accounting by regulation Refusal, obstruction or avoidance a inspection by regulation (Registered Investigation Body), (Designated Examination Body for Energy Manager) (Designated Training Agency for Energy Management Officer)
Article 87 Paragraph 4 to Paragraph 5
31 No Reporting or a false reporting on keeping of books and stating of matters in the booksRefusal, obstruction or avoidance a inspection by regulation (Registered Investigation Body), (Designated Examination Body for Energy Manager) (Designated Training Agency for Energy Management Officer)
Article 5 Article 33, Paragraph 1 to Paragraph 2
32 Violation to regulation of abolishment of Examination Affairs without permission of Minister of Economy, Trade and Industry (Designated Examination Body for Energy Manager)
Article 25
Fine of less than 500,000
yen
33 Violation to regulation of keeping of finacial statement, or stating of matters in finacial statement Refusal of request of inspection or copy of finacial statement (Registered Investigation Body)
Atricle 47, Paragraph 1 to Paragraph 2
No-penal fine of less than 200,000 yen

ANNEX 7
EE&C AWARD IN JAPAN
1. Energy Efficiency Commendation Program
The Energy Efficiency Commendation Program has an objective to raise awareness toward energy conservation and to promote energy efficient equipments and systems through giving award to individual, group, factory and firm who contributes to promotion of energy conservation. The program aims to contribute to development of energy efficiency industry and establishment of energy efficient society. The program used to give award only to the energy efficient equipment and system in the commercial and residential sector. From this year, “human resource” and “organization” are added as award to the program. This program is being implemented by The Energy Conservation Center, Japan (ECCJ) in commission from the Ministry of Economy, Trade and Industry, Japan (METI) (cited from home page of ECCJ: http://www.eccj.or.jp/bigaward/index.html).
Table 1 Category of Award
inside firm Human resource
support service
CGO (Chief Green Officer)/ inside firm
Case: inside-firm (industrial)
Case: inside-firm (commercial) Organization
Case: inside-firm(support service)
Residential sector
Commercial sector Equipment and system
Vehicle
Source: Website of ECCJ: http://www.eccj.or.jp/bigaward/index.html
Figure 1 Energy Conservation Grand Prize
Source: Website of ECCJ: http://www.eccj.or.jp/bigaward/index.html
A7 - 1
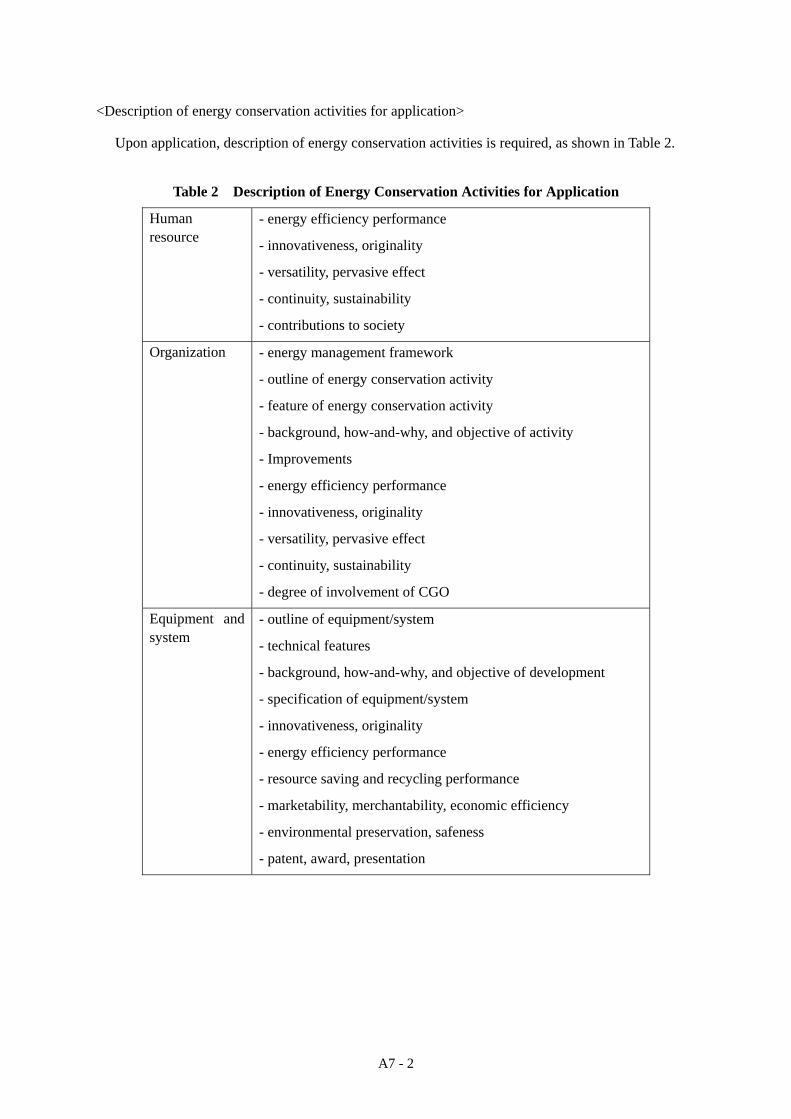
<Description of energy conservation activities for application>
Upon application, description of energy conservation activities is required, as shown in Table 2.
Table 2 Description of Energy Conservation Activities for Application
Human resource
- energy efficiency performance
- innovativeness, originality
- versatility, pervasive effect
- continuity, sustainability
- contributions to society
Organization - energy management framework
- outline of energy conservation activity
- feature of energy conservation activity
- background, how-and-why, and objective of activity
- Improvements
- energy efficiency performance
- innovativeness, originality
- versatility, pervasive effect
- continuity, sustainability
- degree of involvement of CGO
Equipment and system
- outline of equipment/system
- technical features
- background, how-and-why, and objective of development
- specification of equipment/system
- innovativeness, originality
- energy efficiency performance
- resource saving and recycling performance
- marketability, merchantability, economic efficiency
- environmental preservation, safeness
- patent, award, presentation
A7 - 2
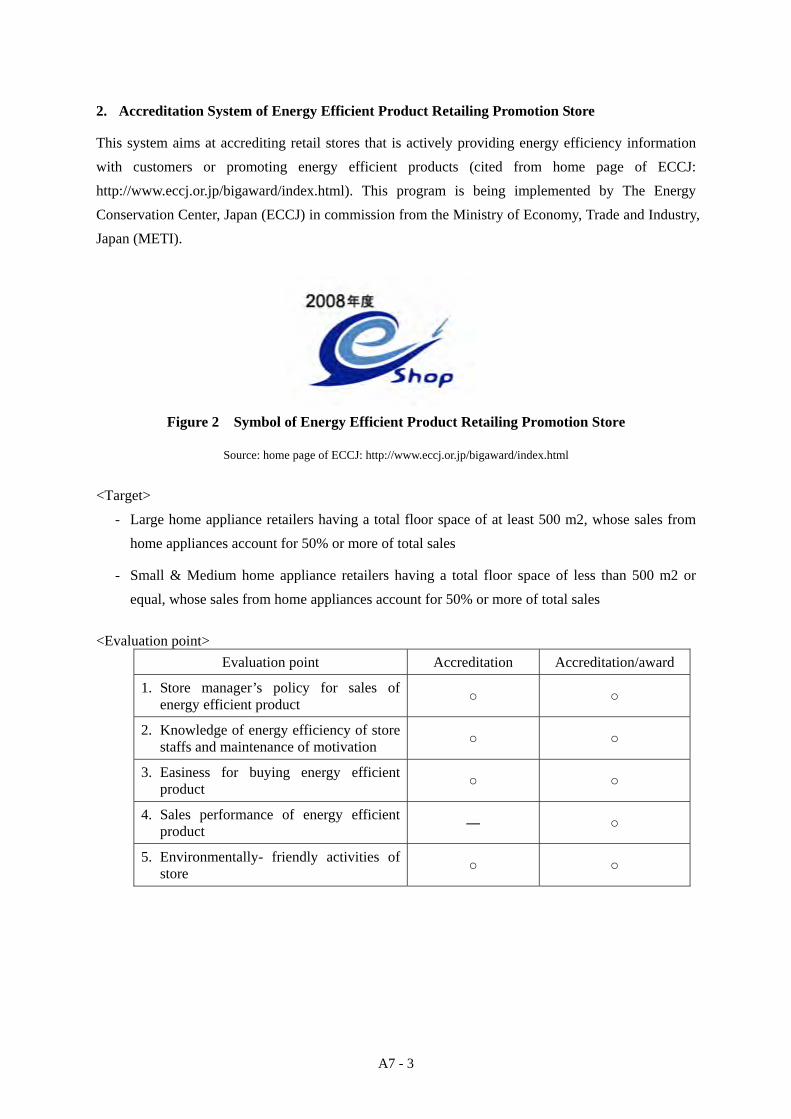
2. Accreditation System of Energy Efficient Product Retailing Promotion Store
This system aims at accrediting retail stores that is actively providing energy efficiency information with customers or promoting energy efficient products (cited from home page of ECCJ: http://www.eccj.or.jp/bigaward/index.html). This program is being implemented by The Energy Conservation Center, Japan (ECCJ) in commission from the Ministry of Economy, Trade and Industry, Japan (METI).
Figure 2 Symbol of Energy Efficient Product Retailing Promotion Store
Source: home page of ECCJ: http://www.eccj.or.jp/bigaward/index.html
<Target>
- Large home appliance retailers having a total floor space of at least 500 m2, whose sales from home appliances account for 50% or more of total sales
- Small & Medium home appliance retailers having a total floor space of less than 500 m2 or equal, whose sales from home appliances account for 50% or more of total sales
<Evaluation point>
Evaluation point Accreditation Accreditation/award
1. Store manager’s policy for sales of energy efficient product ○ ○
2. Knowledge of energy efficiency of store staffs and maintenance of motivation ○ ○
3. Easiness for buying energy efficient product ○ ○
4. Sales performance of energy efficient product ― ○
5. Environmentally- friendly activities of store ○ ○
A7 - 3

3. Commendation Program for Superior Energy-Saving Machines
Every year the JMF presents awards to companies or groups of companies judged to have contributed to the promotion of efficient use of energy by developing and commercializing superior energy-saving machines. Eligible machinery should be developed and commercialized within the previous three years and should fall into one of the following categories: (1) general machinery as well as installations, facilities, and systems; (2) gauges and various measuring instruments; (3) machinery utilizing non-recycled resources such as industrial wastes, garbage, methane gas, and agricultural wastes (Automobiles and air conditioners are not eligible) (cited from home page of The Japan
Machinery Federation: http://www.jmf.or.jp/japanese/commendations/energy/index.html).
Figure 3 Symbol for Superior Energy-Saving Machines
Source: home page of The Japan Machinery Federation: http://www.jmf.or.jp/japanese/commendations/energy/index.html
A7 - 4
ANNEX 8
CONVERSION FACTOR OF
ELECTRICITY TO PRIMARY ENERGY
The Study on Master Plan of Energy Conservation and Effective Use in The Socialist Republic of Vietnam
A8-1
Conversion Factorof Electricity to Primary Energy
The Study on Master Plan of Energy Conservation and Effective Use in The Socialist Republic of Vietnam
A8-2
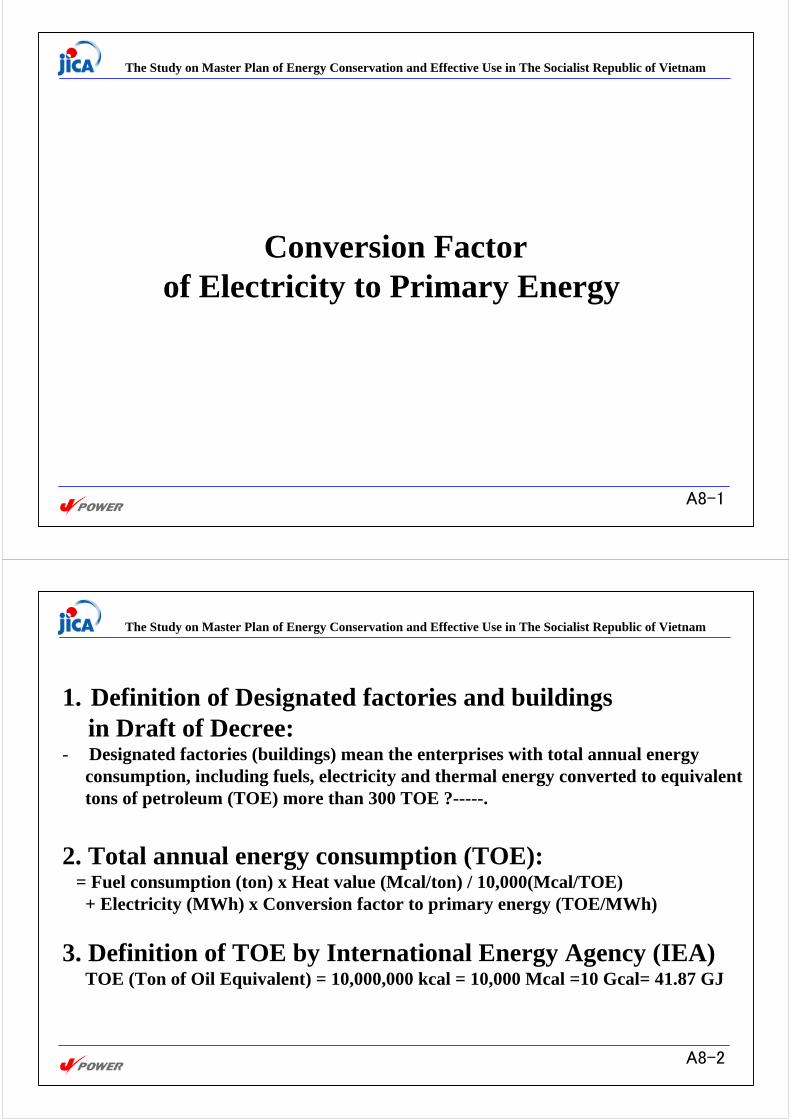
1. Definition of Designated factories and buildings in Draft of Decree:
- Designated factories (buildings) mean the enterprises with total annual energyconsumption, including fuels, electricity and thermal energy converted to equivalent tons of petroleum (TOE) more than 300 TOE ?-----.
2. Total annual energy consumption (TOE):= Fuel consumption (ton) x Heat value (Mcal/ton) / 10,000(Mcal/TOE)
+ Electricity (MWh) x Conversion factor to primary energy (TOE/MWh)
3. Definition of TOE by International Energy Agency (IEA)TOE (Ton of Oil Equivalent) = 10,000,000 kcal = 10,000 Mcal =10 Gcal= 41.87 GJ
The Study on Master Plan of Energy Conservation and Effective Use in The Socialist Republic of Vietnam
A8-3
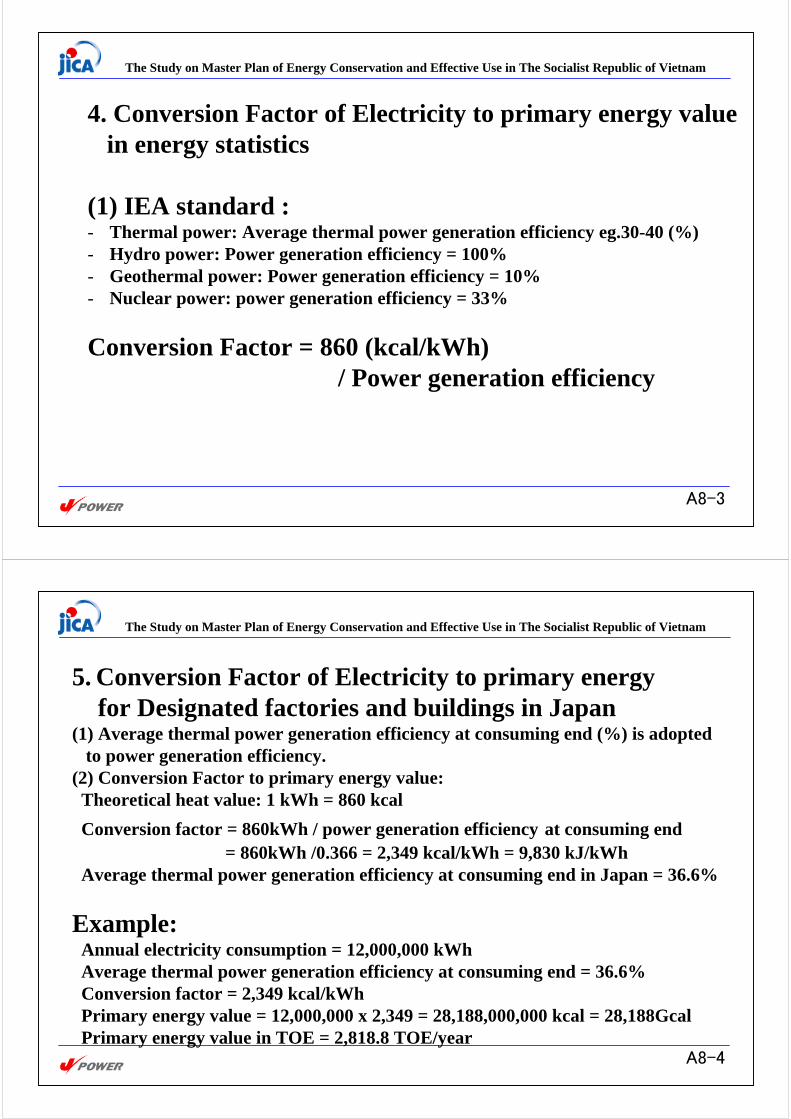
4. Conversion Factor of Electricity to primary energy value in energy statistics
(1) IEA standard :- Thermal power: Average thermal power generation efficiency eg.30-40 (%)- Hydro power: Power generation efficiency = 100%- Geothermal power: Power generation efficiency = 10%- Nuclear power: power generation efficiency = 33%
Conversion Factor = 860 (kcal/kWh)/ Power generation efficiency
The Study on Master Plan of Energy Conservation and Effective Use in The Socialist Republic of Vietnam
A8-4
5. Conversion Factor of Electricity to primary energyfor Designated factories and buildings in Japan
(1) Average thermal power generation efficiency at consuming end (%) is adopted to power generation efficiency.
(2) Conversion Factor to primary energy value:Theoretical heat value: 1 kWh = 860 kcalConversion factor = 860kWh / power generation efficiency at consuming end
= 860kWh /0.366 = 2,349 kcal/kWh = 9,830 kJ/kWhAverage thermal power generation efficiency at consuming end in Japan = 36.6%
Example:Annual electricity consumption = 12,000,000 kWhAverage thermal power generation efficiency at consuming end = 36.6%Conversion factor = 2,349 kcal/kWhPrimary energy value = 12,000,000 x 2,349 = 28,188,000,000 kcal = 28,188GcalPrimary energy value in TOE = 2,818.8 TOE/year
The Study on Master Plan of Energy Conservation and Effective Use in The Socialist Republic of Vietnam
A8-5
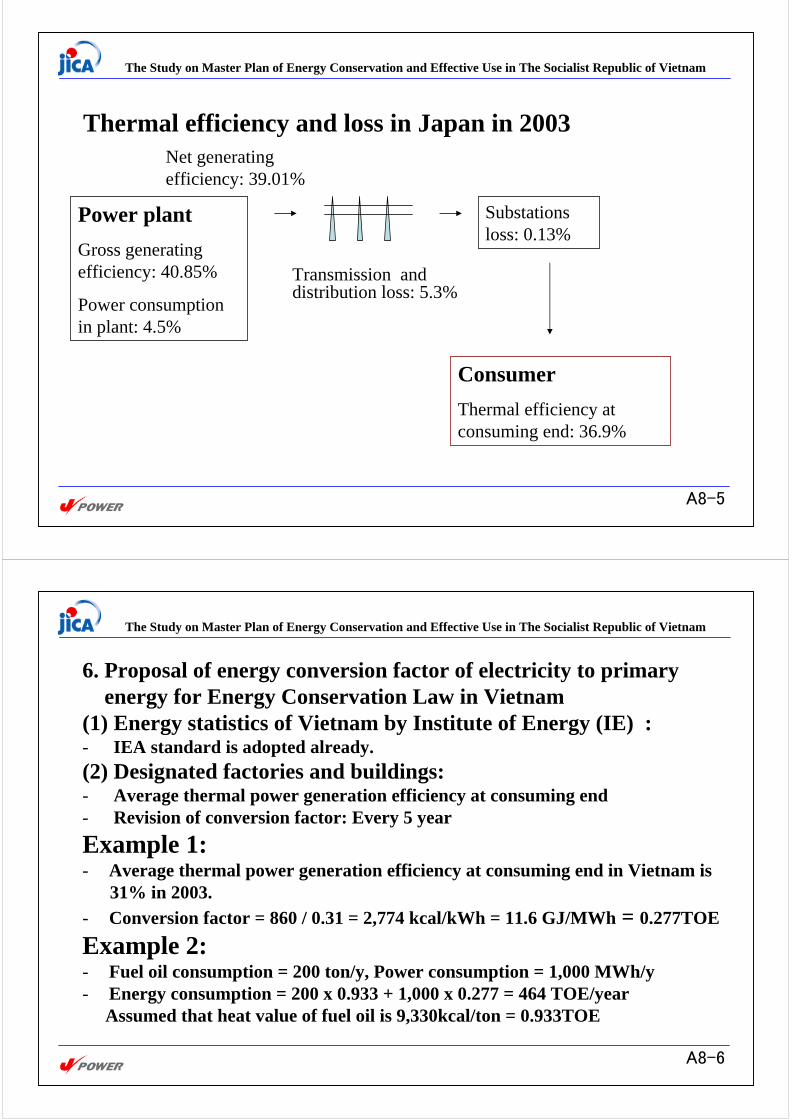
Power plantGross generating efficiency: 40.85%
Power consumption in plant: 4.5%
Transmission and distribution loss: 5.3%
Substations loss: 0.13%
ConsumerThermal efficiency at consuming end: 36.9%
Thermal efficiency and loss in Japan in 2003Net generating efficiency: 39.01%
The Study on Master Plan of Energy Conservation and Effective Use in The Socialist Republic of Vietnam
A8-6
6. Proposal of energy conversion factor of electricity to primary energy for Energy Conservation Law in Vietnam
(1) Energy statistics of Vietnam by Institute of Energy (IE) :- IEA standard is adopted already.(2) Designated factories and buildings:- Average thermal power generation efficiency at consuming end - Revision of conversion factor: Every 5 yearExample 1:- Average thermal power generation efficiency at consuming end in Vietnam is
31% in 2003.- Conversion factor = 860 / 0.31 = 2,774 kcal/kWh = 11.6 GJ/MWh = 0.277TOE Example 2:- Fuel oil consumption = 200 ton/y, Power consumption = 1,000 MWh/y- Energy consumption = 200 x 0.933 + 1,000 x 0.277 = 464 TOE/year
Assumed that heat value of fuel oil is 9,330kcal/ton = 0.933TOE
ANNEX 9
ENERGY INTENSITY AND ELASTICITY

The Study on Master Plan of Energy Conservation and Effective Use in The Socialist Republic of Vietnam
Energy Intensity and Elasticity
A9-1
The Study on Master Plan of Energy Conservation and Effective Use in The Socialist Republic of Vietnam
Presentation Outline• Energy Intensity• What is Energy Intensity?• How is it related to the policy issue?• How to measure Energy Intensity?• Is Aggregate Energy Intensity a good indicator to measure energy
efficiency?• How about the Sectoral and Sub-Sectoral Energy Intensities?• Energy Elasticity• What is Energy Elasticity?• How is it related to the policy issue?• Why it tends to be different between developed and developing
countries?• Indonesia’s Energy Intensity and Energy Elasticity• Data availability for the calculation• Tentative results of calculation
A9-2
The Study on Master Plan of Energy Conservation and Effective Use in The Socialist Republic of Vietnam
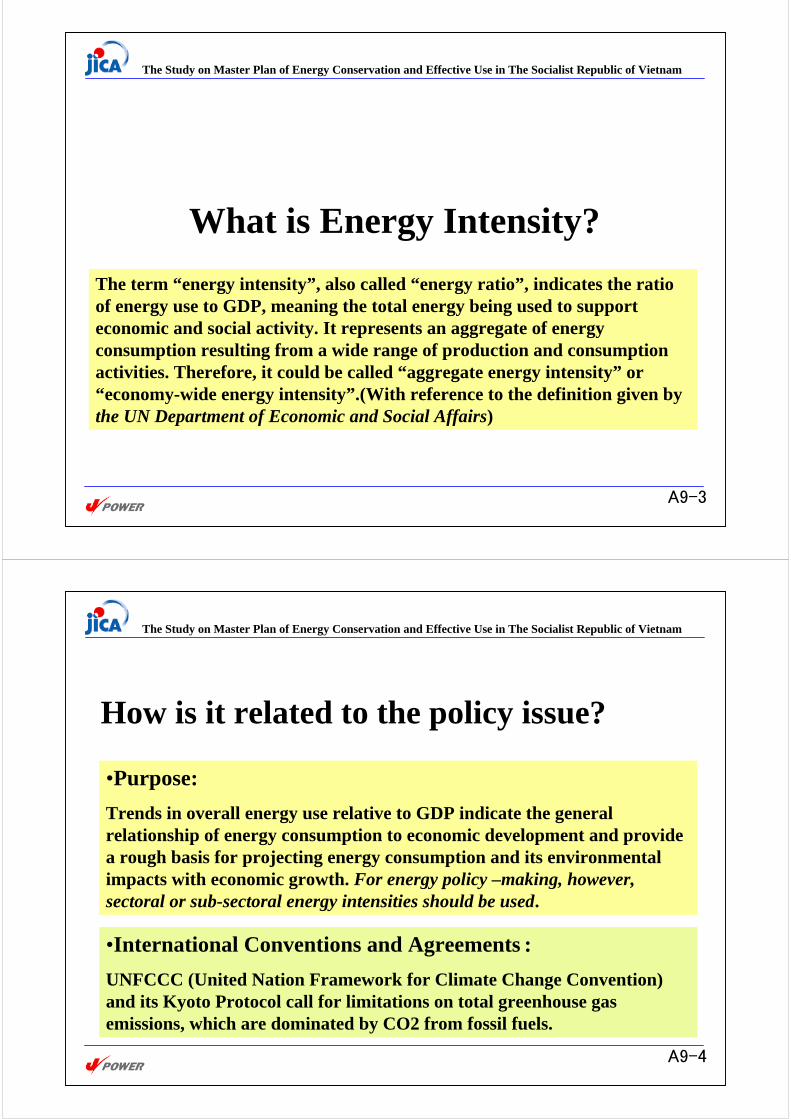
What is Energy Intensity?The term “energy intensity”, also called “energy ratio”, indicates the ratio of energy use to GDP, meaning the total energy being used to support economic and social activity. It represents an aggregate of energy consumption resulting from a wide range of production and consumption activities. Therefore, it could be called “aggregate energy intensity” or “economy-wide energy intensity”.(With reference to the definition given by the UN Department of Economic and Social Affairs)
A9-3
The Study on Master Plan of Energy Conservation and Effective Use in The Socialist Republic of Vietnam
How is it related to the policy issue?
•Purpose: Trends in overall energy use relative to GDP indicate the general relationship of energy consumption to economic development and provide a rough basis for projecting energy consumption and its environmental impacts with economic growth. For energy policy –making, however, sectoral or sub-sectoral energy intensities should be used.
•International Conventions and Agreements : UNFCCC (United Nation Framework for Climate Change Convention) and its Kyoto Protocol call for limitations on total greenhouse gas emissions, which are dominated by CO2 from fossil fuels.
A9-4
The Study on Master Plan of Energy Conservation and Effective Use in The Socialist Republic of Vietnam
How is it related to the policy issue? •International Targets/Recommended Standards : There are no specific targets for energy intensity. The Kyoto Protocol sets targets for total greenhouse gas emissions for developed countries only.
•Linkages to Other Indicators : The ratio of energy use to GDP is an aggregate of sectoral energy intensity indicators and is thus linked to the energy intensities for the manufacturing, transportation, commercial/services and residential sectors. This indicator is also linked to indicators for total energy consumption, greenhouse gas emissions and air pollution emissions.
A9-5
The Study on Master Plan of Energy Conservation and Effective Use in The Socialist Republic of Vietnam
•Measurement of Energy Use : Total and sectoral energy consumption is obtained from national energy balances. Household and services/commercial consumption should be carefully separated, and manufacturing should be separated from other industries and agriculture.
Unit: Energy is measured in Joule
•Measurement of Output : Components of GDP should be deflated to constant dollars by chaining each component, not simply by deflating each component by the overall GDP deflator.
Unit: GDP is measured in US dollars, converted from real local currency at purchasing power parity (PPP) for the base year to which local currency was deflated.
How to measure Energy Intensity?
A9-6
The Study on Master Plan of Energy Conservation and Effective Use in The Socialist Republic of Vietnam
Is “Aggregate (nation wide)” Energy Intensity a good indicator to measure energy efficiency?----No, because of the limitations below.
Energy/ Product amount (ton etc)
• Influenced by the Economic Structure and Sectoral Energy Intensities
•Variety of Products makes hard to calculate the Production amount
•Geographical Factors Influence the Comparison of Energy Intensity among Countries
•Difference of Energy Sources Confuse the Interpretation of Energy Intensity
A9-7
The Study on Master Plan of Energy Conservation and Effective Use in The Socialist Republic of Vietnam
•The ratio of sectoral or sub-sectoral energy use to the output or activity of the sector or sub-sector provides a more useful indicator of energy intensity.
•Total energy use should be disaggregated into components, by sector (manufacturing, transportation, residential, commercial/services, industry, agriculture, construction, etc.) or sub-sector.
How about the Sectoral and Sub-sectoralEnergy Intensities?
----Opinions given by the UN Department of Economicand Social Affairs:
•For each sector or sub-sector, energy use can be related to a convenient measure of output to provide a sectoral or sub-sectoral energy intensity. E.g. > energy use for steel-making relative to tonnes of steel produced > energy consumption by passenger vehicles relative to passenger- or vehicle-kilometers > energy consumption in buildings relative to their floor area.
A9-8

The Study on Master Plan of Energy Conservation and Effective Use in The Socialist Republic of Vietnam
Table: Summary of Major Sectoral Intensity IndicatorsIntensity of Energy Use
In ManufacturingIntensity of Energy Use
In the Commercial/ Service Sectors
Intensity of Energy UseIn the Residential Sectors
Brief Definition
Energy consumption per unit of manufacturing output
Energy consumption per unit of commercial/service sector output or per unit of commercial/service sector floor area.
Amount of energy used per capita or household in the residential sector
Unit ofMeasurement
Megajoules (MJ) per unit output of the manufacturing sector in constant US$
Megajoules per US$ (MJ/$) or megajoules per square meters (MJ/m2).
Gigajoules (GJ) per capita or GJ per household
Relevance to Sustainable Development
Sustainable development requires increases in energy efficiency in order to reduce fossil fuel consumption, greenhouse gas emissions and related air pollution emissions.
The sector is less energy intensive than manufacturing and the growth of it relative to manufacturing contributes to the long-term reduction in the total energy intensity, though a large consumer of electricity.
As a major consumer of energy with a distinctive pattern of usage, many policies addressing energy efficiency and savings have been formulated for this sector, with the electric appliance as the focus.
International Arrangements
There are the UNFCCC and its Kyoto Protocol. Without specific international targets regarding energy use or energy efficiency, many industrialized countries have targets for reducing energy use and carbon emissions from manufacturing branches.
Without international agreements, international targets or standards, some countries are promulgating energy-efficiency standards for lighting, office equipment or other devices, while others are negotiating voluntary agreements to reduce energy consumption per square meter of floor space.
Without international agreements or targets, thermal standards for new homes are in effect in most of OECD and East European countries, China and some other countries in colder climates. Many have efficiency standards for boilers, some have efficiency standards on electric appliances.
A9-9
The Study on Master Plan of Energy Conservation and Effective Use in The Socialist Republic of Vietnam
What is Energy Elasticity?•The term “energy elasticity”, also known as “energy coefficient”, refers to the sensitivity of energy consumption in response to the growth of GDP, or in other words, the percentage change in energy use associated with one percent change in economic activity. (F. Gerard Adams and Peter Miovic )
•While “energy intensity” is a concept with implication of “marginality”, “energy elasticity” is a concept with implication of “average”. (Ozawa Masaharu )
A9-10
The Study on Master Plan of Energy Conservation and Effective Use in The Socialist Republic of Vietnam
How is it related to the policy issue?•The long term forecast of energy consumption is usually based on functional relationships between energy consumption and economic activity, regarding which past studies in Western Europe and the United States have frequently used the “energy elasticity”.
•The implicit “energy elasticity”, overall or sector-by-sector, remains an important consideration in judging the reasonableness or consistency of the forecast, though recent work has tended toward increased methodological sophistication.(F. Gerard Adams and Peter Miovic)
A9-11
The Study on Master Plan of Energy Conservation and Effective Use in The Socialist Republic of Vietnam
Why Energy Elasticity tends to be different between developed and developing countries?•Since in advanced economies fuel use appears to grow more slowly than GNP; the elasticities generally have been found to be less than 1.0. Gross elasticities of energy consumption with respect to GNP have been estimated variously as between 0.7 and 0.9 and somewhat lower with respect to industrial production. In the developing countries, in contrast, the elasticity is frequently substantially above 1.0.
•By conversion to more efficient from less efficient fuels, the unadjusted elasticity was often less than 1.0 in developed countries. The adjusted elasticities on the other hand lay between 1.23 and 1.4 when related to GDP and between 1.04 and 1.15 when related to industrial production.
(F. Gerard Adams and Peter Miovic)
A9-12

ANNEX 10
ON-SITE SURVEY REPORT (INDUSTRY)
The Study on Master Plan for Energy Conservation and Effective Use in the Socialist Republic of VietNam
Final ReportA10 - 1
The Study on Master Plan for
Energy Conservation and Efficient Use in
the Socialist Republic of Viet Nam
On-site Survey Report (Factories)
December 2009
The Study on Master Plan for Energy Conservation and Effective Use in the Socialist Republic of VietNam
Final ReportA10 - 2
1. Steel-making Factory A
1.1 Introduction
1) Factory name: Steel-making Factory A
2) Location: Hanoi City
3) Description of business
(1) Sub-sector of industry: Steel rolling mill industry
(2) Main products: Wire rod (6 to 8 mm in diameter), Deformed bar (10 to 40 mm in diameter)
(3) Production capacity: 250,000 ton/y
(4) Annual production: 180,000 ton/y
(5) Number of employees: 245 persons
4) Person in charge of energy on-site survey: Production Manager and Electricity Manager
5) Outline of the factory
The factory is a rolling mill, which began production of wire rod and deformed bar in 2001.
Billets are supplied from group companies, because the factory does not have steel-making
facilities.
1.2 Outline of energy on-site survey
1) Survey team member
JICA Study Team: Mr. Norio Fukushima, Mr. Wataru Ishikawa, Mr. Hisashi Amano,
Mr. Yoichi Isobe, Mr. Takeshi Onoguchi
Institute of Energy: Mr. Hung, Mr. Song, Mr. Hoang Anh, Mr. Hau
2) Surveyed period: 1st to 3rd October, 2008 (3 days)
3) Surveyed equipment: Steel billet reheating furnace, cooling tower, receiving and transforming
equipment and air compressor
1.3 Results of energy on-site survey
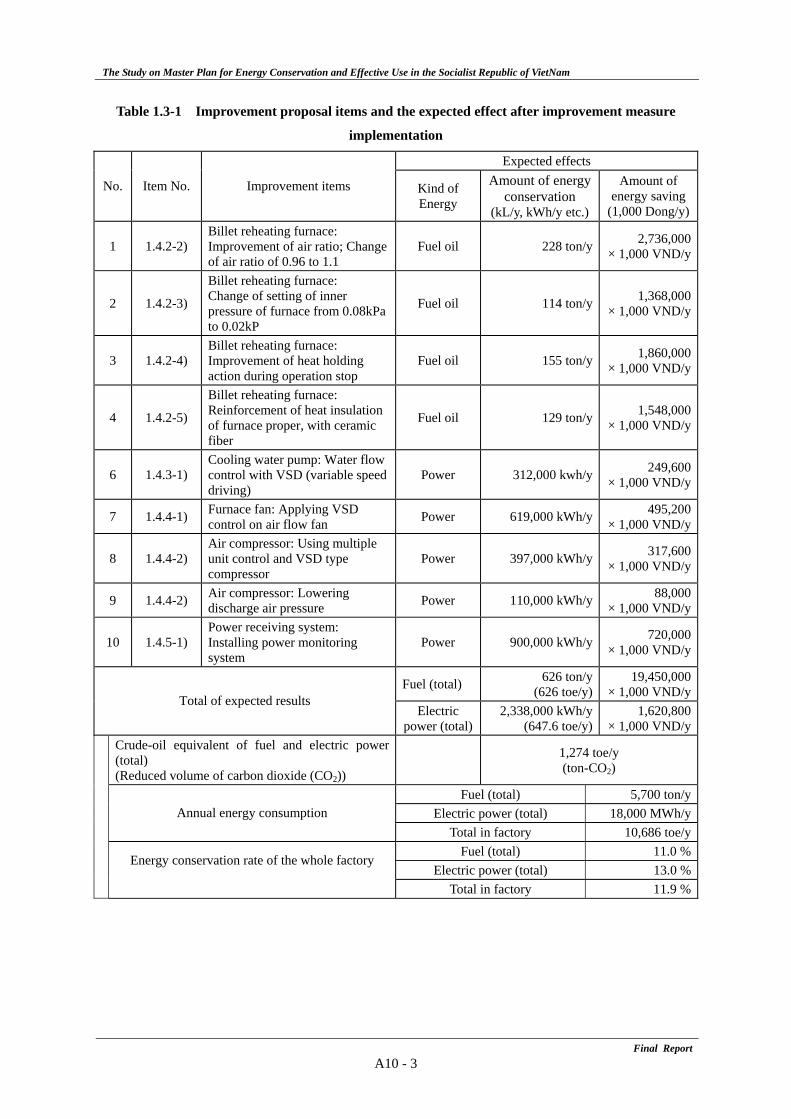
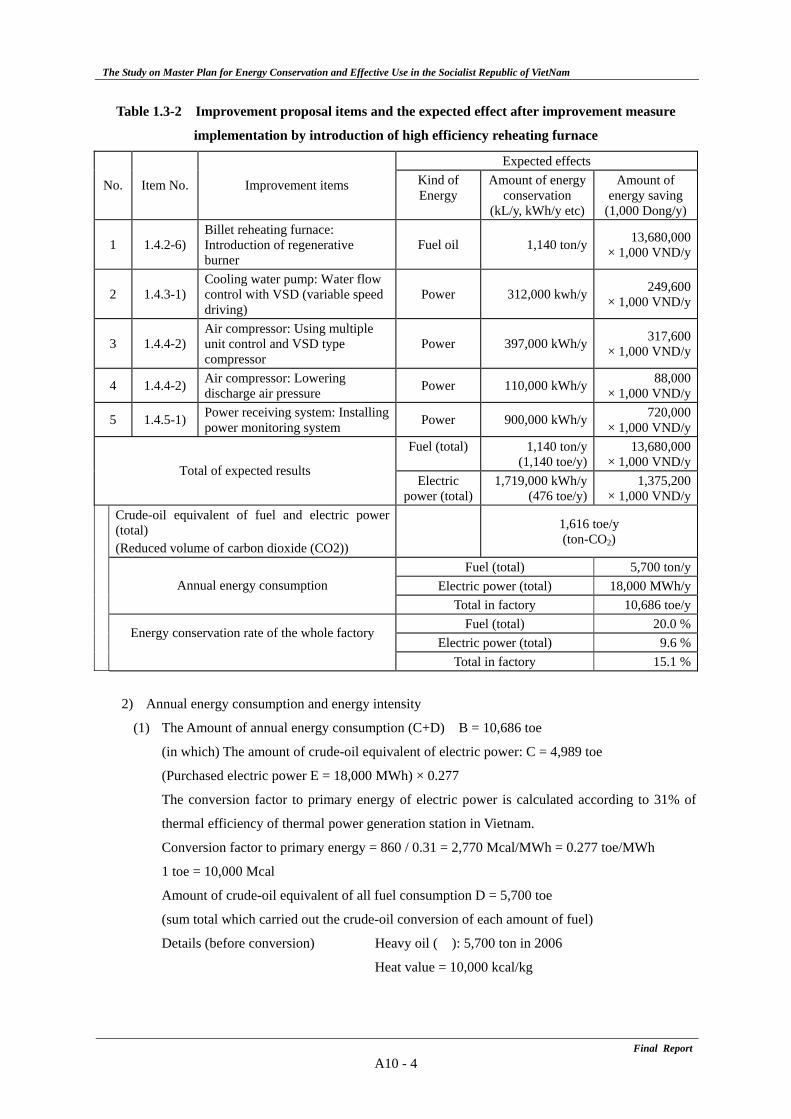
1) Improvement proposal items and the expected effects after improvement measure implementation
are shown in Table 1.3-1 and expected effects by introduction of high efficient reheating furnace
with regenerative burner are shown in Figure 1.4.2-1.
The EE&C potential in the present equipment is 11.0%, and also the EE&C potential by
introduction of high efficient reheating furnace is 15.1%.
The Study on Master Plan for Energy Conservation and Effective Use in the Socialist Republic of VietNam
Final ReportA10 - 3
Table 1.3-1 Improvement proposal items and the expected effect after improvement measure
implementation
Expected effects
No. Item No. Improvement items Kind of Energy
Amount of energy conservation
(kL/y, kWh/y etc.)
Amount of energy saving
(1,000 Dong/y)
1 1.4.2-2) Billet reheating furnace: Improvement of air ratio; Change of air ratio of 0.96 to 1.1
Fuel oil 228 ton/y 2,736,000× 1,000 VND/y
2 1.4.2-3)
Billet reheating furnace: Change of setting of inner pressure of furnace from 0.08kPa to 0.02kP
Fuel oil 114 ton/y 1,368,000× 1,000 VND/y
3 1.4.2-4) Billet reheating furnace: Improvement of heat holding action during operation stop
Fuel oil 155 ton/y 1,860,000× 1,000 VND/y
4 1.4.2-5)
Billet reheating furnace: Reinforcement of heat insulation of furnace proper, with ceramic fiber
Fuel oil 129 ton/y 1,548,000× 1,000 VND/y
6 1.4.3-1) Cooling water pump: Water flow control with VSD (variable speed driving)
Power 312,000 kwh/y 249,600× 1,000 VND/y
7 1.4.4-1) Furnace fan: Applying VSD control on air flow fan Power 619,000 kWh/y 495,200
× 1,000 VND/y
8 1.4.4-2) Air compressor: Using multiple unit control and VSD type compressor
Power 397,000 kWh/y 317,600× 1,000 VND/y
9 1.4.4-2) Air compressor: Lowering discharge air pressure Power 110,000 kWh/y 88,000
× 1,000 VND/y
10 1.4.5-1) Power receiving system: Installing power monitoring system
Power 900,000 kWh/y 720,000× 1,000 VND/y
Fuel (total) 626 ton/y (626 toe/y)
19,450,000× 1,000 VND/y
Total of expected results Electric
power (total)2,338,000 kWh/y
(647.6 toe/y) 1,620,800
× 1,000 VND/yCrude-oil equivalent of fuel and electric power (total) (Reduced volume of carbon dioxide (CO2))
1,274 toe/y (ton-CO2)
Fuel (total) 5,700 ton/yElectric power (total) 18,000 MWh/yAnnual energy consumption
Total in factory 10,686 toe/y
Fuel (total) 11.0 %
Energy conservation rate of the whole factory Electric power (total) 13.0 %
Total in factory 11.9 %
The Study on Master Plan for Energy Conservation and Effective Use in the Socialist Republic of VietNam
Final ReportA10 - 4
Table 1.3-2 Improvement proposal items and the expected effect after improvement measure
implementation by introduction of high efficiency reheating furnace
Expected effects
No. Item No. Improvement items Kind of Energy
Amount of energy conservation
(kL/y, kWh/y etc)
Amount of energy saving
(1,000 Dong/y)
1 1.4.2-6) Billet reheating furnace: Introduction of regenerative burner
Fuel oil 1,140 ton/y 13,680,000× 1,000 VND/y
2 1.4.3-1) Cooling water pump: Water flow control with VSD (variable speed driving)
Power 312,000 kwh/y 249,600× 1,000 VND/y
3 1.4.4-2) Air compressor: Using multiple unit control and VSD type compressor
Power 397,000 kWh/y 317,600× 1,000 VND/y
4 1.4.4-2) Air compressor: Lowering discharge air pressure Power 110,000 kWh/y 88,000
× 1,000 VND/y
5 1.4.5-1) Power receiving system: Installing power monitoring system Power 900,000 kWh/y 720,000
× 1,000 VND/yFuel (total) 1,140 ton/y
(1,140 toe/y) 13,680,000
× 1,000 VND/yTotal of expected results
Electric power (total)
1,719,000 kWh/y (476 toe/y)
1,375,200× 1,000 VND/y
Crude-oil equivalent of fuel and electric power (total) (Reduced volume of carbon dioxide (CO2))
1,616 toe/y (ton-CO2)
Fuel (total) 5,700 ton/yElectric power (total) 18,000 MWh/yAnnual energy consumption
Total in factory 10,686 toe/y
Fuel (total) 20.0 %
Energy conservation rate of the whole factory Electric power (total) 9.6 %
Total in factory 15.1 %
2) Annual energy consumption and energy intensity
(1) The Amount of annual energy consumption (C+D) B = 10,686 toe
(in which) The amount of crude-oil equivalent of electric power: C = 4,989 toe
(Purchased electric power E = 18,000 MWh) × 0.277
The conversion factor to primary energy of electric power is calculated according to 31% of
thermal efficiency of thermal power generation station in Vietnam.
Conversion factor to primary energy = 860 / 0.31 = 2,770 Mcal/MWh = 0.277 toe/MWh
1 toe = 10,000 Mcal
Amount of crude-oil equivalent of all fuel consumption D = 5,700 toe
(sum total which carried out the crude-oil conversion of each amount of fuel)
Details (before conversion) Heavy oil ( ): 5,700 ton in 2006
Heat value = 10,000 kcal/kg
The Study on Master Plan for Energy Conservation and Effective Use in the Socialist Republic of VietNam
Final ReportA10 - 5
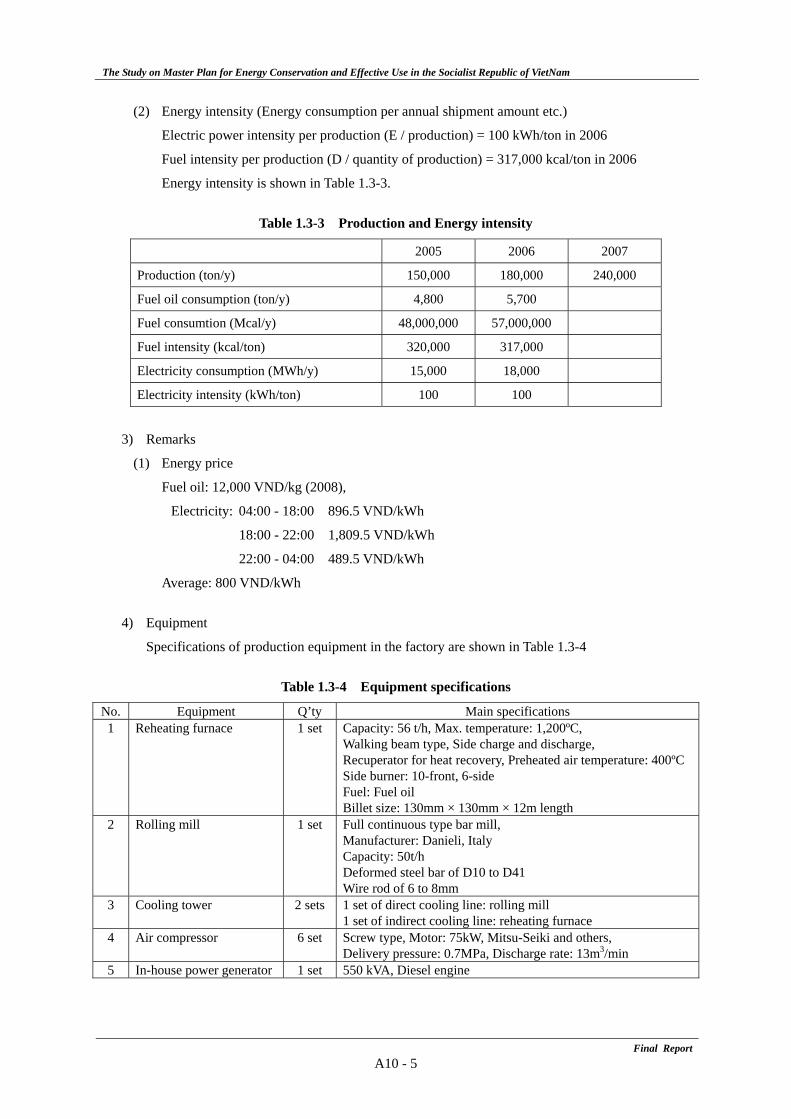
(2) Energy intensity (Energy consumption per annual shipment amount etc.)
Electric power intensity per production (E / production) = 100 kWh/ton in 2006
Fuel intensity per production (D / quantity of production) = 317,000 kcal/ton in 2006
Energy intensity is shown in Table 1.3-3.
Table 1.3-3 Production and Energy intensity
2005 2006 2007
Production (ton/y) 150,000 180,000 240,000
Fuel oil consumption (ton/y) 4,800 5,700
Fuel consumtion (Mcal/y) 48,000,000 57,000,000
Fuel intensity (kcal/ton) 320,000 317,000
Electricity consumption (MWh/y) 15,000 18,000
Electricity intensity (kWh/ton) 100 100
3) Remarks
(1) Energy price
Fuel oil: 12,000 VND/kg (2008),
Electricity: 04:00 - 18:00 896.5 VND/kWh
18:00 - 22:00 1,809.5 VND/kWh
22:00 - 04:00 489.5 VND/kWh
Average: 800 VND/kWh
4) Equipment
Specifications of production equipment in the factory are shown in Table 1.3-4
Table 1.3-4 Equipment specifications
No. Equipment Q’ty Main specifications 1 Reheating furnace 1 set Capacity: 56 t/h, Max. temperature: 1,200ºC,
Walking beam type, Side charge and discharge, Recuperator for heat recovery, Preheated air temperature: 400ºC Side burner: 10-front, 6-side Fuel: Fuel oil Billet size: 130mm × 130mm × 12m length
2 Rolling mill 1 set Full continuous type bar mill, Manufacturer: Danieli, Italy Capacity: 50t/h Deformed steel bar of D10 to D41 Wire rod of 6 to 8mm
3 Cooling tower 2 sets 1 set of direct cooling line: rolling mill 1 set of indirect cooling line: reheating furnace
4 Air compressor 6 set Screw type, Motor: 75kW, Mitsu-Seiki and others, Delivery pressure: 0.7MPa, Discharge rate: 13m3/min
5 In-house power generator 1 set 550 kVA, Diesel engine
The Study on Master Plan for Energy Conservation and Effective Use in the Socialist Republic of VietNam
Final ReportA10 - 6
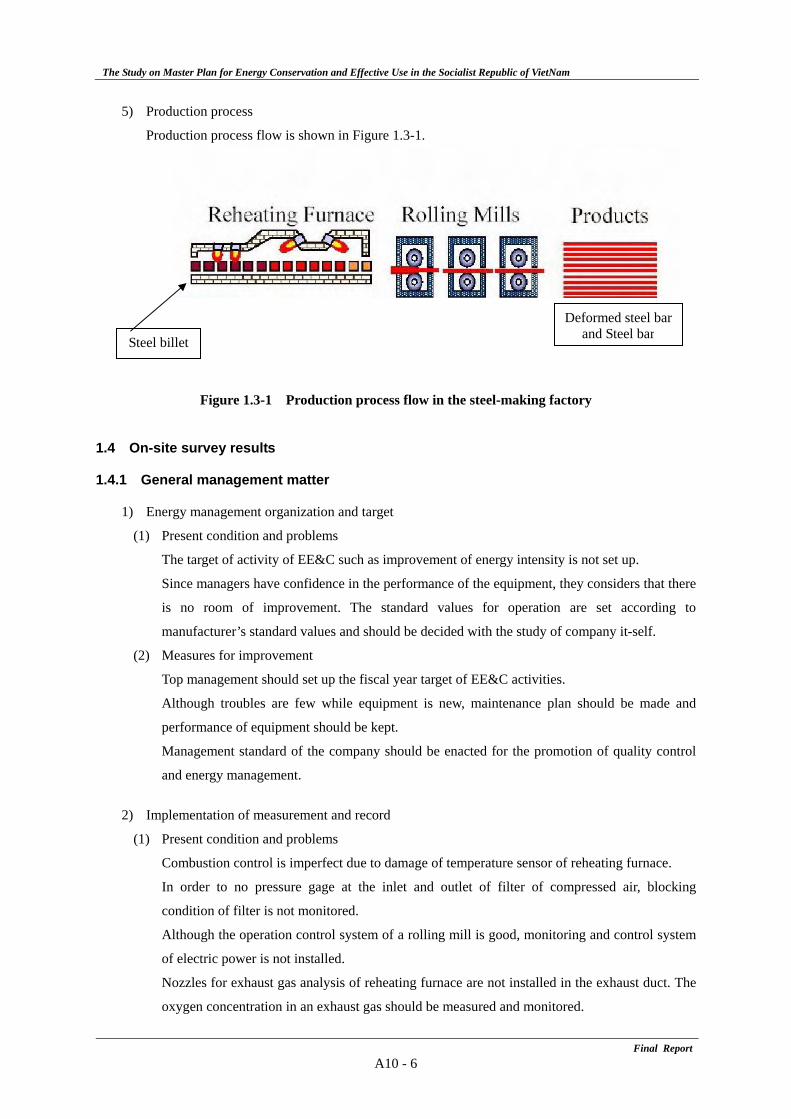
5) Production process
Production process flow is shown in Figure 1.3-1.
Figure 1.3-1 Production process flow in the steel-making factory
1.4 On-site survey results
1.4.1 General management matter
1) Energy management organization and target
(1) Present condition and problems
The target of activity of EE&C such as improvement of energy intensity is not set up.
Since managers have confidence in the performance of the equipment, they considers that there
is no room of improvement. The standard values for operation are set according to
manufacturer’s standard values and should be decided with the study of company it-self.
(2) Measures for improvement
Top management should set up the fiscal year target of EE&C activities.
Although troubles are few while equipment is new, maintenance plan should be made and
performance of equipment should be kept.
Management standard of the company should be enacted for the promotion of quality control
and energy management.
2) Implementation of measurement and record
(1) Present condition and problems
Combustion control is imperfect due to damage of temperature sensor of reheating furnace.
In order to no pressure gage at the inlet and outlet of filter of compressed air, blocking
condition of filter is not monitored.
Although the operation control system of a rolling mill is good, monitoring and control system
of electric power is not installed.
Nozzles for exhaust gas analysis of reheating furnace are not installed in the exhaust duct. The
oxygen concentration in an exhaust gas should be measured and monitored.
Steel billet
Deformed steel barand Steel bar
The Study on Master Plan for Energy Conservation and Effective Use in the Socialist Republic of VietNam
Final ReportA10 - 7
(2) Measures for improvement
Inner temperature sensor of reheating furnace is very important for combustion control. The
sensor and the meter should be managed according to priority.
For backup of combustion control of reheating furnace, the oxygen concentration analyzer in
exhaust gas should be installed and monitored always.
3) Maintenance management of equipment
(1) Present condition and problems
Although equipment is new, maintenance of equipment is not good.
(2) Measures for improvement
Maintenance of equipment should be implemented according to management standard.
4) Energy consumption management
(1) Present condition and problems
Gathered data are not utilized enough, although many data are gathered in the rolling mill
operation room.
(2) Measures for improvement
Change of consumption of fuel and electric power should be monitored with graph and unusual
value should be detected early.
5) Energy intensity management of main products
(1) Present condition and problems
Production yield is good, which is 97.5% for wire rod and 95.5 to 97.0% for deformed bar.
Fuel intensity is 28.5-29.0 kg-oil/ton and electric power intensity is 122 kWh/ton for wire rod
and 70 to 132 kWh/ton for deformed bar.
(2) Measures for improvement
Rolling mill equipment is operated for 7 years, and an equipment condition is good. It is
necessary to establish the organization at the time of unusual value generating of energy
intensity and production yield.
6) PDCA management cycle
(1) Present condition and problems
PDCA management cycle is not carried out.
(2) Measures for improvement
Improvement activities should be promoted.
7) Evaluation of an energy management situation
Evaluation of energy management situation is shown in Figure 1.4.1-1.
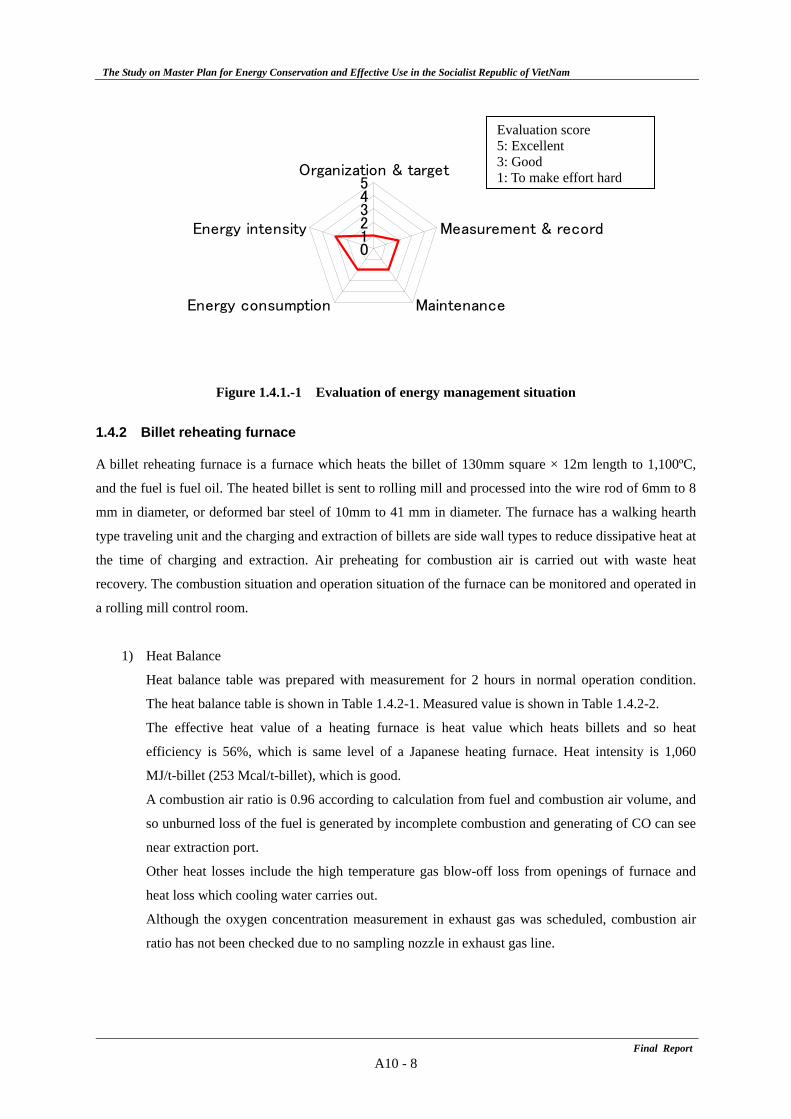
The Study on Master Plan for Energy Conservation and Effective Use in the Socialist Republic of VietNam
Final ReportA10 - 8
Figure 1.4.1.-1 Evaluation of energy management situation
1.4.2 Billet reheating furnace
A billet reheating furnace is a furnace which heats the billet of 130mm square × 12m length to 1,100ºC,
and the fuel is fuel oil. The heated billet is sent to rolling mill and processed into the wire rod of 6mm to 8
mm in diameter, or deformed bar steel of 10mm to 41 mm in diameter. The furnace has a walking hearth
type traveling unit and the charging and extraction of billets are side wall types to reduce dissipative heat at
the time of charging and extraction. Air preheating for combustion air is carried out with waste heat
recovery. The combustion situation and operation situation of the furnace can be monitored and operated in
a rolling mill control room.
1) Heat Balance
Heat balance table was prepared with measurement for 2 hours in normal operation condition.
The heat balance table is shown in Table 1.4.2-1. Measured value is shown in Table 1.4.2-2.
The effective heat value of a heating furnace is heat value which heats billets and so heat
efficiency is 56%, which is same level of a Japanese heating furnace. Heat intensity is 1,060
MJ/t-billet (253 Mcal/t-billet), which is good.
A combustion air ratio is 0.96 according to calculation from fuel and combustion air volume, and
so unburned loss of the fuel is generated by incomplete combustion and generating of CO can see
near extraction port.
Other heat losses include the high temperature gas blow-off loss from openings of furnace and
heat loss which cooling water carries out.
Although the oxygen concentration measurement in exhaust gas was scheduled, combustion air
ratio has not been checked due to no sampling nozzle in exhaust gas line.
012345
Organization & target
Measurement & record
MaintenanceEnergy consumption
Energy intensity
Evaluation score 5: Excellent 3: Good 1: To make effort hard
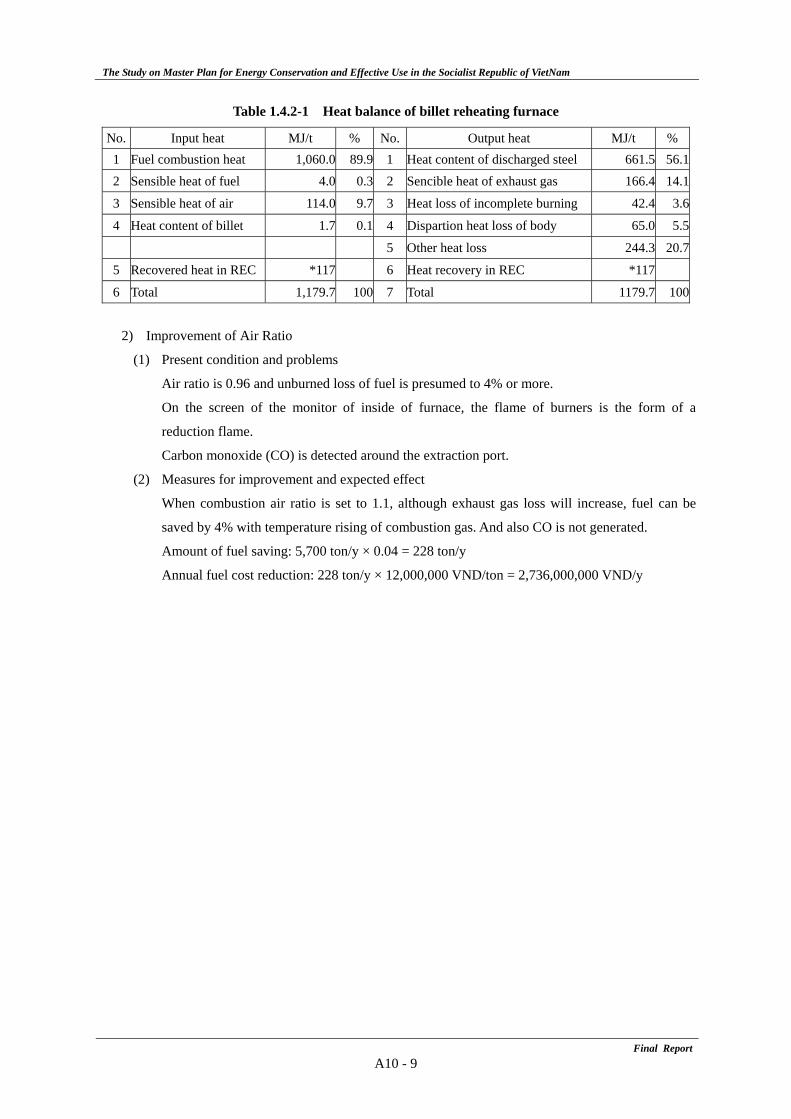
The Study on Master Plan for Energy Conservation and Effective Use in the Socialist Republic of VietNam
Final ReportA10 - 9
Table 1.4.2-1 Heat balance of billet reheating furnace
No. Input heat MJ/t % No. Output heat MJ/t %1 Fuel combustion heat 1,060.0 89.9 1 Heat content of discharged steel 661.5 56.1 2 Sensible heat of fuel 4.0 0.3 2 Sencible heat of exhaust gas 166.4 14.1
3 Sensible heat of air 114.0 9.7 3 Heat loss of incomplete burning 42.4 3.6
4 Heat content of billet 1.7 0.1 4 Dispartion heat loss of body 65.0 5.5
5 Other heat loss 244.3 20.7
5 Recovered heat in REC *117 6 Heat recovery in REC *117
6 Total 1,179.7 100 7 Total 1179.7 100
2) Improvement of Air Ratio
(1) Present condition and problems
Air ratio is 0.96 and unburned loss of fuel is presumed to 4% or more.
On the screen of the monitor of inside of furnace, the flame of burners is the form of a
reduction flame.
Carbon monoxide (CO) is detected around the extraction port.
(2) Measures for improvement and expected effect
When combustion air ratio is set to 1.1, although exhaust gas loss will increase, fuel can be
saved by 4% with temperature rising of combustion gas. And also CO is not generated.
Amount of fuel saving: 5,700 ton/y × 0.04 = 228 ton/y
Annual fuel cost reduction: 228 ton/y × 12,000,000 VND/ton = 2,736,000,000 VND/y
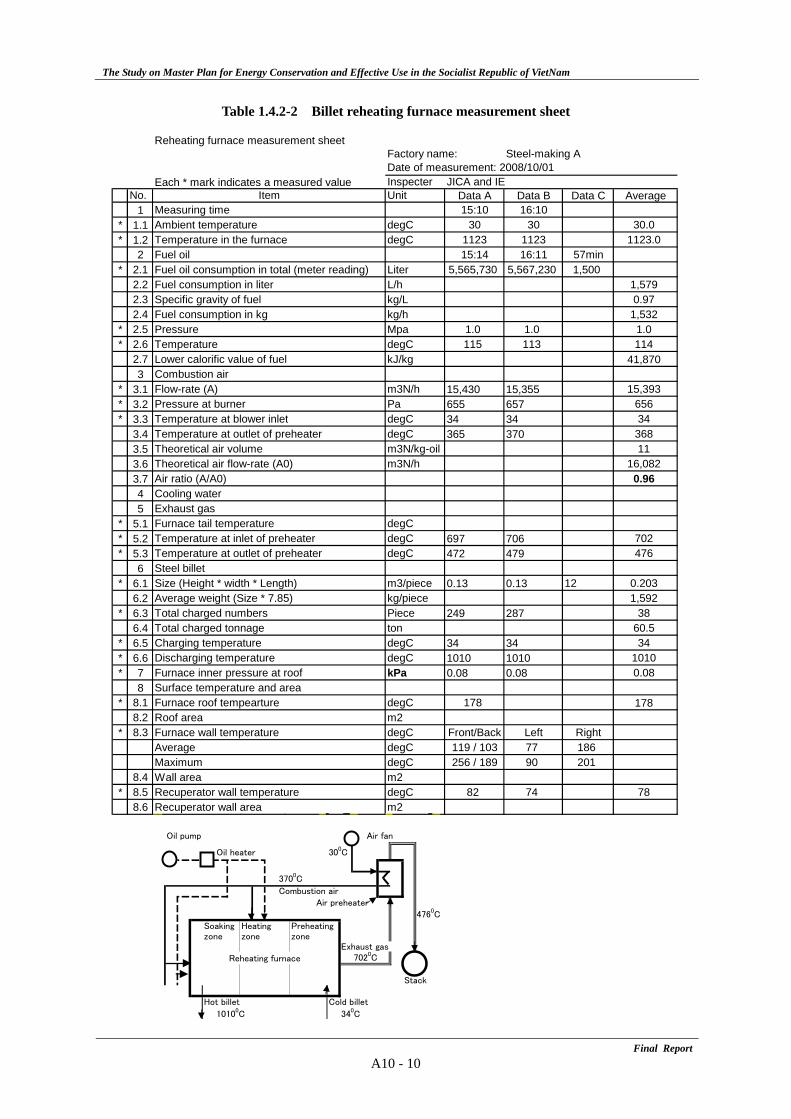
The Study on Master Plan for Energy Conservation and Effective Use in the Socialist Republic of VietNam
Final ReportA10 - 10
Table 1.4.2-2 Billet reheating furnace measurement sheet
Factory name: Steel-making A
Each * mark indicates a measured value Inspecter JICA and IENo. Item Unit Data A Data B Data C Average
1 Measuring time 15:10 16:10* 1.1 Ambient temperature degC 30 30 30.0* 1.2 Temperature in the furnace degC 1123 1123 1123.0
2 Fuel oil 15:14 16:11 57min* 2.1 Fuel oil consumption in total (meter reading) Liter 5,565,730 5,567,230 1,500
2.2 Fuel consumption in liter L/h 1,5792.3 Specific gravity of fuel kg/L 0.972.4 Fuel consumption in kg kg/h 1,532
* 2.5 Pressure Mpa 1.0 1.0 1.0* 2.6 Temperature degC 115 113 114
2.7 Lower calorific value of fuel kJ/kg 41,8703 Combustion air
* 3.1 Flow-rate (A) m3N/h 15,430 15,355 15,393* 3.2 Pressure at burner Pa 655 657 656* 3.3 Temperature at blower inlet degC 34 34 34
3.4 Temperature at outlet of preheater degC 365 370 3683.5 Theoretical air volume m3N/kg-oil 113.6 Theoretical air flow-rate (A0) m3N/h 16,0823.7 Air ratio (A/A0) 0.964 Cooling water5 Exhaust gas
* 5.1 Furnace tail temperature degC* 5.2 Temperature at inlet of preheater degC 697 706 702* 5.3 Temperature at outlet of preheater degC 472 479 476
6 Steel billet* 6.1 Size (Height * width * Length) m3/piece 0.13 0.13 12 0.203
6.2 Average weight (Size * 7.85) kg/piece 1,592* 6.3 Total charged numbers Piece 249 287 38
6.4 Total charged tonnage ton 60.5* 6.5 Charging temperature degC 34 34 34* 6.6 Discharging temperature degC 1010 1010 1010* 7 Furnace inner pressure at roof kPa 0.08 0.08 0.08
8 Surface temperature and area* 8.1 Furnace roof tempearture degC 178 178
8.2 Roof area m2* 8.3 Furnace wall temperature degC Front/Back Left Right
Average degC 119 / 103 77 186Maximum degC 256 / 189 90 201
8.4 Wall area m2* 8.5 Recuperator wall temperature degC 82 74 78
8.6 Recuperator wall area m2
Reheating furnace measurement sheet
Date of measurement: 2008/10/01
Oil pump Air fan
Oil heater 300C
3700C
Combustion air
Air preheater
4760C
Soaking Heating Preheatingzone zone zone
Exhaust gas
Reheating furnace
Stack
Hot billet Cold billet
10100C 340C
7020C
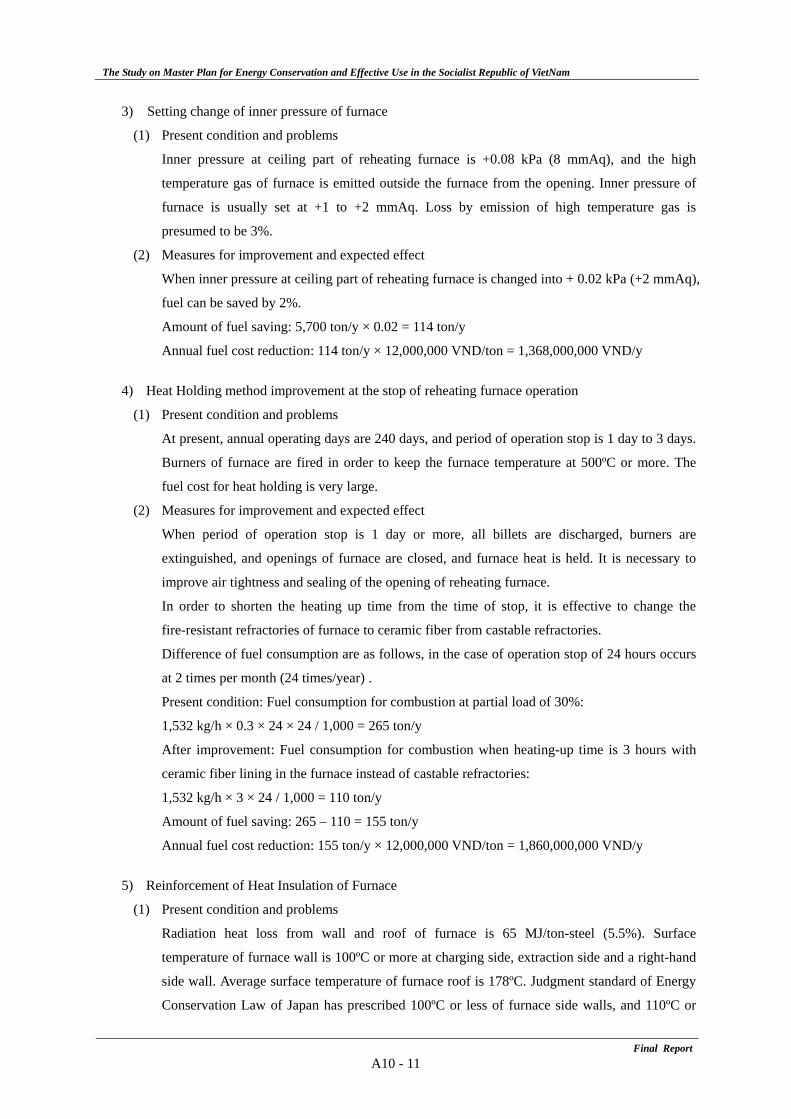
The Study on Master Plan for Energy Conservation and Effective Use in the Socialist Republic of VietNam
Final ReportA10 - 11
3) Setting change of inner pressure of furnace
(1) Present condition and problems
Inner pressure at ceiling part of reheating furnace is +0.08 kPa (8 mmAq), and the high
temperature gas of furnace is emitted outside the furnace from the opening. Inner pressure of
furnace is usually set at +1 to +2 mmAq. Loss by emission of high temperature gas is
presumed to be 3%.
(2) Measures for improvement and expected effect
When inner pressure at ceiling part of reheating furnace is changed into + 0.02 kPa (+2 mmAq),
fuel can be saved by 2%.
Amount of fuel saving: 5,700 ton/y × 0.02 = 114 ton/y
Annual fuel cost reduction: 114 ton/y × 12,000,000 VND/ton = 1,368,000,000 VND/y
4) Heat Holding method improvement at the stop of reheating furnace operation
(1) Present condition and problems
At present, annual operating days are 240 days, and period of operation stop is 1 day to 3 days.
Burners of furnace are fired in order to keep the furnace temperature at 500ºC or more. The
fuel cost for heat holding is very large.
(2) Measures for improvement and expected effect
When period of operation stop is 1 day or more, all billets are discharged, burners are
extinguished, and openings of furnace are closed, and furnace heat is held. It is necessary to
improve air tightness and sealing of the opening of reheating furnace.
In order to shorten the heating up time from the time of stop, it is effective to change the
fire-resistant refractories of furnace to ceramic fiber from castable refractories.
Difference of fuel consumption are as follows, in the case of operation stop of 24 hours occurs
at 2 times per month (24 times/year) .
Present condition: Fuel consumption for combustion at partial load of 30%:
1,532 kg/h × 0.3 × 24 × 24 / 1,000 = 265 ton/y
After improvement: Fuel consumption for combustion when heating-up time is 3 hours with
ceramic fiber lining in the furnace instead of castable refractories:
1,532 kg/h × 3 × 24 / 1,000 = 110 ton/y
Amount of fuel saving: 265 – 110 = 155 ton/y
Annual fuel cost reduction: 155 ton/y × 12,000,000 VND/ton = 1,860,000,000 VND/y
5) Reinforcement of Heat Insulation of Furnace
(1) Present condition and problems
Radiation heat loss from wall and roof of furnace is 65 MJ/ton-steel (5.5%). Surface
temperature of furnace wall is 100ºC or more at charging side, extraction side and a right-hand
side wall. Average surface temperature of furnace roof is 178ºC. Judgment standard of Energy
Conservation Law of Japan has prescribed 100ºC or less of furnace side walls, and 110ºC or
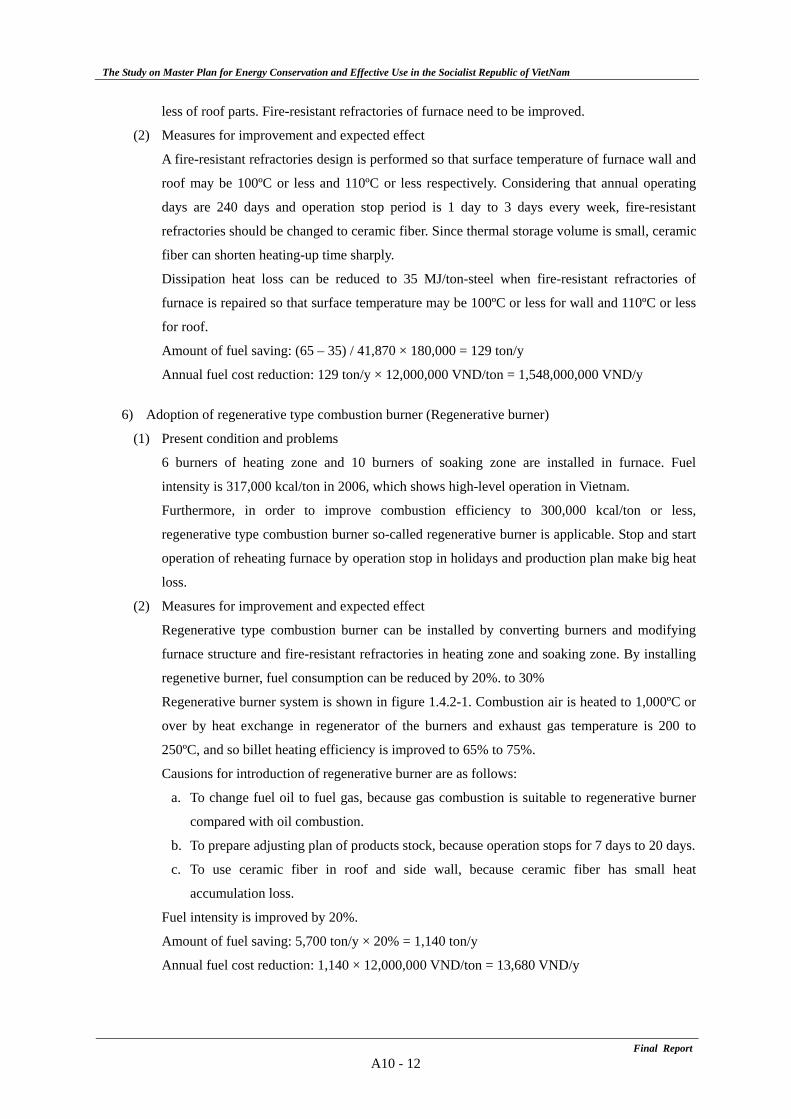
The Study on Master Plan for Energy Conservation and Effective Use in the Socialist Republic of VietNam
Final ReportA10 - 12
less of roof parts. Fire-resistant refractories of furnace need to be improved.
(2) Measures for improvement and expected effect
A fire-resistant refractories design is performed so that surface temperature of furnace wall and
roof may be 100ºC or less and 110ºC or less respectively. Considering that annual operating
days are 240 days and operation stop period is 1 day to 3 days every week, fire-resistant
refractories should be changed to ceramic fiber. Since thermal storage volume is small, ceramic
fiber can shorten heating-up time sharply.
Dissipation heat loss can be reduced to 35 MJ/ton-steel when fire-resistant refractories of
furnace is repaired so that surface temperature may be 100ºC or less for wall and 110ºC or less
for roof.
Amount of fuel saving: (65 – 35) / 41,870 × 180,000 = 129 ton/y
Annual fuel cost reduction: 129 ton/y × 12,000,000 VND/ton = 1,548,000,000 VND/y
6) Adoption of regenerative type combustion burner (Regenerative burner)
(1) Present condition and problems
6 burners of heating zone and 10 burners of soaking zone are installed in furnace. Fuel
intensity is 317,000 kcal/ton in 2006, which shows high-level operation in Vietnam.
Furthermore, in order to improve combustion efficiency to 300,000 kcal/ton or less,
regenerative type combustion burner so-called regenerative burner is applicable. Stop and start
operation of reheating furnace by operation stop in holidays and production plan make big heat
loss.
(2) Measures for improvement and expected effect
Regenerative type combustion burner can be installed by converting burners and modifying
furnace structure and fire-resistant refractories in heating zone and soaking zone. By installing
regenetive burner, fuel consumption can be reduced by 20%. to 30%
Regenerative burner system is shown in figure 1.4.2-1. Combustion air is heated to 1,000ºC or
over by heat exchange in regenerator of the burners and exhaust gas temperature is 200 to
250ºC, and so billet heating efficiency is improved to 65% to 75%.
Causions for introduction of regenerative burner are as follows:
a. To change fuel oil to fuel gas, because gas combustion is suitable to regenerative burner
compared with oil combustion.
b. To prepare adjusting plan of products stock, because operation stops for 7 days to 20 days.
c. To use ceramic fiber in roof and side wall, because ceramic fiber has small heat
accumulation loss.
Fuel intensity is improved by 20%.
Amount of fuel saving: 5,700 ton/y × 20% = 1,140 ton/y
Annual fuel cost reduction: 1,140 × 12,000,000 VND/ton = 13,680 VND/y
The Study on Master Plan for Energy Conservation and Effective Use in the Socialist Republic of VietNam
Final ReportA10 - 13
Figure 1.4.2-1 Regenerative burner system
1.4.3 Cooling facilities
1) Operation management of cooling tower equipment
(1) Present condition and problems
Cooling water supply system consists of 2 lines, direct cooling water line for jet-cooling to
high temperature rolled steel shown in Figure 1.4.3-1 and indirect cooling water line for
reheating furnace and lubricate oil cooling shown in Figure 1.4.3-2.
Figure 1.4.3-1 Cooling tower system for direct cooling water line
M Cooling tower
Fan
Air temperature Water flow-rate
DB = 32.50CRH = 57%
WB = 25.70C (Calculation)Rolling mill
Water temperaturePump
Scale Water temperature Pressurepit 34.3 - 30.50C 0.5 MPa
M M
Water temperature
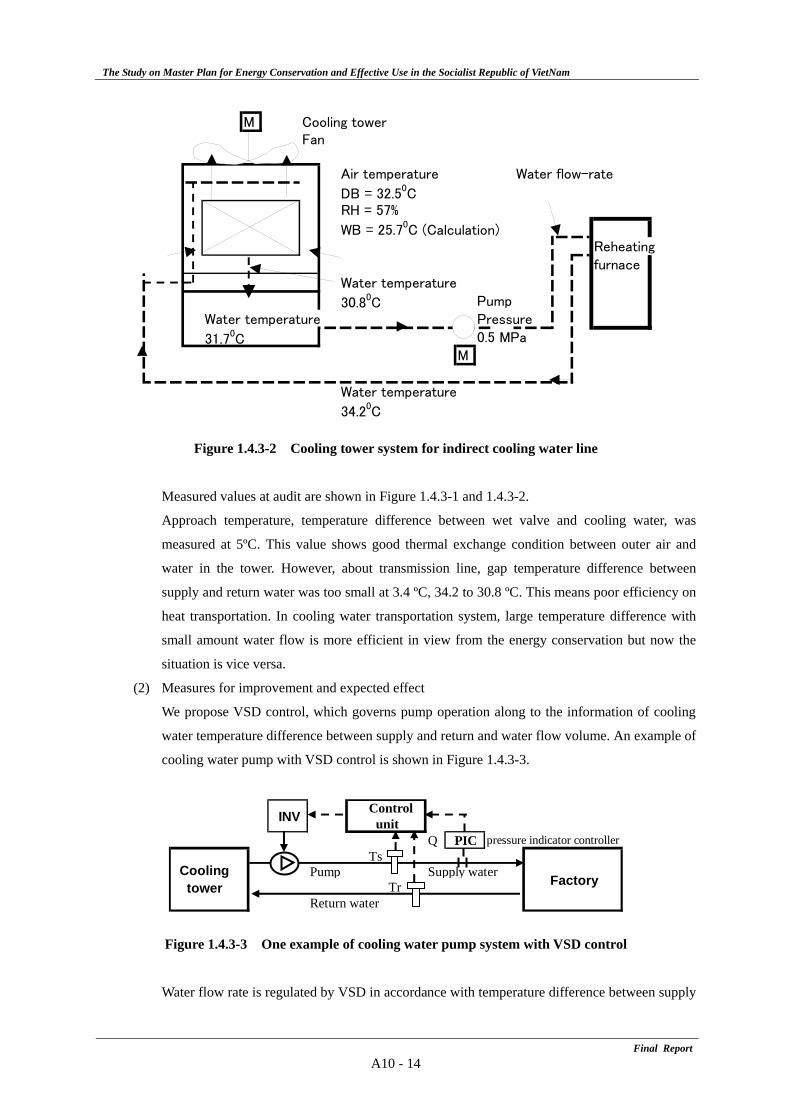
The Study on Master Plan for Energy Conservation and Effective Use in the Socialist Republic of VietNam
Final ReportA10 - 14
Figure 1.4.3-2 Cooling tower system for indirect cooling water line
Measured values at audit are shown in Figure 1.4.3-1 and 1.4.3-2.
Approach temperature, temperature difference between wet valve and cooling water, was
measured at 5ºC. This value shows good thermal exchange condition between outer air and
water in the tower. However, about transmission line, gap temperature difference between
supply and return water was too small at 3.4 ºC, 34.2 to 30.8 ºC. This means poor efficiency on
heat transportation. In cooling water transportation system, large temperature difference with
small amount water flow is more efficient in view from the energy conservation but now the
situation is vice versa.
(2) Measures for improvement and expected effect
We propose VSD control, which governs pump operation along to the information of cooling
water temperature difference between supply and return and water flow volume. An example of
cooling water pump with VSD control is shown in Figure 1.4.3-3.
Control unit
Q PIC pressure indicator controllerTs
Pump Supply waterTr
Return water
Factory
INV
Coolingtower
Figure 1.4.3-3 One example of cooling water pump system with VSD control
Water flow rate is regulated by VSD in accordance with temperature difference between supply
M Cooling tower
Fan
Air temperature Water flow-rate
DB = 32.50CRH = 57%
WB = 25.70C (Calculation)Reheatingfurnace
Water temperature
30.80C PumpWater temperature Pressure
31.70C 0.5 MPaM
Water temperature
34.20C
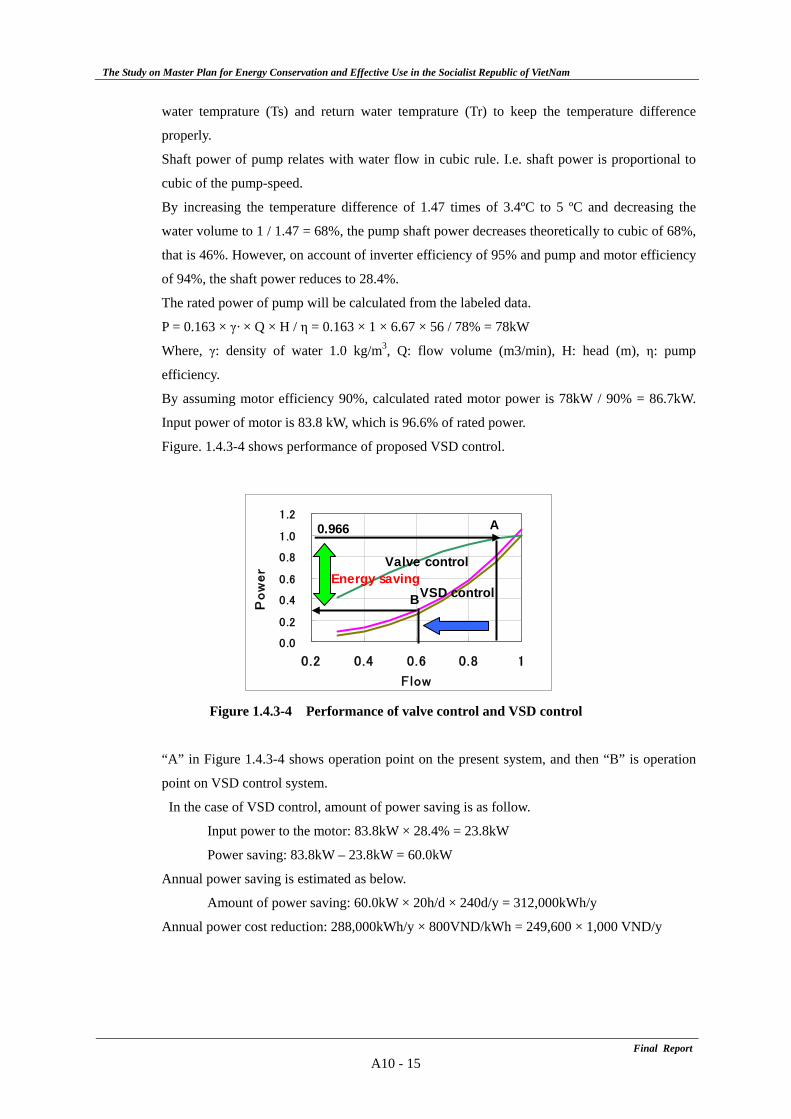
The Study on Master Plan for Energy Conservation and Effective Use in the Socialist Republic of VietNam
Final ReportA10 - 15
water temprature (Ts) and return water temprature (Tr) to keep the temperature difference
properly.
Shaft power of pump relates with water flow in cubic rule. I.e. shaft power is proportional to
cubic of the pump-speed.
By increasing the temperature difference of 1.47 times of 3.4ºC to 5 ºC and decreasing the
water volume to 1 / 1.47 = 68%, the pump shaft power decreases theoretically to cubic of 68%,
that is 46%. However, on account of inverter efficiency of 95% and pump and motor efficiency
of 94%, the shaft power reduces to 28.4%.
The rated power of pump will be calculated from the labeled data.
P = 0.163 × γ· × Q × H / η = 0.163 × 1 × 6.67 × 56 / 78% = 78kW
Where, γ: density of water 1.0 kg/m3, Q: flow volume (m3/min), H: head (m), η: pump
efficiency.
By assuming motor efficiency 90%, calculated rated motor power is 78kW / 90% = 86.7kW.
Input power of motor is 83.8 kW, which is 96.6% of rated power.
Figure. 1.4.3-4 shows performance of proposed VSD control.
Figure 1.4.3-4 Performance of valve control and VSD control
“A” in Figure 1.4.3-4 shows operation point on the present system, and then “B” is operation
point on VSD control system.
In the case of VSD control, amount of power saving is as follow.
Input power to the motor: 83.8kW × 28.4% = 23.8kW
Power saving: 83.8kW – 23.8kW = 60.0kW
Annual power saving is estimated as below.
Amount of power saving: 60.0kW × 20h/d × 240d/y = 312,000kWh/y
Annual power cost reduction: 288,000kWh/y × 800VND/kWh = 249,600 × 1,000 VND/y
0 .0
0 .2
0 .4
0 .6
0 .8
1 .0
1 .2
0.2 0.4 0.6 0.8 1
Flow
Pow
er
consum
pti
on
Va lve control
Ideal curve
Energy saving VSD control
0.0
0.2
0.4
0.6
0.8
1.0
1.2
0.2 0.4 0.6 0.8 1
Flow
Pow
er
I
Energy savingVSD control
Valve control
0.966 A
B
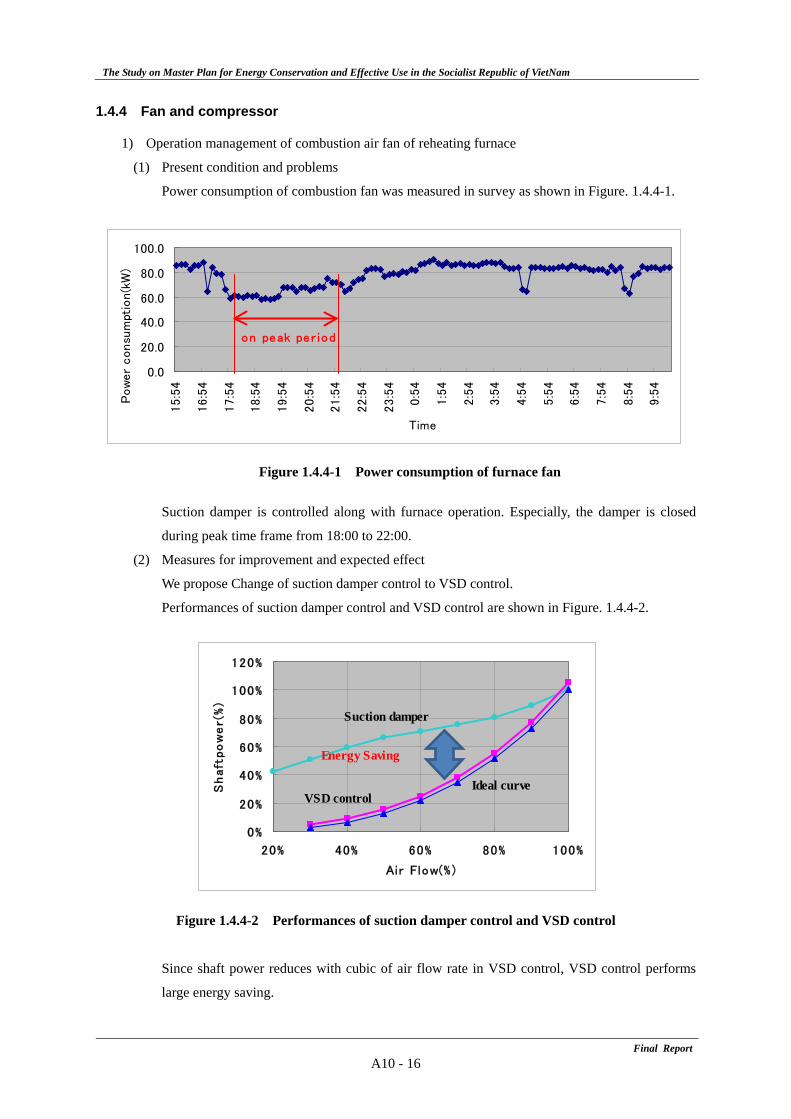
The Study on Master Plan for Energy Conservation and Effective Use in the Socialist Republic of VietNam
Final ReportA10 - 16
1.4.4 Fan and compressor
1) Operation management of combustion air fan of reheating furnace
(1) Present condition and problems
Power consumption of combustion fan was measured in survey as shown in Figure. 1.4.4-1.
Figure 1.4.4-1 Power consumption of furnace fan
Suction damper is controlled along with furnace operation. Especially, the damper is closed
during peak time frame from 18:00 to 22:00.
(2) Measures for improvement and expected effect
We propose Change of suction damper control to VSD control.
Performances of suction damper control and VSD control are shown in Figure. 1.4.4-2.
Figure 1.4.4-2 Performances of suction damper control and VSD control
Since shaft power reduces with cubic of air flow rate in VSD control, VSD control performs
large energy saving.
0.0
20.0
40.0
60.0
80.0
100.0
15:5
4
16:5
4
17:5
4
18:5
4
19:5
4
20:5
4
21:5
4
22:5
4
23:5
4
0:5
4
1:5
4
2:5
4
3:5
4
4:5
4
5:5
4
6:5
4
7:5
4
8:5
4
9:5
4
Time
Pow
er
consu
mpt
ion(k
W)
on peak per iod
0%
20%
40%
60%
80%
100%
120%
20% 40% 60% 80% 100%
Air Flow(% )
Sh
aft
po
we
r(%
)
Suction damper
Ideal curveVSD control
Energy Saving
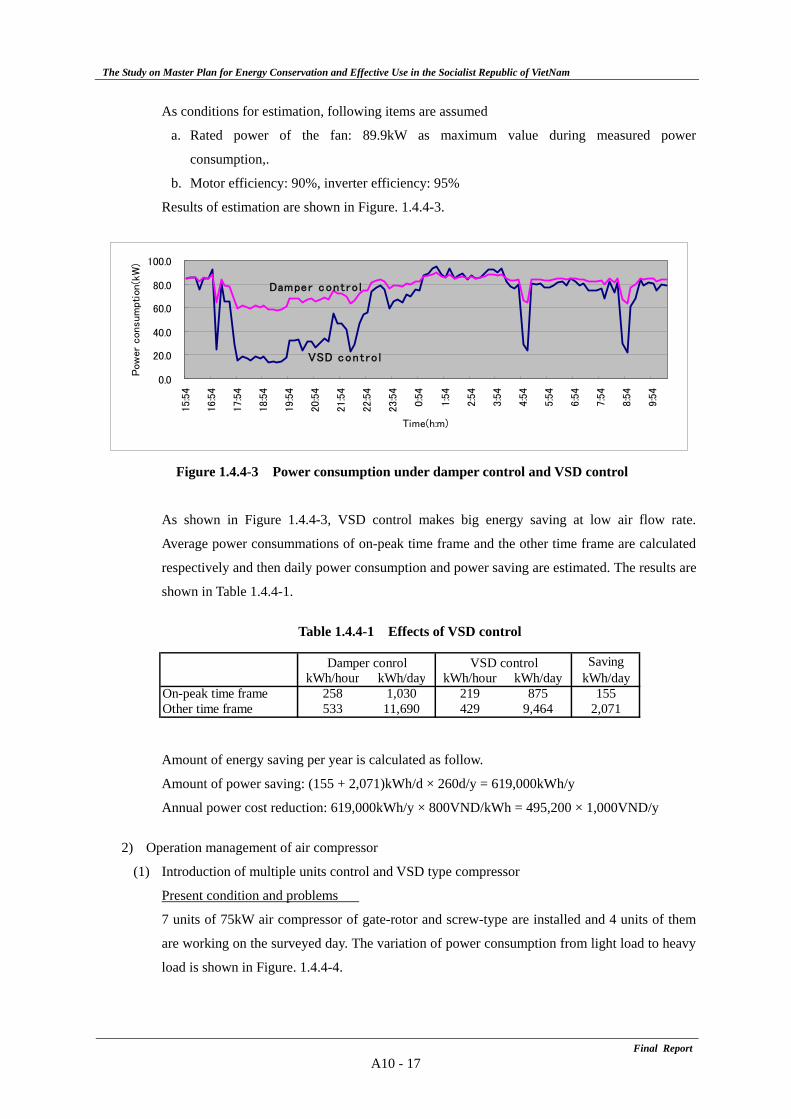
The Study on Master Plan for Energy Conservation and Effective Use in the Socialist Republic of VietNam
Final ReportA10 - 17
As conditions for estimation, following items are assumed
a. Rated power of the fan: 89.9kW as maximum value during measured power
consumption,.
b. Motor efficiency: 90%, inverter efficiency: 95%
Results of estimation are shown in Figure. 1.4.4-3.
Figure 1.4.4-3 Power consumption under damper control and VSD control
As shown in Figure 1.4.4-3, VSD control makes big energy saving at low air flow rate.
Average power consummations of on-peak time frame and the other time frame are calculated
respectively and then daily power consumption and power saving are estimated. The results are
shown in Table 1.4.4-1.
Table 1.4.4-1 Effects of VSD control
Amount of energy saving per year is calculated as follow.
Amount of power saving: (155 + 2,071)kWh/d × 260d/y = 619,000kWh/y
Annual power cost reduction: 619,000kWh/y × 800VND/kWh = 495,200 × 1,000VND/y
2) Operation management of air compressor
(1) Introduction of multiple units control and VSD type compressor
Present condition and problems
7 units of 75kW air compressor of gate-rotor and screw-type are installed and 4 units of them
are working on the surveyed day. The variation of power consumption from light load to heavy
load is shown in Figure. 1.4.4-4.
SavingkWh/hour kWh/day kWh/hour kWh/day kWh/day
On-peak time frame 258 1,030 219 875 155Other time frame 533 11,690 429 9,464 2,071
Damper conrol VSD control
0.0
20.0
40.0
60.0
80.0
100.0
15:5
4
16:5
4
17:5
4
18:5
4
19:5
4
20:5
4
21:5
4
22:5
4
23:5
4
0:5
4
1:5
4
2:5
4
3:5
4
4:5
4
5:5
4
6:5
4
7:5
4
8:5
4
9:5
4
Time(h:m)
Pow
er
con
sum
ption
(kW
)
Damper contro l
VSD cont ro l
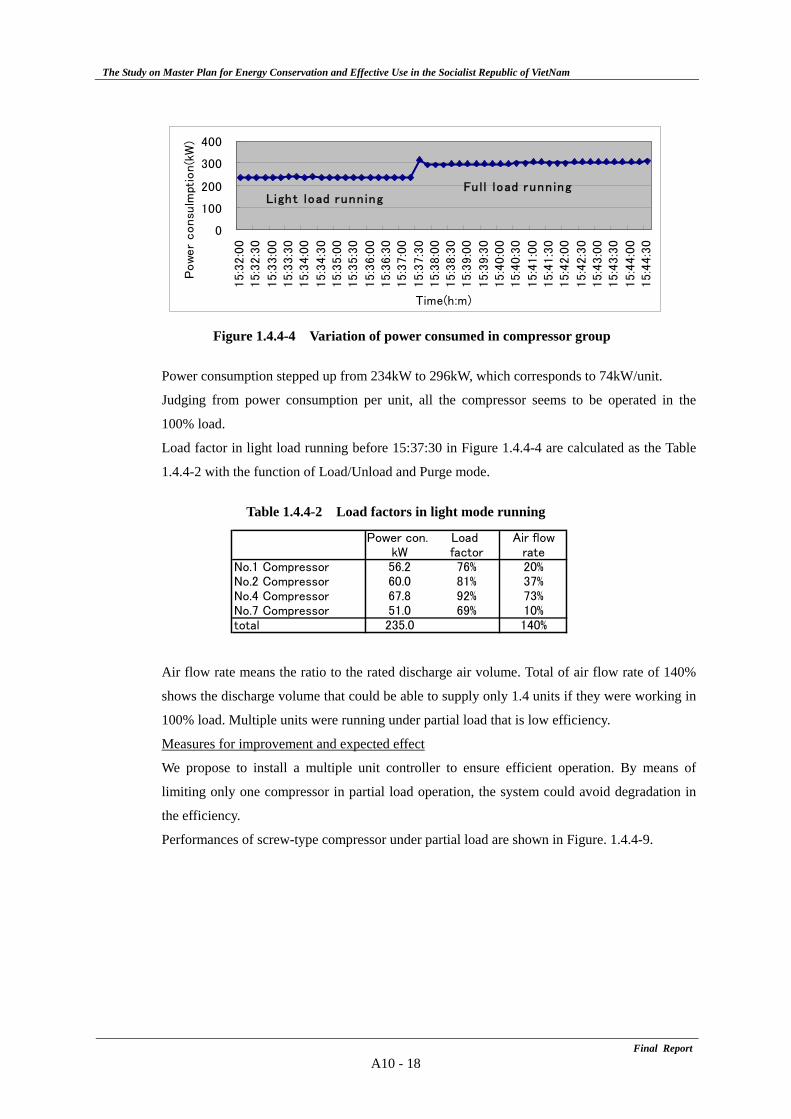
The Study on Master Plan for Energy Conservation and Effective Use in the Socialist Republic of VietNam
Final ReportA10 - 18
Figure 1.4.4-4 Variation of power consumed in compressor group
Power consumption stepped up from 234kW to 296kW, which corresponds to 74kW/unit.
Judging from power consumption per unit, all the compressor seems to be operated in the
100% load.
Load factor in light load running before 15:37:30 in Figure 1.4.4-4 are calculated as the Table
1.4.4-2 with the function of Load/Unload and Purge mode.
Table 1.4.4-2 Load factors in light mode running
Air flow rate means the ratio to the rated discharge air volume. Total of air flow rate of 140%
shows the discharge volume that could be able to supply only 1.4 units if they were working in
100% load. Multiple units were running under partial load that is low efficiency.
Measures for improvement and expected effect
We propose to install a multiple unit controller to ensure efficient operation. By means of
limiting only one compressor in partial load operation, the system could avoid degradation in
the efficiency.
Performances of screw-type compressor under partial load are shown in Figure. 1.4.4-9.
0
100
200
300
400
15:3
2:0
015:3
2:3
0
15:3
3:0
015:3
3:3
015:3
4:0
0
15:3
4:3
015:3
5:0
015:3
5:3
0
15:3
6:0
015:3
6:3
015:3
7:0
0
15:3
7:3
015:3
8:0
015:3
8:3
015:3
9:0
0
15:3
9:3
015:4
0:0
015:4
0:3
0
15:4
1:0
015:4
1:3
015:4
2:0
0
15:4
2:3
015:4
3:0
015:4
3:3
0
15:4
4:0
015:4
4:3
0
Time(h:m)
Pow
er
consu
lmpt
ion(k
W)
L ight load runn ingFu l l load runn ing
Power con. Load Air flowkW factor rate
No.1 Compressor 56.2 76% 20%No.2 Compressor 60.0 81% 37%No.4 Compressor 67.8 92% 73%No.7 Compressor 51.0 69% 10%total 235.0 140%
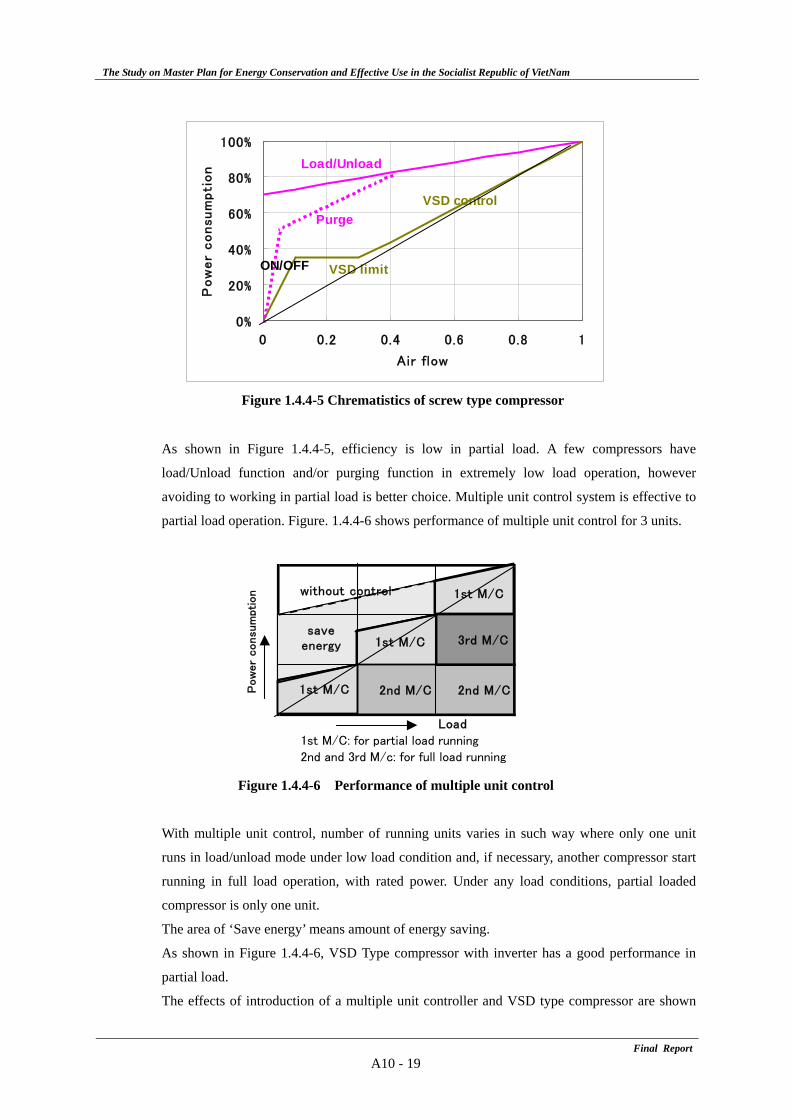
The Study on Master Plan for Energy Conservation and Effective Use in the Socialist Republic of VietNam
Final ReportA10 - 19
Figure 1.4.4-5 Chrematistics of screw type compressor
As shown in Figure 1.4.4-5, efficiency is low in partial load. A few compressors have
load/Unload function and/or purging function in extremely low load operation, however
avoiding to working in partial load is better choice. Multiple unit control system is effective to
partial load operation. Figure. 1.4.4-6 shows performance of multiple unit control for 3 units.
Figure 1.4.4-6 Performance of multiple unit control
With multiple unit control, number of running units varies in such way where only one unit
runs in load/unload mode under low load condition and, if necessary, another compressor start
running in full load operation, with rated power. Under any load conditions, partial loaded
compressor is only one unit.
The area of ‘Save energy’ means amount of energy saving.
As shown in Figure 1.4.4-6, VSD Type compressor with inverter has a good performance in
partial load.
The effects of introduction of a multiple unit controller and VSD type compressor are shown
0%
20%
40%
60%
80%
100%
0 0.2 0.4 0.6 0.8 1
Air flow
Pow
er
consum
pti
on
Purge
VSD limit
Load/Unload
VSD control
ON/OFF
3rd M/C
1st M/C 2nd M/C 2nd M/C
Load
1st M/C: for partial load running2nd and 3rd M/c: for full load running
1st M/C
1st M/C
1st M/Cwithout control
Pow
er
consu
mption
saveenergy
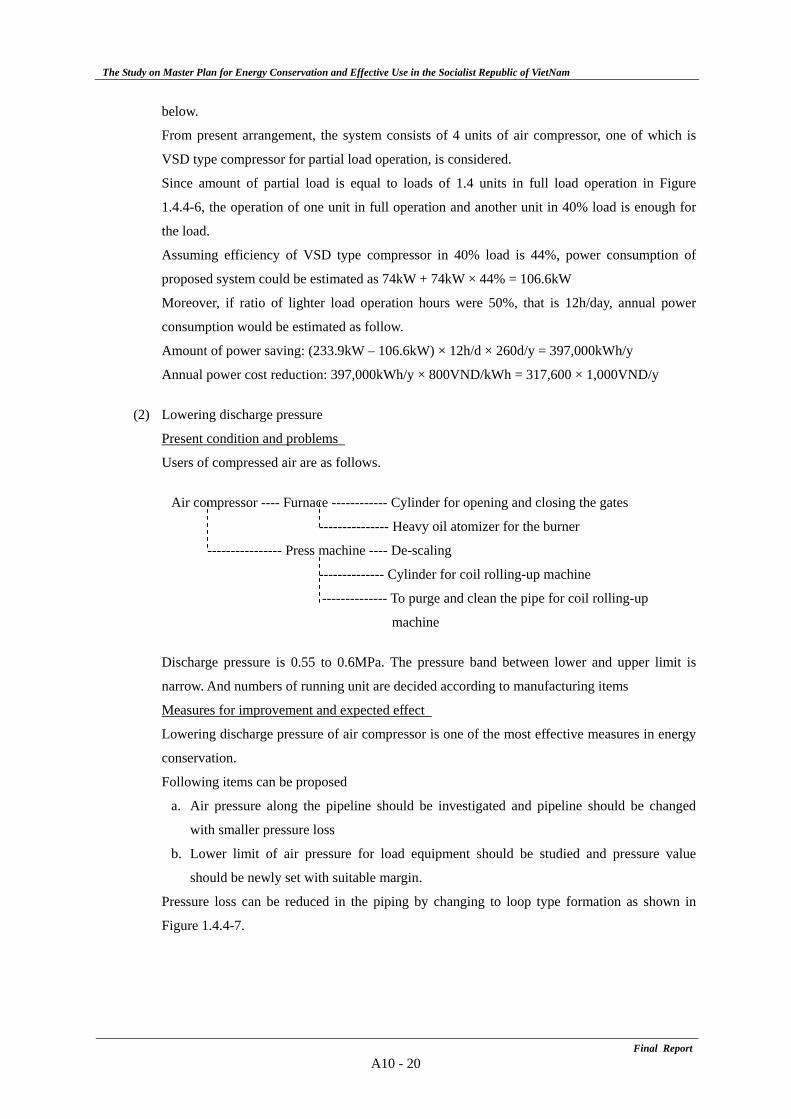
The Study on Master Plan for Energy Conservation and Effective Use in the Socialist Republic of VietNam
Final ReportA10 - 20
below.
From present arrangement, the system consists of 4 units of air compressor, one of which is
VSD type compressor for partial load operation, is considered.
Since amount of partial load is equal to loads of 1.4 units in full load operation in Figure
1.4.4-6, the operation of one unit in full operation and another unit in 40% load is enough for
the load.
Assuming efficiency of VSD type compressor in 40% load is 44%, power consumption of
proposed system could be estimated as 74kW + 74kW × 44% = 106.6kW
Moreover, if ratio of lighter load operation hours were 50%, that is 12h/day, annual power
consumption would be estimated as follow.
Amount of power saving: (233.9kW – 106.6kW) × 12h/d × 260d/y = 397,000kWh/y
Annual power cost reduction: 397,000kWh/y × 800VND/kWh = 317,600 × 1,000VND/y
(2) Lowering discharge pressure
Present condition and problems
Users of compressed air are as follows.
Air compressor ---- Furnace ------------ Cylinder for opening and closing the gates
--------------- Heavy oil atomizer for the burner
---------------- Press machine ---- De-scaling
-------------- Cylinder for coil rolling-up machine
-------------- To purge and clean the pipe for coil rolling-up
machine
Discharge pressure is 0.55 to 0.6MPa. The pressure band between lower and upper limit is
narrow. And numbers of running unit are decided according to manufacturing items
Measures for improvement and expected effect
Lowering discharge pressure of air compressor is one of the most effective measures in energy
conservation.
Following items can be proposed
a. Air pressure along the pipeline should be investigated and pipeline should be changed
with smaller pressure loss
b. Lower limit of air pressure for load equipment should be studied and pressure value
should be newly set with suitable margin.
Pressure loss can be reduced in the piping by changing to loop type formation as shown in
Figure 1.4.4-7.
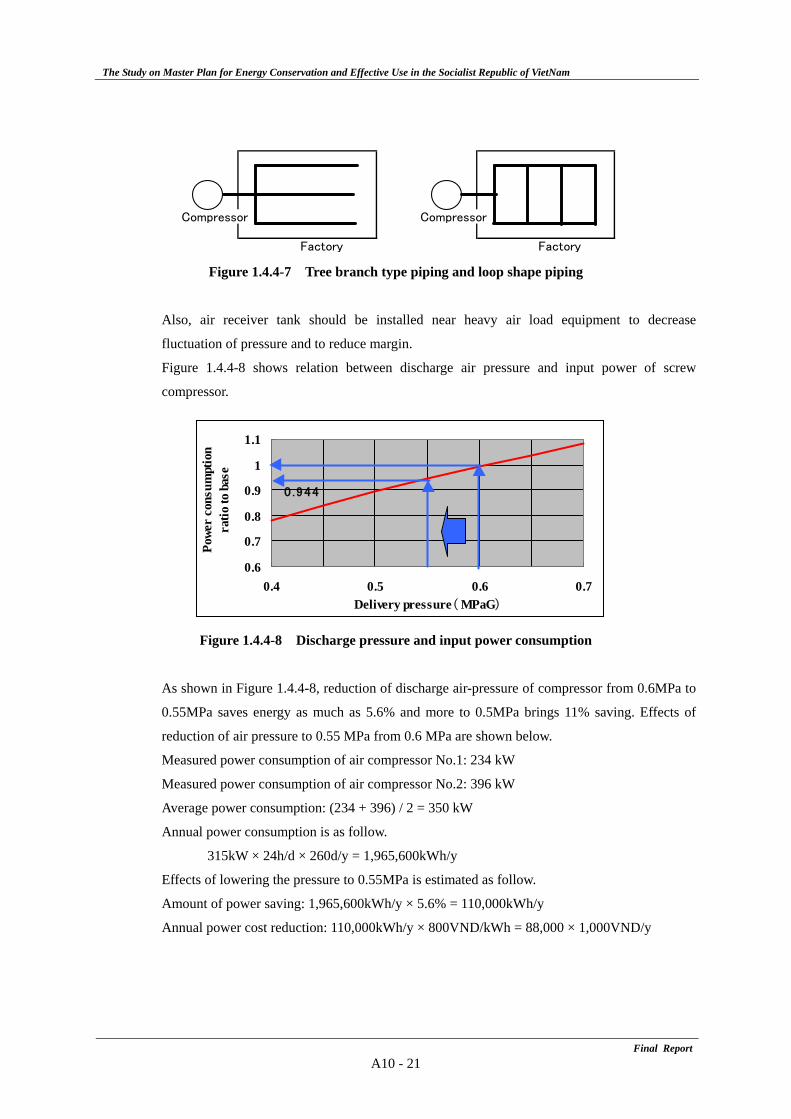
The Study on Master Plan for Energy Conservation and Effective Use in the Socialist Republic of VietNam
Final ReportA10 - 21
Figure 1.4.4-7 Tree branch type piping and loop shape piping
Also, air receiver tank should be installed near heavy air load equipment to decrease
fluctuation of pressure and to reduce margin.
Figure 1.4.4-8 shows relation between discharge air pressure and input power of screw
compressor.
Figure 1.4.4-8 Discharge pressure and input power consumption
As shown in Figure 1.4.4-8, reduction of discharge air-pressure of compressor from 0.6MPa to
0.55MPa saves energy as much as 5.6% and more to 0.5MPa brings 11% saving. Effects of
reduction of air pressure to 0.55 MPa from 0.6 MPa are shown below.
Measured power consumption of air compressor No.1: 234 kW
Measured power consumption of air compressor No.2: 396 kW
Average power consumption: (234 + 396) / 2 = 350 kW
Annual power consumption is as follow.
315kW × 24h/d × 260d/y = 1,965,600kWh/y
Effects of lowering the pressure to 0.55MPa is estimated as follow.
Amount of power saving: 1,965,600kWh/y × 5.6% = 110,000kWh/y
Annual power cost reduction: 110,000kWh/y × 800VND/kWh = 88,000 × 1,000VND/y
Compressor Compressor
Factory Factory
0.6
0.7
0.8
0.9
1
1.1
0.4 0.5 0.6 0.7Delivery pressure( MPaG)
Powe
r co
nsum
ptio
nra
tio to
bas
e
0 .944
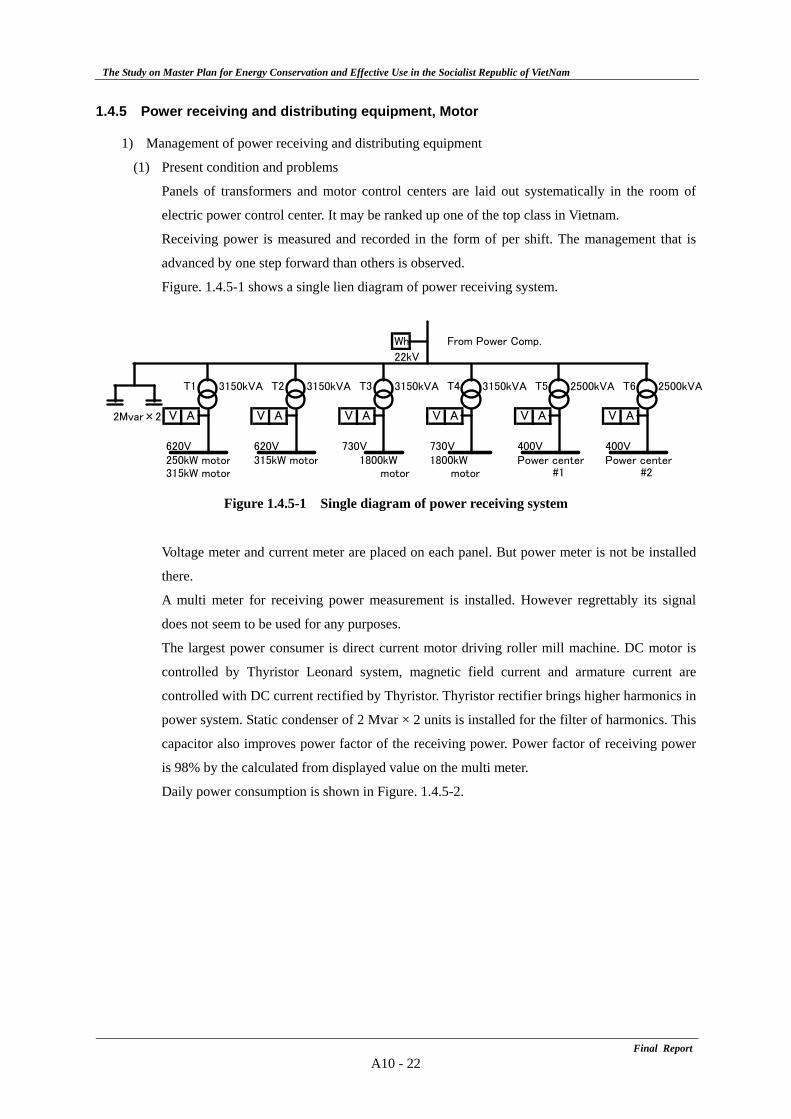
The Study on Master Plan for Energy Conservation and Effective Use in the Socialist Republic of VietNam
Final ReportA10 - 22
1.4.5 Power receiving and distributing equipment, Motor
1) Management of power receiving and distributing equipment
(1) Present condition and problems
Panels of transformers and motor control centers are laid out systematically in the room of
electric power control center. It may be ranked up one of the top class in Vietnam.
Receiving power is measured and recorded in the form of per shift. The management that is
advanced by one step forward than others is observed.
Figure. 1.4.5-1 shows a single lien diagram of power receiving system.
Figure 1.4.5-1 Single diagram of power receiving system
Voltage meter and current meter are placed on each panel. But power meter is not be installed
there.
A multi meter for receiving power measurement is installed. However regrettably its signal
does not seem to be used for any purposes.
The largest power consumer is direct current motor driving roller mill machine. DC motor is
controlled by Thyristor Leonard system, magnetic field current and armature current are
controlled with DC current rectified by Thyristor. Thyristor rectifier brings higher harmonics in
power system. Static condenser of 2 Mvar × 2 units is installed for the filter of harmonics. This
capacitor also improves power factor of the receiving power. Power factor of receiving power
is 98% by the calculated from displayed value on the multi meter.
Daily power consumption is shown in Figure. 1.4.5-2.
Wh From Power Comp.
22kV
T1 3150kVA T2 3150kVA T3 3150kVA T4 3150kVA T5 2500kVA T6 2500kVA
2Mvar×2 V A V A V A V A V A V A
620V 620V 730V 730V 400V 400V250kW motor 315kW motor 1800kW 1800kW Power center Power center315kW motor motor motor #1 #2
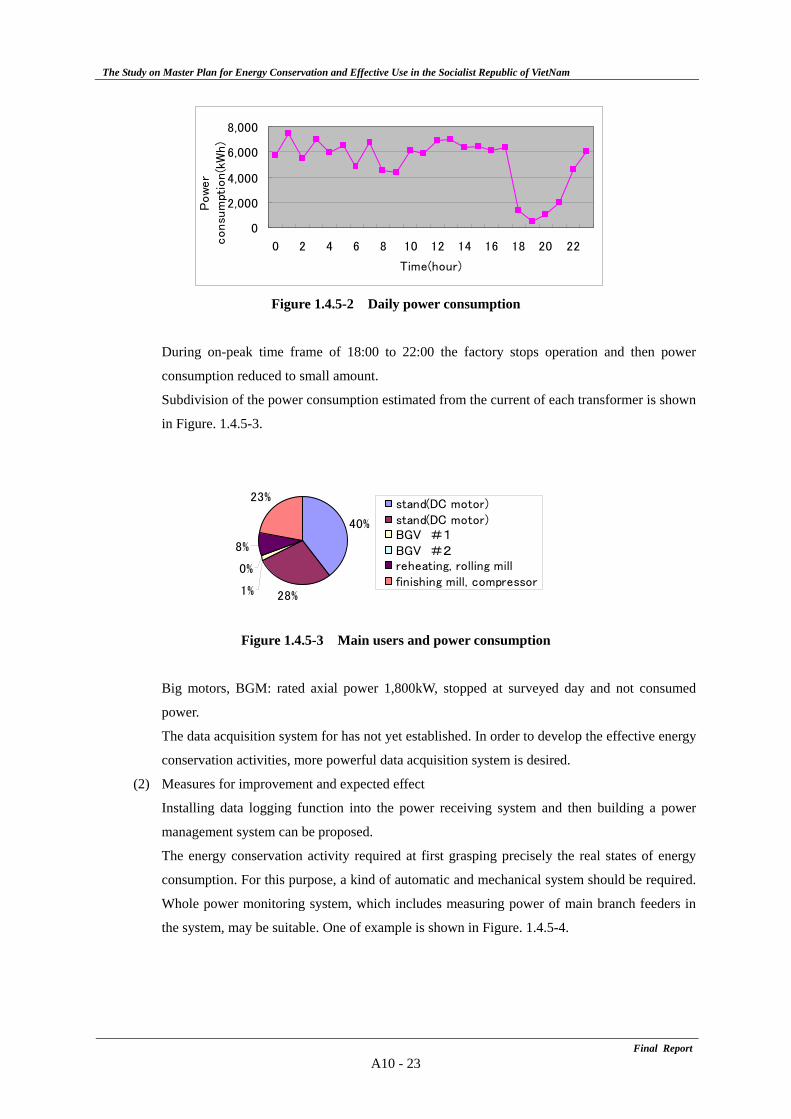
The Study on Master Plan for Energy Conservation and Effective Use in the Socialist Republic of VietNam
Final ReportA10 - 23
Figure 1.4.5-2 Daily power consumption
During on-peak time frame of 18:00 to 22:00 the factory stops operation and then power
consumption reduced to small amount.
Subdivision of the power consumption estimated from the current of each transformer is shown
in Figure. 1.4.5-3.
Figure 1.4.5-3 Main users and power consumption
Big motors, BGM: rated axial power 1,800kW, stopped at surveyed day and not consumed
power.
The data acquisition system for has not yet established. In order to develop the effective energy
conservation activities, more powerful data acquisition system is desired.
(2) Measures for improvement and expected effect
Installing data logging function into the power receiving system and then building a power
management system can be proposed.
The energy conservation activity required at first grasping precisely the real states of energy
consumption. For this purpose, a kind of automatic and mechanical system should be required.
Whole power monitoring system, which includes measuring power of main branch feeders in
the system, may be suitable. One of example is shown in Figure. 1.4.5-4.
0
2,000
4,000
6,000
8,000
0 2 4 6 8 10 12 14 16 18 20 22
Time(hour)
Pow
er
consu
mpt
ion(k
Wh)
40%
28%1%
0%
8%
23%stand(DC motor)stand(DC motor)BGV #1BGV #2reheating, rolling millfinishing mill, compressor
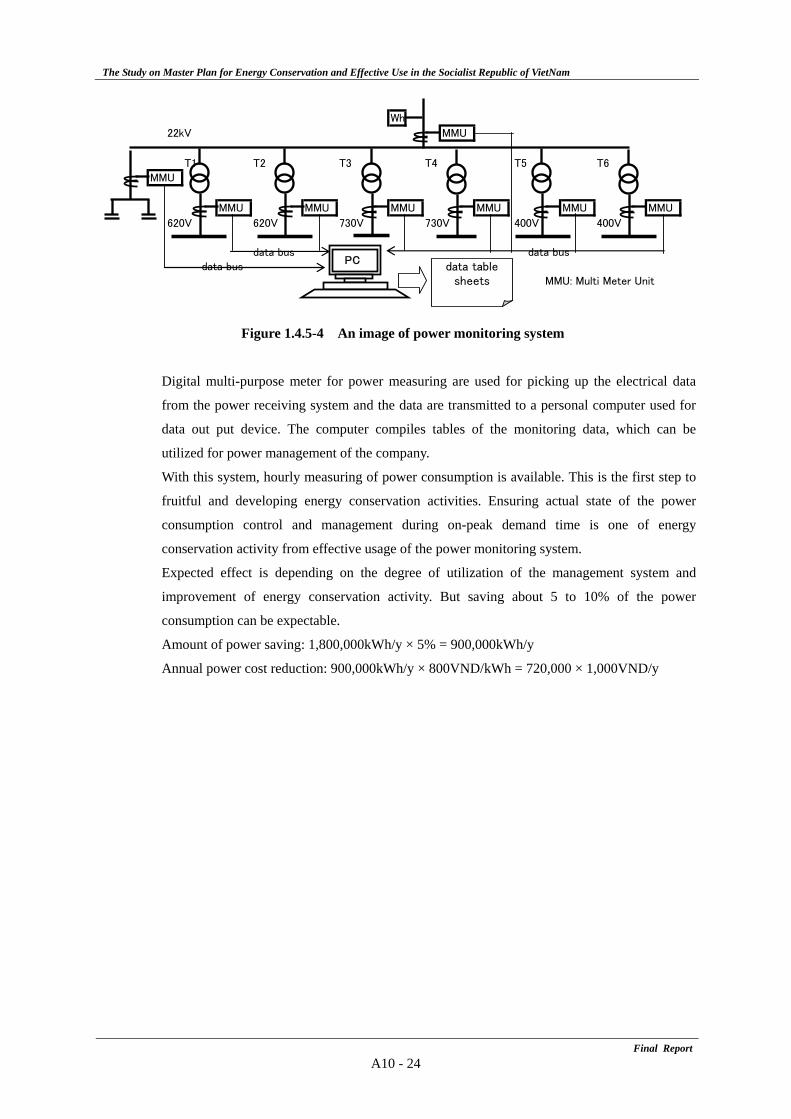
The Study on Master Plan for Energy Conservation and Effective Use in the Socialist Republic of VietNam
Final ReportA10 - 24
Wh
22kV MMU
T1 T2 T3 T4 T5 T6MMU
MMU MMU MMU MMU MMU MMU
620V 620V 730V 730V 400V 400V
data bus data busdata bus
MMU: Multi Meter Unit
PCdata table
sheets
Figure 1.4.5-4 An image of power monitoring system
Digital multi-purpose meter for power measuring are used for picking up the electrical data
from the power receiving system and the data are transmitted to a personal computer used for
data out put device. The computer compiles tables of the monitoring data, which can be
utilized for power management of the company.
With this system, hourly measuring of power consumption is available. This is the first step to
fruitful and developing energy conservation activities. Ensuring actual state of the power
consumption control and management during on-peak demand time is one of energy
conservation activity from effective usage of the power monitoring system.
Expected effect is depending on the degree of utilization of the management system and
improvement of energy conservation activity. But saving about 5 to 10% of the power
consumption can be expectable.
Amount of power saving: 1,800,000kWh/y × 5% = 900,000kWh/y
Annual power cost reduction: 900,000kWh/y × 800VND/kWh = 720,000 × 1,000VND/y
The Study on Master Plan for Energy Conservation and Effective Use in the Socialist Republic of VietNam
Final ReportA10 - 25
2. Ceramics Factory B
2.1 Introduction
1) Name: Ceramics Factory B
2) Address: Hanoi City
3) Business
(1) Type: Ceramics
(2) Main product: Floor tile and Brick
(3) Amount of product: 1,400,000 m2 (2007)
(4) Export: Taiwan, Korea, USA, UK, Japan
(5) Employee: 253 persons
4) Person in charge of energy on-site survey: Vice President
5) Outline of the factory
Production began in 2001 with equipment introduced from Italy. Almost all raw materials used
are domestics and partly imported from Spain. Production of tile by this factory accounts for 5 %
of the total production in Vietnam, and they are exported to Taiwan, South Korea, the U.S., the
U.K. and Japan. It has a plan to a suburb of Hanoi City constructing a new factory, and begin
production in 2010.
2.2 Outline of on-site survey
1) Survey team member
JICA Study Team: Mr. Norio Fukushima, Mr, Wataru Ishikawa, Mr. Hisashi Amano
Institute of Energy: Mr.Song ,Mr. Hoang Anh
ECC-Hanoi: Mr. huynh, Mr. Hai, Ms. Linh
2) Surveyed period: 29th to 30th September, 2008 (2 days)
3) Request for energy conservation
How to improve energy conservation
How much is energy conservation effect
2.3 Results of energy on-site survey
1) Improvement items and effects of forecast after improvement
Improvement items and effects of forecast after improvement by on-site survey is shown in Table
2.3-1. Energy conservation potential is 12.3%
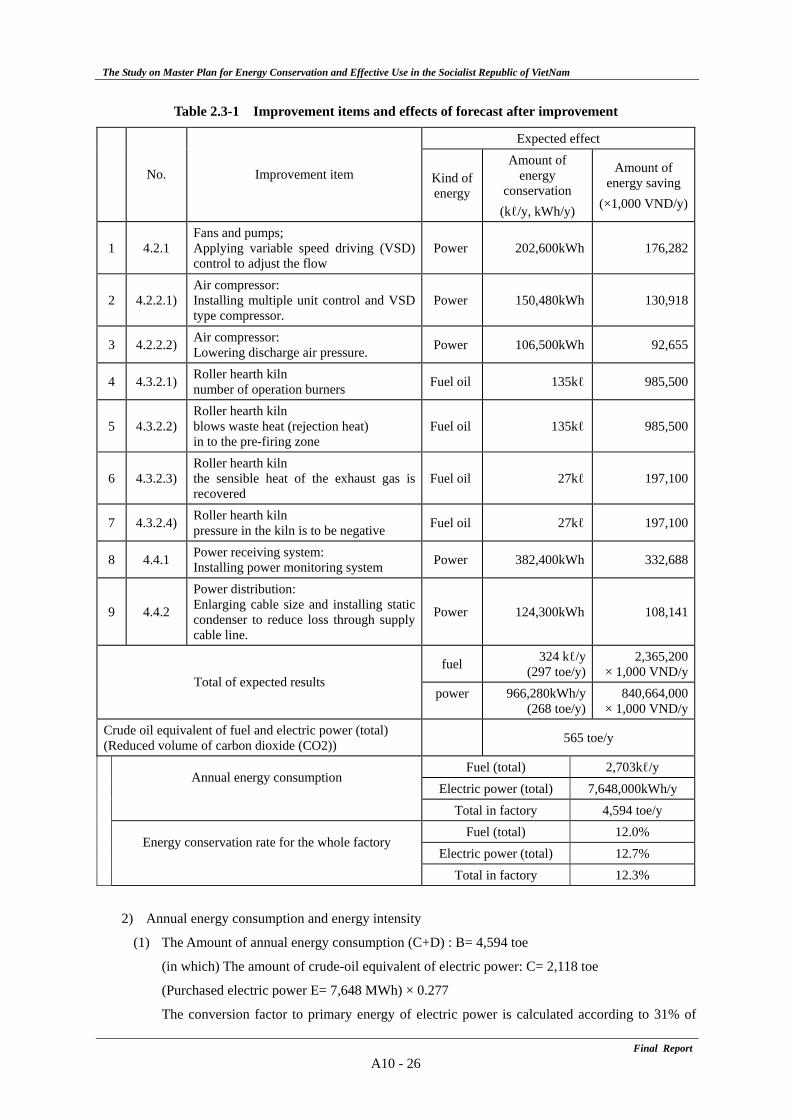
The Study on Master Plan for Energy Conservation and Effective Use in the Socialist Republic of VietNam
Final ReportA10 - 26
Table 2.3-1 Improvement items and effects of forecast after improvement
Expected effect
No. Improvement item Kind of energy
Amount of energy
conservation (kℓ/y, kWh/y)
Amount of energy saving
(×1,000 VND/y)
1 4.2.1 Fans and pumps; Applying variable speed driving (VSD) control to adjust the flow
Power 202,600kWh 176,282
2 4.2.2.1) Air compressor: Installing multiple unit control and VSD type compressor.
Power 150,480kWh 130,918
3 4.2.2.2) Air compressor: Lowering discharge air pressure. Power 106,500kWh 92,655
4 4.3.2.1) Roller hearth kiln number of operation burners Fuel oil 135kℓ 985,500
5 4.3.2.2) Roller hearth kiln blows waste heat (rejection heat) in to the pre-firing zone
Fuel oil 135kℓ 985,500
6 4.3.2.3) Roller hearth kiln the sensible heat of the exhaust gas is recovered
Fuel oil 27kℓ 197,100
7 4.3.2.4) Roller hearth kiln pressure in the kiln is to be negative Fuel oil 27kℓ 197,100
8 4.4.1 Power receiving system: Installing power monitoring system Power 382,400kWh 332,688
9 4.4.2
Power distribution: Enlarging cable size and installing static condenser to reduce loss through supply cable line.
Power 124,300kWh 108,141
fuel 324 kℓ/y (297 toe/y)
2,365,200× 1,000 VND/y
Total of expected results power 966,280kWh/y
(268 toe/y) 840,664,000
× 1,000 VND/yCrude oil equivalent of fuel and electric power (total) (Reduced volume of carbon dioxide (CO2))
565 toe/y
Fuel (total) 2,703kℓ/y Annual energy consumption
Electric power (total) 7,648,000kWh/y Total in factory 4,594 toe/y
Fuel (total) 12.0%
Energy conservation rate for the whole factory Electric power (total) 12.7%
Total in factory 12.3%
2) Annual energy consumption and energy intensity
(1) The Amount of annual energy consumption (C+D) : B= 4,594 toe
(in which) The amount of crude-oil equivalent of electric power: C= 2,118 toe
(Purchased electric power E= 7,648 MWh) × 0.277
The conversion factor to primary energy of electric power is calculated according to 31% of
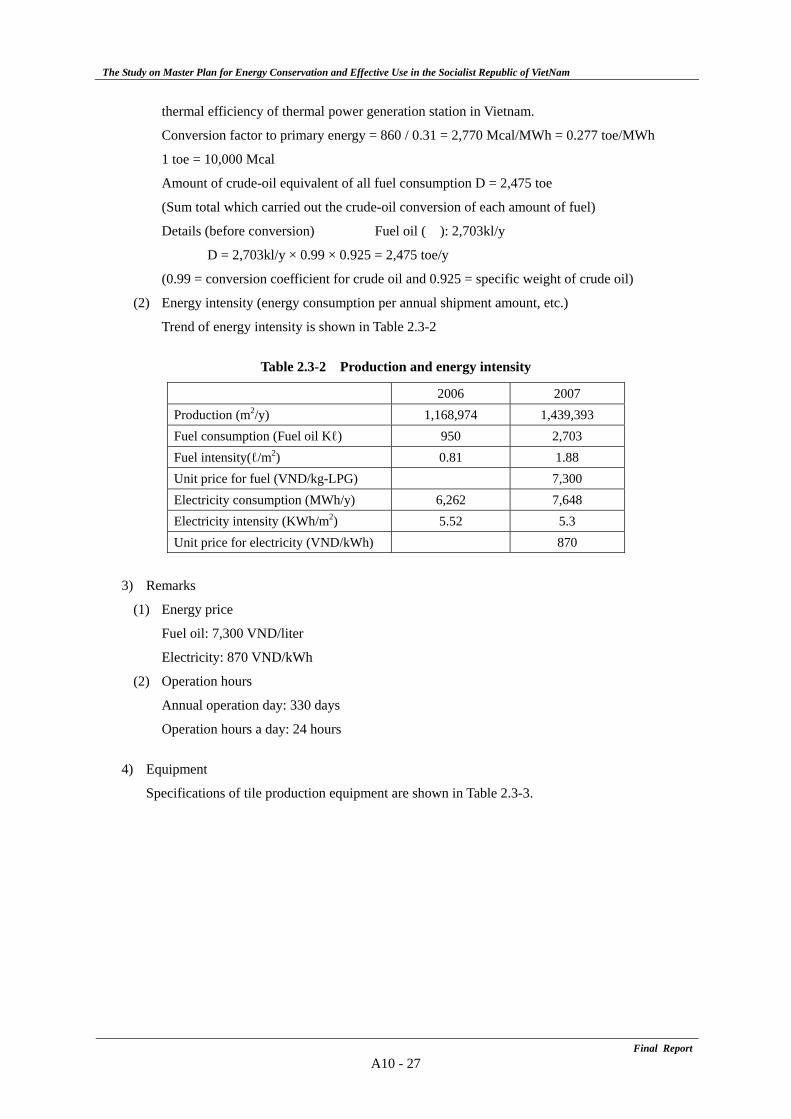
The Study on Master Plan for Energy Conservation and Effective Use in the Socialist Republic of VietNam
Final ReportA10 - 27
thermal efficiency of thermal power generation station in Vietnam.
Conversion factor to primary energy = 860 / 0.31 = 2,770 Mcal/MWh = 0.277 toe/MWh
1 toe = 10,000 Mcal
Amount of crude-oil equivalent of all fuel consumption D = 2,475 toe
(Sum total which carried out the crude-oil conversion of each amount of fuel)
Details (before conversion) Fuel oil ( ): 2,703kl/y
D = 2,703kl/y × 0.99 × 0.925 = 2,475 toe/y
(0.99 = conversion coefficient for crude oil and 0.925 = specific weight of crude oil)
(2) Energy intensity (energy consumption per annual shipment amount, etc.)
Trend of energy intensity is shown in Table 2.3-2
Table 2.3-2 Production and energy intensity
2006 2007 Production (m2/y) 1,168,974 1,439,393 Fuel consumption (Fuel oil Kℓ) 950 2,703 Fuel intensity(ℓ/m2) 0.81 1.88 Unit price for fuel (VND/kg-LPG) 7,300 Electricity consumption (MWh/y) 6,262 7,648 Electricity intensity (KWh/m2) 5.52 5.3 Unit price for electricity (VND/kWh) 870
3) Remarks
(1) Energy price
Fuel oil: 7,300 VND/liter
Electricity: 870 VND/kWh
(2) Operation hours
Annual operation day: 330 days
Operation hours a day: 24 hours
4) Equipment
Specifications of tile production equipment are shown in Table 2.3-3.
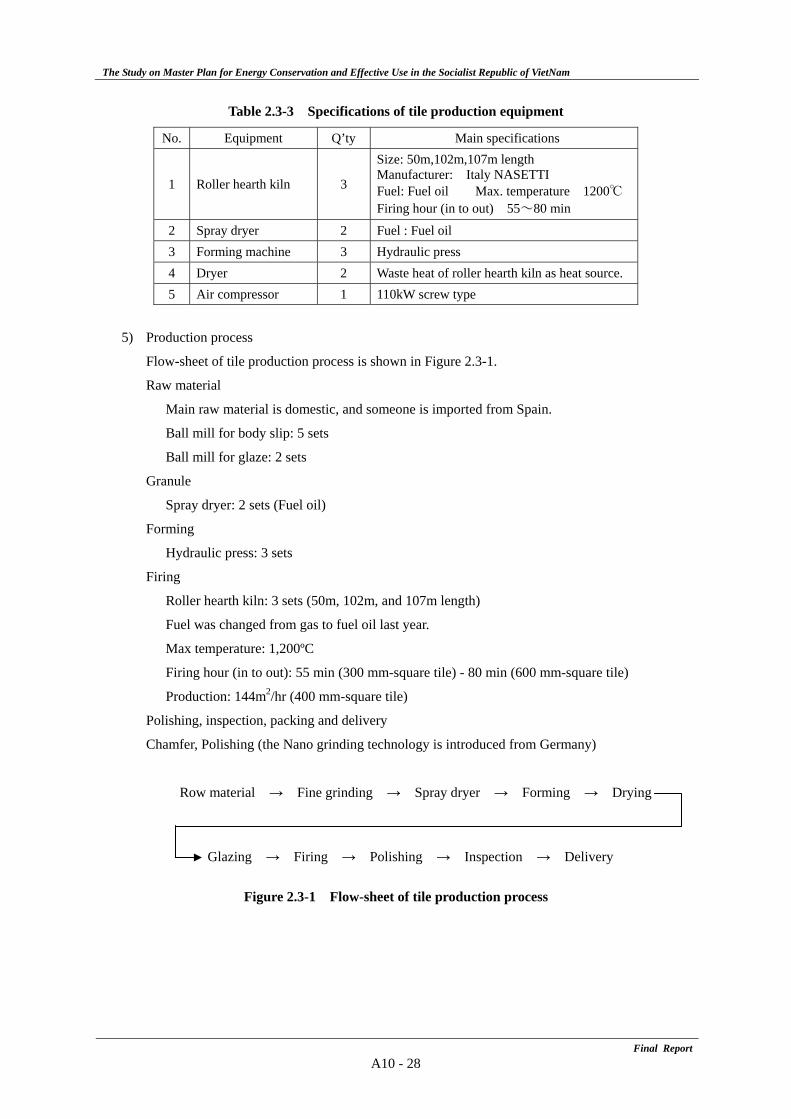
The Study on Master Plan for Energy Conservation and Effective Use in the Socialist Republic of VietNam
Final ReportA10 - 28
Table 2.3-3 Specifications of tile production equipment
No. Equipment Q’ty Main specifications
1 Roller hearth kiln 3
Size: 50m,102m,107m length Manufacturer: Italy NASETTI Fuel: Fuel oil Max. temperature 1200℃ Firing hour (in to out) 55~80 min
2 Spray dryer 2 Fuel : Fuel oil 3 Forming machine 3 Hydraulic press 4 Dryer 2 Waste heat of roller hearth kiln as heat source. 5 Air compressor 1 110kW screw type
5) Production process
Flow-sheet of tile production process is shown in Figure 2.3-1.
Raw material
Main raw material is domestic, and someone is imported from Spain.
Ball mill for body slip: 5 sets
Ball mill for glaze: 2 sets
Granule
Spray dryer: 2 sets (Fuel oil)
Forming
Hydraulic press: 3 sets
Firing
Roller hearth kiln: 3 sets (50m, 102m, and 107m length)
Fuel was changed from gas to fuel oil last year.
Max temperature: 1,200ºC
Firing hour (in to out): 55 min (300 mm-square tile) - 80 min (600 mm-square tile)
Production: 144m2/hr (400 mm-square tile)
Polishing, inspection, packing and delivery
Chamfer, Polishing (the Nano grinding technology is introduced from Germany) Row material → Fine grinding → Spray dryer → Forming → Drying Glazing → Firing → Polishing → Inspection → Delivery
Figure 2.3-1 Flow-sheet of tile production process
The Study on Master Plan for Energy Conservation and Effective Use in the Socialist Republic of VietNam
Final ReportA10 - 29
2.4 On-site survey report
2.4.1 General management matter
1) Energy management organization and target
(1) Present condition and problems
Energy management organization is not established, and also the target of energy intensity and
energy conservation activity. The equipment is the modern machine and problems are not in
hardware, but the problems are how to introduce the firing technology and the management
technique such as soft ware.
(2) Measures for Improvement
Energy conservation activity including cost reduction should be enforced and top management
of the company should overcome these problems and introducing a soft ware.
2) Implementation of measurement and record
(1) Present condition and problems
The equipment is not different from that of Japan, but a part of the instrumentation and the
record meter are out of order. therefore energy use condition is not grasped.
(2) Measures for Improvement
It is important for managers and engineers to recognize the energy conservation.
3) Maintenance of facility
(1) Present condition and problems
Some oil leakage is found in the piping of the oil pump. Maintenance is not done with the
measurement devices broke down. It is necessary to set up management standard including the
item and inspection frequency and to implement maintenance.
(2) Measures for Improvement
Periodic inspection should be implemented.
4) Management of fuel consumption
(1) Present condition and problems
The shortage and defective operation of instrumentation are seen partially, and also the energy
consumption management is not implemented by using the measured and recorded data.
(2) Measures for Improvement
The maintenance of instrumentation is a starting point of energy conservation activity.
5) Energy intensity management of main products
(1) Present condition and problems
Since management of the energy consumption is not carried out, energy intensity has not been
managed.
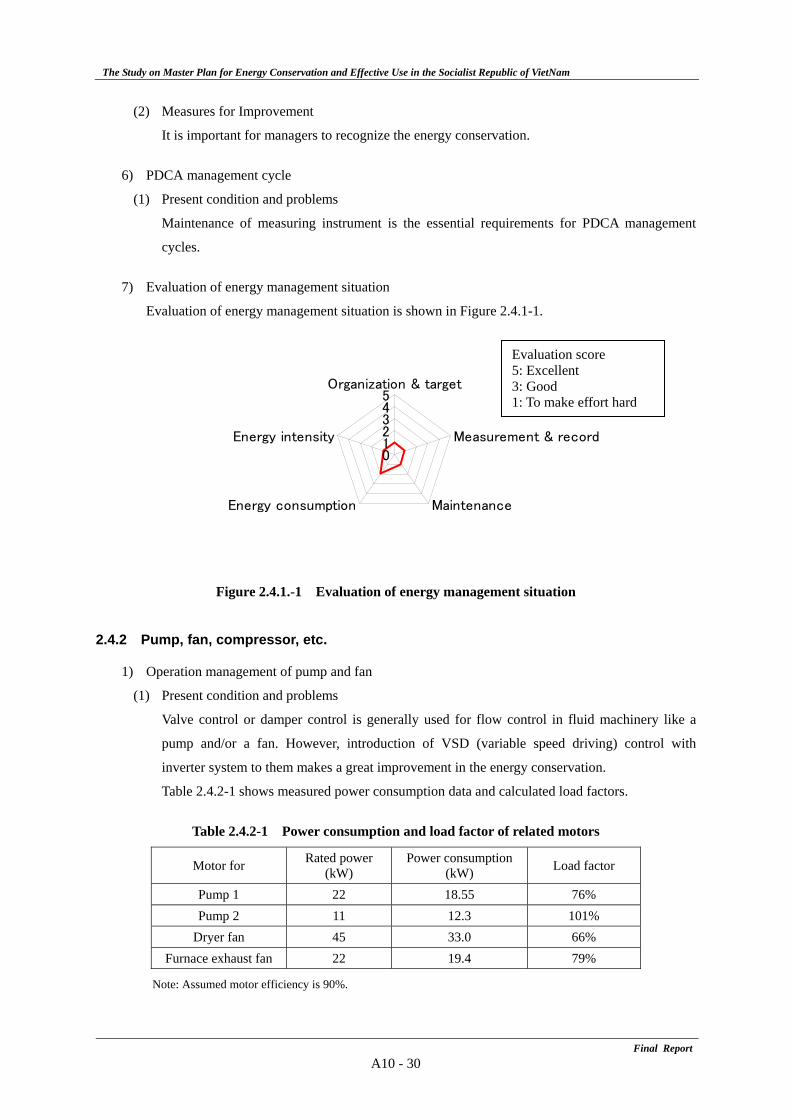
The Study on Master Plan for Energy Conservation and Effective Use in the Socialist Republic of VietNam
Final ReportA10 - 30
(2) Measures for Improvement
It is important for managers to recognize the energy conservation.
6) PDCA management cycle
(1) Present condition and problems
Maintenance of measuring instrument is the essential requirements for PDCA management
cycles.
7) Evaluation of energy management situation
Evaluation of energy management situation is shown in Figure 2.4.1-1.
Figure 2.4.1.-1 Evaluation of energy management situation
2.4.2 Pump, fan, compressor, etc.
1) Operation management of pump and fan
(1) Present condition and problems
Valve control or damper control is generally used for flow control in fluid machinery like a
pump and/or a fan. However, introduction of VSD (variable speed driving) control with
inverter system to them makes a great improvement in the energy conservation.
Table 2.4.2-1 shows measured power consumption data and calculated load factors.
Table 2.4.2-1 Power consumption and load factor of related motors
Motor for Rated power (kW)
Power consumption (kW) Load factor
Pump 1 22 18.55 76% Pump 2 11 12.3 101%
Dryer fan 45 33.0 66% Furnace exhaust fan 22 19.4 79%
Note: Assumed motor efficiency is 90%.
012345
Organization & target
Measurement & record
MaintenanceEnergy consumption
Energy intensity
Evaluation score 5: Excellent 3: Good 1: To make effort hard
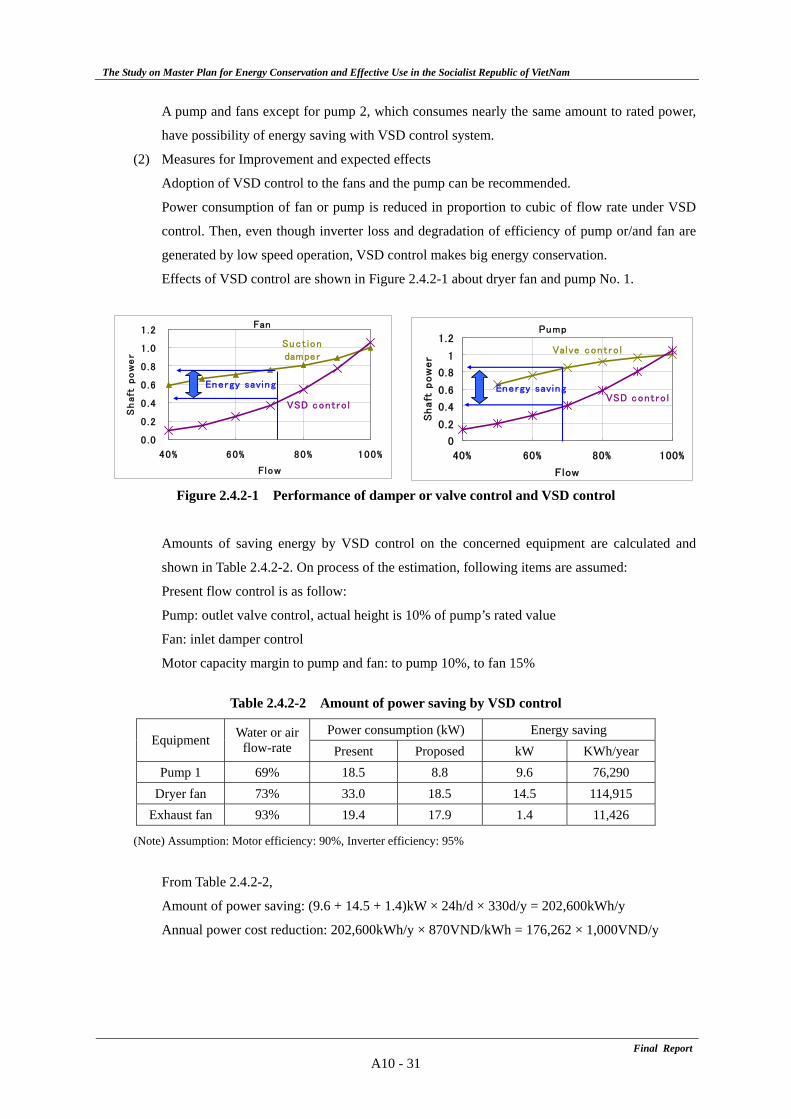
The Study on Master Plan for Energy Conservation and Effective Use in the Socialist Republic of VietNam
Final ReportA10 - 31
A pump and fans except for pump 2, which consumes nearly the same amount to rated power,
have possibility of energy saving with VSD control system.
(2) Measures for Improvement and expected effects
Adoption of VSD control to the fans and the pump can be recommended.
Power consumption of fan or pump is reduced in proportion to cubic of flow rate under VSD
control. Then, even though inverter loss and degradation of efficiency of pump or/and fan are
generated by low speed operation, VSD control makes big energy conservation.
Effects of VSD control are shown in Figure 2.4.2-1 about dryer fan and pump No. 1.
Figure 2.4.2-1 Performance of damper or valve control and VSD control
Amounts of saving energy by VSD control on the concerned equipment are calculated and
shown in Table 2.4.2-2. On process of the estimation, following items are assumed:
Present flow control is as follow:
Pump: outlet valve control, actual height is 10% of pump’s rated value
Fan: inlet damper control
Motor capacity margin to pump and fan: to pump 10%, to fan 15%
Table 2.4.2-2 Amount of power saving by VSD control
Power consumption (kW) Energy saving Equipment Water or air
flow-rate Present Proposed kW KWh/year Pump 1 69% 18.5 8.8 9.6 76,290
Dryer fan 73% 33.0 18.5 14.5 114,915 Exhaust fan 93% 19.4 17.9 1.4 11,426
(Note) Assumption: Motor efficiency: 90%, Inverter efficiency: 95%
From Table 2.4.2-2,
Amount of power saving: (9.6 + 14.5 + 1.4)kW × 24h/d × 330d/y = 202,600kWh/y
Annual power cost reduction: 202,600kWh/y × 870VND/kWh = 176,262 × 1,000VND/y
Pump
0
0.2
0.4
0.6
0.8
1
1.2
40% 60% 80% 100%
Flow
Shaft
pow
er
Fan
0 .0
0 .2
0 .4
0 .6
0 .8
1 .0
1 .2
40% 60% 80% 100%
Flow
Sh
aft
po
we
r
Energy saving
Suct iondamper
Energy saving
VSD contro lVSD contro l
Valve contro l
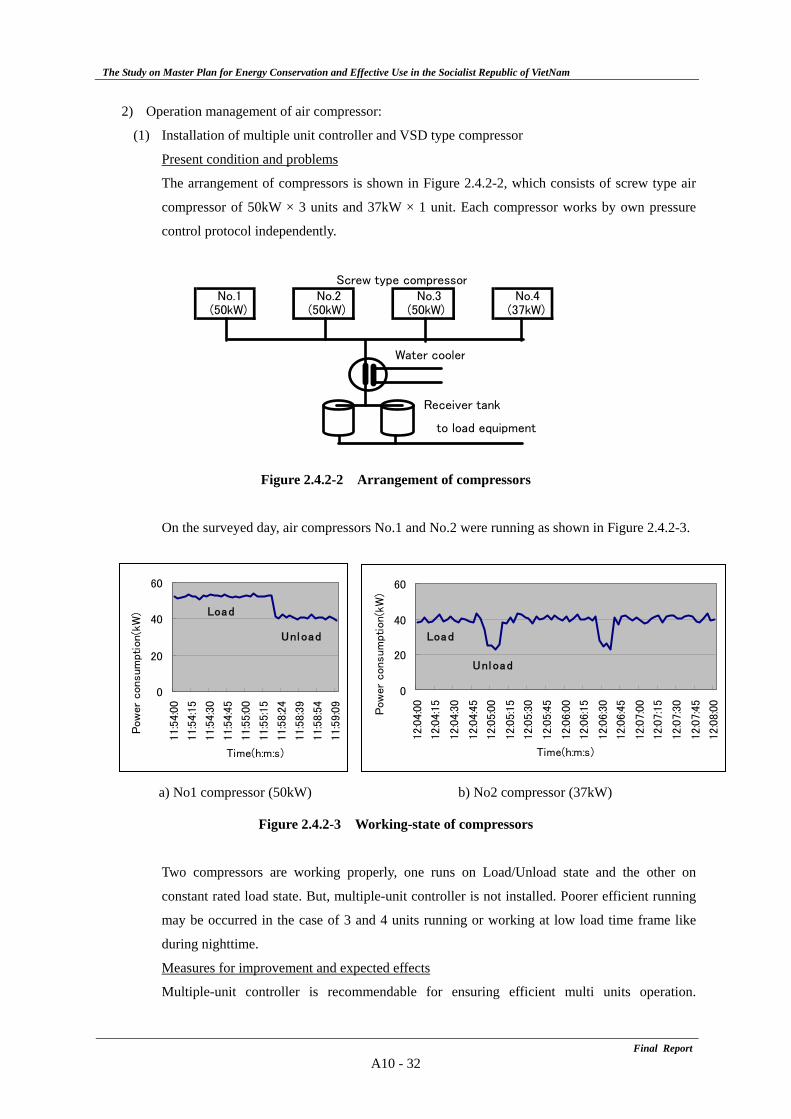
The Study on Master Plan for Energy Conservation and Effective Use in the Socialist Republic of VietNam
Final ReportA10 - 32
2) Operation management of air compressor:
(1) Installation of multiple unit controller and VSD type compressor
Present condition and problems
The arrangement of compressors is shown in Figure 2.4.2-2, which consists of screw type air
compressor of 50kW × 3 units and 37kW × 1 unit. Each compressor works by own pressure
control protocol independently.
Figure 2.4.2-2 Arrangement of compressors
On the surveyed day, air compressors No.1 and No.2 were running as shown in Figure 2.4.2-3.
a) No1 compressor (50kW) b) No2 compressor (37kW)
Figure 2.4.2-3 Working-state of compressors
Two compressors are working properly, one runs on Load/Unload state and the other on
constant rated load state. But, multiple-unit controller is not installed. Poorer efficient running
may be occurred in the case of 3 and 4 units running or working at low load time frame like
during nighttime.
Measures for improvement and expected effects
Multiple-unit controller is recommendable for ensuring efficient multi units operation.
Screw type compressorNo.1 No.2 No.3 No.4
(50kW) (50kW) (50kW) (37kW)
Water cooler
to load equipment
Receiver tank
0
20
40
60
11:5
4:0
0
11:5
4:1
5
11:5
4:3
0
11:5
4:4
5
11:5
5:0
0
11:5
5:1
5
11:5
8:2
4
11:5
8:3
9
11:5
8:5
4
11:5
9:0
9
Time(h:m:s)
Pow
er
consum
ptio
n(k
W)
0
20
40
60
12:0
4:0
0
12:0
4:1
5
12:0
4:3
0
12:0
4:4
5
12:0
5:0
0
12:0
5:1
5
12:0
5:3
0
12:0
5:4
5
12:0
6:0
0
12:0
6:1
5
12:0
6:3
0
12:0
6:4
5
12:0
7:0
0
12:0
7:1
5
12:0
7:3
0
12:0
7:4
5
12:0
8:0
0
Time(h:m:s)
Pow
er c
onsum
ptio
n(k
W)
Load
Unload Load
Unload
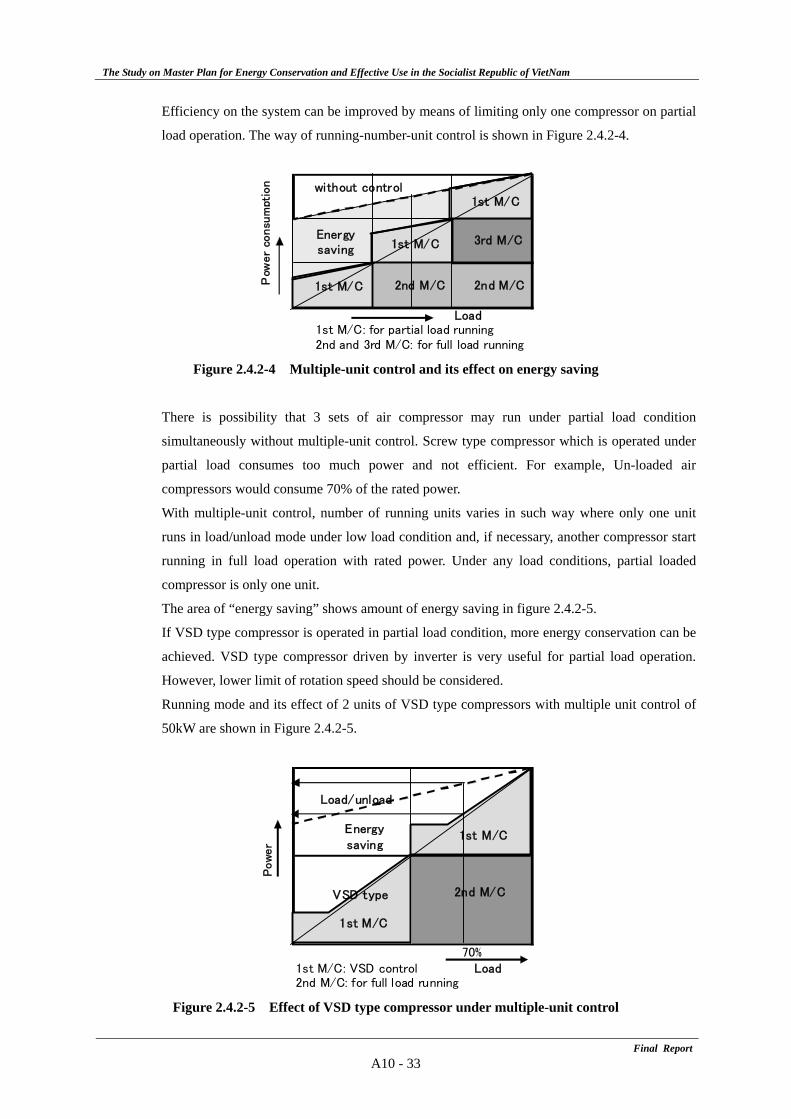
The Study on Master Plan for Energy Conservation and Effective Use in the Socialist Republic of VietNam
Final ReportA10 - 33
Efficiency on the system can be improved by means of limiting only one compressor on partial
load operation. The way of running-number-unit control is shown in Figure 2.4.2-4.
3rd M/C
1st M/C 2nd M/C 2nd M/C
Load1st M/C: for partial load running2nd and 3rd M/C: for full load running
1st M/C
1st M/C
1st M/Cwithout control
Pow
er
consu
mpt
ion
Energysaving
Figure 2.4.2-4 Multiple-unit control and its effect on energy saving
There is possibility that 3 sets of air compressor may run under partial load condition
simultaneously without multiple-unit control. Screw type compressor which is operated under
partial load consumes too much power and not efficient. For example, Un-loaded air
compressors would consume 70% of the rated power.
With multiple-unit control, number of running units varies in such way where only one unit
runs in load/unload mode under low load condition and, if necessary, another compressor start
running in full load operation with rated power. Under any load conditions, partial loaded
compressor is only one unit.
The area of “energy saving” shows amount of energy saving in figure 2.4.2-5.
If VSD type compressor is operated in partial load condition, more energy conservation can be
achieved. VSD type compressor driven by inverter is very useful for partial load operation.
However, lower limit of rotation speed should be considered.
Running mode and its effect of 2 units of VSD type compressors with multiple unit control of
50kW are shown in Figure 2.4.2-5.
2nd M/C
1st M/C: VSD control Load2nd M/C: for full load running
70%
1st M/C
1st M/C
Load/unload
Pow
er
Energysaving
VSD type
Figure 2.4.2-5 Effect of VSD type compressor under multiple-unit control
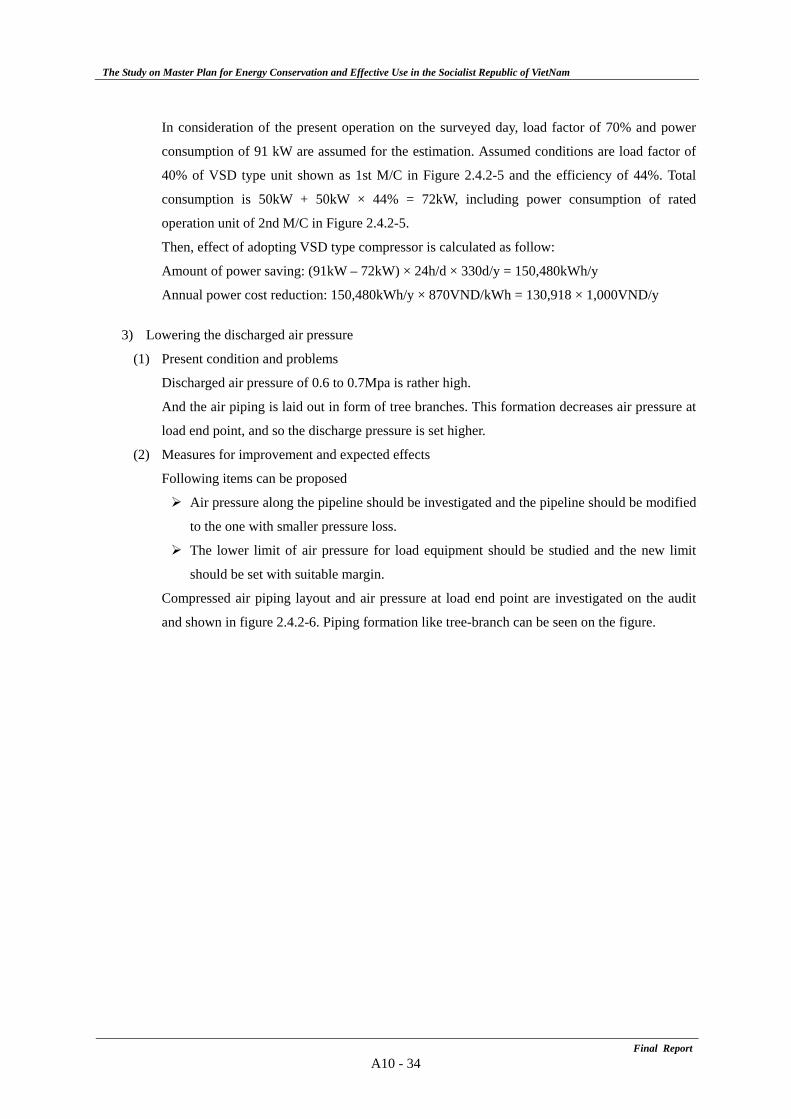
The Study on Master Plan for Energy Conservation and Effective Use in the Socialist Republic of VietNam
Final ReportA10 - 34
In consideration of the present operation on the surveyed day, load factor of 70% and power
consumption of 91 kW are assumed for the estimation. Assumed conditions are load factor of
40% of VSD type unit shown as 1st M/C in Figure 2.4.2-5 and the efficiency of 44%. Total
consumption is 50kW + 50kW × 44% = 72kW, including power consumption of rated
operation unit of 2nd M/C in Figure 2.4.2-5.
Then, effect of adopting VSD type compressor is calculated as follow:
Amount of power saving: (91kW – 72kW) × 24h/d × 330d/y = 150,480kWh/y
Annual power cost reduction: 150,480kWh/y × 870VND/kWh = 130,918 × 1,000VND/y
3) Lowering the discharged air pressure
(1) Present condition and problems
Discharged air pressure of 0.6 to 0.7Mpa is rather high.
And the air piping is laid out in form of tree branches. This formation decreases air pressure at
load end point, and so the discharge pressure is set higher.
(2) Measures for improvement and expected effects
Following items can be proposed
Air pressure along the pipeline should be investigated and the pipeline should be modified
to the one with smaller pressure loss.
The lower limit of air pressure for load equipment should be studied and the new limit
should be set with suitable margin.
Compressed air piping layout and air pressure at load end point are investigated on the audit
and shown in figure 2.4.2-6. Piping formation like tree-branch can be seen on the figure.
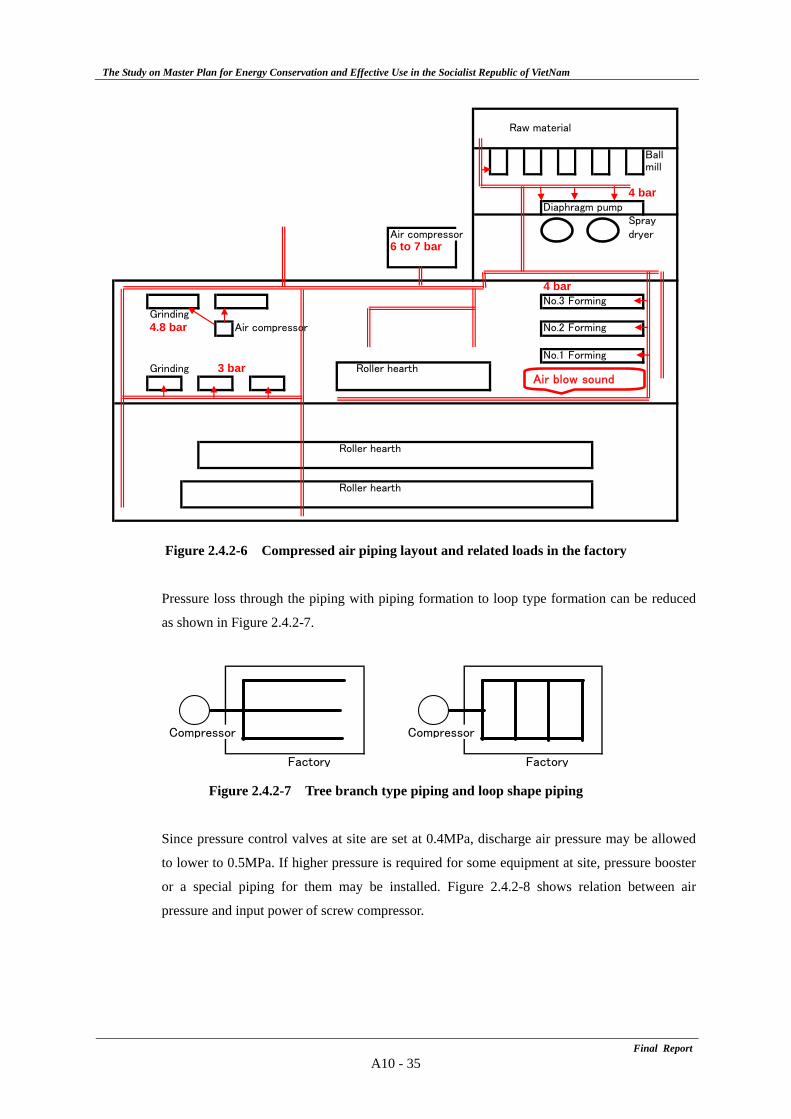
The Study on Master Plan for Energy Conservation and Effective Use in the Socialist Republic of VietNam
Final ReportA10 - 35
Raw material
Ballmill
4 barDiaphragm pump
SprayAir compressor dryer6 to 7 bar
4 barNo.3 Forming
Grinding4.8 bar Air compressor No.2 Forming
No.1 Forming Grinding 3 bar Roller hearth
Roller hearth
Roller hearth
Air blow sound
Figure 2.4.2-6 Compressed air piping layout and related loads in the factory
Pressure loss through the piping with piping formation to loop type formation can be reduced
as shown in Figure 2.4.2-7.
Figure 2.4.2-7 Tree branch type piping and loop shape piping
Since pressure control valves at site are set at 0.4MPa, discharge air pressure may be allowed
to lower to 0.5MPa. If higher pressure is required for some equipment at site, pressure booster
or a special piping for them may be installed. Figure 2.4.2-8 shows relation between air
pressure and input power of screw compressor.
Compressor Compressor
Factory Factory
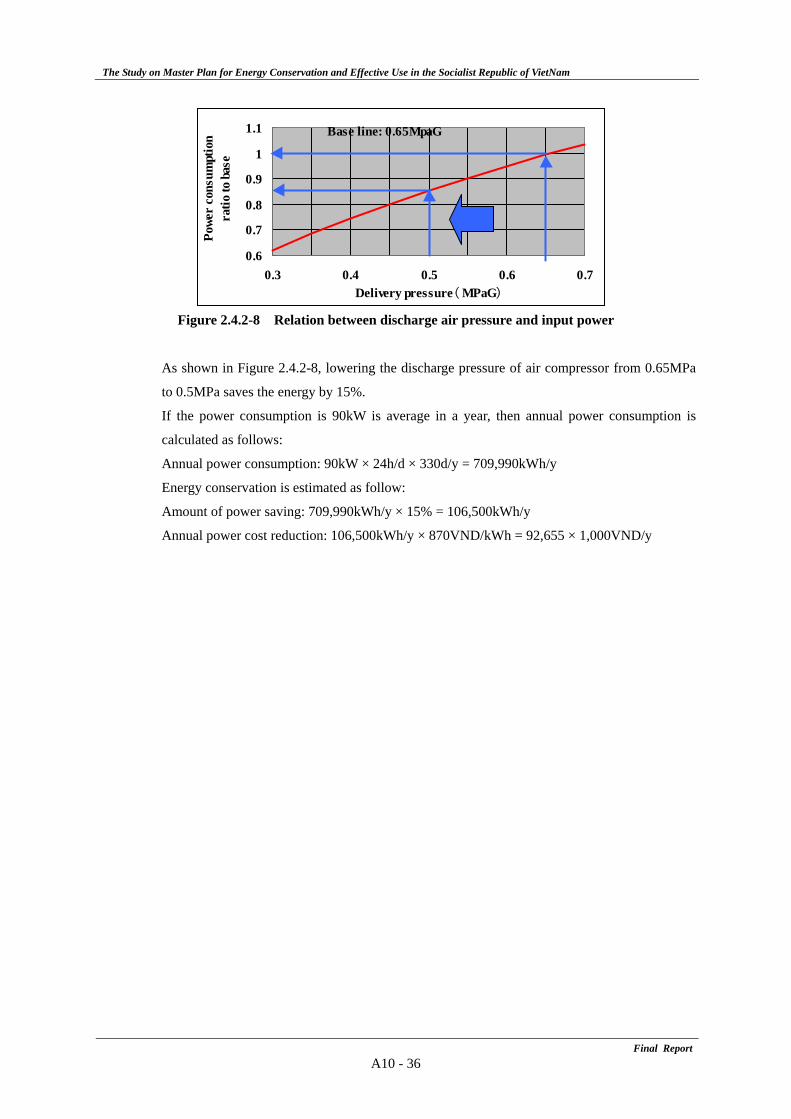
The Study on Master Plan for Energy Conservation and Effective Use in the Socialist Republic of VietNam
Final ReportA10 - 36
Figure 2.4.2-8 Relation between discharge air pressure and input power
As shown in Figure 2.4.2-8, lowering the discharge pressure of air compressor from 0.65MPa
to 0.5MPa saves the energy by 15%.
If the power consumption is 90kW is average in a year, then annual power consumption is
calculated as follows:
Annual power consumption: 90kW × 24h/d × 330d/y = 709,990kWh/y
Energy conservation is estimated as follow:
Amount of power saving: 709,990kWh/y × 15% = 106,500kWh/y
Annual power cost reduction: 106,500kWh/y × 870VND/kWh = 92,655 × 1,000VND/y
Base line: 0.65MpaG
0.6
0.7
0.8
0.9
1
1.1
0.3 0.4 0.5 0.6 0.7Delivery pressure( MPaG)
Powe
r co
nsum
ptio
nra
tio to
bas
e
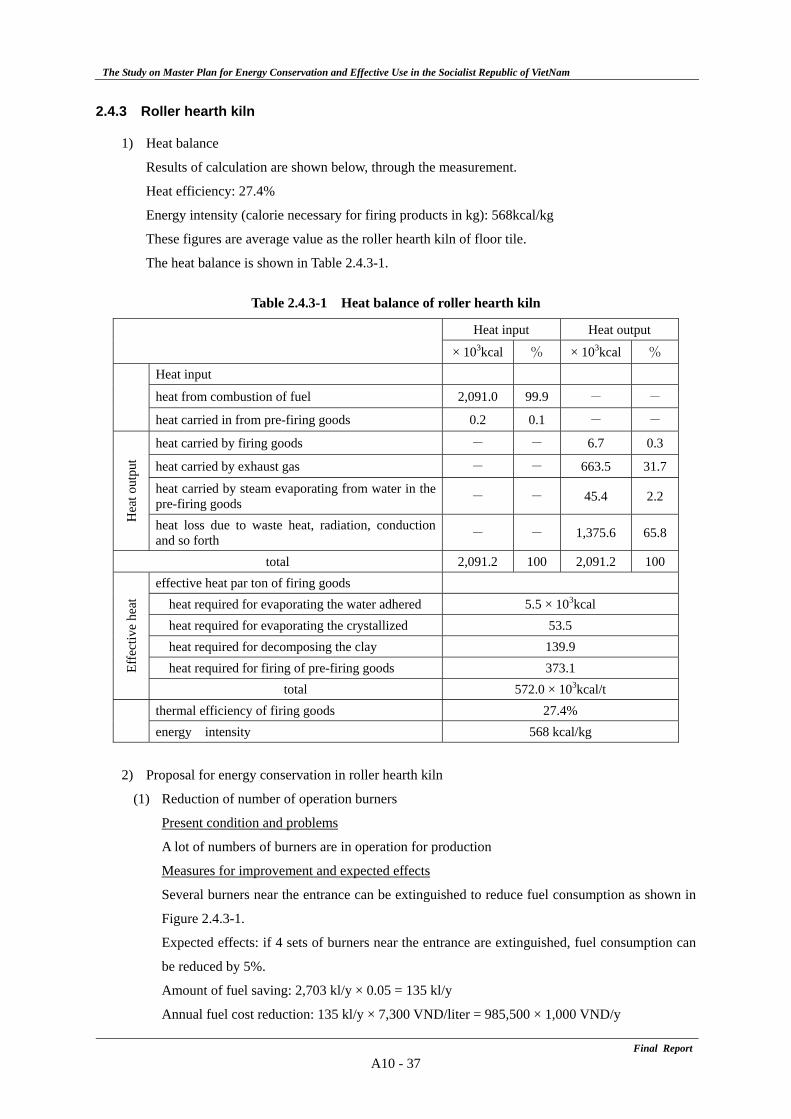
The Study on Master Plan for Energy Conservation and Effective Use in the Socialist Republic of VietNam
Final ReportA10 - 37
2.4.3 Roller hearth kiln
1) Heat balance
Results of calculation are shown below, through the measurement.
Heat efficiency: 27.4%
Energy intensity (calorie necessary for firing products in kg): 568kcal/kg
These figures are average value as the roller hearth kiln of floor tile.
The heat balance is shown in Table 2.4.3-1.
Table 2.4.3-1 Heat balance of roller hearth kiln
Heat input Heat output
× 103kcal % × 103kcal %
Heat input
heat from combustion of fuel 2,091.0 99.9 - -
heat carried in from pre-firing goods 0.2 0.1 - -
heat carried by firing goods - - 6.7 0.3
heat carried by exhaust gas - - 663.5 31.7
heat carried by steam evaporating from water in the pre-firing goods - - 45.4 2.2
Hea
t out
put
heat loss due to waste heat, radiation, conduction and so forth - - 1,375.6 65.8
total 2,091.2 100 2,091.2 100 effective heat par ton of firing goods heat required for evaporating the water adhered 5.5 × 10³kcal heat required for evaporating the crystallized 53.5 heat required for decomposing the clay 139.9 heat required for firing of pre-firing goods 373.1 Ef
fect
ive
heat
total 572.0 × 10³kcal/t thermal efficiency of firing goods 27.4%
energy intensity 568 kcal/kg
2) Proposal for energy conservation in roller hearth kiln
(1) Reduction of number of operation burners
Present condition and problems
A lot of numbers of burners are in operation for production
Measures for improvement and expected effects
Several burners near the entrance can be extinguished to reduce fuel consumption as shown in
Figure 2.4.3-1.
Expected effects: if 4 sets of burners near the entrance are extinguished, fuel consumption can
be reduced by 5%.
Amount of fuel saving: 2,703 kl/y × 0.05 = 135 kl/y
Annual fuel cost reduction: 135 kl/y × 7,300 VND/liter = 985,500 × 1,000 VND/y
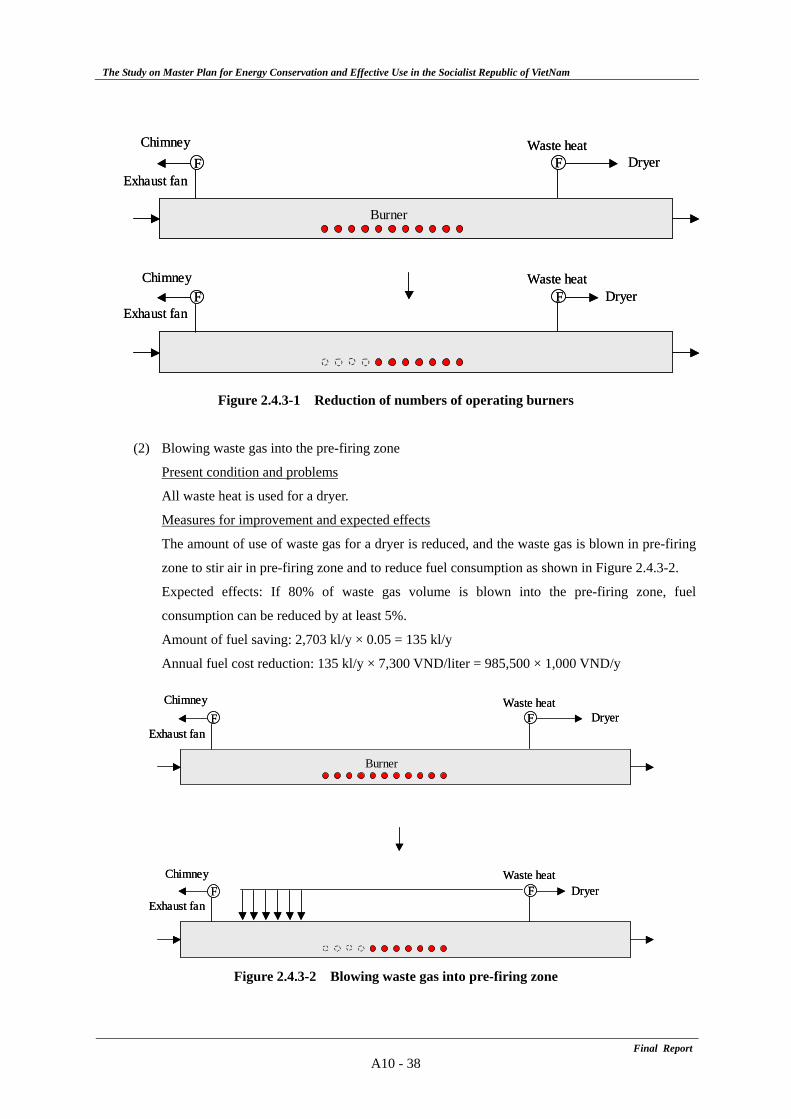
The Study on Master Plan for Energy Conservation and Effective Use in the Socialist Republic of VietNam
Final ReportA10 - 38
Figure 2.4.3-1 Reduction of numbers of operating burners
(2) Blowing waste gas into the pre-firing zone
Present condition and problems
All waste heat is used for a dryer.
Measures for improvement and expected effects
The amount of use of waste gas for a dryer is reduced, and the waste gas is blown in pre-firing
zone to stir air in pre-firing zone and to reduce fuel consumption as shown in Figure 2.4.3-2.
Expected effects: If 80% of waste gas volume is blown into the pre-firing zone, fuel
consumption can be reduced by at least 5%.
Amount of fuel saving: 2,703 kl/y × 0.05 = 135 kl/y
Annual fuel cost reduction: 135 kl/y × 7,300 VND/liter = 985,500 × 1,000 VND/y
Figure 2.4.3-2 Blowing waste gas into pre-firing zone
FFChimney
Exhaust fan
Waste heatDryer
FF DryerWaste heatChimney
Exhaust fan
Burner
FFChimney
Exhaust fan
Waste heatDryer
FF DryerWaste heatChimney
Exhaust fan
Burner
FFChimney
Exhaust fan
Waste heatDryer
FF DryerWaste heatChimney
Exhaust fan
Burner
FFChimney
Exhaust fan
Waste heatDryer
FF DryerWaste heatChimney
Exhaust fan
Burner
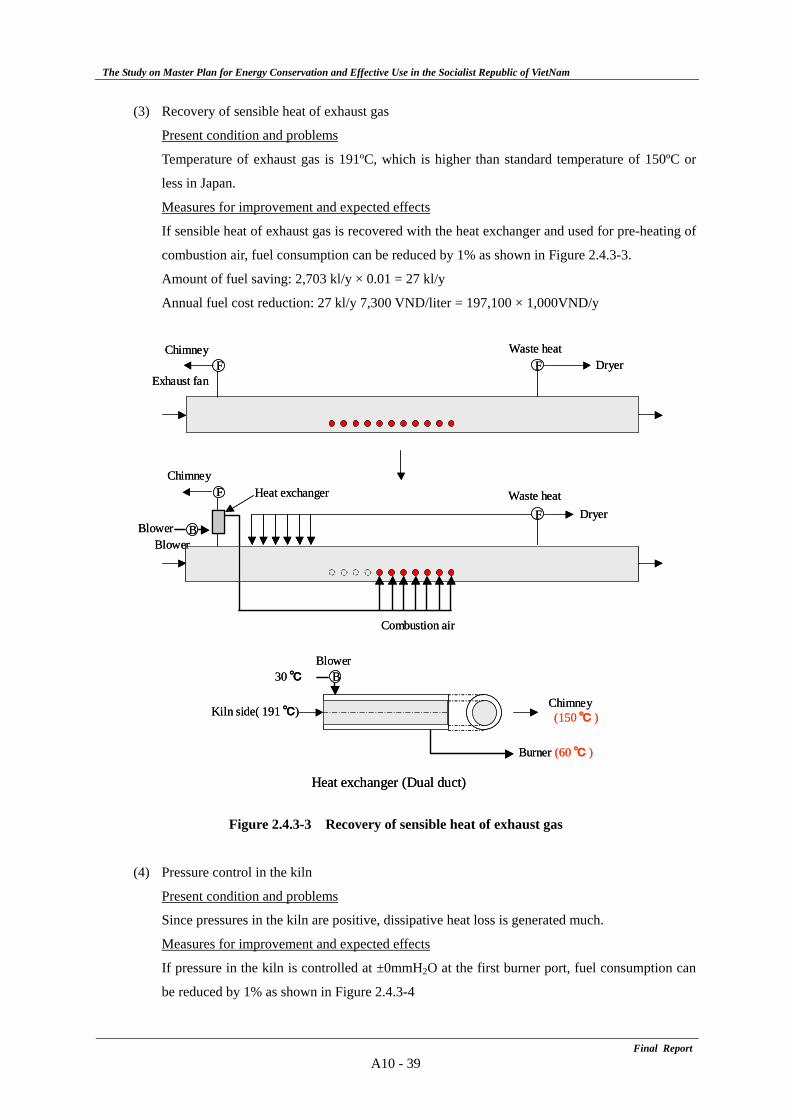
The Study on Master Plan for Energy Conservation and Effective Use in the Socialist Republic of VietNam
Final ReportA10 - 39
(3) Recovery of sensible heat of exhaust gas
Present condition and problems
Temperature of exhaust gas is 191ºC, which is higher than standard temperature of 150ºC or
less in Japan.
Measures for improvement and expected effects
If sensible heat of exhaust gas is recovered with the heat exchanger and used for pre-heating of
combustion air, fuel consumption can be reduced by 1% as shown in Figure 2.4.3-3.
Amount of fuel saving: 2,703 kl/y × 0.01 = 27 kl/y
Annual fuel cost reduction: 27 kl/y 7,300 VND/liter = 197,100 × 1,000VND/y
Figure 2.4.3-3 Recovery of sensible heat of exhaust gas
(4) Pressure control in the kiln
Present condition and problems
Since pressures in the kiln are positive, dissipative heat loss is generated much.
Measures for improvement and expected effects
If pressure in the kiln is controlled at ±0mmH2O at the first burner port, fuel consumption can
be reduced by 1% as shown in Figure 2.4.3-4
FF
F
F
B
Kiln side( 191 ℃)
B
Chimney (150 ℃ )
Burner (60 ℃ )
Heat exchanger (Dual duct)
30 ℃
Combustion air
Chimney
Chimney
Exhaust fan
Blower
Waste heat
Waste heatDryer
Dryer
Blower
Blower
Heat exchanger
FF
F
F
B
Kiln side( 191 ℃)
B
Chimney (150 ℃ )
Burner (60 ℃ )
Heat exchanger (Dual duct)
30 ℃
Combustion air
Chimney
Chimney
Exhaust fan
Blower
Waste heat
Waste heatDryer
Dryer
Blower
Blower
Heat exchanger
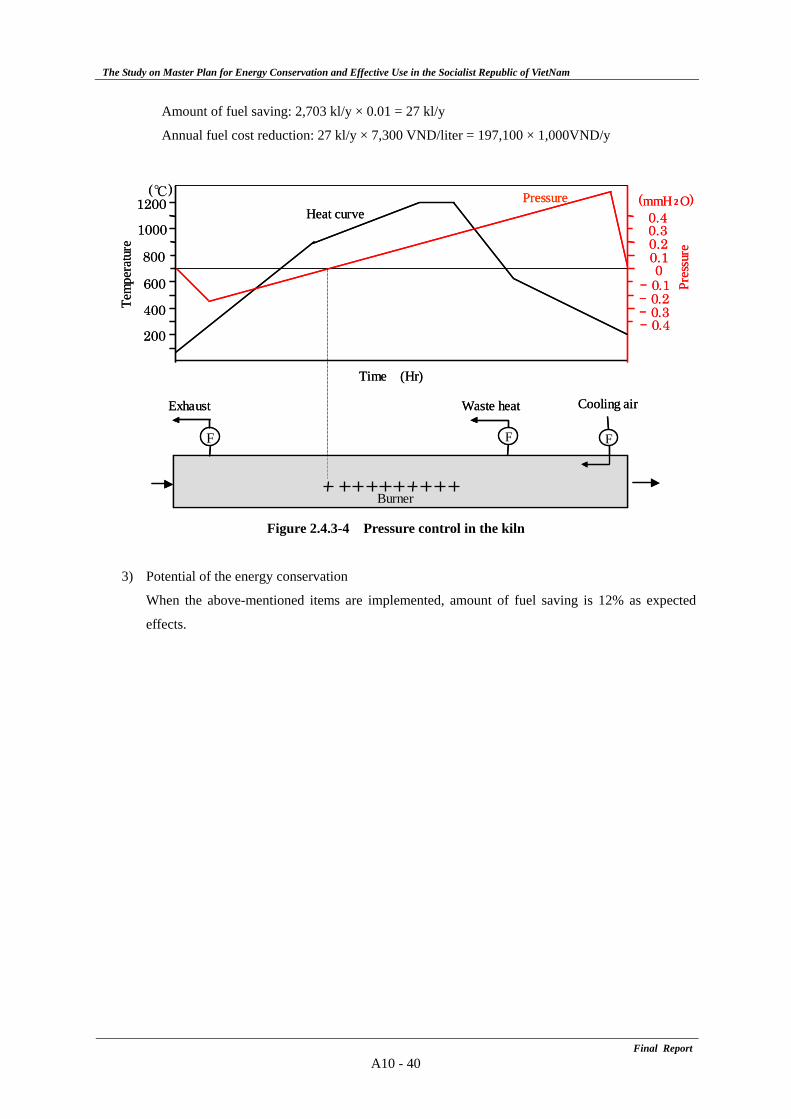
The Study on Master Plan for Energy Conservation and Effective Use in the Socialist Republic of VietNam
Final ReportA10 - 40
Amount of fuel saving: 2,703 kl/y × 0.01 = 27 kl/y
Annual fuel cost reduction: 27 kl/y × 7,300 VND/liter = 197,100 × 1,000VND/y
Figure 2.4.3-4 Pressure control in the kiln
3) Potential of the energy conservation
When the above-mentioned items are implemented, amount of fuel saving is 12% as expected
effects.
F F F
Exhaust Waste heat Cooling air
200
600
800
1000
1200( ℃)
Time (Hr)
- 0.4- 0.3- 0.2- 0.1
00.10.20.30.4
Pres
sure
(mmH 2 O)
400Tem
pera
ture
Burner
PressureHeat curve
F F F
Exhaust Waste heat Cooling air
200
600
800
1000
1200( ℃)
Time (Hr)
- 0.4- 0.3- 0.2- 0.1
00.10.20.30.4
Pres
sure
(mmH 2 O)
400Tem
pera
ture
Burner
PressureHeat curve
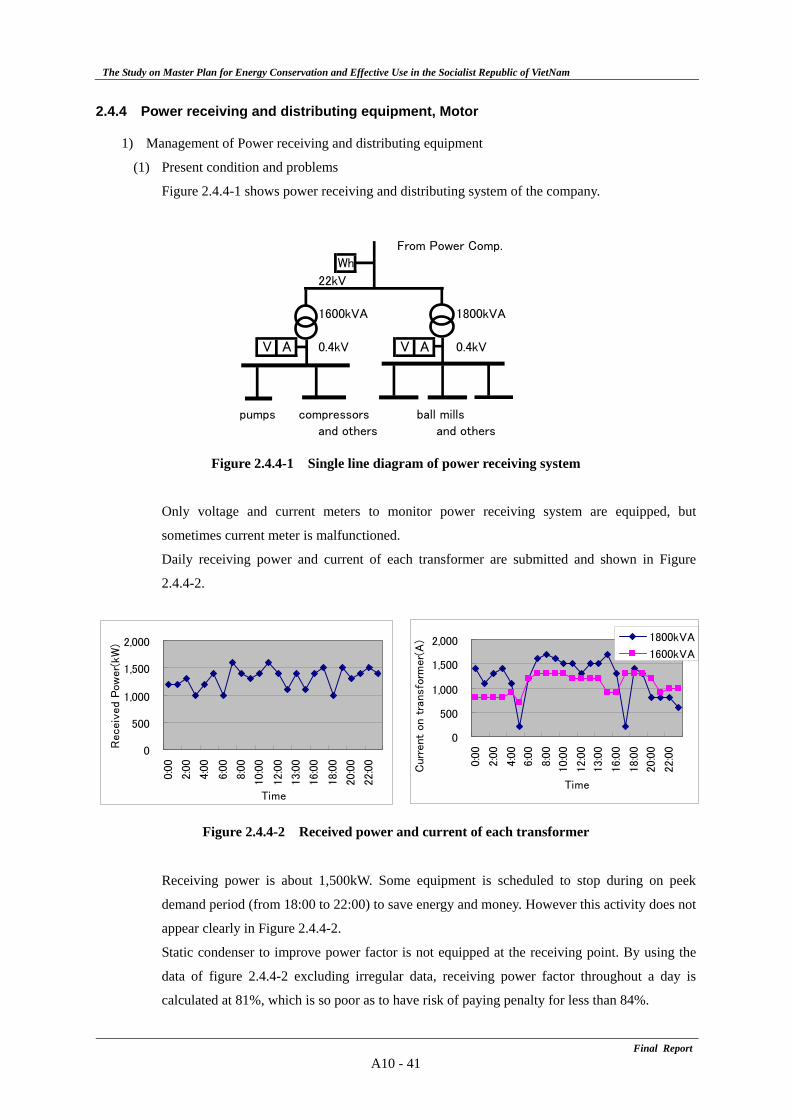
The Study on Master Plan for Energy Conservation and Effective Use in the Socialist Republic of VietNam
Final ReportA10 - 41
2.4.4 Power receiving and distributing equipment, Motor
1) Management of Power receiving and distributing equipment
(1) Present condition and problems
Figure 2.4.4-1 shows power receiving and distributing system of the company.
Figure 2.4.4-1 Single line diagram of power receiving system
Only voltage and current meters to monitor power receiving system are equipped, but
sometimes current meter is malfunctioned.
Daily receiving power and current of each transformer are submitted and shown in Figure
2.4.4-2.
Figure 2.4.4-2 Received power and current of each transformer
Receiving power is about 1,500kW. Some equipment is scheduled to stop during on peek
demand period (from 18:00 to 22:00) to save energy and money. However this activity does not
appear clearly in Figure 2.4.4-2.
Static condenser to improve power factor is not equipped at the receiving point. By using the
data of figure 2.4.4-2 excluding irregular data, receiving power factor throughout a day is
calculated at 81%, which is so poor as to have risk of paying penalty for less than 84%.
From Power Comp.
Wh
22kV
1600kVA 1800kVA
V A 0.4kV V A 0.4kV
pumps compressors ball millsand others and others
0
500
1,000
1,500
2,000
0:0
0
2:0
0
4:0
0
6:0
0
8:0
0
10:0
0
12:0
0
13:0
0
16:0
0
18:0
0
20:0
0
22:0
0
Time
Receiv
ed
Pow
er(
kW
)
0
500
1,000
1,500
2,000
0:0
0
2:0
0
4:0
0
6:0
0
8:0
0
10:0
0
12:0
0
13:0
0
16:0
0
18:0
0
20:0
0
22:0
0
Time
Curr
ent
on t
ransfo
rmer(
A) 1800kVA
1600kVA
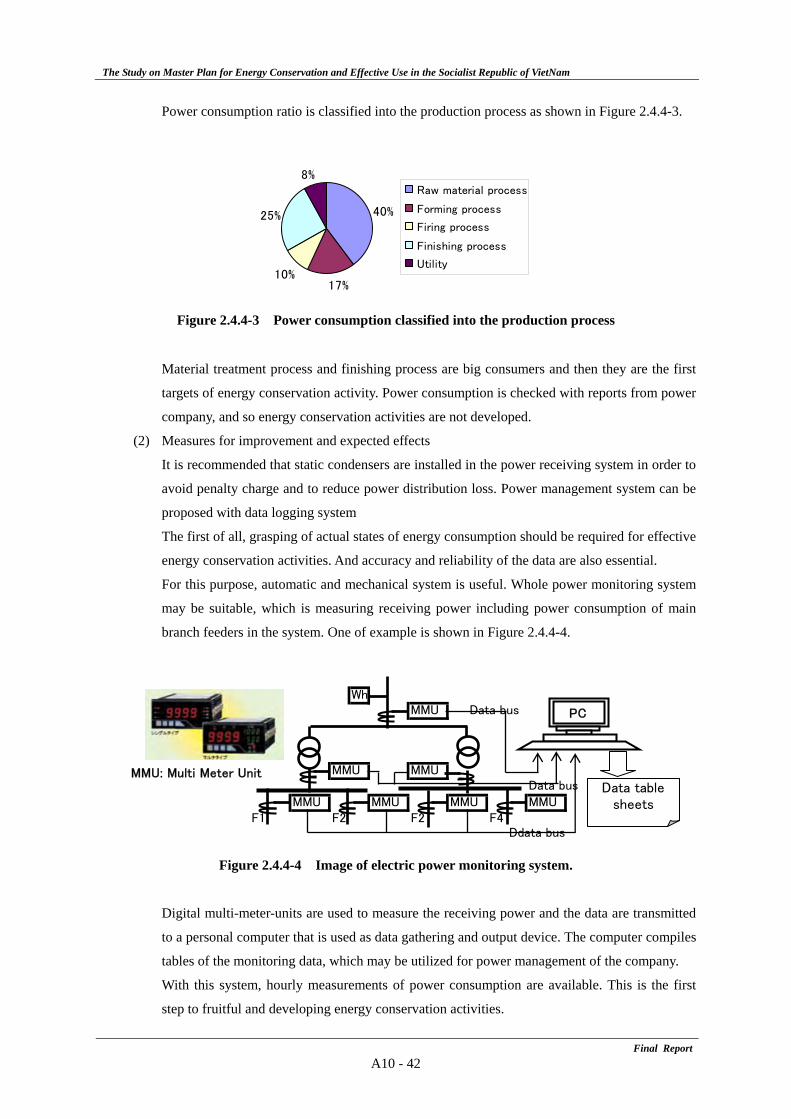
The Study on Master Plan for Energy Conservation and Effective Use in the Socialist Republic of VietNam
Final ReportA10 - 42
Power consumption ratio is classified into the production process as shown in Figure 2.4.4-3.
Figure 2.4.4-3 Power consumption classified into the production process
Material treatment process and finishing process are big consumers and then they are the first
targets of energy conservation activity. Power consumption is checked with reports from power
company, and so energy conservation activities are not developed.
(2) Measures for improvement and expected effects
It is recommended that static condensers are installed in the power receiving system in order to
avoid penalty charge and to reduce power distribution loss. Power management system can be
proposed with data logging system
The first of all, grasping of actual states of energy consumption should be required for effective
energy conservation activities. And accuracy and reliability of the data are also essential.
For this purpose, automatic and mechanical system is useful. Whole power monitoring system
may be suitable, which is measuring receiving power including power consumption of main
branch feeders in the system. One of example is shown in Figure 2.4.4-4.
WhMMU Data bus
MMU MMUData bus
MMU MMU MMU MMUF1 F2 F2 F4
Ddata bus
PC
Data tablesheets
MMU: Multi Meter Unit
Figure 2.4.4-4 Image of electric power monitoring system.
Digital multi-meter-units are used to measure the receiving power and the data are transmitted
to a personal computer that is used as data gathering and output device. The computer compiles
tables of the monitoring data, which may be utilized for power management of the company.
With this system, hourly measurements of power consumption are available. This is the first
step to fruitful and developing energy conservation activities.
40%
17%10%
25%
8%Raw material process
Forming process
Firing process
Finishing process
Utility
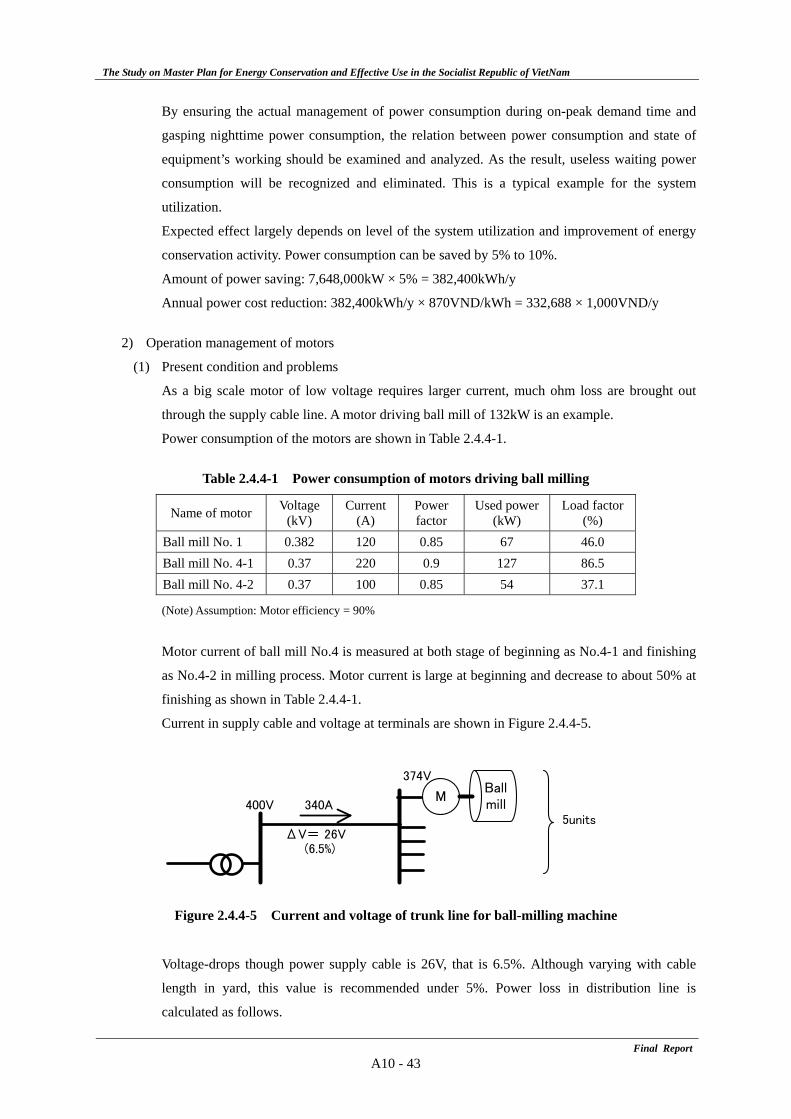
The Study on Master Plan for Energy Conservation and Effective Use in the Socialist Republic of VietNam
Final ReportA10 - 43
By ensuring the actual management of power consumption during on-peak demand time and
gasping nighttime power consumption, the relation between power consumption and state of
equipment’s working should be examined and analyzed. As the result, useless waiting power
consumption will be recognized and eliminated. This is a typical example for the system
utilization.
Expected effect largely depends on level of the system utilization and improvement of energy
conservation activity. Power consumption can be saved by 5% to 10%.
Amount of power saving: 7,648,000kW × 5% = 382,400kWh/y
Annual power cost reduction: 382,400kWh/y × 870VND/kWh = 332,688 × 1,000VND/y
2) Operation management of motors
(1) Present condition and problems
As a big scale motor of low voltage requires larger current, much ohm loss are brought out
through the supply cable line. A motor driving ball mill of 132kW is an example.
Power consumption of the motors are shown in Table 2.4.4-1.
Table 2.4.4-1 Power consumption of motors driving ball milling
Name of motor Voltage (kV)
Current (A)
Power factor
Used power(kW)
Load factor (%)
Ball mill No. 1 0.382 120 0.85 67 46.0 Ball mill No. 4-1 0.37 220 0.9 127 86.5 Ball mill No. 4-2 0.37 100 0.85 54 37.1
(Note) Assumption: Motor efficiency = 90%
Motor current of ball mill No.4 is measured at both stage of beginning as No.4-1 and finishing
as No.4-2 in milling process. Motor current is large at beginning and decrease to about 50% at
finishing as shown in Table 2.4.4-1.
Current in supply cable and voltage at terminals are shown in Figure 2.4.4-5.
Figure 2.4.4-5 Current and voltage of trunk line for ball-milling machine
Voltage-drops though power supply cable is 26V, that is 6.5%. Although varying with cable
length in yard, this value is recommended under 5%. Power loss in distribution line is
calculated as follows.
374V
400V 340A5units
ΔV= 26V(6.5%)
Ballmill
M
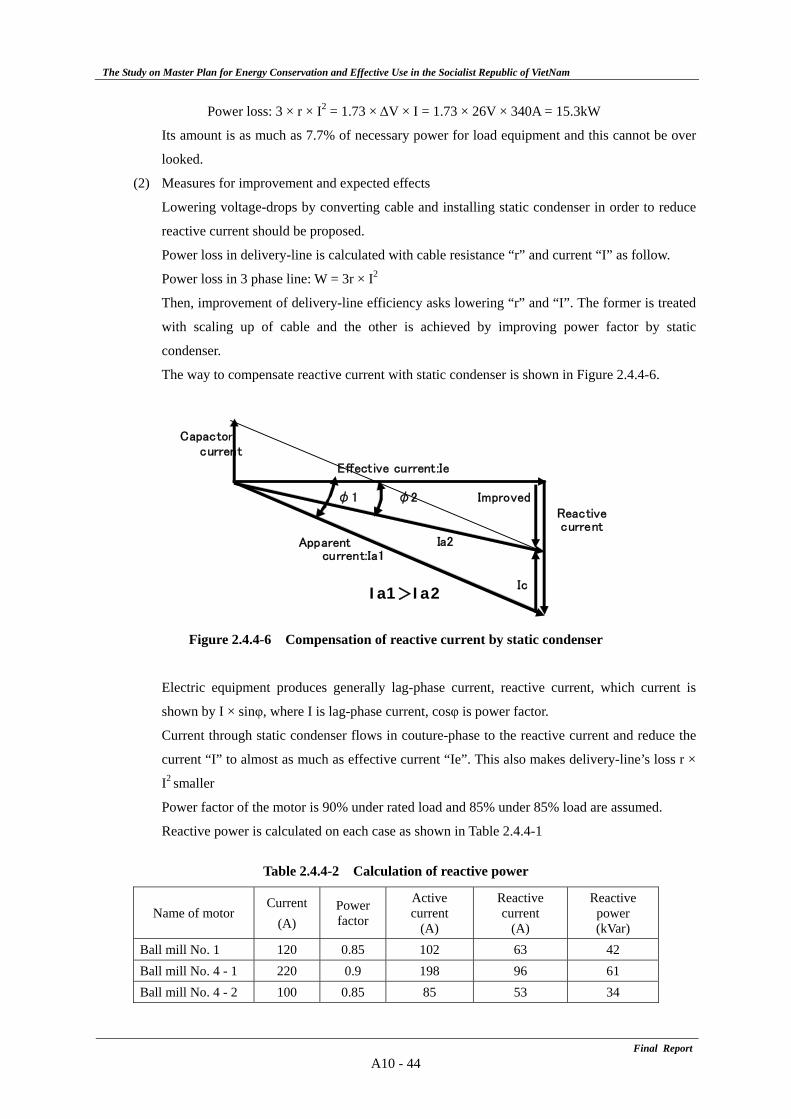
The Study on Master Plan for Energy Conservation and Effective Use in the Socialist Republic of VietNam
Final ReportA10 - 44
Power loss: 3 × r × I2 = 1.73 × ΔV × I = 1.73 × 26V × 340A = 15.3kW
Its amount is as much as 7.7% of necessary power for load equipment and this cannot be over
looked.
(2) Measures for improvement and expected effects
Lowering voltage-drops by converting cable and installing static condenser in order to reduce
reactive current should be proposed.
Power loss in delivery-line is calculated with cable resistance “r” and current “I” as follow.
Power loss in 3 phase line: W = 3r × I2
Then, improvement of delivery-line efficiency asks lowering “r” and “I”. The former is treated
with scaling up of cable and the other is achieved by improving power factor by static
condenser.
The way to compensate reactive current with static condenser is shown in Figure 2.4.4-6.
Capactorcurrent
Effective current:Ie
φ1 φ2 ImprovedReactivecurrent
Apparent Ia2 current:Ia1
IcIa1>Ia2
Figure 2.4.4-6 Compensation of reactive current by static condenser
Electric equipment produces generally lag-phase current, reactive current, which current is
shown by I × sinφ, where I is lag-phase current, cosφ is power factor.
Current through static condenser flows in couture-phase to the reactive current and reduce the
current “I” to almost as much as effective current “Ie”. This also makes delivery-line’s loss r ×
I2 smaller
Power factor of the motor is 90% under rated load and 85% under 85% load are assumed.
Reactive power is calculated on each case as shown in Table 2.4.4-1
Table 2.4.4-2 Calculation of reactive power
Name of motor Current
(A) Power factor
Active current
(A)
Reactive current
(A)
Reactive power (kVar)
Ball mill No. 1 120 0.85 102 63 42 Ball mill No. 4 - 1 220 0.9 198 96 61 Ball mill No. 4 - 2 100 0.85 85 53 34
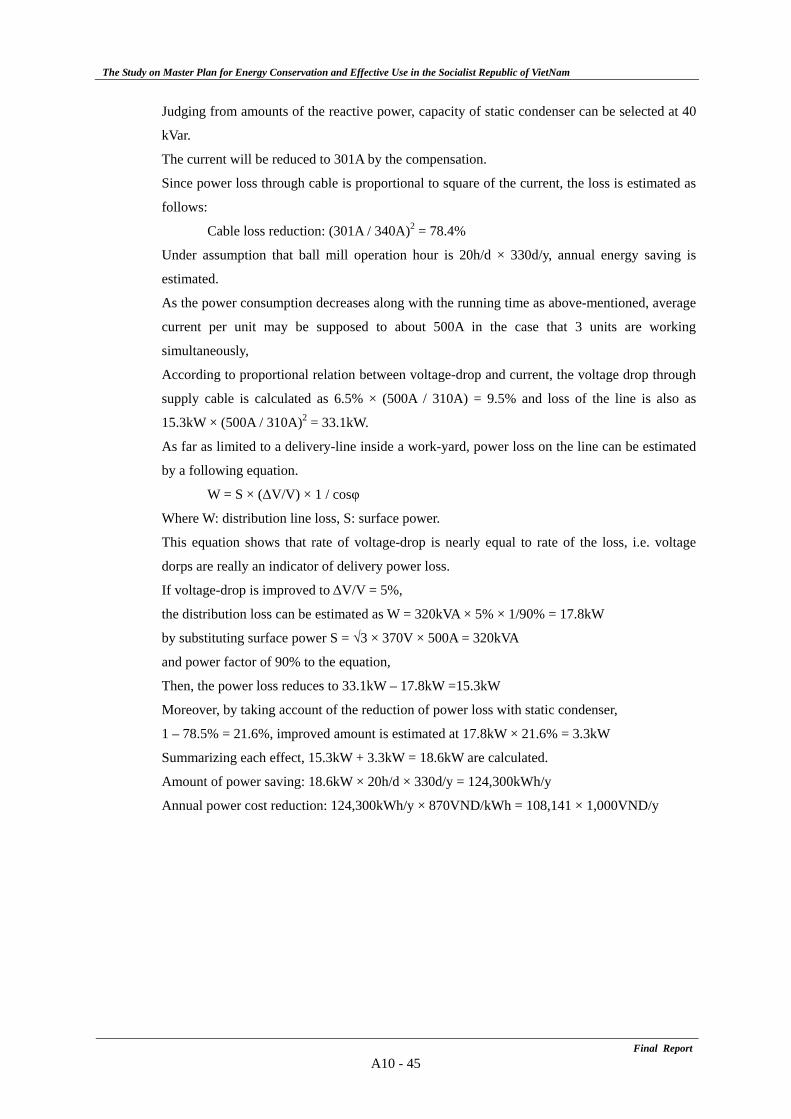
The Study on Master Plan for Energy Conservation and Effective Use in the Socialist Republic of VietNam
Final ReportA10 - 45
Judging from amounts of the reactive power, capacity of static condenser can be selected at 40
kVar.
The current will be reduced to 301A by the compensation.
Since power loss through cable is proportional to square of the current, the loss is estimated as
follows:
Cable loss reduction: (301A / 340A)2 = 78.4%
Under assumption that ball mill operation hour is 20h/d × 330d/y, annual energy saving is
estimated.
As the power consumption decreases along with the running time as above-mentioned, average
current per unit may be supposed to about 500A in the case that 3 units are working
simultaneously,
According to proportional relation between voltage-drop and current, the voltage drop through
supply cable is calculated as 6.5% × (500A / 310A) = 9.5% and loss of the line is also as
15.3kW × (500A / 310A)2 = 33.1kW.
As far as limited to a delivery-line inside a work-yard, power loss on the line can be estimated
by a following equation.
W = S × (ΔV/V) × 1 / cosφ
Where W: distribution line loss, S: surface power.
This equation shows that rate of voltage-drop is nearly equal to rate of the loss, i.e. voltage
dorps are really an indicator of delivery power loss.
If voltage-drop is improved to ΔV/V = 5%,
the distribution loss can be estimated as W = 320kVA × 5% × 1/90% = 17.8kW
by substituting surface power S = √3 × 370V × 500A = 320kVA
and power factor of 90% to the equation,
Then, the power loss reduces to 33.1kW – 17.8kW =15.3kW
Moreover, by taking account of the reduction of power loss with static condenser,
1 – 78.5% = 21.6%, improved amount is estimated at 17.8kW × 21.6% = 3.3kW
Summarizing each effect, 15.3kW + 3.3kW = 18.6kW are calculated.
Amount of power saving: 18.6kW × 20h/d × 330d/y = 124,300kWh/y
Annual power cost reduction: 124,300kWh/y × 870VND/kWh = 108,141 × 1,000VND/y
The Study on Master Plan for Energy Conservation and Effective Use in the Socialist Republic of VietNam
Final ReportA10 - 46
3. Cement Factory C
3.1 Introduction
1) Factory name: Cement factory C
2) Location: Da Nang City
3) Description of business
(1) Type of industry: Cement manufacturing industry
(2) Main product: Portland mixture cement PCB 30 (28-day strength: 30 N/mm2)
(3) Production capacity: Cement 140,000 ton/year
(4) Annual production: 110,000 ton/year in 2007
(5) Number of employees: 305 persons
4) Person in charge for energy on-site survey: Vice General Manager
5) Outline of the factory
This factory built a vertical type cement shaft kiln imported from China in 1992, and it started
production in 1995. In 2003, the company was reorganized from a state-own enterprise to a
private company.
Its production equipment consists of one vertical type cement shaft kiln with production capacity
of 300 ton/day, one ball mill for raw material crushing, and two ball mills for cement finishing.
The main material (limestone) is conveyed from a mine owned by the company, which is 50 km
away from the factory. In accordance with the government policy announced in September 2008,
the company has a plan to replace the shaft kiln by a rotary kiln with a production capacity of
1,000 ton/day. The present production equipment can manufacture Portland mixture cement
PCB30, but it can not manufacture high-strength Portland cement PC50 (28-day strength is 50
N/mm2).
3.2 Outline of energy on-site survey
1) Survey team member
JICA Study Team: Mr. Norio Fukushima, Mr. Wataru Ishikawa, Mr. Hisashi Amano
Institute of Energy: Mr. Hung, Mr. Song, Mr. Hau
ECC Da Nang: Mr. Van Ban, Mr. Vy
2) Survey period: October 6 to 8, 2008
3) Surveyed equipment: cement shaft kiln, rotary drier for raw material, ball mill for raw material
and finishing, fan for cement shaft kiln, exhaust blower for cement shaft kiln, and power receiving
equipment
4) Request of the factory
The factory requested study of power consumption to JICA Study Team, and especially requested
the measures for power saving of exhaust fan motor (90kW) of cement kiln
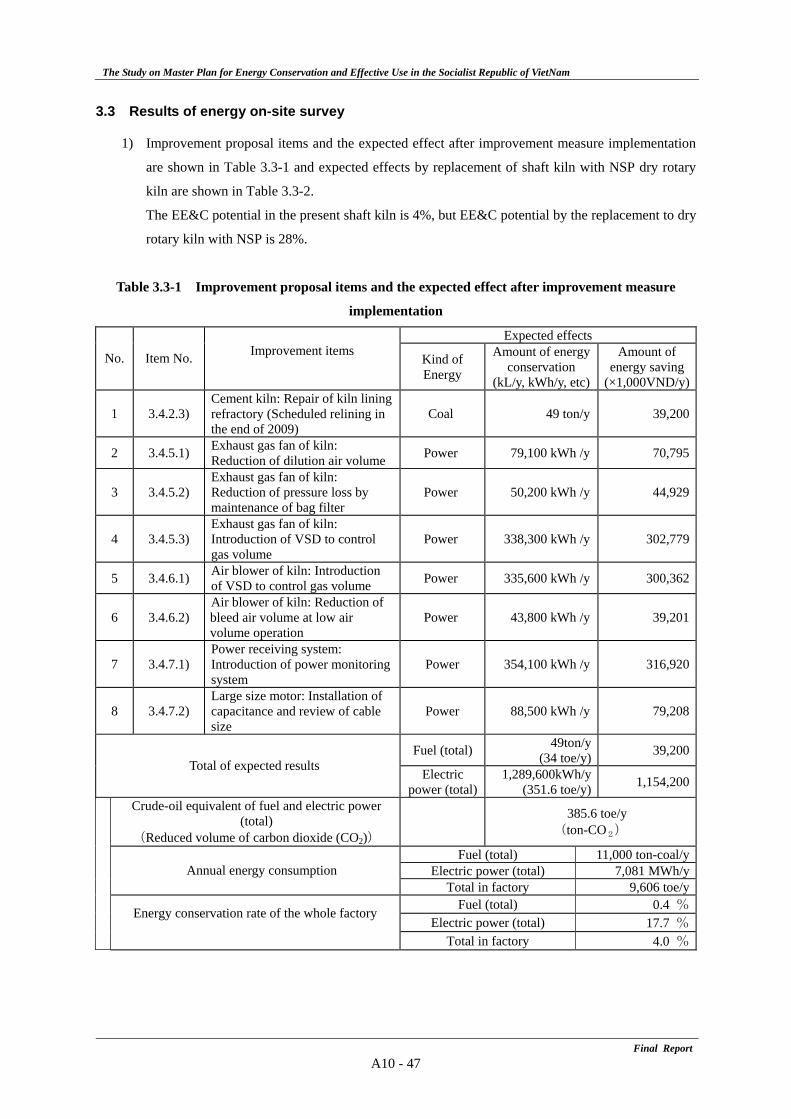
The Study on Master Plan for Energy Conservation and Effective Use in the Socialist Republic of VietNam
Final ReportA10 - 47
3.3 Results of energy on-site survey
1) Improvement proposal items and the expected effect after improvement measure implementation
are shown in Table 3.3-1 and expected effects by replacement of shaft kiln with NSP dry rotary
kiln are shown in Table 3.3-2.
The EE&C potential in the present shaft kiln is 4%, but EE&C potential by the replacement to dry
rotary kiln with NSP is 28%.
Table 3.3-1 Improvement proposal items and the expected effect after improvement measure
implementation
Expected effects
No. Item No. Improvement items Kind of
Energy
Amount of energy conservation
(kL/y, kWh/y, etc)
Amount of energy saving
(×1,000VND/y)
1 3.4.2.3) Cement kiln: Repair of kiln lining refractory (Scheduled relining in the end of 2009)
Coal 49 ton/y 39,200
2 3.4.5.1) Exhaust gas fan of kiln: Reduction of dilution air volume Power 79,100 kWh /y 70,795
3 3.4.5.2) Exhaust gas fan of kiln: Reduction of pressure loss by maintenance of bag filter
Power 50,200 kWh /y 44,929
4 3.4.5.3) Exhaust gas fan of kiln: Introduction of VSD to control gas volume
Power 338,300 kWh /y 302,779
5 3.4.6.1) Air blower of kiln: Introduction of VSD to control gas volume Power 335,600 kWh /y 300,362
6 3.4.6.2) Air blower of kiln: Reduction of bleed air volume at low air volume operation
Power 43,800 kWh /y 39,201
7 3.4.7.1) Power receiving system: Introduction of power monitoring system
Power 354,100 kWh /y 316,920
8 3.4.7.2) Large size motor: Installation of capacitance and review of cable size
Power 88,500 kWh /y 79,208
Fuel (total) 49ton/y (34 toe/y) 39,200
Total of expected results Electric power (total)
1,289,600kWh/y (351.6 toe/y) 1,154,200
Crude-oil equivalent of fuel and electric power (total)
(Reduced volume of carbon dioxide (CO2)) 385.6 toe/y
(ton-CO2)
Fuel (total) 11,000 ton-coal/yElectric power (total) 7,081 MWh/yAnnual energy consumption
Total in factory 9,606 toe/y
Fuel (total) 0.4 %
Energy conservation rate of the whole factory Electric power (total) 17.7 %
Total in factory 4.0 %
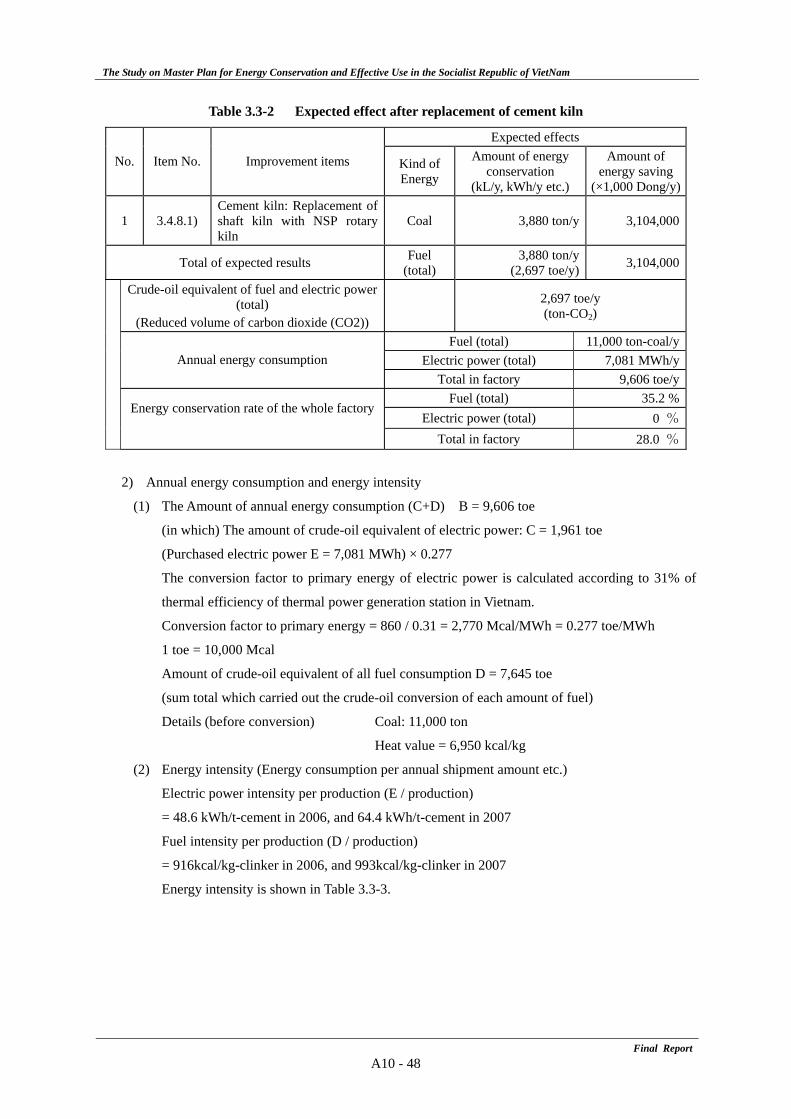
The Study on Master Plan for Energy Conservation and Effective Use in the Socialist Republic of VietNam
Final ReportA10 - 48
Table 3.3-2 Expected effect after replacement of cement kiln
Expected effects
No. Item No. Improvement items Kind of Energy
Amount of energy conservation
(kL/y, kWh/y etc.)
Amount of energy saving
(×1,000 Dong/y)
1 3.4.8.1) Cement kiln: Replacement of shaft kiln with NSP rotary kiln
Coal 3,880 ton/y 3,104,000
Total of expected results Fuel (total)
3,880 ton/y (2,697 toe/y) 3,104,000
Crude-oil equivalent of fuel and electric power (total)
(Reduced volume of carbon dioxide (CO2)) 2,697 toe/y
(ton-CO2)
Fuel (total) 11,000 ton-coal/yElectric power (total) 7,081 MWh/yAnnual energy consumption
Total in factory 9,606 toe/y
Fuel (total) 35.2 %
Energy conservation rate of the whole factoryElectric power (total) 0 %
Total in factory 28.0 %
2) Annual energy consumption and energy intensity
(1) The Amount of annual energy consumption (C+D) B = 9,606 toe
(in which) The amount of crude-oil equivalent of electric power: C = 1,961 toe
(Purchased electric power E = 7,081 MWh) × 0.277
The conversion factor to primary energy of electric power is calculated according to 31% of
thermal efficiency of thermal power generation station in Vietnam.
Conversion factor to primary energy = 860 / 0.31 = 2,770 Mcal/MWh = 0.277 toe/MWh
1 toe = 10,000 Mcal
Amount of crude-oil equivalent of all fuel consumption D = 7,645 toe
(sum total which carried out the crude-oil conversion of each amount of fuel)
Details (before conversion) Coal: 11,000 ton
Heat value = 6,950 kcal/kg
(2) Energy intensity (Energy consumption per annual shipment amount etc.)
Electric power intensity per production (E / production)
= 48.6 kWh/t-cement in 2006, and 64.4 kWh/t-cement in 2007
Fuel intensity per production (D / production)
= 916kcal/kg-clinker in 2006, and 993kcal/kg-clinker in 2007
Energy intensity is shown in Table 3.3-3.
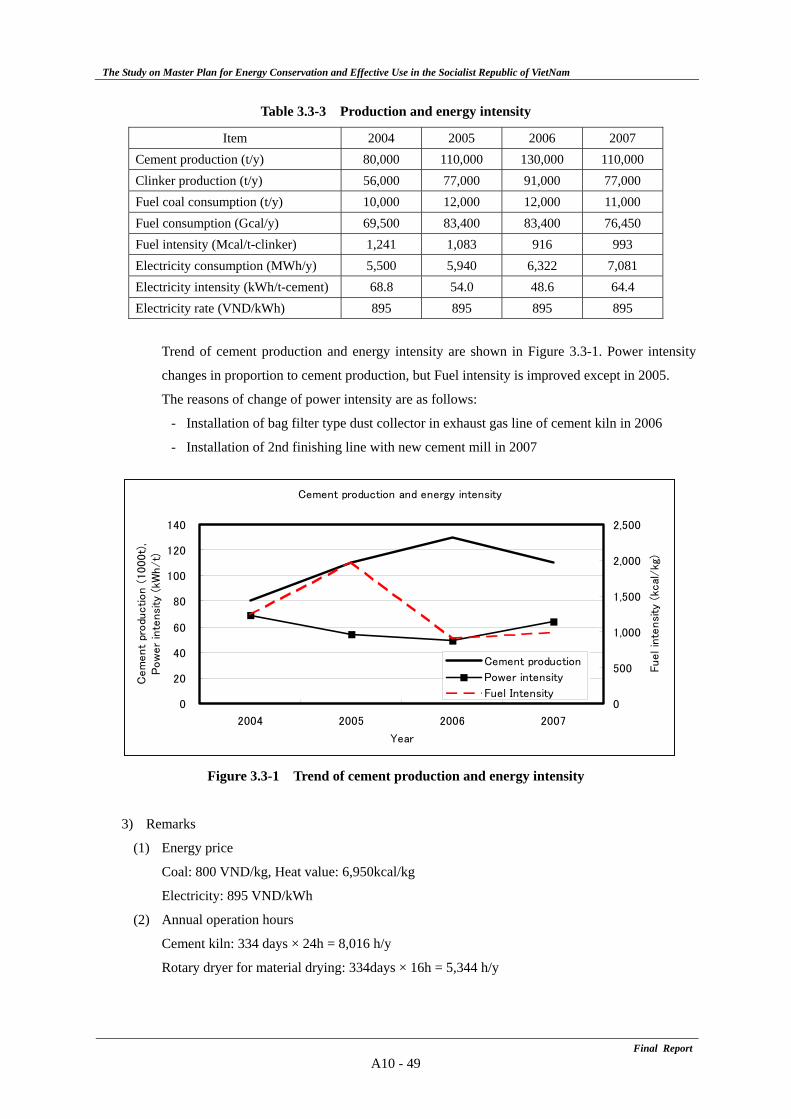
The Study on Master Plan for Energy Conservation and Effective Use in the Socialist Republic of VietNam
Final ReportA10 - 49
Table 3.3-3 Production and energy intensity
Item 2004 2005 2006 2007 Cement production (t/y) 80,000 110,000 130,000 110,000 Clinker production (t/y) 56,000 77,000 91,000 77,000 Fuel coal consumption (t/y) 10,000 12,000 12,000 11,000 Fuel consumption (Gcal/y) 69,500 83,400 83,400 76,450 Fuel intensity (Mcal/t-clinker) 1,241 1,083 916 993 Electricity consumption (MWh/y) 5,500 5,940 6,322 7,081 Electricity intensity (kWh/t-cement) 68.8 54.0 48.6 64.4 Electricity rate (VND/kWh) 895 895 895 895
Trend of cement production and energy intensity are shown in Figure 3.3-1. Power intensity
changes in proportion to cement production, but Fuel intensity is improved except in 2005.
The reasons of change of power intensity are as follows:
- Installation of bag filter type dust collector in exhaust gas line of cement kiln in 2006
- Installation of 2nd finishing line with new cement mill in 2007
Figure 3.3-1 Trend of cement production and energy intensity
3) Remarks
(1) Energy price
Coal: 800 VND/kg, Heat value: 6,950kcal/kg
Electricity: 895 VND/kWh
(2) Annual operation hours
Cement kiln: 334 days × 24h = 8,016 h/y
Rotary dryer for material drying: 334days × 16h = 5,344 h/y
Cement production and energy intensity
0
20
40
60
80
100
120
140
2004 2005 2006 2007
Year
Cem
ent
produ
ction (
1000t)
,Pow
er
inte
nsi
ty (
kWh/t)
0
500
1,000
1,500
2,000
2,500
Fuel in
tensi
ty (
kcal
/kg
)Cement production
Power intensity
Fuel Intensity
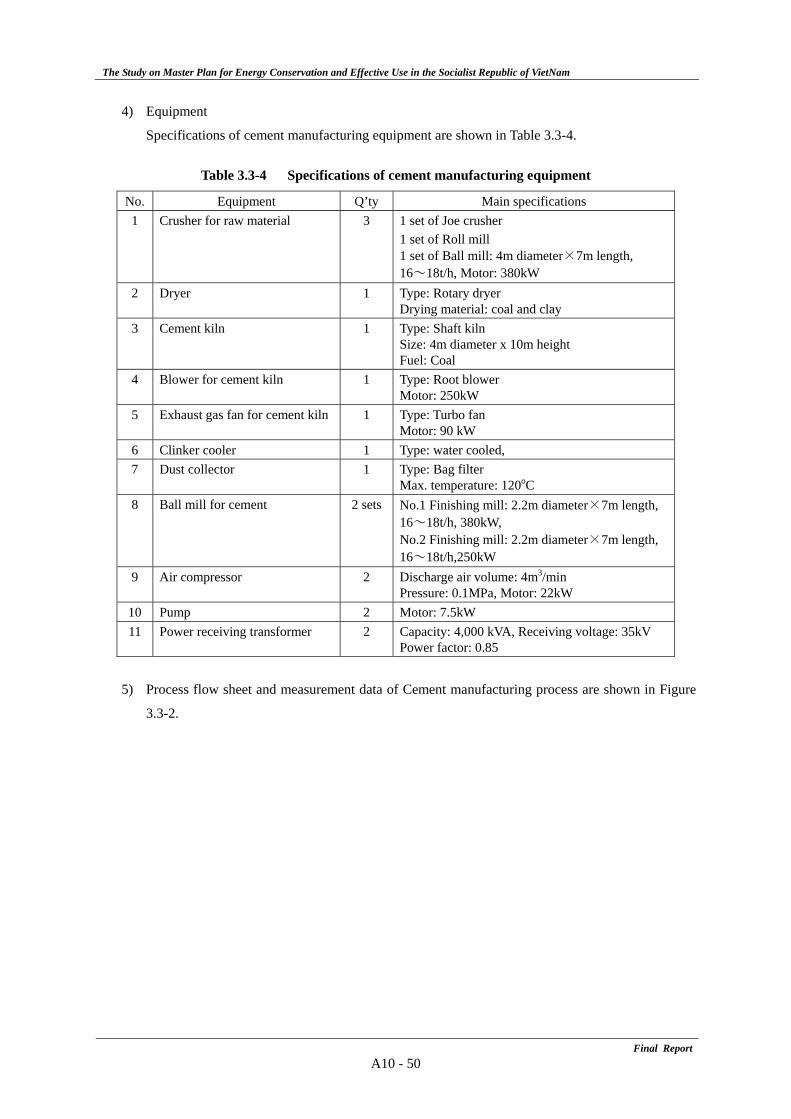
The Study on Master Plan for Energy Conservation and Effective Use in the Socialist Republic of VietNam
Final ReportA10 - 50
4) Equipment
Specifications of cement manufacturing equipment are shown in Table 3.3-4.
Table 3.3-4 Specifications of cement manufacturing equipment
No. Equipment Q’ty Main specifications 1 Crusher for raw material 3 1 set of Joe crusher
1 set of Roll mill 1 set of Ball mill: 4m diameter×7m length, 16~18t/h, Motor: 380kW
2 Dryer 1 Type: Rotary dryer Drying material: coal and clay
3 Cement kiln 1 Type: Shaft kiln Size: 4m diameter x 10m height Fuel: Coal
4 Blower for cement kiln 1 Type: Root blower Motor: 250kW
5 Exhaust gas fan for cement kiln 1 Type: Turbo fan Motor: 90 kW
6 Clinker cooler 1 Type: water cooled, 7 Dust collector 1 Type: Bag filter
Max. temperature: 120oC 8 Ball mill for cement 2 sets No.1 Finishing mill: 2.2m diameter×7m length,
16~18t/h, 380kW, No.2 Finishing mill: 2.2m diameter×7m length, 16~18t/h,250kW
9 Air compressor 2 Discharge air volume: 4m3/min Pressure: 0.1MPa, Motor: 22kW
10 Pump 2 Motor: 7.5kW 11 Power receiving transformer 2 Capacity: 4,000 kVA, Receiving voltage: 35kV
Power factor: 0.85
5) Process flow sheet and measurement data of Cement manufacturing process are shown in Figure
3.3-2.
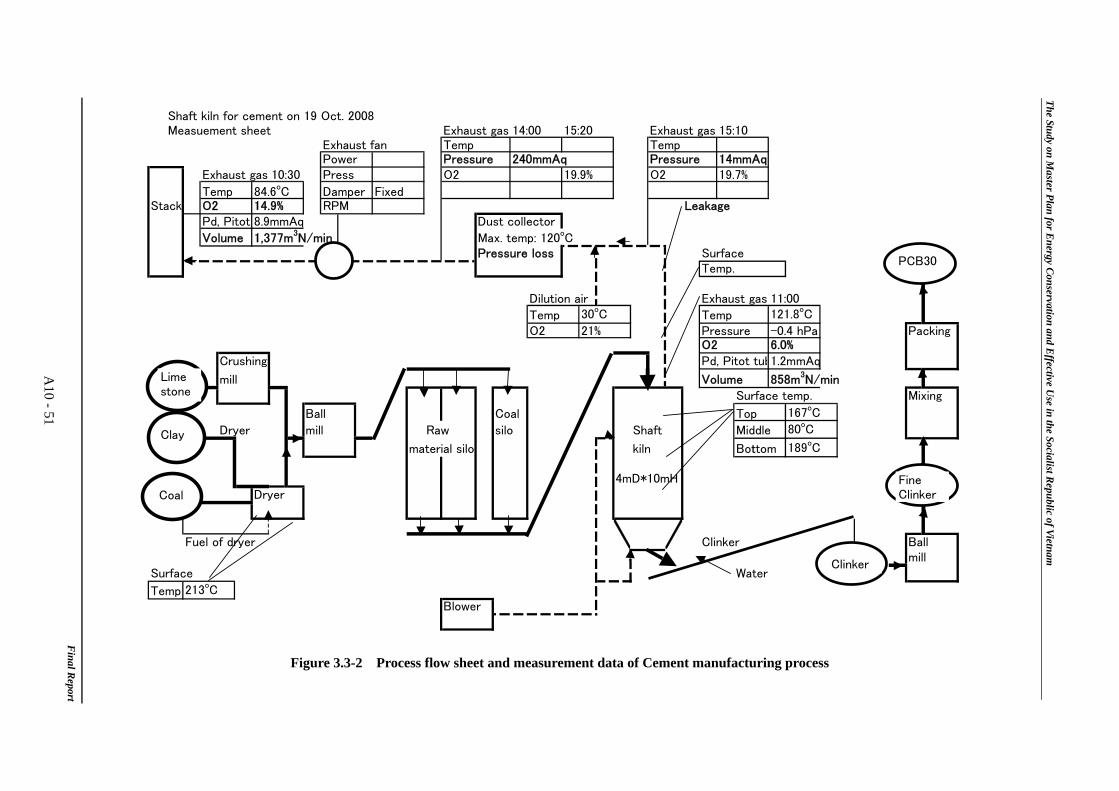
The Study on Master Plan for E
nergy Conservation and E
ffective Use in the Socialist R
epublic of Vietnam
Final R
eport
A10 - 51
Figure 3.3-2 Process flow sheet and measurement data of Cement manufacturing process
Shaft kiln for cement on 19 Oct. 2008Measuement sheet Exhaust gas 14:00 15:20 Exhaust gas 15:10
Exhaust fan Temp TempPower Pressure 240mmAq Pressure 14mmAq
Exhaust gas 10:30 Press O2 O2
Temp 84.6oC Damper FixedStack O2 14.9% RPM Leakage
Pd, Pitot 8.9mmAq Dust collector
Volume 1,377m3N/min Max. temp: 120oCPressure loss Surface
Temp.
Dilution air Exhaust gas 11:00
Temp TempO2 Pressure Packing
O2Crushing Pd, Pitot tub
mill Volume 858m3N/minSurface temp. Mixing
Ball Coal Top
Dryer mill Raw silo Shaft Middle
material silo kiln Bottom
4mD*10mHDryer
Fuel of dryer Clinker Ballmill
Surface Water
Temp.Blower
80oC
189oC
213oC
19.9% 19.7%
167oC
121.8oC
-0.4 hPa6.0%1.2mmAq
30oC
21%
Coal
Clinker
Limestone
Clay
FineClinker
PCB30
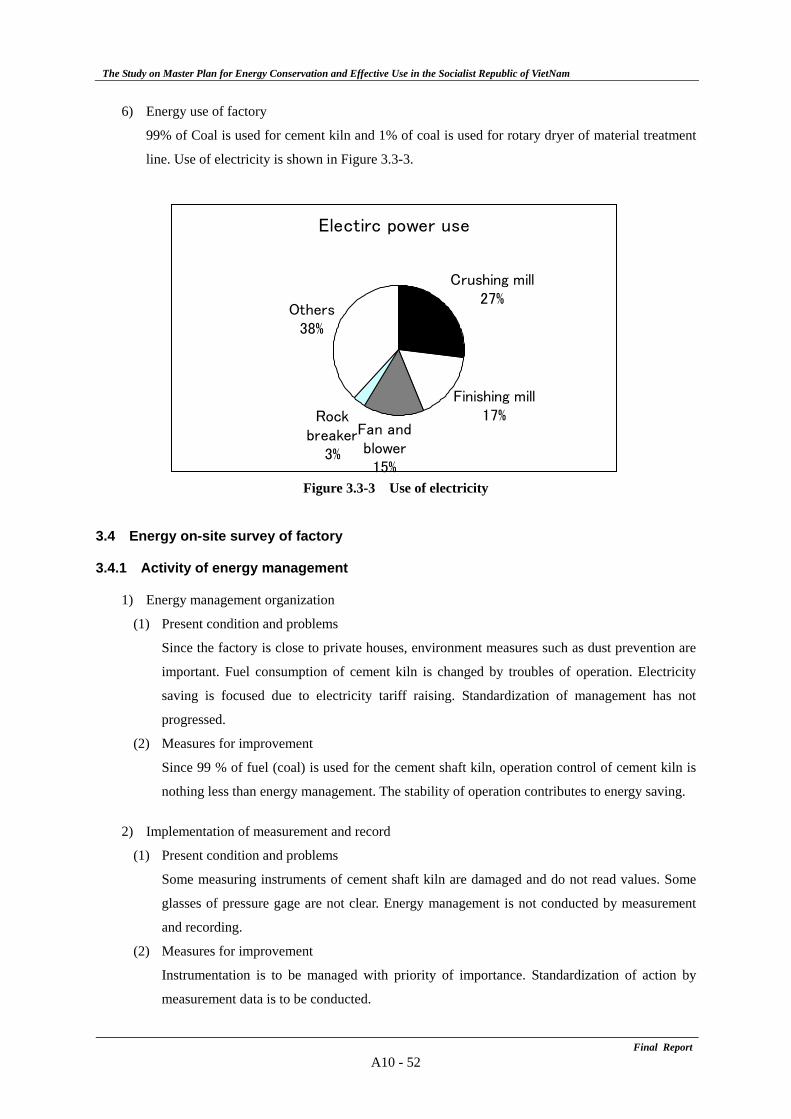
The Study on Master Plan for Energy Conservation and Effective Use in the Socialist Republic of VietNam
Final ReportA10 - 52
6) Energy use of factory
99% of Coal is used for cement kiln and 1% of coal is used for rotary dryer of material treatment
line. Use of electricity is shown in Figure 3.3-3.
Figure 3.3-3 Use of electricity
3.4 Energy on-site survey of factory
3.4.1 Activity of energy management
1) Energy management organization
(1) Present condition and problems
Since the factory is close to private houses, environment measures such as dust prevention are
important. Fuel consumption of cement kiln is changed by troubles of operation. Electricity
saving is focused due to electricity tariff raising. Standardization of management has not
progressed.
(2) Measures for improvement
Since 99 % of fuel (coal) is used for the cement shaft kiln, operation control of cement kiln is
nothing less than energy management. The stability of operation contributes to energy saving.
2) Implementation of measurement and record
(1) Present condition and problems
Some measuring instruments of cement shaft kiln are damaged and do not read values. Some
glasses of pressure gage are not clear. Energy management is not conducted by measurement
and recording.
(2) Measures for improvement
Instrumentation is to be managed with priority of importance. Standardization of action by
measurement data is to be conducted.
Electirc power use
Crushing mill27%
Finishing mill17%
Fan andblower15%
Rockbreaker
3%
Others38%
The Study on Master Plan for Energy Conservation and Effective Use in the Socialist Republic of VietNam
Final ReportA10 - 53
3) Maintenance management of equipment
(1) Present condition and problems
Road in the factory is rough with cement dust, and so walking and transportation are difficult.
Equipment is not well cleaned.
(2) Measures for improvement
Since cement factory is dusty, equipment is dirty. Cleaning of equipment is required for good
maintenance.
4) Energy consumption management
(1) Present condition and problems
Coal consumption of cement kiln is measured at the discharge port of coal stock bin, but
collected data is not shown as graph or tables in operation control room. Receiving power is
recorded periodically, but it is not clear how the data is utilized in electric energy management.
Consumed power is recorded every 10 days, and voltage and current of feeders are recorded
once a day
(2) Measures for improvement
Daily report and record of cement kiln is to be enforced.
Record of receiving power is to be used to power consumption management.
5) Energy intensity management
(1) Present condition and problems
Fuel consumption intensity is calculated monthly at present.
(2) Measures for improvement
Energy intensity is to be calculated once a day at least.
6) PDCA management cycle
(1) Present condition and problems
The PDCA management cycle is not carried out.
(2) Measures for improvement
PDCA management is to be used for energy intensity management and improvement of
equipment.
7) Evaluation of energy management activity
Evaluation of energy management activity is shown in Figure 3.4.1-1.
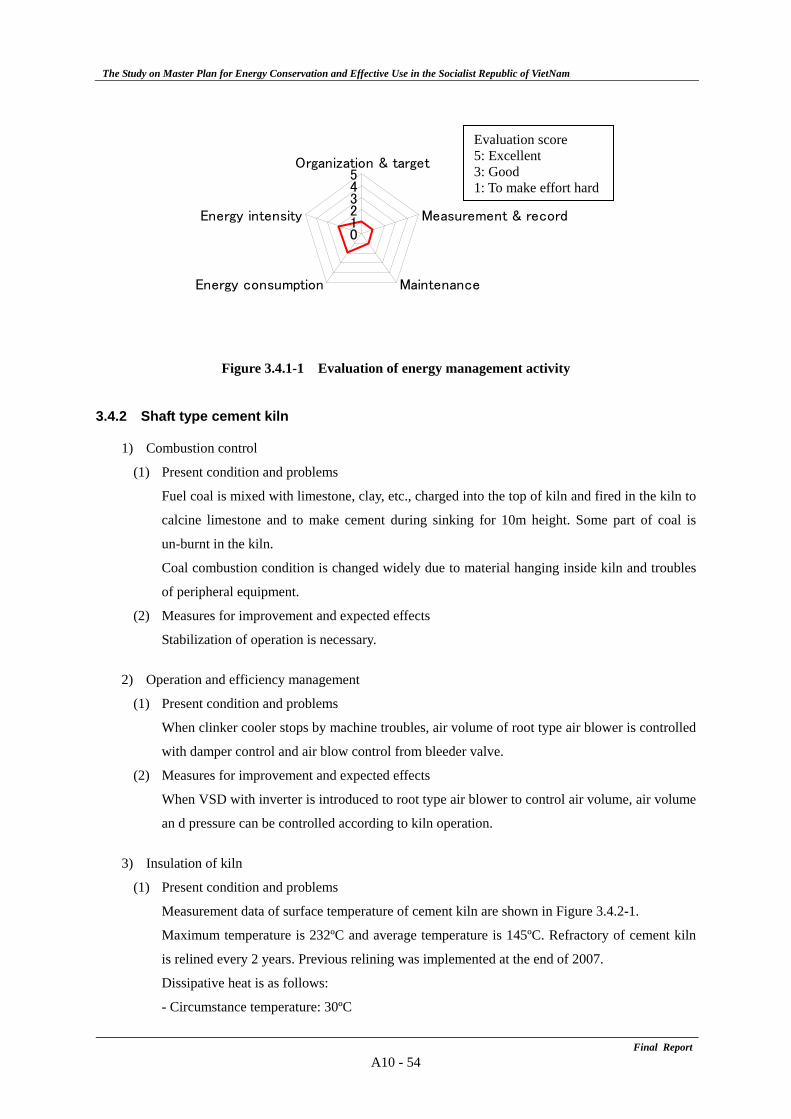
The Study on Master Plan for Energy Conservation and Effective Use in the Socialist Republic of VietNam
Final ReportA10 - 54
Figure 3.4.1-1 Evaluation of energy management activity
3.4.2 Shaft type cement kiln
1) Combustion control
(1) Present condition and problems
Fuel coal is mixed with limestone, clay, etc., charged into the top of kiln and fired in the kiln to
calcine limestone and to make cement during sinking for 10m height. Some part of coal is
un-burnt in the kiln.
Coal combustion condition is changed widely due to material hanging inside kiln and troubles
of peripheral equipment.
(2) Measures for improvement and expected effects
Stabilization of operation is necessary.
2) Operation and efficiency management
(1) Present condition and problems
When clinker cooler stops by machine troubles, air volume of root type air blower is controlled
with damper control and air blow control from bleeder valve.
(2) Measures for improvement and expected effects
When VSD with inverter is introduced to root type air blower to control air volume, air volume
an d pressure can be controlled according to kiln operation.
3) Insulation of kiln
(1) Present condition and problems
Measurement data of surface temperature of cement kiln are shown in Figure 3.4.2-1.
Maximum temperature is 232ºC and average temperature is 145ºC. Refractory of cement kiln
is relined every 2 years. Previous relining was implemented at the end of 2007.
Dissipative heat is as follows:
- Circumstance temperature: 30ºC
012345
Organization & target
Measurement & record
MaintenanceEnergy consumption
Energy intensity
Evaluation score 5: Excellent 3: Good 1: To make effort hard
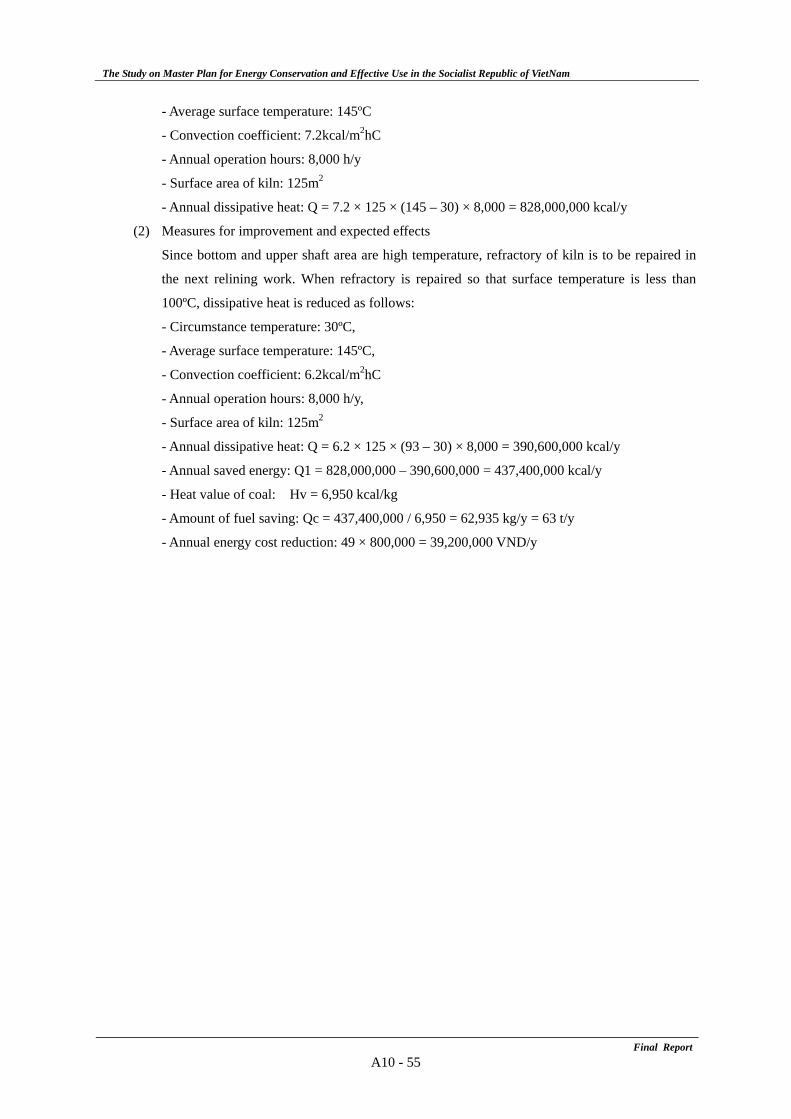
The Study on Master Plan for Energy Conservation and Effective Use in the Socialist Republic of VietNam
Final ReportA10 - 55
- Average surface temperature: 145ºC
- Convection coefficient: 7.2kcal/m2hC
- Annual operation hours: 8,000 h/y
- Surface area of kiln: 125m2
- Annual dissipative heat: Q = 7.2 × 125 × (145 – 30) × 8,000 = 828,000,000 kcal/y
(2) Measures for improvement and expected effects
Since bottom and upper shaft area are high temperature, refractory of kiln is to be repaired in
the next relining work. When refractory is repaired so that surface temperature is less than
100ºC, dissipative heat is reduced as follows:
- Circumstance temperature: 30ºC,
- Average surface temperature: 145ºC,
- Convection coefficient: 6.2kcal/m2hC
- Annual operation hours: 8,000 h/y,
- Surface area of kiln: 125m2
- Annual dissipative heat: Q = 6.2 × 125 × (93 – 30) × 8,000 = 390,600,000 kcal/y
- Annual saved energy: Q1 = 828,000,000 – 390,600,000 = 437,400,000 kcal/y
- Heat value of coal: Hv = 6,950 kcal/kg
- Amount of fuel saving: Qc = 437,400,000 / 6,950 = 62,935 kg/y = 63 t/y
- Annual energy cost reduction: 49 × 800,000 = 39,200,000 VND/y
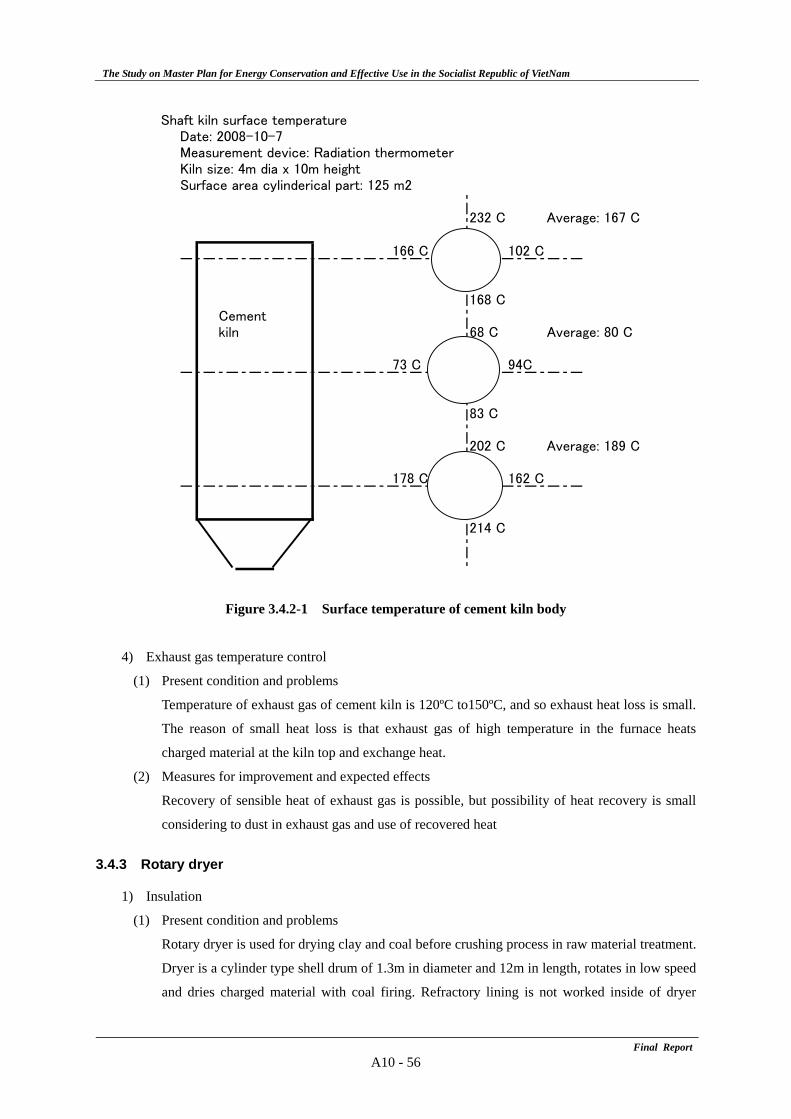
The Study on Master Plan for Energy Conservation and Effective Use in the Socialist Republic of VietNam
Final ReportA10 - 56
Figure 3.4.2-1 Surface temperature of cement kiln body
4) Exhaust gas temperature control
(1) Present condition and problems
Temperature of exhaust gas of cement kiln is 120ºC to150ºC, and so exhaust heat loss is small.
The reason of small heat loss is that exhaust gas of high temperature in the furnace heats
charged material at the kiln top and exchange heat.
(2) Measures for improvement and expected effects
Recovery of sensible heat of exhaust gas is possible, but possibility of heat recovery is small
considering to dust in exhaust gas and use of recovered heat
3.4.3 Rotary dryer
1) Insulation
(1) Present condition and problems
Rotary dryer is used for drying clay and coal before crushing process in raw material treatment.
Dryer is a cylinder type shell drum of 1.3m in diameter and 12m in length, rotates in low speed
and dries charged material with coal firing. Refractory lining is not worked inside of dryer
Shaft kiln surface temperatureDate: 2008-10-7Measurement device: Radiation thermometerKiln size: 4m dia x 10m heightSurface area cylinderical part: 125 m2
232 C Average: 167 C
166 C 102 C
168 CCementkiln 68 C Average: 80 C
73 C 94C
83 C
202 C Average: 189 C
178 C 162 C
214 C
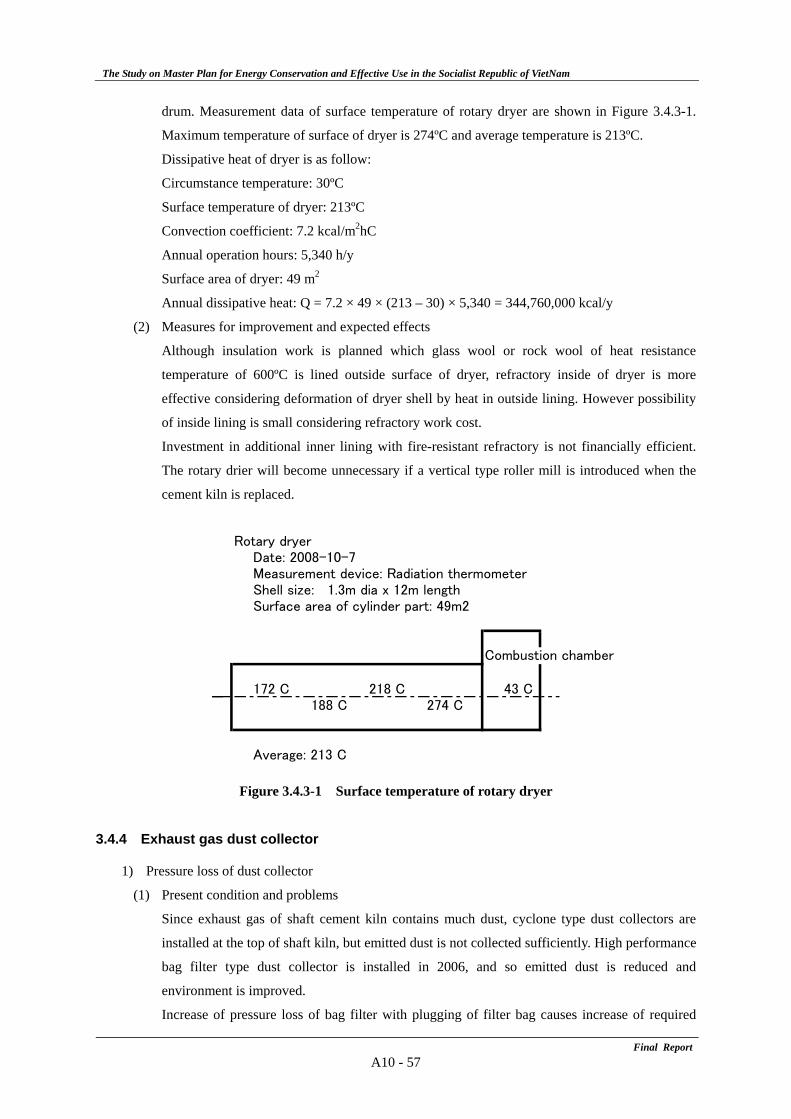
The Study on Master Plan for Energy Conservation and Effective Use in the Socialist Republic of VietNam
Final ReportA10 - 57
drum. Measurement data of surface temperature of rotary dryer are shown in Figure 3.4.3-1.
Maximum temperature of surface of dryer is 274ºC and average temperature is 213ºC.
Dissipative heat of dryer is as follow:
Circumstance temperature: 30ºC
Surface temperature of dryer: 213ºC
Convection coefficient: 7.2 kcal/m2hC
Annual operation hours: 5,340 h/y
Surface area of dryer: 49 m2
Annual dissipative heat: Q = 7.2 × 49 × (213 – 30) × 5,340 = 344,760,000 kcal/y
(2) Measures for improvement and expected effects
Although insulation work is planned which glass wool or rock wool of heat resistance
temperature of 600ºC is lined outside surface of dryer, refractory inside of dryer is more
effective considering deformation of dryer shell by heat in outside lining. However possibility
of inside lining is small considering refractory work cost.
Investment in additional inner lining with fire-resistant refractory is not financially efficient.
The rotary drier will become unnecessary if a vertical type roller mill is introduced when the
cement kiln is replaced.
Figure 3.4.3-1 Surface temperature of rotary dryer
3.4.4 Exhaust gas dust collector
1) Pressure loss of dust collector
(1) Present condition and problems
Since exhaust gas of shaft cement kiln contains much dust, cyclone type dust collectors are
installed at the top of shaft kiln, but emitted dust is not collected sufficiently. High performance
bag filter type dust collector is installed in 2006, and so emitted dust is reduced and
environment is improved.
Increase of pressure loss of bag filter with plugging of filter bag causes increase of required
Rotary dryerDate: 2008-10-7Measurement device: Radiation thermometerShell size: 1.3m dia x 12m lengthSurface area of cylinder part: 49m2
Combustion chamber
172 C 218 C 43 C188 C 274 C
Average: 213 C
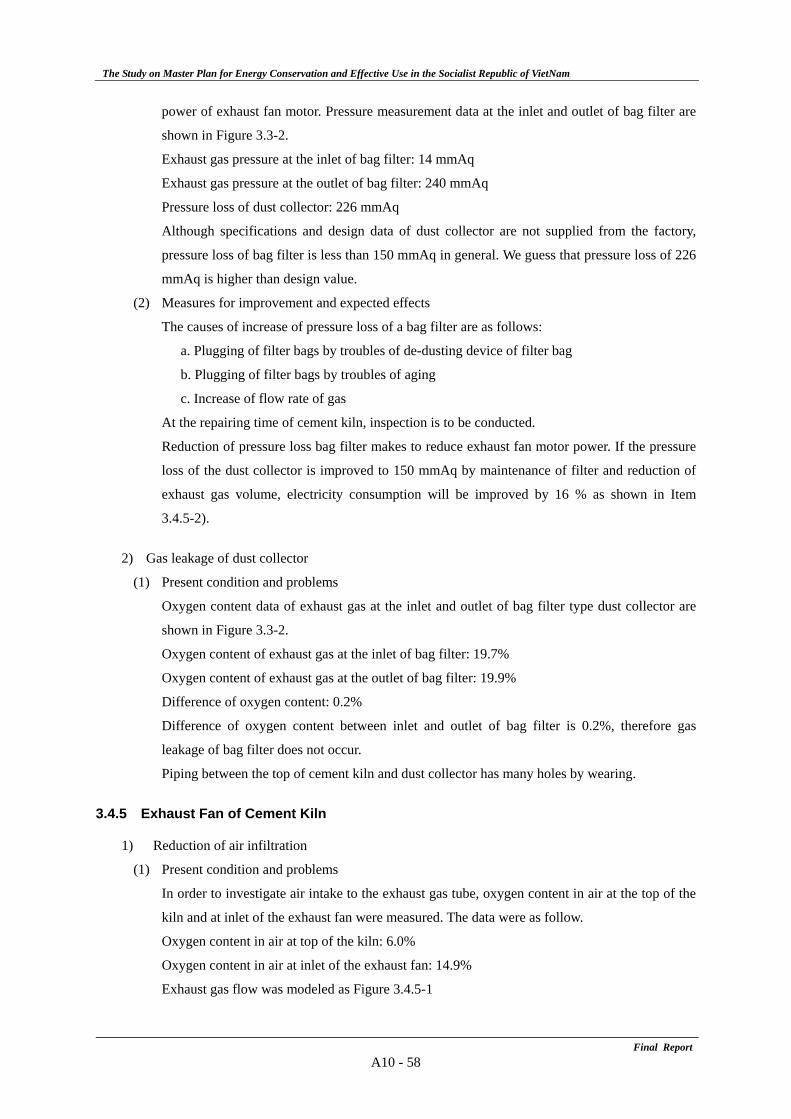
The Study on Master Plan for Energy Conservation and Effective Use in the Socialist Republic of VietNam
Final ReportA10 - 58
power of exhaust fan motor. Pressure measurement data at the inlet and outlet of bag filter are
shown in Figure 3.3-2.
Exhaust gas pressure at the inlet of bag filter: 14 mmAq
Exhaust gas pressure at the outlet of bag filter: 240 mmAq
Pressure loss of dust collector: 226 mmAq
Although specifications and design data of dust collector are not supplied from the factory,
pressure loss of bag filter is less than 150 mmAq in general. We guess that pressure loss of 226
mmAq is higher than design value.
(2) Measures for improvement and expected effects
The causes of increase of pressure loss of a bag filter are as follows:
a. Plugging of filter bags by troubles of de-dusting device of filter bag
b. Plugging of filter bags by troubles of aging
c. Increase of flow rate of gas
At the repairing time of cement kiln, inspection is to be conducted.
Reduction of pressure loss bag filter makes to reduce exhaust fan motor power. If the pressure
loss of the dust collector is improved to 150 mmAq by maintenance of filter and reduction of
exhaust gas volume, electricity consumption will be improved by 16 % as shown in Item
3.4.5-2).
2) Gas leakage of dust collector
(1) Present condition and problems
Oxygen content data of exhaust gas at the inlet and outlet of bag filter type dust collector are
shown in Figure 3.3-2.
Oxygen content of exhaust gas at the inlet of bag filter: 19.7%
Oxygen content of exhaust gas at the outlet of bag filter: 19.9%
Difference of oxygen content: 0.2%
Difference of oxygen content between inlet and outlet of bag filter is 0.2%, therefore gas
leakage of bag filter does not occur.
Piping between the top of cement kiln and dust collector has many holes by wearing.
3.4.5 Exhaust Fan of Cement Kiln
1) Reduction of air infiltration
(1) Present condition and problems
In order to investigate air intake to the exhaust gas tube, oxygen content in air at the top of the
kiln and at inlet of the exhaust fan were measured. The data were as follow.
Oxygen content in air at top of the kiln: 6.0%
Oxygen content in air at inlet of the exhaust fan: 14.9%
Exhaust gas flow was modeled as Figure 3.4.5-1
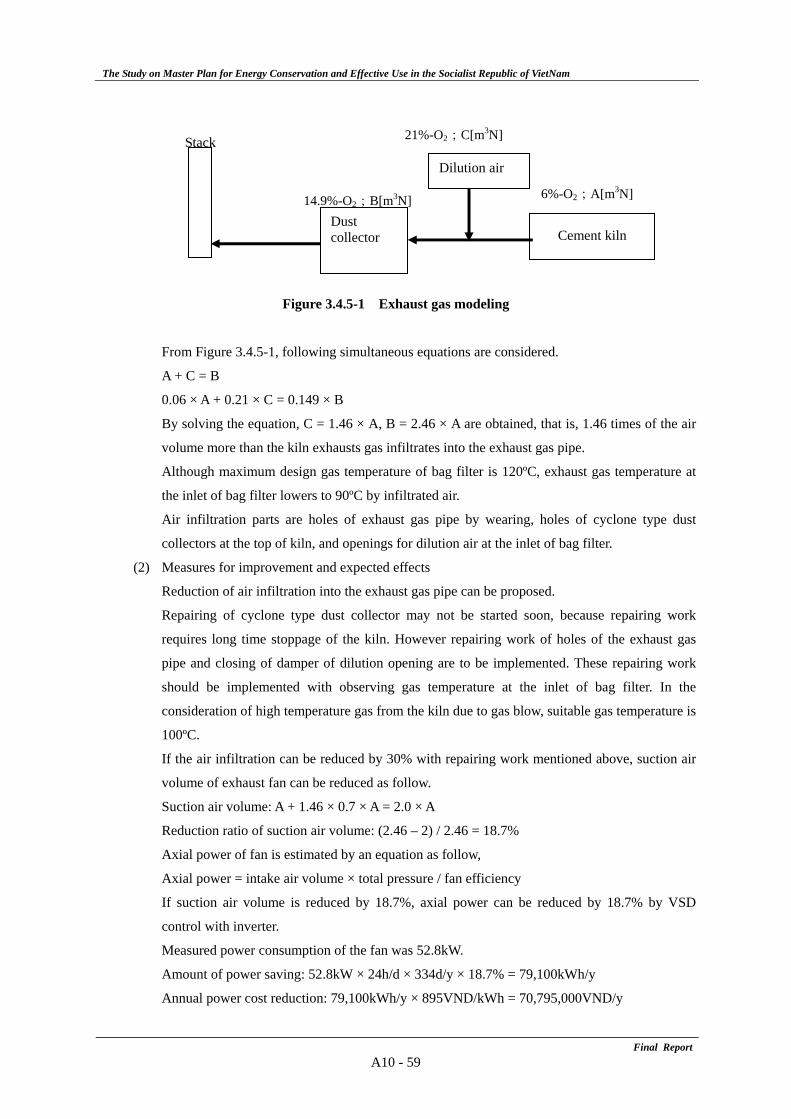
The Study on Master Plan for Energy Conservation and Effective Use in the Socialist Republic of VietNam
Final ReportA10 - 59
Figure 3.4.5-1 Exhaust gas modeling
From Figure 3.4.5-1, following simultaneous equations are considered.
A + C = B
0.06 × A + 0.21 × C = 0.149 × B
By solving the equation, C = 1.46 × A, B = 2.46 × A are obtained, that is, 1.46 times of the air
volume more than the kiln exhausts gas infiltrates into the exhaust gas pipe.
Although maximum design gas temperature of bag filter is 120ºC, exhaust gas temperature at
the inlet of bag filter lowers to 90ºC by infiltrated air.
Air infiltration parts are holes of exhaust gas pipe by wearing, holes of cyclone type dust
collectors at the top of kiln, and openings for dilution air at the inlet of bag filter.
(2) Measures for improvement and expected effects
Reduction of air infiltration into the exhaust gas pipe can be proposed.
Repairing of cyclone type dust collector may not be started soon, because repairing work
requires long time stoppage of the kiln. However repairing work of holes of the exhaust gas
pipe and closing of damper of dilution opening are to be implemented. These repairing work
should be implemented with observing gas temperature at the inlet of bag filter. In the
consideration of high temperature gas from the kiln due to gas blow, suitable gas temperature is
100ºC.
If the air infiltration can be reduced by 30% with repairing work mentioned above, suction air
volume of exhaust fan can be reduced as follow.
Suction air volume: A + 1.46 × 0.7 × A = 2.0 × A
Reduction ratio of suction air volume: (2.46 – 2) / 2.46 = 18.7%
Axial power of fan is estimated by an equation as follow,
Axial power = intake air volume × total pressure / fan efficiency
If suction air volume is reduced by 18.7%, axial power can be reduced by 18.7% by VSD
control with inverter.
Measured power consumption of the fan was 52.8kW.
Amount of power saving: 52.8kW × 24h/d × 334d/y × 18.7% = 79,100kWh/y
Annual power cost reduction: 79,100kWh/y × 895VND/kWh = 70,795,000VND/y
Dust collector Cement kiln
Dilution air
Stack 21%-O2;C[m3N]
14.9%-O2;B[m3N] 6%-O2;A[m3N]
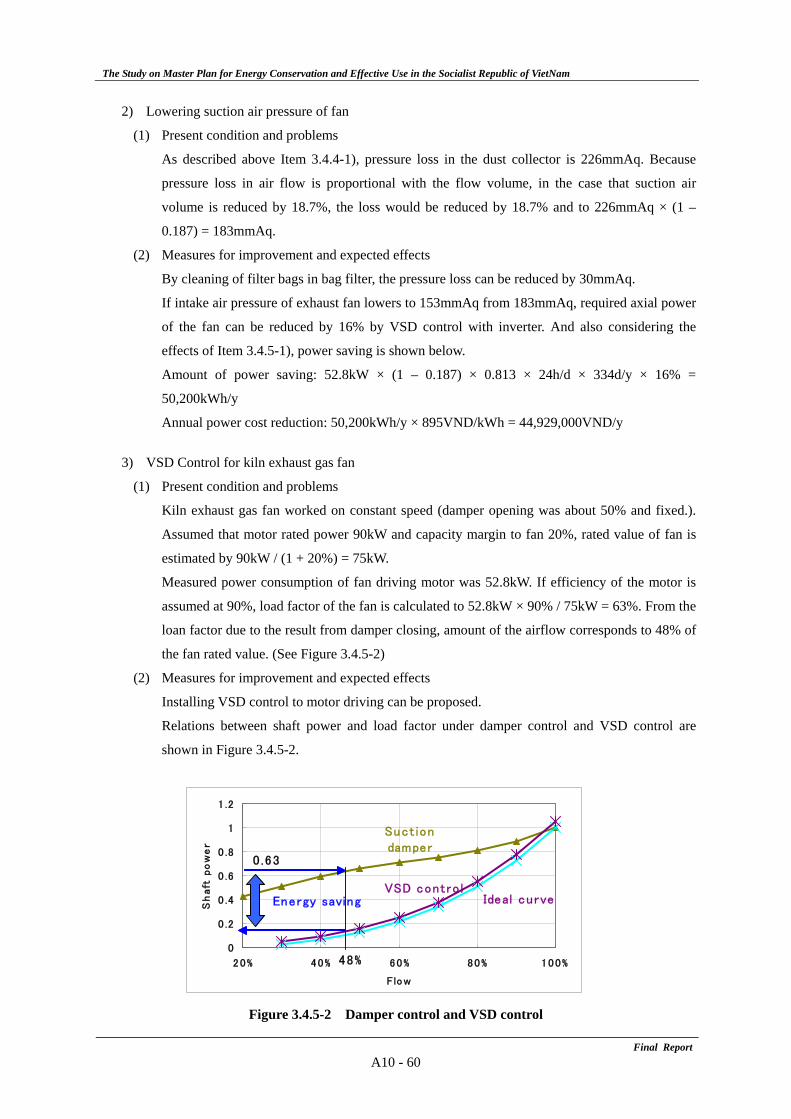
The Study on Master Plan for Energy Conservation and Effective Use in the Socialist Republic of VietNam
Final ReportA10 - 60
2) Lowering suction air pressure of fan
(1) Present condition and problems
As described above Item 3.4.4-1), pressure loss in the dust collector is 226mmAq. Because
pressure loss in air flow is proportional with the flow volume, in the case that suction air
volume is reduced by 18.7%, the loss would be reduced by 18.7% and to 226mmAq × (1 –
0.187) = 183mmAq.
(2) Measures for improvement and expected effects
By cleaning of filter bags in bag filter, the pressure loss can be reduced by 30mmAq.
If intake air pressure of exhaust fan lowers to 153mmAq from 183mmAq, required axial power
of the fan can be reduced by 16% by VSD control with inverter. And also considering the
effects of Item 3.4.5-1), power saving is shown below.
Amount of power saving: 52.8kW × (1 – 0.187) × 0.813 × 24h/d × 334d/y × 16% =
50,200kWh/y
Annual power cost reduction: 50,200kWh/y × 895VND/kWh = 44,929,000VND/y
3) VSD Control for kiln exhaust gas fan
(1) Present condition and problems
Kiln exhaust gas fan worked on constant speed (damper opening was about 50% and fixed.).
Assumed that motor rated power 90kW and capacity margin to fan 20%, rated value of fan is
estimated by 90kW / (1 + 20%) = 75kW.
Measured power consumption of fan driving motor was 52.8kW. If efficiency of the motor is
assumed at 90%, load factor of the fan is calculated to 52.8kW × 90% / 75kW = 63%. From the
loan factor due to the result from damper closing, amount of the airflow corresponds to 48% of
the fan rated value. (See Figure 3.4.5-2)
(2) Measures for improvement and expected effects
Installing VSD control to motor driving can be proposed.
Relations between shaft power and load factor under damper control and VSD control are
shown in Figure 3.4.5-2.
Figure 3.4.5-2 Damper control and VSD control
0
0 .2
0 .4
0 .6
0 .8
1
1 .2
20% 40% 60% 80% 100%
Flow
Sh
aft
po
we
r
Energy saving
Suct iondamper
VSD contro lIdeal curve
48%
0 .63
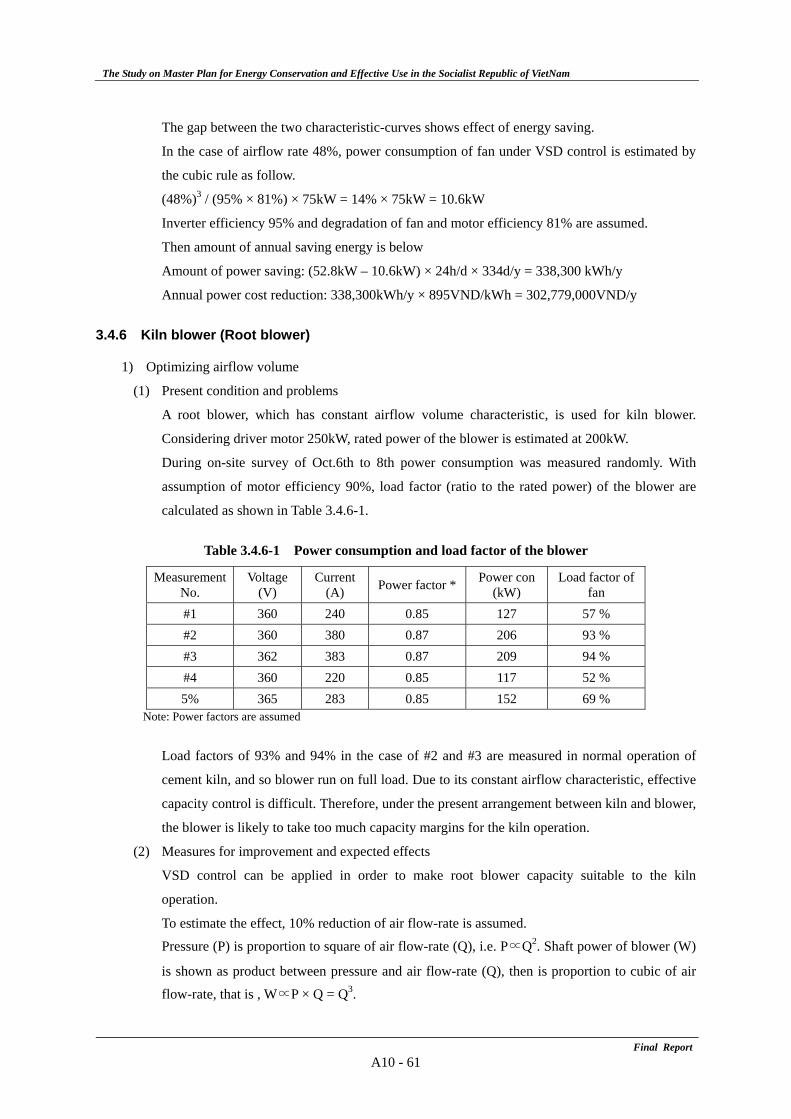
The Study on Master Plan for Energy Conservation and Effective Use in the Socialist Republic of VietNam
Final ReportA10 - 61
The gap between the two characteristic-curves shows effect of energy saving.
In the case of airflow rate 48%, power consumption of fan under VSD control is estimated by
the cubic rule as follow.
(48%)3 / (95% × 81%) × 75kW = 14% × 75kW = 10.6kW
Inverter efficiency 95% and degradation of fan and motor efficiency 81% are assumed.
Then amount of annual saving energy is below
Amount of power saving: (52.8kW – 10.6kW) × 24h/d × 334d/y = 338,300 kWh/y
Annual power cost reduction: 338,300kWh/y × 895VND/kWh = 302,779,000VND/y
3.4.6 Kiln blower (Root blower)
1) Optimizing airflow volume
(1) Present condition and problems
A root blower, which has constant airflow volume characteristic, is used for kiln blower.
Considering driver motor 250kW, rated power of the blower is estimated at 200kW.
During on-site survey of Oct.6th to 8th power consumption was measured randomly. With
assumption of motor efficiency 90%, load factor (ratio to the rated power) of the blower are
calculated as shown in Table 3.4.6-1.
Table 3.4.6-1 Power consumption and load factor of the blower
Measurement No.
Voltage (V)
Current (A) Power factor * Power con
(kW) Load factor of
fan #1 360 240 0.85 127 57 % #2 360 380 0.87 206 93 % #3 362 383 0.87 209 94 % #4 360 220 0.85 117 52 % 5% 365 283 0.85 152 69 %
Note: Power factors are assumed
Load factors of 93% and 94% in the case of #2 and #3 are measured in normal operation of
cement kiln, and so blower run on full load. Due to its constant airflow characteristic, effective
capacity control is difficult. Therefore, under the present arrangement between kiln and blower,
the blower is likely to take too much capacity margins for the kiln operation.
(2) Measures for improvement and expected effects
VSD control can be applied in order to make root blower capacity suitable to the kiln
operation.
To estimate the effect, 10% reduction of air flow-rate is assumed.
Pressure (P) is proportion to square of air flow-rate (Q), i.e. P∝Q2. Shaft power of blower (W)
is shown as product between pressure and air flow-rate (Q), then is proportion to cubic of air
flow-rate, that is , W∝P × Q = Q3.
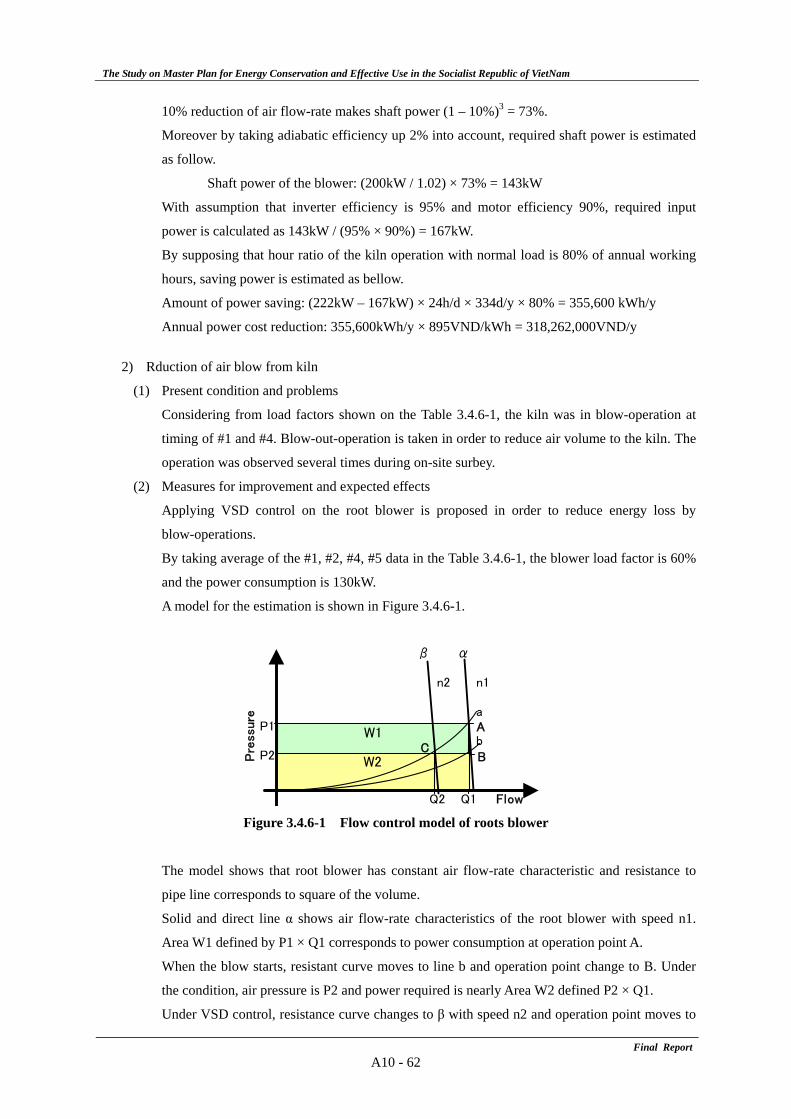
The Study on Master Plan for Energy Conservation and Effective Use in the Socialist Republic of VietNam
Final ReportA10 - 62
10% reduction of air flow-rate makes shaft power (1 – 10%)3 = 73%.
Moreover by taking adiabatic efficiency up 2% into account, required shaft power is estimated
as follow.
Shaft power of the blower: (200kW / 1.02) × 73% = 143kW
With assumption that inverter efficiency is 95% and motor efficiency 90%, required input
power is calculated as 143kW / (95% × 90%) = 167kW.
By supposing that hour ratio of the kiln operation with normal load is 80% of annual working
hours, saving power is estimated as bellow.
Amount of power saving: (222kW – 167kW) × 24h/d × 334d/y × 80% = 355,600 kWh/y
Annual power cost reduction: 355,600kWh/y × 895VND/kWh = 318,262,000VND/y
2) Rduction of air blow from kiln
(1) Present condition and problems
Considering from load factors shown on the Table 3.4.6-1, the kiln was in blow-operation at
timing of #1 and #4. Blow-out-operation is taken in order to reduce air volume to the kiln. The
operation was observed several times during on-site surbey.
(2) Measures for improvement and expected effects
Applying VSD control on the root blower is proposed in order to reduce energy loss by
blow-operations.
By taking average of the #1, #2, #4, #5 data in the Table 3.4.6-1, the blower load factor is 60%
and the power consumption is 130kW.
A model for the estimation is shown in Figure 3.4.6-1.
Figure 3.4.6-1 Flow control model of roots blower
The model shows that root blower has constant air flow-rate characteristic and resistance to
pipe line corresponds to square of the volume.
Solid and direct line α shows air flow-rate characteristics of the root blower with speed n1.
Area W1 defined by P1 × Q1 corresponds to power consumption at operation point A.
When the blow starts, resistant curve moves to line b and operation point change to B. Under
the condition, air pressure is P2 and power required is nearly Area W2 defined P2 × Q1.
Under VSD control, resistance curve changes to β with speed n2 and operation point moves to
β α
n2 n1
aP1
bP2
Q2 Q1 Flow
W1
W2Pre
ssure
C
A
B
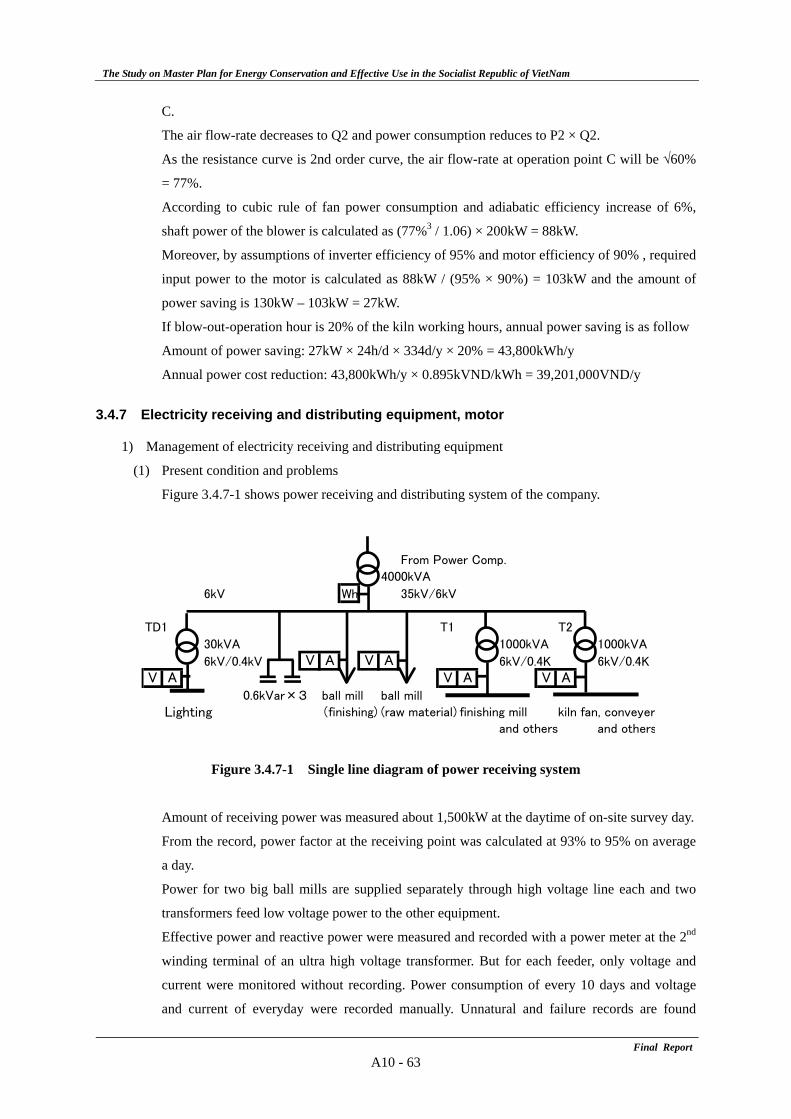
The Study on Master Plan for Energy Conservation and Effective Use in the Socialist Republic of VietNam
Final ReportA10 - 63
C.
The air flow-rate decreases to Q2 and power consumption reduces to P2 × Q2.
As the resistance curve is 2nd order curve, the air flow-rate at operation point C will be √60%
= 77%.
According to cubic rule of fan power consumption and adiabatic efficiency increase of 6%,
shaft power of the blower is calculated as (77%3 / 1.06) × 200kW = 88kW.
Moreover, by assumptions of inverter efficiency of 95% and motor efficiency of 90% , required
input power to the motor is calculated as 88kW / (95% × 90%) = 103kW and the amount of
power saving is 130kW – 103kW = 27kW.
If blow-out-operation hour is 20% of the kiln working hours, annual power saving is as follow
Amount of power saving: 27kW × 24h/d × 334d/y × 20% = 43,800kWh/y
Annual power cost reduction: 43,800kWh/y × 0.895kVND/kWh = 39,201,000VND/y
3.4.7 Electricity receiving and distributing equipment, motor
1) Management of electricity receiving and distributing equipment
(1) Present condition and problems
Figure 3.4.7-1 shows power receiving and distributing system of the company.
Figure 3.4.7-1 Single line diagram of power receiving system
Amount of receiving power was measured about 1,500kW at the daytime of on-site survey day.
From the record, power factor at the receiving point was calculated at 93% to 95% on average
a day.
Power for two big ball mills are supplied separately through high voltage line each and two
transformers feed low voltage power to the other equipment.
Effective power and reactive power were measured and recorded with a power meter at the 2nd
winding terminal of an ultra high voltage transformer. But for each feeder, only voltage and
current were monitored without recording. Power consumption of every 10 days and voltage
and current of everyday were recorded manually. Unnatural and failure records are found
From Power Comp.
4000kVA
6kV Wh 35kV/6kV
TD1 T1 T2
30kVA 1000kVA 1000kVA
6kV/0.4kV V A V A 6kV/0.4K 6kV/0.4K
V A V A V A0.6kVar×3 ball mill ball mill
Lighting (finishing) (raw material) finishing mill kiln fan, conveyerand others and others
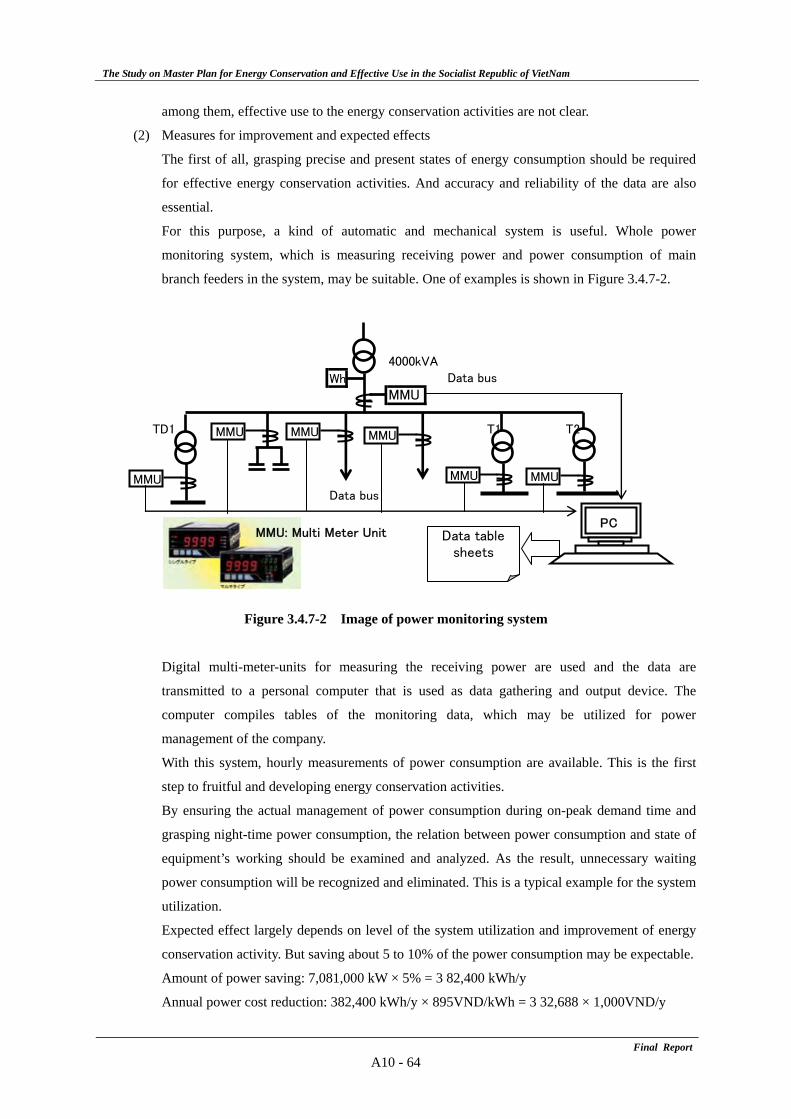
The Study on Master Plan for Energy Conservation and Effective Use in the Socialist Republic of VietNam
Final ReportA10 - 64
among them, effective use to the energy conservation activities are not clear.
(2) Measures for improvement and expected effects
The first of all, grasping precise and present states of energy consumption should be required
for effective energy conservation activities. And accuracy and reliability of the data are also
essential.
For this purpose, a kind of automatic and mechanical system is useful. Whole power
monitoring system, which is measuring receiving power and power consumption of main
branch feeders in the system, may be suitable. One of examples is shown in Figure 3.4.7-2.
4000kVA
Wh Data bus
MMU
TD1 T1 T2
Data bus
PCData table
sheets
MMU: Multi Meter Unit
MMU MMUMMU
MMUMMUMMU
Figure 3.4.7-2 Image of power monitoring system
Digital multi-meter-units for measuring the receiving power are used and the data are
transmitted to a personal computer that is used as data gathering and output device. The
computer compiles tables of the monitoring data, which may be utilized for power
management of the company.
With this system, hourly measurements of power consumption are available. This is the first
step to fruitful and developing energy conservation activities.
By ensuring the actual management of power consumption during on-peak demand time and
grasping night-time power consumption, the relation between power consumption and state of
equipment’s working should be examined and analyzed. As the result, unnecessary waiting
power consumption will be recognized and eliminated. This is a typical example for the system
utilization.
Expected effect largely depends on level of the system utilization and improvement of energy
conservation activity. But saving about 5 to 10% of the power consumption may be expectable.
Amount of power saving: 7,081,000 kW × 5% = 3 82,400 kWh/y
Annual power cost reduction: 382,400 kWh/y × 895VND/kWh = 3 32,688 × 1,000VND/y
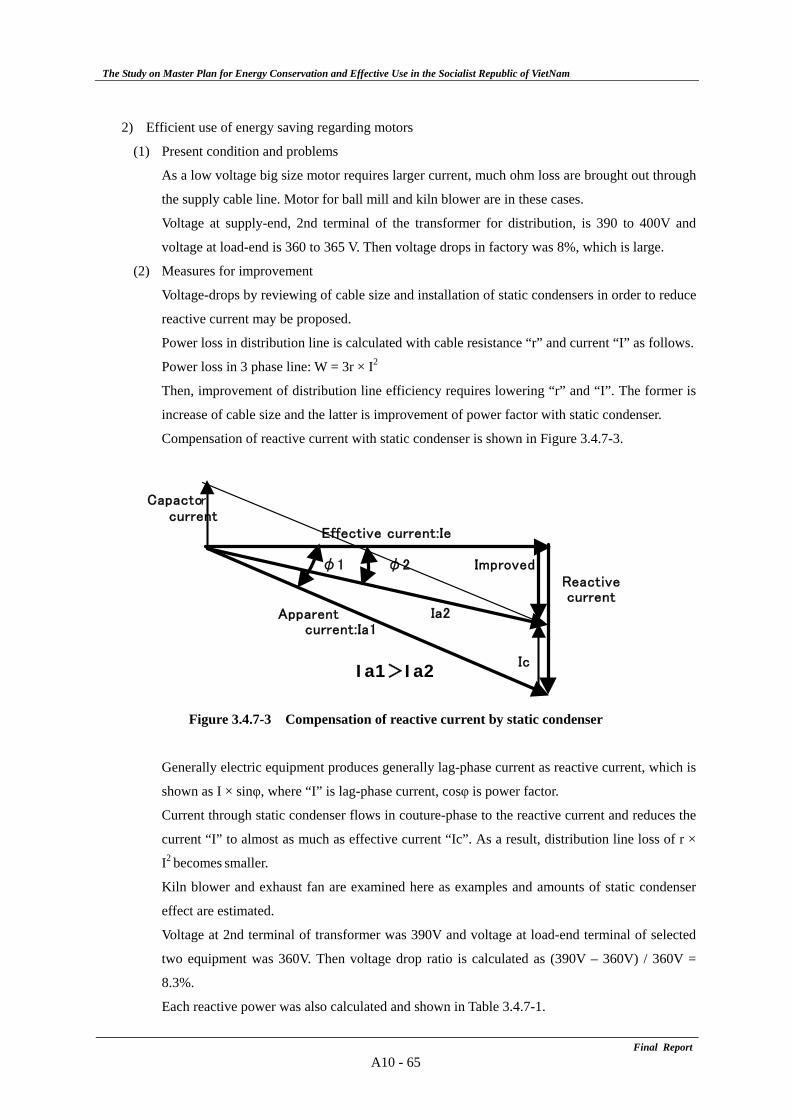
The Study on Master Plan for Energy Conservation and Effective Use in the Socialist Republic of VietNam
Final ReportA10 - 65
2) Efficient use of energy saving regarding motors
(1) Present condition and problems
As a low voltage big size motor requires larger current, much ohm loss are brought out through
the supply cable line. Motor for ball mill and kiln blower are in these cases.
Voltage at supply-end, 2nd terminal of the transformer for distribution, is 390 to 400V and
voltage at load-end is 360 to 365 V. Then voltage drops in factory was 8%, which is large.
(2) Measures for improvement
Voltage-drops by reviewing of cable size and installation of static condensers in order to reduce
reactive current may be proposed.
Power loss in distribution line is calculated with cable resistance “r” and current “I” as follows.
Power loss in 3 phase line: W = 3r × I2
Then, improvement of distribution line efficiency requires lowering “r” and “I”. The former is
increase of cable size and the latter is improvement of power factor with static condenser.
Compensation of reactive current with static condenser is shown in Figure 3.4.7-3.
Figure 3.4.7-3 Compensation of reactive current by static condenser
Generally electric equipment produces generally lag-phase current as reactive current, which is
shown as I × sinφ, where “I” is lag-phase current, cosφ is power factor.
Current through static condenser flows in couture-phase to the reactive current and reduces the
current “I” to almost as much as effective current “Ic”. As a result, distribution line loss of r ×
I2 becomes smaller.
Kiln blower and exhaust fan are examined here as examples and amounts of static condenser
effect are estimated.
Voltage at 2nd terminal of transformer was 390V and voltage at load-end terminal of selected
two equipment was 360V. Then voltage drop ratio is calculated as (390V – 360V) / 360V =
8.3%.
Each reactive power was also calculated and shown in Table 3.4.7-1.
Capactorcurrent
Effective current:Ie
φ1 φ2 ImprovedReactive current
Apparent Ia2 current:Ia1
IcIa1>Ia2
The Study on Master Plan for Energy Conservation and Effective Use in the Socialist Republic of VietNam
Final ReportA10 - 66
Table 3.4.7-1 Reactive power of motor for kiln blower and exhaust fan motor
Name of motor Current (A)
Power factor
Active current
(A)
Reactive current
(A)
Reactive power (kVar)
Exhaust fan 104 81% 84 61 38 Kiln blower 380 87% 331 187 117
Capacity of static condenser is selected in order to compensate the reactive power 38kVar and
117kVar each. Then power factor improvement and its effect are calculated and shown in Table
3.4.7-2.
Table 3.4.7-2 Power factor improvements and its effect
Static condenser Name of motor
ΜF kVar
Reactive current
(A)
Surface current
(A)
Before (kW)
After (kW)
Saving (kW)
Exhaust fan 900 37 2 84 5.4 3.6 1.8 Kiln fan 2,500 102 24 331 19.7 15.0 4.7
The static condensers reduce power loss in distribution cables by 1.8kW and 4.7 kW and
voltage drop through the lines are improved by 24V (6.7%) and 26V (7.8%).
By enlarging of cable size in order to improve voltage drop to 5%, voltage drop is reduced to
4.9V and 6.7V respectively. Distribution power loss on each line is improved by 0.7kW and
3.8kW with these repairing.
Total improvement of each line is summarized as follow.
Exhaust fan line: 1.8kW + 0.7kW = 2.5kW
Kiln blower line: 4.7kW + 3.8kW = 8.5kW
Then,
Amount of power saving: (2.5+8.5) × 24h/d × 334d/y = 88,500kWh/y
Annual power cost reduction: 88,500kWh/y × 895VND/kWh = 79,208 × 1,000VND/y
As far as limited in a factory, following equations can be used for estimation of distribution
power loss.
W = S × (ΔV/V) × 1/cosφ
Where, W: power loss, S: apparent power.
Voltage drop of ΔV/V shows a rough index of the loss, which is ratio of loss in a supply cable
to necessary power for load. The value of larger than 5% should be examined and improved.
3.4.8 Improvement of process
1) Review of line
(1) Present condition and problems
In the case of vertical type cement shaft kilns, since preheating of material, quick-liming and
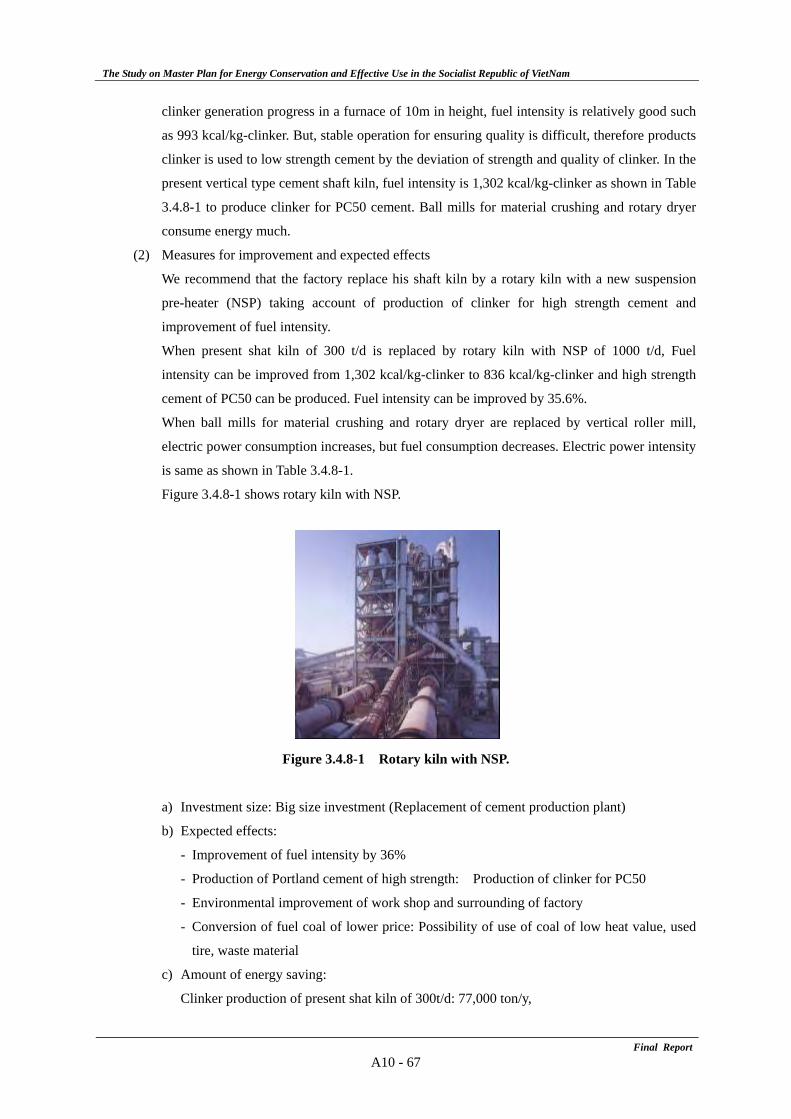
The Study on Master Plan for Energy Conservation and Effective Use in the Socialist Republic of VietNam
Final ReportA10 - 67
clinker generation progress in a furnace of 10m in height, fuel intensity is relatively good such
as 993 kcal/kg-clinker. But, stable operation for ensuring quality is difficult, therefore products
clinker is used to low strength cement by the deviation of strength and quality of clinker. In the
present vertical type cement shaft kiln, fuel intensity is 1,302 kcal/kg-clinker as shown in Table
3.4.8-1 to produce clinker for PC50 cement. Ball mills for material crushing and rotary dryer
consume energy much.
(2) Measures for improvement and expected effects
We recommend that the factory replace his shaft kiln by a rotary kiln with a new suspension
pre-heater (NSP) taking account of production of clinker for high strength cement and
improvement of fuel intensity.
When present shat kiln of 300 t/d is replaced by rotary kiln with NSP of 1000 t/d, Fuel
intensity can be improved from 1,302 kcal/kg-clinker to 836 kcal/kg-clinker and high strength
cement of PC50 can be produced. Fuel intensity can be improved by 35.6%.
When ball mills for material crushing and rotary dryer are replaced by vertical roller mill,
electric power consumption increases, but fuel consumption decreases. Electric power intensity
is same as shown in Table 3.4.8-1.
Figure 3.4.8-1 shows rotary kiln with NSP.
Figure 3.4.8-1 Rotary kiln with NSP.
a) Investment size: Big size investment (Replacement of cement production plant)
b) Expected effects:
- Improvement of fuel intensity by 36%
- Production of Portland cement of high strength: Production of clinker for PC50
- Environmental improvement of work shop and surrounding of factory
- Conversion of fuel coal of lower price: Possibility of use of coal of low heat value, used
tire, waste material
c) Amount of energy saving:
Clinker production of present shat kiln of 300t/d: 77,000 ton/y,
The Study on Master Plan for Energy Conservation and Effective Use in the Socialist Republic of VietNam
Final ReportA10 - 68
Coal consumption: 11,000 × 99%
Saved energy: 11,000 × 0.99 × 35.6% = 3,880 ton/y
d) Annual Energy cost reduction: 3,880t/y × 800,000 VND/t = 3,104,000,000VND/y
e) Investment cost of rotary kiln with NSP of 1,000t/d:
Clinker production: 1,000 ton/d, 330,000ton/y
Unit cost of rotary kiln plant: US$501/ton-clinker/y from Table 3.4.8-1
Investment cost of rotary kiln with NSP is estimated as follows:
330,000 × 501 = US$165,330,000.
165,330,000 × 16,000 VND/US$ = VND2,645,000,000,000.
Table 3.4.8-1 Energy consumption and installation cost of cement plant
Fossil fuel intensity Power intensity Plant cost
(Mcal/t-clinker) (kWhl/t-clinker) (USD/t-clinker/y)
Small size plant(1,000t-cl/d or less)
Type 1: Shaft kiln 1,302 148 324.9
Type 2: Wet type rotary kiln 1,481 146 438.5
Type 3: Dry type rotary kiln 955 146 526.9
Type 4: Dry type rotary kiln (SP/NSP) 836 141 501.7
Type 5: new type fluidization shaft kiln 714 110 473.3
Large size plant (2,000t-cl/d or over)
Type 6: Wet type rotary kiln 1,182 146 409.1
Type 7: Dry type rotary kiln 855 139 542.8
Type 8: Dry type rotary kiln (SP/NSP) 712 134 267.9
Type 9: Dry type rotary kiln (SP/NSP) BAT 576 88 307.8
Source: Research Institute of Innovative Technology for the Earth (RITE), Japan, August 2008
The Study on Master Plan for Energy Conservation and Effective Use in the Socialist Republic of VietNam
Final ReportA10 - 69
4. Ceramic Factory D
4.1 Introduction
1) Name: Ceramic Factory D
2) Address: Danang city
3) Business
(1) Type: Ceramics
(2) Main product: Sanitary ware
Amount of product: 100,000 pcs in 2007
Export: none
(3) Employee: 281 persons
4) Attendee: President, Factory manager, Maintenance, Mechanical engineer, Quality control
5) Outline of factory
The equipment was introduced from Italy in 2001 and production began in 2003. Originally, this
company was a state-run enterprise, but it was privatized in 2006. All raw material is domestics,
and products are not exported. The tunnel kiln is sometime stopped because the volume of sales is
smaller than production capacity.
4.2 Energy on-site Survey
1) Survey member
JICA team: N. Fukushima, M. Ishikawa, N. Amano, T. Onoguchi
Institute of Energy: Mr.Song, Mr. Hau
ECC-Danang: Mr.Ban Duong, Mr. Vy
2) Date: 9 -10th October 2008
3) Request of energy conservation
How to improve energy conservation
How much is energy conservation effect
4.3 Result of energy on-site Survey
1) Improvement item and effect of forecast after improvement
Improvement item and effect of forecast after improvement by on-site survey is shown in Table
4.3-1. Energy conservation potential is 18.3%
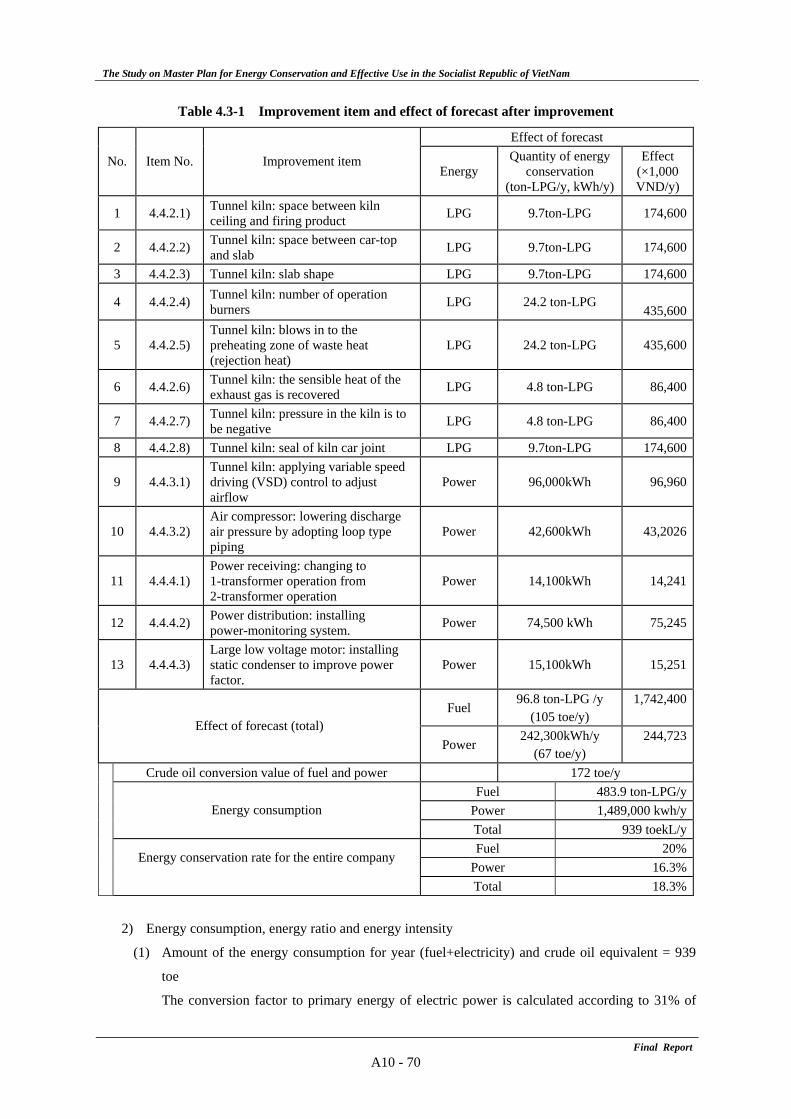
The Study on Master Plan for Energy Conservation and Effective Use in the Socialist Republic of VietNam
Final ReportA10 - 70
Table 4.3-1 Improvement item and effect of forecast after improvement
Effect of forecast
No. Item No. Improvement item Energy
Quantity of energy conservation
(ton-LPG/y, kWh/y)
Effect (×1,000 VND/y)
1 4.4.2.1) Tunnel kiln: space between kiln ceiling and firing product LPG 9.7ton-LPG 174,600
2 4.4.2.2) Tunnel kiln: space between car-top and slab LPG 9.7ton-LPG 174,600
3 4.4.2.3) Tunnel kiln: slab shape LPG 9.7ton-LPG 174,600
4 4.4.2.4) Tunnel kiln: number of operation burners LPG 24.2 ton-LPG
435,600
5 4.4.2.5) Tunnel kiln: blows in to the preheating zone of waste heat (rejection heat)
LPG 24.2 ton-LPG 435,600
6 4.4.2.6) Tunnel kiln: the sensible heat of the exhaust gas is recovered LPG 4.8 ton-LPG 86,400
7 4.4.2.7) Tunnel kiln: pressure in the kiln is to be negative LPG 4.8 ton-LPG 86,400
8 4.4.2.8) Tunnel kiln: seal of kiln car joint LPG 9.7ton-LPG 174,600
9 4.4.3.1) Tunnel kiln: applying variable speed driving (VSD) control to adjust airflow
Power 96,000kWh 96,960
10 4.4.3.2) Air compressor: lowering discharge air pressure by adopting loop type piping
Power 42,600kWh 43,2026
11 4.4.4.1) Power receiving: changing to 1-transformer operation from 2-transformer operation
Power 14,100kWh 14,241
12 4.4.4.2) Power distribution: installing power-monitoring system. Power 74,500 kWh 75,245
13 4.4.4.3) Large low voltage motor: installing static condenser to improve power factor.
Power 15,100kWh 15,251
Fuel 96.8 ton-LPG /y
(105 toe/y) 1,742,400
Effect of forecast (total) Power
242,300kWh/y (67 toe/y)
244,723
Crude oil conversion value of fuel and power 172 toe/y Fuel 483.9 ton-LPG/y
Power 1,489,000 kwh/yEnergy consumption Total 939 toekL/y
Fuel 20%
Energy conservation rate for the entire company Power 16.3%
Total 18.3%
2) Energy consumption, energy ratio and energy intensity
(1) Amount of the energy consumption for year (fuel+electricity) and crude oil equivalent = 939
toe
The conversion factor to primary energy of electric power is calculated according to 31% of
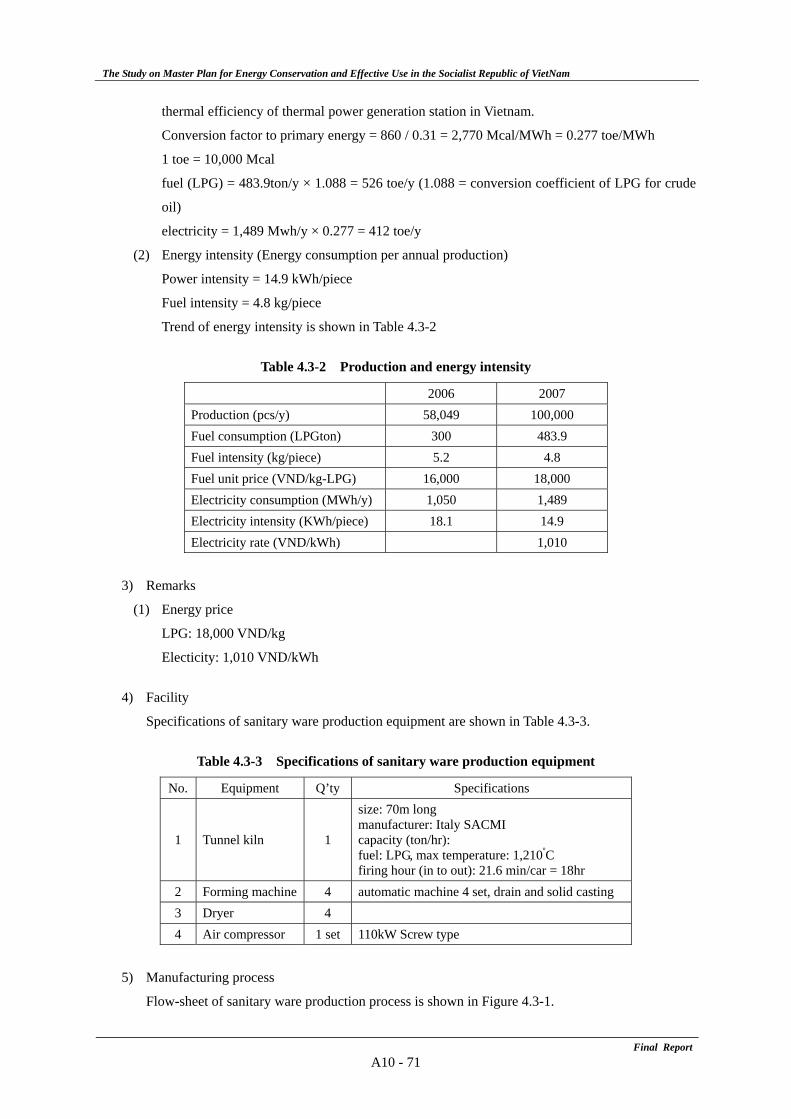
The Study on Master Plan for Energy Conservation and Effective Use in the Socialist Republic of VietNam
Final ReportA10 - 71
thermal efficiency of thermal power generation station in Vietnam.
Conversion factor to primary energy = 860 / 0.31 = 2,770 Mcal/MWh = 0.277 toe/MWh
1 toe = 10,000 Mcal
fuel (LPG) = 483.9ton/y × 1.088 = 526 toe/y (1.088 = conversion coefficient of LPG for crude
oil)
electricity = 1,489 Mwh/y × 0.277 = 412 toe/y
(2) Energy intensity (Energy consumption per annual production)
Power intensity = 14.9 kWh/piece
Fuel intensity = 4.8 kg/piece
Trend of energy intensity is shown in Table 4.3-2
Table 4.3-2 Production and energy intensity
2006 2007 Production (pcs/y) 58,049 100,000 Fuel consumption (LPGton) 300 483.9 Fuel intensity (kg/piece) 5.2 4.8 Fuel unit price (VND/kg-LPG) 16,000 18,000 Electricity consumption (MWh/y) 1,050 1,489 Electricity intensity (KWh/piece) 18.1 14.9 Electricity rate (VND/kWh) 1,010
3) Remarks
(1) Energy price
LPG: 18,000 VND/kg
Electicity: 1,010 VND/kWh
4) Facility
Specifications of sanitary ware production equipment are shown in Table 4.3-3.
Table 4.3-3 Specifications of sanitary ware production equipment
No. Equipment Q’ty Specifications
1 Tunnel kiln 1
size: 70m long manufacturer: Italy SACMI capacity (ton/hr): fuel: LPG, max temperature: 1,210ºC firing hour (in to out): 21.6 min/car = 18hr
2 Forming machine 4 automatic machine 4 set, drain and solid casting 3 Dryer 4 4 Air compressor 1 set 110kW Screw type
5) Manufacturing process
Flow-sheet of sanitary ware production process is shown in Figure 4.3-1.
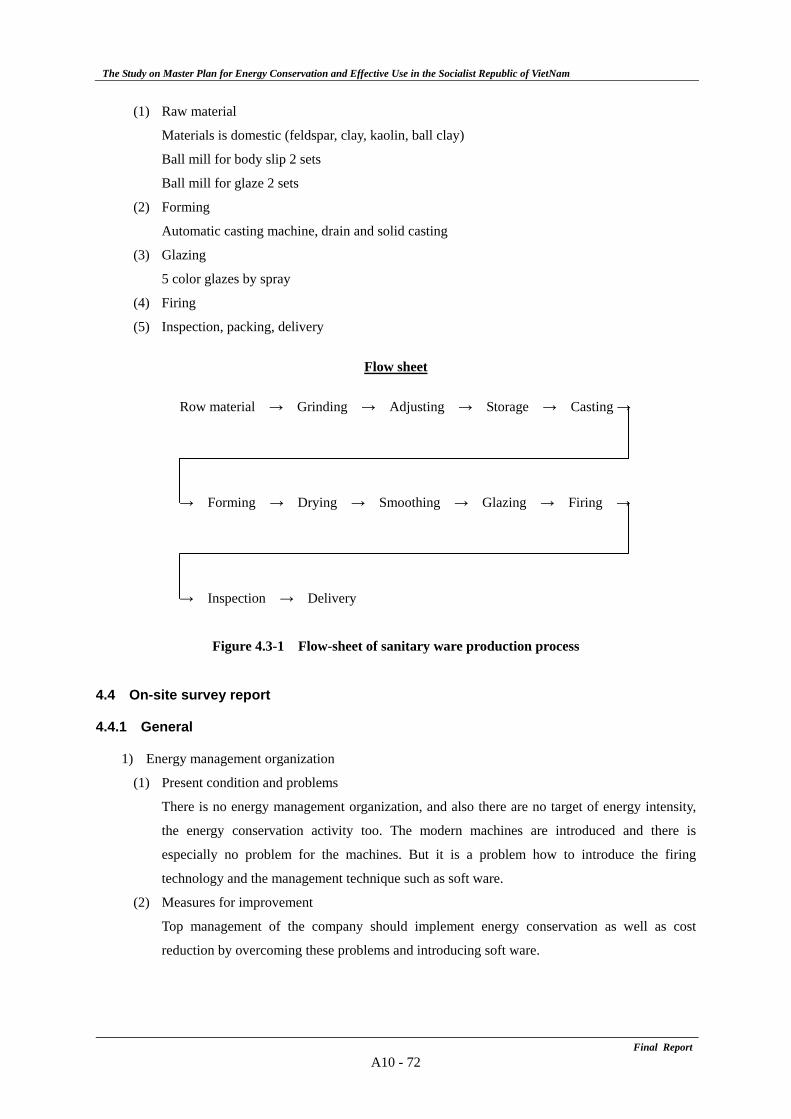
The Study on Master Plan for Energy Conservation and Effective Use in the Socialist Republic of VietNam
Final ReportA10 - 72
(1) Raw material
Materials is domestic (feldspar, clay, kaolin, ball clay)
Ball mill for body slip 2 sets
Ball mill for glaze 2 sets
(2) Forming
Automatic casting machine, drain and solid casting
(3) Glazing
5 color glazes by spray
(4) Firing
(5) Inspection, packing, delivery
Flow sheet
Row material → Grinding → Adjusting → Storage → Casting →
→ Forming → Drying → Smoothing → Glazing → Firing →
→ Inspection → Delivery
Figure 4.3-1 Flow-sheet of sanitary ware production process
4.4 On-site survey report
4.4.1 General
1) Energy management organization
(1) Present condition and problems
There is no energy management organization, and also there are no target of energy intensity,
the energy conservation activity too. The modern machines are introduced and there is
especially no problem for the machines. But it is a problem how to introduce the firing
technology and the management technique such as soft ware.
(2) Measures for improvement
Top management of the company should implement energy conservation as well as cost
reduction by overcoming these problems and introducing soft ware.
The Study on Master Plan for Energy Conservation and Effective Use in the Socialist Republic of VietNam
Final ReportA10 - 73
2) Implementation of measurement and record
(1) Present condition and problems
The equipment is the same as that in Japan, and the equipment and measurement
instrumentation is also sufficient for operation. Measurement record is insufficient but
minimum requirement is implemented for electric power monitoring and recording.
(2) Measures for improvement
Watt-hour meter is installed at the secondary side of receiving transformer. Power consumption
can be grasped by using the watt-hour meter. Power consumption management can be
implemented by reading the indicated values of watt-hour meter peroidically.
3) Maintenance of facility
(1) Present condition and problems
The equipment is new, but purpose and necessity of the maintenance does not be understood.
Especially filter of fan is not cleaned. It is necessary to make management items, maintenance
cycle and the purpose of all fan, and motor and to implement periodical inspection.
(2) Measures for improvement
Filters of fans should be cleaned. Equipment management standard should be prepared
including management items, purpose and maintenance cycle, and periodic inspection should
be implemented.
4) Energy consumption management
(1) Present condition and problems
Fuel consumption for tunnel kiln which is energy intensive equipment, but energy management
is not implemented by measurement data of fuel consumption. Power consumption is not
grasped sufficiently.
(2) Measures for improvement
Energy consumption data should be shown with graphs in the factory, and All the employees
should have awareness of energy conservation.
5) Energy intensity management
(1) Present condition and problems
The energy intensity and thermal efficiency are not managed, and employees do not recognize
energy conservation
(2) Measures for improvement
Energy intensity per production volume should be managed. Energy cost should be reduced
with awareness of energy conservation.
6) PDCA management cycle
(1) Present condition and problems
Energy consumption is recorded but is not managed.
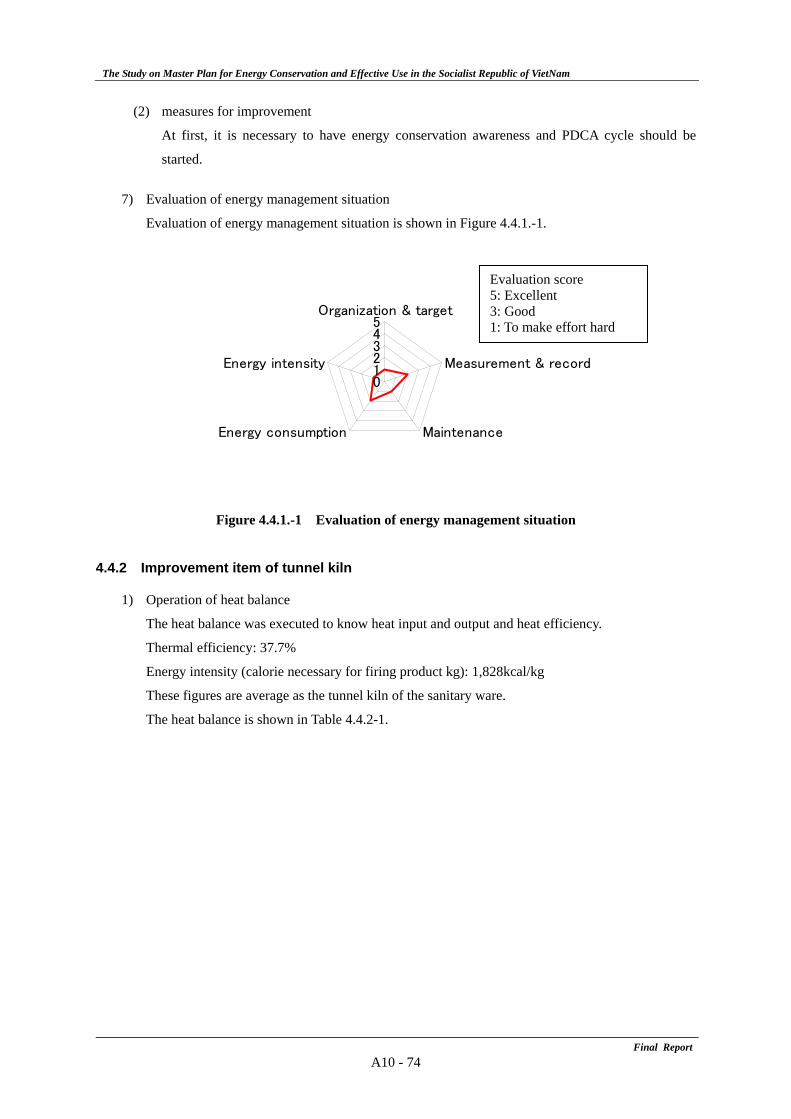
The Study on Master Plan for Energy Conservation and Effective Use in the Socialist Republic of VietNam
Final ReportA10 - 74
(2) measures for improvement
At first, it is necessary to have energy conservation awareness and PDCA cycle should be
started.
7) Evaluation of energy management situation
Evaluation of energy management situation is shown in Figure 4.4.1.-1.
Figure 4.4.1.-1 Evaluation of energy management situation
4.4.2 Improvement item of tunnel kiln
1) Operation of heat balance
The heat balance was executed to know heat input and output and heat efficiency.
Thermal efficiency: 37.7%
Energy intensity (calorie necessary for firing product kg): 1,828kcal/kg
These figures are average as the tunnel kiln of the sanitary ware.
The heat balance is shown in Table 4.4.2-1.
012345
Organization & target
Measurement & record
MaintenanceEnergy consumption
Energy intensity
Evaluation score 5: Excellent 3: Good 1: To make effort hard
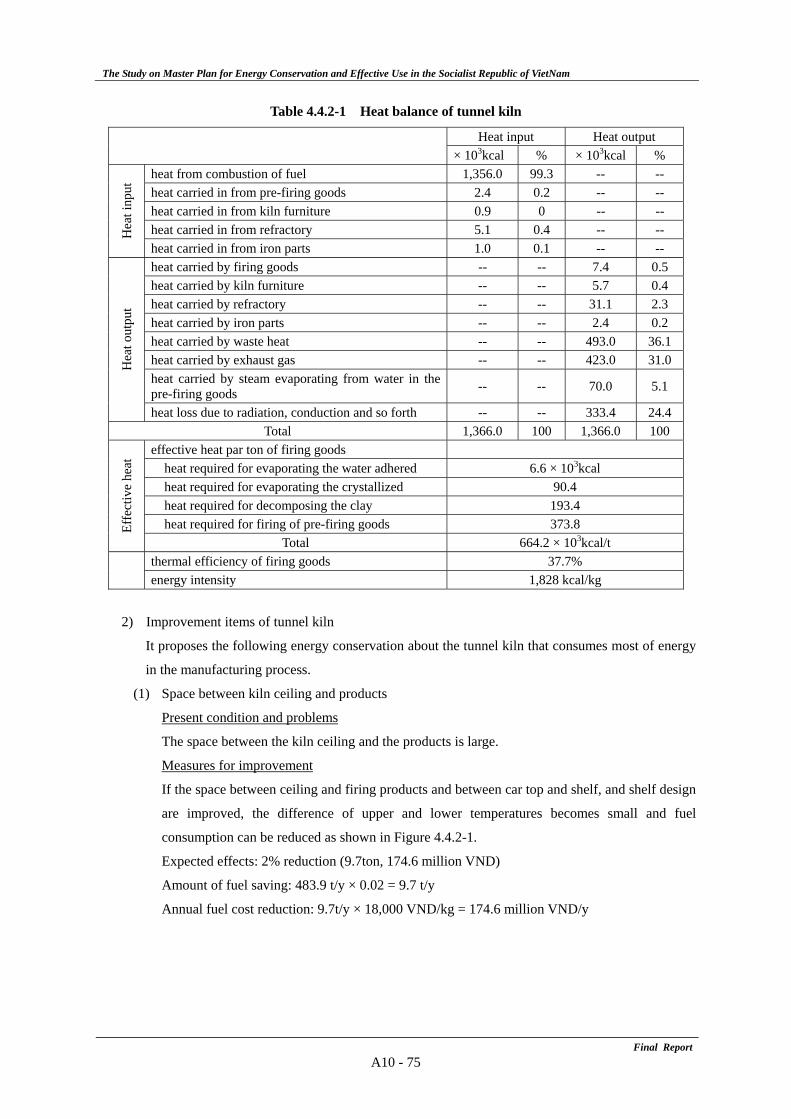
The Study on Master Plan for Energy Conservation and Effective Use in the Socialist Republic of VietNam
Final ReportA10 - 75
Table 4.4.2-1 Heat balance of tunnel kiln
Heat input Heat output
× 103kcal % × 103kcal % heat from combustion of fuel 1,356.0 99.3 -- -- heat carried in from pre-firing goods 2.4 0.2 -- -- heat carried in from kiln furniture 0.9 0 -- -- heat carried in from refractory 5.1 0.4 -- -- H
eat i
nput
heat carried in from iron parts 1.0 0.1 -- -- heat carried by firing goods -- -- 7.4 0.5 heat carried by kiln furniture -- -- 5.7 0.4 heat carried by refractory -- -- 31.1 2.3 heat carried by iron parts -- -- 2.4 0.2 heat carried by waste heat -- -- 493.0 36.1heat carried by exhaust gas -- -- 423.0 31.0heat carried by steam evaporating from water in thepre-firing goods -- -- 70.0 5.1
Hea
t out
put
heat loss due to radiation, conduction and so forth -- -- 333.4 24.4Total 1,366.0 100 1,366.0 100
effective heat par ton of firing goods heat required for evaporating the water adhered 6.6 × 10³kcal heat required for evaporating the crystallized 90.4 heat required for decomposing the clay 193.4 heat required for firing of pre-firing goods 373.8 Ef
fect
ive
heat
Total 664.2 × 10³kcal/t thermal efficiency of firing goods 37.7%
energy intensity 1,828 kcal/kg
2) Improvement items of tunnel kiln
It proposes the following energy conservation about the tunnel kiln that consumes most of energy
in the manufacturing process.
(1) Space between kiln ceiling and products
Present condition and problems
The space between the kiln ceiling and the products is large.
Measures for improvement
If the space between ceiling and firing products and between car top and shelf, and shelf design
are improved, the difference of upper and lower temperatures becomes small and fuel
consumption can be reduced as shown in Figure 4.4.2-1.
Expected effects: 2% reduction (9.7ton, 174.6 million VND)
Amount of fuel saving: 483.9 t/y × 0.02 = 9.7 t/y
Annual fuel cost reduction: 9.7t/y × 18,000 VND/kg = 174.6 million VND/y
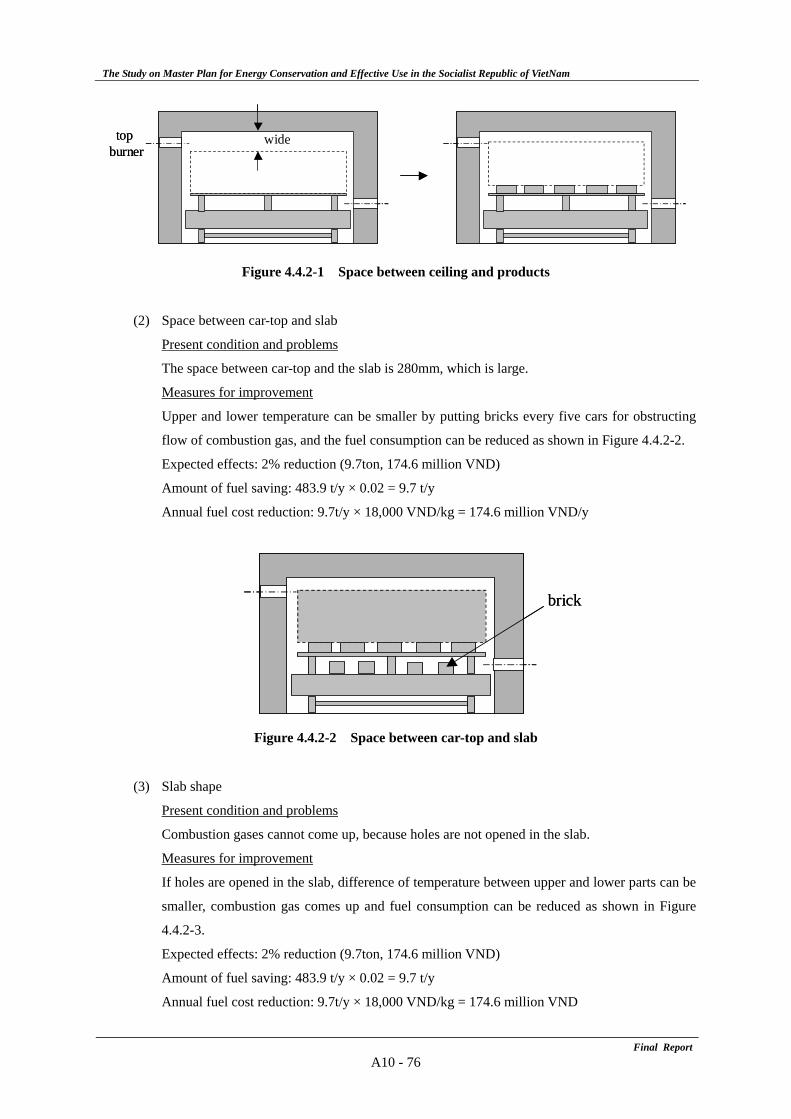
The Study on Master Plan for Energy Conservation and Effective Use in the Socialist Republic of VietNam
Final ReportA10 - 76
Figure 4.4.2-1 Space between ceiling and products
(2) Space between car-top and slab
Present condition and problems
The space between car-top and the slab is 280mm, which is large.
Measures for improvement
Upper and lower temperature can be smaller by putting bricks every five cars for obstructing
flow of combustion gas, and the fuel consumption can be reduced as shown in Figure 4.4.2-2.
Expected effects: 2% reduction (9.7ton, 174.6 million VND)
Amount of fuel saving: 483.9 t/y × 0.02 = 9.7 t/y
Annual fuel cost reduction: 9.7t/y × 18,000 VND/kg = 174.6 million VND/y
Figure 4.4.2-2 Space between car-top and slab
(3) Slab shape
Present condition and problems
Combustion gases cannot come up, because holes are not opened in the slab.
Measures for improvement
If holes are opened in the slab, difference of temperature between upper and lower parts can be
smaller, combustion gas comes up and fuel consumption can be reduced as shown in Figure
4.4.2-3.
Expected effects: 2% reduction (9.7ton, 174.6 million VND)
Amount of fuel saving: 483.9 t/y × 0.02 = 9.7 t/y
Annual fuel cost reduction: 9.7t/y × 18,000 VND/kg = 174.6 million VND
widetop burner
widetop burner
brickbrick
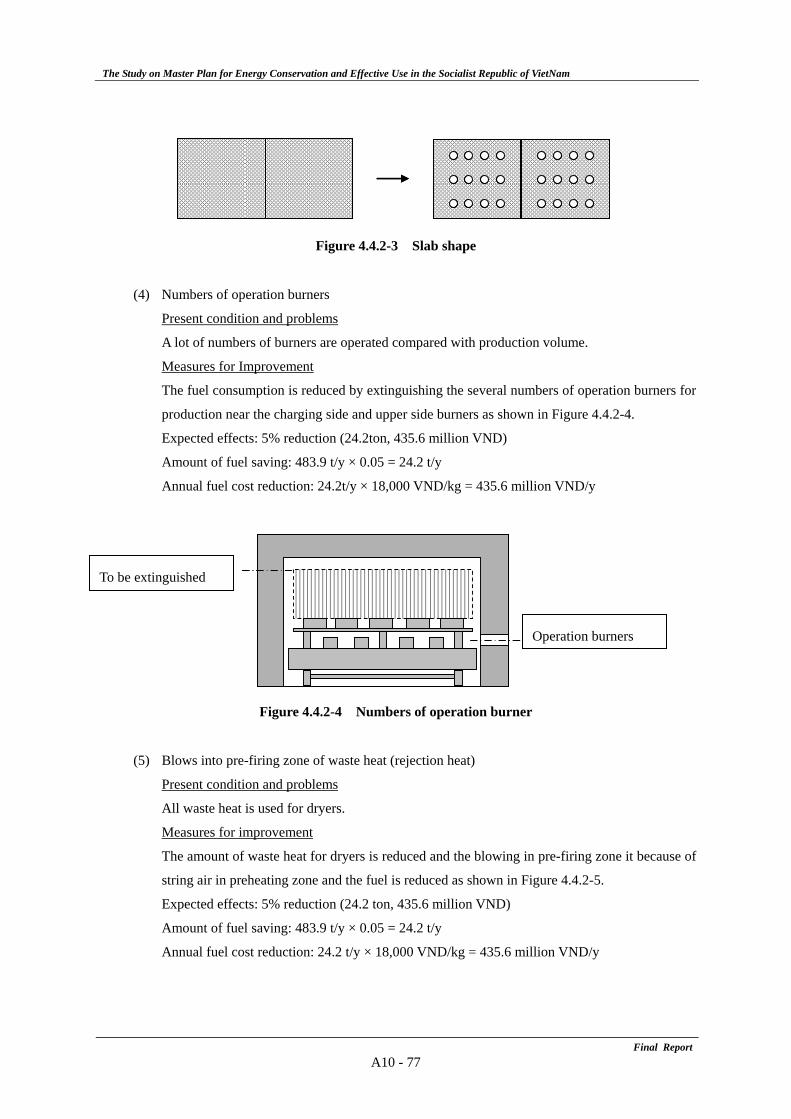
The Study on Master Plan for Energy Conservation and Effective Use in the Socialist Republic of VietNam
Final ReportA10 - 77
Figure 4.4.2-3 Slab shape
(4) Numbers of operation burners
Present condition and problems
A lot of numbers of burners are operated compared with production volume.
Measures for Improvement
The fuel consumption is reduced by extinguishing the several numbers of operation burners for
production near the charging side and upper side burners as shown in Figure 4.4.2-4.
Expected effects: 5% reduction (24.2ton, 435.6 million VND)
Amount of fuel saving: 483.9 t/y × 0.05 = 24.2 t/y
Annual fuel cost reduction: 24.2t/y × 18,000 VND/kg = 435.6 million VND/y
Figure 4.4.2-4 Numbers of operation burner
(5) Blows into pre-firing zone of waste heat (rejection heat)
Present condition and problems
All waste heat is used for dryers.
Measures for improvement
The amount of waste heat for dryers is reduced and the blowing in pre-firing zone it because of
string air in preheating zone and the fuel is reduced as shown in Figure 4.4.2-5.
Expected effects: 5% reduction (24.2 ton, 435.6 million VND)
Amount of fuel saving: 483.9 t/y × 0.05 = 24.2 t/y
Annual fuel cost reduction: 24.2 t/y × 18,000 VND/kg = 435.6 million VND/y
To be extinguished
Operation burners
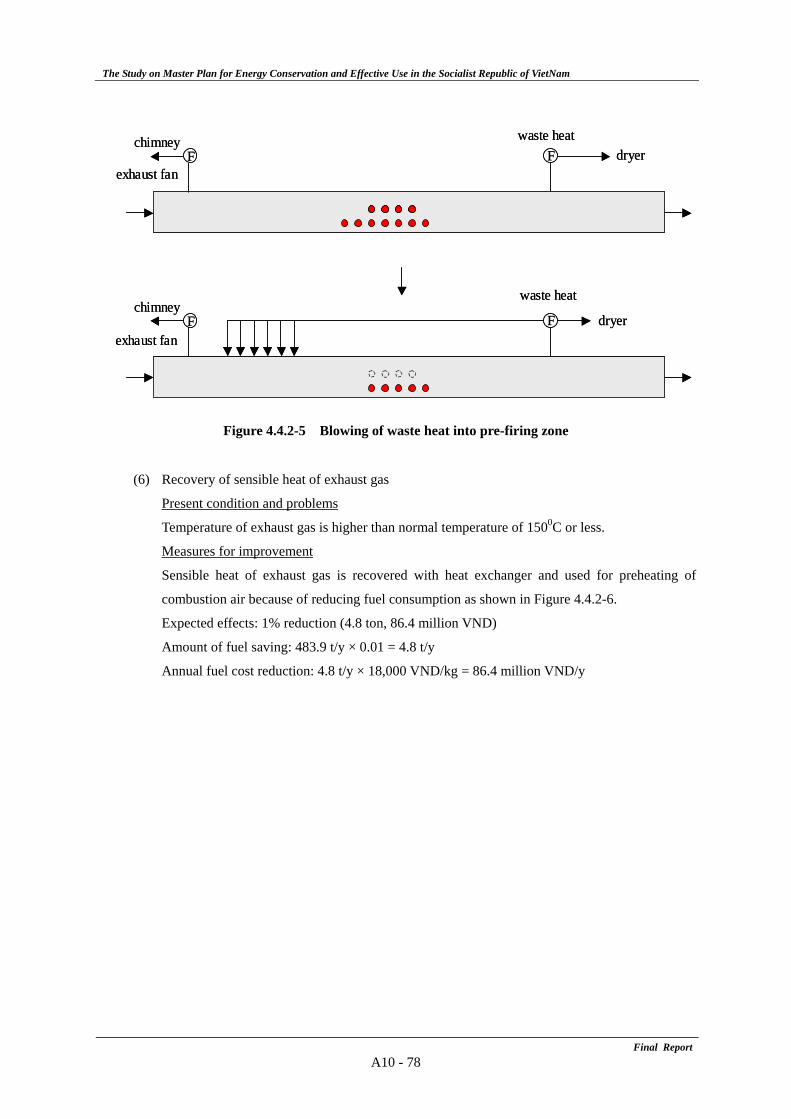
The Study on Master Plan for Energy Conservation and Effective Use in the Socialist Republic of VietNam
Final ReportA10 - 78
Figure 4.4.2-5 Blowing of waste heat into pre-firing zone
(6) Recovery of sensible heat of exhaust gas
Present condition and problems
Temperature of exhaust gas is higher than normal temperature of 1500C or less.
Measures for improvement
Sensible heat of exhaust gas is recovered with heat exchanger and used for preheating of
combustion air because of reducing fuel consumption as shown in Figure 4.4.2-6.
Expected effects: 1% reduction (4.8 ton, 86.4 million VND)
Amount of fuel saving: 483.9 t/y × 0.01 = 4.8 t/y
Annual fuel cost reduction: 4.8 t/y × 18,000 VND/kg = 86.4 million VND/y
FFchimney
exhaust fan
waste heatdryer
FFchimney
exhaust fan
waste heat
dryer
FFchimney
exhaust fan
waste heatdryer
FFchimney
exhaust fan
waste heat
dryer
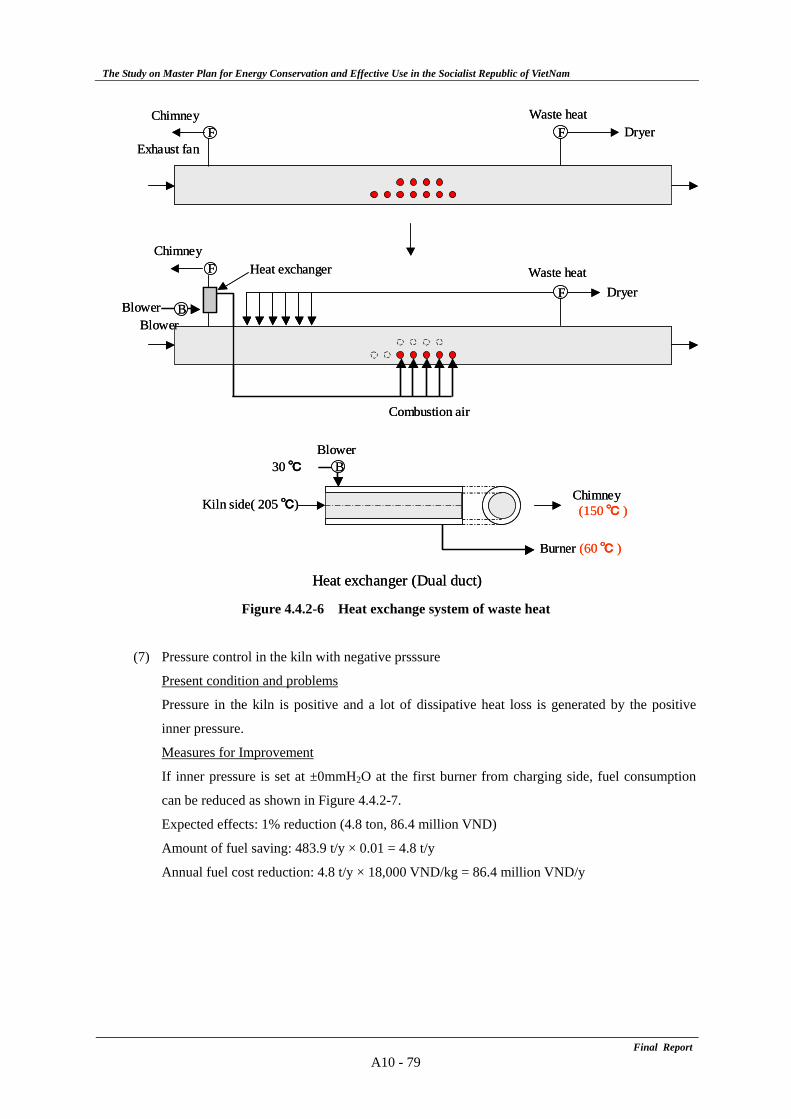
The Study on Master Plan for Energy Conservation and Effective Use in the Socialist Republic of VietNam
Final ReportA10 - 79
Figure 4.4.2-6 Heat exchange system of waste heat
(7) Pressure control in the kiln with negative prsssure
Present condition and problems
Pressure in the kiln is positive and a lot of dissipative heat loss is generated by the positive
inner pressure.
Measures for Improvement
If inner pressure is set at ±0mmH2O at the first burner from charging side, fuel consumption
can be reduced as shown in Figure 4.4.2-7.
Expected effects: 1% reduction (4.8 ton, 86.4 million VND)
Amount of fuel saving: 483.9 t/y × 0.01 = 4.8 t/y
Annual fuel cost reduction: 4.8 t/y × 18,000 VND/kg = 86.4 million VND/y
FF
F
F
B
Kiln side( 205 ℃)
B
Chimney (150 ℃ )
Burner (60 ℃ )
Heat exchanger (Dual duct)
30 ℃
Combustion air
Chimney
Chimney
Exhaust fan
Blower
Waste heat
Waste heatDryer
Dryer
Blower
Blower
Heat exchanger
FF
F
F
B
Kiln side( 205 ℃)
B
Chimney (150 ℃ )
Burner (60 ℃ )
Heat exchanger (Dual duct)
30 ℃
Combustion air
Chimney
Chimney
Exhaust fan
Blower
Waste heat
Waste heatDryer
Dryer
Blower
Blower
Heat exchanger
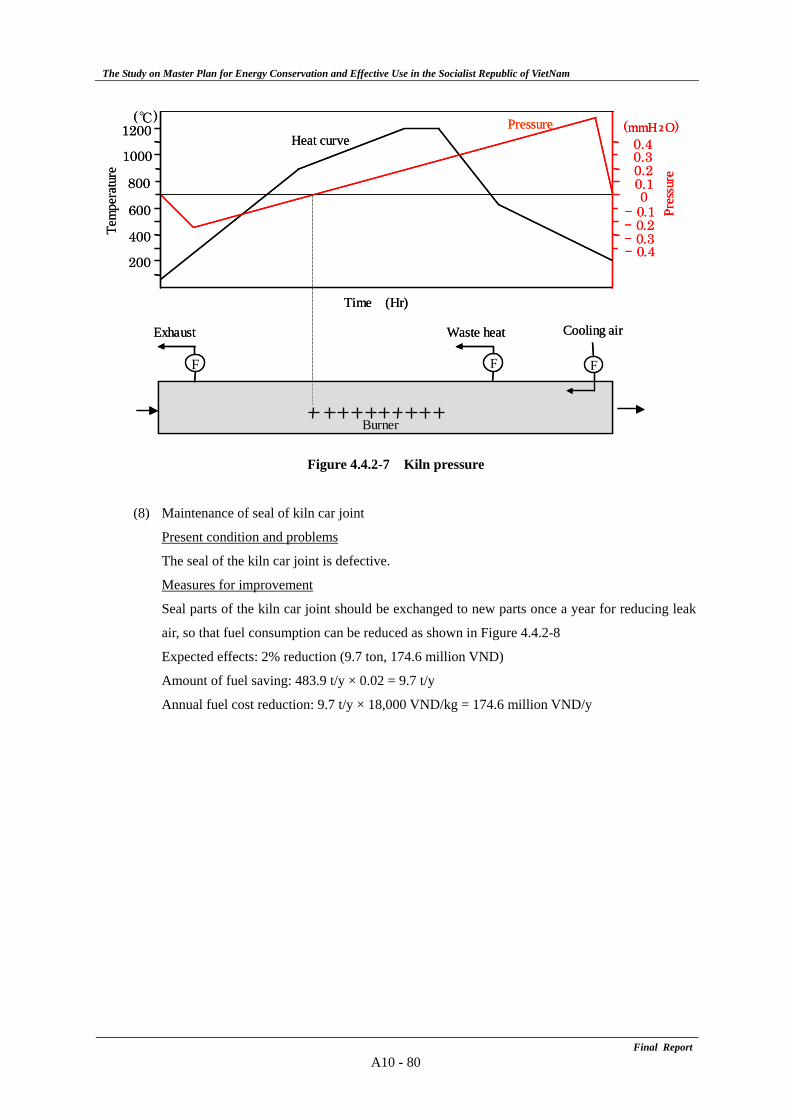
The Study on Master Plan for Energy Conservation and Effective Use in the Socialist Republic of VietNam
Final ReportA10 - 80
Figure 4.4.2-7 Kiln pressure
(8) Maintenance of seal of kiln car joint
Present condition and problems
The seal of the kiln car joint is defective.
Measures for improvement
Seal parts of the kiln car joint should be exchanged to new parts once a year for reducing leak
air, so that fuel consumption can be reduced as shown in Figure 4.4.2-8
Expected effects: 2% reduction (9.7 ton, 174.6 million VND)
Amount of fuel saving: 483.9 t/y × 0.02 = 9.7 t/y
Annual fuel cost reduction: 9.7 t/y × 18,000 VND/kg = 174.6 million VND/y
F F F
Exhaust Waste heat Cooling air
200
600
800
1000
1200( ℃)
Time (Hr)
- 0.4- 0.3- 0.2- 0.1
00.10.20.30.4
Pres
sure
(mmH 2 O)
400Tem
pera
ture
Burner
PressureHeat curve
F F F
Exhaust Waste heat Cooling air
200
600
800
1000
1200( ℃)
Time (Hr)
- 0.4- 0.3- 0.2- 0.1
00.10.20.30.4
Pres
sure
(mmH 2 O)
400Tem
pera
ture
Burner
PressureHeat curve
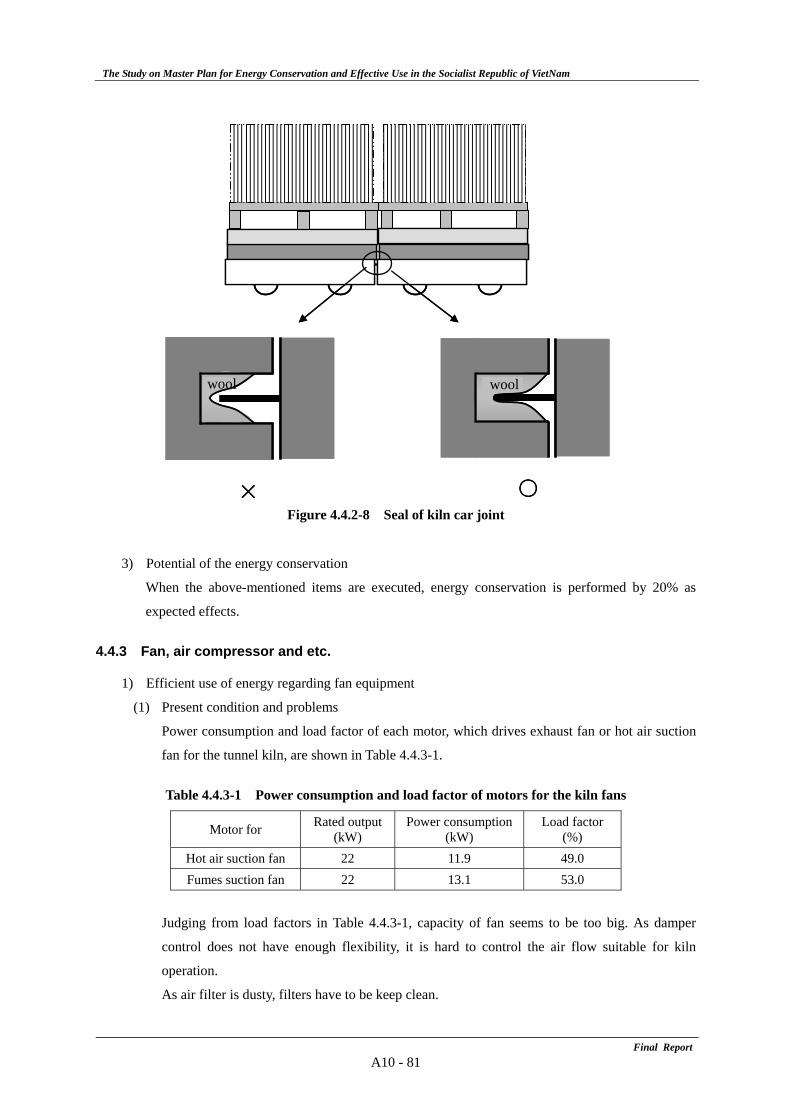
The Study on Master Plan for Energy Conservation and Effective Use in the Socialist Republic of VietNam
Final ReportA10 - 81
Figure 4.4.2-8 Seal of kiln car joint
3) Potential of the energy conservation
When the above-mentioned items are executed, energy conservation is performed by 20% as
expected effects.
4.4.3 Fan, air compressor and etc.
1) Efficient use of energy regarding fan equipment
(1) Present condition and problems
Power consumption and load factor of each motor, which drives exhaust fan or hot air suction
fan for the tunnel kiln, are shown in Table 4.4.3-1.
Table 4.4.3-1 Power consumption and load factor of motors for the kiln fans
Motor for Rated output (kW)
Power consumption(kW)
Load factor (%)
Hot air suction fan 22 11.9 49.0 Fumes suction fan 22 13.1 53.0
Judging from load factors in Table 4.4.3-1, capacity of fan seems to be too big. As damper
control does not have enough flexibility, it is hard to control the air flow suitable for kiln
operation.
As air filter is dusty, filters have to be keep clean.
○×
woolwool
○×
woolwool
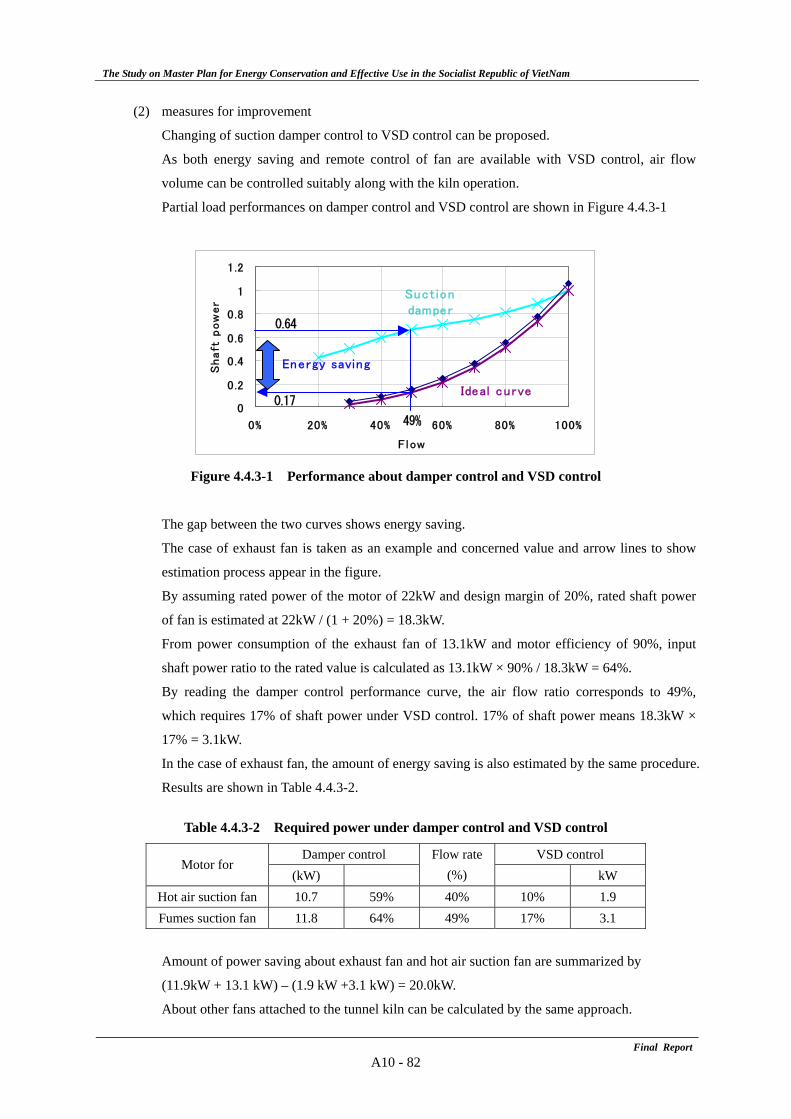
The Study on Master Plan for Energy Conservation and Effective Use in the Socialist Republic of VietNam
Final ReportA10 - 82
(2) measures for improvement
Changing of suction damper control to VSD control can be proposed.
As both energy saving and remote control of fan are available with VSD control, air flow
volume can be controlled suitably along with the kiln operation.
Partial load performances on damper control and VSD control are shown in Figure 4.4.3-1
Figure 4.4.3-1 Performance about damper control and VSD control
The gap between the two curves shows energy saving.
The case of exhaust fan is taken as an example and concerned value and arrow lines to show
estimation process appear in the figure.
By assuming rated power of the motor of 22kW and design margin of 20%, rated shaft power
of fan is estimated at 22kW / (1 + 20%) = 18.3kW.
From power consumption of the exhaust fan of 13.1kW and motor efficiency of 90%, input
shaft power ratio to the rated value is calculated as 13.1kW × 90% / 18.3kW = 64%.
By reading the damper control performance curve, the air flow ratio corresponds to 49%,
which requires 17% of shaft power under VSD control. 17% of shaft power means 18.3kW ×
17% = 3.1kW.
In the case of exhaust fan, the amount of energy saving is also estimated by the same procedure.
Results are shown in Table 4.4.3-2.
Table 4.4.3-2 Required power under damper control and VSD control
Damper control VSD control Motor for
(kW) Flow rate
(%) kW Hot air suction fan 10.7 59% 40% 10% 1.9 Fumes suction fan 11.8 64% 49% 17% 3.1
Amount of power saving about exhaust fan and hot air suction fan are summarized by
(11.9kW + 13.1 kW) – (1.9 kW +3.1 kW) = 20.0kW.
About other fans attached to the tunnel kiln can be calculated by the same approach.
0
0.2
0.4
0.6
0.8
1
1.2
0% 20% 40% 60% 80% 100%
F low
Shaft
pow
er
Energy saving
Suct iondamper
Ideal curve
49%
0.64
0.17
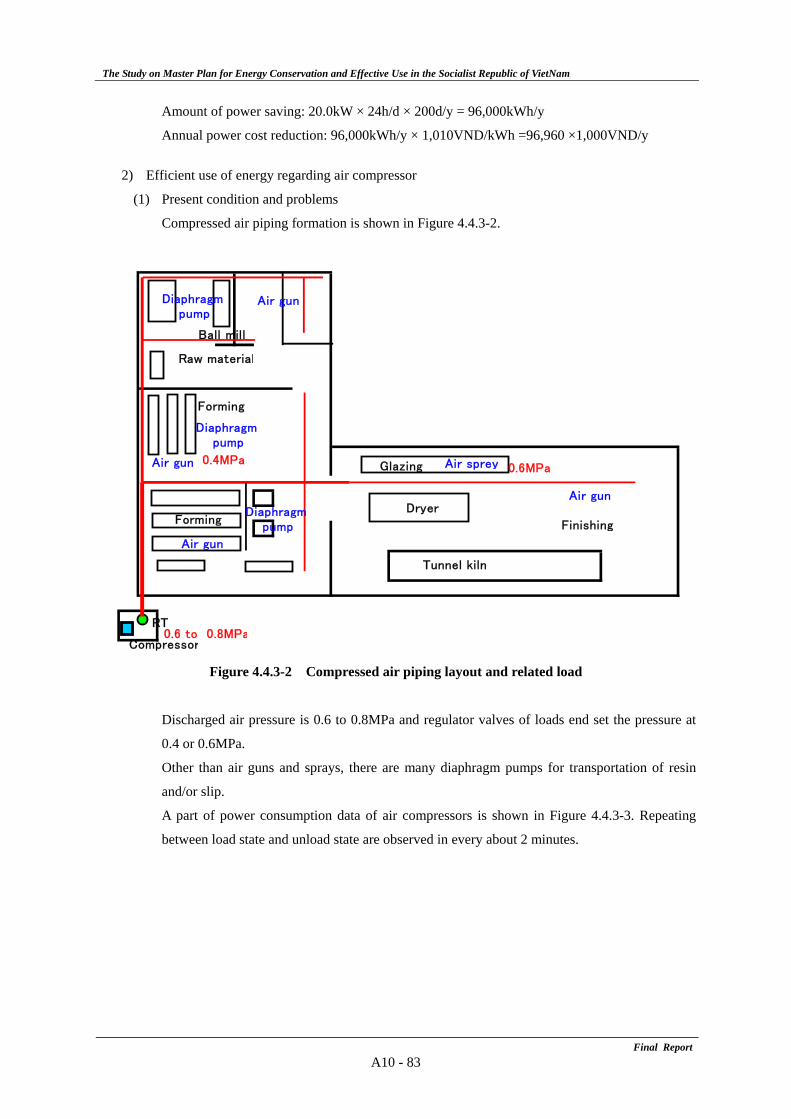
The Study on Master Plan for Energy Conservation and Effective Use in the Socialist Republic of VietNam
Final ReportA10 - 83
Amount of power saving: 20.0kW × 24h/d × 200d/y = 96,000kWh/y
Annual power cost reduction: 96,000kWh/y × 1,010VND/kWh =96,960 ×1,000VND/y
2) Efficient use of energy regarding air compressor
(1) Present condition and problems
Compressed air piping formation is shown in Figure 4.4.3-2.
Figure 4.4.3-2 Compressed air piping layout and related load
Discharged air pressure is 0.6 to 0.8MPa and regulator valves of loads end set the pressure at
0.4 or 0.6MPa.
Other than air guns and sprays, there are many diaphragm pumps for transportation of resin
and/or slip.
A part of power consumption data of air compressors is shown in Figure 4.4.3-3. Repeating
between load state and unload state are observed in every about 2 minutes.
Compressor
RT
Tunnel kiln
Dryer
Glazing
Ball mill
Diaphragm pump
0.6 to 0.8MPa
0.6MPa0.4MPa
Forming
Forming
Raw material
Air sprey
Diaphragm pump
Diaphragm pump
Air gun
Finishing
Air gun
Air gun
Air gun
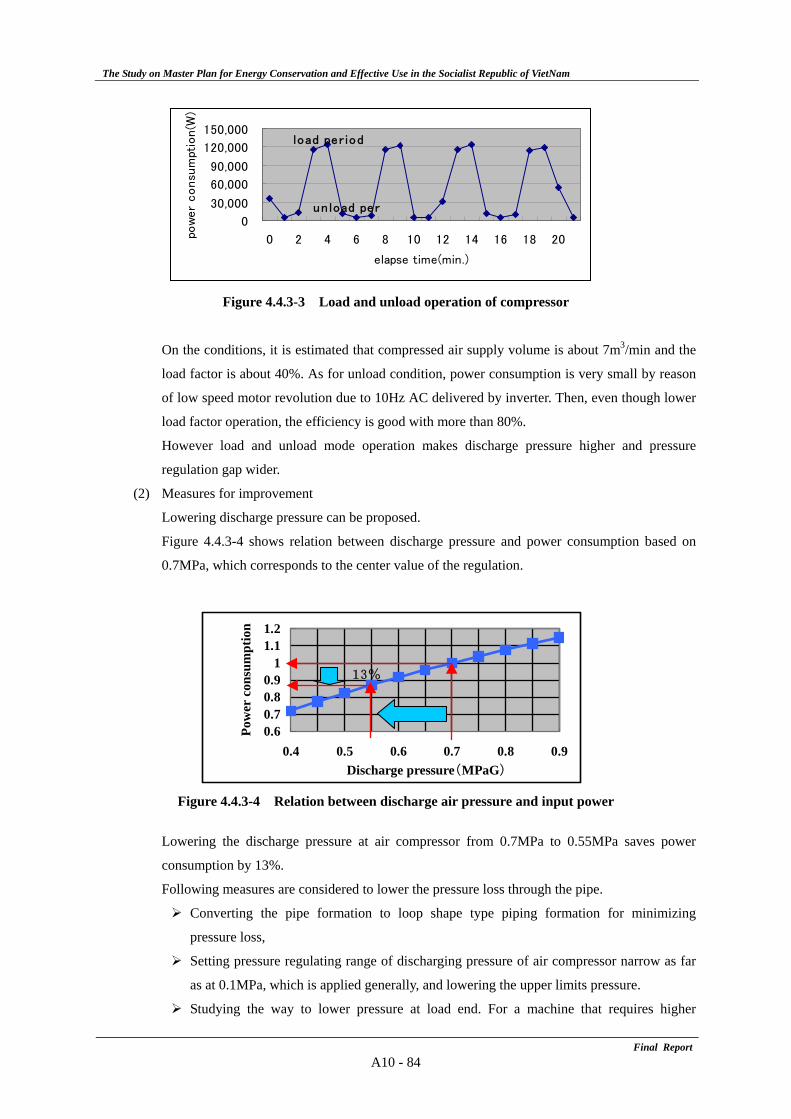
The Study on Master Plan for Energy Conservation and Effective Use in the Socialist Republic of VietNam
Final ReportA10 - 84
Figure 4.4.3-3 Load and unload operation of compressor
On the conditions, it is estimated that compressed air supply volume is about 7m3/min and the
load factor is about 40%. As for unload condition, power consumption is very small by reason
of low speed motor revolution due to 10Hz AC delivered by inverter. Then, even though lower
load factor operation, the efficiency is good with more than 80%.
However load and unload mode operation makes discharge pressure higher and pressure
regulation gap wider.
(2) Measures for improvement
Lowering discharge pressure can be proposed.
Figure 4.4.3-4 shows relation between discharge pressure and power consumption based on
0.7MPa, which corresponds to the center value of the regulation.
Figure 4.4.3-4 Relation between discharge air pressure and input power
Lowering the discharge pressure at air compressor from 0.7MPa to 0.55MPa saves power
consumption by 13%.
Following measures are considered to lower the pressure loss through the pipe.
Converting the pipe formation to loop shape type piping formation for minimizing
pressure loss,
Setting pressure regulating range of discharging pressure of air compressor narrow as far
as at 0.1MPa, which is applied generally, and lowering the upper limits pressure.
Studying the way to lower pressure at load end. For a machine that requires higher
0
30,000
60,000
90,000
120,000
150,000
0 2 4 6 8 10 12 14 16 18 20
elapse time(min.)
pow
er
consu
mpt
ion(W
)
l oad per iod
un load per
0.60.70.80.9
11.11.2
0.4 0.5 0.6 0.7 0.8 0.9Discharge pressure(MPaG)
Pow
er c
onsu
mpt
ion
13%
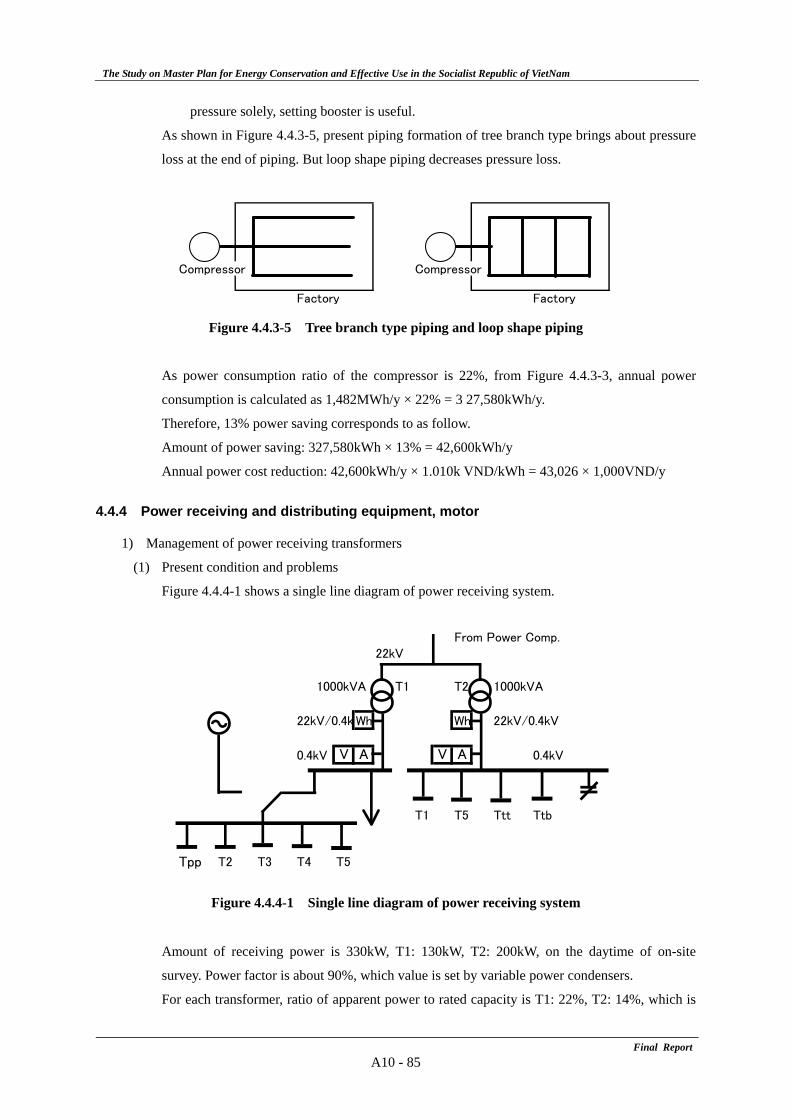
The Study on Master Plan for Energy Conservation and Effective Use in the Socialist Republic of VietNam
Final ReportA10 - 85
pressure solely, setting booster is useful.
As shown in Figure 4.4.3-5, present piping formation of tree branch type brings about pressure
loss at the end of piping. But loop shape piping decreases pressure loss.
Figure 4.4.3-5 Tree branch type piping and loop shape piping
As power consumption ratio of the compressor is 22%, from Figure 4.4.3-3, annual power
consumption is calculated as 1,482MWh/y × 22% = 3 27,580kWh/y.
Therefore, 13% power saving corresponds to as follow.
Amount of power saving: 327,580kWh × 13% = 42,600kWh/y
Annual power cost reduction: 42,600kWh/y × 1.010k VND/kWh = 43,026 × 1,000VND/y
4.4.4 Power receiving and distributing equipment, motor
1) Management of power receiving transformers
(1) Present condition and problems
Figure 4.4.4-1 shows a single line diagram of power receiving system.
Figure 4.4.4-1 Single line diagram of power receiving system
Amount of receiving power is 330kW, T1: 130kW, T2: 200kW, on the daytime of on-site
survey. Power factor is about 90%, which value is set by variable power condensers.
For each transformer, ratio of apparent power to rated capacity is T1: 22%, T2: 14%, which is
From Power Comp.22kV
1000kVA T1 T2 1000kVA
22kV/0.4k Wh Wh 22kV/0.4kV
0.4kV V A V A 0.4kV
T1 T5 Ttt Ttb
Tpp T2 T3 T4 T5
Compressor Compressor
Factory Factory
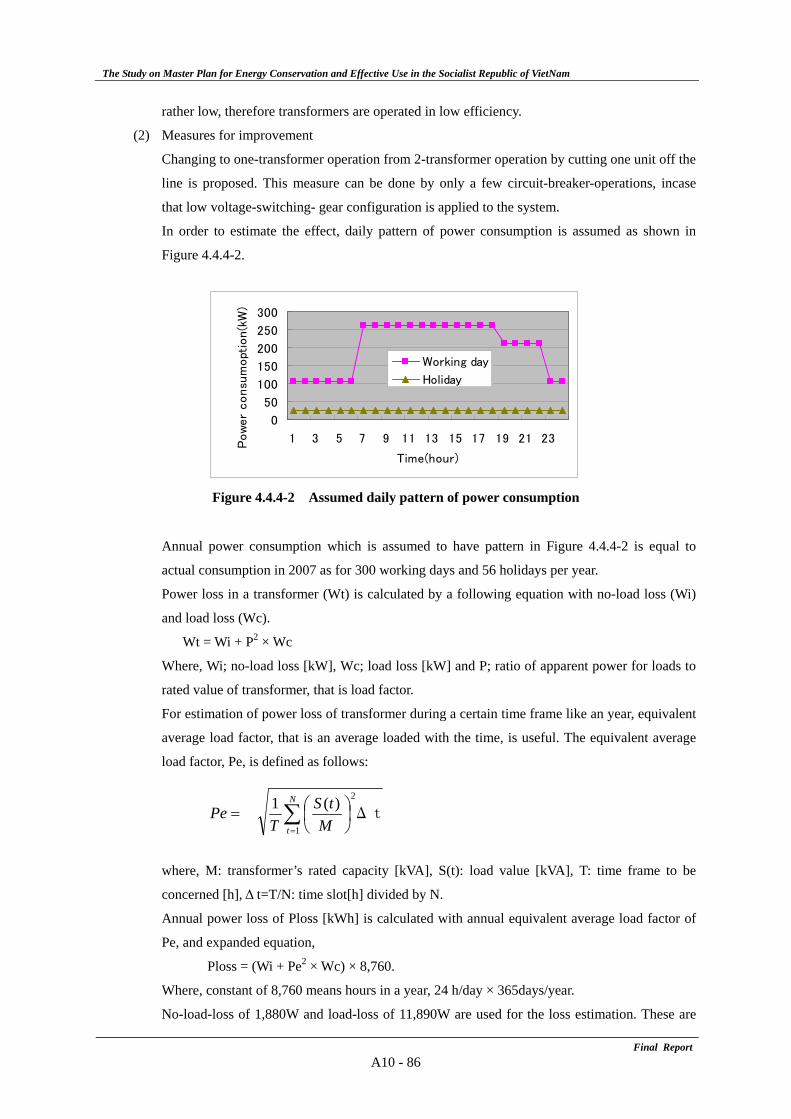
The Study on Master Plan for Energy Conservation and Effective Use in the Socialist Republic of VietNam
Final ReportA10 - 86
rather low, therefore transformers are operated in low efficiency.
(2) Measures for improvement
Changing to one-transformer operation from 2-transformer operation by cutting one unit off the
line is proposed. This measure can be done by only a few circuit-breaker-operations, incase
that low voltage-switching- gear configuration is applied to the system.
In order to estimate the effect, daily pattern of power consumption is assumed as shown in
Figure 4.4.4-2.
Figure 4.4.4-2 Assumed daily pattern of power consumption
Annual power consumption which is assumed to have pattern in Figure 4.4.4-2 is equal to
actual consumption in 2007 as for 300 working days and 56 holidays per year.
Power loss in a transformer (Wt) is calculated by a following equation with no-load loss (Wi)
and load loss (Wc).
Wt = Wi + P2 × Wc
Where, Wi; no-load loss [kW], Wc; load loss [kW] and P; ratio of apparent power for loads to
rated value of transformer, that is load factor.
For estimation of power loss of transformer during a certain time frame like an year, equivalent
average load factor, that is an average loaded with the time, is useful. The equivalent average
load factor, Pe, is defined as follows:
=Pe Δt2
1
)(1 ∑=
⎟⎠⎞
⎜⎝⎛N
t MtS
T
where, M: transformer’s rated capacity [kVA], S(t): load value [kVA], T: time frame to be
concerned [h], Δ t=T/N: time slot[h] divided by N.
Annual power loss of Ploss [kWh] is calculated with annual equivalent average load factor of
Pe, and expanded equation,
Ploss = (Wi + Pe2 × Wc) × 8,760.
Where, constant of 8,760 means hours in a year, 24 h/day × 365days/year.
No-load-loss of 1,880W and load-loss of 11,890W are used for the loss estimation. These are
0
50
100
150
200
250
300
1 3 5 7 9 11 13 15 17 19 21 23
Time(hour)
Pow
er
consu
mopt
ion(k
W)
Working day
Holiday
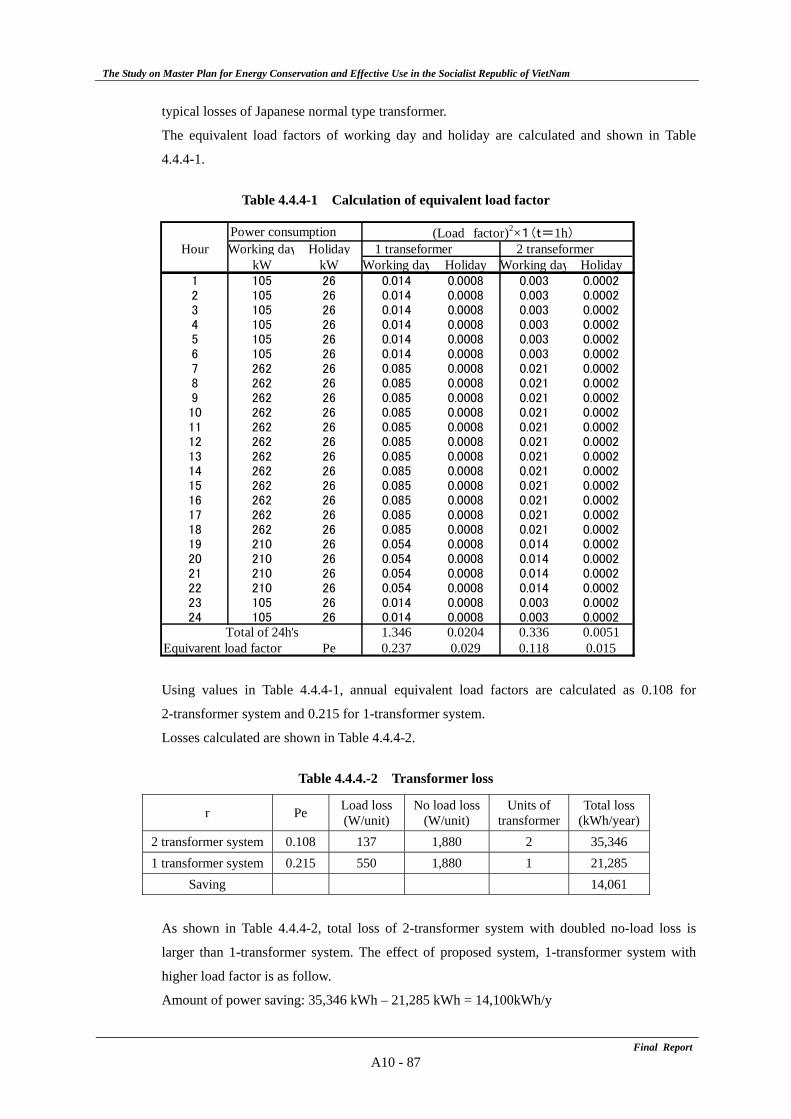
The Study on Master Plan for Energy Conservation and Effective Use in the Socialist Republic of VietNam
Final ReportA10 - 87
typical losses of Japanese normal type transformer.
The equivalent load factors of working day and holiday are calculated and shown in Table
4.4.4-1.
Table 4.4.4-1 Calculation of equivalent load factor
Using values in Table 4.4.4-1, annual equivalent load factors are calculated as 0.108 for
2-transformer system and 0.215 for 1-transformer system.
Losses calculated are shown in Table 4.4.4-2.
Table 4.4.4.-2 Transformer loss
r Pe Load loss(W/unit)
No load loss(W/unit)
Units of transformer
Total loss (kWh/year)
2 transformer system 0.108 137 1,880 2 35,346 1 transformer system 0.215 550 1,880 1 21,285
Saving 14,061
As shown in Table 4.4.4-2, total loss of 2-transformer system with doubled no-load loss is
larger than 1-transformer system. The effect of proposed system, 1-transformer system with
higher load factor is as follow.
Amount of power saving: 35,346 kWh – 21,285 kWh = 14,100kWh/y
Power consumption (Load factor)2×1(t=1h)Hour Working day Holiday 1 transeformer 2 transeformer
kW kW Working day Holiday Working day Holiday1 105 26 0.014 0.0008 0.003 0.00022 105 26 0.014 0.0008 0.003 0.00023 105 26 0.014 0.0008 0.003 0.00024 105 26 0.014 0.0008 0.003 0.00025 105 26 0.014 0.0008 0.003 0.00026 105 26 0.014 0.0008 0.003 0.00027 262 26 0.085 0.0008 0.021 0.00028 262 26 0.085 0.0008 0.021 0.00029 262 26 0.085 0.0008 0.021 0.000210 262 26 0.085 0.0008 0.021 0.000211 262 26 0.085 0.0008 0.021 0.000212 262 26 0.085 0.0008 0.021 0.000213 262 26 0.085 0.0008 0.021 0.000214 262 26 0.085 0.0008 0.021 0.000215 262 26 0.085 0.0008 0.021 0.000216 262 26 0.085 0.0008 0.021 0.000217 262 26 0.085 0.0008 0.021 0.000218 262 26 0.085 0.0008 0.021 0.000219 210 26 0.054 0.0008 0.014 0.000220 210 26 0.054 0.0008 0.014 0.000221 210 26 0.054 0.0008 0.014 0.000222 210 26 0.054 0.0008 0.014 0.000223 105 26 0.014 0.0008 0.003 0.000224 105 26 0.014 0.0008 0.003 0.0002
Total of 24h's 1.346 0.0204 0.336 0.0051Equivarent load factor Pe 0.237 0.029 0.118 0.015
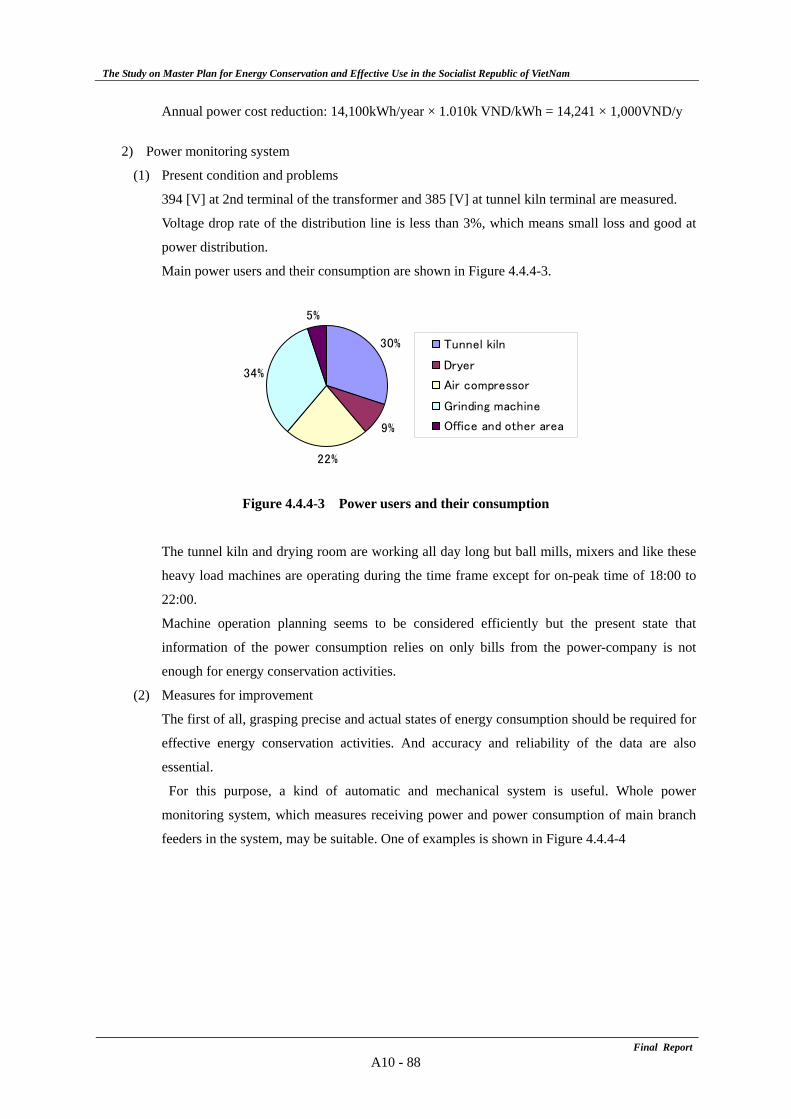
The Study on Master Plan for Energy Conservation and Effective Use in the Socialist Republic of VietNam
Final ReportA10 - 88
Annual power cost reduction: 14,100kWh/year × 1.010k VND/kWh = 14,241 × 1,000VND/y
2) Power monitoring system
(1) Present condition and problems
394 [V] at 2nd terminal of the transformer and 385 [V] at tunnel kiln terminal are measured.
Voltage drop rate of the distribution line is less than 3%, which means small loss and good at
power distribution.
Main power users and their consumption are shown in Figure 4.4.4-3.
Figure 4.4.4-3 Power users and their consumption
The tunnel kiln and drying room are working all day long but ball mills, mixers and like these
heavy load machines are operating during the time frame except for on-peak time of 18:00 to
22:00.
Machine operation planning seems to be considered efficiently but the present state that
information of the power consumption relies on only bills from the power-company is not
enough for energy conservation activities.
(2) Measures for improvement
The first of all, grasping precise and actual states of energy consumption should be required for
effective energy conservation activities. And accuracy and reliability of the data are also
essential.
For this purpose, a kind of automatic and mechanical system is useful. Whole power
monitoring system, which measures receiving power and power consumption of main branch
feeders in the system, may be suitable. One of examples is shown in Figure 4.4.4-4
30%
9%
22%
34%
5%
Tunnel kiln
Dryer
Air compressor
Grinding machine
Office and other area
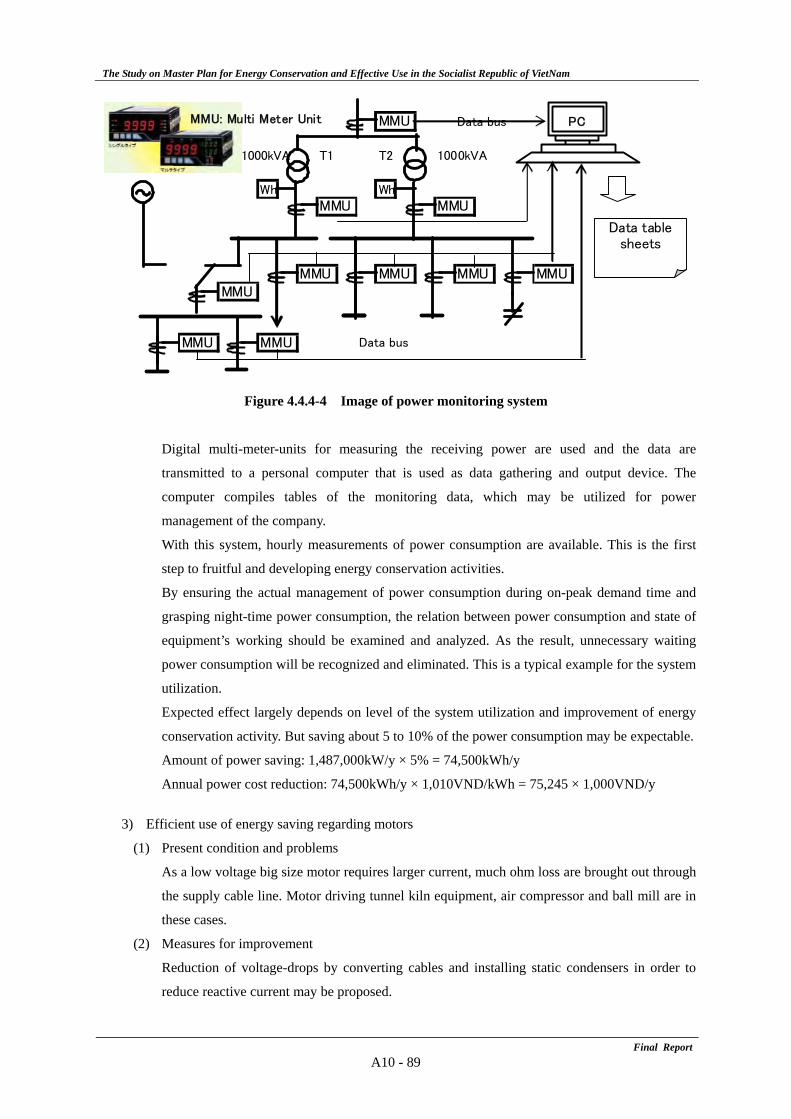
The Study on Master Plan for Energy Conservation and Effective Use in the Socialist Republic of VietNam
Final ReportA10 - 89
MMU Data bus
1000kVA T1 T2 1000kVA
Wh Wh
MMU MMU
MMU MMU MMU MMUMMU
MMU MMU Data bus
PC
Data tablesheets
MMU: Multi Meter Unit
Figure 4.4.4-4 Image of power monitoring system
Digital multi-meter-units for measuring the receiving power are used and the data are
transmitted to a personal computer that is used as data gathering and output device. The
computer compiles tables of the monitoring data, which may be utilized for power
management of the company.
With this system, hourly measurements of power consumption are available. This is the first
step to fruitful and developing energy conservation activities.
By ensuring the actual management of power consumption during on-peak demand time and
grasping night-time power consumption, the relation between power consumption and state of
equipment’s working should be examined and analyzed. As the result, unnecessary waiting
power consumption will be recognized and eliminated. This is a typical example for the system
utilization.
Expected effect largely depends on level of the system utilization and improvement of energy
conservation activity. But saving about 5 to 10% of the power consumption may be expectable.
Amount of power saving: 1,487,000kW/y × 5% = 74,500kWh/y
Annual power cost reduction: 74,500kWh/y × 1,010VND/kWh = 75,245 × 1,000VND/y
3) Efficient use of energy saving regarding motors
(1) Present condition and problems
As a low voltage big size motor requires larger current, much ohm loss are brought out through
the supply cable line. Motor driving tunnel kiln equipment, air compressor and ball mill are in
these cases.
(2) Measures for improvement
Reduction of voltage-drops by converting cables and installing static condensers in order to
reduce reactive current may be proposed.
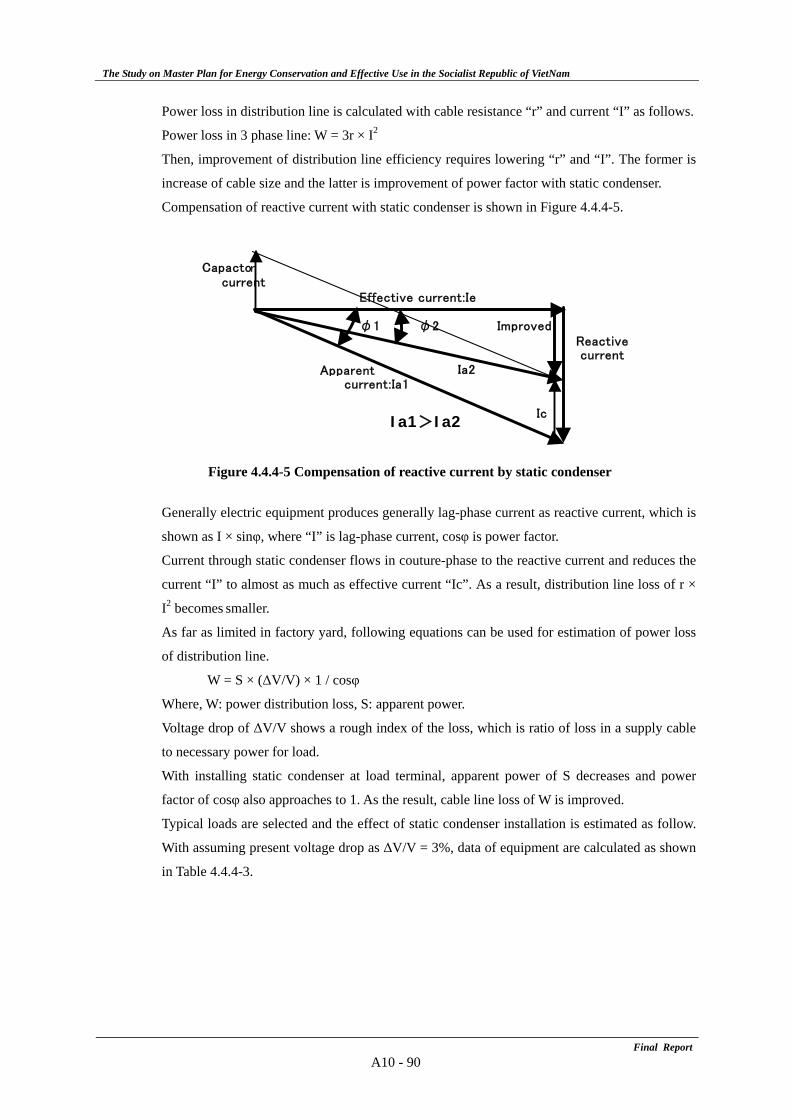
The Study on Master Plan for Energy Conservation and Effective Use in the Socialist Republic of VietNam
Final ReportA10 - 90
Power loss in distribution line is calculated with cable resistance “r” and current “I” as follows.
Power loss in 3 phase line: W = 3r × I2
Then, improvement of distribution line efficiency requires lowering “r” and “I”. The former is
increase of cable size and the latter is improvement of power factor with static condenser.
Compensation of reactive current with static condenser is shown in Figure 4.4.4-5.
Figure 4.4.4-5 Compensation of reactive current by static condenser
Generally electric equipment produces generally lag-phase current as reactive current, which is
shown as I × sinφ, where “I” is lag-phase current, cosφ is power factor.
Current through static condenser flows in couture-phase to the reactive current and reduces the
current “I” to almost as much as effective current “Ic”. As a result, distribution line loss of r ×
I2 becomes smaller.
As far as limited in factory yard, following equations can be used for estimation of power loss
of distribution line.
W = S × (ΔV/V) × 1 / cosφ
Where, W: power distribution loss, S: apparent power.
Voltage drop of ΔV/V shows a rough index of the loss, which is ratio of loss in a supply cable
to necessary power for load.
With installing static condenser at load terminal, apparent power of S decreases and power
factor of cosφ also approaches to 1. As the result, cable line loss of W is improved.
Typical loads are selected and the effect of static condenser installation is estimated as follow.
With assuming present voltage drop as ΔV/V = 3%, data of equipment are calculated as shown
in Table 4.4.4-3.
Capactorcurrent
Effective current:Ie
φ1 φ2 ImprovedReactive current
Apparent Ia2current:Ia1
IcIa1>Ia2
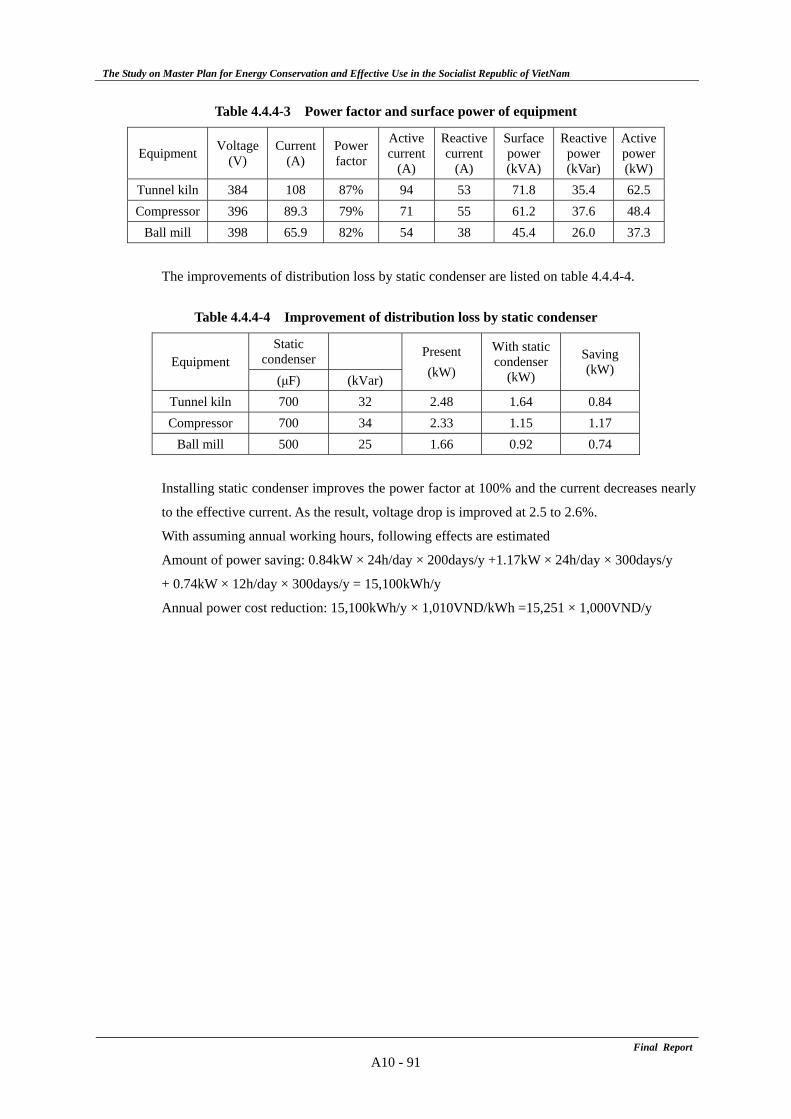
The Study on Master Plan for Energy Conservation and Effective Use in the Socialist Republic of VietNam
Final ReportA10 - 91
Table 4.4.4-3 Power factor and surface power of equipment
Equipment Voltage (V)
Current (A)
Power factor
Active current
(A)
Reactive current
(A)
Surface power (kVA)
Reactive power (kVar)
Active power(kW)
Tunnel kiln 384 108 87% 94 53 71.8 35.4 62.5 Compressor 396 89.3 79% 71 55 61.2 37.6 48.4
Ball mill 398 65.9 82% 54 38 45.4 26.0 37.3
The improvements of distribution loss by static condenser are listed on table 4.4.4-4.
Table 4.4.4-4 Improvement of distribution loss by static condenser
Static condenser
Equipment (μF) (kVar)
Present (kW)
With static condenser
(kW)
Saving (kW)
Tunnel kiln 700 32 2.48 1.64 0.84 Compressor 700 34 2.33 1.15 1.17
Ball mill 500 25 1.66 0.92 0.74
Installing static condenser improves the power factor at 100% and the current decreases nearly
to the effective current. As the result, voltage drop is improved at 2.5 to 2.6%.
With assuming annual working hours, following effects are estimated
Amount of power saving: 0.84kW × 24h/day × 200days/y +1.17kW × 24h/day × 300days/y
+ 0.74kW × 12h/day × 300days/y = 15,100kWh/y
Annual power cost reduction: 15,100kWh/y × 1,010VND/kWh =15,251 × 1,000VND/y
The Study on Master Plan for Energy Conservation and Effective Use in the Socialist Republic of VietNam
Final ReportA10 - 92
5. Textile Factory E
5.1 Introduction
1) Factory name: Textile Factory E
2) Location: Ho Chi Minh City
3) Description of business
(1) Sub-sector of industry: Textile industry of weaving, dyeing and sewing
(2) Main product: cloth, T-shirt and sport shirt
(3) Annual production: cloth: 1,400,000 m2/year, T-shirt: 250 ton/year, Shirt: 580 ton/year in 2007
(4) Export ratio: 50%, Export to Japan, EU and USA
(5) Number of employees: 420 persons
4) Person in charge of energy on-site survey: Deputy General Director
5) Outline of factory
This factory is a medium-scale textiles, dyeing and sewing factory, which began production in
1992 as a state-run enterprise, and it was privatized in January 2008. Since the surrounding area
has been urbanized, the factory is directed by the local government to move to the suburbs in two
years. An energy audit of this factory was carried out in December 2007 as a project of Ho Chi
Minh City.
5.2 Outline of energy on-site survey
1) Survey team member
JICA Study Team: Mr. Norio Fukushima, Mr. Wataru Ishikawa, Mr. Hisashi Amano
Institute of Energy: Mr. Hung, Mr. Hoang Anh
ENERTEAM: Mr. Hien, Mr. Linh
2) Survey period: November 6th to 7th and 13th, 2008
3) Surveyed equipment: heat medium boiler, steam piping, power receiving equipment, tenter
(drying and heat set), motor load, and illuminance of sewing shop
5.3 Results of energy on-site survey
1) Improvement proposal items and the expected effect after improvement measure implementation
are shown in Table 5.3-1
The EE&C potential in the present equipment is 13.7%
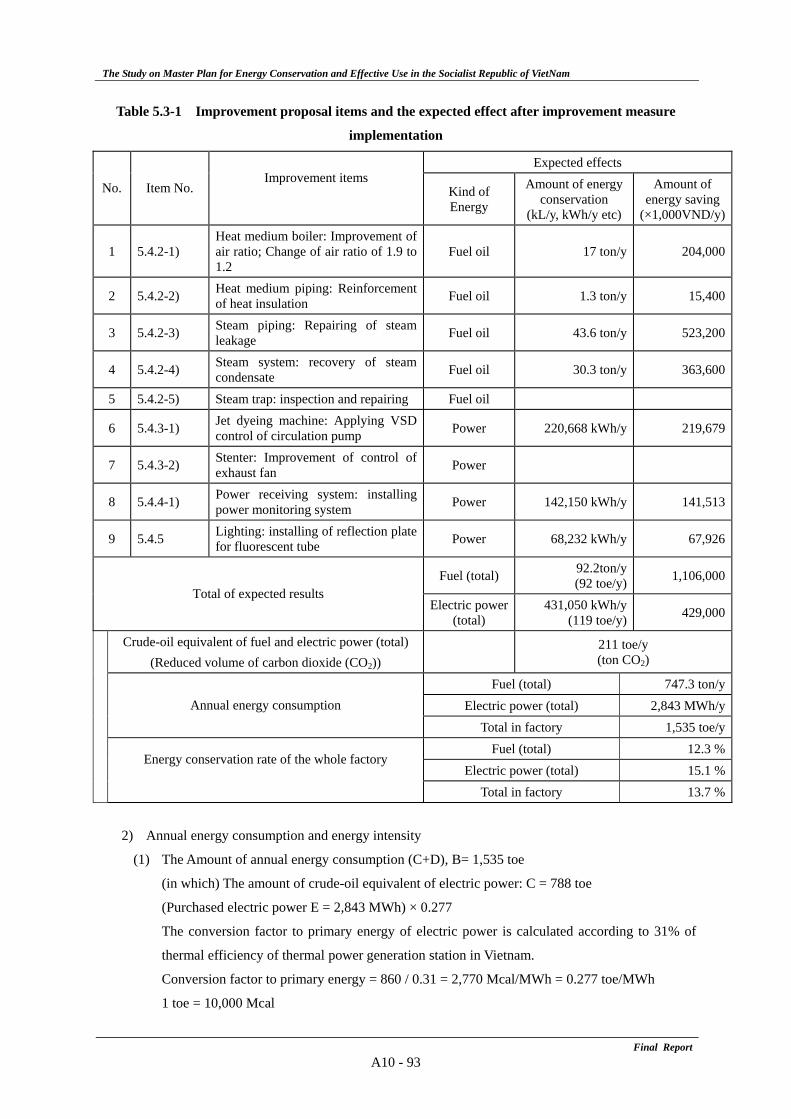
The Study on Master Plan for Energy Conservation and Effective Use in the Socialist Republic of VietNam
Final ReportA10 - 93
Table 5.3-1 Improvement proposal items and the expected effect after improvement measure
implementation
Expected effects
No. Item No. Improvement items
Kind of Energy
Amount of energy conservation
(kL/y, kWh/y etc)
Amount of energy saving
(×1,000VND/y)
1 5.4.2-1) Heat medium boiler: Improvement of air ratio; Change of air ratio of 1.9 to 1.2
Fuel oil 17 ton/y 204,000
2 5.4.2-2) Heat medium piping: Reinforcement of heat insulation Fuel oil 1.3 ton/y 15,400
3 5.4.2-3) Steam piping: Repairing of steam leakage Fuel oil 43.6 ton/y 523,200
4 5.4.2-4) Steam system: recovery of steam condensate Fuel oil 30.3 ton/y 363,600
5 5.4.2-5) Steam trap: inspection and repairing Fuel oil
6 5.4.3-1) Jet dyeing machine: Applying VSD control of circulation pump Power 220,668 kWh/y 219,679
7 5.4.3-2) Stenter: Improvement of control of exhaust fan Power
8 5.4.4-1) Power receiving system: installing power monitoring system Power 142,150 kWh/y 141,513
9 5.4.5 Lighting: installing of reflection plate for fluorescent tube Power 68,232 kWh/y 67,926
Fuel (total) 92.2ton/y (92 toe/y) 1,106,000
Total of expected results Electric power
(total) 431,050 kWh/y
(119 toe/y) 429,000
Crude-oil equivalent of fuel and electric power (total) (Reduced volume of carbon dioxide (CO2))
211 toe/y (ton CO2)
Fuel (total) 747.3 ton/yElectric power (total) 2,843 MWh/yAnnual energy consumption
Total in factory 1,535 toe/y
Fuel (total) 12.3 %
Energy conservation rate of the whole factory Electric power (total) 15.1 %
Total in factory 13.7 %
2) Annual energy consumption and energy intensity
(1) The Amount of annual energy consumption (C+D), B= 1,535 toe
(in which) The amount of crude-oil equivalent of electric power: C = 788 toe
(Purchased electric power E = 2,843 MWh) × 0.277
The conversion factor to primary energy of electric power is calculated according to 31% of
thermal efficiency of thermal power generation station in Vietnam.
Conversion factor to primary energy = 860 / 0.31 = 2,770 Mcal/MWh = 0.277 toe/MWh
1 toe = 10,000 Mcal
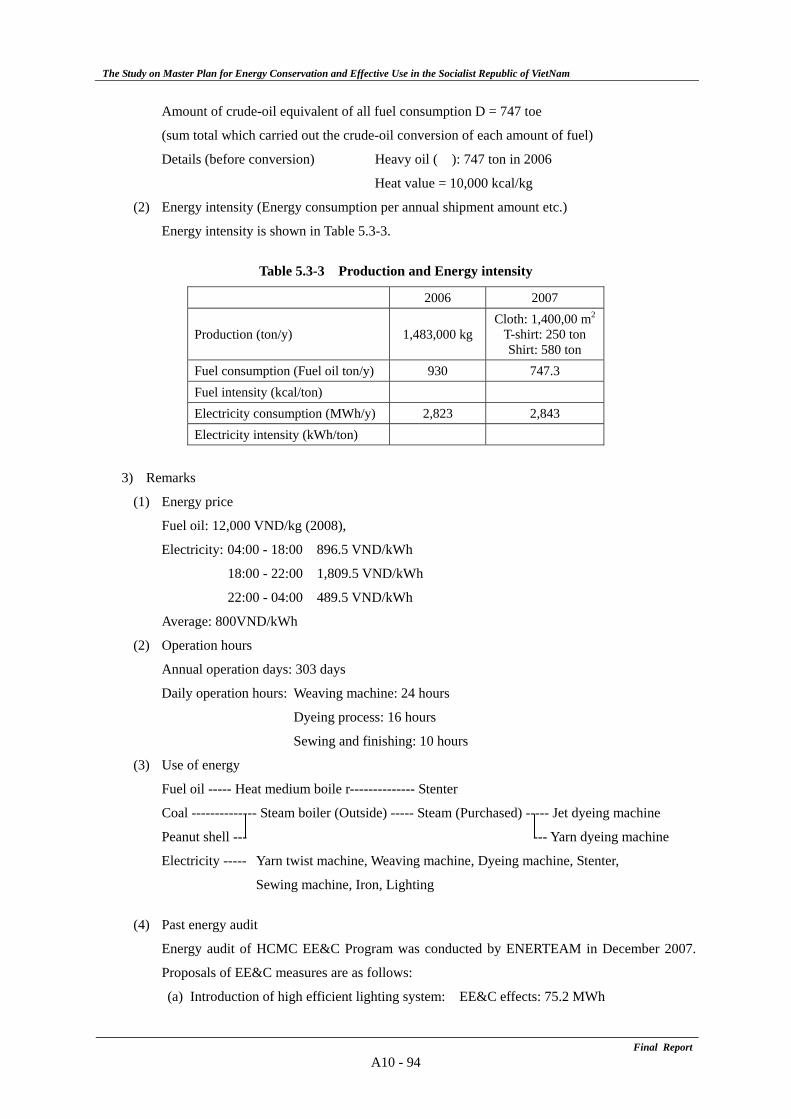
The Study on Master Plan for Energy Conservation and Effective Use in the Socialist Republic of VietNam
Final ReportA10 - 94
Amount of crude-oil equivalent of all fuel consumption D = 747 toe
(sum total which carried out the crude-oil conversion of each amount of fuel)
Details (before conversion) Heavy oil ( ): 747 ton in 2006
Heat value = 10,000 kcal/kg
(2) Energy intensity (Energy consumption per annual shipment amount etc.)
Energy intensity is shown in Table 5.3-3.
Table 5.3-3 Production and Energy intensity
2006 2007
Production (ton/y) 1,483,000 kg Cloth: 1,400,00 m2
T-shirt: 250 ton Shirt: 580 ton
Fuel consumption (Fuel oil ton/y) 930 747.3 Fuel intensity (kcal/ton) Electricity consumption (MWh/y) 2,823 2,843 Electricity intensity (kWh/ton)
3) Remarks
(1) Energy price
Fuel oil: 12,000 VND/kg (2008),
Electricity: 04:00 - 18:00 896.5 VND/kWh
18:00 - 22:00 1,809.5 VND/kWh
22:00 - 04:00 489.5 VND/kWh
Average: 800VND/kWh
(2) Operation hours
Annual operation days: 303 days
Daily operation hours: Weaving machine: 24 hours
Dyeing process: 16 hours
Sewing and finishing: 10 hours
(3) Use of energy
Fuel oil ----- Heat medium boile r-------------- Stenter
Coal -------------- Steam boiler (Outside) ----- Steam (Purchased) ----- Jet dyeing machine
Peanut shell --- --- Yarn dyeing machine
Electricity ----- Yarn twist machine, Weaving machine, Dyeing machine, Stenter,
Sewing machine, Iron, Lighting
(4) Past energy audit
Energy audit of HCMC EE&C Program was conducted by ENERTEAM in December 2007.
Proposals of EE&C measures are as follows:
(a) Introduction of high efficient lighting system: EE&C effects: 75.2 MWh
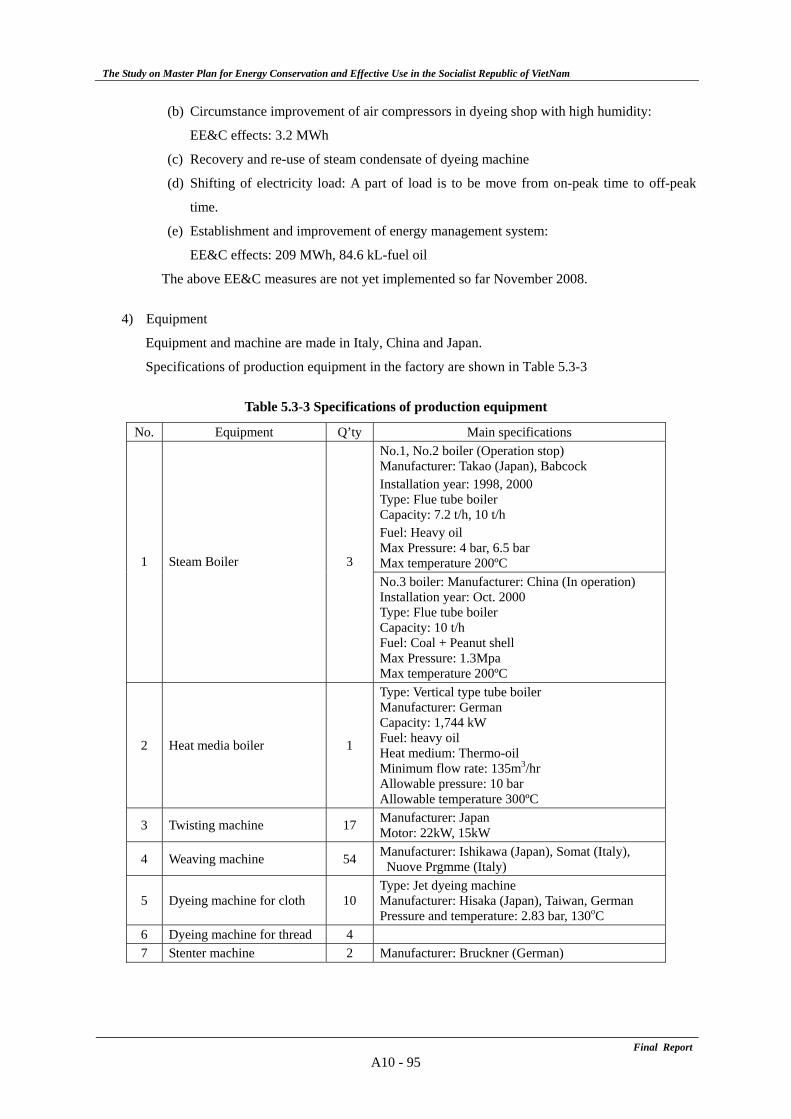
The Study on Master Plan for Energy Conservation and Effective Use in the Socialist Republic of VietNam
Final ReportA10 - 95
(b) Circumstance improvement of air compressors in dyeing shop with high humidity:
EE&C effects: 3.2 MWh
(c) Recovery and re-use of steam condensate of dyeing machine
(d) Shifting of electricity load: A part of load is to be move from on-peak time to off-peak
time.
(e) Establishment and improvement of energy management system:
EE&C effects: 209 MWh, 84.6 kL-fuel oil
The above EE&C measures are not yet implemented so far November 2008.
4) Equipment
Equipment and machine are made in Italy, China and Japan.
Specifications of production equipment in the factory are shown in Table 5.3-3
Table 5.3-3 Specifications of production equipment
No. Equipment Q’ty Main specifications No.1, No.2 boiler (Operation stop) Manufacturer: Takao (Japan), Babcock Installation year: 1998, 2000 Type: Flue tube boiler Capacity: 7.2 t/h, 10 t/h Fuel: Heavy oil Max Pressure: 4 bar, 6.5 bar Max temperature 200ºC 1 Steam Boiler 3 No.3 boiler: Manufacturer: China (In operation) Installation year: Oct. 2000 Type: Flue tube boiler Capacity: 10 t/h Fuel: Coal + Peanut shell Max Pressure: 1.3Mpa Max temperature 200ºC
2 Heat media boiler 1
Type: Vertical type tube boiler Manufacturer: German Capacity: 1,744 kW Fuel: heavy oil Heat medium: Thermo-oil Minimum flow rate: 135m3/hr Allowable pressure: 10 bar Allowable temperature 300ºC
3 Twisting machine 17 Manufacturer: Japan Motor: 22kW, 15kW
4 Weaving machine 54 Manufacturer: Ishikawa (Japan), Somat (Italy), Nuove Prgmme (Italy)
5 Dyeing machine for cloth 10 Type: Jet dyeing machine Manufacturer: Hisaka (Japan), Taiwan, German Pressure and temperature: 2.83 bar, 130oC
6 Dyeing machine for thread 4 7 Stenter machine 2 Manufacturer: Bruckner (German)
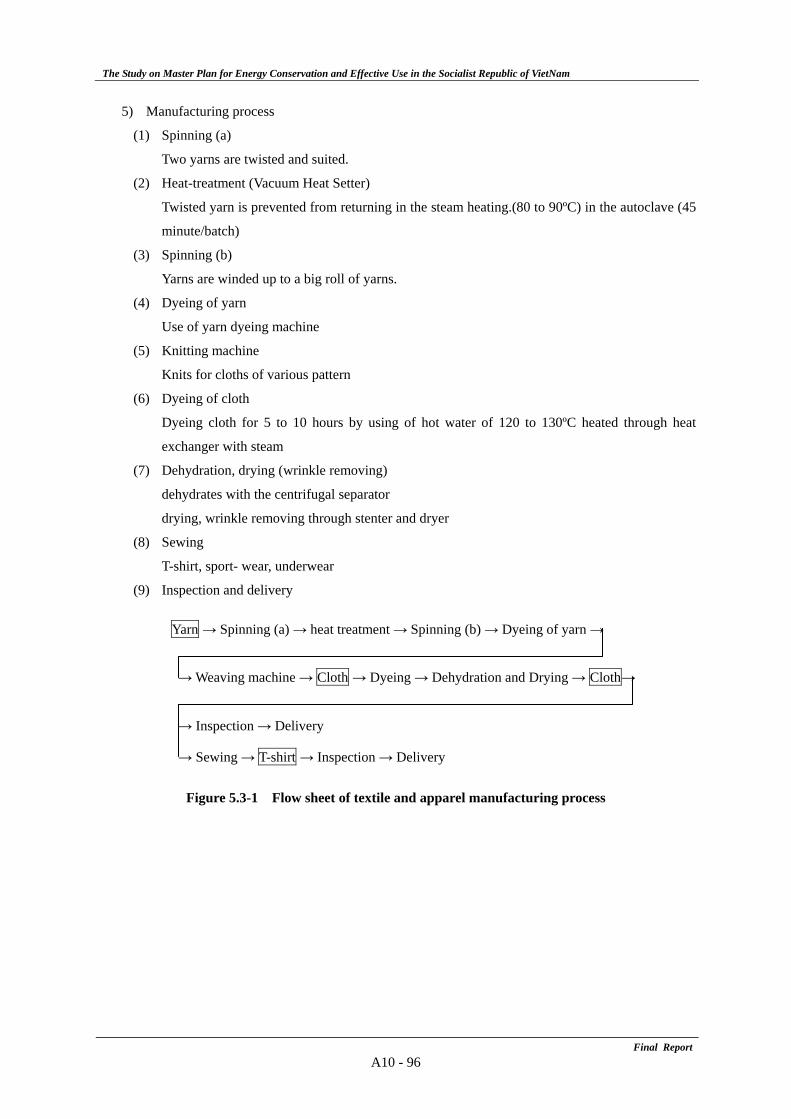
The Study on Master Plan for Energy Conservation and Effective Use in the Socialist Republic of VietNam
Final ReportA10 - 96
5) Manufacturing process
(1) Spinning (a)
Two yarns are twisted and suited.
(2) Heat-treatment (Vacuum Heat Setter)
Twisted yarn is prevented from returning in the steam heating.(80 to 90ºC) in the autoclave (45
minute/batch)
(3) Spinning (b)
Yarns are winded up to a big roll of yarns.
(4) Dyeing of yarn
Use of yarn dyeing machine
(5) Knitting machine
Knits for cloths of various pattern
(6) Dyeing of cloth
Dyeing cloth for 5 to 10 hours by using of hot water of 120 to 130ºC heated through heat
exchanger with steam
(7) Dehydration, drying (wrinkle removing)
dehydrates with the centrifugal separator
drying, wrinkle removing through stenter and dryer
(8) Sewing
T-shirt, sport- wear, underwear
(9) Inspection and delivery
Yarn → Spinning (a) → heat treatment → Spinning (b) → Dyeing of yarn →
→ Weaving machine → Cloth → Dyeing → Dehydration and Drying → Cloth→
→ Inspection → Delivery
→ Sewing → T-shirt → Inspection → Delivery
Figure 5.3-1 Flow sheet of textile and apparel manufacturing process
The Study on Master Plan for Energy Conservation and Effective Use in the Socialist Republic of VietNam
Final ReportA10 - 97
5.4 Energy On-site Survey of Factory
5.4.1 Activity of energy management
1) Energy management organization
(1) Present condition and problems
Energy management organization is not established.
(2) Measures for improvement
As top management does not have awareness of EE&C, top management has to establish the
energy management organization and promote awareness of EE&C.
2) Implementation of measurement and recording
(1) Present condition and problems
Most of instrument meter is out of service, and so gathering and measurement of data are not
implemented.
(2) Measures for improvement
Instrumentation meter has to be repaired for measurement.
3) Maintenance management of equipment
(1) Present condition and problems
Many leakage points of steam and water are found. Heat insulation material of steam piping is
broken in some place and is not repaired.
(2) Measures for improvement
Broken insulation material is to be repaired soon, and periodical inspection is to be conducted
with checklist.
4) Energy consumption management
(1) Present condition and problems
Recording of energy consumption is not conducted.
(2) Measures for improvement
It is necessary for managers to have awareness in energy conservation.
5) Energy intensity management
(1) Present condition and problems
Energy intensity management is not conducted.
(2) Measures for improvement
Water intensity is important as well as fuel and electricity intensity.
6) PDCA management cycle
(1) Present condition and problems
PDCA management is not conducted.
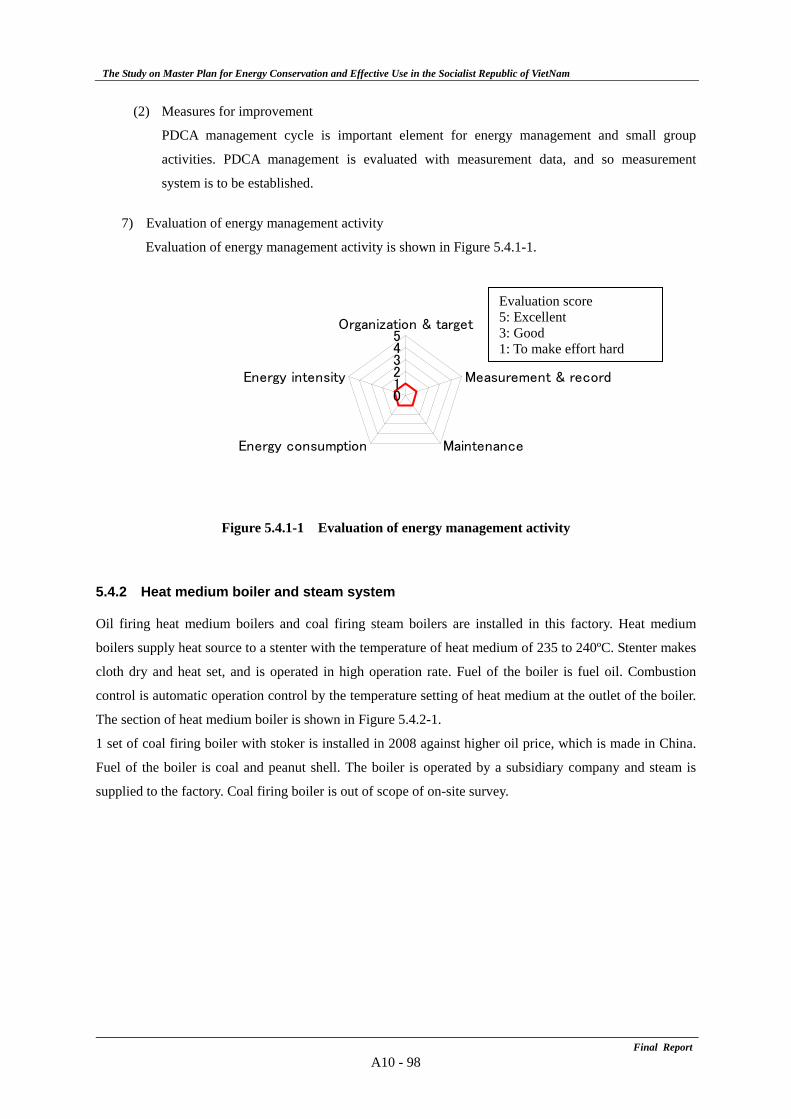
The Study on Master Plan for Energy Conservation and Effective Use in the Socialist Republic of VietNam
Final ReportA10 - 98
(2) Measures for improvement
PDCA management cycle is important element for energy management and small group
activities. PDCA management is evaluated with measurement data, and so measurement
system is to be established.
7) Evaluation of energy management activity
Evaluation of energy management activity is shown in Figure 5.4.1-1.
Figure 5.4.1-1 Evaluation of energy management activity
5.4.2 Heat medium boiler and steam system
Oil firing heat medium boilers and coal firing steam boilers are installed in this factory. Heat medium
boilers supply heat source to a stenter with the temperature of heat medium of 235 to 240ºC. Stenter makes
cloth dry and heat set, and is operated in high operation rate. Fuel of the boiler is fuel oil. Combustion
control is automatic operation control by the temperature setting of heat medium at the outlet of the boiler.
The section of heat medium boiler is shown in Figure 5.4.2-1.
1 set of coal firing boiler with stoker is installed in 2008 against higher oil price, which is made in China.
Fuel of the boiler is coal and peanut shell. The boiler is operated by a subsidiary company and steam is
supplied to the factory. Coal firing boiler is out of scope of on-site survey.
012345
Organization & target
Measurement & record
MaintenanceEnergy consumption
Energy intensity
Evaluation score 5: Excellent 3: Good 1: To make effort hard
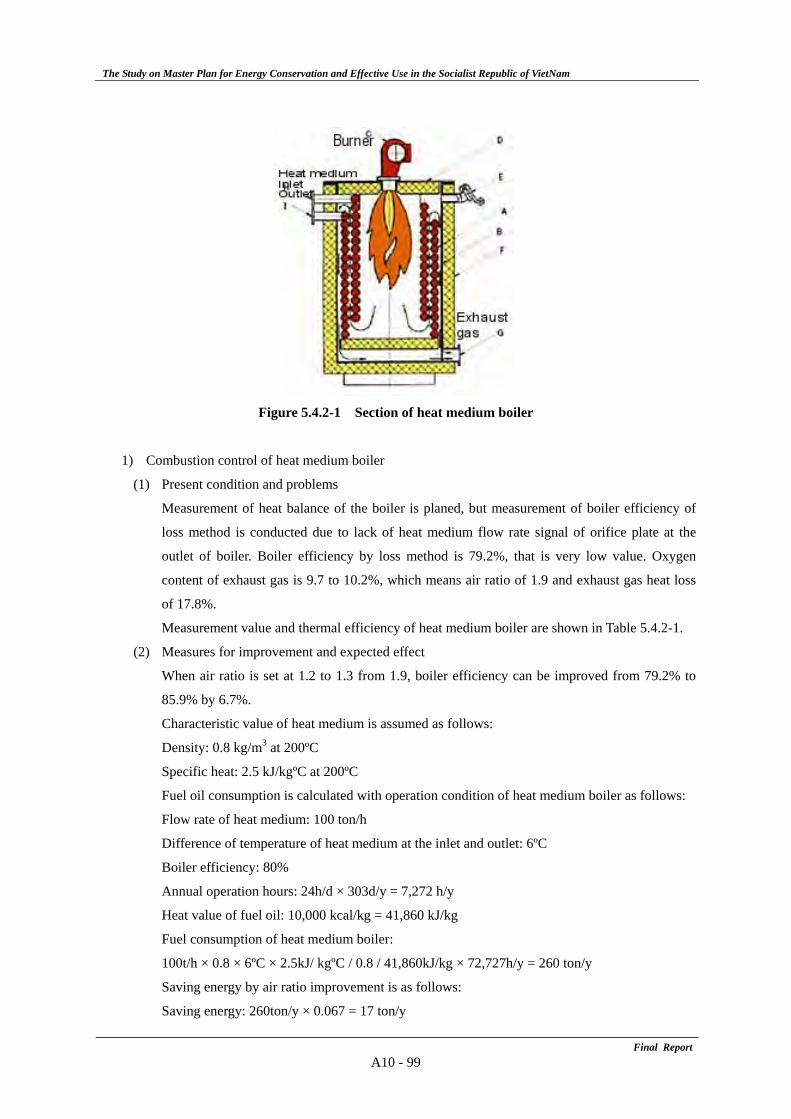
The Study on Master Plan for Energy Conservation and Effective Use in the Socialist Republic of VietNam
Final ReportA10 - 99
Figure 5.4.2-1 Section of heat medium boiler
1) Combustion control of heat medium boiler
(1) Present condition and problems
Measurement of heat balance of the boiler is planed, but measurement of boiler efficiency of
loss method is conducted due to lack of heat medium flow rate signal of orifice plate at the
outlet of boiler. Boiler efficiency by loss method is 79.2%, that is very low value. Oxygen
content of exhaust gas is 9.7 to 10.2%, which means air ratio of 1.9 and exhaust gas heat loss
of 17.8%.
Measurement value and thermal efficiency of heat medium boiler are shown in Table 5.4.2-1.
(2) Measures for improvement and expected effect
When air ratio is set at 1.2 to 1.3 from 1.9, boiler efficiency can be improved from 79.2% to
85.9% by 6.7%.
Characteristic value of heat medium is assumed as follows:
Density: 0.8 kg/m3 at 200ºC
Specific heat: 2.5 kJ/kgºC at 200ºC
Fuel oil consumption is calculated with operation condition of heat medium boiler as follows:
Flow rate of heat medium: 100 ton/h
Difference of temperature of heat medium at the inlet and outlet: 6ºC
Boiler efficiency: 80%
Annual operation hours: 24h/d × 303d/y = 7,272 h/y
Heat value of fuel oil: 10,000 kcal/kg = 41,860 kJ/kg
Fuel consumption of heat medium boiler:
100t/h × 0.8 × 6ºC × 2.5kJ/ kgºC / 0.8 / 41,860kJ/kg × 72,727h/y = 260 ton/y
Saving energy by air ratio improvement is as follows:
Saving energy: 260ton/y × 0.067 = 17 ton/y
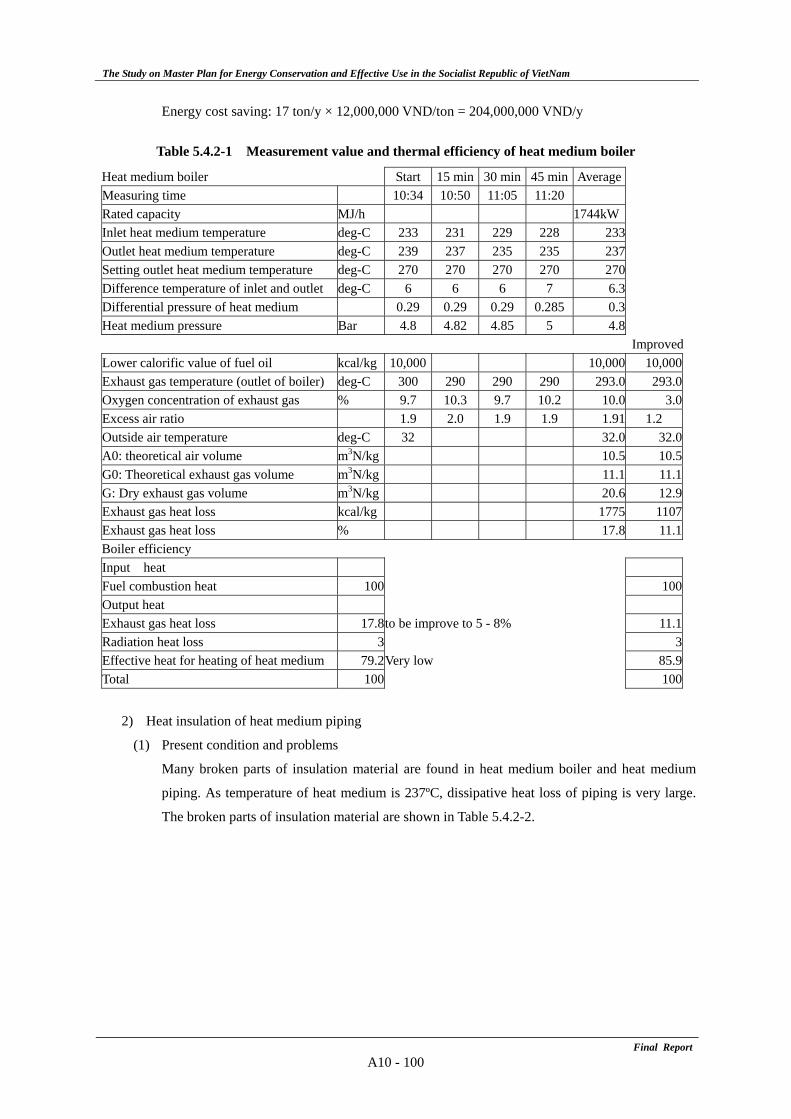
The Study on Master Plan for Energy Conservation and Effective Use in the Socialist Republic of VietNam
Final ReportA10 - 100
Energy cost saving: 17 ton/y × 12,000,000 VND/ton = 204,000,000 VND/y
Table 5.4.2-1 Measurement value and thermal efficiency of heat medium boiler
2) Heat insulation of heat medium piping
(1) Present condition and problems
Many broken parts of insulation material are found in heat medium boiler and heat medium
piping. As temperature of heat medium is 237ºC, dissipative heat loss of piping is very large.
The broken parts of insulation material are shown in Table 5.4.2-2.
Heat medium boiler Start 15 min 30 min 45 min Average Measuring time 10:34 10:50 11:05 11:20 Rated capacity MJ/h 1744kW Inlet heat medium temperature deg-C 233 231 229 228 233 Outlet heat medium temperature deg-C 239 237 235 235 237 Setting outlet heat medium temperature deg-C 270 270 270 270 270 Difference temperature of inlet and outlet deg-C 6 6 6 7 6.3 Differential pressure of heat medium 0.29 0.29 0.29 0.285 0.3 Heat medium pressure Bar 4.8 4.82 4.85 5 4.8 ImprovedLower calorific value of fuel oil kcal/kg 10,000 10,000 10,000 Exhaust gas temperature (outlet of boiler) deg-C 300 290 290 290 293.0 293.0 Oxygen concentration of exhaust gas % 9.7 10.3 9.7 10.2 10.0 3.0 Excess air ratio 1.9 2.0 1.9 1.9 1.91 1.2 Outside air temperature deg-C 32 32.0 32.0 A0: theoretical air volume m3N/kg 10.5 10.5 G0: Theoretical exhaust gas volume m3N/kg 11.1 11.1 G: Dry exhaust gas volume m3N/kg 20.6 12.9 Exhaust gas heat loss kcal/kg 1775 1107 Exhaust gas heat loss % 17.8 11.1 Boiler efficiency Input heat Fuel combustion heat 100 100Output heat Exhaust gas heat loss 17.8to be improve to 5 - 8% 11.1 Radiation heat loss 3 3 Effective heat for heating of heat medium 79.2Very low 85.9 Total 100 100
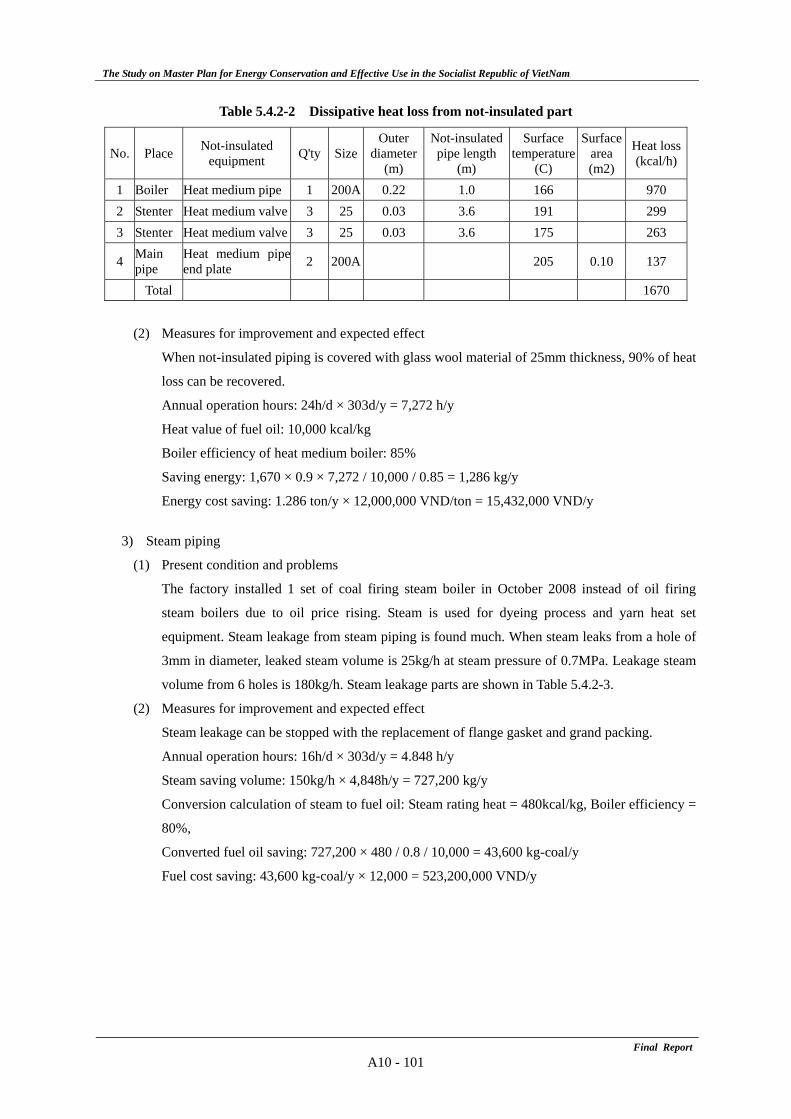
The Study on Master Plan for Energy Conservation and Effective Use in the Socialist Republic of VietNam
Final ReportA10 - 101
Table 5.4.2-2 Dissipative heat loss from not-insulated part
No. Place Not-insulated equipment Q'ty Size
Outer diameter
(m)
Not-insulated pipe length
(m)
Surface temperature
(C)
Surface area (m2)
Heat loss(kcal/h)
1 Boiler Heat medium pipe 1 200A 0.22 1.0 166 970 2 Stenter Heat medium valve 3 25 0.03 3.6 191 299 3 Stenter Heat medium valve 3 25 0.03 3.6 175 263
4 Main pipe
Heat medium pipeend plate 2 200A 205 0.10 137
Total 1670
(2) Measures for improvement and expected effect
When not-insulated piping is covered with glass wool material of 25mm thickness, 90% of heat
loss can be recovered.
Annual operation hours: 24h/d × 303d/y = 7,272 h/y
Heat value of fuel oil: 10,000 kcal/kg
Boiler efficiency of heat medium boiler: 85%
Saving energy: 1,670 × 0.9 × 7,272 / 10,000 / 0.85 = 1,286 kg/y
Energy cost saving: 1.286 ton/y × 12,000,000 VND/ton = 15,432,000 VND/y
3) Steam piping
(1) Present condition and problems
The factory installed 1 set of coal firing steam boiler in October 2008 instead of oil firing
steam boilers due to oil price rising. Steam is used for dyeing process and yarn heat set
equipment. Steam leakage from steam piping is found much. When steam leaks from a hole of
3mm in diameter, leaked steam volume is 25kg/h at steam pressure of 0.7MPa. Leakage steam
volume from 6 holes is 180kg/h. Steam leakage parts are shown in Table 5.4.2-3.
(2) Measures for improvement and expected effect
Steam leakage can be stopped with the replacement of flange gasket and grand packing.
Annual operation hours: 16h/d × 303d/y = 4.848 h/y
Steam saving volume: 150kg/h × 4,848h/y = 727,200 kg/y
Conversion calculation of steam to fuel oil: Steam rating heat = 480kcal/kg, Boiler efficiency =
80%,
Converted fuel oil saving: 727,200 × 480 / 0.8 / 10,000 = 43,600 kg-coal/y
Fuel cost saving: 43,600 kg-coal/y × 12,000 = 523,200,000 VND/y
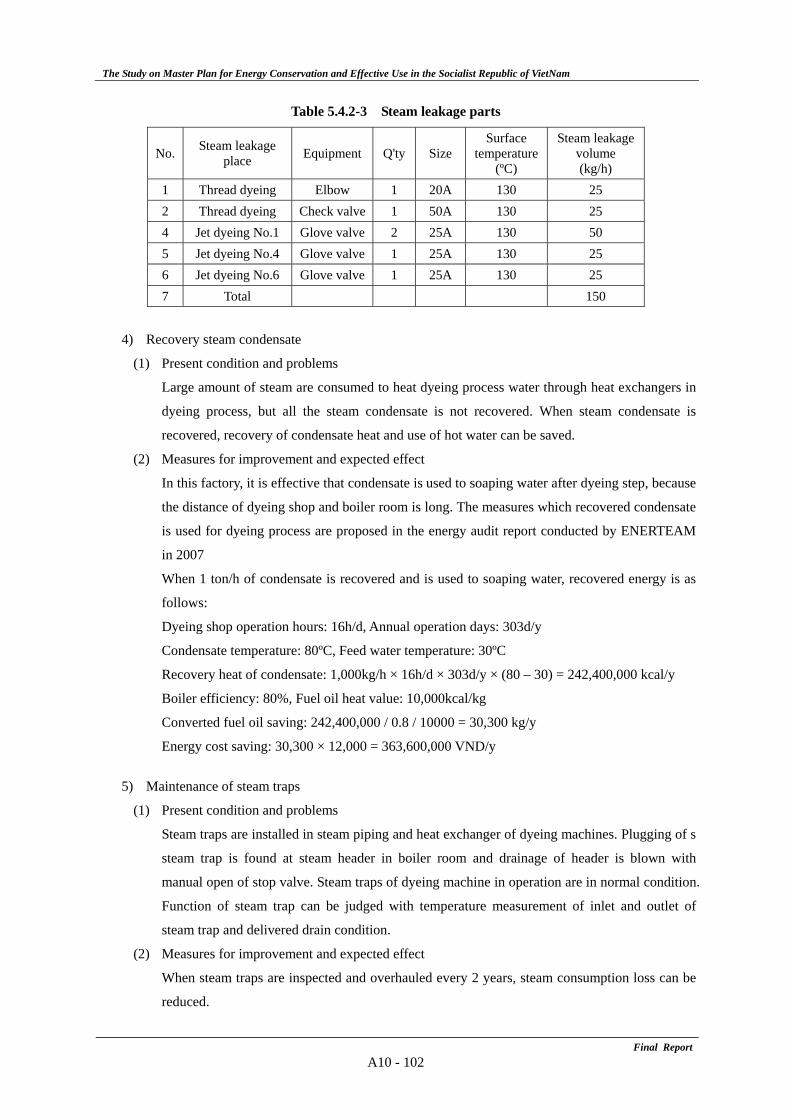
The Study on Master Plan for Energy Conservation and Effective Use in the Socialist Republic of VietNam
Final ReportA10 - 102
Table 5.4.2-3 Steam leakage parts
No. Steam leakage place Equipment Q'ty Size
Surface temperature
(ºC)
Steam leakage volume (kg/h)
1 Thread dyeing Elbow 1 20A 130 25 2 Thread dyeing Check valve 1 50A 130 25 4 Jet dyeing No.1 Glove valve 2 25A 130 50 5 Jet dyeing No.4 Glove valve 1 25A 130 25 6 Jet dyeing No.6 Glove valve 1 25A 130 25 7 Total 150
4) Recovery steam condensate
(1) Present condition and problems
Large amount of steam are consumed to heat dyeing process water through heat exchangers in
dyeing process, but all the steam condensate is not recovered. When steam condensate is
recovered, recovery of condensate heat and use of hot water can be saved.
(2) Measures for improvement and expected effect
In this factory, it is effective that condensate is used to soaping water after dyeing step, because
the distance of dyeing shop and boiler room is long. The measures which recovered condensate
is used for dyeing process are proposed in the energy audit report conducted by ENERTEAM
in 2007
When 1 ton/h of condensate is recovered and is used to soaping water, recovered energy is as
follows:
Dyeing shop operation hours: 16h/d, Annual operation days: 303d/y
Condensate temperature: 80ºC, Feed water temperature: 30ºC
Recovery heat of condensate: 1,000kg/h × 16h/d × 303d/y × (80 – 30) = 242,400,000 kcal/y
Boiler efficiency: 80%, Fuel oil heat value: 10,000kcal/kg
Converted fuel oil saving: 242,400,000 / 0.8 / 10000 = 30,300 kg/y
Energy cost saving: 30,300 × 12,000 = 363,600,000 VND/y
5) Maintenance of steam traps
(1) Present condition and problems
Steam traps are installed in steam piping and heat exchanger of dyeing machines. Plugging of s
steam trap is found at steam header in boiler room and drainage of header is blown with
manual open of stop valve. Steam traps of dyeing machine in operation are in normal condition.
Function of steam trap can be judged with temperature measurement of inlet and outlet of
steam trap and delivered drain condition.
(2) Measures for improvement and expected effect
When steam traps are inspected and overhauled every 2 years, steam consumption loss can be
reduced.
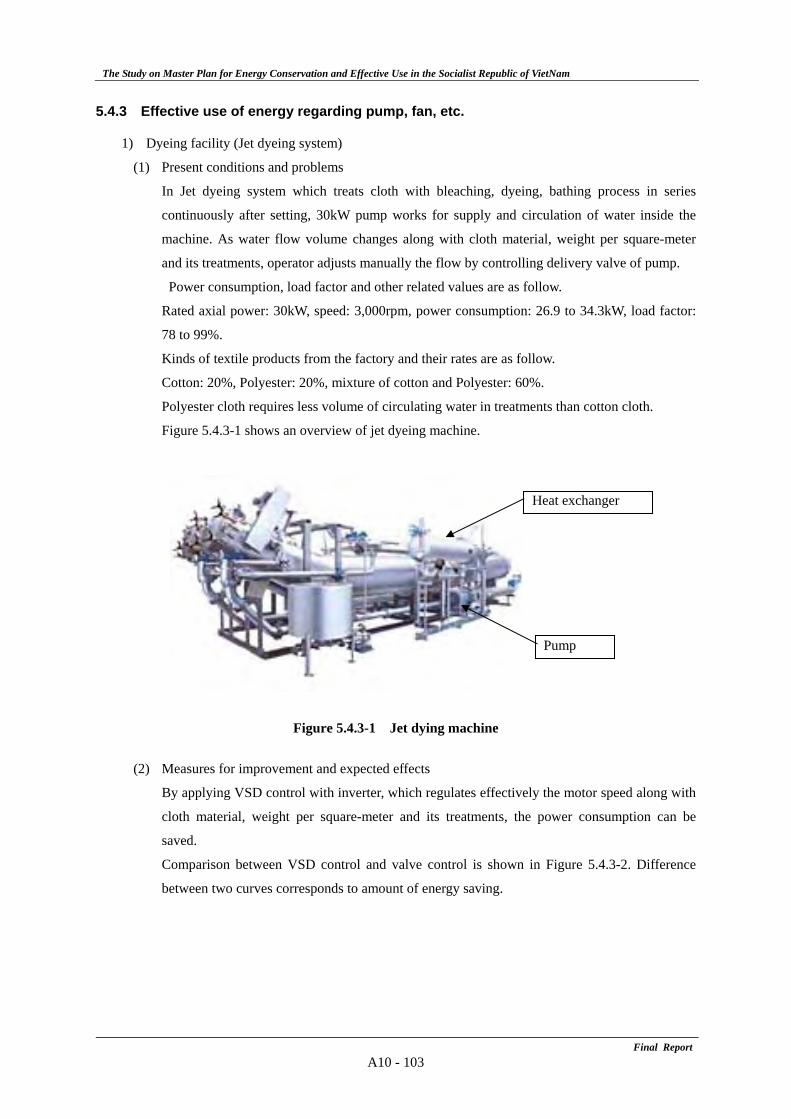
The Study on Master Plan for Energy Conservation and Effective Use in the Socialist Republic of VietNam
Final ReportA10 - 103
5.4.3 Effective use of energy regarding pump, fan, etc.
1) Dyeing facility (Jet dyeing system)
(1) Present conditions and problems
In Jet dyeing system which treats cloth with bleaching, dyeing, bathing process in series
continuously after setting, 30kW pump works for supply and circulation of water inside the
machine. As water flow volume changes along with cloth material, weight per square-meter
and its treatments, operator adjusts manually the flow by controlling delivery valve of pump.
Power consumption, load factor and other related values are as follow.
Rated axial power: 30kW, speed: 3,000rpm, power consumption: 26.9 to 34.3kW, load factor:
78 to 99%.
Kinds of textile products from the factory and their rates are as follow.
Cotton: 20%, Polyester: 20%, mixture of cotton and Polyester: 60%.
Polyester cloth requires less volume of circulating water in treatments than cotton cloth.
Figure 5.4.3-1 shows an overview of jet dyeing machine.
Figure 5.4.3-1 Jet dying machine
(2) Measures for improvement and expected effects
By applying VSD control with inverter, which regulates effectively the motor speed along with
cloth material, weight per square-meter and its treatments, the power consumption can be
saved.
Comparison between VSD control and valve control is shown in Figure 5.4.3-2. Difference
between two curves corresponds to amount of energy saving.
Pump
Heat exchanger
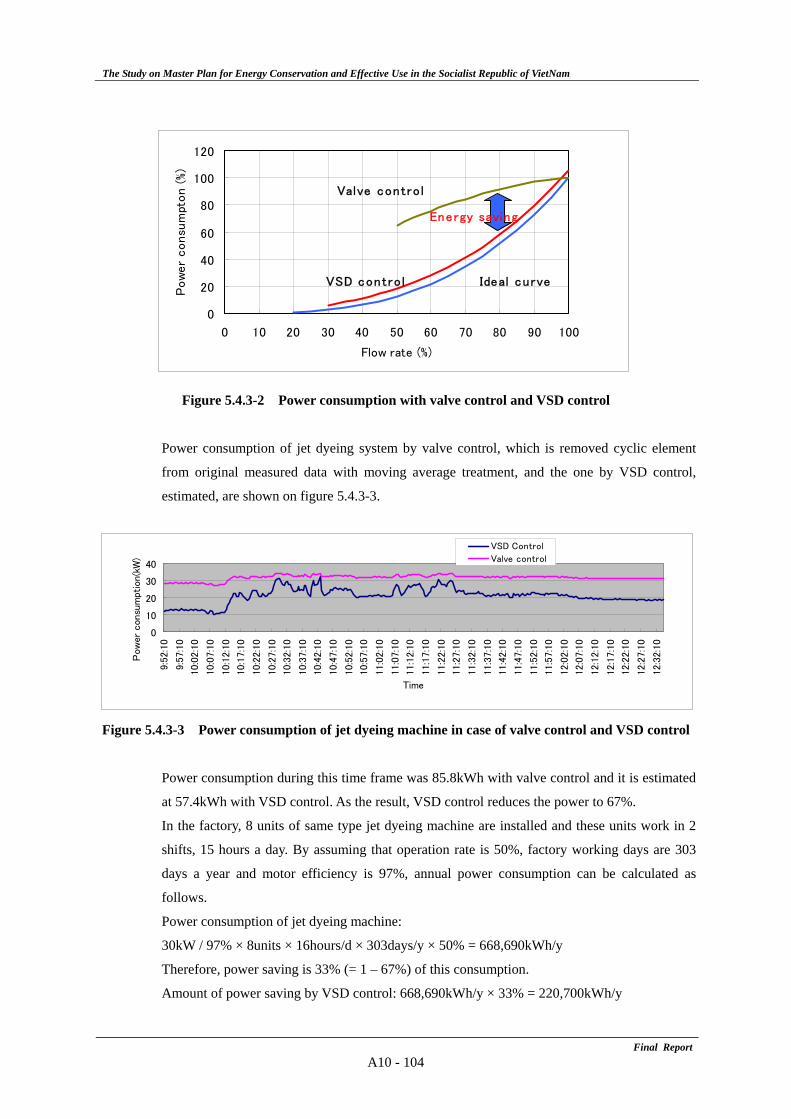
The Study on Master Plan for Energy Conservation and Effective Use in the Socialist Republic of VietNam
Final ReportA10 - 104
Figure 5.4.3-2 Power consumption with valve control and VSD control
Power consumption of jet dyeing system by valve control, which is removed cyclic element
from original measured data with moving average treatment, and the one by VSD control,
estimated, are shown on figure 5.4.3-3.
Figure 5.4.3-3 Power consumption of jet dyeing machine in case of valve control and VSD control
Power consumption during this time frame was 85.8kWh with valve control and it is estimated
at 57.4kWh with VSD control. As the result, VSD control reduces the power to 67%.
In the factory, 8 units of same type jet dyeing machine are installed and these units work in 2
shifts, 15 hours a day. By assuming that operation rate is 50%, factory working days are 303
days a year and motor efficiency is 97%, annual power consumption can be calculated as
follows.
Power consumption of jet dyeing machine:
30kW / 97% × 8units × 16hours/d × 303days/y × 50% = 668,690kWh/y
Therefore, power saving is 33% (= 1 – 67%) of this consumption.
Amount of power saving by VSD control: 668,690kWh/y × 33% = 220,700kWh/y
0
20
40
60
80
100
120
0 10 20 30 40 50 60 70 80 90 100
Flow rate (%)
Pow
er
consu
mpt
on (
%)
Ideal curveVSD contro l
Valve contro l
Energy saving
0
10
20
30
40
9:52:
10
9:57:
10
10:0
2:10
10:0
7:10
10:1
2:10
10:1
7:10
10:2
2:10
10:2
7:10
10:3
2:10
10:3
7:10
10:4
2:10
10:4
7:10
10:5
2:10
10:5
7:10
11:0
2:10
11:0
7:10
11:1
2:10
11:1
7:10
11:2
2:10
11:2
7:10
11:3
2:10
11:3
7:10
11:4
2:10
11:4
7:10
11:5
2:10
11:5
7:10
12:0
2:10
12:0
7:10
12:1
2:10
12:1
7:10
12:2
2:10
12:2
7:10
12:3
2:10
Time
Pow
er c
onsu
mption
(kW
)
VSD Control
Valve control
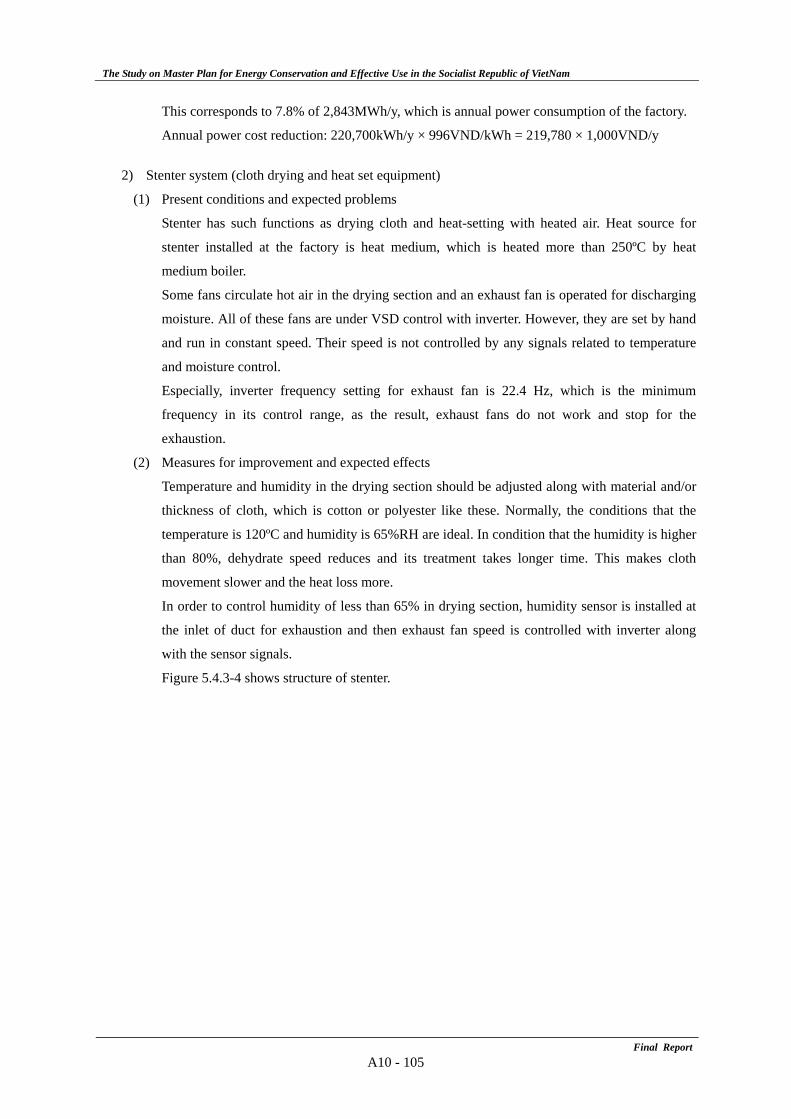
The Study on Master Plan for Energy Conservation and Effective Use in the Socialist Republic of VietNam
Final ReportA10 - 105
This corresponds to 7.8% of 2,843MWh/y, which is annual power consumption of the factory.
Annual power cost reduction: 220,700kWh/y × 996VND/kWh = 219,780 × 1,000VND/y
2) Stenter system (cloth drying and heat set equipment)
(1) Present conditions and expected problems
Stenter has such functions as drying cloth and heat-setting with heated air. Heat source for
stenter installed at the factory is heat medium, which is heated more than 250ºC by heat
medium boiler.
Some fans circulate hot air in the drying section and an exhaust fan is operated for discharging
moisture. All of these fans are under VSD control with inverter. However, they are set by hand
and run in constant speed. Their speed is not controlled by any signals related to temperature
and moisture control.
Especially, inverter frequency setting for exhaust fan is 22.4 Hz, which is the minimum
frequency in its control range, as the result, exhaust fans do not work and stop for the
exhaustion.
(2) Measures for improvement and expected effects
Temperature and humidity in the drying section should be adjusted along with material and/or
thickness of cloth, which is cotton or polyester like these. Normally, the conditions that the
temperature is 120ºC and humidity is 65%RH are ideal. In condition that the humidity is higher
than 80%, dehydrate speed reduces and its treatment takes longer time. This makes cloth
movement slower and the heat loss more.
In order to control humidity of less than 65% in drying section, humidity sensor is installed at
the inlet of duct for exhaustion and then exhaust fan speed is controlled with inverter along
with the sensor signals.
Figure 5.4.3-4 shows structure of stenter.
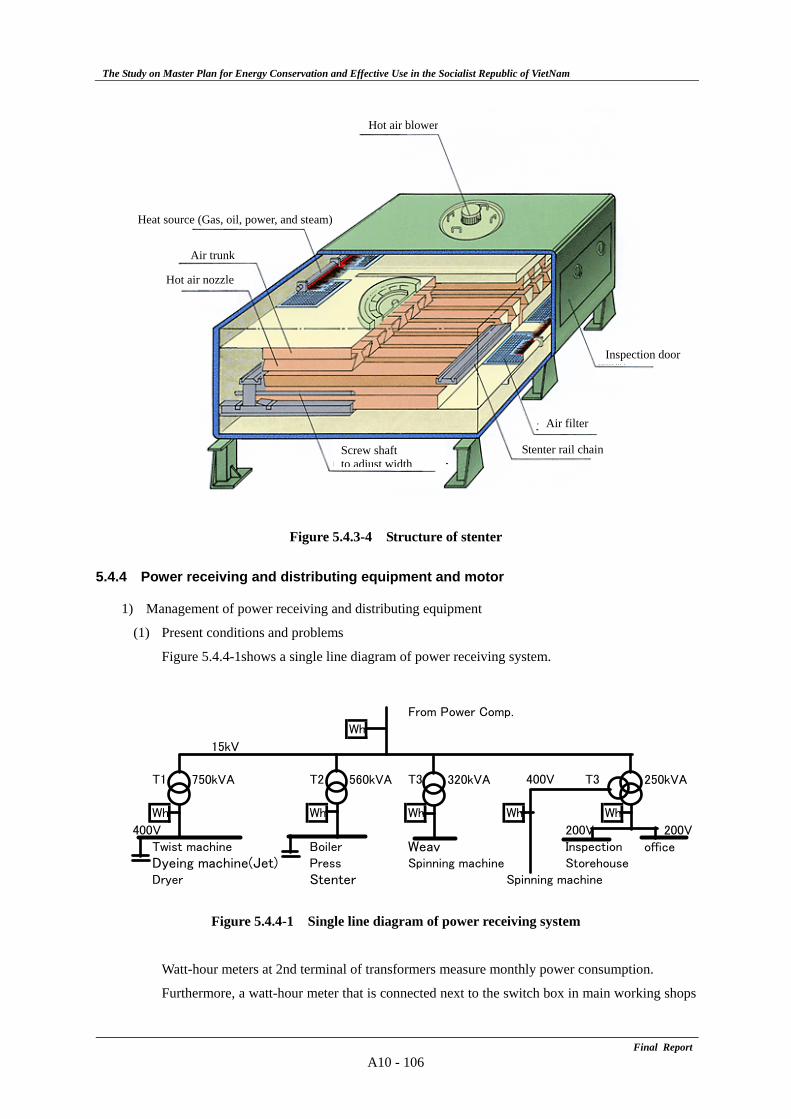
The Study on Master Plan for Energy Conservation and Effective Use in the Socialist Republic of VietNam
Final ReportA10 - 106
Figure 5.4.3-4 Structure of stenter
5.4.4 Power receiving and distributing equipment and motor
1) Management of power receiving and distributing equipment
(1) Present conditions and problems
Figure 5.4.4-1shows a single line diagram of power receiving system.
Figure 5.4.4-1 Single line diagram of power receiving system
Watt-hour meters at 2nd terminal of transformers measure monthly power consumption.
Furthermore, a watt-hour meter that is connected next to the switch box in main working shops
From Power Comp.
Wh
15kV
T1 750kVA T2 560kVA T3 320kVA 400V T3 250kVA
Wh Wh Wh Wh Wh
400V 200V 200VTwist machine Boiler Weav Inspection officeDyeing machine(Jet) Press Spinning machine StorehouseDryer Stenter Spinning machine
Hot air blower
Heat source (Gas, oil, power, and steam)
Air trunk
Hot air nozzle
Inspection door
Air filter
Stenter rail chain Screw shaft to adjust width
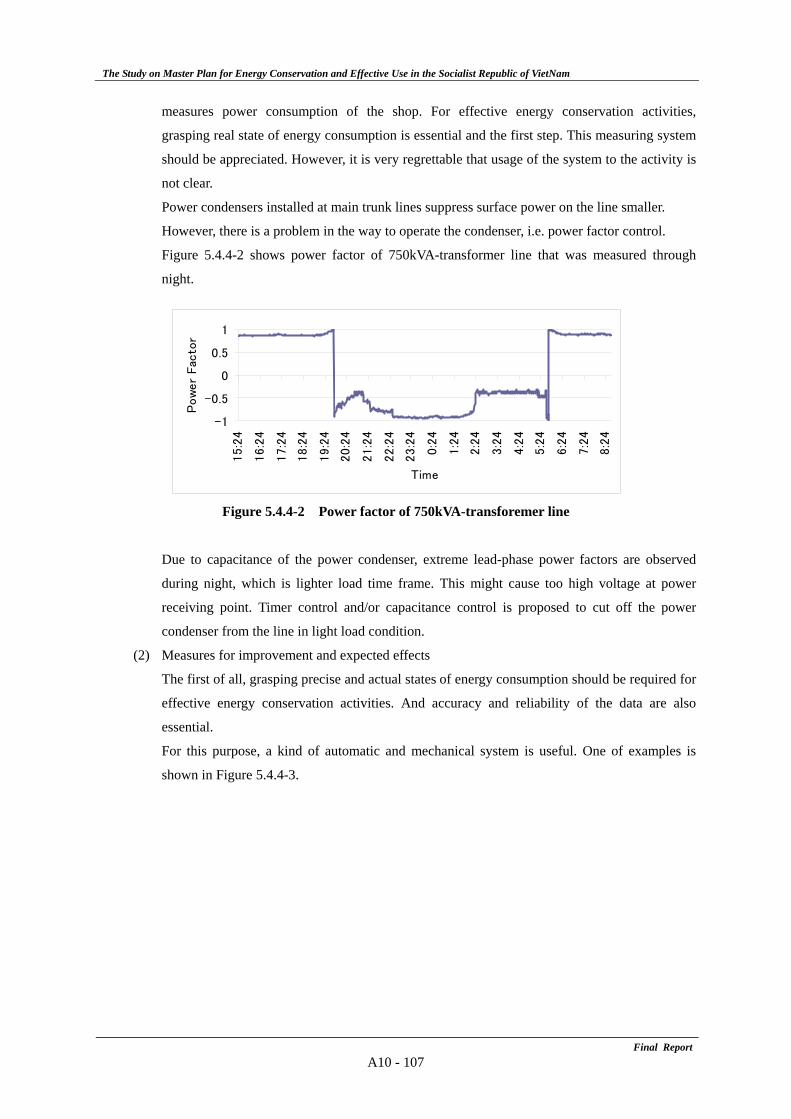
The Study on Master Plan for Energy Conservation and Effective Use in the Socialist Republic of VietNam
Final ReportA10 - 107
measures power consumption of the shop. For effective energy conservation activities,
grasping real state of energy consumption is essential and the first step. This measuring system
should be appreciated. However, it is very regrettable that usage of the system to the activity is
not clear.
Power condensers installed at main trunk lines suppress surface power on the line smaller.
However, there is a problem in the way to operate the condenser, i.e. power factor control.
Figure 5.4.4-2 shows power factor of 750kVA-transformer line that was measured through
night.
Figure 5.4.4-2 Power factor of 750kVA-transforemer line
Due to capacitance of the power condenser, extreme lead-phase power factors are observed
during night, which is lighter load time frame. This might cause too high voltage at power
receiving point. Timer control and/or capacitance control is proposed to cut off the power
condenser from the line in light load condition.
(2) Measures for improvement and expected effects
The first of all, grasping precise and actual states of energy consumption should be required for
effective energy conservation activities. And accuracy and reliability of the data are also
essential.
For this purpose, a kind of automatic and mechanical system is useful. One of examples is
shown in Figure 5.4.4-3.
-1
-0.5
0
0.5
1
15:2
4
16:2
4
17:2
4
18:2
4
19:2
4
20:2
4
21:2
4
22:2
4
23:2
4
0:2
4
1:2
4
2:2
4
3:2
4
4:2
4
5:2
4
6:2
4
7:2
4
8:2
4
Time
Pow
er
Fac
tor
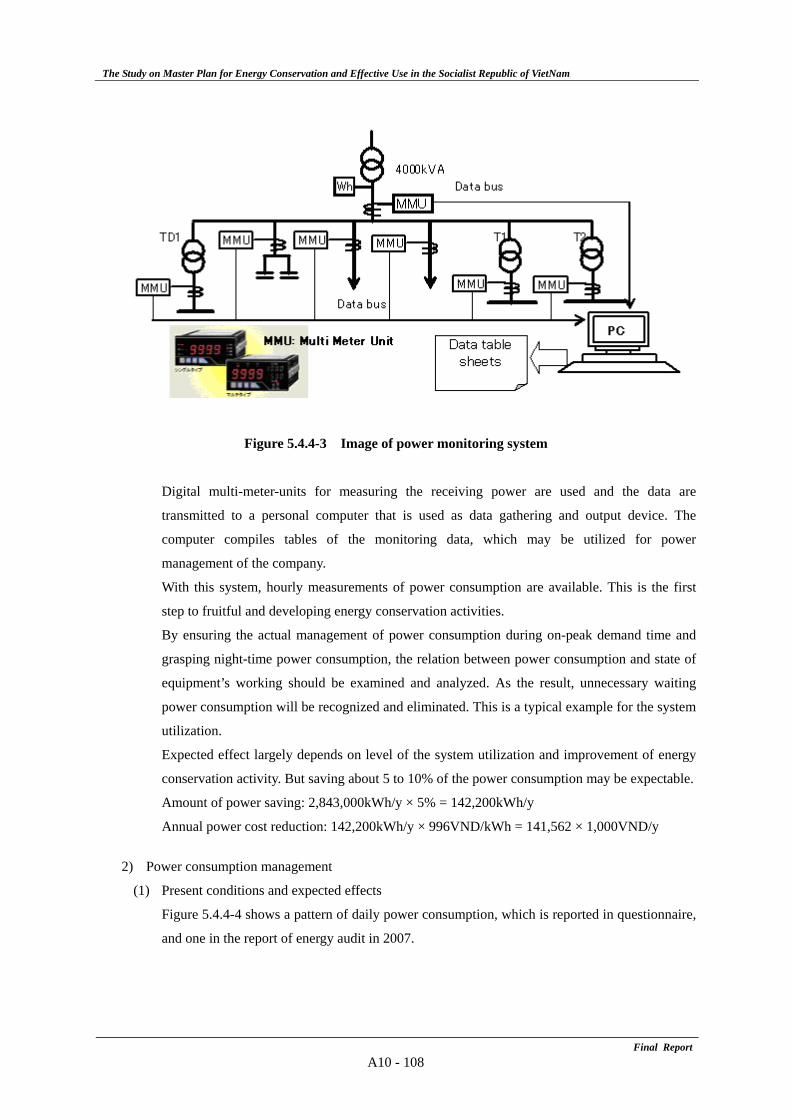
The Study on Master Plan for Energy Conservation and Effective Use in the Socialist Republic of VietNam
Final ReportA10 - 108
Figure 5.4.4-3 Image of power monitoring system
Digital multi-meter-units for measuring the receiving power are used and the data are
transmitted to a personal computer that is used as data gathering and output device. The
computer compiles tables of the monitoring data, which may be utilized for power
management of the company.
With this system, hourly measurements of power consumption are available. This is the first
step to fruitful and developing energy conservation activities.
By ensuring the actual management of power consumption during on-peak demand time and
grasping night-time power consumption, the relation between power consumption and state of
equipment’s working should be examined and analyzed. As the result, unnecessary waiting
power consumption will be recognized and eliminated. This is a typical example for the system
utilization.
Expected effect largely depends on level of the system utilization and improvement of energy
conservation activity. But saving about 5 to 10% of the power consumption may be expectable.
Amount of power saving: 2,843,000kWh/y × 5% = 142,200kWh/y
Annual power cost reduction: 142,200kWh/y × 996VND/kWh = 141,562 × 1,000VND/y
2) Power consumption management
(1) Present conditions and expected effects
Figure 5.4.4-4 shows a pattern of daily power consumption, which is reported in questionnaire,
and one in the report of energy audit in 2007.
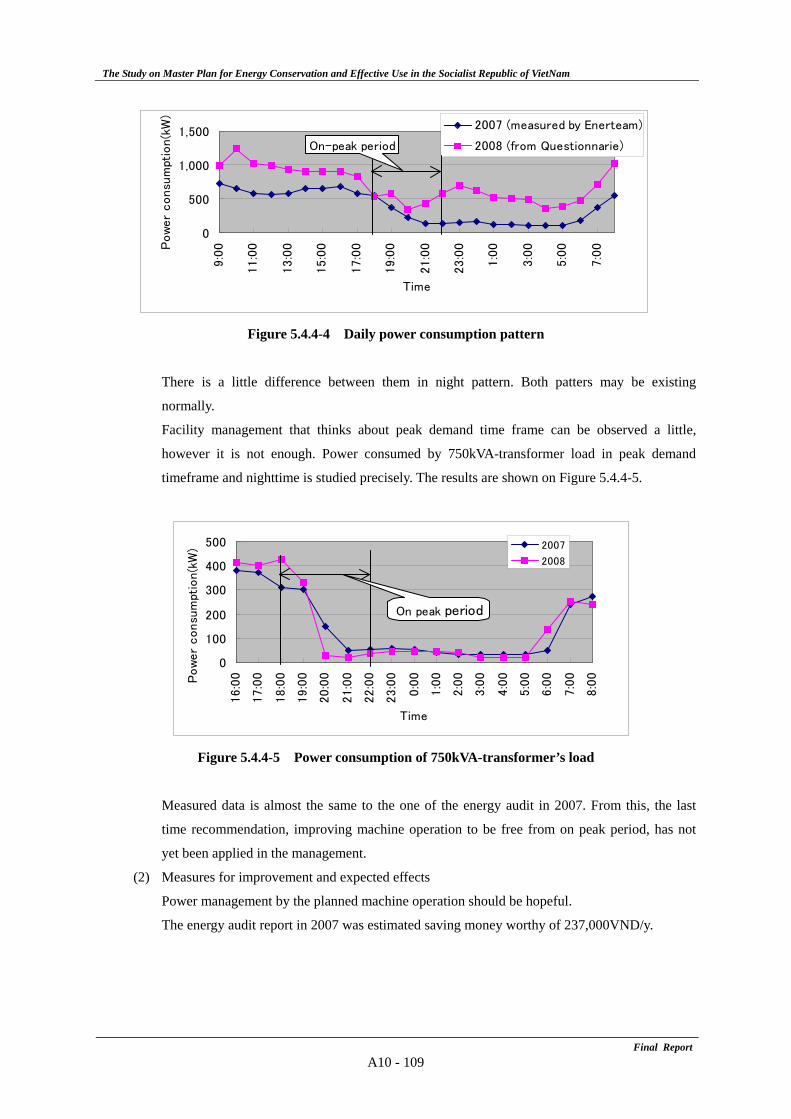
The Study on Master Plan for Energy Conservation and Effective Use in the Socialist Republic of VietNam
Final ReportA10 - 109
Figure 5.4.4-4 Daily power consumption pattern
There is a little difference between them in night pattern. Both patters may be existing
normally.
Facility management that thinks about peak demand time frame can be observed a little,
however it is not enough. Power consumed by 750kVA-transformer load in peak demand
timeframe and nighttime is studied precisely. The results are shown on Figure 5.4.4-5.
Figure 5.4.4-5 Power consumption of 750kVA-transformer’s load
Measured data is almost the same to the one of the energy audit in 2007. From this, the last
time recommendation, improving machine operation to be free from on peak period, has not
yet been applied in the management.
(2) Measures for improvement and expected effects
Power management by the planned machine operation should be hopeful.
The energy audit report in 2007 was estimated saving money worthy of 237,000VND/y.
0
500
1,000
1,500
9:0
0
11:0
0
13:0
0
15:0
0
17:0
0
19:0
0
21:0
0
23:0
0
1:0
0
3:0
0
5:0
0
7:0
0
Time
Pow
er
consu
mpt
ion(k
W)
2007 (measured by Enerteam)
2008 (from Questionnarie)On-peak period
0
100
200
300
400
500
16:0
0
17:0
0
18:0
0
19:0
0
20:0
0
21:0
0
22:0
0
23:0
0
0:0
0
1:0
0
2:0
0
3:0
0
4:0
0
5:0
0
6:0
0
7:0
0
8:0
0
Time
Pow
er
consu
mpt
ion(k
W) 2007
2008
On peak period
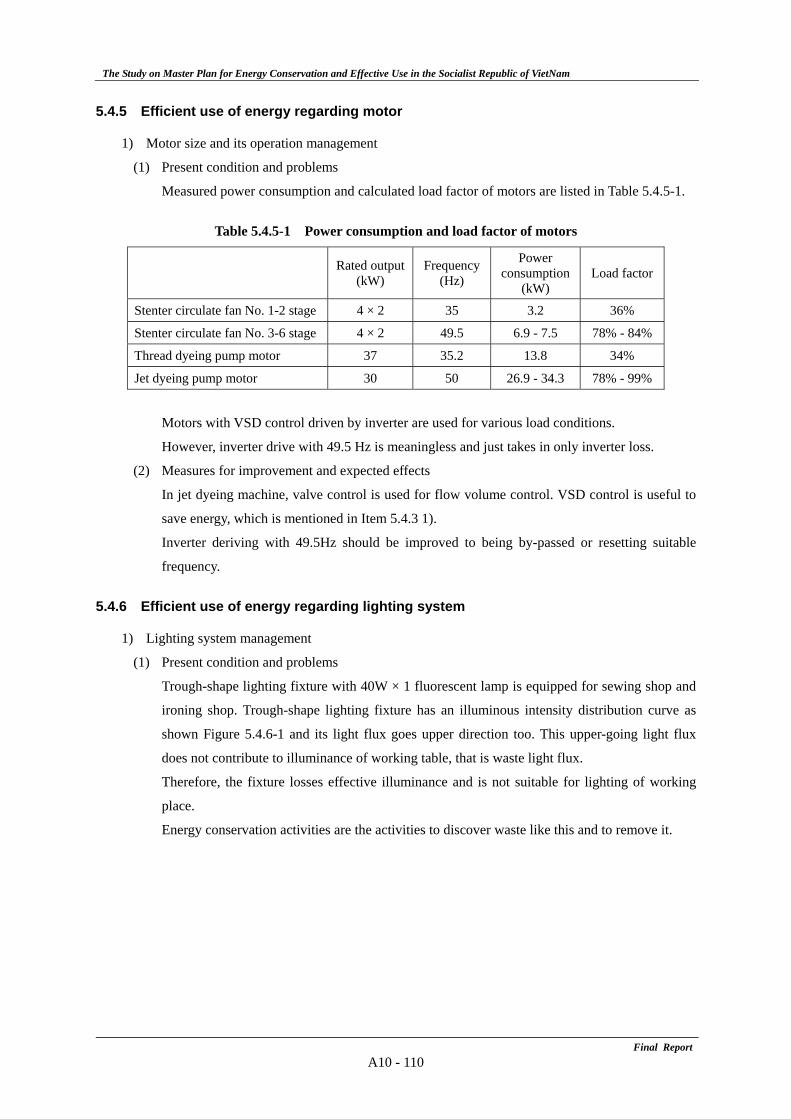
The Study on Master Plan for Energy Conservation and Effective Use in the Socialist Republic of VietNam
Final ReportA10 - 110
5.4.5 Efficient use of energy regarding motor
1) Motor size and its operation management
(1) Present condition and problems
Measured power consumption and calculated load factor of motors are listed in Table 5.4.5-1.
Table 5.4.5-1 Power consumption and load factor of motors
Rated output(kW)
Frequency(Hz)
Power consumption
(kW) Load factor
Stenter circulate fan No. 1-2 stage 4 × 2 35 3.2 36%
Stenter circulate fan No. 3-6 stage 4 × 2 49.5 6.9 - 7.5 78% - 84%
Thread dyeing pump motor 37 35.2 13.8 34%
Jet dyeing pump motor 30 50 26.9 - 34.3 78% - 99%
Motors with VSD control driven by inverter are used for various load conditions.
However, inverter drive with 49.5 Hz is meaningless and just takes in only inverter loss.
(2) Measures for improvement and expected effects
In jet dyeing machine, valve control is used for flow volume control. VSD control is useful to
save energy, which is mentioned in Item 5.4.3 1).
Inverter deriving with 49.5Hz should be improved to being by-passed or resetting suitable
frequency.
5.4.6 Efficient use of energy regarding lighting system
1) Lighting system management
(1) Present condition and problems
Trough-shape lighting fixture with 40W × 1 fluorescent lamp is equipped for sewing shop and
ironing shop. Trough-shape lighting fixture has an illuminous intensity distribution curve as
shown Figure 5.4.6-1 and its light flux goes upper direction too. This upper-going light flux
does not contribute to illuminance of working table, that is waste light flux.
Therefore, the fixture losses effective illuminance and is not suitable for lighting of working
place.
Energy conservation activities are the activities to discover waste like this and to remove it.
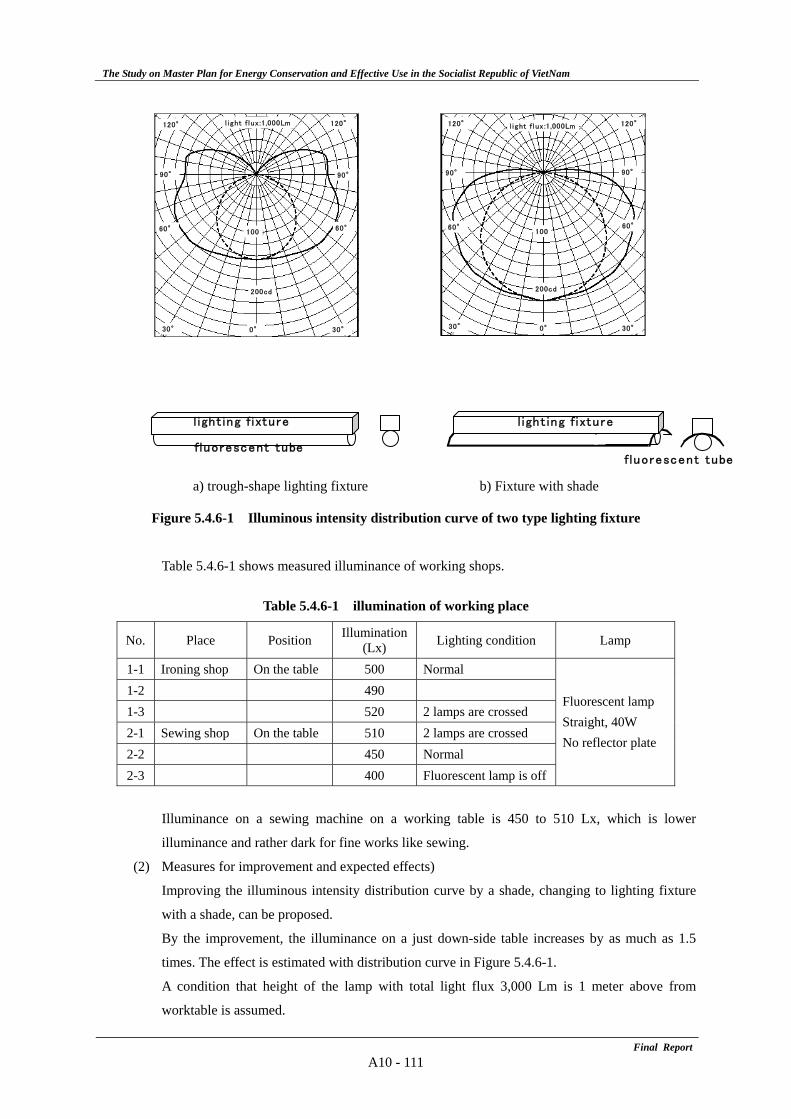
The Study on Master Plan for Energy Conservation and Effective Use in the Socialist Republic of VietNam
Final ReportA10 - 111
a) trough-shape lighting fixture b) Fixture with shade
Figure 5.4.6-1 Illuminous intensity distribution curve of two type lighting fixture
Table 5.4.6-1 shows measured illuminance of working shops.
Table 5.4.6-1 illumination of working place
No. Place Position Illumination(Lx) Lighting condition Lamp
1-1 Ironing shop On the table 500 Normal 1-2 490 1-3 520 2 lamps are crossed 2-1 Sewing shop On the table 510 2 lamps are crossed 2-2 450 Normal 2-3 400 Fluorescent lamp is off
Fluorescent lamp Straight, 40W No reflector plate
Illuminance on a sewing machine on a working table is 450 to 510 Lx, which is lower
illuminance and rather dark for fine works like sewing.
(2) Measures for improvement and expected effects)
Improving the illuminous intensity distribution curve by a shade, changing to lighting fixture
with a shade, can be proposed.
By the improvement, the illuminance on a just down-side table increases by as much as 1.5
times. The effect is estimated with distribution curve in Figure 5.4.6-1.
A condition that height of the lamp with total light flux 3,000 Lm is 1 meter above from
worktable is assumed.
l i g ht f l ux :1,000Lm 120°120°
90° 90°
60°60° 100
200cd
0°30° 30°
100
200cd
0°30° 30°
60°60°
90° 90°
120°120° l ight f l ux :1,000Lm
l ight ing fixture
fluorescent tube
l ight ing f ixture
fluorescent tube
The Study on Master Plan for Energy Conservation and Effective Use in the Socialist Republic of VietNam
Final ReportA10 - 112
In case of trough-shape lighting fixture;
From Figure 5.4.6-1 a), luminance of lamp with light flux 1,000 Lm is 145 cd for 0-degree
direction.
Illuminace by lamp with total light flux 3,000 Lm is calculated as follows.
Illuminance: 3 × 145cd / (1m)2 = 435Lx
In case of fixture with shade;
From Figure 5.4.6-1 b), luminance of lamp with light flux 1,000 Lm is 220 cd for 0-degree
direction.
Illuminace by lamp with total light flux 3,000 Lm is calculated as follows.
Illuminance: 3 × 220cd / (1m)2 = 660Lx
The illluminance is improved by 660Lx / 435Lx = 1.5.
Illuminance on worktable is estimated as 680 to 760 Lx by referring to measured data.
Here, evaluation of energy conservation is studied.
Energy intensity is used as a standard of evaluation. Energy intensity is defined as following
equation.
Energy intensity = amount of energy consumption / amount of production or like this
There are two ways for improving the energy intensity.
a) Decreasing value of the denominator: “reducing energy consumption”
b) Increasing value of the numerator: “increasing production”
Only the reducing and/or saving are likely taken account when it comes to energy
conservation.
However, especially in factory case, activities with a viewpoint of increasing the productivity
bring sometimes more fruitful effect in general.
Which of these is selected as strategy depends on manager’s attitude and opinion.
Many lighting fixtures and lamps in not only sewing shop and ironing shop but also other
shops are not clean enough. Scheduled cleaning should be necessary.
As an effective countermeasure that enhances illuminances and makes cleaning works easier,
putting a reflection plate on a fluorescent lamp can be introduced. Figure 5.4.6-2 shows an
overview of a refractor attached on a lamp.
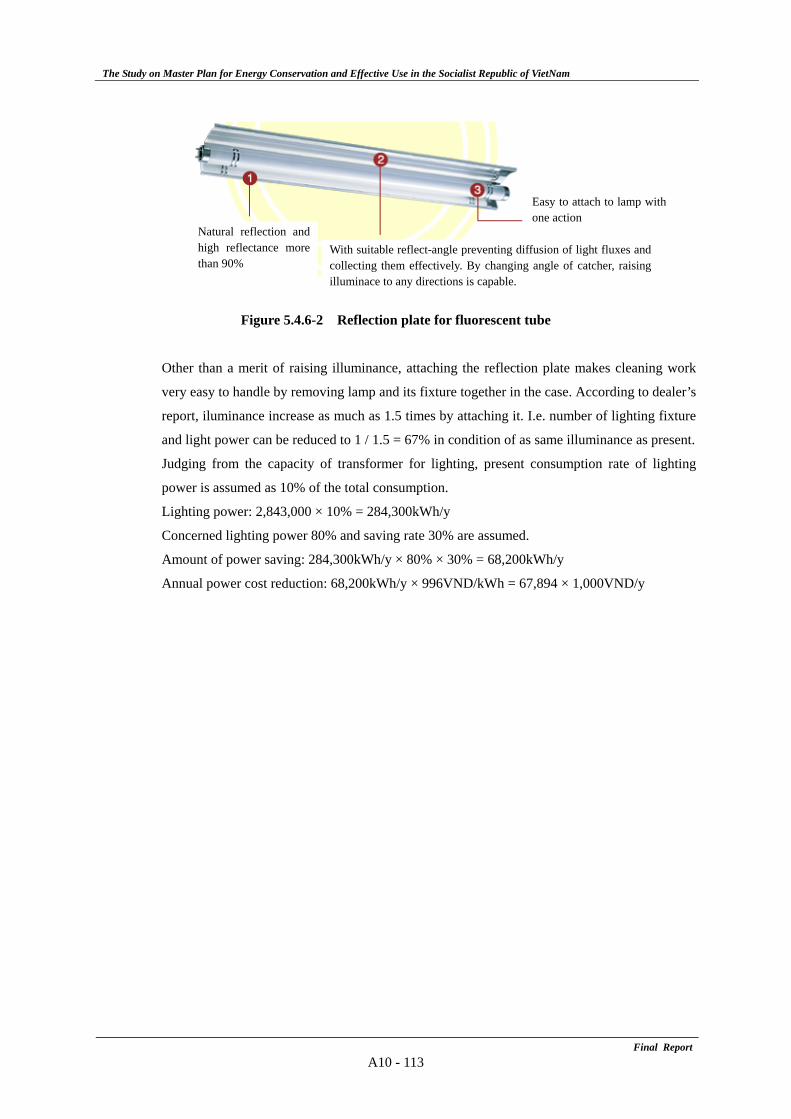
The Study on Master Plan for Energy Conservation and Effective Use in the Socialist Republic of VietNam
Final ReportA10 - 113
Figure 5.4.6-2 Reflection plate for fluorescent tube
Other than a merit of raising illuminance, attaching the reflection plate makes cleaning work
very easy to handle by removing lamp and its fixture together in the case. According to dealer’s
report, iluminance increase as much as 1.5 times by attaching it. I.e. number of lighting fixture
and light power can be reduced to 1 / 1.5 = 67% in condition of as same illuminance as present.
Judging from the capacity of transformer for lighting, present consumption rate of lighting
power is assumed as 10% of the total consumption.
Lighting power: 2,843,000 × 10% = 284,300kWh/y
Concerned lighting power 80% and saving rate 30% are assumed.
Amount of power saving: 284,300kWh/y × 80% × 30% = 68,200kWh/y
Annual power cost reduction: 68,200kWh/y × 996VND/kWh = 67,894 × 1,000VND/y
Natural reflection and high reflectance more than 90%
Easy to attach to lamp with one action
With suitable reflect-angle preventing diffusion of light fluxes and collecting them effectively. By changing angle of catcher, raising illuminace to any directions is capable.
The Study on Master Plan for Energy Conservation and Effective Use in the Socialist Republic of VietNam
Final ReportA10 - 114
6. Food Processing Factory F
6.1 Introduction
1) Name: Food Processing Factory F
2) Address: HCM City
3) Description of Business
(1) Su-sector of industry: Food processing
(2) Main product: Fresh Milk, Yoghurt, Canned Milk, Plastic Spoon,
(3) Start of operation: 2003
(4) Amount of product: 28,418kL (2007)
(5) Export: none
(6) Employee: 300
4) Person in charge of energy on-site survey: Vice-president, 1 - Machinery engineer
5) Outline of factory
This factory belongs to a group of the state-run enterprise and collects milk from the farm around
Ho Chi Minh City, and manufactures fresh milk and yogurt.
The Factory manufactures container and spoon of lactic acid drink with plastic injection machines
besides fresh milk and has a manufacturing line for canned milk.
This factory introduced from Denmark, France and Germany in 2003.
6.2 Outline of energy on-site Survey
1) Survey member
JICA Study Team: Mr. Norio Fukushima, Mr. Wataru Ishikawa, Mr. Hisashi Amano
Institute of Energy: Mr.Hung, Mr. Auh
ENERTEAM: Mr.Vinh
2) Survey period: November 10th and 11th, 2008
6.3 Results of energy on-site survey
1) Improvement proposal items and the expected effect after improvement measure implementation
are shown in Table 6.3-1
The EE&C potential in the present equipment is 16.2%
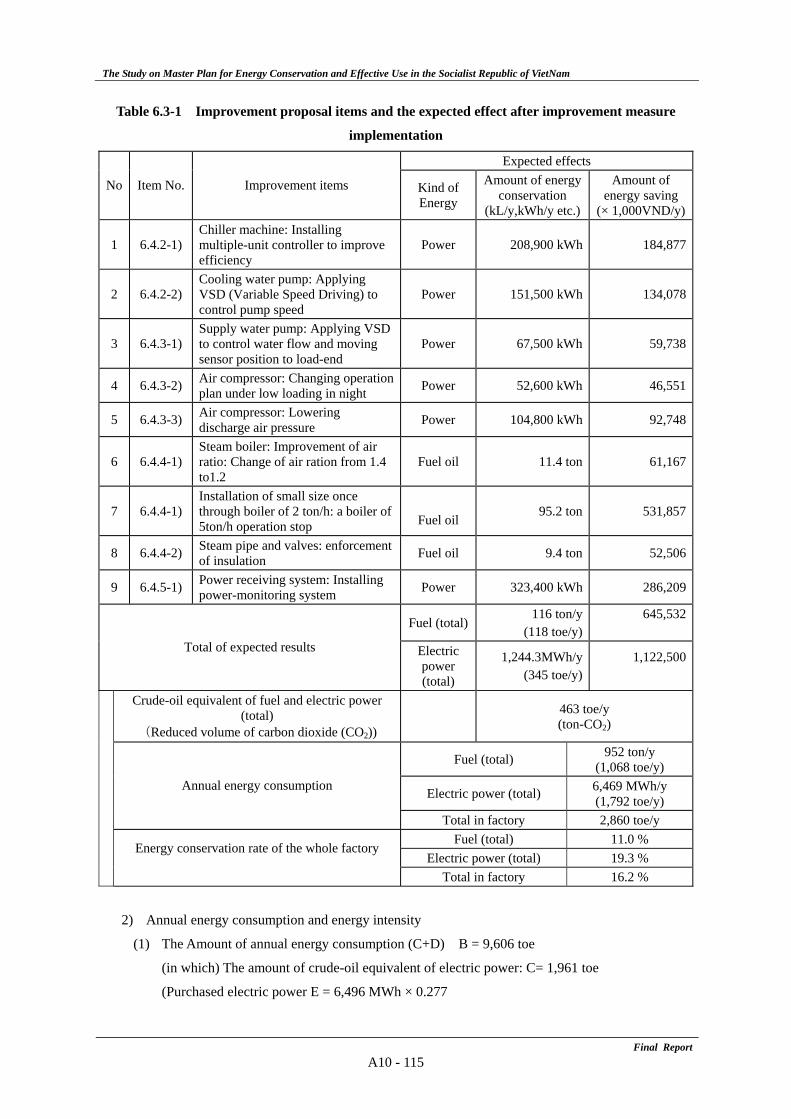
The Study on Master Plan for Energy Conservation and Effective Use in the Socialist Republic of VietNam
Final ReportA10 - 115
Table 6.3-1 Improvement proposal items and the expected effect after improvement measure
implementation
Expected effects
No Item No. Improvement items Kind of Energy
Amount of energy conservation
(kL/y,kWh/y etc.)
Amount of energy saving
(× 1,000VND/y)
1 6.4.2-1) Chiller machine: Installing multiple-unit controller to improve efficiency
Power 208,900 kWh 184,877
2 6.4.2-2) Cooling water pump: Applying VSD (Variable Speed Driving) to control pump speed
Power 151,500 kWh 134,078
3 6.4.3-1) Supply water pump: Applying VSD to control water flow and moving sensor position to load-end
Power 67,500 kWh 59,738
4 6.4.3-2) Air compressor: Changing operation plan under low loading in night Power 52,600 kWh 46,551
5 6.4.3-3) Air compressor: Lowering discharge air pressure Power 104,800 kWh 92,748
6 6.4.4-1) Steam boiler: Improvement of air ratio: Change of air ration from 1.4 to1.2
Fuel oil 11.4 ton 61,167
7 6.4.4-1) Installation of small size once through boiler of 2 ton/h: a boiler of 5ton/h operation stop
Fuel oil
95.2 ton 531,857
8 6.4.4-2) Steam pipe and valves: enforcement of insulation Fuel oil 9.4 ton 52,506
9 6.4.5-1) Power receiving system: Installing power-monitoring system Power 323,400 kWh 286,209
Fuel (total)116 ton/y
(118 toe/y) 645,532
Total of expected results Electric power (total)
1,244.3MWh/y (345 toe/y)
1,122,500
Crude-oil equivalent of fuel and electric power (total)
(Reduced volume of carbon dioxide (CO2)) 463 toe/y
(ton-CO2)
Fuel (total) 952 ton/y (1,068 toe/y)
Electric power (total) 6,469 MWh/y (1,792 toe/y)
Annual energy consumption
Total in factory 2,860 toe/y
Fuel (total) 11.0 %
Energy conservation rate of the whole factory Electric power (total) 19.3 %
Total in factory 16.2 %
2) Annual energy consumption and energy intensity
(1) The Amount of annual energy consumption (C+D) B = 9,606 toe
(in which) The amount of crude-oil equivalent of electric power: C= 1,961 toe
(Purchased electric power E = 6,496 MWh × 0.277
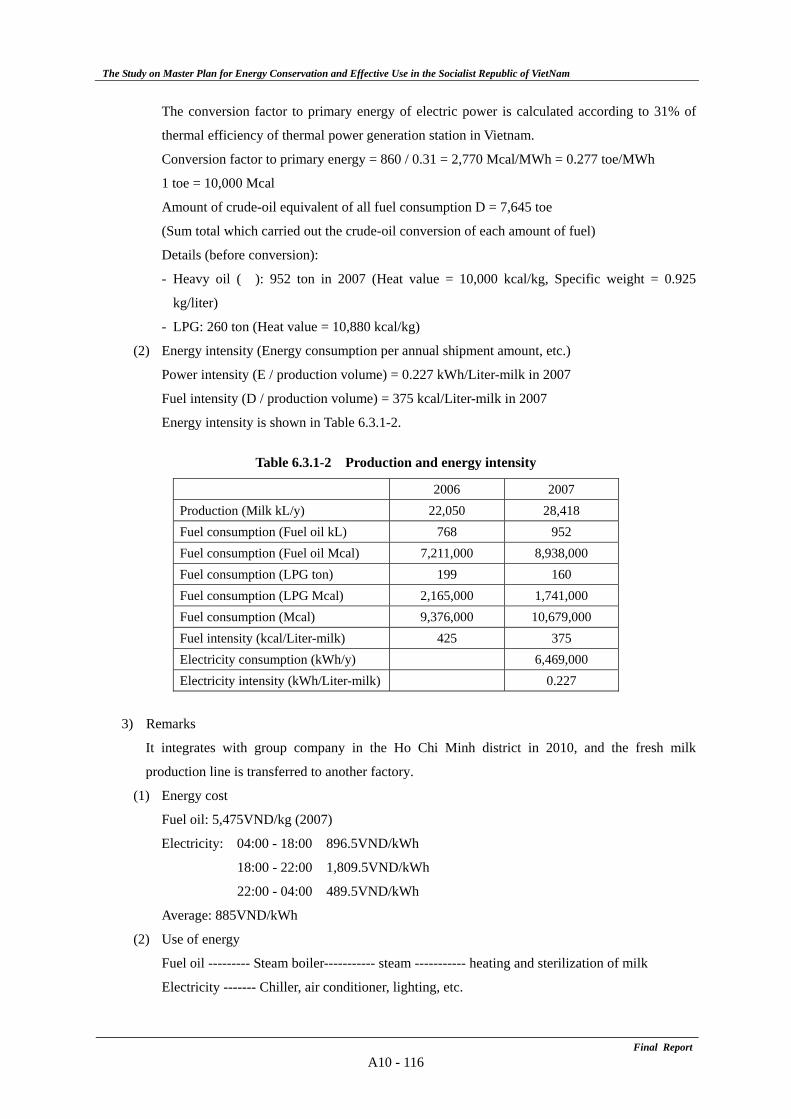
The Study on Master Plan for Energy Conservation and Effective Use in the Socialist Republic of VietNam
Final ReportA10 - 116
The conversion factor to primary energy of electric power is calculated according to 31% of
thermal efficiency of thermal power generation station in Vietnam.
Conversion factor to primary energy = 860 / 0.31 = 2,770 Mcal/MWh = 0.277 toe/MWh
1 toe = 10,000 Mcal
Amount of crude-oil equivalent of all fuel consumption D = 7,645 toe
(Sum total which carried out the crude-oil conversion of each amount of fuel)
Details (before conversion):
- Heavy oil ( ): 952 ton in 2007 (Heat value = 10,000 kcal/kg, Specific weight = 0.925
kg/liter)
- LPG: 260 ton (Heat value = 10,880 kcal/kg)
(2) Energy intensity (Energy consumption per annual shipment amount, etc.)
Power intensity (E / production volume) = 0.227 kWh/Liter-milk in 2007
Fuel intensity (D / production volume) = 375 kcal/Liter-milk in 2007
Energy intensity is shown in Table 6.3.1-2.
Table 6.3.1-2 Production and energy intensity
2006 2007 Production (Milk kL/y) 22,050 28,418 Fuel consumption (Fuel oil kL) 768 952 Fuel consumption (Fuel oil Mcal) 7,211,000 8,938,000 Fuel consumption (LPG ton) 199 160 Fuel consumption (LPG Mcal) 2,165,000 1,741,000 Fuel consumption (Mcal) 9,376,000 10,679,000 Fuel intensity (kcal/Liter-milk) 425 375 Electricity consumption (kWh/y) 6,469,000 Electricity intensity (kWh/Liter-milk) 0.227
3) Remarks
It integrates with group company in the Ho Chi Minh district in 2010, and the fresh milk
production line is transferred to another factory.
(1) Energy cost
Fuel oil: 5,475VND/kg (2007)
Electricity: 04:00 - 18:00 896.5VND/kWh
18:00 - 22:00 1,809.5VND/kWh
22:00 - 04:00 489.5VND/kWh
Average: 885VND/kWh
(2) Use of energy
Fuel oil --------- Steam boiler----------- steam ----------- heating and sterilization of milk
Electricity ------- Chiller, air conditioner, lighting, etc.
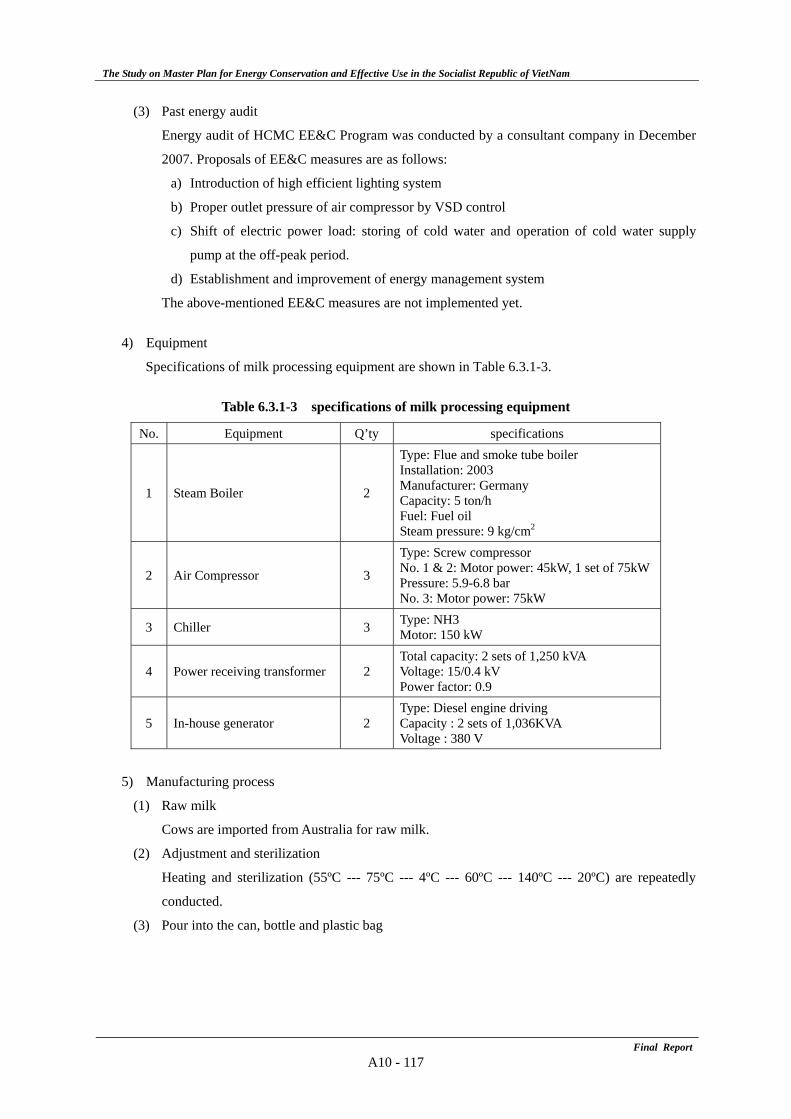
The Study on Master Plan for Energy Conservation and Effective Use in the Socialist Republic of VietNam
Final ReportA10 - 117
(3) Past energy audit
Energy audit of HCMC EE&C Program was conducted by a consultant company in December
2007. Proposals of EE&C measures are as follows:
a) Introduction of high efficient lighting system
b) Proper outlet pressure of air compressor by VSD control
c) Shift of electric power load: storing of cold water and operation of cold water supply
pump at the off-peak period.
d) Establishment and improvement of energy management system
The above-mentioned EE&C measures are not implemented yet.
4) Equipment
Specifications of milk processing equipment are shown in Table 6.3.1-3.
Table 6.3.1-3 specifications of milk processing equipment
No. Equipment Q’ty specifications
1 Steam Boiler 2
Type: Flue and smoke tube boiler Installation: 2003 Manufacturer: Germany Capacity: 5 ton/h Fuel: Fuel oil Steam pressure: 9 kg/cm2
2 Air Compressor 3
Type: Screw compressor No. 1 & 2: Motor power: 45kW, 1 set of 75kW Pressure: 5.9-6.8 bar No. 3: Motor power: 75kW
3 Chiller 3 Type: NH3 Motor: 150 kW
4 Power receiving transformer 2 Total capacity: 2 sets of 1,250 kVA Voltage: 15/0.4 kV Power factor: 0.9
5 In-house generator 2 Type: Diesel engine driving Capacity : 2 sets of 1,036KVA Voltage : 380 V
5) Manufacturing process
(1) Raw milk
Cows are imported from Australia for raw milk.
(2) Adjustment and sterilization
Heating and sterilization (55ºC --- 75ºC --- 4ºC --- 60ºC --- 140ºC --- 20ºC) are repeatedly
conducted.
(3) Pour into the can, bottle and plastic bag
The Study on Master Plan for Energy Conservation and Effective Use in the Socialist Republic of VietNam
Final ReportA10 - 118
(4) Inspection, packing and delivery
Original milk (milk, sugar, butter) → Mixing → pasteurization, homogenizing →
→ Cool storage → Pasteurization, homogenizing → Pour into can, bottle →
→ Packing → Delivery
Figure 6.3.1-4 Flow sheet of milk processing process
6.4 On-site survey report
6.4.1 Activity of energy management
1) Energy management organization
(1) Present condition and problems
Organized communication is held smoothly with 4 heat engineers and 12 electrical engineers,
though energy management organization is not established.
Target of energy conservation is not set up due to low energy price.
Awareness on energy conservation of manager is low, and energy conservation measures of the
energy audit executed in November, 2007 are not implemented.
(2) Measures for improvement
It is important that top management of the factory has awareness of EE&C and implement
energy conservation activities.
2) Implementation of measurement and record
(1) Present condition and problems
Collection and management of data of operation is regularly implemented, and management
criteria on operation are set up.
3) Maintenance management of equipment
(1) Present condition and problems
Fuel leakage and steam leakage of boilers and steam piping and malfunction of steam traps are
found and equipment is not managed enough though inspection and maintenance of equipment
is conducted.
Energy saving and automation of main equipment are advanced because of modern equipment,
but engineering of overall factory is not implemented sufficiently such as pressure control of
compressed air and the pressure setting of the feed-water pump. Piping system diagram of
water and compressed air are not maintained.
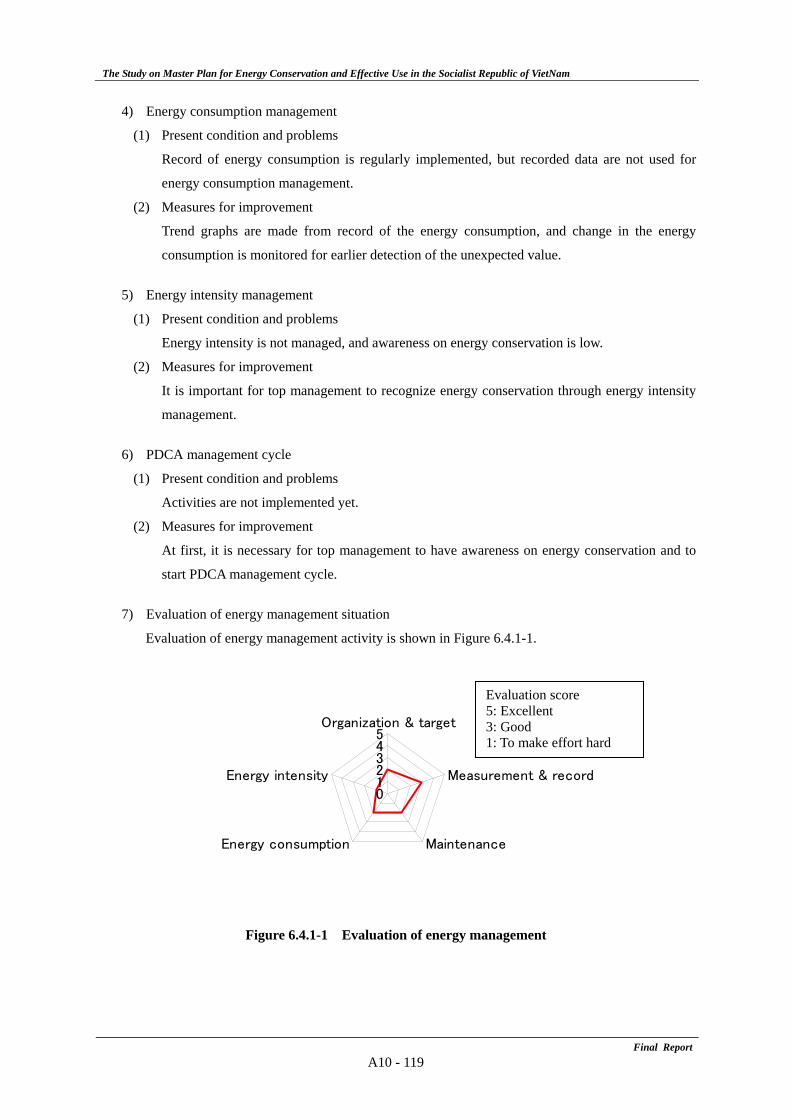
The Study on Master Plan for Energy Conservation and Effective Use in the Socialist Republic of VietNam
Final ReportA10 - 119
4) Energy consumption management
(1) Present condition and problems
Record of energy consumption is regularly implemented, but recorded data are not used for
energy consumption management.
(2) Measures for improvement
Trend graphs are made from record of the energy consumption, and change in the energy
consumption is monitored for earlier detection of the unexpected value.
5) Energy intensity management
(1) Present condition and problems
Energy intensity is not managed, and awareness on energy conservation is low.
(2) Measures for improvement
It is important for top management to recognize energy conservation through energy intensity
management.
6) PDCA management cycle
(1) Present condition and problems
Activities are not implemented yet.
(2) Measures for improvement
At first, it is necessary for top management to have awareness on energy conservation and to
start PDCA management cycle.
7) Evaluation of energy management situation
Evaluation of energy management activity is shown in Figure 6.4.1-1.
Figure 6.4.1-1 Evaluation of energy management
012345
Organization & target
Measurement & record
MaintenanceEnergy consumption
Energy intensity
Evaluation score 5: Excellent 3: Good 1: To make effort hard
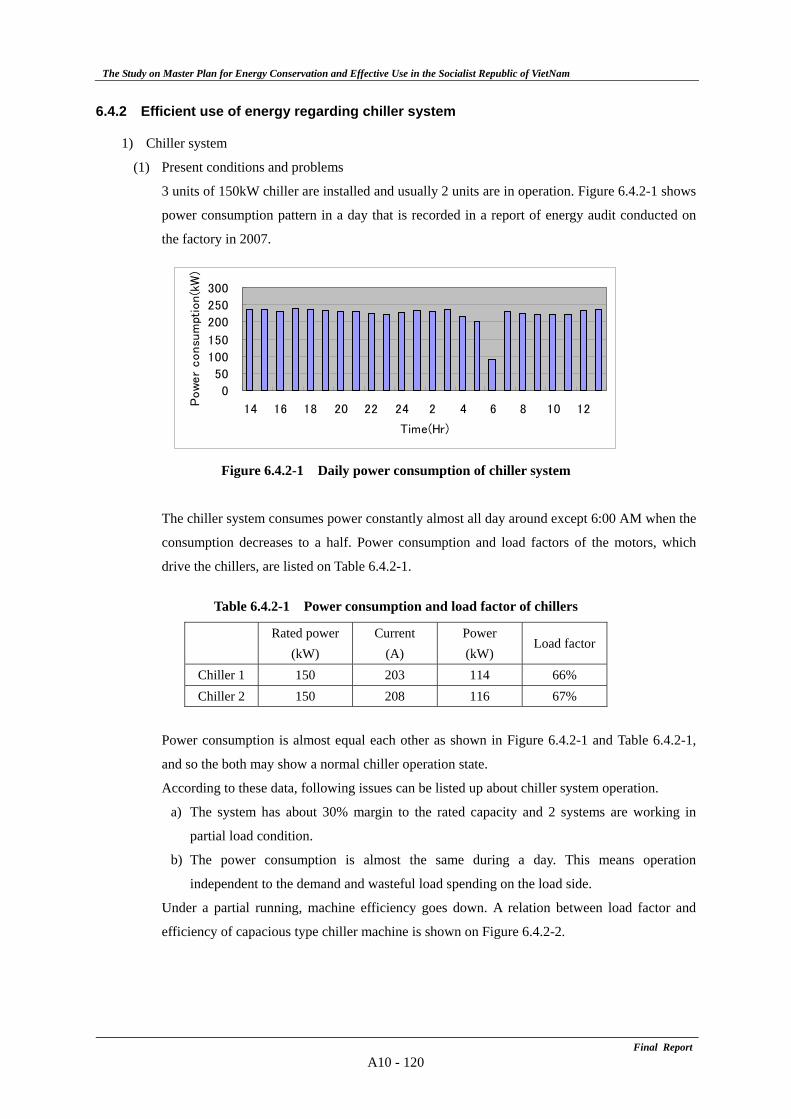
The Study on Master Plan for Energy Conservation and Effective Use in the Socialist Republic of VietNam
Final ReportA10 - 120
6.4.2 Efficient use of energy regarding chiller system
1) Chiller system
(1) Present conditions and problems
3 units of 150kW chiller are installed and usually 2 units are in operation. Figure 6.4.2-1 shows
power consumption pattern in a day that is recorded in a report of energy audit conducted on
the factory in 2007.
0
50
100
150
200
250
300
14 16 18 20 22 24 2 4 6 8 10 12
Time(Hr)
Pow
er
consu
mpt
ion(k
W)
Figure 6.4.2-1 Daily power consumption of chiller system
The chiller system consumes power constantly almost all day around except 6:00 AM when the
consumption decreases to a half. Power consumption and load factors of the motors, which
drive the chillers, are listed on Table 6.4.2-1.
Table 6.4.2-1 Power consumption and load factor of chillers
Rated power
(kW) Current
(A) Power (kW)
Load factor
Chiller 1 150 203 114 66% Chiller 2 150 208 116 67%
Power consumption is almost equal each other as shown in Figure 6.4.2-1 and Table 6.4.2-1,
and so the both may show a normal chiller operation state.
According to these data, following issues can be listed up about chiller system operation.
a) The system has about 30% margin to the rated capacity and 2 systems are working in
partial load condition.
b) The power consumption is almost the same during a day. This means operation
independent to the demand and wasteful load spending on the load side.
Under a partial running, machine efficiency goes down. A relation between load factor and
efficiency of capacious type chiller machine is shown on Figure 6.4.2-2.
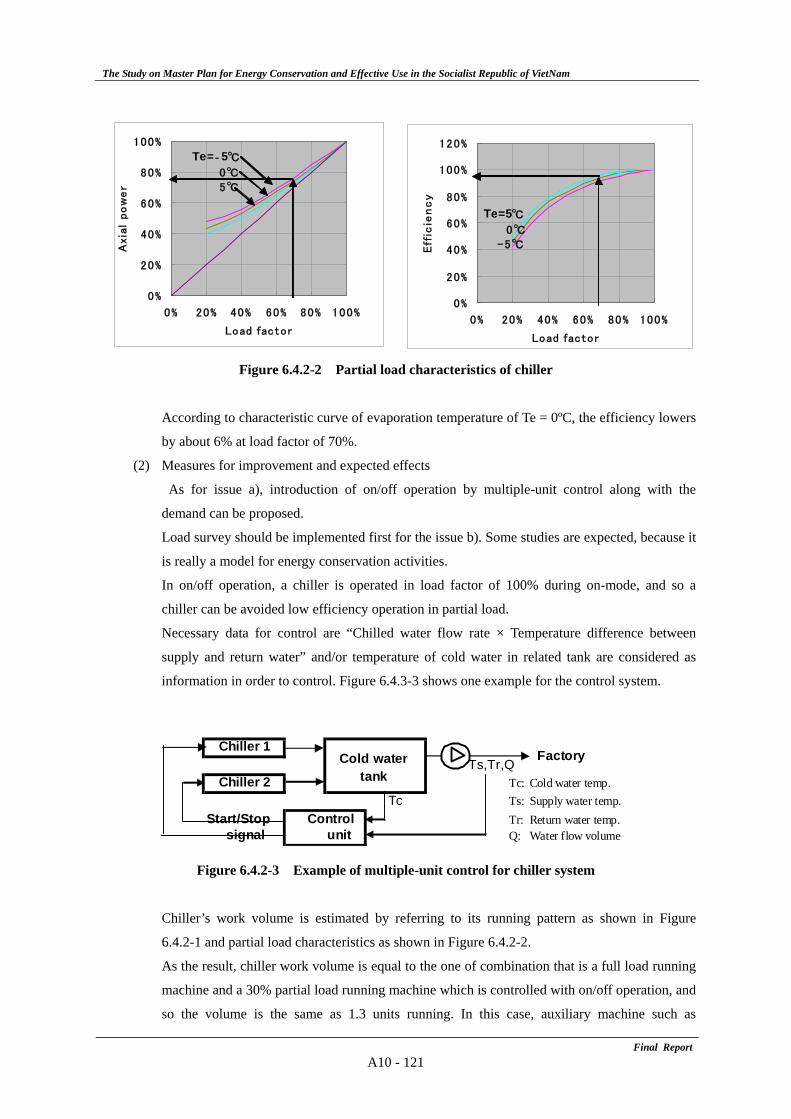
The Study on Master Plan for Energy Conservation and Effective Use in the Socialist Republic of VietNam
Final ReportA10 - 121
Figure 6.4.2-2 Partial load characteristics of chiller
According to characteristic curve of evaporation temperature of Te = 0ºC, the efficiency lowers
by about 6% at load factor of 70%.
(2) Measures for improvement and expected effects
As for issue a), introduction of on/off operation by multiple-unit control along with the
demand can be proposed.
Load survey should be implemented first for the issue b). Some studies are expected, because it
is really a model for energy conservation activities.
In on/off operation, a chiller is operated in load factor of 100% during on-mode, and so a
chiller can be avoided low efficiency operation in partial load.
Necessary data for control are “Chilled water flow rate × Temperature difference between
supply and return water” and/or temperature of cold water in related tank are considered as
information in order to control. Figure 6.4.3-3 shows one example for the control system.
Ts,Tr,QTc: Cold water temp.
Tc Ts: Supply water temp.Start/Stop Control Tr: Return water temp.
signal unit Q: Water flow volume
Chiller 1
Chiller 2
FactoryCold watertank
Figure 6.4.2-3 Example of multiple-unit control for chiller system
Chiller’s work volume is estimated by referring to its running pattern as shown in Figure
6.4.2-1 and partial load characteristics as shown in Figure 6.4.2-2.
As the result, chiller work volume is equal to the one of combination that is a full load running
machine and a 30% partial load running machine which is controlled with on/off operation, and
so the volume is the same as 1.3 units running. In this case, auxiliary machine such as
0%
20%
40%
60%
80%
100%
0% 20% 40% 60% 80% 100%
Load factor
Axia
l po
we
r
0 %
20%
40%
60%
80%
100%
120%
0% 20% 40% 60% 80% 100%
Load factor
Eff
icie
nc
y
Te=‐5℃
0℃ 5℃
Te=5℃
0℃ -5℃
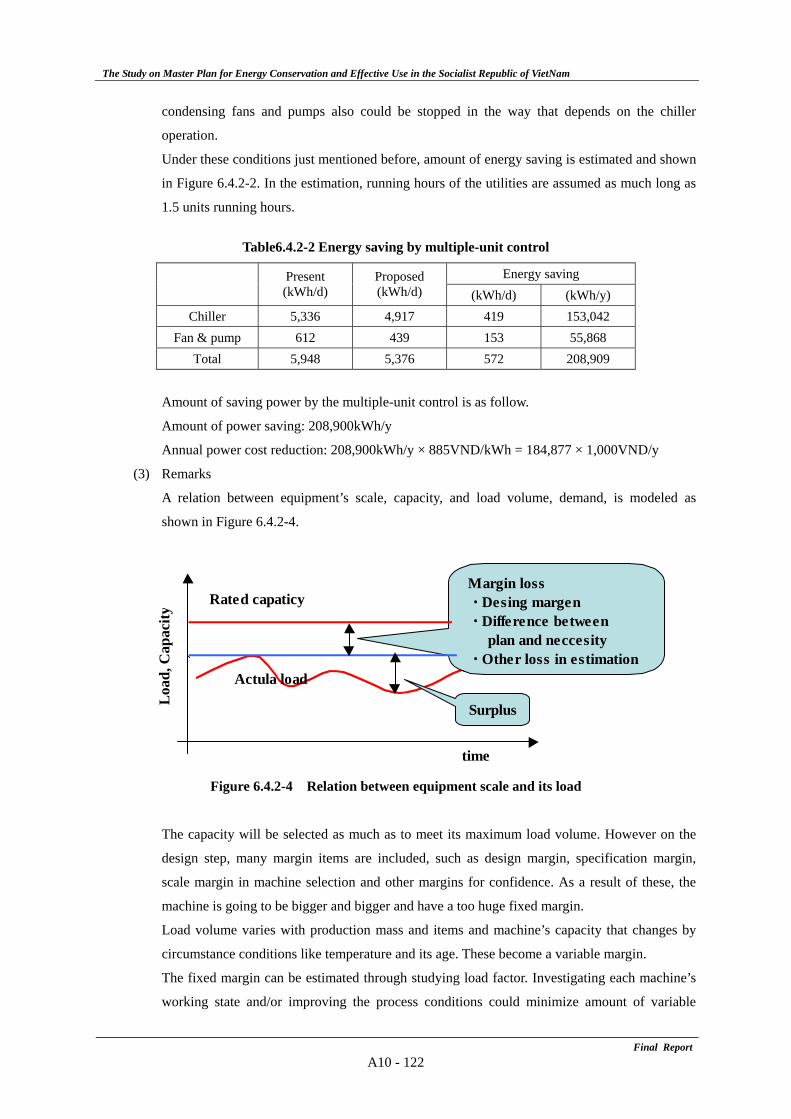
The Study on Master Plan for Energy Conservation and Effective Use in the Socialist Republic of VietNam
Final ReportA10 - 122
condensing fans and pumps also could be stopped in the way that depends on the chiller
operation.
Under these conditions just mentioned before, amount of energy saving is estimated and shown
in Figure 6.4.2-2. In the estimation, running hours of the utilities are assumed as much long as
1.5 units running hours.
Table6.4.2-2 Energy saving by multiple-unit control
Energy saving Present
(kWh/d) Proposed (kWh/d) (kWh/d) (kWh/y)
Chiller 5,336 4,917 419 153,042 Fan & pump 612 439 153 55,868
Total 5,948 5,376 572 208,909
Amount of saving power by the multiple-unit control is as follow.
Amount of power saving: 208,900kWh/y
Annual power cost reduction: 208,900kWh/y × 885VND/kWh = 184,877 × 1,000VND/y
(3) Remarks
A relation between equipment’s scale, capacity, and load volume, demand, is modeled as
shown in Figure 6.4.2-4.
Figure 6.4.2-4 Relation between equipment scale and its load
The capacity will be selected as much as to meet its maximum load volume. However on the
design step, many margin items are included, such as design margin, specification margin,
scale margin in machine selection and other margins for confidence. As a result of these, the
machine is going to be bigger and bigger and have a too huge fixed margin.
Load volume varies with production mass and items and machine’s capacity that changes by
circumstance conditions like temperature and its age. These become a variable margin.
The fixed margin can be estimated through studying load factor. Investigating each machine’s
working state and/or improving the process conditions could minimize amount of variable
time
Loa
d, C
apac
ity
Margin loss ・ Desing margen ・ Difference between plan and neccesity・ Other loss in estimation
Surplus
Rated capaticy
Actula load
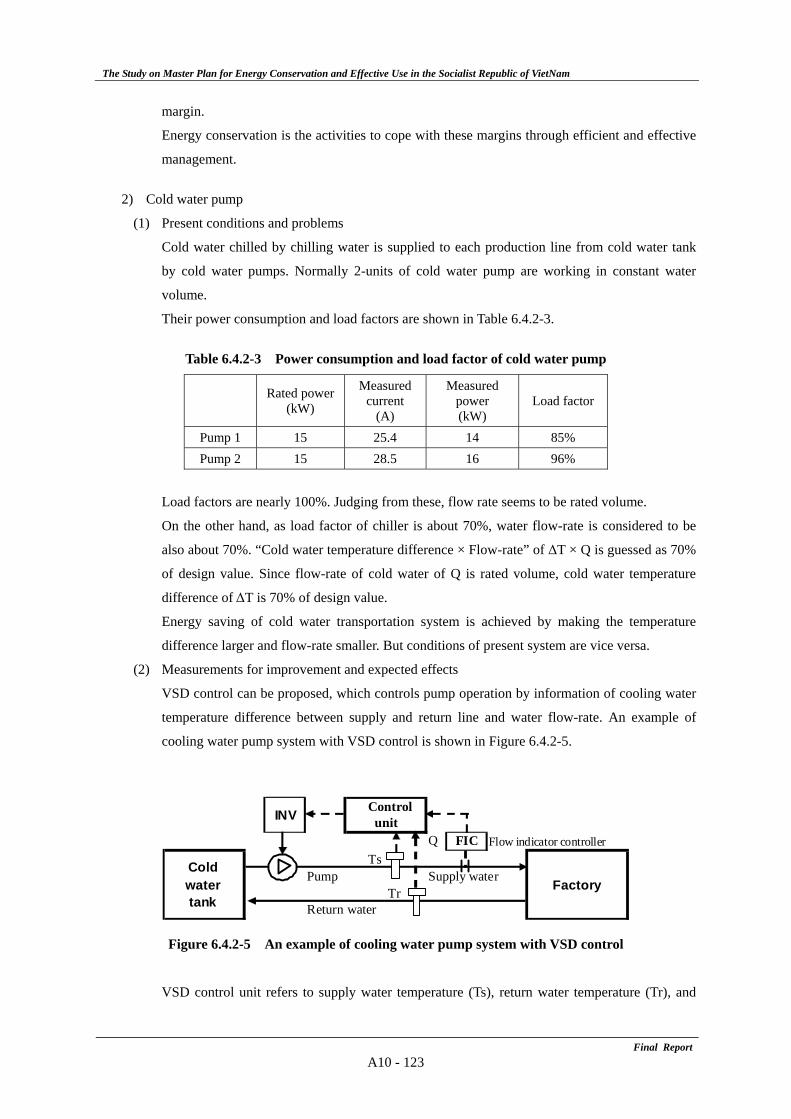
The Study on Master Plan for Energy Conservation and Effective Use in the Socialist Republic of VietNam
Final ReportA10 - 123
margin.
Energy conservation is the activities to cope with these margins through efficient and effective
management.
2) Cold water pump
(1) Present conditions and problems
Cold water chilled by chilling water is supplied to each production line from cold water tank
by cold water pumps. Normally 2-units of cold water pump are working in constant water
volume.
Their power consumption and load factors are shown in Table 6.4.2-3.
Table 6.4.2-3 Power consumption and load factor of cold water pump
Rated power(kW)
Measured current
(A)
Measured power (kW)
Load factor
Pump 1 15 25.4 14 85% Pump 2 15 28.5 16 96%
Load factors are nearly 100%. Judging from these, flow rate seems to be rated volume.
On the other hand, as load factor of chiller is about 70%, water flow-rate is considered to be
also about 70%. “Cold water temperature difference × Flow-rate” of ΔT × Q is guessed as 70%
of design value. Since flow-rate of cold water of Q is rated volume, cold water temperature
difference of ΔT is 70% of design value.
Energy saving of cold water transportation system is achieved by making the temperature
difference larger and flow-rate smaller. But conditions of present system are vice versa.
(2) Measurements for improvement and expected effects
VSD control can be proposed, which controls pump operation by information of cooling water
temperature difference between supply and return line and water flow-rate. An example of
cooling water pump system with VSD control is shown in Figure 6.4.2-5.
Control unit
Q FIC Flow indicator controllerTs
Pump Supply waterTr
Return water
Factory
INV
Coldwatertank
Figure 6.4.2-5 An example of cooling water pump system with VSD control
VSD control unit refers to supply water temperature (Ts), return water temperature (Tr), and
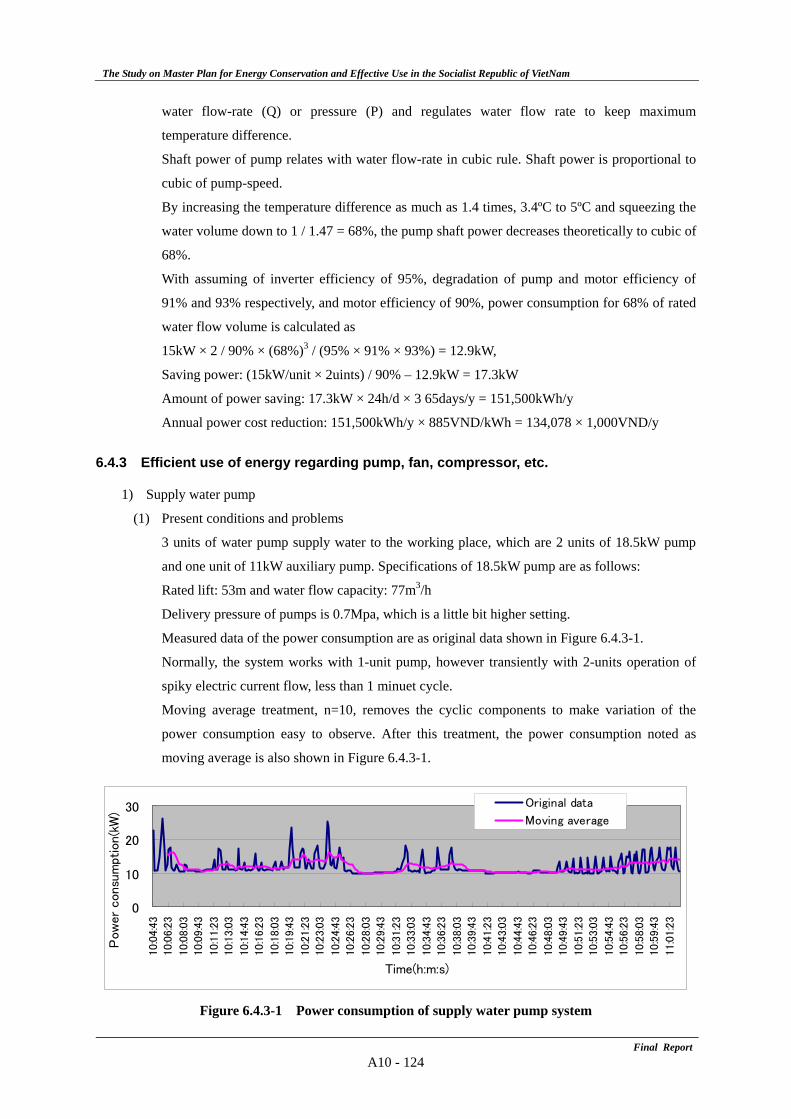
The Study on Master Plan for Energy Conservation and Effective Use in the Socialist Republic of VietNam
Final ReportA10 - 124
water flow-rate (Q) or pressure (P) and regulates water flow rate to keep maximum
temperature difference.
Shaft power of pump relates with water flow-rate in cubic rule. Shaft power is proportional to
cubic of pump-speed.
By increasing the temperature difference as much as 1.4 times, 3.4ºC to 5ºC and squeezing the
water volume down to 1 / 1.47 = 68%, the pump shaft power decreases theoretically to cubic of
68%.
With assuming of inverter efficiency of 95%, degradation of pump and motor efficiency of
91% and 93% respectively, and motor efficiency of 90%, power consumption for 68% of rated
water flow volume is calculated as
15kW × 2 / 90% × (68%)3 / (95% × 91% × 93%) = 12.9kW,
Saving power: (15kW/unit × 2uints) / 90% – 12.9kW = 17.3kW
Amount of power saving: 17.3kW × 24h/d × 3 65days/y = 151,500kWh/y
Annual power cost reduction: 151,500kWh/y × 885VND/kWh = 134,078 × 1,000VND/y
6.4.3 Efficient use of energy regarding pump, fan, compressor, etc.
1) Supply water pump
(1) Present conditions and problems
3 units of water pump supply water to the working place, which are 2 units of 18.5kW pump
and one unit of 11kW auxiliary pump. Specifications of 18.5kW pump are as follows:
Rated lift: 53m and water flow capacity: 77m3/h
Delivery pressure of pumps is 0.7Mpa, which is a little bit higher setting.
Measured data of the power consumption are as original data shown in Figure 6.4.3-1.
Normally, the system works with 1-unit pump, however transiently with 2-units operation of
spiky electric current flow, less than 1 minuet cycle.
Moving average treatment, n=10, removes the cyclic components to make variation of the
power consumption easy to observe. After this treatment, the power consumption noted as
moving average is also shown in Figure 6.4.3-1.
0
10
20
30
10:0
4:4
3
10:0
6:2
3
10:0
8:0
3
10:0
9:4
3
10:1
1:2
3
10:1
3:0
3
10:1
4:4
3
10:1
6:2
3
10:1
8:0
3
10:1
9:4
3
10:2
1:2
3
10:2
3:0
3
10:2
4:4
3
10:2
6:2
3
10:2
8:0
3
10:2
9:4
3
10:3
1:2
3
10:3
3:0
3
10:3
4:4
3
10:3
6:2
3
10:3
8:0
3
10:3
9:4
3
10:4
1:2
3
10:4
3:0
3
10:4
4:4
3
10:4
6:2
3
10:4
8:0
3
10:4
9:4
3
10:5
1:2
3
10:5
3:0
3
10:5
4:4
3
10:5
6:2
3
10:5
8:0
3
10:5
9:4
3
11:0
1:2
3
Time(h:m:s)
Pow
er
consu
mpt
ion(k
W)
Original data
Moving average
Figure 6.4.3-1 Power consumption of supply water pump system
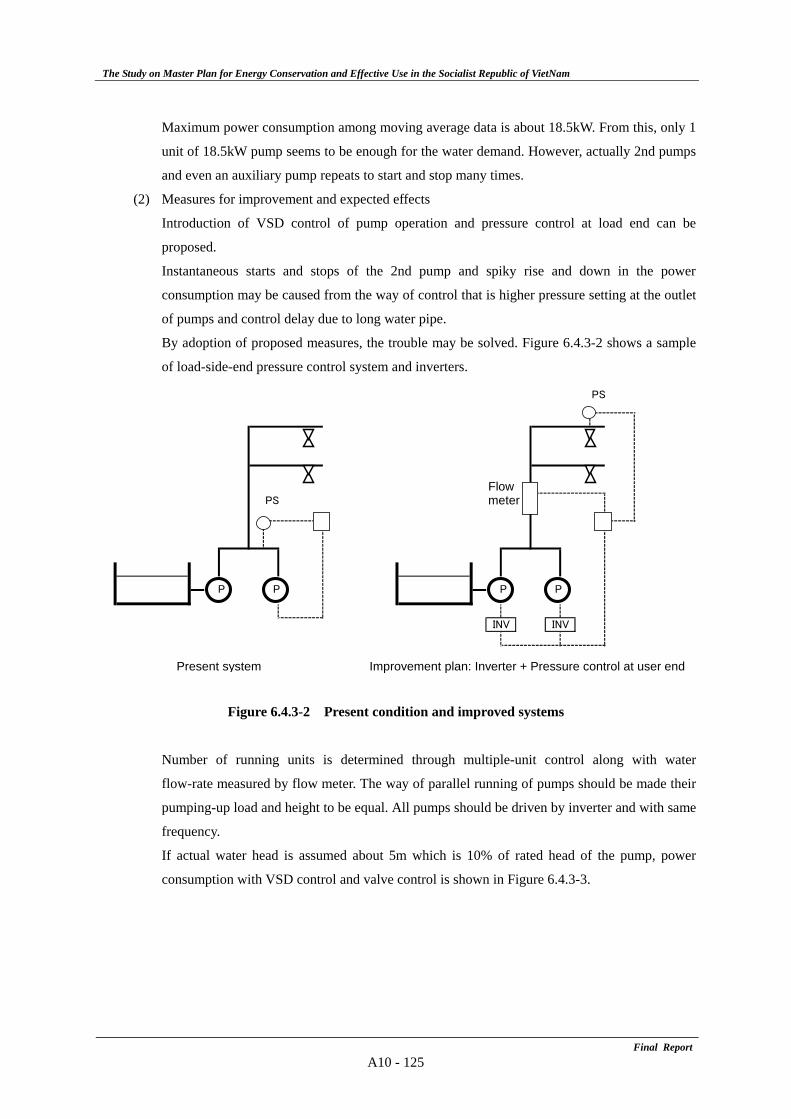
The Study on Master Plan for Energy Conservation and Effective Use in the Socialist Republic of VietNam
Final ReportA10 - 125
Maximum power consumption among moving average data is about 18.5kW. From this, only 1
unit of 18.5kW pump seems to be enough for the water demand. However, actually 2nd pumps
and even an auxiliary pump repeats to start and stop many times.
(2) Measures for improvement and expected effects
Introduction of VSD control of pump operation and pressure control at load end can be
proposed.
Instantaneous starts and stops of the 2nd pump and spiky rise and down in the power
consumption may be caused from the way of control that is higher pressure setting at the outlet
of pumps and control delay due to long water pipe.
By adoption of proposed measures, the trouble may be solved. Figure 6.4.3-2 shows a sample
of load-side-end pressure control system and inverters.
Figure 6.4.3-2 Present condition and improved systems
Number of running units is determined through multiple-unit control along with water
flow-rate measured by flow meter. The way of parallel running of pumps should be made their
pumping-up load and height to be equal. All pumps should be driven by inverter and with same
frequency.
If actual water head is assumed about 5m which is 10% of rated head of the pump, power
consumption with VSD control and valve control is shown in Figure 6.4.3-3.
PS
FlowPS meter
Present system Improvement plan: Inverter + Pressure control at user end
INV INV
P P P P
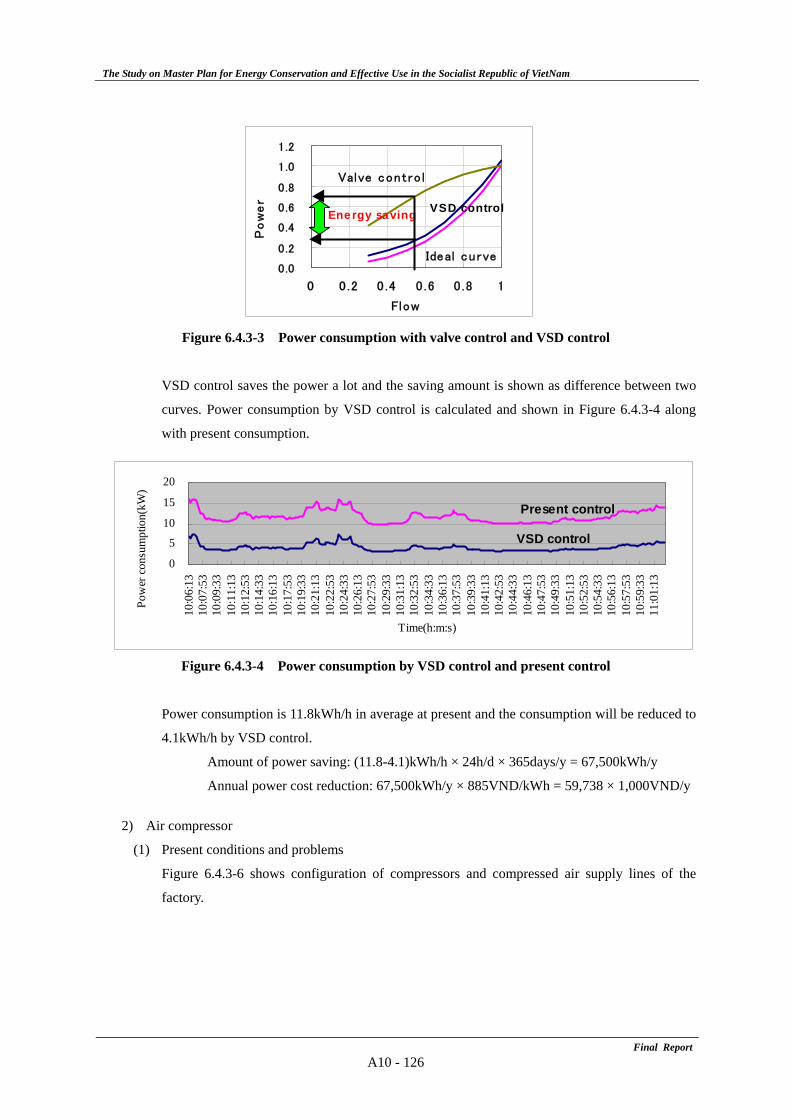
The Study on Master Plan for Energy Conservation and Effective Use in the Socialist Republic of VietNam
Final ReportA10 - 126
Figure 6.4.3-3 Power consumption with valve control and VSD control
VSD control saves the power a lot and the saving amount is shown as difference between two
curves. Power consumption by VSD control is calculated and shown in Figure 6.4.3-4 along
with present consumption.
Figure 6.4.3-4 Power consumption by VSD control and present control
Power consumption is 11.8kWh/h in average at present and the consumption will be reduced to
4.1kWh/h by VSD control.
Amount of power saving: (11.8-4.1)kWh/h × 24h/d × 365days/y = 67,500kWh/y
Annual power cost reduction: 67,500kWh/y × 885VND/kWh = 59,738 × 1,000VND/y
2) Air compressor
(1) Present conditions and problems
Figure 6.4.3-6 shows configuration of compressors and compressed air supply lines of the
factory.
0.0
0.2
0.4
0.6
0.8
1.0
1.2
0 0 .2 0 .4 0 .6 0 .8 1
Flow
Po
we
r
Valve contro l
Ideal curve
Energy saving VSD control
0
5
10
15
20
10:0
6:13
10:0
7:53
10:0
9:33
10:1
1:13
10:1
2:53
10:1
4:33
10:1
6:13
10:1
7:53
10:1
9:33
10:2
1:13
10:2
2:53
10:2
4:33
10:2
6:13
10:2
7:53
10:2
9:33
10:3
1:13
10:3
2:53
10:3
4:33
10:3
6:13
10:3
7:53
10:3
9:33
10:4
1:13
10:4
2:53
10:4
4:33
10:4
6:13
10:4
7:53
10:4
9:33
10:5
1:13
10:5
2:53
10:5
4:33
10:5
6:13
10:5
7:53
10:5
9:33
11:0
1:13
Time(h:m:s)
Pow
er c
onsu
mpt
ion(
kW)
Present control
VSD control
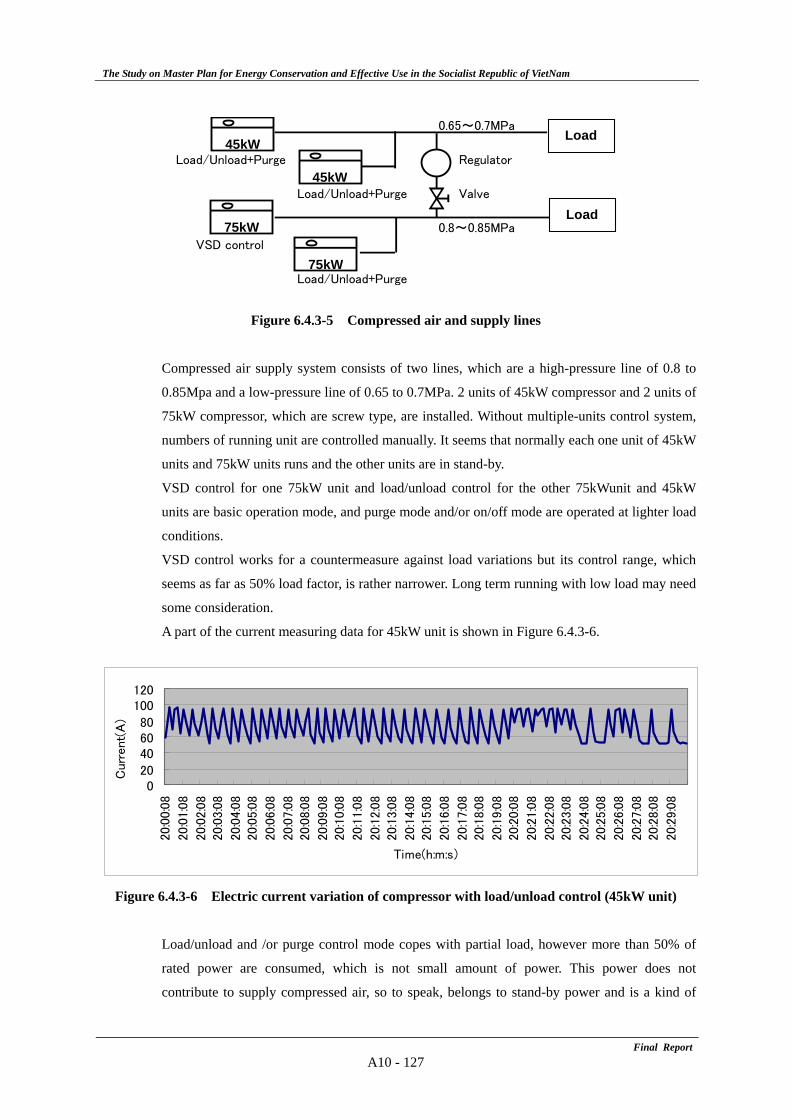
The Study on Master Plan for Energy Conservation and Effective Use in the Socialist Republic of VietNam
Final ReportA10 - 127
Figure 6.4.3-5 Compressed air and supply lines
Compressed air supply system consists of two lines, which are a high-pressure line of 0.8 to
0.85Mpa and a low-pressure line of 0.65 to 0.7MPa. 2 units of 45kW compressor and 2 units of
75kW compressor, which are screw type, are installed. Without multiple-units control system,
numbers of running unit are controlled manually. It seems that normally each one unit of 45kW
units and 75kW units runs and the other units are in stand-by.
VSD control for one 75kW unit and load/unload control for the other 75kWunit and 45kW
units are basic operation mode, and purge mode and/or on/off mode are operated at lighter load
conditions.
VSD control works for a countermeasure against load variations but its control range, which
seems as far as 50% load factor, is rather narrower. Long term running with low load may need
some consideration.
A part of the current measuring data for 45kW unit is shown in Figure 6.4.3-6.
Figure 6.4.3-6 Electric current variation of compressor with load/unload control (45kW unit)
Load/unload and /or purge control mode copes with partial load, however more than 50% of
rated power are consumed, which is not small amount of power. This power does not
contribute to supply compressed air, so to speak, belongs to stand-by power and is a kind of
020
406080
100120
20:0
0:0
8
20:0
1:0
8
20:0
2:0
8
20:0
3:0
8
20:0
4:0
8
20:0
5:0
8
20:0
6:0
8
20:0
7:0
8
20:0
8:0
8
20:0
9:0
8
20:1
0:0
8
20:1
1:0
8
20:1
2:0
8
20:1
3:0
8
20:1
4:0
8
20:1
5:0
8
20:1
6:0
8
20:1
7:0
8
20:1
8:0
8
20:1
9:0
8
20:2
0:0
8
20:2
1:0
8
20:2
2:0
8
20:2
3:0
8
20:2
4:0
8
20:2
5:0
8
20:2
6:0
8
20:2
7:0
8
20:2
8:0
8
20:2
9:0
8
Time(h:m:s)
Curr
ent(
A)
0.65~0.7MPa
Load/Unload+Purge Regulator
Load/Unload+Purge Valve
0.8~0.85MPa
VSD control
Load/Unload+Purge
45kW
Load45kW
75kW
75kWLoad
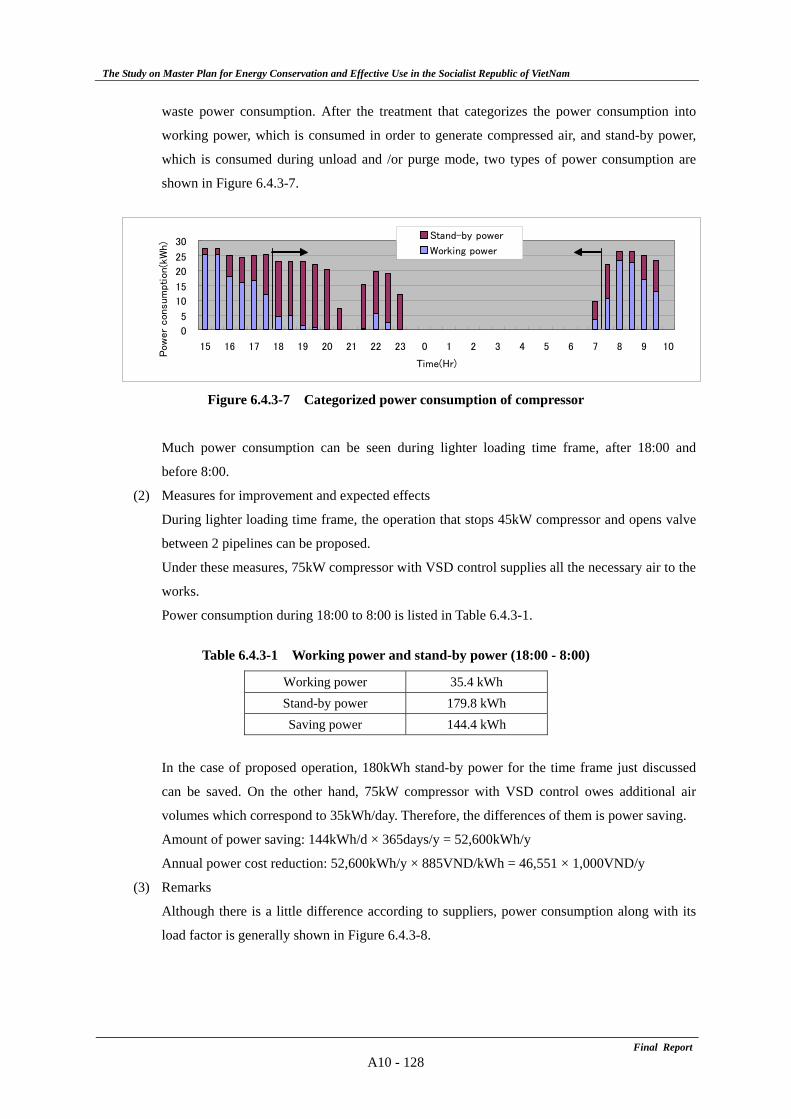
The Study on Master Plan for Energy Conservation and Effective Use in the Socialist Republic of VietNam
Final ReportA10 - 128
waste power consumption. After the treatment that categorizes the power consumption into
working power, which is consumed in order to generate compressed air, and stand-by power,
which is consumed during unload and /or purge mode, two types of power consumption are
shown in Figure 6.4.3-7.
Figure 6.4.3-7 Categorized power consumption of compressor
Much power consumption can be seen during lighter loading time frame, after 18:00 and
before 8:00.
(2) Measures for improvement and expected effects
During lighter loading time frame, the operation that stops 45kW compressor and opens valve
between 2 pipelines can be proposed.
Under these measures, 75kW compressor with VSD control supplies all the necessary air to the
works.
Power consumption during 18:00 to 8:00 is listed in Table 6.4.3-1.
Table 6.4.3-1 Working power and stand-by power (18:00 - 8:00)
Working power 35.4 kWh Stand-by power 179.8 kWh Saving power 144.4 kWh
In the case of proposed operation, 180kWh stand-by power for the time frame just discussed
can be saved. On the other hand, 75kW compressor with VSD control owes additional air
volumes which correspond to 35kWh/day. Therefore, the differences of them is power saving.
Amount of power saving: 144kWh/d × 365days/y = 52,600kWh/y
Annual power cost reduction: 52,600kWh/y × 885VND/kWh = 46,551 × 1,000VND/y
(3) Remarks
Although there is a little difference according to suppliers, power consumption along with its
load factor is generally shown in Figure 6.4.3-8.
0
5
10
15
20
25
30
15 16 17 18 19 20 21 22 23 0 1 2 3 4 5 6 7 8 9 10
Time(Hr)
Pow
er
con
sum
ptio
n(k
Wh)
Stand-by power
Working power
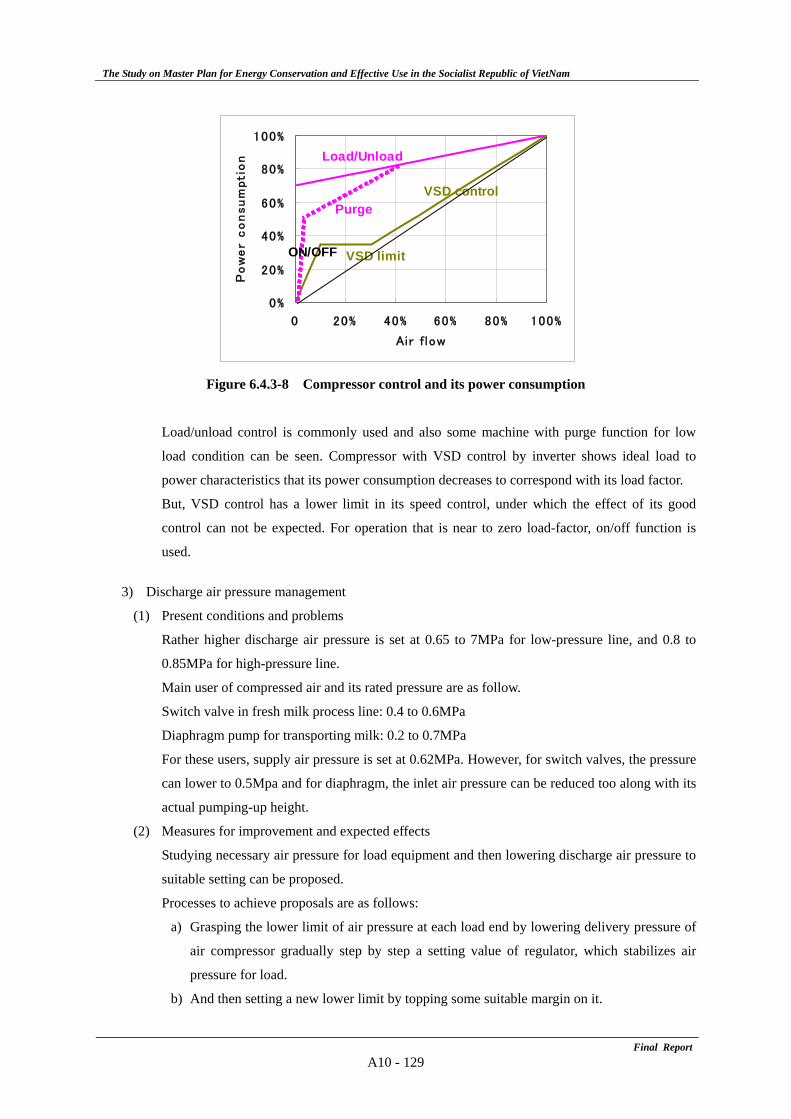
The Study on Master Plan for Energy Conservation and Effective Use in the Socialist Republic of VietNam
Final ReportA10 - 129
Figure 6.4.3-8 Compressor control and its power consumption
Load/unload control is commonly used and also some machine with purge function for low
load condition can be seen. Compressor with VSD control by inverter shows ideal load to
power characteristics that its power consumption decreases to correspond with its load factor.
But, VSD control has a lower limit in its speed control, under which the effect of its good
control can not be expected. For operation that is near to zero load-factor, on/off function is
used.
3) Discharge air pressure management
(1) Present conditions and problems
Rather higher discharge air pressure is set at 0.65 to 7MPa for low-pressure line, and 0.8 to
0.85MPa for high-pressure line.
Main user of compressed air and its rated pressure are as follow.
Switch valve in fresh milk process line: 0.4 to 0.6MPa
Diaphragm pump for transporting milk: 0.2 to 0.7MPa
For these users, supply air pressure is set at 0.62MPa. However, for switch valves, the pressure
can lower to 0.5Mpa and for diaphragm, the inlet air pressure can be reduced too along with its
actual pumping-up height.
(2) Measures for improvement and expected effects
Studying necessary air pressure for load equipment and then lowering discharge air pressure to
suitable setting can be proposed.
Processes to achieve proposals are as follows:
a) Grasping the lower limit of air pressure at each load end by lowering delivery pressure of
air compressor gradually step by step a setting value of regulator, which stabilizes air
pressure for load.
b) And then setting a new lower limit by topping some suitable margin on it.
0%
20%
40%
60%
80%
100%
0 20% 40% 60% 80% 100%
Air f low
Po
we
r c
on
su
mpti
on
Purge
VSD limit
Load/Unload
VSD control
ON/OFF
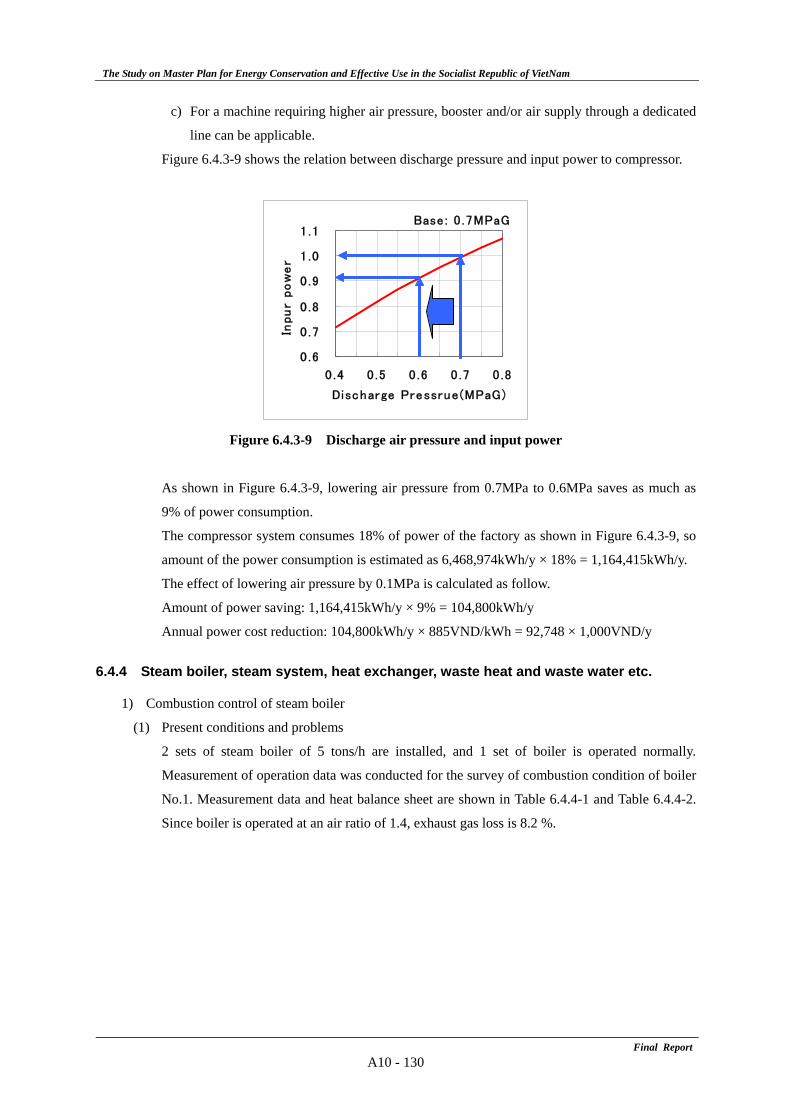
The Study on Master Plan for Energy Conservation and Effective Use in the Socialist Republic of VietNam
Final ReportA10 - 130
c) For a machine requiring higher air pressure, booster and/or air supply through a dedicated
line can be applicable.
Figure 6.4.3-9 shows the relation between discharge pressure and input power to compressor.
Figure 6.4.3-9 Discharge air pressure and input power
As shown in Figure 6.4.3-9, lowering air pressure from 0.7MPa to 0.6MPa saves as much as
9% of power consumption.
The compressor system consumes 18% of power of the factory as shown in Figure 6.4.3-9, so
amount of the power consumption is estimated as 6,468,974kWh/y × 18% = 1,164,415kWh/y.
The effect of lowering air pressure by 0.1MPa is calculated as follow.
Amount of power saving: 1,164,415kWh/y × 9% = 104,800kWh/y
Annual power cost reduction: 104,800kWh/y × 885VND/kWh = 92,748 × 1,000VND/y
6.4.4 Steam boiler, steam system, heat exchanger, waste heat and waste water etc.
1) Combustion control of steam boiler
(1) Present conditions and problems
2 sets of steam boiler of 5 tons/h are installed, and 1 set of boiler is operated normally.
Measurement of operation data was conducted for the survey of combustion condition of boiler
No.1. Measurement data and heat balance sheet are shown in Table 6.4.4-1 and Table 6.4.4-2.
Since boiler is operated at an air ratio of 1.4, exhaust gas loss is 8.2 %.
Base : 0 .7MPaG
0 .6
0 .7
0 .8
0 .9
1 .0
1 .1
0 .4 0 .5 0 .6 0 .7 0 .8
Discharge Pressrue(MPaG)
Inpu
r po
we
r
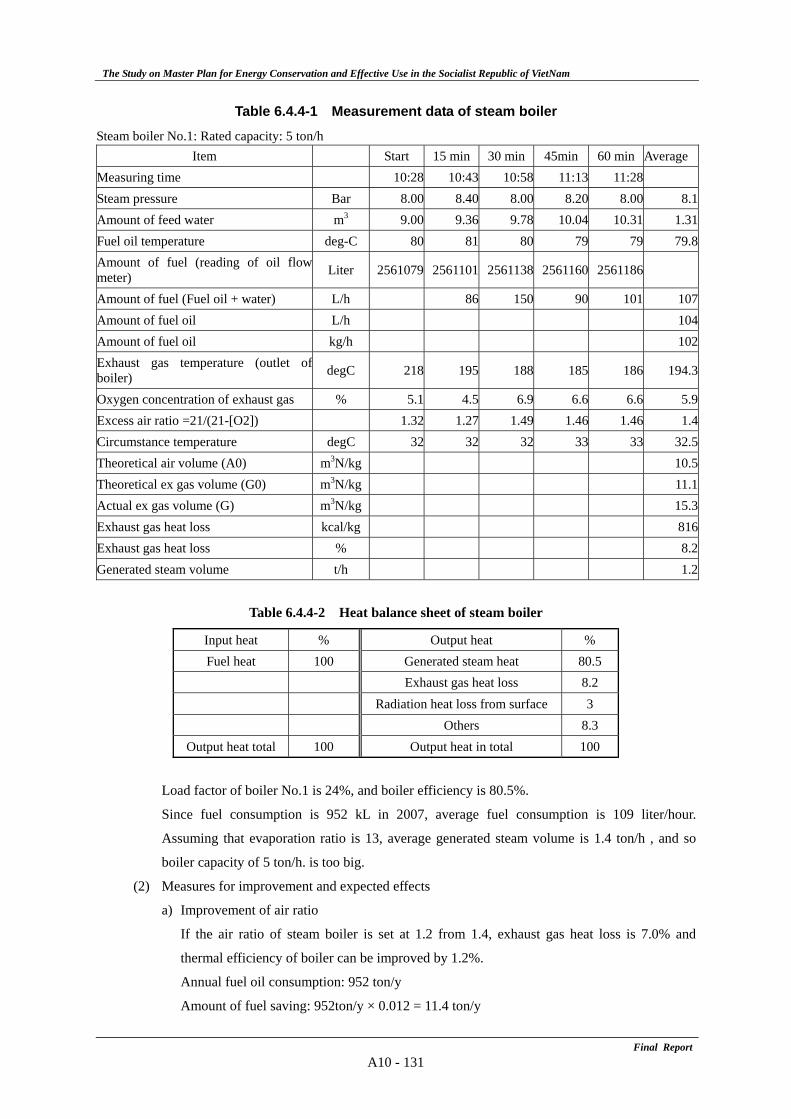
The Study on Master Plan for Energy Conservation and Effective Use in the Socialist Republic of VietNam
Final ReportA10 - 131
Table 6.4.4-1 Measurement data of steam boiler
Steam boiler No.1: Rated capacity: 5 ton/h Item Start 15 min 30 min 45min 60 min Average
Measuring time 10:28 10:43 10:58 11:13 11:28Steam pressure Bar 8.00 8.40 8.00 8.20 8.00 8.1 Amount of feed water m3 9.00 9.36 9.78 10.04 10.31 1.31 Fuel oil temperature deg-C 80 81 80 79 79 79.8 Amount of fuel (reading of oil flow meter) Liter 2561079 2561101 2561138 2561160 2561186
Amount of fuel (Fuel oil + water) L/h 86 150 90 101 107Amount of fuel oil L/h 104Amount of fuel oil kg/h 102 Exhaust gas temperature (outlet of boiler) degC 218 195 188 185 186 194.3
Oxygen concentration of exhaust gas % 5.1 4.5 6.9 6.6 6.6 5.9 Excess air ratio =21/(21-[O2]) 1.32 1.27 1.49 1.46 1.46 1.4 Circumstance temperature degC 32 32 32 33 33 32.5 Theoretical air volume (A0) m3N/kg 10.5 Theoretical ex gas volume (G0) m3N/kg 11.1 Actual ex gas volume (G) m3N/kg 15.3 Exhaust gas heat loss kcal/kg 816 Exhaust gas heat loss % 8.2 Generated steam volume t/h 1.2
Table 6.4.4-2 Heat balance sheet of steam boiler
Input heat % Output heat % Fuel heat 100 Generated steam heat 80.5
Exhaust gas heat loss 8.2 Radiation heat loss from surface 3 Others 8.3
Output heat total 100 Output heat in total 100
Load factor of boiler No.1 is 24%, and boiler efficiency is 80.5%.
Since fuel consumption is 952 kL in 2007, average fuel consumption is 109 liter/hour.
Assuming that evaporation ratio is 13, average generated steam volume is 1.4 ton/h , and so
boiler capacity of 5 ton/h. is too big.
(2) Measures for improvement and expected effects
a) Improvement of air ratio
If the air ratio of steam boiler is set at 1.2 from 1.4, exhaust gas heat loss is 7.0% and
thermal efficiency of boiler can be improved by 1.2%.
Annual fuel oil consumption: 952 ton/y
Amount of fuel saving: 952ton/y × 0.012 = 11.4 ton/y
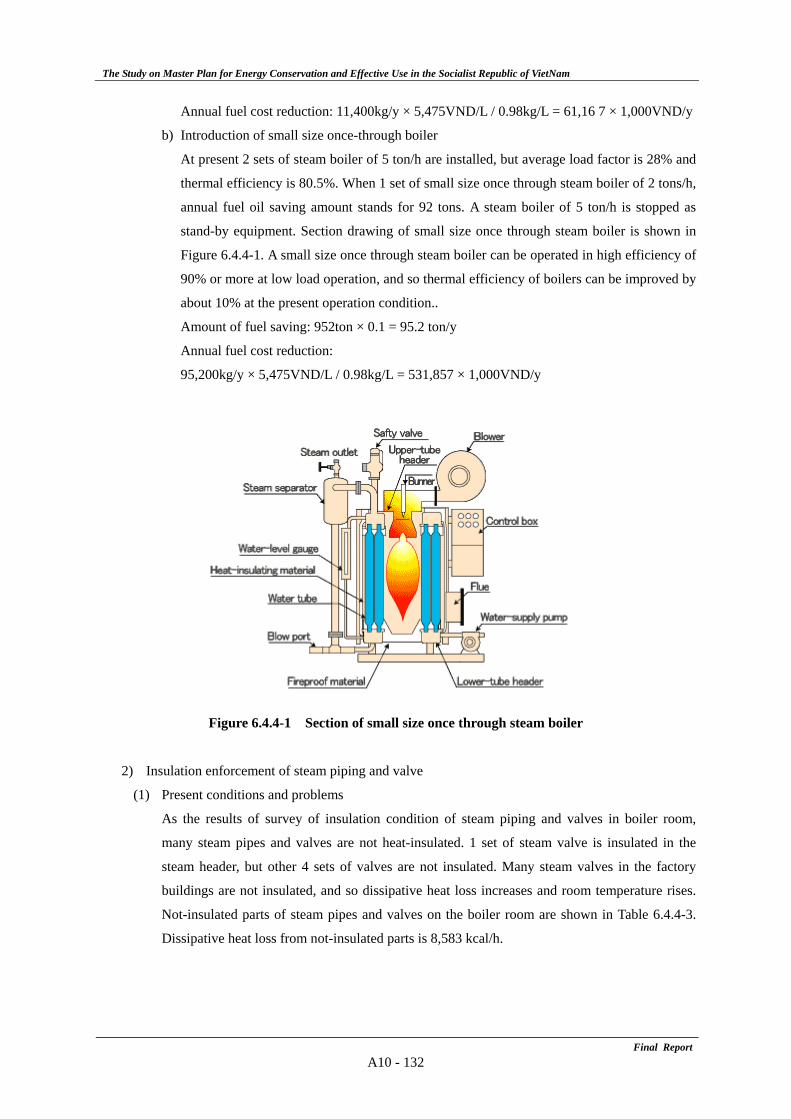
The Study on Master Plan for Energy Conservation and Effective Use in the Socialist Republic of VietNam
Final ReportA10 - 132
Annual fuel cost reduction: 11,400kg/y × 5,475VND/L / 0.98kg/L = 61,16 7 × 1,000VND/y
b) Introduction of small size once-through boiler
At present 2 sets of steam boiler of 5 ton/h are installed, but average load factor is 28% and
thermal efficiency is 80.5%. When 1 set of small size once through steam boiler of 2 tons/h,
annual fuel oil saving amount stands for 92 tons. A steam boiler of 5 ton/h is stopped as
stand-by equipment. Section drawing of small size once through steam boiler is shown in
Figure 6.4.4-1. A small size once through steam boiler can be operated in high efficiency of
90% or more at low load operation, and so thermal efficiency of boilers can be improved by
about 10% at the present operation condition..
Amount of fuel saving: 952ton × 0.1 = 95.2 ton/y
Annual fuel cost reduction:
95,200kg/y × 5,475VND/L / 0.98kg/L = 531,857 × 1,000VND/y
Figure 6.4.4-1 Section of small size once through steam boiler
2) Insulation enforcement of steam piping and valve
(1) Present conditions and problems
As the results of survey of insulation condition of steam piping and valves in boiler room,
many steam pipes and valves are not heat-insulated. 1 set of steam valve is insulated in the
steam header, but other 4 sets of valves are not insulated. Many steam valves in the factory
buildings are not insulated, and so dissipative heat loss increases and room temperature rises.
Not-insulated parts of steam pipes and valves on the boiler room are shown in Table 6.4.4-3.
Dissipative heat loss from not-insulated parts is 8,583 kcal/h.
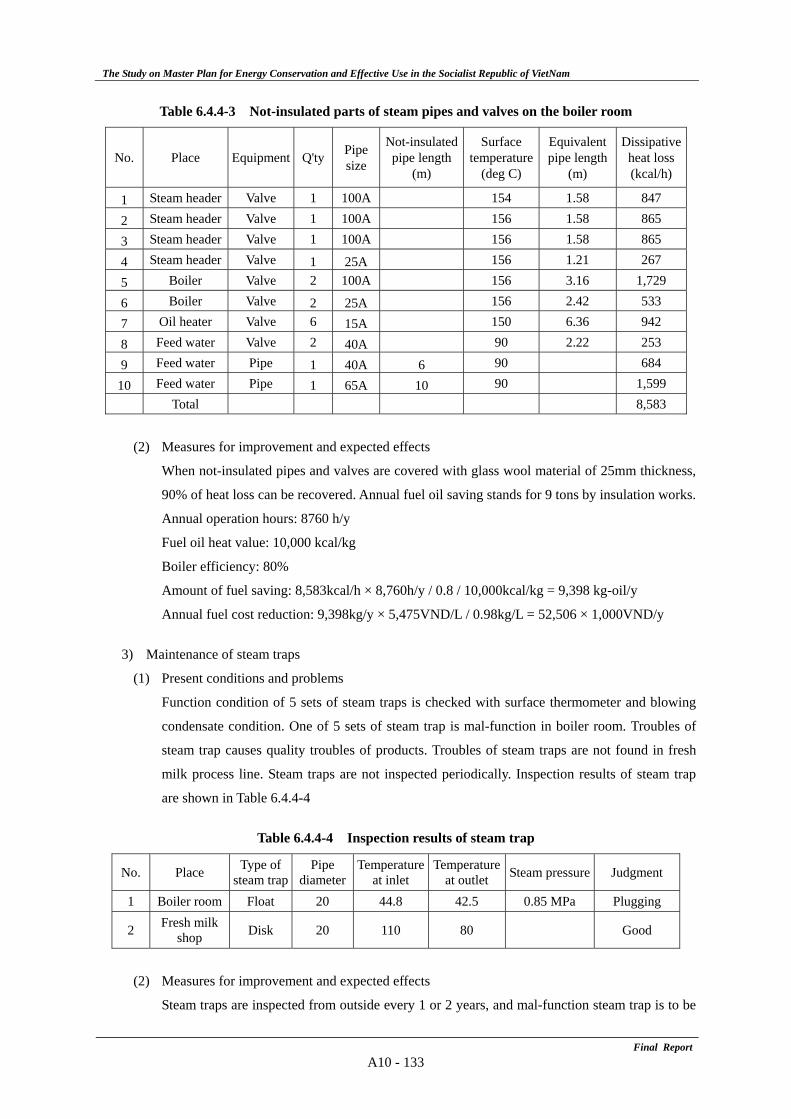
The Study on Master Plan for Energy Conservation and Effective Use in the Socialist Republic of VietNam
Final ReportA10 - 133
Table 6.4.4-3 Not-insulated parts of steam pipes and valves on the boiler room
No. Place Equipment Q'ty Pipe size
Not-insulated pipe length
(m)
Surface temperature
(deg C)
Equivalent pipe length
(m)
Dissipative heat loss(kcal/h)
1 Steam header Valve 1 100A 154 1.58 847
2 Steam header Valve 1 100A 156 1.58 865
3 Steam header Valve 1 100A 156 1.58 865
4 Steam header Valve 1 25A 156 1.21 267
5 Boiler Valve 2 100A 156 3.16 1,729
6 Boiler Valve 2 25A 156 2.42 533
7 Oil heater Valve 6 15A 150 6.36 942
8 Feed water Valve 2 40A 90 2.22 253
9 Feed water Pipe 1 40A 6 90 684
10 Feed water Pipe 1 65A 10 90 1,599
Total 8,583
(2) Measures for improvement and expected effects
When not-insulated pipes and valves are covered with glass wool material of 25mm thickness,
90% of heat loss can be recovered. Annual fuel oil saving stands for 9 tons by insulation works.
Annual operation hours: 8760 h/y
Fuel oil heat value: 10,000 kcal/kg
Boiler efficiency: 80%
Amount of fuel saving: 8,583kcal/h × 8,760h/y / 0.8 / 10,000kcal/kg = 9,398 kg-oil/y
Annual fuel cost reduction: 9,398kg/y × 5,475VND/L / 0.98kg/L = 52,506 × 1,000VND/y
3) Maintenance of steam traps
(1) Present conditions and problems
Function condition of 5 sets of steam traps is checked with surface thermometer and blowing
condensate condition. One of 5 sets of steam trap is mal-function in boiler room. Troubles of
steam trap causes quality troubles of products. Troubles of steam traps are not found in fresh
milk process line. Steam traps are not inspected periodically. Inspection results of steam trap
are shown in Table 6.4.4-4
Table 6.4.4-4 Inspection results of steam trap
No. Place Type of steam trap
Pipe diameter
Temperature at inlet
Temperature at outlet Steam pressure Judgment
1 Boiler room Float 20 44.8 42.5 0.85 MPa Plugging
2 Fresh milk shop Disk 20 110 80 Good
(2) Measures for improvement and expected effects
Steam traps are inspected from outside every 1 or 2 years, and mal-function steam trap is to be
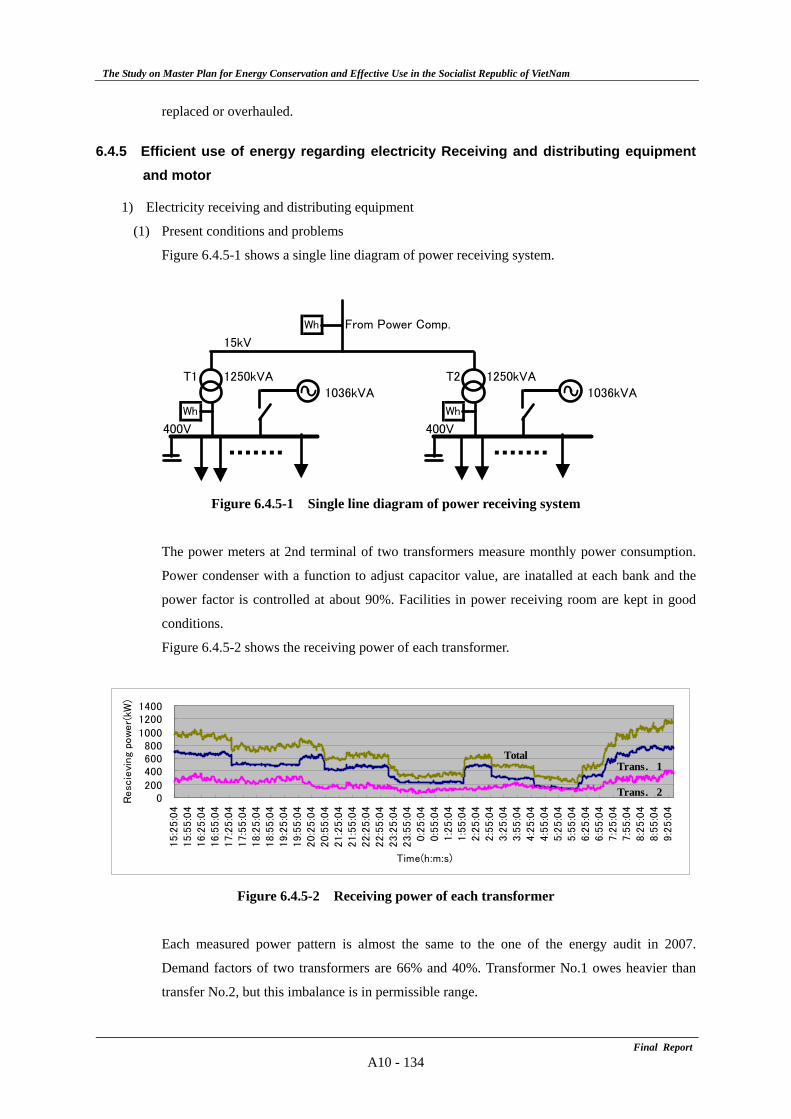
The Study on Master Plan for Energy Conservation and Effective Use in the Socialist Republic of VietNam
Final ReportA10 - 134
replaced or overhauled.
6.4.5 Efficient use of energy regarding electricity Receiving and distributing equipment and motor
1) Electricity receiving and distributing equipment
(1) Present conditions and problems
Figure 6.4.5-1 shows a single line diagram of power receiving system.
Figure 6.4.5-1 Single line diagram of power receiving system
The power meters at 2nd terminal of two transformers measure monthly power consumption.
Power condenser with a function to adjust capacitor value, are inatalled at each bank and the
power factor is controlled at about 90%. Facilities in power receiving room are kept in good
conditions.
Figure 6.4.5-2 shows the receiving power of each transformer.
Figure 6.4.5-2 Receiving power of each transformer
Each measured power pattern is almost the same to the one of the energy audit in 2007.
Demand factors of two transformers are 66% and 40%. Transformer No.1 owes heavier than
transfer No.2, but this imbalance is in permissible range.
Wh From Power Comp.
15kV
T1 1250kVA T2 1250kVA1036kVA 1036kVA
Wh Wh
400V 400V
0200400600800
100012001400
15:2
5:0
415:5
5:0
416:2
5:0
416:5
5:0
417:2
5:0
417:5
5:0
418:2
5:0
418:5
5:0
419:2
5:0
419:5
5:0
420:2
5:0
420:5
5:0
421:2
5:0
421:5
5:0
422:2
5:0
422:5
5:0
423:2
5:0
423:5
5:0
40:2
5:0
40:5
5:0
41:2
5:0
41:5
5:0
42:2
5:0
42:5
5:0
43:2
5:0
43:5
5:0
44:2
5:0
44:5
5:0
45:2
5:0
45:5
5:0
46:2
5:0
46:5
5:0
47:2
5:0
47:5
5:0
48:2
5:0
48:5
5:0
49:2
5:0
4
Time(h:m:s)
Resc
ievi
ng
pow
er(
kW)
Trans. 1
Trans. 2
Total
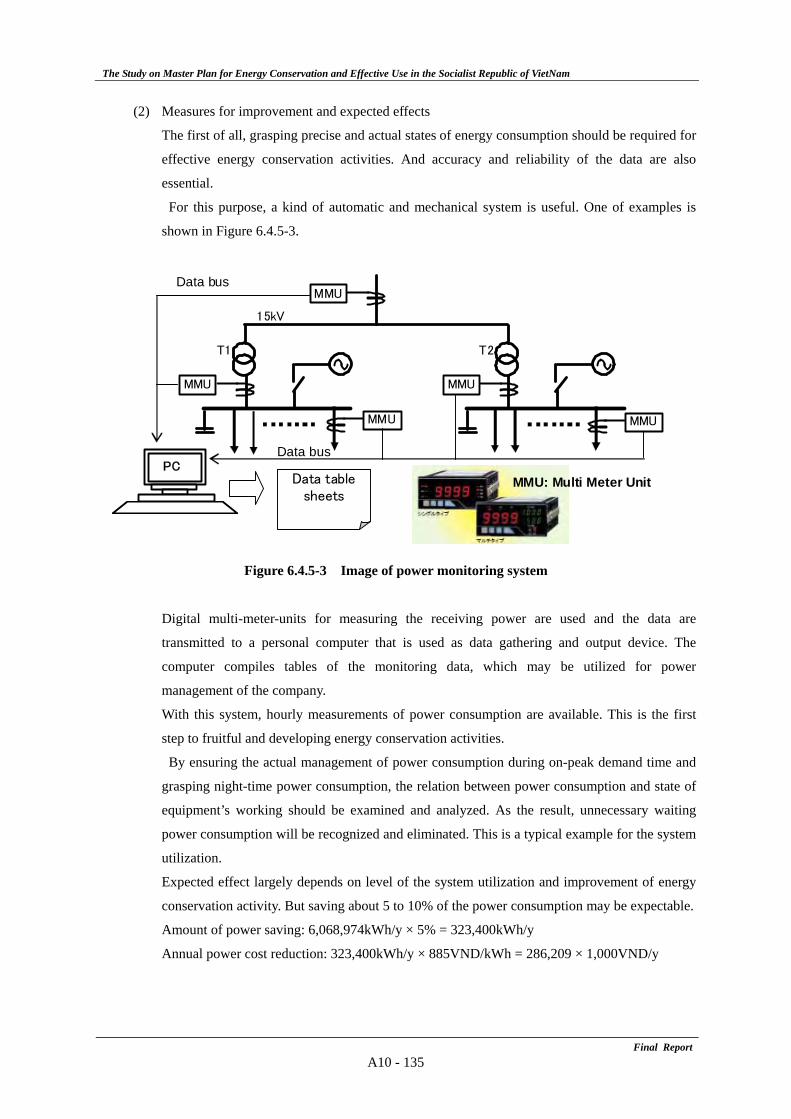
The Study on Master Plan for Energy Conservation and Effective Use in the Socialist Republic of VietNam
Final ReportA10 - 135
(2) Measures for improvement and expected effects
The first of all, grasping precise and actual states of energy consumption should be required for
effective energy conservation activities. And accuracy and reliability of the data are also
essential.
For this purpose, a kind of automatic and mechanical system is useful. One of examples is
shown in Figure 6.4.5-3.
Data bus
15kV
T1 T2
Data busPC
Data tablesheets
MMU
MMU MMU
MMU MMU
MMU: Multi Meter Unit
Figure 6.4.5-3 Image of power monitoring system
Digital multi-meter-units for measuring the receiving power are used and the data are
transmitted to a personal computer that is used as data gathering and output device. The
computer compiles tables of the monitoring data, which may be utilized for power
management of the company.
With this system, hourly measurements of power consumption are available. This is the first
step to fruitful and developing energy conservation activities.
By ensuring the actual management of power consumption during on-peak demand time and
grasping night-time power consumption, the relation between power consumption and state of
equipment’s working should be examined and analyzed. As the result, unnecessary waiting
power consumption will be recognized and eliminated. This is a typical example for the system
utilization.
Expected effect largely depends on level of the system utilization and improvement of energy
conservation activity. But saving about 5 to 10% of the power consumption may be expectable.
Amount of power saving: 6,068,974kWh/y × 5% = 323,400kWh/y
Annual power cost reduction: 323,400kWh/y × 885VND/kWh = 286,209 × 1,000VND/y
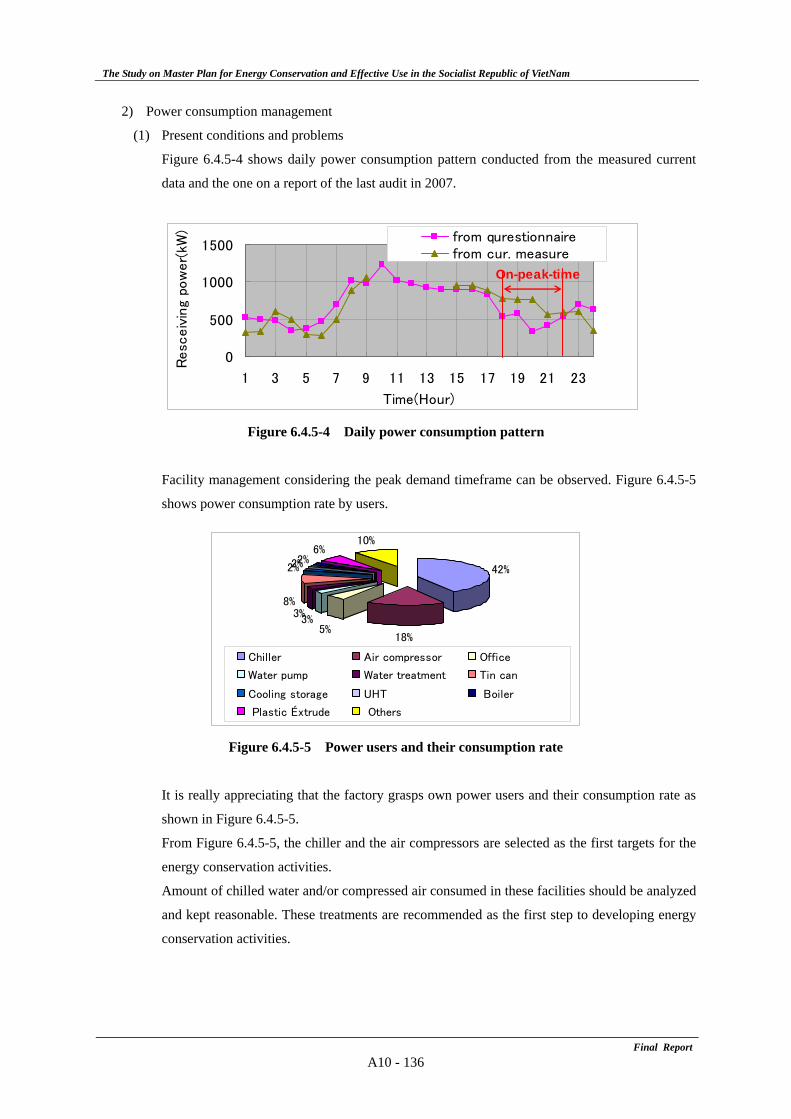
The Study on Master Plan for Energy Conservation and Effective Use in the Socialist Republic of VietNam
Final ReportA10 - 136
2) Power consumption management
(1) Present conditions and problems
Figure 6.4.5-4 shows daily power consumption pattern conducted from the measured current
data and the one on a report of the last audit in 2007.
Figure 6.4.5-4 Daily power consumption pattern
Facility management considering the peak demand timeframe can be observed. Figure 6.4.5-5
shows power consumption rate by users.
42%
18%5%
3%3%
8%
2%2%2%6%
10%
Chiller Air compressor Office
Water pump Water treatment Tin can
Cooling storage UHT Boiler
Plastic Éxtrude Others
Figure 6.4.5-5 Power users and their consumption rate
It is really appreciating that the factory grasps own power users and their consumption rate as
shown in Figure 6.4.5-5.
From Figure 6.4.5-5, the chiller and the air compressors are selected as the first targets for the
energy conservation activities.
Amount of chilled water and/or compressed air consumed in these facilities should be analyzed
and kept reasonable. These treatments are recommended as the first step to developing energy
conservation activities.
0
500
1000
1500
1 3 5 7 9 11 13 15 17 19 21 23
Time(Hour)
Resc
eiv
ing
pow
er(
kW) from qurestionnaire
from cur. measure
On-peak-time

ANNEX 11
ON-SITE SURVEY PRESENTATION MATERIALS (BUILDING)

The Study on Master Plan of Energy Conservation and Effective Use in The Socialist Republic of Vietnam
Findings from On-site Survey
Buildings 2008 in Viet Nam
A11-1
The Study on Master Plan of Energy Conservation and Effective Use in The Socialist Republic of Vietnam
Industry sector: Cement, Steel-making, Ceramics, Textile, Food processing
On-Site and Questionnaire Survey
Commercial Sector:Business office, Government office, Hotel & Shopping mall
JICA study team
2-4 JICA experts
Survey & recommendation
Output:- Energy conservation potential by sector- Applicable energy conservation technology- Recommendation on Energy Manager system
3-5 Vietnamese staff for survey
Questionnaire to factory and building
Energy audit report analysis in Vietnam
Survey data
Technology transfer
Energy data of Vietnam
A11-2
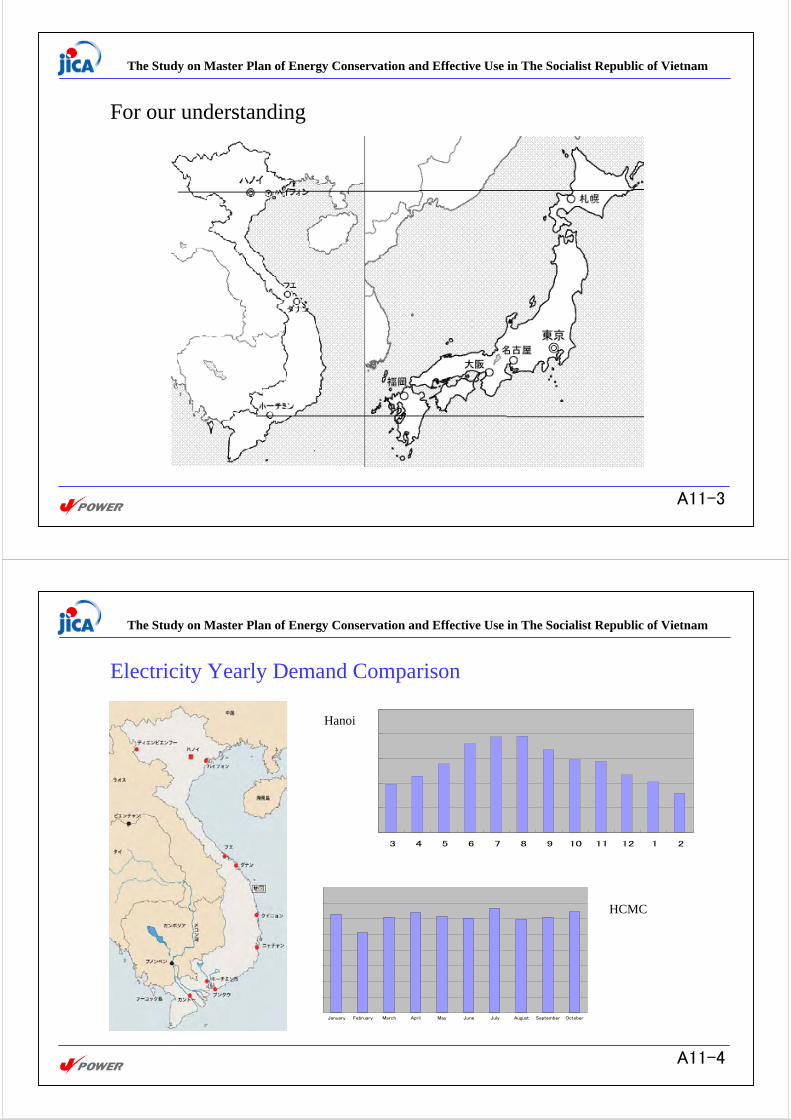
The Study on Master Plan of Energy Conservation and Effective Use in The Socialist Republic of Vietnam
For our understanding
A11-3
The Study on Master Plan of Energy Conservation and Effective Use in The Socialist Republic of Vietnam
3 4 5 6 7 8 9 10 11 12 1 2
January February March April May June July August September October
Hanoi
HCMC
Electricity Yearly Demand Comparison
A11-4
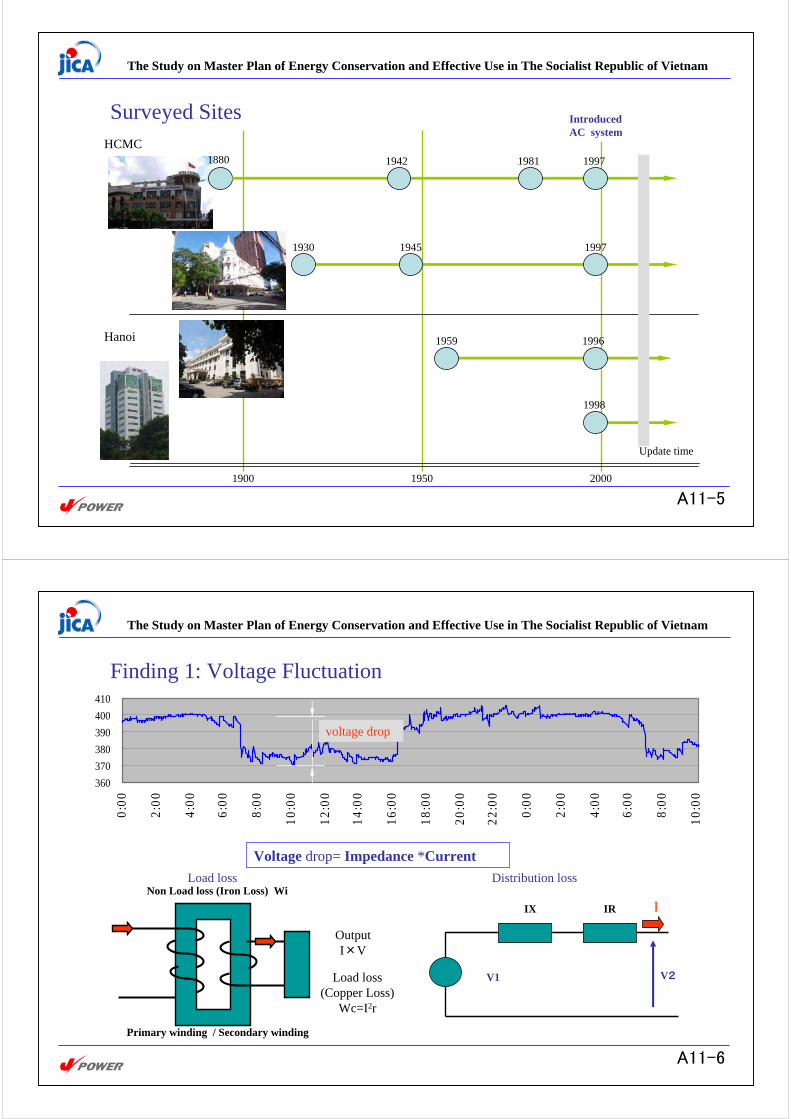
The Study on Master Plan of Energy Conservation and Effective Use in The Socialist Republic of Vietnam
1900 2000
Introduced AC system
Update time
1998
1959
1945 1997
1997
1996Hanoi
HCMC
1950
1880 1942 1981
1930
Surveyed Sites
A11-5
The Study on Master Plan of Energy Conservation and Effective Use in The Socialist Republic of Vietnam
360370380390400410
0:00
2:00
4:00
6:00
8:00
10:0
0
12:0
0
14:0
0
16:0
0
18:0
0
20:0
0
22:0
0
0:00
2:00
4:00
6:00
8:00
10:0
0
voltage drop
Finding 1: Voltage Fluctuation
Primary winding / Secondary winding
Non Load loss (Iron Loss) Wi
Load loss(Copper Loss)
Wc=I2r
OutputI×V
IX IR
V1 V2
I
Load loss Distribution loss
Voltage drop= Impedance *Current
A11-6
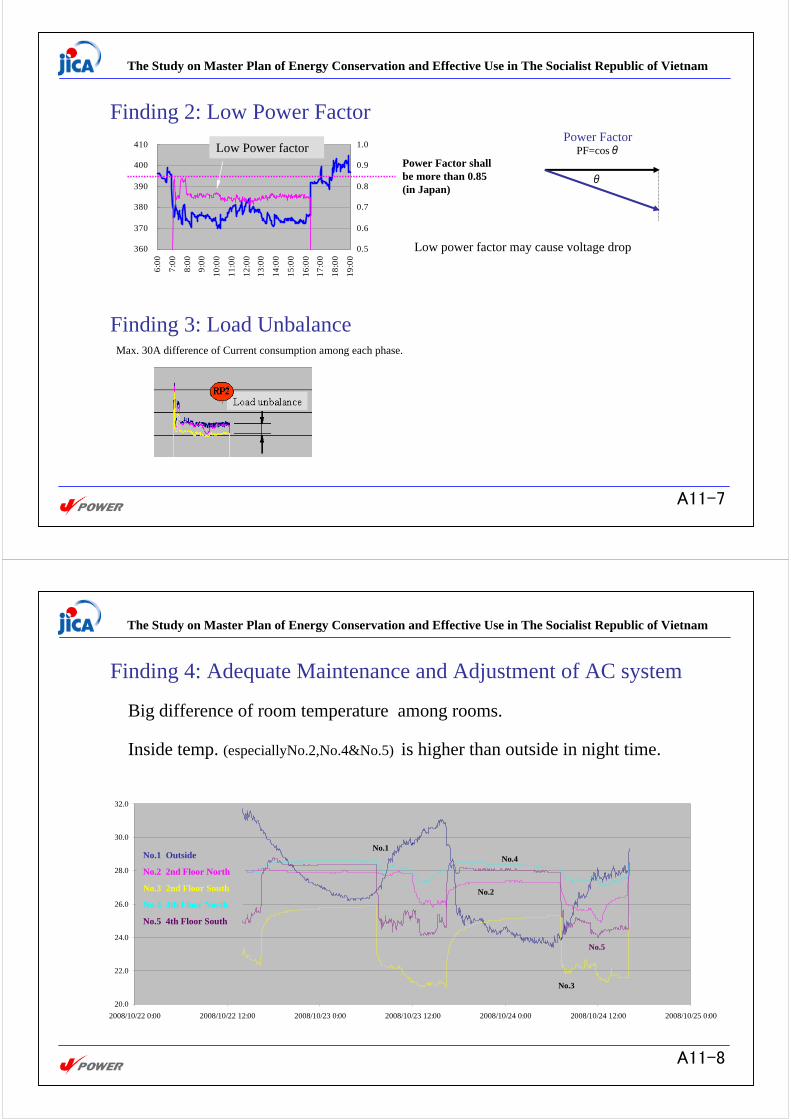
The Study on Master Plan of Energy Conservation and Effective Use in The Socialist Republic of Vietnam
360
370
380
390
400
4106:
00
7:00
8:00
9:00
10:0
0
11:0
0
12:0
013
:00
14:0
0
15:0
0
16:0
017
:00
18:0
0
19:0
0
0.5
0.6
0.7
0.8
0.9
1.0
Power Factor shall be more than 0.85(in Japan)
Low power factor may cause voltage drop
Low Power factor
Finding 2: Low Power Factor
θ
Power FactorPF=cosθ
Finding 3: Load UnbalanceMax. 30A difference of Current consumption among each phase.
A11-7
The Study on Master Plan of Energy Conservation and Effective Use in The Socialist Republic of Vietnam
20.0
22.0
24.0
26.0
28.0
30.0
32.0
2008/10/22 0:00 2008/10/22 12:00 2008/10/23 0:00 2008/10/23 12:00 2008/10/24 0:00 2008/10/24 12:00 2008/10/25 0:00
No.1
No.2
No.3
No.4
No.5
No.1 Outside
No.2 2nd Floor North
No.3 2nd Floor South
No.4 4th Floor North
No.5 4th Floor South
Inside temp. (especiallyNo.2,No.4&No.5) is higher than outside in night time.
Big difference of room temperature among rooms.
Finding 4: Adequate Maintenance and Adjustment of AC system
A11-8
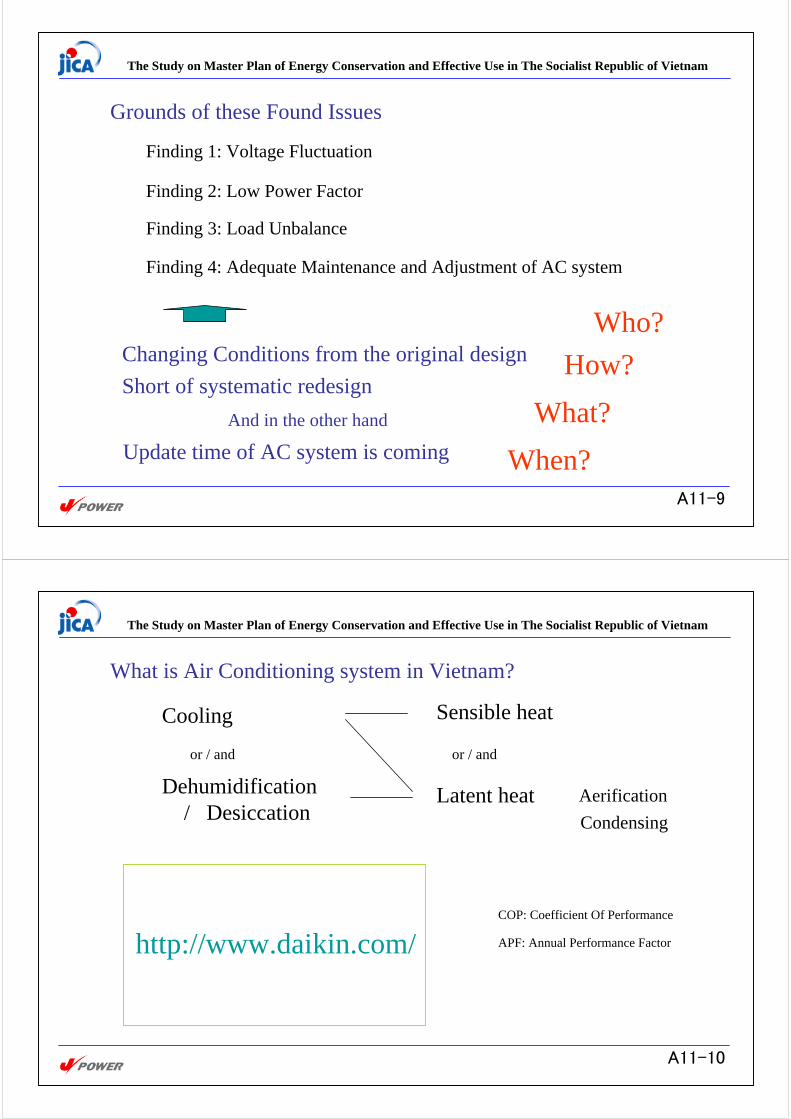
The Study on Master Plan of Energy Conservation and Effective Use in The Socialist Republic of Vietnam
Finding 1: Voltage Fluctuation
Finding 2: Low Power Factor
Finding 3: Load Unbalance
Finding 4: Adequate Maintenance and Adjustment of AC system
Grounds of these Found Issues
Changing Conditions from the original design
And in the other hand
Short of systematic redesign
Who?How?
What?Update time of AC system is coming When?
A11-9
The Study on Master Plan of Energy Conservation and Effective Use in The Socialist Republic of Vietnam
What is Air Conditioning system in Vietnam?
Latent heat
Sensible heat
COP: Coefficient Of Performance
APF: Annual Performance Factor
Dehumidification/ Desiccation
Cooling
or / and or / and
AerificationCondensing
http://www.daikin.com/
A11-10
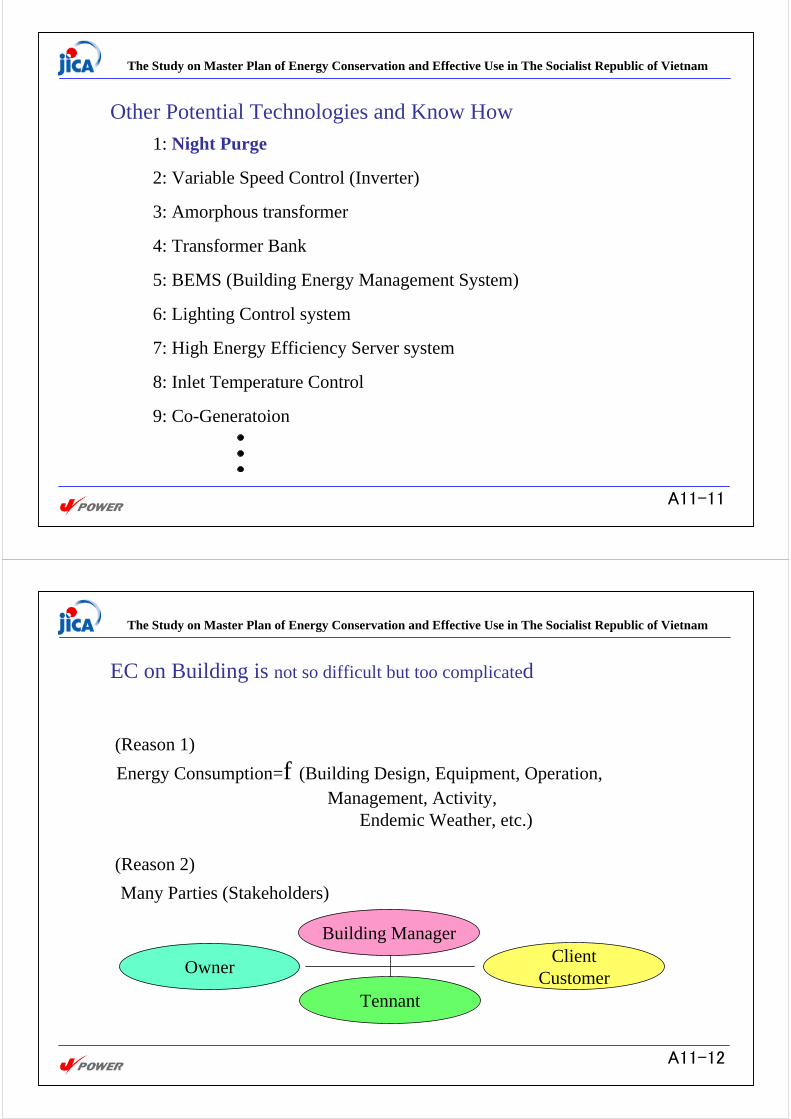
The Study on Master Plan of Energy Conservation and Effective Use in The Socialist Republic of Vietnam
Other Potential Technologies and Know How1: Night Purge
2: Variable Speed Control (Inverter)
3: Amorphous transformer
4: Transformer Bank
5: BEMS (Building Energy Management System)
6: Lighting Control system
7: High Energy Efficiency Server system
8: Inlet Temperature Control
9: Co-Generatoion
A11-11
The Study on Master Plan of Energy Conservation and Effective Use in The Socialist Republic of Vietnam
EC on Building is not so difficult but too complicated
Many Parties (Stakeholders)
Energy Consumption=f (Building Design, Equipment, Operation, Management, Activity,
Endemic Weather, etc.)
Building Manager
Tennant
Owner ClientCustomer
(Reason 1)
(Reason 2)
A11-12
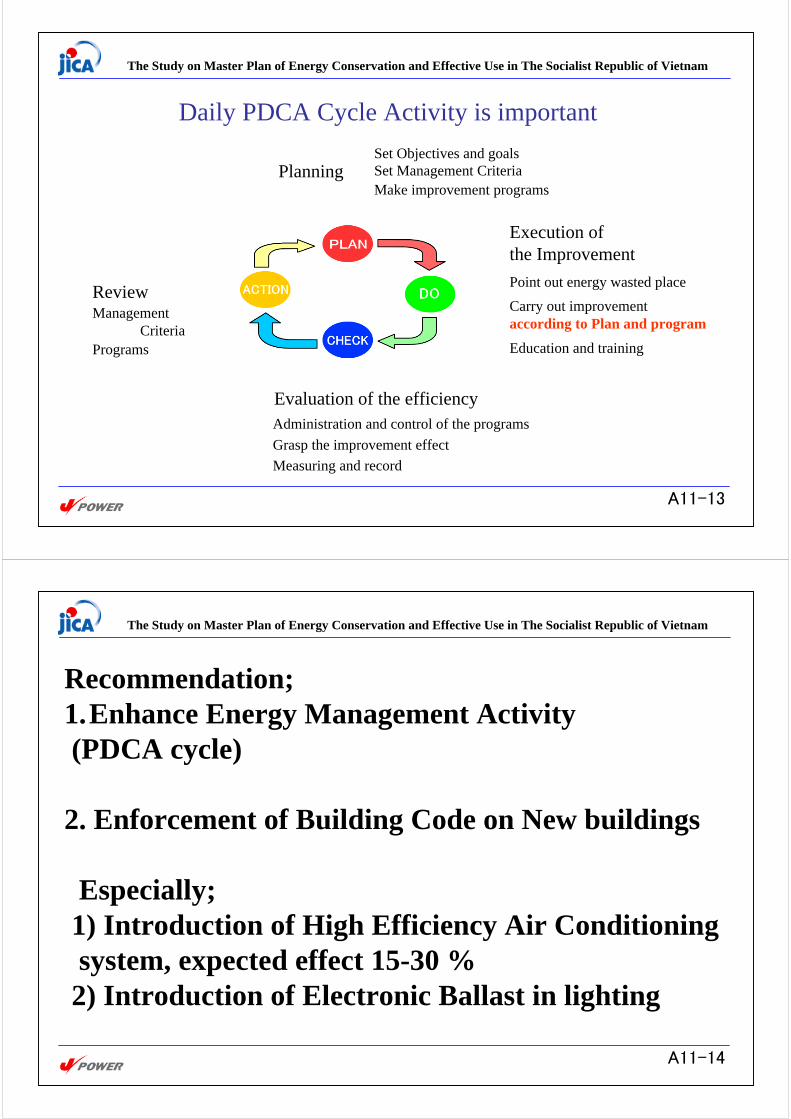
The Study on Master Plan of Energy Conservation and Effective Use in The Socialist Republic of Vietnam
Evaluation of the efficiency
Execution of the Improvement
Planning
Review
Set Objectives and goalsSet Management CriteriaMake improvement programs
Point out energy wasted place
Administration and control of the programsGrasp the improvement effectMeasuring and record
Management Criteria
Programs
Carry out improvement according to Plan and program
Education and training
Daily PDCA Cycle Activity is important
A11-13
The Study on Master Plan of Energy Conservation and Effective Use in The Socialist Republic of Vietnam
Recommendation;1.Enhance Energy Management Activity(PDCA cycle)
2. Enforcement of Building Code on New buildings
Especially;1) Introduction of High Efficiency Air Conditioning system, expected effect 15-30 %
2) Introduction of Electronic Ballast in lighting
A11-14
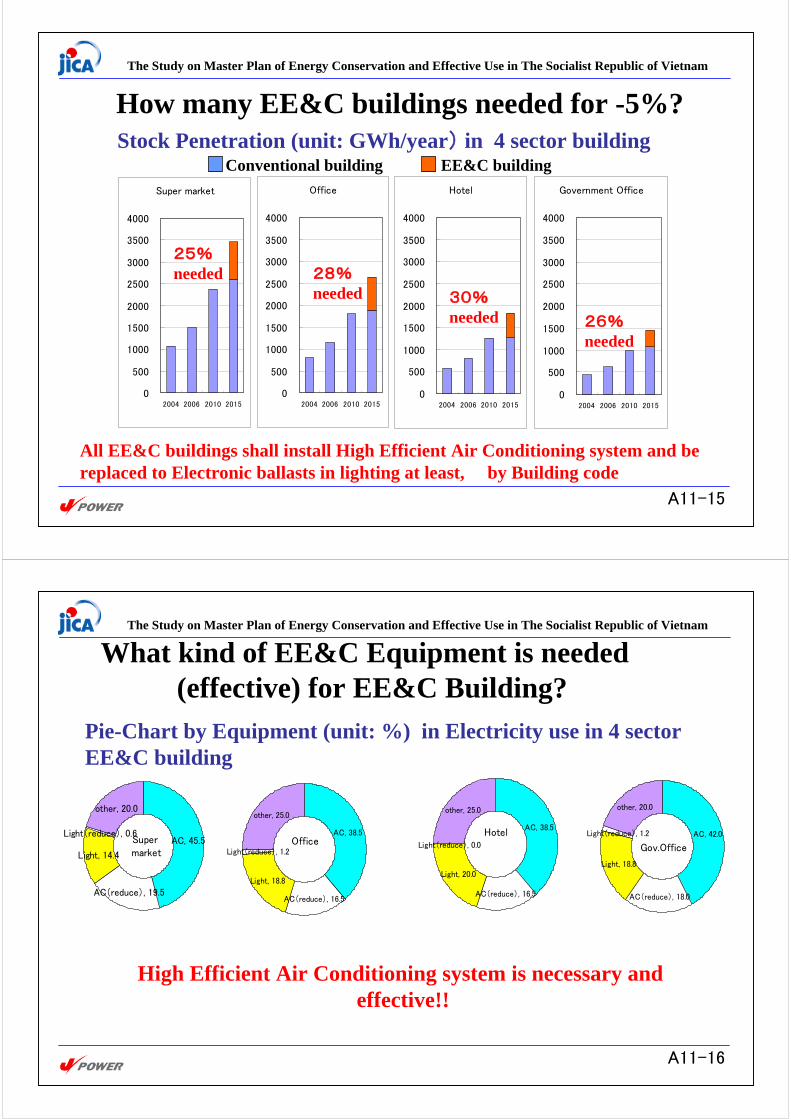
The Study on Master Plan of Energy Conservation and Effective Use in The Socialist Republic of Vietnam
How many EE&C buildings needed for -5%?Stock Penetration (unit: GWh/year) in 4 sector building
Super market
0
500
1000
1500
2000
2500
3000
3500
4000
2004 2006 2010 2015
Office
0
500
1000
1500
2000
2500
3000
3500
4000
2004 2006 2010 2015
Hotel
0
500
1000
1500
2000
2500
3000
3500
4000
2004 2006 2010 2015
Government Office
0
500
1000
1500
2000
2500
3000
3500
4000
2004 2006 2010 2015
Conventional building EE&C building
25%needed 28%
needed 30%needed 26%
needed
All EE&C buildings shall install High Efficient Air Conditioning system and be replaced to Electronic ballasts in lighting at least, by Building code
A11-15
The Study on Master Plan of Energy Conservation and Effective Use in The Socialist Republic of Vietnam
What kind of EE&C Equipment is needed (effective) for EE&C Building?
Pie-Chart by Equipment (unit: %) in Electricity use in 4 sector EE&C building
High Efficient Air Conditioning system is necessary andeffective!!
Super market
AC, 45.5
AC(reduce), 19.5
Light, 14.4
Light(reduce), 0.6
other, 20.0
OfficeAC, 38.5
AC(reduce), 16.5
Light, 18.8
Light(reduce), 1.2
other, 25.0
HotelAC, 38.5
AC(reduce), 16.5
Light, 20.0
Light(reduce), 0.0
other, 25.0
Gov.Office
AC, 42.0
AC(reduce), 18.0
Light, 18.8
Light(reduce), 1.2
other, 20.0
A11-16
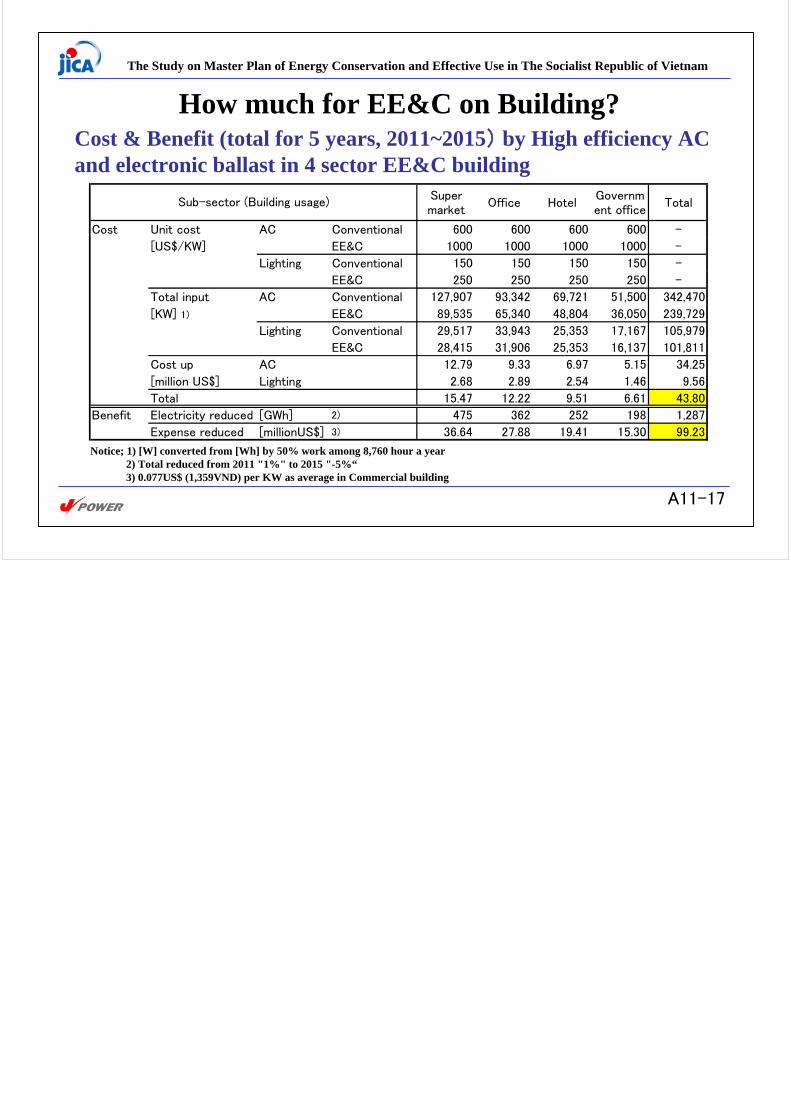
The Study on Master Plan of Energy Conservation and Effective Use in The Socialist Republic of Vietnam
How much for EE&C on Building?Cost & Benefit (total for 5 years, 2011~2015) by High efficiency AC and electronic ballast in 4 sector EE&C building
Supermarket
Office HotelGovernment office
Total
Cost Unit cost AC Conventional 600 600 600 600 -
[US$/KW] EE&C 1000 1000 1000 1000 -
Lighting Conventional 150 150 150 150 -
EE&C 250 250 250 250 -
Total input AC Conventional 127,907 93,342 69,721 51,500 342,470
[KW] 1) EE&C 89,535 65,340 48,804 36,050 239,729
Lighting Conventional 29,517 33,943 25,353 17,167 105,979
EE&C 28,415 31,906 25,353 16,137 101,811
Cost up AC 12.79 9.33 6.97 5.15 34.25
[million US$] Lighting 2.68 2.89 2.54 1.46 9.56
Total 15.47 12.22 9.51 6.61 43.80
Benefit Electricity reduced [GWh] 2) 475 362 252 198 1,287
Expense reduced [millionUS$] 3) 36.64 27.88 19.41 15.30 99.23
Sub-sector (Building usage)
Notice; 1) [W] converted from [Wh] by 50% work among 8,760 hour a year2) Total reduced from 2011 "1%" to 2015 "-5%“3) 0.077US$ (1,359VND) per KW as average in Commercial building
A11-17

ANNEX 12
CURRICULUM OF EE&C TRAINING IN JAPAN
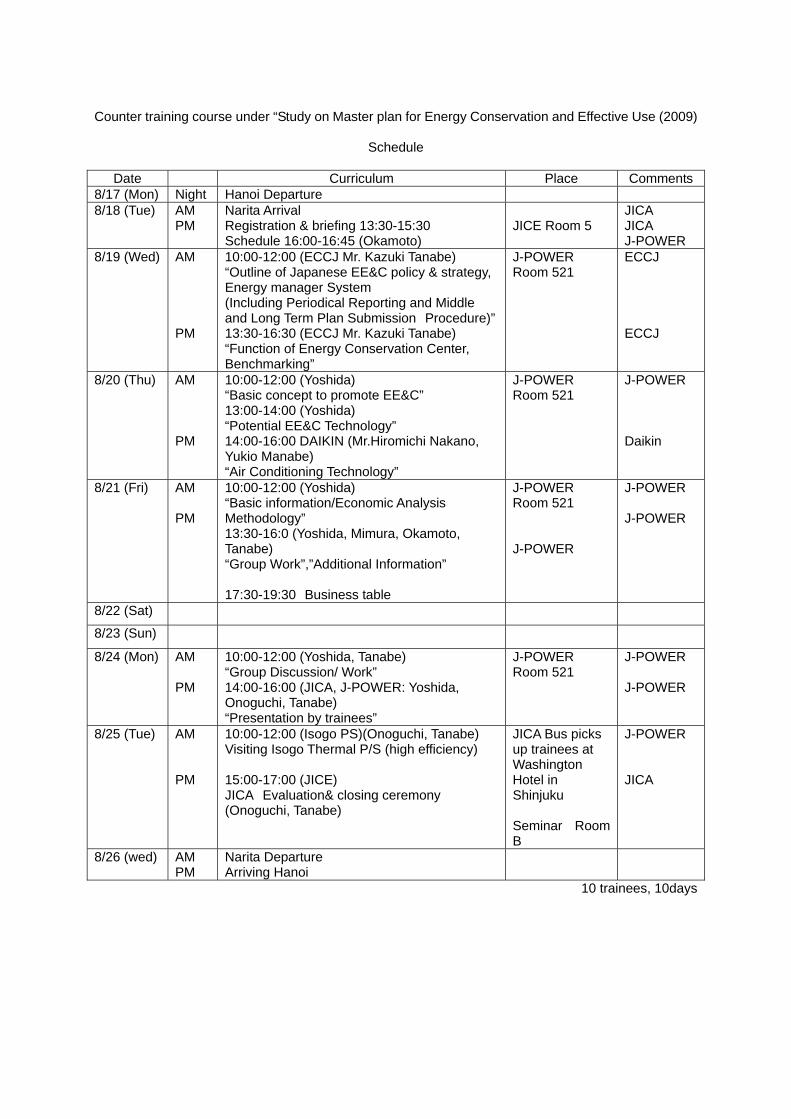
Counter training course under “Study on Master plan for Energy Conservation and Effective Use (2009)
Schedule
Date Curriculum Place Comments
8/17 (Mon) Night Hanoi Departure 8/18 (Tue) AM
PM Narita Arrival Registration & briefing 13:30-15:30 Schedule 16:00-16:45 (Okamoto)
JICE Room 5
JICA JICA J-POWER
8/19 (Wed) AM PM
10:00-12:00 (ECCJ Mr. Kazuki Tanabe) “Outline of Japanese EE&C policy & strategy, Energy manager System (Including Periodical Reporting and Middle and Long Term Plan Submission Procedure)”13:30-16:30 (ECCJ Mr. Kazuki Tanabe) “Function of Energy Conservation Center, Benchmarking”
J-POWER Room 521
ECCJ ECCJ
8/20 (Thu) AM PM
10:00-12:00 (Yoshida) “Basic concept to promote EE&C” 13:00-14:00 (Yoshida) “Potential EE&C Technology” 14:00-16:00 DAIKIN (Mr.Hiromichi Nakano, Yukio Manabe) “Air Conditioning Technology”
J-POWER Room 521
J-POWER Daikin
8/21 (Fri) AM PM
10:00-12:00 (Yoshida) “Basic information/Economic Analysis Methodology” 13:30-16:0 (Yoshida, Mimura, Okamoto, Tanabe) “Group Work”,”Additional Information” 17:30-19:30 Business table
J-POWER Room 521 J-POWER
J-POWER J-POWER
8/22 (Sat)
8/23 (Sun)
8/24 (Mon) AM PM
10:00-12:00 (Yoshida, Tanabe) “Group Discussion/ Work” 14:00-16:00 (JICA, J-POWER: Yoshida, Onoguchi, Tanabe) “Presentation by trainees”
J-POWER Room 521
J-POWER J-POWER
8/25 (Tue) AM PM
10:00-12:00 (Isogo PS)(Onoguchi, Tanabe) Visiting Isogo Thermal P/S (high efficiency) 15:00-17:00 (JICE) JICA Evaluation& closing ceremony (Onoguchi, Tanabe)
JICA Bus picks up trainees at Washington Hotel in Shinjuku Seminar Room B
J-POWER JICA
8/26 (wed) AM PM
Narita Departure Arriving Hanoi
10 trainees, 10days