rancho cucamonga campus master plan
TRANSCRIPT

April 2022 | Draft Environmental Impact Report State Clearinghouse No. 2021060412
RANCHO CUCAMONGA CAMPUS MASTER PLAN
Prepared for:
Chaffey Community College District Contact: Troy Ament, Interim Vice President of Administrative Services and Emergency Operations
Executive Director, Facilities & Construction 5885 Haven Avenue
Rancho Cucamonga, California 91737-3002 909.652.6171
Prepared by:
PlaceWorks Contact: Dwayne Mears, AICP, Principal
3 MacArthur Place, Suite 1100 Santa Ana, California 92707
714.966.9220 [email protected] www.placeworks.com

R A N C H O C U C A M O N G A C A M P U S M A S T E R P L A N D R A F T E I R C H A F F E Y C O M M U N I T Y C O L L E G E D I S T R I C T
Table of Contents
Contents Page
April 2022 Page i
1. EXECUTIVE SUMMARY .............................................................................................................. 1-1 1.1 INTRODUCTION ............................................................................................................................................. 1-1 1.2 ENVIRONMENTAL PROCEDURES ......................................................................................................... 1-1
1.2.1 EIR Format .......................................................................................................................................... 1-2 1.2.2 Type and Purpose of This DEIR ..................................................................................................... 1-3
1.3 PROJECT LOCATION .................................................................................................................................... 1-4 1.4 PROJECT SUMMARY ...................................................................................................................................... 1-4 1.5 SUMMARY OF PROJECT ALTERNATIVES .......................................................................................... 1-10
1.5.1 No Project Alternative ..................................................................................................................... 1-10 1.5.2 Integrated Historic Resources Alternative .................................................................................... 1-10
1.6 ISSUES TO BE RESOLVED ........................................................................................................................ 1-11 1.7 AREAS OF CONTROVERSY ...................................................................................................................... 1-11 1.8 SUMMARY OF ENVIRONMENTAL IMPACTS, MITIGATION MEASURES, AND LEVELS
OF SIGNIFICANCE AFTER MITIGATION .......................................................................................... 1-11 2. INTRODUCTION ........................................................................................................................... 2-1
2.1 PURPOSE OF THE ENVIRONMENTAL IMPACT REPORT ............................................................. 2-1 2.2 NOTICE OF PREPARATION AND INITIAL STUDY .......................................................................... 2-2 2.3 SCOPE OF THIS DEIR ................................................................................................................................... 2-4
2.3.1 Impacts Considered Less Than Significant .................................................................................... 2-4 2.3.2 Potentially Significant Adverse Impacts .......................................................................................... 2-5 2.3.3 Unavoidable Significant Adverse Impacts ...................................................................................... 2-5
2.4 INCORPORATION BY REFERENCE ....................................................................................................... 2-5 2.5 FINAL EIR CERTIFICATION ...................................................................................................................... 2-6 2.6 MITIGATION MONITORING ..................................................................................................................... 2-6
3. PROJECT DESCRIPTION............................................................................................................ 3-1 3.1 PROJECT LOCATION .................................................................................................................................... 3-1 3.2 BACKGROUND AND PROJECT HISTORY ............................................................................................ 3-1 3.3 STATEMENT OF OBJECTIVES .................................................................................................................. 3-2 3.4 PROJECT DEFINITION ................................................................................................................................. 3-2 3.5 PROJECT DESCRIPTION .............................................................................................................................. 3-2
3.5.1 Demolition............................................................................................................................................ 3-4 3.5.2 New Building Construction............................................................................................................... 3-4 3.5.3 Renovation ............................................................................................................................................ 3-5 3.5.4 Student Capacity .................................................................................................................................. 3-8
3.6 INTENDED USES OF THE EIR ................................................................................................................. 3-8 4. ENVIRONMENTAL SETTING ...................................................................................................... 4-1
4.1 INTRODUCTION ............................................................................................................................................. 4-1 4.2 HISTORY ............................................................................................................................................................. 4-1 4.3 ENVIRONMENTAL SETTING .................................................................................................................... 4-3
4.3.1 Project Location .................................................................................................................................. 4-3 4.3.2 Surrounding Land Uses ...................................................................................................................... 4-3 4.3.3 Existing Conditions ............................................................................................................................ 4-3 4.3.4 General Plan and Zoning ................................................................................................................... 4-3
4.4 ASSUMPTIONS REGARDING CUMULATIVE IMPACTS .................................................................. 4-4 4.5 REFERENCES .................................................................................................................................................... 4-4
5. ENVIRONMENTAL ANALYSIS .................................................................................................... 5-1 5.1 AIR QUALITY ................................................................................................................................................. 5.1-1
5.1.1 Environmental Setting ..................................................................................................................... 5.1-1 5.1.2 Thresholds of Significance .......................................................................................................... 5.1-17

R A N C H O C U C A M O N G A C A M P U S M A S T E R P L A N D R A F T E I R C H A F F E Y C O M M U N I T Y C O L L E G E D I S T R I C T
Table of Contents
Contents Page
Page ii PlaceWorks
5.1.3 Plans, Programs, and Policies ...................................................................................................... 5.1-22 5.1.4 Environmental Impacts ................................................................................................................ 5.1-23 5.1.5 Cumulative Impacts ...................................................................................................................... 5.1-40 5.1.6 Level of Significance Before Mitigation ................................................................................... 5.1-40 5.1.7 Mitigation Measures ...................................................................................................................... 5.1-41 5.1.8 Level of Significance After Mitigation ...................................................................................... 5.1-42 5.1.9 References ....................................................................................................................................... 5.1-45
5.2 BIOLOGICAL RESOURCES ...................................................................................................................... 5.2-1 5.2.1 Environmental Setting ..................................................................................................................... 5.2-1 5.2.2 Thresholds of Significance .......................................................................................................... 5.2-16 5.2.3 Plans, Programs, and Policies ...................................................................................................... 5.2-17 5.2.4 Environmental Impacts ................................................................................................................ 5.2-17 5.2.5 Cumulative Impacts ...................................................................................................................... 5.2-23 5.2.6 Level of Significance Before Mitigation ................................................................................... 5.2-24 5.2.7 Mitigation Measures ...................................................................................................................... 5.2-24 5.2.8 Level of Significance After Mitigation ...................................................................................... 5.2-26 5.2.9 References ....................................................................................................................................... 5.2-26
5.3 CULTURAL RESOURCES ........................................................................................................................... 5.3-1 5.3.1 Environmental Setting ..................................................................................................................... 5.3-1 5.3.2 Thresholds of Significance .......................................................................................................... 5.3-11 5.3.3 Plans, Programs, and Policies ...................................................................................................... 5.3-11 5.3.4 Environmental Impacts ................................................................................................................ 5.3-12 5.3.5 Cumulative Impacts ...................................................................................................................... 5.3-18 5.3.6 Level of Significance Before Mitigation ................................................................................... 5.3-19 5.3.7 Mitigation Measures ...................................................................................................................... 5.3-19 5.3.8 Level of Significance After Mitigation ...................................................................................... 5.3-21 5.3.9 References ....................................................................................................................................... 5.3-21
5.4 GREENHOUSE GAS EMISSIONS ........................................................................................................... 5.4-1 5.4.1 Environmental Setting ..................................................................................................................... 5.4-1 5.4.2 Thresholds of Significance .......................................................................................................... 5.4-17 5.4.3 Plans, Programs, and Policies ...................................................................................................... 5.4-19 5.4.4 Environmental Impacts ................................................................................................................ 5.4-19 5.4.5 Cumulative Impacts ...................................................................................................................... 5.4-24 5.4.6 Level of Significance Before Mitigation ................................................................................... 5.4-24 5.4.7 Mitigation Measures ...................................................................................................................... 5.4-24 5.4.8 Level of Significance After Mitigation ...................................................................................... 5.4-24 5.4.9 References ....................................................................................................................................... 5.4-25
5.5 NOISE ................................................................................................................................................................ 5.5-1 5.5.1 Environmental Setting ..................................................................................................................... 5.5-1 5.5.2 Thresholds of Significance .......................................................................................................... 5.5-12 5.5.3 Plans, Programs, and Policies ...................................................................................................... 5.5-14 5.5.4 Environmental Impacts ................................................................................................................ 5.5-14 5.5.5 Cumulative Impacts ...................................................................................................................... 5.5-24 5.5.6 Level of Significance Before Mitigation ................................................................................... 5.5-25 5.5.7 Mitigation Measures ...................................................................................................................... 5.5-25 5.5.8 Level of Significance After Mitigation ...................................................................................... 5.5-29 5.5.9 References ....................................................................................................................................... 5.5-29
5.6 TRANSPORTATION ..................................................................................................................................... 5.6-1 5.6.1 Environmental Setting ..................................................................................................................... 5.6-1 5.6.2 Thresholds of Significance .......................................................................................................... 5.6-19 5.6.3 Plans, Programs, and Policies ...................................................................................................... 5.6-19

R A N C H O C U C A M O N G A C A M P U S M A S T E R P L A N D R A F T E I R C H A F F E Y C O M M U N I T Y C O L L E G E D I S T R I C T
Table of Contents
Contents Page
April 2022 Page iii
5.6.4 Environmental Impacts ................................................................................................................ 5.6-19 5.6.5 Cumulative Impacts ...................................................................................................................... 5.6-24 5.6.6 Level of Significance Before Mitigation ................................................................................... 5.6-24 5.6.7 Mitigation Measures ...................................................................................................................... 5.6-24 5.6.8 Level of Significance After Mitigation ...................................................................................... 5.6-24 5.6.9 References ....................................................................................................................................... 5.6-24
5.7 TRIBAL CULTURAL RESOURCES .......................................................................................................... 5.7-1 5.7.1 Environmental Setting ..................................................................................................................... 5.7-1 5.7.2 Thresholds of Significance ............................................................................................................. 5.7-4 5.7.3 Plans, Programs, and Policies ......................................................................................................... 5.7-4 5.7.4 Environmental Impacts ................................................................................................................... 5.7-5 5.7.5 Cumulative Impacts ......................................................................................................................... 5.7-6 5.7.6 Level of Significance Before Mitigation ...................................................................................... 5.7-6 5.7.7 Mitigation Measures ......................................................................................................................... 5.7-7 5.7.8 Level of Significance After Mitigation ......................................................................................... 5.7-7 5.7.9 References .......................................................................................................................................... 5.7-8
6. SIGNIFICANT UNAVOIDABLE ADVERSE IMPACTS ................................................................ 6-1 7. ALTERNATIVES TO THE PROPOSED PROJECT ..................................................................... 7-1
7.1 INTRODUCTION ............................................................................................................................................. 7-1 7.1.1 Purpose and Scope .............................................................................................................................. 7-1 7.1.2 Project Objectives ............................................................................................................................... 7-2
7.2 ALTERNATIVES CONSIDERED AND REJECTED DURING THE SCOPING/PROJECT PLANNING PROCESS .................................................................................................................................... 7-2 7.2.1 Alternative Development Areas ....................................................................................................... 7-3
7.3 ALTERNATIVES SELECTED FOR FURTHER ANALYSIS................................................................ 7-3 7.4 NO PROJECT ALTERNATIVE .................................................................................................................... 7-3
7.4.1 Air Quality ............................................................................................................................................ 7-3 7.4.2 Biological Impacts ............................................................................................................................... 7-4 7.4.3 Cultural Resources............................................................................................................................... 7-4 7.4.4 Greenhouse Gas Emissions .............................................................................................................. 7-4 7.4.5 Noise ...................................................................................................................................................... 7-4 7.4.6 Transportation ..................................................................................................................................... 7-5 7.4.7 Tribal Cultural Resources ................................................................................................................... 7-5 7.4.8 Conclusion ............................................................................................................................................ 7-5
7.5 INTEGRATED HISTORIC RESOURCES ALTERNATIVE................................................................. 7-6 7.5.1 Air Quality ............................................................................................................................................ 7-6 7.5.2 Biological Impacts ............................................................................................................................... 7-7 7.5.3 Cultural Resources............................................................................................................................... 7-7 7.5.4 Greenhouse Gas Emissions .............................................................................................................. 7-7 7.5.5 Noise ...................................................................................................................................................... 7-7 7.5.6 Transportation ..................................................................................................................................... 7-7 7.5.7 Tribal Cultural Resources ................................................................................................................... 7-7 7.5.8 Conclusion ............................................................................................................................................ 7-8
7.6 ENVIRONMENTALLY SUPERIOR ALTERNATIVE ........................................................................... 7-9 8. IMPACTS FOUND NOT TO BE SIGNIFICANT ............................................................................ 8-1
8.1 AESTHETICS ..................................................................................................................................................... 8-1 8.2 AGRICULTURE AND FORESTRY RESOURCES .................................................................................. 8-3 8.3 ENERGY .............................................................................................................................................................. 8-4 8.4 GEOLOGY AND SOILS ................................................................................................................................. 8-6 8.5 HAZARDS AND HAZARDOUS MATERIALS ...................................................................................... 8-12

R A N C H O C U C A M O N G A C A M P U S M A S T E R P L A N D R A F T E I R C H A F F E Y C O M M U N I T Y C O L L E G E D I S T R I C T
Table of Contents
Contents Page
Page iv PlaceWorks
8.6 HYDROLOGY AND WATER QUALITY ................................................................................................ 8-14 8.7 LAND USE AND PLANNING ................................................................................................................... 8-19 8.8 MINERAL RESOURCES ............................................................................................................................... 8-19 8.9 POPULATION AND HOUSING ............................................................................................................... 8-19 8.10 PUBLIC SERVICES ......................................................................................................................................... 8-20 8.11 RECREATION ................................................................................................................................................. 8-21 8.12 UTILITIES AND SERVICE SYSTEMS ..................................................................................................... 8-22 8.13 WILDFIRE ......................................................................................................................................................... 8-23 8.14 REFERENCES .................................................................................................................................................. 8-26
9. SIGNIFICANT IRREVERSIBLE CHANGES DUE TO THE PROPOSED PROJECT ................. 9-1 10. GROWTH-INDUCING IMPACTS OF THE PROPOSED PROJECT .......................................... 10-1 11. ORGANIZATIONS AND PERSONS CONSULTED .................................................................... 11-1 12. QUALIFICATIONS OF PERSONS PREPARING EIR ................................................................ 12-1
PLACEWORKS ................................................................................................................................................................. 12-1 13. BIBLIOGRAPHY ......................................................................................................................... 13-1
R A N C H O C U C A M O N G A C A M P U S M A S T E R P L A N D R A F T E I R C H A F F E Y C O M M U N I T Y C O L L E G E D I S T R I C T
Table of Contents
Contents Page
April 2022 Page v
APPENDICES
Appendix A NOP and NOP Comments
Appendix B Air Quality and GHG Emissions Data
Appendix C Construction Health Risk Assessment
Appendix D Biological Resources Technical Report
Appendix E Cultural Resources Technical Report
Appendix F Noise Data
Appendix G Traffic Analysis
Appendix H VMT Screening Memo
Appendix I Paleontological Resources Data
R A N C H O C U C A M O N G A C A M P U S M A S T E R P L A N D R A F T E I R C H A F F E Y C O M M U N I T Y C O L L E G E D I S T R I C T
Table of Contents
Figure Page
Page vi PlaceWorks
Figure 3-1 Regional Location .................................................................................................................................... 3-11
Figure 3-2 Local Vicinity ............................................................................................................................................ 3-13
Figure 3-3 Aerial Photo .............................................................................................................................................. 3-15
Figure 3-4 New Buildings and Renovations ........................................................................................................... 3-17
Figure 3-5 Demolition Plan ....................................................................................................................................... 3-19
Figure 4-1 Existing Campus ......................................................................................................................................... 4-5
Figure 4-2 General Plan Designation ......................................................................................................................... 4-7
Figure 4-3 Zoning Map ................................................................................................................................................. 4-9
Figure 5.2-1 Biological Resources Study Area and Vegetation Communities .................................................... 5.2-5
Figure 5.2-2 Biological Resources Impact Areas ................................................................................................... 5.2-19
Figure 5.3-1 Buildings Older Than 45 Years ............................................................................................................ 5.3-9
Figure 5.5-1 Approximate Noise Monitoring Locations ........................................................................................ 5.5-9
Figure 5.5-2 Temporary Noise Barrier Location ................................................................................................... 5.5-27
Figure 5.6-1 Existing Roadways and Intersection Controls ................................................................................... 5.6-7
Figure 5.6-2 Existing Bicycle Facilities .................................................................................................................... 5.6-11
Figure 5.6-3 Existing Trails........................................................................................................................................ 5.6-13
Figure 5.6-4 Existing Pedestrian Facilities .............................................................................................................. 5.6-15
Figure 5.6-5 Existing Bus Routes ............................................................................................................................. 5.6-17

R A N C H O C U C A M O N G A C A M P U S M A S T E R P L A N D R A F T E I R C H A F F E Y C O M M U N I T Y C O L L E G E D I S T R I C T
Table of Contents
Table Page
April 2022 Page vii
Table 1-1 Project Components and Phasing Summary ......................................................................................... 1-5
Table 1-2 Building Demolition Summary ................................................................................................................. 1-6
Table 1-3 New Building Construction Summary .................................................................................................... 1-7
Table 1-4 Renovation Summary ................................................................................................................................. 1-9
Table 1-5 Summary of Environmental Impacts, Mitigation Measures and Levels of Significance After Mitigation ................................................................................................. 1-13
Table 2-1 NOP Comment Summary ........................................................................................................................ 2-2
Table 3-1 Project Components and Phasing Summary ......................................................................................... 3-3
Table 3-2 Building Demolition Summary ................................................................................................................. 3-4
Table 3-3 New Building Construction Summary .................................................................................................... 3-5
Table 3-4 Renovation Summary ................................................................................................................................. 3-7
Table 5.1-1 Criteria Air Pollutant Health Effects Summary ................................................................................. 5.1-4
Table 5.1-2 Ambient Air Quality Standards for Criteria Air Pollutants ............................................................. 5.1-6
Table 5.1-3 Attainment Status of Criteria Air Pollutants in the South Coast Air Basin ................................ 5.1-13
Table 5.1-4 Ambient Air Quality Monitoring Summary ..................................................................................... 5.1-15
Table 5.1-5 Existing Criteria Air Pollutant Emissions ........................................................................................ 5.1-16
Table 5.1-6 South Coast AQMD Significance Thresholds ................................................................................. 5.1-17
Table 5.1-7 South Coast AQMD Localized Significance Thresholds............................................................... 5.1-20
Table 5.1-8 South Coast AQMD Screening-Level Localized Significance Thresholds: Construction .......................................................................................................................... 5.1-21
Table 5.1-9 South Coast AQMD Toxic Air Contaminants Incremental Risk Thresholds ........................... 5.1-22
Table 5.1-10 Phase 1: Construction Activities, Phasing, and Equipment .......................................................... 5.1-24
Table 5.1-11 Phase 2: Construction Activities, Phasing, and Equipment .......................................................... 5.1-25
Table 5.1-12 Phase 3: Construction Activities, Phasing, and Equipment .......................................................... 5.1-25
Table 5.1-13 Phase 4: Construction Activities, Phasing, and Equipment .......................................................... 5.1-26
Table 5.1-14 Phase 5: Construction Activities, Phasing, and Equipment .......................................................... 5.1-26
Table 5.1-15 Maximum Daily Regional Construction Emissions by Development Phase ............................. 5.1-30
Table 5.1-16 Full Buildout: Net Maximum Daily Operation-Phase Emissions ................................................ 5.1-33
Table 5.1-17 Potential Overlap of Construction and Operational Activities .................................................... 5.1-34
Table 5.1-18 Maximum Daily Onsite Localized Construction Emissions ......................................................... 5.1-35
Table 5.1-19 Construction Risk Summary ............................................................................................................... 5.1-37
Table 5.1-20 Maximum Daily Regional Construction Emissions by Development Phase: Mitigated ................................................................................................................................. 5.1-42
Table 5.1-21 Phase 1 Maximum Daily Onsite Localized Construction Emissions: Mitigated ....................... 5.1-45
Table 5.2-1 Vegetation Community Acreages ........................................................................................................ 5.2-7
Table 5.2-2 Sensitive Plant Species Assessment ................................................................................................... 5.2-10

R A N C H O C U C A M O N G A C A M P U S M A S T E R P L A N D R A F T E I R C H A F F E Y C O M M U N I T Y C O L L E G E D I S T R I C T
Table of Contents
Table Page
Page viii PlaceWorks
Table 5.2-3 Sensitive Wildlife Species Assessment .............................................................................................. 5.2-14
Table 5.3-1 Cultural Resources Within One-Mile Radius of the Project Site .................................................... 5.3-6
Table 5.3-2 Buildings Older Than 45 Years ............................................................................................................ 5.3-7
Table 5.3-3 Historic District Contributor Evaluation Summary ....................................................................... 5.3-14
Table 5.4-1 GHG Emissions and Their Relative Global Warming Potential Compared to CO2 ................. 5.4-2
Table 5.4-2 Summary of GHG Emissions Risks to California ............................................................................ 5.4-5
Table 5.4-3 2017 Climate Change Scoping Plan Emissions Reductions Gap ................................................. 5.4-10
Table 5.4-4 2017 Climate Change Scoping Plan Emissions Change by Sector ............................................... 5.4-10
Table 5.4-5 Existing GHG Emissions Inventory ................................................................................................. 5.4-17
Table 5.4-6 Operational Phase GHG Emissions ................................................................................................. 5.4-22
Table 5.5-1 Typical Noise Levels .............................................................................................................................. 5.5-4
Table 5.5-2 Rancho Cucamonga Noise Compatibility Standards for People .................................................... 5.5-6
Table 5.5-3 Rancho Cucamonga Exterior Noise Standards ................................................................................. 5.5-7
Table 5.5-4 Long-Term Noise Measurement Summary ...................................................................................... 5.5-11
Table 5.5-5 Short-Term Noise Measurements Summary in A-weighted Sound Levels ................................ 5.5-12
Table 5.5-6 Groundborne Vibration Criteria: Architectural Damage ............................................................... 5.5-14
Table 5.5-7 List of Construction Equipment and Noise Emission Levels ...................................................... 5.5-16
Table 5.5-8 Construction Phasing Schedule .......................................................................................................... 5.5-17
Table 5.5-9 Project-Related Construction Noise, dBA Leq at Off-Campus Receptors .................................. 5.5-17
Table 5.5-10 Traffic Noise Levels for Existing and Project Buildout Conditions............................................ 5.5-21
Table 5.5-11 Vibration Levels for Typical Construction Equipment ................................................................. 5.5-23
Table 5.5-12 Traffic Noise Levels for Existing and Project Buildout Conditions............................................ 5.5-24
Table 5.6-1 Existing Trip Generation Summary .................................................................................................. 5.6-10
Table 5.6-2 Project Trip Generation Summary .................................................................................................... 5.6-20
Table 7-1 Summary of Proposed Project and Alternatives ................................................................................... 7-9
Table 7-2 Ability of Each Alternative to Meet the Project Objectives ............................................................. 7-10
Table 8-1 Construction BMPs .................................................................................................................................... 8-9
R A N C H O C U C A M O N G A C A M P U S M A S T E R P L A N D R A F T E I R C H A F F E Y C O M M U N I T Y C O L L E G E D I S T R I C T
Abbreviations and Acronyms
April 2022 Page ix
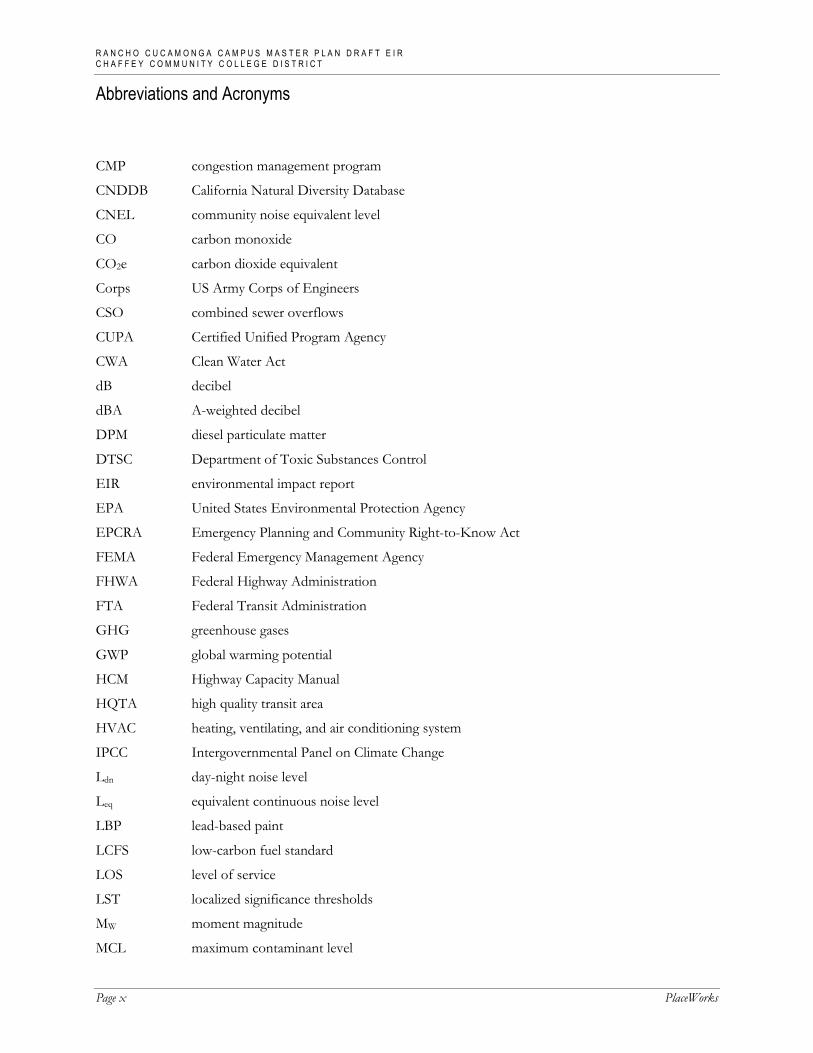
ABBREVIATIONS AND ACRONYMS
AAQS ambient air quality standards
AB Assembly Bill
ACM asbestos-containing materials
ADT average daily traffic
amsl above mean sea level
AQMP air quality management plan
AST aboveground storage tank
BAU business as usual
bgs below ground surface
BMP best management practices
CAA Clean Air Act
CAFE corporate average fuel economy
CalARP California Accidental Release Prevention Program
CalEMA California Emergency Management Agency
Cal/EPA California Environmental Protection Agency
CAL FIRE California Department of Forestry and Fire Protection
CALGreen California Green Building Standards Code
Cal/OSHA California Occupational Safety and Health Administration
CalRecycle California Department of Resources, Recycling, and Recovery
Caltrans California Department of Transportation
CARB California Air Resources Board
CBC California Building Code
CCAA California Clean Air Act
CCCD Chaffey Community College District
CCR California Code of Regulations
CDE California Department of Education
CDFW California Department of Fish and Wildlife
CEQA California Environmental Quality Act
CERCLA Comprehensive Environmental Response, Compensation and Liability Act
cfs cubic feet per second
CGS California Geologic Survey
R A N C H O C U C A M O N G A C A M P U S M A S T E R P L A N D R A F T E I R C H A F F E Y C O M M U N I T Y C O L L E G E D I S T R I C T
Abbreviations and Acronyms
Page x PlaceWorks
CMP congestion management program
CNDDB California Natural Diversity Database
CNEL community noise equivalent level
CO carbon monoxide
CO2e carbon dioxide equivalent
Corps US Army Corps of Engineers
CSO combined sewer overflows
CUPA Certified Unified Program Agency
CWA Clean Water Act
dB decibel
dBA A-weighted decibel
DPM diesel particulate matter
DTSC Department of Toxic Substances Control
EIR environmental impact report
EPA United States Environmental Protection Agency
EPCRA Emergency Planning and Community Right-to-Know Act
FEMA Federal Emergency Management Agency
FHWA Federal Highway Administration
FTA Federal Transit Administration
GHG greenhouse gases
GWP global warming potential
HCM Highway Capacity Manual
HQTA high quality transit area
HVAC heating, ventilating, and air conditioning system
IPCC Intergovernmental Panel on Climate Change
Ldn day-night noise level
Leq equivalent continuous noise level
LBP lead-based paint
LCFS low-carbon fuel standard
LOS level of service
LST localized significance thresholds
MW moment magnitude
MCL maximum contaminant level
R A N C H O C U C A M O N G A C A M P U S M A S T E R P L A N D R A F T E I R C H A F F E Y C O M M U N I T Y C O L L E G E D I S T R I C T
Abbreviations and Acronyms
April 2022 Page xi
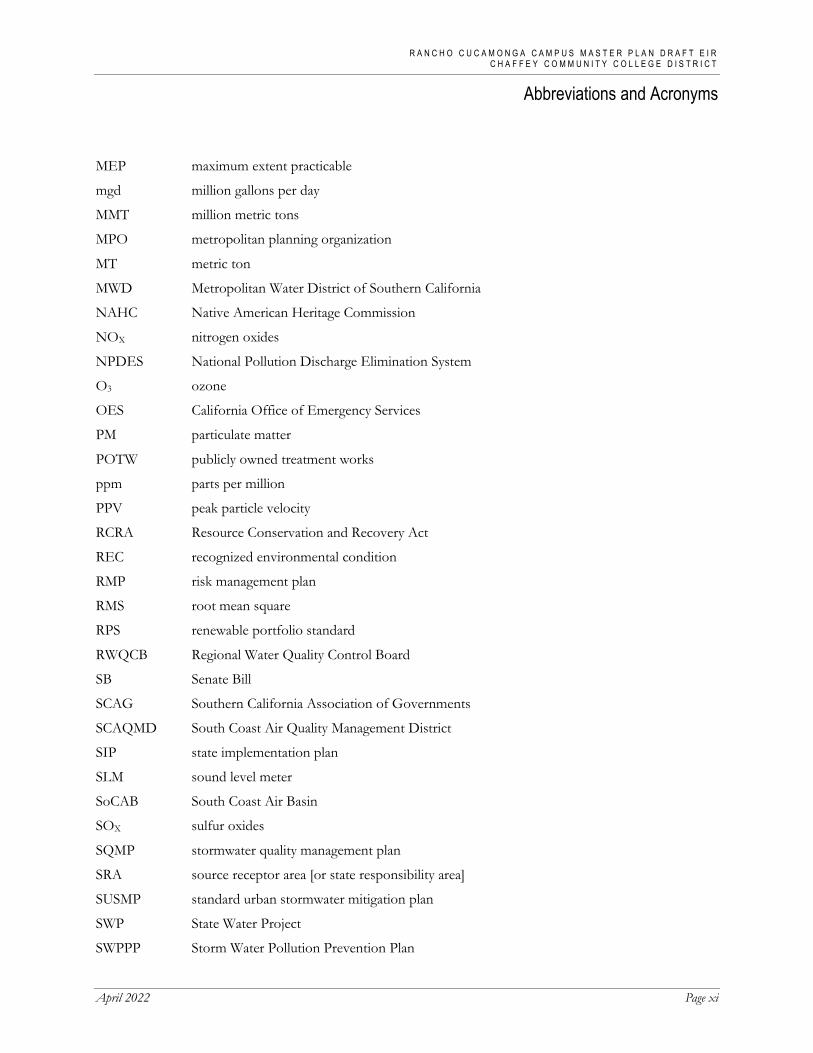
MEP maximum extent practicable
mgd million gallons per day
MMT million metric tons
MPO metropolitan planning organization
MT metric ton
MWD Metropolitan Water District of Southern California
NAHC Native American Heritage Commission
NOX nitrogen oxides
NPDES National Pollution Discharge Elimination System
O3 ozone
OES California Office of Emergency Services
PM particulate matter
POTW publicly owned treatment works
ppm parts per million
PPV peak particle velocity
RCRA Resource Conservation and Recovery Act
REC recognized environmental condition
RMP risk management plan
RMS root mean square
RPS renewable portfolio standard
RWQCB Regional Water Quality Control Board
SB Senate Bill
SCAG Southern California Association of Governments
SCAQMD South Coast Air Quality Management District
SIP state implementation plan
SLM sound level meter
SoCAB South Coast Air Basin
SOX sulfur oxides
SQMP stormwater quality management plan
SRA source receptor area [or state responsibility area]
SUSMP standard urban stormwater mitigation plan
SWP State Water Project
SWPPP Storm Water Pollution Prevention Plan

R A N C H O C U C A M O N G A C A M P U S M A S T E R P L A N D R A F T E I R C H A F F E Y C O M M U N I T Y C O L L E G E D I S T R I C T
Abbreviations and Acronyms
Page xii PlaceWorks
SWRCB State Water Resources Control Board
TAC toxic air contaminants
TNM transportation noise model
tpd tons per day
TRI toxic release inventory
TTCP traditional tribal cultural places
USFWS United States Fish and Wildlife Service
USGS United States Geological Survey
UST underground storage tank
UWMP urban water management plan
V/C volume-to-capacity ratio
VdB velocity decibels
VHFHSZ very high fire hazard severity zone
VMT vehicle miles traveled
VOC volatile organic compound
WQMP water quality management plan
WSA water supply assessment

April 2022 Page 1-1
1. Executive Summary 1.1 INTRODUCTION This draft environmental impact report (DEIR) addresses the environmental effects associated with the implementation of the Rancho Cucamonga Campus Master Plan. The California Environmental Quality Act (CEQA) requires that local government agencies consider the environmental consequences before taking action on projects over which they have discretionary approval authority. An environmental impact report (EIR) analyzes potential environmental consequences in order to inform the public and support informed decisions by local and state governmental agency decision makers.
This DEIR has been prepared pursuant to the requirements of CEQA and the Chaffey Community College District’s (District) CEQA procedures. The District, as the lead agency, has reviewed and revised all submitted drafts, technical studies, and reports as necessary to reflect its own independent judgment.
Data for this DEIR derive from onsite field observations, discussions with affected agencies, analysis of adopted plans and policies, review of available studies, reports, data and similar literature, and specialized environmental assessments (air quality, biological resources, cultural resources, noise, and transportation).
1.2 ENVIRONMENTAL PROCEDURES This DEIR has been prepared pursuant to CEQA to assess the environmental effects associated with implementation of the proposed project, as well as anticipated future discretionary actions and approvals. CEQA established six main objectives for an EIR:
1. Disclose to decision makers and the public the significant environmental effects of proposed activities.
2. Identify ways to avoid or reduce environmental damage.
3. Prevent environmental damage by requiring implementation of feasible alternatives or mitigation measures.
4. Disclose to the public reasons for agency approval of projects with significant environmental effects.
5. Foster interagency coordination in the review of projects.
6. Enhance public participation in the planning process.
An EIR is the most comprehensive form of environmental documentation in CEQA and the CEQA Guidelines; it is intended to provide an objective, factually supported analysis and full disclosure of the environmental consequences of a proposed project with the potential to result in significant, adverse environmental impacts.

R A N C H O C U C A M O N G A C A M P U S M A S T E R P L A N D R A F T E I R C H A F F E Y C O M M U N I T Y C O L L E G E D I S T R I C T
1. Executive Summary
Page 1-2 PlaceWorks
An EIR is one of various decision-making tools used by a lead agency to consider the merits and disadvantages of a project that is subject to its discretionary authority. Before approving a proposed project, the lead agency must consider the information in the EIR; determine whether the EIR was prepared in accordance with CEQA and the CEQA Guidelines; determine that it reflects the independent judgment of the lead agency; adopt findings concerning the project’s significant environmental impacts and alternatives; and adopt a statement of overriding considerations if significant impacts cannot be avoided.
1.2.1 EIR Format Chapter 1. Executive Summary: Summarizes the background and description of the proposed project, the format of this EIR, project alternatives, any critical issues remaining to be resolved, and the potential environmental impacts and mitigation measures identified for the project.
Chapter 2. Introduction: Describes the purpose of this EIR, background on the project, the notice of preparation, the use of incorporation by reference, and Final EIR certification.
Chapter 3. Project Description: A detailed description of the project, including its objectives, its area and location, approvals anticipated to be required as part of the project, necessary environmental clearances, and the intended uses of this EIR.
Chapter 4. Environmental Setting: A description of the physical environmental conditions in the vicinity of the project as they existed at the time the notice of preparation was published, from local and regional perspectives. These provide the baseline physical conditions from which the lead agency determines the significance of the project’s environmental impacts.
Chapter 5. Environmental Analysis: Each environmental topic is analyzed in a separate section that discusses: the thresholds used to determine if a significant impact would occur; the methodology to identify and evaluate the potential impacts of the project; the existing environmental setting; the potential adverse and beneficial effects of the project; the level of impact significance before mitigation; the mitigation measures for the proposed project; the level of significance after mitigation is incorporated; and the potential cumulative impacts of the proposed project and other existing, approved, and proposed development in the area.
Chapter 6. Significant Unavoidable Adverse Impacts: Describes the significant unavoidable adverse impacts of the proposed project.
Chapter 7. Alternatives to the Proposed Project: Describes the alternatives and compares their impacts to the impacts of the proposed project. Alternatives include the No Project Alternative and a Reduced Intensity Alternative.
Chapter 8. Impacts Found Not to Be Significant: Briefly describes the potential impacts of the project that were determined not to be significant by the Initial Study and were therefore not discussed in detail in this EIR.
Chapter 9. Significant Irreversible Changes Due to the Proposed Project: Describes the significant irreversible environmental changes associated with the project.

R A N C H O C U C A M O N G A C A M P U S M A S T E R P L A N D R A F T E I R C H A F F E Y C O M M U N I T Y C O L L E G E D I S T R I C T
1. Executive Summary
April 2022 Page 1-3
Chapter 10. Growth-Inducing Impacts of the Project: Describes the ways in which the proposed project would cause increases in employment or population that could result in new physical or environmental impacts.
Chapter 11. Organizations and Persons Consulted: Lists the people and organizations that were contacted during the preparation of this EIR.
Chapter 12. Qualifications of Persons Preparing EIR: Lists the people who prepared this EIR for the proposed project.
Chapter 13. Bibliography: The technical reports and other sources used to prepare this EIR.
Appendices: The appendices for this document (in PDF format on a CD attached to the front cover) comprise these supporting documents:
Appendix A: NOP and NOP Comments
Appendix B: Air Quality and GHG Emissions Data
Appendix C: Construction Health Risk Assessment Appendix D: Biological Resources Technical Report
Appendix E: Cultural Resources Technical Report
Appendix F: Noise Data
Appendix G: Traffic Analysis
Appendix H: VMT Screening Memo Appendix I: Paleontological Resources Data
1.2.2 Type and Purpose of This DEIR This DEIR fulfills the requirements for a Program EIR. Although the legally required contents of a Program EIR are the same as for a Project EIR, Program EIRs are typically more conceptual than Project EIRs, with a more general discussion of impacts, alternatives, and mitigation measures. According to Section 15168 of the CEQA Guidelines, a Program EIR may be prepared on a series of actions that can be characterized as one large project. Use of a Program EIR gives the lead agency an opportunity to consider broad policy alternatives and programwide mitigation measures, as well as greater flexibility to address project-specific and cumulative environmental impacts on a comprehensive scale.
Agencies prepare Program EIRs for programs or a series of related actions that are linked geographically; logical parts of a chain of contemplated events, rules, regulations, or plans that govern the conduct of a continuing program; or individual activities carried out under the same authority and having generally similar environmental effects that can be mitigated in similar ways.
Once a Program EIR has been prepared, subsequent activities within the program must be evaluated to determine whether an additional CEQA document is necessary. However, if the Program EIR addresses the program’s effects as specifically and comprehensively as possible, many subsequent activities may be within the Program EIR’s scope, and additional environmental documents may not be required (Guidelines § 15168[c]). When a lead agency relies on a Program EIR for a subsequent activity, it must incorporate feasible mitigation

R A N C H O C U C A M O N G A C A M P U S M A S T E R P L A N D R A F T E I R C H A F F E Y C O M M U N I T Y C O L L E G E D I S T R I C T
1. Executive Summary
Page 1-4 PlaceWorks
measures and alternatives from the Program EIR into the subsequent activities (Guidelines § 15168[c][3]). If a subsequent activity would have effects outside the scope of the Program EIR, the lead agency must prepare a new Initial Study leading to a Negative Declaration, Mitigated Negative Declaration, or an EIR. Even in this case, the Program EIR still serves a valuable purpose as the first-tier environmental analysis. The CEQA Guidelines encourage the use of Program EIRs, citing five advantages:
Provide a more exhaustive consideration of impacts and alternatives than would be practical in an individual EIR;
Focus on cumulative impacts that might be slighted in a case-by-case analysis;
Avoid continual reconsideration of recurring policy issues;
Consider broad policy alternatives and programmatic mitigation measures at an early stage when the agency has greater flexibility to deal with them;
Reduce paperwork by encouraging the reuse of data (through tiering). (Guidelines § 15168[h])
1.3 PROJECT LOCATION The 200-acre project site is at 5885 Haven Avenue in the north part of the City of Rancho Cucamonga, San Bernardino County (Assessor’s Parcel Number [APN] 020119115) State Route 210 (SR-210; Foothill Freeway) is about 0.5 mile south, Interstate 15 (I-15; Ontario Freeway) is about 4 miles southeast. The project site is bounded by Haven Avenue to the west, residences to the east, Wilson Avenue to the north, and Banyan Street to the south. Access to the project site is provided from Haven Avenue and Wilson Avenue.
1.4 PROJECT SUMMARY The project consists of demolition, construction, and renovation of buildings and campus facilities on the 200-acre campus in 5 phases over 30 years. The proposed project would involve demolition of approximately 229,000 square feet of existing buildings and facilities, construction of approximately 397,000 square feet of new buildings, and renovation and repurposing of approximately 148,000 square feet of existing buildings. The proposed project would also provide various outdoor space improvements, athletic fields improvement, and ADA and site improvements. Table 1-1 describes different project components proposed for each of the five phases. Figure 3-4, New Buildings and Renovations, shows the location of the new buildings, renovations, and additions.

R A N C H O C U C A M O N G A C A M P U S M A S T E R P L A N D R A F T E I R C H A F F E Y C O M M U N I T Y C O L L E G E D I S T R I C T
1. Executive Summary
April 2022 Page 1-5
Table 1-1 Project Components and Phasing Summary Demolition New Building / Facility Renovations and Repurposed Space
Phase 1 (Approx. 2027) Administration (AD; Building 1) Campus Center East (CCE; Building 20) Bookstore (B; Building 67) Campus Police (CP; Building 23)
Instructional Building 1 Campus Center East
ADA and Site Improvements 1 Swing Space (existing Library
modifications) Swimming Pool Renovation
Phase 2 (Approx. 2031) Business Education (BE; Building 5) Language Arts (LA; Building 10) Social Science (SS; Building 15) Wargin Hall (WH; Building 17) Vocational Education (VSS; Building 18) (also known
as Vocational and Student Support)
Instructional Building 2 Student Services Building
ADA and Site Improvements 2 Marie Kane Student Services &
Administration (SSA; Building 50)
Phase 3 (Approx. 2038) None. Flexible Performance
Space (FPS) and TV Studio Production Space (TV) Building
ADA and Site Improvements 3 Aeronautics (AERO) Berz Educational Excellence Center
(BEB; Building 51) Phase 4 (Approx. 2042) Math (MATH; Building 24) Physical Science (PS; Building 14)
Instructional Building 3 Operational Support
Building
ADA and Site Improvements 4 Skills Lab Renovation (SL) Theatre (TA)
Phase 5 (Approx. 2051) Health Science East (HS; Building 3) Health Science West (HS; Building 42) Maintenance & Operation (Building 13) Library (LI; Building 11) Modular Classrooms/Offices (MOD)
Instructional Building 4 Maintenance Building
ADA and Site Improvements 5 Earl Sicosky Gymnasium (GYM;
Building 8) Warehouse (Building 22) Kinesiology and Athletic Fields
Depending on the type of development, each phase of construction would be broken down into demolition, site preparation, grading, trenching, building construction, paving, and architectural coating. A variety of equipment would be used in each sub-phase of construction, such as excavators, crawler tractors, loaders, forklifts, pavers, and air compressors. Construction would be performed by qualified contractors and under District contract documents and would comply with federal, state and local regulations.
Demolition. As part of the Master Plan, 16 existing buildings are identified to be demolished as shown in Figure 3-5, Demolition Plan. The total buildings and facilities to be demolished is 152,673 assignable square feet (asf) or 228,628 gross square feet (gsf). Table 1-2 lists the total building areas to be demolished in each phase.

R A N C H O C U C A M O N G A C A M P U S M A S T E R P L A N D R A F T E I R C H A F F E Y C O M M U N I T Y C O L L E G E D I S T R I C T
1. Executive Summary
Page 1-6 PlaceWorks
Table 1-2 Building Demolition Summary Demolition Building Area (asf.) Building Area (gsf)
Phase 1 Administration (AD) 10,234 17,147 Campus Center East (CCE) 14,412 18,094 Bookstore (B) 902 950 Campus Police (CP) 1,014 1,271
Phase 1 Total 26,562 37,462 Phase 2 Business Education (BE; Building 5) 10,402 16,278 Language Arts (LA; Building 10) 7,794 12,198 Social Science (SS; Building 15) 8,344 14,251 Wargin Hall (WH; Building 17) 7,473 11,431 Vocational Student Support (VSS; Building 18 14,829 26,511
Phase 2 Total 48,842 80,669 No Demolition in Phase 3 n/a n/a
Phase 4 Math (MATH; Building 24) 8,942 12,774 Physical Science (PS; Building 14) 11,187 16,105
Phase 4 Total 20,129 28,879 Phase 5 Health Science East (HS; Building 3) 5,941 8121 Health Science West (HS; Building 42) 6,950 8820 Maintenance & Operation (Building 13) 14,940 18601 Library (LI) 26,575 39312 Modular Classrooms/Offices (MOD) 2,734 4,800
Phase 5 Total 57,140 79,654 Demolition Total 152,673 228,628 Assignable Square Feet (ASF) : The area of all space of a building that is assigned or available to be assigned to an occupant or specific use. This metric is often times
used in universities and uses 10 categories for use: classrooms, labs, offices, study facilities, special use, general use, support, health care, residential, and unclassified. Items that don’t fall into ASF are considered Non-Assignable Square Feet.
Gross square feet (GSF): The total amount of square footage of a building. This includes all spaces within the outside faces of the exterior walls (e.g. common areas, maintenance and operation areas, balconies, walkways, corridors, and any other parts of a building that are accessible within a building).
New Building Construction. The Master Plan proposes to construct nine new buildings and one building addition totaling 396,447 square feet in five phases over 30 years. As described in Table 1-3, New Building Construction Summary, new building construction would include outdoor spaces where existing outdoor spaces would be removed and redesigned with various amenities such as new furniture, paving, lighting, trees, screen walls, shades, and wi-fi. Development of the Operational Support Building in Phase 4 would also include a new driveway and parking areas for trucks, staff and visitor, and campus police as shown in Figure 3-4. The new driveway would provide direct access from Haven Avenue to the Operational Support Building’s receiving yard and divert truck traffic from College Drive. No building or site design is available at the Master Plan level and the actual limits of the outdoor spaces, including parking lots, have not been delineated.

R A N C H O C U C A M O N G A C A M P U S M A S T E R P L A N D R A F T E I R C H A F F E Y C O M M U N I T Y C O L L E G E D I S T R I C T
1. Executive Summary
April 2022 Page 1-7
Table 1-3 New Building Construction Summary New Building Building Area (gsf.)
Phase 1 Instructional Building 1 (two or three story) – 2,400 sf of outdoor space renovation 53,100 Campus Center East (two or three story) – Remove and reconstruct outdoor space with furniture, paving, lighting, trees, wi-fi (14,000 sq. ft.)
52,500
Phase 1 Subtotal 105,600 Phase 2 Instructional Building 2 (two or three story) – 2,400 sf of outdoor space renovation 49,110 Student Services Building (two story) 57,649
Phase 2 Subtotal 106,759 Phase 3 Flexible Performance Space (FPS) and TV Studio Production Space (TV) Building – 2,500 sq. ft. of outdoor space renovation
13,200
Phase 3 Subtotal 13,200 Phase 4 Instructional Building 3 (two-story) – 3,000 sf of outdoor space renovation 49,100 Operational Support Building (two-story), new driveway (600 feet long and 24 feet wide) from Haven Avenue to provide direct access, and parking (up to 30 staff and visitor spaces, 12,000 square feet of truck and loading, and 10 police vehicles spaces)
14,400
Phase 4 Subtotal 63,500 Phase 5 Instructional Building 4 (two-story) – 2,400 sf of outdoor space renovation 51,788 Maintenance Building and approx. 50,000 sq. ft. of outdoor space improvement 25,300 Two-story addition to the Gymnasium (Laboratory, offices for faculty and head coaches, shared breakroom and storage/processing space, Library / academic success center, Fitness Center, Athletic Locker Rooms)
30,300
Phase 5 Subtotal 107,388 New Building Area Total 396,447
Renovation. Due to the age and condition of the existing buildings, the Master Plan emphasizes renovation and modernization of existing facilities. Approximately 148,000 square feet of existing buildings are proposed to be renovated and repurposed. Building renovations could include new energy-efficient lighting; ceilings; paint; flooring; casework; stairwells; and heating, ventilation, and air conditioning systems. In some cases, interior walls could be removed or modified. In addition to the building renovations and repurposing, the renovation would also include ADA and site improvements that would fall under the below categories:
Accessibility. Improve policy-related, procedural, and physical barriers, as defined by the Americans with Disabilities Act, that currently impede access to Chaffey College’s services.
Energy. Reduce energy use through retrofits to buildings and energy-using systems, and increase the college’s clean energy sources such as solar carports, LED lighting, conversions, low-emission boiler technology, additional solar photovoltaic systems, and battery storage, that will lead to net zero energy.

R A N C H O C U C A M O N G A C A M P U S M A S T E R P L A N D R A F T E I R C H A F F E Y C O M M U N I T Y C O L L E G E D I S T R I C T
1. Executive Summary
Page 1-8 PlaceWorks
Informal Student Spaces. Widened alcoves and niches in hallways and seating areas in lobbies, portions of plazas and courtyards, and paved nodes along paths and next to buildings. Key amenities would include adequate but comfortable lighting, furnishings, artwork, white boards, display boards, power outlets, and shade and wind screens for outdoor spaces; food options, such as coffee and snack carts and vending machine kiosks.
Landscaping. Construct improvements for the campus’ formal, informal, and natural landscape zones. Promote learning and research opportunities, a clear pedestrian circulation hierarchy, enriched programming of outdoor spaces, urban forests, natural resource conservation, and low impact development (LID) storm water management. Implement xeriscape conversions that will replace turf with landscapes that, once established, need no further irrigation.
Learning Environments. Upgrade and outfit existing instructional and study spaces and remove barriers to flexible use by providing furniture, fixtures, and equipment, including audio-visual and instructional technology systems.
Parking and Vehicular Circulation.1 Reconfigure the Olive Way vehicular entrance and build a new drop-off zone in front of the SSA Building. Build a roundabout on College Drive to improve the flow of converging traffic. Expand the existing parking area by the Grigsby football stadium.
Security and Safety. Improve outdoor and building space using CPTED (Crime Prevention through Environmental Design) design principles and best practices for creating secure environments, such as: door hardware that permits locking from the inside; electronic access control; remote electronic surveillance; mass emergency notification; emergency phones; night time lighting.
Utilities Infrastructure. Improve power, communications, water, sanitary sewer, and storm drainage.
Wayfinding. Install gateway features, signage, identifiable landmarks and other physical design cues, and directories to serve people using every mode of circulation and transportation.
1 The new driveway and parking development as part of Operational Support Building is described as part of new building
construction.

R A N C H O C U C A M O N G A C A M P U S M A S T E R P L A N D R A F T E I R C H A F F E Y C O M M U N I T Y C O L L E G E D I S T R I C T
1. Executive Summary
April 2022 Page 1-9
Table 1-4 Renovation Summary
Demolition Description
Renovations and Repurposed Space
(sf) Phase 1 ADA and Site Improvements 1 Swing Space Existing Library modifications 43,243 Swimming Pool Renovation Replacement of equipment and renovation of support rooms 3,000
Phase 1 Subtotal 46,243 Phase 2 ADA and Site Improvements 2 Marie Kane Student Services &
Administration (SSA) Repurpose space on the first floor and the second floor including an expansion of the Human Resources office.
16,399
Phase 2 Subtotal 16,399 Phase 3 ADA and Site Improvements 3 Aeronautics (AERO) Renovation 23,308 Berz Educational Excellence
Center (BEB; Building 51) Repurpose vacated student support and Language Success Center space in building for Faculty Success Center offices.
3,661
Phase 3 Subtotal 26,969 Phase 4 ADA and Site Improvements 4 Theatre (TA) Renovate lobby, house, stage, and backstage and upgrade theatre
equipment and fixed seating. 33,043
Skills Lab Renovation (SL) Renovation 14,475 Phase 4 Subtotal 47,518
Phase 5 ADA and Site Improvements 5 Warehouse (Building 22) Renovate and repurpose the building to be the Grounds Department’s
offices, equipment storage, workshops, and long-term storage space for the Chaffey College Foundation and Office of Alumni Affairs.
4,602
Kinesiology and Athletic Fields • Renovate and resurface the Track to comply with CCCAA competition standards
• Upgrade the Baseball Field, by providing permanent spectator bleachers and permanent fencing to enclose the facility and renovating the dugouts
• Renovate the Soccer Field • Address soils subsidence issue by removing unsuitable fill soils, placing
engineered earthen fill, and rebuilding the soccer field • Renovate the Football Practice Field • Address soils subsidence issue by removing unsuitable fill soils, placing
engineered earthen fill, and rebuilding the football practice field
20,000 sf of athletic fields
Earl Sicosky Gymnasium (GYM; Building 8)
• Renovate and expand the athletic training room. • Renovate and repurpose fitness center for classrooms, a large lecture
space, library space, and/or offices. 6,200 sf
Phase 5 Subtotal 10,802 Renovation and Repurposed Space Total 147,931

R A N C H O C U C A M O N G A C A M P U S M A S T E R P L A N D R A F T E I R C H A F F E Y C O M M U N I T Y C O L L E G E D I S T R I C T
1. Executive Summary
Page 1-10 PlaceWorks
STUDENT CAPACITY
The pre-pandemic student headcount at the Chaffey College Rancho Cucamonga Campus was 16,474 students actively enrolled in Fall 2019. By 2051, at buildout of the Master Plan, the student count is anticipated to increase by approximately 5.65 percent, or 930 students resulting in a headcount of 17,404 students.
1.5 SUMMARY OF PROJECT ALTERNATIVES The CEQA Guidelines (§ 15126.6[a]) state that an EIR must address “a range of reasonable alternatives to the project, or to the location of the project, which would feasibly attain the basic objectives of the project, but would avoid or substantially lessen any of the significant effects of the project and evaluate the comparative merits of the alternatives.” The alternatives in this DEIR were based, in part, on their potential to reduce or eliminate the impacts determined to be significant and unavoidable for implementation of the Rancho Cucamonga Campus Master Plan project (see Table 1-5, Summary of Environmental Impacts, Mitigation, and Levels of Significance After Mitigation). The project alternatives were not reviewed for financial feasibility. Project alternatives are assessed in further detail in Chapter 7, Alternatives to the Proposed Project.
1.5.1 No Project Alternative CEQA Guidelines require the analysis of a No Project Alternative. This analysis must discuss the existing site conditions as well as what would be reasonably expected in the foreseeable future based on any current plans if the project were not approved. Under the No Project Alternative, the proposed demolition of existing buildings and construction of new buildings would not occur at the existing campus. The Rancho Cucamonga campus would remain in its current state, and only minor improvements and health and safety repairs would be provided. Therefore, the No Project Alternative would avoid elimination of the historic resources as identified under Section 5.3, Cultural Resources.
1.5.1.1 ABILITY TO REDUCE ENVIRONMENTAL IMPACTS
The No Project Alternative would lessen the proposed project’s environmental impacts in all areas, and also avoid the proposed project’s significant and unavoidable cultural resources impact. However, this alternative would not meet any of the project objectives as discussed in Chapter 7, Alternatives to the Proposed Project, Section 7.4.8.
1.5.2 Integrated Historic Resources Alternative Under this alternative, the Chaffey College Historic District will be retained and reused by the District. There are 15 historic district contributor buildings on-campus, and under the proposed project, 11 of the 15 buildings would be demolished and four buildings would be renovated. Therefore, under the Integrated Historic Resources Alternative, no historic district contributor buildings would be demolished, and the historic themes of education, suburbanization, and architecture, and with sub-themes of post-war modernism, and campus planning and design would be retained. The interior of the historic district contributor buildings would be renovated to maximize and improve efficiency and utilization of existing facilities. Under this alternative, the total demolition square footage would be reduced from 228,628 square feet to 32,582 square feet, a reduction

R A N C H O C U C A M O N G A C A M P U S M A S T E R P L A N D R A F T E I R C H A F F E Y C O M M U N I T Y C O L L E G E D I S T R I C T
1. Executive Summary
April 2022 Page 1-11
of approximately 86 percent. Under this alternative, the total new building square footages would also be reduced since most buildings would be renovated. This alternative would reduce the total new building square footage by approximately 50 percent from 396,447 sq. ft. to 200,401 sq. ft. All other ADA and site improvements and other renovations per the Master Plan would occur.
1.5.2.1 ABILITY TO REDUCE ENVIRONMENTAL IMPACTS
The Integrated Historic Resources Alternative would lessen the proposed project’s environmental impacts in all areas except for biological resources where it would have neutral impact, and it would also avoid the proposed project’s significant and unavoidable cultural resources impact. However, this alternative would only partially meet the project objectives as discussed in Chapter 7, Alternatives to the Proposed Project, Section 7.5.8.
1.6 ISSUES TO BE RESOLVED Section 15123(b)(3) of the CEQA Guidelines requires that an EIR contain issues to be resolved, including the choice among alternatives and whether or how to mitigate significant impacts. With regard to the proposed project, the major issues to be resolved include decisions by the lead agency as to:
1. Whether this DEIR adequately describes the environmental impacts of the project.
2. Whether the benefits of the project override those environmental impacts which cannot be feasibly avoided or mitigated to a level of insignificance.
3. Whether the proposed land use changes are compatible with the character of the existing area.
4. Whether the identified goals, policies, or mitigation measures should be adopted or modified.
5. Whether there are other mitigation measures that should be applied to the project besides the Mitigation Measures identified in the DEIR.
6. Whether there are any alternatives to the project that would substantially lessen any of the significant impacts of the proposed project and achieve most of the basic project objectives.
1.7 AREAS OF CONTROVERSY There are no known areas of controversy related to the proposed project.
1.8 SUMMARY OF ENVIRONMENTAL IMPACTS, MITIGATION MEASURES, AND LEVELS OF SIGNIFICANCE AFTER MITIGATION
Table 1-5 summarizes the conclusions of the environmental analysis contained in this EIR. Impacts are identified as significant or less than significant, and mitigation measures are identified for all significant impacts. The level of significance after imposition of the mitigation measures is also presented.

R A N C H O C U C A M O N G A C A M P U S M A S T E R P L A N D R A F T E I R C H A F F E Y C O M M U N I T Y C O L L E G E D I S T R I C T
1. Executive Summary
Page 1-12 PlaceWorks
This page intentionally left blank.
R A N C H O C U C A M O N G A C A M P U S M A S T E R P L A N D R A F T E I R C H A F F E Y C O M M U N I T Y C O L L E G E D I S T R I C T
1. Executive Summary
April 2022 Page 1-13
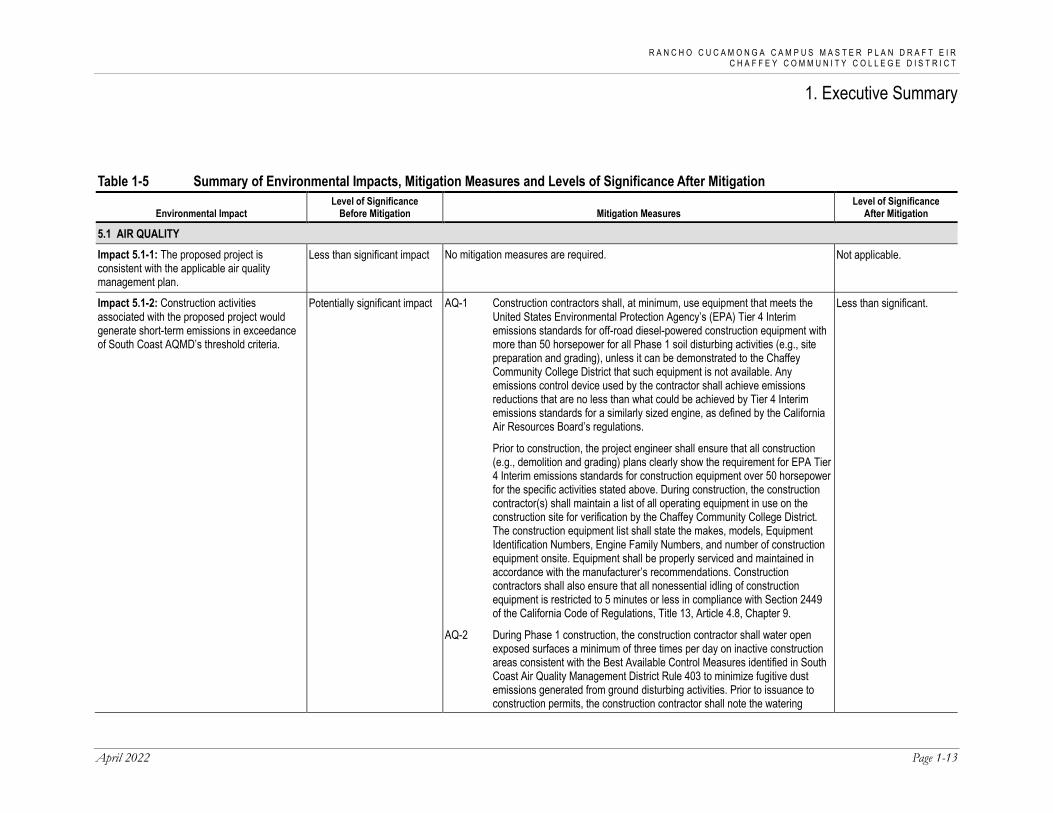
Table 1-5 Summary of Environmental Impacts, Mitigation Measures and Levels of Significance After Mitigation
Environmental Impact Level of Significance
Before Mitigation Mitigation Measures Level of Significance
After Mitigation
5.1 AIR QUALITY Impact 5.1-1: The proposed project is consistent with the applicable air quality management plan.
Less than significant impact No mitigation measures are required. Not applicable.
Impact 5.1-2: Construction activities associated with the proposed project would generate short-term emissions in exceedance of South Coast AQMD’s threshold criteria.
Potentially significant impact AQ-1 Construction contractors shall, at minimum, use equipment that meets the United States Environmental Protection Agency’s (EPA) Tier 4 Interim emissions standards for off-road diesel-powered construction equipment with more than 50 horsepower for all Phase 1 soil disturbing activities (e.g., site preparation and grading), unless it can be demonstrated to the Chaffey Community College District that such equipment is not available. Any emissions control device used by the contractor shall achieve emissions reductions that are no less than what could be achieved by Tier 4 Interim emissions standards for a similarly sized engine, as defined by the California Air Resources Board’s regulations.
Prior to construction, the project engineer shall ensure that all construction (e.g., demolition and grading) plans clearly show the requirement for EPA Tier 4 Interim emissions standards for construction equipment over 50 horsepower for the specific activities stated above. During construction, the construction contractor(s) shall maintain a list of all operating equipment in use on the construction site for verification by the Chaffey Community College District. The construction equipment list shall state the makes, models, Equipment Identification Numbers, Engine Family Numbers, and number of construction equipment onsite. Equipment shall be properly serviced and maintained in accordance with the manufacturer’s recommendations. Construction contractors shall also ensure that all nonessential idling of construction equipment is restricted to 5 minutes or less in compliance with Section 2449 of the California Code of Regulations, Title 13, Article 4.8, Chapter 9.
AQ-2 During Phase 1 construction, the construction contractor shall water open exposed surfaces a minimum of three times per day on inactive construction areas consistent with the Best Available Control Measures identified in South Coast Air Quality Management District Rule 403 to minimize fugitive dust emissions generated from ground disturbing activities. Prior to issuance to construction permits, the construction contractor shall note the watering
Less than significant.

R A N C H O C U C A M O N G A C A M P U S M A S T E R P L A N D R A F T E I R C H A F F E Y C O M M U N I T Y C O L L E G E D I S T R I C T
1. Executive Summary
Page 1-14 PlaceWorks
Table 1-5 Summary of Environmental Impacts, Mitigation Measures and Levels of Significance After Mitigation
Environmental Impact Level of Significance
Before Mitigation Mitigation Measures Level of Significance
After Mitigation and/or soil stabilization requirement on all construction plans submitted to the Chaffey Community College District.
AQ-3 During building construction and renovation activities, the construction contractor shall, at minimum, use paints with a volatile organic compound (VOC) content of 10 grams per liter (g/L) or less for all interior coatings and paints with a VOC content of 25 g/L or less for all exterior coatings of all the new proposed and renovated buildings designated under Phases 1 through 5. This requirement shall be noted on all construction management plans verified by the Chaffey Community College District prior to issuance of any construction permits and during interior coating activities.
Impact 5.1-3: Long-term operation of the project would not generate additional vehicle trips and associated emissions in exceedance of South Coast AQMD’s threshold criteria.
Less than significant impact No mitigation measures are required. Not applicable.
Impact 5.1-4: The proposed project could expose sensitive receptors to substantial pollutant concentrations.
Potentially significant impact Implement Mitigation Measures AQ-1 and AQ-2. Less than significant.
Impact 5.1-5: Project-related construction activities would not result in potentially significant cancer risk impacts to nearby off-site residences.
Less than significant impact No mitigation measures are required. Not applicable.
Impact 5.1-6: Operation of the proposed project would not expose sensitive receptors to substantial pollutant concentrations.
Less than significant impact No mitigation measures are required. Not applicable.
Impact 5.1-7: The proposed project would not result in other emissions that would adversely affect a substantial number of people.
Less than significant impact No mitigation measures are required. Not applicable.

R A N C H O C U C A M O N G A C A M P U S M A S T E R P L A N D R A F T E I R C H A F F E Y C O M M U N I T Y C O L L E G E D I S T R I C T
1. Executive Summary
April 2022 Page 1-15
Table 1-5 Summary of Environmental Impacts, Mitigation Measures and Levels of Significance After Mitigation
Environmental Impact Level of Significance
Before Mitigation Mitigation Measures Level of Significance
After Mitigation
5.2 BIOLOGICAL RESOURCES Impact 5.4-1: The proposed project could have a substantial effect, either directly or through habitat modifications, on any species identified as a candidate, sensitive, or special status species in local or regional plans, policies, or regulations, or by the California Department of Fish and Game or U.S. Fish and Wildlife Service.
Potentially significant impact. BIO-1 Prior to initiating any phase of the project that could directly or indirectly impact coastal sage scrub habitat, the Chaffey Community College District shall retain a qualified biologist to perform focused U.S. Fish and Wildlife Service (USFWS) protocol surveys to determine the presence/absence of the coastal California gnatcatcher. Focused surveys for the coastal California gnatcatcher will follow the USFWS protocol guidelines for conducting breeding or nonbreeding season coastal California gnatcatcher surveys. Specifically, nine nonbreeding or six breeding season surveys shall be conducted within all suitable coastal sage scrub habitats on the project site, depending on the season surveys are initiated. Surveys shall only be conducted between the hours of 6:00 am and 12:00 pm when weather conditions provide conditions for high bird activity. Taped coastal California gnatcatcher vocalization shall be played during the surveys in an effort to elicit a response from the species.
If the species is not detected within or adjacent to the phased action area of the project site, no further action is required for this species. However, if the species is detected within or adjacent to the action area of the project site, formal consultation with the USFWS is required, and an appropriate take permit must be acquired.
BIO-2 Prior to initiation of on-site grading activities within any phase of the project resulting in direct impacts to disturbed habitat, the Chaffey Community College District shall retain a qualified biologist to conduct a preconstruction survey for burrowing owls. The survey shall be conducted 14 days prior to construction activities within the disturbed regions of the phased action area. If ground-disturbing activities are delayed or suspended for more than 14 days after the preconstruction survey, the site shall be resurveyed for burrowing owls.
If owls are determined to be present within or adjacent to the phased construction footprint, they shall be captured and relocated. The preconstruction survey and any relocation activity shall be conducted in accordance with the California Department of Fish and Wildlife (CDFW) Staff Report on Burrowing Owl Mitigation, 2012. According to CDFW guidelines, mitigation actions will be conducted from September 1 to January 31, which is
Less than significant.

R A N C H O C U C A M O N G A C A M P U S M A S T E R P L A N D R A F T E I R C H A F F E Y C O M M U N I T Y C O L L E G E D I S T R I C T
1. Executive Summary
Page 1-16 PlaceWorks
Table 1-5 Summary of Environmental Impacts, Mitigation Measures and Levels of Significance After Mitigation
Environmental Impact Level of Significance
Before Mitigation Mitigation Measures Level of Significance
After Mitigation prior to the nesting season. However, burrowing owl nesting activity is variable, and so the time frame will be adjusted accordingly. Should eggs or fledglings be discovered in any owl burrow, the burrow cannot be disturbed (pursuant to CDFW guidelines) until the young have hatched and fledged (matured to a stage that they can leave the nest on their own). Occupied burrows shall not be disturbed during the nesting season (February 1 through August 31) unless a qualified biologist approved by CDFW verifies through noninvasive methods that: a) the adult birds have not begun egg-laying and incubation; or b) the juveniles from the occupied burrows are foraging independently and are capable of independent survival. If a biologist is unable to verify one of these conditions, no disturbance shall occur within 300 feet of the burrowing owls nest during the breeding season to avoid abandonment of the young.
Impact 5.4-2: The proposed project would not have a substantial adverse effect on any riparian habitat or other sensitive natural community identified in local or regional plans, policies, regulations, or by the California Department of Fish and Wildlife or U.S. Fish and Wildlife Service.
Less than significant impact. No mitigation measures are necessary. Not applicable.
Impact 5.4-3: The proposed project could have a substantial adverse effect on federally protected wetlands as defined by Section 404 of the Clean Water Act (including, but not limited to, marsh, vernal pool, coastal, etc.) through direct removal, filling, hydrological interruption, or other means.
Potentially significant impact. BIO-3 Prior to issuance of grading or construction permits in phases potential directly or indirectly impacting wetlands or jurisdictional resources, the Chaffey Community College District (District) shall conduct a formal jurisdictional delineation to determine the extent of resources on-site regulated by the US Army Corps of Engineer (USACE), California Department of Fish and Wildlife (CDFW), or Regional Water Quality Control Board (RWQCB). The District shall also obtain all applicable permits, which may include 404 Nationwide Permit from the USACE, 1602 Streambed Alteration Agreement from CDFW, and a 401 Certification issued by the RWQCB pursuant to the California Water Code Section 13260.
Less than significant.
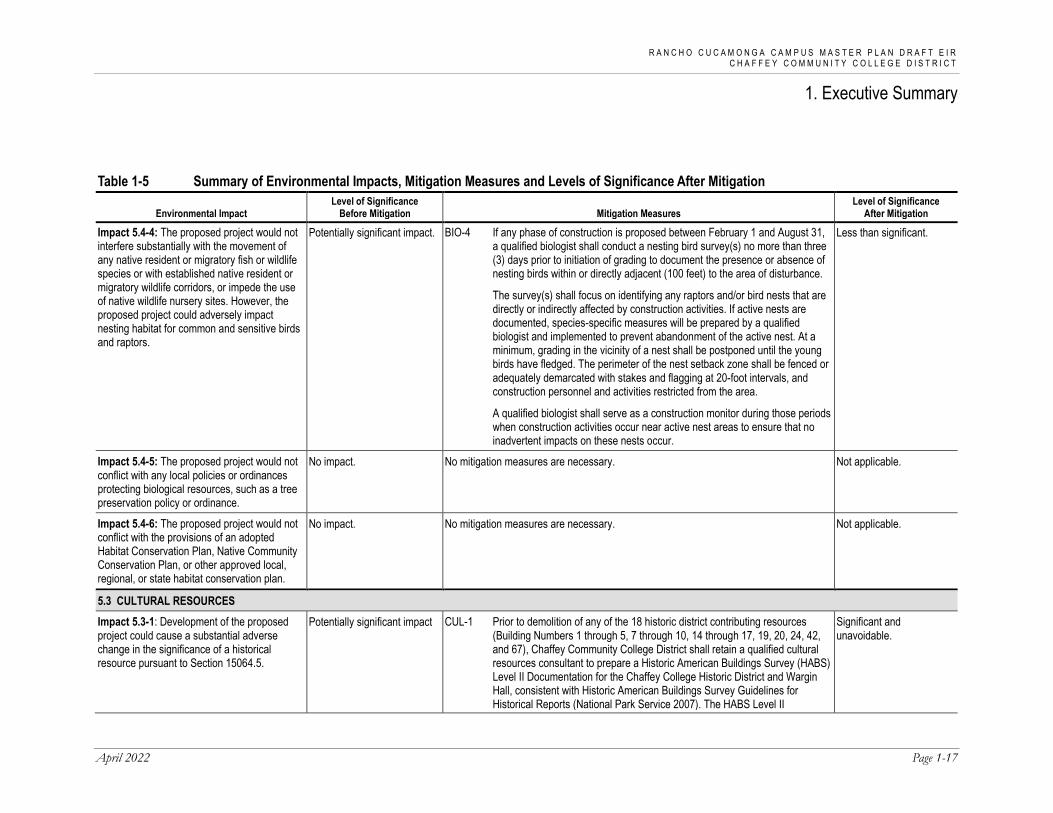
R A N C H O C U C A M O N G A C A M P U S M A S T E R P L A N D R A F T E I R C H A F F E Y C O M M U N I T Y C O L L E G E D I S T R I C T
1. Executive Summary
April 2022 Page 1-17
Table 1-5 Summary of Environmental Impacts, Mitigation Measures and Levels of Significance After Mitigation
Environmental Impact Level of Significance
Before Mitigation Mitigation Measures Level of Significance
After Mitigation
Impact 5.4-4: The proposed project would not interfere substantially with the movement of any native resident or migratory fish or wildlife species or with established native resident or migratory wildlife corridors, or impede the use of native wildlife nursery sites. However, the proposed project could adversely impact nesting habitat for common and sensitive birds and raptors.
Potentially significant impact. BIO-4 If any phase of construction is proposed between February 1 and August 31, a qualified biologist shall conduct a nesting bird survey(s) no more than three (3) days prior to initiation of grading to document the presence or absence of nesting birds within or directly adjacent (100 feet) to the area of disturbance.
The survey(s) shall focus on identifying any raptors and/or bird nests that are directly or indirectly affected by construction activities. If active nests are documented, species-specific measures will be prepared by a qualified biologist and implemented to prevent abandonment of the active nest. At a minimum, grading in the vicinity of a nest shall be postponed until the young birds have fledged. The perimeter of the nest setback zone shall be fenced or adequately demarcated with stakes and flagging at 20-foot intervals, and construction personnel and activities restricted from the area.
A qualified biologist shall serve as a construction monitor during those periods when construction activities occur near active nest areas to ensure that no inadvertent impacts on these nests occur.
Less than significant.
Impact 5.4-5: The proposed project would not conflict with any local policies or ordinances protecting biological resources, such as a tree preservation policy or ordinance.
No impact. No mitigation measures are necessary. Not applicable.
Impact 5.4-6: The proposed project would not conflict with the provisions of an adopted Habitat Conservation Plan, Native Community Conservation Plan, or other approved local, regional, or state habitat conservation plan.
No impact. No mitigation measures are necessary. Not applicable.
5.3 CULTURAL RESOURCES Impact 5.3-1: Development of the proposed project could cause a substantial adverse change in the significance of a historical resource pursuant to Section 15064.5.
Potentially significant impact CUL-1 Prior to demolition of any of the 18 historic district contributing resources (Building Numbers 1 through 5, 7 through 10, 14 through 17, 19, 20, 24, 42, and 67), Chaffey Community College District shall retain a qualified cultural resources consultant to prepare a Historic American Buildings Survey (HABS) Level II Documentation for the Chaffey College Historic District and Wargin Hall, consistent with Historic American Buildings Survey Guidelines for Historical Reports (National Park Service 2007). The HABS Level II
Significant and unavoidable.

R A N C H O C U C A M O N G A C A M P U S M A S T E R P L A N D R A F T E I R C H A F F E Y C O M M U N I T Y C O L L E G E D I S T R I C T
1. Executive Summary
Page 1-18 PlaceWorks
Table 1-5 Summary of Environmental Impacts, Mitigation Measures and Levels of Significance After Mitigation
Environmental Impact Level of Significance
Before Mitigation Mitigation Measures Level of Significance
After Mitigation documentation shall follow the Secretary of Interior Standards and Guidelines for Architectural and Engineering Documentation and include photography, narrative history, and reproduction of selected existing drawings for each building proposed for demolition or alteration. Two narrative histories shall be prepared: one for Wargin Hall and one for the Chaffey College Historic District that includes all 18 contributing resources.
CUL-2 Prior to demolition of any of the 18 historic district contributing resources (Building Numbers 1 through 5, 7 through 10, 14 through 17, 19, 20, 24, 42, and 67), Chaffey Community College District shall develop an interpretative display as part of the project plan to commemorate the history of the Chaffey College Historic District and Wargin Hall to be placed in a central location on campus. The interpretative display is to include text and images from this report, as well as original architectural renderings and drawings and historical campus photos and aerial views drawn from the Chaffey College archives at the on-campus library. The interpretive display could include information from the Historic American Buildings Survey documentation (narrative histories and large-format photographs). If an outdoor exhibition is selected, the exhibit shall include at least three resin-coated panels to be grouped together in a single location with accompanying paving/walkways and landscaping.
CUL-3 Prior to demolition of any of the 18 historic district contributing resources (Building Numbers 1 through 5, 7 through 10, 14 through 17, 19, 20, 24, 42, and 67), Chaffey Community College District shall expand the history section of the Chaffey College Historic District website (https://www.chaffey.edu/about/ourhistory.php) to include narratives and historical images similar to those used on the Interpretive Display (see Mitigation Measure CUL-2). The focus shall be the development of the physical campus and include information about the architects involved.
CUL-4 Ongoing during operation of the proposed project, Chaffey Community College District shall provide funding to organize and catalog material related to the original plans and construction of the campus buildings available in various repositories on campus and archive them at the campus library. Examples of materials to be archived include historical reports, newsletters, architectural and campus photographs, and aerial views. An example of

R A N C H O C U C A M O N G A C A M P U S M A S T E R P L A N D R A F T E I R C H A F F E Y C O M M U N I T Y C O L L E G E D I S T R I C T
1. Executive Summary
April 2022 Page 1-19
Table 1-5 Summary of Environmental Impacts, Mitigation Measures and Levels of Significance After Mitigation
Environmental Impact Level of Significance
Before Mitigation Mitigation Measures Level of Significance
After Mitigation cataloging is accessing digital copies of original architectural drawings currently stored on central computer drives and making them available to researchers.
Impact 5.3-2: Development of the project could cause a substantial adverse change in the significance of an archaeological resource pursuant to Section 15064.5.
Potentially significant impact CUL-5 During grading and site preparation activities, the construction contractor retained by the Chaffey Community College District (District) shall monitor all construction activities. In the event that cultural resources (i.e., prehistoric sites, historic sites, and/or isolated artifacts) and/or tribal cultural resources are discovered, work shall be halted immediately within 60 feet of the discovery and the construction contractor shall inform the project manager of the District. Construction activities may continue in other areas during the assessment period. The District shall retain a qualified archaeologist that meets the Secretary of the Interior’s Standards and Guidelines for Professional Qualifications in Archaeology to analyze the significance of the discovery. Additionally, the San Manuel Band of Missions Indians Cultural Resources Department (SMBMI) shall be contacted, as detailed in Mitigation Measure TCR-1, regarding any pre-contact and/or historic-era finds and be provided information after the archaeologist makes the initial assessment of the nature of the find, so as to provide tribal input with regards to significance and treatment. If, in consultation with the District, the discovery is determined not to be important pursuant to State law described below, work will be permitted to continue in the area.
If the qualified archaeologist determines a resource to constitute a “historical resource” pursuant to CEQA Guidelines Section 15064.5(a) or a “unique archaeological resource” pursuant to Public Resources Code Section 21083.2(g), the qualified archaeologist shall coordinate with the District to develop a monitoring and treatment plan (the plan). The plan should serve to reduce impacts to the resources and allow construction to proceed. The plan established for the resources shall be in accordance with CEQA Guidelines Section 15064.5(f) for historical resources and Public Resources Code Section 21083.2(b) for unique archaeological resources. The draft of the plan shall be provided to SMBMI for review and comment, as detailed in Mitigation Measure TCR-1. The qualified archaeologist shall monitor the remainder of the project site and implement the plan accordingly. Preservation in place (i.e., avoidance) is the preferred manner of treatment.
Less than significant.

R A N C H O C U C A M O N G A C A M P U S M A S T E R P L A N D R A F T E I R C H A F F E Y C O M M U N I T Y C O L L E G E D I S T R I C T
1. Executive Summary
Page 1-20 PlaceWorks
Table 1-5 Summary of Environmental Impacts, Mitigation Measures and Levels of Significance After Mitigation
Environmental Impact Level of Significance
Before Mitigation Mitigation Measures Level of Significance
After Mitigation If preservation in place is not feasible, treatment may include implementation
of archaeological data recovery excavations to remove the resource along with subsequent laboratory processing and analysis.
The District shall offer any historic archaeological material that is not Native American in origin for curation at a public, nonprofit institution with a research interest in the materials. If no institution accepts the archaeological material, the District shall keep the archaeological material within the campus library for educational purposes.
Impact 5.3-3: The proposed project could disturb human remains, including those interred outside of dedicated cemeteries.
Less than significant impact No mitigation measures are required. Not applicable.
5.4 GREENHOUSE GAS EMISSIONS Impact 5.4-1: Buildout of the proposed project would not generate a net increase in GHG emissions, either directly or indirectly, that would have a significant impact on the environment.
Less than significant impact No mitigation measures are required. Not applicable.
Impact 5.4-2: The proposed project would not conflict with plans adopted for the purpose of reducing GHG emissions.
Less than significant impact No mitigation measures are required. Not applicable.
5.5 NOISE Impact 5.5-1: Construction activities could result in temporary noise increases in the vicinity of the proposed project.
Potentially significant impact. N-1 The Chaffey Community College District (District) shall require the following measures to be identified in the construction plans and implemented during construction activities.
Mitigation for Offsite Exterior Noise Levels During Construction. The District shall implement the following practices:
• During the construction of the parking lot expansion east of Grigsby Field, erect a temporary noise barrier/curtain along project boundary between the construction zone and residences east of Grigsby Field (see Figure 5.5-2, Temporary Noise Barrier Location). The temporary
Less than significant impact.
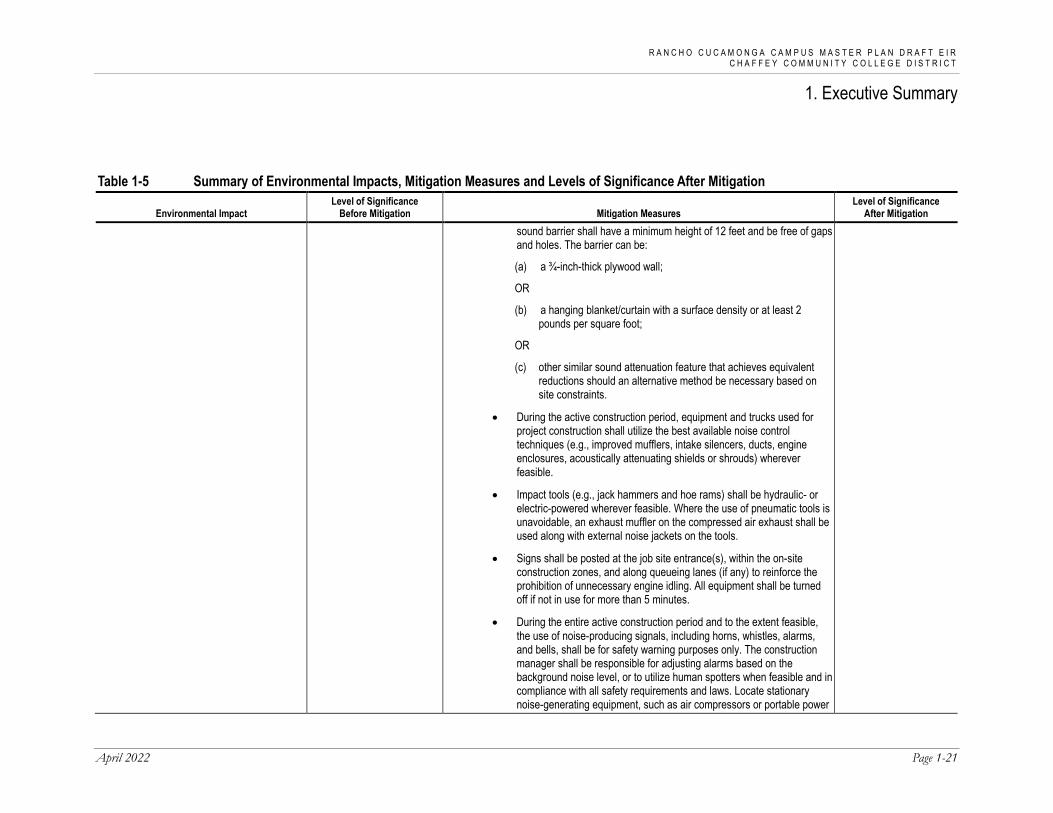
R A N C H O C U C A M O N G A C A M P U S M A S T E R P L A N D R A F T E I R C H A F F E Y C O M M U N I T Y C O L L E G E D I S T R I C T
1. Executive Summary
April 2022 Page 1-21
Table 1-5 Summary of Environmental Impacts, Mitigation Measures and Levels of Significance After Mitigation
Environmental Impact Level of Significance
Before Mitigation Mitigation Measures Level of Significance
After Mitigation sound barrier shall have a minimum height of 12 feet and be free of gaps and holes. The barrier can be:
(a) a ¾-inch-thick plywood wall;
OR
(b) a hanging blanket/curtain with a surface density or at least 2 pounds per square foot;
OR
(c) other similar sound attenuation feature that achieves equivalent reductions should an alternative method be necessary based on site constraints.
• During the active construction period, equipment and trucks used for project construction shall utilize the best available noise control techniques (e.g., improved mufflers, intake silencers, ducts, engine enclosures, acoustically attenuating shields or shrouds) wherever feasible.
• Impact tools (e.g., jack hammers and hoe rams) shall be hydraulic- or electric-powered wherever feasible. Where the use of pneumatic tools is unavoidable, an exhaust muffler on the compressed air exhaust shall be used along with external noise jackets on the tools.
• Signs shall be posted at the job site entrance(s), within the on-site construction zones, and along queueing lanes (if any) to reinforce the prohibition of unnecessary engine idling. All equipment shall be turned off if not in use for more than 5 minutes.
• During the entire active construction period and to the extent feasible, the use of noise-producing signals, including horns, whistles, alarms, and bells, shall be for safety warning purposes only. The construction manager shall be responsible for adjusting alarms based on the background noise level, or to utilize human spotters when feasible and in compliance with all safety requirements and laws. Locate stationary noise-generating equipment, such as air compressors or portable power

R A N C H O C U C A M O N G A C A M P U S M A S T E R P L A N D R A F T E I R C H A F F E Y C O M M U N I T Y C O L L E G E D I S T R I C T
1. Executive Summary
Page 1-22 PlaceWorks
Table 1-5 Summary of Environmental Impacts, Mitigation Measures and Levels of Significance After Mitigation
Environmental Impact Level of Significance
Before Mitigation Mitigation Measures Level of Significance
After Mitigation generators, as far as possible from onsite and offsite sensitive receptors as feasible. If they must be located near receptors, adequate muffling (with enclosures where feasible and appropriate) shall be used reduce noise levels at the adjacent sensitive receptors. Any enclosure openings or venting shall face away from sensitive receptors.
• Construction staging areas shall be established at locations that will create the greatest distance between the construction-related noise sources and noise-sensitive receptors nearest the project site during all project construction.
• Designate a "disturbance coordinator" who would be responsible for responding to any complaints about construction noise. The disturbance coordinator will determine the cause of the noise complaint (e.g., bad muffler, etc.) and will require that reasonable measures be implemented to correct the problem. Conspicuously post a telephone number for the disturbance coordinator at the construction site and include in it the notice sent to neighbors regarding the construction schedule.
N-2 The Chaffey Community College District shall require the following measures to be identified in the construction plans and implemented during construction activities.
Mitigation for Onsite Interior Noise Levels During Construction. Prior to the start of construction, the construction contractor shall submit a list of equipment and activities required during construction to the Chaffey Community College District (District) in order to ensure proper planning of the most intense construction activities during time periods that would least impact the campus operation. Prior to start of each construction phase, the District shall assess if any operational instructional buildings are within 150 feet of construction activities. Where operational instructional buildings are found to be within 150 feet of proposed construction, the District shall ensure that interior classroom noise levels do not exceed 50 dBA Leq. Feasible methods to achieve this include:
• Relocating students to a different building at least 150 feet away from on-site construction activities

R A N C H O C U C A M O N G A C A M P U S M A S T E R P L A N D R A F T E I R C H A F F E Y C O M M U N I T Y C O L L E G E D I S T R I C T
1. Executive Summary
April 2022 Page 1-23
Table 1-5 Summary of Environmental Impacts, Mitigation Measures and Levels of Significance After Mitigation
Environmental Impact Level of Significance
Before Mitigation Mitigation Measures Level of Significance
After Mitigation • Where relocation is not feasible, the contractor shall erect a temporary
noise barrier with a minimum height of at least 12 feet and be free of gaps and holes. The barrier can be (a) a ¾-inch-thick plywood wall OR (b) a hanging acoustical blanket/curtain with a surface density or at least 1.5 pounds per square foot.
Impact 5.5-2: Project implementation would result in long-term operation-related noise that would not exceed noise standards.
Less than significant impact. No mitigation measures are required. Not applicable.
Impact 5.5-3: The project would not create short-term nor long-term operational groundborne vibration and groundborne noise in excess of established standards.
Less than significant impact. No mitigation measures are required. Not applicable.
Impact 5.5-4: The proximity of the project site to an airport or airstrip would not result in exposure of future workers to excessive airport-related noise.
No impact. No mitigation measures are required. Not applicable.
5.6 TRANSPORTATION Impact 5.6-1: The proposed project would not conflict with a program, plan, ordinance, or policy addressing the circulation system, including transit, roadway, bicycle, and pedestrian facilities.
Less than significant impact. No mitigation measures are required. Not applicable.
Impact 5.6-2: The proposed project would not conflict or be inconsistent with CEQA Guidelines § 15064.3, subdivision (b).
Less than significant impact. No mitigation measures are required. Not applicable.
Impact 5.6-3: The proposed project would not substantially increase hazards due to a geometric design feature (e.g., sharp curves or dangerous intersections) or incompatible uses (e.g., farm equipment).
Less than significant impact. No mitigation measures are required. Not applicable.

R A N C H O C U C A M O N G A C A M P U S M A S T E R P L A N D R A F T E I R C H A F F E Y C O M M U N I T Y C O L L E G E D I S T R I C T
1. Executive Summary
Page 1-24 PlaceWorks
Table 1-5 Summary of Environmental Impacts, Mitigation Measures and Levels of Significance After Mitigation
Environmental Impact Level of Significance
Before Mitigation Mitigation Measures Level of Significance
After Mitigation
Impact 5.6-4: The proposed project would not result in inadequate emergency access.
Less than significant impact. No mitigation measures are required. Not applicable.
5.7 TRIBAL CULTURAL RESOURCES Impact 5.7-1: The proposed project would not cause a substantial adverse change in the significance of a tribal cultural resource, defined in Public Resources Code § 21074 and that is listed or eligible for listing in the California Register of Historical Resources, or in a local register of historical resources as defined in Public Resources Code section 5020.1(k).
No impact. No mitigation measures are required. Not applicable
Impact 5.7-2: The proposed project would not cause a substantial adverse change in the significance of a tribal cultural resource, defined in Public Resources Code § 21074 and a resource determined by the lead agency, in its discretion and supported by substantial evidence, to be significant pursuant to criteria set forth in subdivision (c) of Public Resources Code §5024.1. .
Potentially significant impact. TCR-1 During grading and site preparation activities, the construction contractor retained by the Chaffey Community College District (District) shall monitor all construction activities. In the event that any pre-contact and/or historic-era cultural resources are inadvertently unearthed, work shall be halted immediately within 60 feet of the discovery and the construction contractor shall inform the project manager of the District. Construction activities may continue in other areas. As detailed in Mitigation Measure CUL-5, the District shall retain a qualified archaeologist that meets the Secretary of the Interior’s Standards and Guidelines for Professional Qualifications in Archaeology to analyze the significance of the discovery. Additionally, the San Manuel Band of Missions Indians Cultural Resources Department (SMBMI) shall be contacted, and be provided information regarding the nature of the find, so as to provide Tribal input with regards to significance and treatment. If the resources are Native American in origin and deemed significant as defined by CEQA Guidelines, a cultural resources monitoring and treatment plan shall be prepared by a qualified archaeologist in coordination with SMBMI and all subsequent finds shall be subject to the plan. The plan shall allow for a monitor to be present that represents SMBMI for the remainder of the project development, should SMBMI elect to place a monitor on-site. The plan will outline the treatment plan for the fine to retain it/them in the form and/or
Less than significant impact.

R A N C H O C U C A M O N G A C A M P U S M A S T E R P L A N D R A F T E I R C H A F F E Y C O M M U N I T Y C O L L E G E D I S T R I C T
1. Executive Summary
April 2022 Page 1-25
Table 1-5 Summary of Environmental Impacts, Mitigation Measures and Levels of Significance After Mitigation
Environmental Impact Level of Significance
Before Mitigation Mitigation Measures Level of Significance
After Mitigation
manner the Tribe deems appropriate for educational, cultural and/or historic purposes.
The District shall disseminate any and all archaeological/cultural documents created as part of the proposed project (isolated records, site records, survey reports, testing reports, etc.) to SMBMI and the District shall, in good faith, consult with SMBMI through the project development. Preservation in place (i.e., avoidance) is the preferred manner of treatment.

R A N C H O C U C A M O N G A C A M P U S M A S T E R P L A N D R A F T E I R C H A F F E Y C O M M U N I T Y C O L L E G E D I S T R I C T
1. Executive Summary
Page 1-26 PlaceWorks
This page intentionally left blank.

April 2022 Page 2-1
2. Introduction 2.1 PURPOSE OF THE ENVIRONMENTAL IMPACT REPORT The California Environmental Quality Act (CEQA) requires that all state and local governmental agencies consider the environmental consequences of projects over which they have discretionary authority before taking action on those projects. This draft environmental impact report (DEIR) has been prepared to satisfy CEQA and the CEQA Guidelines. The EIR is the public document designed to provide decision makers and the public with an analysis of the environmental effects of the proposed project, to indicate possible ways to reduce or avoid environmental damage, and to identify alternatives to the project. The EIR must also disclose significant environmental impacts that cannot be avoided; growth-inducing impacts; effects not found to be significant; and significant cumulative impacts of all past, present, and reasonably foreseeable future projects.
The lead agency means “the public agency which has the principal responsibility for carrying out or approving a project which may have a significant effect upon the environment” (CEQA Section 21067). The Chaffey Community College District (District) has the principal responsibility for approval of the Rancho Cucamonga Campus Master Plan project. For this reason, the District is the CEQA lead agency for this project.
The intent of the DEIR is to provide sufficient information on the potential environmental impacts of the proposed project to allow the Chaffey College Governing Board to make an informed decision regarding approval of the proposed project. Specific discretionary actions to be reviewed by the Governing Board are described in Section 3.4, Intended Uses of the EIR.
This DEIR has been prepared in accordance with requirements of the:
California Environmental Quality Act (CEQA) of 1970, as amended (Public Resources Code, Sections 21000 et seq.)
State Guidelines for the Implementation of the CEQA of 1970 (CEQA Guidelines), as amended (California Code of Regulations, Sections 15000 et seq.)
The overall purpose of this DEIR is to inform the lead agency, responsible agencies, decision makers, and the general public about the environmental effects of the development and operation of the proposed project. This DEIR addresses effects that may be significant and adverse, evaluates alternatives to the project, and identifies mitigation measures to reduce or avoid adverse effects.
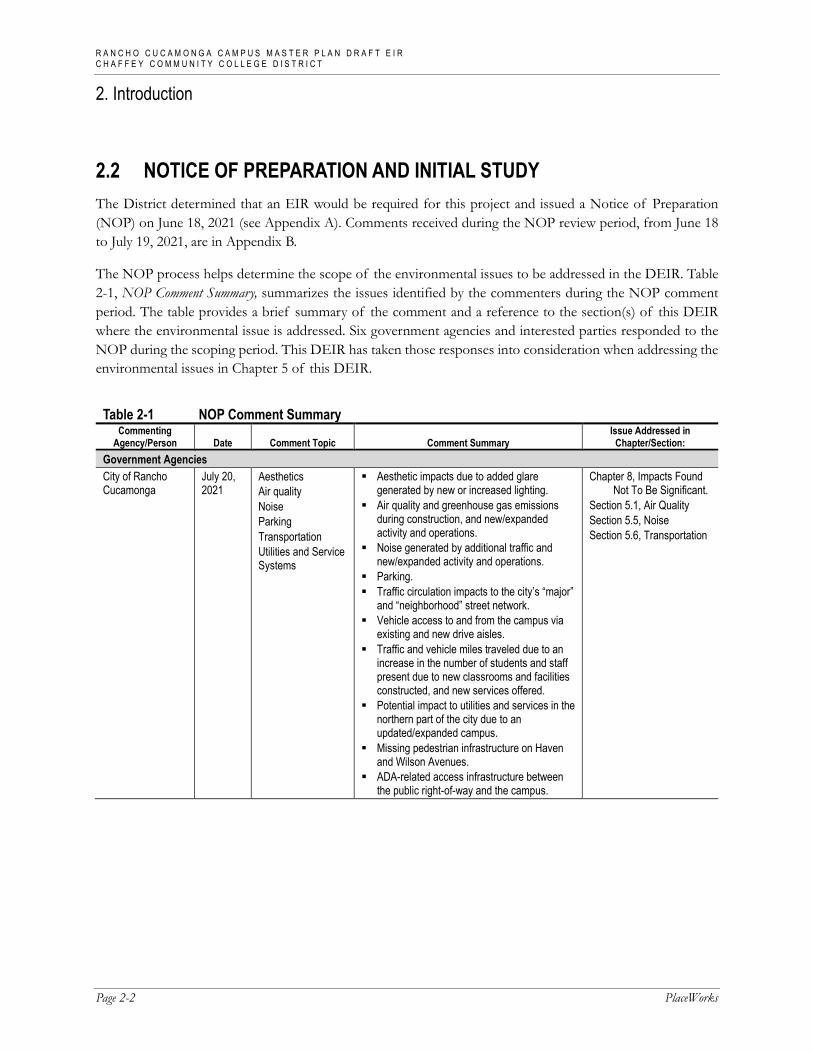
R A N C H O C U C A M O N G A C A M P U S M A S T E R P L A N D R A F T E I R C H A F F E Y C O M M U N I T Y C O L L E G E D I S T R I C T
2. Introduction
Page 2-2 PlaceWorks
2.2 NOTICE OF PREPARATION AND INITIAL STUDY The District determined that an EIR would be required for this project and issued a Notice of Preparation (NOP) on June 18, 2021 (see Appendix A). Comments received during the NOP review period, from June 18 to July 19, 2021, are in Appendix B.
The NOP process helps determine the scope of the environmental issues to be addressed in the DEIR. Table 2-1, NOP Comment Summary, summarizes the issues identified by the commenters during the NOP comment period. The table provides a brief summary of the comment and a reference to the section(s) of this DEIR where the environmental issue is addressed. Six government agencies and interested parties responded to the NOP during the scoping period. This DEIR has taken those responses into consideration when addressing the environmental issues in Chapter 5 of this DEIR.
Table 2-1 NOP Comment Summary Commenting
Agency/Person Date Comment Topic Comment Summary Issue Addressed in
Chapter/Section: Government Agencies City of Rancho Cucamonga
July 20, 2021
Aesthetics Air quality Noise Parking Transportation Utilities and Service Systems
Aesthetic impacts due to added glare generated by new or increased lighting.
Air quality and greenhouse gas emissions during construction, and new/expanded activity and operations.
Noise generated by additional traffic and new/expanded activity and operations.
Parking. Traffic circulation impacts to the city’s “major”
and “neighborhood” street network. Vehicle access to and from the campus via
existing and new drive aisles. Traffic and vehicle miles traveled due to an
increase in the number of students and staff present due to new classrooms and facilities constructed, and new services offered.
Potential impact to utilities and services in the northern part of the city due to an updated/expanded campus.
Missing pedestrian infrastructure on Haven and Wilson Avenues.
ADA-related access infrastructure between the public right-of-way and the campus.
Chapter 8, Impacts Found Not To Be Significant.
Section 5.1, Air Quality Section 5.5, Noise Section 5.6, Transportation

R A N C H O C U C A M O N G A C A M P U S M A S T E R P L A N D R A F T E I R C H A F F E Y C O M M U N I T Y C O L L E G E D I S T R I C T
2. Introduction
April 2022 Page 2-3
Table 2-1 NOP Comment Summary Commenting
Agency/Person Date Comment Topic Comment Summary Issue Addressed in
Chapter/Section: South Coast Air Quality Management District
July 13, 2021
Air Quality Recommends that the DEIR use South Coast AQMD’s CEQA Air Quality Handbook and website as guidance when preparing the air quality and greenhouse gas analyses. It is also recommended that the CalEEMod is used.
Recommends that the DEIR quantifies criteria pollutant emissions and compare the emissions to South Coast AQMD’s CEQA regional pollutant emissions significance thresholds and localized significance thresholds.
Requests that the DEIR identifies any potential adverse air quality impacts that could occur from all phases of the project and all air pollutant sources related to the project.
Requests that in the event that the project results in significant adverse air quality impacts, all feasible mitigation measures that go beyond what is required by law be utilized to minimize these impacts, and any impacts resulting from mitigation measures.
Section 5.1, Air Quality
Native American Heritage Commission
June 30, 2021
Tribal Cultural Resources
Protocol for evaluation of cultural and historic resources.
Tribal consultation requirements under Assembly Bill 52 (AB 52) and Senate Bill 18 (SB 18).
Section 5.7, Tribal Cultural Resources
Public San Manuel Band of Mission Indians
June 29, 2021
Cultural Resources Tribal Cultural Resources
Asks how the DEIR came to the conclusion that there would be no impact on existing cultural resources without a cultural resources review.
Not applicable since the NOP indicated that there could be potentially significant impacts to cultural and tribal cultural resources. See also Section 5.3, Cultural Resources, and Section 5.7, Tribal Cultural Resources.

R A N C H O C U C A M O N G A C A M P U S M A S T E R P L A N D R A F T E I R C H A F F E Y C O M M U N I T Y C O L L E G E D I S T R I C T
2. Introduction
Page 2-4 PlaceWorks
Table 2-1 NOP Comment Summary Commenting
Agency/Person Date Comment Topic Comment Summary Issue Addressed in
Chapter/Section: Mitchell M. Tsai (on behalf of Southwest Regional Council of Carpenters)
July 12, 2021
Notification Requests to provide a notice for any and all notices referring or related to the proposed project.
States that the District should require local hire and use of a skilled and trained workforce to build the project.
States that the City should require the project to be built to standards exceeding the current 2019 California Green Building Code and 2020 County of Los Angeles Green Building Standards Code.
States that the NOP fails to provide information describing the project’s potential environmental effects.
States that due to COVID-19, the District must adopt a Mandatory Finding of Significance that the project may cause a substantial adverse effect on human beings and mitigate COVID-19 impacts.
Recommends that the City require that construction site design, COVID-19 testing procedures, and COVID-19 planning practices be implemented during construction.
Not applicable.
CREED LA July 2, 2021
Notification Requests a copy of any and all records related to the Rancho Cucamonga Campus Master Plan.
Not applicable.
2.3 SCOPE OF THIS DEIR The scope of the DEIR was determined based partially on the comments received in response to the NOP. Pursuant to Sections 15126.2 and 15126.4 of the CEQA Guidelines, the DEIR should identify any potentially significant adverse impacts and recommend mitigation that would reduce or eliminate these impacts to levels of insignificance.
The information in Chapter 3, Project Description, establishes the basis for analyzing project-related environmental impacts.
2.3.1 Impacts Considered Less Than Significant During preparation of the Draft EIR, the District determined that 13 environmental impact topics (shown below) would not be significantly affected by the proposed project. The less than significant findings are substantiated in Chapter 8, Impacts Found Not to Be Significant, in this Draft EIR.
R A N C H O C U C A M O N G A C A M P U S M A S T E R P L A N D R A F T E I R C H A F F E Y C O M M U N I T Y C O L L E G E D I S T R I C T
2. Introduction
April 2022 Page 2-5
Aesthetics
Agriculture and Forestry Resources
Energy Geology and Soils
Hazards and Hazardous Materials
Hydrology and Water Quality
Land Use and Planning
Mineral Resources
Population and Housing
Public Services Recreation
Utilities and Service Systems Wildfire
The following environmental impact categories were determined to have less than significant impacts without mitigation in Chapter 5, Environmental Impacts.
Greenhouse Gas Emissions Transportation
2.3.2 Potentially Significant Adverse Impacts The DEIR determined that five environmental factors have potentially significant impacts if the proposed project is implemented.
Air Quality
Biological Resources
Cultural Resources Noise Tribal Cultural Resources
However, as discussed in Chapter 5, Environmental Impacts, with implementation of mitigation measures, all impacts except Cultural Resources were reduced to a less than significant level.
2.3.3 Unavoidable Significant Adverse Impacts The DEIR identified the following environmental impact category as significant and unavoidable impact of the proposed project:
Cultural Resources
2.4 INCORPORATION BY REFERENCE Some documents are incorporated by reference into this DEIR, consistent with Section 15150 of the CEQA Guidelines, and they are available for review at the District office.
City of Rancho Cucamonga General Plan (2021), City of Rancho Cucamonga. The City of Rancho Cucamonga General Plan serves as the city’s blueprint or constitution for future development. It documents the city’s long-range vision and establishes clear goals, objectives and actions to guide the
R A N C H O C U C A M O N G A C A M P U S M A S T E R P L A N D R A F T E I R C H A F F E Y C O M M U N I T Y C O L L E G E D I S T R I C T
2. Introduction
Page 2-6 PlaceWorks
community through the next 10 to 20 years of change. The General Plan is separated into four volumes that are subsequently divided into topical chapters: Volume 1, Vision, consists of Vision & Core Values; Context; and Administration chapters; Volume 2, Built Environment, consists of Land Use & Community Character; Focus Areas; Open Space; Mobility and Access; Housing; and Public Facilities & Services chapters; Volume 3, Environmental Performance, consists of Resource Conservation; Safety; and Noise chapters, and Volume 4, Implementation Strategy, consists of General Plan Work Plan and Placemaking Toolkit chapters.
City of Rancho Cucamonga General Plan Update & Climate Action Plan Draft Environmental Impact Report (2021, September), City of Rancho Cucamonga. This document addresses the environmental effects associated with the implementation of the City of Rancho Cucamonga General Plan Update. The General Plan Update DEIR addressed all 20 environmental topics from the CEQA Guidelines Appendix G.
City of Rancho Cucamonga Municipal Code (2021), City of Rancho Cucamonga. The municipal code identifies land use categories, development standards, and other general provisions that ensure consistency between the General Plan and development projects in the City.
2.5 FINAL EIR CERTIFICATION This DEIR is being circulated for public review for 45 days. Interested agencies and members of the public are invited to provide written comments on the DEIR to the College District address shown on the title page of this document. Upon completion of the 45-day review period, the Chaffey College Governing Board will review all written comments received and prepare written responses for each. A Final EIR (FEIR) will incorporate the received comments, responses to the comments, and any changes to the DEIR that result from comments. The FEIR will be presented to the Governing Board for potential certification as the environmental document for the project. All persons who comment on the DEIR will be notified of the availability of the FEIR and the date of the public hearing before the Governing Board.
The DEIR is available to the general public for review at the following:
Chaffey Community College District, Facilities and Development website: https://www.chaffey.edu/facilitiesdevelopment/CEQA-Compliance.php
2.6 MITIGATION MONITORING Public Resources Code Section 21081.6 requires that agencies adopt a monitoring or reporting program for any project for which it has made findings pursuant to Public Resources Code Section 21081 or adopted a Negative Declaration pursuant to 21080(c). Such a program is intended to ensure the implementation of all mitigation measures adopted through the preparation of an EIR or a (Mitigated) Negative Declaration.
The Mitigation Monitoring Program for the proposed project will be completed as part of the Final EIR, prior to consideration of the project by the Governing Board.

April 2022 Page 3-1
3. Project Description 3.1 PROJECT LOCATION The 200-acre Chaffey College Rancho Cucamonga campus is at 5885 Haven Avenue in the northern part of the City of Rancho Cucamonga, San Bernardino County (Assessor’s Parcel Number [APN] 020119115). The Foothill Freeway (SR-210) is about half a mile south, and the Ontario Freeway (I-15) is about 4 miles southeast (see Figure 3-1, Regional Location, Figure 3-2, Local Vicinity, and Figure 3-3, Aerial Photograph). The project site is bounded by Haven Avenue to the west, residences to the east, Wilson Avenue to the north, and Banyan Street to the south. Access to the project site is provided from Haven Avenue and Wilson Avenue.
3.2 BACKGROUND AND PROJECT HISTORY The Chaffey Community College District (District or College District) is undertaking a comprehensive improvement and building program to make upgrades and repairs of existing buildings and to construct new facilities to improve the safety and educational experience of students, faculty, and staff at the Rancho Cucamonga campus in accordance with Measure P.
In 2018, voters passed a $700 million Measure P Bond Program. Several buildings at Chaffey College campuses were built in the 1960s or before and need basic health, safety, and technology improvements. Because of the changing economy, classrooms and labs must be upgraded to provide students with up-to-date skills and access to modern technology. On the Rancho Cucamonga campus, this means demolition of 1950s-era buildings and construction of new buildings. Measure P funding would also:1
Replace outdated buildings with modern, technologically current buildings.
Upgrade classrooms, labs, and technology to help prepare students to transfer to four-year colleges and universities.
Repair deteriorating gas, electrical, and sewer lines and fix leaky roofs.
Upgrade job training facilities for manufacturing, skilled trades, and health occupations.
Improve student safety and security systems.
Upgrade science, computer, and technology labs.
1 Chaffey College. Local Funding to Help Repair, Upgrade and Improve Chaffey College.
https://www.chaffey.edu/facilitiesdevelopment/measure-p/index.php.

R A N C H O C U C A M O N G A C A M P U S M A S T E R P L A N D R A F T E I R C H A F F E Y C O M M U N I T Y C O L L E G E D I S T R I C T
3. Project Description
Page 3-2 PlaceWorks
3.3 STATEMENT OF OBJECTIVES The primary objective of the Rancho Cucamonga Campus Master Plan is to support and advance the college’s educational mission by guiding the physical development of the campus and its facilities to accommodate gradual student enrollment growth while preserving and enhancing the quality of campus life. Objectives for the Rancho Cucamonga Campus Master Plan project will aid decision makers in their review of the project and associated environmental impacts.
Provide for the development of the site consistent with Vision 2025 Facilities Master Plan and Addendum.
Update and modernize existing building space to meet the District’s instructional needs.
Construct new buildings to meet current and future instructional and technology needs and the District’s academic mission.
Increase academic-square-foot efficiency through renovation and construction of new buildings and facilities to maximize functional space.
Implement health and safety repairs, energy-efficient enhancements, water conservation, Americans with Disabilities Act (ADA) access, building security, National Fire Protection Association Life Safety Code requirement upgrades, a mass communication system, lock-down capabilities, and other needed facility renovations.
Renovate existing facilities to maximize functional space, eliminate nonfunctional space, and improve efficiency/utilization of existing facilities.
3.4 PROJECT DEFINITION “Project,” as defined by the CEQA Guidelines, means:
... the whole of an action, which has a potential for resulting in either a direct physical change in the environment, or a reasonably foreseeable indirect physical change in the environment, and that is any of the following: (1)…enactment and amendment of zoning ordinances, and the adoption and amendment of local General Plans or elements thereof pursuant to Government Code Sections 65100–65700. (14 Cal. Code of Reg. § 15378[a])
3.5 PROJECT DESCRIPTION The project consists of demolition, construction, and renovation of buildings and campus facilities on the 200-acre campus in five phases over 30 years. The proposed project would involve demolition of approximately 229,000 square feet of existing buildings and facilities, construction of approximately 397,000 square feet of new buildings, and renovation and repurposing of approximately 148,000 square feet of existing buildings. The proposed project would also provide various outdoor space improvements, athletic fields improvement, and ADA and site improvements. Table 3-1 describes different project components proposed for each of the five

R A N C H O C U C A M O N G A C A M P U S M A S T E R P L A N D R A F T E I R C H A F F E Y C O M M U N I T Y C O L L E G E D I S T R I C T
3. Project Description
April 2022 Page 3-3
phases. Figure 3-4, New Buildings and Renovations, shows the locations of the new buildings, renovations, and additions.
Table 3-1 Project Components and Phasing Summary Demolition New Building / Facility Renovations and Repurposed Space
Phase 1 (Approx. 2027) Administration (AD; Building 1) Campus Center East (CCE; Building 20) Bookstore (B; Building 67) Campus Police (CP; Building 23)
Instructional Building 1 Campus Center East
ADA and Site Improvements 1/ Outdoor space renovation
Swing Space (existing Library modifications)
Swimming Pool Renovation Phase 2 (Approx. 2031) Business Education (BE; Building 5) Language Arts (LA; Building 10) Social Science (SS; Building 15) Wargin Hall (WH; Building 17) Vocational Education (VSS; Building 18) (also known
as Vocational and Student Support)
Instructional Building 2 Student Services Building
ADA and Site Improvements 2/ Outdoor space renovation
Marie Kane Student Services & Administration (SSA; Building 50)
Phase 3 (Approx. 2038) None. Flexible Performance
Space (FPS) and TV Studio Production Space (TV) Building
ADA and Site Improvements 3/ Outdoor space renovation
Aeronautics (AERO) Berz Educational Excellence Center
(BEB; Building 51) Phase 4 (Approx. 2042) Math (MATH; Building 24) Physical Science (PS; Building 14)
Instructional Building 3 Operational Support
Building
ADA and Site Improvements 4/ Outdoor space renovation
Skills Lab Renovation (SL) Theatre (TA)
Phase 5 (Approx. 2051) Health Science East (HS; Building 3) Health Science West (HS; Building 42) Maintenance & Operation (Building 13) Library (LI; Building 11) Modular Classrooms/Offices (MOD)
Instructional Building 4 Maintenance Building
ADA and Site Improvements 5/ Outdoor space renovation
Earl Sicosky Gymnasium (GYM; Building 8)
Warehouse (Building 22) Kinesiology and Athletic Fields
Depending on the type of development, each phase of construction would be broken down into demolition, site preparation, grading, trenching, building construction, paving, and architectural coating. A variety of equipment would be used in each subphase of construction, such as excavators, crawler tractors, loaders, forklifts, pavers, and air compressors. Construction would be performed by qualified contractors and under District contract documents and would comply with federal, state, and local regulations.
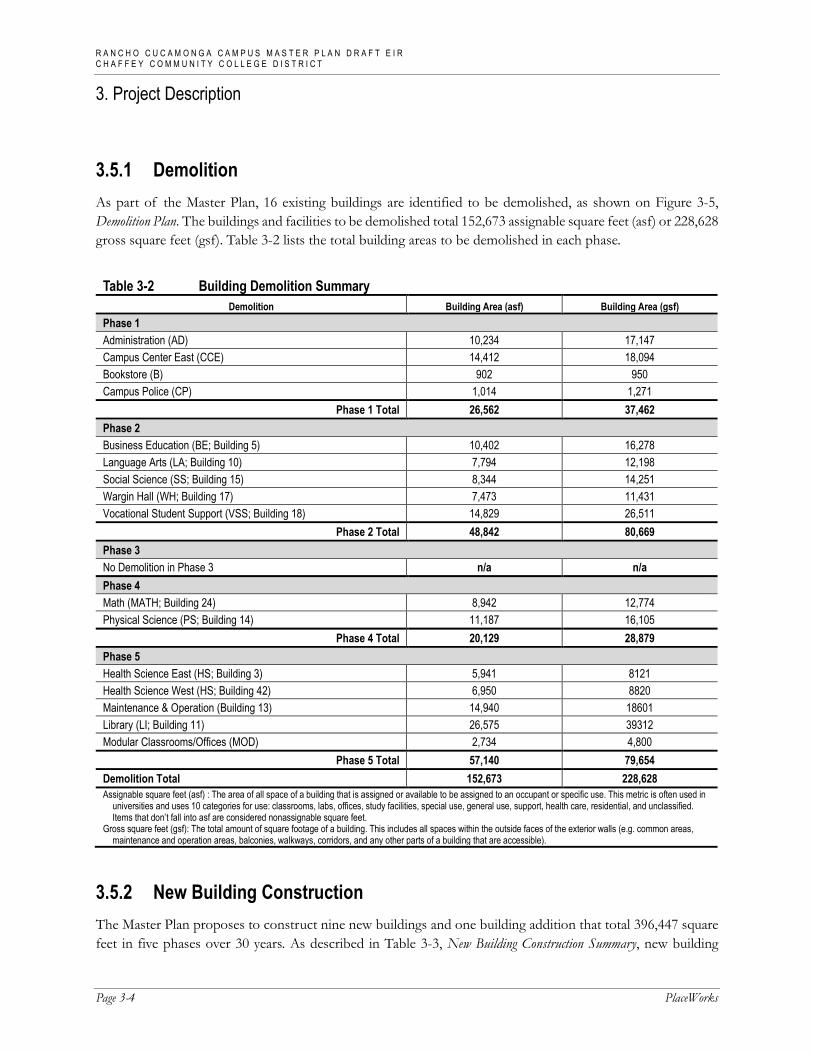
R A N C H O C U C A M O N G A C A M P U S M A S T E R P L A N D R A F T E I R C H A F F E Y C O M M U N I T Y C O L L E G E D I S T R I C T
3. Project Description
Page 3-4 PlaceWorks
3.5.1 Demolition As part of the Master Plan, 16 existing buildings are identified to be demolished, as shown on Figure 3-5, Demolition Plan. The buildings and facilities to be demolished total 152,673 assignable square feet (asf) or 228,628 gross square feet (gsf). Table 3-2 lists the total building areas to be demolished in each phase.
Table 3-2 Building Demolition Summary Demolition Building Area (asf) Building Area (gsf)
Phase 1 Administration (AD) 10,234 17,147 Campus Center East (CCE) 14,412 18,094 Bookstore (B) 902 950 Campus Police (CP) 1,014 1,271
Phase 1 Total 26,562 37,462 Phase 2 Business Education (BE; Building 5) 10,402 16,278 Language Arts (LA; Building 10) 7,794 12,198 Social Science (SS; Building 15) 8,344 14,251 Wargin Hall (WH; Building 17) 7,473 11,431 Vocational Student Support (VSS; Building 18) 14,829 26,511
Phase 2 Total 48,842 80,669 Phase 3 No Demolition in Phase 3 n/a n/a Phase 4 Math (MATH; Building 24) 8,942 12,774 Physical Science (PS; Building 14) 11,187 16,105
Phase 4 Total 20,129 28,879 Phase 5 Health Science East (HS; Building 3) 5,941 8121 Health Science West (HS; Building 42) 6,950 8820 Maintenance & Operation (Building 13) 14,940 18601 Library (LI; Building 11) 26,575 39312 Modular Classrooms/Offices (MOD) 2,734 4,800
Phase 5 Total 57,140 79,654 Demolition Total 152,673 228,628 Assignable square feet (asf) : The area of all space of a building that is assigned or available to be assigned to an occupant or specific use. This metric is often used in
universities and uses 10 categories for use: classrooms, labs, offices, study facilities, special use, general use, support, health care, residential, and unclassified. Items that don’t fall into asf are considered nonassignable square feet.
Gross square feet (gsf): The total amount of square footage of a building. This includes all spaces within the outside faces of the exterior walls (e.g. common areas, maintenance and operation areas, balconies, walkways, corridors, and any other parts of a building that are accessible).
3.5.2 New Building Construction The Master Plan proposes to construct nine new buildings and one building addition that total 396,447 square feet in five phases over 30 years. As described in Table 3-3, New Building Construction Summary, new building

R A N C H O C U C A M O N G A C A M P U S M A S T E R P L A N D R A F T E I R C H A F F E Y C O M M U N I T Y C O L L E G E D I S T R I C T
3. Project Description
April 2022 Page 3-5
construction would include outdoor spaces, where existing outdoor spaces would be removed and redesigned with various amenities such as new furniture, paving, lighting, trees, screen walls, shades, and wi-fi. Development of the Operational Support Building in Phase 4 would also include a new driveway and parking areas for trucks, staff and visitors, and campus police, as shown on Figure 3-4. The new driveway would provide direct access from Haven Avenue to the Operational Support Building’s receiving yard and divert truck traffic from College Drive. No building or site design is available at the Master Plan level, and the actual limits of the outdoor spaces, including parking lots, have not been delineated.
Table 3-3 New Building Construction Summary New Building Building Area (gsf)
Phase 1 Instructional Building 1 (two or three stories); 2,400 sf of outdoor space renovation 53,100 Campus Center East (two or three stories); remove and reconstruct outdoor space with furniture, paving, lighting, trees, wi-fi (14,000 sf) 52,500
Phase 1 Subtotal 105,600 Phase 2 Instructional Building 2 (two or three stories); 2,400 sf of outdoor space renovation 49,110 Student Services Building (two stories) 57,649
Phase 2 Subtotal 106,759 Phase 3 Flexible performance space (FPS) and TV Studio Production Space (TV) Building; 2,500 sf of outdoor space renovation 13,200
Phase 3 Subtotal 13,200 Phase 4 Instructional Building 3 (two stories); 3,000 sf of outdoor space renovation 49,100 Operational Support Building (two stories); new driveway (600 feet long and 24 feet wide) from Haven Avenue to provide direct access; parking (up to 30 staff and visitor spaces, 12,000 sf truck and loading space, and 10 police vehicles spaces)
14,400
Phase 4 Subtotal 63,500 Phase 5 Instructional Building 4 (two stories); 2,400 sf of outdoor space renovation 51,788 Maintenance Building; 50,000 sf of outdoor space improvement 25,300 Two-story addition to the Gymnasium (laboratory, offices for faculty and head coaches, shared break room and storage/processing space, Library / academic success center, Fitness Center, Athletic Locker Rooms)
30,300
Phase 5 Subtotal 107,388
New Building Area Total 396,447
3.5.3 Renovation Due to the age and condition of the existing buildings, the Master Plan emphasizes renovation and modernization of existing facilities. Approximately 148,000 square feet of existing buildings are proposed to be renovated and repurposed, as shown in Table 3-4. Building renovations could include new energy-efficient

R A N C H O C U C A M O N G A C A M P U S M A S T E R P L A N D R A F T E I R C H A F F E Y C O M M U N I T Y C O L L E G E D I S T R I C T
3. Project Description
Page 3-6 PlaceWorks
lighting; ceilings; paint; flooring; casework; stairwells; and heating, ventilation, and air conditioning systems. In some cases, interior walls could be removed or modified. In addition to the building renovations and repurposing, the renovation would also include ADA and site improvements that would fall under the below categories:
Accessibility. Improve policy-related, procedural, and physical barriers, as defined by the ADA, that currently impede access to Chaffey College services.
Energy. Reduce energy use through retrofits to buildings and energy-using systems, and increase the college’s clean energy sources—such as solar carports, LED lighting, conversions, low-emission boiler technology, additional solar photovoltaic systems, and battery storage that will lead to zero net energy.
Informal Student Spaces. Widened alcoves and niches in hallways and seating areas in lobbies, portions of plazas and courtyards, and paved nodes along paths and next to buildings. Key amenities would include adequate but comfortable lighting, furnishings, artwork, white boards, display boards, power outlets, and shade and wind screens for outdoor spaces and food options, such as coffee and snack carts and vending machine kiosks.
Landscaping. Construct improvements for the campus’s formal, informal, and natural landscape zones. Promote learning and research opportunities, a clear pedestrian circulation hierarchy, enriched programming of outdoor spaces, urban forests, natural resource conservation, and low impact development stormwater management. Implement xeriscape conversions that will replace turf with landscapes that, once established, need no further irrigation.
Learning Environments. Upgrade and outfit existing instructional and study spaces and remove barriers to flexible use by providing furniture, fixtures, and equipment, including audiovisual and instructional technology systems.
Parking and Vehicular Circulation.2 Reconfigure the Olive Way vehicular entrance and build a new drop-off zone in front of the SSA Building. Build a roundabout on College Drive to improve the flow of converging traffic. Expand the existing parking area by the Grigsby football stadium.
Security and Safety. Improve outdoor and building space using CPTED (Crime Prevention Through Environmental Design) design principles and best practices for creating secure environments, such as door hardware that permits locking from the inside, electronic access control, remote electronic surveillance, mass emergency notification, emergency phones, and nighttime lighting.
Utilities Infrastructure. Improve power, communications, water, sanitary sewer, and storm drainage.
Wayfinding. Install gateway features, signage, identifiable landmarks, other physical design cues, and directories to serve people using every mode of circulation and transportation.
2 The new driveway and parking development as part of Operational Support Building are described as part of new building
construction.

R A N C H O C U C A M O N G A C A M P U S M A S T E R P L A N D R A F T E I R C H A F F E Y C O M M U N I T Y C O L L E G E D I S T R I C T
3. Project Description
April 2022 Page 3-7
Table 3-4 Renovation Summary
Demolition Description
Renovations and Repurposed Space
(sf) Phase 1 ADA and Site Improvements 1 Swing Space Existing Library modifications 43,243 Swimming Pool Renovation Replacement of equipment and renovation of support rooms 3,000
Phase 1 Subtotal 46,243 Phase 2 ADA and Site Improvements 2 Marie Kane Student Services and
Administration (SSA) Repurpose space on the first floor and the second floor, including an expansion of the Human Resources office.
16,399
Phase 2 Subtotal 16,399 Phase 3 ADA and Site Improvements 3 Aeronautics (AERO) Renovation 23,308 Berz Educational Excellence
Center (BEB; Building 51) Repurpose vacated student support and Language Success Center space in building for Faculty Success Center offices.
3,661
Phase 3 Subtotal 26,969 Phase 4 ADA and Site Improvements 4 Theatre (TA) Renovate lobby, house, stage, and backstage and upgrade theatre
equipment and fixed seating. 33,043
Skills Lab Renovation (SL) Renovation 14,475 Phase 4 Subtotal 47,518
Phase 5 ADA and Site Improvements 5 Warehouse (Building 22) Renovate and repurpose the building to be the Grounds Department’s
offices, equipment storage, workshops, and long-term storage space for the Chaffey College Foundation and Office of Alumni Affairs.
4,602
Kinesiology and Athletic Fields • Renovate and resurface the track to comply with CCCAA competition standards
• Upgrade the baseball field by providing permanent spectator bleachers and permanent fencing to enclose the facility and renovating the dugouts
• Renovate the soccer field • Address soils subsidence issue by removing unsuitable fill soils, placing
engineered earthen fill, and rebuilding the soccer field • Renovate the football practice field • Address soils subsidence issue by removing unsuitable fill soils, placing
engineered earthen fill, and rebuilding the football practice field
20,000 sf of athletic fields
Earl Sicosky Gymnasium (GYM; Building 8)
• Renovate and expand the athletic training room. • Renovate and repurpose fitness center for classrooms, a large lecture
space, library space, and/or offices. 6,200 sf
Phase 5 Subtotal 10,802 Renovation and Repurposed Space Total 147,931

R A N C H O C U C A M O N G A C A M P U S M A S T E R P L A N D R A F T E I R C H A F F E Y C O M M U N I T Y C O L L E G E D I S T R I C T
3. Project Description
Page 3-8 PlaceWorks
3.5.4 Student Capacity The pre-pandemic student headcount at the Chaffey College Rancho Cucamonga Campus was 16,474 students actively enrolled in fall 2019. By 2051, at buildout of the Master Plan, the student count is anticipated to increase by approximately 5.65 percent, or 930 students, resulting in a headcount of 17,404 students.
3.6 INTENDED USES OF THE EIR This is a program EIR that examines the potential environmental impacts of the Rancho Cucamonga Campus Master Plan. This Draft EIR also addresses various actions by the Chaffey Community College District and others to adopt and implement the Master Plan.
This EIR serves the following purposes:
To inform the general public, interested public agencies, and the Governing Board of the potential environmental effects of the Master Plan and alternatives.
To provide the Governing Board with information that enables them to make project decisions that consider environmental consequences.
To provide project-level review for individual projects were sufficient detail exists to reduce the need for subsequent environmental documents.
To provide a basis for tiering subsequent environmental documents pursuant to the CEQA Guidelines Section 15152.
It is the intent of the Draft EIR to evaluate the environmental impacts of the proposed project, thereby enabling the Chaffey College Governing Board, other responsible agencies, and interested parties to make informed decisions with respect to the Master Plan. The anticipated approvals required for this project are:
Lead Agency Action Chaffey College Governing Board Certify Environmental Impact Report and adopt Mitigation Monitoring and Reporting
Program, Findings of Fact, and Statement of Overriding Considerations. Responsible Agencies Action
City of Rancho Cucamonga Fire Protection District Approval of plans for emergency access and emergency evacuation. DSA approval of the fire/life safety portion of a project requires local fire authority review of: elevator/stair access for emergency rescue and patient transport; access roads, fire lane markings, pavers, and gate entrances; fire hydrant location and distribution; and fire flow (location of post indicator valve, fire department connection, and detector check valve assembly).
City of Rancho Cucamonga Engineering Services Permit for curb, gutter, and other off-site improvements; Approval of construction-related haul route.
California Department of General Services, Division of State Architect (DSA)
Plan review and construction oversight, including structural safety, fire and life safety, access compliance, and energy.
State Fire Marshal Facility Fire and Life Safety Program
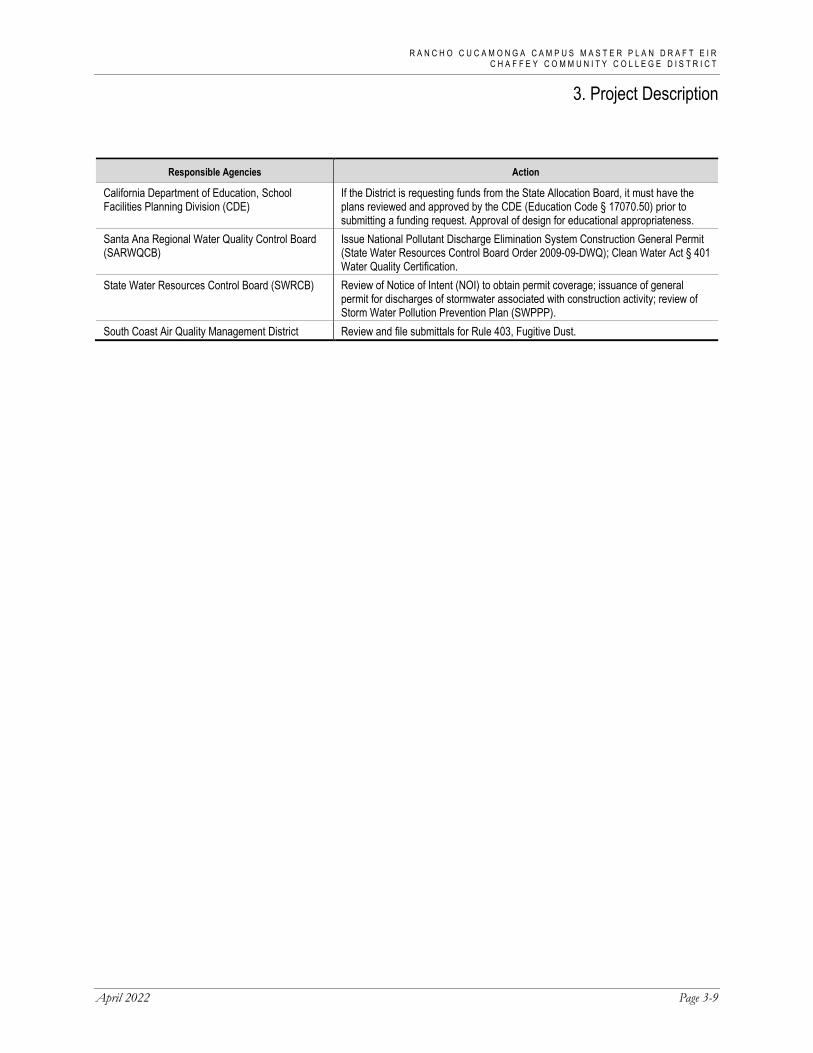
R A N C H O C U C A M O N G A C A M P U S M A S T E R P L A N D R A F T E I R C H A F F E Y C O M M U N I T Y C O L L E G E D I S T R I C T
3. Project Description
April 2022 Page 3-9
Responsible Agencies Action
California Department of Education, School Facilities Planning Division (CDE)
If the District is requesting funds from the State Allocation Board, it must have the plans reviewed and approved by the CDE (Education Code § 17070.50) prior to submitting a funding request. Approval of design for educational appropriateness.
Santa Ana Regional Water Quality Control Board (SARWQCB)
Issue National Pollutant Discharge Elimination System Construction General Permit (State Water Resources Control Board Order 2009-09-DWQ); Clean Water Act § 401 Water Quality Certification.
State Water Resources Control Board (SWRCB) Review of Notice of Intent (NOI) to obtain permit coverage; issuance of general permit for discharges of stormwater associated with construction activity; review of Storm Water Pollution Prevention Plan (SWPPP).
South Coast Air Quality Management District Review and file submittals for Rule 403, Fugitive Dust.

R A N C H O C U C A M O N G A C A M P U S M A S T E R P L A N D R A F T E I R C H A F F E Y C O M M U N I T Y C O L L E G E D I S T R I C T
3. Project Description
Page 3-10 PlaceWorks
This page intentionally left blank.

PlaceWorks
Figure 3-1 - Regional Location
Source: ESRI, 2020
0
Scale (Miles)
3Note: Unincorporated county areas are shown in white.
Chaffey College - Rancho Cucamonga Campus
Cou
nty
of L
os A
ngel
es
Cou
nty
of L
os A
ngel
esC
ount
y of
San
Ber
nard
ino
Cou
nty
of S
an B
erna
rdin
o
County of RiversideCounty of Riverside
County of San BernardinoCounty of San Bernardino
210
71
60
83
31 142
210
138
3. Project Description
R A N C H O C U C A M O N G A C A M P U S M A S T E R P L A N D R A F T E I RC H A F F E Y C O M M U N I T Y C O L L E G E D I S T R I C T

R A N C H O C U C A M O N G A C A M P U S M A S T E R P L A N D R A F T E I R C H A F F E Y C O M M U N I T Y C O L L E G E D I S T R I C T
3. Project Description
Page 3-12 PlaceWorks
This page intentionally left blank.

PlaceWorks
Figure 3-2 - Local Vicinity
Source: ESRI, 2020
3. Project Description
0
Scale (Feet)
2,000
RANCHOCUCAMONGA
UNINCORPORATEDSAN BERNARDINO COUNTY
RANCHOCUCAMONGA
UNINCORPORATEDSAN BERNARDINO COUNTY
City Boundary
Chaffey College - Rancho Cucamonga Campus
ChaffeyCollegeSchool
210
210
R A N C H O C U C A M O N G A C A M P U S M A S T E R P L A N D R A F T E I RC H A F F E Y C O M M U N I T Y C O L L E G E D I S T R I C T

R A N C H O C U C A M O N G A C A M P U S M A S T E R P L A N D R A F T E I R C H A F F E Y C O M M U N I T Y C O L L E G E D I S T R I C T
3. Project Description
Page 3-14 PlaceWorks
This page intentionally left blank.

PlaceWorks
Figure 3-3 - Aerial Photograph
Source: Nearmap, 2020
0
Scale (Feet)
750
Wilson AveWilson Ave
Hav
en A
veH
aven
Ave
Hillside RdHillside Rd
Apple LnApple Ln
Beechwood DrBeechwood Dr
Peach Tree LnPeach Tree Ln
Silver Spur CtSilver Spur Ct
Valin
da A
veVa
linda
Ave
Mor
ning
Sta
r Dr
Mor
ning
Sta
r Dr
Mes
ada
StM
esad
a St
Northridge DrNorthridge Dr
Hillside RdHillside Rd
Popular StPopular St
Mahogany CtMahogany Ct
Manzanita DrManzanita Dr
Lavender CtLavender Ct
San Andreas DrSan Andreas Dr
Banyan StBanyan St
Lemon AveLemon Ave
Car
tilla
Ave
Car
tilla
Ave
Banyan StBanyan St
Champagne Rd
Champagne Rd
Zinfandel StZinfandel St
Mirador DrMirador Dr
Concannon StConcannon St
Dak
ota
Ave
Dak
ota
Ave
Cal
law
ay P
lC
alla
way
Pl
Valin
da A
veVa
linda
Ave
Mus
cat P
lM
usca
t Pl
Cab
arne
t Pl
Cab
arne
t Pl
Orv
ieto
Ct
Orv
ieto
Ct
Bra
ndy
PlB
rand
y Pl
Can
tabr
ia A
veC
anta
bria
Ave
Sere
na P
lSe
rena
Pl
Terr
acin
a Av
eTe
rrac
ina
AvePort StPort St
Sher
ry C
tSh
erry
Ct
Sont
erra
Ct
Sont
erra
Ct
Mor
ning
Pl
Mor
ning
Pl
Fred
eric
ksbu
rg A
veFr
eder
icks
burg
Ave
7 Pines Dr7 Pines Dr
Antietam DrAntietam Dr
Can
iste
l Ave
Can
iste
l Ave
Wilderness DrWilderness Dr
Stone River DrStone River Dr
Cedar Creek DrCedar Creek Dr
Gettysburg DrGettysburg Dr
San
Felip
e C
tSa
n Fe
lipe
Ct
San
Raf
ael C
tSa
n R
afae
l Ct
San
Mar
tin C
tSa
n M
artin
Ct
Merlot CtMerlot Ct
Single-FamilyDevelopment
Single-FamilyDevelopment
Single-FamilyDevelopment
BanyanElementary
School
Single-FamilyDevelopment
Vacant
Church
DetentionBasin
Syca
mor
e C
tSy
cam
ore
Ct
Chaffey College - Rancho Cucamonga Campus
NaturePreserve
Panther DrPanther Dr
Colle
ge D
rCo
llege
Dr
R A N C H O C U C A M O N G A C A M P U S M A S T E R P L A N D R A F T E I RC H A F F E Y C O M M U N I T Y C O L L E G E D I S T R I C T
3. Project Description

R A N C H O C U C A M O N G A C A M P U S M A S T E R P L A N D R A F T E I R C H A F F E Y C O M M U N I T Y C O L L E G E D I S T R I C T
3. Project Description
Page 3-16 PlaceWorks
This page intentionally left blank.

PlaceWorksSource: HMC Architects, 2018
Figure 3-4 - New Buildings and Renovations3. Project Description
0
Scale (Feet)
450
R A N C H O C U C A M O N G A C A M P U S M A S T E R P L A N D R A F T E I RC H A F F E Y C O M M U N I T Y C O L L E G E D I S T R I C T
New Facilitiesand Renovations
MAC
SOCCERFIELD
BASEBALLFIELD
SOFTBALLFIELD
FOOTBALLPRACTICE
FIELD
SPRT
GYMZHDL
CHEMBL
ISSL
MAINTENANCE
INSTRUCTIONALBLDG 2
LIBRARY(Not-A-Part)
INSTRUCTIONALBLDG 1
INSTRUCTIONALBLDG 4
STUDENTSERVICES
INSTRUCTIONALBLDG 3
CAMPUSCENTER
FPS
TV
CAA
BEB
CACCAB
CAE
TA
AERO
ATL
VSS
OPERATIONALSUPPORT
POOL
C
D
A
B
GRIGSBY FIELD
NATURE PRESERVE
BASEBALLFIELD
SOCCERFIELD
FOOTBALLPRACTICE
FIELD
MAINTENANCEYARD
OVERFLOWPARKING
TES
BANYAN STREET
HAV
EN A
VEN
UE
WILSON AVENUE
COLLEGE DRIVE
COLLEGE DRIVE
RECEIVINGYARD
POLICEVEHICLES
AEROYARD
EXISTING FACILITIES
NEW BUILDINGS
RENOVATIONS + REPURPOSING
BUILDING ADDITIONS
SSA
CENTRALPLANT

R A N C H O C U C A M O N G A C A M P U S M A S T E R P L A N D R A F T E I R C H A F F E Y C O M M U N I T Y C O L L E G E D I S T R I C T
3. Project Description
Page 3-18 PlaceWorks
This page intentionally left blank.

4.5HMC ARCHITECTS / RANCHO CUCAMONGA CAMPUS HMC ARCHITECTS
PlaceWorksSource: HMC Architects, 2018
Figure 3-5 - Demolition Plan3. Project Description
0
Scale (Feet)
450
R A N C H O C U C A M O N G A C A M P U S M A S T E R P L A N D R A F T E I RC H A F F E Y C O M M U N I T Y C O L L E G E D I S T R I C T
FACILITIES TO BE REMOVED
EXISTING FACILITIES
SOLAR CARPORT
COLLEGE DRIVE
BANYAN STREET
HAV
EN A
VEN
UE
SLAERO
ATL
IS
ZH
DL
CHEMBL
SSA
C
D
A
B
SS LA
LI
BE
CCE
CP BWH
AD
MATHHS
PS
MACC
CABCAC
TA
BEB WM
CAE
SPRT
GYM
COLLEGE DRIVE
OVERLOWPARKING
POOL
TES
BASEBALLFIELD
FOOTBALLPRACTICE
FIELD
GRIGSBY FIELD
CAA
SOCCERFIELD
CENTRALPLANT
MODULARS FACILITIES
WAREHOUSE
SOFTBALLFIELD
VSS

R A N C H O C U C A M O N G A C A M P U S M A S T E R P L A N D R A F T E I R C H A F F E Y C O M M U N I T Y C O L L E G E D I S T R I C T
3. Project Description
Page 3-20 PlaceWorks
This page intentionally left blank.

April 2022 Page 4-1
4. Environmental Setting 4.1 INTRODUCTION This section provides a “description of the physical environmental conditions in the vicinity of the project, as they exist at the time the notice of preparation is published, ... from both a local and a regional perspective” (Guidelines § 15125[a]), pursuant to provisions of the California Environmental Quality Act (CEQA) and the CEQA Guidelines. The environmental setting provides the baseline physical conditions from which the lead agency will determine the significance of environmental impacts resulting from the proposed project.
4.2 HISTORY Chaffey College represents the vision of George and William Chaffey, who founded the City of Ontario in the last quarter of the nineteenth century. Recognizing the need for an institution of higher learning, the Chaffey brothers donated land and established an endowment for a private college known as the Chaffey College of Agriculture. On March 17, 1883, the cornerstone of the college was laid at Fourth Street and Euclid Avenue in Ontario. Due to meager financial resources, the college became an extension of the University of Southern California and then closed for a brief period in the early 1900s. In 1906 the Chaffey endowment was legally separated from the University of Southern California, and the reorganized Chaffey Union High School District became the beneficiary of the College Trust. In 1916 the Chaffey Junior College of Agriculture was added as a postgraduate department to the high school. The college separated from the high school district in 1922 with the creation of the Chaffey Junior College District. In 1957 bonds were approved in support of a complete separation of the high school and college facilities. Property was acquired in Alta Loma (now Rancho Cucamonga), and a long-anticipated new college opened its doors in the spring of 1960. In 1968, the voters of the Chino Valley School District voted to join the Chaffey College District, bringing the total service area to 310 square miles encompassing Chino, Chino Hills, Ontario, Montclair, Upland, Fontana, and Rancho Cucamonga. The Chaffey Junior College District Board of Trustees formally adopted the name Chaffey Community College District on July 14, 1970.
Passage of Measure L ($230 million) in 2002 has enabled the college to construct and renovate a number of buildings on the Rancho Cucamonga, Chino, and Fontana campuses (CCCD 2020, 2021). The passage of Measure P ($700 million) in 2018 will enable the college to construct and/or renovate a number of buildings on all three campuses. Various projects identified in the District’s Vision 2030 Facilities Master Plan, including new and renovated buildings and improvements at all three campuses and a new, permanent presence in Ontario.

R A N C H O C U C A M O N G A C A M P U S M A S T E R P L A N D R A F T E I R C H A F F E Y C O M M U N I T Y C O L L E G E D I S T R I C T
4. Environmental Setting
Page 4-2 PlaceWorks
Chaffey College Current Operations
Chaffey Colleges are two-year public community colleges accredited by the Accrediting Commission for Community and Junior Colleges, Western Association of Schools and Colleges.
The college district serves the population of the inland empire of western San Bernardino County and the communities of Chino, Chino Hills, Fontana, Guasti, Montclair, Mt. Baldy, Ontario, Rancho Cucamonga (Alta Loma, Cucamonga, and Etiwanda), and Upland. Four school districts serve high school students within these communities: Chaffey Joint Union High School District, Chino Valley Unified School District, Fontana Unified School District, and Upland Unified School District.
Chaffey College has three campuses:
Rancho Cucamonga Campus, 5885 Haven Avenue, Rancho Cucamonga, CA 91737
Fontana Campus, 16855 Merrill Ave, Fontana, CA 92335 Chino Campus, 5897 College Park Avenue, Chino, CA 91710
Chaffey College Rancho Cucamonga’s academic and career communities are:
Arts, Communication and Design
Business, Technology and Hospitality
Health, Wellness and Athletics
Manufacturing, Industrial Design and Transportation
Public Service, Culture and Society Science, Technology, Engineering and Mathematics
Schools of the college are:
School of Business and Applied Technology School of Health Sciences
School of Hospitality, Fashion, Interior and Culinary Arts
School of Kinesiology, Nutrition and Athletics
School of Language Arts
School of Mathematics and Science School of Social and Behavioral Sciences School of Visual and Performing Arts
The prepandemic student headcount at the Chaffey College Rancho Cucamonga Campus was 16,474 students actively enrolled in fall 2019. By 2051, at buildout of the Master Plan, the student count is anticipated to increase by approximately 5.65 percent, or 930 students, resulting in a headcount of 17,404 students.

R A N C H O C U C A M O N G A C A M P U S M A S T E R P L A N D R A F T E I R C H A F F E Y C O M M U N I T Y C O L L E G E D I S T R I C T
4. Environmental Setting
April 2022 Page 4-3
4.3 ENVIRONMENTAL SETTING 4.3.1 Project Location The 200-acre Chaffey College Rancho Cucamonga campus is at 5885 Haven Avenue in the north part of the City of Rancho Cucamonga, southwest San Bernardino County (Assessor’s Parcel Numbers [APN] 0201-191-15, -29, and -32). Regional access to the project site is provided by State Route 210 (SR-210; Foothill Freeway), approximately 0.5 mile to the south (see Figure 3-1, Regional Location). The project site is fronted by Haven Avenue to the west, Wilson Avenue to the north, and Banyan Street and Merlot Court to the south (see Figure 3-2, Local Vicinity). Single-family residences bound the project site to the west. Beyond Haven Avenue to the west are vacant lands, a religious institution, single-family residences, and flood control detention basin; beyond Wilson Avenue to the north are residential uses; and across Banyan Street to the south are single-family residences and Banyan Elementary School and south of Merlot Court are also single-family residences.
4.3.2 Surrounding Land Uses The college campus is bordered by Wilson Avenue and single-family development on the north; Banyan Street and Merlot Court, single-family development, and Banyan Elementary School on the south; single-family development on the east; and Haven Avenue, a large detention basin and drainage channel, single-family development, a church, and a vacant parcel to the west (see Figure 3-3, Aerial Photograph). Other major uses in the area include Los Osos High School, approximately 0.4 mile east, Deer Canyon Wash, approximately 0.3 miles east, and retail plazas with markets and restaurants are approximately 0.3 mile to the south.
4.3.3 Existing Conditions Most buildings form the campus core in the center of the campus, with the Child Development Center in the northwest corner, the nature preserve in the northeast corner, athletic fields in the southeast corner, and open space and storm drainage facility in the southwest corner. In addition to the instructional and support services buildings, the campus includes various athletic facilities (football stadium, gymnasium, pool, tennis courts, baseball field, soccer field, football practice field) and a maintenance yard (maintenance and operations building and warehouse). Parking lots are scattered throughout the campus (Parking Lots 6, 7, 11, 18, and 19 have solar panels). Named internal campus street are Olive Way, Myrtle Drive, College Drive, Panther Drive, and Oak Drive (see Figure 4-1, Existing Campus). There are five access drives along Haven Avenue and four along Wilson Avenue.
4.3.4 General Plan and Zoning The City of Rancho Cucamonga General Plan Land Use designation for the property is ‘Schools (0.10 - 0.20 FAR),” and the zoning district is ‘School (S)’ (see Figure 4-2, General Plan Designation, and Figure 4-3, Zoning Map).

R A N C H O C U C A M O N G A C A M P U S M A S T E R P L A N D R A F T E I R C H A F F E Y C O M M U N I T Y C O L L E G E D I S T R I C T
4. Environmental Setting
Page 4-4 PlaceWorks
4.4 ASSUMPTIONS REGARDING CUMULATIVE IMPACTS Cumulative impacts are defined as “two or more individual effects which, when considered together, are considerable or which compound or increase other environmental impacts” (CA Code of Regulations, Title 14, Section 15355). Cumulative impacts are the change caused by the incremental impact of the project evaluated in the EIR together with the incremental impacts from closely related past, present, and reasonably foreseeable probable future projects. Cumulative impacts can result from individually minor but collectively significant projects taking place over a period of time.
Section 15130 of the CEQA Guidelines states that cumulative impacts must be discussed when the project’s incremental effect is cumulatively considerable. It further states that this discussion must reflect the level and severity of the impact and the likelihood of occurrence, but not in as great a level of detail as for the project.
The information used in an analysis of cumulative impacts comes from one of two sources (per CA Code of Regulations, Title 14, Section 15130 [b][1]):
A. A list of past, present, and probable future projects producing related cumulative impacts, including, if necessary, those projects outside the control of the agency.
B. A summary of projections contained in an adopted general plan or related planning document, or in a prior environmental document which has been adopted or certified, which described or evaluated regional or area-wide conditions contributing to the cumulative impact.
Depending on the environmental category, the cumulative impact analysis in each topical section of this EIR may use either source as appropriate. In most cases, the potential for cumulative impacts is confined to the project site and its immediate surroundings. Potential cumulative impacts that have the potential for impacts beyond the project site boundaries (e.g., traffic, air quality, GHG emissions) have been addressed by using the growth projections adopted by the City of Rancho Cucamonga, SCAG’s 2020 Regional Transportation Plan /Southern California Strategies (ConnectSoCal), and the San Bernardino Transportation Analysis Model, as appropriate. Refer to Chapter 5, Environmental Analysis, for a discussion of the cumulative impacts associated with development and growth in the city and region for each environmental resource topic.
4.5 REFERENCES Chaffey Community College District (CCCD). 2020, February. VISION 2030 Chaffey College Educational
Master Plan. https://www.chaffey.edu/facilitiesdevelopment/docs/chaffey_ college_vision_2030_educational_master_plan_feb_2020.pdf.
———. 2021, November (accessed). Chaffey College 2020-2021 Catalog: General Information. https://www.chaffey.edu/catalogandschedule/docs/catalogs/2020-2021-gen.pdf.
San Bernardino Flood Control District. Comprehensive Storm Drain Plan (CSDP) 2. https://sbcountydpw .maps.arcgis.com/home/webmap/viewer.html?webmap=1555d49212b44eb3ac8a6e6309d1d8e0.

CD-A CD-C
CD-B
GPSAssessment
REV. 6-13-19
CD-D
Swing Space Village
24 Parking
Blue Phones
7PE/Athletics Parking
6PE/Athletics Parking
Project Trailer
OVERFLOWPARKING
East Plaza
PRACTICEFOOTBALL
FIELD
Maintenance Way
Central Plant
CP SubstationTES
1
2
34
5
PlaceWorksSource: Chaffey College, 2020
Figure 4-1 - Existing Campus4. Environmental Setting
0
Scale (Feet)
500
R A N C H O C U C A M O N G A C A M P U S M A S T E R P L A N D R A F T E I RC H A F F E Y C O M M U N I T Y C O L L E G E D I S T R I C T
(East)
Phase 1
Phase 2
Phase 3
Phase 4
Phase 5Solid colored lines indicate buildings to be demolished.Dashed colored lines indicate buildings to be renovated.
HS
(West)HS

R A N C H O C U C A M O N G A C A M P U S M A S T E R P L A N D R A F T E I R C H A F F E Y C O M M U N I T Y C O L L E G E D I S T R I C T
4. Environmental Setting
Page 4-6 PlaceWorks
This page intentionally left blank.

PlaceWorks
Figure 4-2 - General Plan Designation
Source: ESRI, 2021
4. Environmental Setting
0
Scale (Feet)
800
Chaffey College - Rancho Cucamonga Campus
R A N C H O C U C A M O N G A C A M P U S M A S T E R P L A N D R A F T E I RC H A F F E Y C O M M U N I T Y C O L L E G E D I S T R I C T
Low Medium (4.0-8.0 DU/AC)
Medium (8.0-14.0 DU/AC)
Medium High (14.0-24.0 DU/AC)
Office (0.4-1.0 FAR)
Neighborhood Commercial (0.25-0.35 FAR)
Flood Control/Utility Corridor
School (0.10-0.20 FAR)
Low (2.0-4.0 DU/AC)
Very Low (01-2.0 DU/AC)
Civic/Regional (0.40-1.00 FAR)

R A N C H O C U C A M O N G A C A M P U S M A S T E R P L A N D R A F T E I R C H A F F E Y C O M M U N I T Y C O L L E G E D I S T R I C T
4. Environmental Setting
Page 4-8 PlaceWorks
This page intentionally left blank.
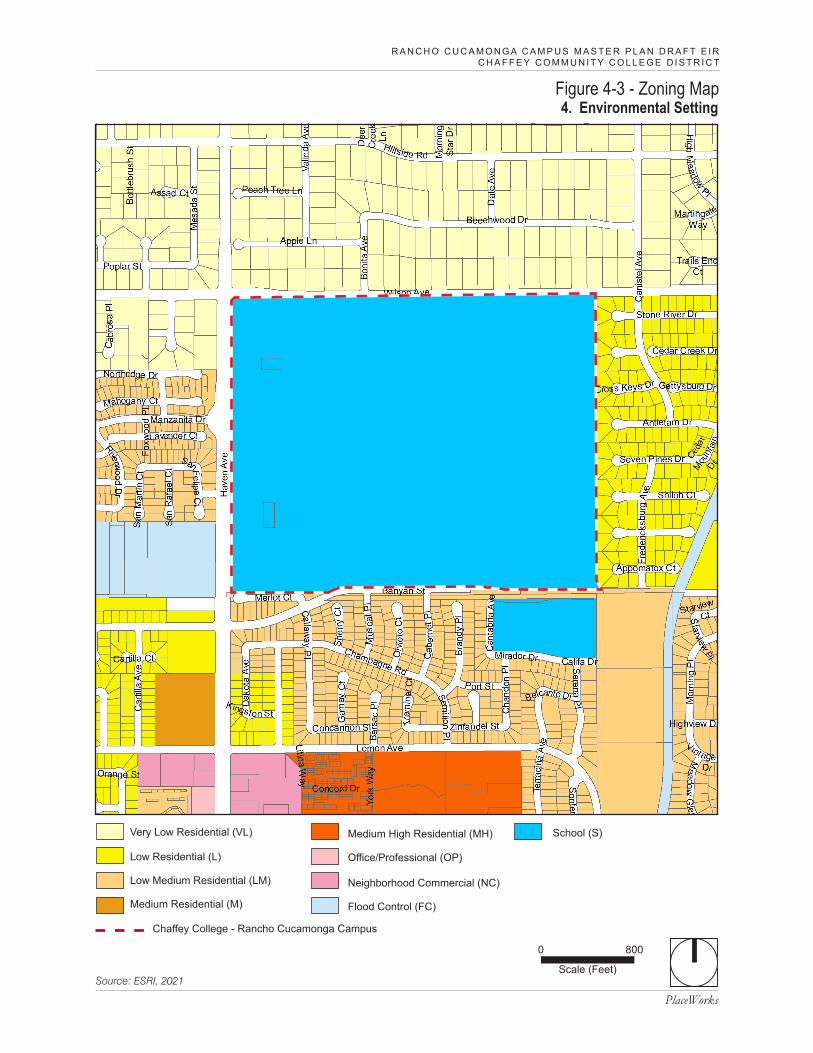
PlaceWorksSource: ESRI, 2021
Figure 4-3 - Zoning Map4. Environmental Setting
0
Scale (Feet)
800
Chaffey College - Rancho Cucamonga Campus
R A N C H O C U C A M O N G A C A M P U S M A S T E R P L A N D R A F T E I RC H A F F E Y C O M M U N I T Y C O L L E G E D I S T R I C T
Low Residential (L)
Very Low Residential (VL)
Low Medium Residential (LM)
Medium Residential (M)
Medium High Residential (MH)
Office/Professional (OP)
Neighborhood Commercial (NC)
Flood Control (FC)
School (S)

R A N C H O C U C A M O N G A C A M P U S M A S T E R P L A N D R A F T E I R C H A F F E Y C O M M U N I T Y C O L L E G E D I S T R I C T
4. Environmental Setting
Page 4-10 PlaceWorks
This page intentionally left blank.

April 2022 Page 5-1
5. Environmental Analysis Chapter 5 examines the environmental setting of the proposed project, analyzes its effects and the significance of its impacts, and recommends mitigation measures to reduce or avoid impacts. This chapter has a separate section for each environmental issue area that was determined to need further study in the EIR. This scope was determined in the notice of preparation (NOP) and through public and agency comments received during the NOP comment period from June 18, 2021, to July 19, 2021 (see Appendix A). Environmental issues and their corresponding sections are:
5.1 Air Quality
5.2 Biological Resources 5.3 Cultural Resources
5.4 Greenhouse Gas Emissions
5.5 Noise
5.6 Transportation 5.7 Tribal Cultural Resources
The following topical areas are discussed in Chapter 8, Impacts Found Not to Be Significant.
Aesthetics
Agriculture and Forestry Resources Energy
Geology and Soils
Hazards and Hazardous Materials
Hydrology and Water Quality
Land Use and Planning Mineral Resources
Population and Housing
Public Services
Recreation
Utilities and Service Systems Wildfire
Sections 5.1 through 5.7 provide detailed discussions of the environmental setting, impacts associated with the proposed project, and mitigation measures designed to reduce significant impacts where required and when feasible. The residual impacts following the implementation of any mitigation measure are also discussed.

R A N C H O C U C A M O N G A C A M P U S M A S T E R P L A N D R A F T E I R C H A F F E Y C O M M U N I T Y C O L L E G E D I S T R I C T
5. Environmental Analysis
Page 5-2 PlaceWorks
Organization of Environmental Analysis
To assist the reader with comparing information between environmental issues, each section is organized under nine major headings:
Environmental Setting Thresholds of Significance
Plans, Programs, and Policies
Environmental Impacts
Cumulative Impacts
Level of Significance Before Mitigation Mitigation Measures
Level of Significance After Mitigation References
In addition, Chapter 1, Executive Summary, has a table that summarizes all impacts by environmental issue.
Terminology Used in This Draft EIR
The level of significance is identified for each impact in this DEIR. Although the criteria for determining significance are different for each topic area, the environmental analysis applies a uniform classification of the impacts based on definitions consistent with CEQA and the CEQA Guidelines:
No impact. The project would not change the environment.
Less than significant. The project would not cause any substantial, adverse change in the environment.
Less than significant with mitigation incorporated. The EIR includes mitigation measures that avoid substantial adverse impacts on the environment.
Significant and unavoidable. The project would cause a substantial adverse effect on the environment, and no feasible mitigation measures are available to reduce the impact to a less than significant level.

R A N C H O C U C A M O N G A C A M P U S M A S T E R P L A N D R A F T E I R C H A F F E Y C O M M U N I T Y C O L L E G E D I S T R I C T
5. Environmental Analysis
April 2022 Page 5.1-1
5.1 AIR QUALITY This section of the Draft Environmental Impact Report (DEIR) evaluates the potential for the Rancho Cucamonga Campus Master Plan project (proposed project) to impact air quality in a local and regional context. This evaluation is based on the methodology recommended by the South Coast Air Quality Management District (South Coast AQMD). The analysis focuses on air pollution from regional emissions and localized pollutant concentrations. In this section, “emissions” refers to the actual quantity of pollutant, measured in pounds per day (lbs/day), and “concentrations” refers to the amount of pollutant material per volumetric unit of air. Concentrations are measured in parts per million (ppm), parts per billion (ppb), or micrograms per cubic meter (µg/m3).
Criteria air pollutant emissions modeling is included in Appendix B, Air Quality and GHG Emissions Data, of this DEIR. Transportation-sector impacts are based on trip generation data as provided by Urban Crossroads (see Appendix G and Appendix H). Cumulative impacts related to air quality are based on the regional boundaries of the South Coast Air Basin (SoCAB). An evaluation of localized construction health risks is in Appendix C, Construction Health Risk Assessment, of this DEIR.
5.1.1 Environmental Setting 5.1.1.1 AIR POLLUTANTS OF CONCERN
Criteria Air Pollutants
The pollutants emitted into the ambient air by stationary and mobile sources are categorized as primary and/or secondary pollutants. Primary air pollutants are emitted directly from sources. Carbon monoxide (CO), volatile organic compounds (VOC), nitrogen oxides (NOX), sulfur dioxide (SO2), coarse inhalable particulate matter (PM10), fine inhalable particulate matter (PM2.5), and lead (Pb) are primary air pollutants. Of these, CO, SO2, nitrogen dioxide (NO2), PM10, and PM2.5 are “criteria air pollutants,” which means that ambient air quality standards (AAQS) have been established for them. VOC and NOX are criteria pollutant precursors that form secondary criteria air pollutants through chemical and photochemical reactions in the atmosphere. Ozone (O3) and NO2 are the principal secondary pollutants.
Each of the primary and secondary criteria air pollutants and its known health effects are described below.
Carbon Monoxide is a colorless, odorless, toxic gas produced by incomplete combustion of carbon substances, such as gasoline or diesel fuel. CO is a primary criteria air pollutant. CO concentrations tend to be the highest during winter mornings with little to no wind, when surface-based inversions trap the pollutant at ground levels. Because CO is emitted directly from internal combustion, engines and motor vehicles operating at slow speeds are the primary source of CO in the SoCAB. The highest ambient CO concentrations are generally found near traffic-congested corridors and intersections. The primary adverse health effect associated with CO is interference with normal oxygen transfer to the blood, which may result in tissue oxygen deprivation (South Coast AQMD 2005; US EPA 2022). The SoCAB is designated as being in attainment under the California AAQS and attainment (serious maintenance) under the National AAQS (CARB 2022a).

R A N C H O C U C A M O N G A C A M P U S M A S T E R P L A N D R A F T E I R C H A F F E Y C O M M U N I T Y C O L L E G E D I S T R I C T
5. Environmental Analysis AIR QUALITY
Page 5.1-2 PlaceWorks
Volatile Organic Compounds are composed primarily of hydrogen and carbon atoms. Internal combustion associated with motor vehicle usage is the major source of VOCs. Other sources include evaporative emissions from paints and solvents, asphalt paving, and household consumer products such as aerosols (South Coast AQMD 2005). There are no AAQS for VOCs. However, because they contribute to the formation of O3, South Coast AQMD has established a significance threshold. The health effects for ozone are described later in this section.
Nitrogen Oxides are a byproduct of fuel combustion and contribute to the formation of O3, PM10, and PM2.5. The two major forms of NOX are nitric oxide (NO) and NO2. The principal form of NO2 produced by combustion is NO, but NO reacts with oxygen to form NO2, creating the mixture of NO and NO2 commonly called NOX. NO2 acts as an acute irritant and, in equal concentrations, is more injurious than NO. At atmospheric concentrations, however, NO2 is only potentially irritating. There is some indication of a relationship between NO2 and chronic pulmonary fibrosis. Some increase in bronchitis in children (two and three years old) has also been observed at concentrations below 0.3 part per million (ppm). NO2 absorbs blue light; the result is a brownish-red cast to the atmosphere and reduced visibility. NO is a colorless, odorless gas formed from atmospheric nitrogen and oxygen when combustion takes place under high temperature and/or high pressure (South Coast AQMD 2005; US EPA 2022). The SoCAB is designated as an attainment (maintenance) area under the National AAQS and attainment area under the California AAQS (CARB 2022a).
Sulfur Dioxide is a colorless, pungent, irritating gas formed by the combustion of sulfurous fossil fuels. It enters the atmosphere as a result of burning high-sulfur-content fuel oils and coal and chemical processes at plants and refineries. Gasoline and natural gas have very low sulfur content and do not release significant quantities of SO2. When sulfur dioxide forms sulfates (SO4) in the atmosphere, together these pollutants are referred to as sulfur oxides (SOX). Thus, SO2 is both a primary and secondary criteria air pollutant. At sufficiently high concentrations, SO2 may irritate the upper respiratory tract. Current scientific evidence links short-term exposures to SO2, ranging from 5 minutes to 24 hours, with an array of adverse respiratory effects, including bronchoconstriction and increased asthma symptoms. These effects are particularly adverse for asthmatics at elevated ventilation rates (e.g., while exercising or playing) at lower concentrations and when combined with particulates, SO2 may do greater harm by injuring lung tissue. Studies also show a connection between short-term exposure and increased visits to emergency facilities and hospital admissions for respiratory illnesses, particularly in at-risk populations such as children, the elderly, and asthmatics (South Coast AQMD 2005; US EPA 2022). The SoCAB is designated as attainment under the California and National AAQS (CARB 2022a).
Suspended Particulate Matter consists of finely divided solids or liquids such as soot, dust, aerosols, fumes, and mists. Two forms of fine particulates are now recognized and regulated. Inhalable coarse particles, or PM10, include particulate matter with an aerodynamic diameter of 10 microns or less (i.e., ≤10 millionths of a meter or 0.0004 inch). Inhalable fine particles, or PM2.5, have an aerodynamic diameter of 2.5 microns or less (i.e., ≤2.5 millionths of a meter or 0.0001 inch). Particulate discharge into the atmosphere results primarily from industrial, agricultural, construction, and transportation activities. Both PM10 and PM2.5 may adversely affect the human respiratory system, especially in people who are naturally
R A N C H O C U C A M O N G A C A M P U S M A S T E R P L A N D R A F T E I R C H A F F E Y C O M M U N I T Y C O L L E G E D I S T R I C T
5. Environmental Analysis AIR QUALITY
April 2022 Page 5.1-3
sensitive or susceptible to breathing problems. The US Environmental Protection Agency’s (US EPA) scientific review concluded that PM2.5, which penetrates deeply into the lungs, is more likely than PM10 to contribute to health effects and at far lower concentrations. These health effects include premature death in people with heart or lung disease, nonfatal heart attacks, irregular heartbeat, aggravated asthma, decreased lung function, and increased respiratory symptoms (e.g., irritation of the airways, coughing, or difficulty breathing) (South Coast AQMD 2005). There has been emerging evidence that ultrafine particulates, which are even smaller particulates with an aerodynamic diameter of <0.1 microns or less (i.e., ≤0.1 millionths of a meter or <0.000004 inch) have human health implications because their toxic components may initiate or facilitate biological processes that may lead to adverse effects to the heart, lungs, and other organs (South Coast AQMD 2013). However, the US EPA and the California Air Resources Board (CARB) have not adopted AAQS to regulate these particulates. Diesel particulate matter is classified by CARB as a carcinogen (CARB 1998). Particulate matter can also cause environmental effects such as visibility impairment,1 environmental damage,2 and aesthetic damage3 (South Coast AQMD 2005; US EPA 2022). The SoCAB is a nonattainment area for PM2.5 under California and National AAQS and a nonattainment area for PM10 under the California AAQS (CARB 2022a).4
Ozone, or O3, is a key ingredient of “smog” and is a gas that is formed when VOCs and NOX, both by-products of internal combustion engine exhaust, undergo photochemical reactions in sunlight. O3 is a secondary criteria air pollutant. O3 concentrations are generally highest during the summer months when direct sunlight, light winds, and warm temperatures create favorable conditions for its formation. O3 poses a health threat to those who already suffer from respiratory diseases as well as to healthy people. Breathing O3 can trigger a variety of health problems, including chest pain, coughing, throat irritation, and congestion. It can worsen bronchitis, emphysema, and asthma. Ground-level O3 also can reduce lung function and inflame the linings of the lungs. Repeated exposure may permanently scar lung tissue. O3 also affects sensitive vegetation and ecosystems, including forests, parks, wildlife refuges, and wilderness areas. In particular, O3 harms sensitive vegetation during the growing season (South Coast AQMD 2005; US EPA 2022). The SoCAB is designated extreme nonattainment under the California AAQS (1-hour and 8-hour) and National AAQS (8-hour) (CARB 2022a).
Lead (Pb) is a metal found naturally in the environment as well as in manufactured products. Once taken into the body, lead distributes throughout the body in the blood and accumulates in the bones. Depending on the level of exposure, lead can adversely affect the nervous system, kidney function, immune system, reproductive and developmental systems, and the cardiovascular system. Lead exposure also affects the oxygen-carrying capacity of the blood. The effects of lead most commonly encountered in current
1 PM2.5 is the main cause of reduced visibility (haze) in parts of the United States. 2 Particulate matter can be carried over long distances by wind and then settle on ground or water, making lakes and streams acidic;
changing the nutrient balance in coastal waters and large river basins; depleting the nutrients in soil; damaging sensitive forests and farm crops; and affecting the diversity of ecosystems.
3 Particulate matter can stain and damage stone and other materials, including culturally important objects such as statues and monuments.
4 CARB approved the South Coast AQMD’s request to redesignate the SoCAB from serious nonattainment for PM10 to attainment for PM10 under the National AAQS on March 25, 2010, because the SoCAB did not violate federal 24-hour PM10 standards from 2004 to 2007. The EPA approved the State of California’s request to redesignate the South Coast PM10 nonattainment area to attainment of the PM10 National AAQS, effective on July 26, 2013.
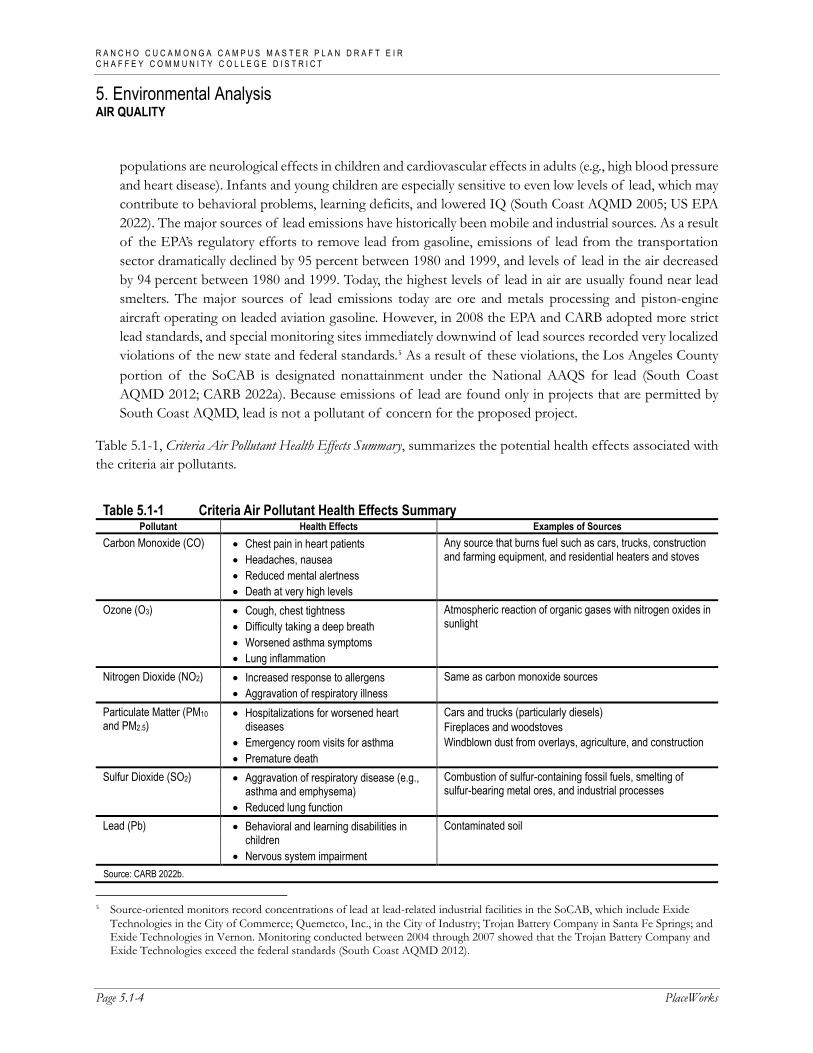
R A N C H O C U C A M O N G A C A M P U S M A S T E R P L A N D R A F T E I R C H A F F E Y C O M M U N I T Y C O L L E G E D I S T R I C T
5. Environmental Analysis AIR QUALITY
Page 5.1-4 PlaceWorks
populations are neurological effects in children and cardiovascular effects in adults (e.g., high blood pressure and heart disease). Infants and young children are especially sensitive to even low levels of lead, which may contribute to behavioral problems, learning deficits, and lowered IQ (South Coast AQMD 2005; US EPA 2022). The major sources of lead emissions have historically been mobile and industrial sources. As a result of the EPA’s regulatory efforts to remove lead from gasoline, emissions of lead from the transportation sector dramatically declined by 95 percent between 1980 and 1999, and levels of lead in the air decreased by 94 percent between 1980 and 1999. Today, the highest levels of lead in air are usually found near lead smelters. The major sources of lead emissions today are ore and metals processing and piston-engine aircraft operating on leaded aviation gasoline. However, in 2008 the EPA and CARB adopted more strict lead standards, and special monitoring sites immediately downwind of lead sources recorded very localized violations of the new state and federal standards.5 As a result of these violations, the Los Angeles County portion of the SoCAB is designated nonattainment under the National AAQS for lead (South Coast AQMD 2012; CARB 2022a). Because emissions of lead are found only in projects that are permitted by South Coast AQMD, lead is not a pollutant of concern for the proposed project.
Table 5.1-1, Criteria Air Pollutant Health Effects Summary, summarizes the potential health effects associated with the criteria air pollutants.
Table 5.1-1 Criteria Air Pollutant Health Effects Summary Pollutant Health Effects Examples of Sources
Carbon Monoxide (CO) • Chest pain in heart patients • Headaches, nausea • Reduced mental alertness • Death at very high levels
Any source that burns fuel such as cars, trucks, construction and farming equipment, and residential heaters and stoves
Ozone (O3) • Cough, chest tightness • Difficulty taking a deep breath • Worsened asthma symptoms • Lung inflammation
Atmospheric reaction of organic gases with nitrogen oxides in sunlight
Nitrogen Dioxide (NO2) • Increased response to allergens • Aggravation of respiratory illness
Same as carbon monoxide sources
Particulate Matter (PM10 and PM2.5)
• Hospitalizations for worsened heart diseases
• Emergency room visits for asthma • Premature death
Cars and trucks (particularly diesels) Fireplaces and woodstoves Windblown dust from overlays, agriculture, and construction
Sulfur Dioxide (SO2) • Aggravation of respiratory disease (e.g., asthma and emphysema)
• Reduced lung function
Combustion of sulfur-containing fossil fuels, smelting of sulfur-bearing metal ores, and industrial processes
Lead (Pb) • Behavioral and learning disabilities in children
• Nervous system impairment
Contaminated soil
Source: CARB 2022b.
5 Source-oriented monitors record concentrations of lead at lead-related industrial facilities in the SoCAB, which include Exide
Technologies in the City of Commerce; Quemetco, Inc., in the City of Industry; Trojan Battery Company in Santa Fe Springs; and Exide Technologies in Vernon. Monitoring conducted between 2004 through 2007 showed that the Trojan Battery Company and Exide Technologies exceed the federal standards (South Coast AQMD 2012).
R A N C H O C U C A M O N G A C A M P U S M A S T E R P L A N D R A F T E I R C H A F F E Y C O M M U N I T Y C O L L E G E D I S T R I C T
5. Environmental Analysis AIR QUALITY
April 2022 Page 5.1-5
Toxic Air Contaminants
People exposed to toxic air contaminants (TACs) at sufficient concentrations and durations may have an increased chance of getting cancer or experiencing other serious health effects. These health effects can include damage to the immune system as well as neurological, reproductive (e.g., reduced fertility), developmental, respiratory, and other health problems (US EPA 2022b). By the last update to the TAC list in December 1999, CARB had designated 244 compounds as TACs (CARB 1999). Additionally, CARB has implemented control measures for a number of compounds that pose high risks and show potential for effective control. There are no air quality standards for TACs. Instead, TAC impacts are evaluated by calculating the health risks associated with a given exposure. The majority of the estimated health risks from TACs can be attributed to relatively few compounds, the most relevant to the proposed project being particulate matter from diesel-fueled engines.
Diesel Particulate Matter
In 1998, CARB identified diesel particulate matter (DPM) as a TAC. Previously, the individual chemical compounds in diesel exhaust were considered TACs. Almost all diesel exhaust particles are 10 microns or less in diameter. Because of their extremely small size, these particles can be inhaled and eventually trapped in the bronchial and alveolar regions of the lungs. Long-term (chronic) inhalation of DPM is likely a lung cancer risk. Short-term (i.e., acute) exposure can cause irritation and inflammatory systems and may exacerbate existing allergies and asthma systems (US EPA 2002).
5.1.1.2 REGULATORY BACKGROUND
Ambient air quality standards (AAQS) have been adopted at the state and federal levels for criteria air pollutants. In addition, both the state and federal government regulate the release of TACs. The proposed project is in the SoCAB and is subject to the rules and regulations imposed by the South Coast AQMD, the California AAQS adopted by CARB, and National AAQS adopted by the US EPA. Federal, state, regional, and local laws, regulations, plans, or guidelines that are potentially applicable to the proposed project are summarized in this section.
Federal and State
Ambient Air Quality Standards
The Clean Air Act (CAA) was passed in 1963 by the US Congress and has been amended several times. The 1970 CAA amendments strengthened previous legislation and laid the foundation for the regulatory scheme of the 1970s and 1980s. In 1977, Congress again added several provisions, including nonattainment requirements for areas not meeting National AAQS and the Prevention of Significant Deterioration program. The 1990 amendments represent the latest in a series of federal efforts to regulate the protection of air quality in the United States. The CAA allows states to adopt more stringent standards or to include other pollution species. The California Clean Air Act, signed into law in 1988, requires all areas of the state to achieve and maintain the California AAQS by the earliest practical date. The California AAQS tend to be more restrictive than the National AAQS.

R A N C H O C U C A M O N G A C A M P U S M A S T E R P L A N D R A F T E I R C H A F F E Y C O M M U N I T Y C O L L E G E D I S T R I C T
5. Environmental Analysis AIR QUALITY
Page 5.1-6 PlaceWorks
The National and California AAQS are the levels of air quality considered to provide a margin of safety in the protection of the public health and welfare. They are designed to protect “sensitive receptors” most susceptible to further respiratory distress, such as asthmatics, the elderly, very young children, people already weakened by other disease or illness, and persons engaged in strenuous work or exercise. Healthy adults can tolerate occasional exposure to air pollutant concentrations considerably above these minimum standards before adverse effects are observed.
Both California and the federal government have established health-based AAQS for seven air pollutants, which are shown in Table 5.1-2, Ambient Air Quality Standards for Criteria Air Pollutants. These pollutants are O3), NO2, CO, SO2, PM10, PM2.5, and Pb. In addition, the state has set standards for sulfates, hydrogen sulfide, vinyl chloride, and visibility-reducing particles. These standards are designed to protect the health and welfare of the populace with a reasonable margin of safety.
Table 5.1-2 Ambient Air Quality Standards for Criteria Air Pollutants
Pollutant Averaging Time California Standard1
Federal Primary Standard2 Major Pollutant Sources
Ozone (O3)3 1 hour 0.09 ppm * Motor vehicles, paints, coatings, and solvents. 8 hours 0.070 ppm 0.070 ppm
Carbon Monoxide (CO) 1 hour 20 ppm 35 ppm Internal combustion engines, primarily gasoline-powered motor vehicles.
8 hours 9.0 ppm 9 ppm
Nitrogen Dioxide (NO2) Annual Arithmetic Mean
0.030 ppm 0.053 ppm Motor vehicles, petroleum-refining operations, industrial sources, aircraft, ships, and railroads.
1 hour 0.18 ppm 0.100 ppm
Sulfur Dioxide (SO2) Annual Arithmetic Mean
* 0.030 ppm Fuel combustion, chemical plants, sulfur recovery plants, and metal processing.
1 hour 0.25 ppm 0.075 ppm
24 hours 0.04 ppm 0.14 ppm
Respirable Coarse Particulate Matter (PM10)
Annual Arithmetic Mean
20 µg/m3 * Dust and fume-producing construction, industrial, and agricultural operations, combustion, atmospheric photochemical reactions, and natural activities (e.g., wind-raised dust and ocean sprays).
24 hours 50 µg/m3 150 µg/m3
Respirable Fine Particulate Matter (PM2.5)4
Annual Arithmetic Mean
12 µg/m3 12 µg/m3 Dust and fume-producing construction, industrial, and agricultural operations, combustion, atmospheric photochemical reactions, and natural activities (e.g., wind-raised dust and ocean sprays).
24 hours * 35 µg/m3

R A N C H O C U C A M O N G A C A M P U S M A S T E R P L A N D R A F T E I R C H A F F E Y C O M M U N I T Y C O L L E G E D I S T R I C T
5. Environmental Analysis AIR QUALITY
April 2022 Page 5.1-7
Table 5.1-2 Ambient Air Quality Standards for Criteria Air Pollutants
Pollutant Averaging Time California Standard1
Federal Primary Standard2 Major Pollutant Sources
Lead (Pb) 30-Day Average 1.5 µg/m3 * Present source: lead smelters, battery manufacturing & recycling facilities. Past source: combustion of leaded gasoline. Calendar Quarter * 1.5 µg/m3
Rolling 3-Month Average
* 0.15 µg/m3
Sulfates (SO4)5 24 hours 25 µg/m3 * Industrial processes.
Visibility-Reducing Particles
8 hours ExCo =0.23/km visibility of 10≥
miles
No Federal Standard
Visibility-reducing particles consist of suspended particulate matter, which is a complex mixture of tiny particles that consists of dry solid fragments, solid cores with liquid coatings, and small droplets of liquid. These particles vary greatly in shape, size and chemical composition, and can be made up of many different materials such as metals, soot, soil, dust, and salt.
Hydrogen Sulfide 1 hour 0.03 ppm No Federal Standard
Hydrogen sulfide (H2S) is a colorless gas with the odor of rotten eggs. It is formed during bacterial decomposition of sulfur-containing organic substances. Also, it can be present in sewer gas and some natural gas, and can be emitted as the result of geothermal energy exploitation.
Vinyl Chloride 24 hours 0.01 ppm No Federal Standard
Vinyl chloride (chloroethene), a chlorinated hydrocarbon, is a colorless gas with a mild, sweet odor. Most vinyl chloride is used to make polyvinyl chloride (PVC) plastic and vinyl products. Vinyl chloride has been detected near landfills, sewage plants, and hazardous waste sites, due to microbial breakdown of chlorinated solvents.
Source: CARB 2016. Notes: ppm: parts per million; μg/m3: micrograms per cubic meter * Standard has not been established for this pollutant/duration by this entity. 1 California standards for O3, CO (except 8-hour Lake Tahoe), SO2 (1 and 24 hour), NO2, and particulate matter (PM10, PM2.5, and visibility reducing particles), are
values that are not to be exceeded. All others are not to be equaled or exceeded. California ambient air quality standards are listed in the Table of Standards in Section 70200 of Title 17 of the California Code of Regulations.
2 National standards (other than O3, PM, and those based on annual arithmetic mean) are not to be exceeded more than once a year. The O3 standard is attained when the fourth highest 8-hour concentration measured at each site in a year, averaged over three years, is equal to or less than the standard. For PM10, the 24-hour standard is attained when the expected number of days per calendar year with a 24-hour average concentration above 150 µg/m3 is equal to or less than one. For PM2.5, the 24-hour standard is attained when 98 percent of the daily concentrations, averaged over three years, are equal to or less than the standard.
3 On October 1, 2015, the national 8-hour ozone primary and secondary standards were lowered from 0.075 to 0.070 ppm. 4 On December 14, 2012, the national annual PM2.5 primary standard was lowered from 15 μg/m3 to 12.0 µg/m3. The existing national 24-hour PM2.5 standards
(primary and secondary) were retained at 35 µg/m3, as was the annual secondary standard of 15 µg/m3. The existing 24-hour PM10 standards (primary and secondary) of 150 µg/m3 also were retained. The form of the annual primary and secondary standards is the annual mean, averaged over 3 years.
5 On June 2, 2010, a new 1-hour SO2 standard was established and the existing 24-hour and annual primary standards were revoked. The 1-hour national standard is in units of parts per billion (ppb). California standards are in units of parts per million (ppm). To directly compare the 1-hour national standard to the California standard the units can be converted to ppm. In this case, the national standard of 75 ppb is identical to 0.075 ppm.
R A N C H O C U C A M O N G A C A M P U S M A S T E R P L A N D R A F T E I R C H A F F E Y C O M M U N I T Y C O L L E G E D I S T R I C T
5. Environmental Analysis AIR QUALITY
Page 5.1-8 PlaceWorks
California has also adopted a host of other regulations that reduce criteria pollutant emissions:
Assembly Bill (AB) 1493: Pavley Fuel Efficiency Standards. Pavley I is a clean-car standard that reduces greenhouse gas (GHG) emissions from new passenger vehicles (light-duty auto to medium-duty vehicles) from 2009 through 2016. In January 2012, CARB approved the Advanced Clean Cars program (formerly known as Pavley II) for model years 2017 through 2025.
Senate Bill (SB) 1078 and SB 107: Renewables Portfolio Standards. A major component of California’s Renewable Energy Program is the renewables portfolio standard (RPS) established under SB 1078 (Sher) and SB 107 (Simitian). Under the RPS, certain retail sellers of electricity were required to increase the amount of renewable energy each year by at least 1 percent to reach at least 20 percent by December 30, 2010.
20 California Code of Regulations (CCR): Appliance Energy Efficiency Standards. The 2006 Appliance Efficiency Regulations (20 CCR sections 1601–1608) were adopted by the California Energy Commission on October 11, 2006, and approved by the California Office of Administrative Law on December 14, 2006. The regulations include standards for both federally regulated appliances and non–federally regulated appliances.
24 CCR, Part 6: Building and Energy Efficiency Standards. Energy conservation standards for new residential and nonresidential buildings adopted by the California Energy Resources Conservation and Development Commission (now the California Energy Commission) in June 1977.
24 CCR, Part 11: Green Building Standards Code. Establishes planning and design standards for sustainable site development, energy efficiency (in excess of the California Energy Code requirements), water conservation, material conservation, and internal air contaminants.6
Tanner Air Toxics Act and Air Toxics Hot Spot Information and Assessment Act
Public exposure to TACs is a significant environmental health issue in California. In 1983, the California legislature enacted a program to identify the health effects of TACs and reduce exposure to them. The California Health and Safety Code defines a TAC as “an air pollutant which may cause or contribute to an increase in mortality or in serious illness, or which may pose a present or potential hazard to human health” (17 CCR section 93000). A substance that is listed as a hazardous air pollutant pursuant to section 112(b) of the federal Clean Air Act (42 US Code section 7412[b]) is a TAC. Under state law, the California Environmental Protection Agency (Cal EPA), acting through CARB, is authorized to identify a substance as a TAC if it is an air pollutant that may cause or contribute to an increase in mortality or serious illness, or may pose a present or potential hazard to human health.
California regulates TACs primarily through AB 1807 (Tanner Air Toxics Act) and AB 2588 (Air Toxics “Hot Spot” Information and Assessment Act of 1987). The Tanner Air Toxics Act set up a formal procedure for CARB to designate substances as TACs. Once a TAC is identified, CARB adopts an “airborne toxics control
6 The green building standards became mandatory in the 2010 edition of the code.

R A N C H O C U C A M O N G A C A M P U S M A S T E R P L A N D R A F T E I R C H A F F E Y C O M M U N I T Y C O L L E G E D I S T R I C T
5. Environmental Analysis AIR QUALITY
April 2022 Page 5.1-9
measure” for sources that emit that TAC. If there is a safe threshold for a substance (i.e., a point below which there is no toxic effect), the control measure must reduce exposure to below that threshold. If there is no safe threshold, the measure must incorporate “toxics best available control technology” to minimize emissions. To date, CARB has established formal control measures for 11 TACs that are identified as having no safe threshold.
Under AB 2588, TAC emissions from individual facilities are quantified and prioritized by the air quality management district or air pollution control district. High-priority facilities are required to perform a health risk assessment, and if specific thresholds are exceeded, are required to communicate the results to the public through notices and public meetings.
CARB has promulgated the following specific rules to limit TAC emissions:
13 CCR Chapter 10 section 2485: Airborne Toxic Control Measure to Limit Diesel-Fueled Commercial Motor Vehicle Idling. Generally restricts on-road diesel-powered commercial motor vehicles with a gross vehicle weight rating of greater than 10,000 pounds from idling more than five minutes.
13 CCR Chapter 10 section 2480: Airborne Toxic Control Measure to Limit School Bus Idling and Idling at Schools. Generally restricts a school bus or transit bus from idling for more than five minutes when within 100 feet of a school.
13 CCR section 2477 and Article 8: Airborne Toxic Control Measure for In-Use Diesel-Fueled Transport Refrigeration Units (TRU) and TRU Generator Sets and Facilities Where TRUs Operate. Regulations established to control emissions associated with diesel-powered TRUs.
Regional
Air Quality Management Planning
South Coast AQMD is the agency responsible for improving air quality in the SoCAB and ensuring that the National and California AAQS are attained and maintained. South Coast AQMD is responsible for preparing the air quality management plan (AQMP) for the SoCAB in coordination with the Southern California Association of Governments (SCAG). Since 1979, a number of AQMPs have been prepared.
2016 AQMP
On March 3, 2017, South Coast AQMD adopted the 2016 AQMP, which serves as an update to the 2012 AQMP. The 2016 AQMP addresses strategies and measures to attain the following National AAQS:
2008 National 8-hour ozone standard by 2031 2012 National annual PM2.5 standard by 20257
2006 National 24-hour PM2.5 standard by 2019
7 The 2016 AQMP requests a reclassification from moderate to serious nonattainment for the 2012 National PM2.5 standard.
R A N C H O C U C A M O N G A C A M P U S M A S T E R P L A N D R A F T E I R C H A F F E Y C O M M U N I T Y C O L L E G E D I S T R I C T
5. Environmental Analysis AIR QUALITY
Page 5.1-10 PlaceWorks
1997 National 8-hour ozone standard by 2023 1979 National 1-hour ozone standard by 2022
It is projected that total NOX emissions in the SoCAB would need to be reduced to 150 tons per day (tpd) by year 2023 and to 100 tpd in year 2031 to meet the 1997 and 2008 federal 8-hour ozone standards. The strategy to meet the 1997 federal 8-hour ozone standard would also lead to attaining the 1979 federal 1-hour ozone standard by year 2022 (South Coast AQMD 2017), which requires reducing NOX emissions in the SoCAB to 250 tpd. This is approximately 45 percent additional reductions above existing regulations for the 2023 ozone standard and 55 percent additional reductions to existing regulations to meet the 2031 ozone standard.
Reducing NOX emissions would also reduce PM2.5 concentrations in the SoCAB. However, because the goal is to meet the 2012 federal annual PM2.5 standard no later than year 2025, South Coast AQMD is seeking to reclassify the SoCAB from “moderate” to “serious” nonattainment under this federal standard. A “moderate” nonattainment would require meeting the 2012 federal standard by no later than 2021.
Overall, the 2016 AQMP is composed of stationary and mobile-source emission reductions from regulatory control measures, incentive-based programs, co-benefits from climate programs, mobile-source strategies, and reductions from federal sources, such as aircrafts, locomotives, and ocean-going vessels. Strategies outlined in the 2016 AQMP would be implemented in collaboration between CARB and the EPA (South Coast AQMD 2017).
Lead Implementation Plan
In 2008, the EPA designated the Los Angeles County portion of the SoCAB as a nonattainment area under the federal lead (Pb) classification because of the addition of source-specific monitoring under the new federal regulation. This designation was based on two source-specific monitors in the City of Vernon and the City of Industry that exceeded the new standard in the 2007 to 2009 period. The remainder of the SoCAB, outside the Los Angeles County nonattainment area, remains in attainment of the new 2008 lead standard. On May 24, 2012, CARB approved the State Implementation Plan (SIP) revision for the federal lead standard, which the EPA revised in 2008. Lead concentrations in this nonattainment area have been below the level of the federal standard since December 2011. The SIP revision was submitted to the EPA for approval.
South Coast AQMD Rules and Regulations
All projects are subject to South Coast AQMD rules and regulations in effect at the time of activity, including:
Rule 401, Visible Emissions. This rule is intended to prevent the discharge of pollutant emissions from an emissions source that results in visible emissions. Specifically, the rule prohibits the discharge of any air contaminant into the atmosphere by a person from any single source of emission for a period or periods aggregating more than three minutes in any one hour that is as dark as or darker than designated No. 1 on the Ringelmann Chart, as published by the US Bureau of Mines.
Rule 402, Nuisance. This rule is intended to prevent the discharge of pollutant emissions from an emissions source that results in a public nuisance. Specifically, this rule prohibits any person from discharging quantities of air contaminants or other material from any source such that it would result in an

R A N C H O C U C A M O N G A C A M P U S M A S T E R P L A N D R A F T E I R C H A F F E Y C O M M U N I T Y C O L L E G E D I S T R I C T
5. Environmental Analysis AIR QUALITY
April 2022 Page 5.1-11
injury, detriment, nuisance, or annoyance to any considerable number of persons or to the public. Additionally, the discharge of air contaminants would also be prohibited where it would endanger the comfort, repose, health, or safety of any number of persons or the public, or that cause, or have a natural tendency to cause, injury or damage to business or property. This rule does not apply to odors emanating from agricultural operations necessary for the growing of crops or the raising of fowl or animals.
Rule 403, Fugitive Dust. This rule is intended to reduce the amount of particulate matter entrained in the ambient air as a result of anthropogenic (human-made) fugitive dust sources by requiring actions to prevent, reduce, or mitigate fugitive dust emissions. Rule 403 applies to any activity or human-made condition capable of generating fugitive dust and requires best available control measures to be applied to earth-moving and grading activities.
Rule 445, Wood Burning Devices. In general, the rule prohibits new developments from the installation of wood-burning devices. This rule is intended to reduce the emission of particulate matter from wood-burning devices and applies to manufacturers and sellers of wood-burning devices, commercial sellers of firewood, and property owners and tenants that operate a wood-burning device.
Rule 1113, Architectural Coatings. This rule serves to limit the VOCs content of architectural coatings used on projects in the South Coast AQMD. Any person who supplies, sells, offers for sale, or manufactures any architectural coating for use on projects in the South Coast AQMD must comply with the current VOC standards set in this rule.
Rule 1403, Asbestos Emissions from Demolition/Renovation Activities. The purpose of this rule is to specify work practice requirements to limit asbestos emissions from building demolition and renovation activities, including the removal and associated disturbance of asbestos-containing materials (ACM). The requirements for demolition and renovation activities include asbestos surveying, notification, ACM removal procedures and time schedules, ACM handling and clean-up procedures, and storage, disposal, and landfilling requirements for asbestos-containing waste materials. All operators are required to maintain records, including waste shipment records, and are required to use appropriate warning labels, signs, and markings.
5.1.1.3 EXISTING CONDITIONS
The project site is in the SoCAB, which includes the non-desert portions of San Bernardino, Los Angeles, and Riverside Counties and all of Orange County. The SoCAB is in a coastal plain with connecting broad valleys and low hills and is bounded by the Pacific Ocean in the southwest quadrant, with high mountains forming the remainder of the perimeter. The region lies in the semi-permanent high-pressure zone of the eastern Pacific. As a result, the climate is mild, tempered by cool sea breezes. This usually mild weather pattern is interrupted infrequently by periods of extremely hot weather, winter storms, and Santa Ana winds (South Coast AQMD 2005).

R A N C H O C U C A M O N G A C A M P U S M A S T E R P L A N D R A F T E I R C H A F F E Y C O M M U N I T Y C O L L E G E D I S T R I C T
5. Environmental Analysis AIR QUALITY
Page 5.1-12 PlaceWorks
Meteorology
Temperature and Precipitation
The annual average temperature varies little throughout the SoCAB, ranging from the low to middle 60s, measured in degrees Fahrenheit (°F). With a more pronounced oceanic influence, coastal areas show less variability in annual minimum and maximum temperatures than inland areas. The lowest average temperature for the City of Rancho Cucamonga is 36°F in December, and the highest average temperature is 95°Fahrenheit (°F) in August (USA.com 2022). Overall mean average temperature for the City is 63°F (USA.com 2022).
In contrast to a very steady pattern of temperature, rainfall is seasonally and annually highly variable. Almost all rain falls from November through April. Rainfall historically averages 23.94 inches per year in the City (USA.com 2022).
Humidity
Although the SoCAB has a semiarid climate, the air near the Earth’s surface is typically moist because of a shallow marine layer. This “ocean effect” is dominant except for infrequent periods when dry, continental air is brought into the SoCAB by offshore winds. Periods of heavy fog are frequent, given the Project Site’s location along the coast. Low clouds, often referred to as high fog, are a characteristic climatic feature. Annual average humidity is 70 percent at the coast and 57 percent in the eastern portions of the SoCAB (South Coast AQMD 2005).
Wind
Wind patterns across the southern coastal region are characterized by westerly or southwesterly onshore winds during the day and easterly or northeasterly breezes at night. Wind speed is somewhat greater during the dry summer months than during the rainy winter season.
Between periods of wind, periods of air stagnation may occur in the morning and evening hours. Air stagnation is one of the critical determinants of air quality conditions on any given day. During the winter and fall months, surface high-pressure systems over the SoCAB combined with other meteorological conditions can result in very strong, downslope Santa Ana winds. These winds normally continue a few days before predominant meteorological conditions are reestablished.
The mountain ranges to the east inhibit the eastward transport and diffusion of pollutants. Air quality in the SoCAB generally ranges from fair to poor and is similar to air quality in most of coastal Southern California. The entire region experiences heavy concentrations of air pollutants during prolonged periods of stable atmospheric conditions (South Coast AQMD 2005).
Inversions
In conjunction with the two characteristic wind patterns that affect the rate and orientation of horizontal pollutant transport, two distinct types of temperature inversions control the vertical depth through which pollutants are mixed. These inversions are the marine/subsidence inversion and the radiation inversion. The

R A N C H O C U C A M O N G A C A M P U S M A S T E R P L A N D R A F T E I R C H A F F E Y C O M M U N I T Y C O L L E G E D I S T R I C T
5. Environmental Analysis AIR QUALITY
April 2022 Page 5.1-13
height of the base of the inversion at any given time is known as the “mixing height.” The combination of winds and inversions are critical determinants in leading to the highly degraded air quality in summer and the generally good air quality in the winter in the project area (South Coast AQMD 2005).
SoCAB Nonattainment Areas
The AQMP provides the framework for air quality basins to achieve attainment of the state and federal ambient air quality standards through the SIP. Areas are classified as attainment or nonattainment areas for particular pollutants depending on whether they meet the AAQS. Severity classifications for ozone nonattainment range in magnitude from marginal, moderate, and serious to severe and extreme.
Unclassified. A pollutant is designated unclassified if the data are incomplete and do not support a designation of attainment or nonattainment.
Attainment. A pollutant is in attainment if the AAQS for that pollutant was not violated at any site in the area during a three-year period.
Nonattainment. A pollutant is in nonattainment if there was at least one violation of an AAQS for that pollutant in the area.
Nonattainment/Transitional. A subcategory of the nonattainment designation. An area is designated nonattainment/transitional to signify that the area is close to attaining the AAQS for that pollutant.
The attainment status for the SoCAB is shown in Table 5.1-3, Attainment Status of Criteria Air Pollutants in the South Coast Air Basin.
Table 5.1-3 Attainment Status of Criteria Air Pollutants in the South Coast Air Basin Pollutant State Federal
Ozone – 1-hour Extreme Nonattainment No Federal Standard
Ozone – 8-hour Extreme Nonattainment Extreme Nonattainment PM10 Serious Nonattainment Attainment PM2.5 Nonattainment Nonattainment CO Attainment Attainment NO2 Attainment Attainment/Maintenance
SO2 Attainment Attainment Lead Attainment Nonattainment (Los Angeles County only )1
All others Attainment/Unclassified Attainment/Unclassified Source: CARB 2022a. 1 In 2010, the Los Angeles portion of the SoCAB was designated nonattainment for lead under the new 2008 federal AAQS as a result of large industrial emitters.
Remaining areas in the SoCAB are unclassified.
Multiple Air Toxics Exposure Study V
The Multiple Air Toxics Exposure Study (MATES) is a monitoring and evaluation study on existing ambient concentrations of TACs and the potential health risks from air toxics in the SoCAB. In April 2021, South Coast

R A N C H O C U C A M O N G A C A M P U S M A S T E R P L A N D R A F T E I R C H A F F E Y C O M M U N I T Y C O L L E G E D I S T R I C T
5. Environmental Analysis AIR QUALITY
Page 5.1-14 PlaceWorks
AQMD released the latest update to the MATES study, MATES V. The first MATES analysis, MATES I, began in 1986 but was limited because of the technology available at the time. Conducted in 1998, MATES II was the first MATES iteration to include a comprehensive monitoring program, an air toxics emissions inventory, and a modeling component. MATES III was conducted in 2004 to 2006, with MATES IV following in 2012 to 2013.
MATES V uses measurements taken during 2018 and 2019, with a comprehensive modeling analysis and emissions inventory based on 2018 data. The previous MATES studies quantified the cancer risks based on the inhalation pathway only. MATES V includes information on the chronic noncancer risks from inhalation and non-inhalation pathways for the first time. Cancer risks and chronic noncancer risks from MATES II through IV measurements have been re-examined using current Office of Environmental Health Hazards Assessment (OEHHA) and CalEPA risk assessment methodologies and modern statistical methods to examine the trends over time.
The MATES V study showed that cancer risk in the SoCAB decreased to 454 in a million from 997 in a million in the MATES IV study. Overall, air toxics cancer risk in the SoCAB decreased by 54 percent since 2012 when MATES IV was conducted. MATES V showed the highest risk locations near the Los Angeles International Airport and the Ports of Long Beach and Los Angeles. Diesel particulate matter continues to be the major contributor to air toxics cancer risk (approximately 72 percent of the total cancer risk). Goods movement and transportation corridors have the highest cancer risk. Transportation sources account for 88 percent of carcinogenic air toxics emissions, and the remainder is from stationary sources, which include large industrial operations such as refineries and power plants as well as smaller businesses such as gas stations and chrome-plating facilities. (South Coast AQMD 2021).
Existing Ambient Air Quality
Existing levels of ambient air quality and historical trends and projections in the vicinity of the project site are best documented by measurements taken by the South Coast AQMD. The proposed project is located within Source Receptor Area (SRA) 32: Northwest San Bernardino Valley.8 The air quality monitoring stations closest to the proposed project is the Upland Monitoring Station (O3, NO2, and PM10) and the Fontana – Arrow Highway Monitoring Station (PM2.5).9 Data from these two stations is summarized in Table 5.1-4, Ambient Air Quality Monitoring Summary. The data show regular violations of the state and federal O3, federal PM10, and federal PM2.5 standards in the last five years.
8 Per South Coast AQMD Rule 701, an SRA is defined as: “A source area is that area in which contaminants are discharged and a
receptor area is that area in which the contaminants accumulate and are measured. Any of the areas can be a source area, a receptor area, or both a source and receptor area.” There are 37 SRAs in the South Coast AQMD’s jurisdiction.
9 Locations of the SRAs and monitoring stations are shown here: http://www.aqmd.gov/docs/default-source/default-document-library/map-of-monitoring-areas.pdf.

R A N C H O C U C A M O N G A C A M P U S M A S T E R P L A N D R A F T E I R C H A F F E Y C O M M U N I T Y C O L L E G E D I S T R I C T
5. Environmental Analysis AIR QUALITY
April 2022 Page 5.1-15
Table 5.1-4 Ambient Air Quality Monitoring Summary
Pollutant/Standard1 Number of Days Thresholds Were Exceeded and Maximum Levels
2016 2017 2018 2019 2020 Ozone (O3)2
State 1-Hour ≥ 0.09 ppm (days exceed threshold) State 8-hour ≥ 0.07 ppm (days exceed threshold) Federal 8-Hour > 0.075 ppm (days exceed threshold)
Max. 1-Hour Conc. (ppm) Max. 8-Hour Conc. (ppm)
53 65 89
0.156 0.111
66 72 89
0.141 0.112
25 32 54
0.133 0.106
31 34 54
0.115 0097
82 89 118
0.152 0.116
Nitrogen Dioxide (NO2)2
State 1-Hour ≥ 0.18 ppm (days exceed threshold) Max. 1-Hour Conc. (ppm)
0 0.0701
0 0.0641
0 0.0587
0 0.0579
0 0.0554
Coarse Particulates (PM10)2
State 24-Hour > 50 µg/m3 (days exceed threshold) Federal 24-Hour > 150 µg/m3 (days exceed threshold) Max. 24-Hour Conc. (µg/m3)
* 1
184
* 0
106.5
* 1
156.6
* *
125.9
* 1
174.8 Fine Particulates (PM2.5)3
Federal 24-Hour > 35 µg/m3 (days exceed threshold)
Max. 24-Hour Conc. (µg/m3) 1
58.8 1
39.2 0
29.2 3
81.3 4
57.6 Source: CARB 2022c. Notes: ppm = parts per million; ppb = parts per billion; µg/m3 = micrograms per cubic meter; * = Data not available 1 The CARB iADAM Air Quality Data Statistics does not provide data for lead. 2 Data obtained from the Upland Monitoring Station for O3, NO2, and PM10. 3 Data obtained from the Fontana – Arrow Highway Monitoring Station for PM2.5.
Existing Emissions
The existing college campus currently generates criteria air pollutant emissions from natural gas use for energy, heating, vehicle trips associated with students, employees, vendors, and visitors, and area sources such as landscaping equipment and consumer cleaning products. Table 5.1-5, Existing Criteria Air Pollutant Emissions, summarizes emissions associated with the daily operations of these existing land uses under baseline year (year 2021) and buildout year (year 2051) conditions. The Year 2021 inventory represents the projected emissions generated currently by the existing land uses based on calendar year 2021 emission factors for on-road vehicles. The Buildout Year inventory represents the projected emissions that the existing land uses would generate in the future buildout year. For purposes of this analysis, because CalEEMod only includes on-road vehicle emissions data up to year 2050, the vehicle emissions data for 2050 is used. In general, vehicle emission rates decrease each passing year due to the assumption that older vehicles are replaced by newer cleaner vehicles. Thus, based on this general trend, use of year 2050 emissions data would be either similar to, or slightly higher (i.e., more conservative) compared to year 2051 emissions data if it was available. To isolate the impacts related to the changes proposed, the net change in emissions related to implementation of the proposed project is based on the difference in emissions generated by the existing and proposed conditions under buildout year conditions. This approach is taken as existing uses would be subject to regulations that come into effect in the future that reduce mobile-source emissions. Thus, the level of emissions the existing uses generate today would not be generated in perpetuity, but would be affected by these state regulations.

R A N C H O C U C A M O N G A C A M P U S M A S T E R P L A N D R A F T E I R C H A F F E Y C O M M U N I T Y C O L L E G E D I S T R I C T
5. Environmental Analysis AIR QUALITY
Page 5.1-16 PlaceWorks
Table 5.1-5 Existing Criteria Air Pollutant Emissions
Phase Operation-Related Regional Emissions (pounds/day)1
VOC NOX CO SO2 PM10 PM2.5
Year 2021
Area 13 <1 <1 0 <1 <1
Energy2 <1 3 2 <1 <1 <1
Mobile 70 68 671 1 121 33
Total 84 71 674 1 121 33
Buildout Year
Area 13 <1 <1 0 <1 <1
Energy2 <1 3 2 <1 <1 <1
Mobile3 34 20 358 1 120 32
Total 47 23 360 1 120 32 Sources: CalEEMod Version 2020.4.0. Notes: Based on highest winter or summer emissions. 1 Includes only those pollutants in which South Coast AQMD have established regional significance thresholds and that are applicable. Thus, emissions data for ozone
and lead are omitted. Additionally, because the proposed project does not involve a large permitted industrial project where South Coast AQMD is the lead agency, lead (Pb) is not a pollutant of concern.
2 Utilizes CalEEMod historical energy rates, which are based on the 2005 Building Energy Efficiency Standards. 3 CalEEMod only includes on-road vehicle emissions data up to year 2050, therefore, mobile source emissions shown are based on year 2050 on-road vehicle
emissions data. In general, vehicle emission rates decrease each passing year due to the assumption that older vehicles are replaced by newer cleaner vehicles. Thus, based on this general trend, use of year 2050 emissions data would be either similar to or slightly more conservative compared to year 2051 emissions data if it was available.
Sensitive Receptors
Some land uses are considered more sensitive to air pollution (i.e., TACs) than others due to the types of population groups or activities involved. Sensitive population groups include children, the elderly, the acutely ill, and the chronically ill, especially those with cardiorespiratory diseases.
Residential areas are also considered sensitive to air pollution because residents (including children and the elderly) tend to be at home for extended periods of time, resulting in sustained exposure to any pollutants present. Other sensitive receptors include retirement facilities, hospitals, and schools. Recreational land uses are considered moderately sensitive to air pollution. Although exposure periods are generally short, exercise places a high demand on respiratory functions, which can be impaired by air pollution. In addition, noticeable air pollution can detract from the enjoyment of recreation. Industrial, commercial, retail, and office areas are considered the least sensitive to air pollution. Exposure periods are relatively short and intermittent because the majority of workers tend to stay indoors most of the time. In addition, the workforce is generally the healthiest segment of the population.
The nearest off-site sensitive receptors to the project site include the surrounding single-family residences (e.g., the adjacent residences to the east and the residences to the north, south, and west across Wilson Avenue, Banyan Street, and Haven Avenue, respectively) and students at Banyan Elementary School near the southeast quadrant of the project site south of Banyan Street.

R A N C H O C U C A M O N G A C A M P U S M A S T E R P L A N D R A F T E I R C H A F F E Y C O M M U N I T Y C O L L E G E D I S T R I C T
5. Environmental Analysis AIR QUALITY
April 2022 Page 5.1-17
5.1.2 Thresholds of Significance According to Appendix G of the CEQA Guidelines, a project would normally have a significant effect on the environment if the project would:
AQ-1 Conflict with or obstruct implementation of the applicable air quality plan.
AQ-2 Result in a cumulatively considerable net increase of any criteria pollutant for which the project region is non-attainment under an applicable federal or state ambient air quality standard.
AQ-3 Expose sensitive receptors to substantial pollutant concentrations.
AQ-4 Result in other emissions (such as those leading to odors) adversely affecting a substantial number of people.
5.1.2.1 SOUTH COAST AIR QUALITY MANAGEMENT DISTRICT THRESHOLDS
CEQA allows the significance criteria established by the applicable air quality management or air pollution control district to be used to assess impacts of a project on air quality. South Coast AQMD has established thresholds of significance for regional air quality emissions for construction activities and project operation based on substantial evidence.
Regional Significance Thresholds
South Coast AQMD has adopted regional construction and operational emissions thresholds to determine a project’s cumulative impact on air quality in the SoCAB, shown in Table 5.1-6, South Coast AQMD Significance Thresholds. The table lists thresholds that are applicable for all projects uniformly, regardless of size or scope. There is growing evidence that although ultrafine particulate matter contributes a very small portion of the overall atmospheric mass concentration, it represents a greater proportion of the health risk from PM. However, the US EPA and CARB have not adopted AAQS to regulate ultrafine particulate matter; therefore, South Coast AQMD has not developed thresholds for them.
Table 5.1-6 South Coast AQMD Significance Thresholds Air Pollutant1 Construction Phase Operational Phase
Reactive Organic Gases (ROGs)/Volatile Organic Compounds (VOCs) 75 lbs/day 55 lbs/day Nitrogen Oxides (NOX) 100 lbs/day 55 lbs/day Carbon Monoxide (CO) 550 lbs/day 550 lbs/day Sulfur Oxides (SOX) 150 lbs/day 150 lbs/day Particulates (PM10) 150 lbs/day 150 lbs/day Particulates (PM2.5) 55 lbs/day 55 lbs/day Source: South Coast AQMD 2019. 1 The South Coast AQMD has not developed a regional significance threshold for ozone. In addition, because the proposed project does not involve a large permitted
industrial project where South Coast AQMD is the lead agency, lead (Pb) is not a pollutant of concern.

R A N C H O C U C A M O N G A C A M P U S M A S T E R P L A N D R A F T E I R C H A F F E Y C O M M U N I T Y C O L L E G E D I S T R I C T
5. Environmental Analysis AIR QUALITY
Page 5.1-18 PlaceWorks
Projects that exceed the regional significance threshold contribute to the nonattainment designation of the SoCAB. The attainment designations are based on the AAQS, which are set at levels of exposure that are determined to not result in adverse health effects. Exposure to fine particulate pollution and ozone causes myriad health impacts, particularly to the respiratory and cardiovascular systems:
Increases cancer risk (PM2.5, TACs)
Aggravates respiratory disease (O3, PM2.5) Increases bronchitis (O3, PM2.5)
Causes chest discomfort, throat irritation, and increased effort to take a deep breath (O3)
Reduces resistance to infections and increases fatigue (O3)
Reduces lung growth in children (PM2.5)
Contributes to heart disease and heart attacks (PM2.5) Contributes to premature death (O3, PM2.5) Contributes to lower birth weight in newborns (PM2.5) (South Coast AQMD 2011a)
Exposure to fine particulates and ozone aggravates asthma attacks and can amplify other lung ailments such as emphysema and chronic obstructive pulmonary disease. Exposure to current levels of PM2.5 is responsible for an estimated 4,300 cardiopulmonary-related deaths per year in the SoCAB. In addition, University of Southern California scientists, in a landmark children’s health study, found that lung growth improved as air pollution declined for children aged 11 to 15 in five communities in the SoCAB (South Coast AQMD 2015).
South Coast AQMD is the primary agency responsible for ensuring the health and welfare of sensitive individuals exposed to elevated concentrations of air pollutants in the SoCAB and has established thresholds that would be protective of these individuals. To achieve the health-based standards established by the EPA, South Coast AQMD prepares an AQMP that details regional programs to attain the AAQS. Mass emissions in Table 5.1-6 are not correlated with concentrations of air pollutants but contribute to the cumulative air quality impacts in the SoCAB. The thresholds are based on the trigger levels for the federal New Source Review (NSR) Program. The NSR Program was created to ensure projects are consistent with attainment of health-based federal AAQS. Regional emissions from a single project do not single-handedly trigger a regional health impact, and it is speculative to identify how many more individuals in the air basin would be affected by the health effects listed above. Projects that do not exceed the South Coast AQMD regional significance thresholds in Table 5.1-6 would not violate any air quality standards or contribute substantially to an existing or projected air quality violation.
If projects exceed the emissions in Table 5.1-6, emissions would cumulatively contribute to the nonattainment status and would contribute in elevating health effects associated to these criteria air pollutants. Known health effects related to ozone include worsening of bronchitis, asthma, and emphysema and a decrease in lung function. Health effects associated with particulate matter include premature death of people with heart or lung disease, nonfatal heart attacks, irregular heartbeat, decreased lung function, and increased respiratory symptoms. Reducing emissions would further contribute to reducing possible health effects related to criteria air pollutants. However, for projects that exceed the emissions in Table 5.1-6, it is speculative to determine how exceeding the regional thresholds would affect the number of days the region is in nonattainment since mass emissions are

R A N C H O C U C A M O N G A C A M P U S M A S T E R P L A N D R A F T E I R C H A F F E Y C O M M U N I T Y C O L L E G E D I S T R I C T
5. Environmental Analysis AIR QUALITY
April 2022 Page 5.1-19
not correlated with concentrations of emissions or how many additional individuals in the air basin would be affected by the health effects cited above.
South Coast AQMD has not provided methodology to assess the specific correlation between mass emissions generated and the effect on health in order to address the issue raised in Sierra Club v. County of Fresno (Friant Ranch) (2018) 6 Cal.5th 502, Case No. S21978. In Friant Ranch, the California Supreme Court determined that the EIR for the proposed Friant Ranch project failed to adequately analyze the project’s air quality impacts on human health. The EIR prepared for the project, a master planned retirement community in Fresno County, showed that project-related mass emissions would exceed the San Joaquin Valley Air Pollution Control District’s regional significance thresholds. In its findings, the California Supreme Court affirmed the holding of the Court of Appeal that EIRs for projects must not only identify impacts to human health, but also provide an “analysis of the correlation between the project's emissions and human health impacts” related to each criteria air pollutant that exceeds the regional significance thresholds or explain why it could not make such a connection. In general, the ruling focuses on the correlation of emissions of toxic air contaminants and criteria air pollutants and their impact to human health.
Ozone concentrations are dependent upon a variety of complex factors, including the presence of sunlight and precursor pollutants, natural topography, nearby structures that cause building downwash, atmospheric stability, and wind patterns. Because of the complexities of predicting ground-level ozone concentrations in relation to the National AAQS and California AAQS, it is not feasible to link health risks to the magnitude of emissions exceeding the significance thresholds. However, if a project in the SoCAB exceeds the regional significance thresholds, the project could contribute to an increase in health effects in the basin until such time the attainment standard are met in the SoCAB.
CO Hotspots
Areas of vehicle congestion have the potential to create pockets of CO called hotspots. These pockets have the potential to exceed the state one-hour standard of 20 parts per million (ppm) or the eight-hour standard of 9 ppm. Because CO is produced in greatest quantities from vehicle combustion and does not readily disperse into the atmosphere, adherence to ambient air quality standards is typically demonstrated through an analysis of localized CO concentrations. Hotspots are typically produced at intersections, where traffic congestion is highest because vehicles queue for longer periods and are subject to reduced speeds. With the turnover of older vehicles and introduction of cleaner fuels, as well as implementation of control technology on industrial facilities, CO concentrations in the SoCAB and the state have steadily declined.
In 2007, the SoCAB was designated in attainment for CO under both the California AAQS and National AAQS. The CO hotspot analysis conducted for the attainment by South Coast AQMD did not predict a violation of CO standards at the busiest intersections in Los Angeles during the peak morning and afternoon periods.10 As identified in South Coast AQMD’s 2003 AQMP and the 1992 Federal Attainment Plan for Carbon Monoxide (1992 CO Plan), peak carbon monoxide concentrations in the SoCAB in years before redesignation were a
10 The four intersections were: Long Beach Boulevard and Imperial Highway; Wilshire Boulevard and Veteran Avenue; Sunset
Boulevard and Highland Avenue; and La Cienega Boulevard and Century Boulevard. The busiest intersection evaluated (Wilshire and Veteran) had a daily traffic volume of approximately 100,000 vehicles per day with LOS E in the morning peak hour and LOS F in the evening peak hour.

R A N C H O C U C A M O N G A C A M P U S M A S T E R P L A N D R A F T E I R C H A F F E Y C O M M U N I T Y C O L L E G E D I S T R I C T
5. Environmental Analysis AIR QUALITY
Page 5.1-20 PlaceWorks
result of unusual meteorological and topographical conditions and not of congestion at a particular intersection (South Coast AQMD 1992; South Coast AQMD 2003). Under existing and future vehicle emission rates, a project would have to increase traffic volumes at a single intersection by more than 44,000 vehicles per hour—or 24,000 vehicles per hour where vertical and/or horizontal air does not mix—in order to generate a significant CO impact (BAAQMD 2017).11
Localized Significance Thresholds
The South Coast AQMD identifies localized significance thresholds shown in Table 5.1-7, South Coast AQMD Localized Significance Thresholds. Emissions of NO2, CO, PM10, and PM2.5 generated at a project site (offsite mobile-source emissions are not included in the LST analysis) could expose sensitive receptors to substantial concentrations of criteria air pollutants. A project that generates emissions that trigger a violation of the AAQS when added to the local background concentrations would generate a significant impact.
Table 5.1-7 South Coast AQMD Localized Significance Thresholds Air Pollutant (Relevant AAQS) Concentration
1-Hour CO Standard (CAAQS) 20 ppm 8-Hour CO Standard (CAAQS) 9.0 ppm 1-Hour NO2 Standard (CAAQS) 0.18 ppm Annual NO2 Standard (CAAQS) 0.03 ppm 24-Hour PM10 Standard – Construction (South Coast AQMD)1 10.4 µg/m3 24-Hour PM2.5 Standard – Construction (South Coast AQMD)1 10.4 µg/m3 24-Hour PM10 Standard – Operation (South Coast AQMD)1 2.5 µg/m3 24-Hour PM2.5 Standard – Operation (South Coast AQMD)1 2.5 µg/m3 Annual Average PM10 Standard (South Coast AQMD)1 1.0 µg/m3 Source: South Coast AQMD 2019. ppm – parts per million; µg/m3 – micrograms per cubic meter 1 Threshold is based on South Coast AQMD Rule 403. Since the SoCAB is in nonattainment for PM10 and PM2.5, the threshold is established as an allowable change
in concentration. Therefore, background concentration is irrelevant. To assist lead agencies, South Coast AQMD developed screening-level LSTs to back-calculate the mass amount (lbs. per day) of emissions generated onsite that would trigger the levels shown in Table 5.1-7 for projects under five acres. These “screening-level” LSTs tables are the localized significance thresholds for all projects of five acres and less; however, they can be used as screening criteria for larger projects to determine whether dispersion modeling may be required.
11 The CO hotspot analysis refers to the modeling conducted by the Bay Area Air Quality Management District for its CEQA
Guidelines because it is based on newer data and considers the improvement in mobile-source CO emissions. Although meteorological conditions in the Bay Area differ from those in the Southern California region, the modeling conducted by BAAQMD demonstrates that the net increase in peak hour traffic volumes at an intersection in a single hour would need to be substantial. This finding is consistent with the CO hotspot analysis South Coast AQMD prepared as part of its 2003 AQMP to provide support in seeking CO attainment for the SoCAB. Based on the analysis prepared by South Coast AQMD, no CO hotspots were predicted for the SoCAB. As noted in the preceding footnote, the analysis included some of Los Angeles’ busiest intersections, with daily traffic volumes of 100,000 or more peak hour vehicle trips operating at LOS E and F.

R A N C H O C U C A M O N G A C A M P U S M A S T E R P L A N D R A F T E I R C H A F F E Y C O M M U N I T Y C O L L E G E D I S T R I C T
5. Environmental Analysis AIR QUALITY
April 2022 Page 5.1-21
The construction screening-level LSTs in SRA 32 are shown in Table 5.1-8, South Coast AQMD Screening-Level Localized Significance Thresholds: Construction. For construction activities, the screening-level LSTs are based on the distance to the nearest sensitive receptors and the acreage disturbed per day based on equipment use (South Coast AQMD 2011b). For purposes of this analysis, the screening-level LSTs for Phases 1 and 5 are based on the reference distance of 82 feet (25 meters). The distance of 82 feet is the minimum referenced distance per South Coast AQMD LST methodology (South Coast AQMD 2008). For Phase 2, 3, and 4, the PM10 and PM2.5 screening-level LSTs are based on the reference distance of 140 feet, which is the nearest distance the anticipated construction areas for these development phases would be to surrounding residences (e.g., residences across Haven Avenue).
Table 5.1-8 South Coast AQMD Screening-Level Localized Significance Thresholds: Construction
Referenced Acreage Disturbed
Threshold (lbs/day)
Nitrogen Oxides (NOX)
Carbon Monoxide (CO)
Coarse Particulates (PM10)
Fine Particulates (PM2.5)
Phases 1 and 51 ≤1.00 Acre Disturbed Per Day 118 863 5.00 4.00 1.31 Acres Disturbed Per Day 134 978 5.31 4.31 2.50 Acres Disturbed Per Day 187 1,392 7.66 5.67 3.50 Acres Disturbed Per Day 220 1,712 10.99 7.00 4.00 Acres Disturbed Per Day 237 1,872 12.66 7.67
Phases 2, 3, and 42 ≤1.00 Acre Disturbed Per Day 118 863 11.36 5.41 1.23 Acres Disturbed Per Day 130 746 12.22 5.80 Source: South Coast AQMD 2008 and South Coast AQMD 2011b, Based on receptors in SRA 32. 1 Screening-level LSTs are based on receptors within 82 feet (25 meters). 2 NOX and CO screening-level LSTs are based on receptors within 82 feet (25 meters). PM10 and PM2.5 screening-level LSTs are based on receptors within 140 feet
(43 meters).
Health Risk
Whenever a project would require use of chemical compounds that have been identified in South Coast AQMD Rule 1401, placed on CARB’s air toxics list pursuant to AB 1807, or placed on the EPA’s National Emissions Standards for Hazardous Air Pollutants, a health risk assessment is required by the South Coast AQMD. Table 5.1-9, South Coast AQMD Toxic Air Contaminants Incremental Risk Thresholds, lists the TAC incremental risk thresholds for operation of a project. The types of land uses that typically generate substantial quantities of criteria air pollutants and TACs from operations include industrial (stationary sources) and warehousing (truck idling) land uses (CARB 2005). Community college uses do not use substantial quantities of TACs, thus these thresholds are typically applied to new industrial projects only. Additionally, the purpose of this environmental evaluation is to identify the significant effects of the Master Plan on the environment, not the significant effects of the environment on the Master Plan. California Building Industry Association v. Bay Area Air Quality Management District (2015) 62 Cal.4th 369 (Case No. S213478). However, the environmental document must analyze the impacts of environmental hazards on future users when a proposed project exacerbates an existing

R A N C H O C U C A M O N G A C A M P U S M A S T E R P L A N D R A F T E I R C H A F F E Y C O M M U N I T Y C O L L E G E D I S T R I C T
5. Environmental Analysis AIR QUALITY
Page 5.1-22 PlaceWorks
environmental hazard or condition. As stated, because community college uses do not use substantial quantities of TACs, they typically do not exacerbate existing hazards.
Table 5.1-9 South Coast AQMD Toxic Air Contaminants Incremental Risk Thresholds Maximum Incremental Cancer Risk ≥ 10 in 1 million
Cancer Burden (in areas ≥ 1 in 1 million) > 0.5 excess cancer cases Hazard Index (project increment) ≥ 1.0
Source: South Coast AQMD 2019.
5.1.3 Plans, Programs, and Policies Plans, programs, and policies (PPP), including applicable regulatory requirements and project design features for air quality, are identified below.
PPP AIR-1 New buildings are required to achieve the current California Building Energy Efficiency Standards (Title 24, Part 6) and California Green Building Standards Code (CALGreen) (Title 24, Part 11). The 2019 Building Energy Efficiency Standards became effective on January 1, 2020 and the 2022 Building Energy Efficiency Standards will become effective on January 1, 2023. The Building Energy Efficiency Standards and CALGreen are updated tri-annually with a goal to achieve zero net energy for residential buildings by 2020 and non-residential buildings by 2030.
PPP AIR-2 New buildings are required to adhere to the California Green Building Standards Code (CALGreen) requirement to provide bicycle parking for new non-residential buildings, or meet local bicycle parking ordinances, whichever is stricter (CALGreen Sections 5.106.4.1, 14.106.4.1, and 5.106.4.1.2).
PPP AIR-3 Construction activities will be conducted in compliance with 13 California Code of Regulations (CCR) Section 2499, which requires that nonessential idling of construction equipment is restricted to five minutes or less.
PPP AIR-4 Construction activities will be conducted in compliance with any applicable South Coast Air Quality Management District (South Coast AQMD) rules and regulations, including but not limited to the following:
Rule 403, Fugitive Dust, for controlling fugitive dust and avoiding nuisance.
Rule 402, Nuisance, which states that a project shall not “discharge from any source whatsoever such quantities of air contaminants or other material which cause injury, detriment, nuisance, or annoyance to any considerable number of persons or to the public, or which endanger the comfort, repose, health or safety of any such persons or the public,
R A N C H O C U C A M O N G A C A M P U S M A S T E R P L A N D R A F T E I R C H A F F E Y C O M M U N I T Y C O L L E G E D I S T R I C T
5. Environmental Analysis AIR QUALITY
April 2022 Page 5.1-23
or which cause, or have a natural tendency to cause, injury or damage to business or property.”
Rule 1113, which limits the volatile organic compound content of architectural coatings.
PPP AIR-5 The heavy-heavy duty tractors and trailers (i.e., trucks that are 53-foot or longer) must use US EPA SmartWay certified tractors and trailers or retrofit their existing fleet with SmartWay verified technologies in accordance with CARB’s Heavy-Duty (Tractor-Trailer) GHG Regulation. Owners are responsible for replacing or retrofitting their affected vehicles with compliant aerodynamic technologies and low rolling resistance tires. Sleeper cab tractors model year 2011 and later must be SmartWay certified. All other tractors must use SmartWay verified low rolling resistance tires. Trailers must have low rolling resistance tires and aerodynamic devices.
PPP AIR-6 The medium-duty and heavy-duty vehicle engines are required to comply with the US EPA’s GHG and fuel efficiency standards. The federal and California Phase 1 standards took effect with model year 2014 tractors, vocational vehicles, and heavy-duty pick-up trucks and vans and the engines powering such vehicles (the Phase 1 standards excludes trailers). The federal Phase 2 standards cover model years 2018-2027 for certain trailers and model years 2021-2027 for semi-trucks and large pick-up trucks, vans and all types and sizes of buses and work trucks. California is aligned with the federal Phase 2 standards in structure, timing, and stringency, but with some minor California differences. The California Phase 2 regulations became effective April 1, 2019.
5.1.4 Environmental Impacts 5.1.4.1 METHODOLOGY
This air quality evaluation was prepared in accordance with the requirements of CEQA to determine if significant air quality impacts are likely to occur in conjunction with future development that would be accommodated by the proposed project. South Coast AQMD’s CEQA Air Quality Handbook (Handbook) and updates on its website are intended to provide local governments with guidance for analyzing and mitigating project-specific air quality impacts. The Handbook provides standards, methodologies, and procedures for conducting air quality analyses in environmental impact reports (EIRs), and they were used in this analysis (South Coast AQMD 1993). The following provides a summary of the assumptions utilized for the proposed project analysis.
Criteria Air Pollutant Emissions
Air pollutant emissions are calculated using the California Emissions Estimator Model (CalEEMod), version 2020.4.0 (CAPCOA 2021). CalEEMod compiles an emissions inventory of construction (fugitive dust, off-gas emissions, on-road emissions, and off-road emissions), area sources, indirect emissions from energy use, mobile sources, indirect emissions from waste disposal (annual only), and indirect emissions from water/wastewater (annual only). Criteria air pollutant emissions modeling is included in Appendix B of this DEIR. The calculated emissions of the proposed project are compared to thresholds of significance for individual projects using the

R A N C H O C U C A M O N G A C A M P U S M A S T E R P L A N D R A F T E I R C H A F F E Y C O M M U N I T Y C O L L E G E D I S T R I C T
5. Environmental Analysis AIR QUALITY
Page 5.1-24 PlaceWorks
South Coast AQMD’s Handbook. Following is a summary of the assumptions used for the proposed project analysis.
Construction Phase
Construction would entail demolition of existing structures and asphalt, site preparation, grading, off-site hauling of demolition debris material, construction of the proposed structures and buildings, architectural coating, and asphalt paving over 5 construction phases (Phases 1, 2, 3, 4, and 5). As shown previously in Table 3-1, Project Components and Phasing Summary, buildout of each development phase is anticipated to occur between year 2027 to year 2051. As discussed below, it is anticipated that development would not occur continuously during this period. The campus would continue to operate during construction; therefore, construction activities could occur during periods in which students are on campus.
The construction assumptions for Phase 1 through 5 are discussed below. The construction activities, schedule, and equipment for each development phase utilize CalEEMod defaults based on the projected new construction and buildout year for each development phase.
Phase 1. For purposes of this analysis, Phase 1 is anticipated to begin construction at the start of 2026 and be completed by middle of 2027. Under this development phase, approximately 37,462 square feet of existing campus buildings would be demolished, and up to 105,600 building square feet of new campus buildings would be built. It is anticipated that implementation of the proposed project would result in removal of some of the existing hardscape (i.e., internal roadways, surface parking, and pedestrian walkways). While removal of some of the existing hardscape may occur over the five development phases, for purposes of this analysis, it is assumed that all hardscape that would be demolished and removed would occur in Phase 1. Similarly, while new surface parking lots and internal roadways may likely be constructed over the five development phases, they are assumed to all occur in Phase 1 for purposes of this analysis. In addition, the interior and exterior paintable surface areas also encompass an additional 39,312 building square feet (existing library) to account for the anticipated renovations anticipated for this phase. The general construction activities, schedule, and anticipated equipment are shown in Table 5.1-10, Phase 1 Construction Activities, Phasing, and Equipment.
Table 5.1-10 Phase 1: Construction Activities, Phasing, and Equipment Activities1 Start/End Dates1 Equipment1
Demolition 1/1/2026 to 1/28/2026 1 concrete/industrial saw; 3 excavators; 2 rubber tired dozers; 2 water truck
Site Preparation 1/29/2026 to 2/11/2026 3 rubber tired dozers; 4 tractors/loaders/backhoes; 4 water trucks
Grading 2/12/2026 to 3/25/2026 2 excavators; 1 grader; 1 rubber tired dozer; 2 scrapers; 2 tractors/loaders/backhoes; 8 water trucks
Building Construction 3/26/2026 to 5/19/2027 1 crane; 3 forklifts; 1 generator set; 3 tractors/loaders/backhoes; 1 welder Paving 5/20/2027 to 6/16/2027 2 pavers; 2 paving equipment; 2 rollers Architectural Coating 6/17/2027 to 7/14/2027 1 air compressor Notes: n/a = not applicable 1 Utilizes CalEEMod defaults based on the anticipated new construction and the buildout year of 2027.

R A N C H O C U C A M O N G A C A M P U S M A S T E R P L A N D R A F T E I R C H A F F E Y C O M M U N I T Y C O L L E G E D I S T R I C T
5. Environmental Analysis AIR QUALITY
April 2022 Page 5.1-25
Phase 2. Phase 2 is anticipated to begin construction summer of 2030 and be completed by middle of 2031. Under this development phase, approximately 80,669 square feet of existing campus buildings would be demolished, and up to 106,759 building square feet of new campus buildings would be built. In addition, the interior and exterior paintable surface areas also encompass an additional 24,828 building square feet (existing Marie Kane Admin/Student Services Building) to account for the anticipated renovations anticipated for this phase. The general construction activities, schedule, and anticipated equipment are shown in Table 5.1-11, Phase 2 Construction Activities, Phasing, and Equipment.
Table 5.1-11 Phase 2: Construction Activities, Phasing, and Equipment Activities1 Start/End Dates1 Equipment1
Demolition 08/01/2030 to 08/28/2030 1 concrete/industrial saw; 2 rubber tired dozer; 3 tractors/loaders/backhoes; 2 water trucks
Site Preparation 08/29/2030 to 08/30/2030 1 grader; 1 rubber tired dozer; 1 tractor/loader/backhoe; 2 water trucks Grading 08/31/2030 to 09/05/2030 1 grader; 1 rubber tired dozer; 2 tractors/loaders/backhoes; 3 water trucks Building Construction 09/06/2030 to 06/12/2031 1 crane; 1 forklift; 1 generator set; 1 tractor/loader/backhoe; 3 welders
Paving 06/13/2031 to 06/26/2031 1 cement and mortar mixer; 1 paver; 1 paving equipment; 1 roller; 1 tractor/loader/backhoe
Architectural Coating 06/27/2031 to 07/10/2031 1 air compressor Notes: n/a = not applicable 1 Utilizes CalEEMod defaults based on the anticipated new construction and the buildout year of 2031.
Phase 3. Phase 3 is anticipated to begin construction in the first quarter of 2038 and be completed by middle of 2038. Under this development phase, up to 13,200 building square feet of new campus buildings would be built. In addition, the interior and exterior paintable surface areas also encompass an additional 36,936 building square feet (existing Aeronautics and Berz Educational Excellence Center Buildings) to account for the anticipated building renovations anticipated for this phase. The general construction activities, schedule, and anticipated equipment are shown in Table 5.1-12, Phase 3 Construction Activities, Phasing, and Equipment.
Table 5.1-12 Phase 3: Construction Activities, Phasing, and Equipment Activities1 Start/End Dates1 Equipment1
Site Preparation 02/13/2038 to 02/15/2038 1 grader; 1 tractor/loader/backhoe; 1 water truck Grading 02/16/2038 to 02/17/2038 1 grader; 1 rubber tired dozer; 1 tractor/loader/backhoe; 2 water trucks Building Construction 02/18/2038 to 07/07/2038 1 crane; 2 forklifts; 2 tractors/loaders/backhoes Paving 07/08/2038 to 07/14/2038 4 cement and mortar mixers; 1 paver; 1 roller; 1 tractor/loader/backhoe Architectural Coating 07/15/2038 to 07/21/2038 1 air compressor Notes: n/a = not applicable 1 Utilizes CalEEMod defaults based on the anticipated new construction and the buildout year of 2038.
Phase 4. Phase 4 is anticipated to begin construction in the first quarter of 2042 and be completed by middle of 2042. Under this development phase, approximately 28,879 square feet of existing campus buildings would be demolished, and up to 63,500 building square feet of new campus buildings would be built. In addition, the interior and exterior paintable surface areas also encompass an additional 45,254
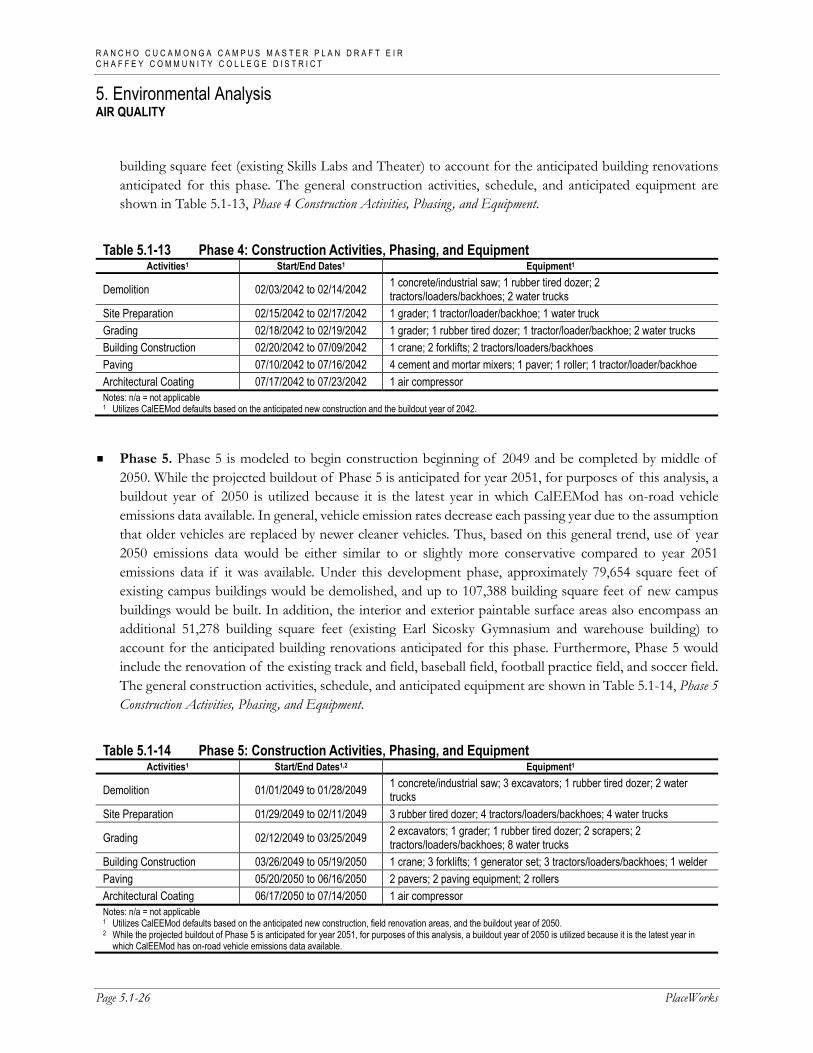
R A N C H O C U C A M O N G A C A M P U S M A S T E R P L A N D R A F T E I R C H A F F E Y C O M M U N I T Y C O L L E G E D I S T R I C T
5. Environmental Analysis AIR QUALITY
Page 5.1-26 PlaceWorks
building square feet (existing Skills Labs and Theater) to account for the anticipated building renovations anticipated for this phase. The general construction activities, schedule, and anticipated equipment are shown in Table 5.1-13, Phase 4 Construction Activities, Phasing, and Equipment.
Table 5.1-13 Phase 4: Construction Activities, Phasing, and Equipment Activities1 Start/End Dates1 Equipment1
Demolition 02/03/2042 to 02/14/2042 1 concrete/industrial saw; 1 rubber tired dozer; 2 tractors/loaders/backhoes; 2 water trucks
Site Preparation 02/15/2042 to 02/17/2042 1 grader; 1 tractor/loader/backhoe; 1 water truck Grading 02/18/2042 to 02/19/2042 1 grader; 1 rubber tired dozer; 1 tractor/loader/backhoe; 2 water trucks Building Construction 02/20/2042 to 07/09/2042 1 crane; 2 forklifts; 2 tractors/loaders/backhoes Paving 07/10/2042 to 07/16/2042 4 cement and mortar mixers; 1 paver; 1 roller; 1 tractor/loader/backhoe Architectural Coating 07/17/2042 to 07/23/2042 1 air compressor Notes: n/a = not applicable 1 Utilizes CalEEMod defaults based on the anticipated new construction and the buildout year of 2042.
Phase 5. Phase 5 is modeled to begin construction beginning of 2049 and be completed by middle of 2050. While the projected buildout of Phase 5 is anticipated for year 2051, for purposes of this analysis, a buildout year of 2050 is utilized because it is the latest year in which CalEEMod has on-road vehicle emissions data available. In general, vehicle emission rates decrease each passing year due to the assumption that older vehicles are replaced by newer cleaner vehicles. Thus, based on this general trend, use of year 2050 emissions data would be either similar to or slightly more conservative compared to year 2051 emissions data if it was available. Under this development phase, approximately 79,654 square feet of existing campus buildings would be demolished, and up to 107,388 building square feet of new campus buildings would be built. In addition, the interior and exterior paintable surface areas also encompass an additional 51,278 building square feet (existing Earl Sicosky Gymnasium and warehouse building) to account for the anticipated building renovations anticipated for this phase. Furthermore, Phase 5 would include the renovation of the existing track and field, baseball field, football practice field, and soccer field. The general construction activities, schedule, and anticipated equipment are shown in Table 5.1-14, Phase 5 Construction Activities, Phasing, and Equipment.
Table 5.1-14 Phase 5: Construction Activities, Phasing, and Equipment Activities1 Start/End Dates1,2 Equipment1
Demolition 01/01/2049 to 01/28/2049 1 concrete/industrial saw; 3 excavators; 1 rubber tired dozer; 2 water trucks
Site Preparation 01/29/2049 to 02/11/2049 3 rubber tired dozer; 4 tractors/loaders/backhoes; 4 water trucks
Grading 02/12/2049 to 03/25/2049 2 excavators; 1 grader; 1 rubber tired dozer; 2 scrapers; 2 tractors/loaders/backhoes; 8 water trucks
Building Construction 03/26/2049 to 05/19/2050 1 crane; 3 forklifts; 1 generator set; 3 tractors/loaders/backhoes; 1 welder Paving 05/20/2050 to 06/16/2050 2 pavers; 2 paving equipment; 2 rollers Architectural Coating 06/17/2050 to 07/14/2050 1 air compressor Notes: n/a = not applicable 1 Utilizes CalEEMod defaults based on the anticipated new construction, field renovation areas, and the buildout year of 2050. 2 While the projected buildout of Phase 5 is anticipated for year 2051, for purposes of this analysis, a buildout year of 2050 is utilized because it is the latest year in
which CalEEMod has on-road vehicle emissions data available.

R A N C H O C U C A M O N G A C A M P U S M A S T E R P L A N D R A F T E I R C H A F F E Y C O M M U N I T Y C O L L E G E D I S T R I C T
5. Environmental Analysis AIR QUALITY
April 2022 Page 5.1-27
Operational Phase (Full Campus Buildout)
Following completion of construction over the five phases, the campus would operate in a manner similar to existing conditions. Enrollment, staffing, and types of activities used by both the college and the community would operate in the same manner as existing conditions. Three main sources of emissions are associated with operation: transportation, area sources, and energy consumption. These are described as follows.
Transportation. The primary source of mobile criteria air pollutant emissions is tailpipe exhaust emissions from the combustion of fuel (i.e., gasoline and diesel). For particulate matter, brake and tire wear and fugitive dust are created by vehicles traveling on roadways. Per Urban Crossroads, the existing campus generates approximately 18,982 average daily vehicle trips (ADT) during the weekday and the proposed project would generate an additional 1,070 ADTs (see Appendix G of this DEIR). Of the existing 18,982 ADTs, approximately 4 ADTs are generated medium-heavy duty trucks and 6 ADTs are generated by heavy-heavy duty trucks that are associated with the existing on-campus warehouse facility (see Appendix G of this DEIR). Implementation of the proposed project would not result in the generation of additional medium- and heavy-heavy duty truck trips compared to existing conditions
Area Sources. Area source emissions from use of consumer cleaning products, landscaping equipment, and VOC emissions from paints for buildings are based on information provided or verified by the District.
Energy. Criteria air pollutant emissions from energy use (natural gas used for cooking, heating, etc.) are based on the CalEEMod defaults for natural gas usage for junior college. For purposes of this analysis, new buildings are modeled using the default CalEEMod energy rates, which are based on the 2019 Building Energy Efficiency Standards. Existing buildings are modeled using the CalEEMod historical energy rates, which are based on the 2005 Building Energy Efficiency Standards.
Toxic Air Contaminants
A construction health risk assessment (HRA) from TACs and PM2.5 associated with construction equipment exhaust was prepared for the proposed project. Sources evaluated in the HRA include off-road construction equipment and heavy-duty diesel trucks along the truck haul route. Modeling is based on US EPA AERMOD, Version 10.2.1, air dispersion modeling program and the latest HRA guidance from OEHHA to estimate excess lifetime cancer risks, chronic non-cancer hazard indices, and the PM2.5 maximum annual concentrations at the nearest maximum exposed off-site and on-site sensitive receptors and assumes 24-hour outdoor exposure with risks averaged over a 70-year lifetime (OEHHA 2015).
DPM emissions were based on the CalEEMod construction runs, using annual exhaust PM10 construction emissions presented in pounds (lbs) per day. The PM2.5 emissions were taken from the CalEEMod output for exhaust PM2.5 also presented in lbs per day. Construction of the proposed project would take place over a total cumulative duration of approximately 4.75 years (1,243 workdays) between years 2026 and 2051. The average daily emission rates from construction equipment used during the proposed project were determined by dividing the annual average emissions for each construction year by the number of construction days per year for each calendar year of construction (e.g., 2026 and 2027). The off-site hauling emission rates were adjusted to evaluate localized emissions from the haul route distance within 1,000 feet of the project site.
R A N C H O C U C A M O N G A C A M P U S M A S T E R P L A N D R A F T E I R C H A F F E Y C O M M U N I T Y C O L L E G E D I S T R I C T
5. Environmental Analysis AIR QUALITY
Page 5.1-28 PlaceWorks
Air dispersion modeling using the US EPA’s AERMOD program was conducted to assess the impact of emitted compounds on sensitive receptors. The model is a steady-state Gaussian plume model and is an approved model by South Coast AQMD for estimating ground level impacts from point and fugitive sources in simple and complex terrain. Meteorological data obtained from the South Coast AQMD for the nearest representative meteorological station (Upland) with the five latest available years (2012 to 2016) of record were used to represent local weather conditions and prevailing winds.
For all modeling runs, a unit emission rate of 1 gram per second was used. The unit emission rates were proportioned over the poly-area sources for on-site construction emissions and divided between the volume sources for off-site hauling emissions. The maximum modeled concentrations at each sensitive receptor were then multiplied by the construction emission rates to obtain the maximum concentrations at the off-site maximum exposed receptors. The calculated total cancer risk for a resident conservatively assumes that the risk for the maximum exposed individual resident (MEIR) consists of a pregnant woman in the third trimester that subsequently gives birth to an infant during the approximately 24- to 25-year construction window; therefore, all calculated risk values for years 2026 and 2027 were multiplied by a factor of 10, by a factor of 3 for years 2030, 2031, 2038, and 2042, and by a factor of 1 for years 2049 and 2050. In addition, it was conservatively assumed that the residents were outdoors 8 hours a day, 260 construction days per year, and exposed to all of the daily construction emissions. For the student receptors, it is assumed the ages range between 4 to 11 years based on the Banyan Elementary School grade levels of kindergarten through 6th grade. Therefore, all calculated risk values were multiplied by a factor of 3. Additionally, it is assumed the students were outdoors and are subject to DPM for 8 hours per day, and approximately 180 school days per year.
5.1.4.2 IMPACT ANALYSIS
The following impact analysis addresses the thresholds of significance; the applicable thresholds are identified in brackets after the impact statement.
Impact 5.1-1: The proposed project is consistent with the applicable air quality management plan. [Threshold AQ-1]
South Coast AQMD is directly responsible for reducing emissions from area, stationary, and mobile sources in the SoCAB to achieve the National and California AAQS. It has responded to this requirement by preparing an AQMP. On March 3, 2017, the South Coast AQMD Governing Board adopted the 2016 AQMP, which is a regional and multiagency effort (South Coast AQMD, CARB, SCAG, and EPA). A consistency determination with the AQMP plays an important role in local agency project review by linking local planning and individual projects to the AQMP. It fulfills the CEQA goal of informing decision makers of the environmental efforts of the project under consideration early enough to ensure that air quality concerns are fully addressed. It also provides the local agency with ongoing information as to whether they are contributing to the clean air goals in the AQMP.

R A N C H O C U C A M O N G A C A M P U S M A S T E R P L A N D R A F T E I R C H A F F E Y C O M M U N I T Y C O L L E G E D I S T R I C T
5. Environmental Analysis AIR QUALITY
April 2022 Page 5.1-29
The two principal criteria for conformance with an AQMP are:
1. Whether the project would exceed the assumptions in the AQMP.
2. Whether the project would result in an increase in the frequency or severity of existing air quality violations, cause or contribute to new violations, or delay timeline attainment of air quality standards.
The SCAG is South Coast AQMD’s partner in the preparation of the AQMP, providing the latest economic and demographic forecasts and developing transportation measures. Regional population, housing, and employment projects developed by SCAG are based, in part, on a city’s general plan land use designations. These projections form the foundation for the emissions inventory of the AQMP and are incorporated into the regional transportation plan/sustainable communities strategy (RTP/SCS) prepared by SCAG to determine priority transportation projects and vehicle miles traveled (VMT) in the SCAG region. Because the AQMP strategy is based on projections from local general plans, projects that are consistent with the local general plan are considered consistent with the air quality-related regional plan. Additionally, only large projects have the potential to substantially affect the demographic forecasts in the AQMP. Furthermore, based on the general premise of the AQMP and its focus on air quality effects from a long-term perspective, construction emissions associated with a project are not considered in the AQMP consistency analysis.
The proposed project would be consistent with the current land use designation as it results in improvements to the existing Rancho Cucamonga campus only and would not introduce a new land use type. Because the proposed project is consistent with the City of Rancho Cucamonga’s existing land use assumptions, the proposed project is also consistent with the assumptions of the AQMP. In addition, the proposed improvements would help to accommodate any general student growth within the local region. Student enrollment data provided from the District indicates that the student population is comprised of local population traveling on average within 10 miles of the campus (see Attachment C to Appendix H). Furthermore, as evaluated under Impact 5.1-2, implementation of the proposed project would not generate long-term emissions of criteria air pollutants that would exceed South Coast AQMD’s regional operation-phase significance thresholds, which were established to determine whether a project has the potential to cumulatively contribute to the SoCAB’s nonattainment designations. Thus, long-term implementation of the proposed project would not result in an increase in the frequency or severity of existing air quality violations; cause or contribute to new violations; or delay timely attainment of the AAQS. Therefore, overall, the proposed project would be considered consistent with the AQMP and impacts are less than significant.
Level of Significance Before Mitigation: Less than significant impact.
Impact 5.1-2: Construction activities associated with the proposed project would generate short-term emissions in exceedance of South Coast AQMD’s threshold criteria. [Threshold AQ-2 [part]]
At full buildout, the proposed project would develop approximately 396,447 building square feet of new campus facilities. Construction activities associated with the proposed project would produce combustion emissions from various sources, such as onsite heavy-duty construction vehicles, vehicles hauling materials to and from the site, and motor vehicles transporting the construction crew. Site preparation and grading activities produce fugitive dust emissions (PM10 and PM2.5) from soil-disturbing activities. Air pollutant emissions from

R A N C H O C U C A M O N G A C A M P U S M A S T E R P L A N D R A F T E I R C H A F F E Y C O M M U N I T Y C O L L E G E D I S T R I C T
5. Environmental Analysis AIR QUALITY
Page 5.1-30 PlaceWorks
construction activities onsite would vary daily as construction activity levels change. Table 5.1-15, Maximum Daily Regional Construction Emissions by Development Phase, shows the construction emissions for the proposed project. The table shows the maximum daily emissions based on the modeled schedules shown above in Tables 5.1-10 through 5.1-14. Additionally, Table 5.1-15 also shows the total maximum daily for the scenario in which all the construction activities within a development phase overlap. For purposes of this analysis, the significance determination is based on the scenario that all construction activities overlapping for each of the five development phases. This scenario is included due to the nature of improvements anticipated for each development phase, which could result in different types of construction activities occurring concurrently. However, because the proposed project is a planning-level master plan project, there is currently no defined construction schedule for each development phase. Thus, the scenario that all construction activities are overlapping could represent a conservative result.
Table 5.1-15 Maximum Daily Regional Construction Emissions by Development Phase
Construction Activity
Criteria Air Pollutants (pounds per day)1, 2
VOC NOX CO SO2 PM10 PM2.5
Phase 1 Year 2026 Phase 1 Demolition 2 21 20 <1 3 1 Phase 1 Site Preparation 3 26 19 <1 10 5 Phase 1 Grading 3 29 27 <1 5 3 Phase 1 Building Construction 2 17 27 <1 4 2 Year 2027 Phase 1 Building Construction 2 17 26 <1 4 2 Phase 1 Paving 3 9 15 <1 1 <1 Phase 1 Architectural Coating 72 1 4 <1 1 <1 Maximum Daily Emissions 72 29 27 <1 10 5 South Coast AQMD Regional Construction Threshold 75 100 550 150 150 55 Significant? No No No No No No All Activities Overlap Maximum Daily Emissions3 85 102 111 <1 23 11 South Coast AQMD Regional Construction Threshold 75 100 550 150 150 55 Significant? Yes Yes No No No No Phase 2 Year 2030 Phase 2 Demolition 1 10 14 <1 2 1 Phase 2 Site Preparation 1 5 6 <1 3 1 Phase 2 Grading 1 6 8 <1 3 2 Phase 2 Building Construction 1 8 14 <1 1 <1 Year 2031 Phase 2 Building Construction 1 8 14 <1 1 <1 Phase 2 Paving 1 4 10 <1 <1 <1 Phase 2 Architectural Coating 122 1 2 <1 <1 <1 Maximum Daily Emissions 122 10 14 <1 3 2 South Coast AQMD Regional Construction Threshold 75 100 550 150 150 55

R A N C H O C U C A M O N G A C A M P U S M A S T E R P L A N D R A F T E I R C H A F F E Y C O M M U N I T Y C O L L E G E D I S T R I C T
5. Environmental Analysis AIR QUALITY
April 2022 Page 5.1-31
Table 5.1-15 Maximum Daily Regional Construction Emissions by Development Phase
Construction Activity
Criteria Air Pollutants (pounds per day)1, 2
VOC NOX CO SO2 PM10 PM2.5
Significant? Yes No No No No No All Activities Overlap Maximum Daily Emissions3 128 35 54 <1 10 4 South Coast AQMD Regional Construction Threshold 75 100 550 150 150 55 Significant? Yes No No No No No Phase 3 Year 2038 Phase 3 Site Preparation <1 2 4 <1 <1 <1 Phase 3 Grading 1 3 5 <1 2 1 Phase 3 Building Construction 1 3 8 <1 <1 <1 Phase 3 Paving 1 3 8 <1 <1 <1 Phase 3 Architectural Coating 93 1 2 <1 <1 <1 Maximum Daily Emissions 93 3 8 <1 2 1 South Coast AQMD Regional Construction Threshold 75 100 550 150 150 55 Significant? Yes No No No No No All Activities Overlap Maximum Daily Emissions3 96 12 27 <1 3 2 South Coast AQMD Regional Construction Threshold 75 100 550 150 150 55 Significant? Yes No No No No No Phase 4 Year 2042 Phase 4 Demolition 1 5 8 <1 2 <1 Phase 4 Site Preparation <1 2 4 <1 <1 <1 Phase 4 Grading 1 2 5 <1 2 1 Phase 4 Building Construction 1 3 8 <1 1 <1 Phase 4 Paving 1 3 8 <1 <1 <1 Phase 4 Architectural Coating 202 1 2 <1 <1 <1 Maximum Daily Emissions 202 5 8 <1 2 1 South Coast AQMD Regional Construction Threshold 75 100 550 150 150 55 Significant? Yes No No No No No All Activities Overlap Maximum Daily Emissions3 204 13 30 <1 3 1 South Coast AQMD Regional Construction Threshold 75 100 550 150 150 55 Significant? Yes No No No No No Phase 5
Year 2049 Phase 5 Demolition 2 7 20 <1 2 1 Phase 5 Site Preparation 2 8 16 <1 9 5 Phase 5 Grading 3 8 23 <1 4 2 Phase 5 Building Construction 1 8 18 <1 1 <1 Year 2050 Phase 5 Building Construction 1 8 18 <1 1 <1 Phase 5 Paving 1 4 16 <1 <1 <1 Phase 5 Architectural Coating 74 1 2 <1 <1 <1

R A N C H O C U C A M O N G A C A M P U S M A S T E R P L A N D R A F T E I R C H A F F E Y C O M M U N I T Y C O L L E G E D I S T R I C T
5. Environmental Analysis AIR QUALITY
Page 5.1-32 PlaceWorks
Table 5.1-15 Maximum Daily Regional Construction Emissions by Development Phase
Construction Activity
Criteria Air Pollutants (pounds per day)1, 2
VOC NOX CO SO2 PM10 PM2.5
Maximum Daily Emissions 74 8 23 <1 9 5 South Coast AQMD Regional Construction Threshold 75 100 550 150 150 55 Significant? No No No No No No All Activities Overlap Maximum Daily Emissions3 83 36 94 <1 17 8 South Coast AQMD Regional Construction Threshold 75 100 550 150 150 55 Significant? Yes No No No No No Source: CalEEMod Version 2020.4.0. Highest winter or summer emissions are reported. 1 Based on the anticipated proposed new buildings and improvements and buildout year. Where specific information regarding project-related construction activities
was not available, construction assumptions were based on CalEEMod defaults. 2 Includes implementation of fugitive dust control measures required by South Coast AQMD under Rule 403, including watering disturbed areas a minimum of two
times per day, reducing speed limit to 15 miles per hour on unpaved surfaces, replacing ground cover quickly, and street sweeping with Rule 1186–compliant sweepers.
3 Based on overlapping of all construction activities. For purposes of this analysis, the maximum daily emissions for each individual construction activity are summed.
As shown in the table, Phase 1 through Phase 5 construction activities could exceed the South Coast AQMD regional significance threshold for VOC. In addition, Phase 1 construction activities could also exceed the South Coast AQMD regional significance threshold for NOX. The primary sources of VOC and NOX during construction would be from the application of paint and exhaust emitted by the operation of off-road vehicles, respectively. VOC is a precursor to the formation of O3 while NOX is a precursor to the formation of both O3 and particulate matter (PM10 and PM2.5). Project-related emissions of VOC and NOX would contribute to the O3, NO2, PM10, and PM2.5 nonattainment designations of the SoCAB. Therefore, project-related construction activities would result in potentially significant regional air quality impacts.
Level of Significance Before Mitigation: Potentially significant impact.
Impact 5.1-3: Long-term operation of the project would not generate additional vehicle trips and associated emissions in exceedance of South Coast AQMD’s threshold criteria. [Threshold AQ-2 [part]]
The following evaluates operation-related impacts associated with the proposed project at full buildout. Implementation of the proposed project would result in direct and indirect criteria air pollutant emissions from transportation, energy (e.g., natural gas use), and area sources (e.g., aerosols and landscaping equipment). Mobile-source criteria air pollutant emissions are based on the traffic analysis conducted by Urban Crossroads (see Appendix G of this DEIR).
Full buildout of the project would generate a net increase of 1,070 ADT (see Appendix G). Overall, under full buildout conditions, the campus would be comprised of 361,815 building square feet of the remaining existing buildings and 396,447 building square feet of new buildings for a total of 758,262 building square feet of campus buildings. Additionally, the total student population would increase by 930 students to a total of 17,404 students and average daily vehicle trips would increase by 1,070 ADTs to a total of 20,052 ADTs. The results of the CalEEMod modeling are shown in Table 5.1-16, Full Buildout: Net Maximum Daily Operation-Phase Emissions. As shown in the table, the net emissions generated from implementation of the proposed project

R A N C H O C U C A M O N G A C A M P U S M A S T E R P L A N D R A F T E I R C H A F F E Y C O M M U N I T Y C O L L E G E D I S T R I C T
5. Environmental Analysis AIR QUALITY
April 2022 Page 5.1-33
would not exceed the South Coast AQMD regional operation-phase significance thresholds. Therefore, long-term air quality impacts would be less than significant.
Table 5.1-16 Full Buildout: Net Maximum Daily Operation-Phase Emissions
Sources Operation-Related Regional Emissions (pounds/day)
VOC NOX CO SO2 PM10 PM2.5 Existing (Buildout Year) Area 13 <1 <1 0 <1 <1 Energy1 <1 3 2 <1 <1 <1 Mobile2 34 20 358 1 120 32
Total 47 23 360 1 120 32 Project (Buildout Year)
Area 17 <1 <1 <1 <1 <1 Energy3 <1 3 3 <1 <1 <1 Mobile2 36 21 378 1 127 34
Total 53 24 381 1 127 34 Net Change (Project – Existing) Net Change 6 2 21 <1 7 2 South Coast AQMD Regional Thresholds 55 55 550 150 150 55
Significant? No No No No No No Source: CalEEMod Version 2020.4.0. Based on highest winter or summer emissions using calendar year 2050 vehicle emissions data. Manual summation of totals and
calculations of net changes may be different from what is shown in the table due to rounding. 1 Utilizes the CalEEMod historical energy rates, which are based on the 2005 Building Energy Efficiency Standards. 2 Based on calendar year 2050 vehicle emissions data. 3 Utilizes the CalEEMod standard default energy rates, which are based on the 2019 Building Energy Efficiency Standards.
Overlap of Construction and Operational Phase
The South Coast AQMD does not have a significance threshold for construction/operation overlap; therefore, this analysis is included for informational purposes only. Table 5.1-17, Potential Overlap of Construction and Operational Activities, shows the overlap of maximum construction and operation emissions based on full buildout of the proposed project. Based on the anticipated implementation schedule for the proposed project, there is potential for overlap between construction (Phases 2 through 5) and operational activity. Table 5.1-17 shows the maximum daily emissions based on the scenario that all construction activities overlapping for Phases 2 through 5 (see Table 5.1-15) and the overall net change in operational-phase daily emissions (see Table 5.1-16). Combining the maximum daily construction emissions with the maximum daily operational emissions would give a maximum daily emission representing peak construction activity and full buildout of the project, a scenario that would not occur because all construction activities would already be completed when the proposed project would operate at full buildout. In addition, there is also the possibility that not all construction activities within a given development phase would occur concurrently, which would result in lower emissions than what is shown in the table below.

R A N C H O C U C A M O N G A C A M P U S M A S T E R P L A N D R A F T E I R C H A F F E Y C O M M U N I T Y C O L L E G E D I S T R I C T
5. Environmental Analysis AIR QUALITY
Page 5.1-34 PlaceWorks
Table 5.1-17 Potential Overlap of Construction and Operational Activities
Scenario Unmitigated Regional Emissions (pounds/day)
VOC NOX CO SO2 PM10 PM2.5 Construction Combined Scenario Maximum Daily Emissions 204 36 94 <1 17 8 Operational Maximum Daily Emissions (Net) 6 2 21 <1 7 2
Max Daily Combined Emissions 210 37 115 <1 24 9 Source: CalEEMod Version 2020.4.0.
Level of Significance Before Mitigation: Less than significant impact.
Impact 5.1-4: The proposed project could expose sensitive receptors to substantial pollutant concentrations. [Threshold AQ-3 [part]]
The proposed project could expose sensitive receptors to elevated pollutant concentrations during construction activities if it would cause or contribute significantly to elevated levels. Unlike the mass of construction and operations emissions shown in the regional emissions analysis in Tables 5.1-15 and 5.1-16, which are described in pounds per day, localized concentrations refer to an amount of pollutant in a volume of air (ppm or µg/m3) and can be correlated to potential health effects.
Construction LSTs
The screening-level LSTs are the amount of project-related emissions at which localized concentrations could exceed the ambient air quality standards for criteria air pollutants for which the SoCAB is designated nonattainment. Screening-level LSTs are based on the proposed project site size and distance to the nearest sensitive receptor. Thresholds are based on the California AAQS, which are the most stringent AAQS, established to provide a margin of safety in the protection of the public health and welfare. They are designed to protect sensitive receptors most susceptible to further respiratory distress, such as asthmatics, the elderly, very young children, people already weakened by other disease or illness, and persons engaged in strenuous work or exercise.
Table 5.1-18, Maximum Daily Onsite Localized Construction Emissions, shows the maximum daily construction emissions (pounds per day) generated during onsite construction activities. Similar to the regional construction emissions analysis under Impact 5.1-1, Table 5.1-18 provides the maximum daily onsite emissions for the individual construction activities in addition to the scenario that all construction activities overlap for each development phase. In addition, the significance determination is also based on the scenario that all construction activities overlap for each development phase. As shown in the table, the maximum daily onsite construction emissions for Phase 1 would exceed the both PM10 and PM2.5 screening-level LSTs. Thus, project-related construction emissions could exceed the California AAQS, and project construction could expose sensitive receptors to substantial pollutant concentrations without mitigation. Therefore, construction activities associated with implementation of proposed project could result in potentially significant localized air quality impacts.

R A N C H O C U C A M O N G A C A M P U S M A S T E R P L A N D R A F T E I R C H A F F E Y C O M M U N I T Y C O L L E G E D I S T R I C T
5. Environmental Analysis AIR QUALITY
April 2022 Page 5.1-35
Table 5.1-18 Maximum Daily Onsite Localized Construction Emissions
Construction Activity
Pollutants (pounds per day)1, 2
NOX CO PM10 PM2.5 Phase 1
Phase 1 Demolition – 2026 19 19 2.20 1.00 Phase 1 Paving – 2027 9 15 0.42 0.39 Phase 1 Architectural Coating – 2027 1 2 0.05 0.05 ≤1.00-Acre Screening-Level LSTs3 118 863 5.00 4.00 Exceeds Screening-Level LSTs? No No No No Phase 1 Building Construction – 2026 12 16 0.53 0.50 Phase 1 Building Construction – 2027 12 16 0.53 0.50 1.31-Acre Screening-Level LSTs3 134 978 5.31 4.31 Exceeds Screening-Level LSTs? No No No No Phase 1 Site Preparation – 2026 25 18 9.49 5.32 3.50-Acre Screening-Level LSTs3 220 1,712 10.99 7.00 Exceeds Screening-Level LSTs? No No No No Phase 1 Grading – 2026 28 26 5.07 2.60 4.00-Acre Screening-Level LSTs3 237 1,872 12.66 7.67 Exceeds Screening-Level LSTs? No No No No All Activities Overlap4 95 93 17.76 9.85 5.00-Acre Screening-Level LSTs3 270 2,193 15.99 9.00 Exceeds Screening-Level LSTs? No No Yes Yes Phase 2 Phase 2 Building Construction – 2030 7 12 0.13 0.13 Phase 2 Building Construction – 2031 7 12 0.13 0.13 Phase 2 Paving – 2031 4 9 0.17 0.17 Phase 2 Architectural Coating – 2031 1 2 0.02 0.02 ≤1.00-Acre Screening-Level LSTs5 118 863 11.36 5.41 Exceeds Screening-Level LSTs? No No No No Phase 2 Demolition – 2030 8 13 1.91 0.47 Phase 2 Site Preparation – 2030 5 6 2.84 1.44 Phase 2 Grading – 2030 6 8 3.21 1.65 1.23-Acre Screening-Level LSTs5 130 946 12.22 5.80 Exceeds Screening-Level LSTs? No No No No All Activities Overlap4 31 50 8.28 3.88 1.23-Acre Screening-Level LSTs5 130 946 12.22 5.80 Exceeds Screening-Level LSTs? No No No No Phase 3 Phase 3 Site Preparation – 2038 2 4 0.26 0.06 Phase 3 Grading – 2038 3 5 2.36 1.19 Phase 3 Building Construction – 2038 3 7 0.04 0.04 Phase 3 Paving – 2038 3 7 0.11 0.11

R A N C H O C U C A M O N G A C A M P U S M A S T E R P L A N D R A F T E I R C H A F F E Y C O M M U N I T Y C O L L E G E D I S T R I C T
5. Environmental Analysis AIR QUALITY
Page 5.1-36 PlaceWorks
Table 5.1-18 Maximum Daily Onsite Localized Construction Emissions
Construction Activity
Pollutants (pounds per day)1, 2
NOX CO PM10 PM2.5 Phase 3 Architectural Coating – 2038 1 2 0.01 0.01 ≤1.00-Acre Screening-Level LSTs5 118 863 11.36 5.41 Exceeds Screening-Level LSTs? No No No No All Activities Overlap4 12 25 2.78 1.40 ≤1.00-Acre Screening-Level LSTs5 118 863 11.36 5.41 Exceeds Screening-Level LSTs? No No No No Phase 4 Phase 4 Demolition – 2042 3 7 1.25 0.22 Phase 4 Site Preparation – 2042 1 4 0.25 0.05 Phase 4 Grading – 2042 2 5 2.33 1.16 Phase 4 Building Construction – 2042 3 7 0.04 0.04 Phase 4 Paving – 2042 3 7 0.08 0.08 Phase 4 Architectural Coating – 2042 1 2 0.01 0.01 ≤1.00-Acre Screening-Level LSTs5 118 863 11.36 5.41 Exceeds Screening-Level LSTs? No No No No All Activities Overlap4 13 33 3.97 1.56 ≤1.00-Acre Screening-Level LSTs5 118 863 11.36 5.41 Exceeds Screening-Level LSTs? No No No No Phase 5
Phase 5 Paving – 2050 4 16 0.12 0.12 Phase 5 Architectural Coating – 2050 1 2 0.01 0.01 ≤1.00-Acre Screening-Level LSTs3 118 863 5.00 4.00 Exceeds Screening-Level LSTs? No No No No Phase 5 Building Construction – 2049 7 16 0.07 0.07 Phase 5 Building Construction – 2050 7 16 0.07 0.07 1.31-Acre Screening-Level LSTs3 134 978 5.31 4.31 Exceeds Screening-Level LSTs? No No No No Phase 5 Demolition – 2049 5 19 1.84 0.42 2.50-Acre Screening-Level LSTs3 187 1,392 7.66 5.67 Exceeds Screening-Level LSTs? No No No No Phase 5 Site Preparation - 2049 8 16 8.61 4.521 3.50-Acre Screening-Level LSTs3 220 1,712 10.99 7.00 Exceeds Screening-Level LSTs? No No No No Phase 5 Grading – 2049 7 22 4.16 1.79 4.00-Acre Screening-Level LSTs3 237 1,872 12.66 7.67 Exceeds Screening-Level LSTs? No No No No All Activities Overlap4 32 90 14.80 6.92

R A N C H O C U C A M O N G A C A M P U S M A S T E R P L A N D R A F T E I R C H A F F E Y C O M M U N I T Y C O L L E G E D I S T R I C T
5. Environmental Analysis AIR QUALITY
April 2022 Page 5.1-37
Table 5.1-18 Maximum Daily Onsite Localized Construction Emissions
Construction Activity
Pollutants (pounds per day)1, 2
NOX CO PM10 PM2.5 5.00-Acre Screening-Level LSTs3 270 2,193 15.99 9.00 Exceeds Screening-Level LSTs? No No No No Source: CalEEMod 2020.4.0; South Coast AQMD 2008; South Coast AQMD 2011b. Highest winter or summer emissions are reported. 1 Based on the anticipated proposed new buildings and improvements and buildout year. Where specific information regarding project-related construction activities
was not available, construction assumptions were based on CalEEMod defaults. 2 Includes implementation of fugitive dust control measures required by South Coast AQMD under Rule 403, including watering disturbed areas a minimum of two
times per day, reducing speed limit to 15 miles per hour on unpaved surfaces, replacing ground cover quickly, and street sweeping with Rule 1186–compliant sweepers.
3 Screening-level LSTs are based on receptors within 82 feet (25 meters). 4 Based on overlapping of all construction activities. For purposes of this analysis, the maximum daily emissions for each individual construction activity are summed. 5 NOX and CO screening-level LSTs are based on receptors within 82 feet (25 meters). PM10 and PM2.5 screening-level LSTs are based on receptors within 140 feet
(43 meters).
Level of significance Before Mitigation: Potentially significant impact.
Impact 5.1-5: Project-related construction activities would not result in potentially significant cancer risk impacts to nearby off-site residences. [Threshold AQ-3 [part]]
The proposed project would temporarily elevate concentrations TACs and DPM in the vicinity of sensitive land uses during construction activities. As stated, South Coast AQMD currently does not require health risk assessments for short-term emissions from construction equipment, which primarily consist of DPM. However, this analysis has been included to conservatively gauge the potential health risk-related impacts of short-term construction activities on off-site sensitive receptors.
The proposed project would be developed over five development phases. It is anticipated that the construction duration of each development phase would last in duration of between 5 to 18 months. In addition, construction would not be continuous, but spread out incrementally over a period between 2026 to 2051, which would limit the exposure to on- and off-site receptors. The US EPA AERMOD, Version 10.2.1, dispersion modeling program was used to estimate excess lifetime cancer risk and chronic non-cancer hazard index for non-carcinogenic risk at the nearest sensitive receptors. Results of the analysis are shown in Table 5.1-19, Construction Risk Summary.
Table 5.1-19 Construction Risk Summary Receptor Cancer Risk (per million) Chronic Hazards
Maximum Exposed Individual Resident 3.93 0.01 Maximum Exposed School Receptor – Banyan Elementary School Students 0.02 0.001
Significance Thresholds 10 1.0 Exceeds Threshold? No No Note: Cancer risk calculated using 2015 OEHHA HRA guidance.
R A N C H O C U C A M O N G A C A M P U S M A S T E R P L A N D R A F T E I R C H A F F E Y C O M M U N I T Y C O L L E G E D I S T R I C T
5. Environmental Analysis AIR QUALITY
Page 5.1-38 PlaceWorks
The results of the HRA are based on the maximum modeled receptor concentration over the construction exposure period, conservatively assuming a 24-hour per day outdoor exposure and averaged over a 70-year lifetime. According to the modeling results, the MEIR is the single-family residence at the Antietam Drive cul-de-sac along the eastern boundary of the campus. The maximum exposed school receptor location lies within the northwestern portion of the Banyan Elementary School campus situated across Banyan Street near the southeast corner of the Rancho Cucamonga campus.
Results of the health risk assessment shown in Table 5.1-19 indicate that the maximum incremental cancer risk during the construction phase of the project at the MEIR is 3.93 per million, which is below the significance threshold of 10 per million. Cancer risk for students at Banyan Elementary School is 0.02 per million and would also not exceed 10 per million. For non-carcinogenic effects, the hazard index identified for each toxicological endpoint totaled less than one for both the MEIR and maximum exposed school receptor. Therefore, chronic non-carcinogenic hazards are within acceptable limits. In addition, because the cancer risk for both the MEIR and maximum exposed school receptor would not exceed the 10 per million threshold, project-related construction activities would result in less than significant health risk impacts.
Level of significance Before Mitigation: Less than significant impact.
Impact 5.1-6: Operation of the proposed project would not expose sensitive receptors to substantial pollutant concentrations. [Threshold AQ-3 [part]]
The following discusses the potential localized air quality impacts from implementation of the proposed project.
Operational LSTs
The screening-level LSTs are the amount of project-related stationary and area sources of emissions at which localized concentrations (ppm or µg/m3) would exceed the ambient air quality standards for criteria air pollutants for which the SoCAB is designated a nonattainment area. The proposed project would primarily involve the construction of new college campus buildings that are not associated with generating a high or substantial number of trucks. Typical sources of criteria air pollutant emissions associated with the proposed project from stationary and area sources include energy use (natural gas used for cooking and water heating) and landscaping fuel and aerosols. Types of land uses that typically generate substantial quantities of criteria air pollutants and TACs include industrial (stationary sources) and warehousing (truck idling) land uses. These types of major air pollutant emissions sources would not be included or expanded under the proposed project. Thus, the proposed project would not result in creation of land uses that would generate substantial concentrations of criteria air pollutant emissions. Therefore, localized operation-related air quality impacts are considered less than significant.
Operational Phase CO Hotspots
As previously stated, areas of vehicle congestion have the potential to create pockets of CO called hotspots. Under existing and future vehicle emission rates, a project would have to increase traffic volumes at a single intersection by more than 44,000 vehicles per hour—or 24,000 vehicles per hour where vertical and/or horizontal air does not mix—in order to generate a significant CO impact (BAAQMD 2017). Under full

R A N C H O C U C A M O N G A C A M P U S M A S T E R P L A N D R A F T E I R C H A F F E Y C O M M U N I T Y C O L L E G E D I S T R I C T
5. Environmental Analysis AIR QUALITY
April 2022 Page 5.1-39
buildout conditions, the proposed project would result in a net increase of 102 peak hour trips (AM and PM). Thus, implementation of the proposed project would not produce the volume of traffic required (i.e., 24,000 to 44,000 peak hour vehicle trips) to generate a CO hotspot. Therefore, implementation of the proposed project would not have the potential to substantially increase CO hotspots at intersections in the vicinity of the campus, and impacts would be less than significant.
Level of significance Before Mitigation: Less than significant impact.
Impact 5.1-7: The proposed project would not result in other emissions that would adversely affect a substantial number of people. [Threshold AQ-4]
Nuisance odors from land uses in the SoCAB are regulated under South Coast AQMD Rule 402, Nuisance, which states:
A person shall not discharge from any source whatsoever such quantities of air contaminants or other material which cause injury, detriment, nuisance, or annoyance to any considerable number of persons or to the public, or which endanger the comfort, repose, health or safety of any such persons or the public, or which cause, or have a natural tendency to cause, injury or damage to business or property. The provisions of this rule shall not apply to odors emanating from agricultural operations necessary for the growing of crops or the raising of fowl or animals.
Construction
During construction activities, construction equipment exhaust and application of asphalt and architectural coatings would temporarily generate odors. Any construction-related odor emissions would be temporary and intermittent. Additionally, noxious odors would be confined to the immediate vicinity of the construction equipment. Based on dispersion characteristics of ultrafine particulate matter including DPM associated with major highways, any odors generated from construction equipment exhaust would dissipate quickly within 100 meters (Zhu et al 2002a; Zhu et al 2002b). Also, construction equipment would not be operating at a single location for an extended period of time, but would generally move throughout the project site. Thus, by the time such emissions reach any sensitive receptor sites, they would be diluted to well below any level of air quality concern. Furthermore, short-term construction-related odors are expected to cease upon the drying or hardening of odor-producing materials. Therefore, impacts associated with construction-generated odors are considered less than significant.
Operation
The type of facilities that are considered to have objectionable odors include wastewater treatment plants, compost facilities, landfills, solid waste transfer stations, fiberglass manufacturing facilities, paint/coating operations (e.g., auto body shops), dairy farms, petroleum refineries, asphalt batch plants, chemical manufacturing, and food manufacturing facilities. The new proposed campus facilities would not fall within the aforementioned types of uses typically associated with creating objectionable odors that could affect a substantial number of people. Additionally, South Coast AQMD Rule 402 would minimize and provide a

R A N C H O C U C A M O N G A C A M P U S M A S T E R P L A N D R A F T E I R C H A F F E Y C O M M U N I T Y C O L L E G E D I S T R I C T
5. Environmental Analysis AIR QUALITY
Page 5.1-40 PlaceWorks
control for odors. Therefore, impacts from potential odors generated from the new proposed facilities associated with the proposed project are considered less than significant.
Level of Significance Before Mitigation: Less than significant impact.
5.1.5 Cumulative Impacts In accordance with South Coast AQMD’s methodology, any project that produces a significant project-level regional air quality impact in an area that is in nonattainment contributes to the cumulative impact. The greatest source of emissions in the SoCAB is mobile sources. Due to the extent of the area potentially impacted from cumulative project emissions (i.e., the SoCAB), South Coast AQMD considers a project cumulatively significant when project-related emissions exceed the South Coast AQMD regional emissions thresholds shown in Table 5.1-6. No significant cumulative impacts were identified with regard to CO hotspots.
Construction
The SoCAB is designated nonattainment for O3 and PM2.5 under the California and National AAQS and nonattainment for PM10 and lead (Los Angeles County only) under the National AAQS. Ozone is created by chemical reactions between NOX and volatile organic compounds; thus, NOX and VOCs are precursor to O3. Furthermore, NOX is also a precursor to PM10 and PM2.5. Construction of cumulative projects will further degrade the regional and local air quality. Overall, air quality from VOCs and NOX would be temporarily impacted during project-related construction activities. However, as discussed below, implementation of mitigation would reduce project-related construction VOC and NOX emissions to below the South Coast AQMD regional significance thresholds on a project and cumulative basis. Therefore, the proposed project’s contribution to cumulative air quality impacts would not be cumulatively considerable with incorporation of mitigation.
Operation
For operational air quality emissions, any project that does not exceed or can be mitigated to less than the daily regional threshold values is not considered by South Coast AQMD to be a substantial source of air pollution and does not add significantly to a cumulative impact. As discussed in the above in Impact 5.1-2, operation of the proposed project would not result in emissions in excess of the South Coast AQMD regional emissions thresholds. Therefore, the air pollutant emissions associated with the proposed project would not be cumulatively considerable and impacts are less than significant.
5.1.6 Level of Significance Before Mitigation Upon implementation of plans, programs, and policies, the following impacts would be less than significant: 5.1-1, 5.1-3, 5.1-5, 5.1-6, and 5.1-7.
Without mitigation, these impacts would be potentially significant:

R A N C H O C U C A M O N G A C A M P U S M A S T E R P L A N D R A F T E I R C H A F F E Y C O M M U N I T Y C O L L E G E D I S T R I C T
5. Environmental Analysis AIR QUALITY
April 2022 Page 5.1-41
Impact 5.1-2 Construction activities associated with the proposed project would generate short-term emissions in exceedance of South Coast AQMD’s regional significance thresholds for VOC and NOX.
Impact 5.1-4 Construction activities associated with the proposed project could expose sensitive receptors to substantial criteria air pollutant concentrations.
5.1.7 Mitigation Measures Impact 5.1-2
AQ-1 The Chaffey Community College District shall include in their construction bid a requirement that the chosen construction contractor(s) shall, at minimum, use equipment that meets the United States Environmental Protection Agency’s (EPA) Tier 4 Interim emissions standards for off-road diesel-powered construction equipment with 50 or more horsepower for all Phase 1 soil disturbing activities (e.g., site preparation and grading), unless it can be demonstrated to the Chaffey Community College District that such equipment is not available. Any emissions control device used by the contractor shall achieve emissions reductions that are no less than what could be achieved by Tier 4 Interim emissions standards for a similarly sized engine, as defined by the California Air Resources Board’s regulations.
Prior to construction, the project engineer shall ensure that all construction (e.g., demolition and grading) plans clearly show the requirement for EPA Tier 4 Interim emissions standards for construction equipment with 50 or more horsepower for the specific activities stated above. During construction, the construction contractor(s) shall maintain a list of all operating equipment in use on the construction site for verification by the Chaffey Community College District. The construction equipment list shall state the makes, models, Equipment Identification Numbers, Engine Family Numbers, and number of construction equipment onsite. Equipment shall be properly serviced and maintained in accordance with the manufacturer’s recommendations. Construction contractors shall also ensure that all nonessential idling of construction equipment is restricted to 5 minutes or less in compliance with Section 2449 of the California Code of Regulations, Title 13, Article 4.8, Chapter 9.
AQ-2 The Chaffey Community College District shall include in their construction bid a requirement that during Phase 1 construction, the chosen construction contractor(s) shall water open exposed surfaces a minimum of three times per day on inactive construction areas consistent with the Best Available Control Measures identified in South Coast Air Quality Management District Rule 403 to minimize fugitive dust emissions generated from ground disturbing activities. Prior to issuance to construction permits, the construction contractor shall note the watering requirement on all construction plans submitted to the Chaffey Community College District.
AQ-3 The Chaffey Community College District shall include in their construction bid a requirement that the chosen construction contractor(s) shall, at minimum, use paints with a volatile organic

R A N C H O C U C A M O N G A C A M P U S M A S T E R P L A N D R A F T E I R C H A F F E Y C O M M U N I T Y C O L L E G E D I S T R I C T
5. Environmental Analysis AIR QUALITY
Page 5.1-42 PlaceWorks
compound (VOC) content of 10 grams per liter (g/L) or less for all interior coatings and paints with a VOC content of 25 g/L or less for all exterior coatings of all the new proposed and renovated buildings designated under Phases 1 through 5. This requirement shall be noted on all construction management plans verified by the Chaffey Community College District prior to issuance of any construction permits and during interior coating activities.
Impact 5.1-4
Implement Mitigation Measures AQ-1 and AQ-2.
5.1.8 Level of Significance After Mitigation Impact 5.1-2
Implementation of Mitigation Measures AQ-1 and AQ-2 would require off-road construction equipment of 50 horsepower or greater used for Phase 1 soil disturbing activities (e.g., site preparation and grading) to be fitted with engines that meet the EPA’s Tier 4 Interim emissions standards and watering active exposed areas at least 3 times per day, respectively. In addition, implementation of Mitigation Measure AQ-3 would require use of low VOC interior and exterior paints for the proposed new buildings and building designated for renovation. As shown in Table 5.1-20, Maximum Daily Regional Construction Emissions by Development Phase: Mitigated, incorporation of Mitigations Measures AQ-1 through AQ-3 would reduce project-related construction emissions of VOC and NOX to below their respective significance thresholds. Therefore, Impact 5.1-2 would be reduced to less than significant.
Table 5.1-20 Maximum Daily Regional Construction Emissions by Development Phase: Mitigated
Construction Activity
Criteria Air Pollutants (pounds per day)1, 2
VOC NOX CO SO2 PM10 PM2.5
Phase 1 Year 2026 Phase 1 Demolition 2 21 20 <1 3 1 Phase 1 Site Preparation 1 12 24 <1 8 4 Phase 1 Grading 1 20 38 <1 4 2 Phase 1 Building Construction 2 17 27 <1 4 2 Year 2027 Phase 1 Building Construction 2 17 26 <1 4 2 Phase 1 Paving 3 9 15 <1 1 <1 Phase 1 Architectural Coating 27 1 4 <1 1 <1 Maximum Daily Emissions 27 21 38 <1 8 4 South Coast AQMD Regional Construction Threshold 75 100 550 150 150 55 Significant? No No No No No No All Activities Overlap Maximum Daily Emissions3 36 80 127 <1 19 9 South Coast AQMD Regional Construction Threshold 75 100 550 150 150 55 Significant? No No No No No No

R A N C H O C U C A M O N G A C A M P U S M A S T E R P L A N D R A F T E I R C H A F F E Y C O M M U N I T Y C O L L E G E D I S T R I C T
5. Environmental Analysis AIR QUALITY
April 2022 Page 5.1-43
Table 5.1-20 Maximum Daily Regional Construction Emissions by Development Phase: Mitigated
Construction Activity
Criteria Air Pollutants (pounds per day)1, 2
VOC NOX CO SO2 PM10 PM2.5
Phase 2 Year 2030 Phase 2 Demolition 1 10 14 <1 2 1 Phase 2 Site Preparation 1 5 6 <1 3 1 Phase 2 Grading 1 6 8 <1 3 2 Phase 2 Building Construction 1 8 14 <1 1 <1 Year 2031 Phase 2 Building Construction 1 8 14 <1 1 <1 Phase 2 Paving 1 4 10 <1 <1 <1 Phase 2 Architectural Coating 25 1 2 <1 <1 <1 Maximum Daily Emissions 25 10 14 <1 3 2 South Coast AQMD Regional Construction Threshold 75 100 550 150 150 55 Significant? No No No No No No All Activities Overlap Maximum Daily Emissions3 29 35 62 <1 9 4 South Coast AQMD Regional Construction Threshold 75 100 550 150 150 55 Significant? No No No No No No Phase 3 Year 2038 Phase 3 Site Preparation <1 2 4 <1 <1 <1 Phase 3 Grading 1 3 5 <1 2 1 Phase 3 Building Construction 1 3 8 <1 <1 <1 Phase 3 Paving 1 3 8 <1 <1 <1 Phase 3 Architectural Coating 19 1 2 <1 <1 <1 Maximum Daily Emissions 19 3 8 <1 2 1 South Coast AQMD Regional Construction Threshold 75 100 550 150 150 55 Significant? No No No No No No All Activities Overlap Maximum Daily Emissions3 21 12 27 <1 3 2 South Coast AQMD Regional Construction Threshold 75 100 550 150 150 55 Significant? No No No No No No Phase 4 Year 2042 Phase 4 Demolition 1 5 8 <1 2 <1 Phase 4 Site Preparation <1 2 4 <1 <1 <1 Phase 4 Grading 1 2 5 <1 2 1 Phase 4 Building Construction 1 3 8 <1 1 <1 Phase 4 Paving 1 3 8 <1 <1 <1 Phase 4 Architectural Coating 40 1 2 <1 <1 <1 Maximum Daily Emissions 40 5 8 <1 2 1 South Coast AQMD Regional Construction Threshold 75 100 550 150 150 55 Significant? No No No No No No All Activities Overlap Maximum Daily Emissions3 43 13 30 <1 3 1

R A N C H O C U C A M O N G A C A M P U S M A S T E R P L A N D R A F T E I R C H A F F E Y C O M M U N I T Y C O L L E G E D I S T R I C T
5. Environmental Analysis AIR QUALITY
Page 5.1-44 PlaceWorks
Table 5.1-20 Maximum Daily Regional Construction Emissions by Development Phase: Mitigated
Construction Activity
Criteria Air Pollutants (pounds per day)1, 2
VOC NOX CO SO2 PM10 PM2.5
South Coast AQMD Regional Construction Threshold 75 100 550 150 150 55 Significant? No No No No No No Phase 5
Year 2049 Phase 5 Demolition 2 7 20 <1 2 1 Phase 5 Site Preparation 2 8 16 <1 9 5 Phase 5 Grading 3 8 23 <1 4 2 Phase 5 Building Construction 1 8 18 <1 1 <1 Year 2050 Phase 5 Building Construction 1 8 18 <1 1 <1 Phase 5 Paving 1 4 16 <1 <1 <1 Phase 5 Architectural Coating 30 1 2 <1 <1 <1 Maximum Daily Emissions 30 8 23 <1 9 5 South Coast AQMD Regional Construction Threshold 75 100 550 150 150 55 Significant? No No No No No No All Activities Overlap Maximum Daily Emissions3 27 36 94 <1 17 8 South Coast AQMD Regional Construction Threshold 75 100 550 150 150 55 Significant? No No No No No No Source: CalEEMod Version 2020.4.0. Highest winter or summer emissions are reported. 1 Based on the anticipated proposed new buildings and improvements and buildout year. Where specific information regarding project-related construction activities
was not available, construction assumptions were based on CalEEMod defaults. 2 Includes implementation of fugitive dust control measures required by South Coast AQMD under Rule 403, including watering disturbed areas a minimum of two
times per day, reducing speed limit to 15 miles per hour on unpaved surfaces, replacing ground cover quickly, and street sweeping with Rule 1186–compliant sweepers. Also includes implementation of Mitigation Measures AQ-1 through AQ-3.
3 Based on overlapping of all construction activities. For purposes of this analysis, the maximum daily emissions for each individual construction activity are summed.
Impact 5.1-4
As shown in Table 5.1-21, Phase I Maximum Daily Onsite Localized Construction Emissions: Mitigated, implementation of Mitigation Measures AQ-1 and AQ-2 would reduce localized onsite emissions for those construction activities that would otherwise exceed the screening-level LSTs without mitigation, to below the South Coast AQMD screening-level construction LSTs. Therefore, Impact 5.1-4 would be reduced to less than significant. No significant and unavoidable impact would remain.

R A N C H O C U C A M O N G A C A M P U S M A S T E R P L A N D R A F T E I R C H A F F E Y C O M M U N I T Y C O L L E G E D I S T R I C T
5. Environmental Analysis AIR QUALITY
April 2022 Page 5.1-45
Table 5.1-21 Phase 1 Maximum Daily Onsite Localized Construction Emissions: Mitigated
Construction Activity
Pollutants (pounds per day)1, 2
NOX CO PM10 PM2.5 Phase 1
Phase 1 Demolition – 2026 19 19 2.20 1.00 Phase 1 Paving – 2027 9 15 0.42 0.39 Phase 1 Architectural Coating – 2027 1 2 0.05 0.05 ≤1.00-Acre Screening-Level LSTs3 118 863 5.00 4.00 Exceeds Screening-Level LSTs? No No No No Phase 1 Building Construction – 2026 12 16 0.53 0.50 Phase 1 Building Construction – 2027 12 16 0.53 0.50 1.31-Acre Screening-Level LSTs3 134 978 5.31 4.31 Exceeds Screening-Level LSTs? No No No No Phase 1 Site Preparation – 2026 12 23 7.35 3.81 3.50-Acre Screening-Level LSTs3 220 1,712 10.99 7.00 Exceeds Screening-Level LSTs? No No No No Phase 1 Grading – 2026 19 37 3.51 1.46 4.00-Acre Screening-Level LSTs3 237 1,872 12.66 7.67 Exceeds Screening-Level LSTs? No No No No All Activities Overlap4 73 112 14.06 7.19 5.00-Acre Screening-Level LSTs3 270 2,193 15.99 9.00 Exceeds Screening-Level LSTs? No No No No Source: CalEEMod 2020.4.0; South Coast AQMD 2008b; South Coast AQMD 2011. Highest winter or summer emissions are reported. 1 Based on the anticipated proposed new buildings and improvements and buildout year. Where specific information regarding project-related construction activities
was not available, construction assumptions were based on CalEEMod defaults. 2 Includes implementation of fugitive dust control measures required by South Coast AQMD under Rule 403, including watering disturbed areas a minimum of two
times per day, reducing speed limit to 15 miles per hour on unpaved surfaces, replacing ground cover quickly, and street sweeping with Rule 1186–compliant sweepers. Also includes implementation of Mitigation Measures AQ-1 and AQ-2.
3 Screening-level LSTs are based on receptors within 82 feet (25 meters). 4 Based on overlapping of all construction activities. For purposes of this analysis, the maximum daily emissions for each individual construction activity are summed. 5 NOX and CO screening-level LSTs are based on receptors within 82 feet (25 meters). PM10 and PM2.5 screening-level LSTs are based on receptors within 140 feet
(43 meters).
5.1.9 References Bay Area Air Quality Management District (BAAQMD). 2017, May. California Environmental Quality Act
Air Quality Guidelines. http://www.baaqmd.gov/~/media/files/planning-and-research/ceqa/ceqa_guidelines_may2017-pdf.pdf?la=en.
California Air Pollution Control Officers Association (CAPCOA). 2021. California Emissions Estimator Model (CalEEMod). Version 2020.4.0. Prepared by: BREEZE Software, A Division of Trinity Consultants in collaboration with South Coast Air Quality Management District and the California Air Districts.
California Air Resources Board (CARB). 1992. Federal Attainment Plan for Carbon Monoxide.

R A N C H O C U C A M O N G A C A M P U S M A S T E R P L A N D R A F T E I R C H A F F E Y C O M M U N I T Y C O L L E G E D I S T R I C T
5. Environmental Analysis AIR QUALITY
Page 5.1-46 PlaceWorks
———. 1993. California Environmental Quality Act Air Quality Handbook.
———. 1998, April 22. The Report on Diesel Exhaust. http://www.arb.ca.gov/toxics/dieseltac/de-fnds.htm.
———. 1999. Final Staff Report: Update to the Toxic Air Contaminant List.
______.2016, May 4. Ambient Air Quality Standards. https://ww2.arb.ca.gov/sites/default/files/2020-07/aaqs2.pdf.
______. 2022a, January 20 (accessed). Area Designations Maps/State and National. https://ww2.arb.ca.gov/resources/documents/maps-state-and-federal-area-designations.
______. 2022b, January 20 (accessed). Common Air Pollutants. https://ww2.arb.ca.gov/resources/common-air-pollutants.
______. 2022c, January 20 (accessed). Top Four Summary. https://www.arb.ca.gov/adam/topfour/topfour1.php
Office of Environmental Health Hazard Assessment (OEHHA). 2015, February. Air Toxics Hot Spots Program Risk Assessment Guidelines. Guidance Manual for Preparation of Health Risk Assessments. http://oehha.ca.gov/air/hot_spots/2015/2015GuidanceManual.pdf.
South Coast Air Quality Management District (South Coast AQMD). 1992. Federal Attainment Plan for Carbon Monoxide.
———. 2003, August. 2003 Air Quality Management Plan. Appendix V. https://www.aqmd.gov/home/air-quality/clean-air-plans/air-quality-mgt-plan/2003-aqmp.
———. 2005, May. Guidance Document for Addressing Air Quality Issues in General Plans and Local Planning. http://www.aqmd.gov/docs/default-source/planning/air-quality-guidance/complete-guidance-document.pdf.
———. 2008, June. Final Localized Significance Threshold Methodology. http://www.aqmd.gov/home/regulations/ceqa/air-quality-analysis-handbook/localized-significance-thresholds.
———. 2011a, December. The Health Effects of Air Pollution. http://www.aqmd.gov/docs/default-source/publications/brochures/the-health-effects-of-air-pollution-brochure.pdf.
———. 2011b. Fact Sheet for Applying CalEEMod to Localized Significance Thresholds. http://www.aqmd.gov/docs/default-source/ceqa/handbook/localized-significance-thresholds/caleemod-guidance.pdf.
———. 2012, May 4. Final 2012 Lead State Implementation Plan: Los Angeles County. http://www3.aqmd.gov/hb/attachments/2011-2015/2012May/2012-May4-030.pdf.

R A N C H O C U C A M O N G A C A M P U S M A S T E R P L A N D R A F T E I R C H A F F E Y C O M M U N I T Y C O L L E G E D I S T R I C T
5. Environmental Analysis AIR QUALITY
April 2022 Page 5.1-47
———. 2013, February. 2012 Final Air Quality Management Plan. http://www.aqmd.gov/home/library/clean-air-plans/air-quality-mgt-plan/final-2012-air-quality-management-plan.
———. 2015, October. “Blueprint for Clean Air: 2016 AQMP White Paper.” 2016 AQMP White Papers Web Page. https://www.aqmd.gov/docs/default-source/Agendas/aqmp/white-paper-working-groups/wp-blueprint-final.pdf?sfvrsn=2.
———. 2017, March 4. Final 2016 Air Quality Management Plan. https://www.aqmd.gov/docs/default-source/clean-air-plans/air-quality-management-plans/2016-air-quality-management-plan/final-2016-aqmp/final2016aqmp.pdf?sfvrsn=15.
———. 2019, April (revised). South Coast AQMD Air Quality Significance Thresholds. http://www.aqmd.gov/docs/default-source/ceqa/handbook/scaqmd-air-quality-significance-thresholds.pdf.
———. 2021, August. MATES V: Multiple Air Toxics Exposure Study in the South Coast AQMD. http://www.aqmd.gov/home/air-quality/air-quality-studies/health-studies/mates-v.
US Environmental Protection Agency (US EPA). 2002, May. Health Assessment Document for Diesel Engine Exhaust. Prepared by the National Center for Environmental Assessment, Washington, DC, for the Office of Transportation and Air Quality; EPA/600/8-90/057F.
———. 2022a, January 30 (accessed). Criteria Air Pollutants. https://www.epa.gov/criteria-air-pollutants.
———. 2022b, January 30 (accessed). Health and Environmental Effects of Hazardous Air Pollutants. https://www.epa.gov/haps/health-and-environmental-effects-hazardous-air-pollutants.
USA.com. 2022, January 16 (accessed). Rancho Cucamonga, CA Weather. http://www.usa.com/rancho-cucamonga-ca-weather.htm.
Zhu, Yifang et al., 2002a, September. “Concentration and Size Distribution of Ultrafine Particles Near a Major Highway,” Journal of the Air & Waste Management Association, 52: 1032-1042.
Zhu, Yifang et al., 2002b, “Study of ultrafine particles near a major highway with heavy-duty diesel traffic,” Atmospheric Environment, 36 (2002): 4323-4335.

R A N C H O C U C A M O N G A C A M P U S M A S T E R P L A N D R A F T E I R C H A F F E Y C O M M U N I T Y C O L L E G E D I S T R I C T
5. Environmental Analysis AIR QUALITY
Page 5.1-48 PlaceWorks
This page intentionally left blank.

R A N C H O C U C A M O N G A C A M P U S M A S T E R P L A N D R A F T E I R C H A F F E Y C O M M U N I T Y C O L L E G E D I S T R I C T
5. Environmental Analysis
April 2022 Page 5.2-1
5.2 BIOLOGICAL RESOURCES The analysis in this section is based in part on the following technical report(s):
Biological Resources Technical Report, Cadre Environmental, February 2021.
A complete copy of this study is included in the technical appendices to this Draft EIR (Appendix D).
5.2.1 Environmental Setting 5.2.1.1 REGULATORY BACKGROUND
Federal and State Regulations
Endangered Species Act
The Federal Endangered Species Act (FESA) of 1973, as amended, protects and conserves any species of plant or animal that is endangered or threatened with extinction, as well as the habitats where these species are found. “Take” of endangered species is prohibited under Section 9 of the FESA. “Take” means to “harass, harm, pursue, hunt, wound, kill, trap, capture, collect, or attempt to engage in any such conduct.” Section 7 of the FESA requires federal agencies to consult with the U.S. Fish and Wildlife Service (USFWS) on proposed federal actions that may affect any endangered, threatened, or proposed (for listing) species or critical habitat that may support the species. Section 4(a) of the FESA requires that critical habitat be designated by the USFWS “to the maximum extent prudent and determinable, at the time a species is determined to be endangered or threatened.” This provides guidance for planners/managers and biologists by indicating locations of suitable habitat and where preservation of a particular species has high priority. Section 10 of the FESA provides the regulatory mechanism for incidental take of a listed species by private interests and nonfederal government agencies during lawful activities. Habitat conservation plans for the impacted species must be developed in support of incidental take permits to minimize impacts to the species and formulate viable mitigation measures.
Migratory Bird Treaty Act
The Migratory Bird Treaty Act of 1918 (MBTA) affirms and implements the United States’ commitment to four international conventions—with Canada, Japan, Mexico, and Russia—to protect shared migratory bird resources. The MBTA governs the take, killing, possession, transportation, and importation of migratory birds, their eggs, parts, and nests. It makes it illegal to “pursue, hunt, take, capture, kill, attempt to take, capture, or kill, possess…any migratory bird…or any part, nest, or egg of any such bird” (16 US Code Sections 703–712). It prohibits the take, possession, import, export, transport, sale, purchase, barter, or offering of these items, except under a valid permit or as permitted in the implementing regulations. USFWS administers permits to take migratory birds in accordance with the MBTA. Unlike the federal Endangered Species Act, which clearly applies to the incidental and unintentional take of listed species, neither the MBTA nor its legislative history address whether the law was intended to prohibit the incidental and unintentional take of migratory birds, or only hunting and other forms of direct, intentional take. As of December 3, 2021, the incidental take of protected migratory birds is prohibited, and violations are subject to discretionary enforcement by the USFWS.
R A N C H O C U C A M O N G A C A M P U S M A S T E R P L A N D R A F T E I R C H A F F E Y C O M M U N I T Y C O L L E G E D I S T R I C T
5. Environmental Analysis BIOLOGICAL RESOURCES
Page 5.2-2 PlaceWorks
Bald Eagle and Golden Eagle Protection Act
The Bald Eagle and Golden Eagle Protection Act explicitly protects the bald eagle and golden eagle and imposes its own prohibition on any taking of these species. As defined in this act, take means to pursue, shoot, shoot at, poison, wound, kill, capture, trap, collect, or molest or disturb. Current USFWS policy is to not refer the incidental take of bald eagles for prosecution under the Bald Eagle and Golden Eagle Protection Act (16 US Code 668–668d).
Clean Water Act, Section 404
The United States Army Corps of Engineers (USACE) regulates discharge of dredged or fill material into “waters of the United States.”1 Any filling or dredging within waters of the United States requires a permit, which entails assessment of potential adverse impacts to USACE wetlands and jurisdictional waters and any mitigation measures that the USACE requires. Section 7 consultation with USFWS may be required for impacts to a federally listed species. If cultural resources may be present, Section 106 review may also be required. When a Section 404 permit is required, a Section 401 Water Quality Certification is also required from the Regional Water Quality Control Board (RWQCB).
Clean Water Act, Section 401and 402
Section 401(a)(1) of the CWA specifies that any applicant for a federal license or permit to conduct any activity that may result in any discharge into navigable waters shall provide the federal permitting agency with a certification, issued by the state in which the discharge originates, that any such discharge will comply with the applicable provisions of the CWA. In California, the applicable RWQCB must certify that the project will comply with water quality standards. Permits requiring Section 401 certification include USACE Section 404 permits and National Pollutant Discharge Elimination System (NPDES) permits issued by the Environmental Protection Agency (EPA) under Section 402 of the CWA. NPDES permits are issued by the applicable RWQCB. The City of Rancho Cucamonga is in the jurisdiction of the Santa Ana RWQCB (Region 8).
California Fish and Game Code, Section 1600
Section 1600 of the California Fish and Game Code requires a project proponent to notify the California Department of Fish and Wildlife (CDFW) of any proposed alteration of streambeds, rivers, and lakes. The intent is to protect habitats that are important to fish and wildlife. CDFW may review and place conditions on the project as part of a Streambed Alteration Agreement that address potentially significant adverse impacts within CDFW’s jurisdictional limits.
1 "Waters of the United States," as applied to the jurisdictional limits of the USACE under the Clean Water Act, includes all waters that are
currently used, were used in the past, or may be susceptible to use in interstate or foreign commerce, including all waters that are subject to the tide; all interstate waters, including interstate wetlands; and all other waters, such as intrastate lakes, rivers, streams (including intermittent streams), mudflats, sandflats, wetlands, sloughs, prairie potholes, wet meadows, playa lakes, or natural ponds whose use, degradation, or destruction could affect interstate or foreign commerce; water impoundments; tributaries of waters; territorial seas; and wetlands adjacent to waters. The terminology used by Section 404 of the Clean Water Act includes “navigable waters,” which is defined at Section 502(7) of the act as “waters of the United States, including the territorial seas.”

R A N C H O C U C A M O N G A C A M P U S M A S T E R P L A N D R A F T E I R C H A F F E Y C O M M U N I T Y C O L L E G E D I S T R I C T
5. Environmental Analysis BIOLOGICAL RESOURCES
April 2022 Page 5.2-3
California Endangered Species Act
The California Endangered Species Act (CESA) generally parallels the main provisions of the FESA and is administered by the CDFW. Its intent is to prohibit take and protect state-listed endangered and threatened species of fish, wildlife, and plants. Unlike its federal counterpart, CESA also applies the take prohibitions to species petitioned for listing (state candidates). Candidate species may be afforded temporary protection as though they were already listed as threatened or endangered at the discretion of the Fish and Game Com-mission. Unlike the FESA, CESA does not include listing provisions for invertebrate species. Under certain conditions, CESA has provisions for take through a 2081 permit or memorandum of understanding. In addition, some sensitive mammals and birds are protected by the state as “fully protected species.” California “species of special concern” are species designated as vulnerable to extinction due to declining population levels, limited ranges, and/or continuing threats. This list is primarily a working document for the CDFW’s California Natural Diversity Database (CNDDB), which maintains a record of known and recorded occurrences of sensitive species. Informally listed taxa are not protected per se, but warrant consideration in the preparation of biological resources assessments.
Nesting Bird Protection, California Fish and Game Code
Nesting birds, including raptors, are protected under California Fish and Game Code Section 3503, which reads, “it is unlawful to take, possess, or needlessly destroy the nest or eggs of any bird, except as otherwise provided by this code or any regulation made pursuant thereto.” In addition, under California Fish and Game Code Section 3503.5, “it is unlawful to take, possess, or destroy any birds in the orders Falconiformes or Strigiformes (birds-of-prey) or to take, possess, or destroy the nest or eggs of any such bird except as otherwise provided by this code or any regulation adopted pursuant thereto.” Passerines and non-passerine land birds are further protected under California Fish and Game Code Section 3513.
Fish and Game Code Section 3800 indicates that all birds occurring naturally in California that are not resident game birds, migratory game birds, or fully protected birds are nongame birds. And it is unlawful to take any nongame bird except as provided in the California Fish and Game Code.
Pursuant to these code sections, CDFW recommends surveys for nesting birds that could potentially be directly (e.g., actual removal of trees/vegetation) or indirectly (e.g., noise disturbance) impacted by project-related activities. Disturbance during the breeding season could result in the incidental loss of fertile eggs or nestlings or lead to nest abandonment. Disturbance that causes nest abandonment and/or loss of reproductive effort is considered “take” by CDFW.
Migratory Bird Protection
Take or possession any migratory nongame bird, as designated in the MBTA, is prohibited by Section 3513 of the Fish and Game Code.
Streambed Alteration Permits
California Fish and Game Code Sections 1601 to 1607 prohibit alteration of any lake or streambed under CDFW jurisdiction, including intermittent and seasonal channels and many artificial channels, without

R A N C H O C U C A M O N G A C A M P U S M A S T E R P L A N D R A F T E I R C H A F F E Y C O M M U N I T Y C O L L E G E D I S T R I C T
5. Environmental Analysis BIOLOGICAL RESOURCES
Page 5.2-4 PlaceWorks
execution of a Lake and Streambed Alteration Agreement through CDFW. This applies to any channel modifications that would be required to meet drainage, transportation, or flood control objectives.
Native Plant Protection Act
The Native Plant Protection Act (NPPA) of 1977 (Fish and Game Code §§ 1900–1913) directed CDFW to carry out the legislature's intent to “preserve, protect and enhance rare and endangered plants in this State.” The NPPA gave the California Fish and Game Commission the power to designate native plants as “endangered” or “rare” and protected endangered and rare plants from take. The NPPA thus includes measures to preserve, protect, and enhance rare and endangered native plants.
CESA has largely superseded NPPA for all plants designated endangered by the NPPA. The NPPA nevertheless provides limitations on take of rare and endangered species: “...no person will import into this state, or take, possess, or sell within this state” any rare or endangered native plant, except in compliance with provisions of the CESA (14 CCR § 783.1). Individual land owners are required to notify the CDFW at least 10 days in advance of changing land uses to allow the CDFW to salvage any rare or endangered native plant material.
Local Regulations
City of Rancho Cucamonga Tree Preservation Ordinance
The City’s Municipal Code Chapter 17.80, Tree Preservation, provides provisions to protect the eucalyptus windrow, and Municipal Code Section 17.16.080, Tree Removal Permit, is intended to protect trees defined as heritage trees. According to the City ordinance, "heritage trees" means any tree, shrub, or plant that meets at least one of the following criteria: 1) all eucalyptus windrows; 2) all woody plants in excess of 30 feet in height and having a single trunk circumference of 20 inches or more, as measured four and a half feet from ground level; 3) multitrunk tree(s) having a total circumference of 30 inches or more, as measured 24 inches from ground level; 4) a stand of trees, the nature of which makes each dependent upon the others for survival; or 5) any other tree that may be deemed historically or culturally significant by the City’s Planning Director because of size, condition, location, or aesthetic qualities. Removal of heritage trees requires a tree removal permit from the City’s Planning Director.
5.2.1.2 EXISTING CONDITIONS
Field Survey
As part of the Biological Resources Technical Report, a reconnaissance survey of the biological resources study area was conducted by Ruben Ramirez of Cadre Environmental on January 13, 2021, as shown on Figure 5.2-1, Biological Resources Study Area and Vegetation Communities. The survey characterized and identified potential sensitive plant and wildlife habitats and verified the accuracy of the data identified in the literature search. Geologic and soil maps were examined to identify local soil types that may support sensitive taxa. Aerial photographs, topographic maps, and vegetation and rare plant maps prepared for previous studies in the region were used to determine community types and other physical features that may support sensitive plants/wildlife, uncommon taxa, or rare communities in or adjacent to the study area. Habitat assessments were conducted for the following target species/groups.

1 inch = 300 ft.
Figure 3 - Vegetation Communities MapBiological Resources Technical ReportChaffey College Rancho Cucamonga Campus Master Plan
CADREEnvironmental
APN 201-191-15
Hav
en A
venu
e
Banyan StreetMerlot Court
Wilson Avenue
Panther Drive
College Drive
Nature PreserveNature Preserve
Hav
en A
venu
e
Banyan StreetMerlot Court
Wilson Avenue
Panther Drive
College Drive
Study Area BoundaryStudy Area Boundary
Study Area Boundary
Study Area Boundary
PROJECT SITE BOUNDARYPROJECT SITE BOUNDARY
Mule Fat Scrub
Developed (Ornamental Landscaping)
Coastal Sage Scrub
Legend
Disturbed
Open Water
DEVDEV
CSSCSS
DISDIS
MFSMFS
OWOW
DEVDEV
CSSCSS
DISDISMFSMFS
OWOW
CSSCSS
CSSCSS
DISDIS
DISDIS
DEVDEV
DEVDEV
DEVDEV
DEVDEV
DEVDEV
CSSCSSCSSCSS
DISDIS
DISDIS
CSSCSS
CSSCSS
CSSCSS
Drainage
DEVDEV
DEVDEV
PlaceWorksSource: Cadre, 2021
Figure 5.2-1 - Biological Resources Study Area and Vegetation Communities5. Environmental Analysis
0
Scale (Feet)
600
R A N C H O C U C A M O N G A C A M P U S M A S T E R P L A N D R A F T E I RC H A F F E Y C O M M U N I T Y C O L L E G E D I S T R I C T

R A N C H O C U C A M O N G A C A M P U S M A S T E R P L A N D R A F T E I R C H A F F E Y C O M M U N I T Y C O L L E G E D I S T R I C T
5. Environmental Analysis BIOLOGICAL RESOURCES
Page 5.2-6 PlaceWorks
This page intentionally left blank.

R A N C H O C U C A M O N G A C A M P U S M A S T E R P L A N D R A F T E I R C H A F F E Y C O M M U N I T Y C O L L E G E D I S T R I C T
5. Environmental Analysis BIOLOGICAL RESOURCES
April 2022 Page 5.2-7
Coastal California gnatcatcher
Least Bell’s vireo
Burrowing owl Southwestern willow flycatcher
San Bernardino kangaroo rat
Sensitive plants Protected trees (Rancho Cucamonga Municipal Code, Chapter 17.80, Tree Preservation)
Existing Vegetation Communities
The site survey found that the 163.32-acre study area is dominated by developed/ornamental landscaping, coastal sage scrub, disturbed, mule fat scrub, and open water vegetation communities, as illustrated in Figure 5.2-1 and summarized in Table 5.2-1, Vegetation Community Acreages. The study area soil type is Soboba gravelly loamy sand (SoC) with 0 to 9 percent slopes, except for an area of less than 6 acres along the southern property line that consists of Soboba stony loamy sand (SpC) with 2 to 9 percent slopes.
Table 5.2-1 Vegetation Community Acreages Vegetation Community Acres
Developed/Ornamental Landscaping 149.18 Coastal Sage Scrub 8.52 Disturbed 5.35 Open Water (Detention Basin) 0.23 Mule Fat Scrub 0.04
Total 163.32
Developed/Ornamental Landscaping
The majority of the study area is developed with the college campus and dominated by structures, roads, ornamental shrubs, trees and turf. Ornamental planted vegetation documented in the study area includes but is not limited to Peruvian peppertree (Schinus molle), magnolia (Magnolia grandiflora), Chinese elm (Ulmus parvifolia), bottlebrush (Callistemon sp.), Brazilian peppertree (Schinus terebinthifolia), pines (Pinus sp.), coast redwood (Sequoia sempervirens), Brisbane box (Lophostemon confertus), oleander (Nerium oleander), Pampas grass (Cortaderia selloana), olive (Olea europaea), holly oak (Quercus ilex), Mexican fan palm (Washingtonia robusta), queen palm (Syagrus romanzoffiana), jacaranda (Jacaranda mimosifolia), lantana (Lantana camara), lowboy (Acacia redolens), western sycamore (Platanus racemosa), California ash (Fraxinus dipetala), eucalyptus (Eucalyptus globulus), and fountain grass (Pennisetum setaceum).
Coastal Sage Scrub
Coastal sage scrub extends primarily adjacent to the southwestern study area boundary. This vegetation community represents a remnant of alluvial fan sage scrub habitat. However, the necessary fluvial, periodic flooding and scouring required to sustain alluvial fan sage scrub no longer exists. This conclusion is supported

R A N C H O C U C A M O N G A C A M P U S M A S T E R P L A N D R A F T E I R C H A F F E Y C O M M U N I T Y C O L L E G E D I S T R I C T
5. Environmental Analysis BIOLOGICAL RESOURCES
Page 5.2-8 PlaceWorks
by the dense canopy cover of this vegetation community, dominance of California sagebrush (Artemisia californica) and California buckwheat (Eriogonum fasciculatum) and lack of scale-broom (Lepidospartum squamatum). Additional species documented in this vegetation community include thickleaf yerba santa (Eriodictyon crassifolium), hollyleaf cherry (Prunus ilicifolia), chamise (Adenostoma fasciculatum), blue elderberry (Sambucus cerulea), pinebush (Ericameria pinifolia), and tobacco tree (Nicotiana glauca).
Disturbed
Several regions of disturbed habitat are in the Study Area. These areas are dominated by black mustard (Brassica nigra), tocalote (Centaurea melitensis), red-stemmed filaree (Erodium cicutarium), white-stemmed filaree (Erodium moschatum), prickly lettuce (Lactuca serriola), Russian thistle (Kali tragus), foxtail chess (Bromus madritensis ssp. rubens), telegraph weed (Heterotheca grandiflora), annual bursage (Ambrosia acanthicarpa), ripgut grass (Bromus diandrus), wild oat (Avena fatua), and tumbling pigweed (Amaranthus albus).
Mule Fat Scrub
A single small distressed patch (0.04 acre) of mule fat scrub is at the terminus of a drainage which extends through the coastal sage scrub in the southwestern region of the study area. This vegetation community is dominated by mule fat (Baccharis salicifolia).
Open Water
A single inundated detention basin is in the eastern region of the study area. This open water area is bordered by disturbed coastal sage scrub habitat.
General Wildlife Species
General wildlife species documented on-site or within the vicinity during the site assessment include but are not limited to red-tailed hawk (Buteo jamaicensis), mourning dove (Zenaida macroura), rock dove (Columba livia), Anna’s hummingbird (Calypte anna), black phoebe (Sayornis nigricans), northern flicker (Colaptes auratus), western scrub jay (Aphelocoma californica), California towhee (Melozone crissalis), spotted towhee (Pipilo maculatus), wrentit (Chamaea fasciata), bushtit (Psaltriparus minimus), yellow-rumped warbler (Setophaga coronata), Say’s phoebe (Sayornis saya), American crow (Corvus brachyrhynchos), northern mockingbird (Mimus polyclottos), white-crowned sparrow (Zonotrichia leucophrys), lesser goldfinch (Spinus psaltria), Lawrence’s goldfinch (Spinus lawrencei), house sparrow (Passer domesticus), house finch (Haemorhous mexicanus), and desert cottontail (Sylvilagus audubonii).
Jurisdictional Waters and Wetland Resources
A single wetland (open water) and potential jurisdictional resources (drainages in the southwestern region of study area), as shown in Figure 5.2-1.
Wildlife Movement Corridors
Based on the literature review, analysis of the aerial photograph, and direct observations made in the field survey, the project site is surrounded by urbanized uses, including residential development and high-traffic roadways, and does not represent a wildlife movement corridor or route between open space habitats.

R A N C H O C U C A M O N G A C A M P U S M A S T E R P L A N D R A F T E I R C H A F F E Y C O M M U N I T Y C O L L E G E D I S T R I C T
5. Environmental Analysis BIOLOGICAL RESOURCES
April 2022 Page 5.2-9
5.2.1.3 SENSITIVE RESOURCES
Sensitive biological resources are habitats or individual species that have special recognition by federal, state, or local conservation agencies and organizations as endangered, threatened, or rare. The CDFW, USFWS, and special groups like the California Native Plant Society (CNPS) maintain watch lists of such resources. For the purpose of this analysis, sources used to determine the sensitive status of biological resources are:
Plants: USFWS (2020), CNDDB (CDFW 2020a), CDFW (2020d, 2020e), CNPS (2020), and Skinner and Pavlik (1994).
Wildlife: California Wildlife Habitat Relationships (2008), USFWS (2020), CNDDB (CDFW 2020a), and CDFW (2020b, 2020c).
Habitats: CNDDB (CDFW 2020a, 2020f).
Sensitive Plants
The study area was assessed to determine the potential for 36 sensitive plant species, known to appear in the region, to appear on-site. As shown in Table 5.2-2, Sensitive Plant Species Assessment, no suitable habitat or baseline conditions for federal- or state-listed threatened or endangered plant species were documented in the study area. However, suitable low- to moderate-quality habitat for eight regionally sensitive plant species was documented in the coastal sage scrub habitats in the southwest part of the study area:
Plummer’s mariposa-lily
Catalina mariposa-lily Peninsular spineflower
Parry’s spineflower
Paniculate tarplant
Robinson’s pepper-grass
Brand’s star phacelia White-rabbit tobacco

R A N C H O C U C A M O N G A C A M P U S M A S T E R P L A N D R A F T E I R C H A F F E Y C O M M U N I T Y C O L L E G E D I S T R I C T
5. Environmental Analysis BIOLOGICAL RESOURCES
Page 5.2-10 PlaceWorks
Table 5.2-2 Sensitive Plant Species Assessment Common Name Scientific Name Status Habitat Description Comments Singlewhorl burrobrush
Ambrosia monogyra
CRPR 2B.2 Perennial shrub which generally blooms from August to November within chaparral or Sonoran Desert scrub in sandy substrates (CNPS 2021)
Not observed or expected on-site based on a lack of detection or suitable habitat.
Nevin’s barberry
Berberis nevinii CRPR 1B.1 FE/SE
Perennial evergreen shrub which generally blooms from February to June within chaparral, cismontane woodland, coastal scrub, and riparian scrub in sandy, gravelly substrates (CNPS 2021)
Not observed on-site.
Slender mariposa lily
Calochortus clavatus var. gracilis
CRPR 1B.2 Perennial bulbiferous herb which generally blooms from June to July within coastal bluff scrub, chaparral (maritime), lower montane coniferous forest (CNPS 2021)
Not expected on-site based on a lack of suitable habitat.
Plummer’s mariposa-lily
Calochortus plummerae
CRPR 4.2 Perennial bulbiferous herb which generally blooms from May to June within chaparral, cismontane woodland, coastal scrub, lower montane coniferous forest, and grassland habitats with granite and rocky substrates. (CNPS 2021)
The coastal sage scrub and associated substrates provide suitable habitat for this species.
Smooth tarplant
Centromadia pungens ssp. laevi
CRPR 1B.1 Annual herb which generally blooms from April to September within chenopod scrub, meadows and seeps, playas, riparian woodland, valley and foothill grassland (alkaline substrates). (CNPS 2021)
Not expected on-site based on a lack of suitable habitat and alkaline substrates.
Catalina mariposa-lily
Calochortus catalinae
CRPR 4.2 Perennial bulbiferous herb which generally blooms from March to June within chaparral, cismontane woodland, valley grassland, and coastal sage scrub (CNPS 2021)
The coastal sage scrub and associated substrates provide suitable habitat for this species.
Peninsular spineflower
Chorizanthe leptotheca
CRPR 4.2 Annual herb which generally blooms from May to August within chaparral, coastal scrub, lower montane coniferous forest in alluvial fan, granitic substrates. (CNPS 2021)
The coastal sage scrub and associated substrates provide suitable habitat for this species.
Parry’s spineflower
Chorizanthe parryi var. parryi
CRPR 1B.1 Annual herb which generally blooms from April to June within chaparral, cismontane woodland, coastal scrub and grassland habitats with sandy and/or rocky openings. (CNPS 2021)
The coastal sage scrub and associated substrates provide suitable habitat for this species.
White-bracted spineflower
Chorizanthe xanti var. leucotheca
CRPR 1B.2 Annual herb which generally blooms from April to June within coastal scrub (alluvial fans), Mojavean desert scrub, pinyon and juniper woodland in sandy or gravelly substrates. (CNPS 2021)
Not expected on-site based on a lack of suitable habitat.
California saw-grass
Cladium californicum
CRPR 2B.2 Perennial rhizomatous herb which generally blooms from June to September within meadows, seeps, marshes and swamps in both alkaline and freshwater. (CNPS 2021)
Not detected or expected on-site based on a lack of suitable habitat.
Peirson’s spring beauty
Claytonia lanceolata var. peirsonii
CRPR 3.1 Perennial herb which generally blooms from March to June within subalpine coniferous forest and upper montane coniferous forest. (CNPS 2021)
Not detected or expected on-site based on a lack of suitable habitat.

R A N C H O C U C A M O N G A C A M P U S M A S T E R P L A N D R A F T E I R C H A F F E Y C O M M U N I T Y C O L L E G E D I S T R I C T
5. Environmental Analysis BIOLOGICAL RESOURCES
April 2022 Page 5.2-11
Table 5.2-2 Sensitive Plant Species Assessment Common Name Scientific Name Status Habitat Description Comments Paniculate tarplant
Deinandra paniculata
CRPR 4.2 Annual herb which generally blooms from March to November within coastal sage scrub, valley foothill grassland, and vernal pools with sandy substrates. (CNPS 2021)
The coastal sage scrub and associated substrates provide suitable habitat for this species.
Slender-horned spineflower
Dodecahema leptoceras
CRPR 1B.1 FE/SE
Annual herb which generally blooms from April to June within chaparral, cismontane woodland, and coastal scrub (alluvial fan) with sandy substrates. (CNPS 2021)
Not expected on-site based on a lack of suitable habitat.
Many-stemmed dudleya
Dudleya multicaulis
CRPR 1B.2 Perennial herb which generally blooms from April to July within chaparral, coastal scrub, and valley and foothill grassland often associated with clay substrates. (CNPS 2021)
Not detected or expected on-site based on a lack of suitable substrates.
Santa Ana River woollystar
Eriastrum densifolium ssp. sanctorum
CRPR 1B.1 FE/SE
Perennial herb which generally blooms from April to September within chaparral, coastal scrub (alluvial fan) in sandy and gravelly substrates. (CNPS 2021)
Not detected on-site.
Vanishing wild buckwheat
Eriogonum evanidum
CRPR 1B.1 Annual herb which generally blooms from July to October within chaparral, cismontane woodland, lower montane coniferous forest, and pinyon and juniper woodland in sandy and gravelly substrates. (CNPS 2021)
Not expected on-site based on a lack of suitable habitat
San Gabriel bedstraw
Galium grande CRPR 1B.2 Perennial deciduous shrub which generally blooms from January to July within broad-leafed upland forest, chaparral, cismontane woodland, and lower montane coniferous forest habitats. (CNPS 2021)
Not detected on-site.
Mesa horkelia Horkelia cuneata ssp. puberula
CRPR 1B.1 Perennial herb which generally blooms from February to September within chaparral (maritime), cismontane woodland, and coastal scrub with sandy or gravelly substrates. (CNPS 2021)
Not detected on-site.
Southern California black walnut
Juglans californica CRPR 4.2 Perennial deciduous tree which generally blooms from March to August in chaparral, cismontane woodland, coastal scrub, and riparian woodland in alluvial soils. (CNPS 2021)
Not detected on-site.
Robinson’s pepper-grass
Lepidium virginicum var. robinsonii
CRPR 4.3 Annual herb which generally blooms from January to July within chaparral and coastal sage scrub habitats. (CNPS 2021)
The coastal sage scrub and associated substrates provide suitable habitat for this species.
Lemon lily Lilium parryi CRPR 1B.2 Perennial bulbiferous herb which generally blooms from July to August within lower montane coniferous forest, meadows and seeps, riparian forest, and upper montane coniferous forest (CNPS 2021)
Not expected on-site based on a lack of suitable habitat.
San Gabriel linanthus
Linanthus concinnus
CRPR 1B.2 Annual herb which generally blooms from April to July within chaparral, lower/upper montane coniferous forest in rocky openings. (CNPS 2021)
Not expected on-site based on a lack of suitable habitat.
Parish’s desert-thorn
Lycium parishii CRPR 2B.3 Perennial shrub generally blooms from March to April within coastal scrub and Sonoran Desert scrub. (CNPS 2021)
Not detected on-site.

R A N C H O C U C A M O N G A C A M P U S M A S T E R P L A N D R A F T E I R C H A F F E Y C O M M U N I T Y C O L L E G E D I S T R I C T
5. Environmental Analysis BIOLOGICAL RESOURCES
Page 5.2-12 PlaceWorks
Table 5.2-2 Sensitive Plant Species Assessment Common Name Scientific Name Status Habitat Description Comments Hall’s monardella
Monardella macrantha ssp. hallii
CRPR 1B.3 Perennial rhizomatous herb which generally blooms from June to October within broadleaf upland forest, chaparral, cismontane woodland, lower montane coniferous forest, valley and foothill grassland. (CNPS 2021)
Not detected or expected on-site based on a lack of suitable habitat.
California muhly
Muhlenbergia californica
CRPR 4.3 Perennial rhizomatous herb which generally blooms from June to September within mesic, seeps and streambanks, coastal scrub, chaparral, lower montane coniferous forest and meadows. (CNPS 2021)
Not expected on-site based on a lack of suitable habitat.
Prostrate vernal pool navarretia
Navarretia prostrata
CRPR 1B.1 Annual herb which generally blooms from April to July in coastal sage scrub, meadows and seeps, valley and foothill grassland (alkaline), vernal pools. (CNPS 2021)
Not expected on-site based on a lack of suitable habitat.
Woolly mountain-parsley
Oreonana vestita CRPR 1B.3 Perennial herb which generally blooms from March to September within lower montane coniferous forest, subalpine coniferous forest, upper coniferous forest within gravel or talus substrates (CNPS 2021)
Not expected on-site based on a lack of suitable habitat.
Rock Creek broomrape
Orobanche valida ssp. valida
CRPR 1B.2 Perennial herb (parasitic) which generally blooms from May to September within chaparral and pinyon and juniper woodland in granitic substrates. (CNPS 2021)
Not expected on-site based on a lack of suitable habitat.
Brand’s star phacelia
Phacelia stellaris CRPR 1B.18 FC
Annual herb which generally blooms from March to June within coastal dunes and coastal scrub habitats. (CNPS 2021)
The coastal sage scrub and associated substrates provide suitable habitat for this species.
White-rabbit tobacco
Pseudognaphalium leucocephalum
CRPR 2B.2 Perennial herb which generally blooms from July to August within chaparral, cismontane woodland, coastal scrub, and riparian woodland with sandy or gravelly substrates. (CNPS 2021)
The coastal sage scrub and associated substrates provide suitable habitat for this species.
Sanford’s arrowhead
Sagittaria sanfordii CRPR 1B.2 Perennial rhizomatous herb which generally blooms from May to November near marshes and swamps. (CNPS 2021).
Not expected on-site based on a lack of suitable habitat.
Salt spring checkerbloom
Sidalcea neomexicana
CRPR 2.2 Perennial herb which generally blooms from March to June within chaparral, coastal scrub, lower montane coniferous forest, Mojavean desert scrub, and playas within alkaline and mesic substrates gravelly substrates. (CNPS 2021)
Not expected on-site based on a lack of suitable habitat and soils.
Laguna Mountains jewelflower
Streptanthus bernardinus
CRPR 4.3 Perennial herb which generally blooms from May to August within chaparral, lower montane coniferous forest. (CNPS 2021)
Not expected on-site based on a lack of suitable habitat.
San Bernardino aster
Symphyotrichum defoliatum
CRPR 1B.2 Perennial rhizomatous herb which generally blooms from July to November near ditches, streams, springs in cismontane woodland, coastal scrub, lower montane coniferous forest, meadows and seeps, marshes and swamps, and valley and foothill grassland (vernally mesic). (CNPS 2021).
Not expected on-site based on a lack of suitable habitat.

R A N C H O C U C A M O N G A C A M P U S M A S T E R P L A N D R A F T E I R C H A F F E Y C O M M U N I T Y C O L L E G E D I S T R I C T
5. Environmental Analysis BIOLOGICAL RESOURCES
April 2022 Page 5.2-13
Table 5.2-2 Sensitive Plant Species Assessment Common Name Scientific Name Status Habitat Description Comments Greata’s aster Symphyotrichum
greatae CRPR 1B.3 Perennial rhizomatous herb which generally
blooms from June to October within broad-leaved upland forest, chaparral, cismontane woodland, lower montane coniferous forest and riparian woodland habitats. (CNPS 2021)
Not expected on-site based on a lack of suitable habitat.
California Native Plant Society California Rare Plant Rank (CRPR) CRPR 1A: plants presumed extinct in California CRPR 1B: plants rare, threatened, or endangered in California and elsewhere CRPR 2A: plants presumed extirpated in California but common elsewhere CRPR 2B: plants rare, threatened, or endangered in California but more common elsewhere CRPR 3: plants about which we need more information, a review list CRPR 4: plant species of limited distribution in California (i.e., naturally rare in the wild), but whose existence does not appear to be susceptible to threat, a watch list x.1: Seriously endangered in California x.2: Fairly endangered in California x.3: Not very endangered in California
Federal (USFWS) Protection and Classification FE: Federally Endangered FT: Federally Threatened FC: Federal Candidate for Listing
State (CDFW) Protection and Classification SE: State Endangered ST: State Threatened
Sensitive Wildlife
The study area was assessed to determine the potential for 28 sensitive wildlife species, known to appear in the region, to appear on-site. As shown in Table 5.2-3, Sensitive Wildlife Species Assessment, suitable habitat for one federal- or state-listed threatened or endangered wildlife species, and suitable low- to moderate-quality habitat for six regionally sensitive wildlife species were documented in the coastal sage scrub and disturbed habitats in the southwest and eastern regions of the study area, as listed:
Federal and State
Coastal California gnatcatcher
Regional
Coast horned lizard
Cooper's hawk
Southern California rufous-crowned sparrow
Burrowing owl
Northwestern San Diego pocket mouse Desert San Diego woodrat
The study area is not in or adjacent to a USFWS-designated critical habitat for any federally listed threatened or endangered species.

R A N C H O C U C A M O N G A C A M P U S M A S T E R P L A N D R A F T E I R C H A F F E Y C O M M U N I T Y C O L L E G E D I S T R I C T
5. Environmental Analysis BIOLOGICAL RESOURCES
Page 5.2-14 PlaceWorks
Table 5.2-3 Sensitive Wildlife Species Assessment Species Name Scientific Name Status Habitat Description Comments
INVERTEBRATES Delhi sands flower-loving fly
Rhaphiomidas terminatus abdominalis
FE Restricted to Delhi sand formations in Riverside and San Bernardino counties.
Not expected on-site based on a lack of suitable soils.
AMPHIBIANS Arroyo toad Anaxyrus
californicus FE/SSC Shallow, slow-moving active and braided
stream channels with sandy substrates for breeding, bench and terrace habitats for foraging and aestivation, willow scrub, coastal sage scrub, and riparian/oak woodlands.
Not expected on-site based on a lack of suitable breeding and upland habitat.
Southern mountain yellow-legged frog
Rana muscosa FE/SE/CWL Southern California Distinct
Population Segment
In close proximity to lakes, streams, pools in rocky tributaries and canyons.
Not expected on-site based on a lack of suitable breeding habitat.
REPTILES Coast horned lizard
Phrynosoma blainvillii
SSC Primarily scrub, chaparral, and grassland habitats.
The coastal sage scrub and associated substrates provide suitable habitat for this species.
BIRDS Cooper's hawk Accipiter cooperii SSC Most commonly in or adjacent to riparian/oak
forest and woodland habitats. This uncommon resident of California increases in numbers during winter migration.
Cooper’s hawks occasionally nest in large pines and Eucalyptus trees. The mature ornamental trees in the study area are potential nesting habitat for this species.
Sharp-shinned hawk
Accipiter striatus) CWL Potential habitat includes montane coniferous forest for potential breeding areas and riparian scrub, woodland, forest, oak woodland chaparral, and scrub habitats for foraging.
Not expected to breed on-site based on a lack of suitable habitat.
Southern California rufous-crowned sparrow
Aimophila ruficeps canescens)
CWL A nonmigratory bird species that primarily lives in sage scrub and grassland habitats and to a lesser extent chaparral subassociations. Generally breeds on the ground in grassland and scrub communities in the western and central regions of California.
The coastal sage scrub is suitable foraging and breeding habitat for this species.
Golden eagle Aquila chrysaetos CWL, SFP
Within southern California, the species prefers grasslands, brushlands (coastal sage scrub and chaparral), deserts, oak savannas, open coniferous forests, and montane valleys.
Not expected to breed on-site based on a lack of suitable habitat.
Burrowing owl Athene cunicularia SSC Predominantly open land, including grassland, agriculture (e.g., dry-land farming and grazing areas), playa, and sparse coastal sage scrub and desert scrub habitats. Some breeding owls are year-round residents, and additional individuals from the north may winter throughout the region.
No occupied burrows were documented in the study area. However, this species may occupy the disturbed habitats in the eastern region of the study area during annual migration.

R A N C H O C U C A M O N G A C A M P U S M A S T E R P L A N D R A F T E I R C H A F F E Y C O M M U N I T Y C O L L E G E D I S T R I C T
5. Environmental Analysis BIOLOGICAL RESOURCES
April 2022 Page 5.2-15
Table 5.2-3 Sensitive Wildlife Species Assessment Species Name Scientific Name Status Habitat Description Comments
Northern harrier Circus cyaneus SSC Open wetlands, wet and lightly grazed pastures, old fields, dry uplands, upland prairies, mesic grasslands, drained marshlands, croplands, shrub-steppe, meadows, grasslands, open rangelands, desert sinks, fresh and saltwater emergent wetlands; seldom found in wooded areas.
Not expected on-site based on a lack of suitable habitat.
Western yellow-billed cuckoo
Coccyzus americanus occidentalis
FT/SE Dense riparian and shrub communities. Not expected on-site based on a lack of suitable riparian habitat.
White-tailed kite
Elanus leucurus SFP Riparian, oak woodlands adjacent to open spaces including grasslands, wetlands, savannahs and agricultural fields. A nonmigratory bird in lower elevations of California.
Not expected to breed on-site based on a lack of suitable habitat.
Southwestern willow flycatcher
Empidonax traillii extimus
FE/SE Breeds in dense riparian and shrub communities where exposed water is present including rivers, wetlands, and reservoirs.
Not expected on-site based on a lack of suitable riparian habitat
Merlin Falco columbarius CWL Transient in the spring and fall and may occasionally winter in the area. It does not require specific conditions or locations for nesting because it does not nest in the region.
Not expected on-site. Breeds in the northern Great Plains.
Prairie falcon Falco mexicanus CWL Annual grasslands to alpine meadows. Associated primarily with perennial grasslands, savannahs, rangeland, some agricultural fields during the winter season, and desert scrub areas, all typically dry environments of western North American where there are cliffs or bluffs for nest sites.
Not expected to breed on-site based on a lack of suitable habitat.
American peregrine falcon
Falco peregrinus anatum
SFP A large variety of open habitats, including tundra, marshes, seacoasts, savannahs, and high mountains.
Not expected to breed on-site based on a lack of suitable habitat.
Yellow-breasted chat
Icteria virens SSC Associated with riparian woodland and riparian scrub habitats.
Not expected on-site based on a lack of suitable riparian habitat
Coastal California gnatcatcher
Polioptila californica californica
FT/SSC A nonmigratory bird, primarily in sage scrub habitats in coastal southern California dominated by California sagebrush.
The coastal sage scrub is suitable foraging and breeding habitat for this species.
Yellow warbler Setophaga petechia
SSC Habitat characteristics include riparian scrub, forest and woodland vegetation.
Not expected on-site based on a lack of suitable riparian habitat.
Least Bell's vireo
Vireo bellii pusillus FE/SE Riparian habitats with a well-defined understory including southern willow scrub, mule fat, and riparian forest/woodland habitats.
Not expected on-site based on a lack of suitable riparian habitat.
MAMMALS Pallid bat Antrozous pallidus SSC Roosts in rocky areas and forages in
grassland, shrublands, and woodlands. Not expected on-site based on a lack of suitable habitat

R A N C H O C U C A M O N G A C A M P U S M A S T E R P L A N D R A F T E I R C H A F F E Y C O M M U N I T Y C O L L E G E D I S T R I C T
5. Environmental Analysis BIOLOGICAL RESOURCES
Page 5.2-16 PlaceWorks
Table 5.2-3 Sensitive Wildlife Species Assessment Species Name Scientific Name Status Habitat Description Comments
Northwestern San Diego pocket mouse
Chaetodipus fallax fallax
SSC Coastal sage, upland sage scrubs, and alluvial fan sage scrub, sage scrub/grassland ecotones, chaparral, and desert scrubs at all elevations up to 6,000 feet.
The coastal sage scrub is suitable habitat for this species.
San Bernardino kangaroo rat
Dipodomys merriami parvus
FE/SSC Prefers alluvial scrub, coastal sage scrub habitats with sandy and gravelly substrates.
Although suitable soils were documented on-site, the species is not expected on-site based on a lack of suitable habitat. The mature thick canopy does not provide suitable habitat for this species.
Western mastiff bat
Eumops perotis californicus
SSC Roosts in rocky areas and forages in grassland, shrublands, and woodlands.
Not expected on-site based on a lack of suitable habitat.
Western yellow bat
Lasiurus xanthinus
SSC Roosts in the skirts of palm trees and forages in adjacent habitats.
Not expected on-site based on a lack of suitable foraging habitat in the vicinity of the study area.
San Diego black-tailed jackrabbit
Lepus californicus bennettii
SSC Open habitats, primarily grasslands, sage scrub, alluvial fan sage scrub, and Great Basin sage scrub.
Not observed or expected on-site based on a lack of suitable habitat and no sign of burrow structures.
Desert San Diego woodrat
Neotoma lepida intermedia
SSC Sage scrub and chaparral with rock outcrops, boulders, cactus patches, and dense undergrowth.
The coastal sage scrub is suitable habitat for this species.
Los Angeles pocket mouse
Perognathus longimembris brevinasus
SSC Low elevation grassland alluvial sage scrub and coastal sage scrub habitats.
Not expected on-site based on a lack of suitable habitat. The mature thick canopy does not provide suitable habitat for this species.
Federal (USFWS) Protection and Classification FE: Federally Endangered FT: Federally Threatened FC: Federal Candidate for Listing State (CDFW) Protection and Classification SE: State Endangered ST: State Threatened SSC: State Species of Special Concern CWL: California Watch List SPF: State Fully Protected
5.2.2 Thresholds of Significance According to Appendix G of the CEQA Guidelines, a project would normally have a significant effect on the environment if the project would:
B-1 Have a substantial effect, either directly or through habitat modifications, on any species identified as a candidate, sensitive, or special status species in local or regional plans, policies, or regulations, or by the California Department of Fish and Game or U.S. Fish and Wildlife Service.

R A N C H O C U C A M O N G A C A M P U S M A S T E R P L A N D R A F T E I R C H A F F E Y C O M M U N I T Y C O L L E G E D I S T R I C T
5. Environmental Analysis BIOLOGICAL RESOURCES
April 2022 Page 5.2-17
B-2 Have a substantial adverse effect on any riparian habitat or other sensitive natural community identified in local or regional plans, policies, regulations, or by the California Department of Fish and Game or U.S. Fish and Wildlife Service.
B-3 Have a substantial adverse effect on state or federally protected wetlands (including, but not limited to, marsh, vernal pool, coastal, etc.) through direct removal, filling, hydrological interruption, or other means.
B-4 Interfere substantially with the movement of any native resident or migratory fish or wildlife species or with established native resident or migratory wildlife corridors or impede the use of native wildlife nursery sites.
B-5 Conflict with any local policies or ordinances protecting biological resources, such as a tree preservation policy or ordinance.
B-6 Conflict with the provisions of an adopted habitat Conservation Plan, Natural Community Conservation Plan, or other approved local, regional, or state habitat conservation plan.
5.2.3 Plans, Programs, and Policies Plans, programs, and policies (PPP), including applicable regulatory requirements and project design features for biological resources, are identified below.
PPP BIO-1 In compliance with California Fish and Game Code Sections 3503, 3503.5, 3513, and 3800, the proposed project shall avoid the incidental loss of fertile eggs or nestlings or other activities that lead to nest abandonment. Chaffey Community College District is required to conduct a preconstruction survey prior to removal of nesting habitat if construction-related vegetation removal occurs during nesting season (typically between February 1 and August 31). Construction outside the nesting season (between September 1st and January 31st) do not require preconstruction nesting bird surveys.
5.2.4 Environmental Impacts 5.2.4.1 IMPACT ANALYSIS
The following impact analysis addresses the thresholds of significance; the applicable thresholds are identified in brackets after the impact statement.
Impact 5.2-1: The proposed project could have a substantial effect, either directly or through habitat modifications, on any species identified as a candidate, sensitive, or special status species in local or regional plans, policies, or regulations, or by the California Department of Fish and Game or U.S. Fish and Wildlife Service. [Threshold B-1]
As discussed in Section 5.2.1.3, Sensitive Resources, suitable habitat for the federally threatened and state species of special concern coastal California gnatcatcher was detected in areas of the project site mapped as coastal

R A N C H O C U C A M O N G A C A M P U S M A S T E R P L A N D R A F T E I R C H A F F E Y C O M M U N I T Y C O L L E G E D I S T R I C T
5. Environmental Analysis BIOLOGICAL RESOURCES
Page 5.2-18 PlaceWorks
sage scrub. There is also a possibility of state species of special concern burrowing owl colonization in the disturbed habitats of the eastern region of the project site during annual migration. The proposed project would disturb or eliminate approximately 1.91 acres of potentially suitable habitat (coastal sage scrub) on the project site, as shown in Figure 5.2-2, Biological Resources Impact Areas. Impacts to the 1.91 acres of coastal sage scrub that these identified species could potentially occupy would be a significant impact that requires mitigation.
No suitable habitat for federal- or state-listed plant species was documented within the project site. As described in Tables 5.2-2 and 5.2-3, suitable habitat exists in the coastal sage scrub habitat of the project site for four sensitive wildlife species: coast horned lizard, southern California rufous-crowned sparrow, northwestern San Diego pocket mouse, and desert San Diego woodrat, and eight sensitive floral species: Plummer’s mariposa-lily, Catalina mariposa-lily, peninsular spineflower, Parry’s spineflower, paniculate tarplant, Robinson’s pepper-grass, Brand’s star phacelia, and white-rabbit tobacco.
As shown in Table 5.2-3, coast horned lizard, northwestern San Diego pocket mouse, and desert San Diego woodrat are listed as State Species of Special Concern (SSC) and southern California rufous-crowned sparrow is listed as California Watch List (CWL) by the CDFW classification. The goal of designating SSCs is to halt or reverse their decline by calling attention to their plight and addressing the issues of concern early enough to secure their long-term viability. Not all SSCs have declined equally; some species may be just starting to decline, while others may have already reached the point where they meet the criteria for listing as a threatened or endangered under state and/or federal endangered species acts. The four listed wildlife species are still common and the loss of 1.91-acre of isolated suitable habitat would not result in a substantial effect on these species because there are approximately 3,700 acres of contiguous Riversidean alluvial fan sage scrub open space vegetation in the Etiwanda Heights Neighborhood and Conservation Plan (EHNCP) approximately 2,500 feet northeast of the project site. The EHNCP, adopted in October 2019, establishes three new conservation areas between the northern portion of Rancho Cucamonga and the San Bernardino National Forest. The intent of the EHNCP is to conserve the area’s natural and rural character, recreational and habitat resources, and visual qualities for future generations. The proposed project would result in impacts to 1.9 acres of isolated native habitats surrounded by residential development. However, there are other larger areas of open space that support high quality habitat near the project site that could support the special status wildlife species, thereby ensuring that existing and potential occurrences of these impacted species within northeastern Rancho Cucamonga are sustainable. Therefore, impacts to these wildlife species would not be considered significant.

1 inch = 300 ft.
Figure 9 - Vegetation Communities Impact MapBiological Resources Technical ReportChaffey College Rancho Cucamonga Campus Master Plan
CADREEnvironmental
APN 201-191-15
Hav
en A
venu
e
Banyan StreetMerlot Court
Wilson Avenue
Panther Drive
College Drive
Nature PreserveNature Preserve
Hav
en A
venu
e
Banyan StreetMerlot Court
Wilson Avenue
Panther Drive
College Drive
Study Area BoundaryStudy Area Boundary
Study Area Boundary
Study Area Boundary
PROJECT SITE BOUNDARYPROJECT SITE BOUNDARY
Mule Fat Scrub
Developed (Ornamental Landscaping)
Coastal Sage Scrub
Legend
Disturbed
Open Water
DEVDEV
CSSCSS
DISDIS
MFSMFS
OWOW
DEVDEV
CSSCSS
DISDISMFSMFS
OWOW
CSSCSS
CSSCSS
DISDIS
DISDIS
DEVDEV
DEVDEV
DEVDEV
DEVDEV
DEVDEV
CSSCSSCSSCSS
DISDIS
DISDIS
CSSCSS
CSSCSS
CSSCSS
Proposed Facilities Removed
Proposed New Buildings
Proposed Renovations
Proposed Circulation, Parking, AccessImprovements
Drainage
PlaceWorksSource: Cadre, 2021
Figure 5.2-2 - Biological Resources Impact Areas5. Environmental Analysis
0
Scale (Feet)
600
R A N C H O C U C A M O N G A C A M P U S M A S T E R P L A N D R A F T E I RC H A F F E Y C O M M U N I T Y C O L L E G E D I S T R I C T

R A N C H O C U C A M O N G A C A M P U S M A S T E R P L A N D R A F T E I R C H A F F E Y C O M M U N I T Y C O L L E G E D I S T R I C T
5. Environmental Analysis BIOLOGICAL RESOURCES
Page 5.2-20 PlaceWorks
This page intentionally left blank.

R A N C H O C U C A M O N G A C A M P U S M A S T E R P L A N D R A F T E I R C H A F F E Y C O M M U N I T Y C O L L E G E D I S T R I C T
5. Environmental Analysis BIOLOGICAL RESOURCES
April 2022 Page 5.2-21
As shown in Table 5.2-2, Plummer’s mariposa-lily, Catalina mariposa-lily, Peninsular spineflower, and paniculate tarplant are listed as CRPR 4.2, and Robinson’s pepper-grass is listed as CRPR 4.3. CRPR 4.2 and 4.3 includes plant species are on the watch-list with limited distribution in California (i.e., naturally rare in the wild), but whose existence does not appear to be susceptible to threat. Many of the species in CRPR 4 listing are placed on the list and removed as additional survey data finds that the species are more common than previously thought. Parry’s spineflower and Brand’s star phacelia are listed as CRPR 1B. CRPR 1B includes plants that are rare, threatened, or endangered in California and elsewhere. White-rabbit tobacco is listed as CRPR 2B.2, which includes plant species that are rare in California but more common outside of California. Although these plant species have special status, impacts to the 1.91 acres of coastal sage scrub habitat would not result in significant impacts to these species because the project site has been previously disturbed and is bordered by residential development, therefore, the project site does not provide any long-term conservation value or local contribution to the species persistence. Furthermore, as discussed above, the approximately 3,700 acres of contiguous Riversidean alluvial fan sage scrub open space vegetation in the nearby EHNCP would provide high quality habitat for these impacted special status species. And although not part of the EHNCP, a portion of Deer Creek, approximately 1,000 feet east of the project site also provides Riversidean alluvial fan sage scrub.
Therefore, these species would remain regionally widespread and would not substantially reduce or threaten the regional or local populations of these species below self-sustaining levels. Impacts to the four wildlife species and eight floral species would be less than significant.
Level of Significance Before Mitigation: Potentially significant impact.
Impact 5.2-2: The proposed project would not have a substantial adverse effect on any riparian habitat or other sensitive natural community identified in local or regional plans, policies, regulations, or by the California Department of Fish and Wildlife or U.S. Fish and Wildlife Service. [Threshold B-2]
As described in Section 5.2.1.2 under “Existing Vegetation Communities,” the project site contains a single small distressed patch (0.04 acre) of mule fat scrub (Baccharis salicifolia) at the end of a drainage that extends through the coastal sage scrub in the southwestern region of the project site. Mule fat is generally, but not exclusively, found near wetlands, riparian areas, and moist valleys. As shown in Figure 5.2-2, Biological Resources Impact Areas, the proposed project would not directly or indirectly disturb the 0.04-acre of mule fat scrub area during any phase. Therefore, the proposed project would not impact the mule fat community. Figure 5.2-2 also shows coastal sage scrub totaling 8.52 acres that extends primarily adjacent to the southwestern boundary of the project site. This vegetation community represents a remnant of alluvial fan sage scrub habitat (sensitive habitat). Alluvial fan sage scrub is a subtype of coastal sage scrub found on the alluvial fans and flood plains of the coastal side of the San Bernardino and San Gabriel Mountains. However, the alluvial fan sage scrub habitat no longer provides necessary fluvial, periodic flooding and scouring required to sustain alluvial fan sage scrub. This conclusion is supported by the dense canopy cover of this vegetation community, the dominance of California sagebrush and California buckwheat, and the lack of scale-broom, which warrant classification as coastal sage scrub. Therefore, although some of the sage scrub community would be impacted by the proposed project, the impacts would not be considered significant.

R A N C H O C U C A M O N G A C A M P U S M A S T E R P L A N D R A F T E I R C H A F F E Y C O M M U N I T Y C O L L E G E D I S T R I C T
5. Environmental Analysis BIOLOGICAL RESOURCES
Page 5.2-22 PlaceWorks
Level of Significance Before Mitigation: Less than significant impact.
Impact 5.2-3: The proposed project could have a substantial adverse effect on federally protected wetlands as defined by Section 404 of the Clean Water Act (including, but not limited to, marsh, vernal pool, coastal, etc.) through direct removal, filling, hydrological interruption, or other means. [Threshold B-3]
As shown in Figure 5.2-2, a single wetland (open water) is present south of the natural preserve, and there are drainages in the southwestern area of the project site that could be potential jurisdictional resources regulated by the USACE, CDFW, and/or RWQCB. The drainages flow westward to a basin across Haven Avenue to the west. Implementation of the proposed project would impact these wetlands. Federally protected wetlands are regulated by the USACE, CDFW, or RWQCB, and disturbances require jurisdictional delineation to determine the extent of resources on-site. Prior to disturbance of any drainages and open water, the District will be required to obtain all applicable permits from the resources agencies, which may include 404 Nationwide Permit from the USACE, 1602 Streambed Alteration Agreement from CDFW, and a 401 Certification issued by the RWQCB pursuant to the California Water Code Section 13260. Implementation of the proposed project could result in substantial adverse effects to wetlands as defined by Section 404 of the Clean Water Act.
Level of Significance Before Mitigation: Potentially significant impact.
Impact 5.2-4: The proposed project would not interfere substantially with the movement of any native resident or migratory fish or wildlife species or with established native resident or migratory wildlife corridors, or impede the use of native wildlife nursery sites. However, the proposed project could adversely impact nesting habitat for common and sensitive birds and raptors. [Threshold B-4]
The project site is surrounded by urbanized uses, including residential development and high-traffic roadways, and does not represent a wildlife movement corridor or route between open space habitats. The existing Nature Preserve at the northeast corner of the campus would not be impacted by the proposed project. The open water detention basin does not contain any migratory fish or wildlife species. The native and nonnative ornamental vegetation, trees, and shrubs within the project site are expected to potentially provide nesting habitat for common and sensitive bird and raptors (including the Cooper’s hawk).
As described in Section 5.2.1.1, Regulatory Background, CDFG Code Section 3503 protects nesting habitat for common and sensitive bird and raptors and requires compliance. Therefore, if any phase of construction is proposed between February 1 and August 31, a qualified biologist must conduct a preconstruction nesting bird survey(s) no more than three days prior to initiation of grading to document the presence or absence of nesting birds or raptors within or directly adjacent (100 feet) to the impact area. Construction outside the nesting season (between September 1 and January 31) does not require preconstruction nesting bird surveys.
Level of Significance Before Mitigation: Potentially significant impact.

R A N C H O C U C A M O N G A C A M P U S M A S T E R P L A N D R A F T E I R C H A F F E Y C O M M U N I T Y C O L L E G E D I S T R I C T
5. Environmental Analysis BIOLOGICAL RESOURCES
April 2022 Page 5.2-23
Impact 5.2-5: The proposed project would not conflict with any local policies or ordinances protecting biological resources, such as a tree preservation policy or ordinance. [Threshold B-5]
The City of Rancho Cucamonga’s tree preservation ordinance regulates the removal of trees that are considered a community resource. The City’s Municipal Code Chapter 17.80, Tree Preservation, provides provisions to protect the eucalyptus windrow, and Municipal Code Section 17.16.080, Tree Removal Permit, is intended to protect trees defined as heritage trees as described in Section 5.2.1.1, Local Regulations subheading. Removal of a heritage tree requires a tree removal permit from the City’s planning director. However, the District is its own lead agency and is not subject to the City’s tree preservation ordinance and the tree removal permit. Therefore, the City’s tree preservation ordinance is not applicable to the proposed project. There are no local policies or ordinances protecting biological resources that are applicable to the proposed project. No impact would occur.
Level of Significance Before Mitigation: No impact.
Impact 5.2-6: The proposed project would not conflict with the provisions of an adopted habitat conservation plan; native community conservation plan; or other approved local, regional, or state habitat conservation plan. [Threshold B-5]
There is no habitat conservation plan; natural community conservation plan; or other approved local, regional, or state habitat conservation plan in the City of Rancho Cucamonga. Therefore, implementation of all phases of the project would not result in a conflict with the provisions of an adopted habitat conservation plan, and no impact would occur.
Level of Significance Before Mitigation: No impact.
5.2.5 Cumulative Impacts The proposed project is within the limits of the existing Rancho Cucamonga campus. As discussed above, the proposed project would not contribute substantially to loss of protected natural habitats or other biological resources provided that existing regulatory requirements and mitigation measures are incorporated. The proposed project would occur over approximately 30 years and based on the General Plan Update Volume 1: Vision’s Figure V-1, “Degrees of Change Map”, the areas surrounding the project site are projected to see limited and moderate changes. Limited change is defined in the GPU as areas of the city where the general character, uses, and activities of the area will remain the same but be enhanced in limited ways. Moderate change is defined as areas where moderate development change is desired and planned for 15 years or beyond. Specific construction projects and their buildout schedule in the Moderate Change areas, where potential development could occur, are unknown at this time and therefore speculative. Although limited and moderate changes are anticipated in the areas surrounding the project site, as development projects occur in the city, they would also have to meet existing requirements to reduce impacts related to biological resources to a less than significant level. Implementation of the proposed project combined with the cumulative projects in the city would not incrementally result in significant biological resources. No adverse cumulative impacts would occur.
R A N C H O C U C A M O N G A C A M P U S M A S T E R P L A N D R A F T E I R C H A F F E Y C O M M U N I T Y C O L L E G E D I S T R I C T
5. Environmental Analysis BIOLOGICAL RESOURCES
Page 5.2-24 PlaceWorks
5.2.6 Level of Significance Before Mitigation Upon implementation of plans, programs, and policies, the following impacts would be less than significant: 5.2-2, 5.2-5, and 5.2-6.
Without mitigation, these impacts would be potentially significant:
Impact 5.2-1 Disturbance of on-site coastal sage scrub habitat could result in adverse impacts to coastal California gnatcatcher and burrowing owl.
Impact 5.2-3 The proposed project could potentially disturb federally protected wetlands.
Impact 5.2-4 The proposed project could potentially impact nesting birds.
5.2.7 Mitigation Measures Impact 5.2-1
BIO-1 Prior to initiating any phase of the project that could directly or indirectly impact coastal sage scrub habitat, the Chaffey Community College District shall retain a qualified biologist to perform focused U.S. Fish and Wildlife Service (USFWS) protocol surveys to determine the presence/absence of the coastal California gnatcatcher. Focused surveys for the coastal California gnatcatcher will follow the USFWS protocol guidelines for conducting breeding or nonbreeding season coastal California gnatcatcher surveys. Specifically, nine nonbreeding or six breeding season surveys shall be conducted within all suitable coastal sage scrub habitats on the project site, depending on the season surveys are initiated. Surveys shall only be conducted between the hours of 6:00 am and 12:00 pm when weather conditions provide conditions for high bird activity. Taped coastal California gnatcatcher vocalization shall be played during the surveys in an effort to elicit a response from the species.
If the species is not detected within or adjacent to the phased action area of the project site, no further action is required for this species. However, if the species is detected within or adjacent to the action area of the project site, formal consultation with the USFWS is required, and an appropriate take permit must be acquired.
BIO-2 Prior to initiation of on-site grading activities within any phase of the project resulting in direct impacts to disturbed habitat, the Chaffey Community College District shall retain a qualified biologist to conduct a preconstruction survey for burrowing owls. The survey shall be conducted 14 days prior to construction activities within the disturbed regions of the phased action area. If ground-disturbing activities are delayed or suspended for more than 14 days after the preconstruction survey, the site shall be resurveyed for burrowing owls.
If owls are determined to be present within or adjacent to the phased construction footprint, they shall be captured and relocated. The preconstruction survey and any relocation activity shall be conducted in accordance with the California Department of Fish and Wildlife

R A N C H O C U C A M O N G A C A M P U S M A S T E R P L A N D R A F T E I R C H A F F E Y C O M M U N I T Y C O L L E G E D I S T R I C T
5. Environmental Analysis BIOLOGICAL RESOURCES
April 2022 Page 5.2-25
(CDFW) Staff Report on Burrowing Owl Mitigation, 2012. According to CDFW guidelines, mitigation actions will be conducted from September 1 to January 31, which is prior to the nesting season. However, burrowing owl nesting activity is variable, and so the time frame will be adjusted accordingly. Should eggs or fledglings be discovered in any owl burrow, the burrow cannot be disturbed (pursuant to CDFW guidelines) until the young have hatched and fledged (matured to a stage that they can leave the nest on their own). Occupied burrows shall not be disturbed during the nesting season (February 1 through August 31) unless a qualified biologist approved by CDFW verifies through noninvasive methods that: a) the adult birds have not begun egg-laying and incubation; or b) the juveniles from the occupied burrows are foraging independently and are capable of independent survival. If a biologist is unable to verify one of these conditions, no disturbance shall occur within 300 feet of the burrowing owls nest during the breeding season to avoid abandonment of the young.
Impact 5.2-3
BIO-3 Prior to issuance of grading or construction permits in phases potential directly or indirectly impacting wetlands or jurisdictional resources, the Chaffey Community College District (District) shall conduct a formal jurisdictional delineation to determine the extent of resources on-site regulated by the US Army Corps of Engineer (USACE), California Department of Fish and Wildlife (CDFW), or Regional Water Quality Control Board (RWQCB). The District shall also obtain all applicable permits, which may include 404 Nationwide Permit from the USACE, 1602 Streambed Alteration Agreement from CDFW, and a 401 Certification issued by the RWQCB pursuant to the California Water Code Section 13260.
Impact 5.2-4
BIO-4 If any phase of construction is proposed between February 1st and August 31st, a qualified biologist shall conduct a nesting bird survey(s) no more than three (3) days prior to initiation of grading to document the presence or absence of nesting birds within or directly adjacent (100 feet) to the area of disturbance.
The survey(s) shall focus on identifying any raptors and/or bird nests that are directly or indirectly affected by construction activities. If active nests are documented, species-specific measures will be prepared by a qualified biologist and implemented to prevent abandonment of the active nest. At a minimum, grading in the vicinity of a nest shall be postponed until the young birds have fledged. The perimeter of the nest setback zone shall be fenced or adequately demarcated with stakes and flagging at 20-foot intervals, and construction personnel and activities restricted from the area.
A qualified biologist shall serve as a construction monitor during those periods when construction activities occur near active nest areas to ensure that no inadvertent impacts on these nests occur.

R A N C H O C U C A M O N G A C A M P U S M A S T E R P L A N D R A F T E I R C H A F F E Y C O M M U N I T Y C O L L E G E D I S T R I C T
5. Environmental Analysis BIOLOGICAL RESOURCES
Page 5.2-26 PlaceWorks
5.2.8 Level of Significance After Mitigation Impact 5.2-1
Implementation of the proposed project would disturb coastal sage scrub habitat, which could result in adverse impacts to special status species such as California gnatcatchers (FT/SSC) and burrowing owls (SSC). However, implementation of Mitigation Measures BIO-1 and BIO-2 would ensure that appropriate surveys are performed prior to any ground-disturbing activities during any phase of the project, thereby reducing impacts to a less than significant level. No significant and unavoidable impact would remain.
Impact 5.2-3
Implementation of the proposed project could disturb drainages at the southwest corner of the project site and an open water basin south of the Nature Preserve that may be considered wetlands regulated by the USACE, CDFW, or RWQCB. However, implementation of Mitigation Measure BIO-3 would require a formal jurisdictional delineation to be performed prior to any ground-disturbing activities near these wetland areas, and all applicable permits would need to be obtained, which may include 404 Nationwide Permit from the USACE, 1602 Streambed Alteration Agreement from CDFW, and a 401 Certification issued by the RWQCB pursuant to the California Water Code Section 13260. Therefore, impacts would be reduced to a less than significant level, and no significant and unavoidable impact would remain.
Impact 5.2-4
Removal of the native and nonnative ornamental vegetation, trees, and shrubs within the project site during nesting season (between February 1 and August 31) could potentially impact common and sensitive birds and raptors. However, implementation of MM BIO-4 would require the preconstruction survey that would reduce impacts to migratory birds to a less than significant level. No significant and unavoidable impact would remain.
5.2.9 References Cadre Environmental (Cadre). 2021, March. Biological Resources Technical Report. DEIR Appendix D.
Rancho Cucamonga, City of. Rancho Cucamonga Municipal Code. http://qcode.us/codes/ranchocucamonga/.

R A N C H O C U C A M O N G A C A M P U S M A S T E R P L A N D R A F T E I R C H A F F E Y C O M M U N I T Y C O L L E G E D I S T R I C T
5. Environmental Analysis
April 2022 Page 5.3-1
5.3 CULTURAL RESOURCES This section of the Draft Environmental Impact Report (DEIR) evaluates the potential for implementation of the proposed Master Plan to impact cultural resources. Cultural resources comprise archaeological and historical resources. Archaeology studies human artifacts, such as places, objects, and settlements that reflect group or individual religious, cultural, or everyday activities. Historical resources include sites, structures, objects, or places that are at least 50 years old and are significant for their engineering, architecture, cultural use or association, etc. In California, historic resources cover human activities over the past 12,000 years. This section of the Draft EIR evaluates the potential for implementation of the proposed project to impact cultural resources based in part on the following information:
Draft Cultural Resources Technical Report for Chaffey College Master Plan Update, Rancho Cucamonga Campus, ASM Affiliates, April 2021
A complete copy of this study is in Appendix E of this Draft EIR.
5.3.1 Environmental Setting 5.3.1.1 REGULATORY BACKGROUND
Federal
National Historic Preservation Act
The National Historic Preservation Act of 1966 coordinates public and private efforts to identify, evaluate, and protect the nation’s historic and archaeological resources. The act authorized the National Register of Historic Places (NRHP), which lists districts, sites, buildings, structures, and objects that are significant in American history, architecture, archaeology, engineering, and culture.
Section 106 (Protection of Historic Properties) of the act requires federal agencies to take into account the effects of their undertakings on historic properties. Section 106 Review ensures that historic properties are considered during federal project planning and implementation. The Advisory Council on Historic Preservation, an independent federal agency, administers the review process with assistance from state historic preservation offices.
National Register of Historic Places
The National Register of Historic Places (NRHP) is authorized by the National Historic Preservation Act of 1966 (Code of Federal Regulations, Title 36, Chapter I, Part 60). It is the nation’s official list of buildings, structures, objects, sites, and districts worthy of preservation because of their significance in American history, architectures, archaeology, engineering, and culture. The NRHP recognizes resources of local, state, and national significance that have been documented and evaluated according to uniform standards and criteria.
The NRHP is administered by the National Park Service. Properties are nominated by the State Historic Preservation Officer of the state in which the property is located, by the Federal Preservation Officer for

R A N C H O C U C A M O N G A C A M P U S M A S T E R P L A N D R A F T E I R C A F F E Y C O M M U N I T Y C O L L E G E D I S T R I C T
5. Environmental Analysis CULTURAL RESOURCES
Page 5.3-2 PlaceWorks
properties under federal ownership or control, or by the Tribal Historic Preservation Officer if a property is on tribal lands.
To be eligible for listing in the National Register, a resource must meet at least one of the following criteria:
A. Is associated with events that have made a significant contribution to the broad patterns of history.
B. Is associated with the lives of persons in our past.
C. Embodies the distinctive characteristics of a type, period, or method of construction; represents the work of a master; possesses high artistic values; or represents a significant and distinguishable entity whose components may lack individual distinction.
D. Has yielded, or may be likely to yield, information important in prehistory or history.
A final critical component of eligibility is “integrity.” Integrity refers to the ability of a property to convey its significance and the degree to which the property retains the identity, including physical and visual attributes, for which it is significant under the four basic criteria. The NRHP criteria recognize seven aspects or qualities of integrity: location, design, setting, materials, workmanship, feeling, and association.
Archaeological Resources Protection Act
The Archaeological Resources Protection Act of 1979 regulates the protection of archaeological resources and sites on federal and Indian lands.
Preservation of American Antiquities
The Federal Antiquities Act of 1906 was enacted to protect cultural resources in the United States. It explicitly prohibits appropriation, excavation, injury, and destruction of any “historic or prehistoric ruin or monument, or any object of antiquity” on lands owned or controlled by the federal government without permission from the secretary of the federal department with jurisdiction. It also established criminal penalties for these acts, including fines and/or imprisonment. Neither the Antiquities Act itself nor its implementing regulations specifically mention paleontological resources. However, several federal agencies––including the National Park Service, the Bureau of Land Management, and the US Forest Service––have interpreted objects of antiquity to include fossils. Consequently, the Antiquities Act also represents an early cornerstone for efforts to protect the nation’s paleontological resources.
Native American Graves Protection and Repatriation Act
NAGPRA is a federal law passed in 1990 that mandates museums and federal agencies to return certain Native American cultural items—such as human remains, funerary objects, sacred objects, or objects of cultural patrimony—to lineal descendants or culturally affiliated Indian tribes.

R A N C H O C U C A M O N G A C A M P U S M A S T E R P L A N D R A F T E I R C A F F E Y C O M M U N I T Y C O L L E G E D I S T R I C T
5. Environmental Analysis CULTURAL RESOURCES
April 2022 Page 5.3-3
State
California Register of Historical Resources
The State Historical Resources Commission designed this program for state and local agencies, private groups, and citizens to identify, evaluate, register, and protect California’s historical resources. The California Register of Historical Resources (CRHR) is the authoritative guide to the state’s significant historical and archaeological resources.
The CRHR program encourages public recognition and protection of resources of architectural, historical, archaeological, and cultural significance; identifies historical resources for state and local planning purposes; determines eligibility for state historic preservation grant funding; and affords certain protections under CEQA.
To be eligible for listing in the CRHR, a resource must meet at least one of the following criteria:
A. Associated with events that have made a significant contribution to the broad patterns of local or regional history or the cultural heritage of California or the United States.
B. Associated with the lives of person important to local, California or national history.
C. Embodies the distinctive characteristics of a type, period, region, or method of construction or represents the work of a master or possesses high artistic values.
D. Has yielded, or has the potential to yield, information important to the prehistory or history of the local area, California or the nation. (California Public Resources Code [PRC] Section 5024.1[c])
In addition to having significance, resources must have integrity for the period of significance. The period of significance is the date or span of time within which significant events transpired or significant individuals made their important contributions. Integrity is the authenticity of a historical resource’s physical identity as evidenced by the survival of characteristics or historic fabric that existed during the resource’s period of significance. Alterations to a resource or changes in its use over time may have historical, cultural, or architectural significance. In summary, resources must retain enough of their historic character or appearance to be recognizable as historical resources and to convey the reasons for their significance. A resource that has lost its historic character or appearance may still have sufficient integrity for the CRHR if, under Criterion D, it maintains the potential to yield significant scientific or historical information or specific data.
California Public Resources Code
PRC Sections 5020 to 5029.5 continued the former Historical Landmarks Advisory Committee as the State Historical Resources Commission. The commission oversees the administration of the California Register of Historical Resources and is responsible for designating State Historical Landmarks and Historical Points of Interest.
PRC Sections 5079 to 5079.65 define the functions and duties of the Office of Historic Preservation, which administers federal- and state-mandated historic preservation programs in California as well as the California Heritage Fund.

R A N C H O C U C A M O N G A C A M P U S M A S T E R P L A N D R A F T E I R C A F F E Y C O M M U N I T Y C O L L E G E D I S T R I C T
5. Environmental Analysis CULTURAL RESOURCES
Page 5.3-4 PlaceWorks
PRC Sections 5097.9 to 5097.991 provide protection to Native American historical and cultural resources and sacred sites; identify the powers and duties of the Native American Heritage Commission; require that descendants be notified when Native American human remains are discovered; and provide for treatment and disposition of human remains and associated grave goods.
Local
City of Rancho Cucamonga General Plan
The Managing Land Use, Community Design, and Historic Resources chapter of the City of Rancho Cucamonga General Plan includes goals and policies aimed at providing guidance and policy direction regarding historic resources in the city. The goals and policies allow for the continued protection, preservation, maintenance, recognition, and documentation of historic resources.
Local Programs
In 1978, the City adopted the Historic Preservation Commission Ordinance to “designate, preserve, protect, enhance, and perpetuate those historic structures and sites which contribute to the cultural and aesthetic benefit of Rancho Cucamonga.” The ordinance established a Landmark Designation Program and encouraged participation by providing benefits and incentives. The ordinance also established a Historic Preservation Commission to review applications for landmark designation, review plans for physical alterations or change of use to landmarks, and maintain the register of landmarks. Participation in the Landmark Designation Program provides the following benefits:
Qualifies buildings to use the flexible Historical Building Code.
Qualifies the owners to apply for use of the Mills Act contract for lower property taxes.
Enables owners to receive free information about rehabilitation.
Fosters civic pride and encourages additional historical research. Allows qualified owners to participate in the city’s Landmark Plaque Program.
Historic Districts and Neighborhood Character Areas
In an effort to recognize historic communities in Rancho Cucamonga and groupings of historic resources and places of interest, the General Plan recommends evaluating the potential creation of historic districts and/or neighborhood character areas.
A historic district is a definable unified geographic entity that possesses a significant concentration, linkage, or continuity of sites, buildings, structures, or objects united historically or aesthetically by plan or physical development.
A neighborhood character area, also commonly referred to as a conservation district, is a tool used to define a group of significant historic resources that do not retain adequate integrity to qualify as a historic district but still maintain important levels of cultural, historic, or architectural significance. The focus of a neighborhood character area is on maintaining basic community character of an area, but not necessarily specific historic details of buildings or landscapes. Neighborhood character areas are designated as a zoning overlay

R A N C H O C U C A M O N G A C A M P U S M A S T E R P L A N D R A F T E I R C A F F E Y C O M M U N I T Y C O L L E G E D I S T R I C T
5. Environmental Analysis CULTURAL RESOURCES
April 2022 Page 5.3-5
geographically over a neighborhood and may be coupled with other regulations. Conceptually, a neighborhood character area creates “buffer zones” to transition from historic districts to surrounding development.
City of Rancho Cucamonga Municipal Code
Title 2, Administration and Personnel, Chapter 2.24, Historic Preservation
This chapter provides a mechanism to identify, designate, protect, preserve, enhance, and perpetuate those historic sites, structures, and objects that embody and reflect the city’s aesthetic, cultural, architectural, and historic heritage. The provisions of this chapter are administered by the city’s historic preservation commission.
Title 17, Development Code, Chapter 17.18.010, Historic Preservation Commission Decision
This chapter establishes permits and entitlements that are decided by the historic preservation commission; it is intended to work in conjunction with chapter 2.24 of the municipal code. This chapter provides mechanisms to identify, designate, protect, preserve, enhance, and perpetuate historic sites, structures, and objects that embody and reflect the city’s aesthetic, cultural, architectural, and historic heritage. Each permit and entitlement type is described in this chapter in terms of purpose and applicability, exemptions, review process, findings for approval, and conditions. General processing procedures are in chapter 17.14.
5.3.1.2 EXISTING CONDITIONS
Records Search Results
A records search was conducted with the South Central Coastal Information Center, part of the California Historical Resources Information System housed at California State University, Fullerton. The records search identified 25 previous cultural resource studies that had been conducted within a one-mile radius of the Rancho Cucamonga campus and identified 14 cultural resources within the search radius, as described in Table 5.3-1. The nearest documented resource is approximately 0.4 mile from the campus. All but one are historical-period resources, primarily consisting of various residential buildings and structures as well as remains related to the prior agricultural uses of the surrounding area. The single prehistoric site was documented at the north edge of the search buffer, one mile north of the project site.

R A N C H O C U C A M O N G A C A M P U S M A S T E R P L A N D R A F T E I R C A F F E Y C O M M U N I T Y C O L L E G E D I S T R I C T
5. Environmental Analysis CULTURAL RESOURCES
Page 5.3-6 PlaceWorks
Table 5.3-1 Cultural Resources Within One-Mile Radius of the Project Site
No. Primary # Trinomial (CA-SBR)
Date Recorded (Recorded by,
Affiliation) Site Type/ Description Attribute Code 1 000895 895 1975 (Leonard); 1976
(Martz); 2014 (R. Shepard, ECORP)
Site (Prehistoric)/ Deer Canyon
AP2. Lithic scatter; AP4. Bedrock milling feature; AP8. Cains/rock features; AP11. Hearths/pits; AP14. Rock shelter/cave; AP15. Habitation debris
2 009000 9000H 1998 (Love, CRM Tech)
Site AH3. Landscaping/orchard; AH8. Dams
3 010304 10304H 2001 (Dice, L&L Environmental); 2003 (Smallwood)
Object, Site/ Schowalter Rock Pile
AH3. Landscaping/orchard; AH11. Walls/fences
4 010305 10305H 2001 (Dice, L&L Environmental)
Building, Site AH15. Standing structures; HP2. Single family property; HP4. Ancillary building; HP29. Landscape architecture; HP30. Trees/vegetation; HP33. Farm/ranch; HP45. Unreinforced masonry building
5 013741 - 1989 (Gallup, Caltrans)
Building/ Ellen Loeb House AH15. Standing structures
6 013742 - 1989 (Gallup, Caltrans)
Structure/ Hilleman Residence; 10067 Highland Av.
HP2. Single family property
7 013743 - 1989 (Gallup, Caltrans)
Building/ H. W. Minor Residence; The Ranch Egg Store
HP2. Single family property
8 016475 - 1989 (Gallup, Caltrans)
Building/ El Rancho Grande Wedding Chapel; Herbert and Evelyn Goerlitz House
HP2. Religious building
9 016478 - 1987 (Merrill) Building/ 9983 Hillside, Rancho Cucamonga; Cherbak/Stowe House
HP2. Single family property
10 018750 - 1987 (Merrill) Building/ Albert House HP2. Single family property
11 020545 - 1989 (Gallup, Caltrans); 2004 (Raun)
Building/ Jackson House/Gosney Ranch
HP2. Single family property
12 021688 - 2006 (Landaverde, City of Rancho Cucamonga)
Building/ Krysto Ranch HP4. Ancillary building
13 031685 31685H 2014 (Myers, ECORP) Site AH11. Walls/fences 14 033150 - 2019 (Terri
Jacquemain, CRM Tech)
Building, Structure/ Kryshtopovich Farmstead
AH5. Wells/cisterns; HP2. Single-family property; HP4. Ancillary building; HP33. Farm/ranch
According to the review of historical aerials and topographical maps, before 1959 the project area was largely undeveloped and lacked any structures or clear land use. In the 1959 aerial, more than a dozen buildings were on the project site. Preparation of the sports field areas had begun in the 1959 image, and the fields appear fully realized in the 1966 image. Further infrastructure developments are also evident in this image, and additional development and infill is visible in the 1980 image. By this time, the nature preserve area appears

R A N C H O C U C A M O N G A C A M P U S M A S T E R P L A N D R A F T E I R C A F F E Y C O M M U N I T Y C O L L E G E D I S T R I C T
5. Environmental Analysis CULTURAL RESOURCES
April 2022 Page 5.3-7
more vegetated, and the roads that previously divided it into rough quarters are no longer visible. Additional minor changes are evident over time, and the campus appears largely as it does today in the 2012 image.
Field Survey
Field surveys were conducted by ASM Affiliates on January 21 and February 17, 2021. The surveys covered the grounds of the Rancho Cucamonga campus, focusing on the buildings over 45 years of age that would be affected by the proposed project. As shown in Table 5.3-2, Buildings Older Than 45 Years, 17 buildings older than 45 years that are proposed for demolition or renovation by the proposed project were surveyed and evaluated. Figure 5.3-1, Buildings Older Than 45 Years, shows the locations of these buildings. During the intensive-level surveys, digital photographs were taken of the interiors of the buildings as well as overviews of the campus and landscaping. Detailed field notes were recorded about features of the buildings, landscaping, and setting. Survey photographs are included in Appendix A of the Cultural Study (Appendix E to the DEIR). No previously undocumented archaeological resources were identified as a result of the survey.
Table 5.3-2 Buildings Older Than 45 Years No. Bldg. No. Building Name Project Year Built Architect* 1 1 Administration (AD) Demo 1959 Neptune & Thomas 2 2 Aeronautics Shop (AERO) Reno 1959 Neptune & Thomas 3 67 Bookstore (B) Demo 1959 Harnish, Morgan & Causey 4 5 Business Education (BE) Demo 1959 Harnish & Fickes 5 20 Campus Center East (CCE) Demo 1969 Harnish, Morgan & Causey 6 8 Gymnasium (G) Reno 1959 Neptune & Thomas 7 3 Health Science East (HS East) Demo 1968 Wm. E. Blurock 8 42 Health Science West (HS West) Demo 1959 Austin, Field & Fry 9 10 Language Arts (LA) Demo 1959 Harnish & Fickes 10 11 Library (LI) Demo 1959 Harnish & Fickes 11 13 Maintenance & Operations (M&O) Demo 1962 unknown 12 24 Math (MATH) Demo 1959 Austin, Field & Fry 13 14 Physical Science (PS) Demo 1959 Austin, Field & Fry 14 7 Skills Lab (SL) Reno 1959 Neptune & Thomas 15 15 Social Science (SS) Demo 1959 Harnish & Fickes 16 16 Theatre (TA) Reno 1959 Stanley Clark Meston 17 17 Wargin Hall (WH) Demo 1968 Wm. E. Blurock
* Architects are confirmed by original drawings on file with the Chaffey College facilities office.
Architectural Resources
The campus buildings were designed by four architectural firms: Austin, Field & Fry; Jay Dewey Harnish (and Harnish & Fickes); Stanley Clark Meston; and Neptune & Thomas and Associates, with Austin, Field & Fry providing oversight as managing architects for the buildings and the site plan. The architectural style of the campus was first described as “Pacific Modern,” without any indication of the characteristics of such a style. A year later, a progress report prepared by the college stated that “Contemporary Rancho” had been selected as

R A N C H O C U C A M O N G A C A M P U S M A S T E R P L A N D R A F T E I R C A F F E Y C O M M U N I T Y C O L L E G E D I S T R I C T
5. Environmental Analysis CULTURAL RESOURCES
Page 5.3-8 PlaceWorks
the architectural theme for the campus. Of the 17 buildings evaluated, 13 were constructed in 1959, and 4 were added in the 1960s. The 1959 buildings were present when the school opened in 1960. Although four different architectural firms participated in the site design and the architecture of individual buildings, the design is cohesive across the campus due to the oversight of Austin, Field & Fry, who also designed many of the buildings.
The original buildings share architectural features that were consciously emulated in most of the subsequent additions to the campus. The campus buildings show consistency of design; they are primarily long, horizontally oriented, low-slung, single-story buildings with side gables and prominent cast-concrete columns running the length of the buildings. The original classroom buildings all share architectural features of domestic scale with single-story massing, moderately sloped side-gabled roofs, and open corridors sheltered by roof extensions supported by heavy rectangular precast concrete columns with deep horizontal scoring that extend beyond the edge of the roof (described as “fin-like”). Buildings that are not classrooms replicate the columns in the form of regularly spaced pilasters with red-brick walls. Classroom buildings have high windows in a continuous horizontal placement above the level of the doors, with the remainder of the walls constructed of red brick rather than simply clad. In the classroom buildings, horizontal rows of windows sit above red-brick walls, joining with transoms above the doors. The interiors of the classrooms are nearly universally carpet on poured concrete. Most buildings have internal courtyards; in the case of classroom buildings, small offices open off the courtyards. Throughout the campus, the buildings from the 1950s and 1960s follow a design aesthetic of red brick contrasting with white concrete accents and structural elements. Most of the original 1950s to 1960s buildings have not been significantly altered since construction, with the exception of the Library (significantly altered) and the Campus Center west (demolished in 2011).
Landscaping
The landscaping throughout campus is clearly intentional and is consistent with the original campus plan. However, research did not reveal the landscape designer. Despite the additions of infill buildings, the landscaping retains its original features of rolling lawns, meandering concrete walkways, and carefully arranged boulders. Many of the olive trees, eucalypti, and native shrubs from the original plan remain. A group of red-brick planters was designed by William E. Blurock in 1967.
Archaeological Resources
The archaeological pedestrian survey was focused on any exposed ground surfaces adjacent to or near the specific buildings that have been slated for replacement or renovation. Before construction of the campus, the project site was characterized by a generally flat but slightly south-sloping terrain surrounded by agricultural fields. The majority of the project site has been heavily altered and modified over time by building and facility construction, landscaping, and hardscaping. As a result, the central portion of the campus, which was the primary focus of the cultural evaluation, does not appear to retain any clearly discernable original ground surfaces, particularly in proximity to the subject buildings. The original slope of the natural topography is maintained within the campus layout, with landscaping characterized by expansive rolling lawns and concrete walkways and asphalt roads connecting the buildings and various parts of the campus.
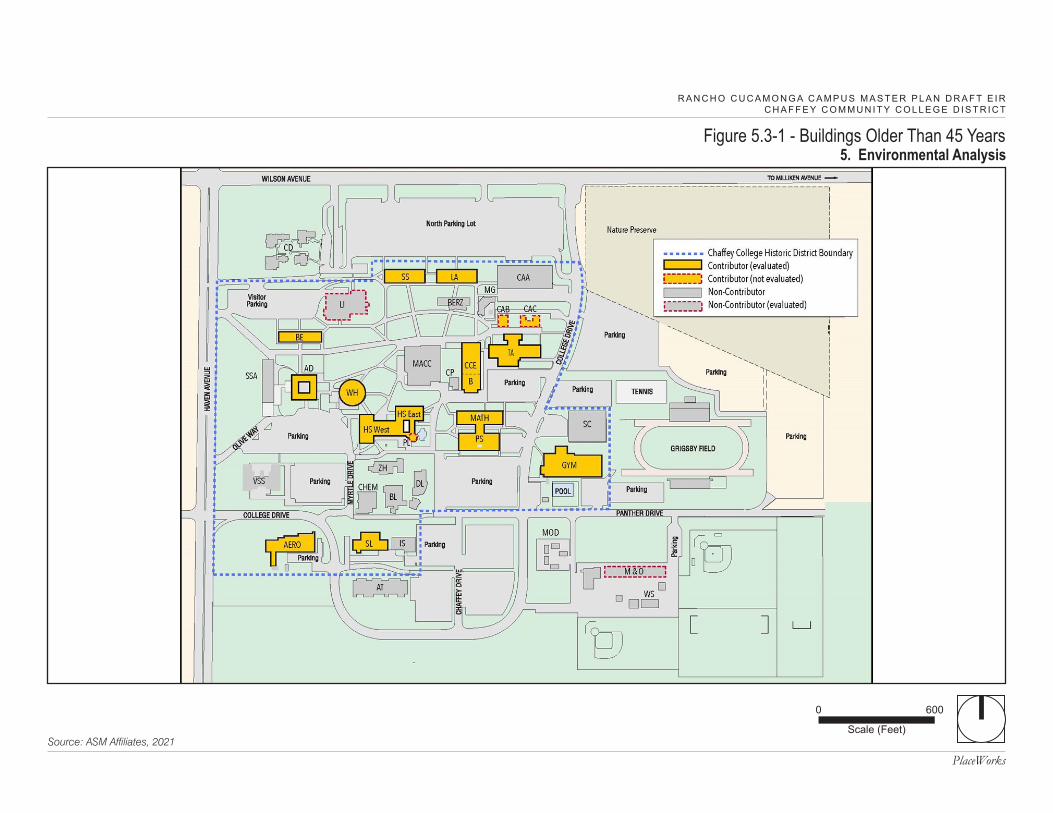
PlaceWorksSource: ASM Affiliates, 2021
Figure 5.3-1 - Buildings Older Than 45 Years5. Environmental Analysis
0
Scale (Feet)
600
R A N C H O C U C A M O N G A C A M P U S M A S T E R P L A N D R A F T E I RC H A F F E Y C O M M U N I T Y C O L L E G E D I S T R I C T

R A N C H O C U C A M O N G A C A M P U S M A S T E R P L A N D R A F T E I R C A F F E Y C O M M U N I T Y C O L L E G E D I S T R I C T
5. Environmental Analysis CULTURAL RESOURCES
Page 5.3-10 PlaceWorks
This page intentionally left blank.

R A N C H O C U C A M O N G A C A M P U S M A S T E R P L A N D R A F T E I R C A F F E Y C O M M U N I T Y C O L L E G E D I S T R I C T
5. Environmental Analysis CULTURAL RESOURCES
April 2022 Page 5.3-11
All visible ground surfaces surrounding the buildings to be demolished and renovated were carefully examined for any evidence of cultural materials that may have been exposed over time. No evidence of either prehistoric or historical archaeological materials was observed during the survey.
According to the records search results from the South Central Coastal Information Center, only one prehistoric resource site is identified within one mile radius of the project. This prehistoric site has assigned primary number P-36-000895 and trinomial number CA-SBR-895, and is associated with resources including lithic scatter, bedrock milling feature, cains/rock features, hearths/pits, rock shelter/cave, and habitation debris.
5.3.2 Thresholds of Significance According to Appendix G of the CEQA Guidelines, a project would normally have a significant effect on the environment if the project would:
C-1 Cause a substantial adverse change in the significance of a historical resource pursuant to Section 15064.5.
C-2 Cause a substantial adverse change in the significance of an archaeological resource pursuant to Section 15064.5.
C-3 Disturb any human remains, including those interred outside of dedicated cemeteries.
5.3.3 Plans, Programs, and Policies Plans, programs, and policies (PPP), including applicable regulatory requirements and project design features for cultural resources, are identified below.
PPP CUL-1 Native American historical and cultural resources and sacred sites are protected under PRC Sections 5097.9 to 5097.991, which require that descendants be notified when Native American human remains are discovered and provide for treatment and disposition of human remains and associated grave goods.
PPP CUL-2 If human remains are discovered within a project site, disturbance of the site must stop until the coroner has investigated and made recommendations for the treatment and disposition of the human remains to the person responsible for the excavation, or to his or her authorized representative. If the coroner has reason to believe the human remains are those of a Native American, he or she shall contact, by telephone within 24 hours, the Native American Heritage Commission. (California Health and Safety Code Section 7050.5)

R A N C H O C U C A M O N G A C A M P U S M A S T E R P L A N D R A F T E I R C A F F E Y C O M M U N I T Y C O L L E G E D I S T R I C T
5. Environmental Analysis CULTURAL RESOURCES
Page 5.3-12 PlaceWorks
5.3.4 Environmental Impacts 5.3.4.1 METHODOLOGY
California Register of Historical Resources
CEQA Guidelines Section 15064.5 provides direction on determining significance of impacts to archaeological and historical resources. Generally, a resource shall be considered “historically significant” if the resource meets the criteria for listing on the CRHR:
1) Is associated with events that have made a significant contribution to the broad patterns of California’s history and cultural heritage;
2) Is associated the with lives of persons important in our past;
3) Embodies the distinctive characteristics of a type, period, region or method of construction, or represents the work of an important creative individual, or possesses high artistic values; or
4) Has yielded, or may be likely to yield, information important in prehistory or history. (PRC Section 5024.1; 14 CCR Section 4852)
Integrity
National Register Bulletin 15, “How to Apply the National Register Criteria for Evaluation,” establishes how to evaluate the integrity of a property. To retain historic integrity, a property must possess several, and usually most, aspects of integrity:
1) Location is the place where the historic property was constructed or the place where the historic event occurred.
2) Design is the combination of elements that create the form, plan, space, structure, and style of a property.
3) Setting is the physical environment of a historic property, and refers to the character of the site and the relationship to surrounding features and open space. Setting often refers to the basic physical conditions under which a property was built and the functions it was intended to serve. These features can be either natural or manmade, including vegetation, paths, fences, and relationships between other features or open space.
4) Materials are the physical elements that were combined or deposited during a particular period or time, and in a particular pattern or configuration to form a historic property.
5) Workmanship is the physical evidence of crafts of a particular culture or people during any given period of history or prehistory, and can be applied to the property as a whole, or to individual components.
6) Feeling is a property’s expression of the aesthetic or historic sense of a particular period of time. It results from the presence of physical features that, when taken together, convey the property’s historic character.

R A N C H O C U C A M O N G A C A M P U S M A S T E R P L A N D R A F T E I R C A F F E Y C O M M U N I T Y C O L L E G E D I S T R I C T
5. Environmental Analysis CULTURAL RESOURCES
April 2022 Page 5.3-13
7) Association is the direct link between the important historic event or person and a historic property.
The Rancho Cucamonga campus was evaluated for historical resources eligibility based on the four CRHR criteria pursuant to the CEQA Guidelines Section 15064.5. Furthermore, historical resources eligible for listing in the CRHR must also retain enough of their historic character or appearance to be recognizable as historical resources and to convey the reasons for their significance. Therefore, the campus was also evaluated to see if it retains the seven listed aspects of integrity as defined by the NRHP.
5.3.4.2 IMPACT ANALYSIS
The following impact analysis addresses the thresholds of significance; the applicable thresholds are identified in brackets after the impact statement.
Impact 5.3-1: Development of the proposed project could cause a substantial adverse change in the significance of a historical resource pursuant to Section 15064.5. [Threshold C-1]
Historic District Eligibility
The Rancho Cucamonga campus was evaluated for historical significance under the broad themes of “Education and Suburbanization in San Bernardino County” under CRHR criteria 1, 2, 3, and 4. The evaluation determined that the campus meets the historic district eligibility under Criterion 1 at the local level, under the themes of education and suburbanization, for its association with the development of Rancho Cucamonga and its surrounding communities, and under Criterion 3, architecture with a period of significance of 1959 to 1969.
Seventeen buildings were surveyed that are over 45 years old and are proposed for demolition or alterations as part of the Master Plan. As shown in Table 5.3-3, Historic District Contributor Evaluation Summary, of the 17 buildings, 15 are recommended as contributors to the historic district, and two are not contributors—library (Bldg. 11) and maintenance and operations (Bldg. 13). The cultural study found that the library building has been too altered to convey its historical significance as an original campus building, and the maintenance and operations building is not associated with the themes or criteria for the rest of the contributing resources. Note that there are three buildings that were not surveyed—Center for the Arts B, Center for the Arts C, and the Planetarium—that are over 45 years old but are not planned for demolition or renovation as part of the proposed project. These three buildings are also recommended as contributing resources to the historic district, because they were original to the campus design and do not appear to have been extensively altered. Therefore, 18 buildings (15 surveyed buildings plus 3 not-surveyed buildings) were identified as contributors to the historic district.
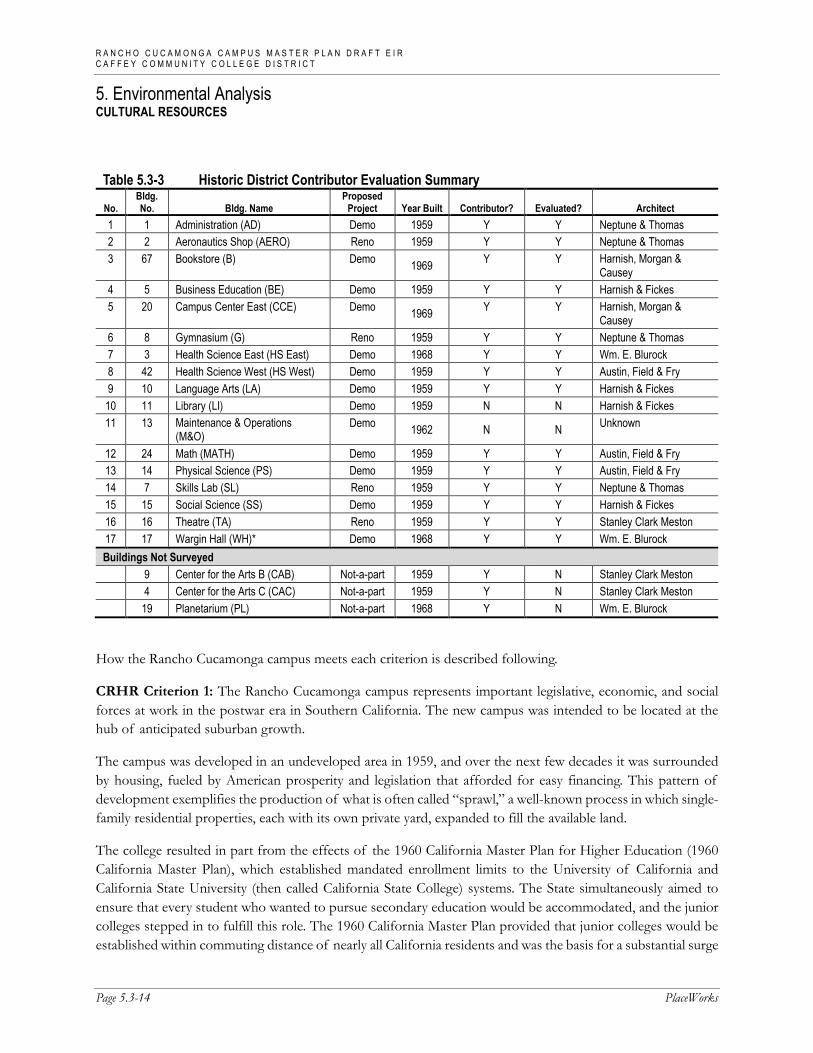
R A N C H O C U C A M O N G A C A M P U S M A S T E R P L A N D R A F T E I R C A F F E Y C O M M U N I T Y C O L L E G E D I S T R I C T
5. Environmental Analysis CULTURAL RESOURCES
Page 5.3-14 PlaceWorks
Table 5.3-3 Historic District Contributor Evaluation Summary
No. Bldg. No. Bldg. Name
Proposed Project Year Built Contributor? Evaluated? Architect
1 1 Administration (AD) Demo 1959 Y Y Neptune & Thomas 2 2 Aeronautics Shop (AERO) Reno 1959 Y Y Neptune & Thomas 3 67 Bookstore (B) Demo 1969 Y Y Harnish, Morgan &
Causey 4 5 Business Education (BE) Demo 1959 Y Y Harnish & Fickes 5 20 Campus Center East (CCE) Demo 1969 Y Y Harnish, Morgan &
Causey 6 8 Gymnasium (G) Reno 1959 Y Y Neptune & Thomas 7 3 Health Science East (HS East) Demo 1968 Y Y Wm. E. Blurock 8 42 Health Science West (HS West) Demo 1959 Y Y Austin, Field & Fry 9 10 Language Arts (LA) Demo 1959 Y Y Harnish & Fickes 10 11 Library (LI) Demo 1959 N N Harnish & Fickes 11 13 Maintenance & Operations
(M&O) Demo 1962 N N Unknown
12 24 Math (MATH) Demo 1959 Y Y Austin, Field & Fry 13 14 Physical Science (PS) Demo 1959 Y Y Austin, Field & Fry 14 7 Skills Lab (SL) Reno 1959 Y Y Neptune & Thomas 15 15 Social Science (SS) Demo 1959 Y Y Harnish & Fickes 16 16 Theatre (TA) Reno 1959 Y Y Stanley Clark Meston 17 17 Wargin Hall (WH)* Demo 1968 Y Y Wm. E. Blurock Buildings Not Surveyed 9 Center for the Arts B (CAB) Not-a-part 1959 Y N Stanley Clark Meston 4 Center for the Arts C (CAC) Not-a-part 1959 Y N Stanley Clark Meston 19 Planetarium (PL) Not-a-part 1968 Y N Wm. E. Blurock
How the Rancho Cucamonga campus meets each criterion is described following.
CRHR Criterion 1: The Rancho Cucamonga campus represents important legislative, economic, and social forces at work in the postwar era in Southern California. The new campus was intended to be located at the hub of anticipated suburban growth.
The campus was developed in an undeveloped area in 1959, and over the next few decades it was surrounded by housing, fueled by American prosperity and legislation that afforded for easy financing. This pattern of development exemplifies the production of what is often called “sprawl,” a well-known process in which single-family residential properties, each with its own private yard, expanded to fill the available land.
The college resulted in part from the effects of the 1960 California Master Plan for Higher Education (1960 California Master Plan), which established mandated enrollment limits to the University of California and California State University (then called California State College) systems. The State simultaneously aimed to ensure that every student who wanted to pursue secondary education would be accommodated, and the junior colleges stepped in to fulfill this role. The 1960 California Master Plan provided that junior colleges would be established within commuting distance of nearly all California residents and was the basis for a substantial surge

R A N C H O C U C A M O N G A C A M P U S M A S T E R P L A N D R A F T E I R C A F F E Y C O M M U N I T Y C O L L E G E D I S T R I C T
5. Environmental Analysis CULTURAL RESOURCES
April 2022 Page 5.3-15
in development in California higher education and implied associated residential growth. Easy access to junior college campuses and practical vocational offerings—including electronics, business education, and, in the case of Rancho Cucamonga campus, aeronautics—opened this lower rung of higher education to a large pool of new students.
Because the Rancho Cucamonga campus is a good example of the effects of economic prosperity in the postwar era, legislation that encouraged higher education through a tiered system of facilities in California, and new attitudes toward learning, the campus is recommended eligible under Criterion 1 for its association with important events in history, and the Chaffey College Historic District is warranted. The period of significance is 1959 through 1969, beginning in 1959 when the campus was established and most of the major buildings were constructed, according to the Master Plan, and ending in 1969, when the development of the college campus was complete.
CRHR Criterion 2: The Chaffey College Historic District was evaluated for eligibility under Criterion 2—for association with persons important in our history. Other than outstanding principals, no notable individuals were found to be associated specifically with the campus. Therefore, eligibility under Criterion 2 would not apply.
CRHR Criterion 3: The Chaffey College Historic District exhibits character-defining features of an era that focused on educating the baby boomers. Drawing from the characteristics set for such schools in the Los Angeles Unified District, the campus is a product of postwar expansion reflected in a modern, functional school facility. The unified campus design includes the following attributes that represent schools of that period: lack of formality and monumentality; low, one-story massing with a domestic scale; a decentralized layout; a function-driven site design; and buildings that are placed across the site. The campus was designed with the intent of serving the yet-to-be-constructed residential neighborhoods on large expanses of land, with swaths of land devoted to landscape design.
With the availability of undeveloped, cheap land, the campus was planned with wide separation between buildings and extensive landscaping. The open corridors on buildings with back-to-back classrooms is nearly endemic to Southern California.
Typical of postwar schools, plentiful funding allowed the districts to hire accomplished, often well-known architects. Rancho Cucamonga campus is a good example of the drive for master-planned campuses that dominated school design in the late 1950s and early 1960s.
The original campus is notable for construction techniques that applied the efficiency of modern concrete tilt-up construction. Table 5.3-2 lists the architects responsible for individual buildings on campus. Among these architects, Blurock, responsible for the Wargin Hall, Planetarium, and Health Science East, was known for innovation in school design that included master planning; however, his ideas are not reflected in the plan for the Rancho Cucamonga campus. Although Stanley Clark Meston’s role in the development of McDonald’s “Golden Arches,” one of the most iconic commercial designs of the mid-twentieth century, is notable, it is the only achievement for which he is recognized; therefore, he cannot be considered a master architect. Harnish & Fickes and Neptune & Thomas were only active locally and are not considered master architects.

R A N C H O C U C A M O N G A C A M P U S M A S T E R P L A N D R A F T E I R C A F F E Y C O M M U N I T Y C O L L E G E D I S T R I C T
5. Environmental Analysis CULTURAL RESOURCES
Page 5.3-16 PlaceWorks
Austin, Field & Fry, the firm responsible for the original master plan campus design, is recognized for its work in Los Angeles. The firm was responsible for several of Los Angeles’ most important public postwar buildings, including the U.S. Custom House at Terminal Island, Port of Los Angeles; the Los Angeles County Courthouse; and the Los Angeles County Hall of Administration. Among the firm’s eligible projects are St. Vincent College of Nursing, which is an example of Late Modern style, and the Faculty Building at UCLA, a domestic-scale building exhibiting features of the Ranch house style. The firm is highlighted on the LA Conservancy’s website as master architects. The Los Angeles Unified School District Historic Context Statement, 1870 to 1969, also lists the firm among the prominent master architects of Los Angeles schools in the twentieth century. Therefore, the campus and its buildings possess high artistic value; embody distinctive characteristics of a type, period, and method of construction; and are a good example of the work of master architects Austin, Field & Fry. For these reasons, the Chaffey College Historic District is recommended eligible under CRHR Criterion 3 for its design and construction.
CRHR Criterion 4: The Chaffey College Historic District has not yielded and is not likely to yield, information important to the prehistory or history of the area. Therefore, eligibility under Criterion 4 would not apply.
Historic District Eligibility Conclusion
As discussed above, pursuant to Section 15064.5, the Rancho Cucamonga campus as a whole is considered a potential historic district (Chaffey College Historic District), with 18 contributing resources under the themes of education, suburbanization, and architecture, and with subthemes of postwar modernism and campus planning and design. Therefore, demolition of any portions of these contributing resources would be considered a significant impact.
Individual Eligibility
The campus buildings surveyed for cultural study were also considered for individual eligibility under the CRHR Criterion 1, 2, 3, or 4, and determined that only one contributor, Wargin Hall, meets one of the criteria for individual eligibility:
Under CRHR Criterion 1, none of the contributors were found to be good individual representations of the themes of education and suburbanization on a regional level, and therefore none are recommended individually eligible under Criterion 1.
Under CRHR Criterion 2, no evidence of association with the lives of any person of historical significance was found, so none of the contributors are recommended individually eligible under this criterion.
Under CRHR Criterion 3, the campus is a good example of master planning, but none of the contributors convey this significance individually. However, one contributor, Wargin Hall, exemplifies Mid-Century Modernism, as shown in the simple geometric volumes of the round plan, the flat roof with wide overhang, concrete and brick materials, and direct expression of its structural system in the exposed concrete beams. Additionally, Wargin Hall is a good example of the work of master architect William Blurock with its round plan and unusual configuration of lecture halls and classrooms that represents the

R A N C H O C U C A M O N G A C A M P U S M A S T E R P L A N D R A F T E I R C A F F E Y C O M M U N I T Y C O L L E G E D I S T R I C T
5. Environmental Analysis CULTURAL RESOURCES
April 2022 Page 5.3-17
architect’s reputation for innovative school design as a means of influencing teaching and learning methods. Therefore, Wargin Hall (Bldg. No. 17) is recommended individually eligible under Criterion 3. None of the other contributors are recommended individually eligible under Criterion 3.
Under CRHR Criterion 4, all of the buildings are common property types that do not have the potential to provide information about history or prehistory that is not available through historic research.
Individual Eligibility Conclusion
Wargin Hall is individually eligible under CRHR Criterion C as a good example of Mid-Century-Modernism architect and the work of master architect William Blurock. Therefore, demolition of Wargin Hall would be considered a significant impact.
Historical Resources Impact Summary
The cultural evaluation determined that the Rancho Cucamonga campus is a good example of the drive for master-planned campuses that dominated school design in the late 1950s and early 1960s and is eligible as a historic district under CRHR Criteria 1 and 3 for the themes of Education, Suburbanization, and Architecture with a period of significance of 1959 to 1969. Additionally, Wargin Hall is individually eligible under CRHR Criterion 3 as a good example of Mid-Century-Modernism architect and the work of master architect William Blurock. Therefore, the Chaffey College Historic District and Wargin Hall are the two CEQA historical resources on the Rancho Cucamonga campus that could be impacted by project implementation.
Level of Significance Before Mitigation: Potentially significant impact.
Impact 5.3-2: Development of the project could cause a substantial adverse change in the significance of an archaeological resource pursuant to Section 15064.5. [Threshold C-2]
As described in Section 5.3.1.2, Existing Conditions, “Archaeological Resources,” no evidence of either prehistoric or historical archaeological materials was observed during the pedestrian survey, and only one prehistoric resource site was found within a one-mile radius of the project site. Considering the developed nature of the project site, where structures have been built over or extensively landscaped, and limited archaeological finds in the vicinity of the project site, the potential for discovering archaeological resources during construction would be low. However, because most of the construction undertaken on the campus took place before the institution of CEQA, the campus has never been fully assessed for the presence or absence of archaeological remains. Further, the search of the Sacred Lands File by the Native American Heritage Commission was positive, indicating that there may be tribal cultural resources related to the general project area. Therefore, there is a possibility of unanticipated and accidental archaeological discoveries during ground-disturbing project-related activities.
Level of Significance Before Mitigation: Potentially significant impact.

R A N C H O C U C A M O N G A C A M P U S M A S T E R P L A N D R A F T E I R C A F F E Y C O M M U N I T Y C O L L E G E D I S T R I C T
5. Environmental Analysis CULTURAL RESOURCES
Page 5.3-18 PlaceWorks
Impact 5.3-3: The proposed project could disturb human remains, including those interred outside of dedicated cemeteries. [Threshold C-3]
The project site is currently developed and would require demolition, ground clearing, excavation, grading, and other construction activities to accommodate the proposed project. California Health and Safety Code, Section 7050.5; CEQA Section 15064.5; and PRC Section 5097.98 mandate the process to be followed in the event of an accidental discovery of any human remains in a location other than a dedicated cemetery. Specifically, California Health and Safety Code, Section 7050.5, requires that disturbance of the site shall halt until the coroner has investigated the circumstances, manner, and cause of death and made the recommendations concerning the treatment and disposition of the human remains to the person responsible for the excavation, or to his or her authorized representative, according to PRC Section 5097.98. If the coroner determines that the remains are not subject to his or her authority and has reason to believe they belong to a Native American, he or she shall contact, by telephone within 24 hours, the Native American Heritage Commission. In the event soil-disturbing activities associated with the proposed project would result in the discovery of human remains, compliance with existing law (see PPP CUL-2) would ensure that impacts to human remains would not be significant.
Level of Significance Before Mitigation: Less than significant with implementation of PPP CUL-2.
5.3.5 Cumulative Impacts The cumulative context associated with the proposed project is the city of Rancho Cucamonga. Implementation of the proposed project would result in significant impacts to historical resources, where the Rancho Cucamonga campus as a whole is considered a potential historic district under the themes of education, suburbanization, and architecture, with subthemes of postwar modernism and campus planning and design. Therefore, although the project impacts would be confined to the limits of the Rancho Cucamonga campus, the historical theme of education, suburbanization, and architecture and subthemes of postwar modernism and campus planning and design in the city and region would be adversely impacted. The City’s General Plan EIR indicates that Rancho Cucamonga has at least 445 previously identified properties listed in the City’s Historic Site List, 3 properties listed in the NRHP; 9 properties listed in the CRHR; 3 California Historical Landmarks; and 6 California Points of Historical Interest (Rancho Cucamonga 2021b). The City also has 77 designated local landmarks and 29 designated points of interest. The City identified 8 properties potentially eligible for listing in the NRHP that were identified as “Potential National Register” properties; 115 properties identified as “Potential Local Landmarks,” 3 of which have been demolished; 24 properties determined insignificant or “Survey Determined Insignificant”; and 154 properties that were listed as “Survey Undetermined Significant.” The proposed project would occur over approximately 30 years and based on the General Plan Update Volume 1: Vision’s Figure V-1, “Degrees of Change Map”, the City is categorized into three areas of potential changes: areas of limited change, moderate change, and significant change. Limited change is defined in the GPU as areas of the city where the general character, uses, and activities of the area will remain the same but be enhanced in limited ways. Moderate change is defined as areas where moderate development change is desired and planned for 15 years or beyond. Significant change is defined as aeras where the community wants to actively facilitate significant change in the short to middle term. These areas may look very different in a short period of time and are the areas where the City may prioritize staff and financial
R A N C H O C U C A M O N G A C A M P U S M A S T E R P L A N D R A F T E I R C A F F E Y C O M M U N I T Y C O L L E G E D I S T R I C T
5. Environmental Analysis CULTURAL RESOURCES
April 2022 Page 5.3-19
resources or actively encourage new private development and public improvements. Future development in the City over 30 years and their impacts to cultural resources would be speculative. However, because the proposed project would individually result in significant impact, when combined with other development projects in the City that could potentially impact cultural resources would be significant and unavoidable.
Although the project site has been previously disturbed, there is a potential for discovery of previously unidentified archaeological resources during ground-disturbing activities. Provided that site-specific impacts are reduced to a less than significant level with appropriate treatment by qualified archaeological consultants, this incremental impact to the project site and other development sites within the city would not result in cumulatively significant impacts.
5.3.6 Level of Significance Before Mitigation Upon implementation of plans, programs, and policies, the following impact would be less than significant: 5.3-3.
Without mitigation, these impacts would be potentially significant:
Impact 5.3-1 Implementation of the proposed project could adversely impact historical resources at the Rancho Cucamonga campus.
Impact 5.3-2 Implementation of the proposed project could result in discovery of subsurface archaeological resources.
5.3.7 Mitigation Measures Impact 5.3-1
CUL-1 Prior to demolition of any of the 18 historic district contributing resources (Building Numbers 1 through 5, 7 through 10, 14 through 17, 19, 20, 24, 42, and 67), Chaffey Community College District shall retain a qualified cultural resources consultant to prepare a Historic American Buildings Survey (HABS) Level II Documentation for the Chaffey College Historic District and Wargin Hall, consistent with Historic American Buildings Survey Guidelines for Historical Reports (National Park Service 2007). The HABS Level II documentation shall follow the Secretary of Interior Standards and Guidelines for Architectural and Engineering Documentation and include photography, narrative history, and reproduction of selected existing drawings for each building proposed for demolition or alteration. Two narrative histories shall be prepared: one for Wargin Hall and one for the Chaffey College Historic District that includes all 18 contributing resources.
CUL-2 Prior to demolition of any of the 18 historic district contributing resources (Building Numbers 1 through 5, 7 through 10, 14 through 17, 19, 20, 24, 42, and 67), Chaffey Community College District shall develop an interpretative display as part of the project plan to commemorate the history of the Chaffey College Historic District and Wargin Hall to be placed in a central

R A N C H O C U C A M O N G A C A M P U S M A S T E R P L A N D R A F T E I R C A F F E Y C O M M U N I T Y C O L L E G E D I S T R I C T
5. Environmental Analysis CULTURAL RESOURCES
Page 5.3-20 PlaceWorks
location on campus. The interpretative display is to include text and images from this report, as well as original architectural renderings and drawings and historical campus photos and aerial views drawn from the Chaffey College archives at the on-campus library. The interpretive display could include information from the Historic American Buildings Survey documentation (narrative histories and large-format photographs). If an outdoor exhibition is selected, the exhibit shall include at least three resin-coated panels to be grouped together in a single location with accompanying paving/walkways and landscaping.
CUL-3 Prior to demolition of any of the 18 historic district contributing resources (Building Numbers 1 through 5, 7 through 10, 14 through 17, 19, 20, 24, 42, and 67), Chaffey Community College District shall expand the history section of the Chaffey College Historic District website (https://www.chaffey.edu/about/ourhistory.php) to include narratives and historical images similar to those used on the Interpretive Display (see Mitigation Measure CUL-2). The focus shall be the development of the physical campus and include information about the architects involved.
CUL-4 Ongoing during operation of the proposed project, Chaffey Community College District shall provide funding to organize and catalog material related to the original plans and construction of the campus buildings available in various repositories on campus and archive them at the campus library. Examples of materials to be archived include historical reports, newsletters, architectural and campus photographs, and aerial views. An example of cataloging is accessing digital copies of original architectural drawings currently stored on central computer drives and making them available to researchers.
Impact 5.3-2
CUL-5 During grading and site preparation activities, the construction contractor retained by the Chaffey Community College District (District) shall monitor all construction activities. In the event that cultural resources (i.e., prehistoric sites, historic sites, and/or isolated artifacts) and/or tribal cultural resources are discovered, work shall be halted immediately within 60 feet of the discovery and the construction contractor shall inform the project manager of the District. Construction activities may continue in other areas during the assessment period. The District shall retain a qualified archaeologist that meets the Secretary of the Interior’s Standards and Guidelines for Professional Qualifications in Archaeology to analyze the significance of the discovery. Additionally, the San Manuel Band of Missions Indians Cultural Resources Department (SMBMI) shall be contacted, as detailed in Mitigation Measure TCR-1, regarding any pre-contact and/or historic-era finds and be provided information after the archaeologist makes the initial assessment of the nature of the find, so as to provide tribal input with regards to significance and treatment. If, in consultation with the District, the discovery is determined not to be important pursuant to State law described below, work will be permitted to continue in the area.

R A N C H O C U C A M O N G A C A M P U S M A S T E R P L A N D R A F T E I R C A F F E Y C O M M U N I T Y C O L L E G E D I S T R I C T
5. Environmental Analysis CULTURAL RESOURCES
April 2022 Page 5.3-21
If the qualified archaeologist determines a resource to constitute a “historical resource” pursuant to CEQA Guidelines Section 15064.5(a) or a “unique archaeological resource” pursuant to Public Resources Code Section 21083.2(g), the qualified archaeologist shall coordinate with the District to develop a monitoring and treatment plan (the plan). The plan should serve to reduce impacts to the resources and allow construction to proceed. The plan established for the resources shall be in accordance with CEQA Guidelines Section 15064.5(f) for historical resources and Public Resources Code Section 21083.2(b) for unique archaeological resources. The draft of the plan shall be provided to SMBMI for review and comment, as detailed in Mitigation Measure TCR-1. The qualified archaeologist shall monitor the remainder of the project site and implement the plan accordingly. Preservation in place (i.e., avoidance) is the preferred manner of treatment.
If preservation in place is not feasible, treatment may include implementation of archaeological data recovery excavations to remove the resource along with subsequent laboratory processing and analysis.
The District shall offer any historic archaeological material that is not Native American in origin for curation at a public, nonprofit institution with a research interest in the materials. If no institution accepts the archaeological material, the District shall keep the archaeological material within the campus library for educational purposes.
5.3.8 Level of Significance After Mitigation Impact 5.3-1
With implementation of Mitigation Measures CUL-1 through CUL-4, potentially significant impacts to historical resources would be reduced. However, the contributing resources would still be demolished; therefore, significant impacts to historical cultural resources would remain significant and unavoidable.
Impact 5.3-2
With implementation of Mitigation Measure CUL-5, potentially significant impacts to archaeological resources would be reduced to a less than significant level. No significant unavoidable adverse impacts to archaeological resources would occur.
5.3.9 References ASM Affiliates (ASM). 2021, April. Draft Cultural Resources Technical Report for Chaffey College Master
Plan Update, Rancho Cucamonga Campus. DEIR Appendix E.
Morton, D. M., and F. K. Miller (Morton and Miller). 2006. Geology map of the San Bernardino and Santa Ana 30’ x 60’ quadrangles, California. Geology and description of map units, version 1.0. Digital preparation by Cossette, P. M. and K. R. Bovard. USGS Open File Report 2006-1217, scale 1:100,000. https://ngmdb.usgs.gov/Prodesc/proddesc_78686.htm.
R A N C H O C U C A M O N G A C A M P U S M A S T E R P L A N D R A F T E I R C A F F E Y C O M M U N I T Y C O L L E G E D I S T R I C T
5. Environmental Analysis CULTURAL RESOURCES
Page 5.3-22 PlaceWorks
Rancho Cucamonga, City of. 2021a, December (adopted). Rancho Cucamonga General Plan. https://www.cityofrc.us/sites/default/files/2021-09/Appendix%203-1%20GPU%20Vol%201-4.pdf.
———. 2021b, September. Rancho Cucamonga General Plan Update and Climate Action Plan Draft Program Environmental Impact Report. Volume I. SCH No. 2021050261. https://www.cityofrc.us/sites/default/files/2021-09/City%20of%20Rancho%20Cucamonga_GP%20Update%20and%20CAP_Draft%20EIR_September%202021.pdf.

R A N C H O C U C A M O N G A C A M P U S M A S T E R P L A N D R A F T E I R C H A F F E Y C O M M U N I T Y C O L L E G E D I S T R I C T
5. Environmental Analysis
April 2022 Page 5.4-1
5.4 GREENHOUSE GAS EMISSIONS This section of the Draft Environmental Impact Report (DEIR) evaluates the potential for implementation of the Rancho Cucamonga Campus Master Plan project (proposed project) to cumulatively contribute to greenhouse gas (GHG) emissions impacts. Because no single project is large enough to result in a measurable increase in global concentrations of GHG, climate change impacts of a project are considered on a cumulative basis. This evaluation is based on the methodology recommended by the South Coast Air Quality Management District (South Coast AQMD). GHG emissions modeling was conducted using the California Emissions Estimator Model (CalEEMod), version 2020.4.0, and model outputs are in Appendix B of this DEIR.
5.4.1 Environmental Setting 5.4.1.1 TERMINOLOGY
Greenhouse gases (GHG). Gases in the atmosphere that absorb infrared light, thereby retaining heat in the atmosphere and contributing to a greenhouse effect.
Global warming potential (GWP). Metric used to describe how much heat a molecule of a greenhouse gas absorbs relative to a molecule of carbon dioxide (CO2) over a given period of time (20, 100, and 500 years). CO2 has a GWP of 1.
Carbon dioxide-equivalent (CO2e). The standard unit to measure the amount of greenhouse gases in terms of the amount of CO2 that would cause the same amount of warming. CO2e is based on the GWP ratios between the various GHGs relative to CO2.
MTCO2e. Metric ton of CO2e.
MMTCO2e. Million metric tons of CO2e.
Scientists have concluded that human activities are contributing to global climate change by adding large amounts of heat-trapping gases, known as GHGs, to the atmosphere. The primary source of these GHGs is fossil fuel use. The Intergovernmental Panel on Climate Change (IPCC) has identified four major GHGs—water vapor, carbon dioxide (CO2), methane (CH4), and ozone (O3)—that are the likely cause of an increase in global average temperatures observed in the 20th and 21st centuries. Other GHGs identified by the IPCC that contribute to global warming to a lesser extent are nitrous oxide (N2O), sulfur hexafluoride (SF6),

R A N C H O C U C A M O N G A C A M P U S M A S T E R P L A N D R A F T E I R C H A F F E Y C O M M U N I T Y C O L L E G E D I S T R I C T
5. Environmental Analysis GREENHOUSE GAS EMISSIONS
Page 5.4-2 PlaceWorks
hydrofluorocarbons, perfluorocarbons, and chlorofluorocarbons (IPCC 2001).1,2 The major GHGs applicable to the proposed project are briefly described.
Carbon dioxide (CO2) enters the atmosphere through the burning of fossil fuels (oil, natural gas, and coal), solid waste, trees and wood products, and respiration, and also as a result of other chemical reactions (e.g., manufacture of cement). Carbon dioxide is removed from the atmosphere (sequestered) when it is absorbed by plants as part of the biological carbon cycle.
Methane (CH4) is emitted during the production and transport of coal, natural gas, and oil. Methane emissions also result from livestock and other agricultural practices and from the decay of organic waste in landfills and water treatment facilities.
Nitrous oxide (N2O) is emitted during agricultural and industrial activities as well as during the combustion of fossil fuels and solid waste.
GHGs are dependent on the lifetime or persistence of the gas molecule in the atmosphere. Some GHGs have stronger greenhouse effects than others. These are referred to as high GWP gases. The GWP of GHG emissions are shown in Table 5.4-1, GHG Emissions and Their Relative Global Warming Potential Compared to CO2. The GWP is used to convert GHGs to CO2-equivalence (CO2e) to show the relative potential that different GHGs have to retain infrared radiation in the atmosphere and contribute to the greenhouse effect. For example, under the IPCC Fourth Assessment Report’s (AR4) GWP values for CH4, a project that generates 10 MT of CH4 would be equivalent to 250 MT of CO2.3
Table 5.4-1 GHG Emissions and Their Relative Global Warming Potential Compared to CO2
GHGs Second Assessment Report
(SAR) GWPs2 Fourth Assessment Report
(AR4) GWPs2 Fifth Assessment Report
(AR5) GWPs2,3
Carbon Dioxide (CO2) 1 1 1 Methane (CH4)1 21 25 28 Nitrous Oxide (N2O) 310 298 265 Sources: IPCC 1995, 2007. 1 The methane GWP includes direct effects and indirect effects due to the production of tropospheric ozone and stratospheric water vapor. The indirect effect due to the
production of CO2 is not included. 2 Based on 100-year time horizon of the GWP of the air pollutant compared to CO2. 3 The GWP values in the IPCC’s Fifth Assessment Report (IPCC 2014) reflect new information on atmospheric lifetimes of GHGs and an improved calculation of the
radiative forcing of CO2. However, the AR4 GWP were used values to maintain consistency in statewide GHG emissions modeling utilized in CalEEMod. In addition, the 2017 Scoping Plan Update was based on the AR4 GWP values.
1 Water vapor (H2O) is the strongest GHG and the most variable in its phases (vapor, cloud droplets, ice crystals). However, water
vapor is not considered a pollutant because it is considered part of the feedback loop rather than a primary cause of change. 2 Black carbon contributes to climate change both directly, by absorbing sunlight, and indirectly, by depositing on snow (making it
melt faster) and by interacting with clouds and affecting cloud formation. Black carbon is the most strongly light-absorbing component of particulate matter (PM) emitted from burning fuels such as coal, diesel, and biomass. Reducing black carbon emissions globally can have immediate economic, climate, and public health benefits. California has been an international leader in reducing emissions of black carbon, with close to 95 percent control expected by 2020 due to existing programs that target reducing PM from diesel engines and burning activities (CARB 2017a). However, state and national GHG inventories do not include black carbon due to ongoing work resolving the precise global warming potential of black carbon. Guidance for CEQA documents does not yet include black carbon.
3 CO2-equivalence is used to show the relative potential that different GHGs have to retain infrared radiation in the atmosphere and contribute to the greenhouse effect. The global warming potential of a GHG is also dependent on the lifetime, or persistence, of the gas molecule in the atmosphere.

R A N C H O C U C A M O N G A C A M P U S M A S T E R P L A N D R A F T E I R C H A F F E Y C O M M U N I T Y C O L L E G E D I S T R I C T
5. Environmental Analysis GREENHOUSE GAS EMISSIONS
April 2022 Page 5.4-3
California’s GHG Sources and Relative Contribution
In 2021, the statewide GHG emissions inventory was updated for 2000 to 2019 emissions using the GWPs in IPCC’s AR4 (IPCC 2013). Based on these GWPs, California produced 418.2 MMTCO2e GHG emissions in 2019. California’s transportation sector was the single largest generator of GHG emissions, producing 39.7 percent of the state’s total emissions. Industrial sector emissions made up 21.1 percent, and electric power generation made up 14.1 percent of the state’s emissions inventory. Other major sectors of GHG emissions include commercial and residential (10.5 percent), agriculture and forestry (7.6 percent), high GWP (4.9 percent), and recycling and waste (2.1 percent) (CARB 2021).
Since the peak level in 2004, California statewide GHG emissions dropped below the 2020 GHG limit of 418.2 MMTCO2e in 2016 and have remained below the 2020 GHG limit since then. In 2019, emissions from routine GHG-emitting activities statewide were almost 13 MMTCO2e lower than the 2020 GHG limit. Per-capita GHG emissions in California have dropped from a 2001 peak of 14.0 MTCO2e per person to 10.5 MTCO2e per person in 2019, a 25 percent decrease. Transportation emissions continued to decline in 2019 as they had done in 2018, with even more substantial reductions due to a significant increase in renewable diesel. Since 2008, California’s electricity sector has followed an overall downward trend in emissions. In 2019, solar power generation continued its rapid growth since 2013. Emissions from high-GWP gases comprised 4.9 percent of California’s emissions in 2019. This continues the increasing trend as the gases replace ozone-depleting substances being phased out under the 1987 Montreal Protocol. Overall trends in the inventory also demonstrate that the carbon intensity of California’s economy (the amount of carbon pollution per million dollars of gross domestic product) has declined 45 percent since the 2001 peak, though the state’s gross domestic product grew 63 percent during this period (CARB 2021).
Human Influence on Climate Change
For approximately 1,000 years before the Industrial Revolution, the amount of GHGs in the atmosphere remained relatively constant. During the 20th century, however, scientists observed a rapid change in the climate and the quantity of climate change pollutants in the Earth’s atmosphere that is attributable to human activities. The amount of CO2 in the atmosphere has increased by more than 35 percent since preindustrial times and has increased at an average rate of 1.4 parts per million per year since 1960, mainly due to combustion of fossil fuels and deforestation (IPCC 2007). These recent changes in the quantity and concentration of climate change pollutants far exceed the extremes of the ice ages, and the global mean temperature is warming at a rate that cannot be explained by natural causes alone. Human activities are directly altering the chemical composition of the atmosphere through the buildup of climate change pollutants (CAT 2006). In the past, gradual changes in the earth’s temperature changed the distribution of species, availability of water, etc. However, human activities are accelerating this process so that environmental impacts associated with climate change no longer occur in a geologic time frame but within a human lifetime (IPCC 2007).
Like the variability in the projections of the expected increase in global surface temperatures, the environmental consequences of gradual changes in the Earth’s temperature are hard to predict. Projections of climate change depend heavily on future human activity. Therefore, climate models are based on different emission scenarios that account for historical trends in emissions and on observations of the climate record that assess the human

R A N C H O C U C A M O N G A C A M P U S M A S T E R P L A N D R A F T E I R C H A F F E Y C O M M U N I T Y C O L L E G E D I S T R I C T
5. Environmental Analysis GREENHOUSE GAS EMISSIONS
Page 5.4-4 PlaceWorks
influence of the trend and projections for extreme weather events. Climate-change scenarios are affected by varying degrees of uncertainty. For example, there are varying degrees of certainty on the magnitude of the trends for:
Warmer and fewer cold days and nights over most land areas.
Warmer and more frequent hot days and nights over most land areas.
An increase in the frequency of warm spells and heat waves over most land areas.
An increase in frequency of heavy precipitation events (or proportion of total rainfall from heavy falls) over most areas.
Larger areas affected by drought.
Intense tropical cyclone activity increases.
Increased incidence of extreme high sea level (excluding tsunamis).
Potential Climate Change Impacts for California
Observed changes over the last several decades across the western United States reveal clear signs of climate change. Statewide, average temperatures increased by about 1.7°F from 1895 to 2011, and warming has been greatest in the Sierra Nevada (CCCC 2012). The years from 2014 through 2016 showed unprecedented temperatures, with 2014 being the warmest (OEHHA 2018). By 2050, California is projected to warm by approximately 2.7°F above 2000 average temperatures, a threefold increase in the rate of warming over the last century. By 2100, average temperatures could increase by 5.6 to 8.8°F, depending on emissions levels (CNRA 2019).
In California and western North America, observations of the climate have shown: 1) a trend toward warmer winter and spring temperatures; 2) a smaller fraction of precipitation falling as snow; 3) a decrease in the amount of spring snow accumulation in the lower and middle elevation mountain zones; 4) advanced shift in the timing of snowmelt of 5 to 30 days earlier in the spring; and 5) a similar shift (5 to 30 days earlier) in the timing of spring flower blooms (CAT 2006). Overall, California has become drier over time, with five of the eight years of severe to extreme drought occurring between 2007 and 2016, and with unprecedented dry years in 2014 and 2015 (OEHHA 2018). Statewide precipitation has become increasingly variable from year to year, with the driest consecutive four years occurring from 2012 to 2015 (OEHHA 2018). According to the California Climate Action Team—a committee of state agency secretaries and the heads of agencies, boards, and departments, led by the Secretary of the California Environmental Protection Agency—even if actions could be taken to immediately curtail climate change emissions, the potency of emissions that have already built up, their long atmospheric lifetimes (see Table 5.4-1), and the inertia of the Earth’s climate system could produce as much as 0.6°C (1.1°F) of additional warming. Consequently, some impacts from climate change are now considered unavoidable. Global climate change risks to California are shown in Table 5.4-2, Summary of GHG Emissions Risks to California, and include impacts to public health, water resources, agriculture, coastal sea level, forest and biological resources, and energy.

R A N C H O C U C A M O N G A C A M P U S M A S T E R P L A N D R A F T E I R C H A F F E Y C O M M U N I T Y C O L L E G E D I S T R I C T
5. Environmental Analysis GREENHOUSE GAS EMISSIONS
April 2022 Page 5.4-5
Table 5.4-2 Summary of GHG Emissions Risks to California Impact Category Potential Risk
Public Health Impacts
Heat waves will be more frequent, hotter, and longer Fewer extremely cold nights Poor air quality made worse Higher temperatures increase ground-level ozone levels
Water Resources Impacts
Decreasing Sierra Nevada snow pack Challenges in securing adequate water supply Potential reduction in hydropower Loss of winter recreation
Agricultural Impacts
Increasing temperature Increasing threats from pests and pathogens Expanded ranges of agricultural weeds Declining productivity Irregular blooms and harvests
Coastal Sea Level Impacts
Accelerated sea level rise Increasing coastal floods Shrinking beaches Worsened impacts on infrastructure
Forest and Biological Resource Impacts
Increased risk and severity of wildfires Lengthening of the wildfire season Movement of forest areas Conversion of forest to grassland Declining forest productivity Increasing threats from pest and pathogens Shifting vegetation and species distribution Altered timing of migration and mating habits Loss of sensitive or slow-moving species
Energy Demand Impacts Potential reduction in hydropower Increased energy demand
Sources: CEC 2006, 2009; CCCC 2012; CNRA 2014.
5.4.1.2 REGULATORY BACKGROUND
Federal, state, and local laws, regulations, plans, or guidelines related to greenhouse gasses that are applicable to the proposed project are summarized in this section.
Federal
United State Environmental Protection Agency
The US Environmental Protection Agency (EPA) announced on December 7, 2009, that GHG emissions threaten the public health and welfare of the American people and that GHG emissions from on-road vehicles contribute to that threat. The EPA’s final findings responded to the 2007 US Supreme Court decision that GHG emissions fit within the Clean Air Act definition of air pollutants. The findings did not in and of themselves impose any emission reduction requirements, but allowed the EPA to finalize the GHG standards proposed in

R A N C H O C U C A M O N G A C A M P U S M A S T E R P L A N D R A F T E I R C H A F F E Y C O M M U N I T Y C O L L E G E D I S T R I C T
5. Environmental Analysis GREENHOUSE GAS EMISSIONS
Page 5.4-6 PlaceWorks
2009 for new light-duty vehicles as part of the joint rulemaking with the Department of Transportation (US EPA 2009).
To regulate GHGs from passenger vehicles, the EPA was required to issue an endangerment finding (US EPA 2022). The finding identified emissions of six key GHGs—carbon dioxide (CO2), methane (CH4), nitrous oxide (N2O), hydrofluorocarbons, perfluorocarbons, and sulfur hexafluoride (SF6)—that have been the subject of scrutiny and intense analysis for decades by scientists in the United States and around the world. The first three are applicable to the project’s GHG emissions inventory because they constitute the majority of GHG emissions and, per South Coast AQMD guidance, are the GHG emissions that should be evaluated as part of a project’s GHG emissions inventory.
US Mandatory Reporting Rule for GHGs (2009)
In response to the endangerment finding, the EPA issued the Mandatory Reporting of GHG Rule that requires substantial emitters of GHG emissions (large stationary sources, etc.) to report GHG emissions data. Facilities that emit 25,000 MTCO2e or more per year are required to submit an annual report.
Update to Corporate Average Fuel Economy Standards (2021 to 2026)
The federal government issued new corporate average fuel economy standards in 2012 for model years 2017 to 2025 that required a fleet average of 54.5 miles per gallon in 2025. However, on March 30, 2020, the EPA finalized updated corporate average fuel economy and GHG emissions standards for passenger cars and light trucks and established new standards covering model years 2021 through 2026, known as the Safer Affordable Fuel Efficient Vehicles Final Rule for Model Years 2021 to 2026. However, a consortium of automakers and California have agreed on a voluntary framework to reduce emissions that can serve as an alternate path forward for clean vehicle standards nationwide. Automakers who agreed to the framework are Ford, Honda, BMW of North America, and Volkswagen Group of America. The framework supports continued annual reductions of vehicle GHG emissions through the 2026 model year, encourages innovation to accelerate the transition to electric vehicles, and gives industry the certainty needed to make investments and create jobs. The auto companies that are parties to the voluntary agreement will only sell cars in the United States that meet these standards (CARB 2019). However, on December 21, 2021, under direction of Executive Order 13990 issued by President Biden, the National Highway Traffic Safety Administration (NHTSA) repealed Safer Affordable Fuel Efficient Vehicles Rule Part One, which had preempted state and local laws related to fuel economy standards. In addition, on August 5, 2021, the NHTSA announced new proposed fuel standards in response to Executive Order 13990. Fuel efficiency under the standards proposed would increase 8 percent annually for model years 2024 to 2026 and increase the estimated fleetwide average by 12 miles per gallon for model year 2026 compared to model year 2021 (NHTSA 2021).
EPA Regulation of Stationary Sources under the Clean Air Act (Ongoing)
Pursuant to its authority under the Clean Air Act, the EPA has been developing regulations for new, large stationary sources of emissions such as power plants and refineries. Under former President Obama’s 2013 Climate Action Plan, the EPA was directed to develop regulations for existing stationary sources as well. On June 19, 2019, the EPA issued the final Affordable Clean Energy rule, which became effective on August 19,

R A N C H O C U C A M O N G A C A M P U S M A S T E R P L A N D R A F T E I R C H A F F E Y C O M M U N I T Y C O L L E G E D I S T R I C T
5. Environmental Analysis GREENHOUSE GAS EMISSIONS
April 2022 Page 5.4-7
2019, following the Energy Independence Executive Order. It officially rescinds the Clean Power Plan rule issued during the Obama administration and sets emissions guidelines for states in developing plans to limit CO2 emissions from coal-fired power plants.
State
Current State of California guidance and goals for reductions in GHG emissions are generally embodied in Executive Order S-03-05, Executive Order B-30-15, Assembly Bill (AB) 32, Senate Bill (SB) 32, and SB 375.
Executive Order S-03-05
Executive Order S-03-05, signed June 1, 2005, set the following GHG reduction targets for the state:
2000 levels by 2010
1990 levels by 2020 80 percent below 1990 levels by 2050
Assembly Bill 32, the Global Warming Solutions Act (2006)
Current State of California guidance and targets for reductions in GHG emissions are generally embodied in AB 32. AB 32 was passed by the California state legislature on August 31, 2006, to place the state on a course toward reducing its contribution of GHG emissions. AB 32 follows the 2020 tier of emissions reduction goals established in Executive Order S-03-05.
CARB 2008 Scoping Plan
The first Scoping Plan was adopted by the California Air Resources Board (CARB) on December 11, 2008. The 2008 Scoping Plan identified that GHG emissions in California were anticipated to be 596 MMTCO2e in 2020. In December 2007, CARB approved a 2020 emissions limit of 427 MMTCO2e for the state (CARB 2008). To effectively implement the emissions cap, AB 32 directed CARB to establish a mandatory reporting system to track and monitor GHG emissions levels for large stationary sources that generate more than 25,000 MTCO2e per year, prepare a plan demonstrating how the 2020 deadline could be met, and develop appropriate regulations and programs to implement the plan by 2012.
First Update to the Scoping Plan
CARB completed a five-year update to the 2008 Scoping Plan, as required by AB 32. The First Update to the Scoping Plan, adopted May 22, 2014, highlighted California’s progress toward meeting the near-term 2020 GHG emission reduction goals defined in the 2008 Scoping Plan. As part of the update, CARB recalculated the 1990 GHG emission levels with the updated AR4 GWPs, which slightly increased the 427 MMTCO2e 1990 emissions level and 2020 GHG emissions limit, established in response to AB 32, to 431 MMTCO2e (CARB 2014).
The First Update to the Scoping Plan found that California was on track to meet the goals of AB 32. However, the update also addressed the state’s longer-term GHG goals in a post-2020 element. The post-2020 element

R A N C H O C U C A M O N G A C A M P U S M A S T E R P L A N D R A F T E I R C H A F F E Y C O M M U N I T Y C O L L E G E D I S T R I C T
5. Environmental Analysis GREENHOUSE GAS EMISSIONS
Page 5.4-8 PlaceWorks
provided a long-term strategy for meeting the 2050 GHG goal, including a recommendation for the state to adopt a midterm target. According to the First Update to the Scoping Plan, local government reduction targets should chart a reduction trajectory that is consistent with or exceeds the trajectory created by statewide goals (CARB 2014). CARB identified that reducing emissions to 80 percent below 1990 levels would require a fundamental shift to efficient, clean energy in every sector of the economy. Progressing toward California’s 2050 climate targets will require significant acceleration of GHG reduction rates. Emissions from 2020 to 2050 will have to decline several times faster than the rate needed to reach the 2020 emissions limit (CARB 2014).
Executive Order B-30-15
Executive Order B-30-15, signed April 29, 2015, sets a goal of reducing GHG emissions in the state to 40 percent below 1990 levels by year 2030. Executive Order B-30-15 also directs CARB to update the Scoping Plan to quantify the 2030 GHG reduction goal for the state and requires state agencies to implement measures to meet the interim 2030 goal as well as the long-term goal for 2050 in Executive Order S-03-05. It also requires the Natural Resources Agency to conduct triennial updates of the California adaptation strategy, “Safeguarding California,” in order to ensure climate change is accounted for in state planning and investment decisions.
Senate Bill 32 and Assembly Bill 197
In September 2016, Governor Brown signed SB 32 and AB 197, making the Executive Order goal for year 2030 into a statewide mandated legislative target. AB 197 established a joint legislative committee on climate change policies and requires the CARB to prioritize direct emissions reductions rather than the market-based cap-and-trade program for large stationary, mobile, and other sources.
2017 Climate Change Scoping Plan
Executive Order B-30-15 and SB 32 required CARB to prepare another update to the Scoping Plan to address the 2030 target for the state. On December 24, 2017, CARB approved the 2017 Climate Change Scoping Plan Update, which outlines potential regulations and programs, including strategies consistent with AB 197 requirements, to achieve the 2030 target. The 2017 Scoping Plan establishes a new emissions limit of 260 MMTCO2e for the year 2030, which corresponds to a 40 percent decrease in 1990 levels by 2030 (CARB 2017b).
California’s climate strategy will require contributions from all sectors of the economy, including enhanced focus on zero- and near-zero-emission (ZE/NZE) vehicle technologies; continued investment in renewables such as solar roofs, wind, and other types of distributed generation; greater use of low carbon fuels; integrated land conservation and development strategies; coordinated efforts to reduce emissions of short-lived climate pollutants (methane, black carbon, and fluorinated gases); and an increased focus on integrated land use planning to support livable, transit-connected communities and conserve agricultural and other lands. Requirements for GHG reductions at stationary sources complement local air pollution control efforts by the local air districts to tighten emissions limits on criteria air pollutants and toxic air contaminants from a broad spectrum of industrial sources. Major elements of the 2017 Scoping Plan framework include:

R A N C H O C U C A M O N G A C A M P U S M A S T E R P L A N D R A F T E I R C H A F F E Y C O M M U N I T Y C O L L E G E D I S T R I C T
5. Environmental Analysis GREENHOUSE GAS EMISSIONS
April 2022 Page 5.4-9
Implementing and/or increasing the standards of the Mobile Source Strategy, which include increasing ZE buses and trucks.
Low Carbon Fuel Standard (LCFS) with an increased stringency (18 percent by 2030).
Implementation of SB 350, which expands the Renewables Portfolio Standard (RPS) to 50 percent RPS and doubles energy efficiency savings by 2030.
California Sustainable Freight Action Plan, which improves freight system efficiency and utilizes near-zero emissions technology and deployment of ZE trucks.
Implementing the proposed Short-Lived Climate Pollutant Strategy, which focuses on reducing methane and hydrofluorocarbon emissions by 40 percent and anthropogenic black carbon emissions by 50 percent by year 2030.
Post-2020 Cap-and-Trade Program that includes declining caps.
Continued implementation of SB 375.
Development of a Natural and Working Lands Action Plan to secure California’s land base as a net carbon sink.
In addition to these statewide strategies, the 2017 Climate Change Scoping Plan identified local governments as essential partners in achieving the state’s long-term GHG reduction goals and recommended local actions to reduce GHG emissions—for example, statewide targets of no more than 6 MTCO2e or less per capita by 2030 and 2 MTCO2e or less per capita by 2050. CARB recommends that local governments evaluate and adopt locally appropriate, robust, and quantitative goals that align with the statewide per capita targets and sustainable development objectives, and develop plans to achieve the local goals. The statewide per capita goals were developed by applying the percentage reductions necessary to reach the 2030 and 2050 climate goals (40 percent and 80 percent, respectively) to the state’s 1990 emissions limit established under AB 32. For CEQA projects, CARB states that lead agencies have discretion to develop evidenced-based numeric thresholds (mass emissions, per capita, or per service population) consistent with the Scoping Plan and the state’s long-term GHG goals. To the degree a project relies on GHG mitigation measures, CARB recommends that lead agencies prioritize on-site design features that reduce emissions—especially from vehicle miles traveled (VMT)—and direct investments in GHG reductions in the project’s region that contribute potential air quality, health, and economic co-benefits. Where further project design or regional investments are infeasible or not proven to be effective, CARB recommends mitigating potential GHG impacts through purchasing and retiring carbon credits.
The Scoping Plan scenario is set against what is called the “business-as-usual” yardstick—that is, what would the GHG emissions look like if the State did nothing at all beyond the existing policies that are required and already in place to achieve the 2020 limit, as shown in Table 5.4-3, 2017 Climate Change Scoping Plan Emissions Reductions Gap. It includes the existing renewables requirements, advanced clean cars, the “10 percent” LCFS, and the SB 375 program for more vibrant communities, among others. However, it does not include a range

R A N C H O C U C A M O N G A C A M P U S M A S T E R P L A N D R A F T E I R C H A F F E Y C O M M U N I T Y C O L L E G E D I S T R I C T
5. Environmental Analysis GREENHOUSE GAS EMISSIONS
Page 5.4-10 PlaceWorks
of new policies or measures that have been developed or put into statute over the past two years. Also shown in the table, the known commitments are expected to result in emissions that are 60 MMTCO2e above the target in 2030. If the estimated GHG reductions from the known commitments are not realized due to delays in implementation or technology, the post-2020 Cap-and-Trade Program would deliver the additional GHG reductions in the sectors it covers to ensure the 2030 target is achieved.
Table 5.4-3 2017 Climate Change Scoping Plan Emissions Reductions Gap
Modeling Scenario 2030 GHG Emissions
MMTCO2e Reference Scenario (Business-as-Usual) 389 With Known Commitments 320 2030 GHG Target 260 Gap to 2030 Target 60
Source: CARB 2017b.
Table 5.4-4, 2017 Climate Change Scoping Plan Emissions Change by Sector, provides estimated GHG emissions compared to 1990 levels and the range of GHG emissions for each sector estimated for 2030.
Table 5.4-4 2017 Climate Change Scoping Plan Emissions Change by Sector
Scoping Plan Sector 1990
MMTCO2e 2030 Proposed Plan Ranges
MMTCO2e % Change from 1990 Agricultural 26 24-25 -8% to -4% Residential and Commercial 44 38-40 -14% to -9% Electric Power 108 30-53 -72% to -51% High GWP 3 8-11 267% to 367% Industrial 98 83-90 -15% to -8% Recycling and Waste 7 8-9 14% to 29% Transportation (including TCU) 152 103-111 -32% to -27% Net Sink1 -7 TBD TBD Sub Total 431 294-339 -32% to -21% Cap-and-Trade Program NA 24-79 NA Total 431 260 -40% Source: CARB 2017b. Notes: TCU = Transportation, Communications, and Utilities; TBD = to be determined. 1 Work was underway through 2017 to estimate the range of potential sequestration benefits from the natural and working lands sector.
Senate Bill 375
In 2008, the Sustainable Communities and Climate Protection Act, SB 375, was adopted to connect the GHG emissions reductions targets established in the 2008 Scoping Plan for the transportation sector to local land use decisions that affect travel behavior. Its intent is to reduce GHG emissions from light-duty trucks and automobiles (excludes emissions associated with goods movement) by aligning regional long-range

R A N C H O C U C A M O N G A C A M P U S M A S T E R P L A N D R A F T E I R C H A F F E Y C O M M U N I T Y C O L L E G E D I S T R I C T
5. Environmental Analysis GREENHOUSE GAS EMISSIONS
April 2022 Page 5.4-11
transportation plans, investments, and housing allocations to local land use planning to reduce VMT and vehicle trips. Specifically, SB 375 required CARB to establish GHG emissions reduction targets for each of the 18 metropolitan planning organizations (MPO). The Southern California Association of Governments (SCAG) is the MPO for the Southern California region, which includes the counties of Los Angeles, Orange, San Bernardino, Riverside, Ventura, and Imperial.
Pursuant to the recommendations of the Regional Transportation Advisory Committee, CARB adopted per capita reduction targets for each of the MPOs rather than a total magnitude reduction target. SCAG’s targets are an 8 percent per capita reduction from 2005 GHG emission levels by 2020 and a 13 percent per capita reduction from 2005 GHG emission levels by 2035 (CARB 2010). The 2020 targets are smaller than the 2035 targets because a significant portion of the built environment in 2020 has been defined by decisions that have already been made. In general, the 2020 scenarios reflect that more time is needed for large land use and transportation infrastructure changes. Most of the reductions in the interim are anticipated to come from improving the efficiency of the region’s transportation network. The targets would result in 3 MMTCO2e of reductions by 2020 and 15 MMTCO2e of reductions by 2035. Based on these reductions, the passenger vehicle target in CARB’s Scoping Plan (for AB 32) would be met (CARB 2010).
2017 Update to the SB 375 Targets
CARB is required to update the targets for the MPOs every eight years. In June 2017, CARB released updated targets and technical methodology and released another update in February 2018. The updated targets consider the need to further reduce VMT, as identified in the 2017 Scoping Plan Update, while balancing the need for additional and more flexible revenue sources to incentivize positive planning and action toward sustainable communities. Like the 2010 targets, the updated SB 375 targets are in units of percent per capita reduction in GHG emissions from automobiles and light trucks compared to 2005. This excludes reductions anticipated from implementation of state technology and fuels strategies and any potential future state strategies such as statewide road user pricing. The proposed targets call for greater per capita GHG emission reductions from SB 375 than are currently in place, which for 2035, translates into proposed targets that either match or exceed the emission reduction levels in the MPOs’ currently adopted sustainable communities strategies (SCS). As proposed, CARB staff ’s proposed targets would result in an additional reduction of over 8 MMTCO2e in 2035 compared to the current targets. For the next round of SCS updates, CARB’s updated targets for the SCAG region are an 8 percent per capita GHG reduction in 2020 from 2005 levels (unchanged from the 2010 target) and a 19 percent per capita GHG reduction in 2035 from 2005 levels (compared to the 2010 target of 13 percent) (CARB 2018). CARB adopted the updated targets and methodology on March 22, 2018. All SCSs adopted after October 1, 2018, are subject to these new targets.
Regional
SCAG’s Regional Transportation Plan / Sustainable Communities Strategy
SB 375 requires each MPO to prepare a sustainable communities strategy in its regional transportation plan. For the SCAG region, the 2020-2045 Regional Transportation Plan/Sustainable Communities Strategy (RTP/SCS) (Connect SoCal) was adopted on September 3, 2020, and is an update to the 2016-2040 RTP/SCS

R A N C H O C U C A M O N G A C A M P U S M A S T E R P L A N D R A F T E I R C H A F F E Y C O M M U N I T Y C O L L E G E D I S T R I C T
5. Environmental Analysis GREENHOUSE GAS EMISSIONS
Page 5.4-12 PlaceWorks
(SCAG 2020). In general, the RTP/SCS outlines a development pattern for the region that, when integrated with the transportation network and other transportation measures and policies, would reduce vehicle miles traveled from automobiles and light duty trucks and thereby reduce GHG emissions from these sources.
Connect SoCal focuses on the continued efforts of the previous RTP/SCSs to integrate transportation and land uses strategies in development of the SCAG region through horizon year 2045 (SCAG 2020). It forecasts that the SCAG region will meet its GHG per capita reduction targets of 8 percent by 2020 and 19 percent by 2035. It also forecasts that implementation of the plan will reduce VMT per capita in year 2045 by 4.1 percent compared to baseline conditions for that year. Connect SoCal includes a “Core Vision” that centers on maintaining and better managing the transportation network for moving people and goods while expanding mobility choices by locating housing, jobs, and transit closer together, and increasing investments in transit and complete streets (SCAG 2020).
Specific Regulations for the Transportation Sector
Assembly Bill 1493
California vehicle GHG emission standards were enacted under AB 1493 (Pavley I). Pavley I is a clean-car standard that reduced GHG emissions from new passenger vehicles (light-duty auto to medium-duty vehicles) from 2009 through 2016 and was anticipated to reduce GHG emissions from new passenger vehicles by 30 percent in 2016. California implemented the Pavley I standards through a waiver granted to California by the EPA. In 2012, the EPA issued a Final Rulemaking that set even more stringent fuel economy and GHG emissions standards for model years 2017 through 2025 light-duty vehicles (see also the discussion on the update to the corporate average fuel economy standards under “Federal,” above). In January 2012, CARB approved the Advanced Clean Cars program (formerly known as Pavley II) for model years 2017 through 2025. The program combines the control of smog, soot, and GHGs with requirements for greater numbers of ZE vehicles into a single package of standards. Under California’s Advanced Clean Car program, by 2025 new automobiles will emit 34 percent less GHG and 75 percent less smog-forming emissions.
Executive Order S-01-07
On January 18, 2007, the state set a new LCFS for transportation fuels sold in the state. Executive Order S-01-07 set a declining standard for GHG emissions measured in CO2e gram per unit of fuel energy sold in California. The LCFS required a reduction of 2.5 percent in the carbon intensity of California’s transportation fuels by 2015 and a reduction of at least 10 percent by 2020. The standard applied to refiners, blenders, producers, and importers of transportation fuels, and would use market-based mechanisms to allow these providers to choose how they reduce emissions during the “fuel cycle” using the most economically feasible methods.
Executive Order B-16-2012
On March 23, 2012, the State announced that CARB, the California Energy Commission (CEC), the Public Utilities Commission, and other relevant agencies worked with the Plug-in Electric Vehicle Collaborative and the California Fuel Cell Partnership to establish benchmarks to accommodate ZE vehicles in major metropolitan areas, including infrastructure to support them (e.g., electric vehicle charging stations). The

R A N C H O C U C A M O N G A C A M P U S M A S T E R P L A N D R A F T E I R C H A F F E Y C O M M U N I T Y C O L L E G E D I S T R I C T
5. Environmental Analysis GREENHOUSE GAS EMISSIONS
April 2022 Page 5.4-13
executive order also directed the number of ZE vehicles in California’s state vehicle fleet to increase through the normal course of fleet replacement so that at least 10 percent of fleet purchases of light-duty vehicles were ZE by 2015 and at least 25 percent by 2020. The executive order also established a target for the transportation sector of reducing GHG emissions 80 percent below 1990 levels.
Executive Order N-79-20
On September 23, 2020, Governor Newsom signed Executive Order N-79-20 with the goal that 100 percent of in-state sales of new passenger cars and trucks will be ZE by 2035. Additionally, this Executive Order identified fleet goals of 100 percent ZE drayage trucks by 2035 and 100 percent ZE medium- and heavy-duty vehicles in the state by 2045, for all operations where feasible. Additionally, the executive order identifies a goal for the state to transition to 100 percent ZE off-road vehicles and equipment by 2035, where feasible.
Renewables Portfolio: Carbon Neutrality Regulations
Senate Bills 1078, 107, and X1-2 and Executive Order S-14-08
A major component of California’s Renewable Energy Program is the renewables portfolio standard established under SBs 1078 (Sher) and 107 (Simitian). Under the RPS, certain retail sellers of electricity were required to increase the amount of renewable energy each year by at least 1 percent in order to reach at least 20 percent by December 30, 2010. Executive Order S-14-08, signed in November 2008, expanded the state’s renewable energy standard to 33 percent renewable power by 2020. This standard was adopted by the legislature in 2011 (SB X1-2). Renewable sources of electricity include wind, small hydropower, solar, geothermal, biomass, and biogas. The increase in renewable sources for electricity production will decrease indirect GHG emissions from development projects because electricity production from renewable sources is generally considered carbon neutral.
Senate Bill 350
Senate Bill 350 (de Leon) was signed into law September 2015 and established tiered increases to the RPS—40 percent by 2024, 45 percent by 2027, and 50 percent by 2030. SB 350 also set a new goal to double the energy-efficiency savings in electricity and natural gas through energy efficiency and conservation measures.
Senate Bill 100
On September 10, 2018, Governor Brown signed SB 100, which replaced the SB 350 requirement of 45 percent renewable energy by 2027 with the requirement of 50 percent by 2026 and raised California’s RPS requirements for 2050 from 50 percent to 60 percent. SB 100 established RPS requirements for publicly owned utilities that consist of 44 percent renewable energy by 2024, 52 percent by 2027, and 60 percent by 2030. The bill also established an overall state policy that eligible renewable energy resources and zero-carbon resources supply 100 percent of all retail sales of electricity to California end-use customers and 100 percent of electricity procured to serve all state agencies by December 31, 2045. Under the bill, the state cannot increase carbon emissions elsewhere in the western grid or allow resource shuffling to achieve the 100 percent carbon-free electricity target.
R A N C H O C U C A M O N G A C A M P U S M A S T E R P L A N D R A F T E I R C H A F F E Y C O M M U N I T Y C O L L E G E D I S T R I C T
5. Environmental Analysis GREENHOUSE GAS EMISSIONS
Page 5.4-14 PlaceWorks
Executive Order B-55-18
Executive Order B-55-18, signed September 10, 2018, set a goal “to achieve carbon neutrality as soon as possible, and no later than 2045, and achieve and maintain net negative emissions thereafter.” Executive Order B-55-18 directs CARB to work with relevant state agencies to ensure that future Scoping Plans identify and recommend measures to achieve the carbon neutrality goal. The goal of carbon neutrality by 2045 is in addition to other statewide goals, meaning that not only should emissions be reduced to 80 percent below 1990 levels by 2050, but that, by no later than 2045, the remaining emissions should be offset by equivalent net removals of CO2e from the atmosphere, including through sequestration in forests, soils, and other natural landscapes.
Energy Efficiency Regulations
California Building Code: Building Energ y Efficiency Standards
Energy conservation standards for new residential and nonresidential buildings were adopted by the California Energy Resources Conservation and Development Commission (now the CEC) in June 1977 (Title 24, Part 6, of the California Code of Regulations [CCR]). Title 24 requires the design of building shells and building components to conserve energy. The standards are updated periodically to allow for consideration and possible incorporation of new energy efficiency technologies and methods. The 2019 Building Energy Efficiency Standards were adopted on May 9, 2018, and went into effect on January 1, 2020.
The 2019 standards move toward cutting energy use in new homes by more than 50 percent and require installation of solar photovoltaic systems for single-family homes and multifamily buildings of three stories and less. The 2019 standards focus on four key areas: 1) smart residential photovoltaic systems; 2) updated thermal envelope standards (preventing heat transfer from the interior to exterior and vice versa); 3) residential and nonresidential ventilation requirements; 4) and nonresidential lighting requirements (CEC 2018a). Under the 2019 standards, nonresidential buildings are 30 percent more energy efficient than under the 2016 standards, and single-family homes are 7 percent more energy efficient (CEC 2018b). When accounting for the electricity generated by the solar photovoltaic system, single-family homes would use 53 percent less energy compared to homes built to the 2016 standards (CEC 2018b).
Furthermore, on August 11, 2021, the CEC adopted the 2022 Building Energy Efficiency Standards, which were subsequently approved by the California Building Standards Commission in December 2021. The 2022 standards become effective and replace the existing 2019 standards on January 1, 2023. The 2022 standards would require mixed-fuel single-family homes to be electric-ready to accommodate replacement of gas appliances with electric appliances. In addition, the new standards also include prescriptive photovoltaic system and battery requirements for high-rise, multifamily buildings (i.e., more than three stories) and noncommercial buildings such as hotels, offices, medical offices, restaurants, retail stores, schools, warehouses, theaters, and convention centers (CEC 2021).
California Building Code: CALGreen
On July 17, 2008, the California Building Standards Commission adopted the nation’s first green building standards. The California Green Building Standards Code (24 CCR, Part 11, known as “CALGreen”) was adopted as part of the California Building Standards Code. CALGreen established planning and design

R A N C H O C U C A M O N G A C A M P U S M A S T E R P L A N D R A F T E I R C H A F F E Y C O M M U N I T Y C O L L E G E D I S T R I C T
5. Environmental Analysis GREENHOUSE GAS EMISSIONS
April 2022 Page 5.4-15
standards for sustainable site development, energy efficiency (in excess of the California Energy Code requirements), water conservation, material conservation, and internal air contaminants.4 The mandatory provisions of the California Green Building Code Standards became effective January 1, 2011, and were last updated in 2019. The 2019 CALGreen standards became effective January 1, 2020.
Section 5.408 of CALGreen also requires that at least 65 percent of the nonhazardous construction and demolition waste from nonresidential construction operations be recycled and/or salvaged for reuse.
2006 Appliance Efficiency Regulations
The 2006 Appliance Efficiency Regulations (20 CCR Sections 1601–1608) were adopted by the CEC on October 11, 2006, and approved by the California Office of Administrative Law on December 14, 2006. The regulations include standards for both federally regulated appliances and non–federally regulated appliances. Though these regulations are now often viewed as “business as usual,” they exceed the standards imposed by all other states, and they reduce GHG emissions by reducing energy demand.
Solid Waste Diversion Regulations
AB 939: Integrated Waste Management Act of 1989
California’s Integrated Waste Management Act of 1989 (AB 939) set a requirement for cities and counties throughout the state to divert 50 percent of all solid waste from landfills by January 1, 2000, through source reduction, recycling, and composting (Public Resources Code Sections 40050 et seq.). In 2008, the requirements were modified to reflect a per capita requirement rather than tonnage. To help achieve this, the act requires that each city and county prepare and submit a source reduction and recycling element. AB 939 also established the goal for all California counties to provide at least 15 years of ongoing landfill capacity.
Assembly Bill 341
AB 341 (Chapter 476, Statutes of 2011) increased the statewide goal for waste diversion to 75 percent by 2020 and requires recycling of waste from commercial and multifamily residential land uses. Section 5.408 of CALGreen also requires that at least 65 percent of the nonhazardous construction and demolition waste from nonresidential construction operations be recycled and/or salvaged for reuse.
Assembly Bill 1327
The California Solid Waste Reuse and Recycling Access Act (AB 1327) requires areas to be set aside for collecting and loading recyclable materials in development projects (Public Resources Code Sections 42900 et seq.). The act required the California Integrated Waste Management Board to develop a model ordinance for adoption by any local agency requiring adequate areas for collection and loading of recyclable materials as part of development projects. Local agencies are required to adopt the model or an ordinance of their own.
Assembly Bill 1826
In October 2014, Governor Brown signed AB 1826, requiring businesses to recycle their organic waste on and after April 1, 2016, depending on the amount of waste they generate per week. This law also requires that on
4 The green building standards became mandatory in the 2010 edition of the code.

R A N C H O C U C A M O N G A C A M P U S M A S T E R P L A N D R A F T E I R C H A F F E Y C O M M U N I T Y C O L L E G E D I S T R I C T
5. Environmental Analysis GREENHOUSE GAS EMISSIONS
Page 5.4-16 PlaceWorks
and after January 1, 2016, local jurisdictions across the state implement an organic waste recycling program to divert organic waste generated by businesses and multifamily residential dwellings that consist of five or more units. Organic waste means food waste, green waste, landscape and pruning waste, nonhazardous wood waste, and food-soiled paper waste that is mixed in with food waste.
Water Efficiency Regulations
SBX7-7
The 20x2020 Water Conservation Plan was issued by the Department of Water Resources (DWR) in 2010 pursuant to Senate Bill 7, which was adopted during the 7th Extraordinary Session of 2009–2010 and therefore dubbed “SBX7-7.” SBX7-7 mandated urban water conservation and authorized the DWR to prepare a plan implementing urban water conservation requirements (20x2020 Water Conservation Plan). In addition, it required agricultural water providers to prepare agricultural water management plans, measure water deliveries to customers, and implement other efficiency measures. SBX7-7 requires urban water providers to adopt a water conservation target of 20 percent reduction in urban per capita water use by 2020 compared to 2005 baseline use.
Assembly Bill 1881: Water Conservation in Landscaping Act
The Water Conservation in Landscaping Act of 2006 (AB 1881) requires local agencies to adopt the updated DWR model ordinance or an equivalent. AB 1881 also requires the CEC to consult with the DWR to adopt, by regulation, performance standards and labeling requirements for landscape irrigation equipment, including irrigation controllers, moisture sensors, emission devices, and valves to reduce the wasteful, uneconomic, inefficient, or unnecessary consumption of energy or water.
Short-Lived Climate Pollutant Reduction Strategy
Senate Bill 1383
On September 19, 2016, the governor signed SB 1383 to supplement the GHG reduction strategies in the Scoping Plan to consider short-lived climate pollutants, including black carbon and methane. Black carbon is the light-absorbing component of fine particulate matter produced during incomplete combustion of fuels. SB 1383 required the state board, no later than January 1, 2018, to approve and begin implementing that comprehensive strategy to reduce emissions of short-lived climate pollutants—to reduce methane by 40 percent, hydrofluorocarbon gases by 40 percent, and anthropogenic black carbon by 50 percent below 2013 levels by 2030. The bill also established targets for reducing organic waste in landfills, which includes a 50 percent reduction in statewide organic waste disposal from 2014 levels by 2020 and a 75 percent reduction from 2014 levels by 2025. Under SB 1383, jurisdictions are required to implement organic waste collection services for all residents and businesses by January 1, 2022. On March 14, 2017, CARB adopted the “Final Proposed Short-Lived Climate Pollutant Reduction Strategy,” which identifies the state’s approach to reducing anthropogenic and biogenic sources of short-lived climate pollutants. Anthropogenic sources of black carbon include on- and off-road transportation, residential wood burning, fuel combustion (charbroiling), and industrial processes. According to CARB, ambient levels of black carbon in California are 90 percent lower than in the early 1960s despite the tripling of diesel fuel use (CARB 2017b). In-use on-road rules were expected

R A N C H O C U C A M O N G A C A M P U S M A S T E R P L A N D R A F T E I R C H A F F E Y C O M M U N I T Y C O L L E G E D I S T R I C T
5. Environmental Analysis GREENHOUSE GAS EMISSIONS
April 2022 Page 5.4-17
to reduce black carbon emissions from on-road sources by 80 percent between 2000 and 2020. South Coast AQMD is one of the air districts that requires air pollution control technologies for chain-driven broilers, which reduces particulate emissions from these char broilers by over 80 percent (CARB 2017b). Additionally, South Coast AQMD Rule 445 limits installation of new fireplaces in the SoCAB.
5.4.1.3 EXISTING CONDITIONS
The existing campus generates GHG emissions from natural gas used for energy, heating, and cooking; electricity usage; vehicle trips for students, employees, vendors, and visitors; and area sources such as landscaping and consumer cleaning products. Existing emissions associated with the proposed project are shown in Table 5.4-5, Existing GHG Emissions Inventory.
Table 5.4-5 Existing GHG Emissions Inventory
Sectors GHG Emissions
MTCO2e per Year Area <1 Energy1 1,817 Mobile 15,403 Solid Waste Disposal 1,512 Water/Wastewater 271
Plan Area Total All Sectors 19,003 Source: CalEEMod, version 2020.4.0. Notes: Totals may not equal 100 percent due to rounding. 1 Utilizes CalEEMod historical energy rates, which are based on the 2005 Building Energy Efficiency Standards.
5.4.2 Thresholds of Significance According to Appendix G of the CEQA Guidelines, a project would normally have a significant effect on the environment if the project would:
GHG-1 Generate greenhouse gas emissions, either directly or indirectly, that may have a significant impact on the environment.
GHG-2 Conflict with an applicable plan, policy or regulation adopted for the purpose of reducing the emissions of greenhouse gases.
South Coast Air Quality Management District
South Coast AQMD adopted a significance threshold of 10,000 MTCO2e per year for permitted (stationary) sources of GHG emissions for which South Coast AQMD is the designated lead agency. To provide guidance to local lead agencies on determining significance for GHG emissions in their CEQA documents, South Coast AQMD convened a GHG CEQA Significance Threshold Working Group. Based on the last Working Group meeting in September 2010 (Meeting No. 15), South Coast AQMD identified a tiered approach for evaluating GHG emissions for development projects where South Coast AQMD is not the lead agency (South Coast AQMD 2010a). The following tiered approach has not been formally adopted by South Coast AQMD.
R A N C H O C U C A M O N G A C A M P U S M A S T E R P L A N D R A F T E I R C H A F F E Y C O M M U N I T Y C O L L E G E D I S T R I C T
5. Environmental Analysis GREENHOUSE GAS EMISSIONS
Page 5.4-18 PlaceWorks
Tier 1. If a project is exempt from CEQA, project-level and contribution to significant cumulative GHG emissions are less than significant.
Tier 2. If the project complies with a GHG emissions reduction plan or mitigation program that avoids or substantially reduces GHG emissions in the project’s geographic area (e.g., city or county), project-level and contribution to significant cumulative GHG emissions are less than significant.
Tier 3. If GHG emissions are less than the screening-level criterion, project-level and contribution to significant cumulative GHG emissions are less than significant.
For projects that are not exempt or where no qualifying GHG reduction plans are directly applicable, South Coast AQMD requires an assessment of GHG emissions. Project-related GHG emissions include on-road transportation, energy use, water use, wastewater generation, solid waste disposal, area sources, off-road emissions, and construction activities. The South Coast AQMD Working Group decided that because construction activities would result in a “one-time” net increase in GHG emissions, construction activities should be amortized into the operational phase GHG emissions inventory based on the service life of a building. For buildings in general, it is reasonable to look at a 30-year time frame, since this is a typical interval before a new building requires the first major renovation. South Coast AQMD identified a screening-level threshold of 3,000 MTCO2e annually for all land use types. The bright-line screening-level criteria are based on a review of the Governor’s Office of Planning and Research database of CEQA projects. Based on review of 711 CEQA projects, 90 percent of CEQA projects would exceed the bright-line thresholds. Therefore, projects that do not exceed the bright-line threshold would have a nominal and less than cumulatively considerable impact on GHG emissions. South Coast AQMD recommends use of the 3,000 MTCO2e interim bright-line screening-level criterion for all project types (South Coast AQMD 2010b).
Tier 4. If emissions exceed the screening threshold, a more detailed review of the project’s GHG emissions is warranted.5
The South Coast AQMD Working Group identified an efficiency target for projects that exceed the screening threshold of 4.8 MTCO2e per year per service population (MTCO2e/year/SP) for project-level analyses and 6.6 MTCO2e/year/SP for plan-level projects (e.g., program-level projects such as general plans) for the year 2020.6 The per capita efficiency targets were based on the AB 32 GHG reduction target and 2020 GHG emissions inventory prepared for CARB’s 2008 Scoping Plan.7
5 South Coast AQMD had identified an efficiency target for projects that exceed the bright-line threshold: a 2020 efficiency target of
4.8 MTCO2e per year per service population (MTCO2e/year/SP) for project-level analyses and 6.6 MTCO2e/year/SP for plan-level projects (e.g., general plans). Service population is generally defined as the sum of residential and employment population of a project. The per capita efficiency targets are based on the AB 32 GHG reduction target and 2020 GHG emissions inventory prepared for CARB’s 2008 Scoping Plan.5
6 It should be noted that the Working Group also considered efficiency targets for 2035 for the first time in this Working Group meeting. 7 South Coast AQMD took the 2020 statewide GHG reduction target for land use only GHG emissions sectors and divided it by the 2020 statewide
employment for the land use sectors to derive a per capita GHG efficiency metric that coincides with the GHG reduction targets of AB 32 for year 2020.

R A N C H O C U C A M O N G A C A M P U S M A S T E R P L A N D R A F T E I R C H A F F E Y C O M M U N I T Y C O L L E G E D I S T R I C T
5. Environmental Analysis GREENHOUSE GAS EMISSIONS
April 2022 Page 5.4-19
The South Coast AQMD Working Group’s bright-line screening-level criterion of 3,000 MTCO2e per year is used as the significance threshold for this project. If the project operation-phase emissions exceed this criterion, GHG emissions would be considered potentially significant without mitigation measures.
5.4.3 Plans, Programs, and Policies Plans, Programs, and Policies
Plans, programs, and policies (PPP), including applicable regulatory requirements and project design features for GHG emissions, are identified below.
PPP GHG-1 New buildings are required to achieve the current California Building Energy Efficiency Standards (Title 24, Part 6) and California Green Building Standards Code (CALGreen) (Title 24, Part 11). The 2019 Building Energy Efficiency Standards became effective on January 1, 2020, and the 2022 Building Energy Efficiency Standards will become effective on January 1, 2023. The Building Energy Efficiency Standards and CALGreen are updated triennially with a goal to achieve zero net energy for nonresidential buildings by 2030.
PPP GHG-2 New buildings are required to adhere to the California Green Building Standards Code (CALGreen) requirement to provide bicycle parking for new nonresidential buildings or meet local bicycle parking ordinances, whichever is stricter (CALGreen Sections 5.106.4.1, 14.106.4.1, and 5.106.4.1.2).
PPP GHG-3 California’s Green Building Standards Code (CALGreen) requires recycling and/or salvaging for reuse for a minimum of 65 percent of the nonhazardous construction and demolition waste generated during most “new construction” projects (CALGreen Sections 4.408 and 5.408). Construction contractors are required to submit a construction waste management plan that identifies the construction and demolition waste materials to be diverted from disposal by recycling, reuse on the project, or salvaged for future use or sale and the amount (by weight or volume).
PPP GHG-4 Construction activities are required to adhere to Title 13 California Code of Regulations Section 2499, which requires that nonessential idling of construction equipment is restricted to five minutes or less.
PPP GHG-5 New buildings are required to adhere to the California Green Building Standards Code and Water Efficient Landscape Ordinance requirements to increase water efficiency and reduce urban per capita water demand.
5.4.4 Environmental Impacts 5.4.4.1 METHODOLOGY
This GHG emissions evaluation was prepared in accordance with the requirements of CEQA to determine if significant GHG emissions impacts are likely in conjunction with the type and scale of development associated

R A N C H O C U C A M O N G A C A M P U S M A S T E R P L A N D R A F T E I R C H A F F E Y C O M M U N I T Y C O L L E G E D I S T R I C T
5. Environmental Analysis GREENHOUSE GAS EMISSIONS
Page 5.4-20 PlaceWorks
with the proposed project. Air pollutant emissions are calculated using CalEEMod, version 2020.4.0. CalEEMod compiles an emissions inventory of construction (fugitive dust, off-gas emissions, on-road emissions, and off-road emissions), area sources, indirect emissions from energy use, mobile sources, indirect emissions from waste disposal (annual only), and indirect emissions from water/wastewater use (annual only). The following provides a summary of the assumptions used for the proposed project analysis. GHG emissions modeling datasheets are in Appendix B.
Construction Phase
Construction would entail demolition of existing structures and asphalt, site preparation, grading, off-site hauling of demolition debris and earthwork material, construction of the proposed structures and buildings, architectural coating, and asphalt paving over 5 construction phases (Phases 1, 2, 3, 4, and 5). As shown previously in Table 3-1, Project Components and Phasing Summary, buildout of each development phase is anticipated between year 2027 and year 2051. It is anticipated that development would not be continuous during this period. Further details on the construction phasing and duration and equipment mix are summarized in Section 5.1.4.1, Methodology, of this DEIR. As discussed in that section, though the projected buildout of Phase 5 is anticipated for year 2051, for purposes of this analysis, a buildout year of 2050 is used because it is the latest year for which CalEEMod has on-road vehicle emissions data available. In general, vehicle emission rates decrease each year due to the assumption that older vehicles are replaced by newer, cleaner vehicles. Based on this general trend, year 2050 emissions would be either similar to or slightly more conservative than year 2051 emissions, if data were available. Annual average construction emissions were amortized over 30 years and included in the emissions inventory to account for one-time GHG emissions from the construction phase of the proposed project (South Coast AQMD 2009).
Operational Phase
Following completion of construction over the five phases, the campus would operate in a manner similar to existing conditions. Enrollment, staffing, and types of activities for both the school and the community would be the same as existing conditions. The main sources of emissions associated with operation are described.
Transportation. The primary source of mobile criteria air pollutant emissions is tailpipe exhaust emissions from the combustion of fuel (i.e., gasoline and diesel). For particulate matter, brake and tire wear and fugitive dust are created by vehicles traveling on roadways. Per Urban Crossroads, the existing campus generates approximately 18,982 average daily vehicle trips (ADT) during the weekday, and the proposed project would generate an additional 1,070 ADTs (see Appendix G of this DEIR). Of the existing 18,982 ADTs, approximately 4 ADTs are generated by medium-heavy-duty trucks and 6 ADTs are generated by heavy-heavy-duty trucks that are associated with the existing on-campus warehouse facility (see Appendix G of this DEIR). Implementation of the proposed project would not result in the generation of additional medium-heavy- and heavy-heavy-duty truck trips compared to existing conditions. For purposes of this analysis, calendar year 2050 vehicle emissions data are used for the buildout year scenario (see discussion under “Construction Phase” methodology, above).
Area Sources. Area source emissions from use of consumer cleaning products, landscaping equipment, and VOC emissions from paints for buildings are based on information provided or verified by the District.

R A N C H O C U C A M O N G A C A M P U S M A S T E R P L A N D R A F T E I R C H A F F E Y C O M M U N I T Y C O L L E G E D I S T R I C T
5. Environmental Analysis GREENHOUSE GAS EMISSIONS
April 2022 Page 5.4-21
Energy. GHG emissions from energy use are based on the CalEEMod defaults for electricity and natural gas usage for a junior college. For purposes of this analysis, new buildings are modeled using the default CalEEMod energy rates, which are based on the 2019 Building Energy Efficiency Standards. Existing buildings are modeled using the CalEEMod historical energy rates, which are based on the 2005 Building Energy Efficiency Standards.
Solid Waste Disposal. For purposes of this analysis, the CalEEMod default solid waste generation rate based on students for the junior college land use is used. As discussed under Section 8.12, Utilities and Service Systems, of this DEIR, the project would serve existing and future students—students that are already and would be generating solid waste without the project. Thus, modeling solid waste emissions associated with the additional 930 students provides a conservative estimate of project-generated emissions.
Water/Wastewater. For purposes of this analysis, the CalEEMod default indoor and outdoor water generation rates used are based on students for the junior college land use. As discussed under Section 8.12, Utilities and Service Systems, of this DEIR, the project would serve existing and future students living in the CVWD’s 47-square-mile service area8 and would not increase the student population or utility demands in the District. Students will be attending this school and using water even without the project. Thus, modeling emissions related to water demand and wastewater generation associated with the additional 930 students provides a conservative estimate of project-generated emissions.
Life cycle emissions are not included in the GHG analysis, consistent with California Natural Resources Agency directives.9 Black carbon emissions are not included in the GHG analysis because CARB does not include this short-lived climate pollutant in the state’s AB 32/SB 32 inventory but treats it separately.10
5.4.4.2 IMPACT ANALYSIS
The following impact analysis addresses the thresholds of significance; the applicable thresholds are identified in brackets after the impact statement.
8 Cucamonga Valley Water District (CVWD). 2021, January 4 (accessed). About Us. https://www.cvwdwater.com/35/About-Us. 9 Life cycle emissions include indirect emissions associated with materials manufacture. However, these indirect emissions involve
numerous parties, each of which is responsible for GHG emissions of their particular activity. The California Resources Agency, in adopting the CEQA Guidelines Amendments on GHG emissions found that lifecycle analysis was not warranted for project-specific CEQA analysis in most situations, for a variety of reasons, including lack of control over some sources, and the possibility of double-counting emissions (see Final Statement of Reasons for Regulatory Action, December 2009). Because the amount of materials consumed during the operation or construction of the proposed project is not known, the origin of the raw materials purchased is not known, and manufacturing information for those raw materials is also not known, calculation of life cycle emissions would be speculative. A life-cycle analysis is not warranted (OPR 2008).
10 Particulate matter emissions, which include black carbon, are analyzed in Section 5.2, Air Quality. Black carbon emissions have sharply declined due to efforts to reduce on-road and off-road vehicle emissions, especially diesel particulate matter. The State's existing air quality policies will virtually eliminate black carbon emissions from on-road diesel engines within 10 years (CARB 2017a).

R A N C H O C U C A M O N G A C A M P U S M A S T E R P L A N D R A F T E I R C H A F F E Y C O M M U N I T Y C O L L E G E D I S T R I C T
5. Environmental Analysis GREENHOUSE GAS EMISSIONS
Page 5.4-22 PlaceWorks
Impact 5.4-1: Buildout of the proposed project would not generate a net increase in GHG emissions, either directly or indirectly, that would have a significant impact on the environment. [Threshold GHG-1])
Implementation of a development project could contribute to global climate change through direct emissions of GHGs from on-site area sources and vehicle trips generated by the project, and indirectly through off-site energy production required for on-site activities, water use, and waste disposal. Because no single project is large enough to result in a measurable increase in global concentrations of GHG emissions, climate change impacts of a project are considered on a cumulative basis.
The net change in annual GHG emissions were calculated for construction and operation of the proposed project and are shown in Table 5.4-6, Operational Phase GHG Emissions. The operational phase emissions are from operation of the proposed project under full buildout conditions. Construction emissions were amortized into the operational phase in accordance with South Coast AQMD’s proposed methodology (South Coast AQMD 2009).
Table 5.4-6 Operational Phase GHG Emissions
Sectors
GHG Emissions (MTCO2e per Year)
Existing Proposed Project1 Percent by Sector Proposed Project Change from Existing
Area <1 <1 <1% <1 Energy2,3 1,817 2,141 14% 324 Mobile4,5 15,403 11,720 74% -3,683 Water/Wastewater 1,512 1,598 10% 85 Solid Waste Disposal 271 284 2% 13 30-Year Amortized Construction6 N/A 80 <1% 80 Total All Sectors 19,003 15,822 100% -3,181 South Coast AQMD Bright-Line Threshold 3,000 Exceeds Threshold? No Source: CalEEMod, Version 2020.4.0. Notes: Manual summation of values may not equal the totals shown due to rounding. N/A: not applicable. 1 Consists of emissions associated with the remaining existing buildings and the new proposed buildings. 2 The existing and remaining existing buildings utilize the CalEEMod historical energy rates, which are based on the 2005 Building Energy Efficiency Standards. 3 The new buildings utilize the default CalEEMod energy rates, which are based on the 2019 Building Energy Efficiency Standards. 4 The Existing mobile-source emissions are based on calendar year 2021 emission rates. 5 CalEEMod only includes on-road vehicle emissions data up to year 2050, therefore, mobile source emissions shown for the proposed project are based on year 2050
on-road vehicle emissions data. In general, vehicle emission rates decrease each passing year due to the assumption that older vehicles are replaced by newer cleaner vehicles
6 Construction emissions are amortized based on a typical 30-year building lifetime (South Coast AQMD 2009).
As shown in the table, under full buildout year with project conditions, implementation of the proposed project would result in an overall annual net decrease of GHG emissions of 3,181 MTCO2e/yr. The net decrease in mobile-source emissions would be the primary factor for the overall net decrease in emissions. As stated, the project full buildout year conditions would result in a net increase of 1,070 ADTs over baseline year 2021 existing conditions. However, the increase would be offset by the anticipated decrease in vehicle emission rates in year 2050 compared to baseline year 2021 conditions. In general, vehicle emission rates would decrease over
R A N C H O C U C A M O N G A C A M P U S M A S T E R P L A N D R A F T E I R C H A F F E Y C O M M U N I T Y C O L L E G E D I S T R I C T
5. Environmental Analysis GREENHOUSE GAS EMISSIONS
April 2022 Page 5.4-23
time due to state and federal regulations requiring cleaner and more efficient cars in addition to vehicle turnover of older, more-polluting vehicles to cleaner vehicles. Therefore, implementation of the proposed project would result in less than significant GHG emissions impacts.
Level of Significance Before Mitigation: Less than significant impact.
Impact 5.4-2: The proposed project would not conflict with plans adopted for the purpose of reducing GHG emissions. [Threshold GHG-2])
Applicable plans adopted for the purpose of reducing GHG emissions include CARB’s Scoping Plan and SCAG’s Connect SoCal. A consistency analysis with these plans is presented below.
CARB Scoping Plan
The CARB Scoping Plan is applicable to state agencies, but is not directly applicable to cities/counties and individual projects (i.e., the Scoping Plan does not require the District to adopt policies, programs, or regulations to reduce GHG emissions). However, new regulations adopted by the state agencies outlined in the Scoping Plan result in GHG emissions reductions at the local level. As a result, local jurisdictions benefit from reductions in transportation emissions rates, increases in water efficiency in the building and landscape codes, and other statewide actions that affect a local jurisdiction’s emissions inventory from the top down. Statewide strategies to reduce GHG emissions include the LCFS and changes in the corporate average fuel economy standards (e.g., Pavley I and Pavley California Advanced Clean Cars program).
The proposed project would adhere to the programs and regulations identified by the Scoping Plan and implemented by state, regional, and local agencies to achieve the statewide GHG reduction goals of AB 32. For example, new buildings under the proposed project would meet the current and future CALGreen and Building Energy Efficiency standards. The CEC anticipates that new nonresidential buildings will be required to achieve zero net energy by 2030. Project GHG emissions shown in Table 5.4-6 include reductions associated with statewide strategies that have been adopted since AB 32. Therefore, the proposed project would generate GHG emissions consistent with the reduction goals of AB 32, and impacts are considered less than significant.
SCAG’s Regional Transportation Plan/Sustainable Communities Strategy
Connect SoCal finds that land use strategies that focus on new housing and job growth in areas rich with destinations and mobility options would be consistent with a land use development pattern that supports and complements the proposed transportation network. The overarching strategy in Connect SoCal is to plan for the southern California region to grow in more compact communities in transit priority areas and priority growth areas; provide neighborhoods with efficient and plentiful public transit; establish abundant and safe opportunities to walk, bike, and pursue other forms of active transportation; and preserve more of the region’s remaining natural lands and farmlands (SCAG 2020). Connect SoCal’s transportation projects help more efficiently distribute population, housing, and employment growth, and forecast development is generally consistent with regional-level general plan data to promote active transportation and reduce GHG emissions. The projected regional development, when integrated with the proposed regional transportation network in

R A N C H O C U C A M O N G A C A M P U S M A S T E R P L A N D R A F T E I R C H A F F E Y C O M M U N I T Y C O L L E G E D I S T R I C T
5. Environmental Analysis GREENHOUSE GAS EMISSIONS
Page 5.4-24 PlaceWorks
Connect SoCal, would reduce per-capita GHG emissions related to vehicular travel and achieve the GHG reduction per capita targets for the SCAG region.
The proposed project would be consistent with the current land use designation because it results in improvements to the existing Rancho Cucamonga campus only and would not introduce a new land use type. Connect SoCal outlines a development pattern for the region that is partially based on land use designations in city/county general plans. Because the proposed project is consistent with the city’s existing land use assumptions, the proposed project is also consistent with the assumptions in Connect SoCal. Additionally, the proposed improvements would help to accommodate any general student growth in the local region. Student enrollment data from the District indicates that the student population consists of local population traveling, on average, within 10 miles of the campus (see Attachment C to Appendix H). Under the proposed project, the existing capacity of the Rancho Cucamonga campus would increase by 930 students. Overall, as discussed under Impact 5.6-2 in Section 5.6, Transportation, of this DEIR, local-serving community colleges are considered local-serving essential services and are presumed to have a less than significant impact on VMT under the Rancho Cucamonga’s adopted Traffic Impact Analysis Guidelines. Therefore, overall, the implementation of the proposed project would not interfere with SCAG’s ability to implement the regional strategies outlined in Connect SoCal, and impacts are considered less than significant.
Level of Significance Before Mitigation: Less than significant impact.
5.4.5 Cumulative Impacts Project-related GHG emissions are not confined to a particular air basin but are dispersed worldwide. Therefore, impacts identified under Impact 5.4-1 are not project-specific impacts to global warming, but the proposed project’s contribution to this cumulative impact. Implementation of the proposed project would not exceed the significance threshold. Thus, the proposed project’s GHG emissions and contribution to global climate change impacts are not considered cumulatively considerable, and therefore are less than significant.
5.4.6 Level of Significance Before Mitigation Upon implementation of regulatory requirements and standard conditions of approval, the following impacts would be less than significant: 5.4-1 and 5.4-2.
5.4.7 Mitigation Measures No mitigation measures are required.
5.4.8 Level of Significance After Mitigation The existing applicable regulations would reduce potential impacts associated with GHG emissions to a level that is less than significant. Therefore, no significant unavoidable adverse impacts relating to GHG emissions have been identified.

R A N C H O C U C A M O N G A C A M P U S M A S T E R P L A N D R A F T E I R C H A F F E Y C O M M U N I T Y C O L L E G E D I S T R I C T
5. Environmental Analysis GREENHOUSE GAS EMISSIONS
April 2022 Page 5.4-25
5.4.9 References California Air Resources Board (CARB). 2008. 2008 Climate Change Scoping Plan.
———. 2010, September 23. Regional Greenhouse Gas Emission Reduction Targets for Automobiles and Light Trucks Pursuant to Senate Bill 375. https://ww3.arb.ca.gov/board/res/2010/res10-31.pdf.
———. 2014, May 15. First Update to the Climate Change Scoping Plan: Building on the Framework, Pursuant to AB 32, The California Global Warming Solutions Act of 2006.
———. 2017a, March 14. Short-Lived Climate Pollutant Reduction Strategy. https://www.arb.ca.gov/cc/shortlived/shortlived.htm.
———. 2017b. California’s 2017 Climate Change Scoping Plan: The Strategy for Achieving California’s 2030 Greenhouse Gas Target. https://www.arb.ca.gov/cc/scopingplan/2030sp_pp_final.pdf.
———. 2018. Updated Final Staff Report: Proposed Update to the SB 375 Greenhouse Gas Emissions Reduction Targets.
———. 2019, July 25. California and Major Automakers Reach Groundbreaking Framework Agreement on Clean Emission Standards. https://ww2.arb.ca.gov/news/california-and-major-automakers-reach -groundbreaking-framework-agreement-clean-emission.
———. 2021, July 28. California Greenhouse Gas 2000-2019 Emissions Trends and Indicators Report. https://ww3.arb.ca.gov/cc/inventory/pubs/reports/2000_2019/ghg_inventory_trends_00-19.pdf.
California Climate Action Team (CAT). 2006, March. Climate Action Team Report to Governor Schwarzenegger and the Legislature.
California Climate Change Center (CCCC). 2012. Our Changing Climate 2012: Vulnerability and Adaptation to the Increasing Risks from Climate Change in California.
California Energy Commission. (CEC). 2006. Our Changing Climate: Assessing the Risks to California. 2006 Biennial Report. CEC-500-2006-077.
———. 2009. The Future Is Now: An Update on Climate Change Science, Impacts, and Response Options for California. CEC-500-2008-0077.
———. 2018a. News Release: Energy Commission Adopts Standards Requiring Solar Systems for New Homes, First in Nation. https://www.energy.ca.gov/news/2018-05/energy-commission-adopts-standards-requiring-solar-systems-new-homes-first.
———. 2018b. 2019 Building Energy and Efficiency Standards Frequently Asked Questions. https://www.energy.ca.gov/sites/default/files/2020-03/Title_24_2019_Building_ Standards_FAQ_ada.pdf.

R A N C H O C U C A M O N G A C A M P U S M A S T E R P L A N D R A F T E I R C H A F F E Y C O M M U N I T Y C O L L E G E D I S T R I C T
5. Environmental Analysis GREENHOUSE GAS EMISSIONS
Page 5.4-26 PlaceWorks
———. 2021, May 19. Amendments to the Building Energy Efficiency Standards (2022 Energy Code) Draft Environmental Report. CEC-400-2021-077-D.
California Natural Resources Agency (CNRA). 2014. Safeguarding California: Reducing Climate Risk, An Update to the 2009 California Climate Adaptation Strategy.
———. 2019, January 16. California’s Fourth Climate Change Assessment: Statewide Summary Report. https://www.energy.ca.gov/sites/default/files/2019-11/Statewide_Reports-SUM-CCCA4-2018 -013_Statewide_Summary_Report_ADA.pdf.
Intergovernmental Panel on Climate Change (IPCC). 1995. Second Assessment Report: Climate Change 1995. https://www.ipcc.ch/site/assets/uploads/2018/02/ipcc_sar_wg_I_full_report.pdf.
———. 2001. Third Assessment Report: Climate Change. New York: Cambridge University Press.
———. 2007. Fourth Assessment Report: Climate Change. New York: Cambridge University Press.
———. 2014. Fifth Assessment Report: Climate Change. New York: Cambridge University Press.
National Highway Traffic Safety Administration (NHTSA). 2021, August 5. USDOT Proposes Improved Fuel Economy Standards for MY 2024-2026 Passenger Cars and Light Trucks. https://www.nhtsa.gov/press-releases/fuel-economy-standards-2024-2026-proposal.
Office of Environmental Health Hazards Assessment (OEHHA). 2018. Indicators of Climate Change in California. https://oehha.ca.gov/media/downloads/climate-change/report/ 2018caindicatorsreportmay2018.pdf.
South Coast Air Quality Management District (South Coast AQMD). 2009, November 19. Greenhouse Gases (GHG) CEQA Significance Thresholds Working Group Meeting 14. http://www.aqmd.gov/docs/default-source/ceqa/handbook/greenhouse-gases-(ghg)-ceqa -significance-thresholds/year-2008-2009/ghg-meeting-14/ghg-meeting-14-main-presentation .pdf?sfvrsn=2.
———. 2010a, September 28. Agenda for Meeting 15. Greenhouse Gases (GHG) CEQA Significance Thresholds Working Group. http://www.aqmd.gov/docs/default-source/ceqa/handbook/ greenhouse-gases-(ghg)-ceqa-significance-thresholds/year-2008-2009/ghg-meeting-15/ghg-meeting -15-main-presentation.pdf?sfvrsn=2.
———. 2010b, September 28. Minutes for the GHG CEQA Significance Threshold Stakeholder Working Group #15. http://www.aqmd.gov/docs/default-source/ceqa/handbook/greenhouse-gases-(ghg) -ceqa-significance-thresholds/year-2008-2009/ghg-meeting-15/ghg-meeting-15-minutes.pdf.
Southern California Association of Governments. 2020, September 3. Connect SoCal Plan: The 2020–2045 Regional Transportation Plan / Sustainable Communities Strategy of the Southern California Association of Governments. https://www.connectsocal.org/Pages/Connect-SoCal-Final-Plan.aspx.

R A N C H O C U C A M O N G A C A M P U S M A S T E R P L A N D R A F T E I R C H A F F E Y C O M M U N I T Y C O L L E G E D I S T R I C T
5. Environmental Analysis GREENHOUSE GAS EMISSIONS
April 2022 Page 5.4-27
US Environmental Protection Agency (US EPA). 2009, December. “Greenhouse Gases Threaten Public Health and the Environment: Science Overwhelmingly Shows Greenhouse Gas Concentrations at Unprecedented Levels Due to Human Activity.” https://archive.epa.gov/epapages/newsroom _archive/newsreleases/08d11a451131bca585257685005bf252.html.
———. 2022, January 18 (accessed). Endangerment and Cause or Contribute Findings for Greenhouse Gases Under Section 202(a) of the Clean Air Act. https://www.epa.gov/climate-change/ endangerment-and-cause-or-contribute-findings-greenhouse-gases-under-section-202a.

R A N C H O C U C A M O N G A C A M P U S M A S T E R P L A N D R A F T E I R C H A F F E Y C O M M U N I T Y C O L L E G E D I S T R I C T
5. Environmental Analysis GREENHOUSE GAS EMISSIONS
Page 5.4-28 PlaceWorks
This page intentionally left blank.

R A N C H O C U C A M O N G A C A M P U S M A S T E R P L A N D R A F T E I R C H A F F E Y C O M M U N I T Y C O L L E G E D I S T R I C T
5. Environmental Analysis
April 2022 Page 5.5-1
5.5 NOISE This section of the Draft Environmental Impact Report (DEIR) evaluates the potential for implementation of the proposed project to result in noise and vibration impacts to off-campus and on-campus sensitive receptors. This section discusses the fundamentals of sound; examines federal, state, and local noise guidelines, policies, and standards; characterizes existing noise levels in the project area; evaluates potential noise and vibration impacts associated with the proposed project; and provides mitigation to reduce noise impacts. Noise modeling worksheets are in Appendix F of this DEIR.
5.5.1 Environmental Setting 5.5.1.1 NOISE AND VIBRATION FUNDAMENTALS
Noise is defined as unwanted sound and is known to have several adverse effects on people, including hearing loss, speech and sleep interference, physiological responses, and annoyance. Although sound can be easily measured, the perception of noise and the physical response to sound complicate the analysis of its impact on people. People judge the relative magnitude of sound sensation in subjective terms such as “noisiness” or “loudness.” The following are brief definitions of terminology used in this section:
Technical Terminology
Sound. A disturbance created by a vibrating object, which, when transmitted by pressure waves through a medium such as air, is capable of being detected by a receiving mechanism, such as the human ear or a microphone.
Noise. Sound that is loud, unpleasant, unexpected, or otherwise undesirable.
Decibel (dB). A unitless measure of sound on a logarithmic scale.
A-Weighted Decibel (dBA). An overall frequency-weighted sound level in decibels that approximates the frequency response of the human ear.
Equivalent Continuous Noise Level (Leq); also called the Energy-Equivalent Noise Level. The value of an equivalent, steady sound level which, in a stated time period (often over an hour) and at a stated location, has the same A-weighted sound energy as the time-varying sound. Thus, the Leq metric is a single numerical value that represents the equivalent amount of variable sound energy received by a receptor over the specified duration.
Statistical Sound Level (Ln). The sound level that is exceeded “n” percent of time during a given sample period. For example, the L50 level is the statistical indicator of the time-varying noise signal that is exceeded 50 percent of the time (during each sampling period); that is, half of the sampling time, the changing noise levels are above this value and half of the time they are below it. This is called the “median sound level.” The L10 level, likewise, is the value that is exceeded 10 percent of the time (i.e., near the maximum) and

R A N C H O C U C A M O N G A C A M P U S M A S T E R P L A N D R A F T E I R C H A F F E Y C O M M U N I T Y C O L L E G E D I S T R I C T
5. Environmental Analysis NOISE
Page 5.5-2 PlaceWorks
this is often known as the “intrusive sound level.” The L90 is the sound level exceeded 90 percent of the time and is often considered the “effective background level” or “residual noise level.”
Day-Night Sound Level (Ldn or DNL). The energy-average of the A-weighted sound levels occurring during a 24-hour period, with 10 dB added to the sound levels occurring during the period from 10:00 pm to 7:00 am.
Community Noise Equivalent Level (CNEL). The energy average of the A-weighted sound levels occurring during a 24-hour period, with 5 dB added from 7:00 pm to 10:00 pm and 10 dB from 10:00 pm to 7:00 am. For general community/environmental noise, CNEL and Ldn values rarely differ by more than 1 dB (with the CNEL being only slightly more restrictive, that is, higher than the Ldn value). As a matter of practice, Ldn and CNEL values are interchangeable and are treated as equivalent in this assessment.
Sensitive Receptor. Noise- and vibration-sensitive receptors include land uses where quiet environments are necessary for enjoyment and public health and safety. Residences, schools, motels and hotels, libraries, religious institutions, hospitals, and nursing homes are examples.
Peak Particle Velocity (PPV). The peak rate of speed at which soil particles move (e.g., inches per second) due to ground vibration.
Sound Fundamentals
Sound is a pressure wave transmitted through the air. It is described in terms of loudness or amplitude (measured in decibels), frequency or pitch (measured in Hertz [Hz] or cycles per second), and duration (measured in seconds or minutes). The standard unit of measurement of the loudness of sound is the decibel (dB). Changes of 1 to 3 dBA are detectable under quiet, controlled conditions and changes of less than 1 dBA are usually indiscernible. A 3 dBA change in noise levels is considered the minimum change that is detectable with human hearing in outside environments. A change of 5 dBA is readily discernable to most people in an exterior environment, and a 10 dBA change is perceived as a doubling (or halving) of the sound.
The human ear is not equally sensitive to all frequencies. Sound waves below 16 Hz are not heard at all and are “felt” more as a vibration. Similarly, while people with extremely sensitive hearing can hear sounds as high as 20,000 Hz, most people cannot hear above 15,000 Hz. In all cases, hearing acuity falls off rapidly above about 10,000 Hz and below about 200 Hz. Since the human ear is not equally sensitive to sound at all frequencies, a special frequency dependent rating scale is usually used to relate noise to human sensitivity. The A-weighted decibel scale (dBA) performs this compensation by discriminating against frequencies in a manner approximating the sensitivity of the human ear.
Sound Measurement
Sound pressure is measured through the A-weighted measure to correct for the relative frequency response of the human ear. That is, an A-weighted noise level de-emphasizes low and very high frequencies of sound similar to the human ear’s de-emphasis of these frequencies.

R A N C H O C U C A M O N G A C A M P U S M A S T E R P L A N D R A F T E I R C H A F F E Y C O M M U N I T Y C O L L E G E D I S T R I C T
5. Environmental Analysis NOISE
April 2022 Page 5.5-3
Unlike linear units such as inches or pounds, decibels are measured on a logarithmic scale, representing points on a sharply rising curve. On a logarithmic scale, an increase of 10 dBA is 10 times more intense than 1 dBA, 20 dBA is 100 times more intense, and 30 dBA is 1,000 times more intense. A sound as soft as human breathing is about 10 times greater than 0 dBA. The decibel system of measuring sound gives a rough connection between the physical intensity of sound and its perceived loudness to the human ear. Ambient sounds generally range from 30 dBA (very quiet) to 100 dBA (very loud).
Sound levels are generated from a source and their decibel level decreases as the distance from that source increases. Sound dissipates exponentially with distance from the noise source. This phenomenon is known as “spreading loss.” For a single point source, sound levels decrease by approximately 6 dBA for each doubling of distance from the source. This drop-off rate is appropriate for noise generated by on-site operations from stationary equipment or activity at a project site. If noise is produced by a line source, such as highway traffic, the sound decreases by 3 dBA for each doubling of distance in a hard site environment. Line source noise in a relatively flat environment with absorptive vegetation decreases by 4.5 dBA for each doubling of distance.
Time variation in noise exposure is typically expressed in terms of a steady-state energy level equal to the energy content of the time varying period (called Leq), or alternately, as a statistical description of the sound level that is exceeded over some fraction of a given observation period. For example, the L50 noise level represents the noise level that is exceeded 50 percent of the time. Half the time the noise level exceeds this level and half the time the noise level is less than this level. This level is also representative of the level that is exceeded 30 minutes in an hour. Similarly, the L2, L8, and L25 values represent the noise levels that are exceeded 2, 8, and 25 percent of the time or 1, 5, and 15 minutes per hour. These “L” values are typically used to demonstrate compliance for stationary noise sources with a city’s noise ordinance, as discussed below. Other values typically noted during a noise survey are the Lmin and Lmax. These values represent the minimum and maximum root-mean-square noise levels obtained over the measurement period.
Because community receptors are more sensitive to unwanted noise intrusion during the evening and at night, an artificial dB increment be added to quiet time noise levels in a 24-hour noise descriptor called the Community Noise Equivalent Level (CNEL) or Day-Night Noise Level (Ldn). The CNEL descriptor requires that an artificial increment of 5 dBA be added to the actual noise level for the hours from 7:00 pm to 10:00 pm and 10 dBA for the hours from 10:00 pm to 7:00 am. The Ldn descriptor uses the same methodology except that there is no artificial increment added to the hours between 7:00 pm and 10:00 pm. Both descriptors give roughly the same 24-hour level with the CNEL being only slightly more restrictive (i.e., higher).
Psychological and Physiological Effects of Noise
Physical damage to human hearing begins at prolonged exposure to noise levels higher than 85 dBA. Exposure to high noise levels affects our entire system, with prolonged noise exposure in excess of 75 dBA increasing body tensions, and thereby affecting blood pressure, functions of the heart and the nervous system. In comparison, extended periods of noise exposure above 90 dBA could result in permanent hearing damage. When the noise level reaches 120 dBA, a tickling sensation occurs in the human ear even with short-term exposure. This level of noise is called the threshold of feeling. As the sound reaches 140 dBA, the tickling

R A N C H O C U C A M O N G A C A M P U S M A S T E R P L A N D R A F T E I R C H A F F E Y C O M M U N I T Y C O L L E G E D I S T R I C T
5. Environmental Analysis NOISE
Page 5.5-4 PlaceWorks
sensation is replaced by the feeling of pain in the ear. This is called the threshold of pain. Table 5.5-1, Typical Noise Levels, shows typical noise levels from familiar noise sources.
Table 5.5-1 Typical Noise Levels
Common Outdoor Activities Noise Level
(dBA) Common Indoor Activities Onset of physical discomfort 120+
110 Rock Band (near amplification system)
Jet Flyover at 1,000 feet 100
Gas Lawn Mower at three feet 90
Diesel Truck at 50 feet, at 50 mph Food Blender at 3 feet 80 Garbage Disposal at 3 feet
Noisy Urban Area, Daytime 70 Vacuum Cleaner at 10 feet
Commercial Area Normal speech at 3 feet Heavy Traffic at 300 feet 60
Large Business Office Quiet Urban Daytime 50 Dishwasher Next Room
Quiet Urban Nighttime 40 Theater, Large Conference Room (background)
Quiet Suburban Nighttime 30 Library
Quiet Rural Nighttime Bedroom at Night, Concert Hall (background) 20 Broadcast/Recording Studio 10
Lowest Threshold of Human Hearing 0 Lowest Threshold of Human Hearing
Source: Caltrans 2013.
Vibration Fundamentals
Vibration is an oscillating motion in the earth. Like noise, vibration is transmitted in waves, but in this case through the earth or solid objects. Unlike noise, vibration is typically of a frequency that is felt rather than heard. Vibration amplitudes can be described in terms of peak particle velocity (PPV), which is the maximum instantaneous peak of the vibration signal. PPV is appropriate for evaluating potential building damage. The units for PPV are normally inches per second (in/sec). Typically, groundborne vibration generated by human activities attenuates rapidly with distance from the source of the vibration.

R A N C H O C U C A M O N G A C A M P U S M A S T E R P L A N D R A F T E I R C H A F F E Y C O M M U N I T Y C O L L E G E D I S T R I C T
5. Environmental Analysis NOISE
April 2022 Page 5.5-5
The way in which vibration is transmitted through the earth is called propagation. As vibration waves propagate from a source, the energy is spread over an ever-increasing area such that the energy level striking a given point is reduced with the distance from the energy source. This geometric spreading loss is inversely proportional to the square of the distance. The amount of attenuation provided by material damping varies with soil type and condition as well as the frequency of the wave.
5.5.1.2 REGULATORY BACKGROUND
The State of California regulates freeway noise, sets standards for sound transmission, provides occupational noise control criteria, identifies noise standards, and provides guidance for local land use compatibility. State law requires that each county and city adopt a general plan that includes a noise element which is to be prepared according to guidelines adopted by the Governor’s Office of Planning and Research. The purpose of the noise element is to “limit the exposure of the community to excessive noise levels.”
CALGreen
The State of California’s noise insulation standards for non-residential uses are codified in the California Code of Regulations, Title 24, Building Standards Administrative Code, Part 11, California Green Building Standards Code (CALGreen). CALGreen noise standards are applied to new or renovation construction projects in California to control interior noise levels resulting from exterior noise sources. Proposed projects may use either the prescriptive method (Section 5.507.4.1) or the performance method (5.507.4.2) to show compliance. Under the prescriptive method, a project must demonstrate transmission loss ratings for the wall and roof-ceiling assemblies and exterior windows when located within a noise environment of 65 dBA CNEL or higher. Under the performance method, a project must demonstrate that interior noise levels do not exceed 50 dBA Leq(1hr).
California Department of Education Title 5
Under Title 5, the California Department of Education (CDE) regulations require the school district to consider noise in the site selection process. As recommended by CDE guidance, if a school district is considering a potential school site near a freeway or other source of noise, it should hire an acoustical engineer to determine the level of sound that the site is exposed to and to assist in designing the school should that site be chosen.
General Plan Guidelines
The State of California’s General Plan Guidelines discusses how ambient noise should influence land use and development decisions and includes a table of normally acceptable, conditionally acceptable, normally unacceptable, and clearly unacceptable uses at different noise levels expressed in CNEL. A conditionally acceptable designation implies new construction or development should be undertaken only after a detailed analysis of the noise reduction requirements for each land use is made and needed noise insulation features are incorporated in the design. By comparison, a normally acceptable designation indicates that standard construction can occur with no special noise reduction requirements. Local municipalities adopt these compatibility standards as part of their general plans and modify them as appropriate for their local environmental setting. The City of Rancho Cucamonga standards are discussed below.

R A N C H O C U C A M O N G A C A M P U S M A S T E R P L A N D R A F T E I R C H A F F E Y C O M M U N I T Y C O L L E G E D I S T R I C T
5. Environmental Analysis NOISE
Page 5.5-6 PlaceWorks
Local Noise Standards
City of Rancho Cucamonga General Plan The City of Rancho Cucamonga recently adopted its new General Plan Update. Volume 3, Environmental Performance, includes the updated noise goals and policies aimed to provide quiet places for people to relax and limit excessive exposure to noise and vibration. Below are the applicable noise policies associated with the noise goal.
Goal N-1 Noise: A city with appropriate noise and vibration levels that support a range of places from quiet neighborhoods to active exciting districts.
Policy N-1.1 Noise Levels. Require new development to meet the noise compatibility standards identified in Table 5.5-2.
Policy N-1.2 Noise Barriers, Buffers and Sound Walls. Require the use of integrated design-related noise reduction measures for both interior and exterior areas prior to the use of noise barriers, buffers, or walls to reduce noise levels generated by or affected by new development.
Policy N-1.3 Non-Architectural Noise Attenuation. Non-architectural noise attenuation measures such as sound walls, setbacks, barriers, and berms shall be discouraged in pedestrian priority areas (or other urban areas or areas where pedestrian access is important).
Policy N-1.4 New Development Near Major Noise Sources. Require development proposing to add people in areas where they may be exposed to major noise sources (e.g., roadways, rail lines, aircraft, industrial or other non-transportation noise sources) to conduct a project level noise analysis and implement recommended noise reduction measures.
Policy N-1.8 Vibration Impact Assessment. Require new development to reduce vibration to 85 VdB or below within 200 feet of an existing structure.
Table 5.5-2 Rancho Cucamonga Noise Compatibility Standards for People
Type of Development dBA CNEL
Exterior Noise Standards Interior Noise Standards Low Density Residential (Single-Family, Duplex, Mobile-Home) 60 45 Medium or High Density Residential (Multifamily, Apartments) 65 45 Lodging (Motels/Hotels) 65 45 Mixed Use/Infill Development 70 45 Schools, Libraries, Community Centers, Religious Institutions, Hospitals, Nursing Homes 70 45
Auditoriums, Concert Halls, Amphitheaters 70 N/A Playgrounds, Neighborhood Parks 70 N/A Outdoor Recreation (Commercial and Public) 75 N/A Commercial (Office/Retail) 70 60 Industrial, Manufacturing, and Utilities 75 70 Source: Rancho Cucamonga General Plan, Volume 3, Environmental Performance Table N-1.

R A N C H O C U C A M O N G A C A M P U S M A S T E R P L A N D R A F T E I R C H A F F E Y C O M M U N I T Y C O L L E G E D I S T R I C T
5. Environmental Analysis NOISE
April 2022 Page 5.5-7
City of Rancho Cucamonga Municipal Code
Section 17.66.050, Noise Standards, of the Rancho Cucamonga Municipal Code provides exterior and interior noise limits for residential and commercial land uses. Users and uses of a site are not permitted to create any noise that would exceed the applicable exterior noise level when measured at the property line of the adjacent land use. Applicable exterior noise limits are shown in Table 5.5-3.
Table 5.5-3 Rancho Cucamonga Exterior Noise Standards
Land Use Maximum Allowable Noise Level (dBA)
7:00 am–10:00 pm 10:00 pm–7:00 am Residential 65 60 Commercial 70 65
Source: Rancho Cucamonga Municipal Code, Section 17.66.050, Noise Standards. Notes: If the intruding noise is continuous and cannot reasonably be discontinued or stopped for a time period where the ambient noise level can be determined, each
of the noise limits above shall be reduced 5 dB for noise consisting of impulse or simple tone noise. If the measurement location is a boundary between two zones, the lower noise standard shall apply.
The following adjustments are applicable to the baseline standards outlined in Table 5.5-3:
Baseline standard for a cumulative period of more than 15 minutes in any hour (L25)
Baseline standard plus 5 dB for a cumulative period of more than 10 minutes in any hour (L16)
Baseline standard plus 14 dB for a cumulative period of more than 5 minutes in any hour (L8) Baseline standard plus 15 dB for any period of time (Lmax)
Exemptions
Per Section 17.66.050 (D)(1) of the Rancho Cucamonga Municipal Code, City- or school-approved activities conducted on public parks, public playgrounds, and public or private school grounds including, but not limited to, athletic and school entertainment events between the hours of 7:00 AM to 10:00 pm are exempt from the noise standards.
Per Section 17.66.050 (D)(4), noise sources or vibration created by construction activities are exempt provided they do not take place during the hours of 8:00 pm and 7:00 am Monday through Saturday or any time on Sundays or national holidays. Construction noise shall not exceed 65 dBA when measured at the adjacent property line.
Per Section 17.66.050 (D)(6), noise sources associated with the maintenance of real property, provided said activities take place between the hours of 7:00 am and 8:00 pm on any day, are exempt.
Vibration
The City of Rancho Cucamonga Municipal Code does not establish vibration thresholds. Therefore, for the purposes of the analysis in this technical memorandum, the Federal Transit Administration (FTA) threshold of 0.2 inches/second (in/sec) PPV is used to assess vibration impacts at nonengineered structures (e.g., wood-frame residential) (FTA 2018).
R A N C H O C U C A M O N G A C A M P U S M A S T E R P L A N D R A F T E I R C H A F F E Y C O M M U N I T Y C O L L E G E D I S T R I C T
5. Environmental Analysis NOISE
Page 5.5-8 PlaceWorks
5.5.1.3 EXISTING CONDITIONS
Ambient Noise Monitoring
To determine a baseline noise level at different environments within the project area, ambient noise monitoring was conducted in the vicinity of Chaffey College in Rancho Cucamonga. Staff conducted noise monitoring at neighborhoods near the project site on November 29 through December 1, 2021. Noise measurements consisted of four short-term (15-minute) locations during peak traffic hours of 3:00 pm to 6:00 pm and four long-term (48-hours) locations.
The primary noise source at all measurement locations was traffic. Urban and residential activity (such as dogs barking), garage doors opening and closing, and aircraft overflights also contributed to the overall noise environment. Meteorological conditions during the measurement period were favorable for outdoor sound measurements and were noted to be representative of the typical conditions for the season. Generally, conditions included clear skies with temperatures varying between 75 to 80 degrees Fahrenheit (°F) and winds averaging 5 miles per hour (mph) or less. All sound level meters were equipped with a windscreen during measurements.
All sound level meters used for noise monitoring (Larson Davis LxT and Larson Davis 820) satisfy the American National Standards Institute standard for Type 1 instrumentation. All sound level meters were set to “slow” response and “A” weighting (dBA). The meters were calibrated prior to and after the monitoring period. All measurements were at least 5 feet above the ground and away from reflective surfaces. Approximate noise measurement locations are described below and shown in Figure 5.5-1, Approximate Noise Monitoring Locations, and results are summarized in Table 5.5-4 and Table 5.5-5.
Long-Term Location 1 (LT-1) was mounted along Haven Avenue near 10520 Apple Lane (residence) and approximately 46 feet east from the nearest northbound travel lane centerline. A 48-hour noise measurement began at 1:00 pm on Monday, November 29, 2021. The noise environment is characterized primarily by traffic along Haven Avenue.
Long-Term Location 2 (LT-2) was mounted along Wilson Street across from 10702 Wilson Street (residence) and approximately 30 feet south from the nearest eastbound travel lane centerline. A 48-hour noise measurement was conducted, beginning at 1:00 pm on Monday, November 29, 2021. The noise environment is characterized primarily by traffic along Wilson Street.
Long-Term Location 3 (LT-3) was mounted along Haven Avenue near the Chaffey College Student Services building and approximately 79 feet east from the nearest northbound travel lane centerline. A 48-hour noise measurement began at 2:00 pm on Monday, November 29, 2021. The noise environment is characterized primarily by traffic along Haven Avenue.
Long-Term Location 4 (LT-4) was mounted along Banyan Street and approximately 25 feet south from the nearest eastbound travel lane centerline. A 48-hour noise measurement began at 4:00 pm on Monday, November 29, 2021. The noise environment is characterized primarily by traffic along Banyan Street.
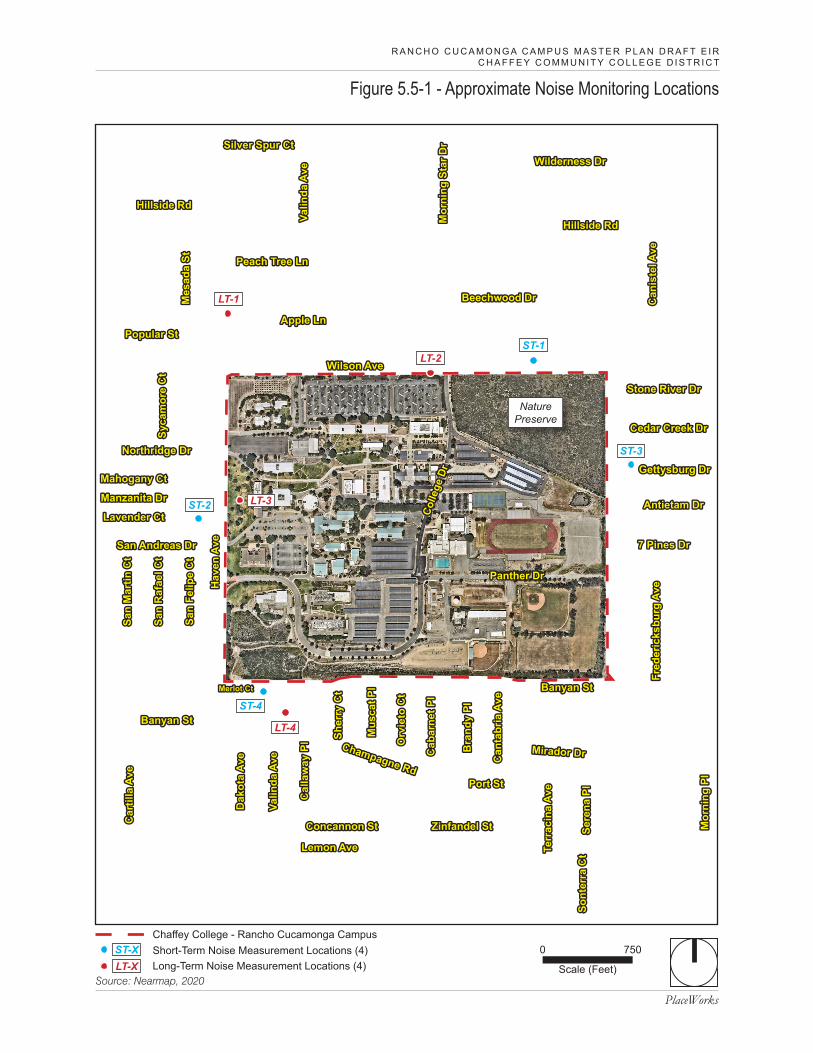
PlaceWorks
Figure 5.5-1 - Approximate Noise Monitoring Locations
Source: Nearmap, 2020
0
Scale (Feet)
750
Wilson AveWilson Ave
Hav
en A
veH
aven
Ave
Hillside RdHillside Rd
Apple LnApple Ln
Beechwood DrBeechwood Dr
Peach Tree LnPeach Tree Ln
Silver Spur CtSilver Spur Ct
Valin
da A
veVa
linda
Ave
Mor
ning
Sta
r Dr
Mor
ning
Sta
r Dr
Mes
ada
StM
esad
a St
Northridge DrNorthridge Dr
Hillside RdHillside Rd
Popular StPopular St
Mahogany CtMahogany Ct
Manzanita DrManzanita Dr
Lavender CtLavender Ct
San Andreas DrSan Andreas Dr
Banyan StBanyan St
Lemon AveLemon Ave
Car
tilla
Ave
Car
tilla
Ave
Banyan StBanyan St
Champagne Rd
Champagne Rd
Zinfandel StZinfandel St
Mirador DrMirador Dr
Concannon StConcannon St
Dak
ota
Ave
Dak
ota
Ave
Cal
law
ay P
lC
alla
way
Pl
Valin
da A
veVa
linda
Ave
Mus
cat P
lM
usca
t Pl
Cab
arne
t Pl
Cab
arne
t Pl
Orv
ieto
Ct
Orv
ieto
Ct
Bra
ndy
PlB
rand
y Pl
Can
tabr
ia A
veC
anta
bria
Ave
Sere
na P
lSe
rena
Pl
Terr
acin
a Av
eTe
rrac
ina
AvePort StPort St
Sher
ry C
tSh
erry
Ct
Sont
erra
Ct
Sont
erra
Ct
Mor
ning
Pl
Mor
ning
Pl
Fred
eric
ksbu
rg A
veFr
eder
icks
burg
Ave
7 Pines Dr7 Pines Dr
Antietam DrAntietam Dr
Can
iste
l Ave
Can
iste
l Ave
Wilderness DrWilderness Dr
Stone River DrStone River Dr
Cedar Creek DrCedar Creek Dr
Gettysburg DrGettysburg Dr
San
Felip
e C
tSa
n Fe
lipe
Ct
San
Raf
ael C
tSa
n R
afae
l Ct
San
Mar
tin C
tSa
n M
artin
Ct
Merlot CtMerlot Ct
Syca
mor
e C
tSy
cam
ore
Ct
Chaffey College - Rancho Cucamonga Campus
NaturePreserve
Panther DrPanther Dr
Colle
ge D
rCo
llege
Dr
R A N C H O C U C A M O N G A C A M P U S M A S T E R P L A N D R A F T E I RC H A F F E Y C O M M U N I T Y C O L L E G E D I S T R I C T
Short-Term Noise Measurement Locations (4)ST-XLong-Term Noise Measurement Locations (4)LT-X
ST-1
LT-1
ST-2
LT-2
ST-3
LT-3
ST-4
LT-4

R A N C H O C U C A M O N G A C A M P U S M A S T E R P L A N D R A F T E I R C H A F F E Y C O M M U N I T Y C O L L E G E D I S T R I C T
5. Environmental Analysis NOISE
Page 5.5-10 PlaceWorks
This page intentionally left blank.

R A N C H O C U C A M O N G A C A M P U S M A S T E R P L A N D R A F T E I R C H A F F E Y C O M M U N I T Y C O L L E G E D I S T R I C T
5. Environmental Analysis NOISE
April 2022 Page 5.5-11
Table 5.5-4 Long-Term Noise Measurement Summary Monitoring Location Description
48-Hour Noise Level, dBA CNEL Lowest Leq(1hr) Highest Leq(1hr)
LT-1 Chaffey College near 10520 Apple Lane 11/29/2021, 1:00 pm 69 48.5 72.5
LT-2 Chaffey College across from 10702 Wilson Street. 11/29/2021, 1:00 pm 64 46 67.1
LT- 3 Chaffey College near the Chaffey College Student Services building 11/29/2021, 2:00 pm
65 49.3 67.5
LT- 4 Chaffey College along Banyan Street 11/29/2021, 4:00 pm 71 51.9 77.6
Chaffey College, Short-Term Location 1 (ST-1) was north of Chaffey College along Wilson Avenue, near 10902 Wilson Ave (residence). The measurement location was approximately 35 feet north of the nearest westbound travel lane centerline. A 15-minute noise measurement began at 4:35 pm on Monday, November 29, 2021. The noise environment is characterized primarily by traffic noise from Wilson Avenue. Traffic generally ranged from 69 dBA to 71 dBA. Noise levels were generally around 43 dBA in the absence of local traffic.
Caffey College, Short-Term Location 2 (ST-2) was west of Chaffey College, inside a residential neighborhood, near 10468 Lavender Court (residence). A 15-minute noise measurement began at 4:11 pm on Monday, November 29, 2021. The noise environment is characterized primarily by traffic noise from Haven Avenue. Secondary noise sources included neighbors walking by and residents talking at a distance in their garage. Noise levels generally ranged from 55 dBA to 62 dBA. A helicopter was observed during the time of measurement and was approximately 60 dBA.
Caffey College, Short-Term Location 3 (ST-3) was south of Chaffey College, inside a residential neighborhood, near 10959 Cross Keys Drive (residence). A 15-minute noise measurement began at 4:57 pm on Monday, November 29, 2021. This is a low traffic area, and the noise environment is characterized primarily by the surrounding nature sounds, faint talking by residents at a distance, dogs barking, and garage doors opening and closing. Secondary noise sources included car doors closing and aircraft overflights; levels ranged from 58 to 61 dBA.
Chaffey College, Short-Term Location 4 (ST-4) was northwest of Chaffey College, near 10559 Marlot Court (residence). A 15-minute noise measurement began at 3:41 pm on Monday, November 29, 2021. This is a low traffic area, and the noise environment is characterized primarily by traffic to the north and west of the of site on Haven Avenue and Banyan Street. Noise levels generally ranged between 51 to 62 dBA.

R A N C H O C U C A M O N G A C A M P U S M A S T E R P L A N D R A F T E I R C H A F F E Y C O M M U N I T Y C O L L E G E D I S T R I C T
5. Environmental Analysis NOISE
Page 5.5-12 PlaceWorks
Table 5.5-5 Short-Term Noise Measurements Summary in A-weighted Sound Levels Monitoring Location Description
15-minute Noise Level, dBA Leq Lmax Lmin L25 L16 L8 L2
ST-1 Chaffey College near 10902 Wilson Avenue 11/29/2021, 4:35 pm 65.8 85.0 43.4 65.2 66.9 69.3 73.8
ST-2 Chaffey College near 10468 Lavender Court 11/29/2021, 4:11 pm 53.0 68.0 37.2 53.4 54.8 56.9 60.5
ST-3 Chaffey College near 10959 Cross Keys Drive 11/29/21, 4:57 pm
52.7 71.9 40.7 51.6 54.7 57.8 61.1
ST-4 Chaffey College near 10559 Marlot Court 11/29/21 3:41 pm 50.1 61.8 39.0 50.5 51.4 52.9 57.0
Sensitive Receptors
Certain land uses, such as residences, schools, and hospitals, are particularly sensitive to noise and vibration. Sensitive receptors include residences, senior housing, schools, places of worship, and recreational areas. These uses are regarded as sensitive because they are where citizens most frequently engage in activities which are likely to be disturbed by noise, such as reading, studying, sleeping, resting, working from home, or otherwise engaging in quiet or passive recreation. Commercial and industrial uses are not particularly sensitive to noise or vibration.
The closest off-campus sensitive receptors to the project site are residences, places of worship, and a school. Residential uses are found in all directions. The Church of Jesus Christ is west across Haven Avenue, and Shepherd of the Hills is to the southwest. Banyan Elementary School is located to the south The temporary construction noise analysis also includes a discussion for on-site receptors. On-site receptors analyzed during construction activities include existing campus buildings that would host classes or would be considered designated learning space, such as a library, study area, etc. The nearest on-site receptors are within 150 feet of proposed construction activities.
5.5.2 Thresholds of Significance According to Appendix G of the CEQA Guidelines, a project would normally have a significant effect on the environment if the project would result in:
N-1 Generation of a substantial temporary or permanent increase in ambient noise levels in the vicinity of the project in excess of standards established in the local general plan or noise ordinance, or applicable standards of other agencies.
N-2 Generation of excessive groundborne vibration or groundborne noise levels.
N-3 For a project located within the vicinity of a private airstrip or an airport land use plan or, where such a plan has not been adopted, within two miles of a public airport or public use airport, if the project would expose people residing or working in the project area to excessive noise levels.
R A N C H O C U C A M O N G A C A M P U S M A S T E R P L A N D R A F T E I R C H A F F E Y C O M M U N I T Y C O L L E G E D I S T R I C T
5. Environmental Analysis NOISE
April 2022 Page 5.5-13
5.5.2.1 CONSTRUCTION NOISE THRESHOLDS
The City of Rancho Cucamonga has set construction noise standards under Section 17.66.050(D)(4) of the municipal code. The section states that construction noise shall not exceed 65 dBA when measured at the adjacent property line. A significant impact would occur if this noise standard is exceeded at the property line of a noise-sensitive receptor. For on-campus receptors, buildings where classes are held or are considered a learning environment, the CALGreen requirement for nonresidential interior spaces of 50 dBA Leq is used as an interior noise threshold for the on-campus receptors.
5.5.2.2 TRANSPORTATION NOISE THRESHOLDS
A project will normally have a significant effect on the environment related to traffic noise if it would substantially increase the ambient noise levels for adjoining areas. Most people can detect changes in sound levels of approximately 3 dBA under normal, quiet conditions, and changes of 1 to 3 dBA under quiet, controlled conditions. Changes of less than 1 dBA are usually indiscernible. A change of 5 dBA is readily discernible to most people in an outdoor environment. Based on this, the following thresholds of significance, similar to those recommended by the Federal Aviation Administration, are used to assess traffic noise impacts at sensitive receptor locations. A significant impact would occur if the traffic noise increase would exceed:
1.5 dBA for ambient noise environments of 65 dBA CNEL and higher. 3 dBA for ambient noise environments of 60 to 64 CNEL. 5 dBA for ambient noise environments of less than 60 dBA CNEL.
5.5.2.3 STATIONARY NOISE THRESHOLDS
As discussed in Section 5.5.1.2, Regulatory Background, the City’s exterior noise standards are established in the City’s Municipal Code, Section 17.66.050 of (Table 5.5-3). For the purposes of this analysis, these exterior noise standards are used to determine potentially significant stationary noise impacts.
5.5.2.4 VIBRATION THRESHOLDS
The City of Rancho Cucamonga has not established specific limits for vibration. FTA criteria for acceptable levels of groundborne vibration for various types of buildings are used in this analysis. Structures amplify groundborne vibration, and wood-frame buildings, such as typical residential structures, are more affected by ground vibration than heavier, engineered buildings. The level at which groundborne vibration is strong enough to cause architectural damage has not been determined conclusively. Conservative estimates are reflected in the FTA standards, shown in Table 5.5-6, Groundborne Vibration Criteria: Architectural Damage.
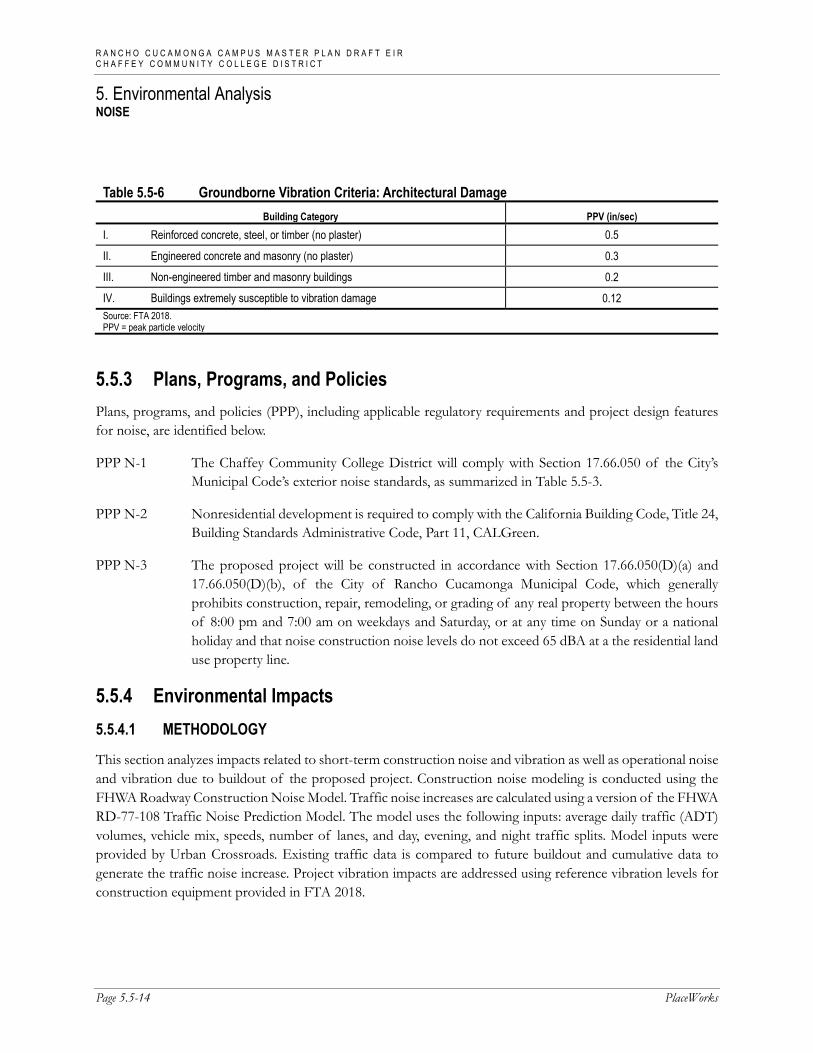
R A N C H O C U C A M O N G A C A M P U S M A S T E R P L A N D R A F T E I R C H A F F E Y C O M M U N I T Y C O L L E G E D I S T R I C T
5. Environmental Analysis NOISE
Page 5.5-14 PlaceWorks
5.5.3 Plans, Programs, and Policies Plans, programs, and policies (PPP), including applicable regulatory requirements and project design features for noise, are identified below.
PPP N-1 The Chaffey Community College District will comply with Section 17.66.050 of the City’s Municipal Code’s exterior noise standards, as summarized in Table 5.5-3.
PPP N-2 Nonresidential development is required to comply with the California Building Code, Title 24, Building Standards Administrative Code, Part 11, CALGreen.
PPP N-3 The proposed project will be constructed in accordance with Section 17.66.050(D)(a) and 17.66.050(D)(b), of the City of Rancho Cucamonga Municipal Code, which generally prohibits construction, repair, remodeling, or grading of any real property between the hours of 8:00 pm and 7:00 am on weekdays and Saturday, or at any time on Sunday or a national holiday and that noise construction noise levels do not exceed 65 dBA at a the residential land use property line.
5.5.4 Environmental Impacts 5.5.4.1 METHODOLOGY
This section analyzes impacts related to short-term construction noise and vibration as well as operational noise and vibration due to buildout of the proposed project. Construction noise modeling is conducted using the FHWA Roadway Construction Noise Model. Traffic noise increases are calculated using a version of the FHWA RD-77-108 Traffic Noise Prediction Model. The model uses the following inputs: average daily traffic (ADT) volumes, vehicle mix, speeds, number of lanes, and day, evening, and night traffic splits. Model inputs were provided by Urban Crossroads. Existing traffic data is compared to future buildout and cumulative data to generate the traffic noise increase. Project vibration impacts are addressed using reference vibration levels for construction equipment provided in FTA 2018.
Table 5.5-6 Groundborne Vibration Criteria: Architectural Damage Building Category PPV (in/sec)
I. Reinforced concrete, steel, or timber (no plaster) 0.5
II. Engineered concrete and masonry (no plaster) 0.3
III. Non-engineered timber and masonry buildings 0.2
IV. Buildings extremely susceptible to vibration damage 0.12 Source: FTA 2018. PPV = peak particle velocity

R A N C H O C U C A M O N G A C A M P U S M A S T E R P L A N D R A F T E I R C H A F F E Y C O M M U N I T Y C O L L E G E D I S T R I C T
5. Environmental Analysis NOISE
April 2022 Page 5.5-15
5.5.4.2 IMPACT ANALYSIS
The following impact analysis addresses the thresholds of significance; the applicable thresholds are identified in brackets after the impact statement.
Impact 5.5-1: Construction activities could result in temporary noise increases in the vicinity of the proposed project. [Threshold N-1]
Two types of short-term noise impacts could occur during construction: (1) mobile-source noise from transport of workers, material deliveries, and debris and soil haul and (2) stationary-source noise from use of construction equipment. Existing uses surrounding the project site would be exposed to construction noise.
Construction Vehicles
The transport of workers and materials to and from the construction site would incrementally increase noise levels along access roadways, including but not limited to Haven Avenue and Wilson Avenue. Individual construction vehicle pass-bys and haul trucks may create momentary noise levels of up to 85 dBA (Lmax) at 50 feet from the vehicle, but these occurrences would be temporary and generally short lived as trucks pass by.
Anticipated maximum daily worker/vendor trips are 407 during building construction of Phase 1. Anticipated maximum daily haul truck trips are 20 during demolition phases for Phase 2 and Phase 5. Existing average daily trips in the project vicinity range from 5,947 to 8,386 trips.1 The addition of temporary worker, vendor, and haul trips would result in a negligible noise increase of 0.5 dBA CNEL or less.2 Therefore, impacts would be less than significant.
Construction Equipment
Noise generated during construction is based on the type of equipment used, the location of the equipment relative to sensitive receptors, and the timing and duration of the noise-generating activities. Each activity phase of construction involves the use of different construction equipment, and therefore each activity phase has its own distinct noise characteristics. Noise levels from construction activities are dominated by the loudest piece of construction equipment. The dominant noise source is typically the engine, although work piece noise (such as dropping of materials) can also be noticeable. Construction would span over five sequential but not overlapping phases, with lengthy time gaps between. Table 5.5-7, List of Construction Equipment and Noise Emission Levels, lists typical noise levels for equipment anticipated for use during project construction.
1 Existing average daily traffic provided by Urban Crossroads. 2 Temporary construction trip traffic increase = 10*Log[(existing daily trips+ temporary construction daily trips)/existing daily
trips).

R A N C H O C U C A M O N G A C A M P U S M A S T E R P L A N D R A F T E I R C H A F F E Y C O M M U N I T Y C O L L E G E D I S T R I C T
5. Environmental Analysis NOISE
Page 5.5-16 PlaceWorks
Table 5.5-7 List of Construction Equipment and Noise Emission Levels
Construction Equipment Typical Noise Level (dBA Leq) at 50 feet
Air Compressors 74 Backhoe 74 Cement and Mortar Mixers 77 Saws 83 Cranes 73 Excavators 77 Forklifts 68 Front End Loader 75 Generator Sets 78 Graders 81 Pavers 74 Pavement Scarifier 83 Rollers 73 Rubber Tired Dozers 78 Scrapers 80 Tractors 80 Welders 70 Source: FHWA 2006.
Noise emissions vary considerably, depending on what specific activity is being performed at any given moment. Noise attenuation due to distance, the number and type of equipment, and the load and power requirements to accomplish tasks at each construction phase would result in different noise levels from construction activities at a given receptor. Since noise from construction equipment is intermittent and diminishes at a rate of at least 6 dBA per doubling of distance (conservatively ignoring other attenuation effects from air absorption, ground effects, and shielding effects), the average noise levels at noise-sensitive receptors could vary considerably, because mobile construction equipment would move around the site with different loads and power requirements. Pile driving would not be needed during any phase of project construction.
The time of day that construction activity is conducted also determines significance, particularly during the more sensitive nighttime hours. However, construction activity would comply with Rancho Cucamonga’s Municipal Code section 17.66.050 (D)(4), which limits the hours of construction to 7:00 am to 8:00 pm on Monday through Saturday and prohibits construction on Sundays or national holidays (PPP N-3). For reference, Table 5.5-7 shows a list of all the known construction equipment and their individual noise emissions at 50 feet. At 50 feet some equipment could reach up to 83 dBA Leq.
Off-Campus Sensitive Receptors
Table 5.5-8, Construction Phasing Schedule, shows the anticipated construction schedule. The Master Plan buildout would span approximately 25 years for construction. All five phases construction would be completed in a total of 4.8 years, but gaps between phases would run from 3.1 to 6.4 years. The longest development phase is

R A N C H O C U C A M O N G A C A M P U S M A S T E R P L A N D R A F T E I R C H A F F E Y C O M M U N I T Y C O L L E G E D I S T R I C T
5. Environmental Analysis NOISE
April 2022 Page 5.5-17
anticipated to be Phases 1 and 5, lasting approximately 1.5 years. Phase 2 would be followed by an approximately 3-year gap before the initiation of Phase 2.
Table 5.5-8 Construction Phasing Schedule Construction Phase and Gaps Start End Total Duration, Years
Phase 1 1/01/2026 7/14/2027 1.5 Gap Between Phases 7/15/2027 7/31/2030 3.1
Phase 2 8/1/2030 7/10/2031 0.9 Gap Between Phases 7/11/2031 2/12/2038 6.6
Phase 3 2/13/2038 7/21/2038 0.4 Gap Between Phases 7/22/2038 2/1/2042 3.5
Phase 4 2/3/2042 7/23/2042 0.5 Gap Between Phases 7/24/2042 12/31/2048 6.4
Phase 5 1/1/2049 7/14/2050 1.5 Total Buildout Schedule 24.5
Total Construction Work Duration without Gaps 4.8 Total Duration of Gaps 19.6
The modeled construction equipment mix is based on the CalEEMod default outputs (see Appendix B to this DEIR) assuming the simultaneous use of the three loudest pieces of equipment per activity phase (e.g., demolition, site preparation, grading, building construction, paving). Table 5.5-9, Project-Related Construction Noise, dBA Leq at Off-Campus Receptors, shows noise levels from the worst-case activity phase modeled at 50 feet and the attenuated noise levels at nearby sensitive receptors. The loudest modeled activity for development Phases 1 through 5 were all found to reach up to 85 dBA Leq at a distance of 50 feet.
Table 5.5-9 Project-Related Construction Noise, dBA Leq at Off-Campus Receptors
Phases
RCNM Model Noise Level at 50 feet1
Nearest Residential Receptors Nearest Non-residential Sensitive Receptors
To the North at 525 Feet
to the East at 350 Feet
To the South at 585 Feet
To the West at 585 Feet
Church of Jesus Christ West at 600
Feet
Banyan School to
South at 615 Feet
Shepherd of The Hills to Southwest at 770 feet
Phases 1 - 5 85 65 68 64 64 65 63 64 Exceeds Threshold of 65 dBA at Sensitive Receptor? No Yes No No No No No
Notes: Values conservatively do not account for additional noise reduction from buildings or other shielding. 1 Represents the loudest activity phase (e.g., demolition, grading, site preparation) out of all development phases modeled using the composite noise emissions of the
top three loudest equipment pieces.
Distances to nearby sensitive receptors were measured from the acoustical center of the nearest proposed demolition, construction, grading, or paving activities. The acoustical center best represents average noise emissions. The following are the nearest proposed areas of disturbance to the surrounding receptors in Table 5.5-9:

R A N C H O C U C A M O N G A C A M P U S M A S T E R P L A N D R A F T E I R C H A F F E Y C O M M U N I T Y C O L L E G E D I S T R I C T
5. Environmental Analysis NOISE
Page 5.5-18 PlaceWorks
Receptors to the north. Demolition of Social Science Building and the Language Arts Building.
Receptors to the east. Parking lot expansion northeast of Grigsby Field.
Receptors to south. Demolition and reconstruction of the Maintenance Building and Operational Support Building and parking lot.
Receptors to the east. Demolition of the Administration Building and construction of new Instructional Building 1. Demolition of Business Education building and construction of new Instructional Building 2.
It is important to note that the nearest construction activities at various receptors would not all occur at once. As shown in Table 5.5-9, nearby sensitive receptors would be exposed to construction noise levels of between 63 dBA Leq and 68 dBA Leq. Receptors to the north, south, and west would not experience noise levels in excess of 65 dBA Leq. However, the receptors to the east could experience noise levels in excess of 65 dBA Leq from the proposed parking lot northeast of Grigsby Field during the parking lot expansion. This would exceed the City’s construction noise standard of 65 dBA Leq. All other construction activities would be 850 feet or farther from the receptors to the east, reducing noise levels to 60 dBA Leq or less.
Athletic Field Renovations and Improvements
A portion of the existing athletic fields (approximately 20,000 square feet) would be renovated under the proposed project. This would include resurfacing Grigsby Field and portions of the soccer, baseball, and practice fields. Other renovations would include installation of permanent bleachers, replacing baseball dugouts, and the removal of unstable soils (baseball and practice fields only). Renovations and improvements would not require heavy-duty construction equipment associated with other phases such as demolition, building construction, or grading. Installing bleachers, replacing dugouts, field resurfacing, and removing unstable soil are improvements that typically take between one to six months. Noise levels at nearby residences would be minimal and, therefore, impacts would be less than significant.
On-Campus Sensitive Receptors
Students would remain on campus during all phases of construction, with the potential for construction activities to occur during school hours. Therefore, students could be exposed to construction activity noise during this time. The CALGreen requirement for nonresidential interior spaces is 50 dBA Leq, and the typical building would provide at least 25 dBA of exterior-to-interior noise reduction. Therefore, if exterior construction noise exceeds 75 dBA Leq at the classroom building façade, interior noise levels could exceed the threshold. Based on the equipment anticipated for project construction (see Table 5.5-7), construction noise could potentially exceed the interior standard of 50 dBA Leq when within 150 feet of an active classroom. There are various existing buildings that would hold classes that are within 150 feet of construction operations during development Phases 1 through 5. Therefore, this impact is considered potentially significant.
Level of significance Before Mitigation: Potentially significant impact.

R A N C H O C U C A M O N G A C A M P U S M A S T E R P L A N D R A F T E I R C H A F F E Y C O M M U N I T Y C O L L E G E D I S T R I C T
5. Environmental Analysis NOISE
April 2022 Page 5.5-19
Impact 5.5-2: Project implementation would result in long-term operation-related noise that would not exceed noise standards. [Threshold N-1]
A project will normally have a significant effect on the environment related to noise if it will substantially increase the ambient noise levels for adjoining areas. Most people can detect changes in sound levels of approximately 3 dBA under normal, quiet conditions, and changes of 1 to 3 dBA are detectable under quiet, controlled conditions. Changes of less than 1 dBA are usually indiscernible. A change of 5 dBA is readily discernible to most people in an exterior environment. Based on this, the following thresholds of significance, similar to those recommended by the Federal Aviation Administration, are used to assess traffic noise impacts at sensitive receptor locations. As discussed in Section 5.13.2, Thresholds of Significance, a significant impact would occur if the traffic noise increase would exceed:
1.5 dBA for ambient noise environments of 65 dBA CNEL and higher.
3 dBA for ambient noise environments of 60 to 64 CNEL. 5 dBA for ambient noise environments of less than 60 dBA CNEL.
Table 5.5-10, Traffic Noise Levels for Existing and Project Buildout Conditions, summarizes project-related traffic-noise increases by segment, calculated using traffic volumes provided by Urban Crossroads. As shown in Table 5.5-10, below, project-related noise increases would be up to 0.3 dBA CNEL and would not exceed the establish thresholds. Therefore, impacts would be less than significant. Cumulative traffic noise impacts are discussed in Section 5.5.5, Cumulative Impacts.
Mechanical Equipment
The proposed project would renovate and construct new buildings throughout the campus. Buildings would have heating, ventilation, and air conditioning (HVAC) systems which are anticipated to be on the rooftops. The nearest proposed buildings with an HVAC system to sensitive receptors would be the Operational Support Building and Instructional Buildings 1 and 2. These buildings are approximately 450 feet from the edge of the building façade to the nearest western residential property line. Typical HVAC noise is 72 dBA at a distance of 3 feet. At 450 feet, noise levels would attenuate to approximately 29 dBA, which is below the daytime and nighttime exterior noise standards of 65 dBA and 60 dBA, respectively. Therefore, HVAC noise impacts would be less than significant.
Recreational Activities
The site is an existing college campus with playfields and student circulation. The proposed project would not substantially change nor add new recreational uses. Though some improvements are proposed for the playfields, this would not substantially change the existing noise environment. Therefore, noise associated with existing recreational uses would be less than significant.
Level of Significance Before Mitigation: Less than significant impact.

R A N C H O C U C A M O N G A C A M P U S M A S T E R P L A N D R A F T E I R C H A F F E Y C O M M U N I T Y C O L L E G E D I S T R I C T
5. Environmental Analysis NOISE
Page 5.5-20 PlaceWorks
This page intentionally left blank.

R A N C H O C U C A M O N G A C A M P U S M A S T E R P L A N D R A F T E I R C H A F F E Y C O M M U N I T Y C O L L E G E D I S T R I C T
5. Environmental Analysis NOISE
April 2022 Page 5.5-21
Table 5.5-10 Traffic Noise Levels for Existing and Project Buildout Conditions
Roadway Segment
Traffic Volumes (ADT) Traffic Noise Increase (dBA CNEL)
Existing No Project
Existing Plus
Project
2040 No
Project
2040 With
Project Project Noise
Increase
Cumulative Plus Project Noise
Increase
Project Contribution to
Cumulative Noise Increase
Haven Avenue - north of Wilson Avenue 5,915 5,947 6,442 6,474 0.0 0.4 0.0
Haven Avenue - south of Wilson Avenue 9,713 9,755 11,365 11,407 0.0 0.7 0.0
Wilson Avenue - east of Haven Avenue 8,386 8,428 12,755 12,797 0.0 1.8 0.0
Wilson Avenue - west of Haven Avenue 5,617 5,669 7,027 7,079 0.0 1.0 0.0
Haven Avenue - north of Driveway 1 9,711 9,753 11,388 11,430 0.0 0.7 0.0
Haven Avenue - south of Driveway 1 10,090 10,154 11,832 11,896 0.0 0.7 0.0
Haven Avenue - north of Olive Way north 10,091 10,154 11,833 11,896 0.0 0.7 0.0
Haven Avenue - south of Olive Way north 10,468 10,553 12,275 12,360 0.0 0.7 0.0
Olive Way north- east of Haven Avenue 571 603 670 702 0.2 0.9 0.2
Haven Avenue - north of Olive Way south 11,616 11,701 13,622 13,707 0.0 0.7 0.0
Haven Avenue - south of Olive Way south 13,318 13,505 15,617 15,804 0.1 0.7 0.1
Olive Way south - east of Haven Avenue 2,247 2,359 2,635 2,747 0.2 0.9 0.2
Haven Avenue - north of Amber Lane 13,316 13,503 16,271 16,458 0.1 0.9 0.0
Haven Avenue - south of Amber Lane 28,222 29,154 33,470 34,402 0.1 0.9 0.1
Amber Lane - east of Haven Avenue 15,300 16,097 11,011 11,808 0.2 -1.1 0.3
Amber Lane - west of Haven Avenue 636 636 791 791 0.0 0.9 0.0
Haven Avenue - north of Lemon Avenue 35,599 36,465 22,424 23,290 0.1 -1.8 0.2
Haven Avenue - south of Lemon Avenue 40,500 41,302 28,568 29,370 0.1 -1.4 0.1
Lemon Avenue - east of Haven Avenue 7,200 7,210 7,106 7,116 0.0 -0.1 0.0
Lemon Avenue - west of Haven Avenue 8,004 8,058 8,587 8,641 0.0 0.3 0.0
Haven Avenue - north of I-210 WB Ramps 51,474 52,277 54,476 55,279 0.1 0.3 0.1
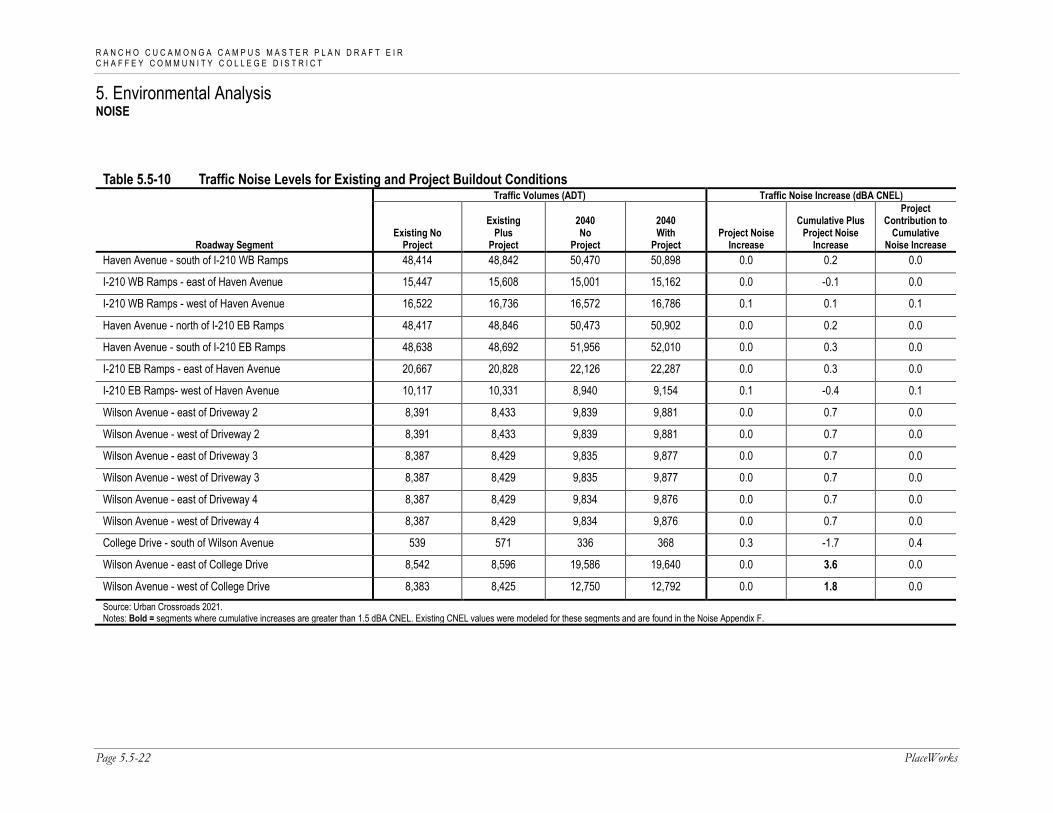
R A N C H O C U C A M O N G A C A M P U S M A S T E R P L A N D R A F T E I R C H A F F E Y C O M M U N I T Y C O L L E G E D I S T R I C T
5. Environmental Analysis NOISE
Page 5.5-22 PlaceWorks
Table 5.5-10 Traffic Noise Levels for Existing and Project Buildout Conditions
Roadway Segment
Traffic Volumes (ADT) Traffic Noise Increase (dBA CNEL)
Existing No Project
Existing Plus
Project
2040 No
Project
2040 With
Project Project Noise
Increase
Cumulative Plus Project Noise
Increase
Project Contribution to
Cumulative Noise Increase
Haven Avenue - south of I-210 WB Ramps 48,414 48,842 50,470 50,898 0.0 0.2 0.0
I-210 WB Ramps - east of Haven Avenue 15,447 15,608 15,001 15,162 0.0 -0.1 0.0
I-210 WB Ramps - west of Haven Avenue 16,522 16,736 16,572 16,786 0.1 0.1 0.1
Haven Avenue - north of I-210 EB Ramps 48,417 48,846 50,473 50,902 0.0 0.2 0.0
Haven Avenue - south of I-210 EB Ramps 48,638 48,692 51,956 52,010 0.0 0.3 0.0
I-210 EB Ramps - east of Haven Avenue 20,667 20,828 22,126 22,287 0.0 0.3 0.0
I-210 EB Ramps- west of Haven Avenue 10,117 10,331 8,940 9,154 0.1 -0.4 0.1
Wilson Avenue - east of Driveway 2 8,391 8,433 9,839 9,881 0.0 0.7 0.0
Wilson Avenue - west of Driveway 2 8,391 8,433 9,839 9,881 0.0 0.7 0.0
Wilson Avenue - east of Driveway 3 8,387 8,429 9,835 9,877 0.0 0.7 0.0
Wilson Avenue - west of Driveway 3 8,387 8,429 9,835 9,877 0.0 0.7 0.0
Wilson Avenue - east of Driveway 4 8,387 8,429 9,834 9,876 0.0 0.7 0.0
Wilson Avenue - west of Driveway 4 8,387 8,429 9,834 9,876 0.0 0.7 0.0
College Drive - south of Wilson Avenue 539 571 336 368 0.3 -1.7 0.4
Wilson Avenue - east of College Drive 8,542 8,596 19,586 19,640 0.0 3.6 0.0
Wilson Avenue - west of College Drive 8,383 8,425 12,750 12,792 0.0 1.8 0.0 Source: Urban Crossroads 2021. Notes: Bold = segments where cumulative increases are greater than 1.5 dBA CNEL. Existing CNEL values were modeled for these segments and are found in the Noise Appendix F.

R A N C H O C U C A M O N G A C A M P U S M A S T E R P L A N D R A F T E I R C H A F F E Y C O M M U N I T Y C O L L E G E D I S T R I C T
5. Environmental Analysis NOISE
April 2022 Page 5.5-23
Impact 5.5-3: The project would not create short-term nor long-term operational groundborne vibration and groundborne noise in excess of established standards. [Threshold N-2]
Construction can generate varying degrees of ground vibration, depending on the construction procedures and equipment. Operation of construction equipment generates vibrations that spread through the ground and diminish with distance from the source. The effect on buildings in the vicinity of the construction site varies depending on soil type, ground strata, and receptor-building construction. The effects from vibration can range from no perceptible effects at the lowest vibration levels, to low rumbling sounds and perceptible vibrations at moderate levels, to slight structural damage at the highest levels. Vibration from construction activities rarely reaches the levels that can damage structures.
Table 5.5-11, Vibration Levels for Typical Construction Equipment, summarizes vibration levels for typical construction equipment at a reference distance of 25 feet. Typical construction equipment can generate vibration levels ranging up to 0.21 in/sec PPV at 25 feet. Vibration levels at a distance greater than 25 feet would attenuate to 0.2 in/sec PPV or less. The nearest sensitive receptor to proposed construction activities is approximately 120 feet to the west, where construction vibration is projected to reach up to 0.02 in/sec PPV. Therefore, construction vibration would not exceed the threshold of 0.2 in/sec PPV, and impacts would be less than significant.
Table 5.5-11 Vibration Levels for Typical Construction Equipment Equipment FTA Reference PPV (in/sec) at 25 feet PPV (in/sec) at Residences to east at 120 feet
Vibratory Roller 0.21 0.020 Large Bulldozer 0.089 0.008 Caisson Drilling 0.089 0.008 Loaded Trucks 0.076 0.007 Jackhammer 0.035 0.003 Small Bulldozer 0.003 <0.001
Source: FTA, 2018. Transit Noise and Vibration Impact Assessment, September.
Operational Vibration
The proposed project would not have any significant sources of vibration. Such sources typically include above-ground or underground rail systems such as a subways or railroad tracks. Therefore, no impact would occur.
Level of Significance Before Mitigation: Less than significant impact.
Impact 5.5-4: The proximity of the project site to an airport or airstrip would not result in exposure of future workers to excessive airport-related noise. [Threshold N-3]
The nearest airports are Cable Airport and Ontario International Airport. Cable Airport is approximately 6.5 miles to the southwest, and Ontario International Airport is approximately 6 miles to the south. At these
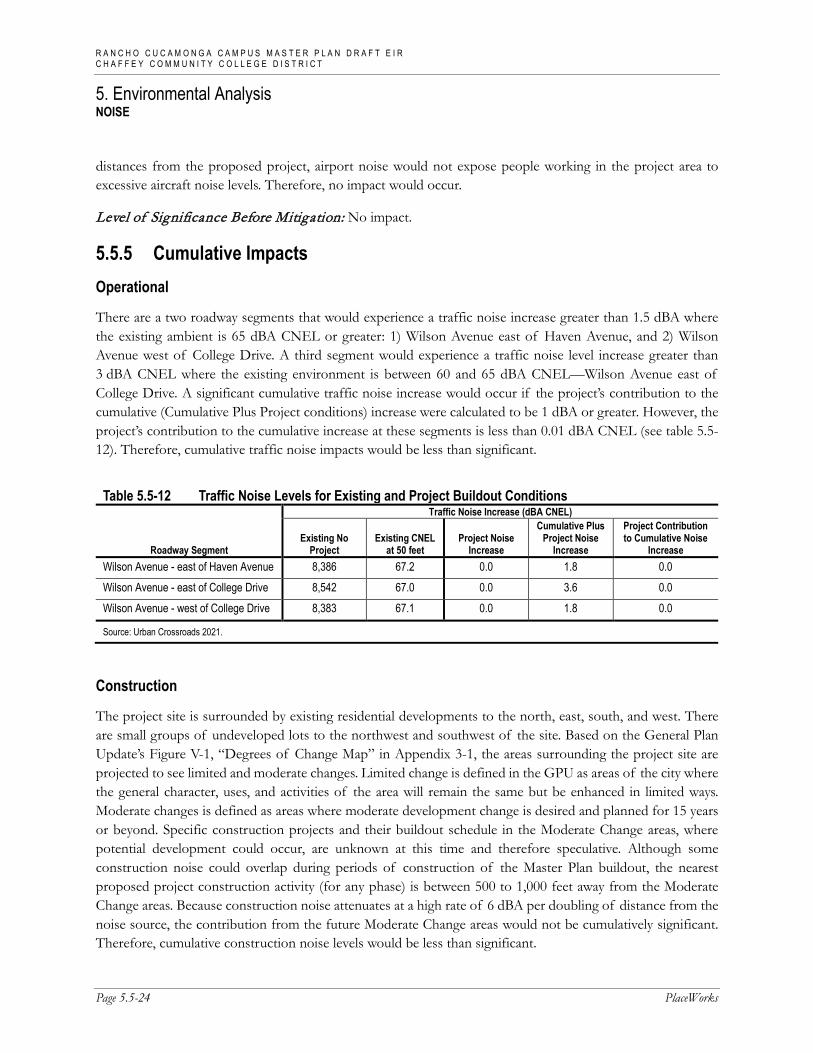
R A N C H O C U C A M O N G A C A M P U S M A S T E R P L A N D R A F T E I R C H A F F E Y C O M M U N I T Y C O L L E G E D I S T R I C T
5. Environmental Analysis NOISE
Page 5.5-24 PlaceWorks
distances from the proposed project, airport noise would not expose people working in the project area to excessive aircraft noise levels. Therefore, no impact would occur.
Level of Significance Before Mitigation: No impact.
5.5.5 Cumulative Impacts Operational
There are a two roadway segments that would experience a traffic noise increase greater than 1.5 dBA where the existing ambient is 65 dBA CNEL or greater: 1) Wilson Avenue east of Haven Avenue, and 2) Wilson Avenue west of College Drive. A third segment would experience a traffic noise level increase greater than 3 dBA CNEL where the existing environment is between 60 and 65 dBA CNEL—Wilson Avenue east of College Drive. A significant cumulative traffic noise increase would occur if the project’s contribution to the cumulative (Cumulative Plus Project conditions) increase were calculated to be 1 dBA or greater. However, the project’s contribution to the cumulative increase at these segments is less than 0.01 dBA CNEL (see table 5.5-12). Therefore, cumulative traffic noise impacts would be less than significant.
Table 5.5-12 Traffic Noise Levels for Existing and Project Buildout Conditions
Roadway Segment
Traffic Noise Increase (dBA CNEL)
Existing No Project
Existing CNEL at 50 feet
Project Noise Increase
Cumulative Plus Project Noise
Increase
Project Contribution to Cumulative Noise
Increase Wilson Avenue - east of Haven Avenue 8,386 67.2 0.0 1.8 0.0 Wilson Avenue - east of College Drive 8,542 67.0 0.0 3.6 0.0 Wilson Avenue - west of College Drive 8,383 67.1 0.0 1.8 0.0
Source: Urban Crossroads 2021.
Construction
The project site is surrounded by existing residential developments to the north, east, south, and west. There are small groups of undeveloped lots to the northwest and southwest of the site. Based on the General Plan Update’s Figure V-1, “Degrees of Change Map” in Appendix 3-1, the areas surrounding the project site are projected to see limited and moderate changes. Limited change is defined in the GPU as areas of the city where the general character, uses, and activities of the area will remain the same but be enhanced in limited ways. Moderate changes is defined as areas where moderate development change is desired and planned for 15 years or beyond. Specific construction projects and their buildout schedule in the Moderate Change areas, where potential development could occur, are unknown at this time and therefore speculative. Although some construction noise could overlap during periods of construction of the Master Plan buildout, the nearest proposed project construction activity (for any phase) is between 500 to 1,000 feet away from the Moderate Change areas. Because construction noise attenuates at a high rate of 6 dBA per doubling of distance from the noise source, the contribution from the future Moderate Change areas would not be cumulatively significant. Therefore, cumulative construction noise levels would be less than significant.

R A N C H O C U C A M O N G A C A M P U S M A S T E R P L A N D R A F T E I R C H A F F E Y C O M M U N I T Y C O L L E G E D I S T R I C T
5. Environmental Analysis NOISE
April 2022 Page 5.5-25
5.5.6 Level of Significance Before Mitigation Upon implementation of plans, programs, and policies, the following impacts would be less than significant: 5.5-2, 5.5-3, and 5.5-4.
Without mitigation, the following impacts would be potentially significant:
Impact 5.5-1 Off-site and existing instructional buildings (classroom buildings) will be potentially exposed to noise levels greater than 65 dBA Leq and 50 dBA Leq, respectively, during construction.
5.5.7 Mitigation Measures Impact 5.5-1
N-1 The Chaffey Community College District (District) shall require the following measures to be identified in the construction plans and implemented during construction activities.
Mitigation for Off-Site Exterior Noise Levels During Construction. The District shall implement the following practices:
During the construction of the parking lot expansion east of Grigsby Field, erect a temporary noise barrier/curtain along project boundary between the construction zone and residences east of Grigsby Field (see Figure 5.5-2, Temporary Noise Barrier Location) . The temporary sound barrier shall have a minimum height of 12 feet and be free of gaps and holes. The barrier can be:
• (a) a ¾-inch-thick plywood wall; or
• (b) a hanging blanket/curtain with a surface density or at least 2 pounds per square foot; or
• (c) other similar sound attenuation feature that achieves equivalent reductions should an alternative method be necessary based on site constraints.
During the active construction period, equipment and trucks used for project construction shall utilize the best available noise control techniques (e.g., improved mufflers, intake silencers, ducts, engine enclosures, acoustically attenuating shields or shrouds) wherever feasible.
Impact tools (e.g., jack hammers and hoe rams) shall be hydraulic or electric powered wherever feasible. Where the use of pneumatic tools is unavoidable, an exhaust muffler on the compressed air exhaust shall be used along with external noise jackets on the tools.
Signs shall be posted at the job site entrance(s), within the on-site construction zones, and along queueing lanes (if any) to reinforce the prohibition of unnecessary engine idling. All equipment shall be turned off if not in use for more than 5 minutes.

R A N C H O C U C A M O N G A C A M P U S M A S T E R P L A N D R A F T E I R C H A F F E Y C O M M U N I T Y C O L L E G E D I S T R I C T
5. Environmental Analysis NOISE
Page 5.5-26 PlaceWorks
During the entire active construction period and to the extent feasible, the use of noise-producing signals, including horns, whistles, alarms, and bells, shall be for safety warning purposes only. The construction manager shall be responsible for adjusting alarms based on the background noise level, or to utilize human spotters when feasible and in compliance with all safety requirements and laws. Locate stationary noise-generating equipment, such as air compressors or portable power generators, as far as possible from onsite and offsite sensitive receptors as feasible. If they must be located near receptors, adequate muffling (with enclosures where feasible and appropriate) shall be used reduce noise levels at the adjacent sensitive receptors. Any enclosure openings or venting shall face away from sensitive receptors.
Construction staging areas shall be established at locations that will create the greatest distance between the construction-related noise sources and noise-sensitive receptors nearest the project site during all project construction.
Designate a “disturbance coordinator” who would be responsible for responding to any complaints about construction noise. The disturbance coordinator will determine the cause of the noise complaint (e.g., bad muffler, etc.) and require that reasonable measures be implemented to correct the problem. Conspicuously post a telephone number for the disturbance coordinator at the construction site and include in it the notice sent to neighbors regarding the construction schedule.
N-2 The Chaffey Community College District shall require the following measures to be identified in the construction plans and implemented during construction activities.
Mitigation for On-Site Interior Noise Levels During Construction. Prior to the start of construction, the construction contractor shall submit a list of equipment and activities required during construction to the Chaffey Community College District (District) in order to ensure proper planning of the most intense construction activities during time periods that would least impact campus operations. Prior to start of each construction phase, the District shall assess if any operational instructional buildings are within 150 feet of construction activities. Where operational instructional buildings are found to be within 150 feet of proposed construction, the District shall ensure that interior classroom noise levels do not exceed 50 dBA Leq. Feasible methods to achieve this include:
Relocating students to a different building at least 150 feet away from on-site construction activities.
Where relocation is not feasible, the contractor shall erect a temporary noise barrier with a minimum height of at least 12 feet and free of gaps and holes. The barrier can be (a) a ¾-inch-thick plywood wall OR (b) a hanging acoustical blanket/curtain with a surface density or at least 1.5 pounds per square foot.

PlaceWorks
Figure 5.5-2 - Temporary Noise Barrier Location
Source: Nearmap, 2022
0
Scale (Feet)
350Chaffey College - Rancho Cucamonga Campus
R A N C H O C U C A M O N G A C A M P U S M A S T E R P L A N D R A F T E I RC H A F F E Y C O M M U N I T Y C O L L E G E D I S T R I C T
Temporary Noise Barrier
Wilson AveWilson Ave
Fred
eric
ksbu
rg A
veFr
eder
icks
burg
Ave
Can
iste
l Ave
Can
iste
l Ave
Seven Pines DrSeven Pines Dr
Antietam DrAntietam Dr
Stone River DrStone River Dr
Cedar Creek DrCedar Creek Dr
Cross Keys DrCross Keys Dr
Cold Harbor DrCold Harbor Dr
Appomatox CtAppomatox Ct
Vicksburg CtVicksburg Ct
Shiloh CtShiloh Ct
Banyan StBanyan St
Residential
Panther DrPanther Dr
NaturePreserve
GrigsbyField

R A N C H O C U C A M O N G A C A M P U S M A S T E R P L A N D R A F T E I R C H A F F E Y C O M M U N I T Y C O L L E G E D I S T R I C T
5. Environmental Analysis NOISE
Page 5.5-28 PlaceWorks
This page intentionally left blank.

R A N C H O C U C A M O N G A C A M P U S M A S T E R P L A N D R A F T E I R C H A F F E Y C O M M U N I T Y C O L L E G E D I S T R I C T
5. Environmental Analysis NOISE
April 2022 Page 5.5-29
5.5.8 Level of Significance After Mitigation A barrier with the specification mentioned in Mitigation Measures N-1 and N-2 would provide at least a 10 dBA attention. Off-campus receptors anticipated to be exposed to levels of 68 dBA Leq would be reduced to at least 58 dBA Leq. Construction within 50 feet could generate noise levels of up to 85 dBA Leq, potentially exposing on-campus receptors to interior noise levels of 60 dBA Leq. With a barrier, interior noise levels would be attenuated to 50 dBA Leq or less. The mitigation measures identified above would reduce potential impacts associated with noise to a level that is less than significant. Therefore, no significant unavoidable adverse impacts relating to noise remain.
5.5.9 References AirNav, LLC. 2019. Airport Information. Accessed January, 2022. http://www.airnav.com/airports.
California Department of Transportation (Caltrans). 2013, September. Technical Noise Supplement (TeNS).
Federal Highway Administration (FHWA). 2006, August. Construction Noise Handbook.
Federal Transit Administration (FTA). 2018, September. Transit Noise and Vibration Impact Assessment.
Harris, Cyril M. 1998. Handbook of Acoustical Measurements and Noise Control. 3rd edition. Woodbury, NY: Acoustical Society of America.
Rancho Cucamonga, City of. 2021, December. City of Rancho Cucamonga General Plan. https://www.cityofrc.us/GeneralPlan.
Urban Crossroads. 2021, September. Chaffey Community College District’s Rancho Cucamonga Campus Master Plan Traffic Analysis. DEIR Appendix G.

R A N C H O C U C A M O N G A C A M P U S M A S T E R P L A N D R A F T E I R C H A F F E Y C O M M U N I T Y C O L L E G E D I S T R I C T
5. Environmental Analysis NOISE
Page 5.5-30 PlaceWorks
This page intentionally left blank.
R A N C H O C U C A M O N G A C A M P U S M A S T E R P L A N D R A F T E I R C H A F F E Y C O M M U N I T Y C O L L E G E D I S T R I C T
5. Environmental Analysis
April 2022 Page 5.6-1
5.6 TRANSPORTATION This section of the draft environmental impact report (DEIR) evaluates the potential for implementation of the proposed project to result in transportation and traffic impacts in the City of Rancho Cucamonga. The analysis in this section is based in part on the following technical report(s):
Chaffey Community College District’s Rancho Cucamonga Campus Master Plan Traffic Analysis, Urban Crossroads, September 10, 2021 (Appendix G)
Chaffey Community College District’s Rancho Cucamonga Campus Master Plan Vehicle Miles Traveled (VMT) Screening Evaluation, Urban Crossroads, July 7, 2021 (Appendix H)
Complete copies of these studies are in the technical appendices of this Draft EIR.
5.6.1 Environmental Setting 5.6.1.1 REGULATORY BACKGROUND
State Regulations
Senate Bill 743
On September 27, 2013, Senate Bill (SB) 743 was signed into law, starting a process that fundamentally changed transportation impact analysis as part of CEQA compliance. The legislature found that with the adoption of the SB 375 (Sustainable Communities and Climate Protection Act), the state had signaled its commitment to encourage land use and transportation planning decisions and investments that reduce vehicle miles traveled (VMT) and thereby contribute to the reduction of greenhouse gas emissions, as required by the California Global Warming Solutions Act of 2006 (Assembly Bill [AB] 32).
SB 743 eliminates auto delay, level of service, and other similar measures of vehicular capacity or traffic congestion as the sole basis for determining significant impacts under CEQA. Instead, other measurements, such as VMT, are to be utilized to measure impacts. Pursuant to SB 743, the Natural Resources Agency adopted revisions to the CEQA Guidelines to implement SB 743 on December 28, 2018, and established new criteria for determining the significance of transportation impacts.
The purpose of SB 743 is to balance the needs of congestion management, infill development, public health, greenhouse gas reductions, and other goals. The Office of Planning and Research released the “Technical Advisory on Evaluating Transportation Impacts in CEQA” in December 2018. Rancho Cucamonga led the countywide effort to develop the SB 743 implementation study, a guiding document for VMT analysis methodology, thresholds, and mitigation strategies for transportation impact evaluation for San Bernardino County Transportation Authority (SBCTA) agencies.
The City of Rancho Cucamonga adopted its VMT thresholds on June 18, 2020, through resolution number 2020-056, and they are memorialized in the City’s Traffic Impact Analysis Guidelines (City Guidelines) (Fehr & Peers 2020).

R A N C H O C U C A M O N G A C A M P U S M A S T E R P L A N D R A F T E I R C H A F F E Y C O M M U N I T Y C O L L E G E D I S T R I C T
5. Environmental Analysis TRANSPORTATION
Page 5.6-2 PlaceWorks
California Department of Transportation
Intersections within incorporated cities associated with freeway on- and off-ramps fall under California Department of Transportation (Caltrans) jurisdiction. Caltrans approves the planning, design, and construction of improvements for all state-controlled facilities. Caltrans uses the Highway Capacity Manual 6 methodology to evaluate intersections within its jurisdiction. LOS criteria for unsignalized intersections differ from LOS criteria for signalized intersections because signalized intersections are designed for heavier traffic and therefore a greater delay. Unsignalized intersections are also associated with more uncertainty for users, as delays are less predictable, which can reduce users’ delay tolerance. For state-controlled intersections, LOS standards and impact criteria specified by Caltrans will apply.
Regional Regulations
Southern California Association of Governments
The Southern California Association of Governments (SCAG) is a council of governments representing Imperial, Los Angeles, Orange, Riverside, San Bernardino, and Ventura counties. SCAG is the federally recognized metropolitan planning organization for this region, which encompasses over 38,000 square miles. SCAG is a regional planning agency and a forum for addressing regional issues concerning transportation, the economy, community development, and the environment. SCAG is also the regional clearinghouse for projects requiring environmental documentation under federal and state law. In this role, SCAG reviews proposed development and infrastructure projects to analyze their impacts on regional planning programs.
2020 Regional Transportation Plan/Sustainable Community Strateg y (Connect SoCal)
Every four years SCAG updates the regional transportation plan/sustainable community strategy (RTP/SCS) for the six-county region that includes Los Angeles, San Bernardino, Riverside, Orange, Ventura, and Imperial counties.
On September 3, 2020, SCAG adopted the 2020-2045 RTP/SCS, Connect SoCal, which encompasses four principles that are important to the region’s future—mobility, economy, healthy/complete communities, and environment. Connect SoCal explicitly lays out goals related to housing, transportation technologies, equity, and resilience in order to adequately reflect the increasing importance of these topics in the region. The RTP/SCS outlines a development pattern for the region which, when integrated with the transportation network and other transportation measures and policies, would reduce greenhouse gas emissions from transportation (excluding good movement). The RTP/SCS is meant to provide growth strategies that would achieve the regional greenhouse gas emissions reduction targets identified by the California Air Resources Board. However, the RTP/SCS does not require that local general plans, specific plans, or zoning be consistent with the RTP/SCS; instead, it provides incentives to governments and developers for consistency.
San Bernardino County Congestion Management Program
The passage of Proposition 111 in June 1990 established a process for each metropolitan county in California, including San Bernardino County within which the City of Rancho Cucamonga is located, to prepare a Congestion Management Plan (CMP). Updated by SBCTA in 2016, the CMP is an effort to align

R A N C H O C U C A M O N G A C A M P U S M A S T E R P L A N D R A F T E I R C H A F F E Y C O M M U N I T Y C O L L E G E D I S T R I C T
5. Environmental Analysis TRANSPORTATION
April 2022 Page 5.6-3
land use, transportation, and air quality management efforts in order to promote reasonable growth management programs that effectively use statewide transportation funds, while ensuring that new development pays its fair share of needed transportation improvements.
The focus of the CMP is the development and coordination of a multimodal transportation system across jurisdictional boundaries, incorporating the goals from SCAG’s RTP/SCS. According to the level of service adopted by SBCTA, when a CMP segment falls to level ‘F’ a deficiency plan must be prepared by the local agency where the deficiency is located. The plan must contain mitigation measures, including transportation demand management strategies and transit alternatives, and a schedule of mitigating the deficiency. It is the responsibility of local agencies to consider the traffic impacts on the CMP when reviewing and approving development proposals.
The intent of a CMP is to more directly link land use, transportation, and air quality, thereby prompting reasonable growth management programs that will effectively utilize new transportation funds, alleviate traffic congestion and related deficiencies, and improve air quality. Counties in California have developed CMPs with varying methods and strategies to meet the intent of the CMP legislation. While SR-210 and Haven Avenue are designated CMP facilities serving the city, no traffic study intersections are identified as CMP intersections. It should be noted that SB 743 provides the option for local agencies to opt out of the CMP individually due to its outdated regulatory nature.
Regional Transportation Plan
The RTP is prepared by SCAG for the six-county SCAG region. This long-range transportation plan (approximately 20-year horizon) projects population and employment growth and defines the vision and overall goals for the regional multimodal transportation system. The RTP identifies future transportation infrastructure needs and defines planned multimodal transportation improvements, including freeways, high-occupancy vehicle facilities, bus and rail transit, freight movement, and aviation. This plan therefore sets the framework for the regional transportation infrastructure system that services Rancho Cucamonga.
Caltrans VMT-Focused Transportation Impact Study Guide
The Caltrans VMT-Focused Transportation Impact Study Guide provides a starting point and a consistent basis for Caltrans to evaluate traffic impacts to state highway facilities. The Guide was adopted on May 20, 2020, and provides guidance to Caltrans Districts, lead agencies, tribal governments, developers, and consultants regarding Caltrans review of a land use project’s or plan’s transportation analysis using a VMT metric. This guidance is not binding on public agencies and is intended as a reference and informational document.
Measure I 2020-2040 Strategic Plan
First approved in 1989 and extended in 2004 by the voters, Measure I is the half-cent sales tax collected throughout San Bernardino County for transportation improvements. Administered by SBCTA, the Measure I 2010-2040 Strategic Plan is the official guide for the allocation and administration of the combination of local transportation sales tax, state and federal transportation revenues, and private fair-share

R A N C H O C U C A M O N G A C A M P U S M A S T E R P L A N D R A F T E I R C H A F F E Y C O M M U N I T Y C O L L E G E D I S T R I C T
5. Environmental Analysis TRANSPORTATION
Page 5.6-4 PlaceWorks
contributions to regional transportation facilities for the Measure I 2010-2040 transportation programs. The strategic plan identifies funding categories, allocations, and planned transportation improvement projects in the county for freeways, major and local arterials, bus and rail transit, and traffic management systems. A regional nexus study was prepared by SBCTA and concluded that each jurisdiction should include a regional fee component in its local program to meet the Measure I requirement. For the fiscal years 2018-2019 through 2022-23, Rancho Cucamonga has identified improvements worth approximately $19 million in funding for pavement rehabilitation projects, citywide Americans with Disabilities Act corrective measures, signal and striping maintenance, etc. These improvements are planned to be funded through the Measure I Local Streets Program. It should be noted that the five-year Capital Improvement Program is programmed to allow use of this funding source if additional funding is available during the five-year planning period. The funds raised through Measure I have funded in the past and will continue to fund new transportation facilities in San Bernardino County.
San Bernardino County Long-Range Transit Plan
SBCTA updates its Long-Range Transit Plan (LRTP) to address transit needs for an approximately 25-year horizon. The LRTP prioritizes goals and projects for transit growth. With the passage of SB 375 by the State legislature in 2008, the LRTP has been modified to more closely tie land use and transportation planning strategies. The LRTP addresses countywide travel challenges and creates a system aimed to increase the role of transit in future travel choices. The LRTP anticipates that a premium transit service, such as rapid buses and rail modes, will offer solutions to future travel demands by providing competitive travel times and increased reliability, mobility, and accessibility. Premium transit will reduce dependence on cars, encourage community revitalization, and encourage more balanced transit-oriented land use development.
SBCTA Non-motorized Transportation Plan
SBCTA published its Non-motorized Transportation Plan (NMTP) in 2011 and revised it in 2018, with the vision of creating a safe, interconnected cycling and walking system in the county. Supplemented by local jurisdiction inventory data, the plan provides both regional- and city-level recommendations, and the jurisdictions are responsible for the implementation of the plan.
SBCTA Development Mitigation Nexus Study
The SBCTA Development Mitigation Nexus Study identifies the fair-share contributions from new development for regional transportation improvements (e.g., freeway interchanges, railroad grade separations, and regional arterial highways). The Nexus Study is updated biennially or as requested by SBCTA Board of Directors and in close coordination with local jurisdictions.
Local Regulations
Circulation Master Plan for Bicyclists and Pedestrians
The City of Rancho Cucamonga published a Circulation Master Plan for Bicyclists and Pedestrians in May 2015 that calls for an increase in bicycling and walking to enhance livability, health, transportation, and economic development. In addition to developing a connected network, the plan also recommends bicycle
R A N C H O C U C A M O N G A C A M P U S M A S T E R P L A N D R A F T E I R C H A F F E Y C O M M U N I T Y C O L L E G E D I S T R I C T
5. Environmental Analysis TRANSPORTATION
April 2022 Page 5.6-5
programs to improve facilities that can make it safer for users of all ages and abilities to ride a bicycle on city streets. The plan developed bicycle facilities network recommendations as well as additional suggestions on improving bike facilities, intersections, bicycle sharing, wayfinding, bicycle parking, end-of-trip amenities, etc. The recommended pedestrian improvements included sidewalk gap closures and high priority segments. Trail implementation recommendations included wayfinding, high visibility crosswalks, sidewalk furniture, etc. Educational programs were recommended to create awareness about biking and walking among different ages and abilities.
City of Rancho Cucamonga Municipal Code
The municipal code includes regulations and standards that govern traffic, parking and loading, and development in the city. Title 10, Vehicles and Traffic, includes regulations on traffic enforcement regulations, pedestrian rights, electric vehicle parking, and truck routes.
City of Rancho Cucamonga Development Impact Fee
The City adopted the latest update to its development impact fee (DIF) program in July 2019. Fees from new residential, commercial, and industrial development are collected to fund Measure-I-compliant regional facilities as well as local facilities. Under the City’s DIF program, the City may grant to developers a credit against specific components of fees when those developers construct certain facilities and landscaped medians identified in the list of improvements funded by the DIF program.
After the City’s DIF fees are collected, they are placed in a separate, restricted-use account pursuant to the requirements of Government Code sections 66000 et seq. The timing to use the DIF fees is established through periodic capital improvement programs that are overseen by the City’s Engineering Department. Periodic traffic counts, review of traffic accidents, and a review of traffic trends throughout the city are also periodically performed by City staff and consultants. The City uses this data to determine the timing of the improvements listed in its facilities list. The City also uses this data to ensure that the improvements listed on the facilities list are constructed before the LOS falls below the LOS performance standards adopted by the City. In this way, the improvements are constructed before the LOS falls below the City’s LOS performance thresholds. The City’s DIF program establishes a timeline to fund, design, and build the improvements.
City of Rancho Cucamonga VMT Thresholds
The City of Rancho Cucamonga Traffic Impact Analysis Guidelines (City Guidelines) identify methodologies and approaches for assessing VMT for project impact determination. It specifically identifies the following significance criteria:
A project would result in a significant project generated VMT impact under either of the following conditions:
1. The baseline project-generated VMT per service population exceeds the City of Ranch Cucamonga baseline VMT per service population, or

R A N C H O C U C A M O N G A C A M P U S M A S T E R P L A N D R A F T E I R C H A F F E Y C O M M U N I T Y C O L L E G E D I S T R I C T
5. Environmental Analysis TRANSPORTATION
Page 5.6-6 PlaceWorks
2. The cumulative project-generated VMT per service population exceeds the City of Rancho Cucamonga baseline VMT per service population.
The project’s impact on VMT would also be considered significant if it resulted in the following condition:
1. The cumulative link-level boundary VMT per service population in the City of Rancho Cucamonga increases under the plus project condition compared to the no project condition.
The guidelines also note that the City was also updating its general plan at the time of this VMT threshold adoption and that the City would reevaluate the threshold based on the outcome of the General Plan effort.
5.6.1.2 EXISTING CONDITIONS
Existing Circulation Network
In collaboration with the City of Rancho Cucamonga staff, 12 key intersections in the city were identified to be studied in the traffic analysis (Appendix G to the DEIR). The roadway network provides regional and local access to the project site and define the extent of the boundaries for the traffic circulation analysis. These intersections are listed below and shown on Figure 5.6-1, Existing Roadways and Intersection Controls.
1) Haven Avenue and Wilson Avenue
2) Haven Avenue and Driveway 1
3) Haven Avenue and Olive Way-North
4) Haven Avenue and Olive Way-South
5) Haven Avenue and Amber Ln./College Drive
6) Haven Avenue and Lemon Avenue
7) Haven Avenue and I-210 WB Ramps
8) Haven Avenue and I-210 EB Ramps
9) Driveway 2 and Wilson Avenue
10) Driveway 3 and Wilson Avenue
11) Driveway 4 and Wilson Avenue
12) College Drive and Wilson Avenue

Chaffey Community College District’s Rancho Cucamonga Campus Master Plan Traffic Analysis
13236-03 TA Report 20
EXHIBIT 3-1: EXISTING NUMBER OF THROUGH LANES AND INTERSECTION CONTROLS
PlaceWorks
Figure 5.6-1 - Existing Roadways and Intersection Controls
Source: Urban Crossroads, 2021b
0
Scale (Feet)
800
R A N C H O C U C A M O N G A C A M P U S M A S T E R P L A N D R A F T E I RC H A F F E Y C O M M U N I T Y C O L L E G E D I S T R I C T
5. Environmental Analysis
Traffic SignalStop SignNumber of Lanes
DividedUndivided
Defacto Right TurnSpeed Limit (MPH)
4
DU
DEF
25SPEEDLIMIT
Chaffey College - Rancho Cucamonga Campus
Existing Location#
210
SiteSite

R A N C H O C U C A M O N G A C A M P U S M A S T E R P L A N D R A F T E I R C H A F F E Y C O M M U N I T Y C O L L E G E D I S T R I C T
5. Environmental Analysis TRANSPORTATION
Page 5.6-8 PlaceWorks
This page intentionally left blank.
R A N C H O C U C A M O N G A C A M P U S M A S T E R P L A N D R A F T E I R C H A F F E Y C O M M U N I T Y C O L L E G E D I S T R I C T
5. Environmental Analysis TRANSPORTATION
April 2022 Page 5.6-9
City of Rancho Cucamonga General Plan Circulation Element
Exhibit 3-2, City of Rancho Cucamonga General Plan Circulation Element, of the traffic analysis (Appendix G) shows roadway classifications of the roadways in the vicinity of the project site from the City’s Circulation Element, and Exhibit 3-3, City of Rancho Cucamonga General Plan Roadway Cross-Sections, of the traffic analysis illustrates planned (ultimate) cross-sections of the major roadways in Rancho Cucamonga. Haven Avenue fronting the project site to the west is designated a Major Divided Arterial that can accommodate six travel lanes and have raised medians. The Major Divided Arterial roadways experience the most traffic in the city. Wilson Avenue fronting the project site to the north is designated Secondary Arterial that can accommodate four travel lanes and provide connection between collectors and arterials. Secondary Arterials have two-way left-turn lanes. Haven Avenue north of Wilson Avenue is also designated a Secondary Arterial. Banyan Street to the south is designated a Collector and provides two travel lanes with a centerline striped median and left-turn pockets at intersections with collector or higher level streets.
Bicycle and Pedestrian Facilities
As shown on Figure 5.6-2, Existing Bicycle Facilities, there are Class II bike lanes along Wilson Avenue and Haven Avenue. As shown on Figure 5.6-3, Existing Trails, there are community trails adjacent to the project site along Wilson Avenue, Haven Avenue, and Banyan Street. Figure 5.6-4, Existing Pedestrian Facilities, illustrates the existing pedestrian facilities, including sidewalks and crosswalk locations. Currently there are no sidewalks along the project site’s frontages of Haven Avenue and Wilson Avenue.
Transit Service
OmniTrans is a public transit agency serving various jurisdictions in San Bernardino County, including Rancho Cucamonga. As shown on Figure 5.6-5, Existing Bus Routes, OmniTrans bus routes 67, 81, 85, and 87 serve the project site by going into the campus. Route 81 runs north-south along Haven Avenue into the campus; Route 85 runs along Milken Avenue and west on Banyan Street to Haven Avenue into the campus; Route 67 runs along Lemon Avenue to Haven Avenue into the campus; and Route 87 runs along 19th Street to Haven Avenue into the campus.
Existing Trip Generation
The prepandemic student head count at the Rancho Cucamonga Campus was 16,474 students actively enrolled in fall 2019. According to the traffic analysis (Appendix G to the DEIR), the existing campus with 16,474 students generates 18,982 two-way trip-ends per day, 1,815 AM peak hour trips and 1,815 PM peak hour trips, as shown in Table 5.6-1, Existing Trip Generation Summary.

R A N C H O C U C A M O N G A C A M P U S M A S T E R P L A N D R A F T E I R C H A F F E Y C O M M U N I T Y C O L L E G E D I S T R I C T
5. Environmental Analysis TRANSPORTATION
Page 5.6-10 PlaceWorks
Table 5.6-1 Existing Trip Generation Summary
Land Use1 Units
(ITE Code) In Out Total In Out Total Daily Trip Generation Rates Junior/Community College STU (ITE 540) 0.09 0.02 0.11 0.06 0.05 0.11 1.15 Warehousing2
TSF (ITE 150)
Passenger Cars 0.114 0.034 0.148 0.044 0.118 0.162 1.27 2-Axle Trucks 0.003 0.001 0.004 0.001 0.003 0.005 0.078 3-Axle Trucks 0.004 0.001 0.005 0.002 0.004 0.006 0.097 4-Axle Trucks 0.011 0.003 0.014 0.005 0.013 0.018 0.294 Warehouse Total 0.131 0.039 0.170 0.051 0.139 0.190 1.74 Existing Trip Generation Summary Fall 2019 (Pre-Pandemic) Enrollment 16,474 STU 1,468 344 1,812 1,015 797 1,812 18,946
Warehousing
20.700 TSF
Passenger Cars 2 1 3 1 2 3 26.29 2-Axle Trucks 0 0 0 0 0 0 1.61 3-Axle Trucks 0 0 0 0 0 0 2.00 4-Axle Trucks 0 0 0 0 0 0 10 Total Warehouse Trips (actual Vehicles)
2 1 3 1 2 3 36
Total Project Trips 1,470 345 1,815 1,016 799 1,815 18,982 STU = students; TSF = thousand square feet 1 Trip Generation Source: Institute of Transportation Engineers (ITE), Trip Generation Manual, 10th edition (2017). 2 Vehicle Mix Source: ITE Trip Generation Handbook Supplement (2020), Appendix C. Truck Mix: South Coast Air Quality Management District’s (SCAQMD)
recommended truck mix, by axle type. Normalized % - Without Cold Storage: 16.7% 2-Axle trucks, 20.7% 3-Axle trucks, 62.6% 4-Axle trucks.
Vehicle Miles Traveled
VMT measures the number of miles traveled during a specific time within a specific region. Cities with more accessibility to key destinations and job centers in a region tend to generate less VMT per service population (i.e., resident population plus employment) or per household compared to places farther from job centers. Based on the City’s General Plan Update Community Mobility Existing Conditions Report, the City’s VMT per service population for baseline year 2018 is 32.

PlaceWorks
Figure 5.6-2 - Existing Bicycle Facilities
Source: Urban Crossroads, 2021b
0
Scale (Feet)
2,500
R A N C H O C U C A M O N G A C A M P U S M A S T E R P L A N D R A F T E I RC H A F F E Y C O M M U N I T Y C O L L E G E D I S T R I C T
5. Environmental Analysis
City Boundary
Chaffey College - Rancho Cucamonga Campus
RANCHOCUCAMONGA
Note: Unincorporated county areas are shown in white.
Existing Class I (Multi-Use Path)Existing Class II (Bike Plan)Proposed Class II (Bike Plan)Existing Class III (Bike Plan)
Schools
Waterways Parks
Wilson Ave
Banyan StMerlot Ct
Hav
en A
ve
Hillside Rd
Can
iste
l Ave
Lemon AveM
illik
en A
ve
Her
mos
a Av
e
Dee
r Cre
ek C
hann
el
19th Ave
Day CreekChannel
SiteSite
210

R A N C H O C U C A M O N G A C A M P U S M A S T E R P L A N D R A F T E I R C H A F F E Y C O M M U N I T Y C O L L E G E D I S T R I C T
5. Environmental Analysis TRANSPORTATION
Page 5.6-12 PlaceWorks
This page intentionally left blank.

PlaceWorks
Figure 5.6-3 - Existing Trails
Source: Urban Crossroads, 2021b
0
Scale (Feet)
2,500
R A N C H O C U C A M O N G A C A M P U S M A S T E R P L A N D R A F T E I RC H A F F E Y C O M M U N I T Y C O L L E G E D I S T R I C T
5. Environmental Analysis
City Boundary
Chaffey College - Rancho Cucamonga Campus
RANCHOCUCAMONGA
Note: Unincorporated county areas are shown in white.
Day CreekChannel
Community Trails
Regional Trails
Equestrian TrailsWaterways
Wilson Ave
Banyan StMerlot Ct
Hav
en A
ve
Hillside Rd
Can
iste
l Ave
Lemon AveM
illik
en A
ve
Her
mos
a Av
e
210
19th Ave
Dee
r Cre
ek C
hann
el
SiteSite
Schools
Parks

R A N C H O C U C A M O N G A C A M P U S M A S T E R P L A N D R A F T E I R C H A F F E Y C O M M U N I T Y C O L L E G E D I S T R I C T
5. Environmental Analysis TRANSPORTATION
Page 5.6-14 PlaceWorks
This page intentionally left blank.

Chaffey Community College District’s Rancho Cucamonga Campus Master Plan Traffic Analysis
13236-03 TA Report 26
EXHIBIT 3-6: EXISTING PEDESTRIAN FACILITIES
PlaceWorks
Figure 5.6-4 - Existing Pedestrian Facilities
Source: Urban Crossroads, 2021b
R A N C H O C U C A M O N G A C A M P U S M A S T E R P L A N D R A F T E I RC H A F F E Y C O M M U N I T Y C O L L E G E D I S T R I C T
5. Environmental Analysis
0
Scale (Feet)
1,500
2
1
4
6
7
210
Crosswalk (Approaches)Sidewalks
2 4
Chaffey College - Rancho Cucamonga Campus
8
9
3
3
5
210
SiteSite

R A N C H O C U C A M O N G A C A M P U S M A S T E R P L A N D R A F T E I R C H A F F E Y C O M M U N I T Y C O L L E G E D I S T R I C T
5. Environmental Analysis TRANSPORTATION
Page 5.6-16 PlaceWorks
This page intentionally left blank.
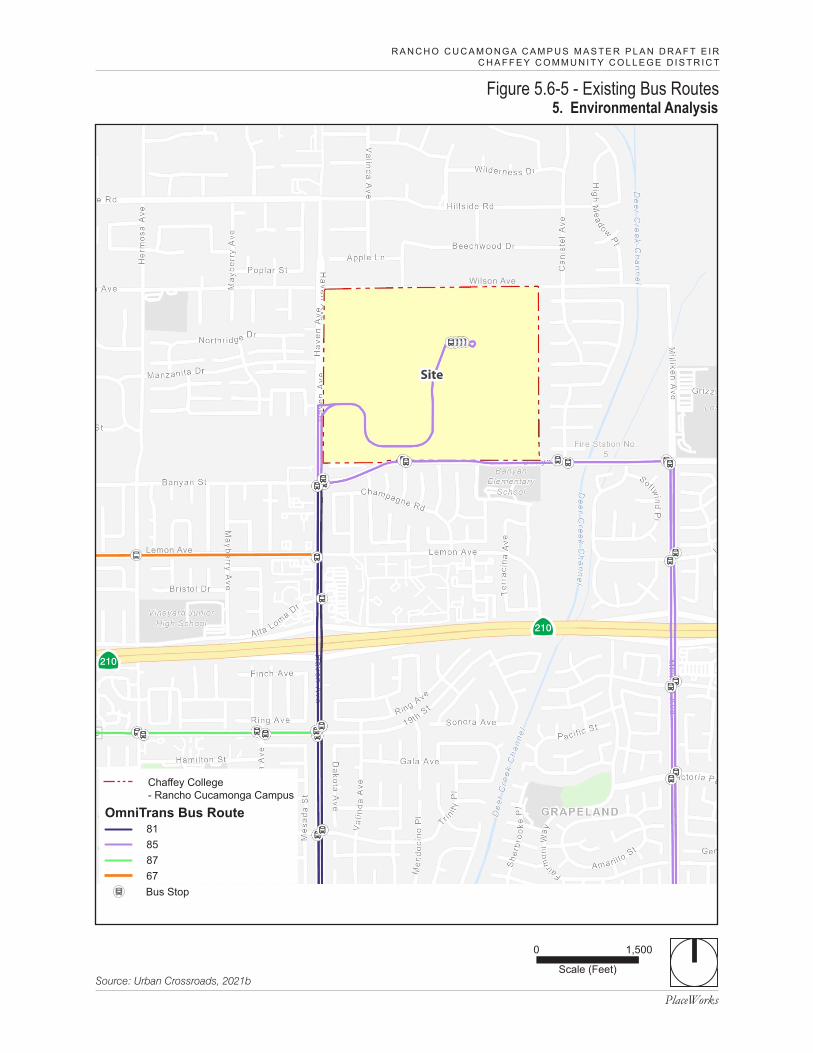
Chaffey Community College District’s Rancho Cucamonga Campus Master Plan Traffic Analysis
13236-03 TA Report 27
EXHIBIT 3-7: EXISTING TRANSIT ROUTES
PlaceWorks
Figure 5.6-5 - Existing Bus Routes
Source: Urban Crossroads, 2021b
0
Scale (Feet)
1,500
R A N C H O C U C A M O N G A C A M P U S M A S T E R P L A N D R A F T E I RC H A F F E Y C O M M U N I T Y C O L L E G E D I S T R I C T
5. Environmental Analysis
Lemon AveLemon Ave
818587
Bus Stop
OmniTrans Bus Route
Chaffey College - Rancho Cucamonga Campus
67
210
210
SiteSite
Wilson AveWilson Ave

R A N C H O C U C A M O N G A C A M P U S M A S T E R P L A N D R A F T E I R C H A F F E Y C O M M U N I T Y C O L L E G E D I S T R I C T
5. Environmental Analysis TRANSPORTATION
Page 5.6-18 PlaceWorks
This page intentionally left blank.

R A N C H O C U C A M O N G A C A M P U S M A S T E R P L A N D R A F T E I R C H A F F E Y C O M M U N I T Y C O L L E G E D I S T R I C T
5. Environmental Analysis TRANSPORTATION
April 2022 Page 5.6-19
5.6.2 Thresholds of Significance According to Appendix G of the CEQA Guidelines, a project would normally have a significant effect on the environment if the project would:
T-1 Conflict with a program, plan, ordinance, or policy addressing the circulation system, including transit, roadway, bicycle, and pedestrian facilities.
T-2 Conflict or be inconsistent with CEQA Guidelines § 15064.3, subdivision (b).
T-3 Substantially increase hazards due to a geometric design feature (e.g., sharp curves or dangerous intersections) or incompatible uses (e.g., farm equipment).
T-4 Result in inadequate emergency access.
5.6.3 Plans, Programs, and Policies Plans, programs, and policies (PPP), including applicable regulatory requirements and project design features for transportation, are identified below.
PPP TRAN-1 At the time of preparation of final grading, landscape, and street improvement plans, whichever comes first, the Chaffey Community College District (District) is required to coordinate with the City of Rancho Cucamonga to receive necessary off-site street improvement permits for the reconfiguration of Olive Way South and the new driveway south of College Drive from Haven Avenue for the Operational Support Building. The driveways will be designed in accordance with the City of Rancho Cucamonga standards, including but not limited to sight-distance standards.
PPP TRAN-2 When construction of any part of development phases would result in temporary lane or roadway closures, the Chaffey Community College District will contact Rancho Cucamonga Police Department to disclose temporary closures and alternate travel routes in order to ensure adequate access for emergency vehicles.
5.6.4 Environmental Impacts Trip Generation
Trip generation represents the amount of traffic that is attracted and produced by a development and is based on the specific land uses planned for a given project. The trip generation summary for the proposed project based on the ITE Trip Generation Manual, 10th edition. Daily and peak hour trip generation estimates are shown in Table 5.6-2, Project Trip Generation Summary. The prepandemic fall 2019 student head count at the Rancho Cucamonga Campus was 16,474 students. The proposed project would be developed in five phases over 30 years. At project buildout in 2051, the student count is anticipated to increase by approximately 5.65 percent, resulting in a headcount of 17,404 students (an increase of 930 students). Therefore, as shown in

R A N C H O C U C A M O N G A C A M P U S M A S T E R P L A N D R A F T E I R C H A F F E Y C O M M U N I T Y C O L L E G E D I S T R I C T
5. Environmental Analysis TRANSPORTATION
Page 5.6-20 PlaceWorks
Table 5.6-2, the proposed project is anticipated to generate a total of 1,070 two-way trip-ends per day, with 102 AM peak hour trips and 102 PM peak hour trips.
Table 5.6-2 Project Trip Generation Summary
Land Use1 Units
(ITE Code) In Out Total In Out Total Daily Trip Generation Rates Junior/Community College STU (ITE 540) 0.09 0.02 0.11 0.06 0.05 0.11 1.15 Proposed Project Trip Generation Summary Rancho Cucamonga Campus 930 STU 83 19 102 57 45 102 1,070
STU = students 1 ITE 10th edition (2017)
5.6.4.1 IMPACT ANALYSIS
The following impact analysis addresses the thresholds of significance; the applicable thresholds are identified in brackets after the impact statement.
Impact 5.6-1: The proposed project would not conflict with a program, plan, ordinance, or policy addressing the circulation system, including transit, roadway, bicycle, and pedestrian facilities. [Threshold T-1]
The proposed project would not change the existing community college land use of the project site. No changes to the City’s General Plan or zoning designations would occur; therefore, the project would not conflict with the City’s General Plan. The proposed project is intended to modernize existing community college facilities by removing some of the older existing buildings, constructing new buildings, renovating existing spaces, and providing various site and infrastructure improvements to maximize functionality and efficiency of the campus and meet the District’s instructional and technology needs. The growth projection for the Master Plan would be minimal, estimated at approximately 930 students in 30 years. The proposed project would require some modifications to the driveways along Haven Avenue and Banyan Street. However, these modifications would be provided in accordance with the City’s standards and reviewed and approved by the City’s Engineering Department. No other off-site circulation improvements that could affect the city’s transit, roadway, bicycle, and pedestrian facilities would result from the project implementation. Therefore, the proposed project would not conflict with a program, plan, ordinance, or policy addressing the circulation system, including transit, roadway, bicycle, and pedestrian facilities.
Level of Significance Before Mitigation: Less than significant impact.
Impact 5.6-2: The proposed project would not conflict or be inconsistent with CEQA Guidelines § 15064.3, subdivision (b). [Threshold T-2]
Consistent with City Guidelines, projects that meet certain screening thresholds based on their location and project type may be presumed to result in a less than significant transportation impact. Consistent with the

R A N C H O C U C A M O N G A C A M P U S M A S T E R P L A N D R A F T E I R C H A F F E Y C O M M U N I T Y C O L L E G E D I S T R I C T
5. Environmental Analysis TRANSPORTATION
April 2022 Page 5.6-21
screening criteria recommended in Office of Planning and Research’s Technical Advisory, the City of Rancho Cucamonga utilizes the following project screening thresholds:
Step 1: Transit Priority Area (TPA) Screening
Step 2: Low VMT Area Screening
Step 3: Project Type Screening
A land use project need only meet one of the above screening criteria to be screened out of further VMT analysis as considered having a less than significant impact.
TPA Screening
Consistent with guidance in the City Guidelines, projects in a transit priority area (TPA) (i.e., within ½ mile of an existing “major transit stop”1 or an existing stop along a “high-quality transit corridor”2) may be presumed to have a less than significant impact absent substantial evidence to the contrary. However, the presumption may not be appropriate if a project:
Has a floor area ratio of less than 0.75.
Includes more parking for use by residents, customers, or employees of the project than required by the jurisdiction (if the jurisdiction requires the project to supply parking).
Is inconsistent with the applicable sustainable communities strategy (as determined by the lead agency, with input from the metropolitan planning organization).
Replaces affordable residential units with a smaller number of moderate- or high-income residential units.
As shown in Attachment A of the VMT Screening Evaluation (Appendix H to the DEIR), the project site is not near a major transit stop or high-quality transit corridor. The TPA screening criteria is not met.
Low VMT Area Screening
City Guidelines state that “residential and office projects located within a low VMT-generating area may be presumed to have a less than significant impact absent substantial evidence to the contrary” (Rancho Cucamonga 2020). Furthermore, the Office of Planning and Research’s Technical Advisory notes that “projects that locate in areas with low VMT and that incorporate similar features (i.e., density, mix of uses, transit accessibility), will tend to exhibit similarly low VMT” (OPR 2018).
1 Pub. Resources Code Section 21064.3: “‘Major transit stop’ means a site containing an existing rail transit station, a ferry terminal
served by either a bus or rail transit service, or the intersection of two or more major bus routes with a frequency of service interval of 15 minutes or less during the morning and afternoon peak commute periods.”
2 Pub. Resources Code Section 21155: “For purposes of this section, a high-quality transit corridor means a corridor with fixed route bus service with service intervals no longer than 15 minutes during peak commute hours.”

R A N C H O C U C A M O N G A C A M P U S M A S T E R P L A N D R A F T E I R C H A F F E Y C O M M U N I T Y C O L L E G E D I S T R I C T
5. Environmental Analysis TRANSPORTATION
Page 5.6-22 PlaceWorks
The City uses the SBCTA Screening Tool to determine low areas of VMT. The Screening Tool uses the subregional San Bernardino Transportation Analysis Model (SBTAM) to measure VMT performance within individual traffic analysis zones (TAZ) in the region.
The project site is in TAZ 53691201, and the Screening Tool was run for the origin/destination VMT per service population measure of VMT. The Screening Tool indicated that the project site is not within a low VMT-generating TAZ. Attachment A of Appendix H, VMT Screening Evaluation, contains screenshot of the SBCTA VMT Screening Tool result. The low-VMT-area screening criteria are not met.
Project Type Screening
The City Guidelines indicate that small development projects generating fewer than 250 daily vehicle trips or less may be presumed to have a less than significant impact, subject to discretionary approval by the City. As shown in Table 5.6-2, the proposed project is anticipated to generate a total of 1,070 vehicle trip-ends per day at project buildout. The number of daily vehicle trips are projected to be exceed the City’s adopted screening criteria of 250 daily vehicle trips.
However, the City Guidelines also indicates that local-serving essential services (e.g., student housing projects on or adjacent to college campuses, community institutions, local-serving community colleges that are consistent with the assumptions noted in the RTP/SCS, etc.) are presumed to have a less than significant impact absent substantial evidence to the contrary.
The proposed project involves modernizing the existing community college campus by removing its old buildings; constructing new buildings; renovating several existing buildings; and providing vehicular and pedestrian circulation improvement, landscaping, utilities infrastructure, informal student gathering spaces, and safety and security upgrades. The City’s General Plan land use plan identifies the project site as “Schools,” and it is also identified “School (S)” by the zoning map. The proposed project would not change the existing land use assumption. The RTP/SCS outlines a development pattern for the region, which is partially based on land use designations in city/county general plans. Because the proposed project is consistent with the City’s existing land use assumptions, the proposed project is also consistent with the assumptions in the RTP/SCS. Additionally, student enrollment data provided from the District indicates that the student population consists of local population traveling an average of within 10 miles of the campus (see Attachment C to Appendix H). The existing college is a local-serving essential service and would continue to serve the local student population. Without local-serving community colleges such as the proposed project, students would need to drive farther distances to other campuses. Therefore, the proposed project is local serving and is presumed to have a less than significant impact to VMT. The project-type screening threshold is met.
Conclusion
The proposed project meets the project-type screening criteria based on the student population consisting of students traveling within the local area and where the land use is consistent with the assumptions in the City’s General Plan and therefore in the RTP/SCS. The project is presumed to result in a less than significant VMT impact; no further VMT analysis is required. The proposed project would not conflict or be inconsistent with CEQA Guidelines § 15064.3, subdivision (b).

R A N C H O C U C A M O N G A C A M P U S M A S T E R P L A N D R A F T E I R C H A F F E Y C O M M U N I T Y C O L L E G E D I S T R I C T
5. Environmental Analysis TRANSPORTATION
April 2022 Page 5.6-23
Level of Significance Before Mitigation: Less than significant impact.
Impact 5.6-3: The proposed project would not substantially increase hazards due to a geometric design feature (e.g., sharp curves or dangerous intersections) or incompatible uses (e.g., farm equipment). [Threshold T-3]
The proposed project includes internal circulation modifications to improve flow of the traffic within the campus, including a new roundabout where College Drive turns south, reconfiguration of Olive Way South as a straight line and not at an angle, a new loading zone in front of the SSA Building connecting Olive Way North to Olive Way South, a new driveway for the Operational Support Building south of College Drive, and expanded an parking lot for the football stadium. The internal circulation improvements would not create sharp curves or dangerous intersections to increase safety hazards. These changes to the existing internal circulation system would allow vehicles to travel more efficiently within the campus without conflicts. The new driveway for the Operational Support Building would allow separate access for truck trips, alleviating congestion at College Drive. On-site traffic improvements, including but not limited to signing and striping, would be implemented in conjunction with detailed construction plans at appropriate phases. Sight distance at each project access point would also be reviewed with respect to standard City of Rancho Cucamonga sight distance standards at the time of preparation of final grading, landscape, and street improvement plans. Compliance with the existing City standards for off-site improvements are incorporated into the DEIR as existing plans, programs, and policies (PPP) TRAN-1.
A queuing analysis was conducted along the site-adjacent roadways and driveways for project buildout conditions. The queuing analysis reviewed the turn-pocket lengths necessary to accommodate long-range 95th percentile queues and determined that there are no anticipated queue issues along the project frontages that would block the adjacent driveways or cause queues in turn lanes to spill into the adjacent through-lanes. The analysis was conducted for the weekday AM and PM peak hours, and the results are in Appendix 1.2 of the traffic analysis in Appendix G of the DEIR. The proposed changes to Olive Way South would not result in substantial changes to queuing conditions because no left turns into or out of from this driveway are allowed, and this condition would not change. Similarly, the new driveway south of College Drive would not allow left turns into or out of the project site, and no queuing impact is anticipated.
The proposed project would not substantially increase hazards due to a geometric design feature or incompatible uses.
Level of Significance Before Mitigation: Less than significant impact with implementation of PPP TRAN-1.
Impact 5.6-4: The proposed project would not result in inadequate emergency access. [Threshold T-4]
The factors that determine whether a project has sufficient access for emergency vehicles include: 1) number of access points (both public and emergency access only); 2) width of access points; and 3) width of internal roadways. The Rancho Cucamonga campus has three street frontages—Wilson Avenue, Haven Avenue, and Banyan Street. There are two access driveways on Wilson Avenue, three driveways on Haven Avenue, and one

R A N C H O C U C A M O N G A C A M P U S M A S T E R P L A N D R A F T E I R C H A F F E Y C O M M U N I T Y C O L L E G E D I S T R I C T
5. Environmental Analysis TRANSPORTATION
Page 5.6-24 PlaceWorks
emergency-access-only driveway on Banyan Street. Therefore, the existing campus provides an adequate number of emergency access points. At project buildout, the Master Plan proposes one more driveway from Haven Avenue, which would be adequately sized for large trucks and emergency vehicles. The final design of the driveway and other roadway improvements would be required to meet the Rancho Cucamonga Fire Protection District standards and turning radii to accommodate emergency vehicles. Additionally, the Master Plan envisions an increase of 930 students, that is, a 5.65 percent increase over a 30-year period, which is not a substantial increase in student enrollment. The increase would be about 31 additional students per year.
With multiple access points, the proposed project would provide adequate emergency access even if one access point were to be closed temporarily during construction. However, if any roadway closure becomes necessary during construction, implementation of PPP TRAN-2 would ensure that impacts are reduced to a less than significant level. The proposed project would not result in inadequate emergency access.
Level of Significance Before Mitigation: Less than significant with implementation of PPP TRAN-2.
5.6.5 Cumulative Impacts The proposed project would be consistent with adopted policies, plans, and programs regarding circulation, including public transit, bicycle, and pedestrian facilities. The proposed project is also a local-serving project that would result in a less-than-significant VMT impact. Therefore, when combined with other development projects in the city, the proposed project would not result in conflict with applicable policies and plans and would not result in increased VMT for residents of Rancho Cucamonga. Cumulative transportation impacts would be less than significant.
5.6.6 Level of Significance Before Mitigation Upon implementation of plans, programs, and policies, the following impacts would be less than significant: 5.6-1, 5.6-2, 5.6-3, and 5.6-4.
5.6.7 Mitigation Measures No mitigation measures are required.
5.6.8 Level of Significance After Mitigation Less than significant impacts relating to transportation would occur without mitigation measures.
5.6.9 References Fehr & Peers. 2020, June. City of Rancho Cucamonga Traffic Impact Analysis Guidelines.
Governor’s Office of Planning and Research (OPR). 2018, December. “Technical Advisory on Evaluating Transportation Impacts in CEQA.”

R A N C H O C U C A M O N G A C A M P U S M A S T E R P L A N D R A F T E I R C H A F F E Y C O M M U N I T Y C O L L E G E D I S T R I C T
5. Environmental Analysis TRANSPORTATION
April 2022 Page 5.6-25
OmniTrans. 2021, November (accessed). Filter by community, Rancho Cucamonga. https://omnitrans.org/plan-a-trip/routes-schedules/.
Rancho Cucamonga, City of. 2020, May. Community Mobility Existing Conditions Report. https://www.cityofrc.us/sites/default/files/2020-06/PlanRC_ExistingConditionsReport _CommunityMobility_May2020.pdf.
Urban Crossroads. 2021a, September. Chaffey Community College District’s Rancho Cucamonga Campus Master Plan Traffic Analysis City of Rancho Cucamonga. DEIR Appendix G.
______. 2021b, July 7. Rancho Cucamonga Campus Master Plan Vehicle Miles Traveled (VMT) Screening Evaluation. DEIR Appendix H.

R A N C H O C U C A M O N G A C A M P U S M A S T E R P L A N D R A F T E I R C H A F F E Y C O M M U N I T Y C O L L E G E D I S T R I C T
5. Environmental Analysis TRANSPORTATION
Page 5.6-26 PlaceWorks
This page intentionally left blank.

R A N C H O C U C A M O N G A C A M P U S M A S T E R P L A N D R A F T E I R C H A F F E Y C O M M U N I T Y C O L L E G E D I S T R I C T
5. Environmental Analysis
April 2022 Page 5.7-1
5.7 TRIBAL CULTURAL RESOURCES Tribal cultural resources (TCR) include landscapes, sacred places, or objects with a cultural value to a California Native American tribe. This section of the Draft Environmental Impact Report (DEIR) evaluates the potential for the proposed project to impact TCRs in Rancho Cucamonga. Potential impacts to other cultural resources (i.e., historic, archaeological, and disturbance of human remains) are evaluated in Section 5.3, Cultural Resources.
The analysis in this section is based in part on the following technical report(s):
Draft Cultural Resources Technical Report for Chaffey College Master Plan Update, Rancho Cucamonga Campus, ASM Affiliates, April 2021.
A complete copy of this study is included in Appendix D to this DEIR.
5.7.1 Environmental Setting 5.7.1.1 REGULATORY BACKGROUND
Federal Archaeological Resources Protection Act
The Archaeological Resources Protection Act (US Code, Title 16, Sections 470aa to mm) became law on October 31, 1979, and has been amended four times. It regulates the protection of archaeological resources and sites that are on federal and Indian lands.
Native American Graves Protection and Repatriation Act
The Native American Graves Protection and Repatriation Act (US Code, Title 25, Sections 3001 et seq.) is a federal law passed in 1990 that established a process for museums and federal agencies to return certain Native American cultural items––such as human remains, funerary objects, sacred objects, or objects of cultural patrimony––to lineal descendants and culturally affiliated Indian tribes.
State California Public Resources Code
Archaeological resources are protected pursuant to a wide variety of state policies and regulations under the California Public Resources Code (PRC). In addition, cultural resources are recognized as nonrenewable and therefore receive protection under the PRC and CEQA.
PRC Sections 5097.9 to 5097.991 protect Native American historical and cultural resources and sacred sites and identify the powers and duties of the Native American Heritage Commission (NAHC). They also require notification to descendants regarding Native American human remains and provide for treatment and disposition of human remains and associated grave goods.
R A N C H O C U C A M O N G A C A M P U S M A S T E R P L A N D R A F T E I R C A F F E Y C O M M U N I T Y C O L L E G E D I S T R I C T
5. Environmental Analysis TRIBAL CULTURAL RESOURCES
Page 5.7-2 PlaceWorks
California Health and Safety Code
California Health and Safety Code Section 7050.5 requires that if human remains are discovered on the project site, disturbance of the site shall halt and remain halted until the coroner has conducted an investigation into the circumstances, manner, and cause of any death, and the recommendations concerning the treatment and disposition of the human remains have been made to the person responsible for the excavation, or to his or her authorized representative. If the coroner determines that the remains are not subject to his or her authority and recognizes or has reason to believe the human remains are those of a Native American, he or she shall contact, by telephone within 24 hours, the NAHC.
California Register of Historical Resources
The California Register of Historical Resources is the state version of the National Register of Historic Places (see also Section 5.3, Cultural Resources). It was enacted in 1992 and became official January 1, 1993. The California Register was established to serve as an authoritative guide to the state’s significant historical and archaeological resources. Resources that may be eligible for listing include buildings, sites, structures, objects, and historic districts. According to subsection (c) of PRC Section 5024.1, a resource may be listed as a historical resource in the California Register if it meets any of the four National Register criteria.
California Senate Bill 18
Native American prehistoric, archaeological, cultural, spiritual, and ceremonial places may include sanctified cemeteries, religious, ceremonial sites, shrines, burial grounds, prehistoric ruins, archaeological or historic sites, Native American rock art inscriptions, or features of Native American historic cultural and sacred sites. Senate Bill 18 (SB 18) went into effect on March 1, 2005, and placed new requirements on local governments for developments within or near “traditional tribal cultural places” (TTCP). SB 18 requires local jurisdictions to provide opportunities for the involvement of California Native American tribes in the land planning process for the purpose of preserving traditional cultural places. The Final Tribal Guidelines recommend that the NAHC provide written information as soon as possible but no later than 30 days after receiving a request to inform the lead agency if the proposed project is determined to be in proximity to a TTCP and another 90 days for tribes to respond to a local government if they want to consult to determine whether the project would have an adverse impact on the TTCP. There is no statutory limit on the consultation duration. Forty-five days before the action is publicly considered by the local government council, the local government refers action to agencies, following the CEQA public review time frame. The CEQA public distribution list may include tribes listed by the NAHC who have requested consultation, or it may not.
SB 18 is triggered before the adoption, revision, amendment, or update of a city’s or county’s general plan. Because the proposed project does not require these discretionary actions from the City of Rancho Cucamonga, the proposed project is not subject to SB 18.
Assembly Bill 52
The Native American Historic Resource Protection Act (AB 52) took effect July 1, 2015, and incorporates tribal consultation and analysis of impacts to TCR into the CEQA process. It requires that impacts to TCRs be

R A N C H O C U C A M O N G A C A M P U S M A S T E R P L A N D R A F T E I R C H A F F E Y C O M M U N I T Y C O L L E G E D I S T R I C T
5. Environmental Analysis TRIBAL CULTURAL RESOURCES
April 2022 Page 5.7-3
analyzed like any other CEQA topic and establishes a consultation process for lead agencies and California tribes. Projects that require a Notice of Preparation of an EIR or Notice of Intent to adopt an ND or MND are subject to AB 52.
Under AB 52, TCRs are defined as sites, features, places, cultural landscapes, sacred places, and objects with cultural value to a California Native American tribe that are either included or eligible for inclusion in the California Register of Historical Resources or included in a local register of historical resources. Or the lead agency, supported by substantial evidence, chooses at its discretion to treat the resource as a historical resource.
AB 52 requires consultation with tribes at an early stage to determine whether the project would have an adverse impact on TCRs and to define mitigation to protect them. Within 14 days of deciding to undertake a project or determining that a project application is complete, the lead agency must provide formal written notification to all tribes who have requested it. The tribes have 30 days after receiving the notification to respond if they wish to engage in consultation. The lead agency must initiate consultation within 30 days of receiving the request from a tribe.
AB 52 requires that the California Native American tribes first formally request to be notified of proposed projects in the geographic area that is traditionally and culturally affiliated with the tribe. The District did not receive formal requests from any of the tribes.
5.7.1.2 EXISTING CONDITIONS
A sacred lands file search conducted by the NAHC for the project site had positive results, and the NAHC asked that the lead agency contact the Gabrieleno Band of Mission Indians–Kizh Nation and the San Manuel Band of Mission Indians for more information. All together, the NAHC identified 12 local Native American tribes as potentially having local knowledge.
Gabrieleno Band of Mission Indians – Kizh Nation Gabrieleno/Tongva San Gabriel Band of Mission Indians
Gabrielino/Tongva Nation
Gabrielino Tongva Indians of California Tribal Council
Gabrielino-Tongva Tribe
Morongo Band of Mission Indians Campo Band of Diegueno Mission Indians
Quechan Tribe of the Fort Yuma Reservation
San Manuel Band of Mission Indians
Santa Rosa Band of Cahuilla Indians
Serrano Nation of Mission Indians Soboba Band of Luiseño Indians
During the preparation of the Cultural Resources Technical Report, ASM sent query letters to the Gabrieleno Band of Mission Indians–Kizh Nation, the San Manuel Band of Mission Indians, and the other 10 tribes on the NAHC contact list. The query letter provided the location of the project site and asked for information

R A N C H O C U C A M O N G A C A M P U S M A S T E R P L A N D R A F T E I R C A F F E Y C O M M U N I T Y C O L L E G E D I S T R I C T
5. Environmental Analysis TRIBAL CULTURAL RESOURCES
Page 5.7-4 PlaceWorks
about potential resources at or near the project site. Responses were received from the Quechan Tribe of the Fort Yuma Reservation and the San Manuel Band of Mission Indians. The Quechan Historic Preservation Officer stated that they have no comments on the proposed project, deferring to more local tribes. The Cultural Resource Analyst for the San Manuel Band replied that in review of their files, they did not have record of any known tribal cultural resources within one mile of the project site; however, they would like to consult with the lead agency as appropriate subject to AB 52.
Under AB 52, tribes are required to formally submit a written request to be notified of proposed projects in the geographic area that is traditionally and culturally affiliated with the tribe. Although the District did not receive such a written request from the San Manuel Band of Mission Indians, in the interest of cooperation and full disclosure, the District initiated consultation by sending an email correspondence on October 1, 2021, asking to meet (virtually or in person) with the representatives of the San Manuel Band of Mission Indians. On March 15, 2022, an email from Ryan Nordness, Cultural Resource Analyst from the San Manuel Band of Mission Indians, stated that he reviewed the Cultural Resources Report for the project site and received the District’s request to consult with the tribe. The email further stated that the project site is within Serrano ancestral territory, therefore, is of interest to the tribe. However, due to the nature and location of the project, and given the tribe’s present knowledge, the tribe does not have any concerns with the project’s implementation at this time. No further consultation is required per AB 52
5.7.2 Thresholds of Significance According to Appendix G of the CEQA Guidelines, a project would normally have a significant effect on the environment if the project would:
TCR-1 Cause a substantial adverse change in the significance of a tribal cultural resource, defined in Public Resources Code § 21074 as either a site, feature, place, cultural landscape that is geographically defined in terms of the size and scope of the landscape, sacred place, or object with cultural value to a California Native American tribe, and that is:
i) Listed or eligible for listing in the California Register of Historical Resources, or in a local register of historical resources as defined in Public Resources Code section 5020.1(k), or
ii) A resource determined by the lead agency, in its discretion and supported by substantial evidence, to be significant pursuant to criteria set forth in subdivision (c) of Public Resources Code § 5024.1. In applying the criteria set forth in subdivision (c) of Public Resource Code § 5024.1, the lead agency shall consider the significance of the resource to a California Native American tribe.
5.7.3 Plans, Programs, and Policies Plans, programs, and policies (PPP), including applicable regulatory requirements and project design features for tribal cultural resources, are identified below.
R A N C H O C U C A M O N G A C A M P U S M A S T E R P L A N D R A F T E I R C H A F F E Y C O M M U N I T Y C O L L E G E D I S T R I C T
5. Environmental Analysis TRIBAL CULTURAL RESOURCES
April 2022 Page 5.7-5
PPP TCR-1 Pursuant to California Health and Safety Code Section 7050.5, if human remains are discovered on the project site, disturbance of the site shall halt and remain halted until the coroner has conducted an investigation. If the coroner determines that the remains are not subject to his or her authority and has reason to believe that they are those of a Native American, he or she shall contact the NAHC by telephone within 24 hours.
5.7.4 Environmental Impacts 5.7.4.1 IMPACT ANALYSIS
The following impact analysis addresses the thresholds of significance; the applicable thresholds are identified in brackets after the impact statement.
Impact 5.7-1: The proposed project would not cause a substantial adverse change in the significance of a tribal cultural resource, defined in Public Resources Code § 21074 and that is listed or eligible for listing in the California Register of Historical Resources, or in a local register of historical resources as defined in Public Resources Code section 5020.1(k). [Threshold TCR-1.i]
As discussed in Section 5.3, Cultural Resources, of this DEIR, the project site is eligible under the CRHR criteria as a historic district under the themes of education, suburbanization, and architecture and with subthemes of postwar modernism and campus planning and design. One building (Wargin Hall) is also individually eligible under CRHR Criterion C as a good example of Mid-Century-Modernism architecture and the work of master architect William Blurock. Therefore, although the proposed project would have adverse effects on the eligible resources of the CRHR, the effects are not related to tribal cultural resources defined in PRC Section 21074. Therefore, no impact would occur.
Level of Significance Before Mitigation: No impact.
Impact 5.7-2: The proposed project could cause a substantial adverse change in the significance of a tribal cultural resource that is determined by the lead agency to be significant pursuant to criteria in Public Resources Code Section 5024.1(c). [Threshold TCR-1.ii]
The project site is developed as a community college campus and is surrounded by residential uses. The NAHC’s Sacred Lands File search result was positive. Twelve tribes were contacted for information related to TRCs in the project site as part of the Cultural Resources Technical Report. A TCR is a site, feature, place, cultural landscape, sacred place, or object with cultural value to a California Native American tribe that is either in or eligible for inclusion in the California Register of Historical Resources or is a resource that the lead agency, at its discretion and supported by substantial evidence, determines should be treated as a TCR (PRC Sections 21074[a][1] to [2]). Out of the 12 tribes that received inquiries related to the proposed project, 2 responded—the Quechan Tribe of the Fort Yuma Reservation and the San Manuel Band of Mission Indians. The Quechan Tribe of the Fort Yuma Reservation indicated that they have no comments. The San Manuel Band of Mission Indians indicated that in review of their files, they did not have records of any known tribal cultural resources within one mile of the project site but would like to consult per AB 52. The District initiated the requested consultation, stating in an email on October 1, 2021, that the San Manuel Band of Mission Indians did not

R A N C H O C U C A M O N G A C A M P U S M A S T E R P L A N D R A F T E I R C A F F E Y C O M M U N I T Y C O L L E G E D I S T R I C T
5. Environmental Analysis TRIBAL CULTURAL RESOURCES
Page 5.7-6 PlaceWorks
submit a formal request to be notified of the District’s projects per AB 52, but the District would like to meet with the tribe in the interest of cooperation and full disclosure. On March 15, 2022, an email from Ryan Nordness, Cultural Resource Analyst from the San Manuel Band of Mission Indians, stated that he reviewed the Cultural Resources Report for the project site and received the District’s request to consult with the tribe. The email further stated that the project site is within Serrano ancestral territory, therefore, is of interest to the tribe. However, due to the nature and location of the project, and given the tribe’s present knowledge, the tribe does not have any concerns with the project’s implementation at this time. No further consultation is required per AB 52
Based on the records search, consultation with the San Manuel Band of Mission Indians, and previous disturbance associated with the project site, the potential to uncover tribal cultural resources for the site is low. However, ground-disturbing activities may encounter undisturbed native soils, and it is possible that subsurface TCRs could be discovered. The San Manuel Band of Mission Indians also recommended provisions in the event of discovery of cultural and tribal cultural resources to be made part of the project permit process. Therefore, in the event of discovery of potential TCRs, a substantial adverse change in the significance of the resource(s) could occur if not mitigated.
Level of Significance Before Mitigation: Potentially significant impact.
5.7.5 Cumulative Impacts TCRs may be found throughout the City of Rancho Cucamonga, but information about them is much more difficult to obtain than for most archaeological resources. Identification of TCRs requires coordination with Native American tribes, and their precise location is often difficult to determine because they may only be documented through the oral history of the tribe. As with the proposed project, each cumulative project would be required to comply with AB 52 and PRC Section 21083.2(i), which addresses accidental discoveries of archaeological sites and resources, including tribal cultural resources; therefore, any discoveries of TCRs caused by the project or related projects would be mitigated to a less than significant level. Therefore, project impacts would not be cumulatively considerable.
5.7.6 Level of Significance Before Mitigation Upon implementation of plans, programs, and policies, the following impact would be less than significant: 5.7-1.
Without mitigation, the following impacts would be potentially significant:
Impact 5.7-2 Project implementation could result in an adverse change in Native American resources during ground-disturbing construction activities.

R A N C H O C U C A M O N G A C A M P U S M A S T E R P L A N D R A F T E I R C H A F F E Y C O M M U N I T Y C O L L E G E D I S T R I C T
5. Environmental Analysis TRIBAL CULTURAL RESOURCES
April 2022 Page 5.7-7
5.7.7 Mitigation Measures Impact 5.7-2 Mitigation Measure CUL-5 in Section 5.3, Cultural Resources, also reduces impacts to TCR. In addition, the following mitigation measure is specific to potential TCR impacts of the proposed project.
TCR-1 During grading and site preparation activities, the construction contractor retained by the Chaffey Community College District (District) shall monitor all construction activities. In the event that any pre-contact and/or historic-era cultural resources are inadvertently unearthed, work shall be halted immediately within 60 feet of the discovery and the construction contractor shall inform the project manager of the District. Construction activities may continue in other areas. As detailed in Mitigation Measure CUL-5, the District shall retain a qualified archaeologist that meets the Secretary of the Interior’s Standards and Guidelines for Professional Qualifications in Archaeology to analyze the significance of the discovery. Additionally, the San Manuel Band of Missions Indians Cultural Resources Department (SMBMI) shall be contacted, and be provided information regarding the nature of the find, so as to provide Tribal input with regards to significance and treatment. If the resources are Native American in origin and deemed significant as defined by CEQA Guidelines, a cultural resources monitoring and treatment plan shall be prepared by a qualified archaeologist in coordination with SMBMI and all subsequent finds shall be subject to the plan. The plan shall allow for a monitor to be present that represents SMBMI for the remainder of the project development, should SMBMI elect to place a monitor on-site. The plan will outline the treatment plan for the fine to retain it/them in the form and/or manner the Tribe deems appropriate for educational, cultural and/or historic purposes.
The District shall disseminate any and all archaeological/cultural documents created as part of the proposed project (isolated records, site records, survey reports, testing reports, etc.) to SMBMI and the District shall, in good faith, consult with SMBMI through the project development. Preservation in place (i.e., avoidance) is the preferred manner of treatment.
5.7.8 Level of Significance After Mitigation Impact 5.7-2 Because the proposed project would require ground-disturbing activities for construction, there is potential to uncover TCRs. Mitigation Measures TCR-1 and CUL-5 would reduce potential impacts associated with tribal cultural resources to a level that is less than significant. Mitigation Measure CUL-5 will require inadvertent discovery of cultural resources to be evaluated by a qualified archaeologist and a formal treatment plan to be developed. Therefore, no significant unavoidable adverse impacts relating to tribal cultural resources remain.
R A N C H O C U C A M O N G A C A M P U S M A S T E R P L A N D R A F T E I R C A F F E Y C O M M U N I T Y C O L L E G E D I S T R I C T
5. Environmental Analysis TRIBAL CULTURAL RESOURCES
Page 5.7-8 PlaceWorks
5.7.9 References ASM Affiliates (ASM). 2021, April. Draft Cultural Resources Technical Report for Chaffey College Master
Plan Update, Rancho Cucamonga Campus. DEIR Appendix D.
Native American Heritage Commission (NAHC). 2020, June 10. Native American Heritage Commission Tribal Consultation Correspondence and Tribal Consultation List, Orange County.

April 2022 Page 6-1
6. Significant Unavoidable Adverse Impacts At the end of Chapter 1, Executive Summary, is a table that summarizes the impacts, mitigation measures, and levels of significance before and after mitigation. Mitigation measures would reduce the level of impact, but the following impact would remain significant, unavoidable, and adverse after mitigation measures are applied:
Cultural Resources
Cultural Resources
Impact 5.3-1
Pursuant to Section 15064.5, the Rancho Cucamonga campus as a whole is considered a potential historic district (Chaffey College Historic District), with 18 contributing resources under the themes of education, suburbanization, and architecture, and with subthemes of postwar modernism and campus planning and design. With implementation of Mitigation Measures CUL-1 through CUL-4 that require documentation for the Chaffey College Historic District and Wargin Hall, potentially significant impacts to historical resources would be reduced. However, demolition of any portions of the contributing resources would still be considered significant impact. Significant impacts to historical cultural resources would remain significant and unavoidable.

R A N C H O C U C A M O N G A C A M P U S M A S T E R P L A N D R A F T E I R C H A F F E Y C O M M U N I T Y C O L L E G E D I S T R I C T
6. Significant Unavoidable Adverse Impacts
Page 6-2 PlaceWorks
This page intentionally left blank.

April 2022 Page 7-1
7. Alternatives to the Proposed Project 7.1 INTRODUCTION 7.1.1 Purpose and Scope The California Environmental Quality Act (CEQA) requires that an environmental impact report (EIR) include a discussion of reasonable project alternatives that would “feasibly attain most of the basic objectives of the project, but would avoid or substantially lessen any significant effects of the project, and evaluate the comparative merits of the alternatives” (CEQA Guidelines § 15126.6[a]). As required by CEQA, this chapter identifies and evaluates potential alternatives to the proposed project.
Section 15126.6 of the CEQA Guidelines explains the foundation and legal requirements for the alternatives analysis in an EIR. Key provisions are:
“[T]he discussion of alternatives shall focus on alternatives to the project or its location which are capable of avoiding or substantially lessening any significant effects of the project, even if these alternatives would impede to some degree the attainment of the project objectives, or would be more costly.” (15126.6[b])
“The specific alternative of ‘no project’ shall also be evaluated along with its impact.” (15126.6[e][1])
“The no project analysis shall discuss the existing conditions at the time the notice of preparation is published, or if no notice of preparation is published, at the time environmental analysis is commenced, as well as what would be reasonably expected to occur in the foreseeable future if the project were not approved, based on current plans and consistent with available infrastructure and community services. If the environmentally superior alternative is the ‘no project’ alternative, the EIR shall also identify an environmentally superior alternative among the other alternatives.” (15126.6[e][2])
“The range of alternatives required in an EIR is governed by a ‘rule of reason’ that requires the EIR to set forth only those alternatives necessary to permit a reasoned choice. The alternatives shall be limited to ones that would avoid or substantially lessen any of the significant effects of the project.” (15126.6[f])
“Among the factors that may be taken into account when addressing the feasibility of alternatives are site suitability, economic viability, availability of infrastructure, general plan consistency, other plans or regulatory limitations, jurisdictional boundaries…, and whether the proponent can reasonably acquire, control or otherwise have access to the alternative site (or the site is already owned by the proponent)” (15126.6[f][1]).
“Only locations that would avoid or substantially lessen any of the significant effects of the project need be considered for inclusion in the EIR.” (15126.6[f][2][A])
R A N C H O C U C A M O N G A C A M P U S M A S T E R P L A N D R A F T E I R C H A F F E Y C O M M U N I T Y C O L L E G E D I S T R I C T
7. Alternatives to the Proposed Project
Page 7-2 PlaceWorks
“An EIR need not consider an alternative whose effect cannot be reasonably ascertained and whose implementation is remote and speculative.” (15126.6[f][3])
For each development alternative, this analysis:
Describes the alterative. Analyzes the impact of the alternative as compared to the proposed project.
Identifies the impacts of the project that would be avoided or lessened by the alternative.
Assesses whether the alternative would meet most of the basic project objectives. Evaluates the comparative merits of the alternative and the project.
According to Section 15126.6(d) of the CEQA Guidelines, “[i]f an alternative would cause…significant effects in addition those that would be caused by the project as proposed, the significant effects of the alternative shall be discussed, but in less detail than the significant effects of the project as proposed.”
7.1.2 Project Objectives As described in Section 3.2, the following objectives have been established for the proposed project and will aid decision makers in their review of the project, the project alternatives, and associated environmental impacts.
Provide for the development of the site consistent with Vision 2025 Facilities Master Plan and Addendum.
Update and modernize existing building space to meet the District’s instructional needs.
Construct new buildings to meet current and future instructional and technology needs and the District’s academic mission.
Increase academic square foot efficiency through renovation and construction of new buildings and facilities to maximize functional space.
Implement health and safety repairs, energy-efficient enhancements, water conservation, Americans with Disabilities Act (ADA) access, building security, National Fire Protection Association Life Safety Code requirement upgrades, a mass communication system, lock-down capabilities, and other needed facility renovations.
Renovate existing facilities to maximize functional space, eliminate nonfunctional space, and improve efficiency/utilization of existing facilities.
7.2 ALTERNATIVES CONSIDERED AND REJECTED DURING THE SCOPING/PROJECT PLANNING PROCESS
The following is a discussion of the land use alternatives considered during the scoping and planning process and the reasons why they were not selected for detailed analysis in this EIR.

R A N C H O C U C A M O N G A C A M P U S M A S T E R P L A N D R A F T E I R C H A F F E Y C O M M U N I T Y C O L L E G E D I S T R I C T
7. Alternatives to the Proposed Project
April 2022 Page 7-3
7.2.1 Alternative Development Areas CEQA requires that the discussion of alternatives focus on alternatives to the project or its location that are capable of avoiding or substantially lessening any significant effects of the project. The key question and first step in the analysis is whether any of the significant effects of the project would be avoided or substantially lessened by putting the project in another location. Only locations that would avoid or substantially lessen any of the significant effects of the project need be considered for inclusion in the EIR (CEQA Guidelines § 15126[5][B][1]). The project by design is intended for the existing Rancho Cucamonga campus. Therefore, an alternative off-site location is not a feasible alternative that would meet any of the project objectives. For this reason, an alternative off-site location alternative was not considered in the EIR.
7.3 ALTERNATIVES SELECTED FOR FURTHER ANALYSIS Based on the criteria listed above, the following two alternatives have been determined to represent a reasonable range of alternatives which have the potential to feasibly attain most of the basic objectives of the project but which may avoid or substantially lessen any of the significant effects of the project. These alternatives are analyzed in detail in the following sections.
No Project Alternative Integrated Historic Resource Alternative
An EIR must identify an “environmentally superior” alternative and where the No Project Alternative is identified as environmentally superior, the EIR is then required to identify as environmentally superior an alternative from among the others evaluated. Each alternative's environmental impacts are compared to the proposed project and determined to be environmentally superior, neutral, or inferior. Section 7.7 identifies the Environmentally Superior Alternative. The preferred land use alternative (proposed project) is analyzed in detail in Chapter 5 of this DEIR.
7.4 NO PROJECT ALTERNATIVE CEQA Guidelines require the analysis of a No Project Alternative. This analysis must discuss the existing site conditions as well as what would be reasonably expected in the foreseeable future based on any current plans if the project were not approved. Under the No Project Alternative, the proposed demolition of existing buildings and construction of new buildings would not occur at the existing campus. The Rancho Cucamonga campus would remain in its current state, and only minor improvements and health and safety repairs would be provided. Therefore, the No Project Alternative would avoid elimination of the historic resources as identified under Section 5.3, Cultural Resources.
7.4.1 Air Quality This alternative would not generate construction-related air pollutants since the campus would remain the same except for critical maintenance and repairs needed for health and safety on an as-needed basis. No existing buildings would be demolished, and no new buildings or site improvements would occur. This alternative would

R A N C H O C U C A M O N G A C A M P U S M A S T E R P L A N D R A F T E I R C H A F F E Y C O M M U N I T Y C O L L E G E D I S T R I C T
7. Alternatives to the Proposed Project
Page 7-4 PlaceWorks
therefore eliminate construction air quality impacts resulting from the proposed project and would not require mitigation measures. This alternative would also reduce operation-related air quality impacts since no increase student-enrollment capacity would be accommodated; no increase in emissions from mobile sources would occur. However, renovation of existing buildings would not be as energy efficient and sustainable as construction of new buildings with infrastructure and design features that can maximize the building energy efficiency with minimal air quality impact. Therefore, this alternative would have neutral operational air quality impact compared to the proposed project. Air quality is not a significant and unavoidable impact of the proposed project.
7.4.2 Biological Impacts This alternative would not disturb or eliminate approximately 1.9 acres of potentially suitable coastal sage scrub habitat on the project site. Therefore, no impacts to four wildlife species: coast horned lizard, southern California rufous-crowned sparrow, northwestern San Diego pocket mouse, and desert San Diego woodrat, and eight sensitive floral species: Plummer’s mariposa-lily, Catalina mariposa-lily, peninsular spineflower, Parry’s spineflower, paniculate tarplant, Robinson’s pepper-grass, Brand’s star phacelia, and white-rabbit tobacco would occur, no mitigation would be required. This alternative would also eliminate potentially significant impacts to a single wetland and the drainages in the southwestern area of the project site that could be potential jurisdictional resources. However, the biological resources topic is not a significant and unavoidable impact of the proposed project.
7.4.3 Cultural Resources Under this alternative, 15 historic district contributor buildings would not be demolished or renovated. Therefore, the existing campus would remain as a potential historic district under the themes of post-war modernism, and campus planning and design; and this significant and unavoidable impact would be eliminated.
7.4.4 Greenhouse Gas Emissions This alternative would not generate construction-related GHG emissions nor any new operational-related GHG emissions, since the campus would remain the same except for critical maintenance and repairs needed for health and safety on an as-needed basis. Although the proposed project would result in a net decrease in GHG emissions, the decrease is due to the cleaner on-road vehicles in 2050 compared to on-road vehicles traveling in baseline year 2021. Therefore, without the proposed project, the net decrease in GHG emissions would be greater. Therefore, this alternative would have less GHG emissions impact compared to the proposed project. GHG is not a significant and unavoidable impact of the proposed project.
7.4.5 Noise This alternative would not generate construction noise nor any new operational noise, since the campus would remain the same except for critical maintenance and repairs needed for health and safety on an as-needed basis. No construction activities related mitigation measures would be required. Therefore, this alternative eliminates

R A N C H O C U C A M O N G A C A M P U S M A S T E R P L A N D R A F T E I R C H A F F E Y C O M M U N I T Y C O L L E G E D I S T R I C T
7. Alternatives to the Proposed Project
April 2022 Page 7-5
any noise impacts compared to the proposed project. However, noise is a significant and unavoidable impact of the proposed project.
7.4.6 Transportation This alternative would not provide modifications to the driveways along Haven Avenue and Banyan Street, and other site improvements within the existing campus such as reconfiguring internal circulation and expanding existing parking lots. The proposed project is intended to improve the internal circulation within the existing campus. Therefore, under this alternative, the beneficial impact of improved internal circulation would not occur. This alternative would have no impact on the existing VMT. Transportation is not a significant and unavoidable impact of the proposed project.
7.4.7 Tribal Cultural Resources This alternative would not require any ground-disturbing activities. Therefore, this alternative would not result in any impacts related to tribal cultural resources, and no mitigation would be necessary. This alternative eliminates any tribal cultural resources impacts identified under the proposed project. However, tribal cultural resources is not a significant and unavoidable impact of the proposed project.
7.4.8 Conclusion The No Project Alternative would lessen the proposed project’s environmental impacts in all areas, and also avoid the proposed project’s significant and unavoidable cultural resources impact.
However, this alternative would not meet any of the project objectives shown in Section 7.1.2 as described below.
Project Objectives Ability to Meet
Project Objectives Explanation 1. Provide for the development of the site consistent
with Vision 2025 Facilities Master Plan and Addendum.
No Under the No Project Alternative, the existing campus would remain in its current state, and only minor improvements and health and safety repairs would be provided. Therefore, the improvements and facilities needs identified in the Master Plan would not be provided.
2. Update and modernize existing building space to meet the District’s instructional needs.
No Under the No Project Alternative, only minor improvements and health and safety repairs would be provided, therefore, the existing building space would not be updated to meet the District’s instructional needs.
3. Construct new buildings to meet current and future instructional and technology needs and the District’s academic mission.
No Under the No Project Alternative, no new buildings would be constructed.
4. Increase academic square foot efficiency through renovation and construction of new buildings and facilities to maximize functional space.
No Under the No Project Alternative, no renovation or new building construction would be provide.

R A N C H O C U C A M O N G A C A M P U S M A S T E R P L A N D R A F T E I R C H A F F E Y C O M M U N I T Y C O L L E G E D I S T R I C T
7. Alternatives to the Proposed Project
Page 7-6 PlaceWorks
Project Objectives Ability to Meet
Project Objectives Explanation 5. Implement health and safety repairs, energy-
efficient enhancements, water conservation, Americans with Disabilities Act (ADA) access, building security, National Fire Protection Association Life Safety Code requirement upgrades, a mass communication system, lock-down capabilities, and other needed facility renovations.
No Under the No Project Alternative, the existing campus would remain in its current state, and only minor improvements and health and safety repairs would be provided. No campus wide improvements and facility renovations would occur.
6. Renovate existing facilities to maximize functional space, eliminate nonfunctional space, and improve efficiency/utilization of existing facilities.
No Under the No Project Alternative, the existing campus would remain in its current state, and only minor improvements and health and safety repairs would be provided. Therefore, maximizing functional space or improving utilization of existing facilities would not occur.
7.5 INTEGRATED HISTORIC RESOURCES ALTERNATIVE Under this alternative, the Chaffey College Historic District will be retained and reused by the District. There are 15 historic district contributor buildings on-campus, and under the proposed project, 11 of the 15 buildings would be demolished and four buildings would be renovated. Therefore, under the Integrated Historic Resources Alternative, no historic district contributor buildings would be demolished, and the historic themes of education, suburbanization, and architecture, and with sub-themes of post-war modernism, and campus planning and design would be retained. The interior of the historic district contributor buildings would be renovated to maximize and improve efficiency and utilization of existing facilities. Under this alternative, the total demolition square footage would be reduced from 228,628 square feet to 32,582 square feet, a reduction of approximately 86 percent. Under this alternative, the total new building square footages would also be reduced since most buildings would be renovated. This alternative would reduce the total new building square footage by approximately 50 percent from 396,447 sq. ft. to 200,401 sq. ft. All other ADA and site improvements and other renovations per the Master Plan would occur.
7.5.1 Air Quality Under this alternative, less intensive construction and shorter construction duration would occur with approximately 80 percent less demolition and 50 percent less new building construction than the proposed project. Therefore, peak construction emissions would be less than for the proposed project.
During the operational phase, this alternative would result in the same vehicle trips and VMT as the proposed project because it would not affect the buildout student enrollment projection. However, renovation of existing buildings would not be as energy efficient and sustainable as construction of new buildings with infrastructure and design features that can maximize the building energy efficiency with minimal air quality impact. Therefore, this alternative would have slightly greater long-term operational air quality emissions compared to the proposed project, though like the proposed project, impacts would be less than significant.

R A N C H O C U C A M O N G A C A M P U S M A S T E R P L A N D R A F T E I R C H A F F E Y C O M M U N I T Y C O L L E G E D I S T R I C T
7. Alternatives to the Proposed Project
April 2022 Page 7-7
7.5.2 Biological Impacts Under this alternative, the existing 1.9 acres of potentially suitable coastal sage scrub habitat and the open water area on the project site would still be disturbed or eliminated as the proposed project. Therefore, biological resources impact would be the same as the proposed project.
7.5.3 Cultural Resources This alternative would avoid demolishing 11 historic district contributor buildings and renovate all 15 historic district contributor buildings. Therefore, this alternative would eliminate significant and unavoidable cultural resources impact.
7.5.4 Greenhouse Gas Emissions This alternative would result in less construction-related GHG emissions due to decreased demolition and new building square footages and shortened construction duration. However, even under the proposed project, 30-year amortized construction emissions contribute less than one percent of the total GHG emissions generated by the proposed project. No changes to VMT would occur compared to the proposed project. Therefore, this alternative would have similar GHG emissions impacts compared to the proposed project. GHG emission is not a significant and unavoidable impact of the proposed project.
7.5.5 Noise Under this alternative, less intensive construction and shorter construction duration would occur with approximately 80 percent less demolition and 50 percent less new building construction than the proposed project. Therefore, construction-related noise impacts would be less than the proposed project. However, this alternative would still require various construction activities on campus that could potentially result in offsite exterior and onsite interior noise impacts and implementation of mitigation measures would still be necessary to reduce impacts to a less than significant level. Similar operational noise impact is anticipated. Noise is not a significant and unavoidable impact of the proposed project.
7.5.6 Transportation This alternative would result in less intensive construction, therefore, construction-related VMT is anticipated to be less than the proposed project. Under this alternative, various site improvements and parking lot improvements would be provided as the proposed project, providing beneficial impacts to internal circulation. The projected student enrollment at project buildout would not change, therefore, operational VMT would be similar to the proposed project under this alternative. Transportation is not a significant and unavoidable impact of the proposed project.
7.5.7 Tribal Cultural Resources This alternative would retain most of the existing buildings to retain their historical significance as an eligible historic district. Therefore, the total area disturbed for earth-moving activities would be less than the proposed
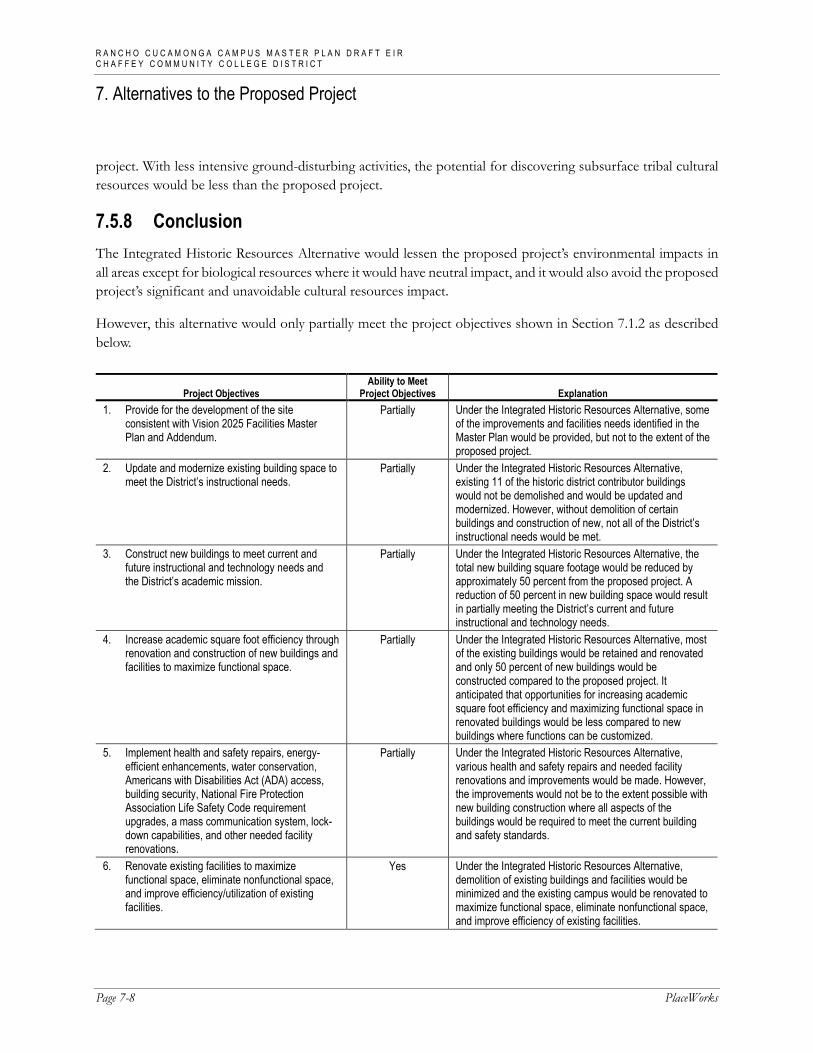
R A N C H O C U C A M O N G A C A M P U S M A S T E R P L A N D R A F T E I R C H A F F E Y C O M M U N I T Y C O L L E G E D I S T R I C T
7. Alternatives to the Proposed Project
Page 7-8 PlaceWorks
project. With less intensive ground-disturbing activities, the potential for discovering subsurface tribal cultural resources would be less than the proposed project.
7.5.8 Conclusion The Integrated Historic Resources Alternative would lessen the proposed project’s environmental impacts in all areas except for biological resources where it would have neutral impact, and it would also avoid the proposed project’s significant and unavoidable cultural resources impact.
However, this alternative would only partially meet the project objectives shown in Section 7.1.2 as described below.
Project Objectives Ability to Meet
Project Objectives Explanation 1. Provide for the development of the site
consistent with Vision 2025 Facilities Master Plan and Addendum.
Partially Under the Integrated Historic Resources Alternative, some of the improvements and facilities needs identified in the Master Plan would be provided, but not to the extent of the proposed project.
2. Update and modernize existing building space to meet the District’s instructional needs.
Partially Under the Integrated Historic Resources Alternative, existing 11 of the historic district contributor buildings would not be demolished and would be updated and modernized. However, without demolition of certain buildings and construction of new, not all of the District’s instructional needs would be met.
3. Construct new buildings to meet current and future instructional and technology needs and the District’s academic mission.
Partially Under the Integrated Historic Resources Alternative, the total new building square footage would be reduced by approximately 50 percent from the proposed project. A reduction of 50 percent in new building space would result in partially meeting the District’s current and future instructional and technology needs.
4. Increase academic square foot efficiency through renovation and construction of new buildings and facilities to maximize functional space.
Partially Under the Integrated Historic Resources Alternative, most of the existing buildings would be retained and renovated and only 50 percent of new buildings would be constructed compared to the proposed project. It anticipated that opportunities for increasing academic square foot efficiency and maximizing functional space in renovated buildings would be less compared to new buildings where functions can be customized.
5. Implement health and safety repairs, energy-efficient enhancements, water conservation, Americans with Disabilities Act (ADA) access, building security, National Fire Protection Association Life Safety Code requirement upgrades, a mass communication system, lock-down capabilities, and other needed facility renovations.
Partially Under the Integrated Historic Resources Alternative, various health and safety repairs and needed facility renovations and improvements would be made. However, the improvements would not be to the extent possible with new building construction where all aspects of the buildings would be required to meet the current building and safety standards.
6. Renovate existing facilities to maximize functional space, eliminate nonfunctional space, and improve efficiency/utilization of existing facilities.
Yes Under the Integrated Historic Resources Alternative, demolition of existing buildings and facilities would be minimized and the existing campus would be renovated to maximize functional space, eliminate nonfunctional space, and improve efficiency of existing facilities.

R A N C H O C U C A M O N G A C A M P U S M A S T E R P L A N D R A F T E I R C H A F F E Y C O M M U N I T Y C O L L E G E D I S T R I C T
7. Alternatives to the Proposed Project
April 2022 Page 7-9
7.6 ENVIRONMENTALLY SUPERIOR ALTERNATIVE CEQA requires a lead agency to identify the “environmentally superior alternative” and, in cases where the “No Project” alternative is environmentally superior to the proposed project, the environmentally superior development alternative must be identified. As summarized in Table 7-1, Summary of Proposed Project and Alternatives, both No Project Alternative and the Integrated Historic Resources Alternative are “environmentally superior” to the proposed project, therefore, Integrated Historic Resources Alternative is identified as the environmentally superior alternative:
No Project Alternative
Integrated Historic Resources Alternative
Table 7-1 Summary of Proposed Project and Alternatives
Topic Proposed Project No Project Alternative Integrated Historic Resources
Alternative 5.1. Air Quality
Short-Term Construction LTS/MM - - Long-Term Operation LTS = +
5.2. Biological Resources LTS/MM - = 5.3. Cultural Resources SU/MM - - 5.4. Greenhouse Gas Emissions LTS - = 5.5 Noise
Short-Term Construction LTS/MM - - Long-Term Operation LTS - =
5.6 Transportation Short-Term Construction LTS - -
Long-Term Operation LTS + = 5.7 Tribal Cultural Resources LTS/MM - - Notes: NI: No Impact; LTS: Less Than Significant; LTS/MM: Less Than Significant with Incorporation of Mitigation Measure; SU: Significant and Unavoidable Even with
Incorporation of Mitigation Measure (-) The alternative would result in less of an impact than the proposed project. (+) The alternative would result in more of an impact than the proposed project. (=) The alternative would result in the same or similar impact as the proposed project.
“Among the factors that may be used to eliminate alternatives from detailed consideration in an EIR are: (i) failure to meet most of the basic project objectives, (ii) infeasibility, or (iii) inability to avoid significant environmental impacts” (CEQA Guidelines § 15126.6[c]). Table 7-2, Ability of Each Alternative to Meet the Project Objectives, identifies the ability of the proposed project and each alternative to achieve project objectives, and the ability to avoid significant impact. As shown, the proposed project achieves all project objectives, but would create a significant and unavoidable cultural resources impact. The No Project Alternative would not create a significant environmental impact, but none of the project objectives would be achieved under this alternative

R A N C H O C U C A M O N G A C A M P U S M A S T E R P L A N D R A F T E I R C H A F F E Y C O M M U N I T Y C O L L E G E D I S T R I C T
7. Alternatives to the Proposed Project
Page 7-10 PlaceWorks
as described in Section 7.4.8. The Integrated Historic Resources Alternative would not create a significant environmental impact, but only partially achieve the listed project objectives as described in Section 7.5.8.
Table 7-2 Ability of Each Alternative to Meet the Project Objectives
Objective Proposed Project Alternative 1: No
Project Alternative
Alternative 2: Integrated Historic Resources
Alternative 1. Provide for the development of the site consistent with
Vision 2025 Facilities Master Plan and Addendum. Yes No Partially
2. Update and modernize existing building space to meet the District’s instructional needs. Yes No Partially
3. Construct new buildings to meet current and future instructional and technology needs and the District’s academic mission.
Yes No Partially
4. Increase academic square foot efficiency through renovation and construction of new buildings and facilities to maximize functional space.
Yes No Partially
5. Implement health and safety repairs, energy-efficient enhancements, water conservation, Americans with Disabilities Act (ADA) access, building security, National Fire Protection Association Life Safety Code requirement upgrades, a mass communication system, lock-down capabilities, and other needed facility renovations.
Yes No Partially
6. Renovate existing facilities to maximize functional space, eliminate nonfunctional space, and improve efficiency/utilization of existing facilities.
Yes No Yes
Ability to avoid significant impact: Cultural Resources
No Yes Yes

April 2022 Page 8-1
8. Impacts Found Not to Be Significant California Public Resources Code § 21003 (f) states: “…it is the policy of the state that…[a]ll persons and public agencies involved in the environmental review process be responsible for carrying out the process in the most efficient, expeditious manner in order to conserve the available financial, governmental, physical, and social resources with the objective that those resources may be better applied toward the mitigation of actual significant effects on the environment.” This policy is reflected in the California Environmental Quality Act Guidelines (CEQA Guidelines) § 15126.2(a), which states that “[a]n EIR [environmental impact report] shall identify and focus on the significant environmental impacts of the proposed project” and § 15143, which states that “[t]he EIR shall focus on the significant effects on the environment.” Guidelines § 15128 requires that an EIR contain a statement briefly indicating the reasons that various possible significant effects of a project were determined not to be significant and were therefore not discussed in detail in the Draft EIR (Chapter 5).
This chapter includes the analysis for the environmental topics where the project would have either no impact or a less than significant impact, as shown below.
Aesthetics Hydrology & Water Quality Recreation
Agriculture & Forestry Resources Land Use & Planning Tribal Cultural Resources
Energy Mineral Resources Utilities & Service Systems
Geology & Soils Population & Housing Wildfire
Hazards & Hazardous Materials Public Services
The following seven topics are analyzed in Chapter 5 of this EIR.
Air Quality Greenhouse Gas Emissions Transportation
Biological Resources Noise Tribal Cultural Resources
Cultural Resources
8.1 AESTHETICS Except as provided in Public Resources Code Section 21099, would the project:
a) Have a substantial adverse effect on a scenic vista?
Less than Significant Impact. Vistas provide visual access or panoramic views to a large geographic area. The field of view from a vista location can be wide and extend into the distance. Panoramic views are usually

R A N C H O C U C A M O N G A C A M P U S M A S T E R P L A N D R A F T E I R C H A F F E Y C O M M U N I T Y C O L L E G E D I S T R I C T
8. Impacts Found Not to Be Significant
Page 8-2 PlaceWorks
associated with vantage points looking out over a section of urban or natural area that provides a geographic orientation not commonly available. Examples of panoramic views include an urban skyline, valley, mountain range, ocean, or other water bodies.
The project site is already developed as a college. There are no protected or designated scenic vistas on the campus or in the surrounding area. The new buildings and other improvements to the campus would be compatible with the current campus development and would not have an adverse effect on a scenic vista. Therefore, scenic vista impacts would be less than significant.
b) Substantially damage scenic resources, including, but not limited to, trees, rock outcroppings, and historic buildings within a state scenic highway?
No Impact. A highway is designated scenic by the California Department of Transportation (Caltrans) depending upon how much of the natural landscape can be seen by travelers, the scenic quality of the landscape, and the extent to which development intrudes upon a traveler's enjoyment of the view (Caltrans 2020a). There are no officially designated or eligible state scenic highways in Rancho Cucamonga (Caltrans 2020b). The closest official designated scenic highway is State Route 2 (SR-2), located approximately 17 miles northwest of the campus. SR-2 is designated from 2.7 miles north of the SR-210 at La Canada Flintridge to the San Bernardino County Line. There is one officially designated State scenic highway in San Bernardino County: SR-38 is 42 miles east and is designated from east of South Fork Campground to 2.9 miles south of State Route 18 at State Line. The campus is not visible from any Eligible State Scenic Highways or County Scenic Highways. The closest eligible state scenic highway is State Route 138, approximately 12.5 miles northeast. The campus improvements would not damage scenic resources within a state scenic highway. No impacts would occur.
c) In nonurbanized areas, substantially degrade the existing visual character or quality of public views of the site and its surroundings? (Public views are those that are experienced from publicly accessible vantage point). If the project is in an urbanized area, would the project conflict with applicable zoning and other regulations governing scenic quality?
Less Than Significant Impact. The community college campus is in an area that qualifies as an “urbanized area.” PRC Section 21071 and CEQA Guidelines Section 15191 defines the “urbanized area” as an area of an incorporated city that either by itself or in combination with two contiguous incorporated cities has a population of at least 100,000 persons. The City of Rancho Cucamonga had a population of about 174,453 in 2020 (Census 2020). The campus has three parcels (APNs 0201-191-15, -32 and -29) zoned School (S). The proposed facilities would be typical of a community college campus and would not be inconsistent or out of scale with the other school facilities. Chaffey College was founded in 1960 and has been a part of the community for over 60 years. The improvements would be constructed within the confines of the existing campus, and no new property would be acquired. The project would not conflict with residential zoning or regulations governing scenic quality. Impacts would be less than significant.

R A N C H O C U C A M O N G A C A M P U S M A S T E R P L A N D R A F T E I R C H A F F E Y C O M M U N I T Y C O L L E G E D I S T R I C T
8. Impacts Found Not to Be Significant
April 2022 Page 8-3
d) Create a new source of substantial light or glare, which would adversely affect day or nighttime views in the area?
Less Than Significant Impact. The two major causes of light pollution are spill light and glare. Spill light is caused by misdirected light that illuminates areas outside the area intended to be lit. Glare occurs when a bright object is against (or reflects off) a dark background or shiny surface.
The campus is surrounded by residential and instructional uses and vacant land. The existing campus generates nighttime light from parking lot, building lights (interior and exterior), and athletic fields. Surrounding land uses also generate light from street lights and school parking lot, vehicle, and building lights.
The project would not significantly increase nighttime lighting in the area because the new buildings would replace existing buildings and would be on the interior of the campus. The new parking lot would have similar lighting to the existing lots. Furthermore, the project does not include any new sources of high-intensity nighttime lighting, such as stadium lights. All lights on new buildings and any new site lighting would be focused and directed onto the campus and would not spill light or glare off the campus. Light and glare impacts would be less than significant.
8.2 AGRICULTURE AND FORESTRY RESOURCES In determining whether impacts to agricultural resources are significant environmental effects, lead agencies may refer to the California Agricultural Land Evaluation and Site Assessment Model (1997) prepared by the California Dept. of Conservation as an optional model to use in assessing impacts on agriculture and farmland. In determining whether impacts to forest resources, including timberland, are significant environmental effects, lead agencies may refer to information compiled by the California Department of Forestry and Fire Protection regarding the state’s inventory of forest land, including the Forest and Range Assessment Project and the Forest Legacy Assessment project; and forest carbon measurement methodology provided in Forest Protocols adopted by the California Air Resources Board. Would the project:
a) Convert Prime Farmland, Unique Farmland, or Farmland of Statewide Importance (Farmland), as shown on the maps prepared pursuant to the Farmland Mapping and Monitoring Program of the California Resources Agency, to non-agricultural use?
No Impact. The project would not convert farmland to nonagricultural uses. There is no agricultural or farm use on or in the vicinity of the campus; therefore, no project-related farmland conversion would occur. The campus is fully developed and is mapped as Urban and Built-up Land (DLRP 2016). No impact would occur.
b) Conflict with existing zoning for agricultural use, or a Williamson Act contract?
No Impact. The California Land Conservation Act of 1965 (Williamson Act) enables counties and cities to designate agricultural preserves and offer preferential taxation based on a property’s agricultural-use value rather than on its market value. In return for the preferential tax rate, the landowner is required to sign a contract with the county or city in which the landowner agrees not to develop the land for a minimum 10-year period. There are no areas in the city that area zoned for agricultural use. The City of Rancho Cucamonga zoning for the

R A N C H O C U C A M O N G A C A M P U S M A S T E R P L A N D R A F T E I R C H A F F E Y C O M M U N I T Y C O L L E G E D I S T R I C T
8. Impacts Found Not to Be Significant
Page 8-4 PlaceWorks
campus is School (S). The college is not used for agricultural purposes and is not bound by a Williamson Act contract (Rancho Cucamonga 2021b). No impact would occur.
c) Conflict with existing zoning for, or cause rezoning of, forest land (as defined in Public Resources Code Section 12220(g)), timberland (as defined by Public Resources Code Section 4526), or timberland zoned Timberland Production (as defined by Government Code Section 51104(g))?
No Impact. Project development would not conflict with existing zoning for forest land, timberland, or timberland production. Forest land is defined as “land that can support 10-percent native tree cover of any species, including hardwoods, under natural conditions, and that allows for management of one or more forest resources, including timber, aesthetics, fish and wildlife, biodiversity, water quality, recreation, and other public benefits” (PRC Section 12220). Timberland is defined as “land…which is available for, and capable of, growing a crop of trees of any commercial species used to produce lumber and other forest products, including Christmas trees” (PRC Section 4526). The college campus is zoned School (S); it is not zoned for forest land or timberland use. No impact would occur.
d) Result in the loss of forest land or conversion of forest land to non-forest use?
No Impact. Construction of the project would not result in the loss or conversion of forest land. No vegetation on-site is cultivated for forest resources. Vegetation is limited to ornamental trees, shrubs, and turf. No forest land would be affected by the project. No impact would occur.
e) Involve other changes in the existing environment which, due to their location or nature, could result in conversion of Farmland, to non-agricultural use or conversion of forest land to non-forest use?
No Impact. There is no mapped important farmland or forest land on and near the campus, and project development would not indirectly cause conversion of such land to nonagricultural or nonforest use. No impact would occur.
8.3 ENERGY Would the project:
a) Result in potentially significant environmental impact due to wasteful, inefficient, or unnecessary consumption of energy resources, during project construction or operation?
Less than Significant Impact. The project would result in short‐term construction and long‐term operational energy consumption.
Short‐Term Construction
Construction of the project would require energy use to power the construction equipment. The energy use would vary during different phases of construction—the majority of construction equipment during demolition and grading would be gas powered or diesel powered, and the later construction phases would

R A N C H O C U C A M O N G A C A M P U S M A S T E R P L A N D R A F T E I R C H A F F E Y C O M M U N I T Y C O L L E G E D I S T R I C T
8. Impacts Found Not to Be Significant
April 2022 Page 8-5
require electricity-powered equipment for interior construction and architectural coatings. Transportation energy use depends on the type and number of trips, vehicle miles traveled, fuel efficiency of vehicles, and travel mode. Transportation energy use during construction would come from the transport and use of construction equipment, delivery vehicles and haul trucks, and construction employee vehicles that would use diesel fuel and/or gasoline.
Construction activities would be subject to applicable regulations such as anti‐idling measures and limits on duration of activities, thereby reducing energy consumption. For example, to limit wasteful and unnecessary energy consumption from transportation, the construction contractors would minimize nonessential idling of construction equipment during construction in accordance with Section 2449 of the California Code of Regulations, Title 13, Article 4.8, Chapter 9, which limits nonessential idling of diesel-powered off-road equipment to five minutes (also see PPP AIR-3 and PPP GHG-4). There are no aspects of the project that would foreseeably result in the inefficient, wasteful, or unnecessary consumption of energy during construction activities. For example, there are no unusual characteristics that would directly or indirectly cause construction activities to be any less efficient than would occur elsewhere (restrictions on equipment, labor, types of activities, etc.). The project would not result in the inefficient, wasteful, or unnecessary consumption of energy during construction activities.
Long‐Term Operation
The project site is already developed as a community college and consumes electrical and gas energy. Operation of the new buildings would not generate a significant increase in the demand for electricity or natural gas compared to existing conditions. During operation, energy is used for heating, cooling, and ventilation of buildings; water heating; equipment; appliances; indoor, outdoor, perimeter, and parking lot lighting; and security systems.
California's Building Energy Efficiency Standards are updated on an approximately three-year cycle to incorporate new energy efficiency technologies. The 2019 Building Energy Efficiency Standards were adopted on May 9, 2018, and went into effect for new construction starting January 1, 2020. The 2019 standards focus on four key areas: 1) smart residential photovoltaic systems; 2) updated thermal envelope standards (preventing heat transfer from the interior to exterior and vice versa); 3) residential and nonresidential ventilation requirements; 4) and nonresidential lighting requirements (CEC 2018a). Furthermore, on August 11, 2021, the CEC adopted the 2022 Building Energy Efficiency Standards, which were subsequently approved by the California Building Standards Commission in December 2021. The 2022 standards become effective and replace the existing 2019 standards on January 1, 2023. The 2022 standards would require mixed-fuel single-family homes to be electric-ready to accommodate replacement of gas appliances with electric appliances. In addition, the new standards also include prescriptive photovoltaic system and battery requirements for high rise multi-family buildings (i.e., more than three stories) and noncommercial buildings such as hotels, offices, medical offices, restaurants, retail stores, schools, warehouses, theaters, and convention centers (CEC 2021). Overall, the new proposed campus buildings would be more energy efficient than the existing buildings designated for demolition. Furthermore, the proposed renovations under the proposed project include energy retrofits to some of the existing buildings to increase energy efficiency, expansion of the solar photovoltaic system, and installation of battery storage to increase renewable energy use.

R A N C H O C U C A M O N G A C A M P U S M A S T E R P L A N D R A F T E I R C H A F F E Y C O M M U N I T Y C O L L E G E D I S T R I C T
8. Impacts Found Not to Be Significant
Page 8-6 PlaceWorks
The project would not result in inefficient, wasteful, and unnecessary consumption of energy during construction or operation. Impacts would be less than significant.
b) Conflict with or obstruct a state or local plan for renewable energy or energy efficiency?
Less Than Significant Impact. The state’s electricity grid is transitioning to renewable energy under California’s Renewable Energy Program. Renewable sources of electricity include wind, small hydropower, solar, geothermal, biomass, and biogas. Electricity production from renewable sources is generally considered carbon neutral. Executive Order S-14-08, signed in November 2008, expanded the state’s renewable portfolios standard (RPS) to 33 percent renewable power by 2020. This standard was adopted by the legislature in 2011 (SB X1-2). Senate Bill 350 (de Leon) was signed into law September 2015 and established tiered increases to the RPS—40 percent by 2024, 45 percent by 2027, and 50 percent by 2030. Senate Bill 350 also set a new goal to double the energy-efficiency savings in electricity and natural gas through energy efficiency and conservation measures. On September 10, 2018, Governor Brown signed Senate Bill 100 (SB 100), which raised California’s RPS requirements to 60 percent by 2030, with interim targets, and 100 percent by 2045. The bill also established a state policy that eligible renewable energy resources and zero-carbon resources supply 100 percent of all retail sales of electricity to California end-use customers and 100 percent of electricity procured to serve all state agencies by December 31, 2045. Under SB 100 the state cannot increase carbon emissions elsewhere in the western grid or allow resource shuffling to achieve the 100 percent carbon-free electricity target.
The statewide RPS goal is not directly applicable to individual development projects, but to utilities and energy providers such as Southern California Edison (SCE), which is the utility that would provide all of electricity needs for the proposed project. Compliance of SCE in meeting the RPS goals would ensure the State meets its objective for transitioning to renewable energy. As stated above, the proposed project would expand the renewable energy infrastructure of the campus. Additionally, the new buildings would be significantly more energy efficient than the existing buildings on campus. The project would be reviewed by the Division of the State Architect (DSA) for compliance with design and construction and energy compliance, and it would not conflict with state or local plans for renewable energy or energy efficiency. Impacts would be less than significant.
8.4 GEOLOGY AND SOILS Would the project:
a) Directly or indirectly cause potential substantial adverse effects, including the risk of loss, injury, or death involving:
i) Rupture of a known earthquake fault, as delineated on the most recent Alquist-Priolo Earthquake Fault Zoning map, issued by the State Geologist for the area or based on other substantial evidence of a known fault? Refer to Division of Mines and Geology Special Publication 42.
No Impact. The Alquist-Priolo Earthquake Fault Zoning Act was passed in 1972 to mitigate the hazards of surface faulting and fault rupture on habitable buildings. Fault rupture generally occurs within 50 feet of

R A N C H O C U C A M O N G A C A M P U S M A S T E R P L A N D R A F T E I R C H A F F E Y C O M M U N I T Y C O L L E G E D I S T R I C T
8. Impacts Found Not to Be Significant
April 2022 Page 8-7
an active fault line and is limited to the immediate area of the fault. Active earthquake faults are faults where surface rupture has occurred within the last 11,000 years.
The college campus does not lie within or immediately adjacent to a fault-rupture hazard zone as defined by the Alquist-Priolo Earthquake Fault Zoning Act. The nearest Alquist-Priolo Earthquake Fault Zone is the Cucamonga fault zone, approximately 1.2 miles north of the campus (Rancho Cucamonga 2021b). No impact would occur.
ii) Strong seismic ground shaking?
Less Than Significant Impact. The project would not increase exposure of people or structures to earthquake impacts. Southern California is a seismically active region. Impacts from ground shaking could occur many miles from an earthquake epicenter. The potential severity of ground shaking depends on many factors, including the distance from the originating fault, the earthquake magnitude, and the nature of the earth materials beneath a given site. There are several known faults in the Rancho Cucamonga region. The Red Hill Fault is about 0.8 mile to the south, and there are several faults in the San Gabriel Mountains to the north of the campus (CGS 2020).
The new buildings would be designed in accordance with the California Building Code, and reviewed and approved by the DSA for compliance with design and construction and accessibility standards and codes, including seismic requirements. The District, with oversight from DSA, would comply with these requirements in the design and construction of the new buildings. Seismic ground shaking impacts would be less than significant.
iii) Seismic-related ground failure, including liquefaction?
Less Than Significant Impact. Liquefaction refers to loose, saturated sand or gravel deposits that lose their load-supporting capability when subjected to intense shaking. Liquefaction potential varies based upon three main contributing factors: 1) cohesionless, granular soils having relatively low densities (usually of Holocene age); 2) shallow groundwater (generally less than 50 feet); and 3) moderate to high seismic ground shaking. The project site is not identified as having potential liquefaction hazard by the Safety Element of the City’s General Plan (Rancho Cucamonga 2020a). Additionally, the proposed project would be construction in compliance with the California Building Code and DSA standards for seismic safety. Therefore, impacts related to seismic-related ground failure would be less than significant.
iv) Landslides?
Less Than Significant Impact. Landslides are a type of erosion in which masses of earth and rock move downslope as a single unit. Susceptibility of slopes to landslides and lurching (earth movement at right angles to a cliff or steep slope during ground shaking) depend on several factors, which are usually present in combination—steep slopes, condition of rock and soil materials, the presence of water, formational contacts, geologic shear zones, and seismic activity.
The project site is not identified as having potential earthquake-induced landslide hazards by the Safety Element of the City’s General Plan (Rancho Cucamonga 2020a). The relatively flat topography at the

R A N C H O C U C A M O N G A C A M P U S M A S T E R P L A N D R A F T E I R C H A F F E Y C O M M U N I T Y C O L L E G E D I S T R I C T
8. Impacts Found Not to Be Significant
Page 8-8 PlaceWorks
campus also precludes stability problems. The project site is relatively flat with a slight slope across the site, with elevations from 1,642 feet above mean sea level in the southwest to 1,804 feet in the northeast (USGS 2021). Therefore, the site is not considered susceptible to seismically induced landslides. The project would not expose people or the new school buildings to adverse effects from landslides. Landslide impacts would be less than significant.
b) Result in substantial soil erosion or the loss of topsoil?
Less Than Significant Impact.
Construction Phase
Erosion is a normal and inevitable geologic process whereby earthen materials are loosened, worn away, decomposed or dissolved, and moved from one place to another. Precipitation, running water, waves, and wind are all agents of erosion. Ordinarily, erosion proceeds imperceptibly, but when the natural equilibrium of the environment is changed, the rate of erosion can be greatly accelerated. This can create aesthetic as well as engineering problems on undeveloped sites. Accelerated erosion in an urban area can cause damage by undermining structures; blocking storm drains; and depositing silt, sand, or mud on roads and in tunnels. Eroded materials can eventually be deposited in local waters, where the carried silt remains suspended in the water for some time, constituting a pollutant and altering the normal balance of plant and animal life.
Project-related construction activities would expose soil through excavation, grading, and trenching, and thus could cause erosion during heavy winds or rain storms. Construction projects of one acre or more are regulated under the National Pollutant Discharge Elimination System (NPDES) General Permit for Storm Water Discharges Associated with Construction and Land Disturbance Activities (Order No. 2012-0006-DWQ) issued by the State Water Resources Control Board. The District is required to obtain coverage by preparing and implementing a Stormwater Pollution Prevention Plan (SWPPP), estimating sediment risk from construction activities to receiving waters, and specifying best management practices (BMP) that would be incorporated into the construction plan to minimize stormwater pollution. Categories of BMPs used in SWPPPs are described in Table 8-1. The project consists of demolition, construction, and renovation of buildings and campus facilities, on the 200-acre campus; thus, construction would be subject to the Statewide Construction General Permit and implementation of BMPs specified in the SWPPP. Construction-phase soil erosion impacts would be less than significant.

R A N C H O C U C A M O N G A C A M P U S M A S T E R P L A N D R A F T E I R C H A F F E Y C O M M U N I T Y C O L L E G E D I S T R I C T
8. Impacts Found Not to Be Significant
April 2022 Page 8-9
Operational Phase
After completion of the project, ground surfaces would be either asphalt parking lot, hardscape, buildings, or maintained landscaping and turf fields, and no large areas of exposed soil would be left to erode. The new buildings and other campus improvements would not cause an increase in erosion of soils off campus. Operational-phase soil erosion impacts would be less than significant.
c) Be located on a geologic unit or soil that is unstable, or that would become unstable as a result of the project, and potentially result in on- or off-site landslide, lateral spreading, subsidence, liquefaction, or collapse?
Less Than Significant Impact. Hazards arising from liquefaction and landslides would be less than significant, as discussed above in Sections 3.7.a (iii) and (iv).
Table 8-1 Construction BMPs Category Purpose Examples
Erosion Controls and Wind Erosion Controls
• Use project scheduling and planning to reduce soil or vegetation disturbance (particularly during the rainy season)
• Prevent or reduce erosion potential by diverting or controlling drainage
• Prepare and stabilize disturbed soil areas
Scheduling, preservation of existing vegetation, hydraulic mulch, hydroseeding, soil binders, straw mulch, geotextile and mats, wood mulching, earth dikes and drainage swales, velocity dissipation devices, slope drains, streambank stabilization, compost blankets, soil preparation/roughening, and non-vegetative stabilization
Sediment Controls • Filter out soil particles that have been detached and transported in water
Silt fence, sediment basin, sediment trap, check dam, fiber rolls, gravel bag berm, street sweeping and vacuuming, sandbag barrier, straw bale barrier, storm drain inlet protection, manufactured linear sediment controls, compost socks and berms, and biofilter bags.
Tracking Controls • Minimize the tracking of soil off-site by vehicles. Stabilized construction roadways and construction entrances/exits; entrance/outlet tire wash.
Non-storm Water Management Controls
• Prohibit discharge of materials other than stormwater, such as discharges from the cleaning, maintenance, and fueling of vehicles and equipment
• Conduct various construction operations, including paving, grinding, and concrete curing and finishing, in ways that minimize non-stormwater discharges and contamination of any such discharges
Water conservation practices, temporary stream crossings, clear water diversions, illicit connection/discharge, potable and irrigation water management, and the proper management of the following operations: paving and grinding, dewatering, vehicle and equipment cleaning, fueling and maintenance, pile driving, concrete curing, concrete finishing, demolition adjacent to water, material over water, and temporary batch plants.
Waste Management and Controls (i.e., good housekeeping practices)
• Management of materials and wastes to avoid contamination of stormwater.
Stockpile management, spill prevention and control, solid waste management, hazardous waste management, contaminated soil management, concrete waste management, sanitary/septic waste management, liquid waste management, and management of material delivery storage and use.
Source: California Stormwater Quality Association (CASQA), California Construction Best Management Practices Handbook, January 2015.

R A N C H O C U C A M O N G A C A M P U S M A S T E R P L A N D R A F T E I R C H A F F E Y C O M M U N I T Y C O L L E G E D I S T R I C T
8. Impacts Found Not to Be Significant
Page 8-10 PlaceWorks
Lateral spreading. Lateral spreading is the downslope movement of surface sediment due to liquefaction in a subsurface layer. The campus is not prone to lateral spreading because near-surface site sediments are not prone to liquefaction.
Subsidence. The major cause of ground subsidence is withdrawal of groundwater. The project would not withdraw groundwater. Project would not result in significant hazards to people or structures due to ground subsidence, and impacts would be less than significant.
Seismically Induced Settlement. In contrast to liquefaction, which occurs in saturated sand or gravel, seismically induced settlement occurs in dry sands and is often caused by loose to medium-dense granular soils densified during ground shaking. Most of the City is susceptible to some degree of seismic settlement, as the alluvial fans underlying much of the City are of low density. However, as past earthquakes have shown, seismic settlement is primarily damaging in areas subject to differential settlement. In the city, differential settlement is most likely to occur at the base of the San Gabriel Mountains. The campus is not at the base of the San Gabriel Mountains and is underlain by stony loamy sand which are excessively drained and highly permeable, and is not of loose to medium-dense granular soils (Rancho Cucamonga 2022b; WSS 2022). Therefore, the potential for settlement is low at the project site. Additionally, the District would comply with a final, engineering-level geotechnical report for proper engineering design, and construction in conformance with current building codes and engineering practices to minimize hazards to people and structures arising from seismically induced settlement. Project development would not subject people or structures to substantial hazards arising from seismic settlement, and impacts would be less than significant.
Compressible and Collapsible Soils. Soil compressibility refers to a soil’s potential for settlement when subjected to increased loads, as from a fill surcharge or a structure. Collapsible soils are typically geologically young, unconsolidated sediments of low density that may compress under the weight of structures. The campus is underlain by stony loamy sand that is of medium to high density, is not highly compressible or collapsible. During the development of the campus, the campus has been constructed with stable fill material. Therefore, the campus has a low risk of collapse.
As part of the DSA review process for the proposed project, the District is required to comply with a final, engineering-level geotechnical report and will include identification of site preparation, specific locations and methods for fill placement, temporary shoring, groundwater seismic design features, excavation stability, foundations, soil stabilization, establishment of any deep foundations, concrete slabs and pavements, surface drainage, cement type and corrosion measures, erosion control, shoring and internal bracing, and plan review.
The project design and construction would incorporate all recommended measures in the engineering-level geotechnical report to ensure that safety is not compromised, as required by existing regulations. Compliance with recommendations of the geotechnical investigation would minimize hazards from unstable soils, and impacts would be less than significant.

R A N C H O C U C A M O N G A C A M P U S M A S T E R P L A N D R A F T E I R C H A F F E Y C O M M U N I T Y C O L L E G E D I S T R I C T
8. Impacts Found Not to Be Significant
April 2022 Page 8-11
d) Be located on expansive soil, as defined in Table 18-1-B of the Uniform Building Code (1994), creating substantial direct or indirect risks to life or property?
Less Than Significant Impact. Expansive soils possess clay particles that react to moisture changes by shrinking when dry or swelling when wet. These soils have the potential to crack building foundations and, in some cases, structurally distress the buildings themselves. Minor-to-severe damage to overlying structures is possible.
The campus is underlain by stony loamy sand that are excessively drained and highly permeable. Runoff on these soils is slow and erosion hazard is slight. These soils have low shrink-swell potential (Rancho Cucamonga 2022b). Therefore, the project would not expose people or the new school buildings to significant adverse effects associated with expansive soils. Impacts would be less than significant.
e) Have soils incapable of adequately supporting the use of septic tanks or alternative waste water disposal systems where sewers are not available for the disposal of waste water?
No Impact. The existing campus does not use septic tanks or other alternative wastewater disposal systems. No impact would occur.
f) Directly or indirectly destroy a unique paleontological resource or site or unique geologic feature?
Less Than Significant Impact. Paleontological resources are the fossilized remains of organisms from prehistoric environments found in geologic strata. These are valued for the information they yield about the history of the earth and its past ecological settings. There are two types of resources: vertebrate and invertebrate. These resources are found in geologic strata conducive to their preservation, typically sedimentary formations. Paleontological sites are areas that show evidence of prehuman activity. Potentially sensitive areas for the presence of paleontological resources are based on the underlying geologic formation. The project site is mapped as late Holocene (Qyf4), young deposits of alluvial fans, composed of unconsolidated to slightly consolidated sand and pebble-boulder gravel (Morton and Miller 2006). Holocene is the current geologic epoch, which began approximately 11,000 years ago. The City of Rancho Cucamonga General Plan indicates that soils and geologic formation within the city’s planning area have a low potential to contain significant paleontological resources (Rancho Cucamonga 2021). A records search was conducted by the Los Angeles County Natural History Museum (NHM) and indicated that no fossil localities have been identified directly beneath the project site. The NHM records search result is in Appendix I to this DEIR. NHM stated that there are fossil localities nearby from the same sedimentary deposits as in the project area, but the nearest fossil locality is over 13 miles southwest of the project site in Chino, and the localities were found in Pleistocene-age alluvial deposits. Distances from the project site to other four localities range from 14 to 20 miles. Furthermore, Late Pleistocene to Holocene young alluvial fan deposits less than eight feet below the modern surface have a low potential for fossils. The project site has been previously developed, and project excavation for building foundation is not anticipated to be deeper than six feet. Therefore, the potential for discovering paleontological resources within the project during construction would be low, and impacts would be less than significant.

R A N C H O C U C A M O N G A C A M P U S M A S T E R P L A N D R A F T E I R C H A F F E Y C O M M U N I T Y C O L L E G E D I S T R I C T
8. Impacts Found Not to Be Significant
Page 8-12 PlaceWorks
8.5 HAZARDS AND HAZARDOUS MATERIALS Would the project:
a) Create a significant hazard to the public or the environment through the routine transport, use or disposal of hazardous materials?
Less Than Significant Impact. Construction of the proposed project would likely involve the use of some hazardous materials, such as vehicle fuels, lubricants, greases, and transmission fluids in construction equipment, and paints and coatings in building construction. However, the project site is developed and operating as a community college, and no significant hazardous materials are being used or stored that would be removed during construction. No routine transport, use, or disposal of hazardous materials currently occurs on-site, and no new or expanded handling of hazardous materials would result from project implementation.
Operation of the project would involve the use of small amounts of hazardous materials for cleaning and maintenance purposes typical of janitorial staff, and pesticides by college maintenance staff. The use, storage, transport, and disposal of hazardous materials by college staff is ongoing, and the District complies with existing regulations of several agencies, including the Department of Toxic Substances Control, US Environmental Protection Agency, Occupational Safety and Health Administration, and the Rancho Cucamonga Fire Protection District. Impacts would be less than significant.
b) Create a significant hazard to the public or the environment through reasonably foreseeable upset and accident conditions involving the release of hazardous materials into the environment?
Less Than Significant Impact. Very little has changed in the surrounding area, and the campus improvements would not place students closer to hazards.
The use, handling, storage, and disposal of hazardous materials in the course of project construction and operation would not pose a substantial hazard to the public or the environment from reasonably foreseeable accidental release. Compliance with the previously discussed regulations is already standard practice at the campus, including training administrators and staff to safely contain and clean up hazardous materials spills; maintenance of hazardous materials spill containment and cleanup supplies on-site; implementing evacuation procedures as needed; and contacting the appropriate hazardous materials emergency response agency immediately pursuant to requirements of regulatory agencies. Impacts from reasonably foreseeable upset and accident conditions would be less than significant.
Long-term operation of the project would involve very little transport, use, or disposal of any hazardous materials, especially since it is an improvement and modernization of the existing community college. The types of hazardous materials associated with operation of the project would generally be limited to those associated with janitorial, maintenance, and repair activities, such as commercial cleaners, solvents, lubricants, paints, etc. Additionally, certain academic courses may involve small quantities of chemicals, solvents, and paints. These materials would be used in small quantities and would be stored in compliance with established federal, state, and local health and safety requirements.

R A N C H O C U C A M O N G A C A M P U S M A S T E R P L A N D R A F T E I R C H A F F E Y C O M M U N I T Y C O L L E G E D I S T R I C T
8. Impacts Found Not to Be Significant
April 2022 Page 8-13
Therefore, the potential for the project’s operation to result in a release, accidental or otherwise, of any hazardous materials into the environment is considered less than significant.
c) Emit hazardous emissions or handle hazardous or acutely hazardous materials, substances, or waste within one-quarter mile of an existing or proposed school?
Less Than Significant Impact. Banyan Elementary School is within 0.25 mile to the south of the college campus. The project would not emit hazardous emissions or handle significant quantities of hazardous or acutely hazardous materials, substances, or waste. Hazardous materials expected at the existing campus would be associated with janitorial, maintenance, and repair activities. These materials would be used in small quantities and would be stored in compliance with established state and federal requirements. Additionally, construction materials and site cleanup would comply with existing regulations. Operation of construction equipment and heavy trucks during project construction would generate diesel emissions, which could be considered hazardous; however, as discussed in Section 5.1, Air Quality, Impact 5.1-2, Impact 5.1-3, and Impact 5.1-4, construction activities associated with the proposed project would result in less than significant construction criteria air pollutants impacts with incorporation of mitigation measures AQ-1 through AQ-3. Additionally, as discussed in Impact 5.1-5, the construction of the proposed project would not result in significant health risk impact to Banyan Elementary School based on a construction health risk assessment prepared for the project (see Appendix C). Health risk was modeled based on the conservative assumption that exposure is a 24-hour per day outdoor exposure and averaged over a 70-year lifetime. Exposure to diesel exhaust during the construction period would not pose substantial hazards to persons at Banyan Elementary School or the students and staff at Chaffey College. Impacts would be less than significant.
d) Be located on a site which is included on a list of hazardous materials sites compiled pursuant to Government code Section 65962.5 and, as a result, would it create a significant hazard to the public or the environment?
Less Than Significant Impact. California Government Code Section 65962.5 requires the California Environmental Protection Agency to compile a list (updated at least annually) of hazardous waste and substances release sites, known as the Cortese List or California Superfund. The list includes hazardous waste facilities; hazardous waste discharges for which the State Water Quality Control Board has issued certain types of orders; public drinking water wells with detectable levels of organic contaminants; underground storage tanks with reported unauthorized releases; and solid waste disposal facilities from which hazardous waste has migrated.
Five environmental databases were searched for hazardous materials sites on the school campus and within a 2,000-foot radius of the center of the main campus:
GeoTracker. State Water Resources Control Board (SWRCB 2020)
EnviroStor. Department of Toxic Substances Control (DTSC 2020 EJScreen. US Environmental Protection Agency (USEPA 2020a).
EnviroMapper. US Environmental Protection Agency (USEPA 2020b).

R A N C H O C U C A M O N G A C A M P U S M A S T E R P L A N D R A F T E I R C H A F F E Y C O M M U N I T Y C O L L E G E D I S T R I C T
8. Impacts Found Not to Be Significant
Page 8-14 PlaceWorks
Solid Waste Information System (SWIS). California Department of Resources Recovery and Recycling (SWIS 2020).
The school campus and its surroundings is not on any of the databases. The project would not create a hazard to the public because of a hazardous materials site pursuant to Government Code Section 65962.5.
e) For a project located within an airport land use plan or, where such a plan has not been adopted, within two miles or a public airport or public use airport, would the project result in a safety hazard or excessive noise for people residing or working in the project area?
No Impact. The campus is not in an airport land use plan area or within two miles of an airport. The project would not expose people residing or working in the project area to hazards. No impact would occur.
f) Impair implementation of or physically interfere with an adopted emergency response plan or emergency evacuation plan?
Less Than Significant Impact. The District maintains and implements the emergency evacuation plan for Chaffey College (CCCD 2020). The project would not interfere with implementation of the evacuation plan. All staging of construction equipment and materials would be off public roadways and fire access routes. Additionally, the proposed project does not involve any off-site improvements that could impair implementation of the City’s emergency response plan or emergency evacuation plan. Impacts would be less than significant.
g) Expose people or structures, either directly or indirectly, to a significant risk of loss, injury or death involving wildland fires?
Less Than Significant Impact. A small area near the southeast corner of the football practice field is in a very high fire hazard severity zone (FHSZ) (Rancho Cucamonga 2022b). However, the proposed project would not change the existing boundary of the college campus and would not involve any actions changing the safety hazards involving wildland fires. There are no significant areas of wildland brush, grass, trees, or other natural fuel sources surrounding the on-site very high FHSZ area that may present a significant fire hazard. Changes to the existing campus would not expose people or structures to a significant risk of loss, injury, or death involving wildland fires. Impacts would be less than significant.
8.6 HYDROLOGY AND WATER QUALITY Would the project:
a) Violate any water quality standards or waste discharge requirements or otherwise substantially degrade surface or ground water quality?
Less Than Significant Impact. A significant impact would occur if the project discharges water that does not meet the quality standards of agencies that regulate surface water quality and water discharge into stormwater drainage systems. A significant impact would also occur if the project does not comply with surface water quality regulations as governed by the State Water Resources Control Board.
R A N C H O C U C A M O N G A C A M P U S M A S T E R P L A N D R A F T E I R C H A F F E Y C O M M U N I T Y C O L L E G E D I S T R I C T
8. Impacts Found Not to Be Significant
April 2022 Page 8-15
New construction projects can result in two types of water quality impacts: (1) short-term impacts from discharge of soil through erosion, sediments, and other pollutants during construction and (2) long-term impacts from impervious surfaces (buildings, roads, parking lots, and walkways) that prevent water from being absorbed into the ground, thereby increasing the pollutants in stormwater runoff. Impervious surfaces can increase the concentration of pollutants in stormwater runoff, such as oil, fertilizers, pesticides, trash, soil, and animal waste. Runoff from short-term construction and long-term operation can flow directly into lakes, local streams, channels, and storm drains and eventually be released untreated into the ocean.
The project site is already developed as a college campus and generates urban runoff. The project site is in the Cucamonga and Chino groundwater basins (SAWC 2022). No active groundwater wells are within the vicinity or within one mile of the campus (USGS 2021b). The campus improvements would not impact groundwater quality.
Construction Phase
Construction activities that disturb one or more acres of land must comply with the requirements of the SWRCB Construction General Permit (CGP; 2009-0009-DWQ) as amended by 2010-0014-DWQ and 2012-0006-DWQ. Under the terms of the permit, applicants must file Permit Registration Documents (PRD) with the SWRCB prior to the start of construction. The PRDs include a Notice of Intent, risk assessment, site map, SWPPP, annual fee, and a signed certification statement. Applicants must also demonstrate conformance with applicable BMPs and prepare a SWPPP containing a site map that shows the construction site perimeter, existing and proposed buildings, lots, roadways, stormwater collection and discharge points, general topography both before and after construction, and drainage patterns across the project site. The SWPPP must list BMPs that would be implemented to prevent soil erosion and discharge of other construction-related pollutants that could contaminate nearby water resources. The District’s required compliance with the CGP would ensure that water quality impacts during construction is less than significant.
Operation Phase
After completion of the project, similar to the existing conditions, ground surfaces at the campus would be either buildings, hardscape, parking lots, or maintained landscaping, and no large areas of exposed soil would be left to erode off the campus. Although detailed design drawings have not yet been developed, and specific site design and source control BMPs to be implemented during operational phase have not been selected at this phase of the planning process, it is anticipated that the following BMPs would be incorporated as appropriate to reduce operational water quality impacts.
Site Design BMPs: These may include, but are not limited to, maximizing pervious areas, minimizing directly connected impervious areas, use of onsite ponding areas (i.e., at-grade detention basins), constructing hardscape with permeable materials, and implementing hydrologically functional landscape design.
Incorporate trees, open space, and landscaping to mitigate urban heat island impacts. Include mostly native plants and drought-tolerant plants in landscaping plans. Use of effective irrigation systems to minimize water usage.

R A N C H O C U C A M O N G A C A M P U S M A S T E R P L A N D R A F T E I R C H A F F E Y C O M M U N I T Y C O L L E G E D I S T R I C T
8. Impacts Found Not to Be Significant
Page 8-16 PlaceWorks
Source Control BMPs: Source control BMPs effectively minimize the potential for typical urban pollutants to contact stormwater, thereby limiting water quality impacts downstream.
Educational materials related to urban runoff provided to all employees, students, and staff.
Inspection and maintenance of site BMPs, including catch basins, grate inlets, etc.
Provide storm drain stenciling or signage on all storm drain inlets and catch basins per City or County requirements, as applicable.
Properly design and inspect on a regular basis all trash storage areas, loading docks, outdoor storage areas, and outdoor work areas.
Treatment Control BMPs. Treatment control BMPs remove anticipated pollutants of concern from on-site runoff. They can be natural treatment systems such as vegetated swales, detention basins, and constructed wetlands or proprietary control measures. The existing campus has an existing retention basin at the northeast corner of the project site.
Furthermore, the proposed project would be required to comply with Chapter 19.20, Municipal Separate Storm Sewer System (MS4), of the Rancho Cucamonga Municipal Code, which is the City’s Stormwater and Urban Runoff Management and Discharge Ordinance. Chapter 19.20 requires that development and redevelopment projects greater than 5,000 square feet submit a water quality management plan that includes BMPs during construction and operational activities. Additionally, as part of the statewide mandate to reduce trash in receiving waters, the District would also be required to adhere to the requirements of the SWRCB Trash Amendments. The requirements include the installation and maintenance of full-capture trash-screening devices at curb inlets, grate inlets, and catch basin inlets. The trash screening devices must be certified by the SWRCB. With the implementation of BMP features and compliance with state, county, and local regulations and code requirements, the proposed project would have a less than significant water quality impact during the operational phase.
b) Substantially decrease groundwater supplies or interfere substantially with groundwater recharge such that the project may impede sustainable groundwater management of the basin?
Less than Significant Impact. The project site is in the Cucamonga and Chino Groundwater Basins. However, the project site is already developed as a college campus and the proposed project would not decrease groundwater supplies. The proposed project would result in a slight increase in water demand but would not involve the extraction or installation of any groundwater wells on the property. Construction and operation of the proposed project would not lower the groundwater table or deplete groundwater supplies. Furthermore, the college campus does not provide intentional groundwater recharge. Therefore, the project would not interfere with groundwater recharge. Impacts would be less than significant.

R A N C H O C U C A M O N G A C A M P U S M A S T E R P L A N D R A F T E I R C H A F F E Y C O M M U N I T Y C O L L E G E D I S T R I C T
8. Impacts Found Not to Be Significant
April 2022 Page 8-17
c) Substantially alter the existing drainage pattern of the site or area, including through the alteration of the course of a stream or river or through the addition of impervious surfaces, in a manner which would:
i) Result in a substantial erosion or siltation on- or off-site?
Less Than Significant Impact.
Construction Phase
During construction, erosion and siltation from the disturbed areas may occur. However, as previously stated in Section 8.6(a), the project would be required to submit PRDs and a SWPPP to the SWRCB for approval prior to the commencement of construction activities. The SWPPP would describe the BMPs to be implemented during the project’s construction activities, including:
Minimize disturbed areas of the site.
Preserve existing vegetation to the maximum extent practicable. Revegetate exposed areas as quickly as possible.
Install on-site sediment basins to prevent off-site migration of erodible materials, as needed.
Install velocity dissipation devices at outlets of sediment basins.
Implement dust control measures, such as silt fences and regular watering of areas.
Stabilize construction entrances/exits. Install storm drain inlet protection measures. Install sediment control measures along the site, such as silt fences or gravel bag barriers.
The required compliance with the CGP and implementation of applicable BMPs per the SWPPP would ensure that construction-related erosion impacts are reduced to a less than significant level. Additionally, South Coast Air Quality Management District has regulations that require control of windblown soil. Impacts would be less than significant.
Operation Phase
Upon project completion, no areas of exposed soil would be left to erode, and the existing drainage pattern of the campus would largely be maintained. If substantial changes to existing impervious surfaces and drainage pattern are proposed during site improvements at any phase of the Master Plan, a water quality management plan would be prepared and implemented per the City’s Stormwater and Urban Runoff Management and Discharge Ordinance. Thus, project development would not cause substantial erosion. Impacts would be less than significant.
ii) Substantially increase the rate or amount of surface runoff in a manner which would result in flooding on- or offsite?
Less Than Significant Impact. Stormwater runoff is conveyed to on-campus retention basins, planted areas, and playfields that can function as retention basins and eliminate the additional runoff created by the

R A N C H O C U C A M O N G A C A M P U S M A S T E R P L A N D R A F T E I R C H A F F E Y C O M M U N I T Y C O L L E G E D I S T R I C T
8. Impacts Found Not to Be Significant
Page 8-18 PlaceWorks
impervious surfaces. Stormwater that does not evaporate or percolate into the ground is conveyed to drainage channels. The drainage pattern and the flow and rate of stormwater runoff from the campus after project completion may increase slightly; however, because of existing drainage system and flood control measures, the project would not result in flooding on or off campus. Impacts would less than significant.
iii) Create or contribute runoff water which would exceed the capacity of existing or planned stormwater drainage systems or provide substantial additional sources of polluted runoff?
Less Than Significant Impact. Project-related changes to the campus would not result in a significant increase in runoff. Because of existing drainage system and water quality measures already in place, the new buildings and other campus improvements would not increase pollutants in stormwater. Impacts would be less than significant.
iv) Impede or redirect flood flows?
No Impact. The campus is outside of 100-year flood zones mapped by the Federal Emergency Management Agency (FEMA 2016). The project would not impede or redirect flood flows. No impact would occur.
d) In flood hazard, tsunami, or seiche zones, risk release of pollutants due to project inundation?
No Impact. The campus is outside of Federal Emergency Management Agency 100-year flood zone (FEMA 2016) and would not be subject to significant flood hazard.
Tsunamis are a type of earthquake-induced flooding produced by large-scale sudden disturbances of the sea floor. Tsunami waves interact with the shallow sea floor when approaching a landmass, resulting in an increase in wave height and a destructive wave surge into low-lying coastal areas. The campus is over 40 miles inland from the Pacific Ocean. Therefore, the campus is outside the tsunami hazard zone and would not be affected by a tsunami.
A seiche is a surface wave created when a body of water is shaken, usually by earthquake activity. Seiches are of concern relative to water storage facilities because inundation from a seiche can occur if the wave overflows a containment wall, such as the wall of a reservoir, water storage tank, dam or other artificial body of water. There are no large, confined bodies of water in or near the project site.
The project would not release pollutants as the result of floods, tsunami, or seiche. No impact would occur.
e) Conflict with or obstruct implementation of a water quality control plan or sustainable groundwater management plan?
No Impact. The project would not conflict or obstruct a sustainable groundwater management plan. Project construction would be subject to the CGP and implementation of BMPs specified in the SWPPP. After completion of the project, ground surfaces would be either hardscape or maintained landscape. Additionally, the project would not affect groundwater quality. No impact would occur.
R A N C H O C U C A M O N G A C A M P U S M A S T E R P L A N D R A F T E I R C H A F F E Y C O M M U N I T Y C O L L E G E D I S T R I C T
8. Impacts Found Not to Be Significant
April 2022 Page 8-19
8.7 LAND USE AND PLANNING Would the project:
a) Physically divide an established community?
No Impact. The campus is fully developed. The project would take place within the campus boundaries and would not divide an established community. No impact would occur.
b) Cause a significant environmental impact due to a conflict with any land use plan, policy, or regulation adopted for the purpose of avoiding or mitigating an environmental effect?
Less Than Significant Impact. The City of Rancho Cucamonga General Plan Land Use designation for the property is Schools (0.10 to 0.20 floor area ratio) and the zoning is School (S). The project site is already developed as a community college campus, and the proposed project would not change the uses at the project site. The proposed project is intended to update and modernize existing building space to meet the District’s instructional needs. The campus improvements do not represent a change in land use and would not conflict with existing plans, policies, or regulations adopted for the purpose of avoiding or mitigating environmental effects. Impacts would be less than significant.
8.8 MINERAL RESOURCES Would the project:
a) Result in the loss of availability of a known mineral resource that would be a value to the region and the residents of the state?
No Impact. The project site is developed and operating as community college. The proposed project would not remove any operating mineral resources recovery sites or result in the loss of availability of a known mineral resource. No impact would occur.
b) Result in the loss of availability of a locally important mineral resource recovery site delineated on a local general plan, specific plan or other land use plan?
No Impact. The project site is not located in an areas of designated regionally significant aggregate resources (Rancho Cucamonga 2021b). The proposed project would not impact the availability of a locally important mineral resource. No impacts would occur.
8.9 POPULATION AND HOUSING Would the project:
a) Induce substantial unplanned population growth in an area, either directly (for example, by proposing new homes and businesses) or indirectly (for example, through extension of roads or other infrastructure)?

R A N C H O C U C A M O N G A C A M P U S M A S T E R P L A N D R A F T E I R C H A F F E Y C O M M U N I T Y C O L L E G E D I S T R I C T
8. Impacts Found Not to Be Significant
Page 8-20 PlaceWorks
No Impact. The project would make physical changes to an existing campus and would not induce population growth. New roads, expanded utility lines, and housing that could induce population growth would not be constructed or required as part of the Master Plan. No impacts related to population growth would occur.
b) Displace substantial numbers of existing people or housing, necessitating the construction of replacement housing elsewhere?
No Impact. No people or housing would be displaced, and no replacement housing would be required. No housing impacts would occur.
8.10 PUBLIC SERVICES Would the project results in substantial adverse physical impacts associated with the provision of new or physically altered governmental facilities, need for new or physically altered governmental facilities, the construction of which could cause significant environmental impacts, in order to maintain acceptable service ratios, response times or other performance objectives for any of the public services:
a) Fire protection?
Less Than Significant Impact. Fire services for the project site are provided by the Rancho Cucamonga Fire Protection District (RCFPD). The nearest fire station to the project site is Banyan Fire Station at 11108 Banyan Street, approximately 0.2 mile to the east (Rancho Cucamonga 2019). In the event of a large-scale emergency, the San Bernardino County Fire Department would also provide fire protection service to the RCFPD fire stations.
The project consists of demolition, construction, and renovation of buildings and campus facilities on the 200-acre campus. Project operation would not involve the use, manufacture, or storage of toxic or otherwise hazardous materials; generate a significant fire hazard; impair fire department access to the campus; or result in an increase in residential population in the area. The proposed project would not negatively impact the ability of RCFPD to provide adequate service, because the existing community college is already under jurisdiction of the fire service. The new buildings would be constructed in compliance with the current fire and building codes and provide automated sprinkler systems, fire alarms, adequate emergency exits, etc. Site plans would be submitted to DSA and RCFPD for review of fire access and fire protection facilities prior to construction. The District would comply with RCFPD requirements for water flow, and access plans would be approved through the DSA. The proposed Master Plan would update and modernize existing space and construct new buildings to meet current and future instructional and technology needs. The proposed project is not intended to increase student capacity or enrollment; the anticipated student enrollment would increase by 5.65 percent, or 930 students in the span of 30 years. Therefore, the proposed project is not anticipated to increase demands for fire protection services within the college campus, and the proposed project would not negatively impact the ability of the RCFPD to provide adequate fire service. Impacts would be less than significant.

R A N C H O C U C A M O N G A C A M P U S M A S T E R P L A N D R A F T E I R C H A F F E Y C O M M U N I T Y C O L L E G E D I S T R I C T
8. Impacts Found Not to Be Significant
April 2022 Page 8-21
b) Police protection?
Less Than Significant Impact. The Chaffey College Police Department (CCPD) provides police protection services on campus. The off-site roadways and areas outside of the college campus are served by the San Bernardino County Sheriff ’s Department. CCPD has a force of 14 sworn officers with full arrest powers and 18 nonsworn support employees (Chaffey College 2021). The Master Plan is not intended to increase student capacity or enrollment within the college campus; the anticipated student enrollment would increase by 5.65 percent, or 930 students in the span of 30 years. And the proposed project would occur within the existing campus, not expanding the geographic area served. Therefore, the numbers and types of calls for service would not change. During construction, active construction areas would be fenced. Any increase in police protection demands would be temporary and would not require construction of new or expanded police facilities. It is anticipated that the CCPD would continue to have sufficient manpower to serve the project site. The project would not create a significant increase in demand for police services. Impacts would be less than significant.
c) Schools?
No Impact. School services are related to the size of the residential population, the geographic area served, and community characteristics. The project would be a benefit to the students, staff, and the community by renovating and modernizing the existing campus. No impact would occur.
d) Parks?
No Impact. Impacts to public parks and recreational facilities are generally caused by population or employment growth. The project would not increase population or significantly increase employment. Therefore, physical impacts to parks and recreation from increased population growth would not occur. No impacts to parks would occur.
e) Other public facilities?
No Impact. The project would not result in impacts associated with the provision of other new or physically altered public facilities (e.g., libraries, hospitals, childcare, teen or senior centers). Physical impacts to public services are usually associated with population in-migration and growth, which increase the demand for public services and facilities. The project would not result in population growth. Therefore, no impacts to other public facilities would occur.
8.11 RECREATION a) Would the project increase the use of existing neighborhood and regional parks or other
recreational facilities, such that substantial physical deterioration of the facility would occur or be accelerated?
No Impact. The project would not increase the use of existing neighborhood and regional parks or other recreational facilities. It would not increase population in the surrounding community. Therefore, it would not cause physical deterioration of neighborhood and regional parks or other recreational facilities. The project would not result in the need for construction of new recreational facilities. No impacts to parks would occur.

R A N C H O C U C A M O N G A C A M P U S M A S T E R P L A N D R A F T E I R C H A F F E Y C O M M U N I T Y C O L L E G E D I S T R I C T
8. Impacts Found Not to Be Significant
Page 8-22 PlaceWorks
b) Does the project include recreational facilities or require the construction or expansion of recreational facilities, which might have an adverse physical effect on the environment?
No Impact. The project includes the renovations of the existing pool, gymnasium (Building 8), and athletic fields. The environmental effects of the construction and operation are considered throughout the environmental analysis in this DEIR. The project would not require the construction or expansion of additional recreational facilities, which could have an adverse effect on the environment. No impacts to recreational facilities would occur.
8.12 UTILITIES AND SERVICE SYSTEMS Would the project:
a) Require or result in the relocation or construction of new or expanded water, wastewater treatment or storm water drainage, electric power, natural gas, or telecommunications facilities, the construction or relocation of which could cause significant environmental effects?
Less Than Significant Impact. The campus is in the City of Rancho Cucamonga and is already served by existing water, wastewater, stormwater, electric power, natural gas, and telecommunications facilities. The proposed project would provide energy-efficient enhancements, water conservation, and a mass communication system to improve the functionality and efficiency of the existing and new facilities on campus. The proposed project would mainly serve the existing and projected student population for the Rancho Cucamonga campus, accounting for an overall student enrollment increase of 5.65 percent over 30 years. This incremental change in student enrollment would not result in substantial changes to the existing utility demands. Although the proposed project would increase the total building area, the new and renovated buildings would meet the current Building Energy Efficiency Standards (Title 24, California Code of Regulations, Part 6) and CALGreen (Title 24, California Code of Regulations, Part 11). Both standards contain energy efficiency requirements for newly constructed buildings. The project would not require the relocation or construction of new water, wastewater treatment, or stormwater drainage, electric power, natural gas, or telecommunications facilities. Impacts would be less than significant.
b) Have sufficient water supplies available to serve the project and reasonably foreseeable future development during normal, dry and multiple dry years?
Less Than Significant Impact. The Cucamonga Valley Water District (CVWD) provides water service to the college campus. Impacts would be less than significant.
c) Result in a determination by the waste water treatment provider, which serves or may serve the project that it has adequate capacity to serve the project’s projected demand in addition to the provider’s existing commitments?
Less Than Significant Impact. CVWD is responsible for the collection and treatment of municipal wastewater in the city. Wastewater is collected through CVWD’s collection system and transported to the Inland Empire Utilities Agency Wastewater Treatment Facilities. The existing college campus is already served by

R A N C H O C U C A M O N G A C A M P U S M A S T E R P L A N D R A F T E I R C H A F F E Y C O M M U N I T Y C O L L E G E D I S T R I C T
8. Impacts Found Not to Be Significant
April 2022 Page 8-23
CVWD, and the projected incremental increase in student enrollment over 30 years would not substantially increase the wastewater treatment demands within the project site. Following project completion, the overall treatment demand for the plant would not significantly increase. Impacts would be less than significant.
d) Generate solid waste in excess of state or local standards, or in excess of the capacity of local infrastructure, or otherwise impair the attainment of solid waste reduction goals?
Less Than Significant Impact. Solid waste generated in the City is transferred to Burrtec’s West Valley Materials Recovery Facility immediately southeast of the city at 13373 Napa Street in Fontana. Solid waste that is not diverted is primarily disposed at Mid-Valley Landfill, a County Class III (i.e., municipal waste) landfill at 2390 North Alder Avenue in Rialto (Rancho Cucamonga 2021b).
Demolition of the existing buildings would generate demolition debris. The California Green Building Standards Code (CALGreen; 24 CCR Part 1, Section 5.408.1.1) requires that at least 65 percent of the nonhazardous construction and demolition waste from nonresidential construction operations be recycled and/or salvaged for reuse. The District would comply with these established standards. Therefore, demolition would not adversely impact landfill capacity.
The project would serve existing and future students and students are already generating solid waste without the project. The project would not impair the attainment of solid waste reduction goals. Impacts would be less than significant.
e) Comply with federal, state, and local management and reduction statutes and regulations related to solid waste?
Less Than Significant Impact. The campus administrators and the District currently comply with federal, state, and local statutes and regulations related to solid waste and will continue this practice. Section 5.408 of CALGreen requires that at least 65 percent of the nonhazardous construction and demolition waste from nonresidential construction operations be recycled and/or salvaged for reuse. Construction of the project would adhere to these established standards. No impact would occur.
8.13 WILDFIRE Wildland fire protection in California is the responsibility of either the local government, state, or the federal government. State responsibility areas (SRA) are the areas in the state where the State of California has the primary financial responsibility for the prevention and suppression of wildland fires. The SRA forms one large area over 31 million acres to which the California Department of Forestry and Fire Protection (CAL FIRE) provides a basic level of wildland fire prevention and protection services.
Local responsibility areas (LRA) include incorporated cities, cultivated agriculture lands, and portions of the desert. LRA fire protection is typically provided by city fire departments, fire protection districts, counties, and by CAL FIRE under contract to local government. RCFPD provides fire and emergency services within the city.

R A N C H O C U C A M O N G A C A M P U S M A S T E R P L A N D R A F T E I R C H A F F E Y C O M M U N I T Y C O L L E G E D I S T R I C T
8. Impacts Found Not to Be Significant
Page 8-24 PlaceWorks
CAL FIRE uses an extension of the SRA Fire Hazard Severity Zone model as the basis for evaluating fire hazard in LRAs. The local responsibility area hazard rating reflects flame and ember intrusion from adjacent wildlands and from flammable vegetation in the urban area. FHSZs are identified by moderate, high, and very high in an SRA, and very high in an LRA.
In the LRA, the southeast corner of the project site is in an FHSZ (CAL FIRE 2008). In the SRA, the nearest FHSZ is 0.3 mile west toward the Day Canyon Wash (CAL FIRE 2007).
If located in or near state responsibility areas or lands classified as very high fire hazard severity zones, would the project:
a) Substantially impair an adopted emergency response plan or emergency evacuation plan?
Less than Significant Impact. The emergency response plans and emergency evacuation plans in effect are through the County, the City, and the District.
County
Under the Federal Disaster Mitigation Act of 2000, local governments in the United States, including counties, cities, and tribes, are required to prepare a local hazards mitigation plan as a condition of receiving federal disaster mitigation funds. This plan identifies the hazards that have occurred or may occur in the study area and provides mitigation strategies or action items designed to save lives and reduce the destruction of property.
San Bernardino County Office of Emergency Service is involved in emergency responses, threat summaries and assessments, and procedures for responding agencies as well as county agencies that would be involved in coordinating and managing responses. The San Bernardino County Multi-jurisdictional Hazard Mitigation Plan identifies the county’s hazards, reviews and assesses past disaster occurrences, estimates the probability of future occurrences, and sets goals to mitigate potential risks to reduce or eliminate long-term risk to people and property from natural and man-made hazards (San Bernardino 2011).
City
The RCFPD’s Emergency Management Division provides emergency management services citywide in cooperation with county agencies and special districts. During an active incident such as a fire or flood requiring emergency sheltering, RCFPD helps to facilitate the resources necessary for first responders to protect the community (Rancho Cucamonga 2020).
District
California Education Code Section 32286 requires each school site to review and update its school safety plan, which must be developed and written by a school site council or its designated safety planning committee in collaboration with teachers, classified staff, parents, and first responders to ensure they are up to date and complete. The plans must have policies and procedures addressing critical issues, including: disaster preparedness; crisis response; mental and physical health; earthquake emergencies; school learning

R A N C H O C U C A M O N G A C A M P U S M A S T E R P L A N D R A F T E I R C H A F F E Y C O M M U N I T Y C O L L E G E D I S T R I C T
8. Impacts Found Not to Be Significant
April 2022 Page 8-25
environment; discipline, suspension, and/or expulsion; hate crime reporting; child abuse reporting; release of a pesticide or toxic substance; and more (CDE 2016).
Emergency preparedness and response planning and coordination is currently coordinated through the District’s Office of Risk Management and Campus Police Department. The college campus has an emergency evacuation plan in compliance with the District’s emergency operations plan.
Project construction would not interfere with existing emergency response plans or emergency evacuation plans. When complete, the project would improve emergency access on campus by enhancing the vehicle circulation with a new parking lot and security and safety upgrades. Emergency response impact would be less than significant.
b) Due to slope, prevailing winds, and other factors, exacerbate wildfire risks, and thereby expose project occupants to pollutant concentrations from a wildfire or the uncontrolled spread of a wildfire?
Less than Significant Impact. Wildland fire is an overarching term describing any nonstructural fire that occurs in vegetation and natural fuels. Wildland fire encompasses both prescribed fire and wildfire. A wildfire is an unplanned fire caused by lightning or other natural causes, by accidental (or arson-caused) human ignitions, or by an escaped prescribed fire (NPS 2020). Fire hazard severity zones in wildlands are determined based on the probability of burning; estimated flame sizes based on fuels, slope, and expected fire weather; and the amount of firebrands (embers) expected to land on the area.
The campus is in a predominantly residential area, and there is no wildland susceptible to wildfire on or adjacent to the school. The corner of the baseball field is considered as a very high FHSZ zone (CAL FIRE 2021). The fields would be renovated and repurposed under the project. Project development would be confined to the project site and would not place people or structures at risk from wildfire. Impacts would be less than significant.
c) Require the installation of associated infrastructure (such as roads, fuel breaks, emergency water sources, power lines or other utilities) that may exacerbate fire risk or that may result in temporary or ongoing impacts to the environment?
No Impact. The campus improvements would not require the installation of new infrastructure that may exacerbate fire risk. No impact would occur.
d) Expose people or structures to significant risks, including downslope or downstream flooding or landslides, as a result of runoff, post-fire slope instability, or drainage changes?
Less than Significant Impact. The campus is surrounded by generally flat topography. There are no vegetated slopes susceptible to wildfire in the surrounding area. The project would not result in runoff, postfire slope instability, or significant drainage changes. Impacts would be less than significant.

R A N C H O C U C A M O N G A C A M P U S M A S T E R P L A N D R A F T E I R C H A F F E Y C O M M U N I T Y C O L L E G E D I S T R I C T
8. Impacts Found Not to Be Significant
Page 8-26 PlaceWorks
8.14 REFERENCES ASM Affiliates (ASM). 2021, April. Draft Cultural Resources Technical Report for Chaffey College Master
Plan Update, Rancho Cucamonga Campus. DEIR Appendix D.
California Department of Education (CDE). 2016, February 24. Memo from Tom Torlakson, State Superintendent of Public Instruction. https://www.cde.ca.gov/nr/el/le/yr16ltr0224.asp.
California Department of Forestry and Fire Prevention (CAL FIRE). 2021, January 4 (accessed). FHSZ Viewer. https://egis.fire.ca.gov/FHSZ/.
———. 2008, October. Very High Fire Hazard Severity Zones in LRA. https://osfm.fire.ca.gov/media/5948/rancho_cucamonga.pdf.
———. 2007, November 7. Fire Hazard Severity Zones in SRA. https://osfm.fire.ca.gov/media/6781/fhszs_map62.pdf.
California Department of Resources Recycling and Recovery (CalRecycle). 2020, December 28 (accessed). SWIS Facility/Site Search. https://www2.calrecycle.ca.gov/SWFacilities/Directory/.
California Department of Transportation (Caltrans). 2020a, December 23 (accessed). Scenic Highways: Frequently Asked Questions. https://dot.ca.gov/programs/design/lap-landscape-architecture-and -community-livability/lap-liv-i-scenic-highways/lap-liv-iscenic-highways-faq2.
———. 2020b, December 23 (accessed). California Highway System. https://caltrans.maps.arcgis.com/ apps/webappviewer/index.html?id=026e830c914c495797c969a3e5668538.
California Department of Toxic Substances Control (DTSC). 2020, December 28 (accessed). EnviroStor. http://www.envirostor.dtsc.ca.gov/public/.
California Energy Commission (CEC). 2018a. News Release: Energy Commission Adopts Standards Requiring Solar Systems for New Homes, First in Nation. https://www.energy.ca.gov/news/2018 -05/energy-commission-adopts-standards-requiring-solar-systems-new-homes-first.
———. 2018b. 2019 Building Energy and Efficiency Standards Frequently Asked Questions. http://www.energy.ca.gov/title24/2019standards/documents/2018_Title_24_2019_Building_Standards_FAQ.pdf.
———. 2021, May 19. Amendments to the Building Energy Efficiency Standards (2022 Energy Code) Draft Environmental Report. CEC-400-2021-077-D.
Chaffey College. 2021, December (accessed). Police Department. https://www.chaffey.edu/police/index.php.
Cucamonga Valley Water District (CVWD). 2021, January 4 (accessed). About Us. https://www.cvwdwater.com/35/About-Us.
R A N C H O C U C A M O N G A C A M P U S M A S T E R P L A N D R A F T E I R C H A F F E Y C O M M U N I T Y C O L L E G E D I S T R I C T
8. Impacts Found Not to Be Significant
April 2022 Page 8-27
Division of Land Resource Protection (DLRP). 2016. California Important Farmland Finder. https://maps.conservation.ca.gov/dlrp/ciff/.
Federal Emergency Management Agency (FEMA). 2016, September 2. FEMA's National Flood Hazard Layer. https://msc.fema.gov/portal/search?AddressQuery=chaffey%20college#searchresultsanchor.
Morton, D. M., and F. K. Miller (Morton and Miller). 2006. Geology map of the San Bernardino and Santa Ana 30’ x 60’ quadrangles, California. Geology and description of map units, version 1.0. Digital preparation by Cossette, P. M. and K. R. Bovard. USGS Open File Report 2006-1217, scale 1:100,000. https://ngmdb.usgs.gov/Prodesc/proddesc_78686.htm.
National Park Service (NPS). 2020, April. Wildland Fire Program. Wildfires, Prescribed Fires, and Fuels. https://www.nps.gov/orgs/1965/wildfires-prescribed-fires-fuels.htm.
Natural History Museum of Los Angeles County (NHM). 2021, November 21. Re: Paleontological resources for the Rancho Cucamonga Campus Master Plan Project. DEIR Appendix I.
Rancho Cucamonga, City of. 2021a, December 15 (adopted). City of Rancho Cucamonga General Plan. https://www.cityofrc.us/GeneralPlan.
———. 2021b, September. Rancho Cucamonga 2021 General Plan Update Draft & Climate Action Plan Program Environmental Impact Report. Volume I. SCH No. 2021050261. https://www.cityofrc.us/ sites/default/files/2021-09/City%20of%20Rancho%20Cucamonga_GP%20Update%20and %20CAP_Draft%20EIR_September%202021.pdf.
———. 2020, December 28 (accessed) Emergency Management. https://www.cityofrc.us/readyrc.
———. 2019. Map of Fire Stations. https://www.cityofrc.us/sites/default/files/2019-08/MapofStations.pdf.
San Antonio Water Company (SAWC). 2022, January (accessed). Your Water, Water Sources. https://www.sawaterco.com/water-sources.
San Bernardino, County of. 2010, Mach 9 (plot date)San Bernardino County Land Use Plan General Plan Geologic Hazard Overlays. http://www.sbcounty.gov/Uploads/lus/GeoHazMaps/FH20C_20100309.pdf.
———. 2011, October. Multi-Jurisdictional Hazard Mitigation Plan. http://www.sbcounty.gov/Uploads/SBCFire/content/oes/pdf/Hazard-Mitigation-Plan.pdf.
State Water Resources Control Board (SWRCB). 2020, December 28 (accessed). GeoTracker. Database. http://geotracker.waterboards.ca.gov/.
US Environmental Protection Agency (USEPA). 2020 December 28 (accessed). EJSCREEN. Database. https://ejscreen.epa.gov/mapper/.

R A N C H O C U C A M O N G A C A M P U S M A S T E R P L A N D R A F T E I R C H A F F E Y C O M M U N I T Y C O L L E G E D I S T R I C T
8. Impacts Found Not to Be Significant
Page 8-28 PlaceWorks
———. 2020, December 28 (accessed). EnviroMapper for EnviroFacts. Database. https://enviro.epa.gov/facts/multisystem.html
US Geological Survey (USGS). 2021a, January 5 (accessed). Topo View. https://ngmdb.usgs.gov/topoview/viewer/#15/34.1503/-117.5654.
———. 2021b, January 5 (accessed). Groundwater Watch. https://groundwaterwatch.usgs.gov/StateMap.asp?sa=CA&sc=06.
US Census Bureau. April 1, 2020. Rancho Cucamonga city, California, Population, Census April 1, 2020. https://www.census.gov/quickfacts/fact/table/ranchocucamongacitycalifornia,US/PST045221.
US Department of Agriculture, Natural Resources Conservation Service, Web Soil Survey (WSS). 2022, January (accessed). https://websoilsurvey.sc.egov.usda.gov/App/WebSoilSurvey.aspx.
April 2022 Page 9-1
9. Significant Irreversible Changes Due to the Proposed Project
Section 15126.2(c) of the CEQA Guidelines requires that an environmental impact report (EIR) describe any significant irreversible environmental changes that would be caused by the proposed project should it be implemented. Specifically, the CEQA Guidelines state:
Uses of nonrenewable resources during the initial and continued phases of the project may be irreversible since a large commitment of such resources makes removal of nonuse thereafter unlikely. Primary impacts and, particularly, secondary impacts (such as highways improvement which provides access to a previously inaccessible area) generally commit future generations to similar uses. Also, irreversible damage can result from environmental accidents associated with the project. Irretrievable commitments of resources should be evaluated to assure that such current consumption is justified.
The following are the significant irreversible changes that would be caused by the proposed project, should it be implemented:
Implementation of the proposed project would include construction activities that would entail the commitment of nonrenewable and/or slowly renewable energy resources; human resources; and natural resources such as lumber and other forest products, sand and gravel, asphalt, steel, copper, lead, other metals, water, and fossil fuels. Operation of the proposed project would require the use of natural gas and electricity, petroleum-based fuels, fossil fuels, and water. The commitment of resources required for the construction and operation of the proposed project would limit the availability of such resources for future generations or for other uses during the life of the project.
Implementation of the proposed project would result in demolition and/or renovation of 15 historic district contributing structures. Although mitigation measures have been incorporated to reduce the historical resources impact, which requires preparation and implementation of a Historic American Buildings Survey (HABS) Level II Documentation, demolition and/or renovation of these historic resources make up the main component of the Master Plan. Therefore, impacts to historic resources cannot be avoided, and irreversible changes to nonrenewable resources would occur.
The visual character of the project site would be altered by the demolition of existing structures and construction of the new structure on-campus. This would result in a permanent change in the character of the project site and on- and off-site views in the project’s vicinity.
Given the low likelihood that the land at the project site would revert to its original form, the proposed project would generally commit future generations to these environmental changes.

R A N C H O C U C A M O N G A C A M P U S M A S T E R P L A N D R A F T E I R C H A F F E Y C O M M U N I T Y C O L L E G E D I S T R I C T
9. Significant Irreversible Changes Due to the Proposed Project
Page 9-2 PlaceWorks
This page intentionally left blank.

April 2022 Page 10-1
10. Growth-Inducing Impacts of the Proposed Project
Pursuant to Sections 15126(d) and 15126.2(d) of the CEQA Guidelines, this section is provided to examine ways in which the proposed project could foster economic or population growth, or the construction of additional housing, either directly or indirectly, in the surrounding environment. Also required is an assessment of other projects that would foster other activities which could affect the environment, individually or cumulatively. To address this issue, potential growth-inducing effects will be examined through analysis of the following questions:
Would this project remove obstacles to growth, e.g., through the construction or extension of major infrastructure facilities that do not presently exist in the project area, or through changes in existing regulations pertaining to land development?
Would this project result in the need to expand one or more public services to maintain desired levels of service?
Would this project encourage or facilitate economic effects that could result in other activities that could significantly affect the environment?
Would approval of this project involve some precedent-setting action that could encourage and facilitate other activities that could significantly affect the environment?
Please note that growth-inducing effects are not to be construed as necessarily beneficial, detrimental, or of little significance to the environment. This issue is presented to provide additional information on ways in which this project could contribute to significant changes in the environment, beyond the direct consequences of developing the land use concept examined in the preceding sections of this EIR.
Would this project remove obstacles to growth, e.g., through the construction or extension of major infrastructure facilities that do not presently exist in the project area, or through changes in existing regulations pertaining to land development?
The project site is currently developed with the existing college campus and served by major infrastructure. Implementation of the proposed project would not require construction or extension of major infrastructure facilities.

R A N C H O C U C A M O N G A C A M P U S M A S T E R P L A N D R A F T E I R C H A F F E Y C O M M U N I T Y C O L L E G E D I S T R I C T
10. Growth-Inducing Impacts of the Proposed Project
Page 10-2 PlaceWorks
Would this project result in the need to expand one or more public services to maintain desired levels of service?
The project site is currently developed with the existing college campus and served by various public services. Implementation of the Master Plan would replace many of the old buildings to sustainable and efficient modern buildings while the student capacity is only anticipated to increase by 5.65 percent or 930 students in 30 years. Therefore, the existing public services such as fire and police would not be adversely impacted by the proposed project and the proposed project would not require expansion of publ9ic services to maintain desired levels of service.
Would this project encourage or facilitate economic effects that could result in other activities that could significantly affect the environment?
The proposed project would replace outdated existing college campus facilities with sustainable modern facilities. All development would occur within the existing campus boundaries for student and staff population and the proposed project would not encourage or facilitate economic effect that could result in other activities that could significantly affect the environment.
Would approval of this project involve some precedent-setting action that could encourage and facilitate other activities that could significantly affect the environment?
The proposed project would replace outdated existing college campus facilities with sustainable modern facilities in approximately 30-year period. The original campus was developed in 1959 and the area surrounding the project site is developed with residential uses. Approval of the proposed project would not involve any precedent setting action that could encourage and facilitate other activities that could significantly affect the environment.

April 2022 Page 11-1
11. Organizations and Persons Consulted Chaffey Community College District
Troy Ament, Interim Vice President of Administrative Services and Emergency Operations, Executive Director, Facilities & Construction
Samir Shah, CCM, LEED AP BD+C, Assoc. DBIA, Bond Program Manager
ASM Affiliates
Shannon Davis, M.A., RPH, Director, Architectural History
Urban Crossroads
Charlene So, PE, Associate Principal
Alex So, Senior Analyst
Cadre Environmental
Ruben Ramirez, Research Biologist
San Manuel Band of Missions Indians
Ryan Nordness, Cultural Resource Analyst

R A N C H O C U C A M O N G A C A M P U S M A S T E R P L A N D R A F T E I R C H A F F E Y C O M M U N I T Y C O L L E G E D I S T R I C T
11. Organizations and Persons Consulted
Page 11-2 PlaceWorks
This page intentionally left blank.

April 2022 Page 12-1
12. Qualifications of Persons Preparing EIR PLACEWORKS Dwayne Mears, AICP Principal
BS California Polytechnic State University, San Luis Obispo, City and Regional Planning
MRP, University of North Carolina, Chapel Hill, City and Regional Planning
Elizabeth Kim Senior Associate
BA Environmental Analysis and Design, University of California, Irvine
MURP, University of California, Irvine
John Vang, JD Senior Associate, Air Quality & GHG
Master of Urban Planning, Design, & Development, Cleveland State University
Juris Doctor, Cleveland-Marshall College of Law, Cleveland State University
BA, Anthropology, University of California, Los Angeles, 2001
Josh Carman, INCE-USA Senior Planner, Noise, Vibration & Acoustics
BA Environmental Studies, University of California, Santa Cruz
Alejandro Garcia, INCE-USA Associate, Noise, Vibration & Acoustics
BS Acoustics, Columbia College, Chicago
Cary Nakama Graphics
AA Computer Graphic Design, Platt College of Computer Graphic Design
BA Business Administration: Data Processing and Marketing, California State University, Long Beach

R A N C H O C U C A M O N G A C A M P U S M A S T E R P L A N D R A F T E I R C H A F F E Y C O M M U N I T Y C O L L E G E D I S T R I C T
12. Qualifications of Persons Preparing EIR
Page 12-2 PlaceWorks
This page intentionally left blank.

April 2022 Page 13-1
13. Bibliography AirNav, LLC. 2019. Airport Information. Accessed January, 2022. http://www.airnav.com/airports.
ASM Affiliates (ASM). 2021, April. Draft Cultural Resources Technical Report for Chaffey College Master Plan Update, Rancho Cucamonga Campus. DEIR Appendix E.
Bay Area Air Quality Management District (BAAQMD). 2017, May. California Environmental Quality Act Air Quality Guidelines. http://www.baaqmd.gov/~/media/files/planning-and-research/ceqa/ceqa_guidelines_may2017-pdf.pdf?la=en.
Cadre Environmental (Cadre). 2021, March. Biological Resources Technical Report. DEIR Appendix D.
California Air Pollution Control Officers Association (CAPCOA). 2021. California Emissions Estimator Model (CalEEMod). Version 2020.4.0. Prepared by: BREEZE Software, A Division of Trinity Consultants in collaboration with South Coast Air Quality Management District and the California Air Districts.
California Air Resources Board (CARB). 1992. Federal Attainment Plan for Carbon Monoxide.
———. 1993. California Environmental Quality Act Air Quality Handbook.
———. 1998, April 22. The Report on Diesel Exhaust. http://www.arb.ca.gov/toxics/dieseltac/de-fnds.htm.
———. 1999. Final Staff Report: Update to the Toxic Air Contaminant List.
______.2016, May 4. Ambient Air Quality Standards. https://ww2.arb.ca.gov/sites/default/files/2020-07/aaqs2.pdf.
______. 2022a, January 20 (accessed). Area Designations Maps/State and National. https://ww2.arb.ca.gov/resources/documents/maps-state-and-federal-area-designations.
______. 2022b, January 20 (accessed). Common Air Pollutants. https://ww2.arb.ca.gov/resources/common-air-pollutants.
______. 2022c, January 20 (accessed). Top Four Summary. https://www.arb.ca.gov/adam/topfour/topfour1.php
California Department of Education (CDE). 2016, February 24. Memo from Tom Torlakson, State Superintendent of Public Instruction. https://www.cde.ca.gov/nr/el/le/yr16ltr0224.asp.

R A N C H O C U C A M O N G A C A M P U S M A S T E R P L A N D R A F T E I R C H A F F E Y C O M M U N I T Y C O L L E G E D I S T R I C T
13. Bibliography
Page 13-2 PlaceWorks
California Department of Forestry and Fire Prevention (CAL FIRE). 2021, January 4 (accessed). FHSZ Viewer. https://egis.fire.ca.gov/FHSZ/.
———. 2008, October. Very High Fire Hazard Severity Zones in LRA. https://osfm.fire.ca.gov/media/5948/rancho_cucamonga.pdf.
———. 2007, November 7. Fire Hazard Severity Zones in SRA. https://osfm.fire.ca.gov/media/6781/fhszs_map62.pdf.
California Department of Resources Recycling and Recovery (CalRecycle). 2020, December 28 (accessed). SWIS Facility/Site Search. https://www2.calrecycle.ca.gov/SWFacilities/Directory/.
California Department of Toxic Substances Control (DTSC). 2020, December 28 (accessed). EnviroStor. http://www.envirostor.dtsc.ca.gov/public/.
California Department of Transportation (Caltrans). 2013, September. Technical Noise Supplement (TeNS).
———. 2020a, December 23 (accessed). Scenic Highways: Frequently Asked Questions. https://dot.ca.gov/programs/design/lap-landscape-architecture-and -community-livability/lap-liv-i-scenic-highways/lap-liv-iscenic-highways-faq2.
———. 2020b, December 23 (accessed). California Highway System. https://caltrans.maps.arcgis.com/ apps/webappviewer/index.html?id=026e830c914c495797c969a3e5668538.
California Energy Commission (CEC). 2018a. News Release: Energy Commission Adopts Standards Requiring Solar Systems for New Homes, First in Nation. https://www.energy.ca.gov/news/2018 -05/energy-commission-adopts-standards-requiring-solar-systems-new-homes-first.
———. 2018b. 2019 Building Energy and Efficiency Standards Frequently Asked Questions. http://www.energy.ca.gov/title24/2019standards/documents/2018_Title_24_2019_Building_Standards_FAQ.pdf.
———. 2021, May 19. Amendments to the Building Energy Efficiency Standards (2022 Energy Code) Draft Environmental Report. CEC-400-2021-077-D.
Chaffey Community College District (CCCD). 2020, February. VISION 2030 Chaffey College Educational Master Plan. https://www.chaffey.edu/facilitiesdevelopment/docs/chaffey_ college_vision_2030_educational_master_plan_feb_2020.pdf.
———. 2021, November (accessed). Chaffey College 2020-2021 Catalog: General Information. https://www.chaffey.edu/catalogandschedule/docs/catalogs/2020-2021-gen.pdf.
———. 2021, December (accessed). Police Department. https://www.chaffey.edu/police/index.php.
Cucamonga Valley Water District (CVWD). 2021, January 4 (accessed). About Us. https://www.cvwdwater.com/35/About-Us.

R A N C H O C U C A M O N G A C A M P U S M A S T E R P L A N D R A F T E I R C H A F F E Y C O M M U N I T Y C O L L E G E D I S T R I C T
13. Bibliography
April 2022 Page 13-3
Division of Land Resource Protection (DLRP). 2016. California Important Farmland Finder. https://maps.conservation.ca.gov/dlrp/ciff/.
Federal Emergency Management Agency (FEMA). 2016, September 2. FEMA's National Flood Hazard Layer. https://msc.fema.gov/portal/search?AddressQuery=chaffey%20college#searchresultsanchor.
Federal Highway Administration (FHWA). 2006, August. Construction Noise Handbook.
Federal Transit Administration (FTA). 2018, September. Transit Noise and Vibration Impact Assessment.
Harris, Cyril M. 1998. Handbook of Acoustical Measurements and Noise Control. 3rd edition. Woodbury, NY: Acoustical Society of America.
Morton, D. M., and F. K. Miller (Morton and Miller). 2006. Geology map of the San Bernardino and Santa Ana 30’ x 60’ quadrangles, California. Geology and description of map units, version 1.0. Digital preparation by Cossette, P. M. and K. R. Bovard. USGS Open File Report 2006-1217, scale 1:100,000. https://ngmdb.usgs.gov/Prodesc/proddesc_78686.htm.
National Park Service (NPS). 2020, April. Wildland Fire Program. Wildfires, Prescribed Fires, and Fuels. https://www.nps.gov/orgs/1965/wildfires-prescribed-fires-fuels.htm.
Native American Heritage Commission (NAHC). 2020, June 10. Native American Heritage Commission Tribal Consultation Correspondence and Tribal Consultation List, Orange County. Master Plan Traffic Analysis. DEIR Appendix G.
Natural History Museum of Los Angeles County (NHM). 2021, November 21. Re: Paleontological resources for the Rancho Cucamonga Campus Master Plan Project. DEIR Appendix I.
Office of Environmental Health Hazard Assessment (OEHHA). 2015, February. Air Toxics Hot Spots Program Risk Assessment Guidelines. Guidance Manual for Preparation of Health Risk Assessments. http://oehha.ca.gov/air/hot_spots/2015/2015GuidanceManual.pdf.
Rancho Cucamonga, City of. 2021, December. City of Rancho Cucamonga General Plan. https://www.cityofrc.us/GeneralPlan.
Rancho Cucamonga, City of. 2021a, December 15 (adopted). City of Rancho Cucamonga General Plan. https://www.cityofrc.us/GeneralPlan.
———. 2021b, September. Rancho Cucamonga 2021 General Plan Update Draft & Climate Action Plan Program Environmental Impact Report. Volume I. SCH No. 2021050261. https://www.cityofrc.us/ sites/default/files/2021-09/City%20of%20Rancho%20Cucamonga_GP%20Update%20and %20CAP_Draft%20EIR_September%202021.pdf.
———. 2020, December 28 (accessed) Emergency Management. https://www.cityofrc.us/readyrc.
———. 2019. Map of Fire Stations. https://www.cityofrc.us/sites/default/files/2019-08/MapofStations.pdf.

R A N C H O C U C A M O N G A C A M P U S M A S T E R P L A N D R A F T E I R C H A F F E Y C O M M U N I T Y C O L L E G E D I S T R I C T
13. Bibliography
Page 13-4 PlaceWorks
Rancho Cucamonga, City of. Rancho Cucamonga Municipal Code. http://qcode.us/codes/ranchocucamonga/.
San Antonio Water Company (SAWC). 2022, January (accessed). Your Water, Water Sources. https://www.sawaterco.com/water-sources.
San Bernardino, County of. 2010, Mach 9 (plot date)San Bernardino County Land Use Plan General Plan Geologic Hazard Overlays. http://www.sbcounty.gov/Uploads/lus/GeoHazMaps/FH20C_20100309.pdf.
———. 2011, October. Multi-Jurisdictional Hazard Mitigation Plan. http://www.sbcounty.gov/Uploads/SBCFire/content/oes/pdf/Hazard-Mitigation-Plan.pdf.
San Bernardino Flood Control District. Comprehensive Storm Drain Plan (CSDP) 2. https://sbcountydpw .maps.arcgis.com/home/webmap/viewer.html?webmap=1555d49212b44eb3ac8a6e6309d1d8e0.
South Coast Air Quality Management District (South Coast AQMD). 1992. Federal Attainment Plan for Carbon Monoxide.
———. 2003, August. 2003 Air Quality Management Plan. Appendix V. https://www.aqmd.gov/home/air-quality/clean-air-plans/air-quality-mgt-plan/2003-aqmp.
———. 2005, May. Guidance Document for Addressing Air Quality Issues in General Plans and Local Planning. http://www.aqmd.gov/docs/default-source/planning/air-quality-guidance/complete-guidance-document.pdf.
———. 2008, June. Final Localized Significance Threshold Methodology. http://www.aqmd.gov/home/regulations/ceqa/air-quality-analysis-handbook/localized-significance-thresholds.
———. 2011a, December. The Health Effects of Air Pollution. http://www.aqmd.gov/docs/default-source/publications/brochures/the-health-effects-of-air-pollution-brochure.pdf.
———. 2011b. Fact Sheet for Applying CalEEMod to Localized Significance Thresholds. http://www.aqmd.gov/docs/default-source/ceqa/handbook/localized-significance-thresholds/caleemod-guidance.pdf.
———. 2012, May 4. Final 2012 Lead State Implementation Plan: Los Angeles County. http://www3.aqmd.gov/hb/attachments/2011-2015/2012May/2012-May4-030.pdf.
———. 2013, February. 2012 Final Air Quality Management Plan. http://www.aqmd.gov/home/library/clean-air-plans/air-quality-mgt-plan/final-2012-air-quality-management-plan.

R A N C H O C U C A M O N G A C A M P U S M A S T E R P L A N D R A F T E I R C H A F F E Y C O M M U N I T Y C O L L E G E D I S T R I C T
13. Bibliography
April 2022 Page 13-5
———. 2015, October. “Blueprint for Clean Air: 2016 AQMP White Paper.” 2016 AQMP White Papers Web Page. https://www.aqmd.gov/docs/default-source/Agendas/aqmp/white-paper-working-groups/wp-blueprint-final.pdf?sfvrsn=2.
———. 2017, March 4. Final 2016 Air Quality Management Plan. https://www.aqmd.gov/docs/default-source/clean-air-plans/air-quality-management-plans/2016-air-quality-management-plan/final-2016-aqmp/final2016aqmp.pdf?sfvrsn=15.
———. 2019, April (revised). South Coast AQMD Air Quality Significance Thresholds. http://www.aqmd.gov/docs/default-source/ceqa/handbook/scaqmd-air-quality-significance-thresholds.pdf.
———. 2021, August. MATES V: Multiple Air Toxics Exposure Study in the South Coast AQMD. http://www.aqmd.gov/home/air-quality/air-quality-studies/health-studies/mates-v.
State Water Resources Control Board (SWRCB). 2020, December 28 (accessed). GeoTracker. Database. http://geotracker.waterboards.ca.gov/.
Urban Crossroads. 2021, September. Chaffey Community College District’s Rancho Cucamonga Campus
USA.com. 2022, January 16 (accessed). Rancho Cucamonga, CA Weather. http://www.usa.com/rancho-cucamonga-ca-weather.htm.
US Census Bureau. April 1, 2020. Rancho Cucamonga city, California, Population, Census April 1, 2020. https://www.census.gov/quickfacts/fact/table/ranchocucamongacitycalifornia,US/PST045221.
US Department of Agriculture, Natural Resources Conservation Service, Web Soil Survey (WSS). 2022, January (accessed). https://websoilsurvey.sc.egov.usda.gov/App/WebSoilSurvey.aspx.
US Environmental Protection Agency (US EPA). 2002, May. Health Assessment Document for Diesel Engine Exhaust. Prepared by the National Center for Environmental Assessment, Washington, DC, for the Office of Transportation and Air Quality; EPA/600/8-90/057F.
———. 2022a, January 30 (accessed). Criteria Air Pollutants. https://www.epa.gov/criteria-air-pollutants.
———. 2022b, January 30 (accessed). Health and Environmental Effects of Hazardous Air Pollutants. https://www.epa.gov/haps/health-and-environmental-effects-hazardous-air-pollutants.
———. 2020 December 28 (accessed). EJSCREEN. Database. https://ejscreen.epa.gov/mapper/.
———. 2020, December 28 (accessed). EnviroMapper for EnviroFacts. Database. https://enviro.epa.gov/facts/multisystem.html
US Geological Survey (USGS). 2021a, January 5 (accessed). Topo View. https://ngmdb.usgs.gov/topoview/viewer/#15/34.1503/-117.5654.

R A N C H O C U C A M O N G A C A M P U S M A S T E R P L A N D R A F T E I R C H A F F E Y C O M M U N I T Y C O L L E G E D I S T R I C T
13. Bibliography
Page 13-6 PlaceWorks
———. 2021b, January 5 (accessed). Groundwater Watch. https://groundwaterwatch.usgs.gov/StateMap.asp?sa=CA&sc=06.