the smart shopping construct: scale development and
TRANSCRIPT
University of Tennessee, Knoxville University of Tennessee, Knoxville
TRACE: Tennessee Research and Creative TRACE: Tennessee Research and Creative
Exchange Exchange
Doctoral Dissertations Graduate School
12-2008
The Smart Shopping Construct: Scale Development and The Smart Shopping Construct: Scale Development and
Validation Validation
Kelly Green Atkins University of Tennessee - Knoxville
Follow this and additional works at: https://trace.tennessee.edu/utk_graddiss
Part of the Hospitality Administration and Management Commons
Recommended Citation Recommended Citation Atkins, Kelly Green, "The Smart Shopping Construct: Scale Development and Validation. " PhD diss., University of Tennessee, 2008. https://trace.tennessee.edu/utk_graddiss/474
This Dissertation is brought to you for free and open access by the Graduate School at TRACE: Tennessee Research and Creative Exchange. It has been accepted for inclusion in Doctoral Dissertations by an authorized administrator of TRACE: Tennessee Research and Creative Exchange. For more information, please contact [email protected].
To the Graduate Council:
I am submitting herewith a dissertation written by Kelly Green Atkins entitled "The Smart
Shopping Construct: Scale Development and Validation." I have examined the final electronic
copy of this dissertation for form and content and recommend that it be accepted in partial
fulfillment of the requirements for the degree of Doctor of Philosophy, with a major in Retail,
Hospitality, and Tourism Management.
Youn-Kyung Kim, Major Professor
We have read this dissertation and recommend its acceptance:
Ann E. Fairhurst, Wanda M. Costen, Robert T. Ladd
Accepted for the Council:
Carolyn R. Hodges
Vice Provost and Dean of the Graduate School
(Original signatures are on file with official student records.)
To the Graduate Council:
I am submitting herewith a dissertation written by Kelly Green Atkins entitled “The
Smart Shopping Construct: Scale Development and Validation.” I have examined the
final electronic copy of this dissertation for form and content and recommend that it be
accepted in partial fulfillment of the requirements for the degree of Doctor of Philosophy,
with a major in Retail, Hospitality, and Tourism Management.
____________________________________
Youn-Kyung Kim, Major Professor
We have read this dissertation
and recommend its acceptance:
____________________________________
Ann E. Fairhurst
____________________________________
Wanda M. Costen
____________________________________
Robert T. Ladd
Accepted for the Council:
_____________________________________
Carolyn R. Hodges,
Vice Provost and Dean of the Graduate School
THE SMART SHOPPING CONSTRUCT:
SCALE DEVELOPMENT AND VALIDATION
A Dissertation Presented
for the Doctor of Philosophy
Degree
The University of Tennessee, Knoxville
Kelly Green Atkins
December 2008
ii
ACKNOWLEDGEMENTS I wish to thank all those who helped me complete my Doctor of Philosophy
Degree. First, I would like to thank Charlotte and W.J. Green, my Mom and Dad, who
instilled the love for reading and education in me at a young age and encouraged me to
persevere and strive for excellence. I am also thankful for Gilbert and Joanne Atkins, my
in-laws, who encouraged and supported me in any way they could. And for my sister,
Sonya, who listened to my challenges and offered advice and consolation as needed.
I also would like to thank special friends, Stacia Couch, Archana Kumar, Kate
Harper, Sarah Wilhoit, Marna Holland, Tamera Caldwell, and Nancy Coppenbarger for
their contributions to my graduate work. My graduation is possible because they assisted
me in various and numerous ways. In addition, I am thankful for my Bible study group
and for their continued prayer support and encouragement throughout the last four years.
I would like to thank my committee chair, Dr. Kim, for the way she has driven me
to do more than I could have done without her. She has been a source of inspiration and
motivation during my entire graduate program. I also have the utmost respect and
appreciation for the other members of my committee: Dr. Fairhurst, Dr. Ladd, and Dr.
Costen. Thank you for your guidance and support.
Finally, I would like to thank John Atkins, my husband, who has given up so
much over the last 5 ½ years. He has supported, encouraged, and believed in me even
when I didn‟t believe in myself. He has willingly given up our second income in addition
to most of our time together and has always comforted me by reminding me that this was
just for “a season” of our lives together. Thank each of you and to God be the glory!
iii
ABSTRACT
This study was designed to gain a better understanding and conceptualization of
the term smart shopping. The specific research objectives were to: (a) investigate
consumers‟ perceptions of the term smart shopping; (b) develop a measure of smart
shopping; and (c) validate the measure of smart shopping.
A comprehensive literature review was used to identify existing smart shopping
theories and to identify opportunities for expanding on the existing meanings of the term.
To obtain consumers‟ perceptions of the term smart shopping, two focus group
interviews and fifteen face-to-face in-depth interviews were employed for initial item
generation and instrument development. Scale development consisted of a pilot test on a
convenience sample of undergraduate students for initial scale refinement (n = 100), and
a pretest (n = 237) and main study (n = 1474) from a consumer panel member list through
a market research company for scale purification and validation. The statistical analyses
were conducted separately for the purchase stages (i.e., pre-purchase, purchase, post-
purchase) and product categories (i.e., clothing, grocery, electronics). Significant
differences were found in each stage among the three product categories.
To compete in today‟s changing retail environment with shifting consumer
socioeconomic patterns and preferences, retailers must decide on unique positioning
strategies. This study conceptualized and tested the term smart shopping from a broader
perspective than previous studies. Gaining a better understanding of the smart shopper
will enable retailers to segment this consumer group more accurately. Managerial
implications and directions for future research based on the findings are provided.
iv
TABLE OF CONTENTS
CHAPTER I ........................................................................................................................ 1 Introduction ......................................................................................................................... 1
Purpose of the Study ....................................................................................................... 3
Contributions of the Study .............................................................................................. 4 CHAPTER II ....................................................................................................................... 6 Literature Review................................................................................................................ 6
Smart Shopping in the Popular Press .............................................................................. 6 Theoretical Framework ................................................................................................... 8
Economic Theory ........................................................................................................ 8 Consumer Efficiency ................................................................................................ 10
Costs ...................................................................................................................... 11 Benefits ................................................................................................................. 13
Utilitarian Aspect .............................................................................................. 14 Hedonic Aspect ................................................................................................. 15
Consumer Decision-Making Process ........................................................................ 16 Chapter Summary ......................................................................................................... 19
CHAPTER III ................................................................................................................... 22 Methods............................................................................................................................. 22
The Research Process ................................................................................................... 22
Qualitative Inquiry ........................................................................................................ 24 Focus Group Interviews ............................................................................................ 25
Focus Group Interview Data Analyses ..................................................................... 31 Thematic findings ................................................................................................. 33
Goals ................................................................................................................. 33
Activities/Behaviors .......................................................................................... 34
Feelings/Outcomes ............................................................................................ 35 Importance ........................................................................................................ 36 Opposites of Smart Shopping ........................................................................... 36
Outcome of Focus Group Interviews .................................................................... 36 Face-to-Face In-Depth Interviews ............................................................................ 37
Face-to-Face In-Depth Interview Data Analyses ...................................................... 42 Conceptualization of Smart Shopping ...................................................................... 43
Conceptual Framework ................................................................................................. 44 Measure Development .................................................................................................. 47
Initial Item Generation .............................................................................................. 47 Instrument Development ........................................................................................... 57
Quantitative Methods .................................................................................................... 58
Pilot Test: Initial Scale Refinement .......................................................................... 60 Pretest: Scale Purification ......................................................................................... 62
Main Study: Scale Validation ................................................................................... 63 Validity Testing .................................................................................................... 65
Chapter Summary ......................................................................................................... 70 CHAPTER IV ................................................................................................................... 71
v
Results and Discussions .................................................................................................... 71
Pilot Test: Initial Scale Refinement .............................................................................. 71 Pretest: Scale Purification ............................................................................................. 77 Main Study: Scale Validation ....................................................................................... 82
Sampling Procedures ................................................................................................ 88 Descriptive Statistics ................................................................................................. 89 Preliminary Statistical Analysis ................................................................................ 92 Scale Validation ........................................................................................................ 95
Pre-purchase Results ............................................................................................. 96
Clothing............................................................................................................. 96 Grocery ............................................................................................................. 99 Electronics....................................................................................................... 105 Invariance Testing ........................................................................................... 106
Purchase Results ................................................................................................. 109 Clothing........................................................................................................... 109
Grocery ........................................................................................................... 113 Electronics....................................................................................................... 116
Invariance Testing ........................................................................................... 118 Post-purchase Results ......................................................................................... 118
Grocery ........................................................................................................... 126
Electronics....................................................................................................... 128 Invariance Testing ........................................................................................... 130
Validity Testing ...................................................................................................... 130 Construct validity ................................................................................................ 130 Nomological validity .......................................................................................... 133
Pre-Purchase and Purchase Stage ................................................................... 143
Post-Purchase Stage ........................................................................................ 145 Discussion of Findings ................................................................................................ 146 Chapter Summary ....................................................................................................... 149
CHAPTER V .................................................................................................................. 151 Conclusions and Implications ......................................................................................... 151
Summary of Findings .................................................................................................. 151 Pre-Purchase Stage.................................................................................................. 153
Purchase Stage ........................................................................................................ 155 Post-Purchase Stage ................................................................................................ 156
Implications................................................................................................................. 157 Limitations and Directions for Future Research ......................................................... 159
LIST OF REFERENCES ................................................................................................ 161
APPENDICES ................................................................................................................ 168 Focus Group Interview Schedule ................................................................................ 169
Face-to-Face In-Depth Interview Schedule ................................................................ 170 Initial Smart Shopping Survey Instrument ................................................................. 171 Smart Shopping Pilot Test Instrument ........................................................................ 177 Smart Shopping Pretest Instrument ............................................................................ 181
vi
Smart Shopping Main Study Instrument..................................................................... 187
Main Study Group Comparison: Gender and Age within Product Category ............. 193 Main Study Assessment of Normality by Scale Item ................................................. 196 Main Study Assessment of Normality by Construct................................................... 198
Final Smart Shopping Scale Items .............................................................................. 199 VITA ............................................................................................................................... 202
vii
LIST OF FIGURES Figure 1 Smart Shopping Research Process ..................................................................... 23 Figure 2 Smart Shopping Conceptual Framework ............................................................ 45 Figure 3 Smart Shopping Scale Development Process ..................................................... 59
Figure 4 Original Measurement Model: Pre-Purchase ..................................................... 97 Figure 5 Final Pre-Purchase Model: Clothing ................................................................ 101 Figure 6 Final Pre-Purchase Model: Grocery ................................................................. 104 Figure 7 Final Pre-Purchase Model: Electronics ............................................................ 107 Figure 8 Original Measurement Model: Purchase .......................................................... 110
Figure 9 Final Purchase Model: Clothing ....................................................................... 114 Figure 10 Final Purchase Model: Grocery ...................................................................... 117 Figure 11 Final Purchase Model: Electronics ................................................................. 119 Figure 12 Original Measurement Model: Post-Purchase ................................................ 120
Figure 13 Final Post-Purchase Model: Clothing ............................................................. 124 Figure 14 Final Post-Purchase Model: Grocery.............................................................. 127
Figure 15 Final Post-Purchase Model: Electronics ......................................................... 129 Figure 16 Final Model of Smart Shopping ..................................................................... 154
viii
LIST OF TABLES Table 1 Smart Shopping Categories and Illustrative Comments: Focus Group Interviews
................................................................................................................................... 32 Table 2 Sample Characteristics: In-Depth Interviews ...................................................... 40
Table 3 Smart Shopping Categories and Illustrative Comments: In-Depth Interviews.... 46 Table 4 Pre-Purchase Scale Items ..................................................................................... 49 Table 5 Purchase Scale Items ........................................................................................... 50 Table 6 Post-Purchase Scale Items ................................................................................... 51 Table 7 Measurement Items for Validity-Checking: Pre-Purchase and Purchase ............ 52
Table 8 Measurement Items for Validity-Checking: Post-Purchase ................................. 55 Table 9 Pilot Test Rotated Component Matrix: Pre-Purchase .......................................... 73 Table 10 Pilot Test Rotated Component Matrix: Purchase .............................................. 74 Table 11 Pilot Test Rotated Component Matrix: Post-Purchase ...................................... 75
Table 12 Pretest Sample Characteristics ........................................................................... 78 Table 13 Pretest Factor Loadings: Pre-Purchase Stage .................................................... 79
Table 14 Pretest Factor Loadings: Purchase Stage ........................................................... 81 Table 15 Pretest Factor Loadings: Post-Purchase Stage ................................................... 83
Table 16 Pretest Model Fit Statistics ................................................................................ 84 Table 17 Pre-Purchase Summary of Scale Items .............................................................. 85 Table 18 Purchase Summary of Scale Items..................................................................... 86
Table 19 Post-Purchase Summary of Scale Items ............................................................ 87 Table 20 Main Study Sample Characteristics ................................................................... 90
Table 21 Main Study Characteristics by Product Category .............................................. 91 Table 22 Main Study Sample Comparison: Chi-Square Test ........................................... 93 Table 23 Main Study Sample Comparison: ANOVA ....................................................... 94
Table 24 Main Study Goodness-of-Fit Statistics: Pre-Purchase ....................................... 98
Table 25Main Study Standardized Loadings: Pre-Purchase ........................................... 100 Table 26 Main Study Composite Reliability: Pre-Purchase ........................................... 102 Table 27 Main Study Invariance Testing: Model Fit and Model Comparison ............... 108
Table 28 Main Study Goodness-of-Fit Statistics: Purchase ........................................... 111 Table 29 Purchase Standardized Loadings ..................................................................... 112
Table 30 Main Study Composite Reliability: Purchase .................................................. 115 Table 31 Main Study Goodness-of-Fit Statistics: Post-Purchase ................................... 122
Table 32 Main Study Standardized Loadings: Post-Purchase ........................................ 123 Table 33 Main Study Composite Reliability: Post-Purchase .......................................... 125 Table 34 Main Study Average Variance Extracted (AVE) ............................................ 132 Table 35 Discriminant Validity: Pre-Purchase Clothing Model ..................................... 134 Table 36 Discriminant Validity: Pre-Purchase Grocery Model ...................................... 135
Table 37 Discriminant Validity: Pre-Purchase Electronics Model ................................. 136 Table 38 Discriminant Validity: Purchase Clothing Model ........................................... 137
Table 39 Discriminant Validity: Purchase Grocery Model ............................................ 138 Table 40 Discriminant Validity: Purchase Electronics Model ....................................... 139 Table 41 Discriminant Validity: Post-Purchase Clothing Model ................................... 140 Table 42 Discriminant Validity: Post-Purchase Grocery Model .................................... 141
ix
Table 43 Discriminant Validity: Post-Purchase Electronics Model ............................... 142
Table 44 Hypotheses Testing: Pearson Correlations ...................................................... 144
1
CHAPTER I
INTRODUCTION
Dramatic changes are taking place in the U.S. marketplace. Socioeconomic
changes such as the aging consumer population, the increasing numbers of dual-income
families and single-parent households, the pervasive presence of time poverty, and the
thriving technological innovations are shifting consumer shopping patterns (Crutsinger,
2006; Kim, Sullivan, & Forney, 2007). Consumers are shopping less frequently, visiting
fewer stores per trip, and spending less per purchase (Reynolds, Ganesh, & Luckett,
2002). Furthermore, consumers are shopping at the closest stores or shopping during slow
traffic times to reduce the total shopping time required (Alreck & Settle, 2002). Focused
on the functional aspects of shopping such as task completion and product acquisition,
these consumers want convenient locations and ease of shopping in addition to low prices
(Poloian, 2003).
In a 2003 poll of consumers regarding reasons for not shopping regularly at value
grocers (mass merchandisers, warehouse, and big box stores), participants indicated that
the value grocers were too far away (64%), too crowded (13%), had too long and slow
checkout processes (8%), and items were too hard to find quickly (4%) (Frank, Mihas,
Narasimhan, & Rauch, 2003). In a similar study conducted two years later, dislike of
overcrowding increased from 13% to 21% (Back, Haveron, Narasimhan, Rauch, &
Sneader, 2005). These reasons for not shopping at value grocers seem to be connected to
consumers‟ perceptions of excessive time and energy spent traveling to or shopping at
these value stores. The results of these consumer polls appear to indicate that the benefits
2
of reduced prices do not always outweigh the costs of increased time and effort involved
in making purchases
Wal-Mart has responded to these types of consumer complaints about the
functionality of value retailer formats by experimenting with a new store format (i.e.,
Neighborhood Market) that is more similar to traditional grocery stores and only about a
quarter of the size of a typical Wal-Mart supercenter. These restructured stores reduce
customers‟ expenditure of time and energy with convenient locations and smaller square
footage stores, which enable customers to make quicker shopping trips (Barta, Martin,
Frye, & Woods, 1999; Frank et al., 2003). Dollar store retailers are another retail format
that has recently received much positive attention because of the ways they meet
consumer needs. A rising number of consumers are shopping at dollar stores to receive
low prices, good name brand product selections, and convenient store locations while
reducing the amount of time and energy needed for their shopping activities (Koch, 2005;
"Low prices, treasure hunts build dollar empire," 2003; Silverstein & Roche, 2006).
In addition to the functional aspects of shopping that are focused on task
completion and product acquisition, hedonic aspects are associated with the emotional
benefits of shopping. Pine and Gilmore (1999) proposed that consumers desire traditional
products and services (e.g., low prices, good selection), yet they are increasingly desiring
“a series of memorable events.” This desire for memorable events indicates that
consumers are seeking emotional or hedonic benefits from their shopping experiences in
addition to task completion.
3
Marketing in “the experience economy” requires a focus on customer experiences
instead of the traditional features-and-benefits approach used by traditional marketing
methods (Schmitt, 1999). Examples of experiential retailers are restaurants such as the
Bubba Gump Shrimp Company and Rainforest Cafe, specialty stores such as Build-a-
Bear Workshop and Bass Pro Shops, and grocers such as Whole Foods Market and Stew
Leonard‟s. These retailers provide more than a meal or a product; they transform their
retail spaces into unique experiences that engage the customer in personal ways. Hedonic
experiences are derived from attractive displays, unique product selections, and
interactive environments that engage customers‟ senses.
These trends and changes in the marketplace are creating consumer demand for
better outcomes (e.g., satisfaction, positive feelings) in exchange for their participation in
shopping activities (Poloian, 2003; Reynolds et al., 2002). Today‟s busy consumers want
shopping trips that minimize the costs and maximize the benefits associated with the
shopping experience. The results of such shopping experiences are consumers who feel
smart about their purchases although the term smart shopping has historically been
defined as achieving monetary saving (Garretson & Burton, 2003; Schindler, 1989;
Shimp & Kavas, 1984). In short, retailers must begin to compete for today‟s “smart”
shopper who places importance on both price and non-price dimensions of shopping
experiences.
Purpose of the Study
The purpose of this study is to gain a better understanding and conceptualization
of the term smart shopping through the use of qualitative and quantitative methods. To
4
conceptualize smart shopping, it is important to consider the various concepts
surrounding the term. A comprehensive literature review will identify existing smart
shopping concepts and theories, uncover the current academic definitions of the term
smart shopping, and identify opportunities for expanding upon the existing meanings of
the term. Consumers‟ perceptions of the term smart shopping will be further understood
through the use of focus group and face-to-face in-depth interviews. Finally, a pilot test,
pretest, and main study will be conducted to develop and validate a scale measuring
smart shopping activities and behaviors.
Contributions of the Study
This study is important for both theory and practice. Its contributions include: (a)
providing an empirically-tested measure of smart shopping; (b) identifying ways of
meeting the needs of smart shoppers; and (c) suggesting methods of marketing to smart
shoppers.
To compete in today‟s challenging retail environment where consumers‟
socioeconomic patterns and preferences are shifting, retailers must decide on unique
positioning strategies. Gaining a better understanding of the smart shopper will enable
retailers to segment smart shoppers more accurately and create more effective positioning
strategies that have the potential to increase market share in this competitive
environment.
Regarding theory, this study can assist academics in understanding how today‟s
consumer uses the term smart shopping. Although the term smart shopping has primarily
been defined in academe by monetary savings, this does not necessarily reflect the way
5
today‟s consumer uses the term. As a result, a more comprehensive definition of smart
shopping will contribute to current consumer behavior theories.
6
CHAPTER II
LITERATURE REVIEW
The purpose of this study is to gain a better understanding and conceptualization
of the term smart shopping through examining popular culture, a comprehensive review
of literature, and consumer interviews. This chapter provides a brief examination of the
term smart shopping in the popular press and a comprehensive literature review related to
the theoretical framework of the study, which is based upon the foundations of economic
theory, consumer efficiency, and the consumer decision-making process.
Smart Shopping in the Popular Press
The terms smart shopper and smart shopping can be seen in the popular press on
newscasts, websites, and bookshelves. Articles on smart shopping discuss topics such as
information gathering, planning, preparation, organization, and shopping enjoyment. In
addition, they give tips on comparison shopping, saving time, saving money, and getting
referrals from other shoppers (electronically or via word of mouth). For example, a book
search on www.amazon.com included one book entitled “Tips of Smart Shopping”
(Gross & Stone, 2002) and another book that stated “Smart shopping doesn‟t always
mean buying the cheapest item…” (Wallner & Matisic, 2005, p. 13).
An online search of Home & Garden Television (HGTV) included two episodes
on smart shopping in 2002 (i.e., “Being a Smart Shopper” and smart shopping)
(www.hgtv.com). The tips in these HGTV episodes on saving time and money included
comparison shopping, making and sticking to a shopping list, and buying more than one
of a product you love. In a recent magazine article, Hamilton-Wright (2007) emphasized
7
the importance of enjoyment in the smart shopping experience. She reminded shoppers of
the recreational aspect of smart shopping and of the balance between finding price
savings and enjoying the experience.
The nationally-known magazine, Consumer Reports, published by an expert,
independent, non-profit organization, has included articles on how to “shop smart” since
1992. One such article discussed automobile fuel efficiency and how to save money and
energy ("Drive smart, save money," 2004), and another discussed product reliability and
brand repair histories ("Buy reliable, fix smart," 2002). The response to these smart
shopping articles was so positive that the editors of Consumer Reports now publish a
magazine entitled ShopSmart. The magazine touts, “you can rely on ShopSmart to tell the
truth and help you make the smart choice every time” ("NOT your typical magazine,"
2007, p. 2). These articles indicate that shopping activities include the expenditure of
time, money, and energy and often include emotional benefits from the shopping
experience itself.
In a search of academic literature on the topic smart shopping, the following
studies were uncovered: Garretson and Burton (2003) studied coupon and sale-prone
consumers; Langer (1997) examined brand loyalty; Schindler (1998, 1989) studied smart-
shopper feelings related to price promotions; and Shimp and Kavas (1984) analyzed
coupon usage and the theory of reasoned action. Each of these studies placed a heavy
emphasis on monetary savings related to smart shopping. This focus on price and price
promotions presents an opportunity to expand the constructs of smart shopping costs and
benefits beyond monetary savings.
8
Theoretical Framework
The theoretical framework of this study is based upon economic theory, consumer
efficiency theory, and the consumer decision-making process. This section of the study
will provide an examination of economic theory, identify the main components of
consumer efficiency theory (i.e., costs and benefits), and discuss the consumer decision-
making process.
Economic Theory
The study of economics is concerned with how individuals, companies,
governments, and other organizations within our society make choices and how those
choices impact the way the society‟s resources are used (Stiglitz, 1997). Similarly,
consumption economics is the study of the choice-making processes of consumers where
the desire to satisfy their wants and needs exceeds their resources (Cochrane & Bell,
1956).
The problem of choice is the central issue in consumer economics (Cochrane &
Bell, 1956). The conditions of this problem are such that each consumer has (a) a finite
income, (b) varied and infinite wants to be satisfied, and (c) a price to pay for each good
or service. Given these conditions, consumers cannot purchase all the desired goods and
services because of resource scarcity (i.e., limited resources); therefore, some
combination of the available goods and services must be selected. As a result, consumers
must make tradeoffs and select some combination of goods and services limited by the
constraints of time, money, and energy (Stiglitz, 1997).
9
Utility has been defined as the psychological benefits, such as pleasure and
satisfaction, that consumers derive from the goods or services they consume (Cochrane &
Bell, 1956). The basic utility model says that the evaluation of a particular choice
alternative is a function of the benefit of the alternative (Hansen, 1972). Hansen (1972)
elaborated to say that the alternative with the highest evaluation will be selected.
According to economic theory, consumers are rational and make choices that
maximize their total utility (Cochrane & Bell, 1956). Maximizing total utility is
accomplished by choosing the most affordable combination of goods and services that
will provide the greatest benefit (Bade & Parkin, 2007).
Rational consumers are viewed as those who weigh costs and benefits involved in
each decision by taking into account all costs and not just direct expenditures
(Kahneman, 2000). Further, rational consumers are also thought to seek to maximize
utility (benefits received) and make decisions that accomplish this goal. This depiction of
the rational consumer suggests a robot-like consumer who calculates the allocation of
scarce resources for goods and services to ensure the greatest yield of utility (Boyes &
Melvin, 2008). This depiction of the rational consumer accurately describes the result of
consumer choice even if the actual process is not robotic.
A concept related to economic utility is „warm glow.‟ The term warm glow is in
reference to kindness or altruism that comes from doing something that is believed to be
good; it is a happiness factor (Andreoni, 1990). Warm glow is incorporated into
economic theory as a benefit of the expenditure of resources. One current example of
consumers desiring warm glow is consumer social responsibility. Many of today‟s
10
consumers are purchasing green products (i.e., products that have less detrimental effects
on the environment) for the warm glow it gives them. If regular and green products are
compared under traditional economic theories in terms of quality or price alone, the
regular products might more effectively maximize total utility; however, when warm
glow is the desired outcome of the green consumer, purchasing green products
maximizes his/her total utility.
Bargain hunting (shopping to save money) has recently been overtaken by
“treasure hunting” (not necessarily about lowest price). Treasure hunters seek good
quality, low prices, and the emotional benefits of “the find” (Silverstein, 2006). The
treasure hunter‟s desire for the satisfaction of “the find” can be compared to the economic
desire for warm glow. “The find” is a happiness factor that provides greater utility than
merely the usefulness of product.
Consumers make everyday choices to minimize costs and maximize benefits
because resources are scarce, and because they desire positive benefits from the
expenditure of their resources. Further, many consumers make decisions (e.g., purchasing
a fuel-efficient car, telling others about sale prices) for the warm glow or positive feelings
that are a result of doing something good. Today‟s smart shoppers can be viewed as
desiring a warm glow from minimizing the costs and maximizing the total utility of their
purchases of goods and services.
Consumer Efficiency
Traditional consumer efficiency literature describes shopping activities in terms
of performing necessary functions at a minimal cost (Ingene, 1984). Downs (1961)
11
discussed the theory of consumer efficiency wherein the consumer sought to minimize
consumption costs (e.g., money, time, energy) relative to outputs or benefits received
(e.g., goods, information, pleasure) on a specified shopping trip. Other researchers also
described consumer efficiency as the tradeoff between sacrifices and benefits (Dodds,
Monroe, & Grewal, 1991; Payne & Holt, 2001) or between input and output (Ingene,
1984).
Costs
Purchase costs have been explained with many different variables. Downs (1961)
separated purchase costs into the monetary costs (i.e., price) and non-monetary costs (i.e.,
time, energy). In his study, monetary costs included the cost of goods and transportation
and any income foregone by time spent shopping. Time costs involved traveling and
parking, traveling from car to store, traveling between stores, and selecting and
purchasing goods from each store. Energy costs included „basic‟ energy expenditures
(e.g., related to the normal amount of time and energy involved) and „extra‟ energy
expenditures (e.g., energy used to carry packages or assemble products once purchased).
In 1964, Bender extended the concept of consumer purchase costs by separating
total purchase costs into prime costs (actual price of the goods) and secondary costs (all
other costs of acquisition). He described the secondary costs as: price (e.g., installation
charges, sales taxes) time (e.g., travel time, searching time), and psychological factors
(e.g., frustration, annoyance). He considered the total purchase-costs to be made up of
prime and secondary purchase-costs. While some consumers in Bender‟s study were not
heavily influenced by the secondary purchase-costs, others were influenced by these costs
12
because they understood that the secondary costs frequently exceeded the prime cost
(price) of the goods. In both Downs‟ (1961) and Bender‟s (1964) studies, the primary
cost of goods was monetary.
In a later study, Murphy and Enis (1986) conceptualized costs on two dimensions:
effort and risk. Effort included the amount of money, time and energy the consumer spent
to purchase a product. Risk was an assessment of the consequences of making a buying
mistake. Unlike previous studies, their study grouped the consumer costs of time, money,
and energy into a category labeled effort.
In addition to previous cost discussions, Swinyard (1997) described consumers‟
payment for purchases in terms of opportunity costs (e.g., the cost of pursuing one
choice over another ) and psycho-social costs (e.g., stress, anxiety and uncertainty). The
author proposed that customers wanted to “get their money‟s worth” by receiving
appropriate benefits for the costs of the purchase (Swinyard, 1997, p. 254). In another
study, Bell, Teck-Hua, and Tang (1998) separated the total cost of a shopping trip into
fixed costs (independent of the shopping list) and variable costs (dependent upon the
shopping list). They reported that variable costs changed among trips because the
shopping list differed for each trip. Through the empirical results of their study, they
found that both fixed (i.e., travel costs) and variable costs (i.e., goods on the shopping
list) played significant roles in consumers‟ store choice. For example, store location
(fixed cost) and pricing format (variable cost) were both factors in consumers‟ store
choice.
13
In review, shopping costs identified in the consumer efficiency literature can be
classified as monetary costs (price) and non-monetary costs (time and effort); prime and
secondary costs; effort and risk; opportunity costs and psychological costs; and fixed and
variable costs. These studies represent many different ways in which consumer costs can
be divided. In each, consumers desired to reduce the costs spent on the purchase although
the definition of costs differed among studies.
Benefits
Purchase benefits have also been explained with many different variables. Downs
(1961) defined benefits or returns of a shopping trip as the goods, information, and
pleasure received from a shopping trip and proposed that consumers minimized costs by
maximizing benefits. Other researchers reported benefits that consumers desire from their
shopping experiences as: products that perform as expected (Swinyard, 1997),
information (Ingene, 1984), pleasure from shopping (Babin, Darden, & Griffin, 1994;
Tauber, 1972), “the right goods at the right time in the right place for the right price”
(Ingene, 1984, p. 32), low price (Zeithaml, 1988), “whatever I want in a product”
(Zeithaml, 1988, p. 13), and convenience (Keeney, 1999). Kim and Kang (1997) argued
that shopping benefits include the quality, price, and the return on the investment of time
and effort expended to purchase the products. These arguments indicate that multiple
shopping benefits are likely to be received from a shopping trip. For example, one benefit
of a shopping trip to an outlet mall might be receiving low prices on products, but an
additional benefit might include obtaining pleasure from taking the shopping trip with
friends.
14
Researchers have categorized shopping benefits into utilitarian benefits (i.e.,
rational, functional, task-related) and hedonic benefits (i.e., emotional, fun, enjoyment)
(Hirschman & Holbrook, 1982; Kim & Kang, 1997; Kim et al., 2007; Mathwick,
Malhotra, & Rigdon, 2001; Sweeney & Soutar, 2001). In the next sections, utilitarian and
hedonic aspects are discussed to provide a clearer understanding of the desired shopping
outcomes.
Utilitarian Aspect
The benefits or returns of a shopping trip can have utilitarian value. Utilitarian
value has been associated with decision utility or the task-related and rational aspect of
shopping (Batra & Ahtola, 1991) such as the accomplishment of productive work or
“shopping as work” (Carsky & Dickinson, 1995; Sherry, McGrath, & Levy, 1993). A
consumer obtains utilitarian shopping value when the necessary product is obtained; the
utilitarian value is increased as the product is obtained with less effort (Griffin, Babin, &
Modianos, 2000).
Academic research using the term smart shopping has primarily related to the
utilitarian benefits of price and price promotions: coupon and sale-prone consumers
(Garretson & Burton, 2003); price promotions (Schindler, 1989, 1998); and coupon usage
(Shimp & Kavas, 1984). This emphasis on monetary savings excludes other utilitarian
benefits such as saving time and effort. In addition, the emphasis on utilitarian benefits in
the smart shopping literature presents a substantial opportunity to expand smart shopping
benefits to include the hedonic benefits of accomplishing a task.
15
Hedonic Aspect
Consumers receive hedonic benefits from shopping experiences that go beyond
the utilitarian accomplishment of a task. Hedonic benefits have been described as
subjective, intangible benefits of shopping such as fun, enjoyment of the product, and
feelings of pleasure evoked by the product (Hirschman & Holbrook, 1982). The hedonic
aspect of shopping reflects the potential entertainment and emotional worth of a shopping
trip and may include feelings such as arousal, satisfaction, and entertainment (Holbrook
& Hirschman, 1982).
Schindler (1989) used “smart shopping feelings” to describe the ego-related
aspect (i.e., self concept) of consumer emotions and excitement generated by price
promotions. Jin and Sternquist (2004) investigated enjoyment as an aspect of price
savings. They found that consumers‟ hedonic responses were caused by price savings
because “the bargain may be a source of pride, excitement, increased sensory
involvement, and accomplishment” (p. 3). Mano and Elliott (1997) evaluated the hedonic
value consumers received from smart purchases in which consumers felt responsible for
finding bargains. In addition, Kim et al. (1997) examined shopping outputs (utilitarian,
hedonic, overall value) and argued that purchases resulted in both utilitarian and hedonic
benefits for the consumer. Contrary to the traditional expectation that hedonic value was
driven by enjoying an attractive atmosphere or relaxing while shopping, Kim and Kang‟s
(1997) study indicated that hedonic shopping value was driven by making purchases at
low prices.
16
In each of the studies mentioned, the hedonic shopping experiences that were
exciting, fascinating, or desirable were a function of a utilitarian activity (i.e., monetary
savings). Though the hedonic benefits of smart shopping have been discussed less
frequently than the utilitarian benefits in the smart shopping literature, smart shopping
does appear to include a desirable hedonic benefit component that appeals to many
shoppers.
Consumer Decision-Making Process
Consumers are forced to make important decisions on the products and services
they use on a daily basis. Their decisions are made from a set of alternatives that vary in
size from one decision to the next (Bettman, Luce, & Payne, 1998). To assist in making
decisions regarding their purchases, consumers utilize various sources of available
information (i.e., memory, external sources) (Coupey, Bodur, & Brinberg, 1998).
Consumers often rely on heuristics in decision-making. Heuristics can be defined
as “shortcuts, retrieved from memory, for acquiring and evaluating information”
(Coupey, 1994, p. 83). When a heuristic is not available for a particular decision,
consumers may opportunistically process information in order to construct a heuristic for
that particular decision. Coupey (1994) found that consumers constructed and
restructured decision information into a form that was easier for them to understand in
order to evaluate alternatives. For example, a consumer may compute the price per unit of
a product to evaluate one retailer‟s unit price against a competing retailer.
Consumers also use external sources of information for their decision-making.
External sources, such as the Internet, provide consumers with a vast amount of
17
information, enable them to obtain information from many sources, and enable them to
receive it in a variety of formats (Coupey et al., 1998). Rapid technological change and
new communication mediums such as the Internet have enhanced the consumer decision-
making process (Bettman et al., 1998).
Researchers agree that consumers typically go through a series of steps in their
decision-making process (Coupey et al., 1998). Blackwell et al. (2005) depicted the
Consumer Decision-Process Model with several decision stages: need recognition, search
for information, pre-purchase alternative evaluation, purchase, consumption, and post-
purchase alternative evaluation, and divestment. In the need recognition stage, consumers
perceive a disparity in their desired and actual states, which activates the decision
process. In the search for information stage, the consumer searches his/her memory (i.e.,
internal search) or acquires information from outside sources (i.e., external search). In the
third stage, pre-purchase alternative evaluation, the consumer evaluates and narrows
down the options. The purchase stage explains the acquisition of the desired item or an
acceptable substitute for the item, followed by the consumption stage. In the post-
purchase alternative evaluation stage, the consumer evaluates the item based upon the
satisfaction of the consumption experience. Finally, the remains of the unconsumed
product are disposed of in the divestment stage (Blackwell et al., 2005).
Consumer decision-making can further be examined based upon individual
decision-making styles. Previous consumer literature has characterized consumer styles
in three ways: the psychographic/lifestyle approach (Darden & Ashton, 1974), the
18
consumer typology (Reynolds et al., 2002; Stone, 1954) and the consumer characteristics
approach (Sproles & Kendall, 1986; Westbrook & Black, 1985).
Using the psychographic/lifestyle approach, Darden and Ashton (1974)
interviewed suburban housewives and identified seven distinct preference groups based
upon lifestyle: the apathetic shopper, the demanding shopper, the quality shopper, the
fastidious shopper, the stamp preferer, the convenient location shopper, and the stamp
haters. They found differences in lifestyle among supermarket attribute preference
groups. For example, the stamp preferer chose supermarkets offering trading stamps and
competitive prices. The authors proposed that the lifestyle and shopping orientations of
the seven groups were valuable for understanding store patronage.
Employing the consumer typology approach, Reynolds, Ganesh, and Luckett
(2002) examined traditional mall and factory-outlet mall shoppers to derive shopper
typologies based upon retail attribute importance. The 16 retail attributes employed
included items such as cleanliness of mall, friendliness of employees, and availability of
parking. Five shopper groups were revealed through cluster analyses for the traditional
mall (i.e., basic shoppers, apathetic shoppers, destination shoppers, enthusiasts, and
serious shoppers) and six groups were revealed for the outlet mall (i.e., basic shoppers,
apathetic shoppers, destination shoppers, enthusiasts, serious shoppers, and brand
seekers). The authors proposed that understanding the types of shoppers at the retail
outlets and the retail attributes the shoppers valued were important in creating
competitive strategies.
19
In their consumer characteristics approach to consumer decision-making styles,
Sproles and Kendall (1986) defined consumer decision-making style as “a mental
orientation characterizing a consumer‟s approach to making choices” ( p. 268). Through
extensive examination of decision-making, the authors identified eight consumer
decision-making styles: perfectionist, brand conscious, novelty, recreational, price-
conscious, impulsive, confused by overchoice, and habitual (Sproles & Kendall, 1986).
These eight characteristics of decision-making are measured through a Consumer Styles
Inventory.
As this review of literature indicates, there are many facets of consumer decision-
making that shape buying and consumption behavior. Consumer decision-making is an
important subject for academics and retailers, because it can be used to analyze, segment
and target consumer groups through identifying their needs in the different decision-
making stages. Three consumer decision-making stages (i.e., pre-purchase, purchase, and
post-purchase) will be examined reflective of Blackwell et al.‟s (2005) Consumer
Decision-Process Model, because they most specifically depict the activities and
outcomes associated with this study.
Chapter Summary
The researcher has examined the term smart shopping in popular culture and
proposed a theoretical framework for conceptualizing smart shopping based upon a
comprehensive review of literature. The popular culture smart shopping articles included
references to information gathering, planning, preparing for the shopping trip, organizing,
comparison shopping, saving time, saving money, getting referrals from other shoppers,
20
and receiving enjoyment from the shopping trip. Upon examination, the smart shopping
activities included the expenditure of time, money, and energy and often discussed the
emotional benefits from the shopping experience itself.
The theoretical framework of the study is based upon the foundations of economic
theory, consumer efficiency, and the consumer decision-making process. Related to
economic theory, consumers make everyday choices to minimize costs and maximize
benefits because resources are scarce and they desire positive benefits from the
expenditure of their resources. Further, many consumers make decisions (e.g., purchasing
a fuel-efficient car; telling others about sale prices) for the warm glow or positive feelings
that result from doing something good.
Downs‟ (1961) seminal paper on consumer efficiency discussed the theory
wherein the consumer sought to minimize consumption costs (e.g., money, time, energy)
relative to outputs or benefits received (e.g., goods, information, pleasure) on a specified
shopping trip. Purchase costs have been explained with many different variables such as
monetary costs (i.e., price) and non-monetary costs (i.e., time, energy) (Downs, 1961).
Shopping benefits have also been explained with several different variables. The main
two benefits discussed in this study will be utilitarian benefits (i.e., rational, functional,
task-related) and hedonic benefits (i.e., emotional, fun, enjoyment) (Hirschman &
Holbrook, 1982; Kim et al., 2007; Mathwick et al., 2001; Sweeney & Soutar, 2001).
Blackwell et al. (2005) depicted the Consumer Decision-Process Model with
several decision stages: need recognition, search for information, pre-purchase alternative
evaluation, purchase, consumption, and post-purchase alternative evaluation, and
21
divestment. Specific to this study, three decision-making stages (i.e., pre-purchase,
purchase, and post-purchase) will be examined as they depict activities and outcomes
expected to be associated with smart shopping.
While this review of academic literature has been valuable in conceptualizing the
components of smart shopping, consumers‟ perceptions of the subject are necessary. A
better understanding and defining of the term can be further enhanced by including
consumers‟ descriptions of smart shopping.
22
CHAPTER III
METHODS
This study was designed to accomplish three objectives: (a) to investigate
consumers‟ perceptions of the term smart shopping; (b) to develop a measure of smart
shopping; and (c) to validate the measure of smart shopping.
The first section of this chapter will present the research process following the
rigorous guidelines of Churchill (1979). The second section presents the research design
of the qualitative inquiry in the form of focus group interviews and face-to-face in-depth
interviews. The third section describes the conceptual framework of smart shopping that
is the result of the qualitative analyses. The fourth section discusses measure
development in terms of initial item generation and instrument development. The final
section presents the quantitative methods used in the pilot test, pretest, and main study.
The Research Process
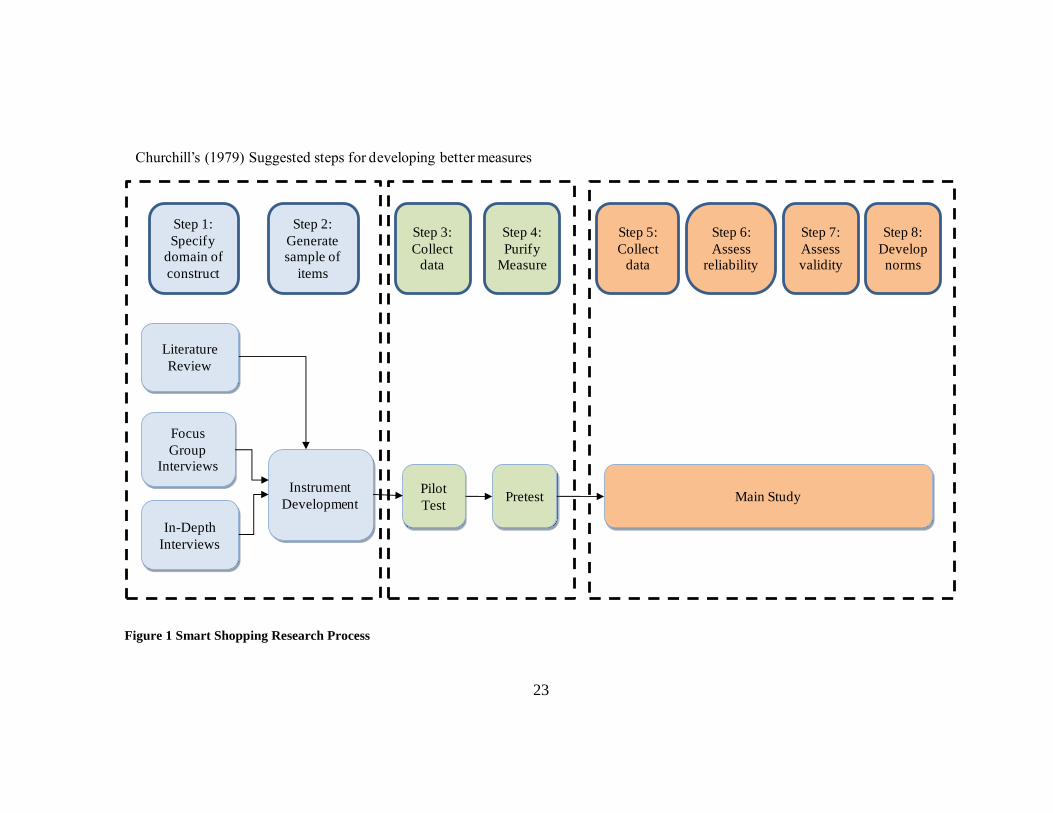
The research process for this study involved several data collection efforts, each
building on the previous step(s) (see Figure 1). These steps were chosen to follow the
rigorous guidelines articulated by Churchill (1979). Churchill‟s steps included: (a)
specify the domain of the construct, (b) generate sample of items, (c) collect data, (d)
purify the measure, (e) collect data, (f) assess reliability with new data, (g) assess
construct validity, and (h) develop norms (1979).
The first step of Churchill‟s (1979) suggested procedure for developing better
measures, specifying the domain of the construct, was accomplished via an academic
literature review and a review of popular consumer periodicals and websites. These
23
Focus
Group Interviews
Pilot
Test
Instrument
Development
In-Depth
Interviews
Literature
Review
Pretest Main Study
Step 1:
Specify domain of
construct
Step 2:
Generate sample of
items
Step 3:
Collect data
Step 4:
Purify Measure
Step 5:
Collect data
Step 6:
Assess reliability
Step 7:
Assess validity
Step 8:
Develop norms
Churchill‟s (1979) Suggested steps for developing better measures
Figure 1 Smart Shopping Research Process
24
reviews were conducted to identify existing concepts related to the term smart shopping
and to examine existing smart shopping theories. Step two, generating a sample of items,
was accomplished via the literature review, focus group interviews, and face-to-face in-
depth interviews. Focus group interviews were used because they are particularly
effective in the exploratory stages of research efforts at generating a range of opinions
about a specific topic (Morgan, 1988). Face-to-face in-depth interviews were used to
obtain a depth of information about the consumers‟ view of smart shopping (Morrison,
Haley, Sheehan, & Taylor, 2002). The literature review was combined with the interview
analyses and both were utilized in instrument development.
Steps three (collecting data) and four (purifying the measure) were accomplished
by collecting and analyzing data generated from a pilot test and a pretest. The pilot test
and pretest data were examined to determine whether the individual scale items belonged
to the domain of the concept and to evaluate the internal consistency of the items. Steps
five (collecting data), six (assessing reliability), seven (assessing validity), and eight
(developing norms), were conducted with the main study data.
Qualitative Inquiry
Employing qualitative methods in the exploratory stages of this study gave the
researcher the opportunity to gather and incorporate everyday consumers‟ views and
perspectives into the proposed smart shopping model. Consumers‟ perspectives helped to
more clearly define the term smart shopping beyond the current focus on price and price
promotions.
25
Qualitative research is an interpretive, naturalistic approach to the world that
attempts to understand and interpret what meanings people ascribe to phenomena
(Denzin & Lincoln, 2005). The qualitative approach can assist in developing a deeper
understanding of the nuances of phenomena. Qualitative research was described by
Strauss and Corbin (1998) as “the nonmathematical process of interpretation, carried out
for the purpose of discovering concepts and relationships in raw data and then organizing
these into a theoretical explanatory scheme” (p. 11). In this study, the researcher is
seeking to understand what the term smart shopping means to consumers and how they
feel about their smart shopping trips. Thus, qualitative methods are uniquely designed to
explore this topic.
Focus group methodology and face-to-face in-depth interviews were employed in
this study. The focus group interviews were analyzed with an ethnographic summary and
the face-to-face in-depth interviews were subjected to an inductive coding procedure. The
results of the two interview methods were combined with the review of literature for
instrument development.
Focus Group Interviews
Focus group interviews were chosen as the first data collection technique for this
exploratory or preliminary study because this method allows the researcher to gather a
broad range of customer perceptions about the topic in a relatively short period of time
(Gibbs, 1997; Krueger, 1994; Morgan, 1988). Focus groups are a form of group
interviewing; however, it is the interaction within the group that produces insightful data
(Morgan, 1988). The goal of the focus group interviews in this study was to identify
26
information regarding: (a) meanings associated with the term “smart shopping” and (b)
activities or behaviors involved in making a person feel like a smart shopper.
The focus group interviews in this study were not used as a self-contained
method, but as “preliminary research to prepare for specific issues in a larger project”
(Morgan, 1988, p. 24). This method suited the present study, because the term smart
shopping needed to be explored more thoroughly to prepare for the large-scale main
study.
The participants were selected from a convenience sample of graduate students,
faculty, and staff members in the Retail, Hospitality, and Tourism Management (RHTM)
department at a major southeastern university. Ideally, the focus group should bring
together six to twelve individuals who share the experience of interest (Fern, 2001;
Krueger, 1994; Morgan, 1988). The target audience of the focus group interview was
general consumers; therefore the invitation for participation was emailed to all faculty,
staff, and graduate students in the RHTM department. In his textbook on consumer
behavior, Solomon defined a consumer as “a person who identified a need or desire,
makes a purchase, and/or disposes of the product” (2002, p. 528). For the purpose of this
study, general consumers were all individuals over age 18 that purchase goods. This
sample population was chosen to provide the most general applicability to the population
at large.
The focus group interviews were scheduled during lunchtime and food was
provided. Lunchtime was chosen because there were fewer scheduling conflicts with the
classes being taught and it did not take university employees away from their regular
27
work. Food was provided based upon the recommendation of Krueger (1994) who
proposed that the presence of food “tends to promote conversation and communication
within the group” (p. 109).
The focus group session was held in the RHTM conference room because
Krueger (1994) and Morgan (1988) suggested a room that is familiar, easy to access, and
provides a large conference table and comfortable chairs where participants could make
eye contact with all other participants and the moderator. The location of focus group
interviews “is dictated by its accessibility and acceptability to the respondents” (Fern,
2001, p. 164). Only two focus group interviews were conducted in the interest of time
and because, according to Krueger (1994), the first two groups provide the most new
information even when additional focus groups are conducted. Further, the focus group
interviews were followed by face-to-face in-depth interviews; therefore, the researcher
felt that additional focus groups were not essential.
Because of the size of the room, voluntary participation, and the nature of the
study, the first focus group consisted of nine participants and the second consisted of
eight participants. The recommended size of the focus group interviews is 6 to 12
participants (Fern, 2001; Krueger, 1994; Morgan, 1988). Fewer than 6 participants limits
the total range of experiences of the group and more than 12 participants limits each
individual‟s opportunity to share insights (Krueger, 1994).
The two focus group interviews were structured to create homogeneity in terms of
group composition. Homogeneity helps the participants feel comfortable about sharing
their individual perspectives without feeling shy or intimidated by others in the group.
28
Group composition affects compatibility, cohesiveness, and the group process; the more
the individuals identify with the group and the more they are attracted to other group
members, the more cohesive the group will be (Fern, 2001). Fern (2001) proposed that
homogeneous groups should spend more time interacting with one another and should be
more compatible and cohesive than heterogeneous groups.
Other researchers reported that homogenous groups may not reveal diverse
opinions and experiences (Gibbs, 1997). Focus groups must have “sufficient variation
among participants to allow for contrasting opinions” (Krueger, 1994, p. 77).
Heterogeneous groups “increase the diversity and range of positions taken on issues that
are discussed” (Fern, 2001, p. 17); however, too much heterogeneity may stifle group
discussion because the members are incompatible (Fern, 2001; Gibbs, 1997). As a result,
within-group homogeneity and between-group heterogeneity is most desirable (Fern,
2001; Krueger, 1994).
The graduate student focus group consisted of eight females and one male,
ranging in age from 21 to 50 years. The faculty/staff focus group, with ages ranging from
31 to 60 years, was made up of eight females. The two focus groups were heterogeneous
between the groups in terms of age, job, and academic classification in that one consisted
of graduate students and the other consisted of faculty/staff members. The faculty/staff
group was homogeneous in terms of gender; the graduate student group was
homogeneous in terms of role within the university (i.e., all graduate students).
The primary researcher moderated the focus group and an unbiased recorder took
written notes. It is important that the moderator has adequate background knowledge of
29
the topic, uses mild, unobtrusive control over the group, respects the participants, and is
self-disciplined to withhold his/her personal opinions (Fern, 2001; Gibbs, 1997; Krueger,
1994). It is also important that the recorder takes comprehensive notes during the
discussion of participants‟ complete statements.
The researcher had classroom teaching experience that enabled her to moderate
and facilitate the group discussion; further, she obtained adequate background knowledge
of focus group interviewing through a review of focus group literature, websites, and
books. In addition, the researcher had individual conversations with researchers
experienced in focus group interviewing techniques.
The recorder was a professional researcher experienced in conducting focus group
interviews with the Center for Business and Economic Research at a major southeastern
university. In addition, the recorder had no association with the research topic,
committee, or department. The recorder attempted to document participant statements as
clearly as possible, but was forced to paraphrase when the discussion progressed quickly.
The interview began with welcoming the participants and introducing the
moderator and note taker. Participants were asked to speak freely and share their
individual points of view and were reminded that there was no right or wrong answer.
Participants were assured that the researcher and recorder would maintain confidentiality
and that their responses would only be used for research purposes. The researcher
ensured that the participant names were not associated with their responses by giving
each participant a number and referencing their responses with their unique number. In
addition, since there were no video or audio recordings of the interviews, their
30
confidentiality was further assured; however, focus group confidentiality is challenging
because there is always more than one participant in the group (Gibbs, 1997).
The researcher developed three open-ended questions for the focus group
interviews (see Appendix A). The typical one-to-two hour time span of focus groups
limits the number of topics that can be explored (Morgan, 1988), and subsequently the
number of questions asked. For an exploratory study, Morgan (1988) suggested exploring
only two or three topics. The open-ended focus group questions were derived from the
popular culture and academic literature review about smart shopping. The review
prompted the researcher to solicit the focus group participants‟ perceptions of the term
smart shopping and the activities and behaviors involved in smart shopping.
Each of the three main questions was posed to the groups. Probing questions were
used to elicit additional information when participants made vague comments. Probing
questions helped provide more detailed responses (Krueger, 1994). Examples of the
probing questions used in this study are located in Appendix A. These questions were
asked, as necessary, for clarification or explanation. To insure “the questioning route is
logical and complete” (Krueger, 1994, p. 55), the moderator asked the final question ,
“Have we missed anything?” Each focus group interview lasted approximately one hour;
this was well within the guidelines of one-to-two hours prescribed by Morgan (1988) and
Krueger (1994).
As suggested by Morgan (1988), the moderator and recorder had a debriefing,
immediately after each focus group session. They discussed and summarized topics and
31
themes shared by the focus groups in addition to comparing field notes taken during each
session.
Focus Group Interview Data Analyses
The researcher used an ethnographic approach to analyze the focus group data.
The ethnographic approach relies more heavily on quotations from the group discussions
rather than numerical descriptions of the data (Morgan, 1988). This approach was
consistent with the two goals of the present focus group interviews (i.e., understanding
the meaning associated with the term smart shopping and identifying the activities or
behaviors involved in making a person feel like a smart shopper).
To gain a better understanding of the information gathered in the focus group
interviews, the researcher reviewed the notes from each focus group and created response
categories based upon prior knowledge, review of literature, and topics that emerged
from the data. While participants shared a wide range of views, clear patterns emerged
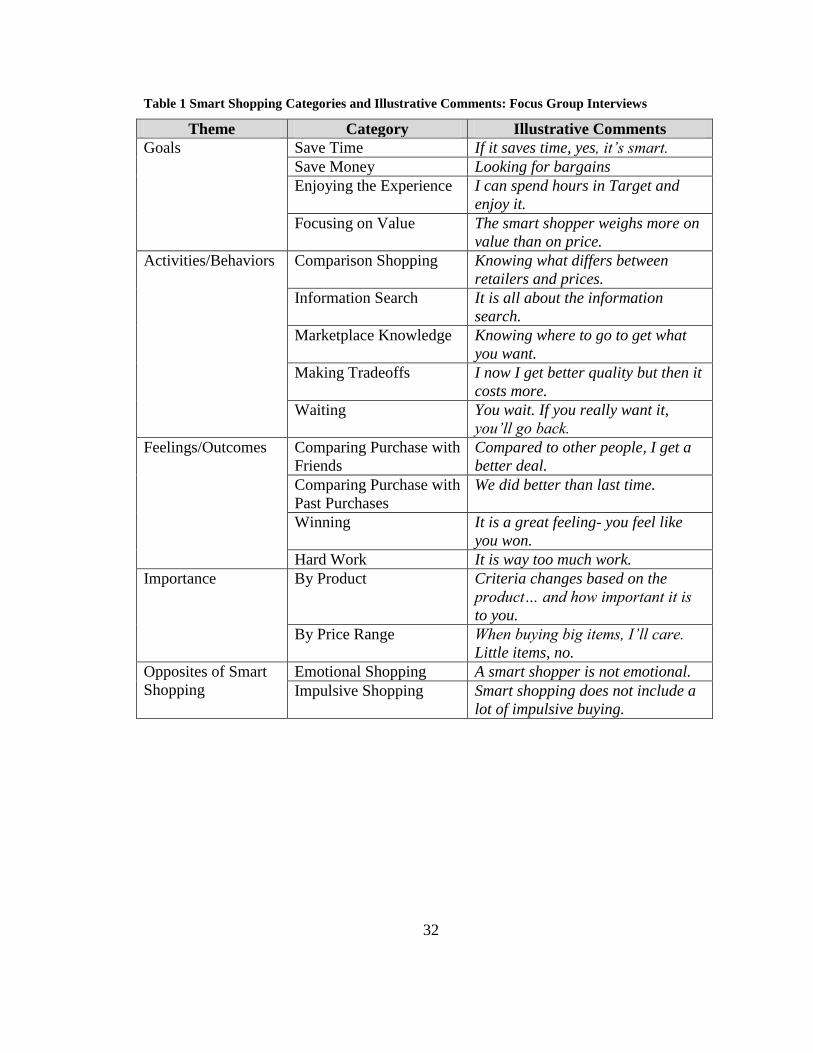
from the data. There were a total of 17 categories discovered during the data analysis (see
Table 1). To be considered a category, the topic had to be discussed by more than one
participant in both focus group interviews. Topics that were not discussed by both focus
groups or by more than one participant were not included in the 17 categories.
Some response categories were generated based upon prior knowledge of the
researcher as a consumer. For example, the information search category was generated
through participant discussions about using the Internet to search for information
combined with the researcher‟s prior experience conducting research prior to making a
purchase. Other categories were generated from the literature. For instance, making
32
Table 1 Smart Shopping Categories and Illustrative Comments: Focus Group Interviews
Theme Category Illustrative Comments
Goals Save Time If it saves time, yes, it’s smart.
Save Money Looking for bargains
Enjoying the Experience I can spend hours in Target and
enjoy it.
Focusing on Value The smart shopper weighs more on
value than on price.
Activities/Behaviors Comparison Shopping Knowing what differs between
retailers and prices.
Information Search It is all about the information
search.
Marketplace Knowledge Knowing where to go to get what
you want.
Making Tradeoffs I now I get better quality but then it
costs more.
Waiting You wait. If you really want it,
you’ll go back.
Feelings/Outcomes Comparing Purchase with
Friends
Compared to other people, I get a
better deal.
Comparing Purchase with
Past Purchases
We did better than last time.
Winning It is a great feeling- you feel like
you won.
Hard Work It is way too much work.
Importance By Product Criteria changes based on the
product… and how important it is
to you.
By Price Range When buying big items, I’ll care.
Little items, no.
Opposites of Smart
Shopping
Emotional Shopping A smart shopper is not emotional.
Impulsive Shopping Smart shopping does not include a
lot of impulsive buying.
33
tradeoffs of costs and benefits was labeled as a category based on the finding that
participants sacrificed price (cost) for time (benefit) and that they seek to obtain more
(benefit) than they spend (cost). Additionally, new categories such as waiting emerged
from the data based on the finding that participants must sometimes wait to make a smart
purchase.
Thematic findings
The 17 categories discovered during the focus group interviews were further
sorted into five smart shopping themes: (a) goals, (b) activities/behaviors, (c) feelings/
outcomes, (d) importance, and (e) opposites of smart shopping (see Table 1). These
themes are higher-level constructs into which the researcher organized the 17 categories.
Goals
The two most frequently mentioned goals of smart shopping were to save time
and to save money. Participants felt that a smart shopper was “someone who saves
money and time.” One participant said, “If it saves time, yes, it‟s smart” and another said
smart shopping was “looking for bargains.” Another goal discussed by the participants
was enjoying the smart shopping experience. This goal is evidenced by one participant
who said, “I can spend hours in Target and enjoy it.” Focusing on value was the last goal
of smart shopping that was brought forth in both focus group interviews. This was
explained by the participant who said, “The smart shopper weighs more on value than on
price.”
34
Activities/Behaviors
Based upon the focus group interviews, there appeared to be five specific types of
activities or behaviors in smart shopping: comparison shopping, information search,
marketplace knowledge, making tradeoffs, and waiting. Participants said that comparison
shopping was a smart shopping activity. Comparison shopping can be done by physically
visiting two or more stores, by searching through sale papers, or through searching the
Internet. One participant demonstrated the presence of comparison shopping with the
statement that smart shopping meant, “Knowing what differs between retailers and
prices.” Another participant described it as “product comparison.”
Information search was another activity involved in smart shopping. The
participants discussed many different ways that they conducted information searches, but
the consensus was that it was smart to do so. One participant stated, “It is all about the
information search.”
Another smart shopping activity discussed during both focus group interviews
was having marketplace knowledge. The marketplace knowledge discussions included
knowing where to shop and knowing people to ask about specific purchases. One
participant described marketplace knowledge as, “Knowing where to go to get what you
want” and another said, “You select different stores for different activities.” In addition,
participants discussed the fact that marketplace knowledge can be gleaned from other
consumers. In reference to knowing people to ask, one participant said, “I had to rely on
other people.”
35
The final smart shopping activities discussed were making tradeoffs and waiting.
Even though the ways participants made tradeoffs differed, the presence of making
tradeoffs in smart shopping was evident. Regarding making tradeoffs, one participant
said, “I know I get better quality but then it costs more,” and another said “I will sacrifice
price for time.” The concept of waiting was one topic that was not discovered in the
review of literature. Regarding technology, one participant said, “In the beginning it is
expensive, so smart shoppers wait.” Another said, “I browse then wait for sales.” Finally,
one participant said, “You wait. If you really want it, you‟ll go back.”
Feelings/Outcomes
The third theme from the focus group interviews included the feelings or
outcomes associated with smart shopping. Categories included: comparing one‟s
purchase with friends, comparing purchase to past purchases, winning, and hard work.
Examples of the first category (comparing purchase with friends) included, “Compared to
other people, I get a better deal” and “I feel smart when I compare my shopping with
others.” This category seems to exemplify the fact that participants got affirmation for
their smart shopping by comparing their purchases with other shoppers. An example of
the second category (comparing purchase to past purchases) was, “We did better than last
time.” This category was another type of affirmation wherein the participant was always
trying to make a “smarter” purchase. The third category of feelings or outcomes was
winning. An example of the feeling of winning at smart shopping was, “It is a great
feeling- you feel like you won.” Finally, the last category was labeled hard work. This
category described negative feelings sometimes associated with smart shopping. An
36
example that was mentioned by both focus groups about smart shopping was, “It is way
too much work.”
Importance
The fourth theme of smart shopping was the importance of the purchase.
Participants discussed how the importance of the purchase differed by product and by
price range. For example, one participant described importance by saying, “Criteria
changes based on product … and how important it is to you.” This quote depicts the way
importance can differ by product category. Participants also indicated that importance
changed based upon price range. An example was, “When buying big items, I‟ll care.
Little items, no.”
Opposites of Smart Shopping
The last theme uncovered in the focus group data was composed of things that
were not a part of smart shopping. Participants of both focus group interviews mentioned
that emotional shopping was not smart and that impulsive shopping was not smart. An
example of the emotional shopping category was, “A smart shopper is not emotional.”
An example of the discussion about impulsive shopping was that smart shopping does not
include “a lot of impulsive buying.”
Outcome of Focus Group Interviews
The information gained from the focus group interviews provided a better
understanding of the goals, activities, outcomes, importance, and opposites of smart
shopping. This understanding was important, because it was utilized in the construction
of scale items by providing insight into how the participants talked about the topic
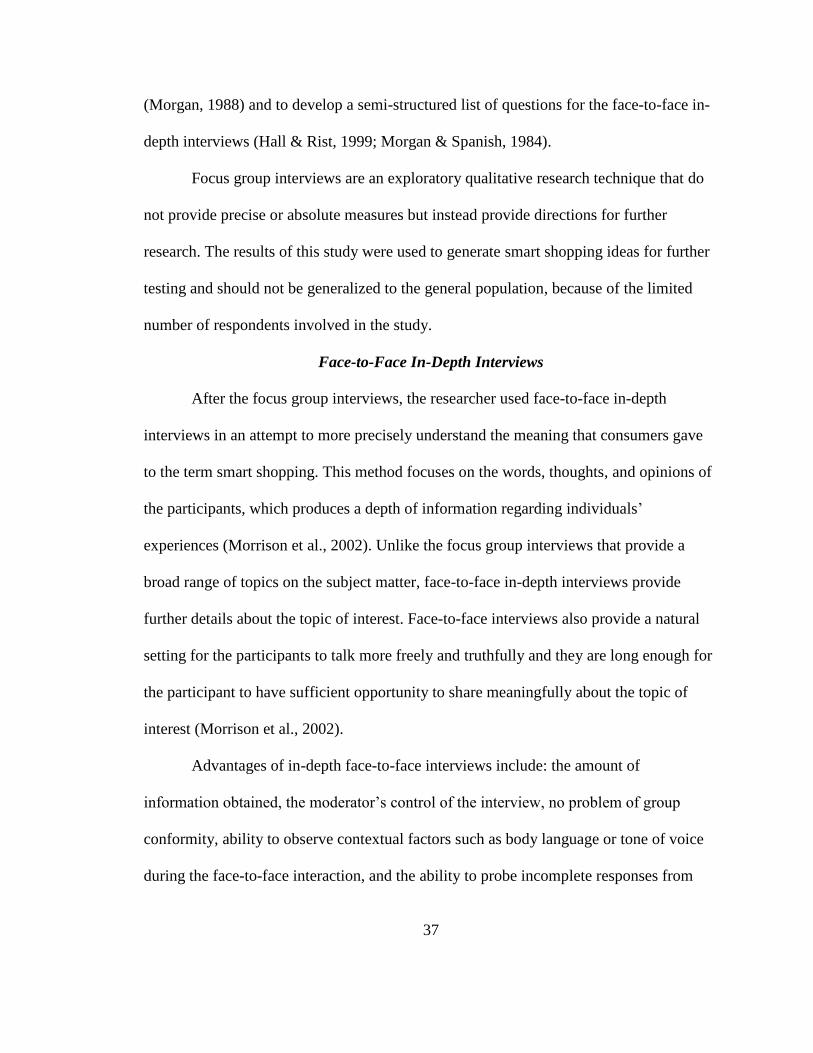
37
(Morgan, 1988) and to develop a semi-structured list of questions for the face-to-face in-
depth interviews (Hall & Rist, 1999; Morgan & Spanish, 1984).
Focus group interviews are an exploratory qualitative research technique that do
not provide precise or absolute measures but instead provide directions for further
research. The results of this study were used to generate smart shopping ideas for further
testing and should not be generalized to the general population, because of the limited
number of respondents involved in the study.
Face-to-Face In-Depth Interviews
After the focus group interviews, the researcher used face-to-face in-depth
interviews in an attempt to more precisely understand the meaning that consumers gave
to the term smart shopping. This method focuses on the words, thoughts, and opinions of
the participants, which produces a depth of information regarding individuals‟
experiences (Morrison et al., 2002). Unlike the focus group interviews that provide a
broad range of topics on the subject matter, face-to-face in-depth interviews provide
further details about the topic of interest. Face-to-face interviews also provide a natural
setting for the participants to talk more freely and truthfully and they are long enough for
the participant to have sufficient opportunity to share meaningfully about the topic of
interest (Morrison et al., 2002).
Advantages of in-depth face-to-face interviews include: the amount of
information obtained, the moderator‟s control of the interview, no problem of group
conformity, ability to observe contextual factors such as body language or tone of voice
during the face-to-face interaction, and the ability to probe incomplete responses from
38
participants (Hall & Rist, 1999). In this study, the face-to-face interviews provided a
deeper level of information about the term smart shopping and about the activities and
feelings involved in smart shopping, which yielded a more clearly defined term. In
addition, applying the two methods of interviewing (i.e., focus group and individual
interviews) cross-validated the findings of the interviews (Morgan, 1988).
For the semi-structured, face-to-face in-depth interviews, the researcher recruited
fifteen participants via telephone or email by using purposive sampling. Purposive
sampling is a nonprobability sampling technique in which participants are selected based
upon the researcher‟s judgment about the appropriate characteristics of the participant
(Zikmund, 2003). Qualitative research, such as face-to-face in-depth interviews, seeks to
purposefully select participants “that will best help the researcher understand the problem
and the research question” (Creswell, 2003, p. 185). The researcher selected the sample
of participants by approaching acquaintances, by telephone or email, briefly describing
the university-based research project, and asking if the individual would be willing to
give their input on smart shopping experiences.
Consumers who were willing to share their opinions about smart shopping were
chosen as the purposive sampling criteria for this study and an interview location and
date were arranged. Those consumers who felt they did not have anything to contribute to
an interview about smart shopping declined to participate, but the researcher asked for a
recommendation of someone else who might be interested in talking about his/her smart
shopping experiences. Based upon quota sampling, a range of male and female
respondents in a range of age groups living in four somewhat distant geographic locations
39
were selected. The purpose of this type of sampling is to enable various subgroups within
the population to be represented in the sample of the study (Zikmund, 2003).
The smart shopping face-to-face interviewing ceased at fifteen interviews,
because the sample size was sufficient for the exploratory study and because the data
collection became redundant. Strauss and Corbin suggested that “data collection
continues until theoretical saturation takes place” (1998, p. 292). Theoretical saturation is
reached when no new information is being gained and any additional information might
be so small as to add very little value to the study (Strauss & Corbin, 1998; Taylor,
1994). Theoretical saturation or redundancy is usually reached between 8 and 15
interviews (Morrison et al., 2002; Taylor, 1994). In addition to theoretical saturation or
redundancy, Strauss and Corbin (1998) recognized the necessity of taking into
consideration time and energy constraints as well as the availability of participants. The
face-to-face interviews were held in the participants‟ home or office, and lasted
approximately one hour. The location and length of the interviews adhere to the
recommendations made by qualitative researchers for conducting interviews in natural
settings for 30 minutes to two hours (Morrison et al., 2002).
Participants‟ demographic characteristics are summarized in Table 2. Ten of the
participants were female; most were married; and all had some college education.
Participants‟ ages ranged from 20s to 60s and each resided in one of four geographic
locations: Johnson City, TN; Atlanta, GA; Washington D.C.; or Charlotte, NC. The
researcher chose the four geographic regions of the interviews to represent several rural
and metropolitan locations in the eastern United States and for convenience.
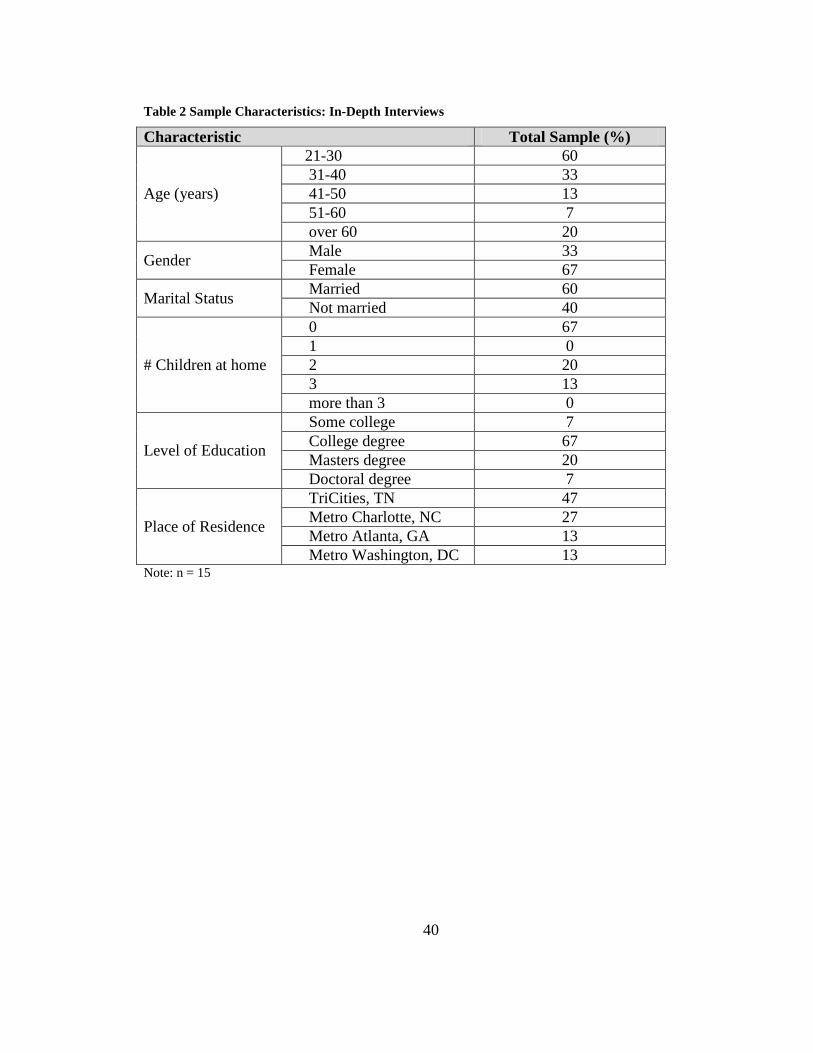
40
Table 2 Sample Characteristics: In-Depth Interviews
Characteristic Total Sample (%)
Age (years)
21-30 60
31-40 33
41-50 13
51-60 7
over 60 20
Gender Male 33
Female 67
Marital Status Married 60
Not married 40
# Children at home
0 67
1 0
2 20
3 13
more than 3 0
Level of Education
Some college 7
College degree 67
Masters degree 20
Doctoral degree 7
Place of Residence
TriCities, TN 47
Metro Charlotte, NC 27
Metro Atlanta, GA 13
Metro Washington, DC 13 Note: n = 15
41
The researcher prepared for conducting the face-to-face in-depth interviews in
three ways: (a) by taking a graduate course focused on qualitative research methods; (b)
by reviewing academic literature regarding conducting interviews; and (c) by conducting
two practice interviews that were reviewed and evaluated by a notable qualitative
researcher in the School of Advertising and Public Relations at a major southeastern
university.
The face-to-face in-depth interviews were conducted based on a semi-structured
interview schedule, which was followed in all interviews (see Appendix B). The
researcher employed questions similar to those used in the focus group interviews;
however, planned prompts or questions that beseeched the participants about their initial
answers were used as needed “to give them the opportunity to consider and discuss
phenomena that do not come readily to mind or speech” (McCracken, 1988, p. 35). All
face-to-face in-depth interviews were conducted by the researcher, tape recorded, and
transcribed verbatim by a professional transcriptionist.
The following safeguards, suggested by Creswell (2003), were employed to
protect the rights of the participants: (a) the Institutional Review Board granted approval
of the study before the interviews were conducted; (b) the objectives of the research
project were articulated verbally and in written form to each participant; (c) written
agreement to participate in the study was received from each participant; (d) participants
were informed of data collection devices used; and (e) participants were assured
confidentiality of their responses. No reference was made in oral or written reports,
which otherwise could link participants to the study. The professional transcriptionist was
42
only given the tape recorded interviews labeled Participant A through Participant P. The
audio tapes did not provide any further identifiers of the participants.
Face-to-Face In-Depth Interview Data Analyses
Once the interviews were transcribed, the data from the 15 face-to-face in-depth
interviews were input into QDA Miner, a qualitative data analysis software program. This
software program allowed the researcher to annotate, sort, and retrieve coded sections of
text for studying patterns among codes. As suggested by Strauss and Corbin (1998),
computer programs are extremely helpful in creating order out of a mountain of interview
notes.
Strauss and Corbin‟s (1998) research methodology (i.e., open coding and axial
coding) was used to analyze the face-to-face in-depth interviews. After obtaining a
general sense of the interviews, the primary researcher, secondary researcher, and a
colleague in the RHTM department began open coding. Open coding is accomplished by
opening up the text and exposing the thoughts, ideas, and meanings contained in the
interview data to assist in uncovering, naming, and developing concepts (Strauss &
Corbin, 1998). To accomplish this, each of the three researchers read the fifteen
interviews, naming and categorizing phenomena as she progressed, resulting in the initial
smart shopping concepts (e.g., using coupons, purchasing in bulk). As each additional
interview was analyzed, new concepts emerged.
Next, the researchers read through their notes, looking for commonalities in
concepts identified in the coding (i.e., reading a magazine, conducting an Internet
search). Similar concepts were clustered together in order to identify more abstract
43
categories of smart shopping (i.e., pre-purchase). Then these categories were sorted into
subcategories (i.e., conducting research).
Finally, the categories and concepts that were taken apart during open coding
were reassembled by identifying relationships among the categories during the process of
axial coding (Strauss & Corbin, 1998). It is during the axial coding process that the
researcher begins to identify how categories relate to one another. For example, the
researcher of the present study discovered that the smart shopping activities and
behaviors discussed in the face-to-face in-depth interviews could be separated into three
phases: pre-purchase, purchase, and post-purchase. Smart shopping sub-categories such
as conducting research and planning were obviously a part of pre-purchase activities,
while positive feelings and satisfaction were a noticeable part of post-purchase
evaluations.
Conceptualization of Smart Shopping
In line with Blackwell et al.‟s (2005) Consumer Decision-Process Model, the
participants of both focus groups and the face-to-face in-depth interviews made reference
to smart shopping activities that could be separated into three phases of the model: (a) the
pre-purchase stage (i.e., information search, comparison shopping, planning for purchase,
and planning for sale purchases); (b) the purchase stage (i.e., making tradeoffs, getting
convenience, getting the right product, saving money, saving time, and saving effort); and
(c) the post-purchase stage (i.e., positive feelings, satisfaction, usefulness, getting
rewards, and word of mouth) of smart shopping.
44
Conceptual Framework
Incorporating the literature review and results of the qualitative analyses, the
original smart shopping model included smart shopping activities and outcomes (see
Figure 2). Further, smart shopping activities were separated into pre-purchase activities
and purchase activities while smart shopping outcomes represented post-purchase results.
The participant responses related to the pre-purchase activities were then sorted into four
sub-categories: information search, comparison shopping, planning for purchase, and
planning for sale purchases. Consumer purchase activities were evaluated and sorted into
six sub-categories: making tradeoffs, getting convenience, getting the right product,
saving money, saving time, and saving effort. Post-purchase activities were sorted into
five sub-categories: positive feelings, satisfaction, usefulness, getting rewards, and word
of mouth.
The results of these coding processes contributed to the overall framework for
conceptualizing smart shopping. Table 3 presents the three smart shopping categories
separated into the sub-categories with examples of participant responses. An example, of
one participant response in the pre-purchase category under the sub-category labeled
planning for purchase was “I took time and waited for what I needed.” Examples of
additional illustrative comments can be found in Table 3.
These smart shopping variables were consistent with economic theory (e.g., trade-
offs, post-purchase evaluations reflecting warm glow) (Cochrane & Bell, 1956),
consumer efficiency (e.g., minimizing costs of money, time, effort) (Downs, 1961), and
the consumer decision-making process (e.g., pre-purchase, purchase, post-purchase)
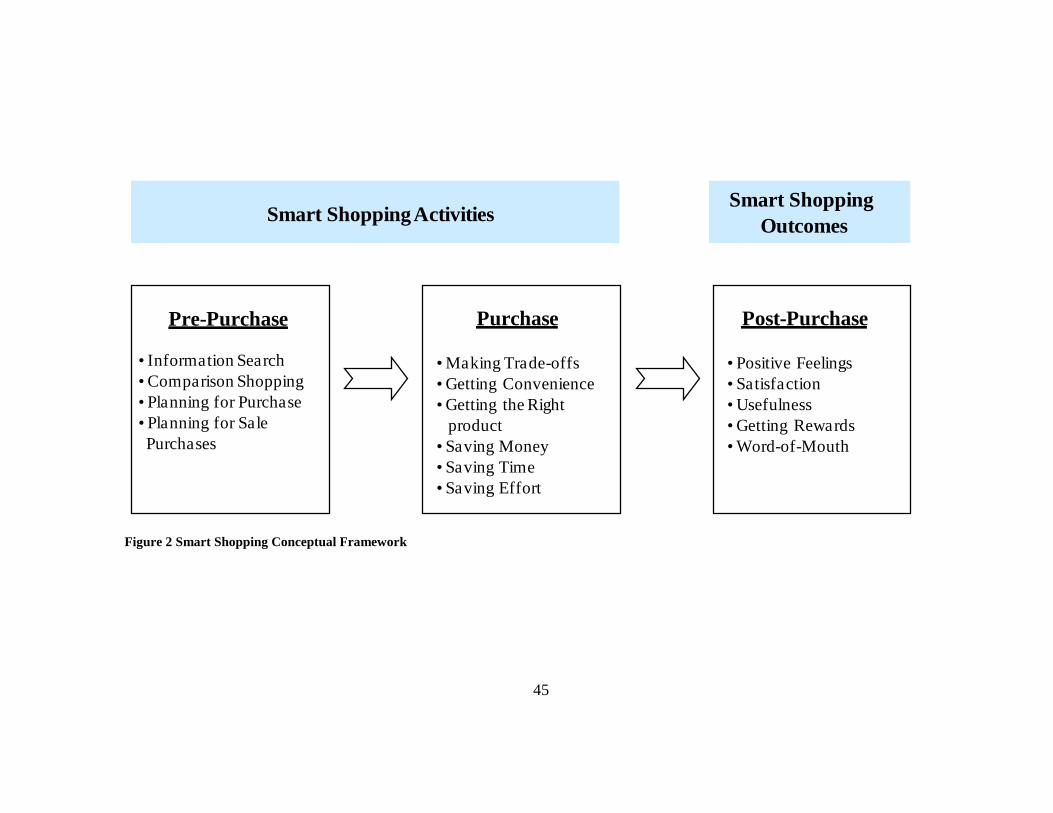
45
Smart Shopping ActivitiesSmart Shopping
Outcomes
Pre-Purchase Purchase Post-Purchase
• Information Search
• Comparison Shopping
• Planning for Purchase
• Planning for Sale
Purchases
• Making Trade-offs
• Getting Convenience
• Getting the Right
product
• Saving Money
• Saving Time
• Saving Effort
• Positive Feelings
• Satisfaction
• Usefulness
• Getting Rewards
• Word-of-Mouth
Figure 2 Smart Shopping Conceptual Framework
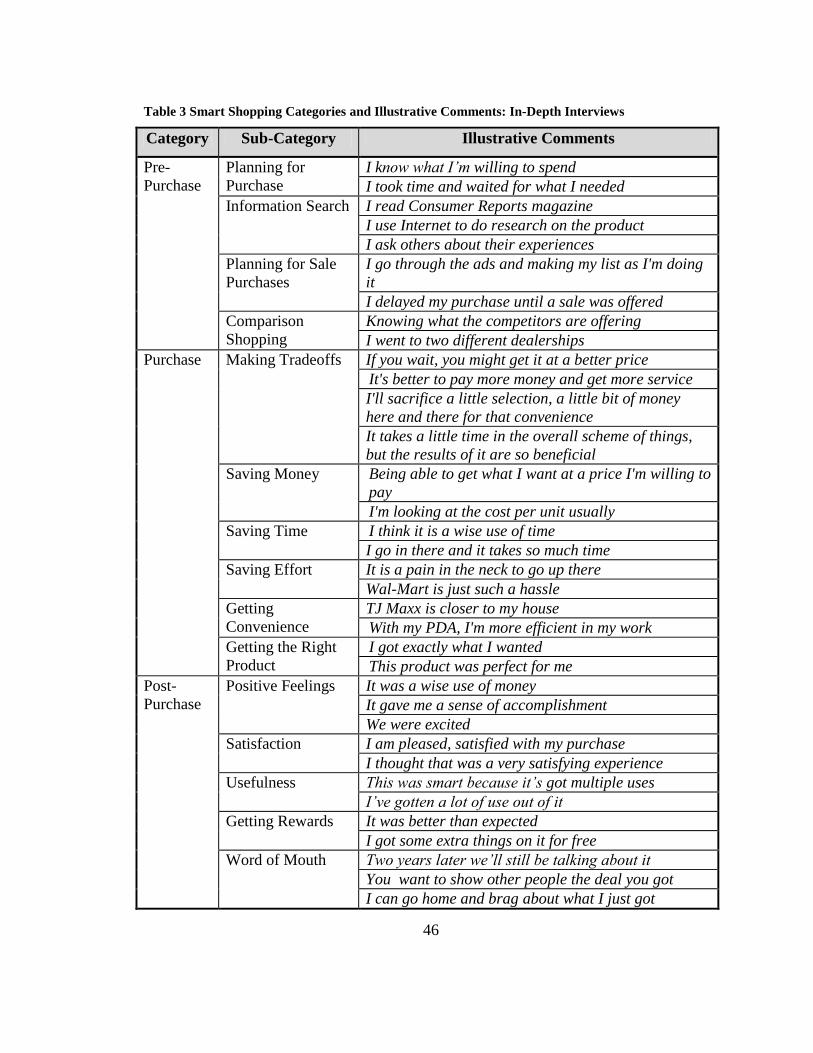
46
Table 3 Smart Shopping Categories and Illustrative Comments: In-Depth Interviews
Category Sub-Category Illustrative Comments
Pre-
Purchase
Planning for
Purchase
I know what I’m willing to spend
I took time and waited for what I needed
Information Search I read Consumer Reports magazine
I use Internet to do research on the product
I ask others about their experiences
Planning for Sale
Purchases
I go through the ads and making my list as I'm doing
it
I delayed my purchase until a sale was offered
Comparison
Shopping
Knowing what the competitors are offering
I went to two different dealerships
Purchase Making Tradeoffs If you wait, you might get it at a better price
It's better to pay more money and get more service
I'll sacrifice a little selection, a little bit of money
here and there for that convenience
It takes a little time in the overall scheme of things,
but the results of it are so beneficial
Saving Money Being able to get what I want at a price I'm willing to
pay
I'm looking at the cost per unit usually
Saving Time I think it is a wise use of time
I go in there and it takes so much time
Saving Effort It is a pain in the neck to go up there
Wal-Mart is just such a hassle
Getting
Convenience
TJ Maxx is closer to my house
With my PDA, I'm more efficient in my work
Getting the Right
Product
I got exactly what I wanted
This product was perfect for me
Post-
Purchase
Positive Feelings It was a wise use of money
It gave me a sense of accomplishment
We were excited
Satisfaction I am pleased, satisfied with my purchase
I thought that was a very satisfying experience
Usefulness This was smart because it’s got multiple uses
I’ve gotten a lot of use out of it
Getting Rewards It was better than expected
I got some extra things on it for free
Word of Mouth Two years later we’ll still be talking about it
You want to show other people the deal you got
I can go home and brag about what I just got
47
(Blackwell et al., 2005) and were utilized in developing measurement items.
Measure Development
Based upon the findings from the academic literature review and the qualitative
interviews, the researcher constructed scale items to conceptualize smart shopping and
borrowed existing measurement scales for validity-checking variables. The initial item
generation and instrument development will be discussed next.
Initial Item Generation
The initial item generation from the qualitative interviews and review of academic
literature produced 130 smart shopping scale items in three stages: 29 items for pre-
purchase, 62 items for purchase, and 39 for post-purchase. To evaluate content and face
validity, the researcher used the Delphi method by employing a knowledgeable group of
experts (i.e., a professor and six graduate students specializing in consumer behavior).
The seven experts evaluated the 130 smart shopping measurement items based
upon clarity of wording and upon the items‟ representation of smart shopping activities
(e.g., information search, planning for purchase) or outcomes (e.g., satisfaction,
usefulness). Although the Delphi method has garnered criticism as being unscientific and
inaccurate, it has also received support from other studies that have successfully used the
method for estimating and forecasting ("The delphi method," n.d.). The success of the
method resides in the formation of group judgment when the group members are
knowledgeable experts.
The experts were asked to make comments on the pool of items and wording
revisions were made based upon their feedback. Scale items that were not clear, not
48
representative of the domain, or open for misinterpretation were eliminated or reworded.
For example, the scale item, “I got everything I wanted from this purchase” was
reworded to, “I got everything I expected from this purchase.” Also, “I waited a while
until this product went on sale” was reworded to, “I waited until this product went on sale
before making the purchase.” In addition, redundant or unnecessary items were
eliminated. For example, the scale item, “I saved time making this purchase” was
eliminated because it was redundant when compared to other statements such as, “In
making this purchase, I used my time wisely.” After rewording and removing 67
redundant or unnecessary items, the remaining item pool consisted of 63 smart shopping
items: 14 items for pre-purchase, 29 items for purchase, and 20 for post-purchase (see
Tables 4, 5 & 6).
For validity-checking, the researcher adapted existing measures with good
internal consistencies from the literature review. The five constructs employed for
checking their relationships to the pre-purchase and purchase smart shopping stages were
price-consciousness, convenience-seeking, marketplace knowledge, time-consciousness,
and smart shopping (see Table 7).
For the assessment of price-consciousness, Alford and Biswas‟ (2002) 3-item
price-consciousness scale was adopted. This scale was also used by Lichtenstein,
Ridgway, and Netemeyer (1993), Garretson and Burton (2003), and Burton, Lichtenstein,
Netemeyer, and Garretson (1998) and has reported reliabilities of 0.84 and above. For
convenience-seeking, Noble et al.‟s (2006) 3-item convenience-seeking scale was
adopted. The scale was previously used by Eastlick and Feinberg (1999) and reported
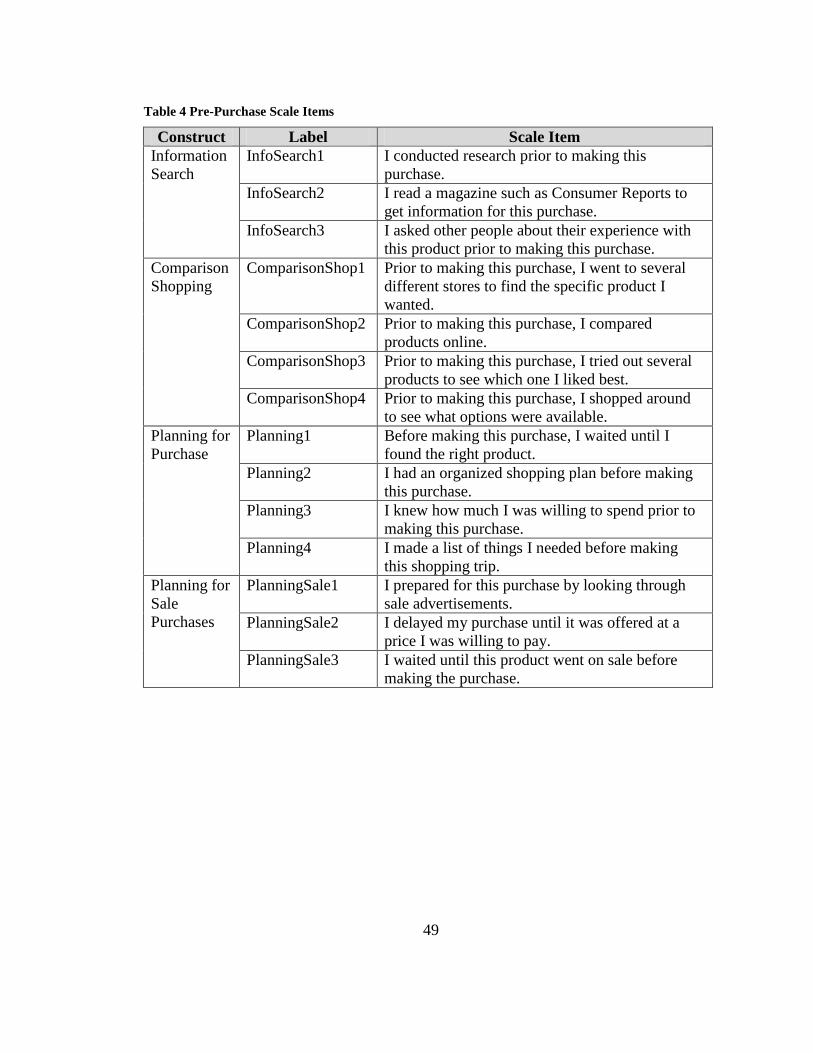
49
Table 4 Pre-Purchase Scale Items
Construct Label Scale Item
Information
Search
InfoSearch1 I conducted research prior to making this
purchase.
InfoSearch2 I read a magazine such as Consumer Reports to
get information for this purchase.
InfoSearch3 I asked other people about their experience with
this product prior to making this purchase.
Comparison
Shopping
ComparisonShop1 Prior to making this purchase, I went to several
different stores to find the specific product I
wanted.
ComparisonShop2 Prior to making this purchase, I compared
products online.
ComparisonShop3 Prior to making this purchase, I tried out several
products to see which one I liked best.
ComparisonShop4 Prior to making this purchase, I shopped around
to see what options were available.
Planning for
Purchase
Planning1 Before making this purchase, I waited until I
found the right product.
Planning2 I had an organized shopping plan before making
this purchase.
Planning3 I knew how much I was willing to spend prior to
making this purchase.
Planning4 I made a list of things I needed before making
this shopping trip.
Planning for
Sale
Purchases
PlanningSale1 I prepared for this purchase by looking through
sale advertisements.
PlanningSale2 I delayed my purchase until it was offered at a
price I was willing to pay.
PlanningSale3 I waited until this product went on sale before
making the purchase.
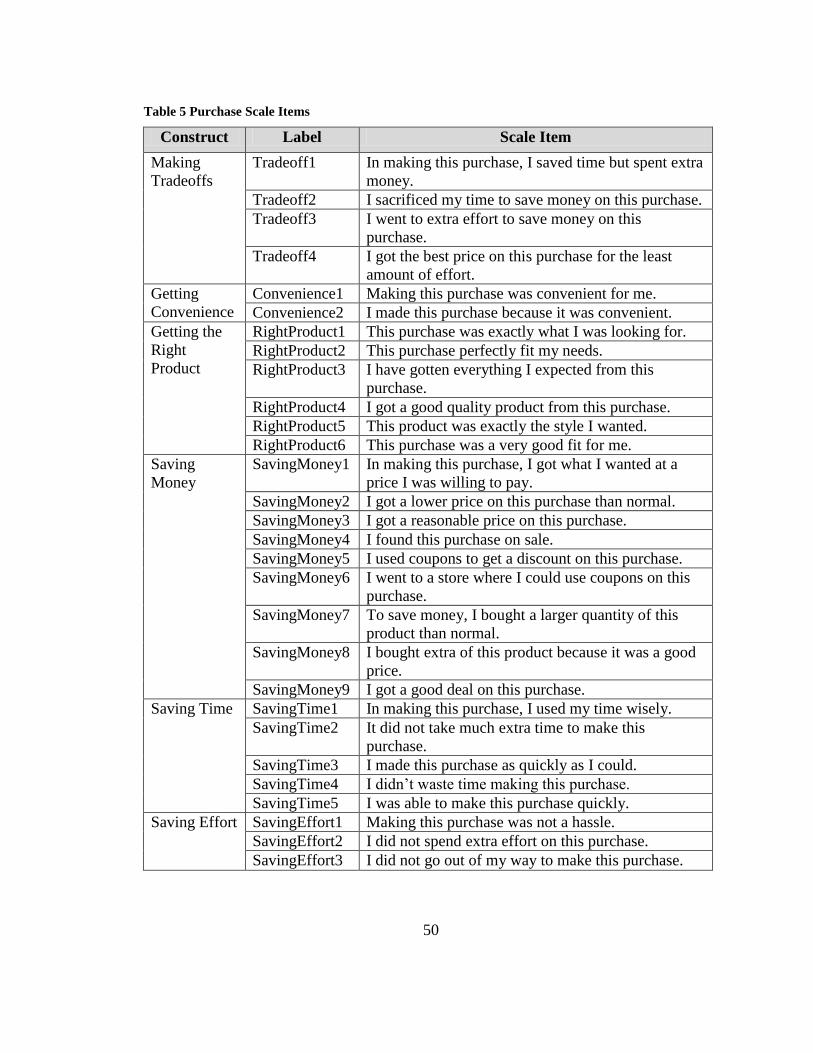
50
Table 5 Purchase Scale Items
Construct Label Scale Item
Making
Tradeoffs
Tradeoff1 In making this purchase, I saved time but spent extra
money.
Tradeoff2 I sacrificed my time to save money on this purchase.
Tradeoff3 I went to extra effort to save money on this
purchase.
Tradeoff4 I got the best price on this purchase for the least
amount of effort.
Getting
Convenience
Convenience1 Making this purchase was convenient for me.
Convenience2 I made this purchase because it was convenient.
Getting the
Right
Product
RightProduct1 This purchase was exactly what I was looking for.
RightProduct2 This purchase perfectly fit my needs.
RightProduct3 I have gotten everything I expected from this
purchase.
RightProduct4 I got a good quality product from this purchase.
RightProduct5 This product was exactly the style I wanted.
RightProduct6 This purchase was a very good fit for me.
Saving
Money
SavingMoney1 In making this purchase, I got what I wanted at a
price I was willing to pay.
SavingMoney2 I got a lower price on this purchase than normal.
SavingMoney3 I got a reasonable price on this purchase.
SavingMoney4 I found this purchase on sale.
SavingMoney5 I used coupons to get a discount on this purchase.
SavingMoney6 I went to a store where I could use coupons on this
purchase.
SavingMoney7 To save money, I bought a larger quantity of this
product than normal.
SavingMoney8 I bought extra of this product because it was a good
price.
SavingMoney9 I got a good deal on this purchase.
Saving Time SavingTime1 In making this purchase, I used my time wisely.
SavingTime2 It did not take much extra time to make this
purchase.
SavingTime3 I made this purchase as quickly as I could.
SavingTime4 I didn‟t waste time making this purchase.
SavingTime5 I was able to make this purchase quickly.
Saving Effort SavingEffort1 Making this purchase was not a hassle.
SavingEffort2 I did not spend extra effort on this purchase.
SavingEffort3 I did not go out of my way to make this purchase.
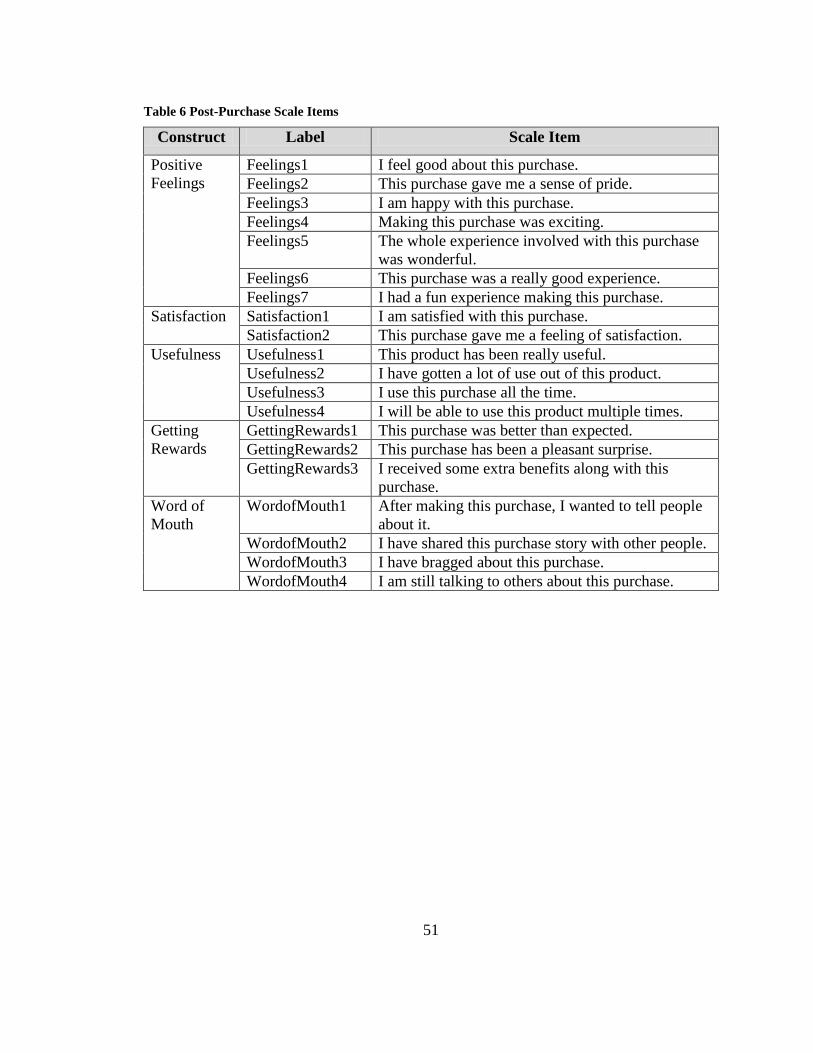
51
Table 6 Post-Purchase Scale Items
Construct Label Scale Item
Positive
Feelings
Feelings1 I feel good about this purchase.
Feelings2 This purchase gave me a sense of pride.
Feelings3 I am happy with this purchase.
Feelings4 Making this purchase was exciting.
Feelings5 The whole experience involved with this purchase
was wonderful.
Feelings6 This purchase was a really good experience.
Feelings7 I had a fun experience making this purchase.
Satisfaction Satisfaction1 I am satisfied with this purchase.
Satisfaction2 This purchase gave me a feeling of satisfaction.
Usefulness Usefulness1 This product has been really useful.
Usefulness2 I have gotten a lot of use out of this product.
Usefulness3 I use this purchase all the time.
Usefulness4 I will be able to use this product multiple times.
Getting
Rewards
GettingRewards1 This purchase was better than expected.
GettingRewards2 This purchase has been a pleasant surprise.
GettingRewards3 I received some extra benefits along with this
purchase.
Word of
Mouth
WordofMouth1 After making this purchase, I wanted to tell people
about it.
WordofMouth2 I have shared this purchase story with other people.
WordofMouth3 I have bragged about this purchase.
WordofMouth4 I am still talking to others about this purchase.
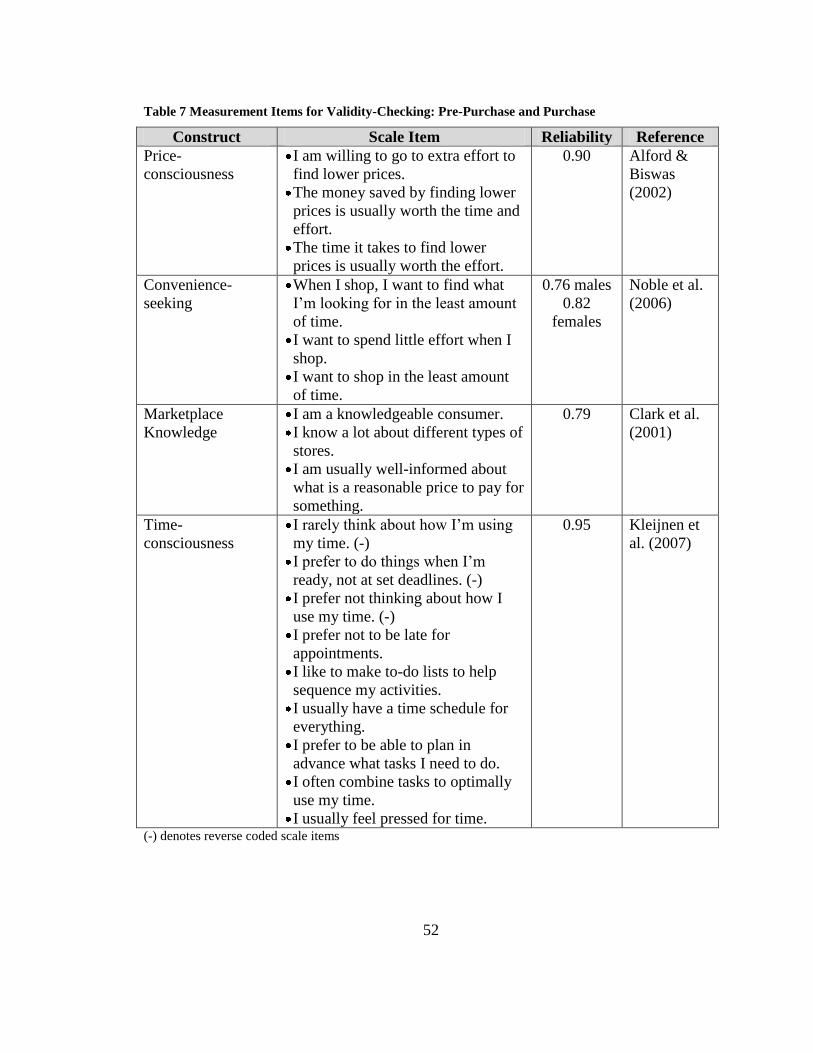
52
Table 7 Measurement Items for Validity-Checking: Pre-Purchase and Purchase
Construct Scale Item Reliability Reference
Price-
consciousness
I am willing to go to extra effort to
find lower prices.
The money saved by finding lower
prices is usually worth the time and
effort.
The time it takes to find lower
prices is usually worth the effort.
0.90 Alford &
Biswas
(2002)
Convenience-
seeking
When I shop, I want to find what
I‟m looking for in the least amount
of time.
I want to spend little effort when I
shop.
I want to shop in the least amount
of time.
0.76 males
0.82
females
Noble et al.
(2006)
Marketplace
Knowledge
I am a knowledgeable consumer.
I know a lot about different types of
stores.
I am usually well-informed about
what is a reasonable price to pay for
something.
0.79 Clark et al.
(2001)
Time-
consciousness
I rarely think about how I‟m using
my time. (-)
I prefer to do things when I‟m
ready, not at set deadlines. (-)
I prefer not thinking about how I
use my time. (-)
I prefer not to be late for
appointments.
I like to make to-do lists to help
sequence my activities.
I usually have a time schedule for
everything.
I prefer to be able to plan in
advance what tasks I need to do.
I often combine tasks to optimally
use my time.
I usually feel pressed for time.
0.95 Kleijnen et
al. (2007)
(-) denotes reverse coded scale items
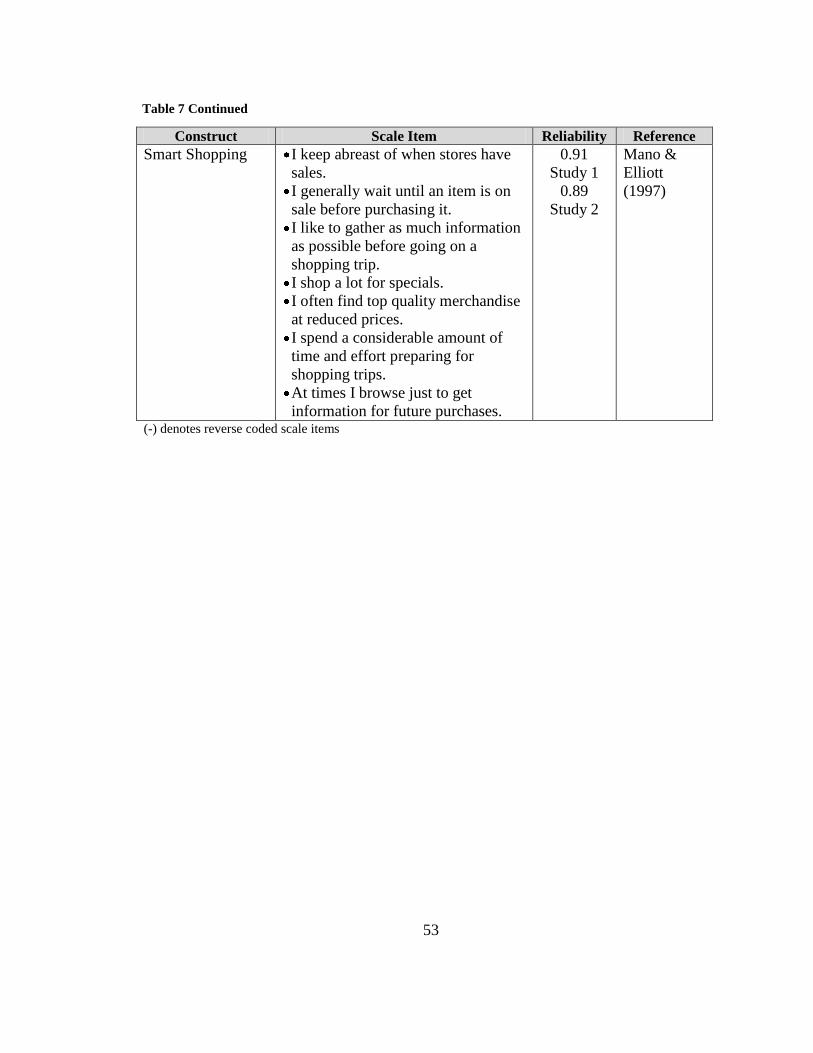
53
Construct Scale Item Reliability Reference
Smart Shopping I keep abreast of when stores have
sales.
I generally wait until an item is on
sale before purchasing it.
I like to gather as much information
as possible before going on a
shopping trip.
I shop a lot for specials.
I often find top quality merchandise
at reduced prices.
I spend a considerable amount of
time and effort preparing for
shopping trips.
At times I browse just to get
information for future purchases.
0.91
Study 1
0.89
Study 2
Mano &
Elliott
(1997)
(-) denotes reverse coded scale items
Table 7 Continued
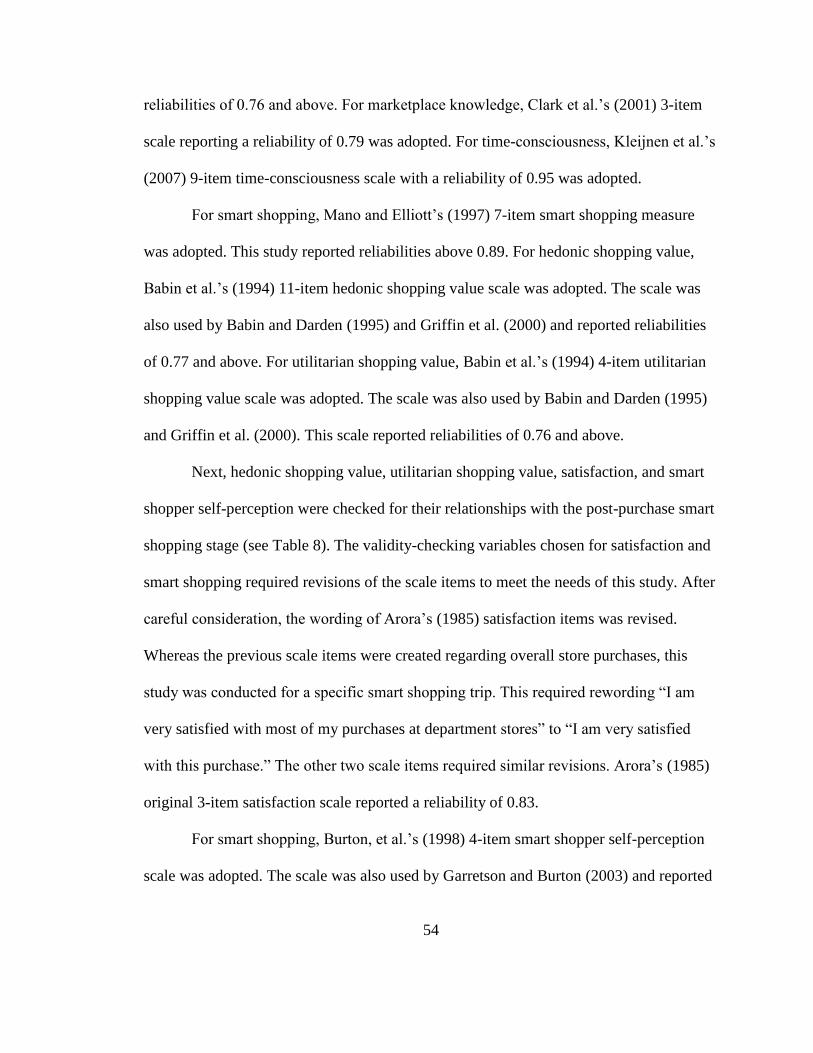
54
reliabilities of 0.76 and above. For marketplace knowledge, Clark et al.‟s (2001) 3-item
scale reporting a reliability of 0.79 was adopted. For time-consciousness, Kleijnen et al.‟s
(2007) 9-item time-consciousness scale with a reliability of 0.95 was adopted.
For smart shopping, Mano and Elliott‟s (1997) 7-item smart shopping measure
was adopted. This study reported reliabilities above 0.89. For hedonic shopping value,
Babin et al.‟s (1994) 11-item hedonic shopping value scale was adopted. The scale was
also used by Babin and Darden (1995) and Griffin et al. (2000) and reported reliabilities
of 0.77 and above. For utilitarian shopping value, Babin et al.‟s (1994) 4-item utilitarian
shopping value scale was adopted. The scale was also used by Babin and Darden (1995)
and Griffin et al. (2000). This scale reported reliabilities of 0.76 and above.
Next, hedonic shopping value, utilitarian shopping value, satisfaction, and smart
shopper self-perception were checked for their relationships with the post-purchase smart
shopping stage (see Table 8). The validity-checking variables chosen for satisfaction and
smart shopping required revisions of the scale items to meet the needs of this study. After
careful consideration, the wording of Arora‟s (1985) satisfaction items was revised.
Whereas the previous scale items were created regarding overall store purchases, this
study was conducted for a specific smart shopping trip. This required rewording “I am
very satisfied with most of my purchases at department stores” to “I am very satisfied
with this purchase.” The other two scale items required similar revisions. Arora‟s (1985)
original 3-item satisfaction scale reported a reliability of 0.83.
For smart shopping, Burton, et al.‟s (1998) 4-item smart shopper self-perception
scale was adopted. The scale was also used by Garretson and Burton (2003) and reported
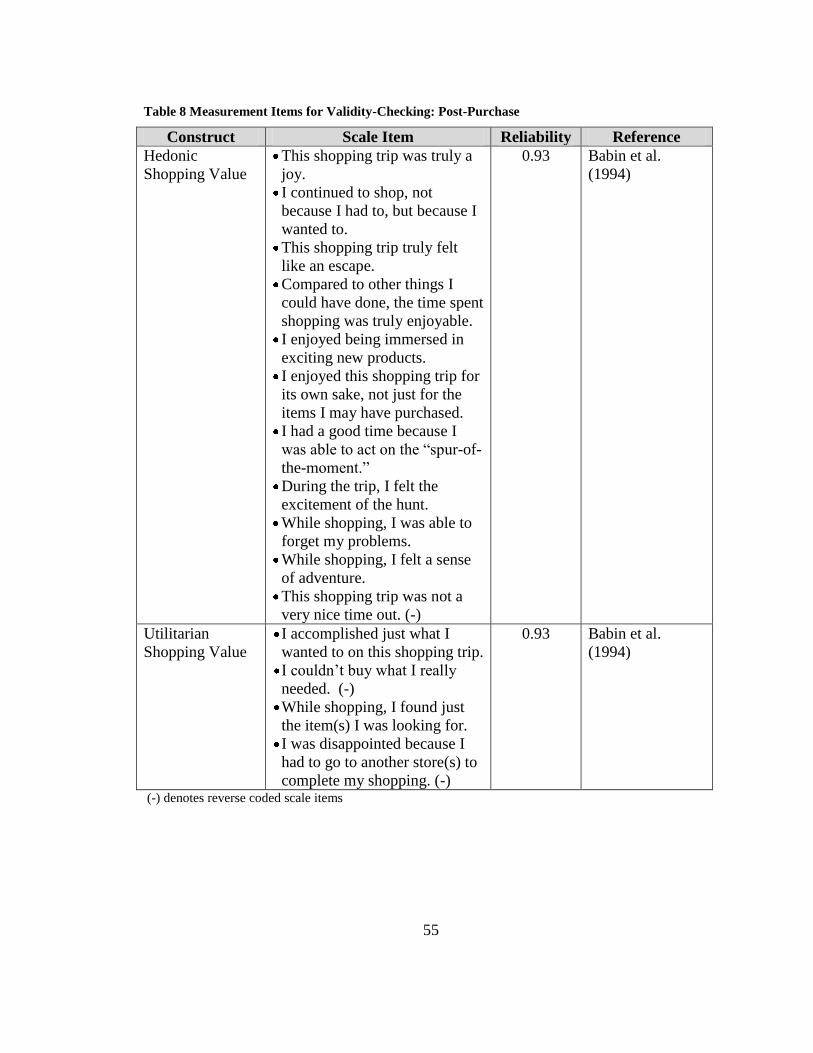
55
Table 8 Measurement Items for Validity-Checking: Post-Purchase
Construct Scale Item Reliability Reference
Hedonic
Shopping Value
This shopping trip was truly a
joy.
I continued to shop, not
because I had to, but because I
wanted to.
This shopping trip truly felt
like an escape.
Compared to other things I
could have done, the time spent
shopping was truly enjoyable.
I enjoyed being immersed in
exciting new products.
I enjoyed this shopping trip for
its own sake, not just for the
items I may have purchased.
I had a good time because I
was able to act on the “spur-of-
the-moment.”
During the trip, I felt the
excitement of the hunt.
While shopping, I was able to
forget my problems.
While shopping, I felt a sense
of adventure.
This shopping trip was not a
very nice time out. (-)
0.93 Babin et al.
(1994)
Utilitarian
Shopping Value
I accomplished just what I
wanted to on this shopping trip.
I couldn‟t buy what I really
needed. (-)
While shopping, I found just
the item(s) I was looking for.
I was disappointed because I
had to go to another store(s) to
complete my shopping. (-)
0.93 Babin et al.
(1994)
(-) denotes reverse coded scale items
56
Construct Scale Item Reliability Reference
Satisfaction I am very satisfied with most
of my purchases at department
stores.
I am very satisfied with this
purchase. I feel very comfortable with
my recent purchase decisions.
I feel very comfortable with
this purchase decision.
I am confident that I generally
make the right decisions.
I am confident that I made
the right decision.
0.83 Arora (1985)
Smart Shopper
Self-Perception
When I shop smartly, I feel
like a winner.
On this smart shopping trip,
I felt like a winner.
When I go shopping, I take a
lot of pride in making smart
purchases.
I took a lot of pride in
making this smart purchase.
Making smart purchases makes
me feel good about myself.
Making this smart purchase
made me feel good about
myself. I get a real sense of joy when I
make wise purchases.
I got a real sense of joy when
I made this wise purchase.
0.94 Burton et al.
(1998)
(-) denotes reverse coded scale items; Bold print denotes revised scale items
Table 8 Continued
57
reliabilities of 0.87 and above. The wording of all four items in the smart shopper self-
perception scale was revised to reference a specific shopping trip instead of shopping
trips in general (see Table 8). For example, “When I shop smartly, I feel like a winner”
was revised to “On this smart shopping trip, I felt like a winner.” The revised
measurement items for satisfaction and smart shopping were reviewed by academic
experts (i.e., a professor and six graduate students specializing in consumer behavior) to
ensure clarity of reworded scale items and readability. A total of 49 randomly ordered
items were used to measure these nine validity-checking constructs (see Table 8). All
measurement items chosen from the literature reported good reliabilities (Cronbach‟s
alpha ranged from 0.76 to 0.95) established in previous studies.
Instrument Development
The initial survey instrument (see Appendix C) consisted of five sections: smart
shopping activities, smart shopping outcomes, shopping trip outcomes (for validity
checking), consumer characteristics (for validity checking), and demographic
information. It was designed to be completed in 10-15 minutes.
The survey began by asking the participant to indicate which of the three product
categories (i.e., clothing, grocery, electronics) they were thinking of when they made a
“smart purchase” in a recent in-store shopping trip. Then they were asked,
“Approximately how much money did you spend on this smart purchase?” This question
was included both for a frame of reference for the participant and for possible future
smart shopping analyses by amount of purchase.
58
The items in the first four sections were measured using a six-point Likert-type
scale labeled: 1 = strongly disagree, 2 = disagree, 3 = somewhat disagree, 4 = somewhat
agree, 5 = agree, and 6 = strongly agree. The 6-point scale was chosen for this study
because it provides adequate variance and, as an even numbered scale, does not change
the direction of the opinion, but does alter the intensity of the opinion held (Garland,
1991). The number of response categories used should be the number that are meaningful
to the respondents (Viswanathan, Sudman, & Johnson, 2004). Further, the reasonable
number of response alternatives falls between five and seven (Cox, 1980). For the
purposes of scale development, the direction of the participants‟ opinion is the most
important aspect and the 6-point scale was chosen because it provides the most
meaningful number of responses for participants.
Information on the demographic and background characteristics of participants
was also obtained in the last section of the questionnaire. This information was used for
description purposes only. Open ended and forced-choice responses were used. They
were asked their gender, ethnic group, marital status, age, education level, work status,
approximate income, and number of children under 12 years of age living in the home.
Quantitative Methods
The smart shopping scale development process consisted of a pilot test for content
analysis and initial scale refinement, a pretest for scale purification, and a main study for
scale validation (see Figure 3). The pilot test was conducted on a convenience sample of
undergraduate students. The data for the pretest and main study were obtained from a
consumer panel member list through e-Rewards Market Research, an online survey
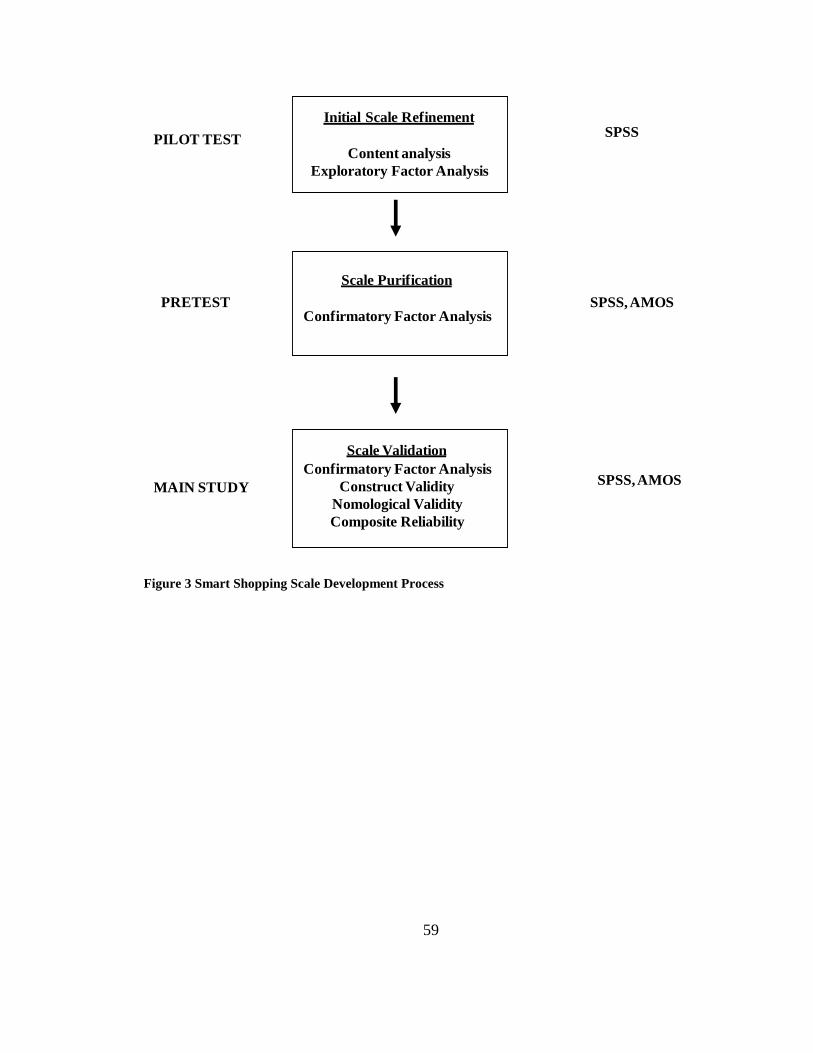
59
Initial Scale Refinement
Content analysis
Exploratory Factor Analysis
Scale Purification
Confirmatory Factor Analysis
Scale Validation
Confirmatory Factor Analysis
Construct Validity
Nomological Validity
Composite Reliability
PILOT TEST
MAIN STUDY
PRETEST
SPSS
SPSS, AMOS
SPSS, AMOS
Figure 3 Smart Shopping Scale Development Process
60
agent. e-Rewards consists of about 3 million panel members that earn e-Reward currency
for the time they spend answering market research surveys ("e-Rewards North American
Consumer Panel," 2007). The online surveys provided an efficient use of time and money
for the researcher and allowed participants to take the survey at their leisure and at their
desired location while giving them as much time as they needed to answer each question.
Cobanoglu, Warde, and Moreo (2001) reported two advantages of web surveys:
increased response rates and decreased costs. In a similar study of online and mail
surveys, Deutskens, Jong, Ruyter, and Wetzels (2006) found that the results of online
surveys were as generalizable as mail surveys and the data collection costs were
decreased.
Pilot Test: Initial Scale Refinement
The population of interest in the pilot test was consumers who had purchased
clothing, grocery, or electronics during a recent in-store shopping trip. To refine the
measurement items generated from this study, the pilot test, consisting of 63 smart
shopping items, was conducted on a convenience sample of undergraduate students
majoring in Retail and Consumer Sciences at a major southeastern university.
Survey participants were given a self-administered questionnaire (see Appendix
D) and asked to recall their most recent in-store shopping trip for clothing, grocery or
electronics when they made what they would consider a smart purchase. In Section 1 of
the survey, participants were asked to rate each statement related to smart shopping
activities. In Section 2, participants were asked to rate each statement related to smart
61
shopping outcomes. In Section 3, general demographic information was solicited. The
validity-checking variables were not used in the pilot test for scale refinement.
The purpose of the pilot test was to conduct exploratory factor analyses to
examine factor patterns. Exploratory factor analyses (EFA) with principal component
analysis as an extraction method and Varimax rotation with Kaiser normalization was
conducted separately for the three stages: pre-purchase, purchase, and post-purchase.
EFA is an applicable type of analysis because it is designed “for the situation where links
between the observed and latent variables are unknown or uncertain” (Byrne, 2001, p. 5).
Thus, the exploratory mode was used to determine how observed variables are linked to
their underlying factors.
Items with factor loadings of 0.40 or above are assumed to have practical
significance and were retained to reduce the risk of eliminating items that might be
important (Hair, Anderson, Tatham, & William, 1995). Items cross-loading onto more
than one factor were called into question. The resulting factors were given descriptive
labels.
Item-total correlations were also examined for each set of smart shopping items.
The reliability of each construct was assessed examining Cronbach‟s alpha coefficient for
a minimum acceptable reliability coefficient of 0.70 (Hair et al., 1995). Finally, pilot test
survey results were examined for potential modification in the wording or instructions of
the questionnaire.
62
Pretest: Scale Purification
The pretest was conducted for scale purification. The pretest sample was drawn
from a pre-recruited consumer panel through an online survey agent. The sample frame
was drawn from online consumers who had purchased clothing, grocery, or electronics
in-store in the last three months and were age 18 or older. Participants younger than age
18 were excluded from the sample because they are not financially independent and
because of limitations related to research involving human subjects under age 18.
In Section 1 of the survey (see Appendix E), participants were asked to recall
their most recent in-store shopping trip for clothing, grocery or electronics when they
made what they would consider a smart purchase. In Section 2, participants were asked to
recall the in-store shopping trip they selected in Section 1 and rate each statement related
to smart shopping outcomes. In Section 3, participants were asked to recall the in-store
shopping trip they selected in Section 1 and rate each statement related to shopping
outcomes. Section 4 asked participants to rate the statements that describe consumer
characteristics regarding their in-store shopping trips in general. Finally, general
demographic information was solicited in Section 5.
Before analyzing the pretest data, the demographic characteristics of the pretest
participants was examined. Next, confirmatory factor analysis (CFA) was employed
separately for the three stages: pre-purchase, purchase, and post-purchase to test scale
convergence and to evaluate the factor loadings of the scale items. Factor loadings above
0.40 are assumed to have practical significance; therefore, items exhibiting factor
loadings below 0.40 were subject to deletion. CFA was also used to assess acceptable fit
63
of the model through the use of comparative fit index (CFI), goodness of fit index (GFI),
adjusted goodness of fit index (AGFI), normative fit index (NFI), and root mean square
error of approximation (RMSEA). In general, satisfactory models are indicated by GFI
and AGFI values close to 1.00 (Byrne, 2001); NFI and CFI values greater than or equal to
0.90 (Hair et al., 1995); and RMSEA values less than or equal to 0.08 (Hair et al., 1995).
Main Study: Scale Validation
The main study was conducted for scale validation. The sample was drawn from a
pre-recruited consumer panel through an online survey agent and consisted of consumers,
age 18 or older, who had purchased clothing, grocery, or electronics in-store in the last
three months.
At the beginning of the survey (see Appendix F), participants were asked to recall
their most recent in-store shopping trip for clothing, grocery or electronics when they
made what they would consider a smart purchase. They were then asked to indicate the
type of product they were thinking of and questions in Sections 1, 2 and 3 were all
answered in reference to the particular purchase they identified. In Section 1, they were
asked to rate each statement related to smart shopping activities. In Section 2, participants
were asked to rate each statement related to smart shopping outcomes. In Section 3,
participants were asked to rate each statement related to shopping trip outcomes. Section
4 asked participants to rate the statements that describe consumer characteristics
regarding their in-store shopping trips in general. Finally, general demographic
information was solicited in Section 5.
64
First, descriptive characteristics of the sample were investigated. Second,
statistical analyses (i.e., χ2 and ANOVA) were conducted to detect any significant
discrepancies in the demographic characteristics among the three product categories. The
categories were considered significantly different if p-value < 0.05. Third, tests for
normality were conducted to measure variability (i.e., mean, minimum and maximum
values, standard deviation, skewness, and kurtosis). High mean values for a six-point
scale were those close to 5.0; pronounced kurtosis was defined by Byrne (2001) as +/-
1.96.
Next, CFA was employed to test the 3-factor models (pre-purchase, purchase,
post-purchase). Path weights of the scale items were examined for significance (p-value <
0.05) and the modification indices (M.I.) were evaluated with the cut off value at 10.0
(Hair et al., 1995). Goodness-of-fit indices (i.e., χ2
test, df, χ2
ratio test, CFI, and RMSEA)
were calculated and recommendations by Hair et al. (1995) were used for evaluation of
model fit (i.e., CFI values greater than or equal to 0.90, RMSEA values less than or equal
to 0.8). Factor loadings > 0.40 are assumed to have practical significance; therefore, this
standard was used in determining which scale items to retain in the 3-factor model.
Factor stability across the three different product categories was examined using tests of
invariance through a multi-group analysis procedure with significant differences
indicated by a p-value < .05.
Next, reliability of each latent construct was examined by assessing composite
reliability (C.R.) for a minimum acceptable reliability coefficient of 0.70 (Hair et al.,
1995). Reliability is a measure of internal consistency. It is the degree to which the
65
construct can produce consistent results across time (Hair et al., 1995) and the degree to
which the measure is free from random error (Peter, 1979).
Validity Testing
Finally, validity is the degree to which an instrument accurately measures the
construct it was designed to measure (Hair et al., 1995; Peter, 1981). Validity was
measured in this study through construct and nomological validity.
Evidence of construct validity was measured through tests for convergent and
discriminant validity with average variance extracted (AVE). Convergent validity is the
degree to which a construct is related to (converges on) other constructs that it
theoretically should also be similar to (Peter, 1981). High correlations should be evidence
of convergent validity. Convergent validity was tested with AVE that indicates the
amount of variance explained by the construct relative to the amount of variance that may
be attributed to measurement error. To indicate that the measurement error is smaller than
the variance captured by the construct and that the indicators are representative of the
construct, the AVE should exceed 0.50 (Fornell & Larcker, 1981; Hair et al., 1995).
Discriminant validity is the degree to which a construct is not related to other
constructs that it theoretically should not be correlated with (Peter, 1981). To show
discriminant validity, the AVE for each construct should be greater than the squared
correlation between that construct and any other construct (Fornell & Larcker, 1981).
Nomological validity assesses “the relationship between constructs purported to
assess different (but conceptually related) constructs” (Peter, 1981, p. 138). Nomological
validity was tested by correlating smart shopping scale responses with existing scales of
66
theoretically-related constructs. Statistically significant correlations produced a p-value >
0.05. Nine constructs that are believed to be related to the smart shopping construct
developed in this study were selected from the literature for this purpose. Nomological
validity was tested by correlating pre-purchase and purchase scale responses with: price
consciousness (Alford & Biswas, 2002), convenience seeking (Noble et al., 2006),
marketplace knowledge (Clark et al., 2001), time consciousness (Kleijnen et al., 2007),
and smart shopping (Mano & Elliott, 1997; Reynolds et al., 2002). Nomological validity
was also tested by correlating post-purchase scale responses with: hedonic shopping
value (Babin et al., 1994), utilitarian shopping value (Babin et al., 1994), satisfaction
(Arora, 1985), and smart shopper self-perception (Burton et al., 1998).
Price-consciousness is the degree to which the consumer focuses exclusively on
paying low prices (Alford & Biswas, 2002; Lichtenstein et al., 1993). The price-
consciousness scale (Alford & Biswas, 2002) includes the statement “The money saved
by finding lower prices is usually worth the time and effort.” It is expected that there will
be a correlation between price-consciousness and saving money. Therefore:
H1: The correlation between the price-consciousness and saving money constructs
will be positive.
Convenience-seeking is “the degree to which consumers strive for time saving in
their shopping” (Noble et al., 2006, p. 181). The convenience-seeking scale includes the
statement “I want to shop in the least amount of time.” A correlation between the
convenience-seeking, saving time, and saving effort constructs was expected. Therefore:
67
H2a: The correlation between the convenience-seeking and saving time constructs
will be positive.
H2b: The correlation between the convenience-seeking and saving effort
constructs will be positive.
Marketplace knowledge is the consumer‟s level of knowledge of factors such as
prices, stores, and shopping (Clark et al., 2001). The marketplace knowledge scale
(Clark et al., 2001) includes the statement “I am usually well-informed about what is a
reasonable price to pay for something.” It is posited that there will be a positive
correlation between the marketplace knowledge and information search constructs.
Therefore:
H3: The correlation between the marketplace knowledge and information search
constructs will be positive.
Time-consciousness is one‟s predisposition to consider time a scarce resource and
to plan its use carefully (Kleijnen et al., 2007). The time-consciousness scale (Kleijnen et
al., 2007) includes the statement “I often combine tasks to optimally use my time.” It is
posited that there will be a correlation between the time-consciousness, saving time, and
saving effort constructs. Therefore:
H4a: The correlation between time-consciousness and saving time constructs will
be positive.
H4b: The correlation between the time-consciousness and saving effort constructs
will be positive.
68
Mano and Elliott defined smart shopping as “a tendency for consumers to invest
considerable time and effort in seeking and utilizing promotion-related information to
achieve price savings” (1997, p. 504). The smart shopping scale (Mano & Elliott, 1997;
Reynolds et al., 2002) includes the statement “I often find top quality merchandise at
reduced prices.” It is posited that there will be a positive correlation between the smart
shopping (as defined by Mano and Elliott, 1997) and saving money constructs. Therefore:
H5: The correlation between the smart shopping and saving money constructs will
be positive.
Hedonic shopping value reflects the potential entertainment and emotional worth
of shopping. The hedonic shopping value scale (Babin et al., 1994) includes the
statement “This shopping trip truly felt like an escape.” Hedonic shopping value is
expected to be positively correlated with the satisfaction and getting rewards constructs.
Therefore:
H6a: The correlation between the hedonic shopping value and satisfaction
constructs will be positive.
H6b: The correlation between the hedonic shopping value and getting rewards
constructs will be positive.
Utilitarian shopping value is task-related and rational. It is dependent upon
whether the shopping task was accomplished (Babin et al., 1994). The utilitarian
shopping value scale (Babin et al., 1994) includes the statement “I accomplished just
what I wanted to on this shopping trip.” Utilitarian shopping value is expected to be
positively correlated with usefulness. Therefore:
69
H7: The correlation between utilitarian shopping value and usefulness constructs
will be positive.
Satisfaction is “a post-choice evaluative judgment concerning a specific purchase
decision” (Westbrook & Oliver, 1991, p. 84). The satisfaction scale (Westbrook &
Oliver, 1991) includes the statement “I am very satisfied with most of my purchases.”
Satisfaction (as defined by Westbrook and Oliver, 1991) is expected to be positively
correlated with the getting rewards, satisfaction, and word of mouth constructs.
Therefore:
H8a: The correlation between the satisfaction (as defined by Westbrook and
Oliver, 1991) and satisfaction constructs will be positive.
H8b: The correlation between the satisfaction (as defined by Westbrook and
Oliver, 1991) and getting rewards constructs will be positive.
H8c: The correlation between the satisfaction (as defined by Westbrook and
Oliver, 1991) and word of mouth constructs will be positive.
Smart shoppers are not easily influenced by national advertising campaigns, are
less impulsive in their decision-making, and make rational choices among brand
alternatives without being influenced by national brand product images (Burton et al.,
1998). The smart shopper self-perception scale (Burton et al., 1998) includes the
statement “When I shop smartly, I feel like a winner.” Smart shopper self-perception is
expected to be positively correlated with the usefulness construct. Therefore:
H9: The correlation between the smart shopper self-perception and usefulness
constructs will be positive.
70
Chapter Summary
Chapter III described methods employed to gain a better understanding and
conceptualization of the term smart shopping. The research process suggested by
Churchill (1979) was discussed. Qualitative methods were used to complete the focus
group interviews, face-to-face in-depth interviews, initial item generation, and instrument
development. The conceptual framework of smart shopping was proposed and the
quantitative methods used for the pilot test, pretest, and main study were presented.
71
CHAPTER IV
RESULTS AND DISCUSSIONS
This chapter describes the data analyses conducted in the pilot test, pretest and
main study. The pilot test was conducted for initial scale refinement with content
analyses and exploratory factor analyses. Next, the pretest was conducted for scale
purification through confirmatory factor analysis. Finally, the main study was conducted
for scale validation through confirmatory factor analysis, construct validity, nomological
validity, and composite reliability. The results of the data analyses will be presented in
the pilot test for each stage (i.e., pre-purchase, purchase, and post-purchase). For the
pretest and main study, the results will be present for each stage and for each product
category (i.e., clothing, grocery, and electronics).
Pilot Test: Initial Scale Refinement
To refine the measurement items generated from this study, the pilot test
consisting of 63 smart shopping items was conducted on a convenience sample of
undergraduate students majoring in Retail and Consumer Sciences at a major
southeastern university. A total of 100 usable surveys were collected; 80 from women
and 20 from men, 93 percent of whom were between the ages of 19 and 23 years. The
surveys were completed in 15 minutes on average.
The purpose of the pilot test was to conduct exploratory factor analyses (EFA) to
examine factor patterns. Using data obtained from the student sample (n = 100), EFA
with principal component analysis as an extraction method and Varimax rotation with
Kaiser normalization was conducted separately for the three stages: pre-purchase,
72
purchase, and post-purchase. The exploratory mode is used to determine how observed
variables are linked to their underlying factors.
Items with factor loadings of 0.40 or above were retained. Item-total correlations
were also examined for each set of smart shopping items. The results identified four
factors for the pre-purchase stage (see Table 9) accounting for 61.47% of the total
variance, nine factors for the purchase stage (see Table 10) accounting for 73.35% of the
total variance, and three factors for the post purchase stage (see Table 11) accounting for
58.91% of the total variance. The reliability of each construct was assessed using
Cronbach‟s alpha coefficient. Coefficient alphas of the sixteen factors ranged from .559
to .916, indicating acceptable levels of reliability for an exploratory study.
The sixteen factors were each given a descriptive label after careful consideration
of the statements included in each factor (see Tables 9, 10 & 11). The four factors
identified in the pre-purchase stage were labeled as: comparison shopping (four scale
items, α = 0.716), information search (three scale items, α = 0.677), planning for sale
purchases (four items, α = 0.680), and planning for purchase (three scale items, α =
0.653). The purchase stage consisted of nine factors labeled as: saving money (six items,
α = 0.786), saving time (four items, α = 0.817), saving effort (five items, α = 0.684), right
fit (three items, α = 0.742), getting the right product (three items, α = 0.559), making bulk
purchases (two items, α = 0.852), using coupons (two items, α = 0.825), getting
convenience (two items, α = 0.612), and making tradeoffs (two items, α = 0.624). The
post-purchase stage consisted of three factors labeled as: positive feelings (seven items, α
= 0.916), word of mouth (six items, α = 0.874), and usefulness (four scale items, α =
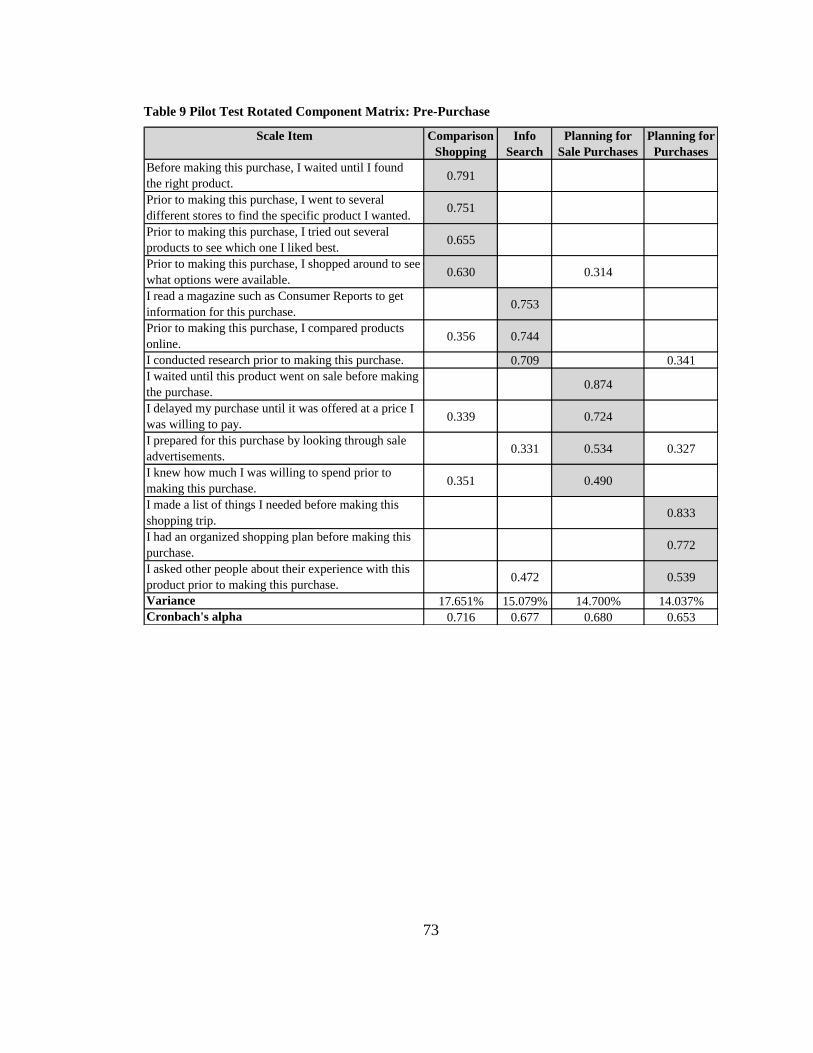
73
Table 9 Pilot Test Rotated Component Matrix: Pre-Purchase
Scale Item Comparison
Shopping
Info
Search
Planning for
Sale Purchases
Planning for
Purchases
Before making this purchase, I waited until I found
the right product.0.791
Prior to making this purchase, I went to several
different stores to find the specific product I wanted.0.751
Prior to making this purchase, I tried out several
products to see which one I liked best.0.655
Prior to making this purchase, I shopped around to see
what options were available.0.630 0.314
I read a magazine such as Consumer Reports to get
information for this purchase. 0.753
Prior to making this purchase, I compared products
online.0.356 0.744
I conducted research prior to making this purchase. 0.709 0.341
I waited until this product went on sale before making
the purchase. 0.874
I delayed my purchase until it was offered at a price I
was willing to pay.0.339 0.724
I prepared for this purchase by looking through sale
advertisements. 0.331 0.534 0.327
I knew how much I was willing to spend prior to
making this purchase.0.351 0.490
I made a list of things I needed before making this
shopping trip. 0.833
I had an organized shopping plan before making this
purchase. 0.772
I asked other people about their experience with this
product prior to making this purchase. 0.472 0.539
Variance 17.651% 15.079% 14.700% 14.037%
Cronbach's alpha 0.716 0.677 0.680 0.653
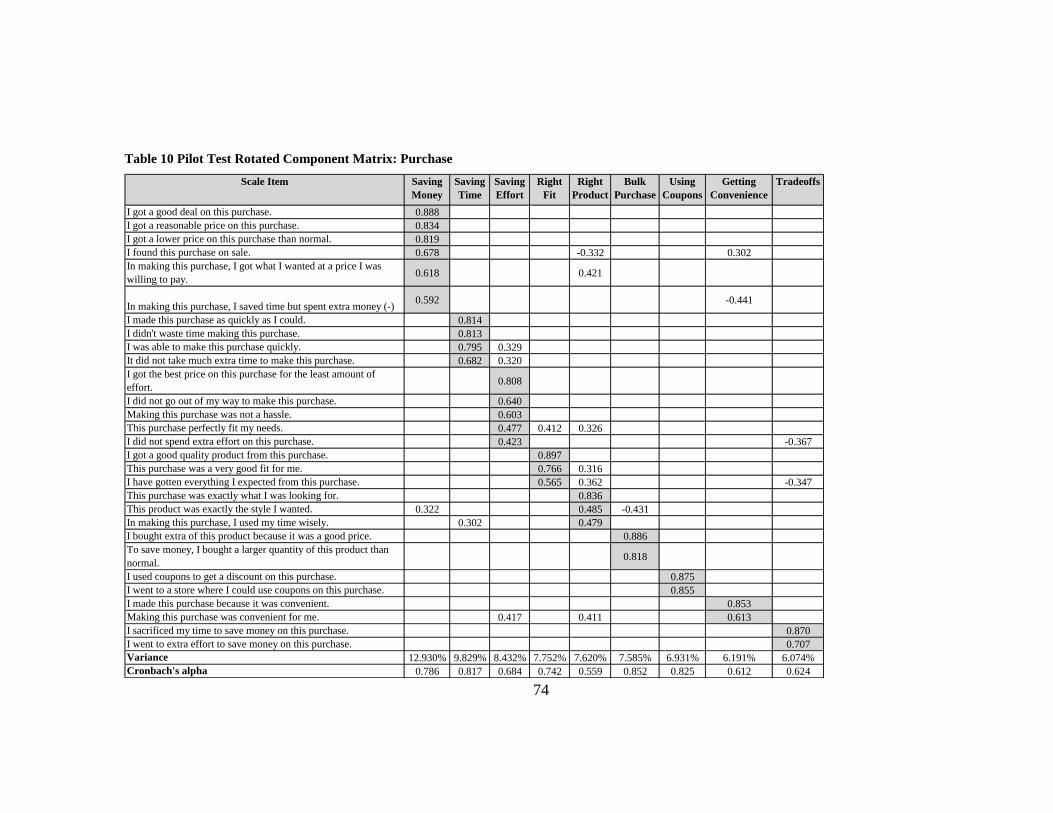
74
Table 10 Pilot Test Rotated Component Matrix: Purchase
Scale Item Saving
Money
Saving
Time
Saving
Effort
Right
Fit
Right
Product
Bulk
Purchase
Using
Coupons
Getting
Convenience
Tradeoffs
I got a good deal on this purchase. 0.888
I got a reasonable price on this purchase. 0.834
I got a lower price on this purchase than normal. 0.819
I found this purchase on sale. 0.678 -0.332 0.302
In making this purchase, I got what I wanted at a price I was
willing to pay.0.618 0.421
In making this purchase, I saved time but spent extra money (-)0.592 -0.441
I made this purchase as quickly as I could. 0.814
I didn't waste time making this purchase. 0.813
I was able to make this purchase quickly. 0.795 0.329
It did not take much extra time to make this purchase. 0.682 0.320
I got the best price on this purchase for the least amount of
effort. 0.808
I did not go out of my way to make this purchase. 0.640
Making this purchase was not a hassle. 0.603
This purchase perfectly fit my needs. 0.477 0.412 0.326
I did not spend extra effort on this purchase. 0.423 -0.367
I got a good quality product from this purchase. 0.897
This purchase was a very good fit for me. 0.766 0.316
I have gotten everything I expected from this purchase. 0.565 0.362 -0.347
This purchase was exactly what I was looking for. 0.836
This product was exactly the style I wanted. 0.322 0.485 -0.431
In making this purchase, I used my time wisely. 0.302 0.479
I bought extra of this product because it was a good price. 0.886
To save money, I bought a larger quantity of this product than
normal. 0.818
I used coupons to get a discount on this purchase. 0.875
I went to a store where I could use coupons on this purchase. 0.855
I made this purchase because it was convenient. 0.853
Making this purchase was convenient for me. 0.417 0.411 0.613
I sacrificed my time to save money on this purchase. 0.870
I went to extra effort to save money on this purchase. 0.707
Variance 12.930% 9.829% 8.432% 7.752% 7.620% 7.585% 6.931% 6.191% 6.074%
Cronbach's alpha 0.786 0.817 0.684 0.742 0.559 0.852 0.825 0.612 0.624
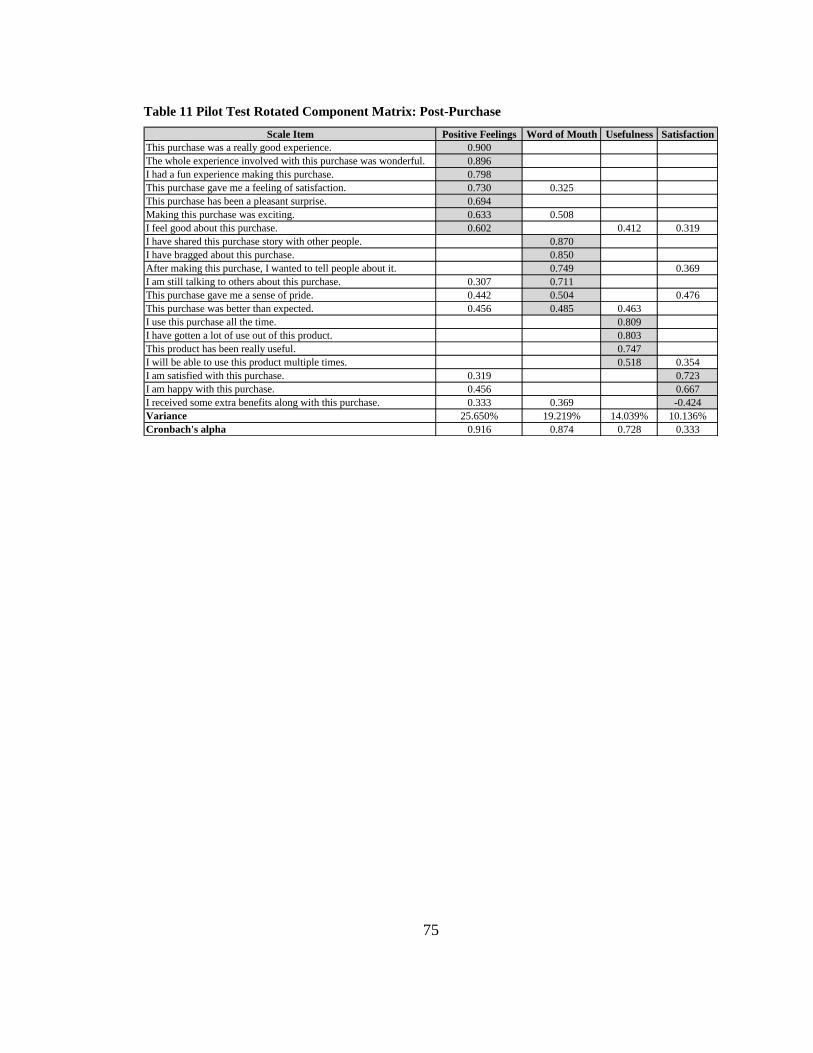
75
Table 11 Pilot Test Rotated Component Matrix: Post-Purchase
Scale Item Positive Feelings Word of Mouth Usefulness Satisfaction
This purchase was a really good experience. 0.900
The whole experience involved with this purchase was wonderful. 0.896
I had a fun experience making this purchase. 0.798
This purchase gave me a feeling of satisfaction. 0.730 0.325
This purchase has been a pleasant surprise. 0.694
Making this purchase was exciting. 0.633 0.508
I feel good about this purchase. 0.602 0.412 0.319
I have shared this purchase story with other people. 0.870
I have bragged about this purchase. 0.850
After making this purchase, I wanted to tell people about it. 0.749 0.369
I am still talking to others about this purchase. 0.307 0.711
This purchase gave me a sense of pride. 0.442 0.504 0.476
This purchase was better than expected. 0.456 0.485 0.463
I use this purchase all the time. 0.809
I have gotten a lot of use out of this product. 0.803
This product has been really useful. 0.747
I will be able to use this product multiple times. 0.518 0.354
I am satisfied with this purchase. 0.319 0.723
I am happy with this purchase. 0.456 0.667
I received some extra benefits along with this purchase. 0.333 0.369 -0.424
Variance 25.650% 19.219% 14.039% 10.136%
Cronbach's alpha 0.916 0.874 0.728 0.333
76
0.728).
Items cross-loading onto more than one factor were called into question. Three
scale items did not load strongly (< 0.40) onto any factor. These items were, “I am
satisfied with this purchase;” “I am happy with this purchase;” and “I received some extra
benefits along with this purchase.” Those these factors did not load strongly onto any
factor, all items used in the pilot test were retained for the pretest because the researcher
felt the sample size and the convenience sample of students may not have been truly
representative of the general consumer population. In addition, a pretest on the general
consumer population was conducted before the main study and the loadings would be
examined again. In sum, the results of the factor analyses largely corroborated the
previously identified model of smart shopping in Figure 2.
The pilot test results suggested further scale refinement by modifying the
questionnaire wording and instructions. To establish whether a participant was in the
population of interest in this study, the question, “Have you purchased clothing, grocery,
or electronics in-store in the last 3 months?” was added to the questionnaire. Next, the
open-ended questions, “Please indicate the store name where you made this “smart”
purchase” and “Please give a brief description of your purchase and why you consider
this a smart purchase” were added as a sequence of questions for cognitive recall of a
specific smart shopping trip. Asking the participant to provide details about a particular
experience has proven to improve recall accuracy; therefore, significantly more accurate
responses can be obtained by using this format (Dillman, 2000). Finally, the stem of each
77
section was changed to improve the clarity of wording for the participant (see
Appendices D & E for comparison of stems).
Pretest: Scale Purification
The pretest was conducted for scale purification. The sample was drawn from
online consumers who had purchased clothing, grocery, or electronics in-store in the last
three months and were age 18 or older.
Table 12 depicts the characteristics of the pretest participants. The sample (n =
237) consisted of responses to three product categories: 39% clothing (n = 91), 46%
grocery (n = 110), and 15% electronics (n = 36). An inspection of the demographic
characteristics of the pretest participants revealed representation in all age, ethnicity,
marital status, and educational attainment categories. The age categories were fairly
evenly distributed. Regarding ethnicity, 91.1% of the sample was Caucasian; half of the
participants were married (50.2%); and almost half of the participants had a Bachelor‟s
degree or higher. In addition, the gender was split fairly equally between females (59.1%)
and males (40.9%).
First, confirmatory factor analysis (CFA) using AMOS with the maximum
likelihood model was conducted separately for the three stages: pre-purchase, purchase,
and post-purchase. CFA of the pre-purchase stage revealed seven items that had low
factor loadings in the electronics product category; four items that had low factor
loadings in the clothing product category; and one item that had a low factor loading in
the grocery product category (see Table 13). The items with low factor loadings are
depicted in the table with asterisks. Rather than eliminating these items, the researcher
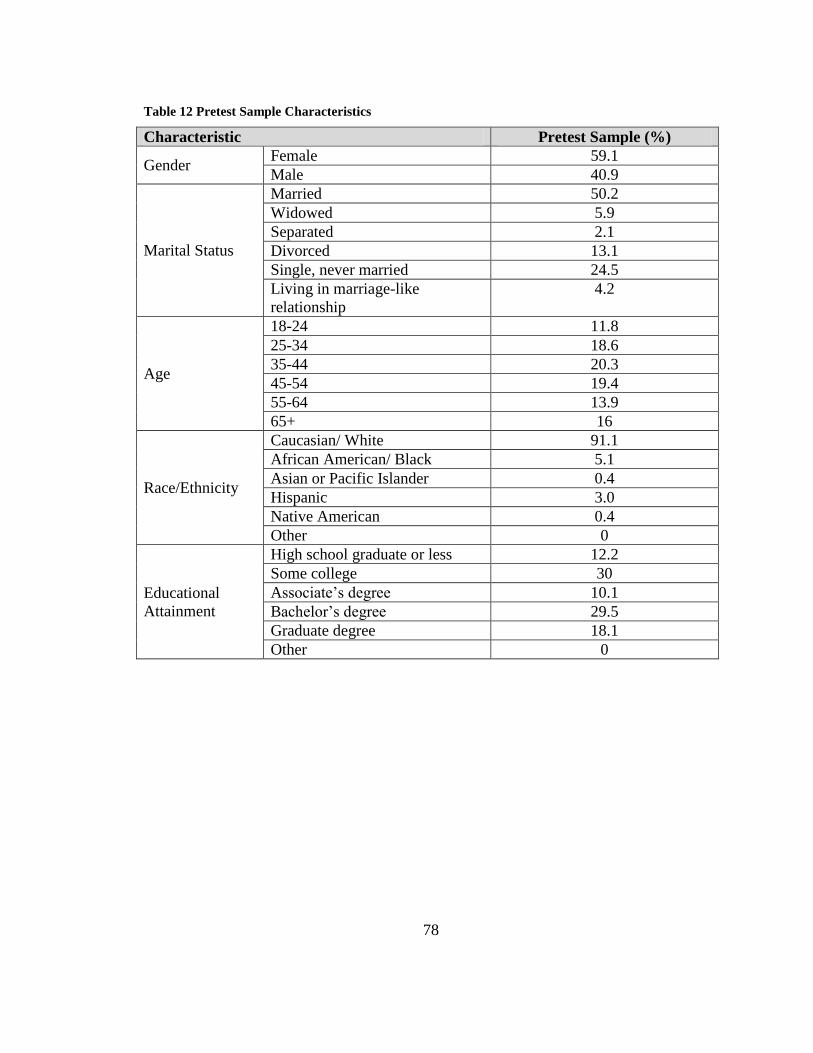
78
Table 12 Pretest Sample Characteristics
Characteristic Pretest Sample (%)
Gender Female 59.1
Male 40.9
Marital Status
Married 50.2
Widowed 5.9
Separated 2.1
Divorced 13.1
Single, never married 24.5
Living in marriage-like
relationship
4.2
Age
18-24 11.8
25-34 18.6
35-44 20.3
45-54 19.4
55-64 13.9
65+ 16
Race/Ethnicity
Caucasian/ White 91.1
African American/ Black 5.1
Asian or Pacific Islander 0.4
Hispanic 3.0
Native American 0.4
Other 0
Educational
Attainment
High school graduate or less 12.2
Some college 30
Associate‟s degree 10.1
Bachelor‟s degree 29.5
Graduate degree 18.1
Other 0
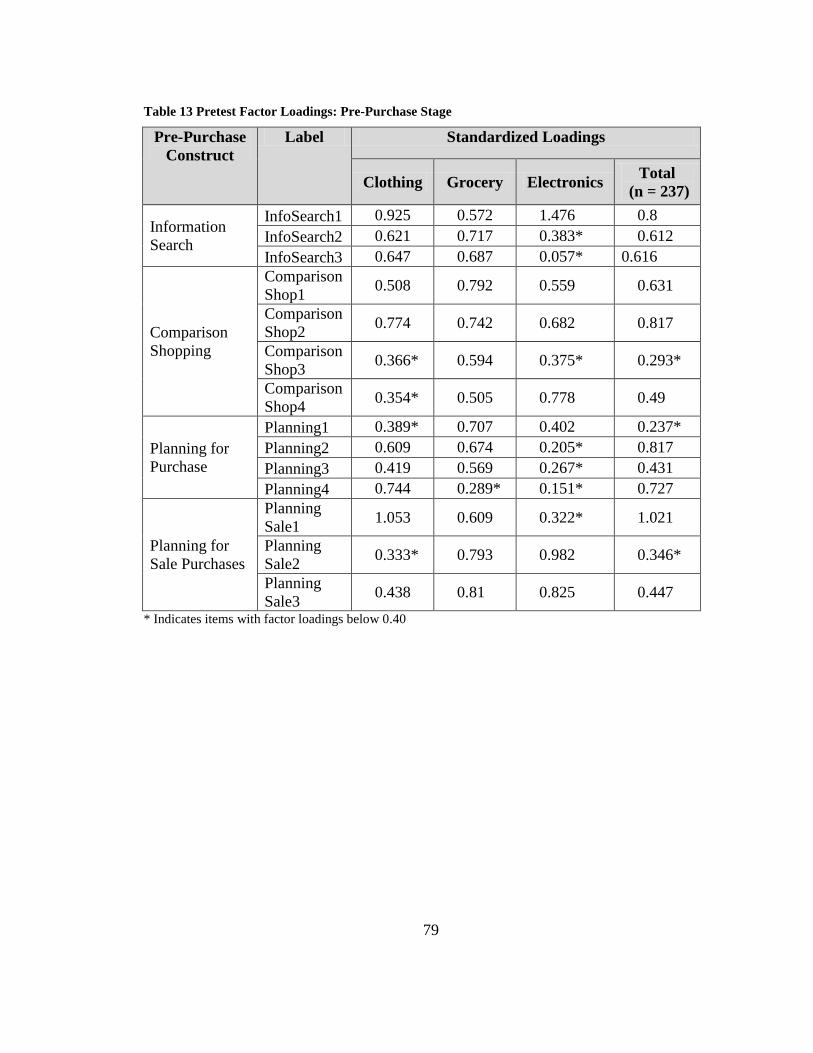
79
Table 13 Pretest Factor Loadings: Pre-Purchase Stage
Pre-Purchase
Construct
Label Standardized Loadings
Clothing Grocery Electronics Total
(n = 237)
Information
Search
InfoSearch1 0.925 0.572 1.476 0.8
InfoSearch2 0.621 0.717 0.383* 0.612
InfoSearch3 0.647 0.687 0.057* 0.616
Comparison
Shopping
Comparison
Shop1 0.508 0.792 0.559 0.631
Comparison
Shop2 0.774 0.742 0.682 0.817
Comparison
Shop3 0.366* 0.594 0.375* 0.293*
Comparison
Shop4 0.354* 0.505 0.778 0.49
Planning for
Purchase
Planning1 0.389* 0.707 0.402 0.237*
Planning2 0.609 0.674 0.205* 0.817
Planning3 0.419 0.569 0.267* 0.431
Planning4 0.744 0.289* 0.151* 0.727
Planning for
Sale Purchases
Planning
Sale1 1.053 0.609 0.322* 1.021
Planning
Sale2 0.333* 0.793 0.982 0.346*
Planning
Sale3 0.438 0.81 0.825 0.447
* Indicates items with factor loadings below 0.40
80
decided to keep the items because each item had reasonable factor loadings (> 0.40) for
other product categories in the pre-purchase stage.
CFA of the purchase stage revealed twelve items that had low factor loadings in
the electronics and clothing product categories and six items that had low factor loadings
in the grocery product category (see Table 14). The items with low factor loadings are
depicted in the tables with asterisks. The researcher decided to eliminate the items that
had low factor loadings for all three product categories in the purchase stage because the
items did not converge in any of the product categories. The eliminated items were
SavingMoney5 (I used coupons to get a discount on this purchase.), SavingMoney6 (I
went to a store where I could use coupons on this purchase.), SavingMoney7 (To save
money, I bought a larger quantity of this product than normal.), and SavingMoney8 (I
bought extra of this product because it was a good price.). In addition, the researcher
chose to eliminate all four items of making tradeoffs construct because it had low factor
loadings for all product categories on 3 of the 4 scale items; therefore, a total of eight
items were eliminated from the pretest.
Upon the recommendation of a professor of statistics, an additional item for the
getting convenience construct was added because three scale items are infinitely more
valuable than two items. Peter (1979) advocates the use of a minimum of three scale
items to assess reliability of a construct. The additional getting convenience item was
developed by reassessing the face-to-face individual depth interview analyses, selecting
two or three statements that pertained to the construct, and asking a panel of experts to
choose the statement that would most appropriately represent the construct and add to the
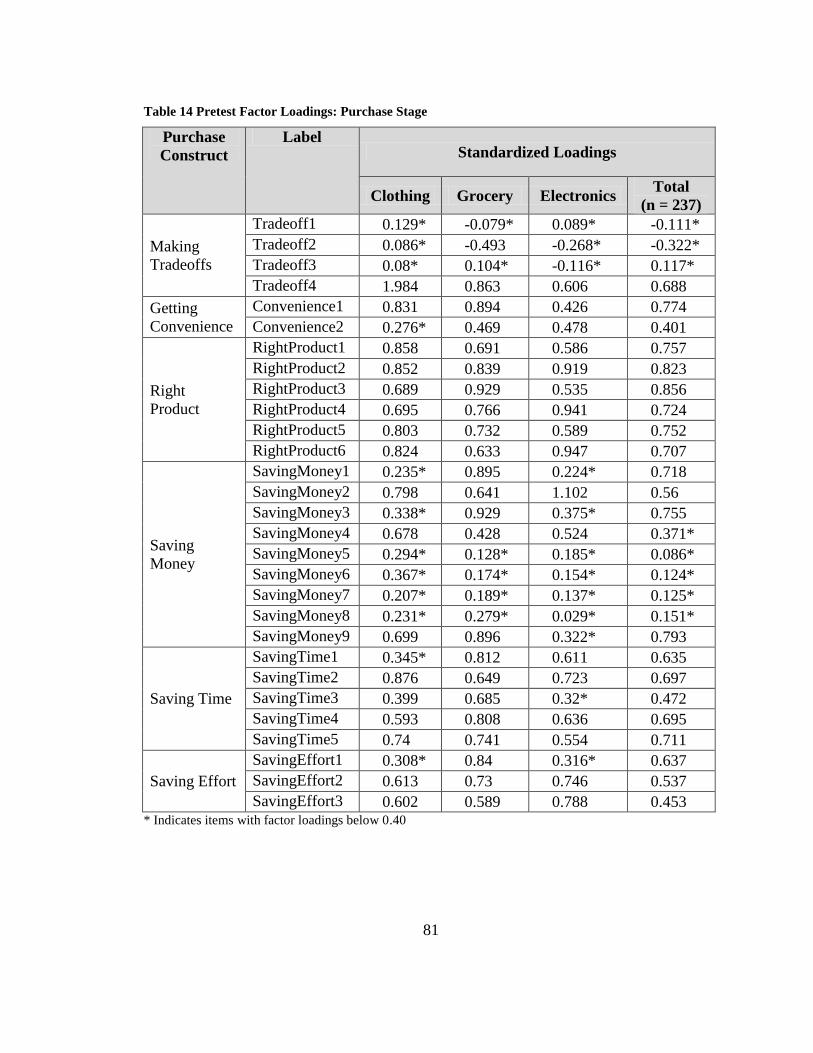
81
Table 14 Pretest Factor Loadings: Purchase Stage
Purchase
Construct
Label Standardized Loadings
Clothing Grocery Electronics Total
(n = 237)
Making
Tradeoffs
Tradeoff1 0.129* -0.079* 0.089* -0.111*
Tradeoff2 0.086* -0.493 -0.268* -0.322*
Tradeoff3 0.08* 0.104* -0.116* 0.117*
Tradeoff4 1.984 0.863 0.606 0.688
Getting
Convenience
Convenience1 0.831 0.894 0.426 0.774
Convenience2 0.276* 0.469 0.478 0.401
Right
Product
RightProduct1 0.858 0.691 0.586 0.757
RightProduct2 0.852 0.839 0.919 0.823
RightProduct3 0.689 0.929 0.535 0.856
RightProduct4 0.695 0.766 0.941 0.724
RightProduct5 0.803 0.732 0.589 0.752
RightProduct6 0.824 0.633 0.947 0.707
Saving
Money
SavingMoney1 0.235* 0.895 0.224* 0.718
SavingMoney2 0.798 0.641 1.102 0.56
SavingMoney3 0.338* 0.929 0.375* 0.755
SavingMoney4 0.678 0.428 0.524 0.371*
SavingMoney5 0.294* 0.128* 0.185* 0.086*
SavingMoney6 0.367* 0.174* 0.154* 0.124*
SavingMoney7 0.207* 0.189* 0.137* 0.125*
SavingMoney8 0.231* 0.279* 0.029* 0.151*
SavingMoney9 0.699 0.896 0.322* 0.793
Saving Time
SavingTime1 0.345* 0.812 0.611 0.635
SavingTime2 0.876 0.649 0.723 0.697
SavingTime3 0.399 0.685 0.32* 0.472
SavingTime4 0.593 0.808 0.636 0.695
SavingTime5 0.74 0.741 0.554 0.711
Saving Effort
SavingEffort1 0.308* 0.84 0.316* 0.637
SavingEffort2 0.613 0.73 0.746 0.537
SavingEffort3 0.602 0.589 0.788 0.453 * Indicates items with factor loadings below 0.40
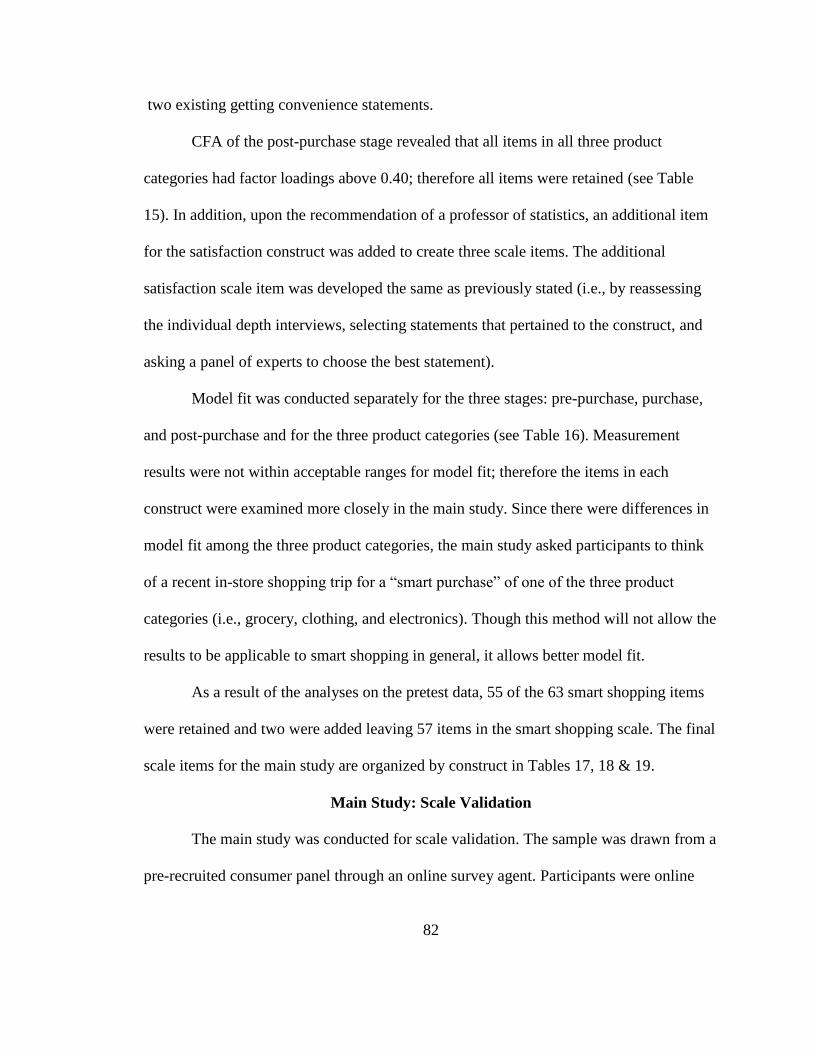
82
two existing getting convenience statements.
CFA of the post-purchase stage revealed that all items in all three product
categories had factor loadings above 0.40; therefore all items were retained (see Table
15). In addition, upon the recommendation of a professor of statistics, an additional item
for the satisfaction construct was added to create three scale items. The additional
satisfaction scale item was developed the same as previously stated (i.e., by reassessing
the individual depth interviews, selecting statements that pertained to the construct, and
asking a panel of experts to choose the best statement).
Model fit was conducted separately for the three stages: pre-purchase, purchase,
and post-purchase and for the three product categories (see Table 16). Measurement
results were not within acceptable ranges for model fit; therefore the items in each
construct were examined more closely in the main study. Since there were differences in
model fit among the three product categories, the main study asked participants to think
of a recent in-store shopping trip for a “smart purchase” of one of the three product
categories (i.e., grocery, clothing, and electronics). Though this method will not allow the
results to be applicable to smart shopping in general, it allows better model fit.
As a result of the analyses on the pretest data, 55 of the 63 smart shopping items
were retained and two were added leaving 57 items in the smart shopping scale. The final
scale items for the main study are organized by construct in Tables 17, 18 & 19.
Main Study: Scale Validation
The main study was conducted for scale validation. The sample was drawn from a
pre-recruited consumer panel through an online survey agent. Participants were online
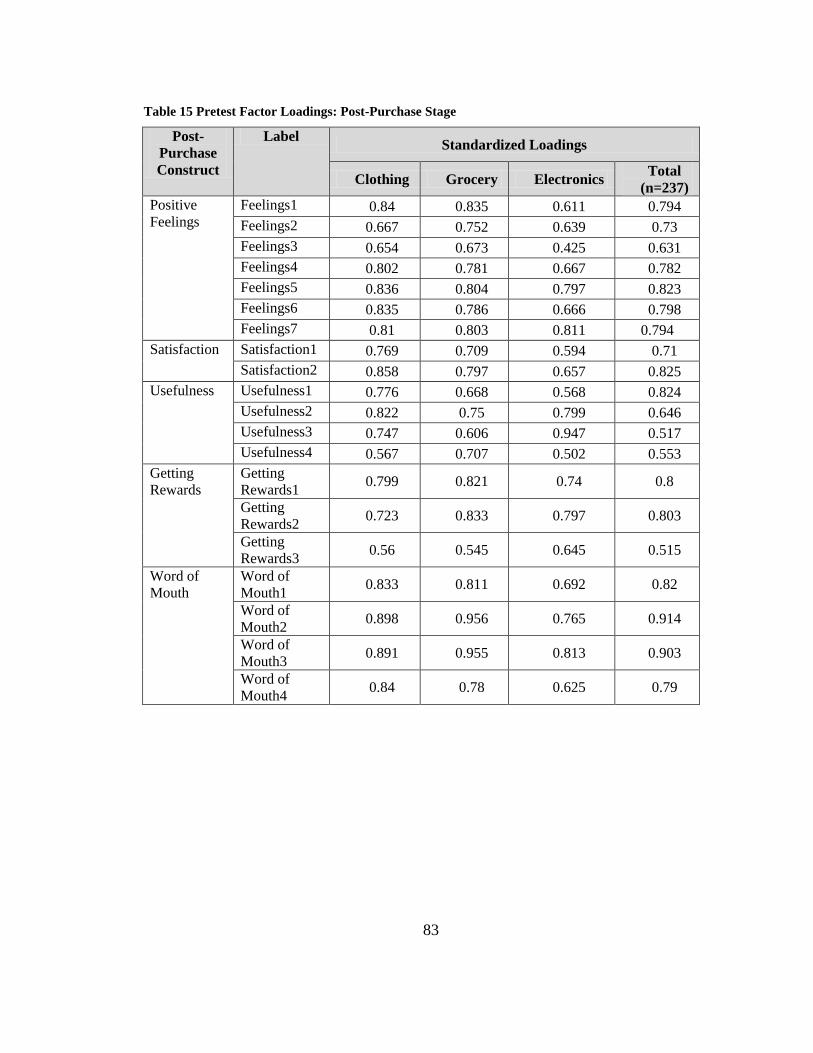
83
Table 15 Pretest Factor Loadings: Post-Purchase Stage
Post-
Purchase
Construct
Label Standardized Loadings
Clothing Grocery Electronics Total
(n=237)
Positive
Feelings
Feelings1 0.84 0.835 0.611 0.794
Feelings2 0.667 0.752 0.639 0.73
Feelings3 0.654 0.673 0.425 0.631
Feelings4 0.802 0.781 0.667 0.782
Feelings5 0.836 0.804 0.797 0.823
Feelings6 0.835 0.786 0.666 0.798
Feelings7 0.81 0.803 0.811 0.794
Satisfaction Satisfaction1 0.769 0.709 0.594 0.71
Satisfaction2 0.858 0.797 0.657 0.825
Usefulness Usefulness1 0.776 0.668 0.568 0.824
Usefulness2 0.822 0.75 0.799 0.646
Usefulness3 0.747 0.606 0.947 0.517
Usefulness4 0.567 0.707 0.502 0.553
Getting
Rewards
Getting
Rewards1 0.799 0.821 0.74 0.8
Getting
Rewards2 0.723 0.833 0.797 0.803
Getting
Rewards3 0.56 0.545 0.645 0.515
Word of
Mouth
Word of
Mouth1 0.833 0.811 0.692 0.82
Word of
Mouth2 0.898 0.956 0.765 0.914
Word of
Mouth3 0.891 0.955 0.813 0.903
Word of
Mouth4 0.84 0.78 0.625 0.79
84
Table 16 Pretest Model Fit Statistics
Stage and Category CFI GFI AGFI NFI RMSEA
Pre-Purchase Clothing (n=91) 0.872 0.849 0.771 0.762 0.094
Grocery (n=110) 0.881 0.847 0.770 0.797 0.098
Electronics (n=36) 0.673 0.671 0.513 0.527 0.159
Total (n=237) 0.887 0.893 0.829 0.845 0.094
Purchase Clothing (n=91) 0.761 0.687 0.618 0.609 0.098
Grocery (n=110) 0.829 0.693 0.624 0.727 0.103
Electronics (n=36) 0.455 0.513 0.408 0.329 0.172
Total (n=237) 0.847 0.778 0.724 0.775 0.082
Post-Purchase Clothing (n=91) 0.842 0.705 0.608 0.765 0.128
Grocery (n=110) 0.786 0.687 0.579 0.731 0.154
Electronics (n=36) 0.711 0.630 0.514 0.511 0.131
Total (n=237) 0.842 0.769 0.689 0.808 0.123
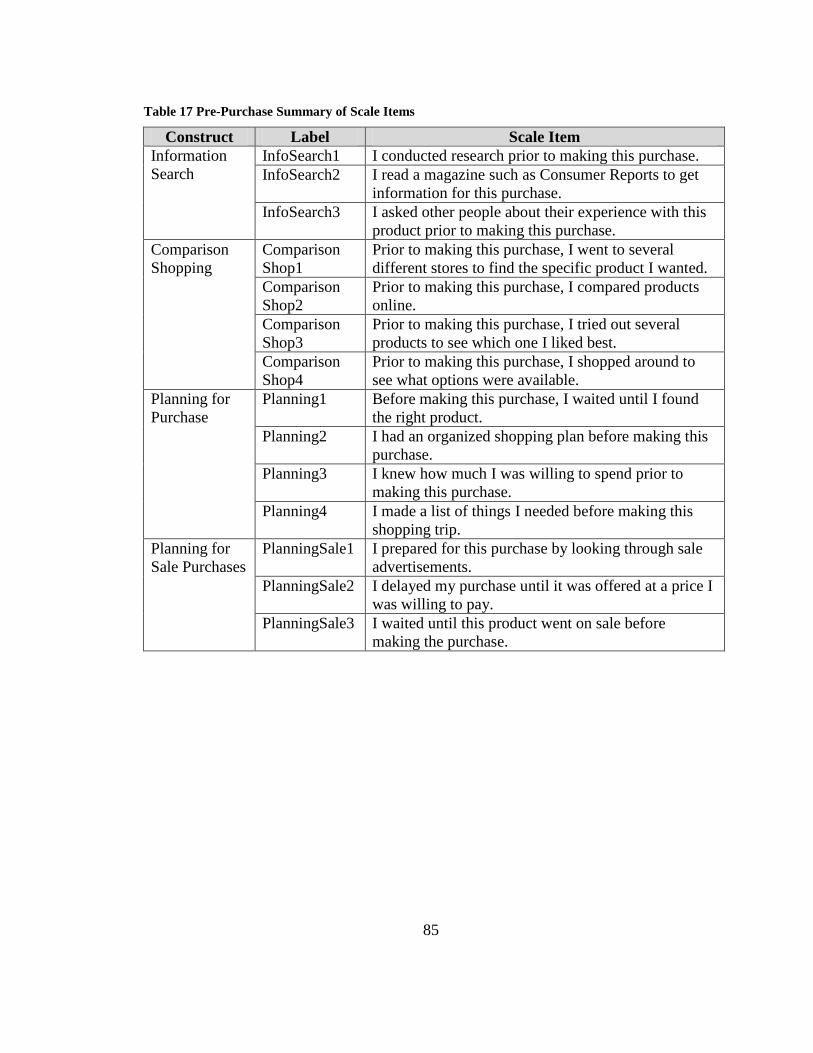
85
Table 17 Pre-Purchase Summary of Scale Items
Construct Label Scale Item
Information
Search
InfoSearch1 I conducted research prior to making this purchase.
InfoSearch2 I read a magazine such as Consumer Reports to get
information for this purchase.
InfoSearch3 I asked other people about their experience with this
product prior to making this purchase.
Comparison
Shopping
Comparison
Shop1
Prior to making this purchase, I went to several
different stores to find the specific product I wanted.
Comparison
Shop2
Prior to making this purchase, I compared products
online.
Comparison
Shop3
Prior to making this purchase, I tried out several
products to see which one I liked best.
Comparison
Shop4
Prior to making this purchase, I shopped around to
see what options were available.
Planning for
Purchase
Planning1 Before making this purchase, I waited until I found
the right product.
Planning2 I had an organized shopping plan before making this
purchase.
Planning3 I knew how much I was willing to spend prior to
making this purchase.
Planning4 I made a list of things I needed before making this
shopping trip.
Planning for
Sale Purchases
PlanningSale1 I prepared for this purchase by looking through sale
advertisements.
PlanningSale2 I delayed my purchase until it was offered at a price I
was willing to pay.
PlanningSale3 I waited until this product went on sale before
making the purchase.
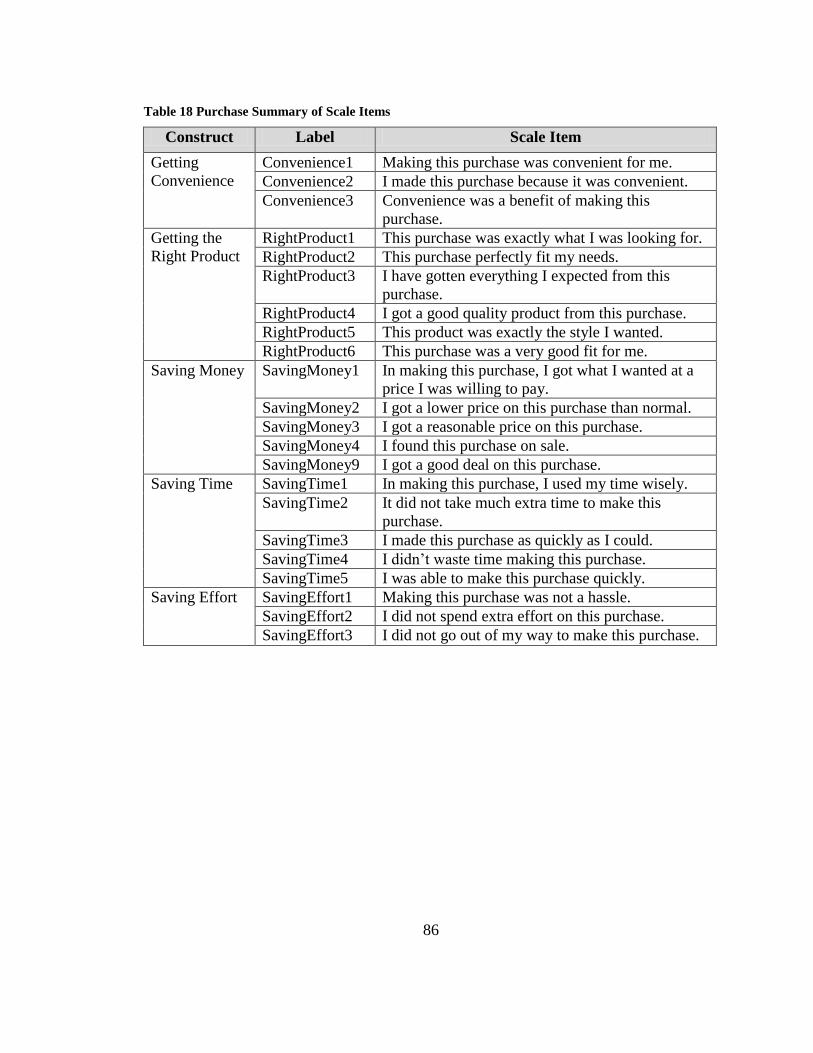
86
Table 18 Purchase Summary of Scale Items
Construct Label Scale Item
Getting
Convenience
Convenience1 Making this purchase was convenient for me.
Convenience2 I made this purchase because it was convenient.
Convenience3 Convenience was a benefit of making this
purchase.
Getting the
Right Product
RightProduct1 This purchase was exactly what I was looking for.
RightProduct2 This purchase perfectly fit my needs.
RightProduct3 I have gotten everything I expected from this
purchase.
RightProduct4 I got a good quality product from this purchase.
RightProduct5 This product was exactly the style I wanted.
RightProduct6 This purchase was a very good fit for me.
Saving Money SavingMoney1 In making this purchase, I got what I wanted at a
price I was willing to pay.
SavingMoney2 I got a lower price on this purchase than normal.
SavingMoney3 I got a reasonable price on this purchase.
SavingMoney4 I found this purchase on sale.
SavingMoney9 I got a good deal on this purchase.
Saving Time SavingTime1 In making this purchase, I used my time wisely.
SavingTime2 It did not take much extra time to make this
purchase.
SavingTime3 I made this purchase as quickly as I could.
SavingTime4 I didn‟t waste time making this purchase.
SavingTime5 I was able to make this purchase quickly.
Saving Effort SavingEffort1 Making this purchase was not a hassle.
SavingEffort2 I did not spend extra effort on this purchase.
SavingEffort3 I did not go out of my way to make this purchase.
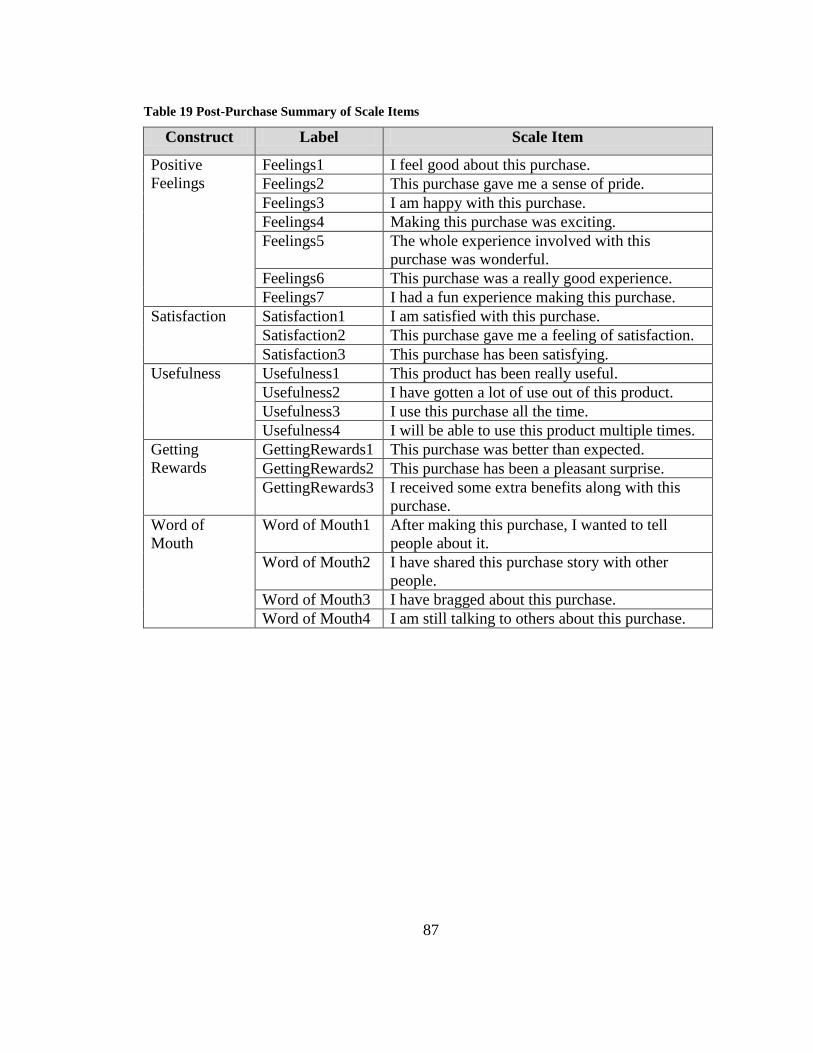
87
Table 19 Post-Purchase Summary of Scale Items
Construct Label Scale Item
Positive
Feelings
Feelings1 I feel good about this purchase.
Feelings2 This purchase gave me a sense of pride.
Feelings3 I am happy with this purchase.
Feelings4 Making this purchase was exciting.
Feelings5 The whole experience involved with this
purchase was wonderful.
Feelings6 This purchase was a really good experience.
Feelings7 I had a fun experience making this purchase.
Satisfaction Satisfaction1 I am satisfied with this purchase.
Satisfaction2 This purchase gave me a feeling of satisfaction.
Satisfaction3 This purchase has been satisfying.
Usefulness Usefulness1 This product has been really useful.
Usefulness2 I have gotten a lot of use out of this product.
Usefulness3 I use this purchase all the time.
Usefulness4 I will be able to use this product multiple times.
Getting
Rewards
GettingRewards1 This purchase was better than expected.
GettingRewards2 This purchase has been a pleasant surprise.
GettingRewards3 I received some extra benefits along with this
purchase.
Word of
Mouth
Word of Mouth1 After making this purchase, I wanted to tell
people about it.
Word of Mouth2 I have shared this purchase story with other
people.
Word of Mouth3 I have bragged about this purchase.
Word of Mouth4 I am still talking to others about this purchase.
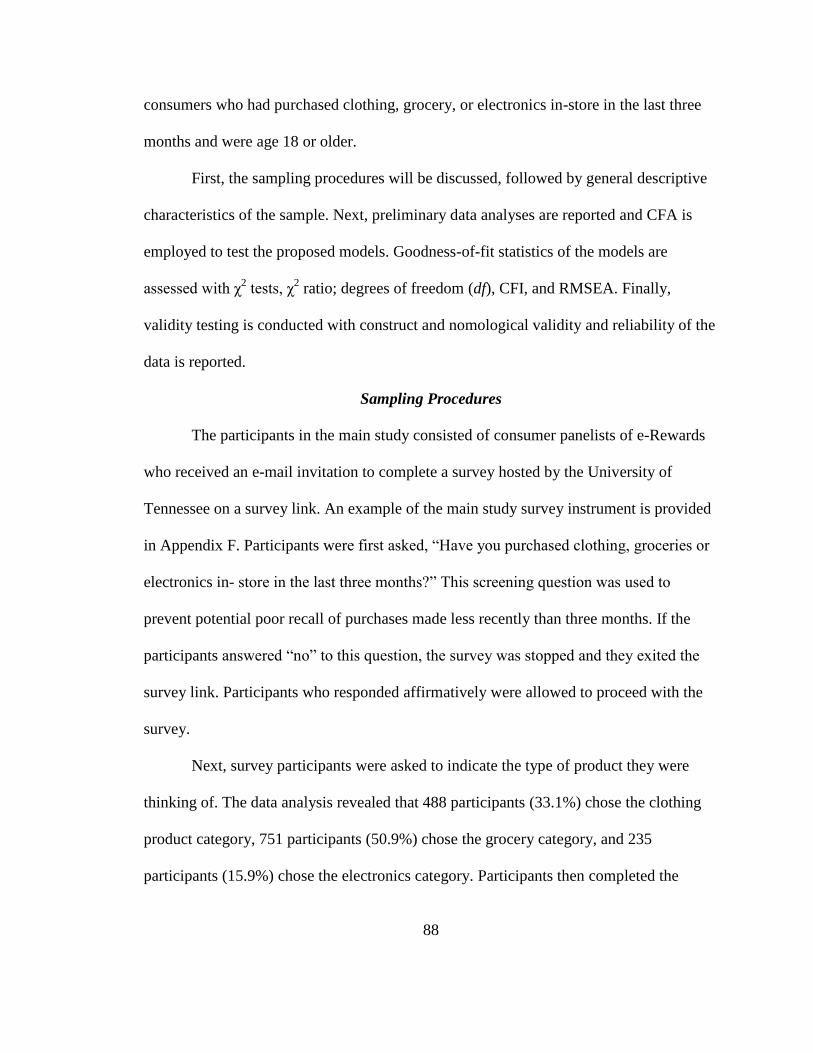
88
consumers who had purchased clothing, grocery, or electronics in-store in the last three
months and were age 18 or older.
First, the sampling procedures will be discussed, followed by general descriptive
characteristics of the sample. Next, preliminary data analyses are reported and CFA is
employed to test the proposed models. Goodness-of-fit statistics of the models are
assessed with χ2 tests, χ
2 ratio; degrees of freedom (df), CFI, and RMSEA. Finally,
validity testing is conducted with construct and nomological validity and reliability of the
data is reported.
Sampling Procedures
The participants in the main study consisted of consumer panelists of e-Rewards
who received an e-mail invitation to complete a survey hosted by the University of
Tennessee on a survey link. An example of the main study survey instrument is provided
in Appendix F. Participants were first asked, “Have you purchased clothing, groceries or
electronics in- store in the last three months?” This screening question was used to
prevent potential poor recall of purchases made less recently than three months. If the
participants answered “no” to this question, the survey was stopped and they exited the
survey link. Participants who responded affirmatively were allowed to proceed with the
survey.
Next, survey participants were asked to indicate the type of product they were
thinking of. The data analysis revealed that 488 participants (33.1%) chose the clothing
product category, 751 participants (50.9%) chose the grocery category, and 235
participants (15.9%) chose the electronics category. Participants then completed the
89
survey with reference to the particular purchase they identified. The survey was designed
so that participants were required to answer each question before proceeding to the next.
Descriptive Statistics
Prior to the statistical analysis of the main study, descriptive characteristics of the
sample were investigated. A total of 2231 people accessed the survey link. Two people
did not complete the survey because of a server malfunction; 574 people abandoned the
survey before completing it; 85 were not qualified to take the survey; 1570 participants
completed the online survey. After 74 duplicate participants, 19 participants with non-
varying responses (i.e., the same response was provided for all questions), and four
participants under age 18 were removed, there remained 1474 usable surveys.
The characteristics of the current sample should be similar to the e-Rewards
consumer panel and the total U.S. demographics. Table 20 presents the demographic
characteristics of the current sample compared to the e-Rewards panel ("e-Rewards North
American Consumer Panel," 2007) and to the general U.S. population ("U.S. Census
Bureau American Community Survey," 2006). An inspection of the characteristics of the
current sample revealed representation in all age, ethnicity, marital status, and education
categories. The age categories were fairly evenly distributed with a mean age of 46 years.
With respect to ethnicity, 83.7% was Caucasian. Almost half of the participants were
married (49.2%) and almost 48 percent of the participants had a Bachelor‟s degree or
higher. The sample was fairly equally divided between males (43%) and females (57%).
An overview of the participant characteristics by product category can be found in
Table 21. Statistical analyses (i.e., χ2 and ANOVA) were conducted to detect differences
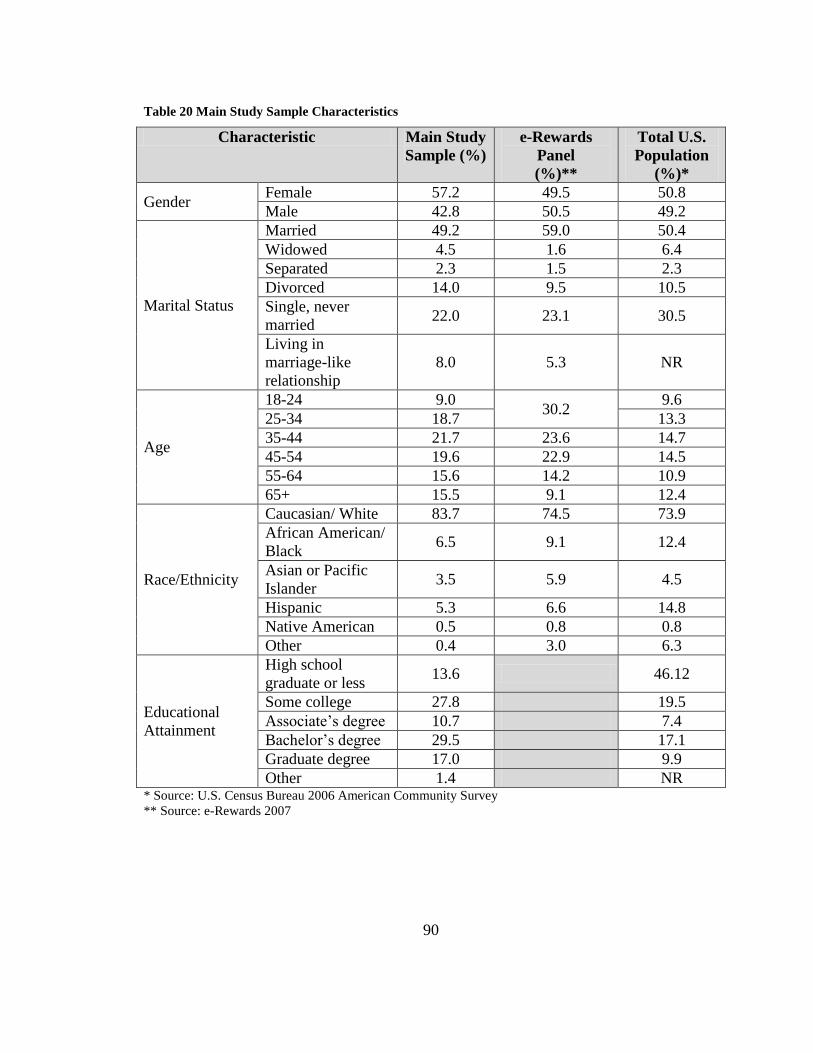
90
Table 20 Main Study Sample Characteristics
Characteristic Main Study
Sample (%)
e-Rewards
Panel
(%)**
Total U.S.
Population
(%)*
Gender Female 57.2 49.5 50.8
Male 42.8 50.5 49.2
Marital Status
Married 49.2 59.0 50.4
Widowed 4.5 1.6 6.4
Separated 2.3 1.5 2.3
Divorced 14.0 9.5 10.5
Single, never
married 22.0 23.1 30.5
Living in
marriage-like
relationship
8.0 5.3 NR
Age
18-24 9.0 30.2
9.6
25-34 18.7 13.3
35-44 21.7 23.6 14.7
45-54 19.6 22.9 14.5
55-64 15.6 14.2 10.9
65+ 15.5 9.1 12.4
Race/Ethnicity
Caucasian/ White 83.7 74.5 73.9
African American/
Black 6.5 9.1 12.4
Asian or Pacific
Islander 3.5 5.9 4.5
Hispanic 5.3 6.6 14.8
Native American 0.5 0.8 0.8
Other 0.4 3.0 6.3
Educational
Attainment
High school
graduate or less 13.6 46.12
Some college 27.8 19.5
Associate‟s degree 10.7 7.4
Bachelor‟s degree 29.5 17.1
Graduate degree 17.0 9.9
Other 1.4 NR * Source: U.S. Census Bureau 2006 American Community Survey
** Source: e-Rewards 2007
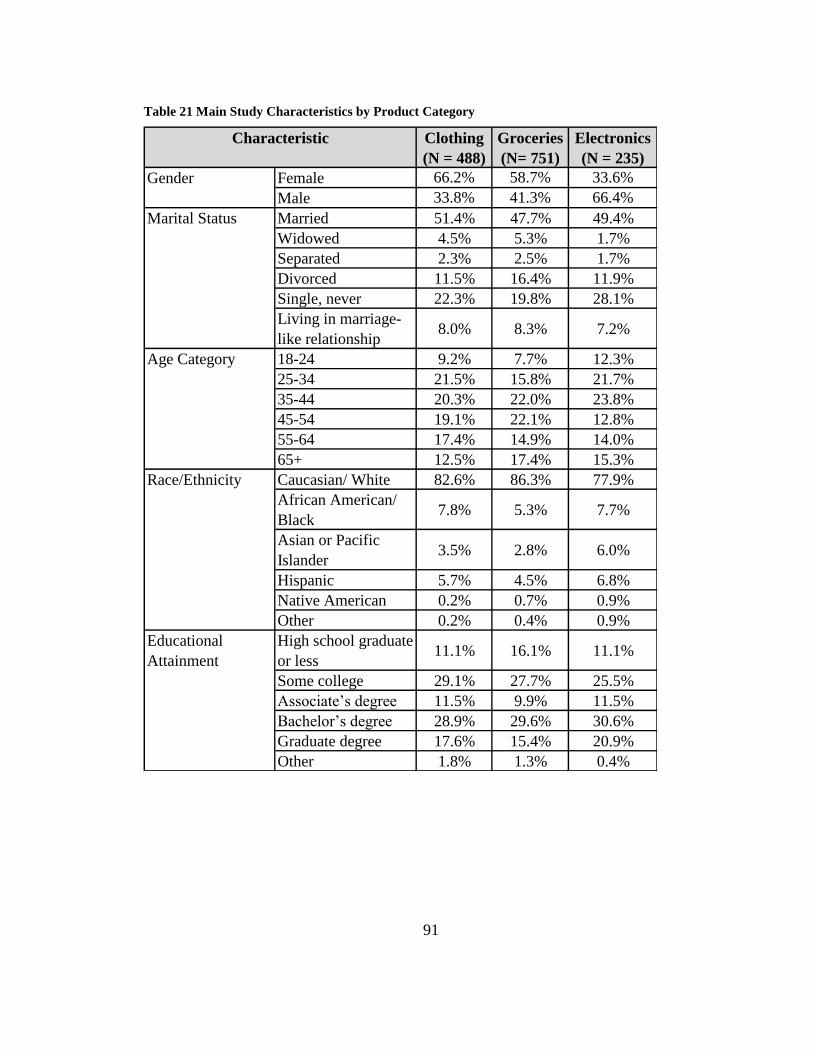
91
Table 21 Main Study Characteristics by Product Category
Clothing
(N = 488)
Groceries
(N= 751)
Electronics
(N = 235)
Female 66.2% 58.7% 33.6%
Male 33.8% 41.3% 66.4%
Married 51.4% 47.7% 49.4%
Widowed 4.5% 5.3% 1.7%
Separated 2.3% 2.5% 1.7%
Divorced 11.5% 16.4% 11.9%
Single, never 22.3% 19.8% 28.1%
Living in marriage-
like relationship8.0% 8.3% 7.2%
18-24 9.2% 7.7% 12.3%
25-34 21.5% 15.8% 21.7%
35-44 20.3% 22.0% 23.8%
45-54 19.1% 22.1% 12.8%
55-64 17.4% 14.9% 14.0%
65+ 12.5% 17.4% 15.3%
Caucasian/ White 82.6% 86.3% 77.9%
African American/
Black7.8% 5.3% 7.7%
Asian or Pacific
Islander3.5% 2.8% 6.0%
Hispanic 5.7% 4.5% 6.8%
Native American 0.2% 0.7% 0.9%
Other 0.2% 0.4% 0.9%
High school graduate
or less11.1% 16.1% 11.1%
Some college 29.1% 27.7% 25.5%
Associate‟s degree 11.5% 9.9% 11.5%
Bachelor‟s degree 28.9% 29.6% 30.6%
Graduate degree 17.6% 15.4% 20.9%
Other 1.8% 1.3% 0.4%
Race/Ethnicity
Educational
Attainment
Characteristic
Gender
Marital Status
Age Category
92
in participant characteristics among the product categories. As shown in Table 22 and 23,
there were significant group differences (p-value < 0.05) in the gender and age category
among the product categories. No significant group differences were found in
race/ethnicity, marital status, or educational attainment. Further invariance testing was
conducted to investigate whether the gender and age groups differed within the product
categories. Appendix G presents the model fit in the unconstrained and constrained rows
and the x2 difference in the difference rows for age category and gender in each product
category and stage. The group comparison illuminated differences in men and women
within the grocery, clothing, and electronics categories. The group comparison also
reported differences in age categories within the clothing and electronics categories. This
indicates that the results may be from differences between groups rather than differences
between product categories.
Preliminary Statistical Analysis
Descriptive statistics of the main study are provided in Appendices H and I.
Mean, minimum and maximum values, standard deviation, skewness, and kurtosis were
calculated using SPSS to measure variability. Every item obtained the full range of
answers (from 1 to 6). Variables marked with an asterisk had relatively high mean values
for a six-point scale (i.e., close to 5.0), relatively low standard deviation values, and
pronounced kurtosis (as defined by Byrne (2001) as +/- 1.96).
Many of the smart shopping scale items appear to be non-normal because of high
mean values or pronounced kurtosis. This problem could be a result of the survey design.
All participants were told to think of a recent smart purchase and three sections of the
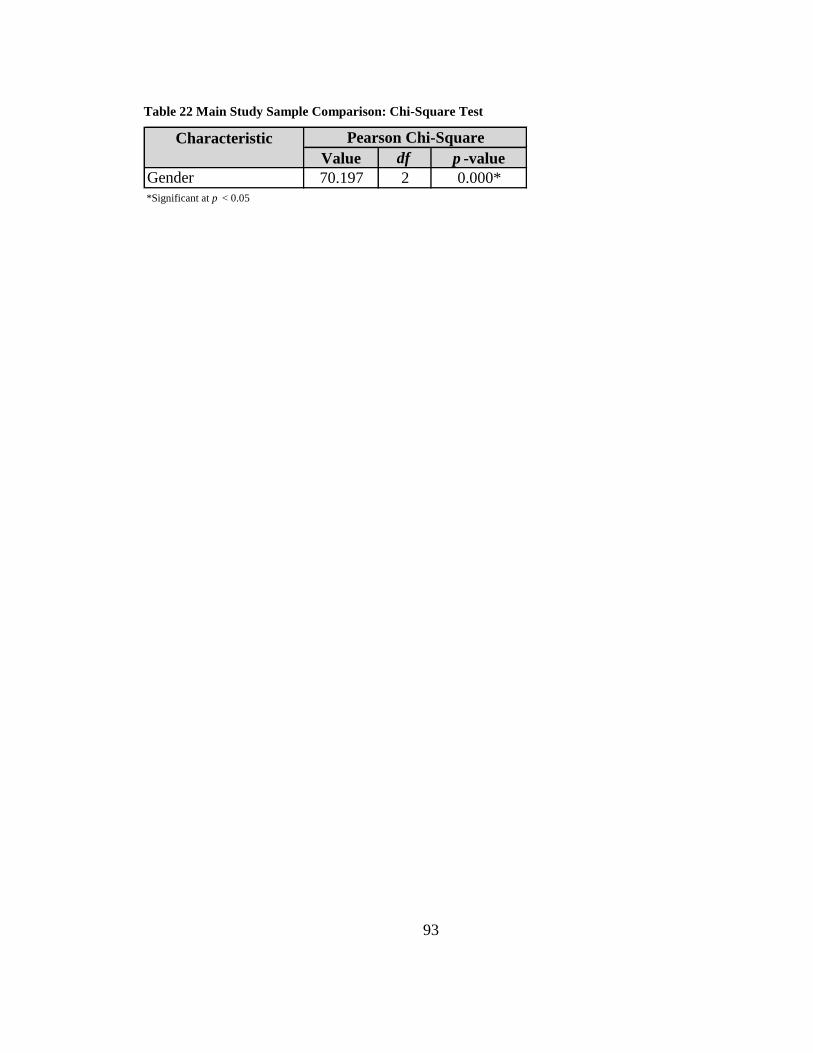
93
Table 22 Main Study Sample Comparison: Chi-Square Test
Value df p -value
Gender 70.197 2 0.000*
*Significant at p < 0.05
Pearson Chi-SquareCharacteristic
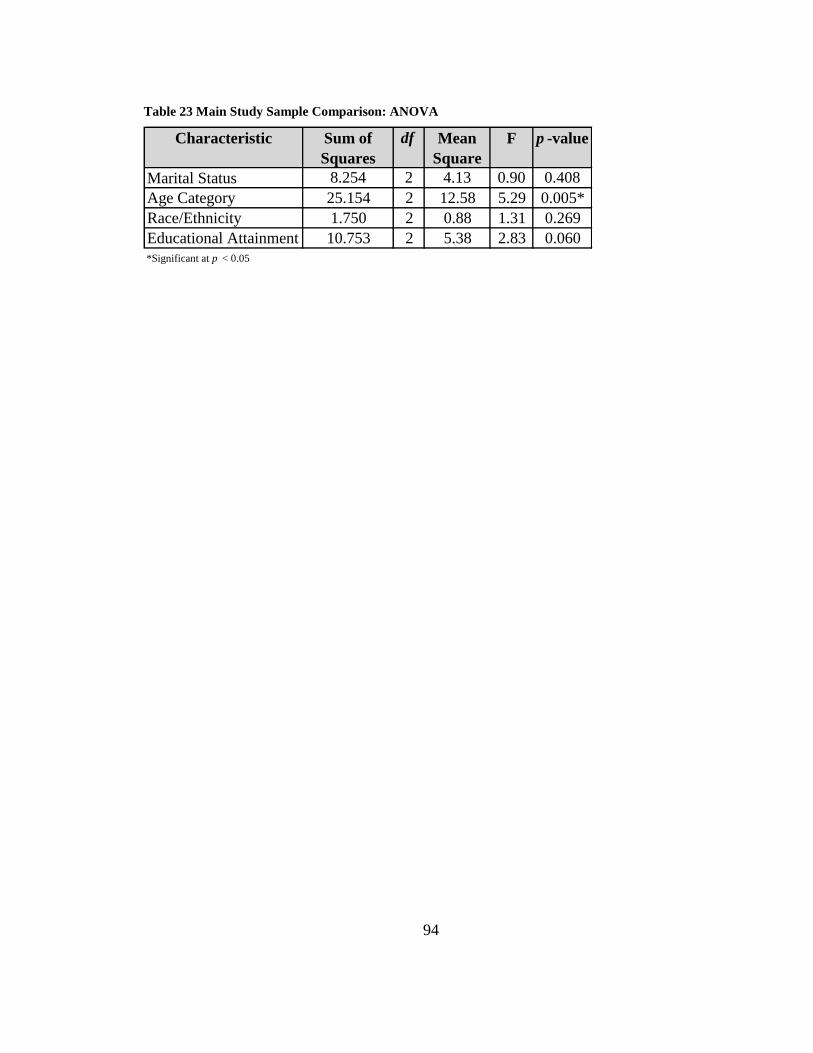
94
Table 23 Main Study Sample Comparison: ANOVA
Characteristic Sum of
Squares
df Mean
Square
F p -value
Marital Status 8.254 2 4.13 0.90 0.408
Age Category 25.154 2 12.58 5.29 0.005*
Race/Ethnicity 1.750 2 0.88 1.31 0.269
Educational Attainment 10.753 2 5.38 2.83 0.060
*Significant at p < 0.05
95
survey refer to the question, “Recall your most recent in-store shopping trip for clothing,
groceries, or electronics when you made what you would consider a smart purchase.” As
a result of the survey design, it is expected that the responses of the sample to the smart
shopping scale items would be higher (i.e., 6 = strongly agree) than the population in
general. The assumption of normality presumes that the samples are drawn from
populations that are normally distributed (Kerlinger & Lee, 2000); however the sample in
this study was not drawn from a normally distributed population.
Scale Validation
Scale validation activities began with the data from the main study (n = 1474).
Scale validation was conducted for a 3-factor model (pre-purchase, purchase, and post-
purchase); that is, the scale for each decision-making stage was tested. Confirmatory
factor analysis (CFA) using AMOS 16.0 was used to identify the overall factor structure
of the shopping items.
CFA was conducted to examine the psychometric properties of each model.
AMOS 16.0 was run allowing all smart shopping constructs (exogenous latent variables)
to correlate with each other and with all smart shopping scale items (endogenous
observed variables) loading on their appropriate construct (latent variable). The
maximum likelihood estimation was used because it is the best estimation procedure for
this theory-based model (Hair et al., 1995).
The magnitude of item error variances, the prevalence of large modification
indices, and significance of residual covariatian indicated potential items for deletion
from the pool of smart shopping items. Results of the three item-analysis techniques
96
along with goodness-of-fit indices (χ2
test, df, χ2
ratio test, CFI, and RMSEA) and
standardized loadings were considered collectively in determining which scale items to
retain in the 3-factor model. These techniques resulted in retention of 56 of 57 items in
the clothing product category, 55 of 57 items in the grocery product category, and 55 of
57 items in the electronics product category. The details of this process will be discussed
in the pre-purchase, purchase, and post-purchase results.
Pre-purchase Results
The original pre-purchase model was a 4-factor structure composed of
information search, comparison shopping, planning for purchases, and planning for sale
purchases (see Figure 4). The data were analyzed separately for the three product
categories (i.e., clothing, grocery, and electronics) in the pre-purchase stage.
Clothing
First, path weights of the scale items were examined for significance. All items in
the pre-purchase model for the clothing product category were found to be significant
(significant at p < 0.05). In reviewing the parameters in the Covariance section of the
AMOS output, the parameters within the same construct representing covariance between
the error terms e1 and e2, e4 and e5, e6 and e7, e8 and e10, e9 and e11, and e12 and e13
were higher than the modification indices (M.I.) cut off value of 10.0 (Hair et al., 1995).
Each of these item pairs with high M.I. was modified with covariance arrows between the
pairs. This reparameterization of the measurement model resulted in acceptable fit as can
be seen in goodness-of-fit statistics for the original pre-purchase model in Table 24. The
covariance between e3 and e14 was higher than the M.I. cut off value of 10.0; therefore,
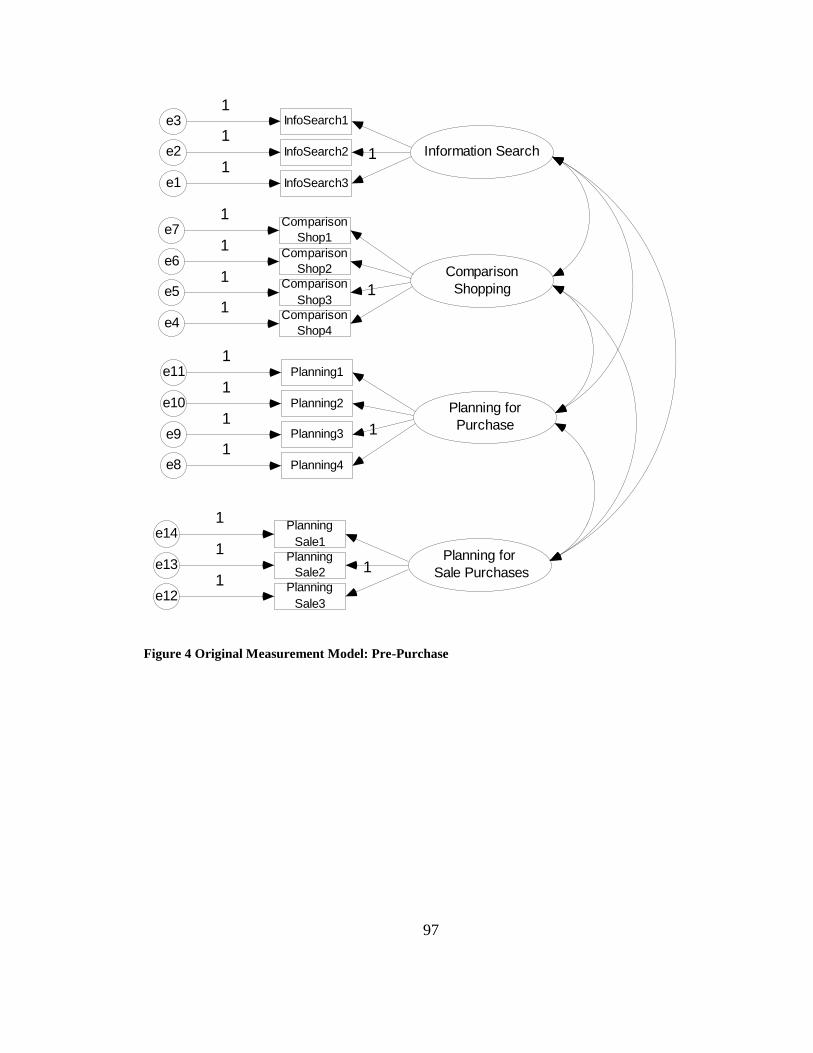
97
Information Search
InfoSearch3e1
11
InfoSearch2e21
InfoSearch1e31
Comparison
Shopping
Comparison
Shop4e4
11
Comparison
Shop3e5
1
Comparison
Shop2e6
1
Comparison
Shop1e7
1
Planning for
Purchase
Planning4e8
1
1Planning3e9
1Planning2e10
1Planning1e11
1
Planning for
Sale PurchasesPlanning
Sale3e12
11
Planning
Sale2e13
1
Planning
Sale1e14
1
Figure 4 Original Measurement Model: Pre-Purchase

98
Table 24 Main Study Goodness-of-Fit Statistics: Pre-Purchase
Clothing Grocery Electronics Clothing Grocery Electronics
CFI 0.902 0.866 0.928 0.917 0.909 0.954
Chi-Square 289.1 572.5 144 239.4 341.6 93.4
Degrees of Freedom 65 68 67 56 41 49
Chi-Square Ratio 4.447 8.419 2.149 4.275 8.333 1.905
RMSEA 0.084 0.099 0.07 0.082 0.099 0.062
Goodness-of-Fit Measures Final Model Fit Original Model Fit
99
PlanningSale1 (I prepared for this purchase by looking through sale advertisements) was
moved to the information search construct.
Next, the correlation between constructs was examined. The correlation between
information search and comparison shopping was 0.851 and the correlation between
planning purchases and planning sale purchases was 0.834 therefore both pairs were
combined to create a 2-factor model. Finally, the standardized loadings were examined
(see Table 25) and the item Planning3 (I knew how much I was willing to spend prior to
making this purchase) was dropped from the pre-purchase clothing model because it
loaded at 0.379. This loading was well below the minimum acceptable factor loading of
0.40 (Hair et al., 1995). The 2-factor model consisted of information search (with 8
items) and planning (with 5 items). The final pre-purchase clothing model consisting of
thirteen observed variables represent acceptable fit: CFI = 0.917; χ2 = 239.4; df = 56;
χ2ratio = 4.275; RMSEA = 0.082 (see Table 23). The final pre-purchase clothing model is
presented in Figure 5.
Reliability of each latent construct was examined by assessing composite
reliability (C.R.) (see Table 26). The C.R. of information search was 0.818 and that of
planning was 0.654. The commonly used threshold value of acceptable reliability is 0.70;
however, values below this threshold are often accepted if the research is exploratory
(Hair et al., 1995) as is the present study.
Grocery
First, path weights of the scale items were examined for significance. All items in
the pre-purchase model for the grocery product category were found to be significant. In
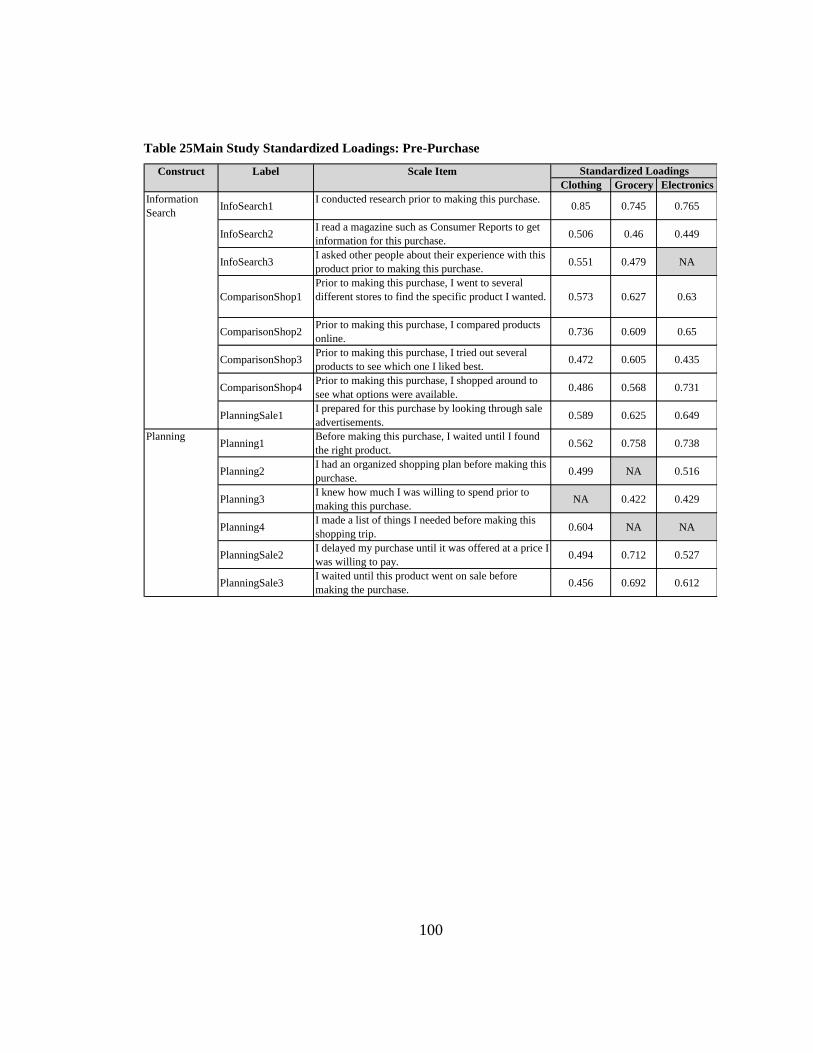
100
Table 25Main Study Standardized Loadings: Pre-Purchase
Clothing Grocery Electronics
InfoSearch1I conducted research prior to making this purchase.
0.85 0.745 0.765
InfoSearch2I read a magazine such as Consumer Reports to get
information for this purchase.0.506 0.46 0.449
InfoSearch3I asked other people about their experience with this
product prior to making this purchase.0.551 0.479 NA
ComparisonShop1
Prior to making this purchase, I went to several
different stores to find the specific product I wanted. 0.573 0.627 0.63
ComparisonShop2Prior to making this purchase, I compared products
online.0.736 0.609 0.65
ComparisonShop3Prior to making this purchase, I tried out several
products to see which one I liked best.0.472 0.605 0.435
ComparisonShop4Prior to making this purchase, I shopped around to
see what options were available.0.486 0.568 0.731
PlanningSale1I prepared for this purchase by looking through sale
advertisements.0.589 0.625 0.649
Planning1Before making this purchase, I waited until I found
the right product.0.562 0.758 0.738
Planning2I had an organized shopping plan before making this
purchase.0.499 NA 0.516
Planning3I knew how much I was willing to spend prior to
making this purchase.NA 0.422 0.429
Planning4I made a list of things I needed before making this
shopping trip.0.604 NA NA
PlanningSale2I delayed my purchase until it was offered at a price I
was willing to pay.0.494 0.712 0.527
PlanningSale3I waited until this product went on sale before
making the purchase.0.456 0.692 0.612
Information
Search
Planning
Standardized LoadingsConstruct Label Scale Item
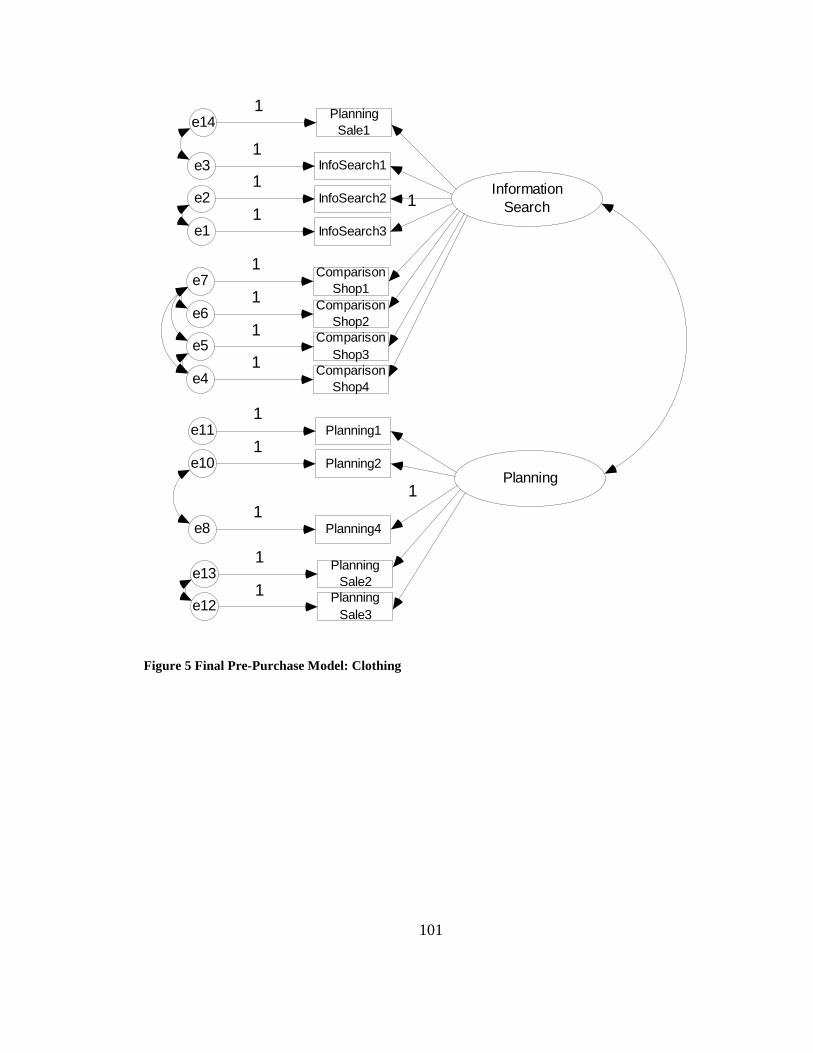
101
Information
Search
InfoSearch3e1
11
InfoSearch2e21
InfoSearch1e31
Comparison
Shop4e4
1
Comparison
Shop3e5
1
Comparison
Shop2e6
1
Comparison
Shop1e7
1
Planning
Planning4e8
1
1
Planning2e101
Planning1e111
Planning
Sale3e12
1
Planning
Sale2e13
1
Planning
Sale1e14
1
Figure 5 Final Pre-Purchase Model: Clothing
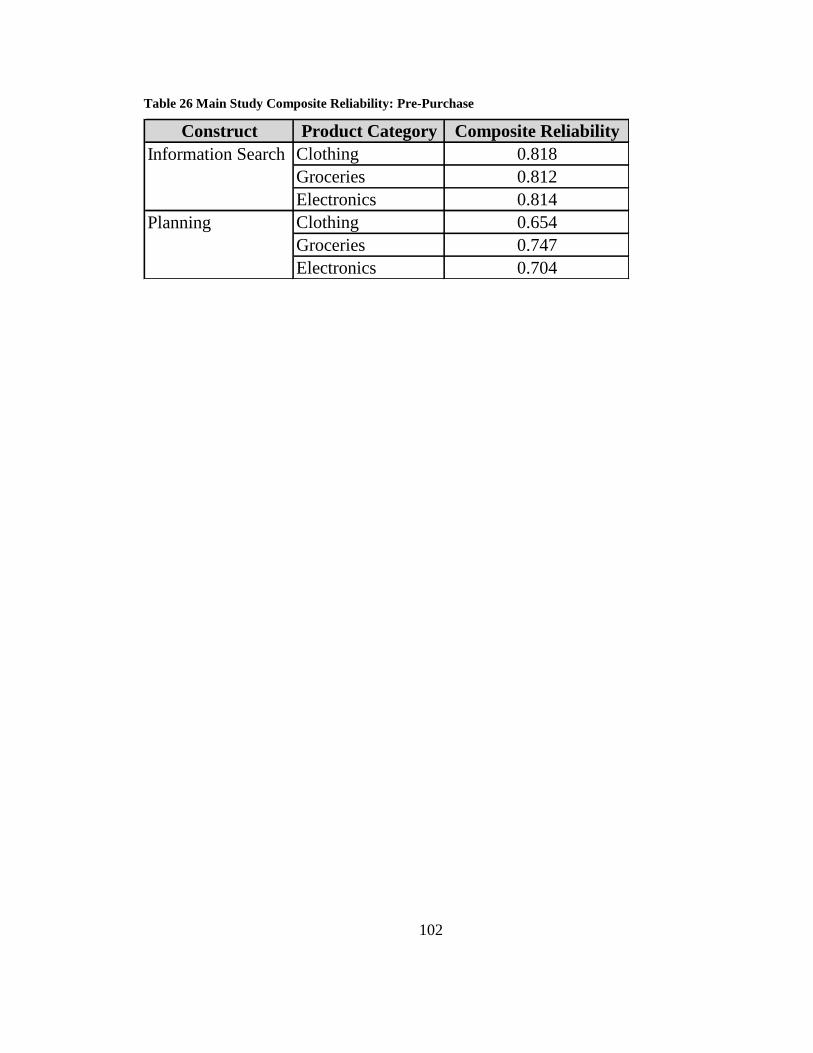
102
Table 26 Main Study Composite Reliability: Pre-Purchase
Construct Product Category Composite Reliability
Clothing 0.818
Groceries 0.812
Electronics 0.814
Clothing 0.654
Groceries 0.747
Electronics 0.704
Information Search
Planning
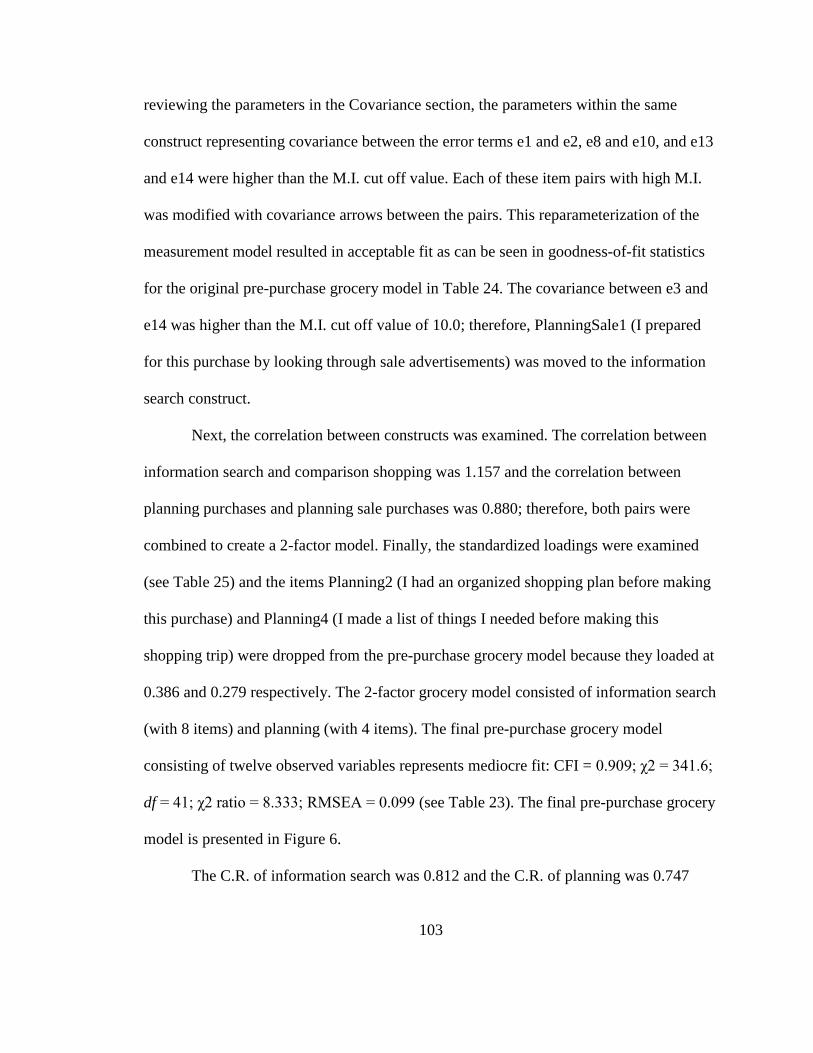
103
reviewing the parameters in the Covariance section, the parameters within the same
construct representing covariance between the error terms e1 and e2, e8 and e10, and e13
and e14 were higher than the M.I. cut off value. Each of these item pairs with high M.I.
was modified with covariance arrows between the pairs. This reparameterization of the
measurement model resulted in acceptable fit as can be seen in goodness-of-fit statistics
for the original pre-purchase grocery model in Table 24. The covariance between e3 and
e14 was higher than the M.I. cut off value of 10.0; therefore, PlanningSale1 (I prepared
for this purchase by looking through sale advertisements) was moved to the information
search construct.
Next, the correlation between constructs was examined. The correlation between
information search and comparison shopping was 1.157 and the correlation between
planning purchases and planning sale purchases was 0.880; therefore, both pairs were
combined to create a 2-factor model. Finally, the standardized loadings were examined
(see Table 25) and the items Planning2 (I had an organized shopping plan before making
this purchase) and Planning4 (I made a list of things I needed before making this
shopping trip) were dropped from the pre-purchase grocery model because they loaded at
0.386 and 0.279 respectively. The 2-factor grocery model consisted of information search
(with 8 items) and planning (with 4 items). The final pre-purchase grocery model
consisting of twelve observed variables represents mediocre fit: CFI = 0.909; χ2 = 341.6;
df = 41; χ2 ratio = 8.333; RMSEA = 0.099 (see Table 23). The final pre-purchase grocery
model is presented in Figure 6.
The C.R. of information search was 0.812 and the C.R. of planning was 0.747
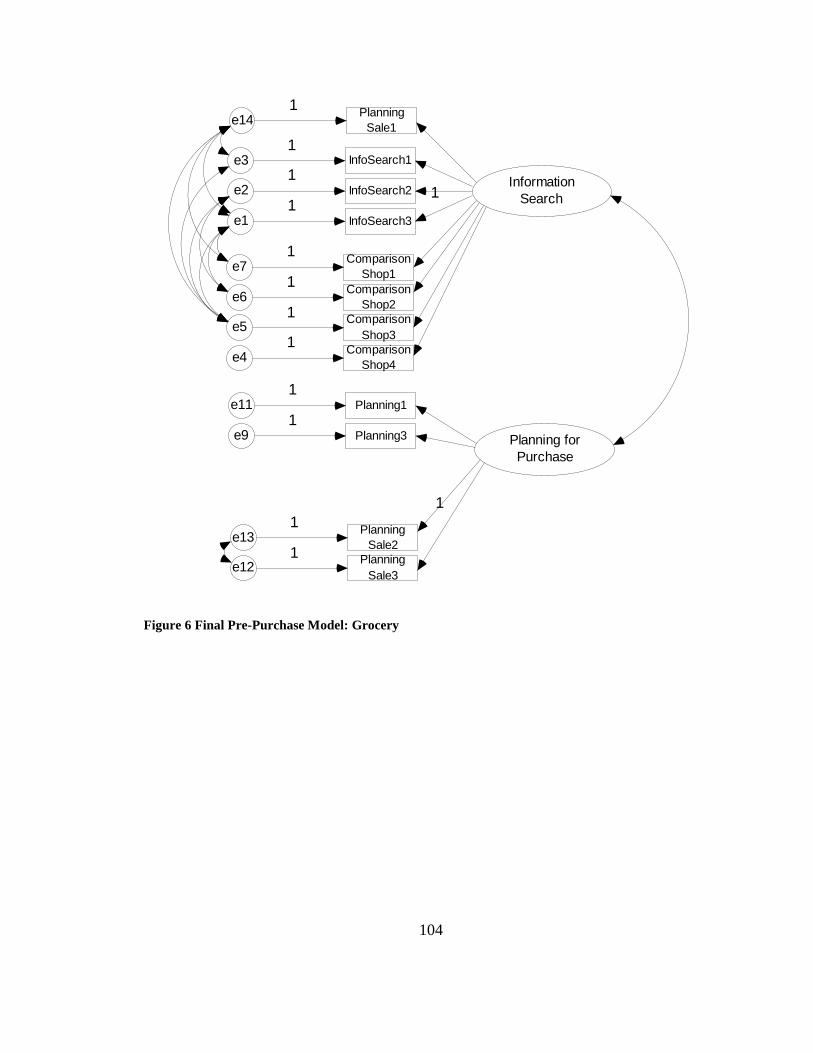
104
Information
Search
InfoSearch3e1
11
InfoSearch2e21
InfoSearch1e31
Comparison
Shop4e4
1
Comparison
Shop3e5
1
Comparison
Shop2e6
1
Comparison
Shop1e7
1
Planning for
Purchase
Planning3e91
Planning1e111
Planning
Sale3e12
1
Planning
Sale2e13
1
Planning
Sale1e14
1
1
Figure 6 Final Pre-Purchase Model: Grocery
105
(see Table 26). The C.R. of both pre-purchase grocery constructs was greater than the
minimum criteria of 0.70 indicating internal consistency of the construct indicators.
Electronics
First, path weights of the scale items were examined for significance. All items in
the pre-purchase model for the electronics product category were found to be significant.
In reviewing the parameters in the Covariance section, the parameters within the same
construct representing covariance between the error terms e1 and e2, e5 and e7, e8 and
e10, and e12 and e13 were higher than the M.I. cut off value. Each of these item pairs
with high M.I. was modified with covariance arrows between the pairs. This
reparameterization of the measurement model resulted in acceptable fit as can be seen in
goodness-of-fit statistics for the original pre-purchase electronics model in Table 24. The
covariance between e3 and e14 was higher than the M.I. cut off value of 10.0; therefore,
PlanSale1 (I prepared for this purchase by looking through sale advertisements) was
moved to the information search construct.
Next, the correlation between constructs was examined. The correlation between
information search and comparison shopping was 0.880 and the correlation between
planning purchases and planning sale purchases was 0.836; therefore, both pairs were
combined to create a 2-factor model. Finally, the standardized loadings were examined
(see Table 25) and the items InfoSearch 3 (I asked other people about their experience
with this product prior to making this purchase) and Planning4 (I made a list of things I
needed before making this shopping trip) were dropped from the pre-purchase electronics
model because they loaded below the minimum factor loading. The 2-factor electronics
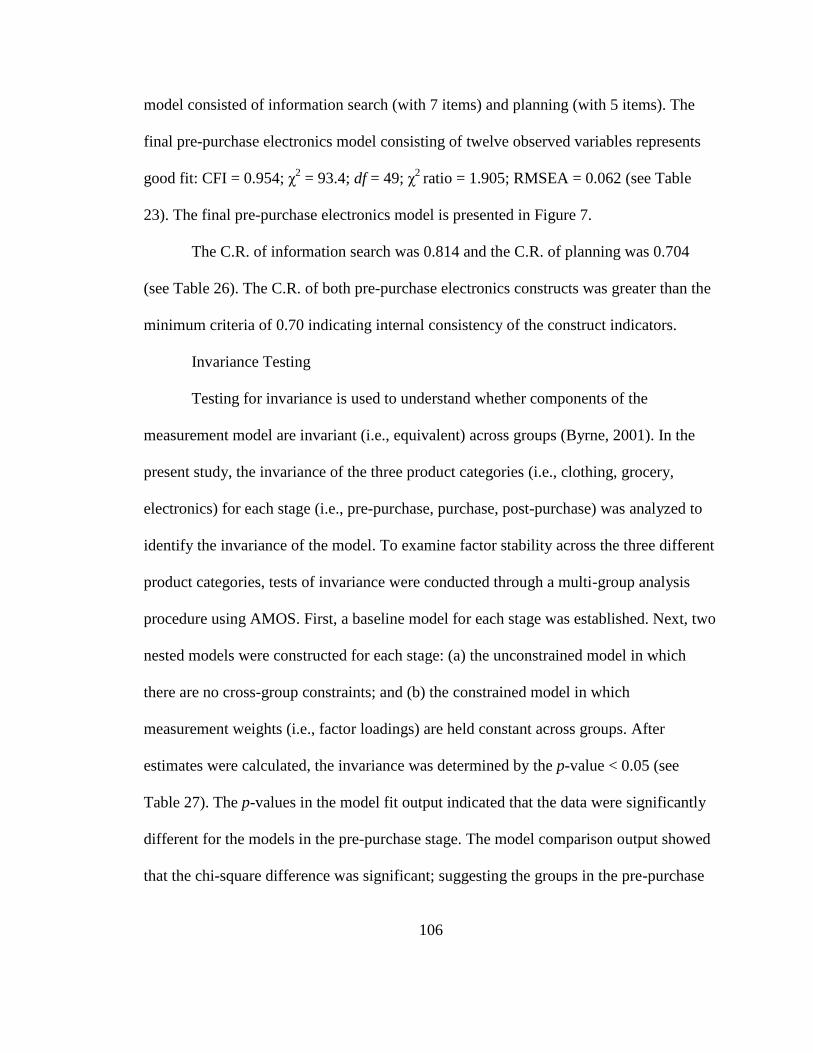
106
model consisted of information search (with 7 items) and planning (with 5 items). The
final pre-purchase electronics model consisting of twelve observed variables represents
good fit: CFI = 0.954; χ2 = 93.4; df = 49; χ
2 ratio = 1.905; RMSEA = 0.062 (see Table
23). The final pre-purchase electronics model is presented in Figure 7.
The C.R. of information search was 0.814 and the C.R. of planning was 0.704
(see Table 26). The C.R. of both pre-purchase electronics constructs was greater than the
minimum criteria of 0.70 indicating internal consistency of the construct indicators.
Invariance Testing
Testing for invariance is used to understand whether components of the
measurement model are invariant (i.e., equivalent) across groups (Byrne, 2001). In the
present study, the invariance of the three product categories (i.e., clothing, grocery,
electronics) for each stage (i.e., pre-purchase, purchase, post-purchase) was analyzed to
identify the invariance of the model. To examine factor stability across the three different
product categories, tests of invariance were conducted through a multi-group analysis
procedure using AMOS. First, a baseline model for each stage was established. Next, two
nested models were constructed for each stage: (a) the unconstrained model in which
there are no cross-group constraints; and (b) the constrained model in which
measurement weights (i.e., factor loadings) are held constant across groups. After
estimates were calculated, the invariance was determined by the p-value < 0.05 (see
Table 27). The p-values in the model fit output indicated that the data were significantly
different for the models in the pre-purchase stage. The model comparison output showed
that the chi-square difference was significant; suggesting the groups in the pre-purchase
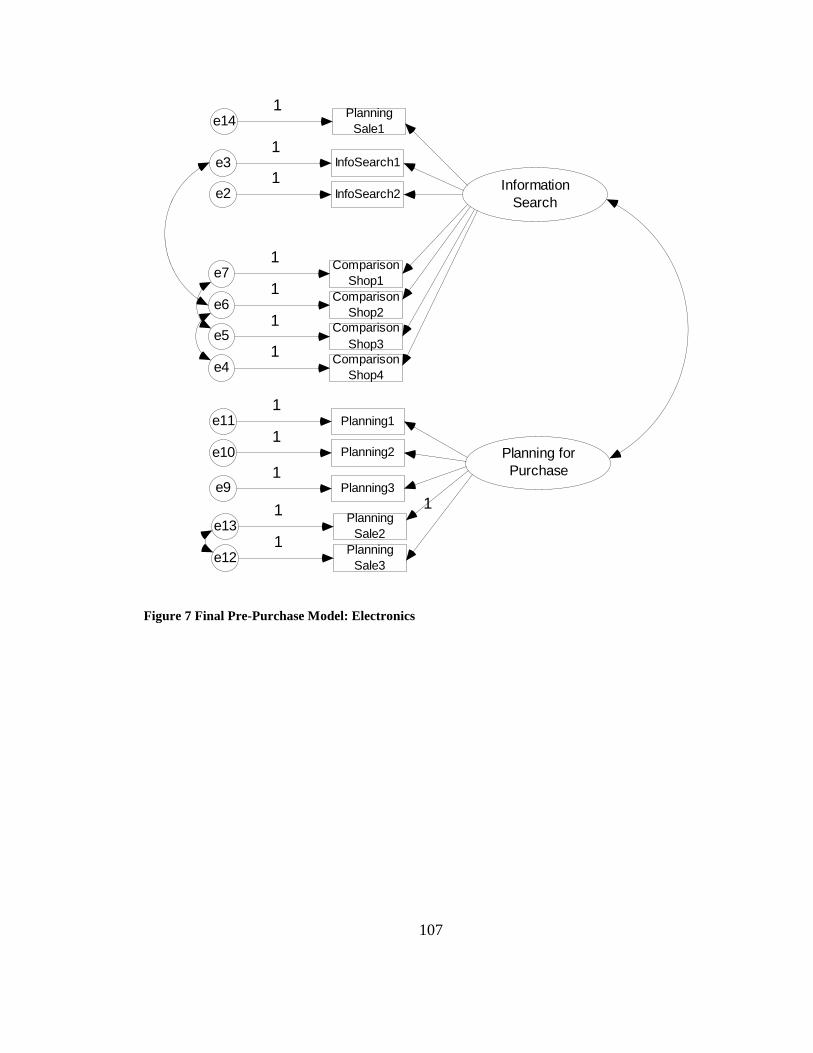
107
Information
SearchInfoSearch2e2
1InfoSearch1e3
1
Comparison
Shop4e4
1
Comparison
Shop3e5
1
Comparison
Shop2e6
1
Comparison
Shop1e7
1
Planning for
Purchase
Planning2e101
Planning1e111
Planning
Sale3e12
1
Planning
Sale2e13
1
Planning
Sale1e14
1
1Planning3e9
1
Figure 7 Final Pre-Purchase Model: Electronics
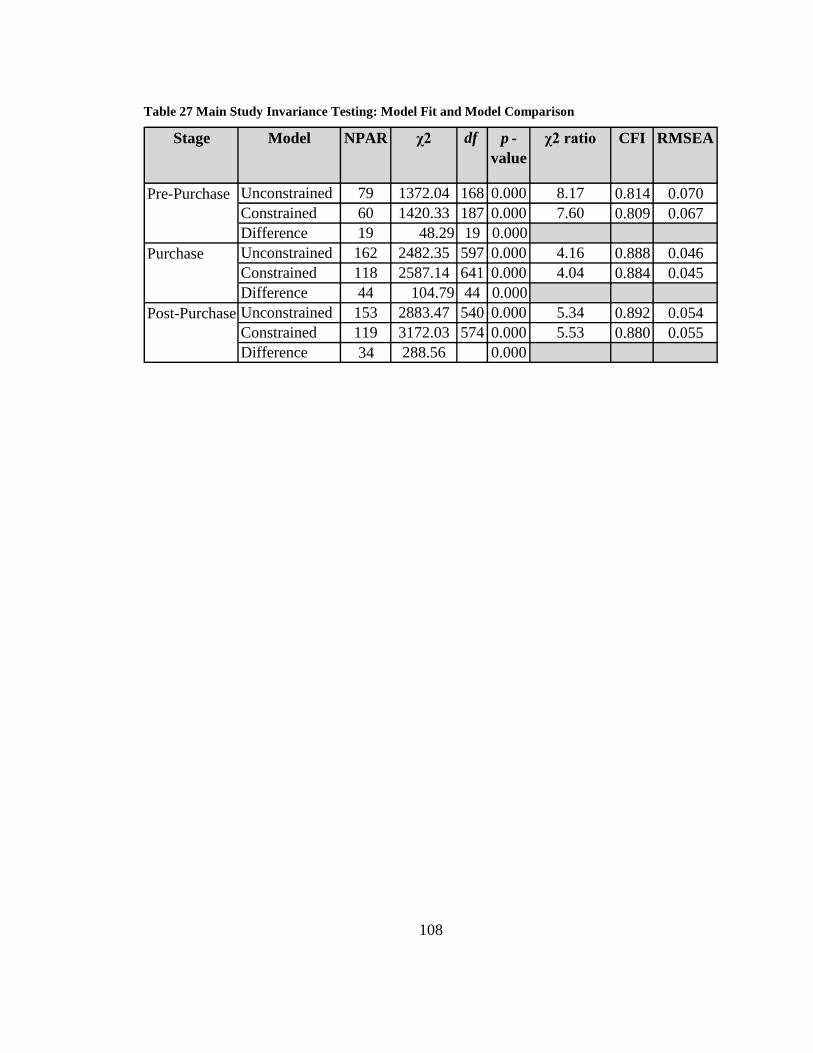
108
Table 27 Main Study Invariance Testing: Model Fit and Model Comparison
Stage Model NPAR χ2 df p -
value
χ2 ratio CFI RMSEA
Unconstrained 79 1372.04 168 0.000 8.17 0.814 0.070
Constrained 60 1420.33 187 0.000 7.60 0.809 0.067
Difference 19 48.29 19 0.000
Unconstrained 162 2482.35 597 0.000 4.16 0.888 0.046
Constrained 118 2587.14 641 0.000 4.04 0.884 0.045
Difference 44 104.79 44 0.000
Unconstrained 153 2883.47 540 0.000 5.34 0.892 0.054
Constrained 119 3172.03 574 0.000 5.53 0.880 0.055
Difference 34 288.56 0.000
Pre-Purchase
Purchase
Post-Purchase
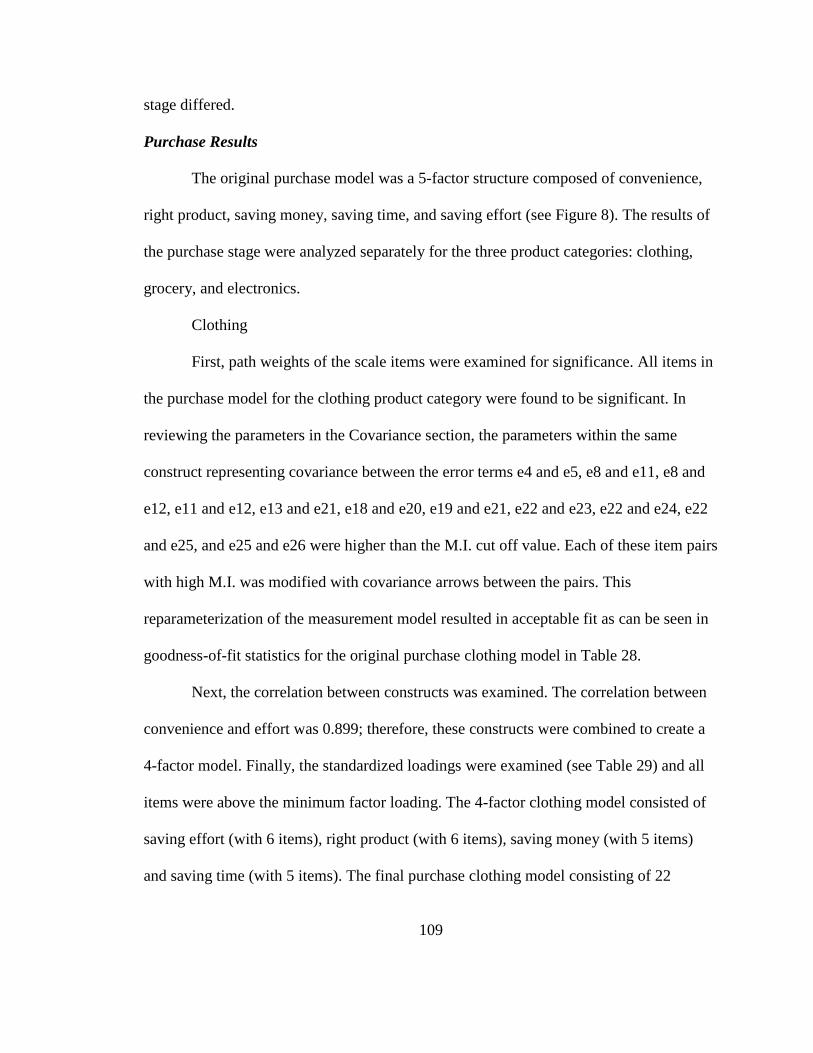
109
stage differed.
Purchase Results
The original purchase model was a 5-factor structure composed of convenience,
right product, saving money, saving time, and saving effort (see Figure 8). The results of
the purchase stage were analyzed separately for the three product categories: clothing,
grocery, and electronics.
Clothing
First, path weights of the scale items were examined for significance. All items in
the purchase model for the clothing product category were found to be significant. In
reviewing the parameters in the Covariance section, the parameters within the same
construct representing covariance between the error terms e4 and e5, e8 and e11, e8 and
e12, e11 and e12, e13 and e21, e18 and e20, e19 and e21, e22 and e23, e22 and e24, e22
and e25, and e25 and e26 were higher than the M.I. cut off value. Each of these item pairs
with high M.I. was modified with covariance arrows between the pairs. This
reparameterization of the measurement model resulted in acceptable fit as can be seen in
goodness-of-fit statistics for the original purchase clothing model in Table 28.
Next, the correlation between constructs was examined. The correlation between
convenience and effort was 0.899; therefore, these constructs were combined to create a
4-factor model. Finally, the standardized loadings were examined (see Table 29) and all
items were above the minimum factor loading. The 4-factor clothing model consisted of
saving effort (with 6 items), right product (with 6 items), saving money (with 5 items)
and saving time (with 5 items). The final purchase clothing model consisting of 22
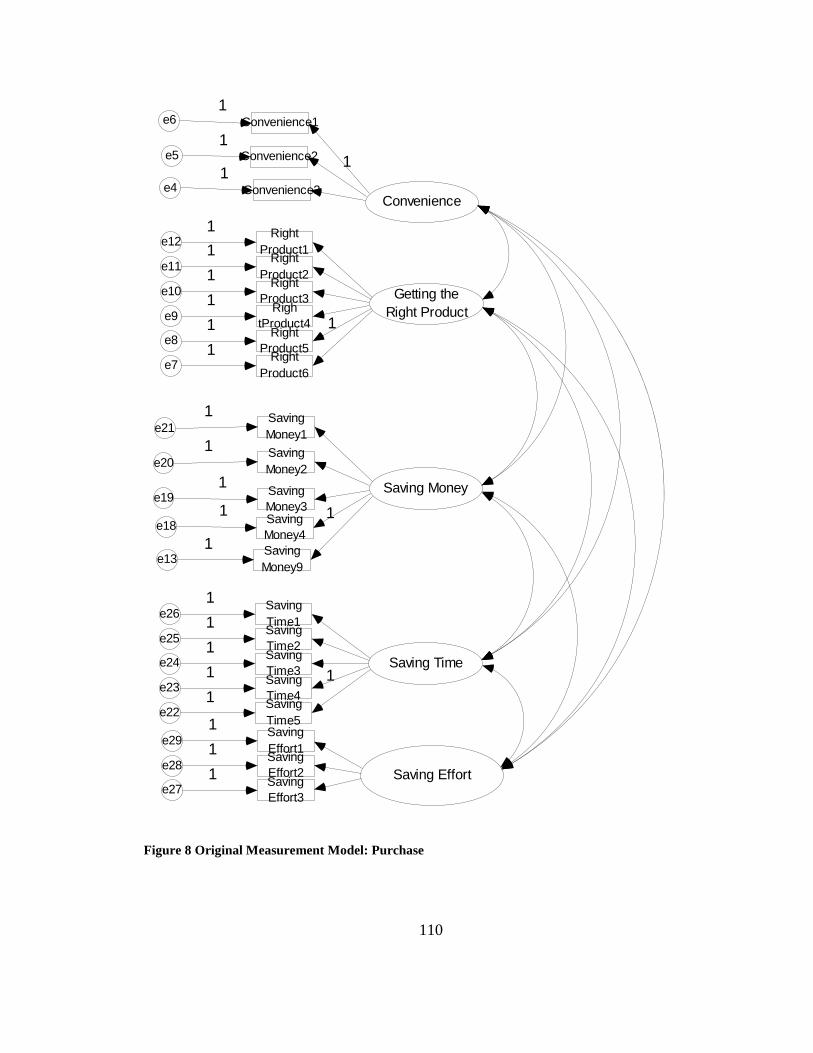
110
Convenience
Convenience2e51
1
Convenience1e61
Getting the
Right Product
Right
Product6e7
1
1Right
Product5e8
1Righ
tProduct4e9
1Right
Product3e10
1Right
Product2e11
1Right
Product1e12
1
Saving Money
Saving
Money9e13
1
1
Saving
Money4e18
1
Saving
Money3e19
1
Saving
Money2e20
1
Saving
Money1e21
1
Saving Time
Saving
Time5e22
1
1Saving
Time4e23
1Saving
Time3e24
1Saving
Time2e25
1Saving
Time1e26
1
Saving
Effort3e27
1Saving
Effort2e28
1Saving
Effort1e29
1
Convenience3e41
Saving Effort
Figure 8 Original Measurement Model: Purchase
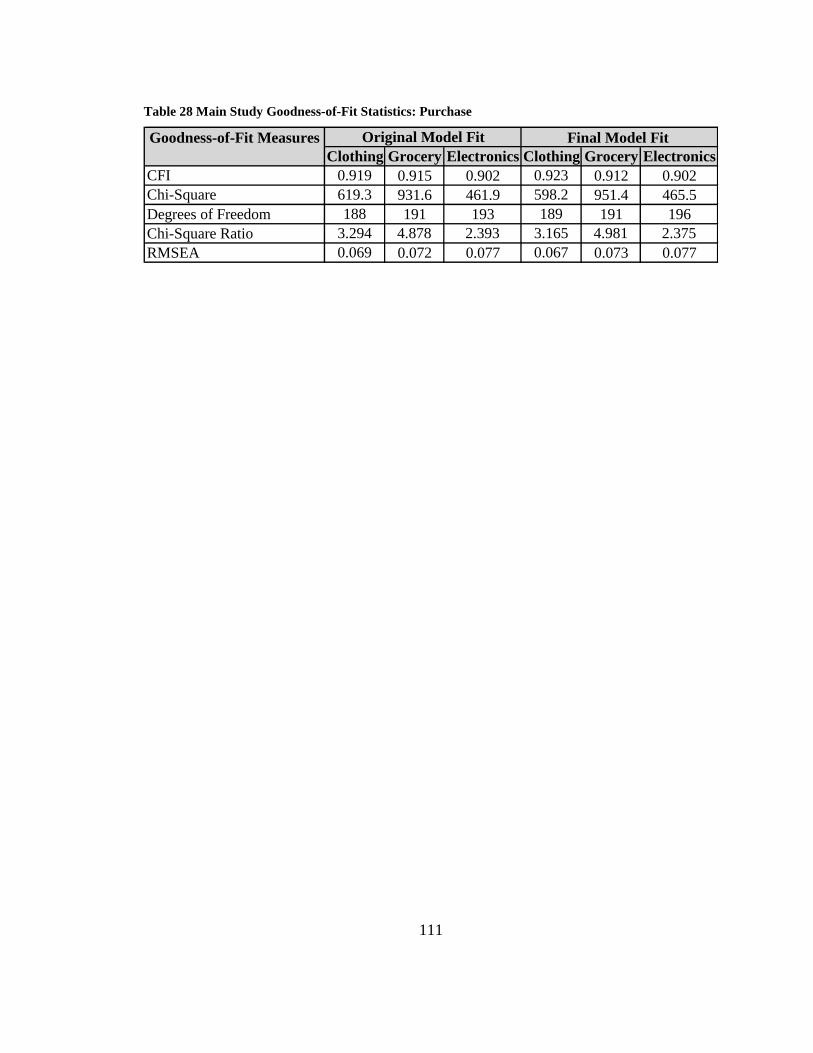
111
Table 28 Main Study Goodness-of-Fit Statistics: Purchase
Clothing Grocery Electronics Clothing Grocery Electronics
CFI 0.919 0.915 0.902 0.923 0.912 0.902
Chi-Square 619.3 931.6 461.9 598.2 951.4 465.5
Degrees of Freedom 188 191 193 189 191 196
Chi-Square Ratio 3.294 4.878 2.393 3.165 4.981 2.375
RMSEA 0.069 0.072 0.077 0.067 0.073 0.077
Goodness-of-Fit Measures Original Model Fit Final Model Fit
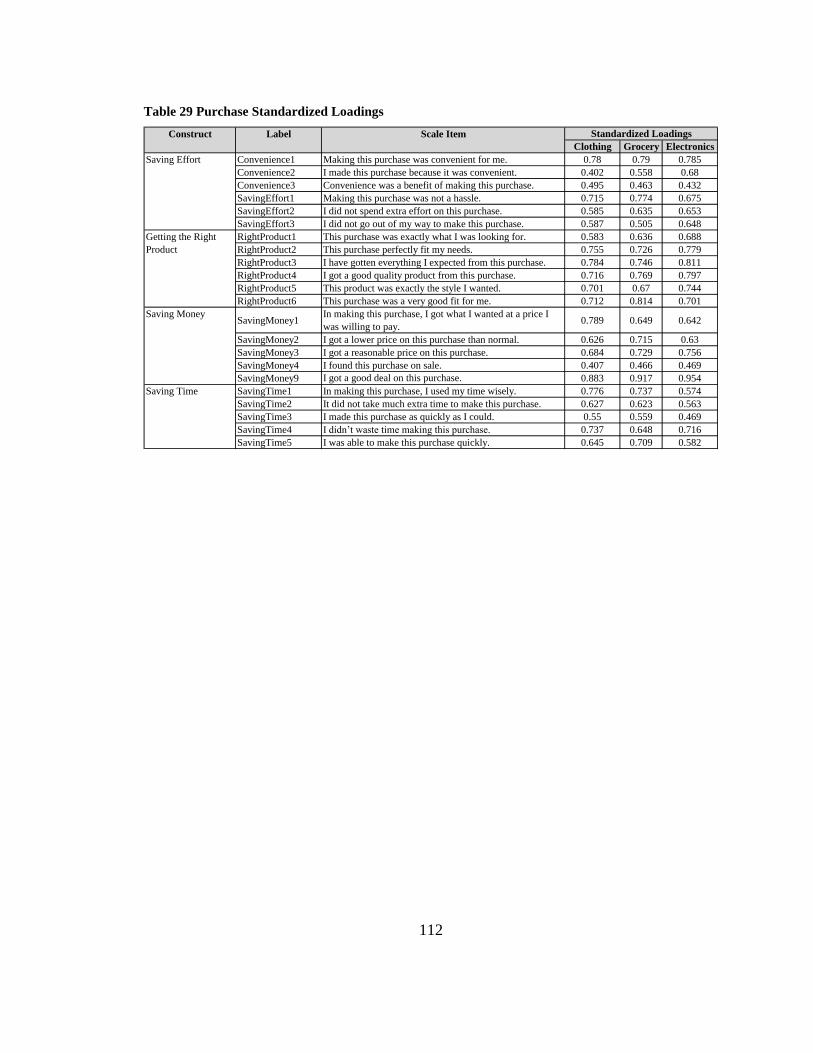
112
Table 29 Purchase Standardized Loadings
Clothing Grocery Electronics
Convenience1 Making this purchase was convenient for me. 0.78 0.79 0.785
Convenience2 I made this purchase because it was convenient. 0.402 0.558 0.68
Convenience3 Convenience was a benefit of making this purchase. 0.495 0.463 0.432
SavingEffort1 Making this purchase was not a hassle. 0.715 0.774 0.675
SavingEffort2 I did not spend extra effort on this purchase. 0.585 0.635 0.653
SavingEffort3 I did not go out of my way to make this purchase. 0.587 0.505 0.648
RightProduct1 This purchase was exactly what I was looking for. 0.583 0.636 0.688
RightProduct2 This purchase perfectly fit my needs. 0.755 0.726 0.779
RightProduct3 I have gotten everything I expected from this purchase. 0.784 0.746 0.811
RightProduct4 I got a good quality product from this purchase. 0.716 0.769 0.797
RightProduct5 This product was exactly the style I wanted. 0.701 0.67 0.744
RightProduct6 This purchase was a very good fit for me. 0.712 0.814 0.701
SavingMoney1In making this purchase, I got what I wanted at a price I
was willing to pay.0.789 0.649 0.642
SavingMoney2 I got a lower price on this purchase than normal. 0.626 0.715 0.63
SavingMoney3 I got a reasonable price on this purchase. 0.684 0.729 0.756
SavingMoney4 I found this purchase on sale. 0.407 0.466 0.469
SavingMoney9 I got a good deal on this purchase. 0.883 0.917 0.954
SavingTime1 In making this purchase, I used my time wisely. 0.776 0.737 0.574
SavingTime2 It did not take much extra time to make this purchase. 0.627 0.623 0.563
SavingTime3 I made this purchase as quickly as I could. 0.55 0.559 0.469
SavingTime4 I didn‟t waste time making this purchase. 0.737 0.648 0.716
SavingTime5 I was able to make this purchase quickly. 0.645 0.709 0.582
Saving Effort
Getting the Right
Product
Saving Money
Standardized LoadingsLabel Scale Item
Saving Time
Construct
113
observed variables represents good fit: CFI = 0.923; χ2 = 598.2; df = 189; χ
2 ratio =
3.165; RMSEA = 0.067 (see Table 28). The final purchase clothing model is presented in
Figure 9.
The C.R. values were 0.770 for saving effort, 0.859 for right product, 0.817 for
saving money, and 0.802 for saving time (see Table 30). The C.R. of all purchase
clothing constructs was greater than the minimum criteria of 0.70 indicating internal
consistency of the construct indicators.
Grocery
First, path weights of the scale items were examined for significance. All items in
the purchase model for the grocery product category were found to be significant. In
reviewing the parameters in the Covariance section, the parameters within the same
construct representing covariance between the error terms e4 and e5, e8 and e11, e8 and
e12, e11 and e12, e18 and e20, e19 and e21, e22 and e24, e22 and e25, and e27 and e28
were higher than the M.I. cut off value. Each of these item pairs with high M.I. was
modified with covariance arrows between the pairs. This reparameterization of the
measurement model resulted in acceptable fit as can be seen in goodness-of-fit statistics
for the original purchase grocery model in Table 28.
Next, the correlation between constructs was examined. The correlation between
convenience and effort was 0.948; therefore, these constructs were combined to create a
four factor model. Finally, the standardized loadings were examined (see Table 29) and
all items were above the minimum factor loading of 0.40. The 4-factor grocery model
consisted of saving effort (with 6 items), right product (with 6 items), saving money (with
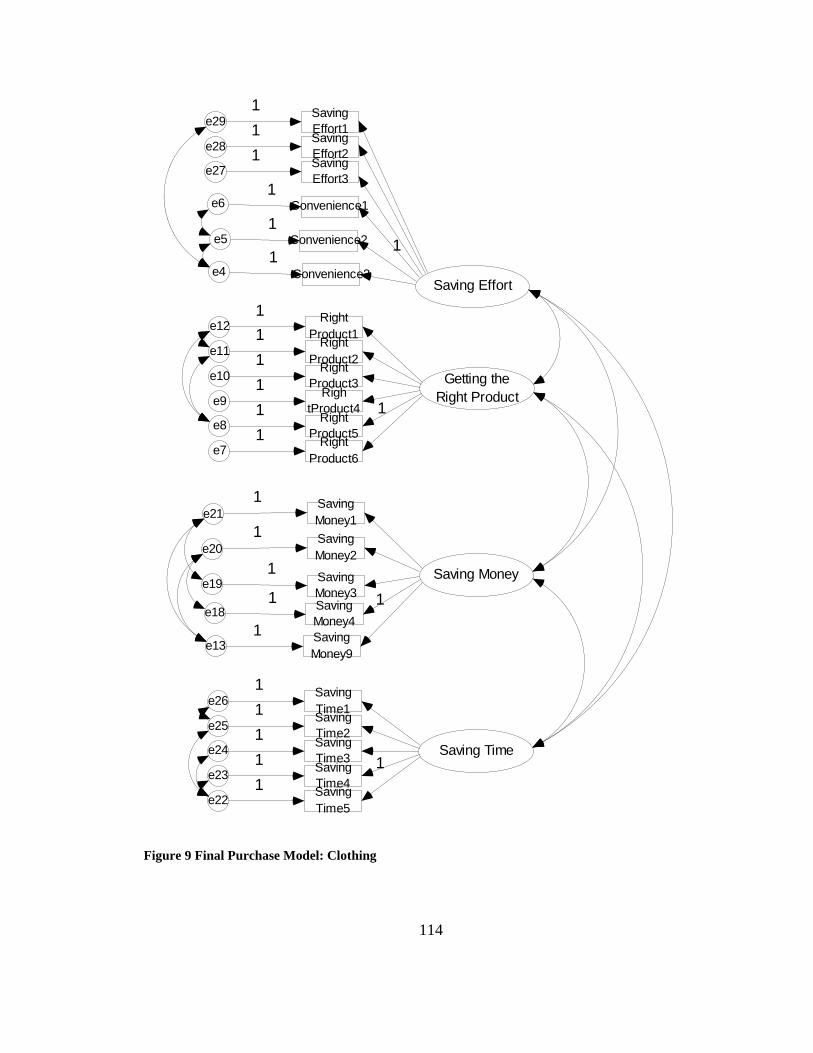
114
Saving Effort
Convenience2e51
1
Convenience1e61
Getting the
Right Product
Right
Product6e7
1
1Right
Product5e8
1Righ
tProduct4e9
1Right
Product3e10
1Right
Product2e11
1Right
Product1e12
1
Saving Money
Saving
Money9e13
1
1
Saving
Money4e18
1
Saving
Money3e19
1
Saving
Money2e20
1
Saving
Money1e21
1
Saving Time
Saving
Time5e22
1
1Saving
Time4e23
1Saving
Time3e24
1Saving
Time2e25
1Saving
Time1e26
1
Saving
Effort3e27
1Saving
Effort2e28
1Saving
Effort1e29
1
Convenience3e41
Figure 9 Final Purchase Model: Clothing
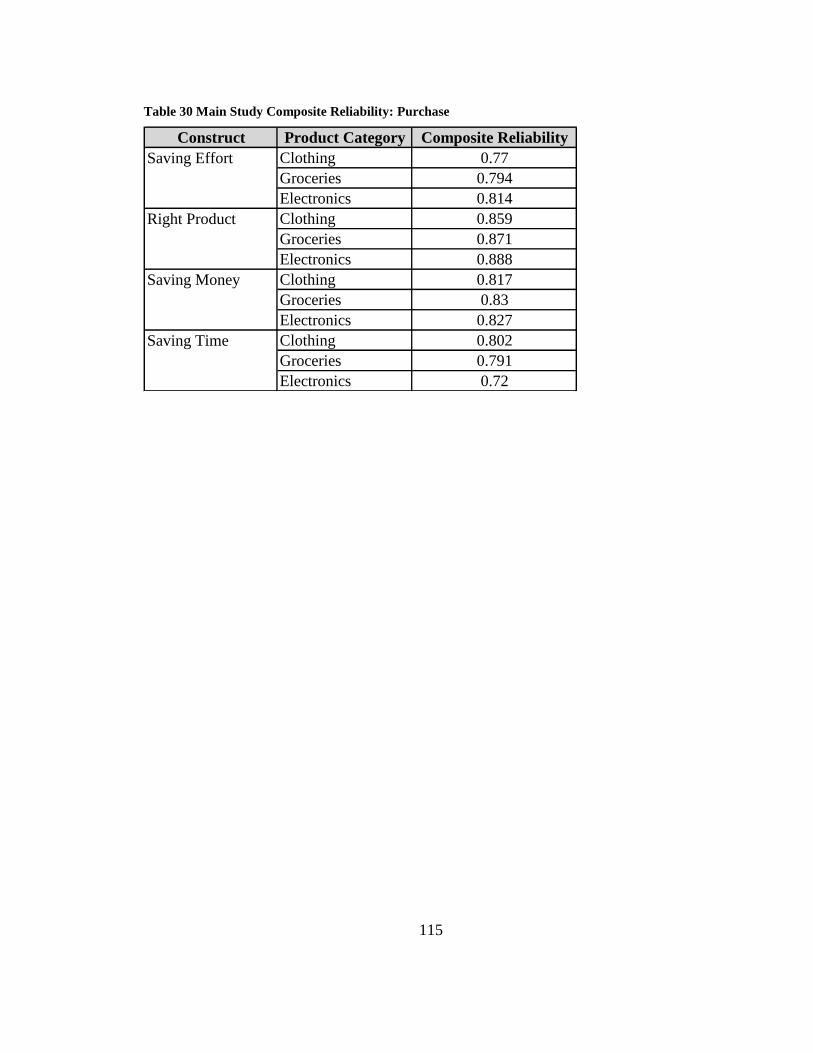
115
Table 30 Main Study Composite Reliability: Purchase
Construct Product Category Composite Reliability
Clothing 0.77
Groceries 0.794
Electronics 0.814
Clothing 0.859
Groceries 0.871
Electronics 0.888
Clothing 0.817
Groceries 0.83
Electronics 0.827
Clothing 0.802
Groceries 0.791
Electronics 0.72
Saving Effort
Right Product
Saving Money
Saving Time
116
5 items) and saving time (with 5 items). The final purchase grocery model consisting of
22 observed variables represents good fit: CFI = 0.912; χ2 = 951.4; df = 191; χ2 ratio =
4.981; RMSEA = 0.073 (see Table 28). The final purchase grocery model is presented in
Figure 10.
The C.R. of the constructs were: saving effort = 0.794; right product = 0.871;
saving money = 0.830; and saving time = 0.791 (see Table 30). The C.R. of all purchase
grocery constructs was greater than the minimum criteria of 0.70 indicating internal
consistency of the construct indicators.
Electronics
First, path weights of the scale items were examined for significance. All items in
the purchase model for the electronics product category were found to be significant. In
reviewing the parameters in the Covariance section, the parameters within the same
construct representing covariance between the error terms e8 and e11, e18 and e20, e19
and e20, e19 and e21, e22 and e24, e23 and e24 were higher than the M.I. cut off value.
Each of these item pairs with high M.I. was modified with covariance arrows between the
pairs. This reparameterization of the measurement model produced acceptable fit as
observed in goodness-of-fit statistics for the original purchase electronics model in Table
28.
Next, the correlation between constructs was examined. The correlation between
convenience and effort was 0.883; therefore, these constructs were combined to create a
4-factor model. Finally, the standardized loadings were examined (see Table 29) and all
items were above the minimum factor loading of 0.40. The 4-factor grocery model
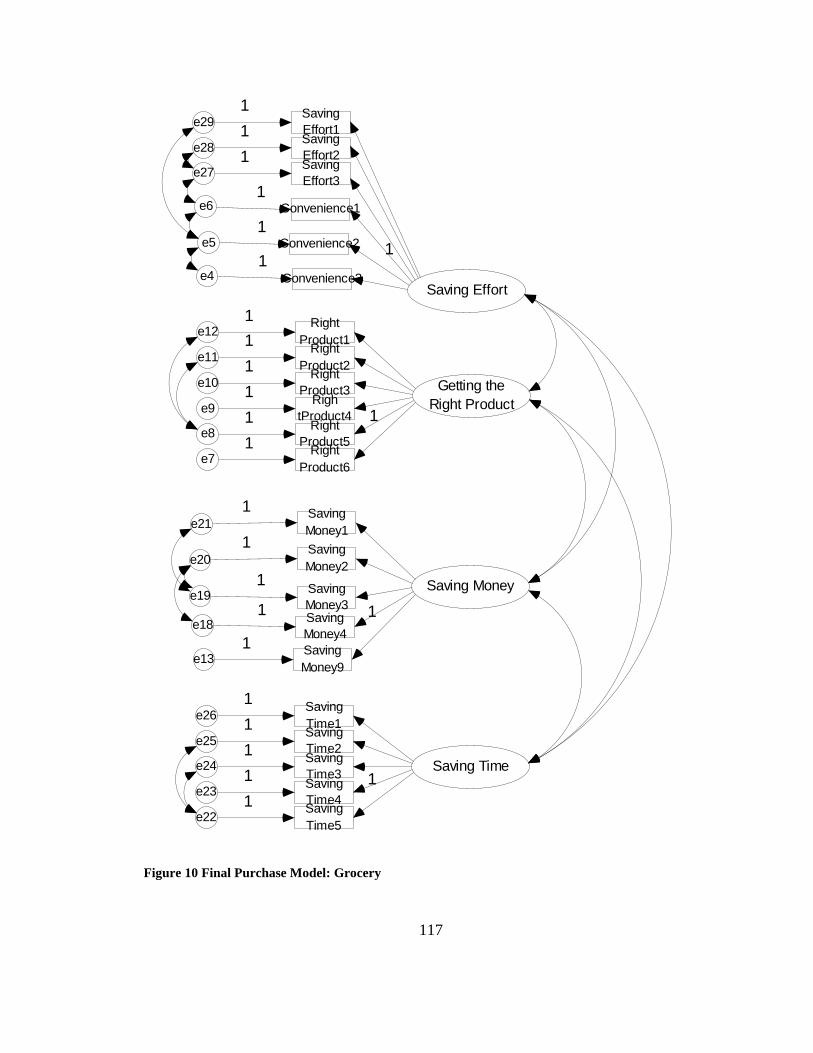
117
Saving Effort
Convenience2e51
1
Convenience1e61
Getting the
Right Product
Right
Product6e7
1
1Right
Product5e8
1Righ
tProduct4e9
1Right
Product3e10
1Right
Product2e11
1Right
Product1e12
1
Saving Money
Saving
Money9e13
1
1
Saving
Money4e18
1
Saving
Money3e19
1
Saving
Money2e20
1
Saving
Money1e21
1
Saving Time
Saving
Time5e22
1
1Saving
Time4e23
1Saving
Time3e24
1Saving
Time2e25
1Saving
Time1e26
1
Saving
Effort3e27
1Saving
Effort2e28
1Saving
Effort1e29
1
Convenience3e41
Figure 10 Final Purchase Model: Grocery
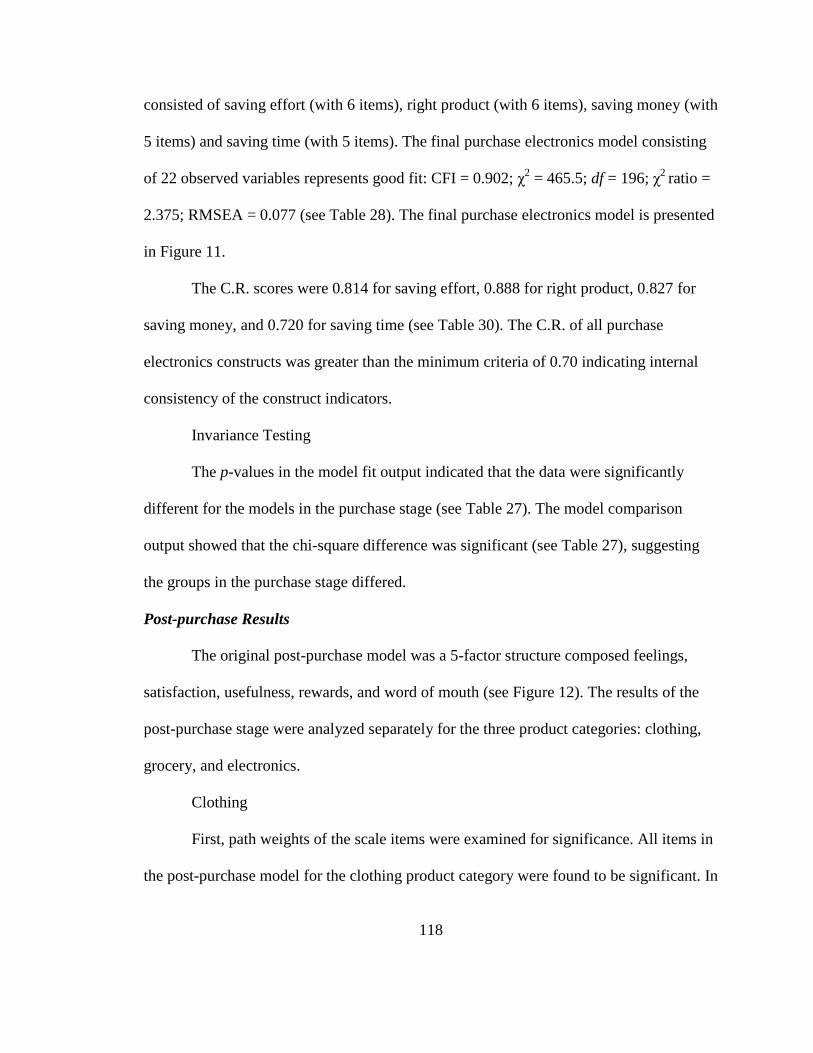
118
consisted of saving effort (with 6 items), right product (with 6 items), saving money (with
5 items) and saving time (with 5 items). The final purchase electronics model consisting
of 22 observed variables represents good fit: CFI = 0.902; χ2 = 465.5; df = 196; χ
2 ratio =
2.375; RMSEA = 0.077 (see Table 28). The final purchase electronics model is presented
in Figure 11.
The C.R. scores were 0.814 for saving effort, 0.888 for right product, 0.827 for
saving money, and 0.720 for saving time (see Table 30). The C.R. of all purchase
electronics constructs was greater than the minimum criteria of 0.70 indicating internal
consistency of the construct indicators.
Invariance Testing
The p-values in the model fit output indicated that the data were significantly
different for the models in the purchase stage (see Table 27). The model comparison
output showed that the chi-square difference was significant (see Table 27), suggesting
the groups in the purchase stage differed.
Post-purchase Results
The original post-purchase model was a 5-factor structure composed feelings,
satisfaction, usefulness, rewards, and word of mouth (see Figure 12). The results of the
post-purchase stage were analyzed separately for the three product categories: clothing,
grocery, and electronics.
Clothing
First, path weights of the scale items were examined for significance. All items in
the post-purchase model for the clothing product category were found to be significant. In
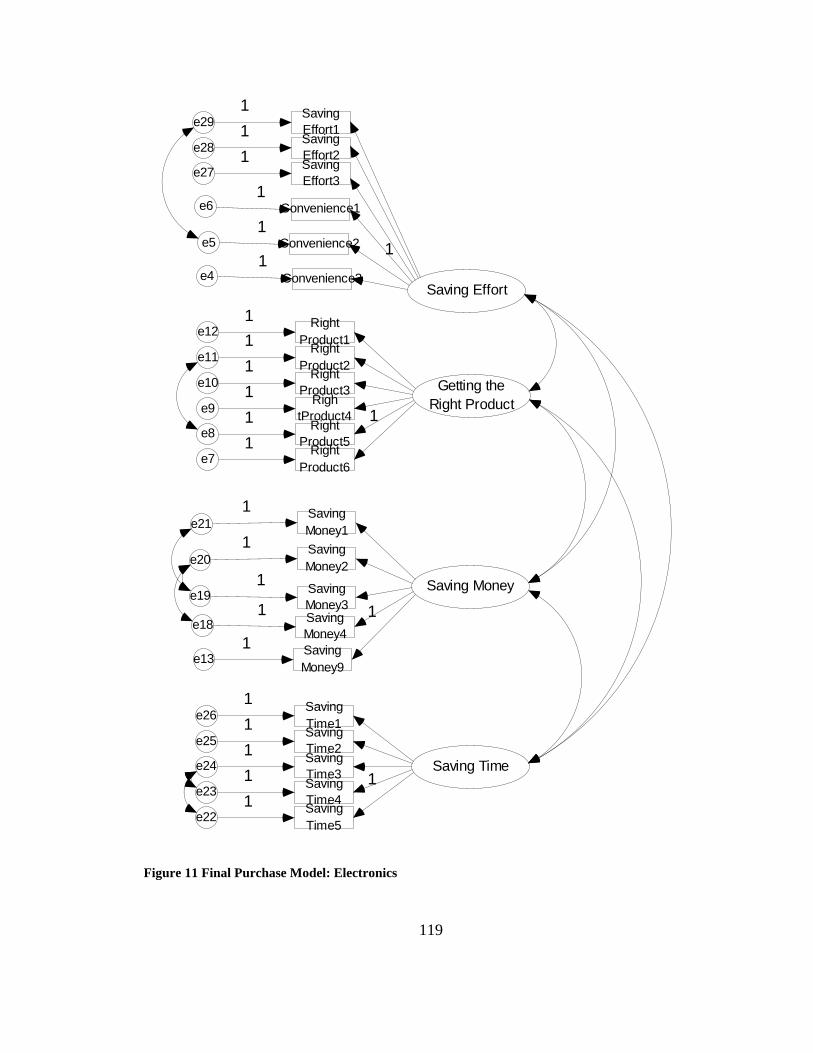
119
Saving Effort
Convenience2e51
1
Convenience1e61
Getting the
Right Product
Right
Product6e7
1
1Right
Product5e8
1Righ
tProduct4e9
1Right
Product3e10
1Right
Product2e11
1Right
Product1e12
1
Saving Money
Saving
Money9e13
1
1
Saving
Money4e18
1
Saving
Money3e19
1
Saving
Money2e20
1
Saving
Money1e21
1
Saving Time
Saving
Time5e22
1
1Saving
Time4e23
1Saving
Time3e24
1Saving
Time2e25
1Saving
Time1e26
1
Saving
Effort3e27
1Saving
Effort2e28
1Saving
Effort1e29
1
Convenience3e41
Figure 11 Final Purchase Model: Electronics
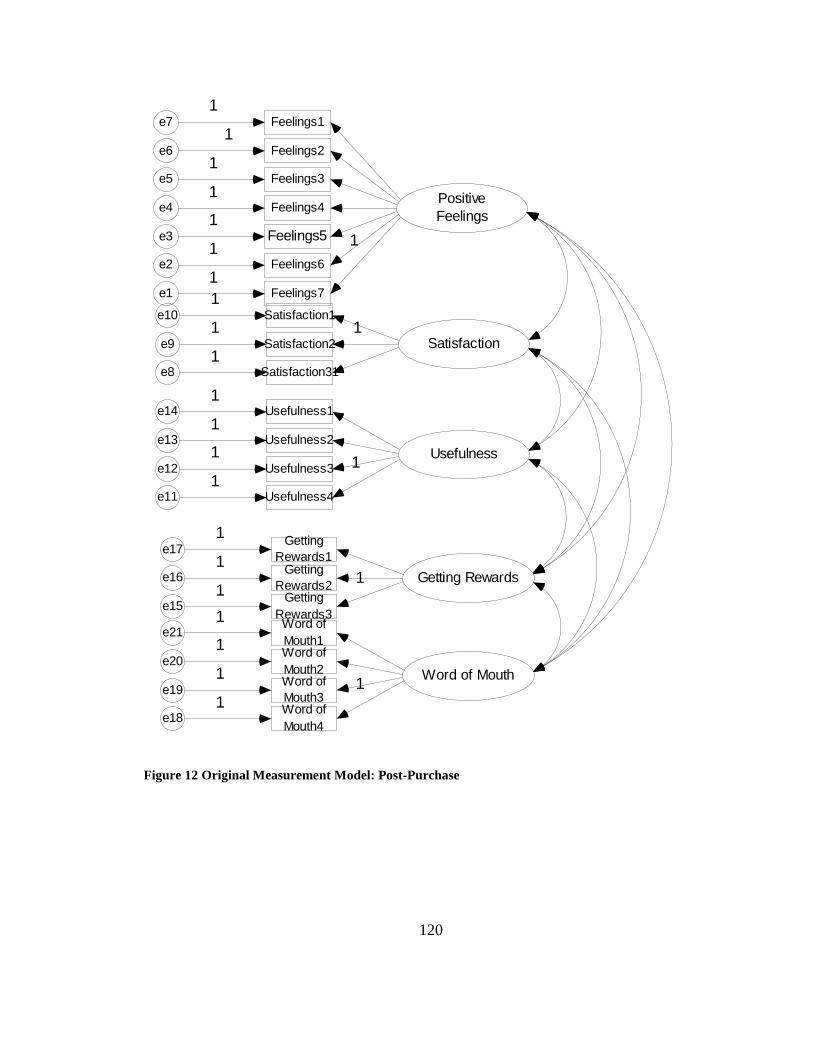
120
Positive
Feelings
Feelings7e1
1
1Feelings6e2
1Feelings5e3
1Feelings4e4
1Feelings3e5
1Feelings2e6
1Feelings1e7
1
SatisfactionSatisfaction2e9
11Satisfaction1e10
1
Usefulness
Usefulness4e11
11
Usefulness3e12
1Usefulness2e13
1Usefulness1e14
1
Getting Rewards
Getting
Rewards3e15
11
Getting
Rewards2e16
1
Getting
Rewards1e17
1
Word of Mouth
Word of
Mouth4e18
11
Word of
Mouth3e19
1
Word of
Mouth2e20
1
Word of
Mouth1e21
1
Satisfaction31e81
Figure 12 Original Measurement Model: Post-Purchase
121
reviewing the parameters in the Covariance section, the parameters within the same
construct representing covariance between the error terms e1 and e2, e1 and e3, e1 and
e4, e1 and e5, e4 and e7, e5 and e7, e8 and e10, e12 and e14, and e19 and e21 were
higher than the M.I. cut off value of 10.0. Each of these item pairs with high M.I. was
modified with covariance arrows between the pairs. This reparameterization of the
measurement model resulted in acceptable fit as can be seen in goodness-of-fit statistics
for the original post-purchase clothing model in Table 31.
Next, the correlation between constructs was examined. The correlation between
positive feelings and satisfaction was 1.037; therefore, these constructs were combined to
create a 4-factor model. Finally, the standardized loadings were examined (see Table 32)
and all items were above the minimum factor loading. The 4-factor clothing model
consisted of satisfaction (with 10 items), usefulness (with 4 items), getting rewards (with
3 items) and word of mouth (with 4 items). The final post-purchase clothing model
consisting of 21observed variables represents mediocre fit: CFI = 0.906; χ2 = 862.6; df =
173; χ2
ratio = 4.986; RMSEA = 0.090 (see Table 31). The final post-purchase clothing
model is presented in Figure 13.
The C.R. of satisfaction = 0.927; usefulness = 0.831; getting rewards = 0.656; and
word of mouth = 0.937 (see Table 33). The C.R. of all post-purchase clothing constructs
except getting rewards was greater than the minimum criteria of 0.70 indicating internal
consistency of the construct indicators. The getting rewards value is acceptable because
of the exploratory nature of the present study.
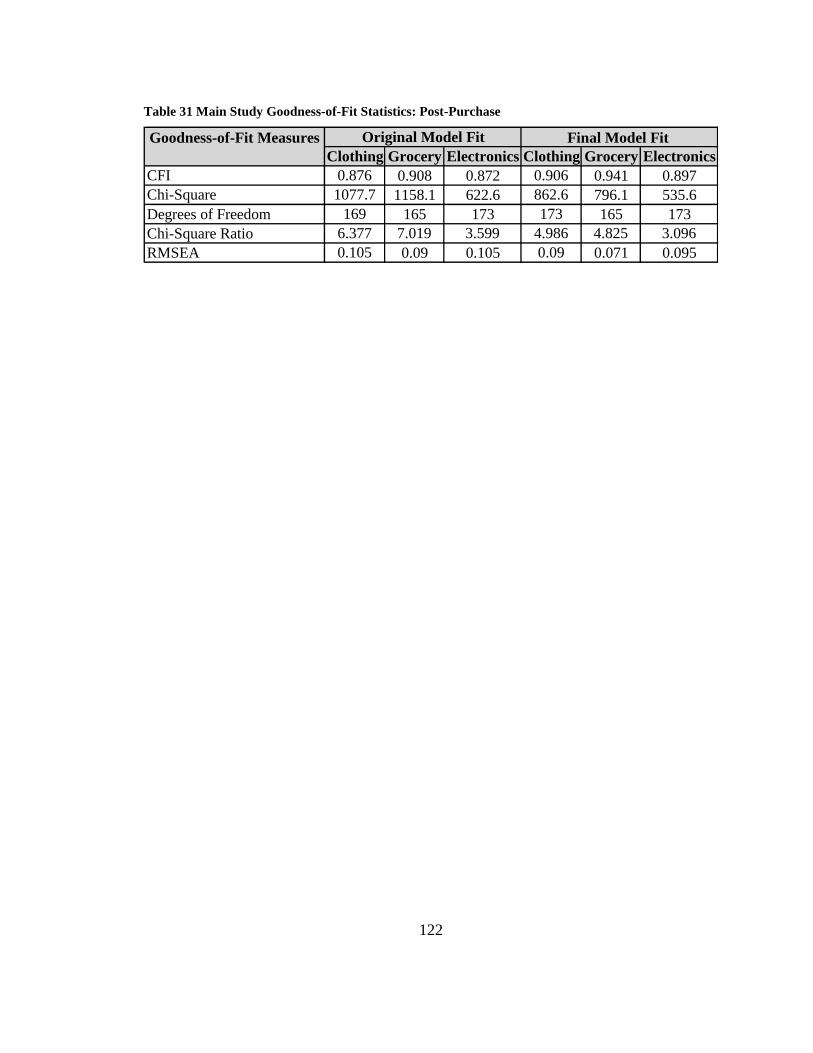
122
Table 31 Main Study Goodness-of-Fit Statistics: Post-Purchase
Clothing Grocery Electronics Clothing Grocery Electronics
CFI 0.876 0.908 0.872 0.906 0.941 0.897
Chi-Square 1077.7 1158.1 622.6 862.6 796.1 535.6
Degrees of Freedom 169 165 173 173 165 173
Chi-Square Ratio 6.377 7.019 3.599 4.986 4.825 3.096
RMSEA 0.105 0.09 0.105 0.09 0.071 0.095
Original Model Fit Final Model Fit Goodness-of-Fit Measures
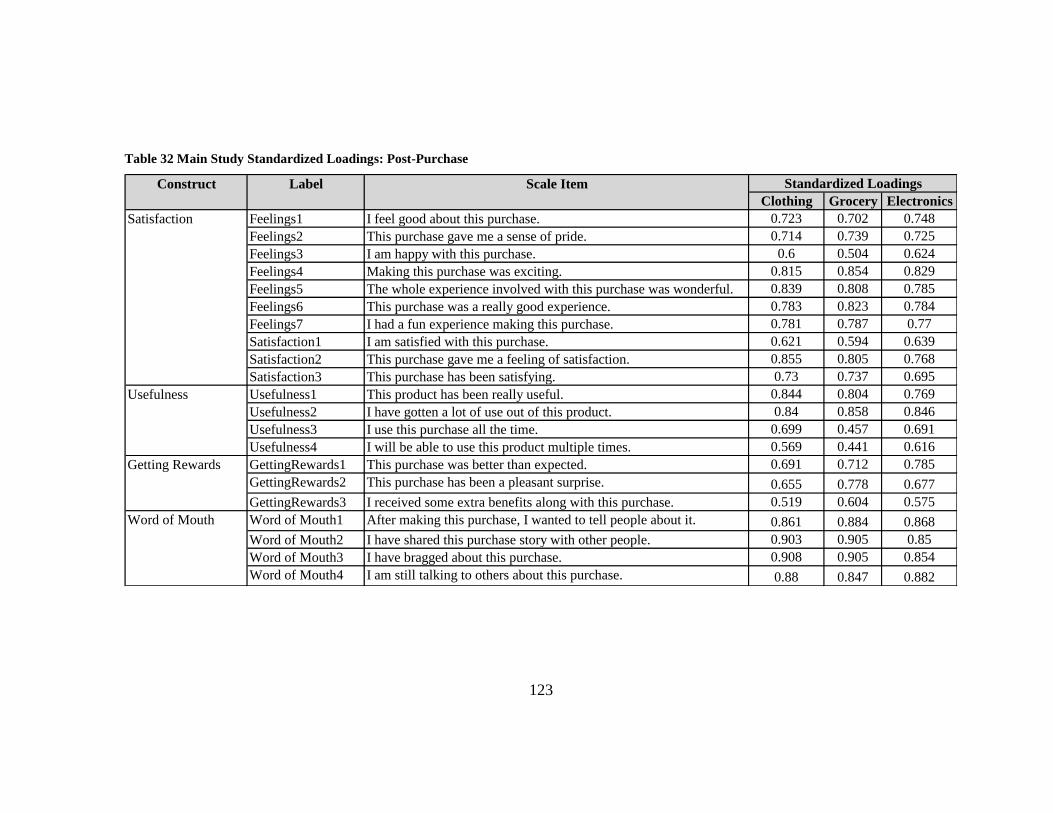
123
Table 32 Main Study Standardized Loadings: Post-Purchase
Clothing Grocery Electronics
Feelings1 I feel good about this purchase. 0.723 0.702 0.748
Feelings2 This purchase gave me a sense of pride. 0.714 0.739 0.725
Feelings3 I am happy with this purchase. 0.6 0.504 0.624
Feelings4 Making this purchase was exciting. 0.815 0.854 0.829
Feelings5 The whole experience involved with this purchase was wonderful. 0.839 0.808 0.785
Feelings6 This purchase was a really good experience. 0.783 0.823 0.784
Feelings7 I had a fun experience making this purchase. 0.781 0.787 0.77
Satisfaction1 I am satisfied with this purchase. 0.621 0.594 0.639
Satisfaction2 This purchase gave me a feeling of satisfaction. 0.855 0.805 0.768
Satisfaction3 This purchase has been satisfying. 0.73 0.737 0.695
Usefulness1 This product has been really useful. 0.844 0.804 0.769
Usefulness2 I have gotten a lot of use out of this product. 0.84 0.858 0.846
Usefulness3 I use this purchase all the time. 0.699 0.457 0.691
Usefulness4 I will be able to use this product multiple times. 0.569 0.441 0.616
GettingRewards1 This purchase was better than expected. 0.691 0.712 0.785
GettingRewards2 This purchase has been a pleasant surprise. 0.655 0.778 0.677
GettingRewards3 I received some extra benefits along with this purchase. 0.519 0.604 0.575
Word of Mouth1 After making this purchase, I wanted to tell people about it. 0.861 0.884 0.868
Word of Mouth2 I have shared this purchase story with other people. 0.903 0.905 0.85
Word of Mouth3 I have bragged about this purchase. 0.908 0.905 0.854
Word of Mouth4 I am still talking to others about this purchase. 0.88 0.847 0.882
Scale Item Standardized Loadings
Satisfaction
Usefulness
Getting Rewards
Word of Mouth
Construct Label
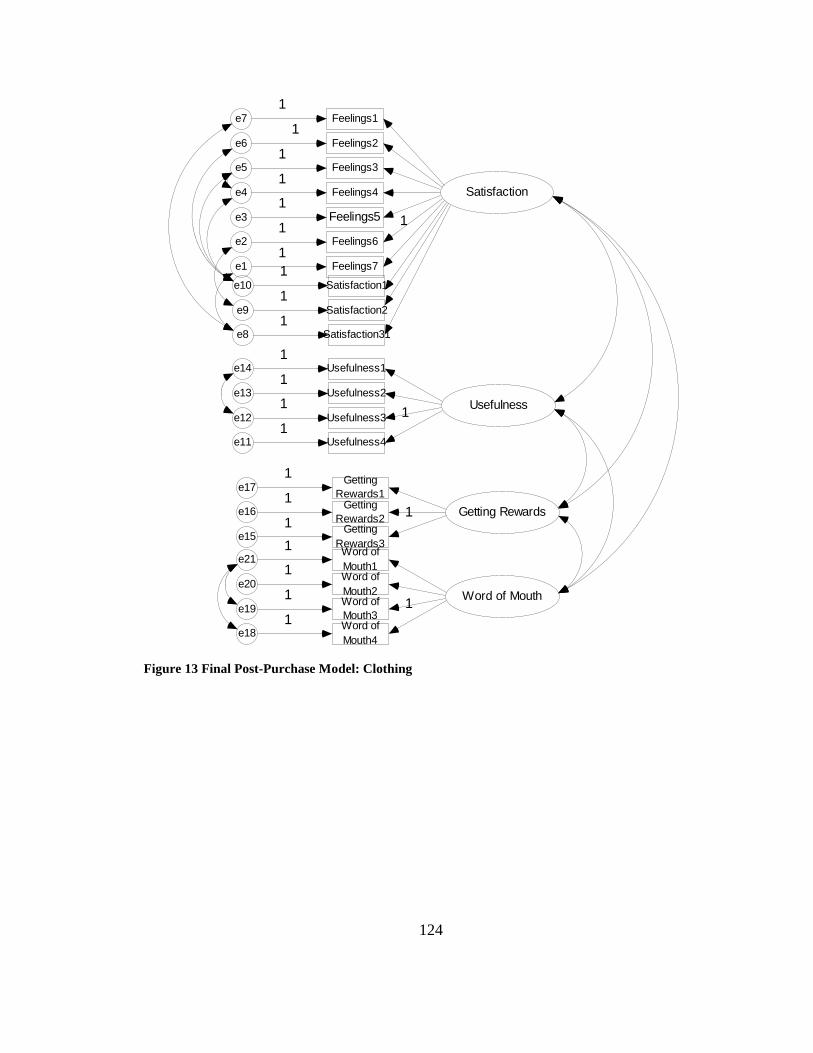
124
Satisfaction
Feelings7e1
1
1Feelings6e2
1Feelings5e3
1Feelings4e4
1Feelings3e5
1Feelings2e6
1Feelings1e7
1
Satisfaction2e9
1Satisfaction1e10
1
Usefulness
Usefulness4e11
11
Usefulness3e12
1Usefulness2e13
1Usefulness1e14
1
Getting Rewards
Getting
Rewards3e15
11
Getting
Rewards2e16
1
Getting
Rewards1e17
1
Word of Mouth
Word of
Mouth4e18
11
Word of
Mouth3e19
1
Word of
Mouth2e20
1
Word of
Mouth1e21
1
Satisfaction31e81
Figure 13 Final Post-Purchase Model: Clothing
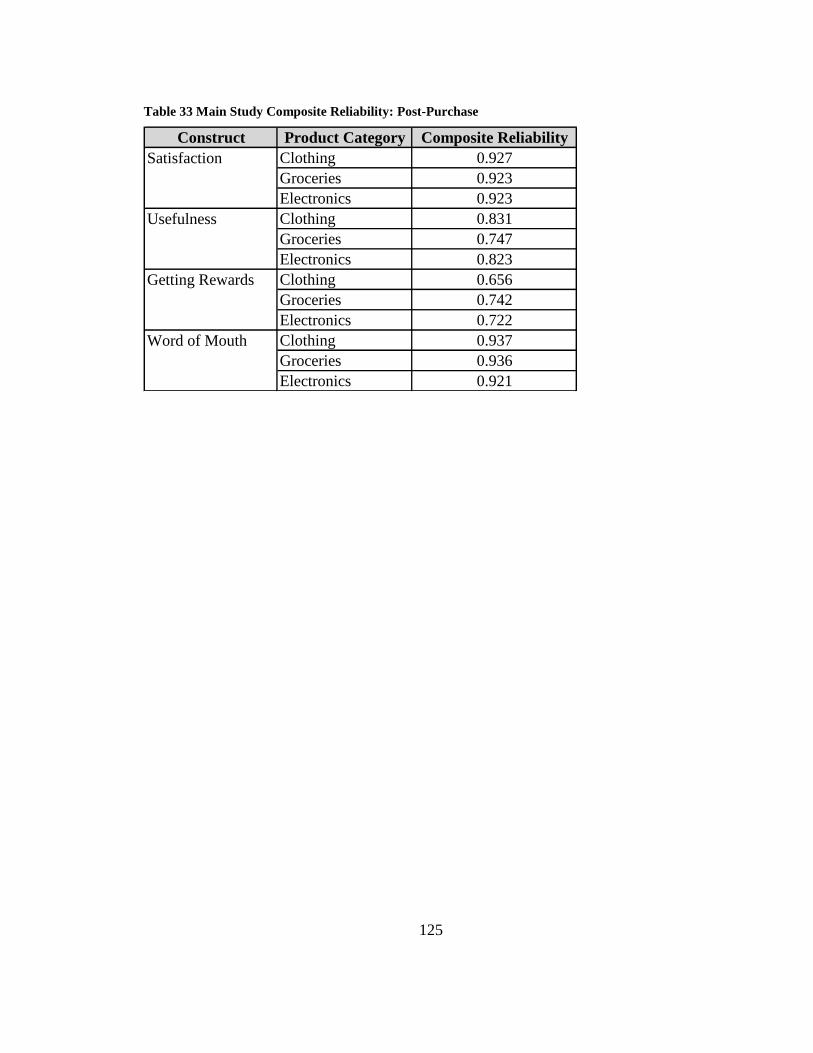
125
Table 33 Main Study Composite Reliability: Post-Purchase
Construct Product Category Composite Reliability
Clothing 0.927
Groceries 0.923
Electronics 0.923
Clothing 0.831
Groceries 0.747
Electronics 0.823
Clothing 0.656
Groceries 0.742
Electronics 0.722
Clothing 0.937
Groceries 0.936
Electronics 0.921
Word of Mouth
Satisfaction
Usefulness
Getting Rewards
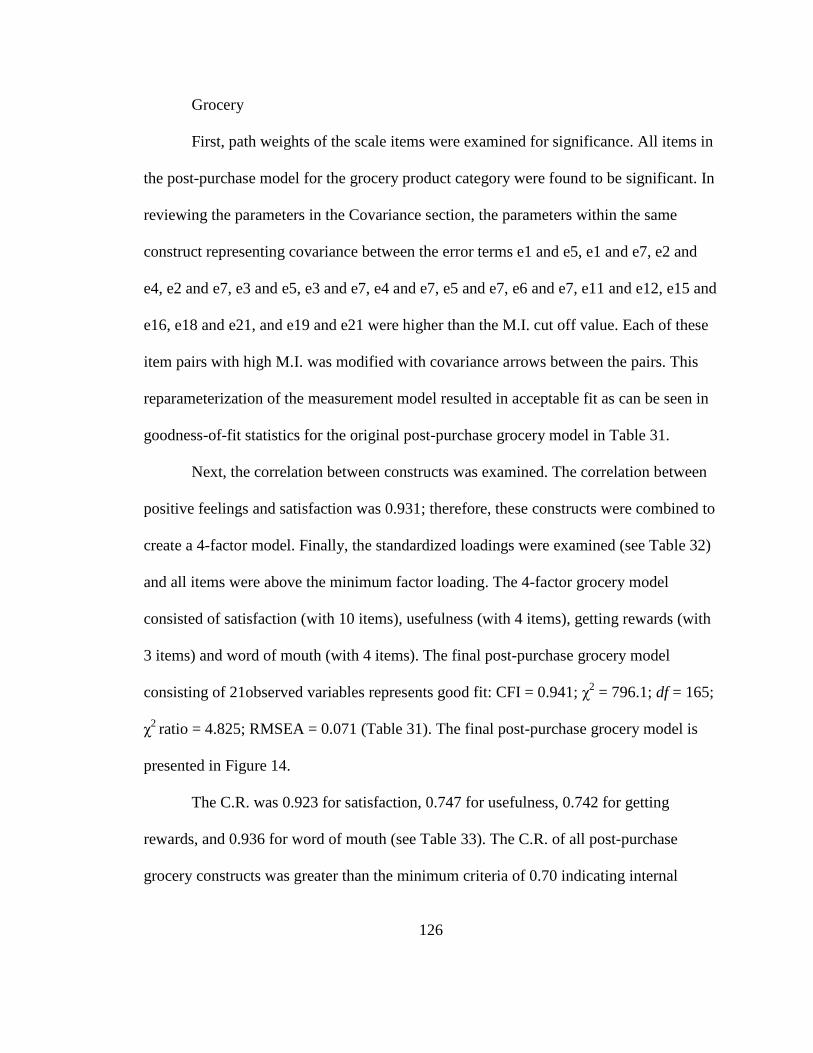
126
Grocery
First, path weights of the scale items were examined for significance. All items in
the post-purchase model for the grocery product category were found to be significant. In
reviewing the parameters in the Covariance section, the parameters within the same
construct representing covariance between the error terms e1 and e5, e1 and e7, e2 and
e4, e2 and e7, e3 and e5, e3 and e7, e4 and e7, e5 and e7, e6 and e7, e11 and e12, e15 and
e16, e18 and e21, and e19 and e21 were higher than the M.I. cut off value. Each of these
item pairs with high M.I. was modified with covariance arrows between the pairs. This
reparameterization of the measurement model resulted in acceptable fit as can be seen in
goodness-of-fit statistics for the original post-purchase grocery model in Table 31.
Next, the correlation between constructs was examined. The correlation between
positive feelings and satisfaction was 0.931; therefore, these constructs were combined to
create a 4-factor model. Finally, the standardized loadings were examined (see Table 32)
and all items were above the minimum factor loading. The 4-factor grocery model
consisted of satisfaction (with 10 items), usefulness (with 4 items), getting rewards (with
3 items) and word of mouth (with 4 items). The final post-purchase grocery model
consisting of 21observed variables represents good fit: CFI = 0.941; χ2 = 796.1; df = 165;
χ2
ratio = 4.825; RMSEA = 0.071 (Table 31). The final post-purchase grocery model is
presented in Figure 14.
The C.R. was 0.923 for satisfaction, 0.747 for usefulness, 0.742 for getting
rewards, and 0.936 for word of mouth (see Table 33). The C.R. of all post-purchase
grocery constructs was greater than the minimum criteria of 0.70 indicating internal
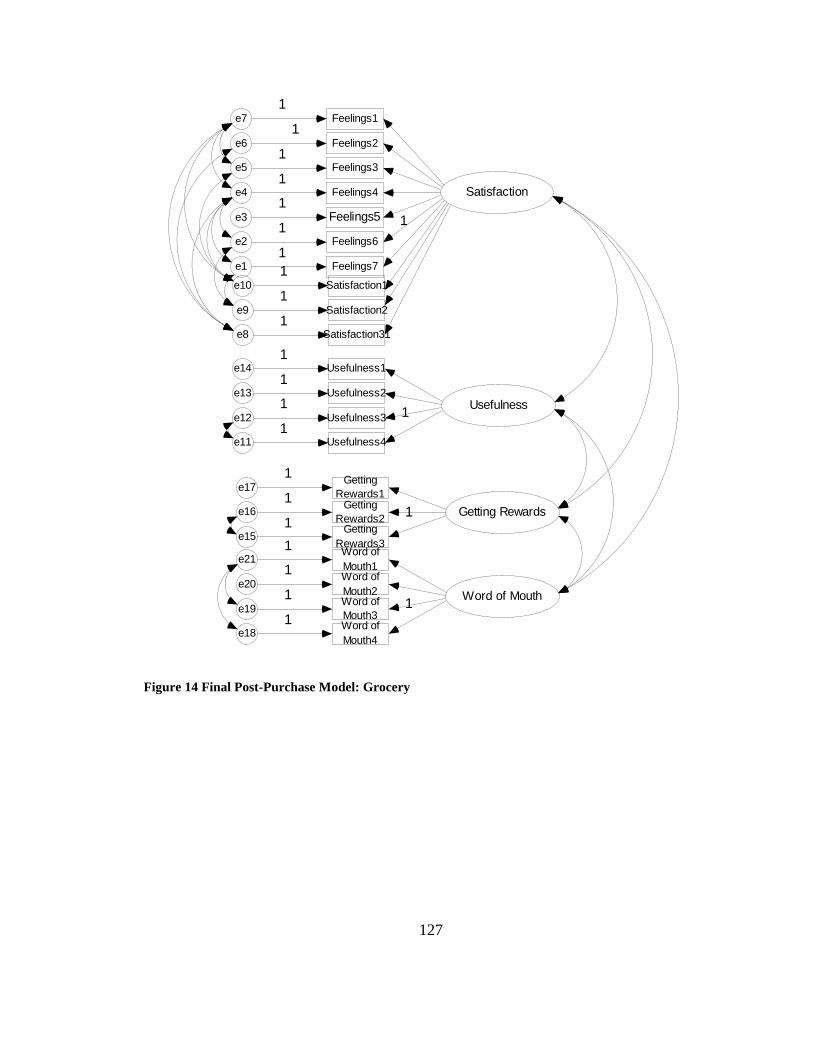
127
Satisfaction
Feelings7e1
1
1Feelings6e2
1Feelings5e3
1Feelings4e4
1Feelings3e5
1Feelings2e6
1Feelings1e7
1
Satisfaction2e9
1Satisfaction1e10
1
Usefulness
Usefulness4e11
11
Usefulness3e12
1Usefulness2e13
1Usefulness1e14
1
Getting Rewards
Getting
Rewards3e15
11
Getting
Rewards2e16
1
Getting
Rewards1e17
1
Word of Mouth
Word of
Mouth4e18
11
Word of
Mouth3e19
1
Word of
Mouth2e20
1
Word of
Mouth1e21
1
Satisfaction31e81
Figure 14 Final Post-Purchase Model: Grocery
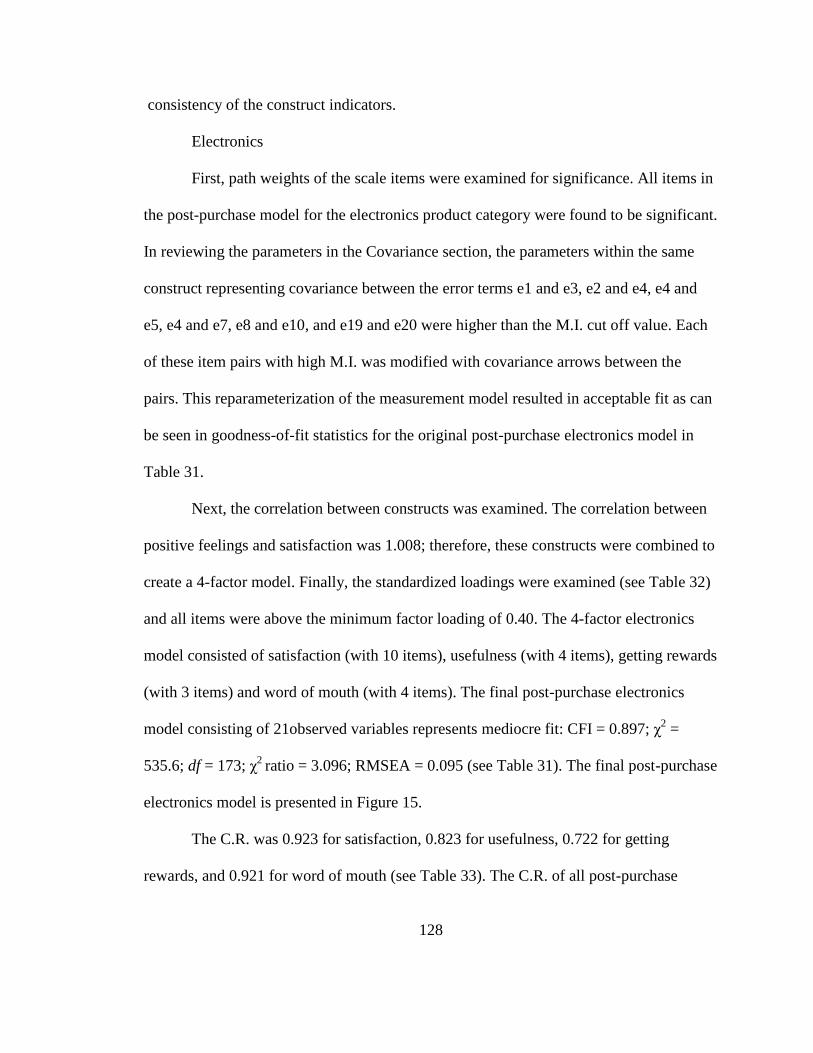
128
consistency of the construct indicators.
Electronics
First, path weights of the scale items were examined for significance. All items in
the post-purchase model for the electronics product category were found to be significant.
In reviewing the parameters in the Covariance section, the parameters within the same
construct representing covariance between the error terms e1 and e3, e2 and e4, e4 and
e5, e4 and e7, e8 and e10, and e19 and e20 were higher than the M.I. cut off value. Each
of these item pairs with high M.I. was modified with covariance arrows between the
pairs. This reparameterization of the measurement model resulted in acceptable fit as can
be seen in goodness-of-fit statistics for the original post-purchase electronics model in
Table 31.
Next, the correlation between constructs was examined. The correlation between
positive feelings and satisfaction was 1.008; therefore, these constructs were combined to
create a 4-factor model. Finally, the standardized loadings were examined (see Table 32)
and all items were above the minimum factor loading of 0.40. The 4-factor electronics
model consisted of satisfaction (with 10 items), usefulness (with 4 items), getting rewards
(with 3 items) and word of mouth (with 4 items). The final post-purchase electronics
model consisting of 21observed variables represents mediocre fit: CFI = 0.897; χ2 =
535.6; df = 173; χ2
ratio = 3.096; RMSEA = 0.095 (see Table 31). The final post-purchase
electronics model is presented in Figure 15.
The C.R. was 0.923 for satisfaction, 0.823 for usefulness, 0.722 for getting
rewards, and 0.921 for word of mouth (see Table 33). The C.R. of all post-purchase
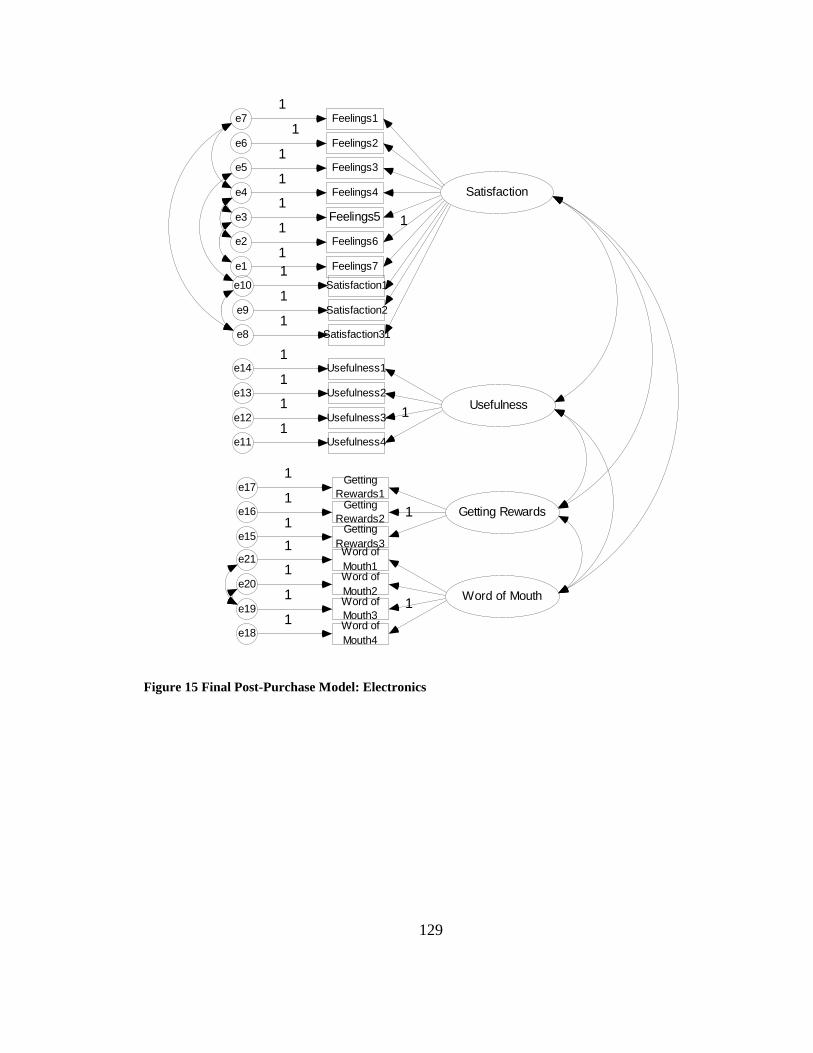
129
Satisfaction
Feelings7e1
1
1Feelings6e2
1Feelings5e3
1Feelings4e4
1Feelings3e5
1Feelings2e6
1Feelings1e7
1
Satisfaction2e9
1Satisfaction1e10
1
Usefulness
Usefulness4e11
11
Usefulness3e12
1Usefulness2e13
1Usefulness1e14
1
Getting Rewards
Getting
Rewards3e15
11
Getting
Rewards2e16
1
Getting
Rewards1e17
1
Word of Mouth
Word of
Mouth4e18
11
Word of
Mouth3e19
1
Word of
Mouth2e20
1
Word of
Mouth1e21
1
Satisfaction31e81
Figure 15 Final Post-Purchase Model: Electronics
130
electronics constructs was greater than the minimum criteria of 0.70 indicating internal
consistency of the construct indicators.
Invariance Testing
The p-values in the model fit output indicated that the data were significantly
different for the models in the post-purchase stage (see Table 27). The model comparison
output showed that the chi-square difference was significant (see Table 27), suggesting
the groups in the post-purchase stage differed.
Validity Testing
The scale validation was conducted for a 3-factor model (pre-purchase, purchase,
and post-purchase); that is, the scale for each decision-making stage was tested. Validity
was measured through tests for construct and nomological validity. Evidence of
unidimensionality was measured through tests for convergent and discriminant validity.
Convergent and discriminant validity were tested with average variance extracted (AVE).
Nomological validity was tested by correlating smart shopping scale responses with
existing scales of theoretically-related constructs.
Construct validity
Evidence of construct validity was provided by convergent and Discriminant
validity. Convergent validity measures whether constructs that are theoretically related
are actually related in the present study (Hair et al., 1995). Convergent validity can be
evaluated through the AVE for the latent variables. To demonstrate convergence, the
AVE scores should be greater than the threshold value of 0.50 (Hair et al., 1995). Higher
131
AVE values occur when the indicators (i.e., scale items) are truly representative of the
construct (Hair et al., 1995).
Evidence of convergent validity using AVE for each of the constructs is provided
in Table 34. AVE values ranged from 0.276 to 0.435 for the pre-purchase stage, from
0.344 to 0.570 for the purchase stage, and 0.392 to 0.789 for the post-purchase stage.
Neither of the constructs in the pre-purchase stage demonstrated convergent validity for
the clothing, grocery, or electronics product categories. Two constructs in the purchase
stage (i.e., right product, saving money) demonstrated convergent validity for the
grocery, and electronics product categories; only one construct (i.e., right product)
demonstrated convergent validity for the clothing product category. Three constructs in
the post-purchase stage (i.e., satisfaction, usefulness, word of mouth) demonstrated
convergent validity for the clothing and electronics product categories. Two constructs in
the post-purchase stage (i.e., satisfaction and word of mouth) demonstrated convergent
validity for the grocery product category. The constructs that did not demonstrate
convergent validity through AVE scores above 0.50 also demonstrated lower reliabilities
(see Tables 26, 30 & 33 for comparison) because the AVE measure is a complementary
measure to construct reliability (Hair et al., 1995).
Discriminant validity measures whether constructs that are not theoretically
related are actually not related to each other in the present study (Hair et al., 1995). This
can be assessed by examining the AVE for each construct and determining whether each
is greater than the shared variance with any other construct under analysis (Fornell &
Larcker, 1981; Hair et al., 1995).
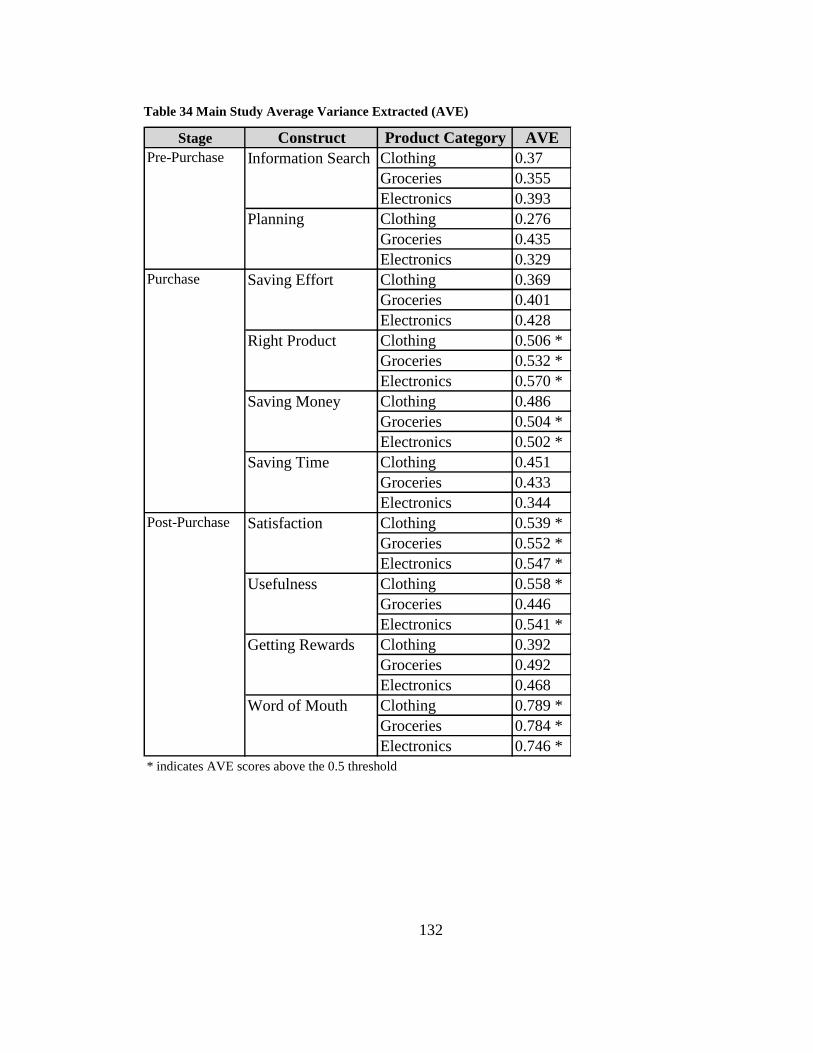
132
Table 34 Main Study Average Variance Extracted (AVE)
Stage Construct Product Category AVE
Clothing 0.37
Groceries 0.355
Electronics 0.393
Clothing 0.276
Groceries 0.435
Electronics 0.329
Clothing 0.369
Groceries 0.401
Electronics 0.428
Clothing 0.506 *
Groceries 0.532 *
Electronics 0.570 *
Clothing 0.486
Groceries 0.504 *
Electronics 0.502 *
Clothing 0.451
Groceries 0.433
Electronics 0.344
Clothing 0.539 *
Groceries 0.552 *
Electronics 0.547 *
Clothing 0.558 *
Groceries 0.446
Electronics 0.541 *
Clothing 0.392
Groceries 0.492
Electronics 0.468
Clothing 0.789 *
Groceries 0.784 *
Electronics 0.746 *
Satisfaction
Usefulness
Getting Rewards
* indicates AVE scores above the 0.5 threshold
Word of Mouth
Pre-Purchase
Purchase
Post-Purchase
Information Search
Planning
Saving Effort
Right Product
Saving Money
Saving Time
133
Evidence of discriminant validity using AVE and shared variance is provided in
Tables 35-43. In some cases, the squared correlations exceeded the AVE values of the
other constructs demonstrating a lack of discriminant validity. Discriminant validity was
not acceptable for the pair of pre-purchase constructs (i.e., information search and
planning) for the clothing, grocery or electronics product categories (see Tables 35, 36 &
37). In the purchase stage, save effort, right product and save money were distinct
constructs, but save effort and save time were not distinctly different in the clothing and
electronics product categories (see Tables 38 and 40). In the purchase stage, save effort
and save money were distinct constructs, but save effort, right product, and save time
were not distinctly different in the grocery category (see Table 39). In the post-purchase
stage, satisfaction, usefulness, and word of mouth were distinct constructs, but
satisfaction and getting rewards were not distinctly different for the clothing, grocery or
electronics product categories (see Tables 41, 42 & 43). These results indicate that all
constructs are not different (discriminant) from other constructs in the measure of smart
shopping.
Nomological validity
Nine constructs that were believed to be related to the smart shopping construct
developed in this study were selected from the literature for validity testing. Nomological
validity was tested by correlating pre-purchase and purchase scale responses with: price
consciousness (Alford & Biswas, 2002), convenience seeking (Noble et al., 2006),
marketplace knowledge (Clark et al., 2001), time consciousness (Kleijnen et al., 2007),
and smart shopping (Mano & Elliott, 1997; Reynolds et al., 2002). Nomological validity
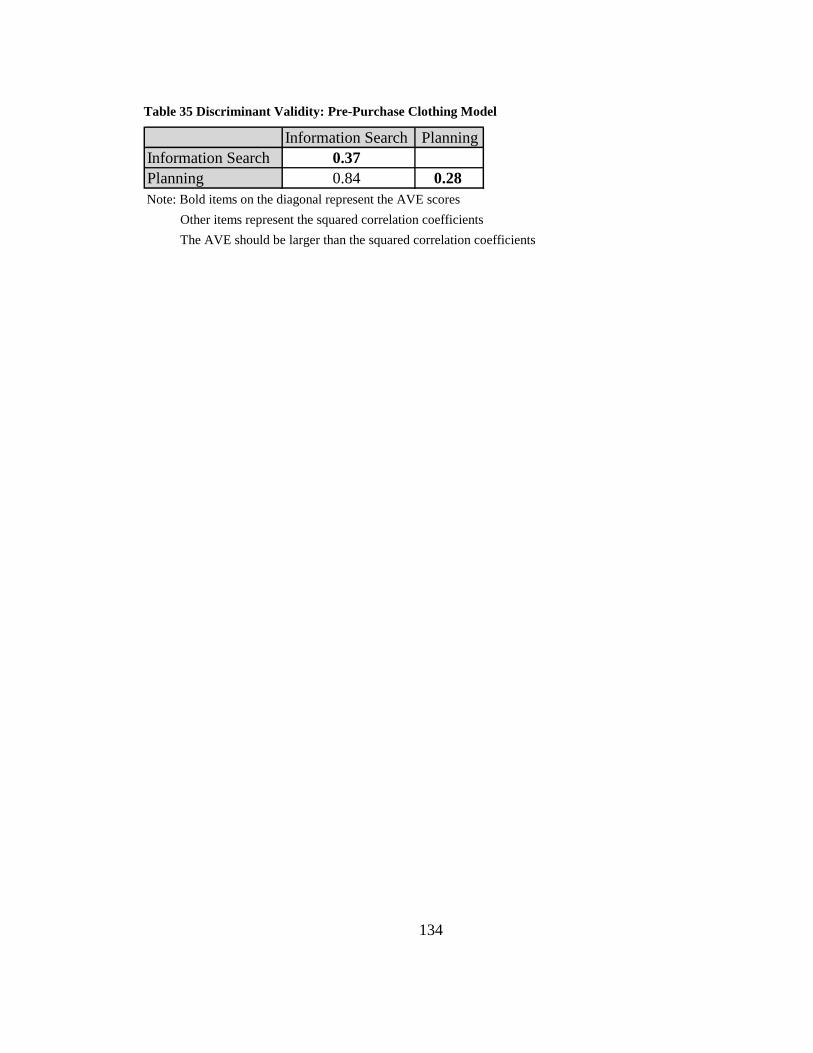
134
Table 35 Discriminant Validity: Pre-Purchase Clothing Model
Information Search Planning
Information Search 0.37
Planning 0.84 0.28
The AVE should be larger than the squared correlation coefficients
Note: Bold items on the diagonal represent the AVE scores
Other items represent the squared correlation coefficients

135
Table 36 Discriminant Validity: Pre-Purchase Grocery Model
Information Search Planning
Information Search 0.36
Planning 0.74 0.44
Note: Bold items on the diagonal represent the AVE scores
Other items represent the squared correlation coefficients
The AVE should be larger than the squared correlation coefficients

136
Table 37 Discriminant Validity: Pre-Purchase Electronics Model
Information Search Planning
Information Search 0.39
Planning 0.90 0.33
The AVE should be larger than the squared correlation coefficients
Note: Bold items on the diagonal represent the AVE scores
Other items represent the squared correlation coefficients
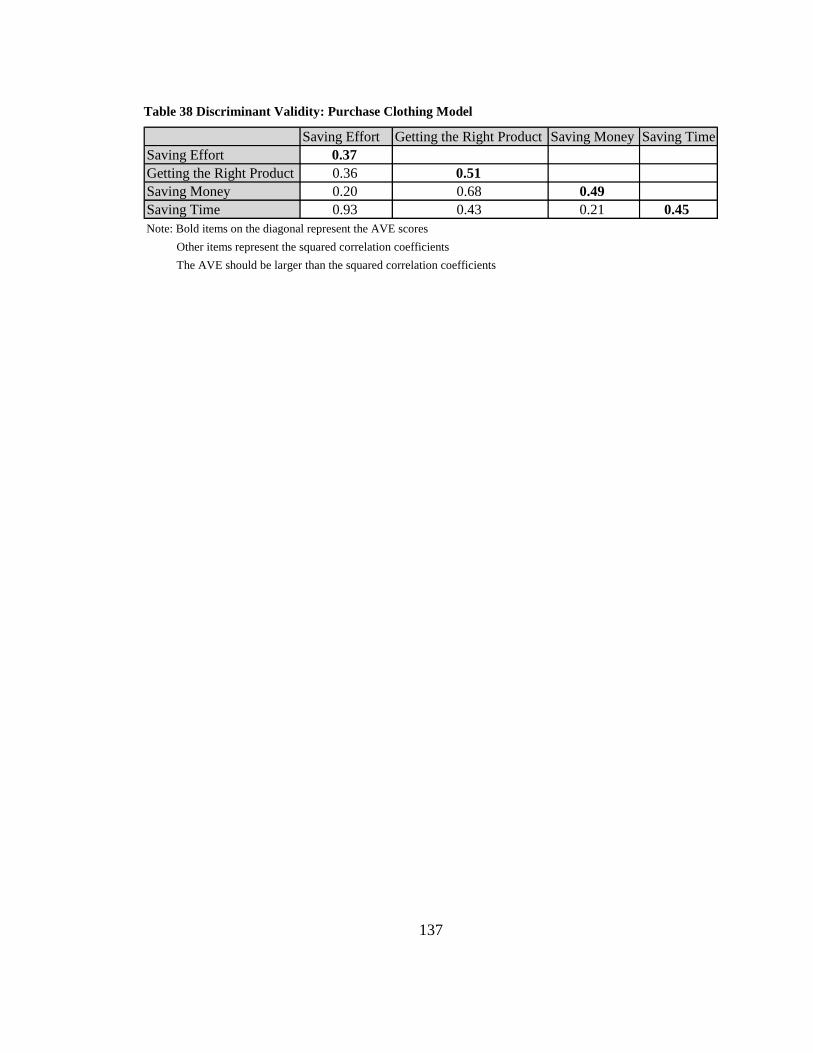
137
Table 38 Discriminant Validity: Purchase Clothing Model
Saving Effort Getting the Right Product Saving Money Saving Time
Saving Effort 0.37
Getting the Right Product 0.36 0.51
Saving Money 0.20 0.68 0.49
Saving Time 0.93 0.43 0.21 0.45
Note: Bold items on the diagonal represent the AVE scores
Other items represent the squared correlation coefficients
The AVE should be larger than the squared correlation coefficients

138
Table 39 Discriminant Validity: Purchase Grocery Model
Saving Effort Getting the Right Product Saving Money Saving Time
Saving Effort 0.40
Getting the Right Product 0.57 0.53
Saving Money 0.30 0.59 0.50
Saving Time 1.02 0.67 0.42 0.43
Note: Bold items on the diagonal represent the AVE scores
Other items represent the squared correlation coefficients
The AVE should be larger than the squared correlation coefficients

139
Table 40 Discriminant Validity: Purchase Electronics Model
Saving Effort Getting the Right Product Saving Money Saving Time
Saving Effort 0.43
Getting the Right Product 0.32 0.57
Saving Money 0.21 0.69 0.50
Saving Time 1.08 0.48 0.26 0.34
Note: Bold items on the diagonal represent the AVE scores
Other items represent the squared correlation coefficients
The AVE should be larger than the squared correlation coefficients

140
Table 41 Discriminant Validity: Post-Purchase Clothing Model
Satisfaction Usefulness Getting Rewards Word of Mouth
Satisfaction 0.54
Usefulness 0.36 0.56
Getting Rewards 0.77 0.37 0.39
Word of Mouth 0.48 0.12 0.53 0.79
Note: Bold items on the diagonal represent the AVE scores
Other items represent the squared correlation coefficients
The AVE should be larger than the squared correlation coefficients

141
Table 42 Discriminant Validity: Post-Purchase Grocery Model
Satisfaction Usefulness Getting Rewards Word of Mouth
Satisfaction 0.55
Usefulness 0.51 0.45
Getting Rewards 0.68 0.36 0.49
Word of Mouth 0.50 0.15 0.55 0.78
Note: Bold items on the diagonal represent the AVE scores
Other items represent the squared correlation coefficients
The AVE should be larger than the squared correlation coefficients
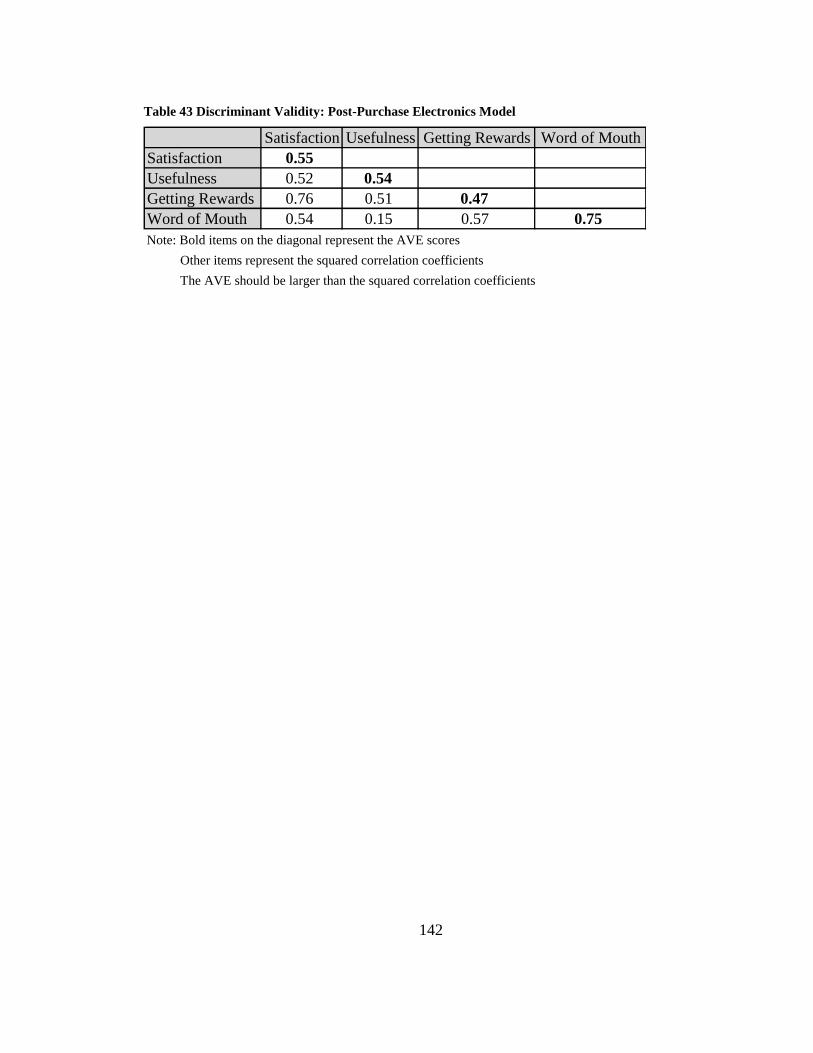
142
Table 43 Discriminant Validity: Post-Purchase Electronics Model
Satisfaction Usefulness Getting Rewards Word of Mouth
Satisfaction 0.55
Usefulness 0.52 0.54
Getting Rewards 0.76 0.51 0.47
Word of Mouth 0.54 0.15 0.57 0.75
Note: Bold items on the diagonal represent the AVE scores
Other items represent the squared correlation coefficients
The AVE should be larger than the squared correlation coefficients
143
was also tested by correlating post-purchase scale responses with: hedonic shopping
value (Babin et al., 1994), utilitarian shopping value (Babin et al., 1994), satisfaction
(Arora, 1985), and smart shopper self-perception (Burton et al., 1998). Table 44 presents
the results of the hypotheses testing.
Pre-Purchase and Purchase Stage
The first hypothesis was tested to examine the positive correlation between the
constructs price-consciousness and saving money. Price-consciousness was tested using
Alford and Biswas‟ (2002) 3-item price-consciousness scale. H1 was supported with a
Pearson correlation of 0.403 which was statistically significant at the 0.01 level.
Hypothesis H2a was tested to examine the positive correlation between the constructs
convenience-seeking and saving time. Hypothesis H2b was tested to examine the positive
correlation between the constructs convenience-seeking and saving effort. Convenience-
seeking was tested using Noble et al.‟s (2006) 3-item convenience-seeking scale. H2a & b
were supported with Pearson correlations of 0.295 and 0.234 respectively. These
correlations were statistically significant at the 0.01 level. The third hypothesis was tested
to examine the positive correlation between the constructs marketplace knowledge and
information search. Marketplace knowledge was tested using Clark et al.‟s (2001) 3-item
marketplace knowledge scale. H3 was supported with a Pearson correlation of 0.204 for
clothing and grocery and 0.220 for electronics. Both were statistically significant at the
0.01 level. Hypothesis H4a was tested to examine the positive correlation between the
constructs time-consciousness and saving time. Hypothesis H4b was tested to examine the
positive correlation between time-consciousness and saving effort constructs. Time-
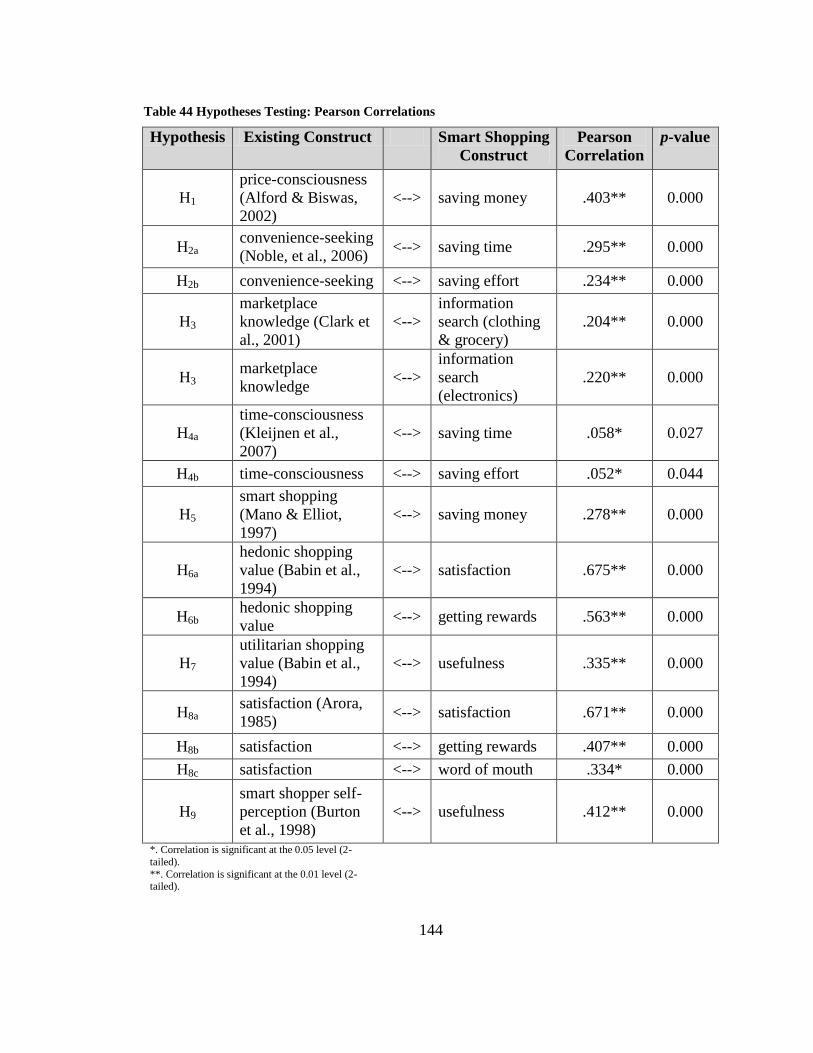
144
Table 44 Hypotheses Testing: Pearson Correlations
Hypothesis Existing Construct Smart Shopping
Construct
Pearson
Correlation
p-value
H1
price-consciousness
(Alford & Biswas,
2002)
<--> saving money .403** 0.000
H2a convenience-seeking
(Noble, et al., 2006) <--> saving time .295** 0.000
H2b convenience-seeking <--> saving effort .234** 0.000
H3
marketplace
knowledge (Clark et
al., 2001)
<-->
information
search (clothing
& grocery)
.204** 0.000
H3 marketplace
knowledge <-->
information
search
(electronics)
.220** 0.000
H4a
time-consciousness
(Kleijnen et al.,
2007)
<--> saving time .058* 0.027
H4b time-consciousness <--> saving effort .052* 0.044
H5
smart shopping
(Mano & Elliot,
1997)
<--> saving money .278** 0.000
H6a
hedonic shopping
value (Babin et al.,
1994)
<--> satisfaction .675** 0.000
H6b hedonic shopping
value <--> getting rewards .563** 0.000
H7
utilitarian shopping
value (Babin et al.,
1994)
<--> usefulness .335** 0.000
H8a satisfaction (Arora,
1985) <--> satisfaction .671** 0.000
H8b satisfaction <--> getting rewards .407** 0.000
H8c satisfaction <--> word of mouth .334* 0.000
H9
smart shopper self-
perception (Burton
et al., 1998)
<--> usefulness .412** 0.000
*. Correlation is significant at the 0.05 level (2-
tailed). **. Correlation is significant at the 0.01 level (2-tailed).
145
consciousness was tested using Kleijnen et al.‟s (2007) 9-item time-consciousness scale.
H4a was supported with a Pearson correlation of 0.058 which was statistically significant
at the 0.05 level. H4b was supported with a Pearson correlation of 0.052 which was
statistically significant at the 0.05 level. Hypothesis H5 was tested to examine the positive
correlation between smart shopping (as defined by Mano & Elliott, 1997) and saving
money constructs. Smart shopping was tested using Mano and Elliott‟s (1997) 7-item
smart shopping scale. H5 was supported with a Pearson correlation of 0.278 which was
statistically significant at the 0.01 level.
Post-Purchase Stage
Hypothesis H6a was tested to examine the positive correlation between hedonic
shopping value and satisfaction constructs. Hypothesis H6b was tested to examine the
positive correlation between hedonic shopping value and getting rewards constructs.
Hedonic shopping value was tested using Babin et al.‟s (1994) 11-item hedonic shopping
value scale. H6a was supported with a Pearson correlation of 0.675 which was statistically
significant at the 0.01 level. H6b was supported with a Pearson correlation of 0.563 which
was statistically significant at the 0.01 level. Hypothesis H7 was tested to examine the
positive correlation between utilitarian shopping value and usefulness constructs.
Utilitarian shopping value was tested using Babin et al.‟s (1994) 4-item utilitarian
shopping value scale. H7 was supported with a Pearson correlation of 0.335 which was
statistically significant at the 0.01 level. Hypothesis H8a was tested to examine the
positive correlation between satisfaction (as defined by Arora, 1985) and satisfaction (as
defined by the present study). Hypothesis H8b was tested to examine the positive
146
correlation between satisfaction (as defined by Arora, 1985) and getting rewards
constructs. H8c was tested to examine the positive correlation between satisfaction (as
defined by Arora, 1985) and word of mouth constructs. Satisfaction was tested using
Arora‟s (1985) 3-item satisfaction scale. H8a was supported with a Pearson correlation of
0.671 which was statistically significant at the 0.01 level. H8b was supported with a
Pearson correlation of 0.407 which was statistically significant at the 0.01 level. H8c was
supported with a with a Pearson correlation of 0.334 which was statistically significant at
the 0.05 level. Hypothesis H9 was tested to examine the positive correlation between
smart shopper self-perception (as defined by Burton et al., 1998) and usefulness
constructs. Smart shopping was tested using Burton et al.‟s (Burton et al., 1998) 4-item
smart shopper self-perception scale. H9 was supported with a Pearson correlation of 0.412
which was statistically significant at the 0.01 level. Correlation estimates between the
smart shopping constructs and the theoretically-related variables provided confirmation
of nomological validity through statistically significant positive correlations with all nine
of the theoretical constructs.
Discussion of Findings
With respect to gaining a better understanding and conceptualization of the term
smart shopping, this study confirmed the presence of monetary savings and hedonic
benefits (satisfaction) in smart shopping and added empirical support for the presence of
additional constructs in smart shopping (i.e., information search, planning, saving effort,
getting the right product, saving time, usefulness, getting rewards, and word of mouth).
147
This study confirmed the smart shopping literature related to monetary savings
such as the study by Schindler (1998) that emphasized the utilitarian benefit of monetary
savings in smart shopping. The present study provided empirical support for the saving
money construct in the purchase stage and extends smart shopping activities to include
purchase constructs labeled saving effort, getting the right product, and saving time.
This study also supported the cost and benefit components of consumer
efficiency. For example, the pre-purchase and purchase stages represent the activities of
smart shopping and are similar to the costs (i.e., price, time, energy) by Downs (1961)
and the post-purchase stage represents the smart shopping behaviors and are similar to
the benefits (i.e., goods, information, pleasure) by Downs (1961).
This study also confirmed the presence of hedonic responses in the smart
shopping purchase experience. Previously, Schindler (1989) examined the smart shopper
feelings associated with consumer emotions and excitement generated by price
promotions. The present study extended Schindler‟s study by identifying other outcome
constructs of smart shopping (i.e., usefulness, getting rewards, word of mouth) and by
identifying other activities that generate emotions and excitement (i.e., saving effort,
getting the right product, saving time). In addition, this study supported the study by
Mano and Elliot (1997) that evaluated the hedonic value consumers received from smart
purchases. Mano and Elliot (1997) only attributed the hedonic responses to price savings,
whereas the present study attributed hedonic responses to other constructs such as saving
effort or saving time.
148
Through the scale purification and validation, the present study provided
empirical support for smart shopping topics previously found in the popular press:
information gathering, planning, shopping enjoyment, saving time, saving money, and
getting referrals from other shoppers. These findings confirmed the supposition that smart
shopping activities included the expenditure of time, money, and effort, and often
included emotional benefits from the shopping experience itself.
This study also supported economic theory that consumers desire utility from
their consumption and that they cannot purchase all the desired goods and services;
therefore, they must choose some combination of goods and services in exchange for
their resources of time, money, and energy to obtain the desired utility.
Finally, this study supported the pre-purhcase, purchase, and post-purchase
consumer decision-making stages presented by Blackwell (2005). In these smart
shopping stages, the consumer acquires information from outside, evaluates and narrows
down the options, acquires the desired product (or an acceptable substitute), and
evaluates the purchase based upon the consumption experience.
The final smart shopping scale items are presented in Appendix J. The pre-
purchase stage includes eight items in the information search construct and six scale
items for the planning construct. As indicated in Appendix J, one scale item (Planning3)
should be excluded from studies in the clothing product category; two items (Planning2
and Planning4) should be excluded from studies in the grocery category; and one item
(InfoSearch3) should be excluded from studies in the electronics category.
149
The purchase stage includes six items in the saving effort construct, six items in
the getting the right product construct, five items in the saving money construct, and five
items in the saving time construct. All scale items should be included in studies of
clothing, grocery, and electronics product categories. The post-purchase stage includes 10
items in the satisfaction construct, four items in the usefulness construct, three items in
the getting rewards construct, and four items in the word of mouth construct. All scale
items should be included in studies of clothing, grocery, and electronics product
categories.
Chapter Summary
In summary, the pilot test was conducted for initial scale refinement and resulted
in modifications to the questionnaire wording and instructions in further studies. The
pretest was conducted for scale purification and resulted in 57 smart shopping scale items
for further studies.
In the main study, CFA was used to identify the overall factor structure of the
smart shopping items. The magnitude of item error variances, the prevalence of large
modification indices, and significance of residual covariatian indicated potential items for
deletion from the pool of smart shopping items. Results of the three item-analysis
techniques along with goodness-of-fit indices (χ2
test, df, χ2
ratio test, CFI, and RMSEA)
and standardized loadings were considered collectively in determining which scale items
to retain in the 3-factor model. These techniques resulted in retention of 56 of 57 items in
the clothing product category, 55 of 57 items in the grocery product category, and 55 of
57 items in the electronics product category. Composite reliability values ranged from
150
0.654 to 0.937. Tests of invariance found significant differences for the models between
the three product categories for each of the three stages. Evidence of convergent and
discriminant validity using AVE differed for the three stages and three product
categories. Confirmation of nomological validity was identified through statistically
significant correlations with all nine of the theoretical constructs.
151
CHAPTER V
CONCLUSIONS AND IMPLICATIONS
The purpose of this study is to gain a better understanding and conceptualization
of the term smart shopping. In this chapter, the findings and implications of the smart
shopping study are discussed, the limitations of the study are proposed, and suggestions
for further research are provided.
Summary of Findings
The specific research objectives of this study are to: (a) investigate consumers‟
perceptions of the term smart shopping; (b) develop a measure of smart shopping; and (c)
validate the measure of smart shopping. A comprehensive review of literature is used to
identify existing smart shopping concepts and theories and to identify opportunities for
expanding upon existing meanings of the term. Customers‟ perceptions of the term smart
shopping are obtained through focus group interviews and face-to-face in-depth
interviews. With this conceptual information, a measure of smart shopping is developed,
purified, and validated through the use of a pilot test, pretest, and main study.
Preliminary statistical analyses reveal significant group differences in gender and
age category variables across the three product categories. Assessments of normality
reveal pronounced kurtosis values. Confirmatory factor analysis (CFA) is conducted for
the three stages (i.e., pre-purchase, purchase, and post-purchase) and three product
categories (i.e., clothing, grocery, and electronics). Results of the standardized loadings
and goodness-of-fit indices are used to determine which scale items to retain in each
model. In the clothing product category, 56 of 57 scale items are retained, in the grocery
152
product category, 55 of 57 items are retained, and in the electronics product category, 55
of 57 items are retained.
With respect to composite reliability, the values of the 10 constructs in the smart
shopping model range from 0.654 to 0.937. The commonly used minimum reliability is
0.70; however values below this threshold are often accepted for exploratory research
(Hair et al., 1995). The researcher conducts invariance testing on each stage for the three
product categories and significant differences are found among the product categories in
each stage.
Evidence of convergent and discriminant validity are evaluated through the AVE
for the latent variables. Neither of the constructs in the pre-purchase stage demonstrates
convergent validity. However, two constructs in the purchase stage (i.e., right product,
saving money) demonstrate convergent validity; and three constructs in the post-purchase
stage (i.e., satisfaction, usefulness, word of mouth) demonstrate convergent validity.
Discriminant validity is not acceptable for the pair of pre-purchase constructs (i.e.,
information search and planning). In the purchase stage, save effort, right product and
save money are distinct constructs, but save effort and save time are not distinctly
different. In the post-purchase stage, satisfaction, usefulness, and word of mouth are
distinct constructs, but satisfaction and getting rewards are not distinctly different.
Finally, correlation estimates between the smart shopping constructs and the
theoretically-related variables provide confirmation of nomological validity through
statistically significant correlations with all nine of the theoretical constructs.
153
With this study, the concept of “smart shopping” is conceptualized and tested
from a broader perspective than previous studies. Previously, studies about smart
shopping were primarily focused on saving money. This study has expanded the
definition of the term by investigating cost and benefit components as well as utilitarian
and hedonic aspects of smart shopping.
The constructs in the smart shopping stages include: (a) information search and
planning in the pre-purchase stage; (b) saving effort, getting the right product, saving
money, and saving time in the purchase stage; and (c) satisfaction, usefulness, getting
rewards, and word of mouth in the post-purchase stage. These constructs are depicted in
the revised smart shopping model (see Figure 16).
Pre-Purchase Stage
With respect to the pre-purchase stage, the smart shopping constructs differ for
the three product categories. This suggests that the consumers‟ information search and
planning behaviors may differ dependent upon the product category (i.e., clothing,
grocery, or electronics). While asking others about their purchase experiences
(InfoSearch3) may be part of the information search for clothing and grocery purchases,
it may not be a part of electronics purchases. Next, having an organized shopping plan
(Planning2) may be a part of clothing and electronics purchases, but not a part of grocery
purchases. In addition, while knowing how much money participants are willing to spend
(Planning3) on their grocery and electronics purchases may be a part of smart shopping,
it may not be an important part of clothing purchases. Finally, making a list before a
shopping trip (Planning4) may be a part of grocery shopping, but may not be a part of
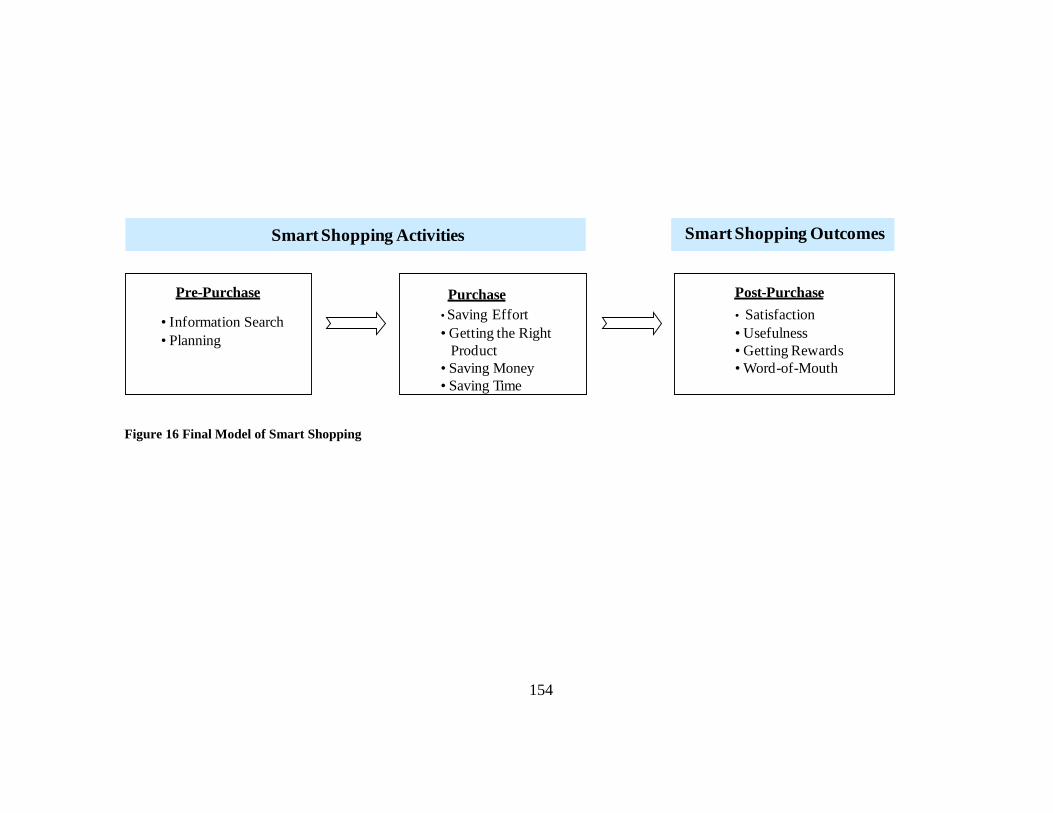
154
Smart Shopping Activities Smart Shopping Outcomes
Pre-Purchase Purchase Post-Purchase
• Information Search
• Planning
• Saving Effort
• Getting the Right
Product
• Saving Money
• Saving Time
• Satisfaction
• Usefulness
• Getting Rewards
• Word-of-Mouth
Figure 16 Final Model of Smart Shopping
155
clothing or electronics shopping. These results show that pre-purchase consumer
shopping activities may not be consistent across product categories.
The original pre-purchase model includes four constructs (i.e., information search,
comparison shopping, planning for purchases, and planning for sale purchases).
However, the data show that the information search and comparison shopping constructs
are highly correlated and exhibit theoretical similarity as are the planning for purchases
and planning for sale purchases constructs. Therefore, these pairs of constructs were
combined to provide two constructs (i.e., information search and planning). In a study of
search behavior of grocery shoppers by Putrevu and Ratchford (1997), search was made
up of 9 subscales: comparing unit prices, checking price tags, comparing brands on
different ingredients/attributes, looking for in-store promotions, searching for coupons,
looking for advertised specials in newspapers/flyers, shopping at multiple markets,
discussing grocery shopping with friends, and looking for newspaper/magazine
evaluations of grocery products. This method of using subscales indicates that the highly
correlated constructs in the pre-purchase stage are theoretically similar; thus, two
constructs remain (i.e., information search and planning).
Purchase Stage
The original purchase model is a 5-factor model composed of convenience, right
product, saving money, saving time, and saving effort. Because of the high correlation
and theoretical similarity between the saving time and getting convenience constructs,
these two constructs are combined. In a study by Donthu and Garcia (1999) that
compared Internet shoppers to Internet nonshoppers, the authors‟ convenience construct
156
consisted of three scale items: I hate to spend time gathering information on products, I
do not like complicated things, and it is convenient to shop from home. In this study, the
terms convenience and time are used in the same construct suggesting that the two are
theoretically-related.
The correlation between the remaining saving time and saving effort constructs is
high. However, based upon the information from the qualitative interviews, they are
proposed to be two distinct constructs. For example, “I did not go out of my way” (saving
effort) is similar to, but conceptually different from “I didn‟t waste time making this
purchase” (saving time). For this reason, the final purchase model is a 4-factor model
consisting of saving effort, right product, saving money, and saving time.
Post-Purchase Stage
The original post-purchase model contains five constructs: positive feelings,
satisfaction, usefulness, getting rewards, and word of mouth. Due to high correlation and
theoretical similarity between satisfaction and positive feelings, these constructs are
combined. Westbrook and Oliver (1991) examined feelings and attitudes toward
purchases with 12 scale items that included both satisfaction statements (e.g., I am
satisfied with my decision to buy this product) and positive feelings statements (e.g., I
have truly enjoyed this purchase). Thus, the final post-purchase model contains four
constructs: satisfaction, usefulness, getting rewards, and word of mouth.
The final smart shopping scale items are presented in Appendix J. The pre-
purchase stage includes eight items in the information search construct and six scale
items for the planning construct. As indicated in the Appendix, one item should be
157
excluded from studies in the clothing product category; two items should be excluded
from studies in the grocery category; and one item should be excluded from studies in the
electronics category.
The purchase stage includes six items in the saving effort construct, six items in
the getting the right product construct, five items in the saving money construct, and five
items in the saving time construct. All scale items should be included in studies of
clothing, grocery, and electronics. The post-purchase stage includes 10 items in the
satisfaction construct, four items in the usefulness construct, three items in the getting
rewards construct, and four items in the word of mouth construct. All scale items should
be included in studies of clothing, grocery, and electronics.
Implications
This study, which investigates the activities and outcomes of the smart shopping
construct, illuminates the complexity of the term smart shopping. In order to compete for
today‟s smart shopper who places importance on both price and non-price dimensions of
shopping, retailers need to develop strategies for a specific smart shopping stage (i.e.,
pre-purchase, purchase, and post-purchase) and a specific product category (e.g.,
clothing, grocery, or electronics).
Specific pre-purchase strategies retailers could adopt to enhance smart shopping
include: (a) online and in-store information kiosks for comparing product features and
benefits; (b) subscriptions to retailer special events, price discounts, or new arrivals via
email or postal service; (c) aisle-by-aisle grocery shopping lists that combine the stores‟
layout with the consumers‟ weekly shopping list. Such pre-purchase strategies could
158
provide shoppers with more information that would enable them to reduce the costs (e.g.,
money, time, effort) or increase the benefits (e.g., satisfaction, usefulness) of the
shopping trip, thus making them feel like a smart shopper.
Purchase strategies could include: (a) online wish lists to save customers time
when revisiting the website or visiting the store and to send to friends or family for gift-
giving suggestions; (b) in-store pickup for online or telephone purchases to save shipping
costs and to reduce shopping effort through reserved parking spaces and expedited check-
out lanes; and (c) store maps on shopping carts or posted throughout the store to assist
customers in navigating the store and in quickly finding the products for which they are
shopping. These types of purchase strategies provide monetary and non-monetary savings
for the smart shopper while also providing positive outcomes.
Post-purchase strategies could focus on the smart shoppers‟ desired outcomes and
provide shopping experiences that increase satisfaction. Such strategies could include: (a)
experiential shopping environments that provide entertainment as well as tangible
products and services; (b) tell-a-friend services for customers to alert others about good
products, services, or sales; and (c) rewards or rebates for purchases or periodic gifts-
with-purchase. These post-purchase strategies provide utilitarian benefits such as saving
money while also providing hedonic benefits such as getting rewards or word of mouth.
By choosing to meet the needs of the “smart” shopper, retailers can shift the focus
from the “sale shopper” who makes shopping decisions purely based upon monetary
costs, to the smart shopper who also wants to reduce the time and effort costs of his/her
shopping trips while experiencing a pleasurable shopping trip.
159
Limitations and Directions for Future Research
This study has several limitations and opportunities for future research. First, as
with all scale development research, one must use caution when applying the smart
shopping scale to other shopping contexts (e.g., online and catalog) or product categories
(e.g., furniture or jewelry). Further evidence is necessary to replicate and extend the
proposed model before generalization beyond in-store clothing, grocery, or electronics
purchases is recommended.
Second, it should be recognized that the participants for the pilot test, pretest, and
main study are U.S. consumers; therefore, this study cannot be generalized to other
cultural contexts. Though the term smart shopping is relatively widespread in American
culture, it may not be applicable in other cultures. Further research could identify ways in
which the proposed model is a reflection of Western cultures.
Third, there was a significant difference among the three product categories by
some demographic characteristics (i.e., gender and age category); therefore, differences
in product categories may be a reflection of differences in gender or age category. For
example, 66.4% of the men in the sample chose the electronics product category;
therefore, the results of the data may be a reflection of the difference between genders
rather than the difference between product categories. This is both a limitation and
direction for further research. Further testing of the demographic characteristics by
product category is warranted.
Another fruitful research direction is to replicate the smart shopping study for
online and catalog shopping. Such a replication would contribute to existing multi-
160
channel research projects and extend the smart shopping scales to multiple shopping
channels.
Finally, more work is necessary to refine our knowledge of smart shopping
activities and behaviors. The 57 smart shopping scale items surviving empirical
verification in the pretest and main study are included in ten smart shopping constructs,
but other potential constructs remain. For example, items specifying “coupon
redemption” and “waiting” as a part of the purchase stage were not retained in the refined
scale although they were voiced in the qualitative interviews. Thus, further attempts at
measuring smart shopping might include items such as coupon redemption and waiting.
Recognizing that consumers desire better outcomes in exchange for their
participation in shopping activities, this study assists in understanding the meaning of the
term smart shopping, identifying ways of meeting the needs of the smart shopper, and
suggesting marketing methods for targeting smart shoppers.

161
LIST OF REFERENCES
162
Alford, B. L., & Biswas, A. (2002). The effects of discount level, price consciousness and
sale proneness on consumers' price perception and behavioral intention. Journal
of Business Research, 55(9), 775-783.
Alreck, P. L., & Settle, R. B. (2002). The hurried consumer: Time-saving perceptions of
Internet and catalogue shopping. Journal of Database Marketing, 10(1), 25.
Andreoni, J. (1990). Impure altruism and donations to public goods: A theory of warm-
glow giving. Economic Journal, 100(401), 464-477.
Arora, R. (1985). Involvement: Its measurement for retail store research. Journal of the
Academy of Marketing Science, 13(2), 229-241.
Babin, B. J., & Darden, W. R. (1995). Consumer self-regulation in a retail environment.
Journal of Retailing, 71(1), 47-70.
Babin, B. J., Darden, W. R., & Griffin, M. (1994). Work and/or fun: Measuring hedonic
and utilitarian shopping value. Journal of Consumer Research, 20(4), 644-656.
Back, T., Haveron, K., Narasimhan, L., Rauch, S., & Sneader, K. (2005). Winning in a
value-driven world. [Electronic Version]. Retrieved April 23, 2007 from
http://www.mckinsey.com/clientservice/retail/pdf/Winninginavaluedrivenworld.p
df
Bade, R., & Parkin, M. (2007). Foundations of economics. New York: Pearson
Education, Inc.
Barta, S., Martin, J., Frye, J., & Woods, M. (1999). Trends in retail trade [Electronic
Version]. Oklahoma State University, Oklahoma Cooperative Extension Facts
Sheets. Retrieved September 28, 2006 from
http://pods.dasnr.okstate.edu/docushare/dsweb/Get/Document-2492/F-
565web.pdf
Batra, R., & Ahtola, O. T. (1991). Measuring the hedonic and utilitarian sources of
consumer attitudes. Marketing Letters, 2(2), 159-170.
Bell, D. R., Ho, T.-H., & Tang, C. S. (1998). Determining where to shop: Fixed and
variable costs of shopping. Journal of Marketing Research (JMR), 35(3), 352-
369.
Bender, W. C. (1964). Consumer purchase-costs--do retailers recognize them? Journal of
Retailing, 40(1), 1-8.
Bettman, J. R., Luce, M. F., & Payne, J. W. (1998). Constructive consumer choice
processes. The Journal of Consumer Research, 25(3), 187-217.
Blackwell, R. D., Miniard, P. W., & Engel, J. F. (2005). Consumer Behavior (10th ed.).
Mason, OH: South-Western College Publishers.
Boyes, W., & Melvin, M. (2008). Economics (7th ed.). New York: Houghton Mifflin
Company.
Burton, S., Lichtenstein, D. R., Netemeyer, R. G., & Garretson, J. A. (1998). A scale for
measuring attitude toward private label products and an examination of its
psychological and behavioral correlates. Journal of the Academy of Marketing
Science, 26(4), 293-306.
Buy reliable, fix smart. (2002). Consumer Reports Buying Guide, 325.
Byrne, B. M. (2001). Structural equation modeling with AMOS: Basic concepts,
applications, and programming. London: Lawrence Erlbaum Associates.
163
Carsky, M. L., & Dickinson, R. (1995). Toward consumer efficiency: A model for
improved buymanship. Journal of Consumer Affairs, 29(2), 442-459.
Churchill, G. A., Jr. (1979). A paradigm for developing better measures of marketing
constructs. Journal of Marketing Research 16(1), 64-73.
Clark, P. W., Martin, C. A., & Bush, A. J. (2001). The effect of role model influence on
adolescents' materialism and marketplace knowledge. Journal of Marketing
Theory & Practice, 9(4), 27-36.
Cobanoglu, C., Warde, B., & Moreo, P. J. (2001). A comparison of mail, fax and web-
based survey methods. International Journal of Market Research, 43(4), 441-452.
Cochrane, W. W., & Bell, C. S. (1956). The economics of consumption: economics of
decision making in the household. New York: McGraw-Hill
Coupey, E. (1994). Restructuring: Constructive processing of information displays in
consumer choice. The Journal of Consumer Research, 21(1), 83-99.
Coupey, E., Bodur, O., & Brinberg, D. (1998). Predecision processes in consumer choice:
Effects of prior knowledge on aspects of decision structuring. Advances in
Consumer Research, 25(1), 226-232.
Cox, E. P. (1980). The optimal number of response alternatives for a scale: A review.
Journal of Marketing Research (JMR), 17(4), 407-422.
Creswell, J. W. (2003). Research design: Qualitative, quantitative, and mixed methods
approaches (Second ed.). Thousand Oaks: Sage Publications.
Crutsinger, M. (2006, October 13, 2007). Personal savings rate turns negative. The San
Diego Union-Tribune.
Darden, W. R., & Ashton, D. (1974). Psychographic profiles of patronage preference
groups. Journal of Retailing, 50(4), 99.
The delphi method. (n.d.). Retrieved May 30, 2008, from
http://www.iit.edu/~it/delphi.html
Denzin, N. K., & Lincoln, Y. S. (2005). The discipline and practice of qualitative
research. In N. K. Denzin & Y. S. Lincoln (Eds.), Handbook of Qualitative
Research (pp. 1-28). Thousand Oaks, CA: Sage Publications.
Deutskens, E., Jong, A., Ruyter, K., & Wetzels, M. (2006). Comparing the
generalizability of online and mail surveys in cross-national service quality
research. Marketing Letters, 17(2), 119-136.
Dillman, D. A. (2000). Mail and internet surveys: The tailored design method (2nd ed.).
New York: John Wiley & Sons, Inc.
Dodds, W. B., Monroe, K. B., & Grewal, D. (1991). Effects of price, brand, and store
information on buyers' product evaluations. Journal of Marketing Research
(JMR), 28(3), 307-319.
Donthu, N., & Garcia, A. (1999). The internet shopper. Journal of Advertising Research,
39(3), 52-58.
Downs, A. (1961). A theory of consumer efficiency. Journal of Retailing, 37, 6-12.
Drive smart, save money. (2004). Consumer Reports, 69, 7.
e-Rewards North American Consumer Panel [Electronic (2007). Version]. Retrieved
August 13, 2008 from http://www.e-
rewards.com/researchers/downloads/US_Consumer_Panels.pdf.
164
Eastlick, M. A., & Feinberg, R. A. (1999). Shopping motives for mail catalog shopping.
Journal of Business Research, 45(3), 281-290.
Fern, E. F. (2001). Advanced focus group research. Thousand Oaks: Sage Publications.
Fornell, C., & Larcker, D. F. (1981). Evaluating structural equation models with
unobservable variables and measurement error. Journal of Marketing Research,
18(1), 39-50.
Frank, R., Mihas, E., Narasimhan, L., & Rauch, S. (2003). Competing in a value-driven
world [Electronic Version]. Retrieved March 30, 2006 from
http://www.mckinsey.com/practices/retail/knowledge/articles/competinginavalued
rivenworld.pdf.
Garland, R. (1991). The mid-point on a rating scale: Is it desirable? Marketing Bulletin,
2, 66-70.
Garretson, J. A., & Burton, S. (2003). Highly coupon and sale prone consumers: Benefits
beyond price savings. Journal of Advertising Research, 43(2), 162-172.
Gibbs, A. (1997). Focus groups [Electronic Version]. Social Research Update, Winter
from http://sru.soc.surrey.ac.uk/SRU19.html.
Griffin, M., Babin, B. J., & Modianos, D. (2000). Shopping values of Russian consumers:
The impact of habituation in a developing economy. Journal of Retailing, 76(1),
33-52.
Gross, K., & Stone, J. (2002). Dress smart men: Wardrobes that win in the new
workplace (Chic Simple). New York: Warner Books.
Hair, J. F., Jr., Anderson, R. E., Tatham, R. L., & William, C. B. (1995). Multivariate
data analysis with readings (4th ed.). Englewood Cliffs: Prentice Hall.
Hall, A. L., & Rist, R. C. (1999). Integrating multiple qualitative research methods (or
avoiding the precariousness of a one-legged stool). Psychology & Marketing,
16(4), 291-304.
Hamilton-Wright, K. J. (2007, May). Are you a smart and happy shopper? Black
Enterprise, 37, 129.
Hansen, F. (1972). Consumer choice behavior. New York: The Free Press.
Hirschman, E. C., & Holbrook, M. B. (1982). Hedonic consumption: Emerging concepts,
methods and propositions. Journal of Marketing, 46(3), 92-101.
Holbrook, M. B., & Hirschman, E. C. (1982). The experiential aspects of consumption:
Consumer fantasies, feelings, and fun. Journal of Consumer Research, 9(2), 132.
Ingene, C. A. (1984). Productivity and functional shifting in spatial retailing: Private and
social perspectives. Journal of Retailing, 60(3), 15-36.
Jin, B., & Sternquist, B. (2004). Shopping is truly a joy. Service Industries Journal,
24(6), 1-18.
Kahneman, D. (2000). New challenges to the rationality assumption. In D. Kahneman &
A. Tversky (Eds.), Choices, values, and frames (pp. 758-774). New York: Russell
Sage Foundation.
Keeney, R. L. (1999). The value of internet commerce to the customer. Management
Science, 45(4), 533-542.
Kerlinger, F. N., & Lee, H. B. (2000). Foundations of behavioral research (4th ed.). Fort
Worth, TX: Harcourt College Publishers.
165
Kim, Y.-K., & Kang, J. K. (1997). Consumer perception of shopping costs and its
relationship with retail trends. Journal of Shopping Center Research, 4(2), 27-62.
Kim, Y.-K., Sullivan, P., & Forney, J. C. (2007). Experiential retailing: Concepts and
strategies that sell. New York: Fairchild Publications, Inc.
Kleijnen, M., de Ruyter, K., & Wetzels, M. (2007). An assessment of value creation in
mobile service delivery and the moderating role of time consciousness. Journal of
Retailing, 83(1), 33-46.
Koch, D. (2005). The rising dollar. Retail Traffic, 34(5), 72-78.
Krueger, R. A. (1994). Focus groups: A practical guide for applied research. Thousand
Oaks, CA: Sage Publications.
Lichtenstein, D. R., Ridgway, N. M., & Netemeyer, R. G. (1993). Price perceptions and
consumer shopping behavior: A field study. Journal of Marketing Research
(JMR), 30(2), 234-245.
Low prices, treasure hunts build dollar empire. (2003). DSN Retailing Today, 42(22), 23-
24.
Mano, H., & Elliott, M. T. (1997). Smart shopping: The origins and consequences of
price savings. Paper presented at the Advances in Consumer Research, Provo,
UT.
Mathwick, C., Malhotra, N., & Rigdon, E. (2001). Experiential value: conceptualization,
measurement and application in the catalog and Internet shopping environment.
Journal of Retailing, 77(1), 39-56.
McCracken, G. (1988). The long interview. London: Sage Publications.
Morgan, D. L. (1988). Focus groups as qualitative research. Newbury Park: Sage
Publications.
Morgan, D. L., & Spanish, M. T. (1984). Focus groups: A new tool for qualitative
research. Qualitative Sociology, 7(3), 253-270.
Morrison, M., Haley, E., Sheehan, K., & Taylor, R. (2002). Using qualitative research in
advertising. Thousand Oaks, CA: Sage.
Murphy, P. E., & Enis, B. M. (1986). Classifying products strategically. Journal of
Marketing, 50(3), 24-42.
Noble, S. M., Griffith, D. A., & Adjei, M. T. (2006). Drivers of local merchant loyalty:
Understanding the influence of gender and shopping motives. Journal of
Retailing, 82(3), 177-188.
NOT your typical magazine. (2007). Shop Smart, August/September.
Payne, A., & Holt, S. (2001). Diagnosing customer value: Integrating the value process
and relationship marketing. British Journal of Management, 12(2), 159-182.
Peter, J. P. (1979). Reliability: A review of psychometric basics and recent marketing
practices. Journal of Marketing Research, 16(1), 6-17.
Peter, J. P. (1981). Construct validity: A review of basic issues and marketing practices.
Journal of Marketing Research, 18(2), 133-145.
Pine, B. J., II, & Gilmore, J. H. (1999). The experience economy. Boston: Harvard
Business School Press.
Poloian, L. (2003). Retailing principles. New York: Fairchild Publications.
166
Putrevu, S., & Ratchford, B. T. (1997). A model of search behavior with an application to
grocery shopping. Journal of Retailing, 73(4), 463-486.
Reynolds, K. E., Ganesh, J., & Luckett, M. (2002). Traditional malls vs. factory outlets:
comparing shopper typologies and implications for retail strategy. Journal of
Business Research, 55(9), 687-696.
Schindler, R. M. (1989). The excitement of getting a bargain: Some hypotheses
concerning the origins and effects of smart-shopper feelings. Paper presented at
the Advances in Consumer Research, Provo, UT.
Schindler, R. M. (1998). Consequences of perceiving oneself as responsible for obtaining
a discount: Evidence for smart-shopper feelings. Journal of Consumer
Psychology, 7(4), 371-392.
Schmitt, B. (1999). Experiential marketing. Journal of Marketing Management, 15(1-3),
53-67.
Sherry, J. F., McGrath, M. A., & Levy, S. J. (1993). The dark side of the gift. Journal of
Business Research, 28(3), 225-244.
Shimp, T. A., & Kavas, A. (1984). The theory of reasoned action applied to coupon
usage. Journal of Consumer Research, 11(3), 795-809.
Silverstein, M. J. (2006). Treasure hunt: Inside the mind of the new consumer. New
York: The Penguin Group.
Silverstein, M. J., & Roche, C. (2006). Cheap is good (Geiz ist geil) [Electronic Version]
from http://www.bcg.com/publications/files/Cheap_Is_Good_May06.pdf.
Solomon, M. R. (2002). Consumer behavior: buying, having, and being (5th ed.). Upper
Saddle River: Prentice-Hall, Inc.
Sproles, G. B., & Kendall, E. L. (1986). A methodology for profiling consumers'
decision-making styles. Journal of Consumer Affairs, 20(2), 267.
Stiglitz, J. E. (1997). Principles of microeconomics (2nd ed.). New York: W.W. Norton
& Company, Inc.
Stone, G. P. (1954). City shoppers and urban identification: observations on the social
psychology of city life. American Journal of Sociology, 36-45.
Strauss, A., & Corbin, J. (1998). Basics of qualitative research: Techniques and
procedures for developing grounded theory (Second ed.). Thousand Oaks: Sage
Publications.
Sweeney, J. C., & Soutar, G. N. (2001). Consumer perceived value: The development of
a multiple item scale. Journal of Retailing, 77(2), 203-220.
Swinyard, W. R. (1997). Retailing trends in the USA: Competition, consumers,
technology and the economy. International Journal of Retail & Distribution
Management, 25(8), 244-255.
Tauber, E. M. (1972). Why do people shop? Journal of Marketing, 36(4), 46-49.
Taylor, R. E. (1994). Qualitative Research. In M. W. Singletary (Ed.), Mass
communication research: Contemporary methods and applications (pp. 265-279).
New York: Longman.
U.S. Census Bureau American Community Survey. (2006). Retrieved June 24, 2008,
from
167
http://factfinder.census.gov/servlet/DatasetMainPageServlet?_program=ACS&_s
ubmenuId=&_lang=en&_ts=
Viswanathan, M., Sudman, S., & Johnson, M. (2004). Maximum versus meaningful
discrimination in scale response: Implications for validity of measurement of
consumer perceptions about products. Journal of Business Research, 57(2), 108-
124.
Wallner, A., & Matisic, K. (2005). The shopping bag: Tips, tricks and information to
make you a savvy shopper. New York: Dutton.
Westbrook, R. A., & Black, W. C. (1985). A motivation-based shopper typology. Journal
of Retailing, 61(1), 78.
Westbrook, R. A., & Oliver, R. L. (1991). The dimensionality of consumption emotion
patterns and consumer satisfaction. Journal of Consumer Research, 18(1), 84-91.
Zeithaml, V. A. (1988). Consumer perceptions of price, quality, and value: A means-end
model and synthesis of evidence. Journal of Marketing, 52(3), 2-22.
Zikmund, W. G. (2003). Essentials of marketing research (2nd ed.). Mason, OH: South-
Western.

168
APPENDICES
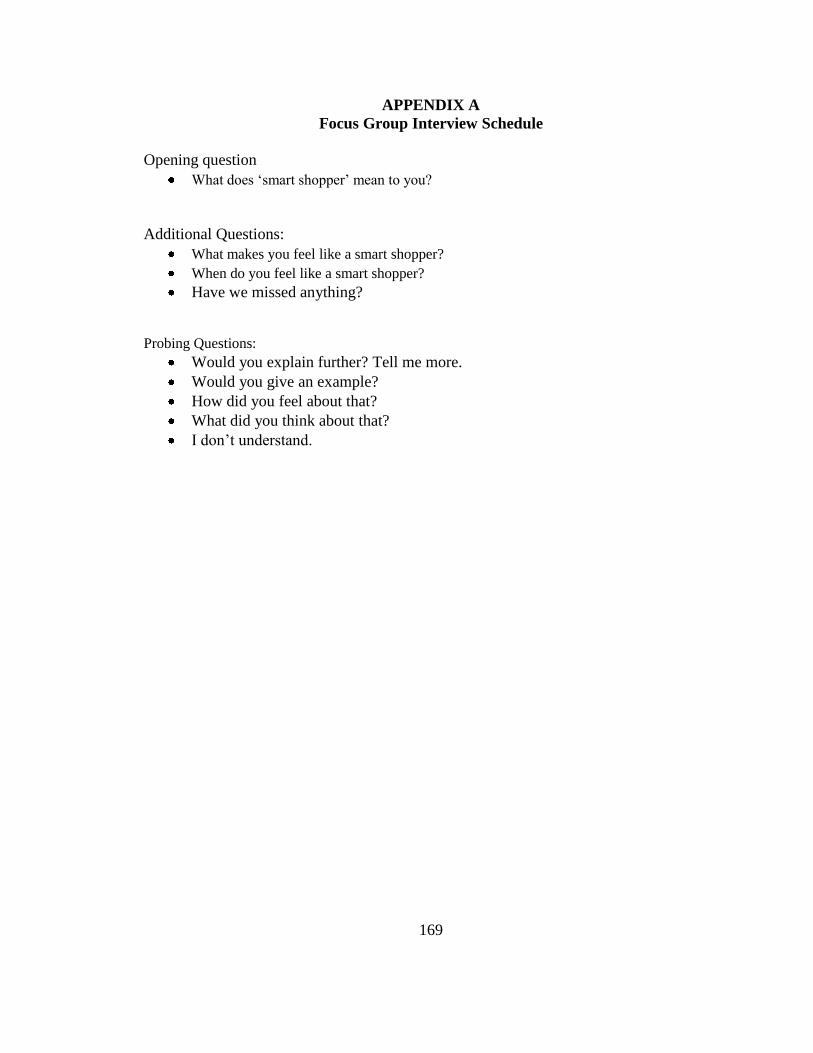
169
APPENDIX A
Focus Group Interview Schedule
Opening question
What does „smart shopper‟ mean to you?
Additional Questions:
What makes you feel like a smart shopper?
When do you feel like a smart shopper?
Have we missed anything?
Probing Questions:
Would you explain further? Tell me more.
Would you give an example?
How did you feel about that?
What did you think about that?
I don‟t understand.
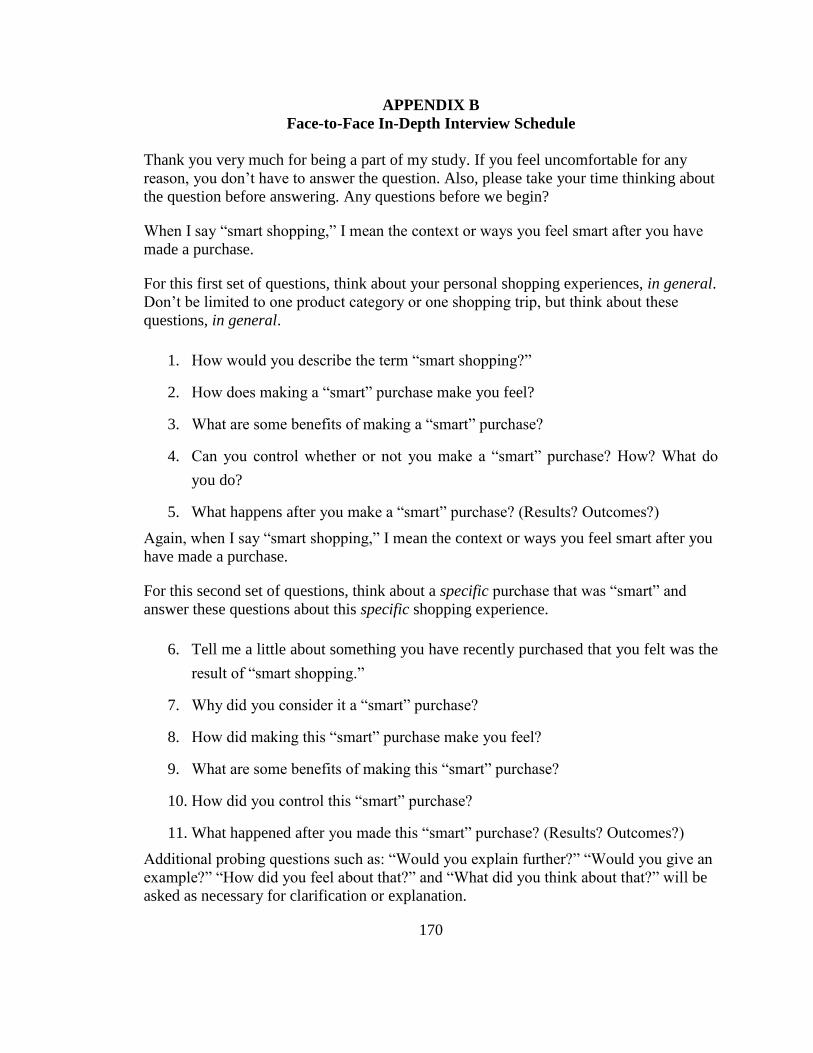
170
APPENDIX B
Face-to-Face In-Depth Interview Schedule
Thank you very much for being a part of my study. If you feel uncomfortable for any
reason, you don‟t have to answer the question. Also, please take your time thinking about
the question before answering. Any questions before we begin?
When I say “smart shopping,” I mean the context or ways you feel smart after you have
made a purchase.
For this first set of questions, think about your personal shopping experiences, in general.
Don‟t be limited to one product category or one shopping trip, but think about these
questions, in general.
1. How would you describe the term “smart shopping?”
2. How does making a “smart” purchase make you feel?
3. What are some benefits of making a “smart” purchase?
4. Can you control whether or not you make a “smart” purchase? How? What do
you do?
5. What happens after you make a “smart” purchase? (Results? Outcomes?)
Again, when I say “smart shopping,” I mean the context or ways you feel smart after you
have made a purchase.
For this second set of questions, think about a specific purchase that was “smart” and
answer these questions about this specific shopping experience.
6. Tell me a little about something you have recently purchased that you felt was the
result of “smart shopping.”
7. Why did you consider it a “smart” purchase?
8. How did making this “smart” purchase make you feel?
9. What are some benefits of making this “smart” purchase?
10. How did you control this “smart” purchase?
11. What happened after you made this “smart” purchase? (Results? Outcomes?)
Additional probing questions such as: “Would you explain further?” “Would you give an
example?” “How did you feel about that?” and “What did you think about that?” will be
asked as necessary for clarification or explanation.
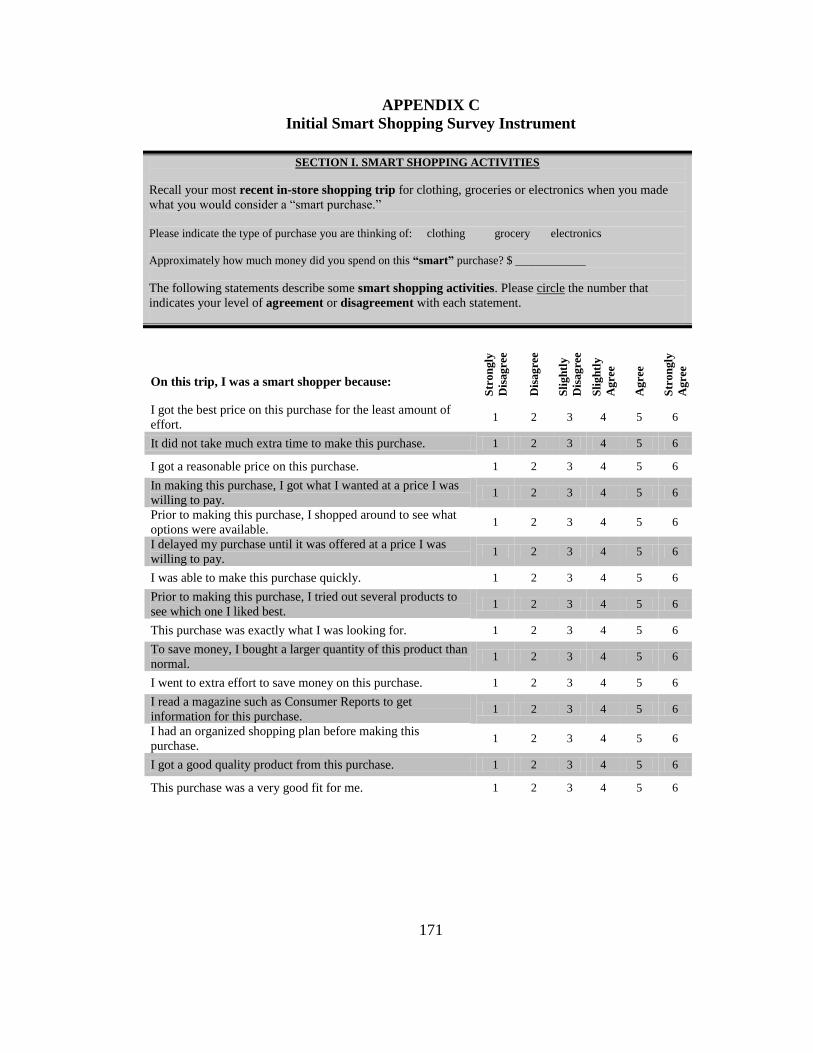
171
APPENDIX C
Initial Smart Shopping Survey Instrument
SECTION I. SMART SHOPPING ACTIVITIES
Recall your most recent in-store shopping trip for clothing, groceries or electronics when you made
what you would consider a “smart purchase.”
Please indicate the type of purchase you are thinking of: clothing grocery electronics
Approximately how much money did you spend on this “smart” purchase? $ ____________
The following statements describe some smart shopping activities. Please circle the number that
indicates your level of agreement or disagreement with each statement.
On this trip, I was a smart shopper because: S
tro
ngly
Dis
ag
ree
Dis
ag
ree
Sli
gh
tly
Dis
ag
ree
Sli
gh
tly
Ag
ree
Ag
ree
Str
on
gly
Ag
ree
I got the best price on this purchase for the least amount of
effort. 1 2 3 4 5 6
It did not take much extra time to make this purchase. 1 2 3 4 5 6
I got a reasonable price on this purchase. 1 2 3 4 5 6
In making this purchase, I got what I wanted at a price I was
willing to pay. 1 2 3 4 5 6
Prior to making this purchase, I shopped around to see what
options were available. 1 2 3 4 5 6
I delayed my purchase until it was offered at a price I was
willing to pay. 1 2 3 4 5 6
I was able to make this purchase quickly. 1 2 3 4 5 6
Prior to making this purchase, I tried out several products to
see which one I liked best. 1 2 3 4 5 6
This purchase was exactly what I was looking for. 1 2 3 4 5 6
To save money, I bought a larger quantity of this product than
normal. 1 2 3 4 5 6
I went to extra effort to save money on this purchase. 1 2 3 4 5 6
I read a magazine such as Consumer Reports to get
information for this purchase. 1 2 3 4 5 6
I had an organized shopping plan before making this
purchase. 1 2 3 4 5 6
I got a good quality product from this purchase. 1 2 3 4 5 6
This purchase was a very good fit for me. 1 2 3 4 5 6
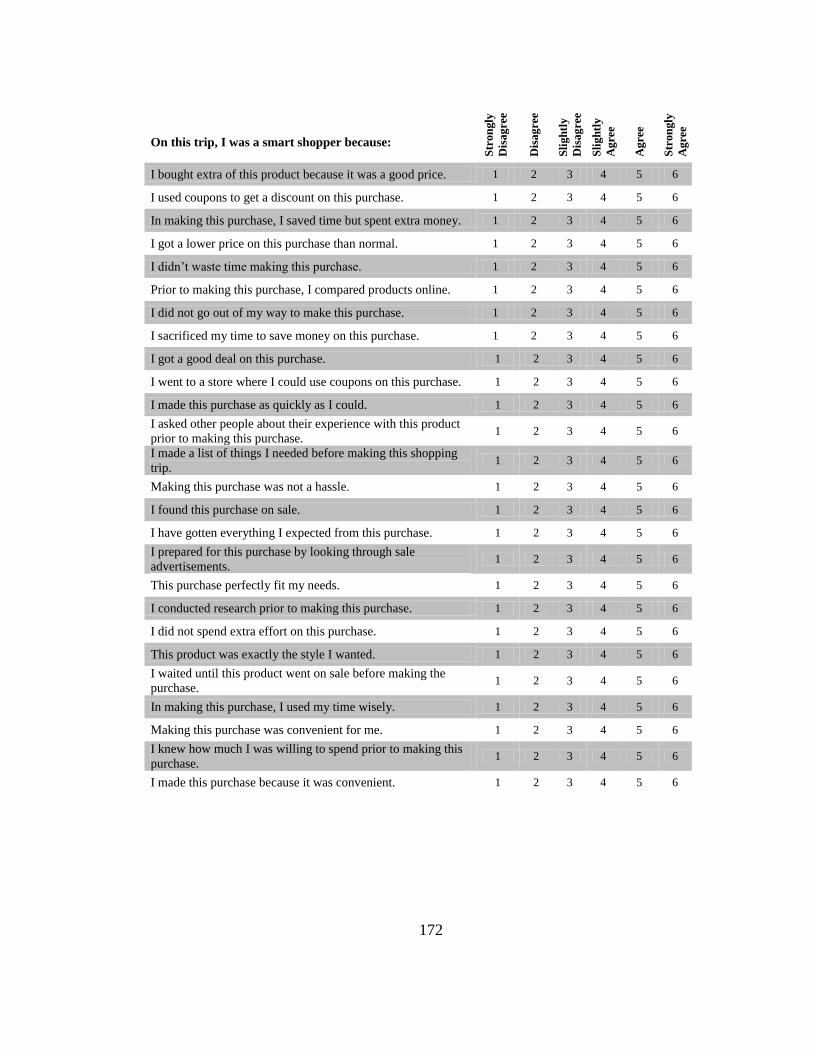
172
On this trip, I was a smart shopper because: S
tro
ngly
Dis
ag
ree
Dis
ag
ree
Sli
gh
tly
Dis
ag
ree
Sli
gh
tly
Ag
ree
Ag
ree
Str
on
gly
Ag
ree
I bought extra of this product because it was a good price. 1 2 3 4 5 6
I used coupons to get a discount on this purchase. 1 2 3 4 5 6
In making this purchase, I saved time but spent extra money. 1 2 3 4 5 6
I got a lower price on this purchase than normal. 1 2 3 4 5 6
I didn‟t waste time making this purchase. 1 2 3 4 5 6
Prior to making this purchase, I compared products online. 1 2 3 4 5 6
I did not go out of my way to make this purchase. 1 2 3 4 5 6
I sacrificed my time to save money on this purchase. 1 2 3 4 5 6
I got a good deal on this purchase. 1 2 3 4 5 6
I went to a store where I could use coupons on this purchase. 1 2 3 4 5 6
I made this purchase as quickly as I could. 1 2 3 4 5 6
I asked other people about their experience with this product
prior to making this purchase. 1 2 3 4 5 6
I made a list of things I needed before making this shopping
trip. 1 2 3 4 5 6
Making this purchase was not a hassle. 1 2 3 4 5 6
I found this purchase on sale. 1 2 3 4 5 6
I have gotten everything I expected from this purchase. 1 2 3 4 5 6
I prepared for this purchase by looking through sale
advertisements. 1 2 3 4 5 6
This purchase perfectly fit my needs. 1 2 3 4 5 6
I conducted research prior to making this purchase. 1 2 3 4 5 6
I did not spend extra effort on this purchase. 1 2 3 4 5 6
This product was exactly the style I wanted. 1 2 3 4 5 6
I waited until this product went on sale before making the
purchase. 1 2 3 4 5 6
In making this purchase, I used my time wisely. 1 2 3 4 5 6
Making this purchase was convenient for me. 1 2 3 4 5 6
I knew how much I was willing to spend prior to making this
purchase. 1 2 3 4 5 6
I made this purchase because it was convenient. 1 2 3 4 5 6
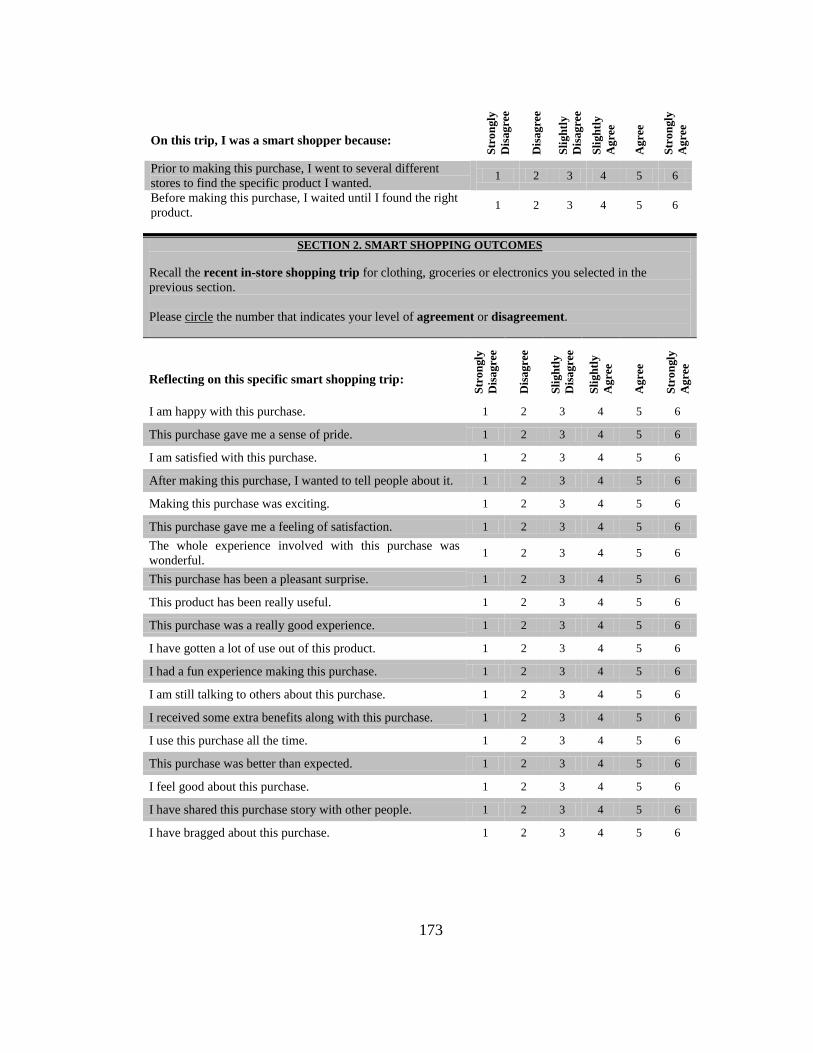
173
On this trip, I was a smart shopper because: S
tron
gly
Dis
agre
e
Dis
agre
e
Sli
gh
tly
Dis
agre
e
Sli
gh
tly
Agre
e
Agre
e
Str
on
gly
Agre
e
Prior to making this purchase, I went to several different
stores to find the specific product I wanted. 1 2 3 4 5 6
Before making this purchase, I waited until I found the right
product. 1 2 3 4 5 6
SECTION 2. SMART SHOPPING OUTCOMES
Recall the recent in-store shopping trip for clothing, groceries or electronics you selected in the
previous section.
Please circle the number that indicates your level of agreement or disagreement.
Reflecting on this specific smart shopping trip: S
tron
gly
Dis
agre
e
Dis
agre
e
Sli
gh
tly
Dis
agre
e
Sli
gh
tly
Agre
e
Agre
e
Str
on
gly
Agre
e
I am happy with this purchase. 1 2 3 4 5 6
This purchase gave me a sense of pride. 1 2 3 4 5 6
I am satisfied with this purchase. 1 2 3 4 5 6
After making this purchase, I wanted to tell people about it. 1 2 3 4 5 6
Making this purchase was exciting. 1 2 3 4 5 6
This purchase gave me a feeling of satisfaction. 1 2 3 4 5 6
The whole experience involved with this purchase was
wonderful. 1 2 3 4 5 6
This purchase has been a pleasant surprise. 1 2 3 4 5 6
This product has been really useful. 1 2 3 4 5 6
This purchase was a really good experience. 1 2 3 4 5 6
I have gotten a lot of use out of this product. 1 2 3 4 5 6
I had a fun experience making this purchase. 1 2 3 4 5 6
I am still talking to others about this purchase. 1 2 3 4 5 6
I received some extra benefits along with this purchase. 1 2 3 4 5 6
I use this purchase all the time. 1 2 3 4 5 6
This purchase was better than expected. 1 2 3 4 5 6
I feel good about this purchase. 1 2 3 4 5 6
I have shared this purchase story with other people. 1 2 3 4 5 6
I have bragged about this purchase. 1 2 3 4 5 6
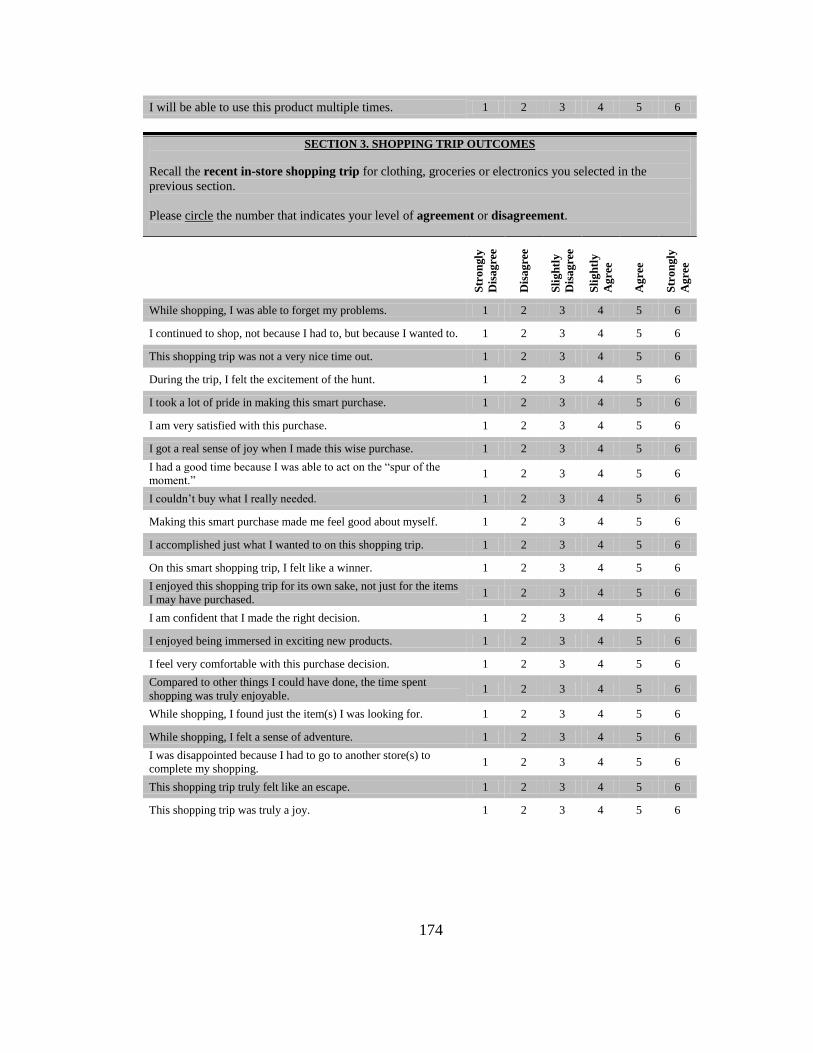
174
I will be able to use this product multiple times. 1 2 3 4 5 6
SECTION 3. SHOPPING TRIP OUTCOMES
Recall the recent in-store shopping trip for clothing, groceries or electronics you selected in the
previous section.
Please circle the number that indicates your level of agreement or disagreement.
Str
on
gly
Dis
ag
ree
Dis
ag
ree
Sli
gh
tly
Dis
ag
ree
Sli
gh
tly
Ag
ree
Ag
ree
Str
on
gly
Ag
ree
While shopping, I was able to forget my problems. 1 2 3 4 5 6
I continued to shop, not because I had to, but because I wanted to. 1 2 3 4 5 6
This shopping trip was not a very nice time out. 1 2 3 4 5 6
During the trip, I felt the excitement of the hunt. 1 2 3 4 5 6
I took a lot of pride in making this smart purchase. 1 2 3 4 5 6
I am very satisfied with this purchase. 1 2 3 4 5 6
I got a real sense of joy when I made this wise purchase. 1 2 3 4 5 6
I had a good time because I was able to act on the “spur of the
moment.” 1 2 3 4 5 6
I couldn‟t buy what I really needed. 1 2 3 4 5 6
Making this smart purchase made me feel good about myself. 1 2 3 4 5 6
I accomplished just what I wanted to on this shopping trip. 1 2 3 4 5 6
On this smart shopping trip, I felt like a winner. 1 2 3 4 5 6
I enjoyed this shopping trip for its own sake, not just for the items
I may have purchased. 1 2 3 4 5 6
I am confident that I made the right decision. 1 2 3 4 5 6
I enjoyed being immersed in exciting new products. 1 2 3 4 5 6
I feel very comfortable with this purchase decision. 1 2 3 4 5 6
Compared to other things I could have done, the time spent
shopping was truly enjoyable. 1 2 3 4 5 6
While shopping, I found just the item(s) I was looking for. 1 2 3 4 5 6
While shopping, I felt a sense of adventure. 1 2 3 4 5 6
I was disappointed because I had to go to another store(s) to
complete my shopping. 1 2 3 4 5 6
This shopping trip truly felt like an escape. 1 2 3 4 5 6
This shopping trip was truly a joy. 1 2 3 4 5 6
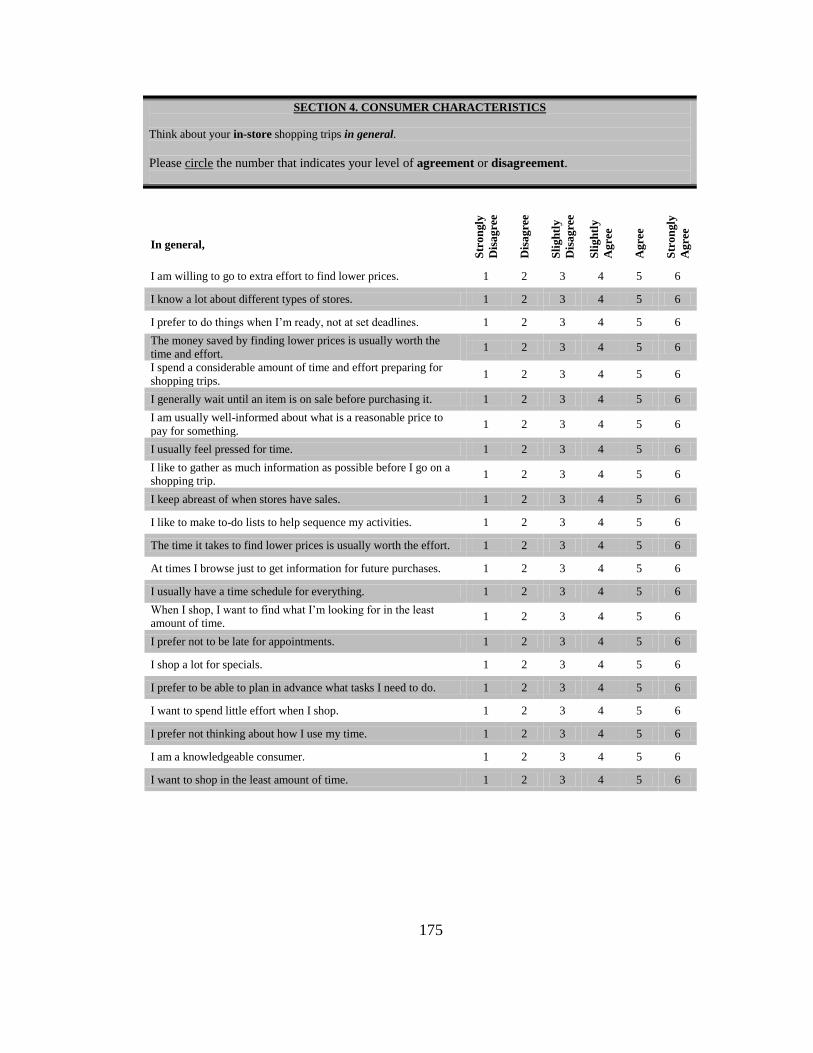
175
SECTION 4. CONSUMER CHARACTERISTICS
Think about your in-store shopping trips in general.
Please circle the number that indicates your level of agreement or disagreement.
In general,
Str
on
gly
Dis
ag
ree
Dis
ag
ree
Sli
gh
tly
Dis
ag
ree
Sli
gh
tly
Ag
ree
Ag
ree
Str
on
gly
Ag
ree
I am willing to go to extra effort to find lower prices. 1 2 3 4 5 6
I know a lot about different types of stores. 1 2 3 4 5 6
I prefer to do things when I‟m ready, not at set deadlines. 1 2 3 4 5 6
The money saved by finding lower prices is usually worth the
time and effort. 1 2 3 4 5 6
I spend a considerable amount of time and effort preparing for
shopping trips. 1 2 3 4 5 6
I generally wait until an item is on sale before purchasing it. 1 2 3 4 5 6
I am usually well-informed about what is a reasonable price to
pay for something. 1 2 3 4 5 6
I usually feel pressed for time. 1 2 3 4 5 6
I like to gather as much information as possible before I go on a
shopping trip. 1 2 3 4 5 6
I keep abreast of when stores have sales. 1 2 3 4 5 6
I like to make to-do lists to help sequence my activities. 1 2 3 4 5 6
The time it takes to find lower prices is usually worth the effort. 1 2 3 4 5 6
At times I browse just to get information for future purchases. 1 2 3 4 5 6
I usually have a time schedule for everything. 1 2 3 4 5 6
When I shop, I want to find what I‟m looking for in the least
amount of time. 1 2 3 4 5 6
I prefer not to be late for appointments. 1 2 3 4 5 6
I shop a lot for specials. 1 2 3 4 5 6
I prefer to be able to plan in advance what tasks I need to do. 1 2 3 4 5 6
I want to spend little effort when I shop. 1 2 3 4 5 6
I prefer not thinking about how I use my time. 1 2 3 4 5 6
I am a knowledgeable consumer. 1 2 3 4 5 6
I want to shop in the least amount of time. 1 2 3 4 5 6

176
In general,
Str
on
gly
Dis
ag
ree
Dis
ag
ree
Sli
gh
tly
Dis
ag
ree
Sli
gh
tly
Ag
ree
Ag
ree
Str
on
gly
Ag
ree
I rarely think about how I‟m using my time. 1 2 3 4 5 6
I often find top quality merchandise at reduced prices. 1 2 3 4 5 6
I often combine tasks to optimally use my time. 1 2 3 4 5 6
SECTION 5. GENERAL INFORMATION
The following questions will be used for description purposes only. Please select the answer that comes closest to
your own.
What is your gender? ___ Male ___ Female
Which of the following best describes your racial or ethnic identification?
___ African American/ Black ___ Caucasion/ White
___ Native American ___ Asian or Pacific Islander
___ Hispanic ___ Other (please specify) _________________
What is your marital status? ___ Married
___ Living in a marriage-like relationship
___ Widowed
___ Separated
___ Divorced
___ Single, never married
What is your age? ____
What is the highest level of education you have completed?
___ High School graduate or less
___ Some college
___ Associate‟s Degree (community college, technical school, two-year college)
___ Bachelor‟s Degree
___ Graduate Degree (Master‟s, Doctoral)
___ Other (please specify) _____________________
Do you work outside of the home? ___Yes- Full-time
___ Yes- Part-time
___ No
___ Retired
What was your approximate total household income last year (before taxes)?
___ Less than $30,000 ___ $30,000-49,999 ___ $50,000-69,999
___ $70,000-89,999 ___ $90,000-109,999 ___ $110,000-129,999
___ $130,000-149,999 ___ $150,000+
How many children under 12 years of age do you have living in your home? _____
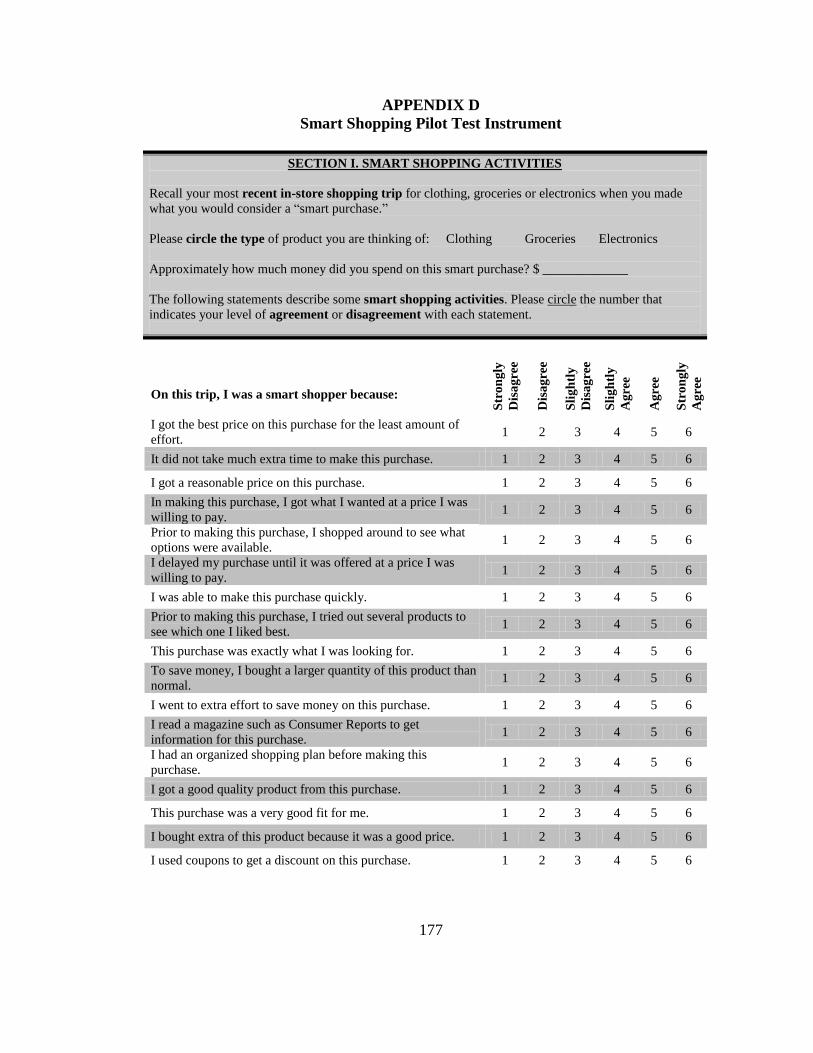
177
APPENDIX D
Smart Shopping Pilot Test Instrument
SECTION I. SMART SHOPPING ACTIVITIES
Recall your most recent in-store shopping trip for clothing, groceries or electronics when you made
what you would consider a “smart purchase.”
Please circle the type of product you are thinking of: Clothing Groceries Electronics
Approximately how much money did you spend on this smart purchase? $ _____________
The following statements describe some smart shopping activities. Please circle the number that
indicates your level of agreement or disagreement with each statement.
On this trip, I was a smart shopper because:
Str
on
gly
Dis
agre
e
Dis
agre
e
Sli
gh
tly
Dis
agre
e
Sli
gh
tly
Agre
e
Agre
e
Str
on
gly
Agre
e
I got the best price on this purchase for the least amount of
effort. 1 2 3 4 5 6
It did not take much extra time to make this purchase. 1 2 3 4 5 6
I got a reasonable price on this purchase. 1 2 3 4 5 6
In making this purchase, I got what I wanted at a price I was
willing to pay. 1 2 3 4 5 6
Prior to making this purchase, I shopped around to see what
options were available. 1 2 3 4 5 6
I delayed my purchase until it was offered at a price I was
willing to pay. 1 2 3 4 5 6
I was able to make this purchase quickly. 1 2 3 4 5 6
Prior to making this purchase, I tried out several products to
see which one I liked best. 1 2 3 4 5 6
This purchase was exactly what I was looking for. 1 2 3 4 5 6
To save money, I bought a larger quantity of this product than
normal. 1 2 3 4 5 6
I went to extra effort to save money on this purchase. 1 2 3 4 5 6
I read a magazine such as Consumer Reports to get
information for this purchase. 1 2 3 4 5 6
I had an organized shopping plan before making this
purchase. 1 2 3 4 5 6
I got a good quality product from this purchase. 1 2 3 4 5 6
This purchase was a very good fit for me. 1 2 3 4 5 6
I bought extra of this product because it was a good price. 1 2 3 4 5 6
I used coupons to get a discount on this purchase. 1 2 3 4 5 6
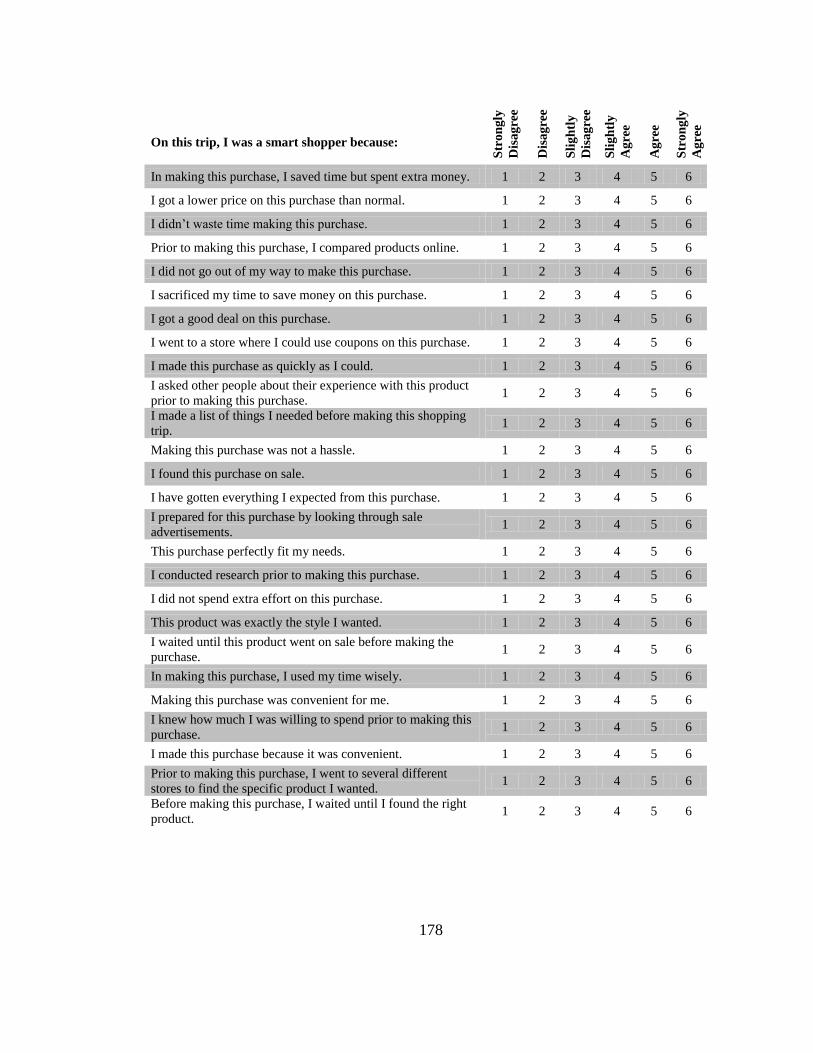
178
On this trip, I was a smart shopper because:
Str
on
gly
Dis
ag
ree
Dis
ag
ree
Sli
gh
tly
Dis
ag
ree
Sli
gh
tly
Ag
ree
Ag
ree
Str
on
gly
Ag
ree
In making this purchase, I saved time but spent extra money. 1 2 3 4 5 6
I got a lower price on this purchase than normal. 1 2 3 4 5 6
I didn‟t waste time making this purchase. 1 2 3 4 5 6
Prior to making this purchase, I compared products online. 1 2 3 4 5 6
I did not go out of my way to make this purchase. 1 2 3 4 5 6
I sacrificed my time to save money on this purchase. 1 2 3 4 5 6
I got a good deal on this purchase. 1 2 3 4 5 6
I went to a store where I could use coupons on this purchase. 1 2 3 4 5 6
I made this purchase as quickly as I could. 1 2 3 4 5 6
I asked other people about their experience with this product
prior to making this purchase. 1 2 3 4 5 6
I made a list of things I needed before making this shopping
trip. 1 2 3 4 5 6
Making this purchase was not a hassle. 1 2 3 4 5 6
I found this purchase on sale. 1 2 3 4 5 6
I have gotten everything I expected from this purchase. 1 2 3 4 5 6
I prepared for this purchase by looking through sale
advertisements. 1 2 3 4 5 6
This purchase perfectly fit my needs. 1 2 3 4 5 6
I conducted research prior to making this purchase. 1 2 3 4 5 6
I did not spend extra effort on this purchase. 1 2 3 4 5 6
This product was exactly the style I wanted. 1 2 3 4 5 6
I waited until this product went on sale before making the
purchase. 1 2 3 4 5 6
In making this purchase, I used my time wisely. 1 2 3 4 5 6
Making this purchase was convenient for me. 1 2 3 4 5 6
I knew how much I was willing to spend prior to making this
purchase. 1 2 3 4 5 6
I made this purchase because it was convenient. 1 2 3 4 5 6
Prior to making this purchase, I went to several different
stores to find the specific product I wanted. 1 2 3 4 5 6
Before making this purchase, I waited until I found the right
product. 1 2 3 4 5 6
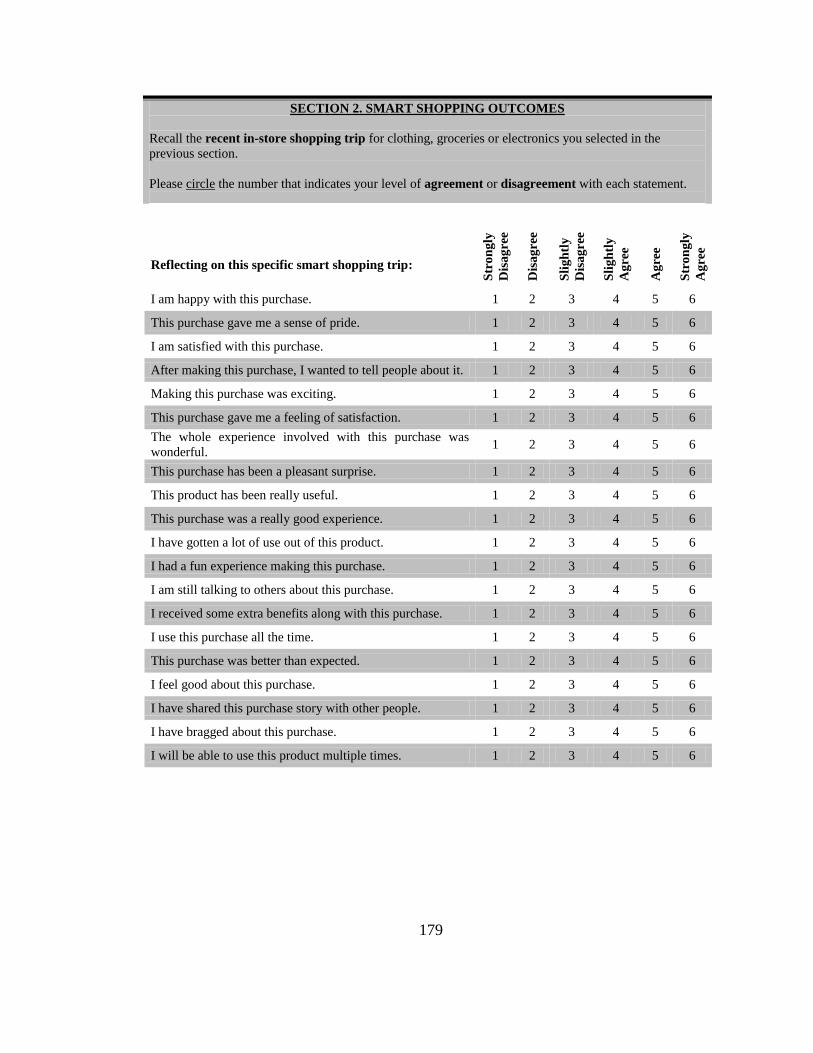
179
SECTION 2. SMART SHOPPING OUTCOMES
Recall the recent in-store shopping trip for clothing, groceries or electronics you selected in the
previous section.
Please circle the number that indicates your level of agreement or disagreement with each statement.
Reflecting on this specific smart shopping trip:
Str
on
gly
Dis
ag
ree
Dis
ag
ree
Sli
gh
tly
Dis
ag
ree
Sli
gh
tly
Ag
ree
Ag
ree
Str
on
gly
Ag
ree
I am happy with this purchase. 1 2 3 4 5 6
This purchase gave me a sense of pride. 1 2 3 4 5 6
I am satisfied with this purchase. 1 2 3 4 5 6
After making this purchase, I wanted to tell people about it. 1 2 3 4 5 6
Making this purchase was exciting. 1 2 3 4 5 6
This purchase gave me a feeling of satisfaction. 1 2 3 4 5 6
The whole experience involved with this purchase was
wonderful. 1 2 3 4 5 6
This purchase has been a pleasant surprise. 1 2 3 4 5 6
This product has been really useful. 1 2 3 4 5 6
This purchase was a really good experience. 1 2 3 4 5 6
I have gotten a lot of use out of this product. 1 2 3 4 5 6
I had a fun experience making this purchase. 1 2 3 4 5 6
I am still talking to others about this purchase. 1 2 3 4 5 6
I received some extra benefits along with this purchase. 1 2 3 4 5 6
I use this purchase all the time. 1 2 3 4 5 6
This purchase was better than expected. 1 2 3 4 5 6
I feel good about this purchase. 1 2 3 4 5 6
I have shared this purchase story with other people. 1 2 3 4 5 6
I have bragged about this purchase. 1 2 3 4 5 6
I will be able to use this product multiple times. 1 2 3 4 5 6
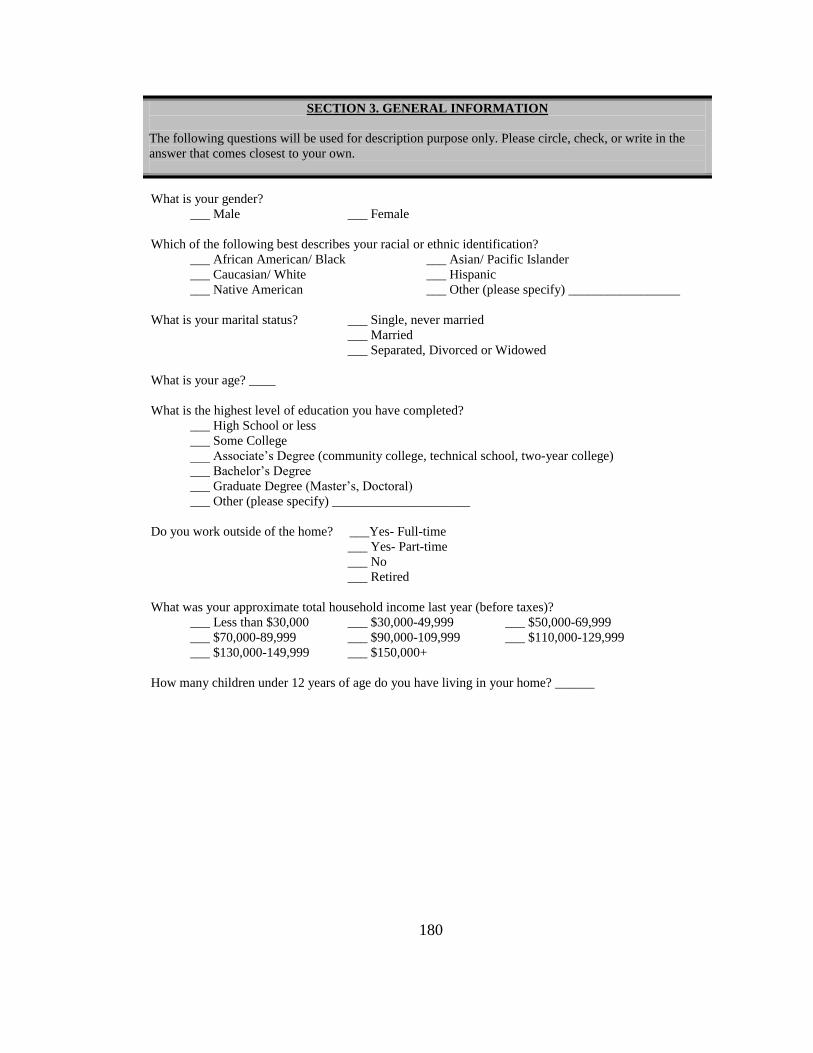
180
SECTION 3. GENERAL INFORMATION
The following questions will be used for description purpose only. Please circle, check, or write in the
answer that comes closest to your own.
What is your gender?
___ Male ___ Female
Which of the following best describes your racial or ethnic identification?
___ African American/ Black ___ Asian/ Pacific Islander
___ Caucasian/ White ___ Hispanic
___ Native American ___ Other (please specify) _________________
What is your marital status? ___ Single, never married
___ Married
___ Separated, Divorced or Widowed
What is your age? ____
What is the highest level of education you have completed?
___ High School or less
___ Some College
___ Associate‟s Degree (community college, technical school, two-year college)
___ Bachelor‟s Degree
___ Graduate Degree (Master‟s, Doctoral)
___ Other (please specify) _____________________
Do you work outside of the home? ___Yes- Full-time
___ Yes- Part-time
___ No
___ Retired
What was your approximate total household income last year (before taxes)?
___ Less than $30,000 ___ $30,000-49,999 ___ $50,000-69,999
___ $70,000-89,999 ___ $90,000-109,999 ___ $110,000-129,999
___ $130,000-149,999 ___ $150,000+
How many children under 12 years of age do you have living in your home? ______
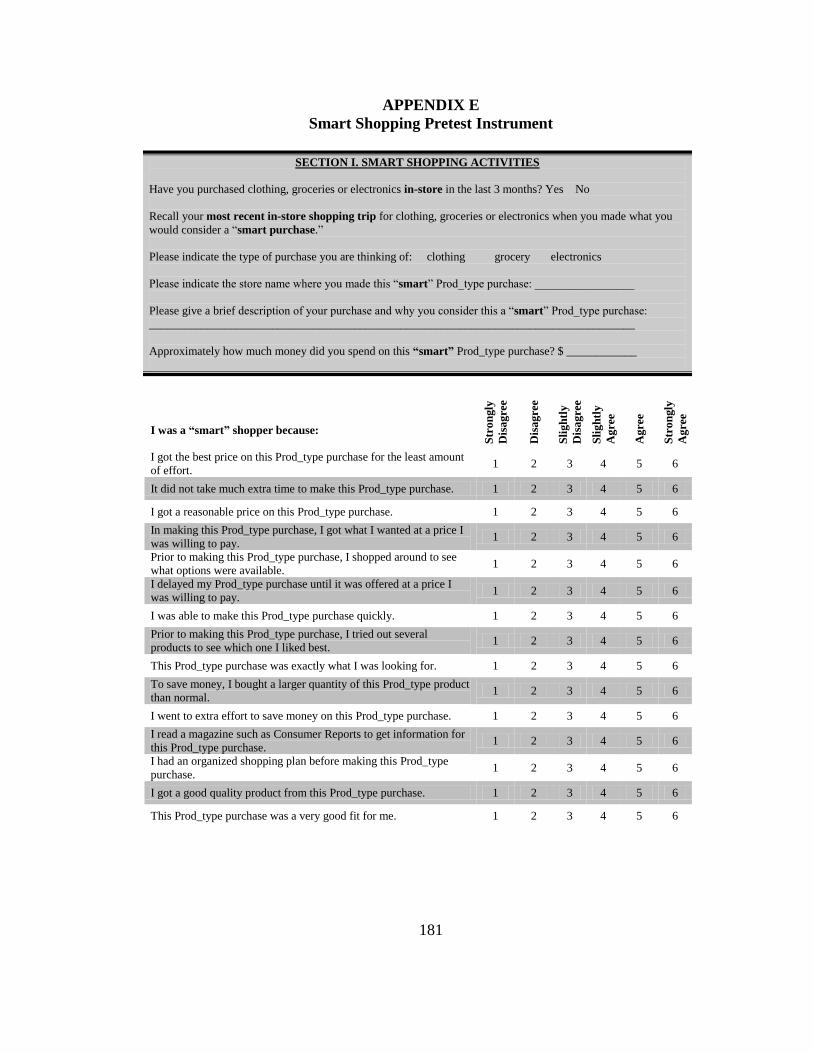
181
APPENDIX E
Smart Shopping Pretest Instrument
SECTION I. SMART SHOPPING ACTIVITIES
Have you purchased clothing, groceries or electronics in-store in the last 3 months? Yes No
Recall your most recent in-store shopping trip for clothing, groceries or electronics when you made what you
would consider a “smart purchase.”
Please indicate the type of purchase you are thinking of: clothing grocery electronics
Please indicate the store name where you made this “smart” Prod_type purchase: _________________
Please give a brief description of your purchase and why you consider this a “smart” Prod_type purchase:
___________________________________________________________________________________
Approximately how much money did you spend on this “smart” Prod_type purchase? $ ____________
I was a “smart” shopper because:
Str
on
gly
Dis
agre
e
Dis
agre
e
Sli
gh
tly
Dis
agre
e
Sli
gh
tly
Agre
e
Agre
e
Str
on
gly
Agre
e
I got the best price on this Prod_type purchase for the least amount
of effort. 1 2 3 4 5 6
It did not take much extra time to make this Prod_type purchase. 1 2 3 4 5 6
I got a reasonable price on this Prod_type purchase. 1 2 3 4 5 6
In making this Prod_type purchase, I got what I wanted at a price I
was willing to pay. 1 2 3 4 5 6
Prior to making this Prod_type purchase, I shopped around to see
what options were available. 1 2 3 4 5 6
I delayed my Prod_type purchase until it was offered at a price I
was willing to pay. 1 2 3 4 5 6
I was able to make this Prod_type purchase quickly. 1 2 3 4 5 6
Prior to making this Prod_type purchase, I tried out several
products to see which one I liked best. 1 2 3 4 5 6
This Prod_type purchase was exactly what I was looking for. 1 2 3 4 5 6
To save money, I bought a larger quantity of this Prod_type product
than normal. 1 2 3 4 5 6
I went to extra effort to save money on this Prod_type purchase. 1 2 3 4 5 6
I read a magazine such as Consumer Reports to get information for
this Prod_type purchase. 1 2 3 4 5 6
I had an organized shopping plan before making this Prod_type
purchase. 1 2 3 4 5 6
I got a good quality product from this Prod_type purchase. 1 2 3 4 5 6
This Prod_type purchase was a very good fit for me. 1 2 3 4 5 6
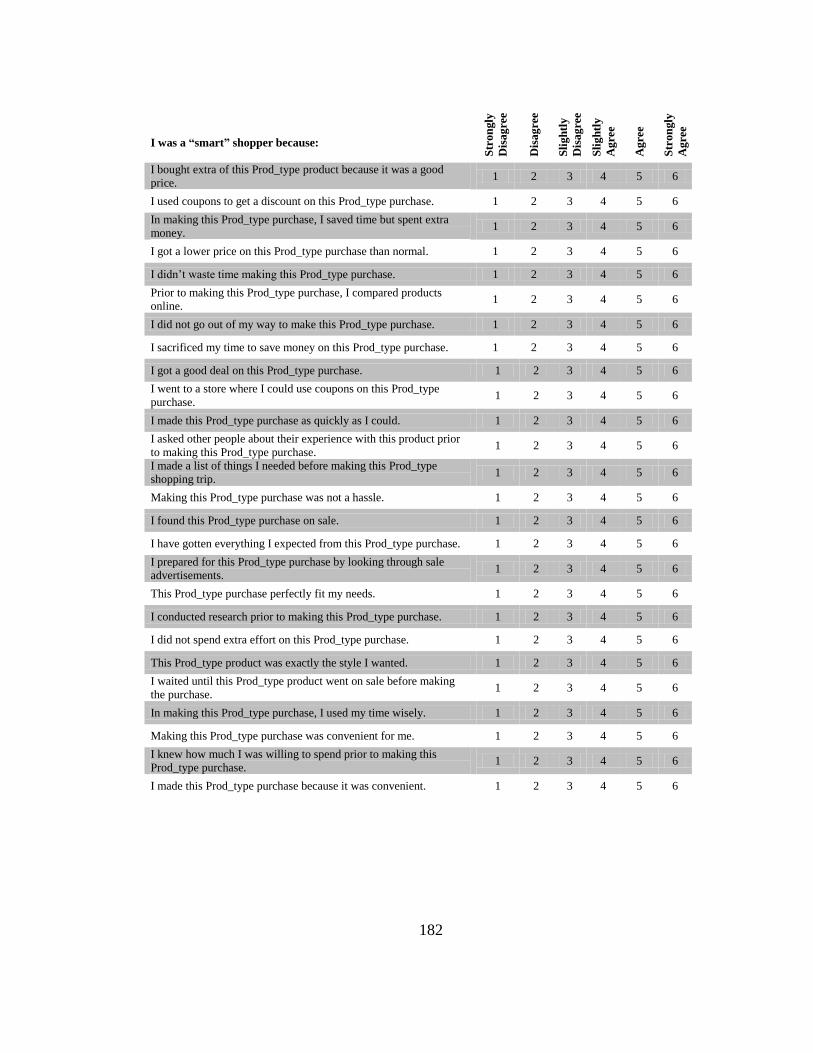
182
I was a “smart” shopper because:
Str
on
gly
Dis
ag
ree
Dis
ag
ree
Sli
gh
tly
Dis
ag
ree
Sli
gh
tly
Agre
e
Agre
e
Str
on
gly
Agre
e
I bought extra of this Prod_type product because it was a good
price. 1 2 3 4 5 6
I used coupons to get a discount on this Prod_type purchase. 1 2 3 4 5 6
In making this Prod_type purchase, I saved time but spent extra
money. 1 2 3 4 5 6
I got a lower price on this Prod_type purchase than normal. 1 2 3 4 5 6
I didn‟t waste time making this Prod_type purchase. 1 2 3 4 5 6
Prior to making this Prod_type purchase, I compared products
online. 1 2 3 4 5 6
I did not go out of my way to make this Prod_type purchase. 1 2 3 4 5 6
I sacrificed my time to save money on this Prod_type purchase. 1 2 3 4 5 6
I got a good deal on this Prod_type purchase. 1 2 3 4 5 6
I went to a store where I could use coupons on this Prod_type
purchase. 1 2 3 4 5 6
I made this Prod_type purchase as quickly as I could. 1 2 3 4 5 6
I asked other people about their experience with this product prior
to making this Prod_type purchase. 1 2 3 4 5 6
I made a list of things I needed before making this Prod_type
shopping trip. 1 2 3 4 5 6
Making this Prod_type purchase was not a hassle. 1 2 3 4 5 6
I found this Prod_type purchase on sale. 1 2 3 4 5 6
I have gotten everything I expected from this Prod_type purchase. 1 2 3 4 5 6
I prepared for this Prod_type purchase by looking through sale
advertisements. 1 2 3 4 5 6
This Prod_type purchase perfectly fit my needs. 1 2 3 4 5 6
I conducted research prior to making this Prod_type purchase. 1 2 3 4 5 6
I did not spend extra effort on this Prod_type purchase. 1 2 3 4 5 6
This Prod_type product was exactly the style I wanted. 1 2 3 4 5 6
I waited until this Prod_type product went on sale before making
the purchase. 1 2 3 4 5 6
In making this Prod_type purchase, I used my time wisely. 1 2 3 4 5 6
Making this Prod_type purchase was convenient for me. 1 2 3 4 5 6
I knew how much I was willing to spend prior to making this
Prod_type purchase. 1 2 3 4 5 6
I made this Prod_type purchase because it was convenient. 1 2 3 4 5 6
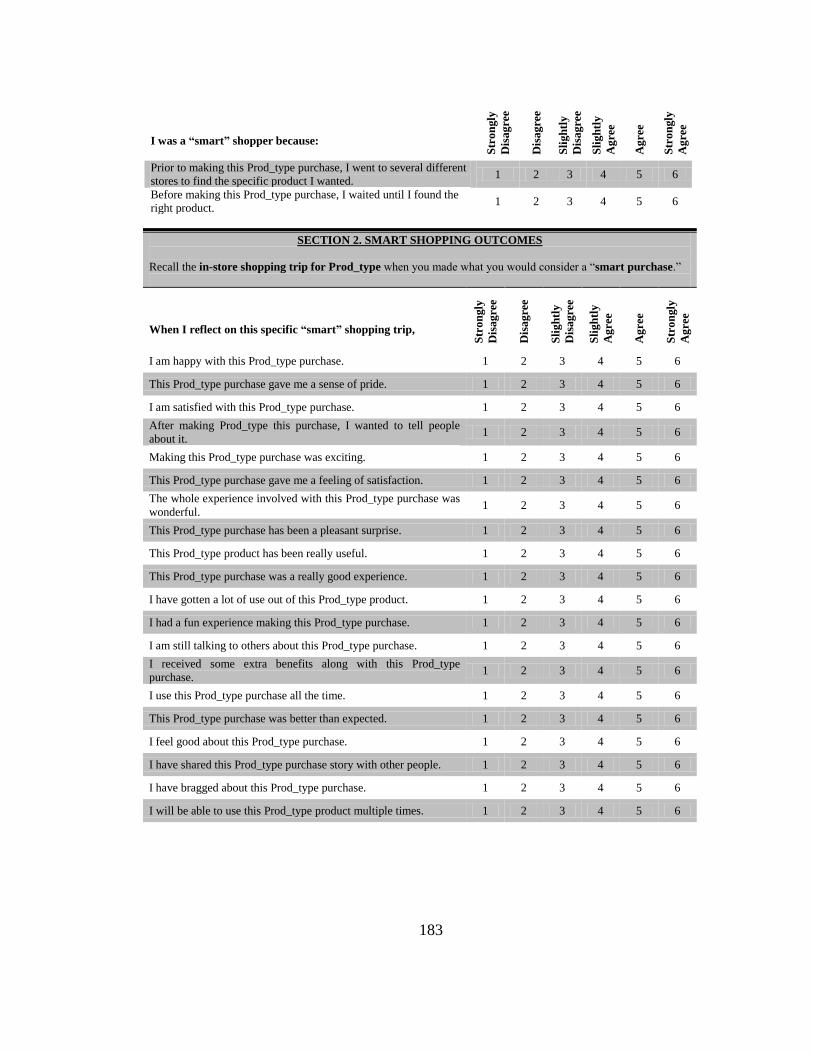
183
I was a “smart” shopper because:
Str
on
gly
Dis
agre
e
Dis
agre
e
Sli
gh
tly
Dis
agre
e
Sli
gh
tly
Agre
e
Agre
e
Str
on
gly
Agre
e
Prior to making this Prod_type purchase, I went to several different
stores to find the specific product I wanted. 1 2 3 4 5 6
Before making this Prod_type purchase, I waited until I found the
right product. 1 2 3 4 5 6
SECTION 2. SMART SHOPPING OUTCOMES
Recall the in-store shopping trip for Prod_type when you made what you would consider a “smart purchase.”
When I reflect on this specific “smart” shopping trip,
Str
on
gly
Dis
agre
e
Dis
agre
e
Sli
gh
tly
Dis
agre
e
Sli
gh
tly
Agre
e
Agre
e
Str
on
gly
Agre
e
I am happy with this Prod_type purchase. 1 2 3 4 5 6
This Prod_type purchase gave me a sense of pride. 1 2 3 4 5 6
I am satisfied with this Prod_type purchase. 1 2 3 4 5 6
After making Prod_type this purchase, I wanted to tell people
about it. 1 2 3 4 5 6
Making this Prod_type purchase was exciting. 1 2 3 4 5 6
This Prod_type purchase gave me a feeling of satisfaction. 1 2 3 4 5 6
The whole experience involved with this Prod_type purchase was
wonderful. 1 2 3 4 5 6
This Prod_type purchase has been a pleasant surprise. 1 2 3 4 5 6
This Prod_type product has been really useful. 1 2 3 4 5 6
This Prod_type purchase was a really good experience. 1 2 3 4 5 6
I have gotten a lot of use out of this Prod_type product. 1 2 3 4 5 6
I had a fun experience making this Prod_type purchase. 1 2 3 4 5 6
I am still talking to others about this Prod_type purchase. 1 2 3 4 5 6
I received some extra benefits along with this Prod_type
purchase. 1 2 3 4 5 6
I use this Prod_type purchase all the time. 1 2 3 4 5 6
This Prod_type purchase was better than expected. 1 2 3 4 5 6
I feel good about this Prod_type purchase. 1 2 3 4 5 6
I have shared this Prod_type purchase story with other people. 1 2 3 4 5 6
I have bragged about this Prod_type purchase. 1 2 3 4 5 6
I will be able to use this Prod_type product multiple times. 1 2 3 4 5 6
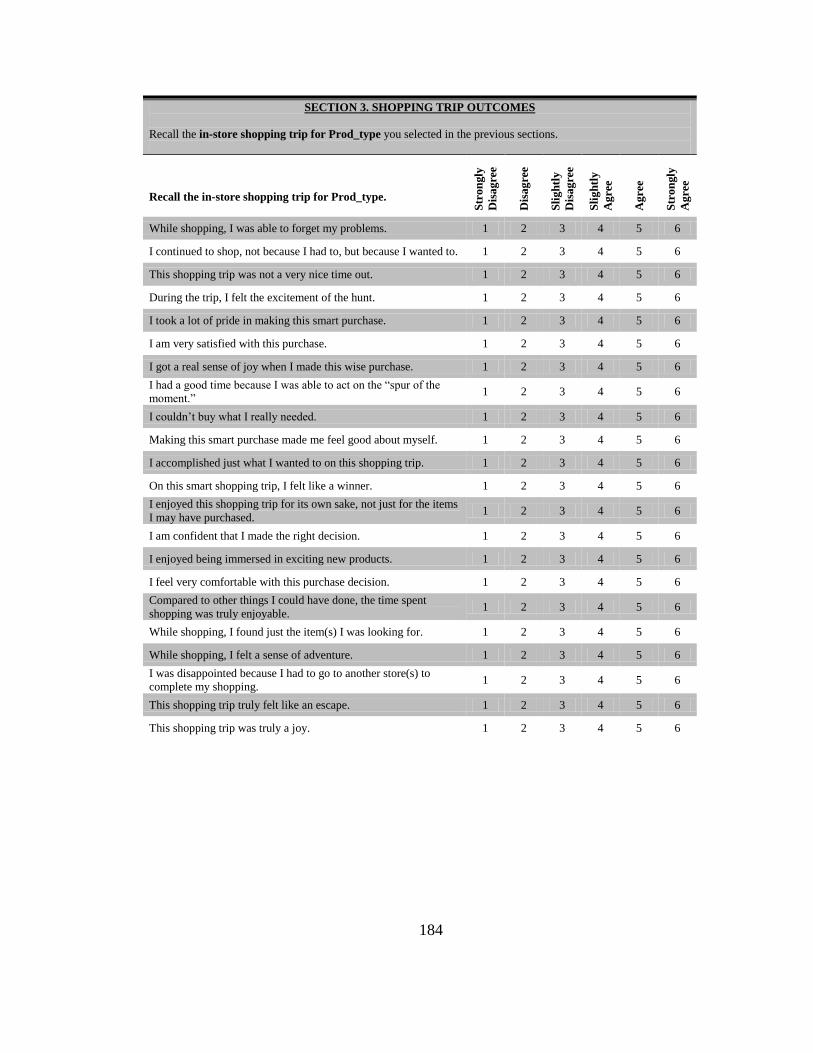
184
SECTION 3. SHOPPING TRIP OUTCOMES
Recall the in-store shopping trip for Prod_type you selected in the previous sections.
Recall the in-store shopping trip for Prod_type.
Str
on
gly
Dis
ag
ree
Dis
ag
ree
Sli
gh
tly
Dis
ag
ree
Sli
gh
tly
Ag
ree
Ag
ree
Str
on
gly
Ag
ree
While shopping, I was able to forget my problems. 1 2 3 4 5 6
I continued to shop, not because I had to, but because I wanted to. 1 2 3 4 5 6
This shopping trip was not a very nice time out. 1 2 3 4 5 6
During the trip, I felt the excitement of the hunt. 1 2 3 4 5 6
I took a lot of pride in making this smart purchase. 1 2 3 4 5 6
I am very satisfied with this purchase. 1 2 3 4 5 6
I got a real sense of joy when I made this wise purchase. 1 2 3 4 5 6
I had a good time because I was able to act on the “spur of the
moment.” 1 2 3 4 5 6
I couldn‟t buy what I really needed. 1 2 3 4 5 6
Making this smart purchase made me feel good about myself. 1 2 3 4 5 6
I accomplished just what I wanted to on this shopping trip. 1 2 3 4 5 6
On this smart shopping trip, I felt like a winner. 1 2 3 4 5 6
I enjoyed this shopping trip for its own sake, not just for the items
I may have purchased. 1 2 3 4 5 6
I am confident that I made the right decision. 1 2 3 4 5 6
I enjoyed being immersed in exciting new products. 1 2 3 4 5 6
I feel very comfortable with this purchase decision. 1 2 3 4 5 6
Compared to other things I could have done, the time spent
shopping was truly enjoyable. 1 2 3 4 5 6
While shopping, I found just the item(s) I was looking for. 1 2 3 4 5 6
While shopping, I felt a sense of adventure. 1 2 3 4 5 6
I was disappointed because I had to go to another store(s) to
complete my shopping. 1 2 3 4 5 6
This shopping trip truly felt like an escape. 1 2 3 4 5 6
This shopping trip was truly a joy. 1 2 3 4 5 6
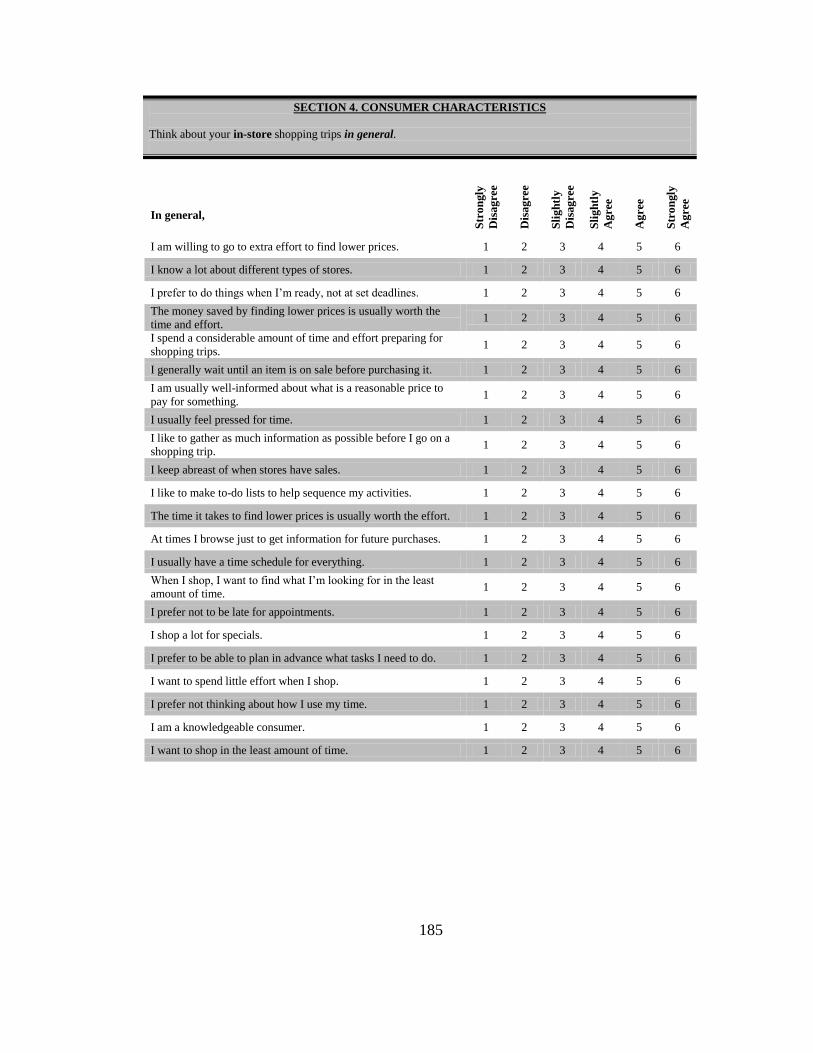
185
SECTION 4. CONSUMER CHARACTERISTICS
Think about your in-store shopping trips in general.
In general,
Str
on
gly
Dis
agre
e
Dis
agre
e
Sli
gh
tly
Dis
agre
e
Sli
gh
tly
Agre
e
Agre
e
Str
on
gly
Agre
e
I am willing to go to extra effort to find lower prices. 1 2 3 4 5 6
I know a lot about different types of stores. 1 2 3 4 5 6
I prefer to do things when I‟m ready, not at set deadlines. 1 2 3 4 5 6
The money saved by finding lower prices is usually worth the
time and effort. 1 2 3 4 5 6
I spend a considerable amount of time and effort preparing for
shopping trips. 1 2 3 4 5 6
I generally wait until an item is on sale before purchasing it. 1 2 3 4 5 6
I am usually well-informed about what is a reasonable price to
pay for something. 1 2 3 4 5 6
I usually feel pressed for time. 1 2 3 4 5 6
I like to gather as much information as possible before I go on a
shopping trip. 1 2 3 4 5 6
I keep abreast of when stores have sales. 1 2 3 4 5 6
I like to make to-do lists to help sequence my activities. 1 2 3 4 5 6
The time it takes to find lower prices is usually worth the effort. 1 2 3 4 5 6
At times I browse just to get information for future purchases. 1 2 3 4 5 6
I usually have a time schedule for everything. 1 2 3 4 5 6
When I shop, I want to find what I‟m looking for in the least
amount of time. 1 2 3 4 5 6
I prefer not to be late for appointments. 1 2 3 4 5 6
I shop a lot for specials. 1 2 3 4 5 6
I prefer to be able to plan in advance what tasks I need to do. 1 2 3 4 5 6
I want to spend little effort when I shop. 1 2 3 4 5 6
I prefer not thinking about how I use my time. 1 2 3 4 5 6
I am a knowledgeable consumer. 1 2 3 4 5 6
I want to shop in the least amount of time. 1 2 3 4 5 6
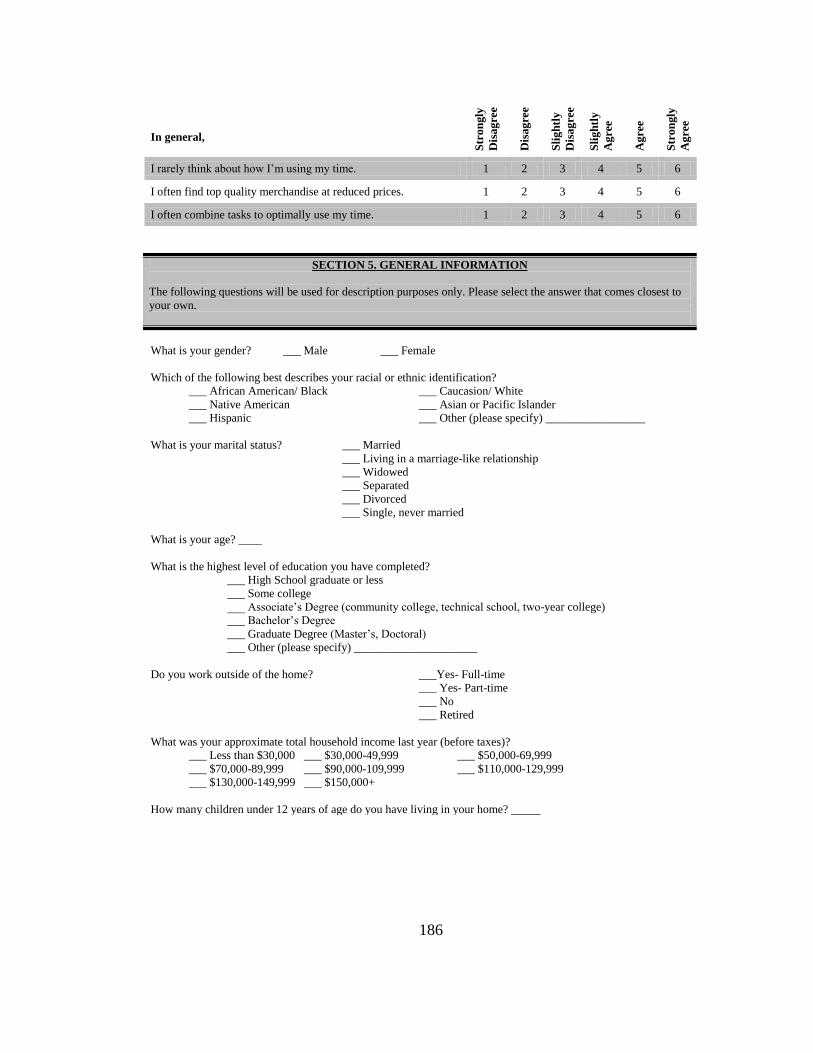
186
I) SS Pre-Test
In general,
Str
on
gly
Dis
ag
ree
Dis
ag
ree
Sli
gh
tly
Dis
ag
ree
Sli
gh
tly
Ag
ree
Ag
ree
Str
on
gly
Ag
ree
I rarely think about how I‟m using my time. 1 2 3 4 5 6
I often find top quality merchandise at reduced prices. 1 2 3 4 5 6
I often combine tasks to optimally use my time. 1 2 3 4 5 6
SECTION 5. GENERAL INFORMATION
The following questions will be used for description purposes only. Please select the answer that comes closest to
your own.
What is your gender? ___ Male ___ Female
Which of the following best describes your racial or ethnic identification?
___ African American/ Black ___ Caucasion/ White
___ Native American ___ Asian or Pacific Islander
___ Hispanic ___ Other (please specify) _________________
What is your marital status? ___ Married
___ Living in a marriage-like relationship
___ Widowed
___ Separated
___ Divorced
___ Single, never married
What is your age? ____
What is the highest level of education you have completed?
___ High School graduate or less
___ Some college
___ Associate‟s Degree (community college, technical school, two-year college)
___ Bachelor‟s Degree
___ Graduate Degree (Master‟s, Doctoral)
___ Other (please specify) _____________________
Do you work outside of the home? ___Yes- Full-time
___ Yes- Part-time
___ No
___ Retired
What was your approximate total household income last year (before taxes)?
___ Less than $30,000 ___ $30,000-49,999 ___ $50,000-69,999
___ $70,000-89,999 ___ $90,000-109,999 ___ $110,000-129,999
___ $130,000-149,999 ___ $150,000+
How many children under 12 years of age do you have living in your home? _____
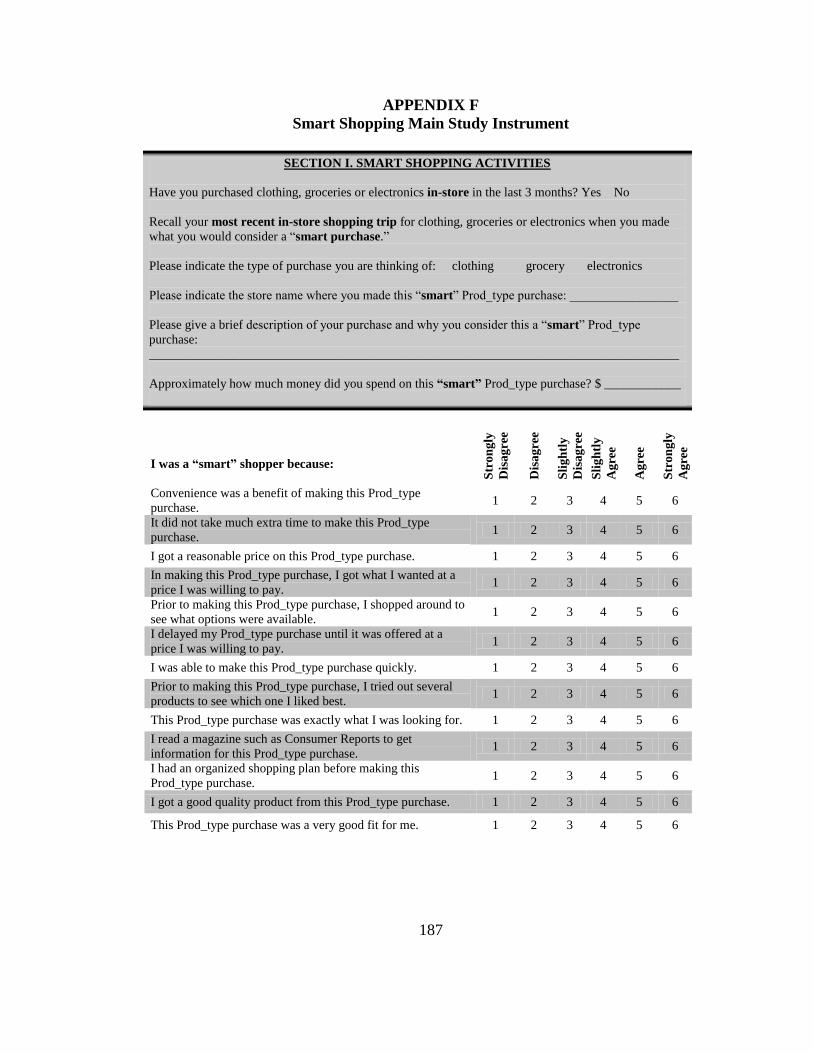
187
APPENDIX F
Smart Shopping Main Study Instrument
SS MainData
SECTION I. SMART SHOPPING ACTIVITIES
Have you purchased clothing, groceries or electronics in-store in the last 3 months? Yes No
Recall your most recent in-store shopping trip for clothing, groceries or electronics when you made
what you would consider a “smart purchase.”
Please indicate the type of purchase you are thinking of: clothing grocery electronics
Please indicate the store name where you made this “smart” Prod_type purchase: _________________
Please give a brief description of your purchase and why you consider this a “smart” Prod_type
purchase:
___________________________________________________________________________________
Approximately how much money did you spend on this “smart” Prod_type purchase? $ ____________
I was a “smart” shopper because:
Str
on
gly
Dis
ag
ree
Dis
ag
ree
Sli
gh
tly
Dis
ag
ree
Sli
gh
tly
Ag
ree
Ag
ree
Str
on
gly
Ag
ree
Convenience was a benefit of making this Prod_type
purchase. 1 2 3 4 5 6
It did not take much extra time to make this Prod_type
purchase. 1 2 3 4 5 6
I got a reasonable price on this Prod_type purchase. 1 2 3 4 5 6
In making this Prod_type purchase, I got what I wanted at a
price I was willing to pay. 1 2 3 4 5 6
Prior to making this Prod_type purchase, I shopped around to
see what options were available. 1 2 3 4 5 6
I delayed my Prod_type purchase until it was offered at a
price I was willing to pay. 1 2 3 4 5 6
I was able to make this Prod_type purchase quickly. 1 2 3 4 5 6
Prior to making this Prod_type purchase, I tried out several
products to see which one I liked best. 1 2 3 4 5 6
This Prod_type purchase was exactly what I was looking for. 1 2 3 4 5 6
I read a magazine such as Consumer Reports to get
information for this Prod_type purchase. 1 2 3 4 5 6
I had an organized shopping plan before making this
Prod_type purchase. 1 2 3 4 5 6
I got a good quality product from this Prod_type purchase. 1 2 3 4 5 6
This Prod_type purchase was a very good fit for me. 1 2 3 4 5 6
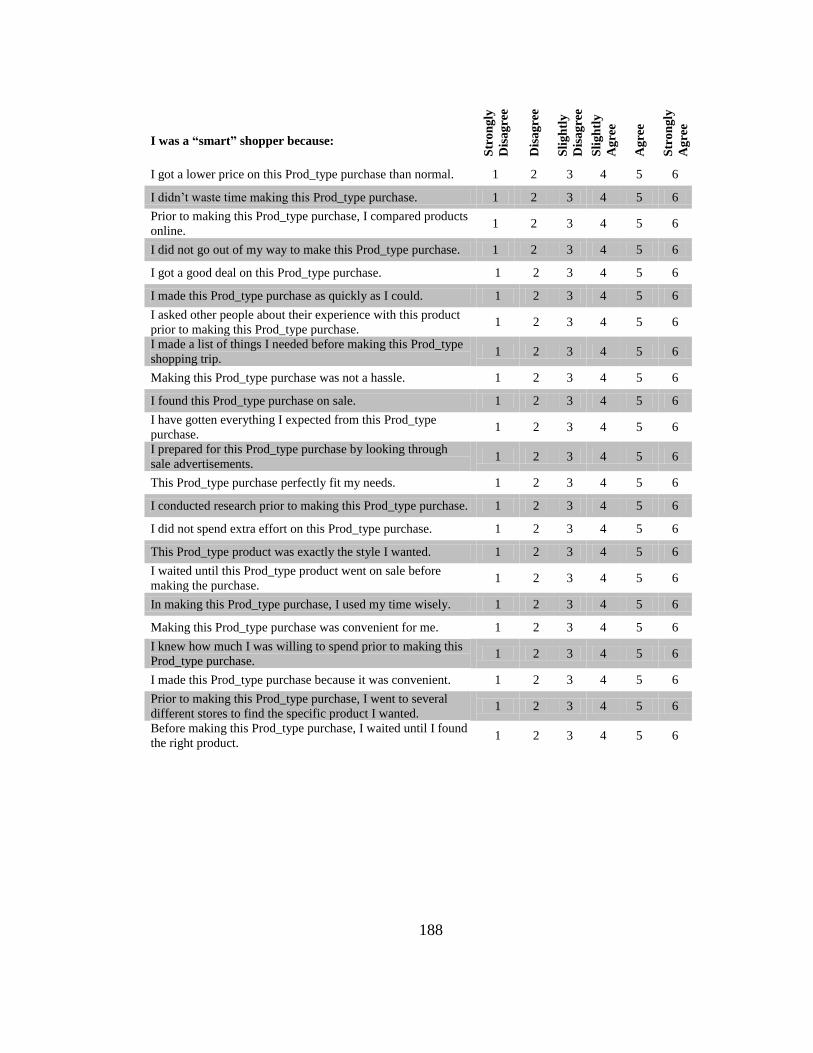
188
I was a “smart” shopper because:
Str
on
gly
Dis
ag
ree
Dis
ag
ree
Sli
gh
tly
Dis
ag
ree
Sli
gh
tly
Ag
ree
Ag
ree
Str
on
gly
Ag
ree
I got a lower price on this Prod_type purchase than normal. 1 2 3 4 5 6
I didn‟t waste time making this Prod_type purchase. 1 2 3 4 5 6
Prior to making this Prod_type purchase, I compared products
online. 1 2 3 4 5 6
I did not go out of my way to make this Prod_type purchase. 1 2 3 4 5 6
I got a good deal on this Prod_type purchase. 1 2 3 4 5 6
I made this Prod_type purchase as quickly as I could. 1 2 3 4 5 6
I asked other people about their experience with this product
prior to making this Prod_type purchase. 1 2 3 4 5 6
I made a list of things I needed before making this Prod_type
shopping trip. 1 2 3 4 5 6
Making this Prod_type purchase was not a hassle. 1 2 3 4 5 6
I found this Prod_type purchase on sale. 1 2 3 4 5 6
I have gotten everything I expected from this Prod_type
purchase. 1 2 3 4 5 6
I prepared for this Prod_type purchase by looking through
sale advertisements. 1 2 3 4 5 6
This Prod_type purchase perfectly fit my needs. 1 2 3 4 5 6
I conducted research prior to making this Prod_type purchase. 1 2 3 4 5 6
I did not spend extra effort on this Prod_type purchase. 1 2 3 4 5 6
This Prod_type product was exactly the style I wanted. 1 2 3 4 5 6
I waited until this Prod_type product went on sale before
making the purchase. 1 2 3 4 5 6
In making this Prod_type purchase, I used my time wisely. 1 2 3 4 5 6
Making this Prod_type purchase was convenient for me. 1 2 3 4 5 6
I knew how much I was willing to spend prior to making this
Prod_type purchase. 1 2 3 4 5 6
I made this Prod_type purchase because it was convenient. 1 2 3 4 5 6
Prior to making this Prod_type purchase, I went to several
different stores to find the specific product I wanted. 1 2 3 4 5 6
Before making this Prod_type purchase, I waited until I found
the right product. 1 2 3 4 5 6
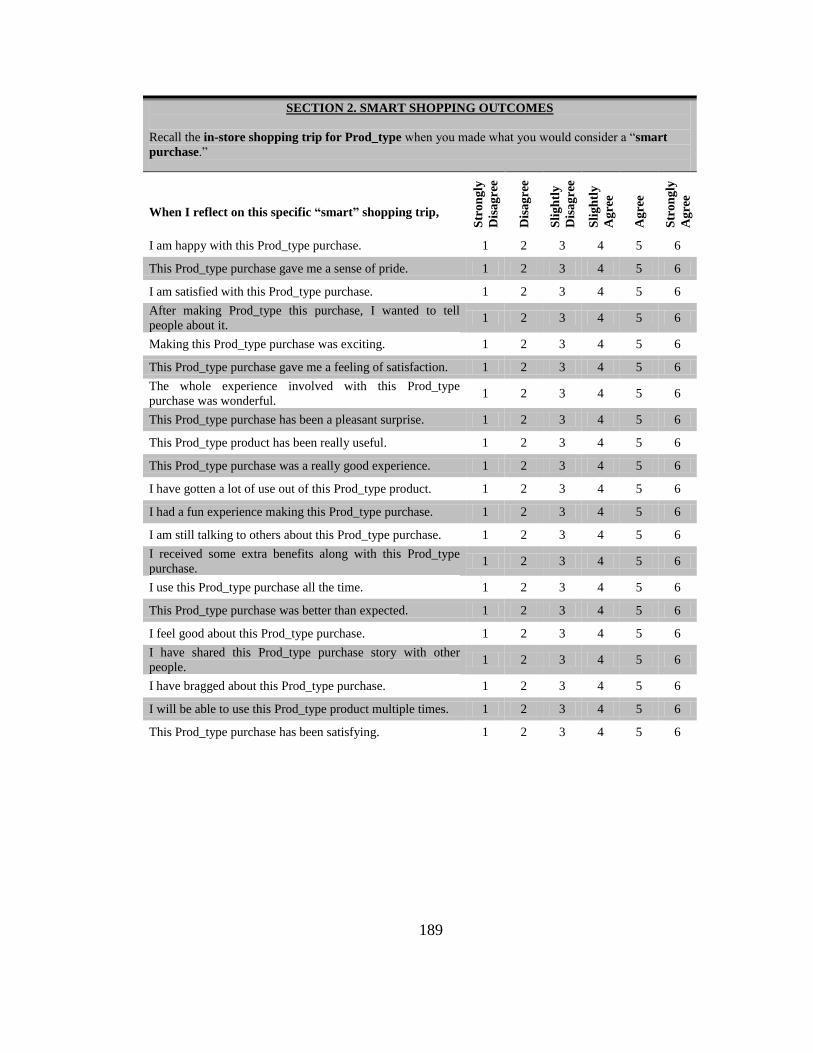
189
SECTION 2. SMART SHOPPING OUTCOMES
Recall the in-store shopping trip for Prod_type when you made what you would consider a “smart
purchase.”
When I reflect on this specific “smart” shopping trip,
Str
on
gly
Dis
ag
ree
Dis
ag
ree
Sli
gh
tly
Dis
ag
ree
Sli
gh
tly
Ag
ree
Ag
ree
Str
on
gly
Ag
ree
I am happy with this Prod_type purchase. 1 2 3 4 5 6
This Prod_type purchase gave me a sense of pride. 1 2 3 4 5 6
I am satisfied with this Prod_type purchase. 1 2 3 4 5 6
After making Prod_type this purchase, I wanted to tell
people about it. 1 2 3 4 5 6
Making this Prod_type purchase was exciting. 1 2 3 4 5 6
This Prod_type purchase gave me a feeling of satisfaction. 1 2 3 4 5 6
The whole experience involved with this Prod_type
purchase was wonderful. 1 2 3 4 5 6
This Prod_type purchase has been a pleasant surprise. 1 2 3 4 5 6
This Prod_type product has been really useful. 1 2 3 4 5 6
This Prod_type purchase was a really good experience. 1 2 3 4 5 6
I have gotten a lot of use out of this Prod_type product. 1 2 3 4 5 6
I had a fun experience making this Prod_type purchase. 1 2 3 4 5 6
I am still talking to others about this Prod_type purchase. 1 2 3 4 5 6
I received some extra benefits along with this Prod_type
purchase. 1 2 3 4 5 6
I use this Prod_type purchase all the time. 1 2 3 4 5 6
This Prod_type purchase was better than expected. 1 2 3 4 5 6
I feel good about this Prod_type purchase. 1 2 3 4 5 6
I have shared this Prod_type purchase story with other
people. 1 2 3 4 5 6
I have bragged about this Prod_type purchase. 1 2 3 4 5 6
I will be able to use this Prod_type product multiple times. 1 2 3 4 5 6
This Prod_type purchase has been satisfying. 1 2 3 4 5 6
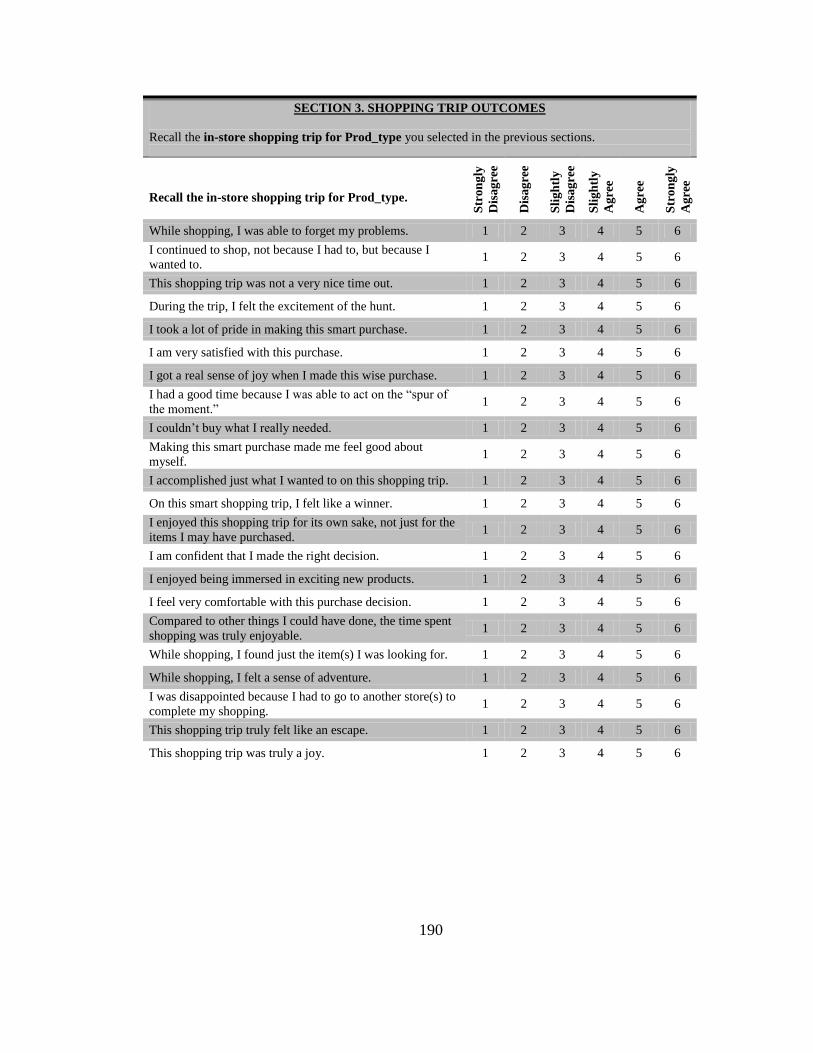
190
SECTION 3. SHOPPING TRIP OUTCOMES
Recall the in-store shopping trip for Prod_type you selected in the previous sections.
Recall the in-store shopping trip for Prod_type.
Str
on
gly
Dis
agre
e
Dis
agre
e
Sli
gh
tly
Dis
agre
e
Sli
gh
tly
Agre
e
Agre
e
Str
on
gly
Agre
e
While shopping, I was able to forget my problems. 1 2 3 4 5 6
I continued to shop, not because I had to, but because I
wanted to. 1 2 3 4 5 6
This shopping trip was not a very nice time out. 1 2 3 4 5 6
During the trip, I felt the excitement of the hunt. 1 2 3 4 5 6
I took a lot of pride in making this smart purchase. 1 2 3 4 5 6
I am very satisfied with this purchase. 1 2 3 4 5 6
I got a real sense of joy when I made this wise purchase. 1 2 3 4 5 6
I had a good time because I was able to act on the “spur of
the moment.” 1 2 3 4 5 6
I couldn‟t buy what I really needed. 1 2 3 4 5 6
Making this smart purchase made me feel good about
myself. 1 2 3 4 5 6
I accomplished just what I wanted to on this shopping trip. 1 2 3 4 5 6
On this smart shopping trip, I felt like a winner. 1 2 3 4 5 6
I enjoyed this shopping trip for its own sake, not just for the
items I may have purchased. 1 2 3 4 5 6
I am confident that I made the right decision. 1 2 3 4 5 6
I enjoyed being immersed in exciting new products. 1 2 3 4 5 6
I feel very comfortable with this purchase decision. 1 2 3 4 5 6
Compared to other things I could have done, the time spent
shopping was truly enjoyable. 1 2 3 4 5 6
While shopping, I found just the item(s) I was looking for. 1 2 3 4 5 6
While shopping, I felt a sense of adventure. 1 2 3 4 5 6
I was disappointed because I had to go to another store(s) to
complete my shopping. 1 2 3 4 5 6
This shopping trip truly felt like an escape. 1 2 3 4 5 6
This shopping trip was truly a joy. 1 2 3 4 5 6
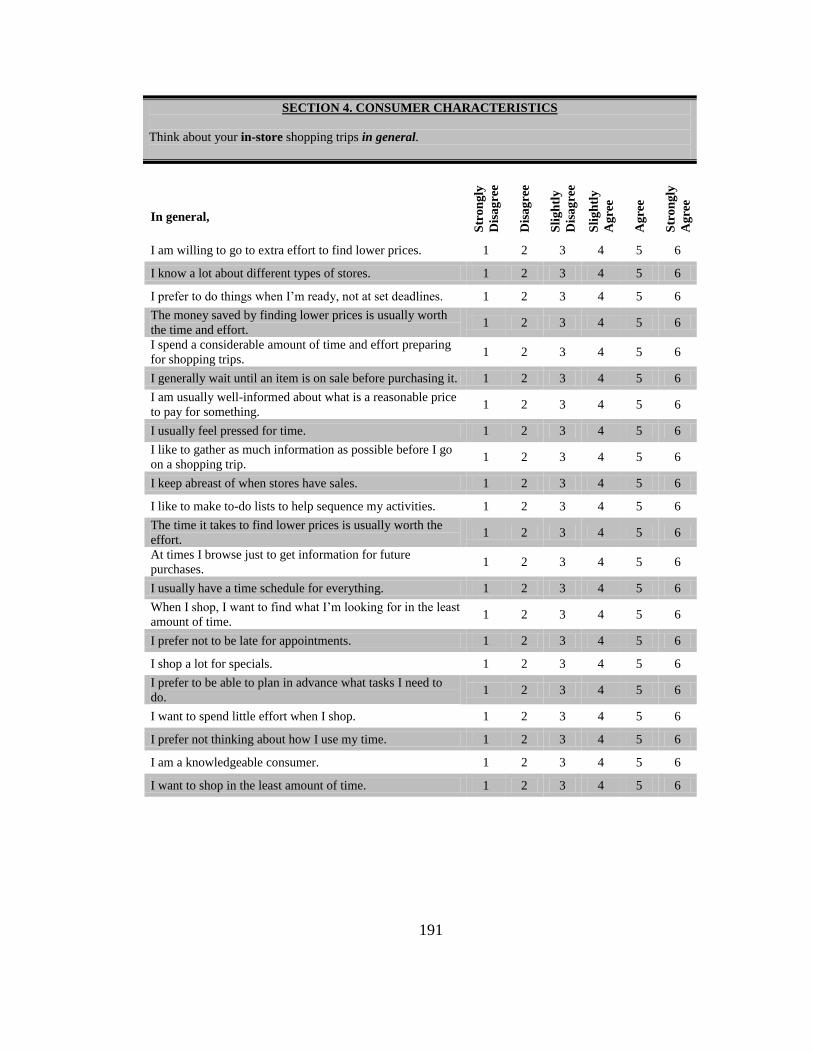
191
SECTION 4. CONSUMER CHARACTERISTICS
Think about your in-store shopping trips in general.
In general,
Str
on
gly
Dis
ag
ree
Dis
ag
ree
Sli
gh
tly
Dis
ag
ree
Sli
gh
tly
Ag
ree
Ag
ree
Str
on
gly
Ag
ree
I am willing to go to extra effort to find lower prices. 1 2 3 4 5 6
I know a lot about different types of stores. 1 2 3 4 5 6
I prefer to do things when I‟m ready, not at set deadlines. 1 2 3 4 5 6
The money saved by finding lower prices is usually worth
the time and effort. 1 2 3 4 5 6
I spend a considerable amount of time and effort preparing
for shopping trips. 1 2 3 4 5 6
I generally wait until an item is on sale before purchasing it. 1 2 3 4 5 6
I am usually well-informed about what is a reasonable price
to pay for something. 1 2 3 4 5 6
I usually feel pressed for time. 1 2 3 4 5 6
I like to gather as much information as possible before I go
on a shopping trip. 1 2 3 4 5 6
I keep abreast of when stores have sales. 1 2 3 4 5 6
I like to make to-do lists to help sequence my activities. 1 2 3 4 5 6
The time it takes to find lower prices is usually worth the
effort. 1 2 3 4 5 6
At times I browse just to get information for future
purchases. 1 2 3 4 5 6
I usually have a time schedule for everything. 1 2 3 4 5 6
When I shop, I want to find what I‟m looking for in the least
amount of time. 1 2 3 4 5 6
I prefer not to be late for appointments. 1 2 3 4 5 6
I shop a lot for specials. 1 2 3 4 5 6
I prefer to be able to plan in advance what tasks I need to
do. 1 2 3 4 5 6
I want to spend little effort when I shop. 1 2 3 4 5 6
I prefer not thinking about how I use my time. 1 2 3 4 5 6
I am a knowledgeable consumer. 1 2 3 4 5 6
I want to shop in the least amount of time. 1 2 3 4 5 6
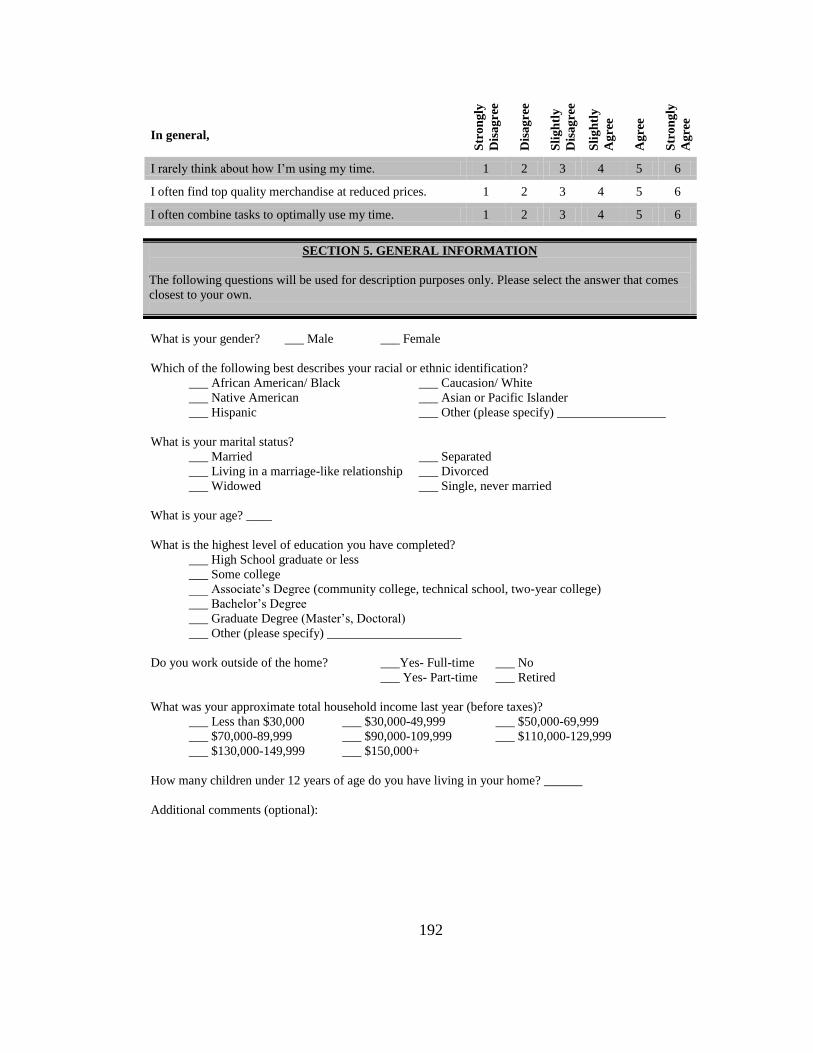
192
In general,
Str
on
gly
Dis
ag
ree
Dis
ag
ree
Sli
gh
tly
Dis
ag
ree
Sli
gh
tly
Agre
e
Agre
e
Str
on
gly
Agre
e
I rarely think about how I‟m using my time. 1 2 3 4 5 6
I often find top quality merchandise at reduced prices. 1 2 3 4 5 6
I often combine tasks to optimally use my time. 1 2 3 4 5 6
SECTION 5. GENERAL INFORMATION
The following questions will be used for description purposes only. Please select the answer that comes
closest to your own.
What is your gender? ___ Male ___ Female
Which of the following best describes your racial or ethnic identification?
___ African American/ Black ___ Caucasion/ White
___ Native American ___ Asian or Pacific Islander
___ Hispanic ___ Other (please specify) _________________
What is your marital status?
___ Married ___ Separated
___ Living in a marriage-like relationship ___ Divorced
___ Widowed ___ Single, never married
What is your age? ____
What is the highest level of education you have completed?
___ High School graduate or less
___ Some college
___ Associate‟s Degree (community college, technical school, two-year college)
___ Bachelor‟s Degree
___ Graduate Degree (Master‟s, Doctoral)
___ Other (please specify) _____________________
Do you work outside of the home? ___Yes- Full-time ___ No
___ Yes- Part-time ___ Retired
What was your approximate total household income last year (before taxes)?
___ Less than $30,000 ___ $30,000-49,999 ___ $50,000-69,999
___ $70,000-89,999 ___ $90,000-109,999 ___ $110,000-129,999
___ $130,000-149,999 ___ $150,000+
How many children under 12 years of age do you have living in your home? ______
Additional comments (optional):
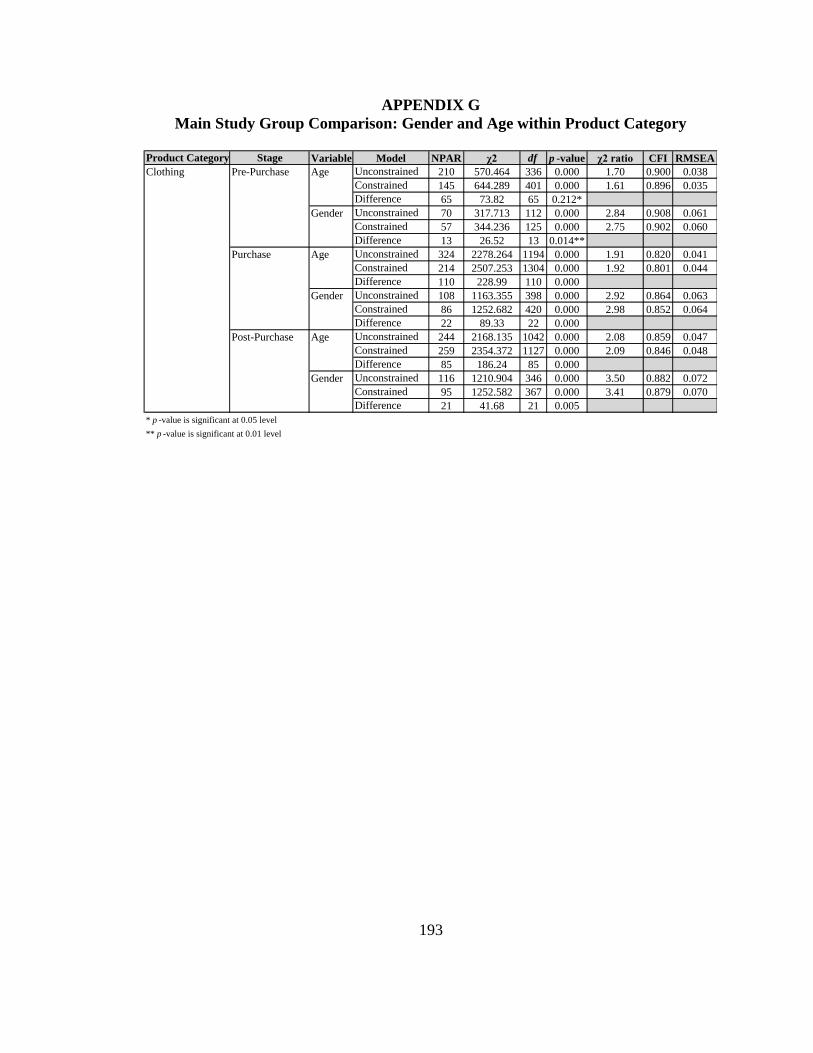
193
APPENDIX G
Main Study Group Comparison: Gender and Age within Product Category
Product Category Stage Variable Model NPAR χ2 df p -value χ2 ratio CFI RMSEA
Unconstrained 210 570.464 336 0.000 1.70 0.900 0.038
Constrained 145 644.289 401 0.000 1.61 0.896 0.035
Difference 65 73.82 65 0.212*
Unconstrained 70 317.713 112 0.000 2.84 0.908 0.061
Constrained 57 344.236 125 0.000 2.75 0.902 0.060
Difference 13 26.52 13 0.014**
Unconstrained 324 2278.264 1194 0.000 1.91 0.820 0.041
Constrained 214 2507.253 1304 0.000 1.92 0.801 0.044
Difference 110 228.99 110 0.000
Unconstrained 108 1163.355 398 0.000 2.92 0.864 0.063
Constrained 86 1252.682 420 0.000 2.98 0.852 0.064
Difference 22 89.33 22 0.000
Unconstrained 244 2168.135 1042 0.000 2.08 0.859 0.047
Constrained 259 2354.372 1127 0.000 2.09 0.846 0.048
Difference 85 186.24 85 0.000
Unconstrained 116 1210.904 346 0.000 3.50 0.882 0.072
Constrained 95 1252.582 367 0.000 3.41 0.879 0.070
Difference 21 41.68 21 0.005
Clothing
* p -value is significant at 0.05 level
** p -value is significant at 0.01 level
Age
Gender
Post-Purchase
Pre-Purchase Age
Gender
Purchase Age
Gender

194
Product Category Stage Variable Model NPAR χ2 df p -value χ2 ratio CFI RMSEA
Unconstrained 222 585.769 246 0.000 2.38 0.900 0.043
Constrained 162 686.166 306 0.000 2.24 0.888 0.041
Difference 60 100.40 60 0.001
Unconstrained 74 384.985 82 0.000 4.70 0.910 0.070
Constrained 62 389.198 84 0.000 4.14 0.912 0.065
Difference 12 4.21 12 0.979*
Unconstrained 324 2848.958 1194 0.000 2.39 0.830 0.043
Constrained 214 3047.794 1304 0.000 2.34 0.821 0.042
Difference 110 198.84 110 0.000
Unconstrained 108 1430.065 398 0.000 3.59 0.884 0.059
Constrained 86 1490.171 420 0.000 3.55 0.880 0.058
Difference 22 60.11 22 0.000
Unconstrained 348 2349.199 1038 0.000 2.26 0.884 0.041
Constrained 243 2512.461 1143 0.000 2.20 0.879 0.040
Difference 105 163.26 105 0.000
Unconstrained 116 1408.311 346 0.000 4.07 0.902 0.064
Constrained 95 1428.96 367 0.000 3.89 0.902 0.062
Difference 21 20.65 21 0.481*
Grocery
* p -value is significant at 0.05 level
** p -value is significant at 0.01 level
Age
Gender
Post-Purchase
Age
Gender
Age
Gender
Pre-Purchase
Purchase
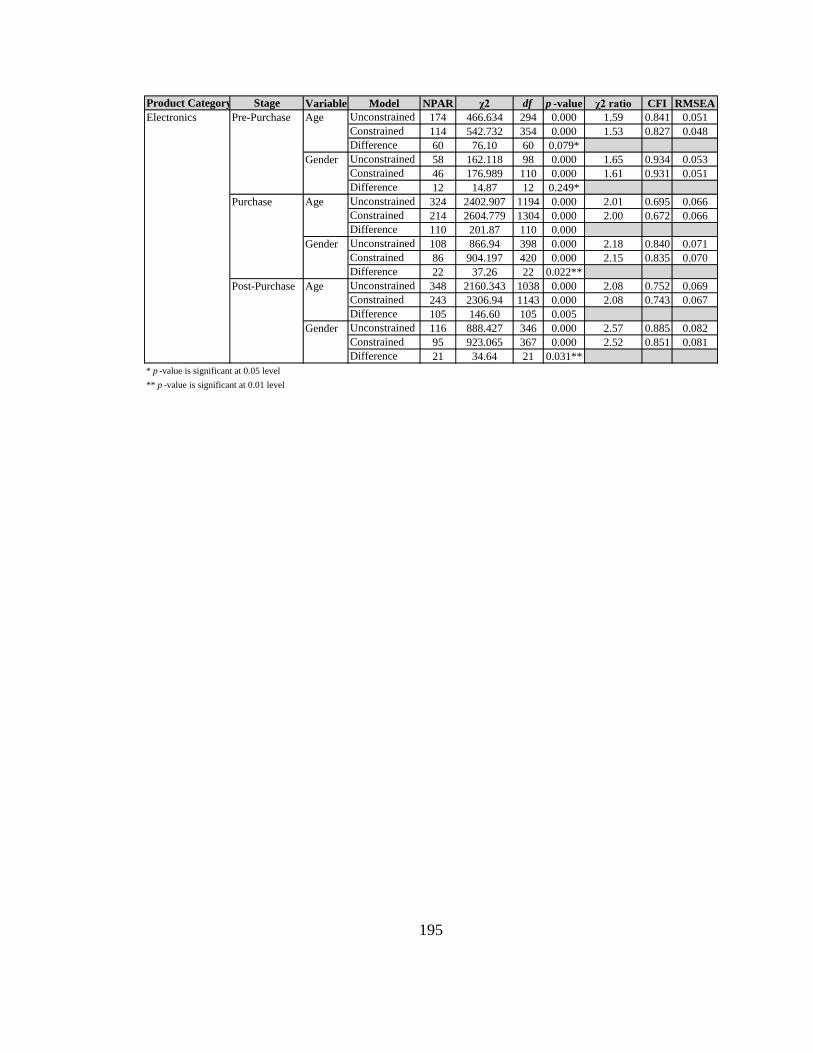
195
Product Category Stage Variable Model NPAR χ2 df p -value χ2 ratio CFI RMSEA
Unconstrained 174 466.634 294 0.000 1.59 0.841 0.051
Constrained 114 542.732 354 0.000 1.53 0.827 0.048
Difference 60 76.10 60 0.079*
Unconstrained 58 162.118 98 0.000 1.65 0.934 0.053
Constrained 46 176.989 110 0.000 1.61 0.931 0.051
Difference 12 14.87 12 0.249*
Unconstrained 324 2402.907 1194 0.000 2.01 0.695 0.066
Constrained 214 2604.779 1304 0.000 2.00 0.672 0.066
Difference 110 201.87 110 0.000
Unconstrained 108 866.94 398 0.000 2.18 0.840 0.071
Constrained 86 904.197 420 0.000 2.15 0.835 0.070
Difference 22 37.26 22 0.022**
Unconstrained 348 2160.343 1038 0.000 2.08 0.752 0.069
Constrained 243 2306.94 1143 0.000 2.08 0.743 0.067
Difference 105 146.60 105 0.005
Unconstrained 116 888.427 346 0.000 2.57 0.885 0.082
Constrained 95 923.065 367 0.000 2.52 0.851 0.081
Difference 21 34.64 21 0.031**
Electronics
* p -value is significant at 0.05 level
** p -value is significant at 0.01 level
Age
Gender
Post-Purchase
Pre-Purchase
Purchase
Age
Gender
Age
Gender
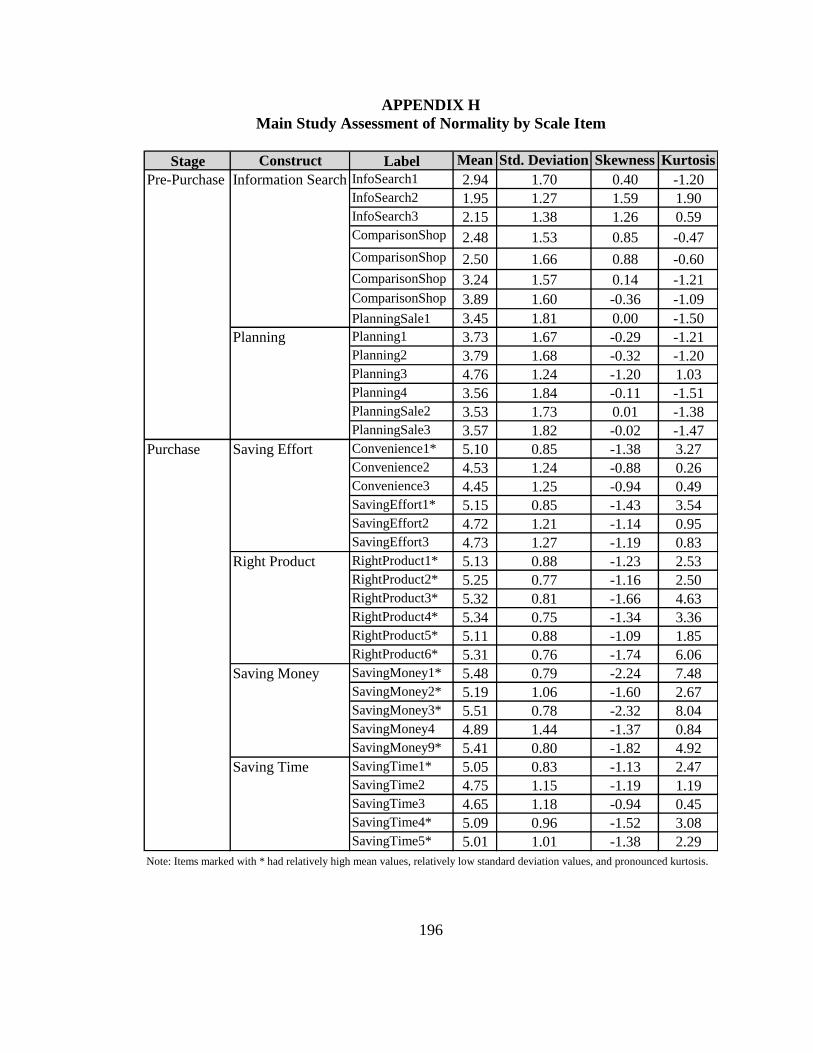
196
APPENDIX H
Main Study Assessment of Normality by Scale Item
Stage Construct Label Mean Std. Deviation Skewness Kurtosis
InfoSearch1 2.94 1.70 0.40 -1.20
InfoSearch2 1.95 1.27 1.59 1.90
InfoSearch3 2.15 1.38 1.26 0.59
ComparisonShop
12.48 1.53 0.85 -0.47
ComparisonShop
22.50 1.66 0.88 -0.60
ComparisonShop
3
3.24 1.57 0.14 -1.21
ComparisonShop
4
3.89 1.60 -0.36 -1.09
PlanningSale1 3.45 1.81 0.00 -1.50
Planning1 3.73 1.67 -0.29 -1.21
Planning2 3.79 1.68 -0.32 -1.20
Planning3 4.76 1.24 -1.20 1.03
Planning4 3.56 1.84 -0.11 -1.51
PlanningSale2 3.53 1.73 0.01 -1.38
PlanningSale3 3.57 1.82 -0.02 -1.47
Convenience1* 5.10 0.85 -1.38 3.27
Convenience2 4.53 1.24 -0.88 0.26
Convenience3 4.45 1.25 -0.94 0.49
SavingEffort1* 5.15 0.85 -1.43 3.54
SavingEffort2 4.72 1.21 -1.14 0.95
SavingEffort3 4.73 1.27 -1.19 0.83
RightProduct1* 5.13 0.88 -1.23 2.53
RightProduct2* 5.25 0.77 -1.16 2.50
RightProduct3* 5.32 0.81 -1.66 4.63
RightProduct4* 5.34 0.75 -1.34 3.36
RightProduct5* 5.11 0.88 -1.09 1.85
RightProduct6* 5.31 0.76 -1.74 6.06
SavingMoney1* 5.48 0.79 -2.24 7.48
SavingMoney2* 5.19 1.06 -1.60 2.67
SavingMoney3* 5.51 0.78 -2.32 8.04
SavingMoney4 4.89 1.44 -1.37 0.84
SavingMoney9* 5.41 0.80 -1.82 4.92
SavingTime1* 5.05 0.83 -1.13 2.47
SavingTime2 4.75 1.15 -1.19 1.19
SavingTime3 4.65 1.18 -0.94 0.45
SavingTime4* 5.09 0.96 -1.52 3.08
SavingTime5* 5.01 1.01 -1.38 2.29
Information Search
Planning
Saving Effort
Right Product
Note: Items marked with * had relatively high mean values, relatively low standard deviation values, and pronounced kurtosis.
Saving Money
Saving Time
Pre-Purchase
Purchase
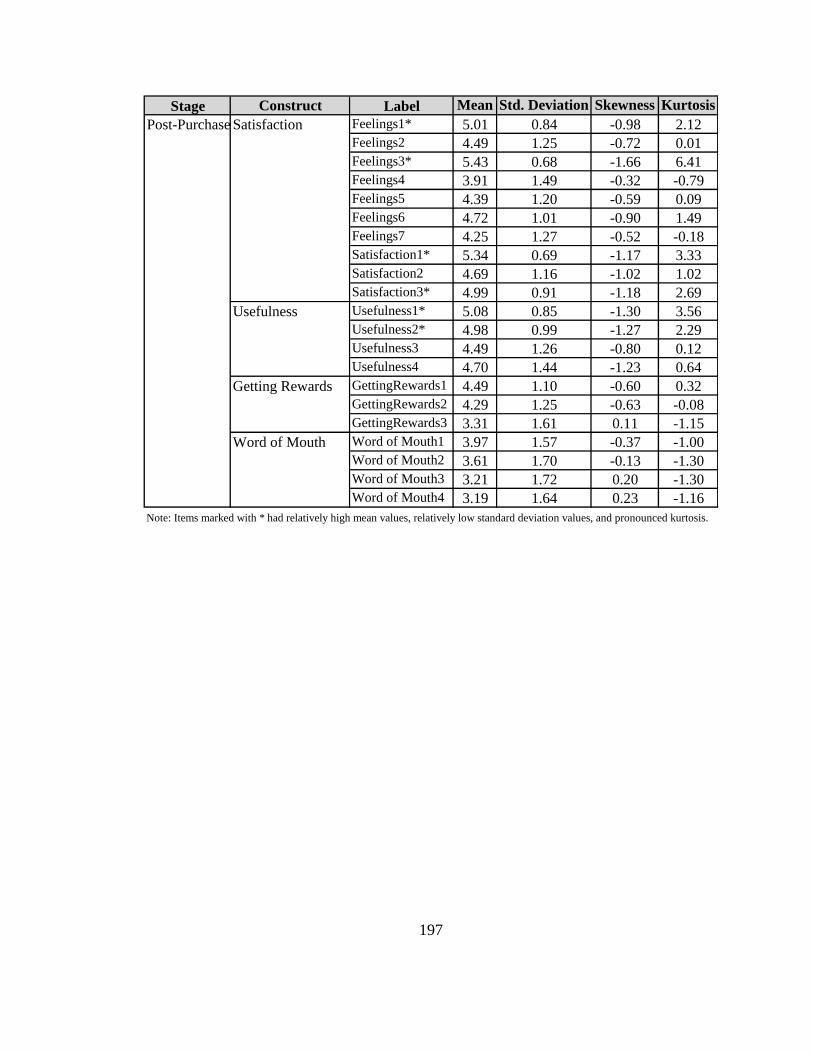
197
Stage Construct Label Mean Std. Deviation Skewness Kurtosis
Feelings1* 5.01 0.84 -0.98 2.12
Feelings2 4.49 1.25 -0.72 0.01
Feelings3* 5.43 0.68 -1.66 6.41
Feelings4 3.91 1.49 -0.32 -0.79
Feelings5 4.39 1.20 -0.59 0.09
Feelings6 4.72 1.01 -0.90 1.49
Feelings7 4.25 1.27 -0.52 -0.18
Satisfaction1* 5.34 0.69 -1.17 3.33
Satisfaction2 4.69 1.16 -1.02 1.02
Satisfaction3* 4.99 0.91 -1.18 2.69
Usefulness1* 5.08 0.85 -1.30 3.56
Usefulness2* 4.98 0.99 -1.27 2.29
Usefulness3 4.49 1.26 -0.80 0.12
Usefulness4 4.70 1.44 -1.23 0.64
GettingRewards1 4.49 1.10 -0.60 0.32
GettingRewards2 4.29 1.25 -0.63 -0.08
GettingRewards3 3.31 1.61 0.11 -1.15
Word of Mouth1 3.97 1.57 -0.37 -1.00
Word of Mouth2 3.61 1.70 -0.13 -1.30
Word of Mouth3 3.21 1.72 0.20 -1.30
Word of Mouth4 3.19 1.64 0.23 -1.16
Note: Items marked with * had relatively high mean values, relatively low standard deviation values, and pronounced kurtosis.
Post-Purchase Satisfaction
Usefulness
Getting Rewards
Word of Mouth
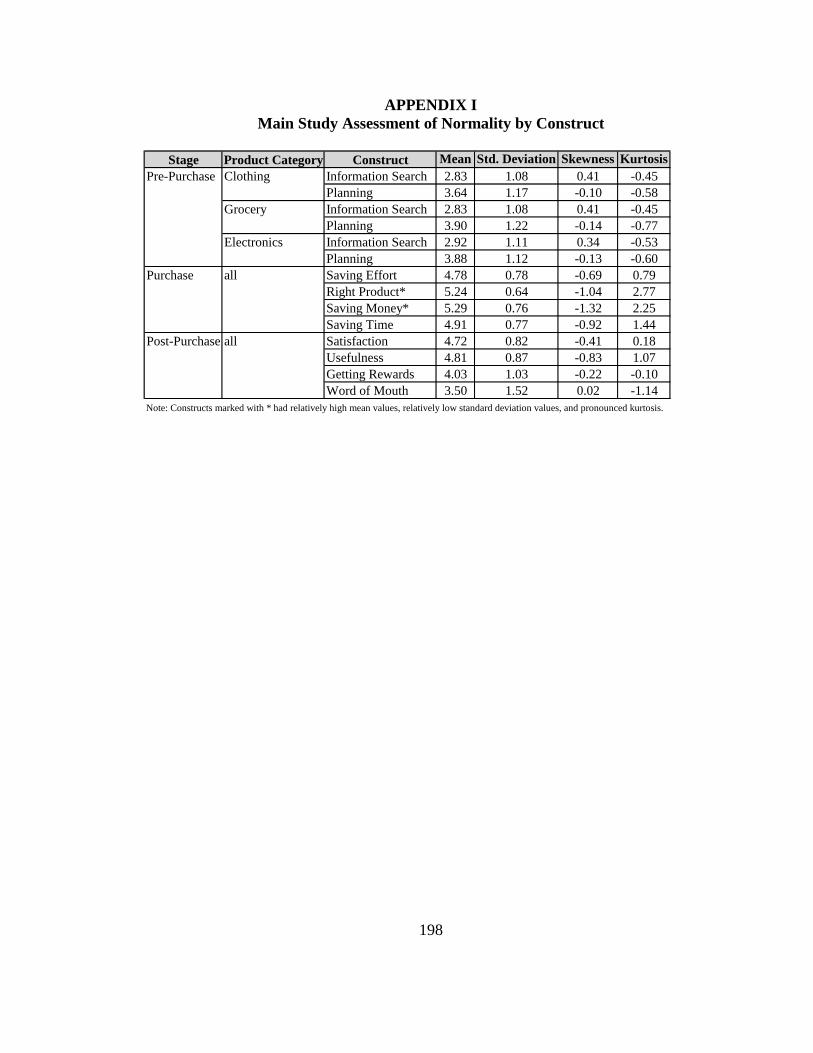
198
APPENDIX I
Main Study Assessment of Normality by Construct
Stage Product Category Construct Mean Std. Deviation Skewness Kurtosis
Information Search 2.83 1.08 0.41 -0.45
Planning 3.64 1.17 -0.10 -0.58
Information Search 2.83 1.08 0.41 -0.45
Planning 3.90 1.22 -0.14 -0.77
Information Search 2.92 1.11 0.34 -0.53
Planning 3.88 1.12 -0.13 -0.60
Saving Effort 4.78 0.78 -0.69 0.79
Right Product* 5.24 0.64 -1.04 2.77
Saving Money* 5.29 0.76 -1.32 2.25
Saving Time 4.91 0.77 -0.92 1.44
Satisfaction 4.72 0.82 -0.41 0.18
Usefulness 4.81 0.87 -0.83 1.07
Getting Rewards 4.03 1.03 -0.22 -0.10
Word of Mouth 3.50 1.52 0.02 -1.14
Note: Constructs marked with * had relatively high mean values, relatively low standard deviation values, and pronounced kurtosis.
Pre-Purchase
Purchase
Post-Purchase
Clothing
Grocery
Electronics
all
all
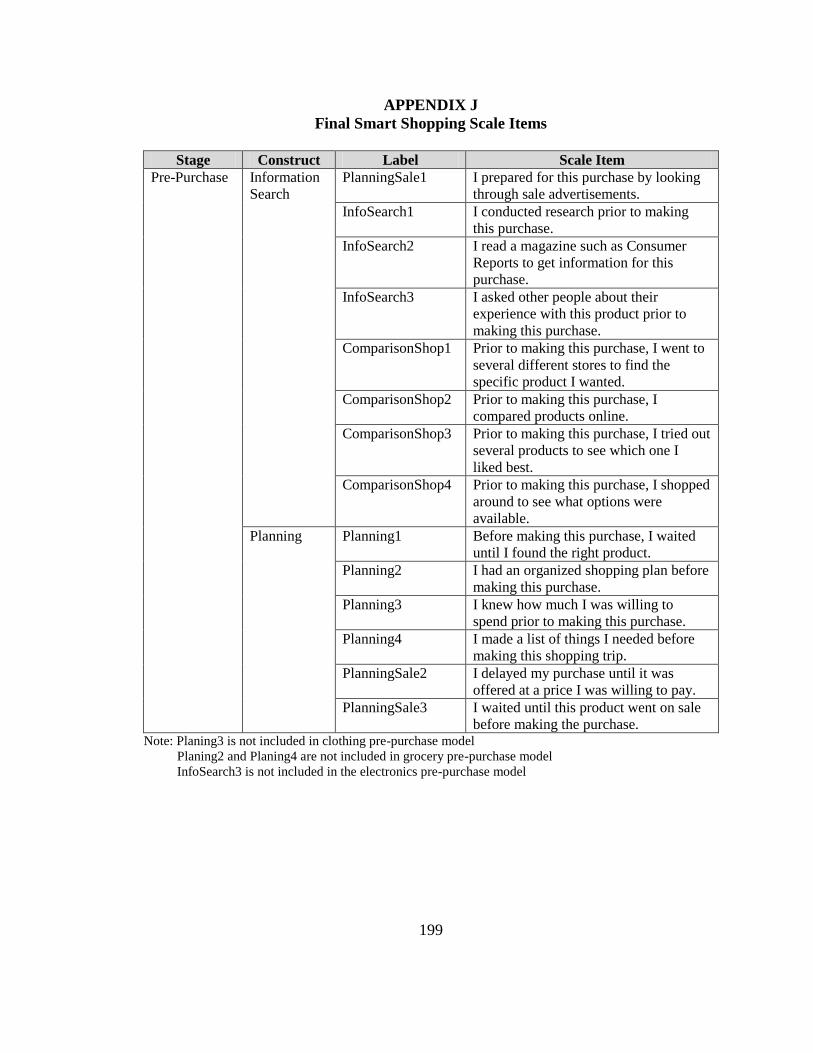
199
APPENDIX J
Final Smart Shopping Scale Items
Stage Construct Label Scale Item
Pre-Purchase Information
Search
PlanningSale1 I prepared for this purchase by looking
through sale advertisements.
InfoSearch1 I conducted research prior to making
this purchase.
InfoSearch2 I read a magazine such as Consumer
Reports to get information for this
purchase.
InfoSearch3 I asked other people about their
experience with this product prior to
making this purchase.
ComparisonShop1 Prior to making this purchase, I went to
several different stores to find the
specific product I wanted.
ComparisonShop2 Prior to making this purchase, I
compared products online.
ComparisonShop3 Prior to making this purchase, I tried out
several products to see which one I
liked best.
ComparisonShop4 Prior to making this purchase, I shopped
around to see what options were
available.
Planning Planning1 Before making this purchase, I waited
until I found the right product.
Planning2 I had an organized shopping plan before
making this purchase.
Planning3 I knew how much I was willing to
spend prior to making this purchase.
Planning4 I made a list of things I needed before
making this shopping trip.
PlanningSale2 I delayed my purchase until it was
offered at a price I was willing to pay.
PlanningSale3 I waited until this product went on sale
before making the purchase. Note: Planing3 is not included in clothing pre-purchase model
Planing2 and Planing4 are not included in grocery pre-purchase model
InfoSearch3 is not included in the electronics pre-purchase model
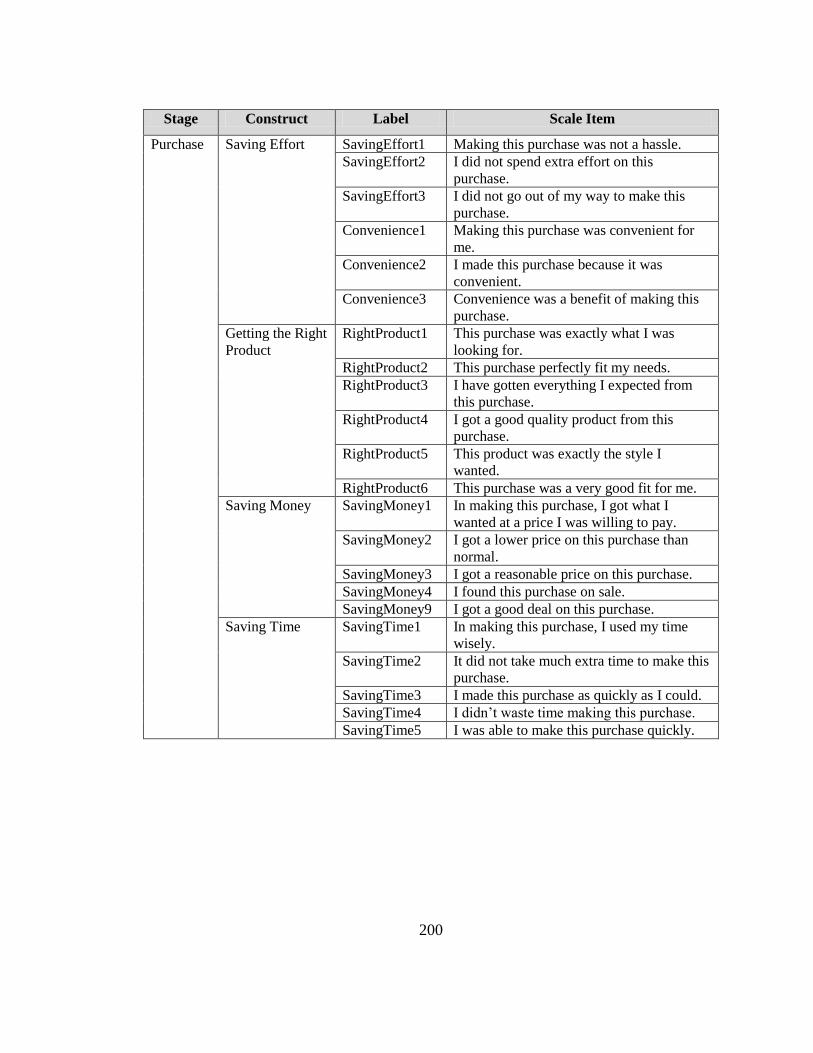
200
Stage Construct Label Scale Item
Purchase Saving Effort SavingEffort1 Making this purchase was not a hassle.
SavingEffort2 I did not spend extra effort on this
purchase.
SavingEffort3 I did not go out of my way to make this
purchase.
Convenience1 Making this purchase was convenient for
me.
Convenience2 I made this purchase because it was
convenient.
Convenience3 Convenience was a benefit of making this
purchase.
Getting the Right
Product
RightProduct1 This purchase was exactly what I was
looking for.
RightProduct2 This purchase perfectly fit my needs.
RightProduct3 I have gotten everything I expected from
this purchase.
RightProduct4 I got a good quality product from this
purchase.
RightProduct5 This product was exactly the style I
wanted.
RightProduct6 This purchase was a very good fit for me.
Saving Money SavingMoney1 In making this purchase, I got what I
wanted at a price I was willing to pay.
SavingMoney2 I got a lower price on this purchase than
normal.
SavingMoney3 I got a reasonable price on this purchase.
SavingMoney4 I found this purchase on sale.
SavingMoney9 I got a good deal on this purchase.
Saving Time SavingTime1 In making this purchase, I used my time
wisely.
SavingTime2 It did not take much extra time to make this
purchase.
SavingTime3 I made this purchase as quickly as I could.
SavingTime4 I didn‟t waste time making this purchase.
SavingTime5 I was able to make this purchase quickly.
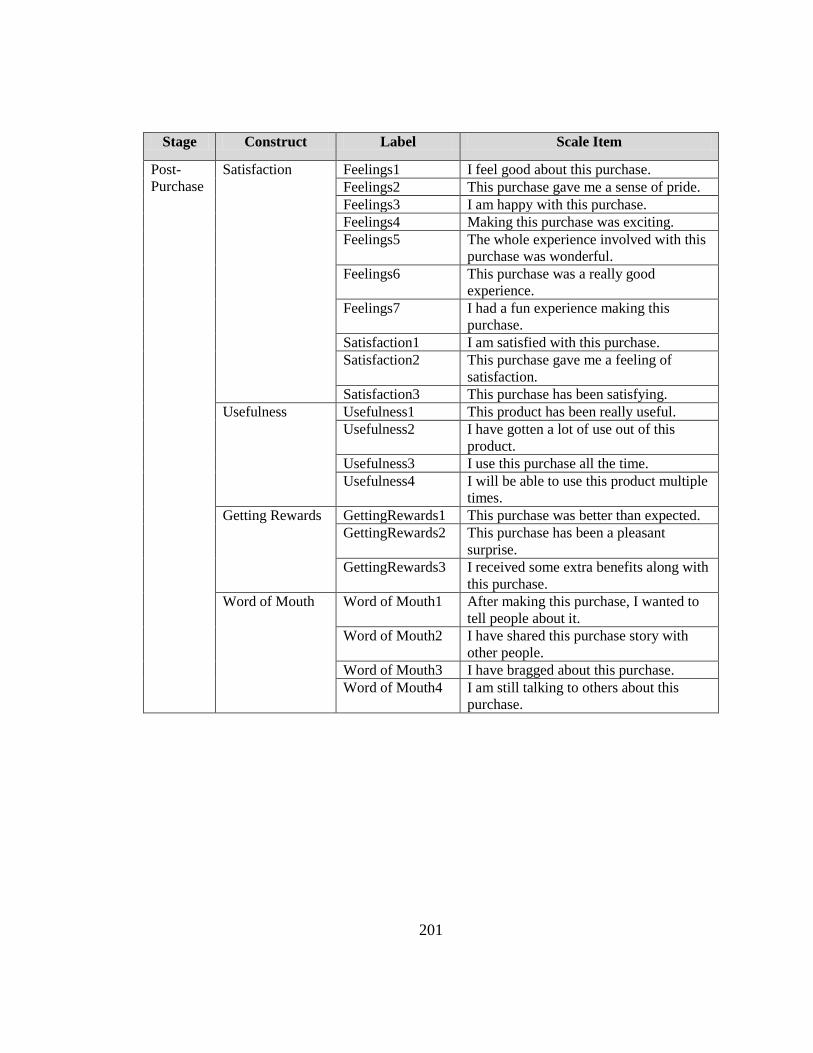
201
Stage Construct Label Scale Item
Post-
Purchase
Satisfaction Feelings1 I feel good about this purchase.
Feelings2 This purchase gave me a sense of pride.
Feelings3 I am happy with this purchase.
Feelings4 Making this purchase was exciting.
Feelings5 The whole experience involved with this
purchase was wonderful.
Feelings6 This purchase was a really good
experience.
Feelings7 I had a fun experience making this
purchase.
Satisfaction1 I am satisfied with this purchase.
Satisfaction2 This purchase gave me a feeling of
satisfaction.
Satisfaction3 This purchase has been satisfying.
Usefulness Usefulness1 This product has been really useful.
Usefulness2 I have gotten a lot of use out of this
product.
Usefulness3 I use this purchase all the time.
Usefulness4 I will be able to use this product multiple
times.
Getting Rewards GettingRewards1 This purchase was better than expected.
GettingRewards2 This purchase has been a pleasant
surprise.
GettingRewards3 I received some extra benefits along with
this purchase.
Word of Mouth Word of Mouth1 After making this purchase, I wanted to
tell people about it.
Word of Mouth2 I have shared this purchase story with
other people.
Word of Mouth3 I have bragged about this purchase.
Word of Mouth4 I am still talking to others about this
purchase.
202
VITA
Kelly Green Atkins completed her Ph.D. in Human Ecology at the University of
Tennessee, Knoxville, in the Retail, Hospitality, and Tourism Department with a
concentration in Retail and Consumer Sciences (2008). She also completed her Master‟s
Degree in Consumer Services Management with a concentration in Retail and Consumer
Sciences from the University of Tennessee (2005). She received her Bachelor of Science
Degree cum laude in Fashion Merchandising and Home Economics from Mars Hill
College, Mars Hill, NC (1992).
Her fellowships and awards at the University of Tennessee included: RHTM
Doctoral Research Scholarship (2008); Hilton A. Smith Graduate Fellowship (2005);
Graduate Teaching Assistantship (2005-2008); Ida A. Anders Scholarship (2006-2007
and 2007-2008); International Travel Award (2006).
She also received the American Collegiate Retailing Association‟s First Place
Morris Mayer Doctoral Dissertation Award (2008); and the International Council of
Shopping Centers ICSC Best Paper Award (2006).
At the University of Tennessee, she professionally edited manuscripts for research
publication (2004-2008) and she assisted Drs. Kim, Jolly, and Fairhurst in a research
project funded by the International Council of Shopping Centers (2004-2005).
Her journal publications are as follows:
Lee, M-Y., Atkins, K., & Kim, Y-K. (2008) Virtual Communities: Impact of
Commercial Orientation on Attitudes Toward Virtual Communities.
International Journal of Electronic Marketing & Retailing, currently in
print.
Lee, M-Y., Atkins, K., Kim, Y-K., & Park, S. (2006). Competitive Analyses
Between Regional Malls and Big-box Retailers: A Correspondence
203
Analyses for Segmentation and Positioning. Journal of Shopping Center
Research, 13(1), 81-98.
Kim, Y-K., Jolly, L., Fairhurst, A, & Atkins, K. (2005). Mixed-use Development:
Creating a Model of Key Success Factors. Journal of Shopping Center
Research, 12(1), 53-75.
Her teaching experience includes: The University of Tennessee, RHTM
Department - Graduate Teaching Assistant- Introduction to Retail Management (August
2005-May 2008); Graduate Teaching Assistant Experiential Retailing (Spring 2007).
East Tennessee State University, Department of Family and Consumer Sciences -
Adjunct Instructor - Merchandise Buying (Spring 2008); Merchandising and Planning
Control (Fall 2007).
Her professional affiliations are: International Textile and Apparel Association
(2005 – present); American Collegiate Retailing Association (2006 – present); Tennessee
Association of Family and Consumer Sciences (2006 – present); American Association
of Family and Consumer Sciences (2006 – present); Honor Society of Phi Kappa Phi
(2005-2008); and Kappa Omicron Nu Honor Society (2005-2008).