the small scale physical evolution of molecular gas in
TRANSCRIPT
HAL Id: tel-00608597https://tel.archives-ouvertes.fr/tel-00608597
Submitted on 13 Jul 2011
HAL is a multi-disciplinary open accessarchive for the deposit and dissemination of sci-entific research documents, whether they are pub-lished or not. The documents may come fromteaching and research institutions in France orabroad, or from public or private research centers.
L’archive ouverte pluridisciplinaire HAL, estdestinée au dépôt et à la diffusion de documentsscientifiques de niveau recherche, publiés ou non,émanant des établissements d’enseignement et derecherche français ou étrangers, des laboratoirespublics ou privés.
The Small Scale Physical Evolution of Molecular Gas inNearby Galaxies
Viviana Casasola
To cite this version:Viviana Casasola. The Small Scale Physical Evolution of Molecular Gas in Nearby Galaxies. Astro-physics [astro-ph]. Université Pierre et Marie Curie - Paris VI, 2008. English. tel-00608597
UNIVERSITA DEGLI STUDI DI PADOVADipartimento di Astronomia
UNIVERSITE PIERRE ET MARIE CURIE PARIS 6Observatoire de Paris
UNIVERSITA ITALO-FRANCESE
DOTTORATO DI RICERCA IN ASTRONOMIA CICLO XX
ECOLE DOCTORALE D’ASTRONOMIE ET D’ASTROPHYSIQUED’ILE-DE-FRANCE
DOTTORATO DI RICERCA IN CO-TUTELA ITALIA-FRANCIA
The Small Scale Physical Evolutionof Molecular Gas in Nearby Galaxies
Coordinatori: Ch.mo Prof. Giampaolo PiottoCh.mo Prof. Pierre Encrenaz
Supervisori: Ch.mo Prof. Giuseppe GallettaCh.ma Prof. Francoise Combes
Dottorando: VIVIANA CASASOLA
31 Gennaio 2008

UNIVERSITA DEGLI STUDI DI PADOVADipartimento di Astronomia
UNIVERSITE PIERRE ET MARIE CURIE PARIS 6Observatoire de Paris
UNIVERSITE FRANCO-ITALIENNE
DOTTORATO DI RICERCA IN ASTRONOMIA CICLO XX
ECOLE DOCTORALE D’ASTRONOMIE ET D’ASTROPHYSIQUED’ILE-DE-FRANCE
DOCTORAT EN CO-TUTELLE ITALIE-FRANCE
The Small Scale Physical Evolutionof Molecular Gas in Nearby Galaxies
Responsables: Prof. Giampaolo PiottoProf. Pierre Encrenaz
Directeurs de these: Prof. Giuseppe GallettaProf. Francoise Combes
Doctorant: VIVIANA CASASOLA
31 Janvier 2008

UNIVERSITY OF PADOVAAstronomy Department
PIERRE ET MARIE CURIE UNIVERSITY PARIS 6Paris Observatory
ITALIAN-FRENCH UNIVERSITY
PhD IN ASTRONOMY COURSE XX (ITALY)
PhD IN ASTRONOMY AND ASTROPHYSICS (FRANCE)
PhD IN CO-TUTORSHIP ITALY-FRANCE
The Small Scale Physical Evolutionof Molecular Gas in Nearby Galaxies
PhD Coordinators: Prof. Giampaolo PiottoProf. Pierre Encrenaz
Supervisors: Prof. Giuseppe GallettaProf. Francoise Combes
PhD Student: VIVIANA CASASOLA
January 31st, 2008


A Benito, Carmen, e Simone

Prefazione (Italian Preface)
Con il termine di Mezzo Interstellare (o ISM) ci riferiamo al gas e polvere cheoccupano lo spazio interstellare. L’ISM e costituito da una miscela estrema-mente diluita (se confrontata alle densita terrestri) di ioni, atomi, molecole,grani di polvere, raggi cosmici, e campi magnetici galattici. Il mezzo in-terstellare ricopre un ruolo fondamentale nell’astrofisica rappresentando ilpunto di congiunzione tra scale stellari e scale galattiche. Le stelle si formanoall’interno delle regioni piu dense del mezzo interstellare, le nubi molecolari,e lo riforniscono di materia ed energia tramite l’azione delle nebulose plan-etarie, dei venti stellari, e delle supernovae. Questa interazione tra stelle emezzo interstellare ci aiuta a determinare il tasso con cui una galassia perdeil suo contenuto gassoso e il tempo di vita del processo di formazione stellareattiva.
La distribuzione e la massa delle varie componenti dell’ISM (gas ato-mico, gas molecolare freddo e denso, gas caldo e ionizzato, . . .) variano pergalassie differenti per tipo morfologico, peculiarita, o proprieta dell’ambientecircostante. Poiche le differenze sui contenuti stellari tra galassie dei primitipi e quelle di morfologia piu avanzata possono essere studiate in terminidi differenze delle proprieta del loro ISM, l’analisi del mezzo interstellare efondamentale per comprendere la natura delle galassie.
Ogni intervallo dello spettro elettromagnetico ci fornisce informazioni sucomponenti diverse dell’ISM: le righe ottiche tracciano regioni ionizzate oregioni HII, l’intervallo infrarosso da informazioni sulla radiazione prove-niente dai grani di polvere interstellare, la riga di emissione a 2.6 mm dellamolecola di monossido di carbonio e un buon tracciante del gas molecolare,la riga a 21 cm traccia il gas atomico, e nell’intervallo di lunghezze d’ondadell’ordine del decimetro e metro si possono rivelare forti sorgenti della ra-diazione continua di sincrotrone.
Lo studio del mezzo interstellare delle galassie si sta avvicinando ad unafase di grande progresso tecnologico, soprattutto relativamente alla com-ponente molecolare. Strumenti millimetrici sia single-dish (FCRAO 14 m,IRAM 30 m, NRO 45 m) che interferometri (IRAM, CARMA, NRO, SMA)sono in grado di osservare ad alta risoluzione (<10′′) le (sotto)strutturedelle nubi molecolari presenti nelle galassie. L’immediato futuro, grazie allacostruzione di nuovi strumenti - primo fra tutti l’Atacama Millimeter Array(ALMA) - sara contraddistinto da una rivoluzione nel campo dell’astronomiamillimetrica. ALMA, operando a lunghezze d’onda tra 0.3 e 9.6 millimetrie raggiungendo risoluzioni di 0.005′′, ricoprira un ruolo simile a quello chel’HST ha avuto nel dominio ottico dando inizio a nuove possibilita e strategieosservative.
In questa tesi di dottorato ci siamo dedicati ad uno dei principali ar-gomenti che ALMA si prefigge di studiare, il gas molecolare nelle galassieesterne, con l’obiettivo di non farci trovare impreparati all’arrivo di questo
iii
iv
strumento. Questa tesi studia la fisica di eccitazione a piccola scala, leproprieta di frammentazione, la distribuzione, e la cinematica del gas mole-colare in due galassie vicine (Messier 81 e NGC 3147) con osservazioni ot-tenute sia con uno strumento millimetrico single-dish che con un radioin-terferometro. Affrontiamo inoltre il problema della variazione del fattore diconversione H2-CO in galassie esterne. Il valore assunto da questo rapporto,definito come X = N(H2)/ICO, e una problematica molto discussa poicheesso dipende dalle particolari condizioni fisico-chimiche del gas molecolare(e.g. temperature, densita, e metallicita). Il rapporto di riga e un altrostrumento utilizzato in questa tesi per derivare le condizioni fisiche del gas,come temperatura di eccitazione e profondita ottica. In combinazione e inmaniera complementare a questi due studi dettagliati sul gas molecolare ingalassie specifiche, in questa tesi presentiamo anche un lavoro statistico edinterpretativo sulle relazioni esistenti tra differenti componenti dell’ISM ot-tenuto analizzando un campione di galassie di tutte le morfologie, attivitanucleare, e tipo di interazione. Alcune relazioni, come quella gia nota trail flusso della riga CO(1-0) e quello a 100 µm per galassie ellittiche, ven-gono confermate ed estese analizzando un grande ed eterogeneo campionedi galassie, altre invece che sembrano non valere solo per specifiche tipologiedi galassie vengono interpretate con l’aiuto di modelli chimico-dinamici.
Questo duplice approccio allo studio del mezzo interstellare - analisi det-tagliata della componente molecolare di singole galassie e studio statisticodelle relazioni tra differenti componenti dell’ISM per un grande campione digalassie - ci ha aiutato a comprendere meglio lo scenario alquanto complessoche si prospetta studiando il mezzo interstellare. Particolare attenzione estata rivolta alla componente molecolare nelle galassie.
La tesi e strutturata nella seguente maniera: nel primo capitolo de-scriviamo le principali caratteristiche delle diverse fasi del mezzo interstel-lare. Il secondo capitolo e interamente dedicato alla componente molecolaredell’ISM, fornendo una panoramica dettagliata delle proprieta delle princi-pali strutture di gas molecolare (nubi molecolari, clumps molecolari, . . .) edel loro legame con il processo di formazione stellare. Viene anche descrittala problematica legata alla variazione del fattore di conversione H2-CO, para-metro usato in tutti gli studi sul gas molecolare, e la distribuzione del gas alvariare del tipo morfologico, dell’ambiente, del redshift, e dell’attivita. Nelterzo capitolo presentiamo un’analisi sulle relazioni esistenti tra i flussi dellariga CO(1-0), a 100 µm, della luminosita B, e dei raggi X per un campione di∼ 3000 galassie. Il quarto capitolo e interamente dedicato allo studio dellacomponente molecolare gassosa nella regione centrale della galassia M 81.Nel quinto capitolo analizziamo il gas molecolare della galassia Seyfert 2NGC 3147 con l’obiettivo di studiare i meccanismi di rifornimento di gas delsuo Nucleo Galattico Attivo (AGN). Nel sesto capitolo riassumiamo i risul-tati ottenuti e descriviamo il ruolo e l’importanza che attualmente rivesteuna ricerca sul gas molecolare.
Preface (French Preface)
Le Milieu Interstellaire (ou MIS) est compose du gaz et de la poussierequi occupent l’espace interstellaire. Le MIS est constitue d’un melangeextremement dilue (par rapport aux densites terrestres) d’ions, d’atomes,de molecules, de grains de poussiere, rayons cosmiques, et champ magnetiquegalactique. Le milieu interstellaire joue un role fondamental en astrophysique,etant le point de jonction entre les echelles stellaires et galactiques. Lesetoiles se forment dans les regions les plus denses du milieu interstellaire, lesnuages moleculaires, et elles le reapprovisionnent en matiere et energie parl’action des nebuleuses planetaires, des vents stellaires, et des supernovae.Cette interaction entre etoiles et milieu interstellaire nous aide a determinerle taux avec lequel une galaxie consume son contenu gazeux, et donc la dureede vie du processus de formation stellaire.
La distribution et la masse des diverses composantes du MIS (gaz ato-mique, gaz moleculaire froid et dense, gaz chaud et ionise, . . .) varientde galaxie a galaxie en fonction du type morphologique, de leur degre deperturbations/interactions, et en fonction de l’environnement. Puisque lesdifferences en contenu stellaire entre galaxies des differents types morphologi-ques peuvent etre etudiees et rapportees aux proprietes de leur MIS, l’analysedu milieu interstellaire est fondamentale pour comprendre la nature des gal-axies.
Chaque intervalle du spectre electromagnetique nous fournit des infor-mations sur des composantes differentes du MIS: les raies optiques tracentles regions ionisees ou regions HII, l’infrarouge donne des informations surle rayonnement provenant des grains de poussiere, la raie de rotation a2.6 mm de la molecule de monoxyde de carbone est un bon traceur du gazmoleculaire, la raie a 21 cm trace le gaz atomique, et le domaine de longueursd’onde du decimetre et du metre revele les sources de rayonnement continusynchrotron ou free-free (supernovae, formation d’etoiles).
L’etude du milieu interstellaire des galaxies va entrer dans une phase degrand progres technologique, surtout relativement a sa composante molecu-laire. Aujourd’hui les telescopes millimetriques a antenne unique (FCRAO14 m, NRO 45m, IRAM 30 m) et les interferometres (IRAM, NRO, CARMA)peuvent resoudre avec une resolution spatiale raisonnable (< 10′′) les (sous)-structures des nuages moleculaires presentes dans les galaxies. Le futurimmediat, grace a la construction de nouveaux instruments - essentiellementAtacama Millimeter Array (ALMA) - sera caracterise par une revolutiondans le champ de l’astronomie millimetrique. ALMA, en operant aux lon-gueurs d’onde entre 0.3 et 9.6 millimetres et en atteignant une resolution de0.005′′, jouera un role similaire a celui du HST dans le domaine optique endonnant a l’astronomie des nouvelles possibilites observationnelles.
Cette these de doctorat est dediee a un des principaux sujets qu’ALMApourra approfondir, le gaz moleculaire dans les galaxies exterieures, avec
v
vi
l’objectif d’etre bien prepare a l’arrivee de ce instrument. Cette these etudiela physique de l’excitation collisionnelle a petite echelle, les proprietes defragmentation, la distribution, et la cinematique du gaz moleculaire en deuxgalaxies proches (Messier 81 et NGC 3147) avec des observations obtenuessoit avec un instrument millimetrique a antenne unique, soit avec un in-terferometre. Nous etudions aussi le probleme de la variation du facteurde conversion H2-CO dans les galaxies exterieures. La valeur supposee dece rapport, defini comme X = N(H2)/ICO, releve d’une problematiquetres debattue car elle depend des conditions physico-chimiques particulieresdu gaz moleculaire (e.g. temperature, densite, et metallicite). Le rapportd’intensite des raies CO(1-0) et CO(2-1) est des moyens utilises dans cettethese pour deduire les conditions physiques du gaz, comme la temperatured’excitation et l’epaisseur optique. En complement a ces deux etudes detail-lees du gaz moleculaire dans des galaxies specifiques, cette these presenteaussi un travail statistique et son interpretation sur les relations existantesentre les differentes composantes du MIS, obtenu en analysant un echantillonde galaxies de tout type morphologique, activite nucleaire, et type d’intera-ction. Quelques relations, comme par exemple celle deja connue entre leflux de la raie CO(1-0) et le flux infrarouge a 100 µm, sont confirmees etetendues en analysant un grand echantillon heterogene de galaxies; d’autresmoins connues qui font intervenir des (sous)echantillons des galaxies, sontinterpretees avec l’aide de modeles couplant la chimie et la dynamique.
Cette double approche a l’etude du milieu interstellaire - analyse detailleede la composante moleculaire des galaxies individuelles et etude statistiquedes relations entre les differentes composantes du MIS pour un grand echan-tillon de galaxies - a aide a mieux comprendre le scenario complexe quicontrole la physique du milieu interstellaire.
La these est structuree de la facon suivante: dans le premier chapitrenous decrivons les principales caracteristiques des differentes phases du mi-lieu interstellaire. Le deuxieme chapitre est entierement consacre a la com-posante moleculaire du MIS, en fournissant une panoramique detaillee desproprietes des principales structures du gaz (nuages moleculaires, grumeauxet sous-structures) et de leur lien avec le processus de formation stellaire.Dans ce chapitre nous decrivons aussi la problematique liee a la varia-tion du facteur de conversion H2-CO, parametre utilise dans toutes lesetudes du gaz moleculaire, la repartition du gaz selon le type morphologique,l’environnement, le redshift, et l’activite de formation d’etoiles. Dans letroisieme chapitre nous presentons une analyse des correlations entre lesflux de la raie CO(1-0), le flux infrarouge a 100 µm, la luminosite B, etles rayons X pour un echantillon de ∼3000 galaxies. Le quatrieme chapitreest entierement dedie a l’etude de la composante moleculaire dans la regioncentrale de la galaxie M 81. Dans le cinquieme chapitre nous analysons legaz moleculaire de la galaxie Liner 2 NGC 3147 avec l’objectif d’etudier lesmecanismes de ravitaillement de gaz de son Noyau Galactique Actif (AGN).Dans le sixieme chapitre nous resumons les resultats obtenus et decrivons lerole et l’importance que revet actuellement une these sur le gaz moleculaire.Grace a la construction de nouveaux instruments, ALMA en particulier,l’astronomie millimetrique entre dans une phase de progres considerable.
Preface
With the term of Interstellar Medium (or ISM) we refer to the gas and thedust that pervade the interstellar space. The ISM consists of an extremelydilute (by terrestrial standards) mixture of ions, atoms, molecules, dustgrains, cosmic rays, and (galactic) magnetic fields. The interstellar mediumplays a crucial role in astrophysics because it intermediates between stel-lar and galactic scales. Stars form within the densest regions of the ISM,molecular clouds, and replenish the ISM with matter and energy throughplanetary nebulae, stellar winds, and supernovae. This interplay betweenstars and the ISM helps to determine the rate at which a galaxy depletes itsgaseous content, and therefore its lifespan of active star formation.
The distribution and mass of the different components of the ISM (theatomic gas, the cold dense molecular gas, the hot ionized gas, . . .) change fordifferent galaxies, according to their Hubble morphological types, peculia-rities, or properties of the environment. Since differences in stellar contentsand light distributions of early- and late-type galaxies can be studied asdifferences in their ISM, the study of the interstellar medium is fundamentalfor understanding the nature of the galaxies.
Observations of different energy ranges give us information on differentgas components of the ISM: the optical lines trace ionized regions or HII re-gions, the infrared range gives information on the radiation from interstellardust grains, the 2.6 mm emission line of the carbon monoxide molecule is agood tracer of the molecular gas, the 21 cm line traces the atomic gas, andin the meter and decimeter range we can detect strong sources of continuoussynchrotron radiation.
The study of the interstellar medium in galaxies is currently in a phaseof strong technical progress, especially concerning the molecular gas compo-nent of the ISM. Both millimeter-wave single-dish telescopes (FCRAO 14 m,IRAM 30 m, NRO 45 m) and interferometers (IRAM, CARMA, NRO, SMA)already perform high resolution observations (< 10′′) resolving (sub)struc-tures of the molecular clouds present in the galaxies. The immediate futurewith the construction of new instruments, the Atacama Millimeter Array(ALMA) in particular, will bring a great revolution in millimeter astronomy.ALMA, operating at wavelengths between 0.3 to 9.6 millimeters and withresolutions as fine as 0.005′′, will play a role similar to HST in the opticaldomain by opening a completely new range of observational possibilities.
In this PhD Thesis we focus on a important topic of the ALMA science,the molecular gas in external galaxies in order to prepare ourselves to thisrevolutionary instrument. We investigate the small scale excitation, frag-mentation properties, distribution and kinematics of the molecular gas intwo nearby galaxies (Messier 81 and NGC 3147) observed both with single-dish and interferometer instruments. We discuss the problem of the H2-COconversion factor variation in external galaxies. The value of this factor,
vii
viii
defined as X = N(H2)/ICO, is matter of discussion because it appears todepend on the particular physical and chemical conditions of the moleculargas (e.g. temperature, density, and metallicity). The line ratio is also usedto derive the physical conditions of the gas, such as excitation temperatureand optical depth. In combination and complementary to these two detailedstudies on the molecular gas component in specific galaxies, in this Thesiswe also present a statistical and interpretative work on the relations existingbetween different components of the ISM obtained considering a sample ofgalaxies of all the morphologies, nuclear activities, and type of interaction.Some relations, such as that known between CO and the 100 µm fluxesfor early-type galaxies, are confirmed and extended considering a large andheterogeneous sample of galaxies, other relationships lacking for particu-lar typologies of galaxies are interpreted with the help of chemo-dynamicalmodels.
This double approach to the study of the interstellar medium - a detailedanalysis of the molecular component of single galaxies and a statistical studyof the relations between different components of the ISM for a large sampleof galaxies - helped us to understand better the complex scenario of theISM. Major efforts have been dedicated to the molecular gas component inthe galaxies.
The Thesis is organized as follows: in the first chapter we describe theprincipal characteristics of the different phases of the interstellar medium.The second chapter is completely dedicated to the molecular component ofthe ISM, describing the properties of the principal molecular gas structures(molecular clouds, molecular clumps, . . .) and their link with the star for-mation process. We also introduce the problem of the H2-CO conversionfactor variation, parameter always used in the studies of the molecular gas,and describe the molecular gas distribution in galaxies as a function of themorphological type, environment, redshift, and activity. In the third chap-ter we present a analysis of the relations existing between CO(1-0) line, 100µm, B, and X-ray fluxes for a sample of ∼ 3000 galaxies. The fourth chap-ter is devoted to a detailed study of the molecular gas component of theM 81 galaxy center. In the fifth chapter we analyze the molecular gas ofthe Seyfert 2 NGC 3147 galaxy to study the mechanisms for gas fueling ofits Active Galactic Nucleus (AGN). In the sixth chapter we summarize ourconclusions and describe the role - at the present day - of a Thesis on themolecular gas.
Contents
List of Figures xi
List of Tables xv
1 The Interstellar Medium 11.1 Components of the Interstellar Medium . . . . . . . . . . . . 21.2 Observation of different emissions in the ISM . . . . . . . . . 3
1.2.1 X-ray and Extreme UV emissions . . . . . . . . . . . . 31.2.2 UV emission . . . . . . . . . . . . . . . . . . . . . . . 41.2.3 Optical line emission . . . . . . . . . . . . . . . . . . . 61.2.4 Infrared emission: radiation by dust . . . . . . . . . . 71.2.5 Radio line emission . . . . . . . . . . . . . . . . . . . . 8
1.3 Other emissions . . . . . . . . . . . . . . . . . . . . . . . . . . 131.3.1 γ-ray emission . . . . . . . . . . . . . . . . . . . . . . 131.3.2 Thermal radio continuum emission . . . . . . . . . . . 131.3.3 Non-Thermal synchrotron emission . . . . . . . . . . . 15
2 Molecular gas in galaxies 192.1 Molecular Clouds . . . . . . . . . . . . . . . . . . . . . . . . . 192.2 Cloud structure . . . . . . . . . . . . . . . . . . . . . . . . . . 20
2.2.1 The Virial Theorem for molecular clouds . . . . . . . 212.2.2 Structure analysis techniques . . . . . . . . . . . . . . 232.2.3 Clumps . . . . . . . . . . . . . . . . . . . . . . . . . . 24
2.3 Star formation in molecular clouds . . . . . . . . . . . . . . . 262.4 Molecular gas content . . . . . . . . . . . . . . . . . . . . . . 29
2.4.1 CO-H2 conversion factor . . . . . . . . . . . . . . . . . 292.4.2 Intensity line ratios . . . . . . . . . . . . . . . . . . . . 30
2.5 Distribution and dynamics of the CO . . . . . . . . . . . . . . 332.5.1 Radial and vertical distribution . . . . . . . . . . . . . 332.5.2 Dynamics: bars, shells and tidal dwarfs . . . . . . . . 34
2.6 CO as a function of type and environment . . . . . . . . . . . 362.7 CO at high redshift . . . . . . . . . . . . . . . . . . . . . . . . 41
3 Relations between ISM tracers 433.1 Emissions and star formation . . . . . . . . . . . . . . . . . . 433.2 The sample . . . . . . . . . . . . . . . . . . . . . . . . . . . . 443.3 Results . . . . . . . . . . . . . . . . . . . . . . . . . . . . . . . 45
3.3.1 Cold gas and warm dust . . . . . . . . . . . . . . . . . 453.3.2 X-ray component . . . . . . . . . . . . . . . . . . . . . 46
3.4 Discussion . . . . . . . . . . . . . . . . . . . . . . . . . . . . . 513.4.1 Late-type galaxies . . . . . . . . . . . . . . . . . . . . 523.4.2 Early-type galaxies . . . . . . . . . . . . . . . . . . . . 53
ix
x CONTENTS
3.5 Modelling early-type galaxies . . . . . . . . . . . . . . . . . . 553.5.1 The galactic radius and mass of stars and gas . . . . . 573.5.2 The scale radii . . . . . . . . . . . . . . . . . . . . . . 583.5.3 The star formation history . . . . . . . . . . . . . . . 59
3.6 Conclusions . . . . . . . . . . . . . . . . . . . . . . . . . . . . 61
4 Messier 81 634.1 The idea . . . . . . . . . . . . . . . . . . . . . . . . . . . . . . 634.2 Observations . . . . . . . . . . . . . . . . . . . . . . . . . . . 654.3 Molecular gas emission . . . . . . . . . . . . . . . . . . . . . . 67
4.3.1 A and B receivers . . . . . . . . . . . . . . . . . . . . 674.3.2 HERA receiver . . . . . . . . . . . . . . . . . . . . . . 684.3.3 Line ratio . . . . . . . . . . . . . . . . . . . . . . . . . 68
4.4 Clumping properties of the gas . . . . . . . . . . . . . . . . . 744.4.1 Molecular Associations . . . . . . . . . . . . . . . . . . 784.4.2 GMAs masses . . . . . . . . . . . . . . . . . . . . . . . 794.4.3 Virial equilibrium . . . . . . . . . . . . . . . . . . . . 804.4.4 The X factor for M 81 . . . . . . . . . . . . . . . . . . 82
4.5 Comparison with previous works . . . . . . . . . . . . . . . . 844.6 Discussion . . . . . . . . . . . . . . . . . . . . . . . . . . . . . 87
4.6.1 The X problem . . . . . . . . . . . . . . . . . . . . . . 874.6.2 Heating of the gas . . . . . . . . . . . . . . . . . . . . 88
4.7 Conclusions . . . . . . . . . . . . . . . . . . . . . . . . . . . . 904.8 Future perspectives . . . . . . . . . . . . . . . . . . . . . . . . 91
5 NUGA survey: NGC 3147 955.1 NUGA project . . . . . . . . . . . . . . . . . . . . . . . . . . 95
5.1.1 Aims and results already obtained . . . . . . . . . . . 955.2 NGC 3147 galaxy . . . . . . . . . . . . . . . . . . . . . . . . . 1005.3 Observations . . . . . . . . . . . . . . . . . . . . . . . . . . . 101
5.3.1 IRAM single dish CO and HCN observations . . . . . 1015.3.2 IRAM interferometer CO observations . . . . . . . . . 1035.3.3 Near-infrared observations . . . . . . . . . . . . . . . . 1045.3.4 Archival observations with Spitzer and GALEX . . . 105
5.4 Single dish results . . . . . . . . . . . . . . . . . . . . . . . . 1055.5 Interferometric results:
Molecular gas properties . . . . . . . . . . . . . . . . . . . . . 1075.5.1 Morphology and mass of the CO rings . . . . . . . . . 1075.5.2 Kinematics of the CO rings . . . . . . . . . . . . . . . 112
5.6 Comparison with Spitzer and GALEX . . . . . . . . . . . . . 1145.7 Computation of the torques . . . . . . . . . . . . . . . . . . . 118
5.7.1 Near infrared images . . . . . . . . . . . . . . . . . . . 1195.7.2 Evaluation of the gravitational potential . . . . . . . . 1205.7.3 Evaluation of gravity torques . . . . . . . . . . . . . . 121
5.8 Discussion . . . . . . . . . . . . . . . . . . . . . . . . . . . . . 1235.9 Conclusions . . . . . . . . . . . . . . . . . . . . . . . . . . . . 125
6 Conclusions and Future Applications 1276.1 Conclusions and obtained results . . . . . . . . . . . . . . . . 1276.2 The future: ALMA . . . . . . . . . . . . . . . . . . . . . . . . 129
6.2.1 Synergy between ALMA and Herschel . . . . . . . . . 131
7 Candidate’s list of papers 133

CONTENTS xi
Bibliography 133
Acknowledgements 147

List of Figures
1.1 FIR SEDs for some spiral galaxies . . . . . . . . . . . . . . . 71.2 The contribution of the UV light from HII regions . . . . . . 91.3 Spitzer images of M 81 galaxy . . . . . . . . . . . . . . . . . . 101.4 CO luminosities and virial mass of molecular clouds . . . . . 121.5 The observed radio/FIR spectrum of M 81 . . . . . . . . . . . 14
2.1 Rosette and G216-2.5 molecular clouds . . . . . . . . . . . . . 242.2 Phases of the star formation . . . . . . . . . . . . . . . . . . . 272.3 Comparison between stellar IMFs . . . . . . . . . . . . . . . . 282.4 The X ratio . . . . . . . . . . . . . . . . . . . . . . . . . . . . 302.5 R21 ratios vs. excitation temperature . . . . . . . . . . . . . . 322.6 CO(1-0) integrated intensity for NGC 3627 . . . . . . . . . . 342.7 A Digitized Sky Survey image of Cen A . . . . . . . . . . . . 352.8 Gas content for normal and interacting galaxies . . . . . . . . 382.9 LFIR vs. morphological type for different galaxies . . . . . . . 392.10 Star formation efficiency for different galaxies . . . . . . . . . 40
3.1 CO(1-0) vs. 100 µm for early-types and early spirals . . . . . 463.2 CO(1-0) vs. 100 µm for late spirals . . . . . . . . . . . . . . . 473.3 mFIR vs. CO(1-0) for early-types and early spirals . . . . . . 483.4 mFIR vs. CO(1-0) for late spirals . . . . . . . . . . . . . . . . 493.5 LX vs. LB for late-type non-active galaxies . . . . . . . . . . 503.6 LX vs. LFIR for late-type non-active galaxies . . . . . . . . . 513.7 LX vs. LB for early-type non-active galaxies . . . . . . . . . . 523.8 LX vs. LFIR for early-type non-active galaxies . . . . . . . . 533.9 LX vs. LB for active galaxies . . . . . . . . . . . . . . . . . . 543.10 LX vs. LFIR for active galaxies . . . . . . . . . . . . . . . . . 553.11 LFIR vs. LX with two template models . . . . . . . . . . . . 563.12 LFIR vs. LX , models of the 1.6 × 10¹¹M⊙ baryonic mass
galaxy with variation of the galactic radius, mass of stars,and mass of gas . . . . . . . . . . . . . . . . . . . . . . . . . . 57
3.13 LFIR vs. LX , models of the 1.6 × 10¹¹M⊙ baryonic massgalaxy for various core radii . . . . . . . . . . . . . . . . . . . 58
3.14 LFIR vs. LX , models of spirals and starbursters . . . . . . . . 603.15 LFIR vs. LX , models of fixed 1.6×10¹¹M⊙ baryonic mass for
various SFHs or at fixed SFH for various masses . . . . . . . 61
4.1 Optical image of Messier 81 . . . . . . . . . . . . . . . . . . . 644.2 Stellar light and HI distributions of the M 81 group . . . . . 654.3 A view of the IRAM 30 m telescope . . . . . . . . . . . . . . . 664.4 The field of our observations . . . . . . . . . . . . . . . . . . . 68
xiii
xiv LIST OF FIGURES
4.5 M 81, CO(1-0) map, IRAM 30 m A and B receivers . . . . . . 694.6 M 81, CO(2-1) map, IRAM 30 m A and B receivers . . . . . . 704.7 M 81, integrated CO(1-0) emission, IRAM 30 m A and B
receivers . . . . . . . . . . . . . . . . . . . . . . . . . . . . . . 714.8 M 81, CO(2-1) map, IRAM 30 m HERA receiver . . . . . . . 724.9 M 81, integrated CO(2-1) emission, IRAM 30 m HERA receiver 744.10 M 81, integrated CO(2-1) emission, IRAM 30 m A and B and
HERA receivers . . . . . . . . . . . . . . . . . . . . . . . . . 754.11 M 81, observations by Brouillet et al. (1991) . . . . . . . . . . 764.12 M 81, observations by Sage & Westpfahl (1991) . . . . . . . . 854.13 M 81, observations by Sakamoto et al. (2001) . . . . . . . . . 864.14 Virial mass-CO luminosity by Solomon et al. (1987) . . . . . 874.15 M 81, figure by Knapen et al. (2006) . . . . . . . . . . . . . . 894.16 Figure by Blitz & Rosolowsky (2006) with M 81 . . . . . . . 92
5.1 NGC 4826, figure by Garcıa-Burillo et al. (2003) . . . . . . . 975.2 NGC 7217, figure by Combes et al. (2004) . . . . . . . . . . . 995.3 NGC 3147 observed with the Palomar telescope . . . . . . . . 1005.4 NGC 3147, 3 mm and 1 mm continuum emission by Krips et
al. (2006) . . . . . . . . . . . . . . . . . . . . . . . . . . . . . 1015.5 NGC 3147, 18 cm and 6 cm continuum emission by Krips et
al. (2007a) . . . . . . . . . . . . . . . . . . . . . . . . . . . . . 1025.6 A view of the IRAM PdBI . . . . . . . . . . . . . . . . . . . . 1035.7 NGC 3147, CO(1-0) and CO(2-1) IRAM 30 m spectra maps . 1065.8 NGC 3147, HCN(1-0) IRAM 30 m spectrum . . . . . . . . . . 1075.9 NGC 3147, CO(1-0) IRAM PdBI velocity channel maps . . . 1085.10 NGC 3147, CO(1-0) IRAM PdBI integrated intensity contours 1095.11 NGC 3147, radial distribution of the CO(1-0) intensity . . . . 1095.12 NGC 3147, CO(2-1) IRAM PdBI integrated intensity contours 1105.13 NGC 3147, radial distribution of the CO(2-1) intensity . . . . 1105.14 NGC 3147, CO(1-0) and CO(2-1) emissions . . . . . . . . . . 1115.15 NGC 3147, CO(1-0) emission from Downes et al. (1991) . . . 1125.16 NGC 3147, CO(2-1)/CO(1-0) ratio map . . . . . . . . . . . . 1135.17 NGC 3147, integrated CO(1-0) emission and CO(1-0) mean-
velocity field . . . . . . . . . . . . . . . . . . . . . . . . . . . . 1135.18 NGC 3147, CO(1-0) position-velocity (p-v) diagram . . . . . 1145.19 NGC 3147, GALEX sky subtracted image . . . . . . . . . . . 1155.20 NGC 3147, CO(1-0) contour levels and GALEX image . . . . 1155.21 NGC 3147, CO(2-1) contour levels and GALEX image . . . . 1165.22 NGC 3147, 8 µm Spitzer image . . . . . . . . . . . . . . . . . 1175.23 NGC 3147, CO(1-0) contour levels and 8 µm Spitzer image . 1175.24 NGC 3147, CO(2-1) contour levels and 8 µm Spitzer image . 1185.25 NGC 3147, CO(1-0) linear contours and CFHT near-infrared
J image . . . . . . . . . . . . . . . . . . . . . . . . . . . . . . 1195.26 NGC 3147, strengths and phases of the m = 1 and m = 2
Fourier components of the stellar potential . . . . . . . . . . . 1205.27 NGC 3147, CO(1–0) contours and gravitational torque map . 1225.28 NGC 3147, CO(2–1) contours and gravitational torque map . 1235.29 NGC 3147, the fraction of the angular momentum transferred
from/to the gas in one rotation for CO(1-0) and CO(2-1) . . 1245.30 NGC 3147, model rotation curve and derived frequencies . . . 125
LIST OF FIGURES xv
6.1 Artist’s concept of ALMA in a compact configuration . . . . 1306.2 ALMA prototype antennas . . . . . . . . . . . . . . . . . . . 1316.3 Image of the Herschel Space Observatory . . . . . . . . . . . 132

LIST OF TABLES xvii
List of Tables
1.1 Principal parameters of the ISM components . . . . . . . . . 3
3.1 Sample of galaxies . . . . . . . . . . . . . . . . . . . . . . . . 44
4.1 M 81, fundamental parameters . . . . . . . . . . . . . . . . . 674.2 CO(1-0) and CO(2-1) intensity lines . . . . . . . . . . . . . . 734.3 M 81, R21 line ratio by Brouillet et al. (1991) . . . . . . . . . 774.4 M 81, GMAs identified with GAUSSCLUMPS . . . . . . . . . 814.5 M 81, properties of the GMAs . . . . . . . . . . . . . . . . . . 834.6 M 81, comparison between CO and FUV . . . . . . . . . . . . 90
5.1 NGC 3147, fundamental parameters . . . . . . . . . . . . . . 104

Chapter 1
The Interstellar Medium
Introduction
For centuries, astronomers believed that the space between the stars wasempty. It wasn’t until the eighteenth century, when William Herschel ob-served nebulous patches of sky through his telescope, that serious consider-ation was given to the notion that the interstellar space was something tostudy. It was only in the last century that observations of interstellar mate-rial suggested that it was not even uniformly distributed through space, butthat it had a unique structure. Today, we know that regions between thestars are far from to be empty, and that contain rarefied gas, dust particles,magnetic fields, relativistically moving electrons, protons and other atomicnuclei. These various components are coupled together, with the result thatfor many purposes they together form a single dynamical entity. The termsInterstellar Medium, Interstellar Matter, or simply the acronym ISM, arecommonly used to define this composite dynamical entity.
Even if the ISM only represents a small fraction (∼ 0.1) of the mass of thegalaxies, the distribution, the phases and the mass of different componentsof the interstellar medium change for different galaxies, according to theirHubble morphological types, peculiarities, or properties of the environment.Differences in stellar contents and light distributions of early- and late-typegalaxies can be studied as differences in their interstellar medium, and forthis reason the study of the ISM is a prerequisite for understanding whygalaxies are as we observe them.
Until the early 1980s it was thought that only spiral galaxies had asignificant interstellar medium, but microwaves, optical and X-ray surveyshave demonstrated that some elliptical galaxies also have a non negligibleinterstellar medium content. The most important difference between early-and late-type galaxies is nor so much in the quantity of the interstellarmedium, as in how the ISM is structured. In spiral galaxies the major partof the ISM resides in a cold component (in form of atomic and molecular gas)and a smaller fraction in photoionized gas. The hot coronal gas has a largevolume filling factor, but constitutes a small mass function. In contrast, thegreat majority of elliptical galaxies are much poorer in cool gas componentthan spirals of similar luminosity, while the most massive gaseous componentis hot X-ray coronal gas, usually extending to a large galactic radius, withmasses ranging between 108 to 1010 M⊙ (Fabbiano, 1989).
However the presence of a cold gas component has been also inferredfor elliptical galaxies from observations in the HI, far infrared (FIR) (suchas Knapp et al., 1985, 1989). A growing number of elliptical galaxies are
1
2 Chapter 1. The Interstellar Medium
now found to contain molecular gas component thanks to CO surveys (Leeset al., 1991; Bregman et al., 1992; Wiklind et al., 1995; Morganti et al.,2006; Combes et al., 2007) that reported the detection of several ellipticalscontaining molecular gas.
Then, elliptical and SO galaxies normally contain less ionized gas thanspirals, but significant detections of ionized gas also exist for early-typegalaxies. Spectroscopic surveys for Hα and [NII] emissions found a nonnegligible percentage of E and S0 galaxies with ionized gas. The mass of theionized gas in early-type galaxies is very small, with values typically in therange from 103 to 104 M⊙ (see Phillips et al., 1986; Sadler, 1987).
1.1 Components of the Interstellar Medium
The ISM has an extremely low density, lower than that of the best va-cuum created on Earth. For comparison, the air that we breathe contains3 ×1019 molecules/cm3, while the interstellar gas around our solar systemonly contains one atom in 10 cm3. The ISM is mainly made up of gaswith some dust. The gas is mostly hydrogen (90%), with a small amountof helium (9%), and very small quantities of heavier elements (1%). Thedust particles are extremely small, their size being about the wavelength ofblue light and consist of silicates, carbon, ice, and/or iron compounds. Inaverage, for every 106 atoms of hydrogen, there are 250 atoms of carbon,500 of oxygen and 80 of nitrogen. The average density of the ISM is of1 particle/cm3, and regions at higher density are molecular cloud cores withdensity ≥ 106 particles/cm3.
The physical conditions in the ISM span from extremely hot X-ray emit-ting plasma with typically T ≈ 107 K and ne ≈ 10−3 cm−3 to the coolmolecular phase with temperatures T ≈10 K (little above the 2.7 K cosmicbackground radiation) and molecular densities up to 103 cm−3.
The phase of the interstellar medium and the transitions to other phasesmainly depend on the energy quantity of the ISM. The stellar environmentsplay the main role as source of energy: stellar winds, supernova explosions,shock heating, and cosmic ray heating enrich the ISM with heavy elements.
The principal phases of the ISM are the neutral component, the colddense molecular component, and the hot ionized component. Most of themass is concentrated in cool dense clouds of molecular gas, while most ofvolume is occupied by hot dilute ionized hydrogen. Another component ofthe cooler part of the ISM consists of dust grains that, although they onlyconstitute the 1% of the total mass contained in the interstellar medium-containing ∼ 50% of the heavy elements of the ISM- and their effect on thedynamics of the gas is weak, they lead to efficient scattering, polarization,and absorption of starlight and thus provide important observational clues.
In addition to these thermal-gas components there is a background ofhigh-energy particles, the cosmic-ray component, consisting mainly of rela-tivistic electrons and ions, tied to the galaxy by its magnetic field. Thisis continuum radio emission (cm) and it mainly traces the high-energyprocesses and the structure or the intensity of the interstellar magnetic field.
Information on the physical conditions of the ISM can be obtained withobservations in different energy ranges. In the optical domain emission linesare the signatures of ionized regions or HII regions, infrared observationsallow to study the radiation from interstellar dust grains, and in the milli-metric domain the 2.6 mm emission line of the carbon monoxide molecule
1.2. Observation of different emissions in the ISM 3
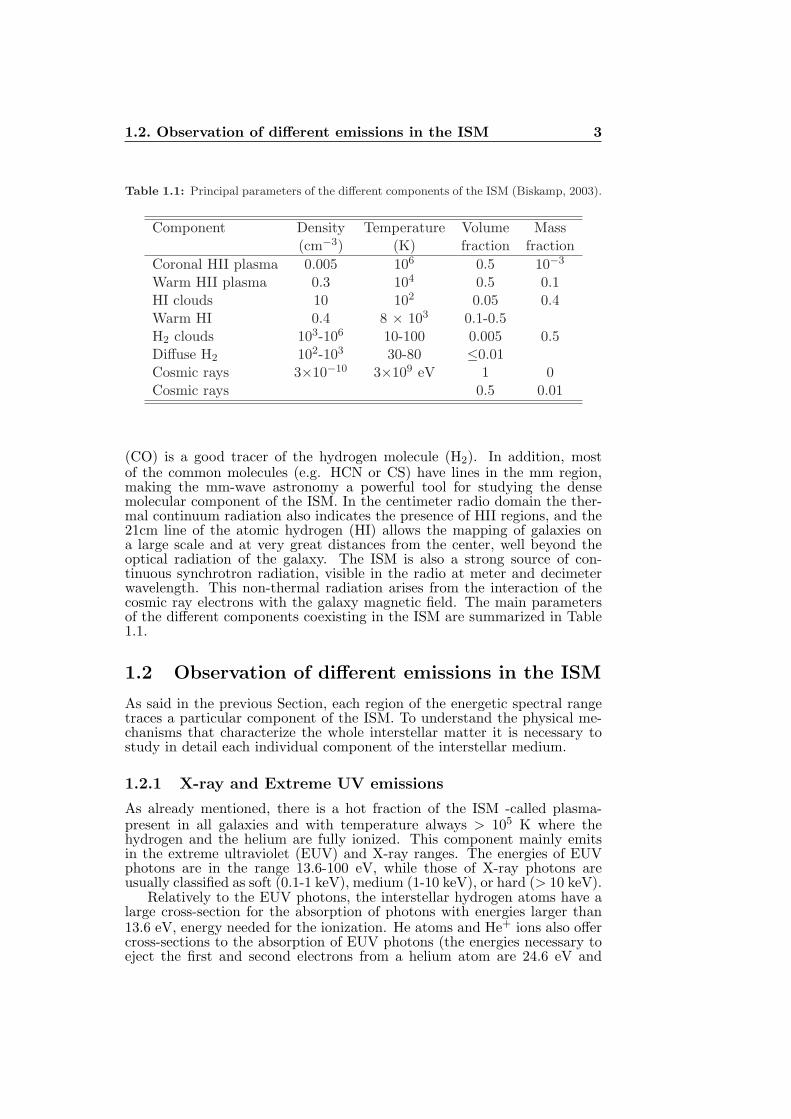
Table 1.1: Principal parameters of the different components of the ISM (Biskamp, 2003).
Component Density Temperature Volume Mass(cm−3) (K) fraction fraction
Coronal HII plasma 0.005 106 0.5 10−3
Warm HII plasma 0.3 104 0.5 0.1HI clouds 10 102 0.05 0.4Warm HI 0.4 8 × 10³ 0.1-0.5H2 clouds 103-106 10-100 0.005 0.5Diffuse H2 102-103 30-80 ≤0.01Cosmic rays 3×10⁻¹⁰ 3×10⁹ eV 1 0Cosmic rays 0.5 0.01
(CO) is a good tracer of the hydrogen molecule (H2). In addition, mostof the common molecules (e.g. HCN or CS) have lines in the mm region,making the mm-wave astronomy a powerful tool for studying the densemolecular component of the ISM. In the centimeter radio domain the ther-mal continuum radiation also indicates the presence of HII regions, and the21cm line of the atomic hydrogen (HI) allows the mapping of galaxies ona large scale and at very great distances from the center, well beyond theoptical radiation of the galaxy. The ISM is also a strong source of con-tinuous synchrotron radiation, visible in the radio at meter and decimeterwavelength. This non-thermal radiation arises from the interaction of thecosmic ray electrons with the galaxy magnetic field. The main parametersof the different components coexisting in the ISM are summarized in Table1.1.
1.2 Observation of different emissions in the ISM
As said in the previous Section, each region of the energetic spectral rangetraces a particular component of the ISM. To understand the physical me-chanisms that characterize the whole interstellar matter it is necessary tostudy in detail each individual component of the interstellar medium.
1.2.1 X-ray and Extreme UV emissions
As already mentioned, there is a hot fraction of the ISM -called plasma-present in all galaxies and with temperature always > 105 K where thehydrogen and the helium are fully ionized. This component mainly emitsin the extreme ultraviolet (EUV) and X-ray ranges. The energies of EUVphotons are in the range 13.6-100 eV, while those of X-ray photons areusually classified as soft (0.1-1 keV), medium (1-10 keV), or hard (> 10 keV).
Relatively to the EUV photons, the interstellar hydrogen atoms have alarge cross-section for the absorption of photons with energies larger than13.6 eV, energy needed for the ionization. He atoms and He+ ions also offercross-sections to the absorption of EUV photons (the energies necessary toeject the first and second electrons from a helium atom are 24.6 eV and
4 Chapter 1. The Interstellar Medium
54.4 eV, respectively). Since significant column densities of HI, He and He+
accumulate over short distances along any line of sight from the Sun, thelocal ISM is highly opaque to EUV photons and it is extremely difficult toprobe the Milky Way and external galaxies with observations in the EUVband.
The X-rays emitted by a plasma are generated by two principal mecha-nisms: (i) the bremsstrahlung process, where a free electron scatters offan ion, and (ii) the bound-bound transitions of ions, in which an excitedstate of an ion decays to a less energetic state.
In a hot plasma the bremsstrahlung emissivity is proportional to thesquare of the density of the plasma (ρ2). It happens because the electrondensity is proportional to ρ and the rate at which electron suffers collisionsis proportional to the ion density, which is itself proportional to ρ.
In an optically thin medium the ions are excited by collisions with ener-getic electrons and de-excited either by collision with a second electron, orradiatively through the emission of a photon. At the typical densities of thehot plasma, collisional de-excitation is much less important than radiativedecay, with the result that essentially every collisional excitation gives riseto the emission of a photon. So, the luminosity per unit volume in lineradiation also is proportional to ρ2.
In a hot plasma, the bremsstrahlung radiation is not the only emissionprocess. At high temperatures low-mass atoms are fully ionized, but heavierhighly-charged nuclei are able to hold on to some of their most tightly boundelectrons. These remaining bound electrons are excited to higher levelsby collisions with energetic free electrons in the hot gas. The consequentradiative decay of these excited atoms produces X-ray emission. Thus, theX-ray spectra generally contain discrete emission lines from various highly-ionized heavy elements on top of the bremsstrahlung continuum.
Analyzing a X-ray spectrum, it is possible to determine the temperature,density and metallicity of a plasma. Another parameter that alters thespectrum at low energies is the amount of absorption by cold gas alongthe line of sight, either in the local ISM or in any material surroundingthe emitting object. All these quantities can be estimated by comparingthe observed spectrum to ones simulated using the full range of plausibleparameter values.
1.2.2 UV emission
The ultraviolet emission (4-400 nm), between X-rays and blue visible light,gives us useful information about the stellar content of a galaxy. For in-stance, the spiral arms in a spiral galaxy contain many hot blue and blue-white stars. These regions are more prominent when viewed in UV light thanother regions that are dominated by older stars which have redder colours.In galaxies the UV emission is dominated by contribution from early-typestars (O, B stars).
The UV window has been less explored until the advent of space astro-nomy: from spatial missions we know that UV observations produce moredifferent samples of galaxies than observations made from the ground lookingat visible light. These studies have shown that UV output is proportionalto the rate at which stars form, the star formation rate (SFR). UV is amuch more sensitive energy range for tracking evolution and star formationactivity within galaxies because the brightest stars are the hottest and emita lot of UV radiation.
1.2. Observation of different emissions in the ISM 5
Thanks to UV emission detected by satellites -the most recent is theGalaxy Evolution Explorer satellite (GALEX )- we can investigate the starformation history, how star formation in galaxies evolved from the earlyUniverse up to the present. With the GALEX satellite we hope to learnanswers to the questions, “When and where did the stars and elements wesee today have their origin?” and “What factors cause star formation ingalaxies?”. UV astronomy is mapping the history of star formation in theUniverse 80 percent of the way back to the Big Bang.
The main problem afflicting UV SFR indicators, but also optical, is dustattenuation. We need to consider two aspects linked to this problem. Oneis that regions with moderate amounts of dust are obscured in a way thatdepends not only on the amount of dust but also on the distribution of theemitters relative to the absorbers (Calzetti et al., 2005). This problem isdue to the fact that populations of different ages suffer different amounts ofdust extinction (e.g. Calzetti et al., 1994; Charlot & Fall, 2000; Zaritsky etal., 2004). In addition, it has been shown that quiescently star-forming gal-axies follow a dust opacity-reddening relation different by star-burst galaxies(e.g. Gordon et al., 2004; Laird et al., 2005). In particular, their IR/UV ra-tio, a measure of dust opacity, is on average lower than that of starburstsfor the same UV colour, a measure of dust reddening, and shows a largerspread. Different ratios between current SFR and lifetime SFR, defined as“b-parameter”, for star-forming and starburst galaxies have been invoked asan explanation for the observed difference (Kong et al., 2004).
A second problem is the unknown fraction of star formation that is com-pletely obscured by dust at UV and optical wavelengths. The UV andfar-infrared (FIR) emissions may, indeed, probe different regions/stages ofstar formation. Heavy obscuration is generally tied to the first temporalphases of star formation, roughly a few million years; as the stars age, theytend to drift off the parental cloud and diffuse in regions of lower gas/dustdensity or to disperse the natal gas/dust cloud (Leisawitz & Hauser, 1988).Estimates indicate that the fraction of completely obscured star formation isrelatively small in the local Universe, ∼ 20% - 30% (Calzetti, 2001), but un-certainties are larger and their impact on the calibration of SFR indicatorsmostly unprobed.
Interesting results on the relation between dust extinction and SF havebeen also obtained by Sullivan et al. (2001). They, presenting a decimetricradio survey undertaken with the Very Large Array, have compared in-dependent star formation diagnostics (Hα, UV continuum, and 1.4 GHz)for a UV-selected sample of nearby galaxies. Sullivan et al. (2001) havefound broad correlations over several orders of magnitude between the dif-ferent SF diagnostics but with a large galaxy-to-galaxy scatter and off-sets/nonlinearities from relations predicted using simple dust extinction andSF scenarios. Finding evidence for luminosity dependent effects, they haveshown that luminosity dependent dust corrections, or a miscalibration ofthe 1.4 GHz-SFR calibration, or a combination of both, can go some wayto resolving this effect. They have concluded that differential extinctionbetween galaxies cannot be solely responsible for the scatter in relations be-tween different star formation diagnostics, and that discrepancies betweendifferent SF diagnostics can only be partly explained by simple models ofdust extinction in galaxies. These models cannot by themselves explain allthe observed differences, introducing the need for temporally varying SFHsand/or more complex models of extinction.
6 Chapter 1. The Interstellar Medium
1.2.3 Optical line emission
Emission optical lines, present in the spectra of many galaxies, are generallyformed in excited interstellar gas. The gas has usually been excited byionizing radiation from either hot stars or an active galactic nucleus, or alsoit has been excited by the passage of a powerful shock wave. The more im-portant case is however that of the photo-excited regions, characterized bythe presence of atoms in higher states of ionization than would occur in ther-modynamic equilibrium at the kinetic temperatures of the gas (T ≃ 8000 K).
The spectra of hot stars are generally such that the radiation from thesestars ionizes all hydrogen atoms within some limiting distance from the stars,while material beyond this distance is neutral. Regions of ionized hydrogenare called HII regions and the volume within which they are contained arecalled Stromgren spheres.
Hydrogen lines
In the optical spectra of HII regions lines of the Balmer series (such asHα at 656 nm, Hβ at 486 nm and Hγ at 434 nm) are prominent. In thethermodynamic equilibrium at the kinematic temperature of a typical HIIregion (∼8000 K), there would be negligible flux in these lines since theyarise from states that lie more than 12 eV above hydrogen’s ground state.It follows that the observed lines are produced by H atoms cascading totheir ground state following capture of an electron by a proton. The relativeintensities of the different lines formed by this recombination process canbe accurately calculated, and depend only weakly on T and -for interstellardensities- negligibly on the density. The Hα line is caused by the recom-bination process passing through the stage H(n=3)→H(n=2) + hν. Thisemission is the conventional standard by which to gauge star formation(Kennicutt et al., 1998b). The idea of this method is quite straightforward:if the galaxy is optically thick it will absorb all the ionizing photons emit-ted by OB stars. Thus the total number of ionizing photons emitted andthe ionizations are balanced by the total number of recombination per unittime. However, to derive the SFR of a galaxy from the observed Hα fluxone needs stellar evolution and photoionization models.
Metal lines
In the spectra of the HII regions there are two most prominent lines, the N1at 500.7 nm and the N2 at 495.9 nm. These lines, “forbidden” as demon-strated by Bowen (1927), are lines of the O2+. In general the spectra ofinterstellar nebulae are dominated by forbidden and semi-forbidden lines ofthe ions of heavy elements such as N, O and S. These ions are over 1000times rarer than those of H and He, and the transitions that are dominatingthe observed radiation are precisely the least probable transitions of theseions.
The only excited states of ions that will be significantly populated in anHII region are those whose energies lie within a few times kT ≃ 1 eV of therelevant ground-state energy. All such low-lying states have the same elec-tronic “configuration” as the ground state, with the result that all transitionsbetween them and the ground state are forbidden. The forbidden nature ofthese transitions prevents their giving rise to interstellar absorption, andsignificant interstellar absorption from ground states only occurs in the UVrange.
1.2. Observation of different emissions in the ISM 7
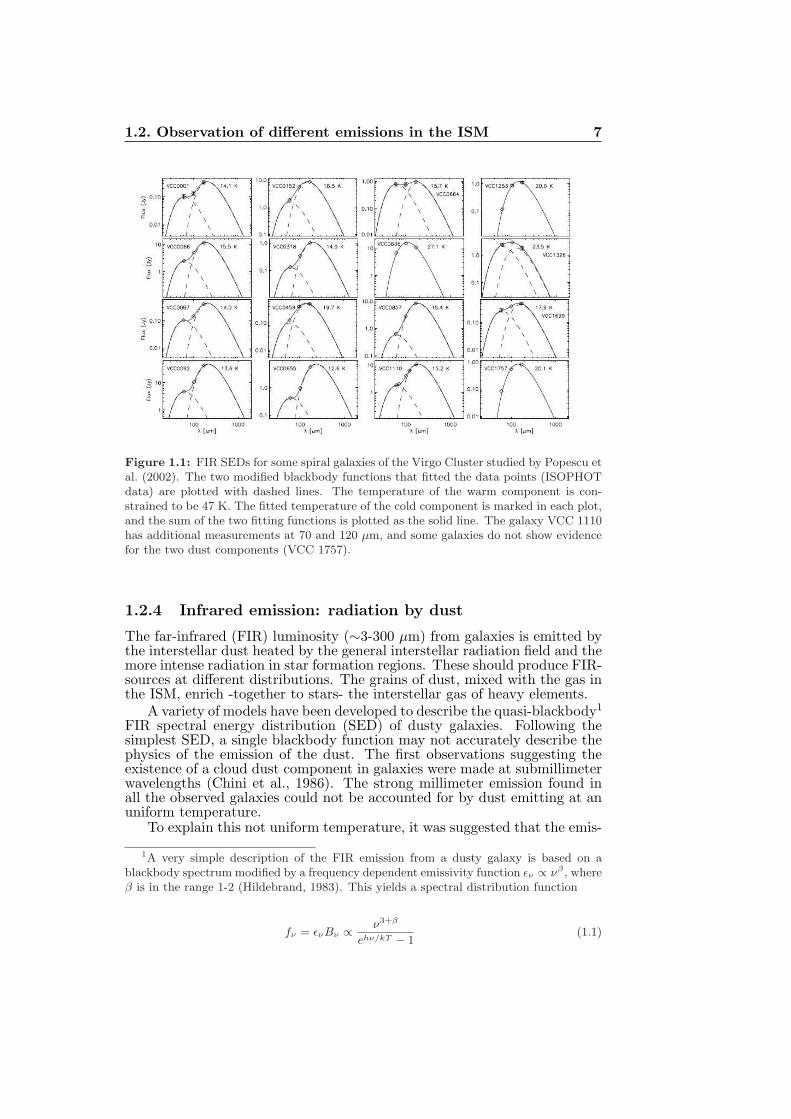
Figure 1.1: FIR SEDs for some spiral galaxies of the Virgo Cluster studied by Popescu etal. (2002). The two modified blackbody functions that fitted the data points (ISOPHOTdata) are plotted with dashed lines. The temperature of the warm component is con-strained to be 47 K. The fitted temperature of the cold component is marked in each plot,and the sum of the two fitting functions is plotted as the solid line. The galaxy VCC 1110has additional measurements at 70 and 120 µm, and some galaxies do not show evidencefor the two dust components (VCC 1757).
1.2.4 Infrared emission: radiation by dust
The far-infrared (FIR) luminosity (∼3-300 µm) from galaxies is emitted bythe interstellar dust heated by the general interstellar radiation field and themore intense radiation in star formation regions. These should produce FIR-sources at different distributions. The grains of dust, mixed with the gas inthe ISM, enrich -together to stars- the interstellar gas of heavy elements.
A variety of models have been developed to describe the quasi-blackbody1
FIR spectral energy distribution (SED) of dusty galaxies. Following thesimplest SED, a single blackbody function may not accurately describe thephysics of the emission of the dust. The first observations suggesting theexistence of a cloud dust component in galaxies were made at submillimeterwavelengths (Chini et al., 1986). The strong millimeter emission found inall the observed galaxies could not be accounted for by dust emitting at anuniform temperature.
To explain this not uniform temperature, it was suggested that the emis-
1A very simple description of the FIR emission from a dusty galaxy is based on ablackbody spectrum modified by a frequency dependent emissivity function ǫν ∝ νβ , whereβ is in the range 1-2 (Hildebrand, 1983). This yields a spectral distribution function
fν = ǫνBν ∝ν3+β
ehν/kT − 1(1.1)
8 Chapter 1. The Interstellar Medium
sions at 60 µm and 100 µm observed by the Infrared Astronomy Satellite(IRAS) -satellite that has revolutionised the infrared astronomy- could bedeconvolved in two components: a warm component with temperature of50-60 K, and a cool component in cirrus at 10-20 K. Since the peak in thethermal spectrum of dust with temperature below ∼30 K falls longwardsof 100 µm, thus outside the IRAS bands, a clear separation of the warmand cool components was only possible with the Infrared Space Observatory(ISO), whose spectral coverage extended up to wavelengths of ∼180 µm.
Popescu et al. (2002), studying the spatially integrated FIR emissions ofa sample of late-type Virgo Cluster galaxies measured with the ISO centeredat 60, 100 and 180 µm, have fitted the FIR spectral energy distributionwith a combination of two modified blackbody functions: a localized dustemission component associated with the HII regions, whose temperature is47 K, and a diffuse emission component of cold dust, broadly distributed,with a median temperature of 18 K (see Fig. 1.1).
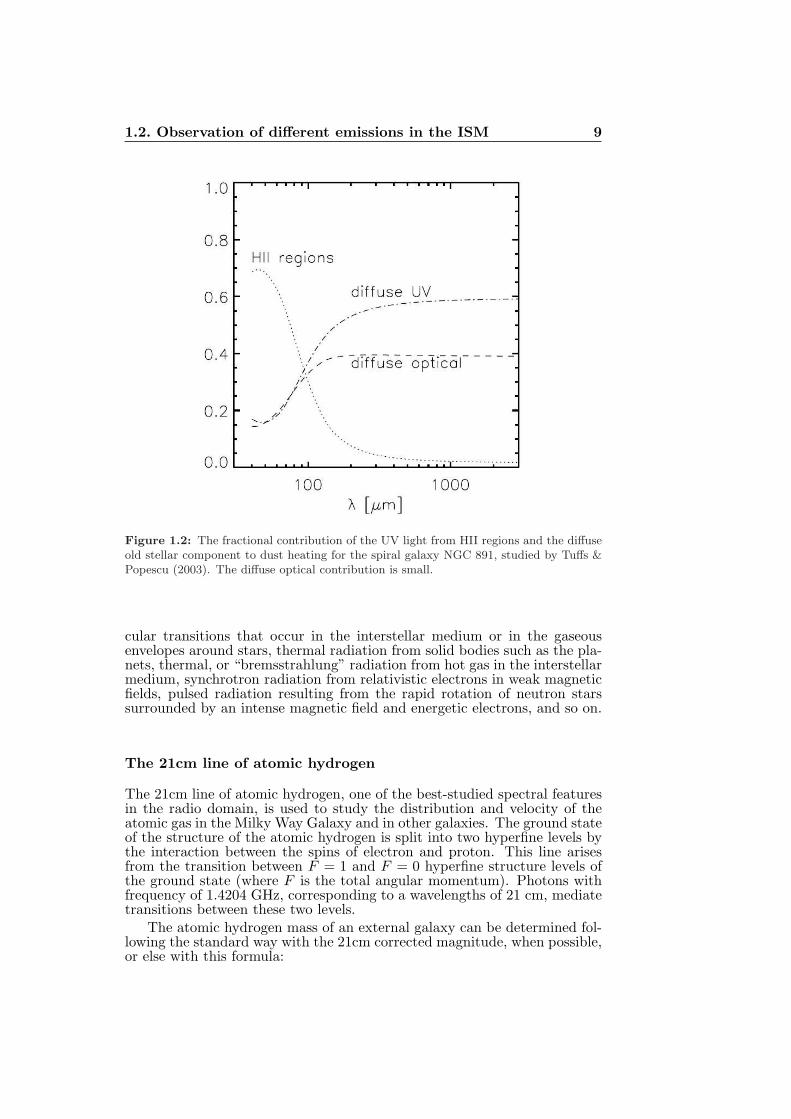
The relative contribution of optical and UV photons in heating the dustis an argument that has been much studied in the literature. Popescu et al.(2000), describing a tool for the analysis from the UV to the sub-millimeterspectral energy distribution (SED) of spiral galaxies then applied to thegalaxy NGC 891, have calculated which part of emitted FIR luminosityfrom each volume element of the galaxy is due to the optical and near-infrared (NIR) photons, and which part is due to the UV photons. Fig. 1.2shows the factional contribution of ultraviolet light from different sources todust heating for the galaxy NGC 891 (Tuffs & Popescu, 2003). The diffuseoptical radiation field only makes a relatively small contribution to the totalemitted dust luminosity.
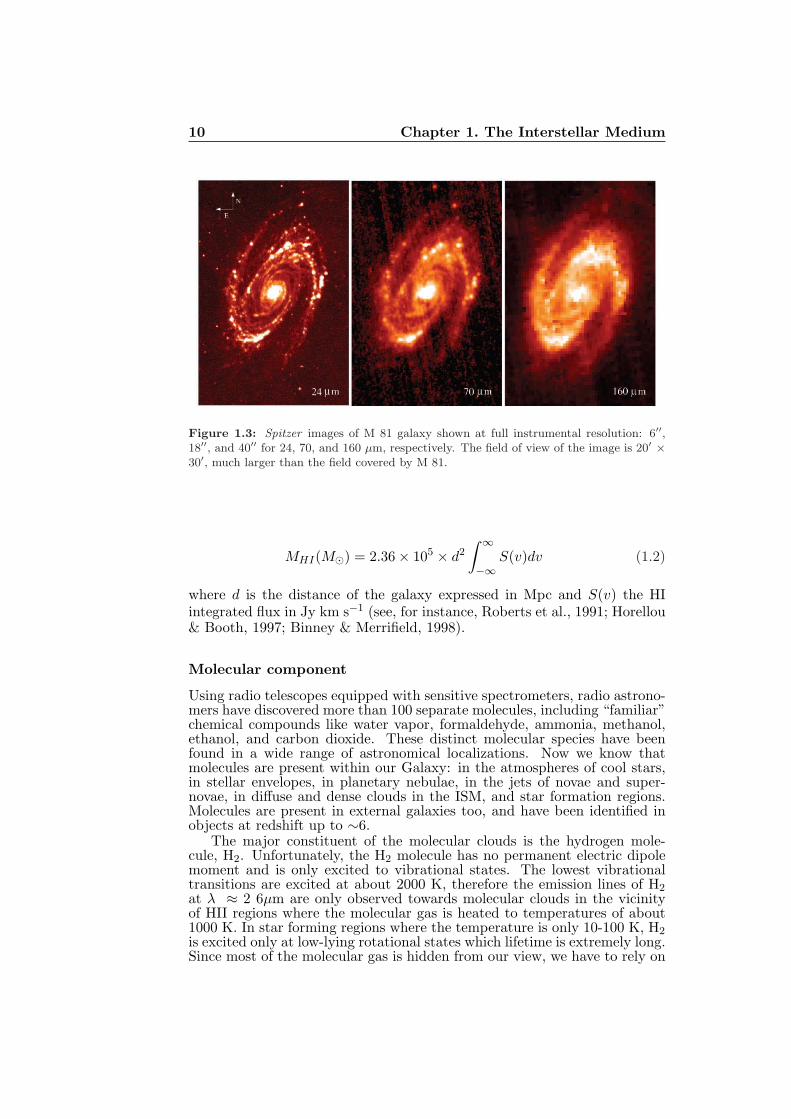
Detailed studies of the FIR emission are now possible thanks to theSpitzer Space Telescope, whose high resolution capabilities are leading tonew possibilities in studying the structure of nearby galaxies. Two optimumexamples are the images of the galaxies M 81 (Gordon et al., 2004) and M 51(Calzetti et al., 2005), that show the details in the spiral structure of thecold and warm dust. Fig. 1.3 shows the M 81 galaxy observed with theSpitzer telescope at 24, 70 and 160 µm, respectively.
Concerning the size of the dust grains, like already said in Section 1.1,there is a significant number of grains comparable in size to the wavelength ofthe blue light. Grains much smaller than 500 nm would scatter less the light,and this scattering would be isotropic. Grains with dimensions of a fractionof a micron radiate fairly efficiently at temperatures much in excess of tensof Kelvin: these grains are expected to be cool, T ≤ 20 K. A grain at 20 Kwill radiate most strongly near 200 µm, for instance in the sub-mm domain.With IRAS, in addition to the “classical” dust grains, with a size of 0.1 µmand containing ≥ 10000 atoms, we have understood that in the ISM thereare dust grains extremely small containing ≤ 100 atoms. These small grainsare detected at shorter IRAS wavebands when a UV photon is absorbed by agrain and its ∼10 eV heats the grain. A grain containing only N ∼50 atomshas the dimension of a molecule. Leger & Puget (1984) have suggested thatmany of these objects may be Polycyclic Aromatic Hydrocarbons (PAHs),which are fragments of graphite sheets onto which hydrogen and perhapssome other atoms have adhered here or there.
1.2.5 Radio line emission
Radio telescopes provide some of the most powerful diagnostic of interstel-lar gas. They can detect spectral line radiation from atomic and mole-
1.2. Observation of different emissions in the ISM 9
Figure 1.2: The fractional contribution of the UV light from HII regions and the diffuseold stellar component to dust heating for the spiral galaxy NGC 891, studied by Tuffs &Popescu (2003). The diffuse optical contribution is small.
cular transitions that occur in the interstellar medium or in the gaseousenvelopes around stars, thermal radiation from solid bodies such as the pla-nets, thermal, or “bremsstrahlung” radiation from hot gas in the interstellarmedium, synchrotron radiation from relativistic electrons in weak magneticfields, pulsed radiation resulting from the rapid rotation of neutron starssurrounded by an intense magnetic field and energetic electrons, and so on.
The 21cm line of atomic hydrogen
The 21cm line of atomic hydrogen, one of the best-studied spectral featuresin the radio domain, is used to study the distribution and velocity of theatomic gas in the Milky Way Galaxy and in other galaxies. The ground stateof the structure of the atomic hydrogen is split into two hyperfine levels bythe interaction between the spins of electron and proton. This line arisesfrom the transition between F = 1 and F = 0 hyperfine structure levels ofthe ground state (where F is the total angular momentum). Photons withfrequency of 1.4204 GHz, corresponding to a wavelengths of 21 cm, mediatetransitions between these two levels.
The atomic hydrogen mass of an external galaxy can be determined fol-lowing the standard way with the 21cm corrected magnitude, when possible,or else with this formula:
10 Chapter 1. The Interstellar Medium
Figure 1.3: Spitzer images of M 81 galaxy shown at full instrumental resolution: 6′′,18′′, and 40′′ for 24, 70, and 160 µm, respectively. The field of view of the image is 20′
×
30′, much larger than the field covered by M 81.
MHI(M⊙) = 2.36 × 10⁵ × d2
∫
∞
−∞
S(v)dv (1.2)
where d is the distance of the galaxy expressed in Mpc and S(v) the HIintegrated flux in Jy km s−1 (see, for instance, Roberts et al., 1991; Horellou& Booth, 1997; Binney & Merrifield, 1998).
Molecular component
Using radio telescopes equipped with sensitive spectrometers, radio astrono-mers have discovered more than 100 separate molecules, including “familiar”chemical compounds like water vapor, formaldehyde, ammonia, methanol,ethanol, and carbon dioxide. These distinct molecular species have beenfound in a wide range of astronomical localizations. Now we know thatmolecules are present within our Galaxy: in the atmospheres of cool stars,in stellar envelopes, in planetary nebulae, in the jets of novae and super-novae, in diffuse and dense clouds in the ISM, and star formation regions.Molecules are present in external galaxies too, and have been identified inobjects at redshift up to ∼6.
The major constituent of the molecular clouds is the hydrogen mole-cule, H2. Unfortunately, the H2 molecule has no permanent electric dipolemoment and is only excited to vibrational states. The lowest vibrationaltransitions are excited at about 2000 K, therefore the emission lines of H2at λ ≈ 2 6µm are only observed towards molecular clouds in the vicinityof HII regions where the molecular gas is heated to temperatures of about1000 K. In star forming regions where the temperature is only 10-100 K, H2is excited only at low-lying rotational states which lifetime is extremely long.Since most of the molecular gas is hidden from our view, we have to rely on
1.2. Observation of different emissions in the ISM 11
the emission lines of other molecules, in combination with the knowledge ofa relation between the line radiation of these molecules and the H2.
The carbon monoxide molecule (CO), existing in the form of its differentisotopes (e.g. 12CO, 13CO), is the second most abundant molecule in thecool dense phase of the ISM. The relative abundance of CO and H2 is oforder of 10−5 - 10−4 and depends on the metallicity (the abundance of Cand O), and other influences like the strength of the radiation field and theefficiency of molecule formation. One of the main advantage of the 12CO isthat the lower rotational transitions (J=1 → J=0 and J=2 → J=1, observedat 2.6 mm and 1.3 mm, respectively) are already excited for collision (withH2 molecules) at relatively low H2 densities, and so the 12CO is usually usedto estimate indirectly the H2 abundance in cold molecular clouds. These COmillimetric lines and those of CS and HCN constitute powerful probes of thedense and cold components of the ISM.
The H2 - CO conversion factor
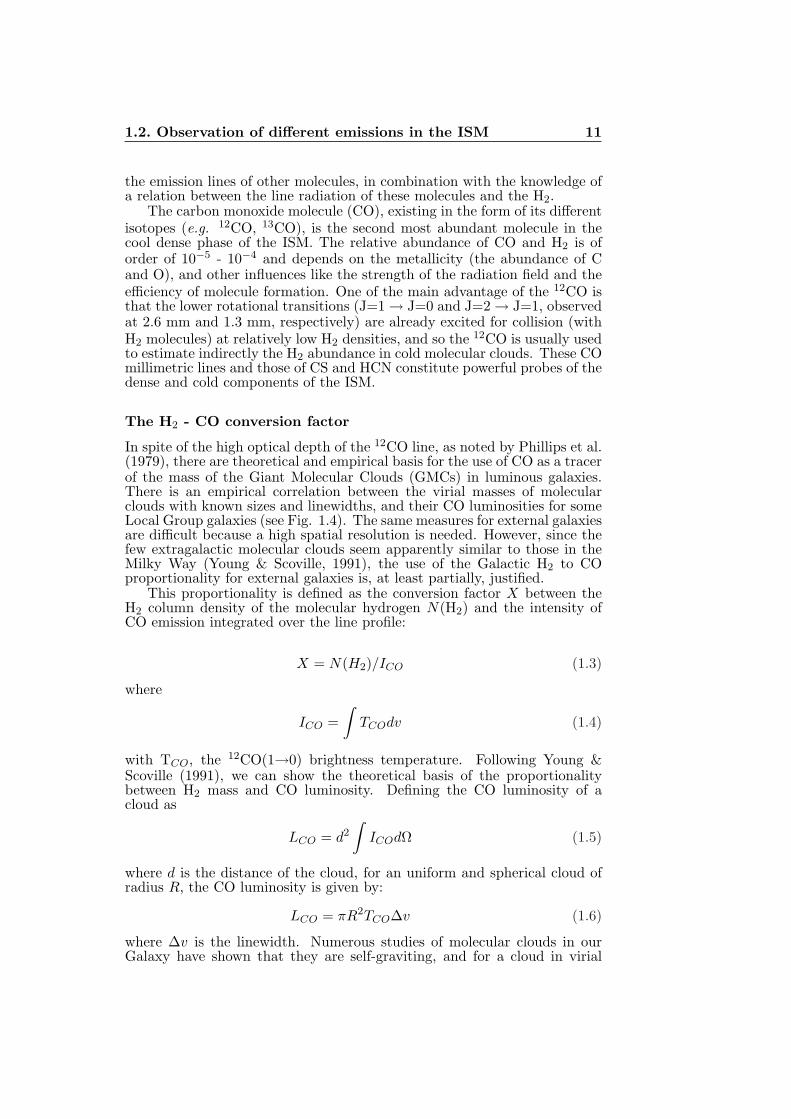
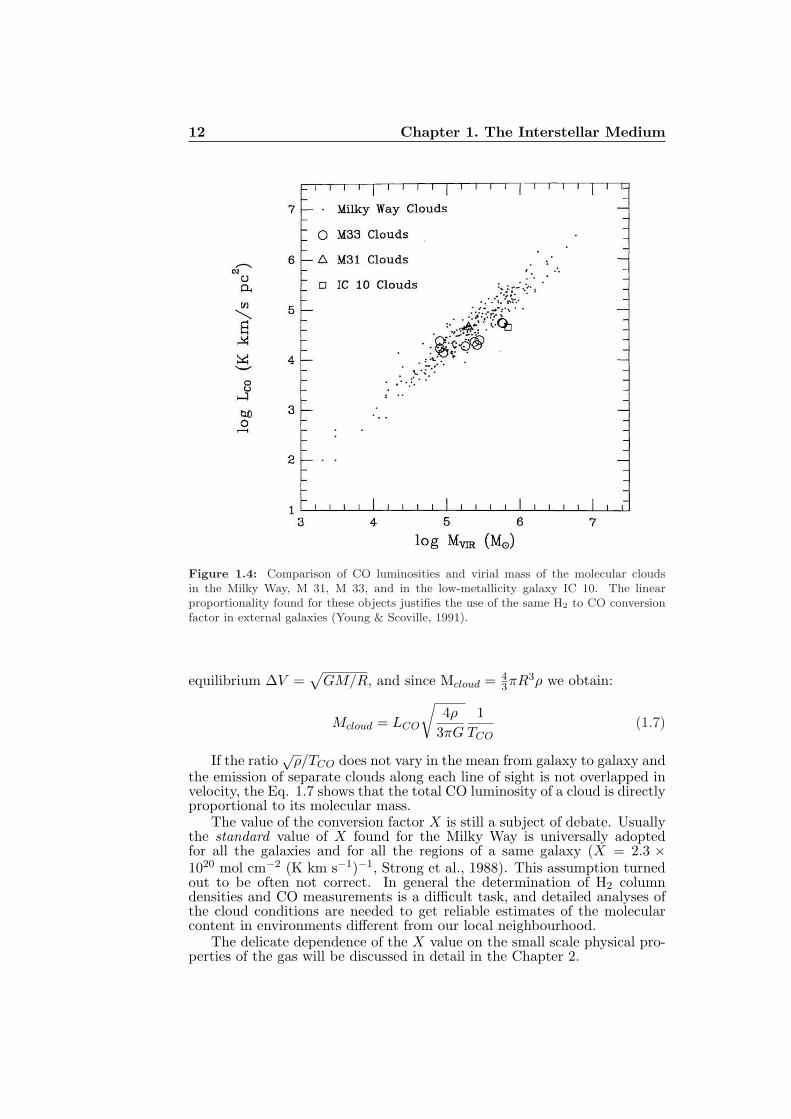
In spite of the high optical depth of the 12CO line, as noted by Phillips et al.(1979), there are theoretical and empirical basis for the use of CO as a tracerof the mass of the Giant Molecular Clouds (GMCs) in luminous galaxies.There is an empirical correlation between the virial masses of molecularclouds with known sizes and linewidths, and their CO luminosities for someLocal Group galaxies (see Fig. 1.4). The same measures for external galaxiesare difficult because a high spatial resolution is needed. However, since thefew extragalactic molecular clouds seem apparently similar to those in theMilky Way (Young & Scoville, 1991), the use of the Galactic H2 to COproportionality for external galaxies is, at least partially, justified.
This proportionality is defined as the conversion factor X between theH2 column density of the molecular hydrogen N(H2) and the intensity ofCO emission integrated over the line profile:
X = N(H2)/ICO (1.3)
where
ICO =
∫
TCOdv (1.4)
with TCO, the 12CO(1→0) brightness temperature. Following Young &Scoville (1991), we can show the theoretical basis of the proportionalitybetween H2 mass and CO luminosity. Defining the CO luminosity of acloud as
LCO = d2
∫
ICOdΩ (1.5)
where d is the distance of the cloud, for an uniform and spherical cloud ofradius R, the CO luminosity is given by:
LCO = πR2TCO∆v (1.6)
where ∆v is the linewidth. Numerous studies of molecular clouds in ourGalaxy have shown that they are self-graviting, and for a cloud in virial
12 Chapter 1. The Interstellar Medium
Figure 1.4: Comparison of CO luminosities and virial mass of the molecular cloudsin the Milky Way, M 31, M 33, and in the low-metallicity galaxy IC 10. The linearproportionality found for these objects justifies the use of the same H2 to CO conversionfactor in external galaxies (Young & Scoville, 1991).
equilibrium ∆V =√
GM/R, and since Mcloud = 43πR3ρ we obtain:
Mcloud = LCO
√
4ρ
3πG
1
TCO(1.7)
If the ratio√
ρ/TCO does not vary in the mean from galaxy to galaxy andthe emission of separate clouds along each line of sight is not overlapped invelocity, the Eq. 1.7 shows that the total CO luminosity of a cloud is directlyproportional to its molecular mass.
The value of the conversion factor X is still a subject of debate. Usuallythe standard value of X found for the Milky Way is universally adoptedfor all the galaxies and for all the regions of a same galaxy (X = 2.3 ×10²⁰ mol cm−2 (K km s−1)−1, Strong et al., 1988). This assumption turnedout to be often not correct. In general the determination of H2 columndensities and CO measurements is a difficult task, and detailed analyses ofthe cloud conditions are needed to get reliable estimates of the molecularcontent in environments different from our local neighbourhood.
The delicate dependence of the X value on the small scale physical pro-perties of the gas will be discussed in detail in the Chapter 2.
1.3. Other emissions 13
1.3 Other emissions
Even if this Thesis is dedicated to the molecular gaseous component of theinterstellar medium in external galaxies and to the relations between thiscomponent and the other ones, such as UV or IR, in this section we willshortly describe also the other constituents of the ISM in order to give acomplete scenario of gas and dust content of the galaxies.
1.3.1 γ-ray emission
Gamma-rays are the most energetic form of electromagnetic radiation, withover 104 times more energy than visible light photons, and the correspondingspectral domain extends from an energy of 0.05 MeV to 1011 MeV. γ-raysare difficult to observe from ground-based telescopes due to atmosphericabsorption, and high-altitude balloons, sounding rockets, and orbiting obser-vatories are therefore used, such as the Compton Gamma Ray Observatory-CGRO or the future Gamma-ray Large Area Space Telescope-GLAST.
Low-energy (or soft) γ-ray astronomy (up to a few megaelectronvolts)deals mainly with processes in dense media, such as plasmas confined closeto neutron stars and black holes. It also concerns cosmic sites where mono-energetic photons are released either by deexcitation of atomic nuclei (nu-clear lines) or by positron-electron annihilation (the 0.511 MeV line). γ-rayastronomy at higher energies relates to emissions induced by relativistic par-ticles throughout the whole interstellar medium, as well as in the vicinity ofsome neutron stars and in the powerful jets beamed by active galactic nu-clei. The penetration power of γ-ray photons enables exploration of regionsthat are hidden at other wavelengths, such as the galactic center region, aswell as of the first stages of the Universe, since the cosmos is particularlytransparent to γ-rays (with the exception of photons whose energy exceeds106 MeV).
A large fraction of the cosmic γ-ray photons originates in interstellarsites: cosmic-ray-induced interstellar emission results mostly from the inter-action of cosmic rays (electrons and protons) with the interstellar gas. Thehigh-energy γ-ray sky is dominated by radiation from the galactic planewhose spatial distribution and intensity can be reliably modeled from know-ledge of the interstellar gas distribution. A large fraction of the pointlikesources observed at medium galactic latitude may be related to the localinterstellar medium. γ-rays have been found emanating from radio galaxies,Seyfert galaxies, and supernovae.
1.3.2 Thermal radio continuum emission
The radio continuum emission from a normal galaxy consists of two compo-nents: a non-thermal component produced via synchrotron emission and athermal one due to a free-free emission from HII regions.
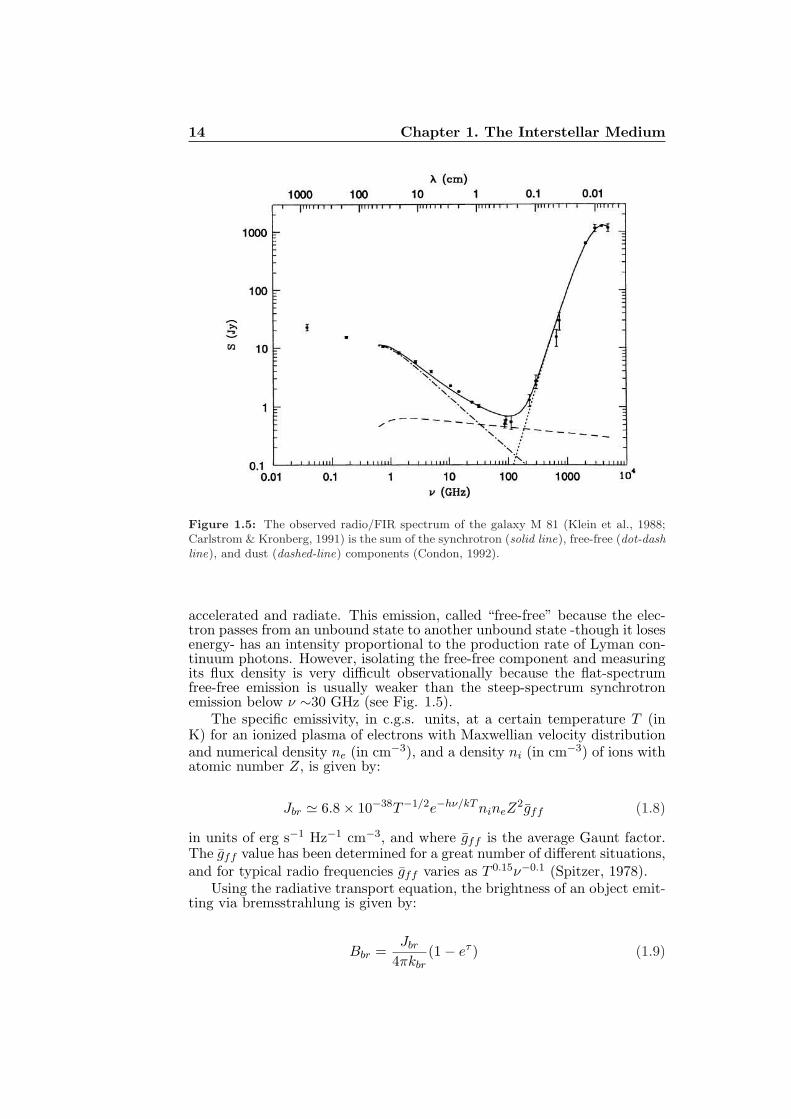
Thermal re-irradiation of starlight by dust quickly overwhelms thesecomponents above ν ∼200 GHz (λ ∼1.5 mm), defining a practical upperbound to the frequencies of the radio observations. Observing the spectrumof the starburst galaxy M 82 (Fig. 1.5), we can note the typical relative in-tensities of synchrotron radiation, free-free (bremsstrahlung) emission, andthe dust re-irradiation.
The free-free emission emerges from HII regions containing ionizing stars,where the electrons in the interstellar plasma are subject to coulomb inter-action with ions, and they travel on hyperbolic trajectories in which they are
14 Chapter 1. The Interstellar Medium
Figure 1.5: The observed radio/FIR spectrum of the galaxy M 81 (Klein et al., 1988;Carlstrom & Kronberg, 1991) is the sum of the synchrotron (solid line), free-free (dot-dashline), and dust (dashed-line) components (Condon, 1992).
accelerated and radiate. This emission, called “free-free” because the elec-tron passes from an unbound state to another unbound state -though it losesenergy- has an intensity proportional to the production rate of Lyman con-tinuum photons. However, isolating the free-free component and measuringits flux density is very difficult observationally because the flat-spectrumfree-free emission is usually weaker than the steep-spectrum synchrotronemission below ν ∼30 GHz (see Fig. 1.5).
The specific emissivity, in c.g.s. units, at a certain temperature T (inK) for an ionized plasma of electrons with Maxwellian velocity distributionand numerical density ne (in cm−3), and a density ni (in cm−3) of ions withatomic number Z, is given by:
Jbr ≃ 6.8 × 10−38T−1/2e−hν/kT nineZ2gff (1.8)
in units of erg s−1 Hz−1 cm−3, and where gff is the average Gaunt factor.The gff value has been determined for a great number of different situations,and for typical radio frequencies gff varies as T 0.15ν−0.1 (Spitzer, 1978).
Using the radiative transport equation, the brightness of an object emit-ting via bremsstrahlung is given by:
Bbr =Jbr
4πkbr(1 − eτ ) (1.9)
1.3. Other emissions 15
where the kbr is the absorption coefficient, and τ is the optical depth. Inthe Rayleigh-Jeans domain, the brightness can be approximated and the Eq.(1.9) becomes:
B(ν, T ) = 2kTeν2
c2τ ≫ 1
B(ν, T ) = 2kTeν2
c2τ τ ≪ 1 (1.10)
where Te is the electron temperature. From Eqs. 1.10 we can note that inthe optically thick case, at low frequencies, the spectrum region emittingvia bremsstrahlung grows proportionally to ν2, while in the optically thincase the spectrum is almost constant for a large range of frequencies. Thusthe temperature of the plasma is the observed brightness temperature atν ≪ ν1, where ν1 is the frequency at which the spectrum passes from theconstant value to the Rayleigh-Jeans form fν ∼ ν2.
Free-free radiation is the most intense source of radiation from HII re-gions, and the nearby Orion nebula is one of the best studied HII region.In general, the thermal radio luminosity of a normal galaxy indicates thetotal photoionization rate and so the current number of the most massiveshort-live stars.
1.3.3 Non-Thermal synchrotron emission
The non-thermal synchrotron radiation is produced by highly relativisticelectrons spiralising in a magnetic field. The radiation from a single elec-tron, of energy E = γm0c
2 with γ = 1/√
1 − v2/c2 Lorentz factor, has ahelicoidal trajectory, with the helix axis parallel to the magnetic lines offorce and is collimated into a cone with half-opening angle 1/γ, centeredin the instantaneus direction of the velocity. The observer receives a shortpulse each time the beam crosses the line of sight. The synchrotron powerby a single electron, moving at an angle θ to the direction of the magneticfield B is:
−dE
dt∼ (Bsinθ)2γ2 (1.11)
and the most of its energy is emitted near the critical frequency νc ∼(Bsinθ)γ2.
At a given frequency, the energy (or Lorentz factor) of the emittingelectrons depends upon the magnetic field strength. For a typical spiraldisk the order of magnitude for the magnetic filed strength is ∼1-10 µG, inthe radio domain between 10 MHz and 100 GHz, the synchrotron emissionis generated by electrons with Lorentz factor in the range 103 - 105.
In Astrophysics normally we deal with a gas of electrons with differentenergies: assuming that every particle is emitted independently from theothers, that total emission can be obtained by simply adding contributionsfrom each particle. If N(E)dE is the number of particles per unit volumewith energy between E and E + dE, and we assume a power-law energy
16 Chapter 1. The Interstellar Medium
distribution of the electrons, such as
N(E) = N0E−δ (1.12)
where N0 and δ are constants, the synchrotron emissivity is:
Js(ν) ∝ N0B(δ+1)/2ν−α ergs−1Hz−1cm−3 (1.13)
where α = δ−12 is the spectral index.
The spectral index of the non-thermal emission from a normal galaxy isusually α ∼ 0.8, and so δ ∼ 2.6.
Synchrotron polarization
The synchrotron radiation presents a high degree of linear polarization. Ifthe magnetic field acting on the plasma is uniform, the synchrotron radiationemitted is strongly polarized perpendicular to the direction of the magneticfield. The degree of polarization may vary between 70 - 80% of the totalintensity, in practice, however, the direction of the magnetic field may varyalong the line of sight, and the observed value is less than these values. Thetotal synchrotron emission traces the total field in the sky plane and thepolarized synchrotron emission traces the regular field component.
To determine the field strength from the synchrotron intensity it is ne-cessary to do an assumption on the relation between cosmic ray electronsand magnetic fields: the minimum total energy density, ǫtot = ǫCR + ǫB =min, where ǫCR is the relativistic particle energy density and ǫB is the mag-netic field density. The total energy for a given synchrotron luminosityis minimized when ǫB = 3
4ǫCR, that is very close to energy equipartition(ǫCR = ǫB), so minimum-energy and equipartition are often used as synony-mous.
This assumption was first proposed by Burbidge (1956) and applied tothe optical synchrotron emission of the jet in M 81 galaxy. The validityof this method has been discussed in the literature, and in our Galaxy theaccuracy of the equipartition assumption can be tested because we haveindependent information about the local ray-cosmic energy density fromin-situ measurements and about their radial distribution from γ-ray data.Combination with radio synchrotron data gives a local strength of the totalfield 〈BT 〉 of 6 µG (Strong et al., 2000), in agreement with the value de-rived from energy equipartition estimates (Beck, 2001). On the other hand,Chi & Wolfendale (1993) claimed significant deviation from equipartitionconditions in the Magellanic Clouds.
Equipartition estimates of field strengths were determined in many spiralgalaxies (Beck, 2000). The mean strength of the total field ranges from a fewµG in galaxies with a low star-formation rate to ∼= 30 µG in grand-designgalaxies like M 51. A recent equipartition and minimum energy formulahave been proposed by Beck & Krause (2005). This revised estimate for thefield strength gives larger values than the classical estimate for the flat radiospectra (α ∼0.5 - 0.6) but smaller values for steep spectra.
Separating thermal and non-thermal emissions
As said before, the total radio spectrum of a galaxy consists of thermaland non-thermal component. Concerning the non-thermal component radio
1.3. Other emissions 17
emission, a division can be made between the diffuse radio emission fromcosmic ray electrons spread over the galactic disk and halo, and the discreteemission from supernova remnants (SNRs)2. The spectrum of the diffusesynchrotron emission is shaped by the physical processes that are charac-terizing the cosmic rays, in particular the type of propagation (diffuse orconvection), the type of energy losses, and the confinement. Gioia et al.(1982), analysing a sample of nearby spiral galaxies, have found that thedistribution of integrated indices is peaked at α = 0.75 recalling the factthat the spectra are dominated by the non-thermal component.
In principle, the relatively flat-spectrum (α ≤ 0.1) thermal radio emissionshould be distinguishable from the steeper-spectrum (α ∼0.8) non-thermalemission via total flux densities or maps obtained at two or more frequencies.In practice, most normal galaxies are not bright enough to be detected atfrequencies much higher than ν ∼10 GHz, so the observed thermal fractionsST /S, where S is the total flux density, are small and most measured ST areuncertain by a factor of two.
Condon & Yin (1990) suggested that the ratio of non-thermal to thermalradio fluxes may be the same for the most spiral galaxies. The average valueof this ratio is approximately given by:
⟨
SNT
ST
⟩
∼ 10( ν
1GHz
)0.1−α(1.14)
where α ∼0.8 is a typical non-thermal index. The non-thermal flux typicallyexceeds the thermal flux for all frequencies below ν ∼30 GHz (λ ∼1 cm).At ν ∼1.4 GHz, on average, about only 10 % of the total flux is thermal.
To separate observationally the diffuse radio emission from the SNRsrequires spatially resolved observations, but is difficult since the spectralindex of these two emissions are very similar. Lisenfeld & Volk (2000)estimated that the radio emission of SNRs represents about 10% of the non-thermal emission of a galaxy. This moderate contribution has a noticeableeffect on the non-thermal radio spectral index, lowering it by 0.1 for steepspectra.
2Stars with masses greater than ∼8 M⊙ die in a catastrophic and spectacular way: thecore collapses within a second and the energy released drives infalling matter outwardsin a violent explosion, producing the visible supernova. The interaction of the expandingsupernova debris with the ISM produces supernova remnants.

Chapter 2
Molecular gas in galaxies
Introduction
Technical progress in millimeter-wave receiver technology made possible tomap molecular clouds at high sensitivity in short time of integration. Focalplane arrays at the FCRAO 14 m (Five College Radio Astronomy Observa-tory) and the NRAO 12 m (National Radio Astronomy Observatory) singledish telescopes have increased the mapping speed by an order of magnitude.Up to four receivers operating at different frequencies can be used simul-taneously at the IRAM 30 m (Institut de Radioastronomie Millimetrique)telescope to observe the same position on the sky. The building and improve-ment of the millimeter-wave interferometers (IRAM, OVRO-Owens ValleyRadio Observatory, and BIMA-Berkeley Illinois Maryland Association) havedramatically increased the imaging quality and sensitivity of these instru-ments and have made high resolution observations (< 10′′) of structure inmolecular clouds considerably quicker and easier.
Thanks to these instruments the molecular component in Our and exter-nal galaxies has been and is now explored and it is, correctly, considered animportant constituent of the ISM. In this Chapter we analyze the principalcharacteristics of the molecular structures in the galaxies.
2.1 Molecular Clouds
Molecular clouds are generally self-gravitating, magnetized, turbulent, andcompressible fluids. The puzzle of how stars form from molecular cloudsbegins with understanding the physics of such objects and how individual,gravitationally unstable cores condense within them.
Most of the mass of the molecular ISM is in the form of Giant MolecularClouds (GMCs), with masses ∼ 105−6 M⊙, diameters ∼ 50 pc, and averagedensities nH2
∼ 102 cm−3 (e.g. Blitz, 1993). The upper end of the molecularcloud mass distribution has a sharp cut-off at ∼ 6 × 10⁶ M⊙, indicating thatcloud masses are limited by some physical process, such as the tidal field ofthe galaxies or the disrupting effect of massive stars within them.
Heyer & Terebey (1998), performing a high resolution survey of the COemission on the outer Galaxy with the FCRAO telescope, have realized adetailed study of the large scale structure of the ISM. They confirmed thatthere are large regions with little or no CO emission (Dame et al., 1986), inagreement to earlier results that these regions have been cleared of molecular
19
20 Chapter 2. Molecular gas in galaxies
gas by the intense radiation fields and stellar winds from massive stars. Thestructural imprint of the massive star formation in individual star formingregions is discussed in several observational studies, such as Carpenter et al.(1995) and Heyer et al. (1996) for our Galaxy, or Patel et al. (1995) for theIC 1396 galaxy. Carpenter et al. (1995) have suggested that massive starscan compress gas and create dense cores that give rise to the next generationof star formation as originally proposed by Elmegreen & Lada (1977).
Digel et al. (1996) and Heyer & Terebey (1998) showed that CO emissionin the outer Galaxy is confined almost exclusively to the spiral arms, con-firming the earlier results of Cohen et al. (1980). The ratio of emission in thearm with respect to the interarm regions is greater than 28:1. The absenceof molecular gas in the interarm regions implies that molecular clouds formfrom a compressed atomic medium, and have lifetimes that are shorter thanthe arm crossing time (∼107 yr). These conclusions may not apply in theinner Galaxy where it has been more difficult to isolate arm emission andcalculate an arm-to-interarm ratio. Solomon & Rivolo (1989) have arguedthat about half of the CO in the inner Galaxy is in clouds that are notactively forming stars, and that this gas is not concentrated in spiral arms.However, Loinard et al. (1996) have found an arm-to-interarm ratio ∼10:1in M 31 galaxy in the south-west ring ∼9 kpc from the galaxy center, whichsuggests that similar conclusions about cloud formation and lifetimes canbe draw in that galaxy too.
Studies on HI halos around molecular clouds (e.g. Williams & Mad-dalena, 1996; Moriarty-Schieven et al., 1997) have shown that to form aGMC of mass 106 M⊙ out of an atomic ISM of density nH ∼1 cm−3, gasmust be accumulated from a volume ∼0.4 kpc in diameter. Since such alarge region encompasses many atomic clouds, the density inhomogeneitiesin molecular clouds may simply reflect the initial non-uniform conditions oftheir formation rather than the first step in the fragmentation/condensationprocess that leads to the creation of stars (Elmegreen, 1985). To distinguishbetween the remnants of the formation of a cloud and the first steps to-ward star formation, it is necessary to analyze and compare structures in anumber of different clouds.
2.2 Cloud structure
Before to discuss the analysis of cloud structure, we can define an operationalcategorization into clouds, clumps, and cores. Almost all known molecularclouds in the Galaxy are detectable in CO. Giant molecular clouds havemasses & 104 M⊙, are generally gravitationally bound, and may containseveral sites of star formation. However, there are also small molecularclouds with masses . 102 M⊙, such as the unbound high latitude cloudsdiscovered by Blitz et al. (1984), and the small gravitational bound molecularclouds in the Galactic plane catalogated by Clemens & Barvainis (1988). Asmall number of low mass stars are observed to form in some of these cloudsbut the contribution to the total SFR in the Galaxy is negligible (Magnaniet al., 1995).
Clumps are coherent regions in galactic longitude and latitude, and ra-dial velocity space (l-b-v), generally identified from spectral line maps ofmolecular emission. Star-forming clumps are the massive clumps out ofwhich stellar clusters form. Although most clusters are unbound, the gasout of which they form is bound (Williams et al., 1995).
2.2. Cloud structure 21
Cores are regions out of which single stars (or multiple systems such asbinaries) form and are necessarily gravitationally bound. Not all materialthat goes into forming a star must come from the core; some may be ac-creted from the surrounding clump or cloud as the protostar moves troughit (Bonnell et al., 1997).
2.2.1 The Virial Theorem for molecular clouds
The condition for a molecular cloud or a clump within it to be gravitationallybound can be inferred from the virial theorem, which can be written:
1
2I = 2 (T − T0) + EM + W (2.1)
where I is the moment of inertia, T is the total kinetic energy (includingthermal), EM is the net magnetic energy, and W is the gravitational energy(see McKee et al., 1993, for more details). The kinetic energy term can beenexpressed as:
T =
∫
Vcl
(
3
2Pth +
1
2ρv2
)
dV =3
2P Vcl (2.2)
that includes both the thermal and non-thermal pressure inside the cloud.The surface term can be expressed as T0 = 3/2P0Vcl, where P0 is aboutequal to the total thermal plus non-thermal pressure in the ambient medium(McKee & Zweibel, 1992). Finally, the gravitational term can be written as(Bertoldi & McKee, 1992):
W = −3PGVcl (2.3)
where the gravitational pressure PG is the mean weight of the material inthe cloud. With these results, the steady-state virial theorem becomes:
P = P0 + PG
(
1 − EM
|W |
)
(2.4)
In this form, the virial theorem has an immediate intuitive meaning: themean pressure inside the cloud is the surface pressure plus the weight of thematerial inside the cloud, reduced by the magnetic field.
In the absence of an external gravitational field, W is the gravitationalenergy of the cloud:
W = −3
5a
(
GE2M
R
)
(2.5)
where a is a numerical factor of order unity that has been evaluated byBertoldi & McKee (1992). The gravitational pressure is then:
PG =3πa
20GΣ2 → 5540A2
V K cm−3 (2.6)
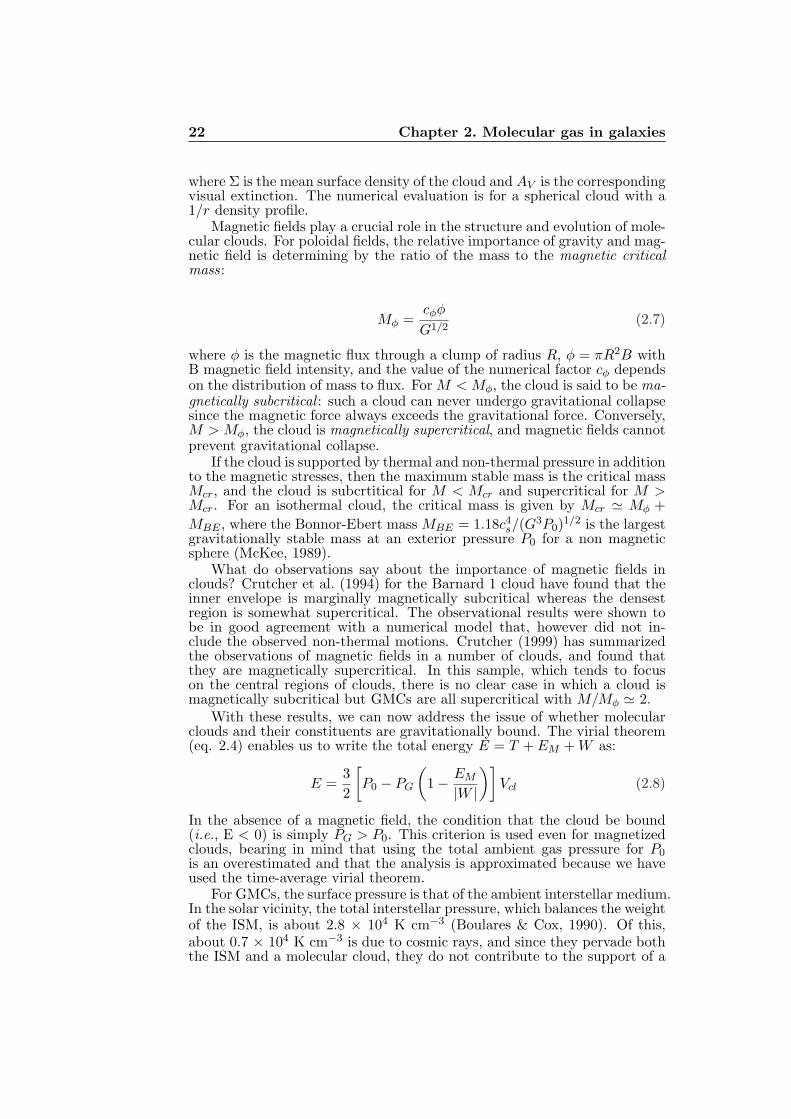
22 Chapter 2. Molecular gas in galaxies
where Σ is the mean surface density of the cloud and AV is the correspondingvisual extinction. The numerical evaluation is for a spherical cloud with a1/r density profile.
Magnetic fields play a crucial role in the structure and evolution of mole-cular clouds. For poloidal fields, the relative importance of gravity and mag-netic field is determining by the ratio of the mass to the magnetic criticalmass:
Mφ =cφφ
G1/2(2.7)
where φ is the magnetic flux through a clump of radius R, φ = πR2B withB magnetic field intensity, and the value of the numerical factor cφ dependson the distribution of mass to flux. For M < Mφ, the cloud is said to be ma-gnetically subcritical : such a cloud can never undergo gravitational collapsesince the magnetic force always exceeds the gravitational force. Conversely,M > Mφ, the cloud is magnetically supercritical, and magnetic fields cannotprevent gravitational collapse.
If the cloud is supported by thermal and non-thermal pressure in additionto the magnetic stresses, then the maximum stable mass is the critical massMcr, and the cloud is subcrtitical for M < Mcr and supercritical for M >Mcr. For an isothermal cloud, the critical mass is given by Mcr ≃ Mφ +
MBE , where the Bonnor-Ebert mass MBE = 1.18c4s/(G3P0)
1/2 is the largestgravitationally stable mass at an exterior pressure P0 for a non magneticsphere (McKee, 1989).
What do observations say about the importance of magnetic fields inclouds? Crutcher et al. (1994) for the Barnard 1 cloud have found that theinner envelope is marginally magnetically subcritical whereas the densestregion is somewhat supercritical. The observational results were shown tobe in good agreement with a numerical model that, however did not in-clude the observed non-thermal motions. Crutcher (1999) has summarizedthe observations of magnetic fields in a number of clouds, and found thatthey are magnetically supercritical. In this sample, which tends to focuson the central regions of clouds, there is no clear case in which a cloud ismagnetically subcritical but GMCs are all supercritical with M/Mφ ≃ 2.
With these results, we can now address the issue of whether molecularclouds and their constituents are gravitationally bound. The virial theorem(eq. 2.4) enables us to write the total energy E = T + EM + W as:
E =3
2
[
P0 − PG
(
1 − EM
|W |
)]
Vcl (2.8)
In the absence of a magnetic field, the condition that the cloud be bound(i.e., E < 0) is simply PG > P0. This criterion is used even for magnetizedclouds, bearing in mind that using the total ambient gas pressure for P0is an overestimated and that the analysis is approximated because we haveused the time-average virial theorem.
For GMCs, the surface pressure is that of the ambient interstellar medium.In the solar vicinity, the total interstellar pressure, which balances the weightof the ISM, is about 2.8 × 10⁴ K cm−3 (Boulares & Cox, 1990). Of this,about 0.7 × 10⁴ K cm−3 is due to cosmic rays, and since they pervade boththe ISM and a molecular cloud, they do not contribute to the support of a
2.2. Cloud structure 23
cloud and may be neglected. The magnetic pressure is about 0.3 × 10⁴ Kcm−3 (Heiles, 1996), leaving P0 ≃ 1.8 × 10⁴ K cm−3 as the total ambientgas pressure.
What is the minimum value of PG for a molecular cloud? According tovan Dishoeck & Black (1988), molecular clouds exposed to the local inter-stellar radiation field have a layer of C+ and C0 corresponding to a visualextinction of 0.7 mag. If we require at least 1/3 of the carbon along a line ofsight through a cloud to be in the form of CO in order for it to be considered“molecular”, then the total visual extinction must be AV > 2 mag (allowingfor a shielding layer on both sides). According to equation (2.6), this givesPG & 2 × 10⁴ K cm−3 ∼ P0, verifying that molecular clouds as observed inCO are at least marginally bound. Note that if we defined molecular cloudsas having a significant fraction of H2 rather than CO, the minimum columndensity required would be substantially less and the clouds might not bebound. Furthermore, the conclusion that CO clouds are bound dependson both the interstellar pressure and on the strength of the FUV radiationfield, and CO clouds may not be bound everywhere in the Galaxy or in othergalaxies (Elmegreen, 1993).
GMCs in the solar neighborhood typically have mean extinctions sig-nificantly greater than 2 mag, and as a result PG is generally significantlygreater than P0. For GMCs in the solar neighborhood, PG ∼2 × 10⁵ Kcm−3, an order of magnitude greater than P0 (e.g. Williams et al., 1995).Thus if GMCs are dynamically stable entities (the crossing time for a GMCis about 107 yr, smaller than the expected lifetime - Blitz & Shu, 1980), thenGMCs must be self-gravitating. In the inner Galaxy where P0 is expected tobe greater, the typical GMC linewidths also appear to be somewhat greaterthan those found locally (Sanders et al., 1985), and thus PG is still comfort-ably greater than P0.
For clumps within GMCs, the surface pressure is just the mean pressureinside the GMC, PG(GMC) ∝ Σ2(GMC), so the virial theorem becomesP (clump) ∝ Σ2(GMC) + Σ2(clump). Most clumps observed in 13CO haveΣ(clump) ≪ Σ(GMC) and are therefore confined by pressure rather thangravity; on the other hand, much of the mass is in massive star-formingclumps that have Σ(clump) & Σ(GMC) and are therefore gravitationallybound (Bertoldi & McKee, 1992).
2.2.2 Structure analysis techniques
Molecular cloud can be mapped via radio spectroscopy of molecular lines(e.g. Bally et al., 1987), continuum emission from dust (e.g. Wood et al.,1994), or stellar absorption by dust (e.g. Lada et al., 1994). The first giveskinematical as well as spatial information and results in a three dimensionalcube of data, whereas the latter two results in two dimensional datasets.Many different techniques have been developed to analyze these data whichwe discuss briefly.
Stutzki & Guesten (1990) and Williams et al. (1994) used the mostdirect approach decomposing the data into a set of discrete clumps; thefirst based on recursive triaxial Gaussian fits, and the latter by identifyingpeaks of emission and then tracing contours to lower levels. The resultingclumps can be considered to be the “building block” of the cloud and maybe analyzed in any number of ways to determine a size-linewidth relation,mass spectrum, and variations in cloud conditions as a function of position
24 Chapter 2. Molecular gas in galaxies
Figure 2.1: Structure in the Rosette and G216-2.5 molecular clouds by Williams et al.(2000). The two left panels show contours of velocity integrated CO emission (with levelsat 15 K km s−1 for the RMC and 1.8 K km s−1 for G216-2.5) overlaid on a greyscale imageof the IRAS 100 µu intensity (1.1 to 2.5 MJy sr−1 for the two clouds). The Rosette cloudis IR bright, indicative of its high SFR, but G216-2.5 has a very low IR luminosity dueto a lack of star formation within it. The four rightmost panels show power law relationsbetween clump mass and size, linewidth, energy balance, and number (i.e. clump massspectrum) for the two clouds. The solid circles represent clumps in the RMC, and opencircles represent clumps in G216-2.5. Each relationship has been fit by a power law: notethat the power law exponent is approximately the same for the clumps in each despite thelarge difference in star formation activity.
(Williams et al., 1995). However, there are caveats associated with eachmethod of clump deconvolution. Since the structure in a spectral line map ofa molecular cloud is not, in general, gaussian, the recursive fitting method ofStutzki & Guesten (1990) tends to find and subsequently fit residuals aroundeach clump, which result in a mass spectrum that is steeper than the truedistribution. On the other hand, the contour tracing method of Williamset al. (1994) has the tendency to blend small features with larger structuresand results in a mass spectrum that is flatter than the true distribution.
2.2.3 Clumps
Clumps decomposition methods, such as those describe above, can be readilyvisualized and have an appealing simplicity. In addition, as for all automatedtechniques, these algorithms offer an unbiased way to analyze datasets, andare still a valid and useful tool for cloud comparisons, even if one does notsubscribe to the notion of clumps within clouds as a physical reality (Scalo,1990).
In a comparative study of two clouds, Williams et al. (1994) searched fordifferences in cloud structure between a star forming and non-star formingGMC. The datasets they analyzed were maps of 13CO(1-0) emission with
2.2. Cloud structure 25
similar spatial (0.7 pc) and velocity resolution (0.68 km s−1), but the twoclouds -although of similar mass ∼ 105 M⊙- have very different levels of starformation activity. The first, the Rosette molecular cloud, is associated toan HII region powered by a cluster of 17 O and B stars and also containsa number of bright infrared sources from ongoing star formation deeperwithin the cloud (Cox et al., 1990). The second cloud, G216-2.5, originallydiscovered by Maddalena & Thaddeus (1985), contains no IRAS sourcesfrom sites of embedded star formation and has an exceptionally low far-infrared luminosity to mass ratio (Blitz, 1990), LIR/Mcloud < 0.07 L⊙/M⊙,if compared to more typical values of order unity (see Williams & Blitz,1998).
Almost 100 clumps were catalogued in each cloud, and sizes, line-widths,and masses were calculated for each. These basic quantities were found tobe related by power laws with the same index for the two clouds, but withdifferent offsets (Fig. 2.1) in the sense that for a given mass, clumps in thenon-star forming cloud are larger, and have greater linewidths than in thestar forming cloud. The similarity of the power law indices suggests that, onthese scales, ∼ few pc, and at the low average densities, 〈nH2
〉 = 300 cm−3,of the observed clumps, the principal difference between the star formingand non-star forming cloud is the change of scale rather than the collectivenature of the structures in each cloud.
Fig. 2.1 shows that the kinetic energy of each clump in G216-2.5 ex-ceeds its gravitational potential energy, and therefore no clump in the cloudis bound (although the cloud as a whole is bound). On the other hand,Williams et al. (1995) showed that, for the Rosette molecular cloud, thestar formation only occurs in the gravitationally bound clumps in the cloud.Therefore, the lack of bound clouds in G216-2.5 may explain why there isno star formation currently taking place within it.
Even in Rosette cloud, most clumps are not gravitationally bound. Theseunbound clumps have similar density profiles, n (r) ∝ 1/r2, but containrelatively little dense gas as traced by CO(3-2) or CO(2-1) (Williams &Blitz, 1998). The unbound clumps are “pressure” confined in that theirinternal kinetic pressure, which is primarily turbulent, is comparable to themean pressure of the ambient GMC (Bertoldi & McKee, 1992). Simulationssuggest that these clumps are transient structures.
The nature of the interclump medium remains unclear: Blitz & Stark(1986) have postulated that it is low density molecular gas, but this hasbeen questioned by Schneider et al. (1996). Blitz (1990, 1993) showed thatatomic envelopes around molecular clouds are quite common and that theatomic gas plausibly pervades the interclump medium. Williams et al. (1995)showed that the HI associated to the molecular gas in the Rosette has aboutthe same turbulent pressure, and suggested that it could serve as the con-fining medium.
Cloud, clump, and core density profiles are reflections of the physicsthat shape their evolution, but the density profiles of clouds and clumpshave received scant attention. For clouds, which often are quite amorphouswithout a clear central peak, the density profile is often difficult to defineobservationally. For clumps, Williams et al. (1995) showed that surfacedensity profiles of pressure bound, gravitationally bound, and star-formingclumps have similar power law indices close to 1. Formally, the fits rangefrom -0.8 to -1.2, but these differences do not appear to be significant. Fora spherical cloud of infinite extent, Σ (r) ∝ r−1 implies ρ (r) ∝ r−1, suggest-ing that the (turbulent) pressure support is spatially constant. However,
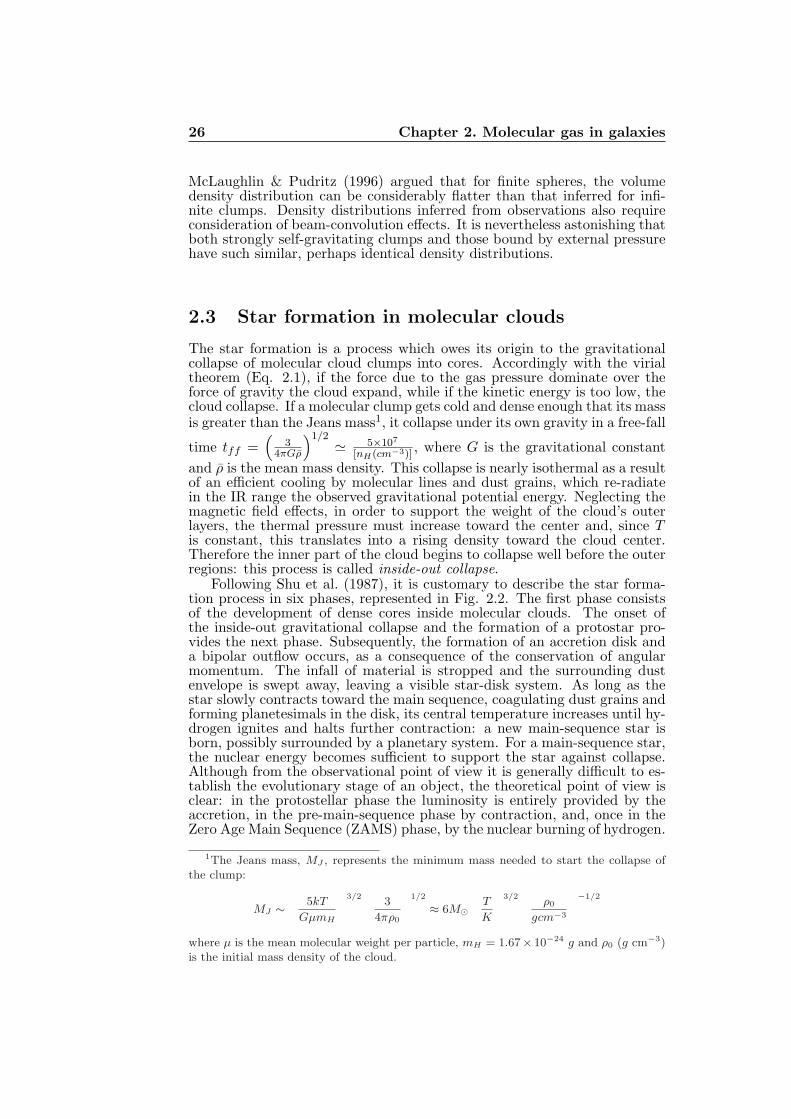
26 Chapter 2. Molecular gas in galaxies
McLaughlin & Pudritz (1996) argued that for finite spheres, the volumedensity distribution can be considerably flatter than that inferred for infi-nite clumps. Density distributions inferred from observations also requireconsideration of beam-convolution effects. It is nevertheless astonishing thatboth strongly self-gravitating clumps and those bound by external pressurehave such similar, perhaps identical density distributions.
2.3 Star formation in molecular clouds
The star formation is a process which owes its origin to the gravitationalcollapse of molecular cloud clumps into cores. Accordingly with the virialtheorem (Eq. 2.1), if the force due to the gas pressure dominate over theforce of gravity the cloud expand, while if the kinetic energy is too low, thecloud collapse. If a molecular clump gets cold and dense enough that its massis greater than the Jeans mass1, it collapse under its own gravity in a free-fall
time tff =(
34πGρ
)1/2≃ 5×10⁷
[nH(cm−3)], where G is the gravitational constant
and ρ is the mean mass density. This collapse is nearly isothermal as a resultof an efficient cooling by molecular lines and dust grains, which re-radiatein the IR range the observed gravitational potential energy. Neglecting themagnetic field effects, in order to support the weight of the cloud’s outerlayers, the thermal pressure must increase toward the center and, since Tis constant, this translates into a rising density toward the cloud center.Therefore the inner part of the cloud begins to collapse well before the outerregions: this process is called inside-out collapse.
Following Shu et al. (1987), it is customary to describe the star forma-tion process in six phases, represented in Fig. 2.2. The first phase consistsof the development of dense cores inside molecular clouds. The onset ofthe inside-out gravitational collapse and the formation of a protostar pro-vides the next phase. Subsequently, the formation of an accretion disk anda bipolar outflow occurs, as a consequence of the conservation of angularmomentum. The infall of material is stropped and the surrounding dustenvelope is swept away, leaving a visible star-disk system. As long as thestar slowly contracts toward the main sequence, coagulating dust grains andforming planetesimals in the disk, its central temperature increases until hy-drogen ignites and halts further contraction: a new main-sequence star isborn, possibly surrounded by a planetary system. For a main-sequence star,the nuclear energy becomes sufficient to support the star against collapse.Although from the observational point of view it is generally difficult to es-tablish the evolutionary stage of an object, the theoretical point of view isclear: in the protostellar phase the luminosity is entirely provided by theaccretion, in the pre-main-sequence phase by contraction, and, once in theZero Age Main Sequence (ZAMS) phase, by the nuclear burning of hydrogen.
1The Jeans mass, MJ , represents the minimum mass needed to start the collapse ofthe clump:
MJ ∼5kT
GµmH
3/23
4πρ0
1/2
≈ 6M⊙
T
K
3/2ρ0
gcm−3
−1/2
where µ is the mean molecular weight per particle, mH = 1.67× 10⁻²⁴ g and ρ0 (g cm−3)is the initial mass density of the cloud.
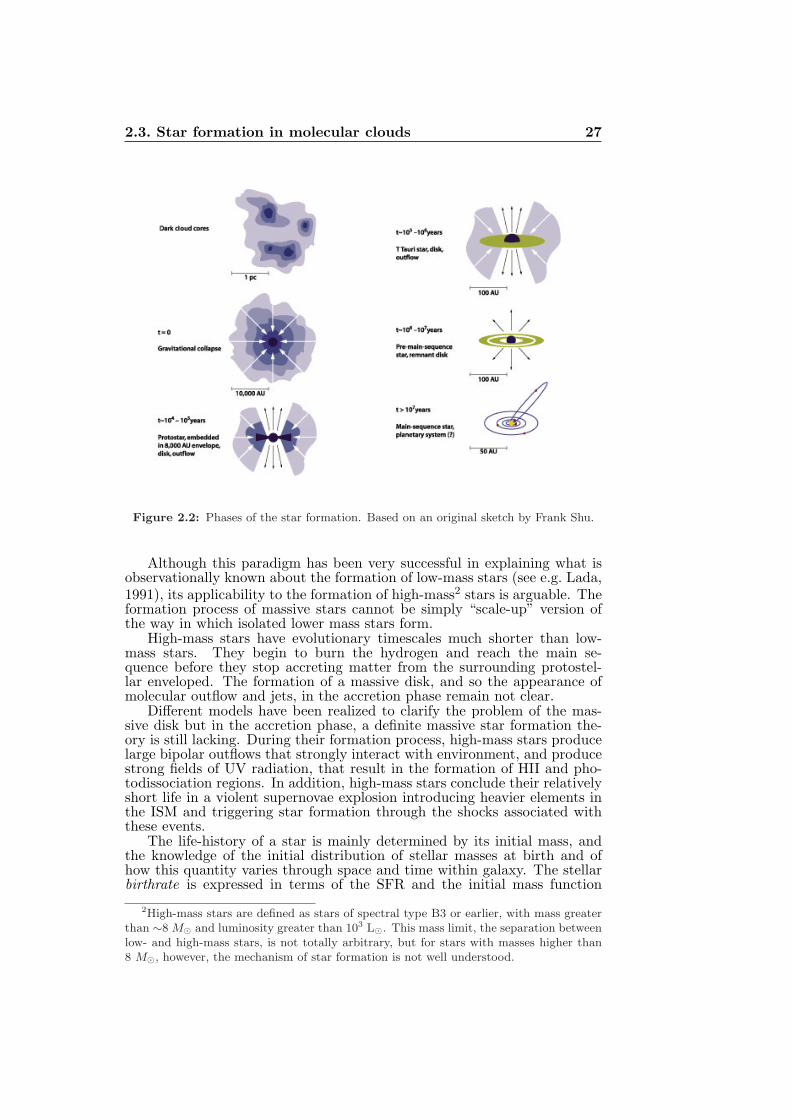
2.3. Star formation in molecular clouds 27
Figure 2.2: Phases of the star formation. Based on an original sketch by Frank Shu.
Although this paradigm has been very successful in explaining what isobservationally known about the formation of low-mass stars (see e.g. Lada,1991), its applicability to the formation of high-mass2 stars is arguable. Theformation process of massive stars cannot be simply “scale-up” version ofthe way in which isolated lower mass stars form.
High-mass stars have evolutionary timescales much shorter than low-mass stars. They begin to burn the hydrogen and reach the main se-quence before they stop accreting matter from the surrounding protostel-lar enveloped. The formation of a massive disk, and so the appearance ofmolecular outflow and jets, in the accretion phase remain not clear.
Different models have been realized to clarify the problem of the mas-sive disk but in the accretion phase, a definite massive star formation the-ory is still lacking. During their formation process, high-mass stars producelarge bipolar outflows that strongly interact with environment, and producestrong fields of UV radiation, that result in the formation of HII and pho-todissociation regions. In addition, high-mass stars conclude their relativelyshort life in a violent supernovae explosion introducing heavier elements inthe ISM and triggering star formation through the shocks associated withthese events.
The life-history of a star is mainly determined by its initial mass, andthe knowledge of the initial distribution of stellar masses at birth and ofhow this quantity varies through space and time within galaxy. The stellarbirthrate is expressed in terms of the SFR and the initial mass function
2High-mass stars are defined as stars of spectral type B3 or earlier, with mass greaterthan ∼8 M⊙ and luminosity greater than 103 L⊙. This mass limit, the separation betweenlow- and high-mass stars, is not totally arbitrary, but for stars with masses higher than8 M⊙, however, the mechanism of star formation is not well understood.
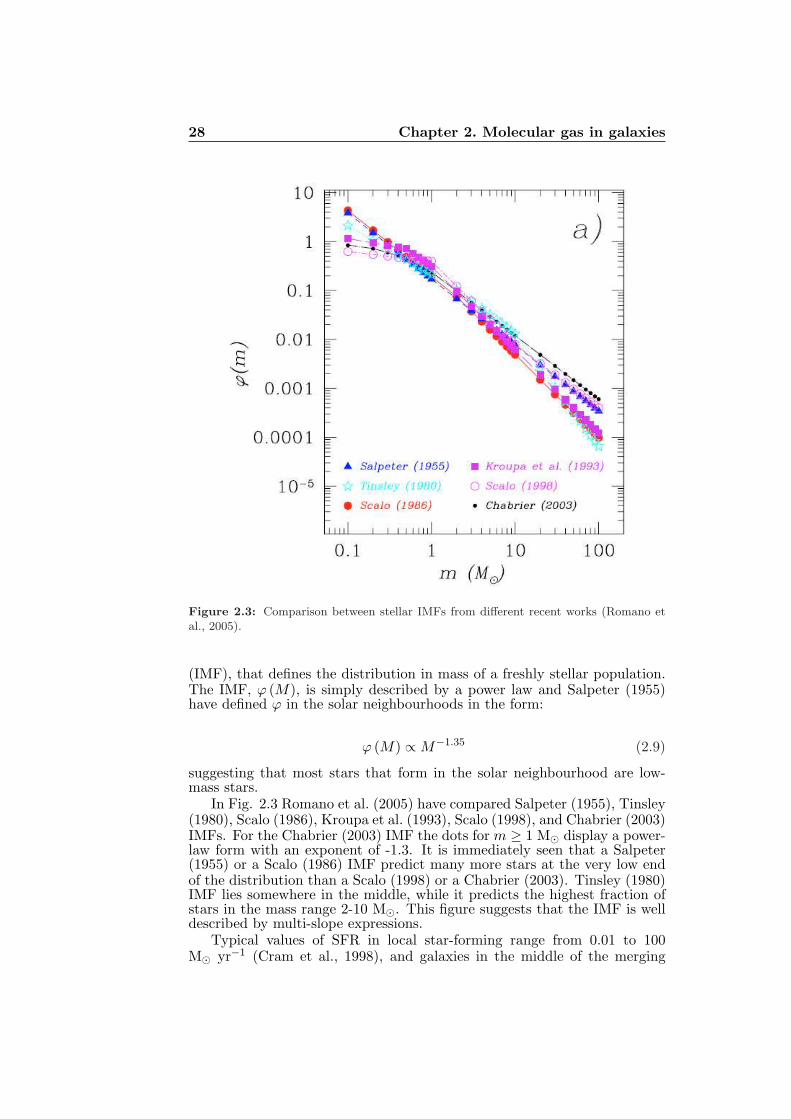
28 Chapter 2. Molecular gas in galaxies
Figure 2.3: Comparison between stellar IMFs from different recent works (Romano etal., 2005).
(IMF), that defines the distribution in mass of a freshly stellar population.The IMF, ϕ (M), is simply described by a power law and Salpeter (1955)have defined ϕ in the solar neighbourhoods in the form:
ϕ (M) ∝ M−1.35 (2.9)
suggesting that most stars that form in the solar neighbourhood are low-mass stars.
In Fig. 2.3 Romano et al. (2005) have compared Salpeter (1955), Tinsley(1980), Scalo (1986), Kroupa et al. (1993), Scalo (1998), and Chabrier (2003)IMFs. For the Chabrier (2003) IMF the dots for m ≥ 1 M⊙ display a power-law form with an exponent of -1.3. It is immediately seen that a Salpeter(1955) or a Scalo (1986) IMF predict many more stars at the very low endof the distribution than a Scalo (1998) or a Chabrier (2003). Tinsley (1980)IMF lies somewhere in the middle, while it predicts the highest fraction ofstars in the mass range 2-10 M⊙. This figure suggests that the IMF is welldescribed by multi-slope expressions.
Typical values of SFR in local star-forming range from 0.01 to 100M⊙ yr−1 (Cram et al., 1998), and galaxies in the middle of the merging
2.4. Molecular gas content 29
process show SFR up to 100-200 M⊙ yr−1 and higher values of SFR char-acterize ultra luminous starburst galaxies. In the study of star formationthere have also been attempts to parametrize the SFR as a simple functionof the gas distribution. Schmidt (1959), for the first time, have describedthe conversion of the gas mass into stars as a power-law function of localgas density SFR ∝ ρN
gas. Schmidt (1959), observing HI and stars, have con-cluded that the power-law index has a value of order 2. Today, with theinclusion of the molecular component in the ISM, the situation is different.Kennicutt (1998c) have found N = 1.4 for global star formation and total(HI + CO) gas surface density in a sample of “normal” galaxies.
2.4 Molecular gas content
The molecular gas content in galaxies is estimated and analyzed using dif-ferent tools, such as, the X conversion factor, the intensity line ratio, andthe excitation temperature. In this section, we discuss the information thatwe can obtain by these parameters and their limits.
2.4.1 CO-H2 conversion factor
As said in the Chapter 1, a difficulty linked to the measurement of the Xvalue is that it is determined by various factors, such as the metallicity, thetemperature, the cosmic ray density, and the UV radiation field (see, forinstance, Boselli et al., 2002).
Theory and observations suggest that the gas temperatures in systemswith high SFR can be quite high, so the use of the standard conversion factorwill lead to serious systematic overestimates of the amount of the moleculargas. This consideration is probably valid not only for the galaxies withunusually high global rates of star formation, such as the infrared-luminousgalaxies discovered by IRAS, but also for the nuclear regions of many lessinfrared-luminous galaxies.
Also the dependence of the CO-H2 conversion factor on the metallicityis quite controversial. Some calculations show that CO emission from anensemble of clouds in an external galaxy does not depends strongly on me-tallicity as long as the individual clouds are optically thick in CO (Dickmanet al., 1986). However, models of individual low-metallicity clouds suggestthat such clouds are optically thin in CO, which produce a strong depen-dence of the CO-H2 conversion factor on metallicity (see Maloney & Black,1988). If the CO-H2 conversion factor is strongly dependent on the metal-licity, then molecular gas masses in irregular galaxies, in the outer regionsof spiral galaxies, and in other low metallicity systems may be significantlyunderestimated. Galaxies with lower metallicity generally have a higher Xfactor: Wilson (1995), studying 5 Local Group galaxies, have found thatthe X conversion factor increases as the metallicity of the host galaxy de-creases, with the conversion factor increasing by a factor of 4.7 for a factorof 10 decrease in metallicity.
The X value also seems to change with the morphological type of thegalaxies. Nakai & Kuno (1995), studying the CO-H2 conversion factor inthe M 51 galaxy and comparing their results with those present in litera-ture for other nearby galaxies, have found that galaxies early-type -earlierthan Scd (M 31, M 33, M 51, NGC 891)- show values from comparable tosmaller (≈ 1-3) than the mean Galactic value, while extremely late-type or
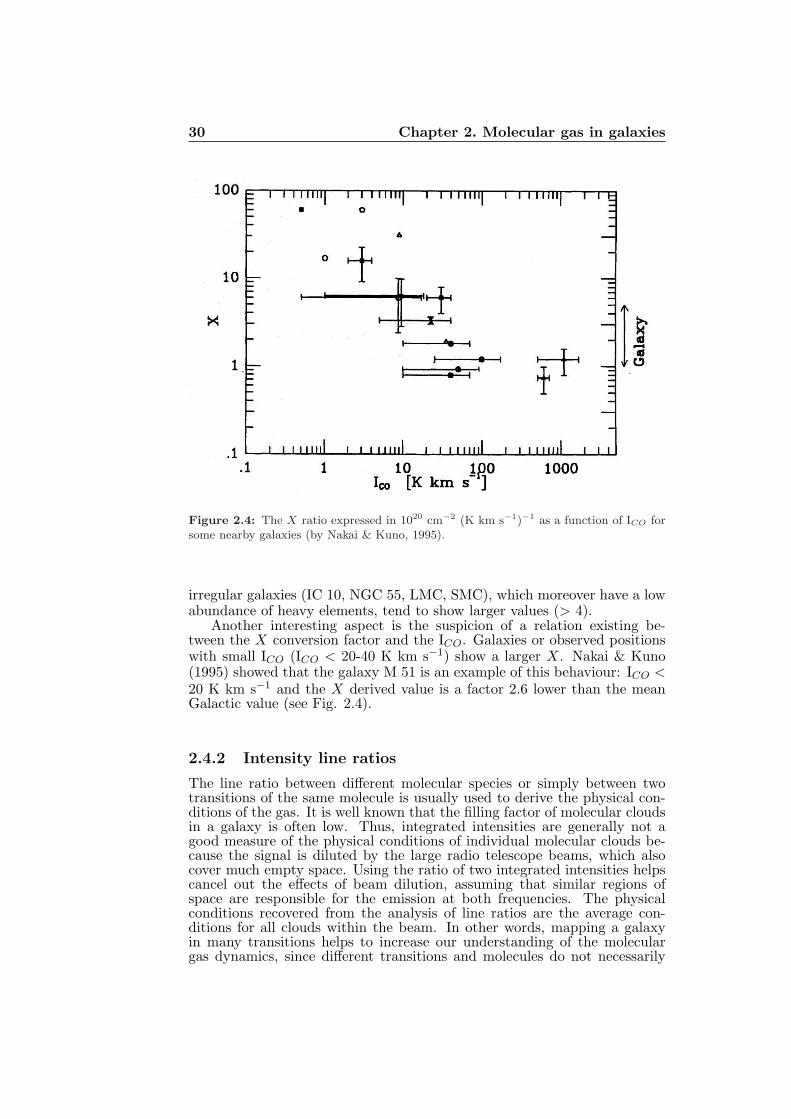
30 Chapter 2. Molecular gas in galaxies
Figure 2.4: The X ratio expressed in 1020 cm−2 (K km s−1)−1 as a function of ICO forsome nearby galaxies (by Nakai & Kuno, 1995).
irregular galaxies (IC 10, NGC 55, LMC, SMC), which moreover have a lowabundance of heavy elements, tend to show larger values (> 4).
Another interesting aspect is the suspicion of a relation existing be-tween the X conversion factor and the ICO. Galaxies or observed positionswith small ICO (ICO < 20-40 K km s−1) show a larger X. Nakai & Kuno(1995) showed that the galaxy M 51 is an example of this behaviour: ICO <20 K km s−1 and the X derived value is a factor 2.6 lower than the meanGalactic value (see Fig. 2.4).
2.4.2 Intensity line ratios
The line ratio between different molecular species or simply between twotransitions of the same molecule is usually used to derive the physical con-ditions of the gas. It is well known that the filling factor of molecular cloudsin a galaxy is often low. Thus, integrated intensities are generally not agood measure of the physical conditions of individual molecular clouds be-cause the signal is diluted by the large radio telescope beams, which alsocover much empty space. Using the ratio of two integrated intensities helpscancel out the effects of beam dilution, assuming that similar regions ofspace are responsible for the emission at both frequencies. The physicalconditions recovered from the analysis of line ratios are the average con-ditions for all clouds within the beam. In other words, mapping a galaxyin many transitions helps to increase our understanding of the moleculargas dynamics, since different transitions and molecules do not necessarily
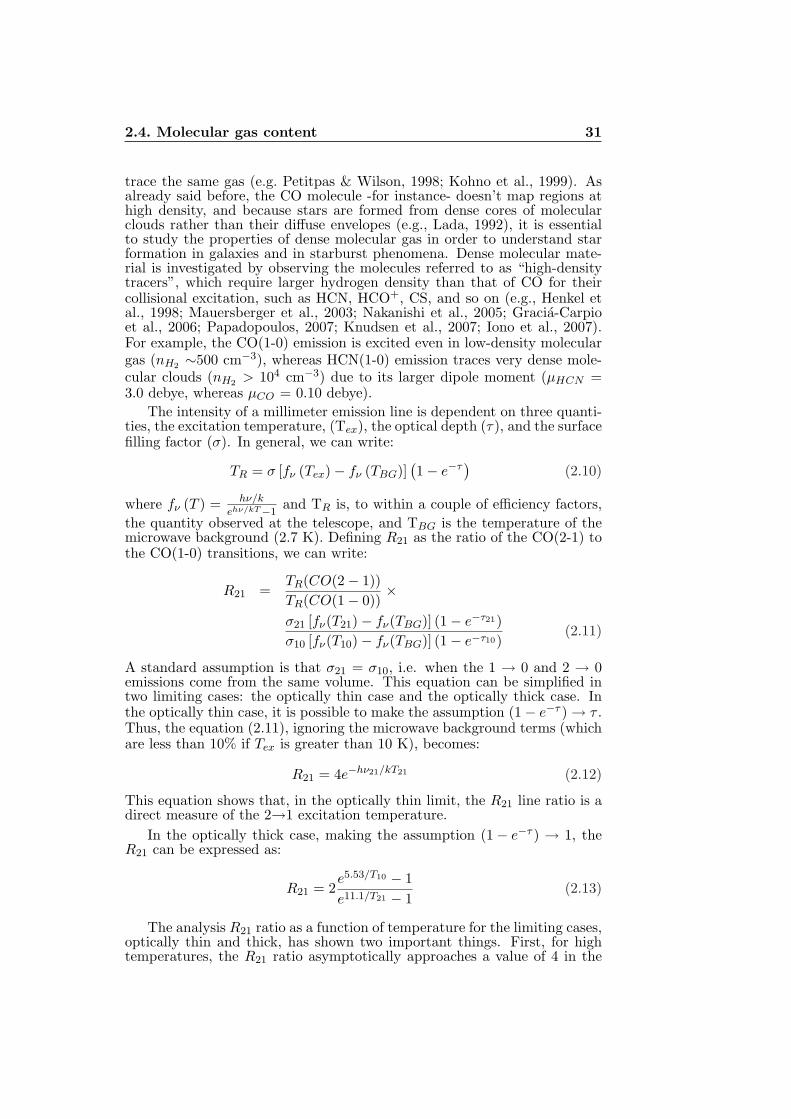
2.4. Molecular gas content 31
trace the same gas (e.g. Petitpas & Wilson, 1998; Kohno et al., 1999). Asalready said before, the CO molecule -for instance- doesn’t map regions athigh density, and because stars are formed from dense cores of molecularclouds rather than their diffuse envelopes (e.g., Lada, 1992), it is essentialto study the properties of dense molecular gas in order to understand starformation in galaxies and in starburst phenomena. Dense molecular mate-rial is investigated by observing the molecules referred to as “high-densitytracers”, which require larger hydrogen density than that of CO for theircollisional excitation, such as HCN, HCO+, CS, and so on (e.g., Henkel etal., 1998; Mauersberger et al., 2003; Nakanishi et al., 2005; Gracia-Carpioet al., 2006; Papadopoulos, 2007; Knudsen et al., 2007; Iono et al., 2007).For example, the CO(1-0) emission is excited even in low-density moleculargas (nH2
∼500 cm−3), whereas HCN(1-0) emission traces very dense mole-cular clouds (nH2
> 104 cm−3) due to its larger dipole moment (µHCN =3.0 debye, whereas µCO = 0.10 debye).
The intensity of a millimeter emission line is dependent on three quanti-ties, the excitation temperature, (Tex), the optical depth (τ), and the surfacefilling factor (σ). In general, we can write:
TR = σ [fν (Tex) − fν (TBG)](
1 − e−τ)
(2.10)
where fν (T ) = hν/k
ehν/kT−1and TR is, to within a couple of efficiency factors,
the quantity observed at the telescope, and TBG is the temperature of themicrowave background (2.7 K). Defining R21 as the ratio of the CO(2-1) tothe CO(1-0) transitions, we can write:
R21 =TR(CO(2 − 1))
TR(CO(1 − 0))×
σ21 [fν(T21) − fν(TBG)] (1 − e−τ21)
σ10 [fν(T10) − fν(TBG)] (1 − e−τ10)(2.11)
A standard assumption is that σ21 = σ10, i.e. when the 1 → 0 and 2 → 0emissions come from the same volume. This equation can be simplified intwo limiting cases: the optically thin case and the optically thick case. Inthe optically thin case, it is possible to make the assumption (1 − e−τ ) → τ .Thus, the equation (2.11), ignoring the microwave background terms (whichare less than 10% if Tex is greater than 10 K), becomes:
R21 = 4e−hν21/kT21 (2.12)
This equation shows that, in the optically thin limit, the R21 line ratio is adirect measure of the 2→1 excitation temperature.
In the optically thick case, making the assumption (1 − e−τ ) → 1, theR21 can be expressed as:
R21 = 2e5.53/T10 − 1
e11.1/T21 − 1(2.13)
The analysis R21 ratio as a function of temperature for the limiting cases,optically thin and thick, has shown two important things. First, for hightemperatures, the R21 ratio asymptotically approaches a value of 4 in the
32 Chapter 2. Molecular gas in galaxies
Figure 2.5: R21 ratios versus excitation temperature in Kelvin for optically depth τ ≫
1 in both lines (by Braine & Combes, 1992).
optically thin case, while it only approaches 1 in the optically thick case.If 1 is the limit for an optically thick gas, R21 ratios > 1 are signatures ofoptically thin CO emission. Second, in the optically thin limit, the R21 ratiodoes not drop below 1 until the excitation temperature drops below 8 K.This situation is improbable, but not impossible, especially if the excitationof the gas is subthermal.
The 12CO lines are optically thick in most galaxies, including the MilkyWay, but there are other galaxies where the problem is still open, like M 82(Loiseau et al., 1990) or NGC 3628 (Reuter et al., 1991). When studyingthe line ratio for a large sample (118) of nearby spiral galaxies, Braine &Combes (1992) saw that subthermal excitation or different gas filling factorsare only required for explaining line ratios less than 0.7.
With line ratios of 0.7, 0.8, and 0.9, the excitation temperatures areexpected to be 7 K, 10.5 K, and 21 K, respectively (see Fig. 2.5). Theselow line ratios can be explained considering that at high gas densities in theheating mechanism, the dust-gas collisions are more important than cosmicrays that ionize H2 or via formation of H2 on dust grains. When neglectingthe heating from gravitational collapse or magnetic sources and assumingthe gas in local thermal equilibrium (Tex = Tkin), Braine & Combes (1992)derived a relationship between gas temperature and dust temperature athigh densities. At gas densities of 104 cm−3, which is required to approxi-mately thermalize the J = 2 level of CO, and dust temperatures of 30 K, theequilibrium gas temperature is 10 - 13 K. Considering that in the clouds thedust is probably warmer in the vicinity of OB stars and lower elsewhere, thegas heated by the warm dust at 50 - 60 K will reach the thermal equilibrium
2.5. Distribution and dynamics of the CO 33
at temperatures of 15 - 20 K. The J = 2 level of CO is populated at thesetemperatures, and Braine & Combes (1992) computed that the expectedline ratios are between 0.7 and 0.9. In addition, it is important to remem-ber that the CO emission is not always thermalized and that the excitationtemperature may change along the line of sight and within a single beam.
2.5 Distribution and dynamics of the CO
Large-scale CO maps of nearby galaxies now available, extend our knowledgeon global properties, radial gradients, and spiral structure of the molecularISM. Millimetric interferometers reveal high velocity gradients in galaxynuclei, and formation of embedded structures, like bars within bars.
2.5.1 Radial and vertical distribution
The HI and CO (or H2) radial distribution can strongly differ from galaxyto galaxy: normally in the center the N(H2)/N(HI) ratio can reach thevalue of 10 or 20, and it falls below 1 in the outer parts. All componentsrelated to the SF, such as the blue luminosity from stars, the Hα (gas ionizedby young stars), the radio-continuum (synchrotron related to supernovae),and also the CO emission, follow an exponential distribution, but this notthe case of the HI gas that is extending much beyond the “optical” disk(RHI = 2 − 4 Ropt).
The HI gas has often a small deficiency in the central regions of thegalaxies. It is possible that the atomic gas is transformed in molecular phasein the denser central parts of the galaxies, where the HI and CO distributionsappear complementary. However this is not the general situation, and allpossibilities have been observed, including central gaseous depletion, bothin CO and HI (like M 81, M 31, or NGC 7331).
Since the HI gas is coming from dissociated molecular gas in photodisso-ciation regions (PDRs), Smith et al. (2000) have proposed that the volumicdensity of local H2 can be deduced from measurements of the HI columndensity coupled to the FUV photon flux. Applying this idea to M 101 ga-laxy, they have found that the molecular gas with a range of density from30 to 1000 cm−3 is located near star-forming regions out to the distanceof ∼26 kpc from the center, close to the photometric limit of R25. Con-cerning the vertical distribution of the molecular gas, we know that thegalaxy disks -both the Milky Way and external galaxies seen edge-on- havemuch narrower distribution in CO emission than HI. This aspect suggeststhat the molecular gas is more confined to the plane due to a much lowervertical velocity dispersion. On the contrary, the face-on galaxies -both inCO (Combes & Becquaert, 1997) and HI (Kamphuis & Briggs, 1992)- ex-hibit velocity dispersion with similar values between them and constant withthe radius. Combes & Becquaert (1997) have interpreted the constancy ofthe velocity dispersion (σv ∼ 6 km s−1) as due to a feedback mechanisminvolving gravitational instabilities and gas dissipation. The similarity ofthe CO and HI velocity dispersions suggests that the two components arewell mixed, and they are only two different phases of the same kinemati-cal gas component. The gas can be transformed from the atomic phase tothe molecular one and vice-versa several times during a vertical oscillation.The possibilities are that 1) the H2 gas follows the HI, but the CO is pho-todissociated at high altitudes, 2) the H2 is not excited, or 3) the H2 could
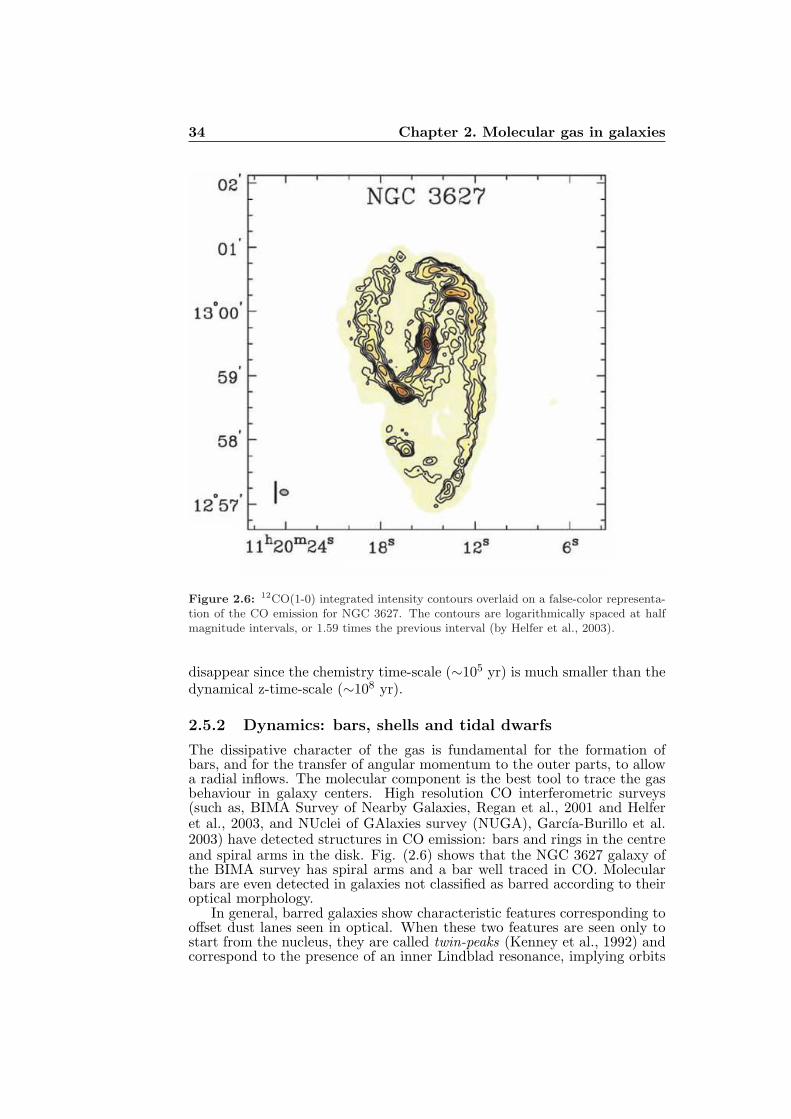
34 Chapter 2. Molecular gas in galaxies
Figure 2.6: 12CO(1-0) integrated intensity contours overlaid on a false-color representa-tion of the CO emission for NGC 3627. The contours are logarithmically spaced at halfmagnitude intervals, or 1.59 times the previous interval (by Helfer et al., 2003).
disappear since the chemistry time-scale (∼105 yr) is much smaller than thedynamical z-time-scale (∼108 yr).
2.5.2 Dynamics: bars, shells and tidal dwarfs
The dissipative character of the gas is fundamental for the formation ofbars, and for the transfer of angular momentum to the outer parts, to allowa radial inflows. The molecular component is the best tool to trace the gasbehaviour in galaxy centers. High resolution CO interferometric surveys(such as, BIMA Survey of Nearby Galaxies, Regan et al., 2001 and Helferet al., 2003, and NUclei of GAlaxies survey (NUGA), Garcıa-Burillo et al.2003) have detected structures in CO emission: bars and rings in the centreand spiral arms in the disk. Fig. (2.6) shows that the NGC 3627 galaxy ofthe BIMA survey has spiral arms and a bar well traced in CO. Molecularbars are even detected in galaxies not classified as barred according to theiroptical morphology.
In general, barred galaxies show characteristic features corresponding tooffset dust lanes seen in optical. When these two features are seen only tostart from the nucleus, they are called twin-peaks (Kenney et al., 1992) andcorrespond to the presence of an inner Lindblad resonance, implying orbits
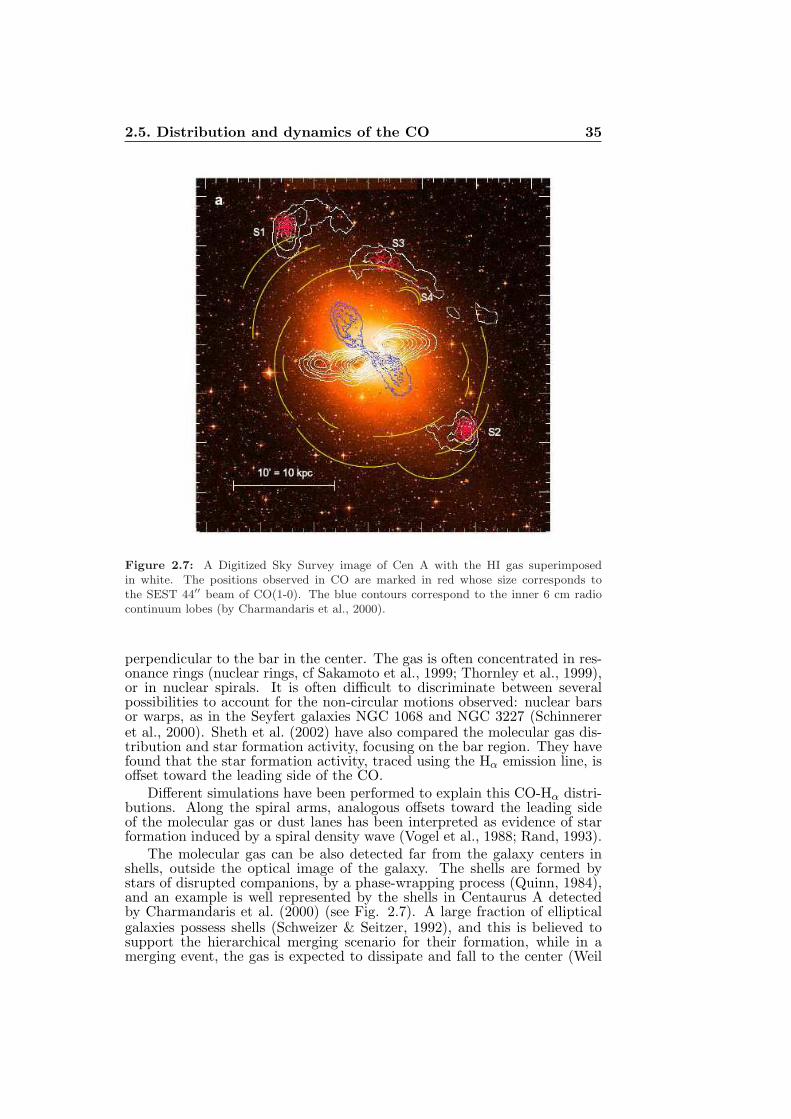
2.5. Distribution and dynamics of the CO 35
Figure 2.7: A Digitized Sky Survey image of Cen A with the HI gas superimposedin white. The positions observed in CO are marked in red whose size corresponds tothe SEST 44′′ beam of CO(1-0). The blue contours correspond to the inner 6 cm radiocontinuum lobes (by Charmandaris et al., 2000).
perpendicular to the bar in the center. The gas is often concentrated in res-onance rings (nuclear rings, cf Sakamoto et al., 1999; Thornley et al., 1999),or in nuclear spirals. It is often difficult to discriminate between severalpossibilities to account for the non-circular motions observed: nuclear barsor warps, as in the Seyfert galaxies NGC 1068 and NGC 3227 (Schinnereret al., 2000). Sheth et al. (2002) have also compared the molecular gas dis-tribution and star formation activity, focusing on the bar region. They havefound that the star formation activity, traced using the Hα emission line, isoffset toward the leading side of the CO.
Different simulations have been performed to explain this CO-Hα distri-butions. Along the spiral arms, analogous offsets toward the leading sideof the molecular gas or dust lanes has been interpreted as evidence of starformation induced by a spiral density wave (Vogel et al., 1988; Rand, 1993).
The molecular gas can be also detected far from the galaxy centers inshells, outside the optical image of the galaxy. The shells are formed bystars of disrupted companions, by a phase-wrapping process (Quinn, 1984),and an example is well represented by the shells in Centaurus A detectedby Charmandaris et al. (2000) (see Fig. 2.7). A large fraction of ellipticalgalaxies possess shells (Schweizer & Seitzer, 1992), and this is believed tosupport the hierarchical merging scenario for their formation, while in amerging event, the gas is expected to dissipate and fall to the center (Weil
36 Chapter 2. Molecular gas in galaxies
& Hernquist, 1993). Also the atomic gas has been observed associated toshells (Schiminovich et al., 1994). In Centaurus A the 10% of the gas inshells is atomic, while the 50% is molecular (Charmandaris et al., 2000).Moreover, the H2/HI ratio is the same in the nuclear disk and in the shells.To explain how in Cen A the gas has been enriched in metals far from thenucleus, Graham (1998, 1999) have proposed that this enrichment happenedin a recent star formation episode triggered in the shell gas by the impactof the radio jet. In fact, in Cen A the shells detected in CO are preciselyaligned with the radio jet, and the recently formed stars could have enrichedthe observed gas in metals and account for the CO detection.
Finally, tidal dwarfs are small systems becoming gravitationally boundwithin tidal tails dragged by the interaction between two massive gas-richgalaxies. The collapse of the gas in these systems triggers new star formation(Duc & Mirabel, 1998). Braine et al. (2000), reporting the discovery of theCO emission in two tidal dwarf galaxies (Arp 105 and Arp 245), have notedthat the concentration of molecular gas in both cases peaks at the samelocation as the maximum in atomic hydrogen density, unlike the situationin most gas-rich galaxies. They inferred from this that the molecular gasformed from the atomic hydrogen, rather than being torn in molecular formfrom the interacting galaxies. Star formation in the tidal dwarf galaxiestherefore appears to mimic the process in normal spiral galaxies like ourown.
2.6 CO as a function of type and environment
Different surveys have been conducted to establish whether galaxies can becharacterized by a canonical gas content that may vary significantly alongthe Hubble sequence (early-type versus late-type objects), and/or dependon the particular environment (isolated versus strongly interacting galaxies)(such as, Knapp et al., 1989; Young & Knezek, 1989; Young & Scoville, 1991;Bregman et al., 1992; Fabbiano et al., 1992; Burstein et al., 1997; Casoli etal., 1998; Beuing et al., 1999; Bettoni et al., 2003; Casasola et al., 2004). Asalready said in the Chapter 1, a global study of the ISM content in galaxiesrequires a multi-wavelength approach: FIR observations at 60 and 100 µmtrace the warm dust content, while those at 140-200 µm the cold dust; mmlines of carbon monoxide and the 21cm line of HI must be used to infer themolecular and atomic gas content respectively, and the X-ray wave-band isused to study the hot gas component.
In general elliptical galaxies are poorer in cool gas than spirals. Thispoverty, combined with the fact that comparatively few giant ellipticals lieconveniently close to the Milky Way, makes them hard to observe at 21 cm,2.6 mm or in the IR, and hinders quantification of their cool ISM content.Most elliptical galaxies possess accreted gas, already detected in HI (Knappet al., 1989; van Gorkom & Schiminovich, 1997), that appears to be unrelatedto the underlying stellar population. It may be the remnant of the mergerevent at their birth, or accretion of small gas-rich companions.
The principal problem linked to the CO surveys is that the results ob-tained can have strong biases due to poor statistics (uneven coverage alongthe Hubble sequence), and also due to the inclusion of galaxies which areknown to be “peculiar”. For instance, the selection of galaxies candidateto be observed in CO surveys have been typically based on FIR criteria,that tend often to favour the inclusion of “peculiar” galaxies in surveys andintroduce a bias against “normal” systems.
2.6. CO as a function of type and environment 37
In first approximation, we can say that the average molecular contentis comparable to the atomic one, with the M(H2)/M(HI) ∼1, but there areeven examples where M(H2)/M(HI) ∼0.2, as found for instance by the COsurvey of Casoli et al. (1998) near the Coma cluster.
In the literature there are also molecular gas surveys that have inves-tigated morphological sub-classes of galaxies with specific characteristics.Combes et al. (2007), for instance, recently presented a CO survey of E/S0galaxies already observed in the optical with the SAURON integral-fieldspectrograph (Peletier et al., 2001). They have found that early-types arenot always devoid of gas, and can even show a substantial amount of COemission. In addition, Combes et al. (2007) did not find strong correlationsbetween the CO content and most stellar parameters, and interpreted thisresult compatible with the idea that, in a significant number of their sam-ple galaxies, the molecular gas has been accreted from the outside and hasproperties rather independent from the old, pre-existing stellar component.Other CO surveys (such as, Bettoni et al., 2001; Boselli et al., 2002; Bettoniet al., 2003; Casasola et al., 2004) studied the molecular gas properties ofgalaxies spanning a large range of morphological type and luminosity, andbelonging to different environments (clusters - field). Boselli et al. (2002),considering only late-type galaxies, have found that low-mass, dwarf galaxieshave higher molecular gas masses (per unit galaxy mass) than early-type,massive spirals. The molecular gas fraction in clouds or complexes is ∼15%of the total HI reservoir for all late-type galaxies. Strongly interacting gal-axies of their sample have, on average, a molecular gas content comparableto isolated-unperturbed objects, and the efficiency in transforming gas intostars is roughly constant in galaxies of different type, luminosity, and envi-ronment.
Another example of molecular gas investigation for galaxies of differenttypologies is our work, Casasola et al. (2004). Compiling a catalogue of morethan 1000 galaxies with strong signs of interaction and/or perturbation andconsidering all morphological types, we studied their gas content propertiesin comparison with galaxies considered normal, or not in interaction withthe environment. First, we have found that the morphological type has arole in determining the properties of these stellar systems, and that may benot correct to mix together interacting galaxies of all morphological types.Secondly, we saw that interacting or disturbed galaxies have always moregas than normal ones, and that this gas is mainly in the form of atomichydrogen in early-type systems, while it is in molecular form for galaxies oflatest types. Fig. (2.8) shows in detail the results found: galaxies classifiedas early-type (t < 0) have dust and HI overabundance, even with respectto their molecular gas, while those classified as late-type (t > 0) are richerin molecular gas and are quite normal, on average, for dust and atomicgas content. All interacting galaxies, from ellipticals to late spirals, have ahigher X-ray luminosity to normal ones.
Another suggestion on the reality of the higher molecular masses forinteracting galaxies comes from the analysis of the star formation rates andefficiencies. We have also found that galaxies in interaction appear moreluminous in the infrared (Fig. 2.9) because of the higher number of newlyformed stars heating the dust (Thronson & Telesco, 1986). This higher starformation rate does not correspond to a different efficiency in star formationper unit of calculated H2 mass (see Fig. 2.10). This may be explained if thehigher star formation is simply due to a higher molecular gas quantity.
We explained the excess of the molecular gas discussing the early-type
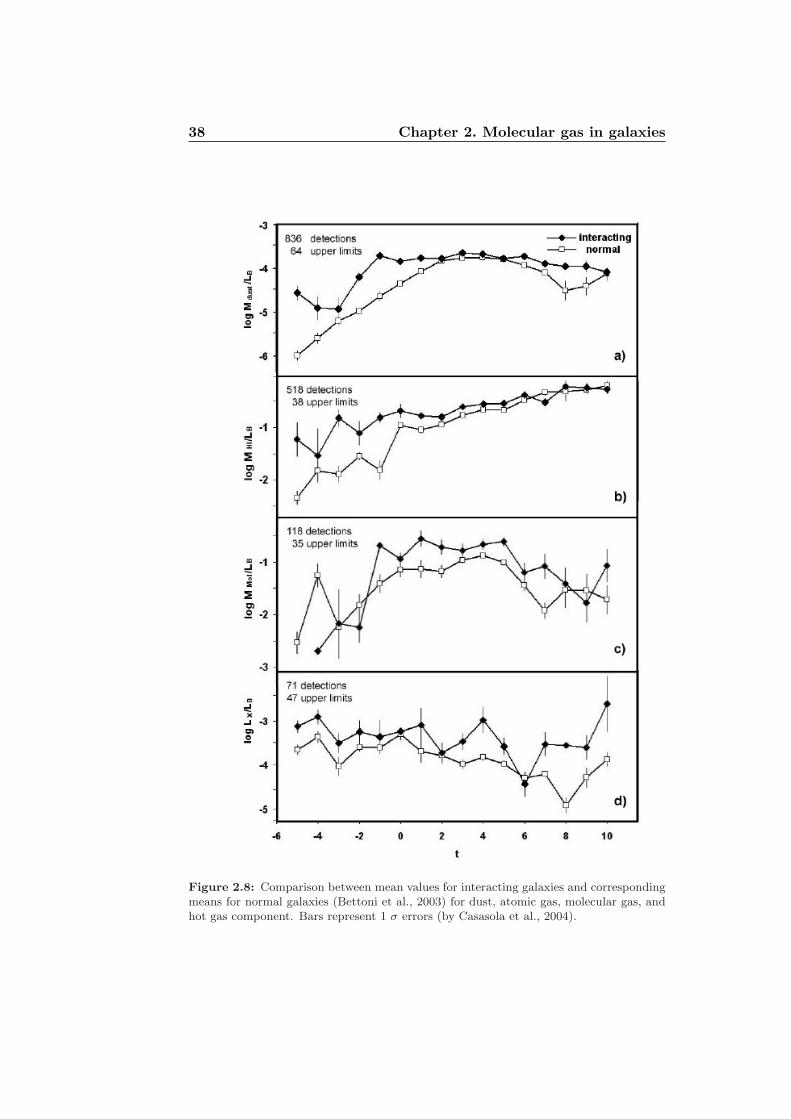
38 Chapter 2. Molecular gas in galaxies
Figure 2.8: Comparison between mean values for interacting galaxies and correspondingmeans for normal galaxies (Bettoni et al., 2003) for dust, atomic gas, molecular gas, andhot gas component. Bars represent 1 σ errors (by Casasola et al., 2004).
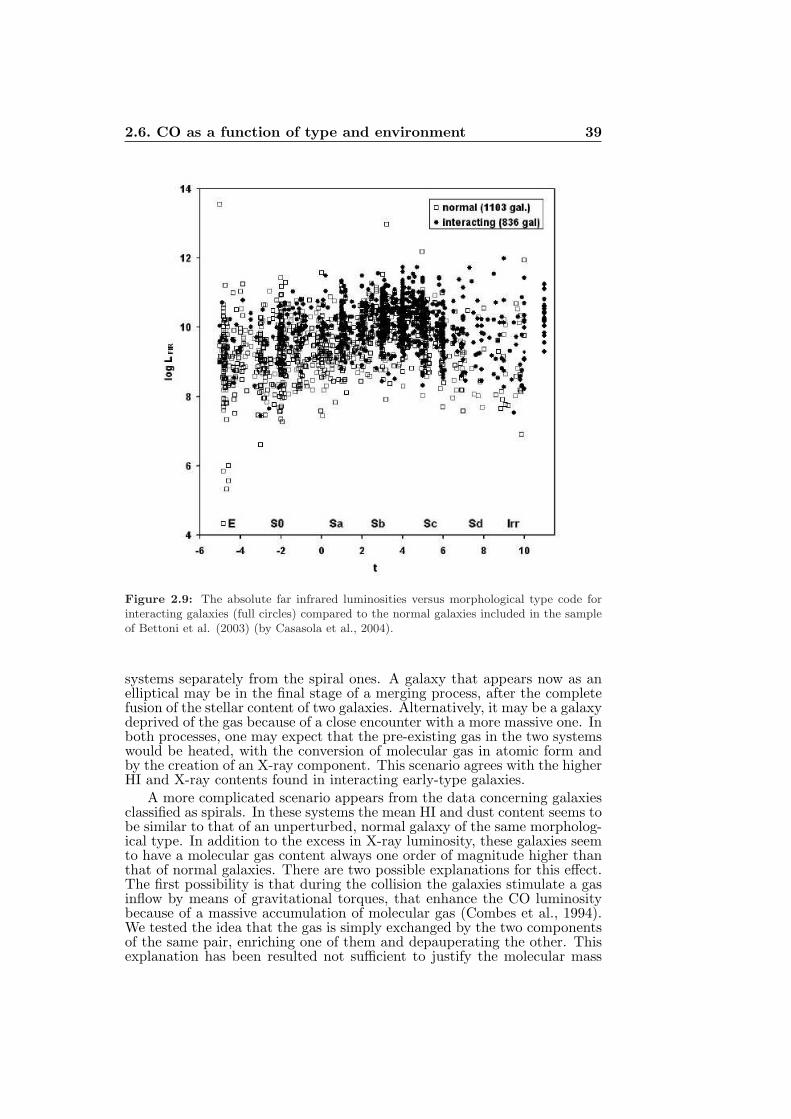
2.6. CO as a function of type and environment 39
Figure 2.9: The absolute far infrared luminosities versus morphological type code forinteracting galaxies (full circles) compared to the normal galaxies included in the sampleof Bettoni et al. (2003) (by Casasola et al., 2004).
systems separately from the spiral ones. A galaxy that appears now as anelliptical may be in the final stage of a merging process, after the completefusion of the stellar content of two galaxies. Alternatively, it may be a galaxydeprived of the gas because of a close encounter with a more massive one. Inboth processes, one may expect that the pre-existing gas in the two systemswould be heated, with the conversion of molecular gas in atomic form andby the creation of an X-ray component. This scenario agrees with the higherHI and X-ray contents found in interacting early-type galaxies.
A more complicated scenario appears from the data concerning galaxiesclassified as spirals. In these systems the mean HI and dust content seems tobe similar to that of an unperturbed, normal galaxy of the same morpholog-ical type. In addition to the excess in X-ray luminosity, these galaxies seemto have a molecular gas content always one order of magnitude higher thanthat of normal galaxies. There are two possible explanations for this effect.The first possibility is that during the collision the galaxies stimulate a gasinflow by means of gravitational torques, that enhance the CO luminositybecause of a massive accumulation of molecular gas (Combes et al., 1994).We tested the idea that the gas is simply exchanged by the two componentsof the same pair, enriching one of them and depauperating the other. Thisexplanation has been resulted not sufficient to justify the molecular mass
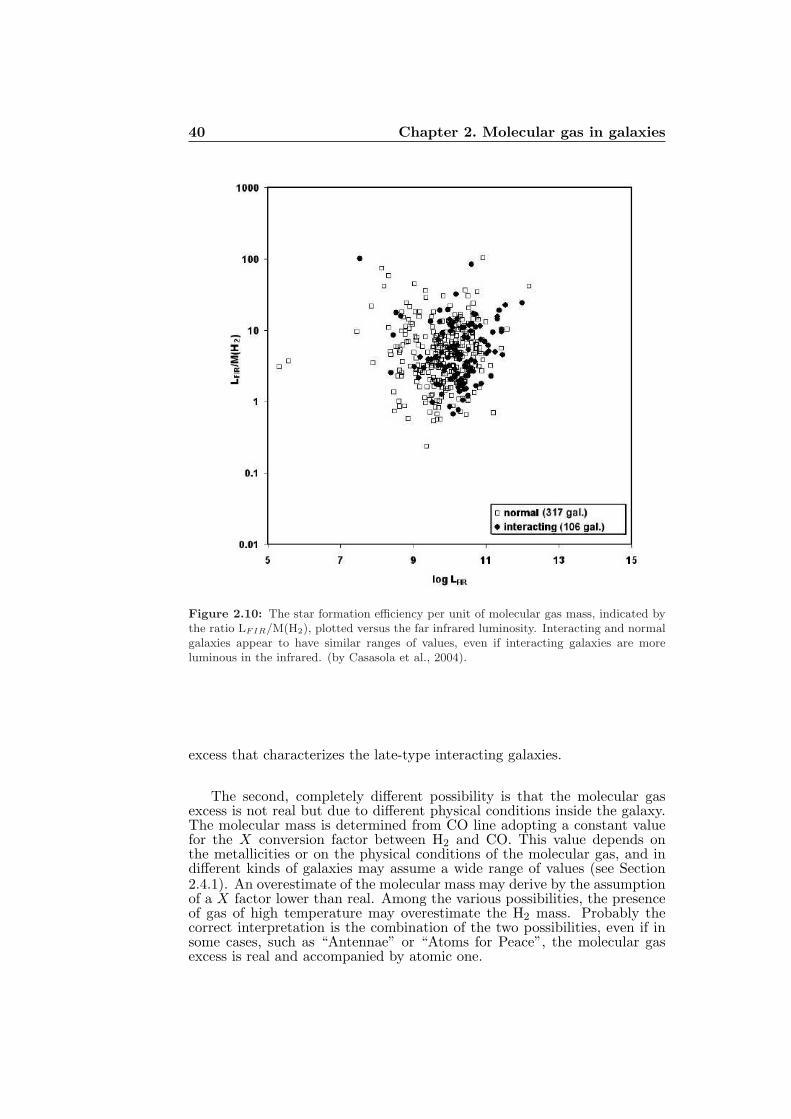
40 Chapter 2. Molecular gas in galaxies
Figure 2.10: The star formation efficiency per unit of molecular gas mass, indicated bythe ratio LFIR/M(H2), plotted versus the far infrared luminosity. Interacting and normalgalaxies appear to have similar ranges of values, even if interacting galaxies are moreluminous in the infrared. (by Casasola et al., 2004).
excess that characterizes the late-type interacting galaxies.
The second, completely different possibility is that the molecular gasexcess is not real but due to different physical conditions inside the galaxy.The molecular mass is determined from CO line adopting a constant valuefor the X conversion factor between H2 and CO. This value depends onthe metallicities or on the physical conditions of the molecular gas, and indifferent kinds of galaxies may assume a wide range of values (see Section2.4.1). An overestimate of the molecular mass may derive by the assumptionof a X factor lower than real. Among the various possibilities, the presenceof gas of high temperature may overestimate the H2 mass. Probably thecorrect interpretation is the combination of the two possibilities, even if insome cases, such as “Antennae” or “Atoms for Peace”, the molecular gasexcess is real and accompanied by atomic one.
2.7. CO at high redshift 41
2.7 CO at high redshift
As already said, the importance of the molecular medium in the history ofthe Universe is directly related to that of the star formation. The features ofthe global star formation history are now reasonably well established. Theyare inferred not only from the analysis of the age of stellar populations inlocal galaxies, but, since about a decade, directly and more accurately fromthe observation and census of high-z star forming galaxies. The majorityof the stellar mass of the Universe was thus formed in progenitors of spiralgalaxies between z = 0.5 and 1.5. Another important fraction is formed athigher redshift, including most of the stellar mass of elliptical galaxies. Theexploration of the properties of the prominent molecular medium at theseepochs of star formation in the Universe is fundamental to understand indetail the evolution of galaxies. This is mostly out of reach with currentmillimeter capabilities.
After the early millimetre detection of dust and CO in exceptional high-z objects, mostly strongly lensed, (Brown & Vanden Bout, 1991, 1992;Solomon et al., 1992; Barvainis et al., 1992, 1994; McMahon et al., 1994),it was realized that CO could be detected with current equipment in thebrightest high-z ultra-luminous infrared galaxies (ULIRGs). After aboutten years of major efforts with millimetre facilities, there are 36 CO de-tections with z between 1.06 and 6.42 collected in the paper of Solomon &Vanden Bout (2005) (this list of detections is constantly increasing with newdetections, e.g. Kneib et al., 2005; Iono et al., 2006; Willott et al., 2007).The list of CO detections includes 14 submillimetre galaxies (SMGs) (andone Lyman Break Galaxy) with z=1.06-3.41, 16 quasi-stellar objects (QSOs)with z=1.42-6.42, and 5 radio galaxies with z=2.39-5.20. We can note thatall the 11 objects with z>3.5 are prominent AGN.
In all objects with z>2, at least one line was detected in the 3 mm at-mospheric window, corresponding to relatively high rotation number, mostlyJ=3-2, 4-3 and 5-4 (in a few cases up to J=7-6). Low-J lines, J=1-0 or 2-1,were detected in the cm range in ten cases, mostly with the Very Large Ar-ray (VLA). The value of the ratio of the intensities may provide informationabout the CO rotational temperature, and hence, the kinetic temperatureand the H2 density. However, an accurate modelling of CO line formationremains difficult in the absence of detailed information about the extensionand the structure of CO emission, and the clumpiness of the molecular gas(see e.g. Combes et al., 1999; Solomon & Vanden Bout, 2005). This limitsthe corresponding diagnosis that it could provide for the emitting galaxy.However systematic programmes, such as the one recently carried out onSMGs at the IRAM-interferometer (Neri et al., 2003; Greve et al., 2005;Tacconi et al., 2006), are efficient in providing basic information about theproperties of such starburst galaxies at high redshift.
The fact that more than half the high-z galaxies where CO has beendetected, are AGN, mainly bright QSOs and powerful radio galaxies, isprobably due to the combination of two reasons. First, there is a highprobability of finding strong starbursts in the host galaxies of such AGN asproven by the many detections of dust submillimeter emission. MAMBO-IRAM studies showed that the probability to detect 1.2 mm continuum witha flux density & 2 mJy is as high as 25-30% around bright QSOs with z & 2(Omont et al., 1996; Carilli et al., 2001; Omont et al., 2001, 2003; Beelen etal., 2004). Secondly, there is a general good correlation between CO and FIRemission, and the FIR emission is strong in many of these AGNs. It is alsomuch easier to have a good determination of the redshift of the molecular
42 Chapter 2. Molecular gas in galaxies
gas of AGN, so that it is accurate enough to warrant that the CO line lieswithin the narrow bandwidth of millimetre detectors used up to now. Thisexplains in particular the absence of non-AGN sources among current COdetections with z > 3.5.
All other emission lines from the bulk of the interstellar gas of thesehigh-z starbursts are significantly more difficult to detect than CO (such as,HCN, HCO+, HNC, CN and the fine structure lines of CI and CII).
Chapter 3
Relations between ISMtracers
Introduction
The observations of galaxies at various wavelengths allow the study of therelationships between different phases of the interstellar gas and betweengas, dust, and stars. Some of these relations have already been known formany years, such as the one between CO and FIR luminosities (Sanders& Mirabel, 1985; Sanders et al., 1986; Solomon & Sage, 1988; Devereux &Young, 1991). Others, connected with X-ray emission, have been studiedeven more recently (Griffiths & Padovani, 1990; David et al., 1992; Ranalliet al., 2003).
In this Chapter we present a statistical and interpretative study on rela-tions existing between different tracers of the interstellar medium in galaxies.The results of this work are collected in the paper G. Galletta, V. Casasola,L. Piovan, E. Merlin, and D. Bettoni, A&A, 462, 495, 2007.
3.1 Emissions and star formation
It is known that fluxes emitted by a galaxy at different wavelengths may belinked by means of the star formation mechanism (see David et al., 1992;Ranalli et al., 2003). For instance, the formation of massive stars generatesheating of the dust clouds in which they are embedded by absorption oftheir UV radiation, and produces a re-emission of this energy in the FIRrange. This process links the current SFR to the IR emission at 60 and 100µm (Thronson & Telesco, 1986). The ionizing radiation of stars may alsoproduce evaporation of the molecular clouds. Inside these clouds, where theparticle density is high enough to produce a significant number of collisionsbetween H2 and CO molecules, these are excited and produce photons, butin optically thick regions. The warming by the UV stellar light makes theseregions less dense, thereby making visible CO lines at their edge. Becauseof this mechanism, these lines are considered tracers of the cold molecularhydrogen that does not emit observable lines, as already discussed in theChapter 2. The newly formed stars are also responsible for the X-ray emis-sion produced by very massive stars, by core-collapse SN, and by high-massX-ray binaries. According to the these mechanisms, we expect that galaxieswith active star formation will have a FIR emission, but also CO and X-
43
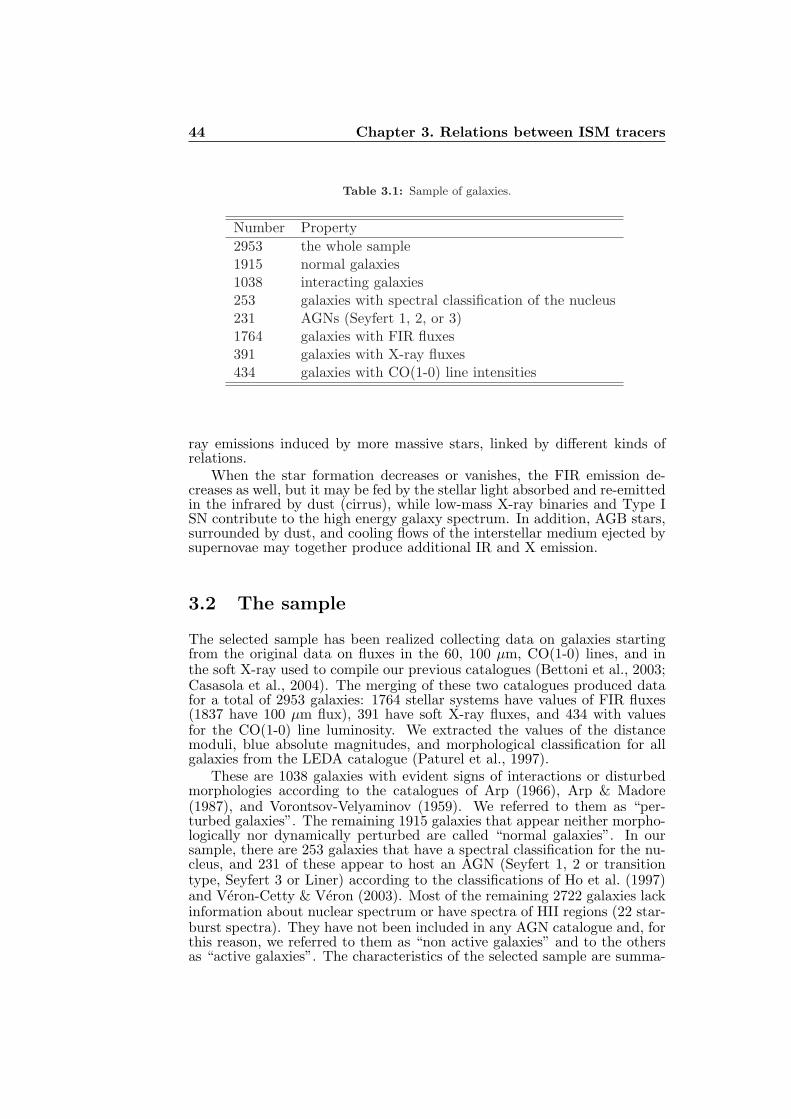
44 Chapter 3. Relations between ISM tracers
Table 3.1: Sample of galaxies.
Number Property
2953 the whole sample1915 normal galaxies1038 interacting galaxies253 galaxies with spectral classification of the nucleus231 AGNs (Seyfert 1, 2, or 3)1764 galaxies with FIR fluxes391 galaxies with X-ray fluxes434 galaxies with CO(1-0) line intensities
ray emissions induced by more massive stars, linked by different kinds ofrelations.
When the star formation decreases or vanishes, the FIR emission de-creases as well, but it may be fed by the stellar light absorbed and re-emittedin the infrared by dust (cirrus), while low-mass X-ray binaries and Type ISN contribute to the high energy galaxy spectrum. In addition, AGB stars,surrounded by dust, and cooling flows of the interstellar medium ejected bysupernovae may together produce additional IR and X emission.
3.2 The sample
The selected sample has been realized collecting data on galaxies startingfrom the original data on fluxes in the 60, 100 µm, CO(1-0) lines, and inthe soft X-ray used to compile our previous catalogues (Bettoni et al., 2003;Casasola et al., 2004). The merging of these two catalogues produced datafor a total of 2953 galaxies: 1764 stellar systems have values of FIR fluxes(1837 have 100 µm flux), 391 have soft X-ray fluxes, and 434 with valuesfor the CO(1-0) line luminosity. We extracted the values of the distancemoduli, blue absolute magnitudes, and morphological classification for allgalaxies from the LEDA catalogue (Paturel et al., 1997).
These are 1038 galaxies with evident signs of interactions or disturbedmorphologies according to the catalogues of Arp (1966), Arp & Madore(1987), and Vorontsov-Velyaminov (1959). We referred to them as “per-turbed galaxies”. The remaining 1915 galaxies that appear neither morpho-logically nor dynamically perturbed are called “normal galaxies”. In oursample, there are 253 galaxies that have a spectral classification for the nu-cleus, and 231 of these appear to host an AGN (Seyfert 1, 2 or transitiontype, Seyfert 3 or Liner) according to the classifications of Ho et al. (1997)and Veron-Cetty & Veron (2003). Most of the remaining 2722 galaxies lackinformation about nuclear spectrum or have spectra of HII regions (22 star-burst spectra). They have not been included in any AGN catalogue and, forthis reason, we referred to them as “non active galaxies” and to the othersas “active galaxies”. The characteristics of the selected sample are summa-
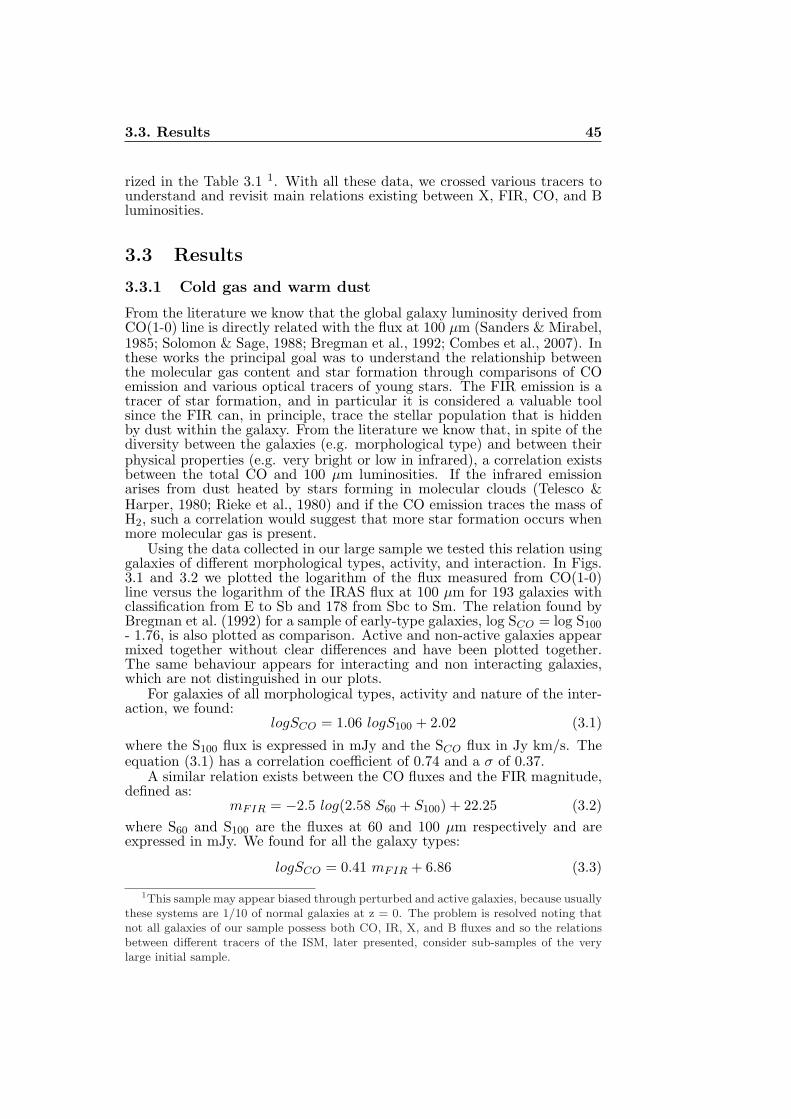
3.3. Results 45
rized in the Table 3.1 1. With all these data, we crossed various tracers tounderstand and revisit main relations existing between X, FIR, CO, and Bluminosities.
3.3 Results
3.3.1 Cold gas and warm dust
From the literature we know that the global galaxy luminosity derived fromCO(1-0) line is directly related with the flux at 100 µm (Sanders & Mirabel,1985; Solomon & Sage, 1988; Bregman et al., 1992; Combes et al., 2007). Inthese works the principal goal was to understand the relationship betweenthe molecular gas content and star formation through comparisons of COemission and various optical tracers of young stars. The FIR emission is atracer of star formation, and in particular it is considered a valuable toolsince the FIR can, in principle, trace the stellar population that is hiddenby dust within the galaxy. From the literature we know that, in spite of thediversity between the galaxies (e.g. morphological type) and between theirphysical properties (e.g. very bright or low in infrared), a correlation existsbetween the total CO and 100 µm luminosities. If the infrared emissionarises from dust heated by stars forming in molecular clouds (Telesco &Harper, 1980; Rieke et al., 1980) and if the CO emission traces the mass ofH2, such a correlation would suggest that more star formation occurs whenmore molecular gas is present.
Using the data collected in our large sample we tested this relation usinggalaxies of different morphological types, activity, and interaction. In Figs.3.1 and 3.2 we plotted the logarithm of the flux measured from CO(1-0)line versus the logarithm of the IRAS flux at 100 µm for 193 galaxies withclassification from E to Sb and 178 from Sbc to Sm. The relation found byBregman et al. (1992) for a sample of early-type galaxies, log SCO = log S100- 1.76, is also plotted as comparison. Active and non-active galaxies appearmixed together without clear differences and have been plotted together.The same behaviour appears for interacting and non interacting galaxies,which are not distinguished in our plots.
For galaxies of all morphological types, activity and nature of the inter-action, we found:
logSCO = 1.06 logS100 + 2.02 (3.1)
where the S100 flux is expressed in mJy and the SCO flux in Jy km/s. Theequation (3.1) has a correlation coefficient of 0.74 and a σ of 0.37.
A similar relation exists between the CO fluxes and the FIR magnitude,defined as:
mFIR = −2.5 log(2.58 S60 + S100) + 22.25 (3.2)
where S60 and S100 are the fluxes at 60 and 100 µm respectively and areexpressed in mJy. We found for all the galaxy types:
logSCO = 0.41 mFIR + 6.86 (3.3)
1This sample may appear biased through perturbed and active galaxies, because usuallythese systems are 1/10 of normal galaxies at z = 0. The problem is resolved noting thatnot all galaxies of our sample possess both CO, IR, X, and B fluxes and so the relationsbetween different tracers of the ISM, later presented, consider sub-samples of the verylarge initial sample.
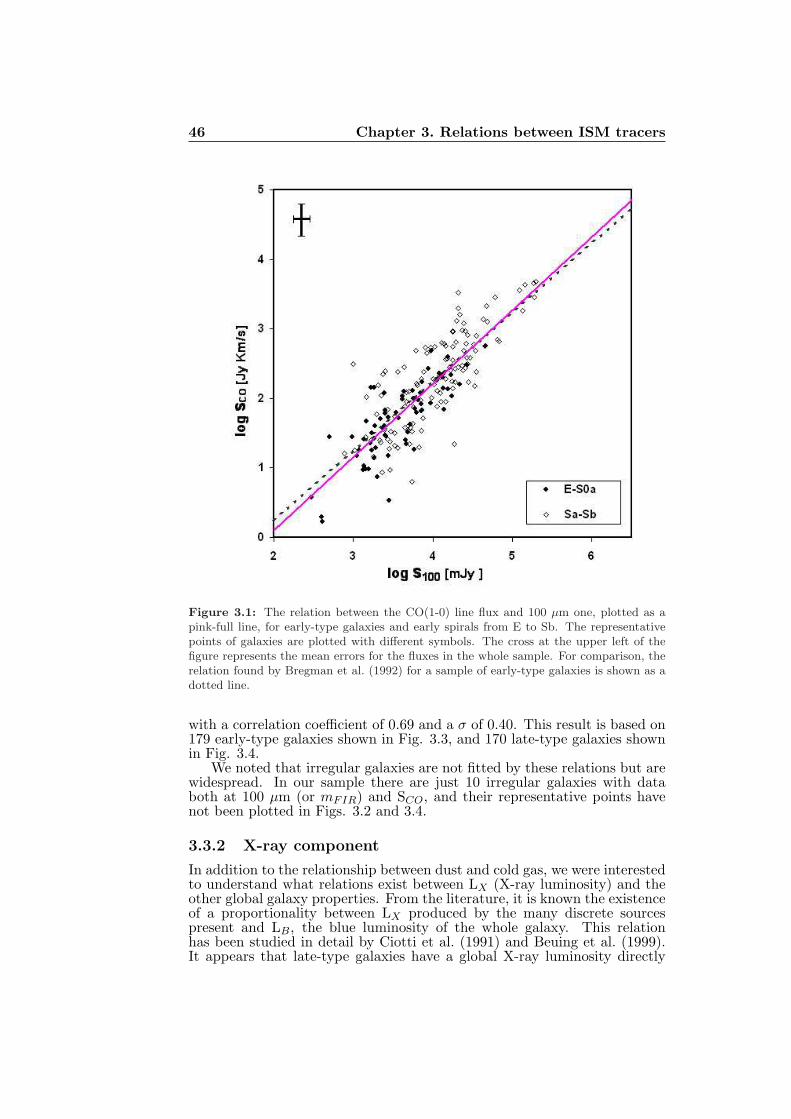
46 Chapter 3. Relations between ISM tracers
Figure 3.1: The relation between the CO(1-0) line flux and 100 µm one, plotted as apink-full line, for early-type galaxies and early spirals from E to Sb. The representativepoints of galaxies are plotted with different symbols. The cross at the upper left of thefigure represents the mean errors for the fluxes in the whole sample. For comparison, therelation found by Bregman et al. (1992) for a sample of early-type galaxies is shown as adotted line.
with a correlation coefficient of 0.69 and a σ of 0.40. This result is based on179 early-type galaxies shown in Fig. 3.3, and 170 late-type galaxies shownin Fig. 3.4.
We noted that irregular galaxies are not fitted by these relations but arewidespread. In our sample there are just 10 irregular galaxies with databoth at 100 µm (or mFIR) and SCO, and their representative points havenot been plotted in Figs. 3.2 and 3.4.
3.3.2 X-ray component
In addition to the relationship between dust and cold gas, we were interestedto understand what relations exist between LX (X-ray luminosity) and theother global galaxy properties. From the literature, it is known the existenceof a proportionality between LX produced by the many discrete sourcespresent and LB, the blue luminosity of the whole galaxy. This relationhas been studied in detail by Ciotti et al. (1991) and Beuing et al. (1999).It appears that late-type galaxies have a global X-ray luminosity directly
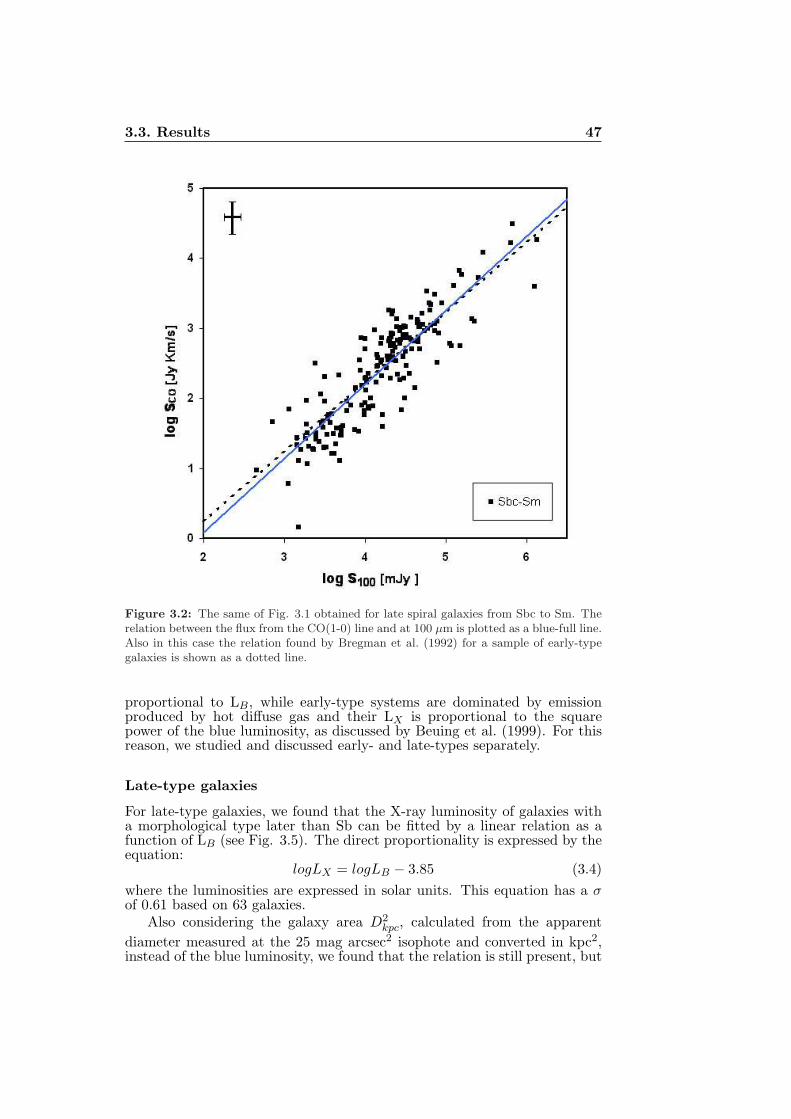
3.3. Results 47
Figure 3.2: The same of Fig. 3.1 obtained for late spiral galaxies from Sbc to Sm. Therelation between the flux from the CO(1-0) line and at 100 µm is plotted as a blue-full line.Also in this case the relation found by Bregman et al. (1992) for a sample of early-typegalaxies is shown as a dotted line.
proportional to LB, while early-type systems are dominated by emissionproduced by hot diffuse gas and their LX is proportional to the squarepower of the blue luminosity, as discussed by Beuing et al. (1999). For thisreason, we studied and discussed early- and late-types separately.
Late-type galaxies
For late-type galaxies, we found that the X-ray luminosity of galaxies witha morphological type later than Sb can be fitted by a linear relation as afunction of LB (see Fig. 3.5). The direct proportionality is expressed by theequation:
logLX = logLB − 3.85 (3.4)
where the luminosities are expressed in solar units. This equation has a σof 0.61 based on 63 galaxies.
Also considering the galaxy area D2kpc, calculated from the apparent
diameter measured at the 25 mag arcsec2 isophote and converted in kpc2,instead of the blue luminosity, we found that the relation is still present, but
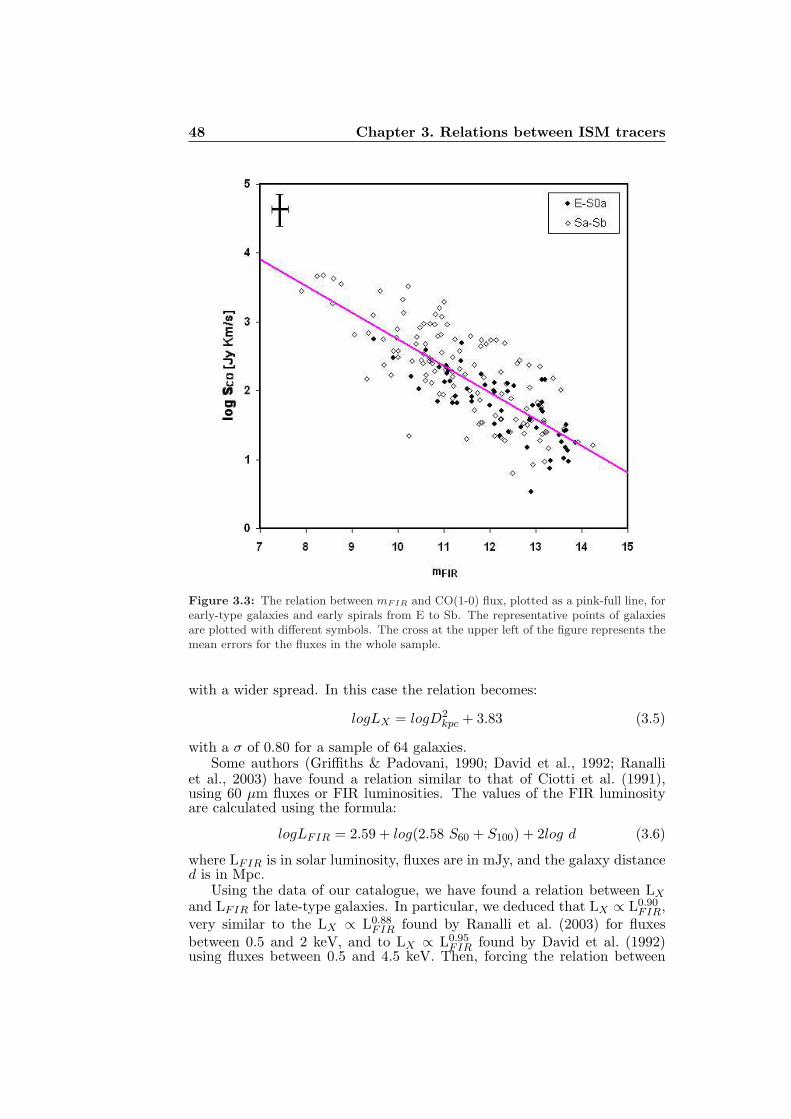
48 Chapter 3. Relations between ISM tracers
Figure 3.3: The relation between mFIR and CO(1-0) flux, plotted as a pink-full line, forearly-type galaxies and early spirals from E to Sb. The representative points of galaxiesare plotted with different symbols. The cross at the upper left of the figure represents themean errors for the fluxes in the whole sample.
with a wider spread. In this case the relation becomes:
logLX = logD2kpc + 3.83 (3.5)
with a σ of 0.80 for a sample of 64 galaxies.Some authors (Griffiths & Padovani, 1990; David et al., 1992; Ranalli
et al., 2003) have found a relation similar to that of Ciotti et al. (1991),using 60 µm fluxes or FIR luminosities. The values of the FIR luminosityare calculated using the formula:
logLFIR = 2.59 + log(2.58 S60 + S100) + 2log d (3.6)
where LFIR is in solar luminosity, fluxes are in mJy, and the galaxy distanced is in Mpc.
Using the data of our catalogue, we have found a relation between LX
and LFIR for late-type galaxies. In particular, we deduced that LX ∝ L0.90FIR,
very similar to the LX ∝ L0.88FIR found by Ranalli et al. (2003) for fluxes
between 0.5 and 2 keV, and to LX ∝ L0.95FIR found by David et al. (1992)
using fluxes between 0.5 and 4.5 keV. Then, forcing the relation between
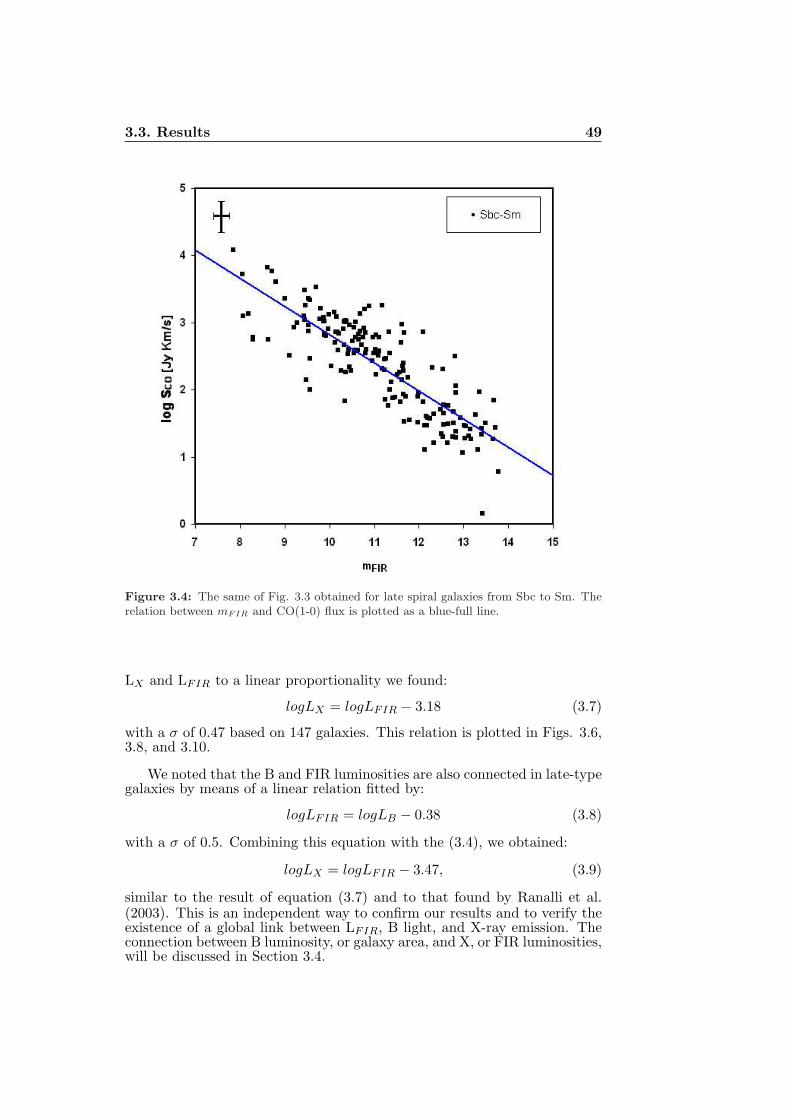
3.3. Results 49
Figure 3.4: The same of Fig. 3.3 obtained for late spiral galaxies from Sbc to Sm. Therelation between mFIR and CO(1-0) flux is plotted as a blue-full line.
LX and LFIR to a linear proportionality we found:
logLX = logLFIR − 3.18 (3.7)
with a σ of 0.47 based on 147 galaxies. This relation is plotted in Figs. 3.6,3.8, and 3.10.
We noted that the B and FIR luminosities are also connected in late-typegalaxies by means of a linear relation fitted by:
logLFIR = logLB − 0.38 (3.8)
with a σ of 0.5. Combining this equation with the (3.4), we obtained:
logLX = logLFIR − 3.47, (3.9)
similar to the result of equation (3.7) and to that found by Ranalli et al.(2003). This is an independent way to confirm our results and to verify theexistence of a global link between LFIR, B light, and X-ray emission. Theconnection between B luminosity, or galaxy area, and X, or FIR luminosities,will be discussed in Section 3.4.
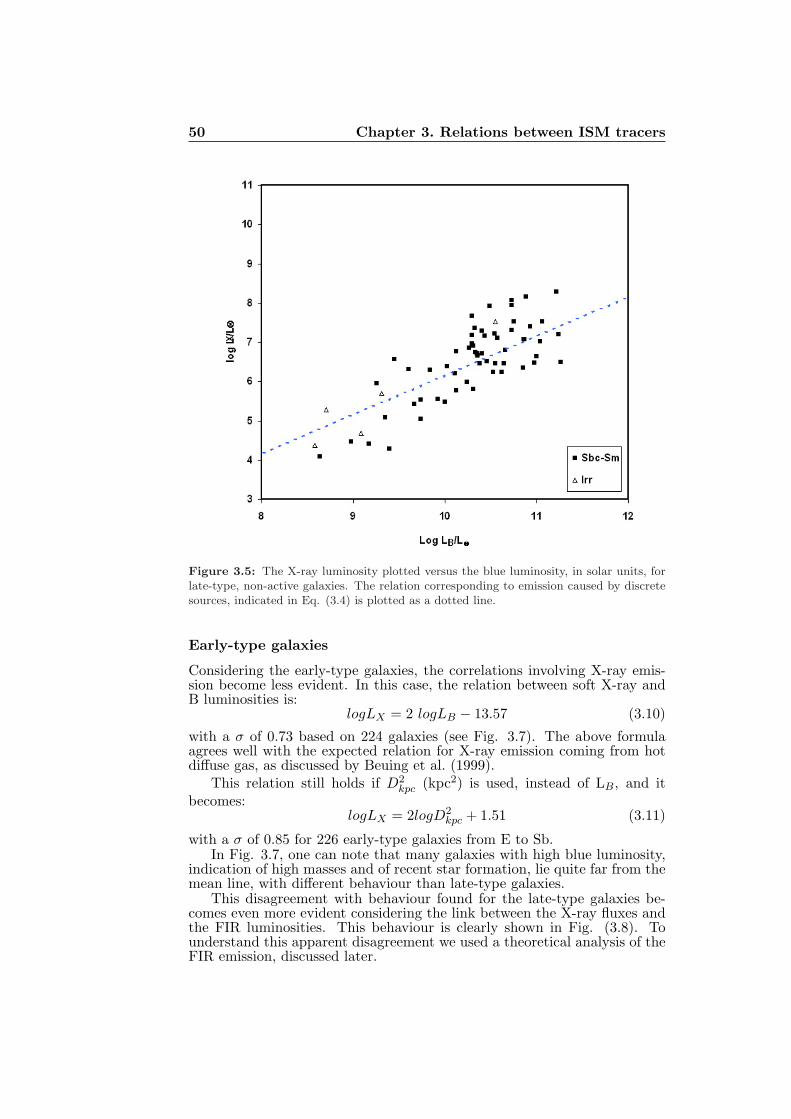
50 Chapter 3. Relations between ISM tracers
Figure 3.5: The X-ray luminosity plotted versus the blue luminosity, in solar units, forlate-type, non-active galaxies. The relation corresponding to emission caused by discretesources, indicated in Eq. (3.4) is plotted as a dotted line.
Early-type galaxies
Considering the early-type galaxies, the correlations involving X-ray emis-sion become less evident. In this case, the relation between soft X-ray andB luminosities is:
logLX = 2 logLB − 13.57 (3.10)
with a σ of 0.73 based on 224 galaxies (see Fig. 3.7). The above formulaagrees well with the expected relation for X-ray emission coming from hotdiffuse gas, as discussed by Beuing et al. (1999).
This relation still holds if D2kpc (kpc2) is used, instead of LB, and it
becomes:logLX = 2logD2
kpc + 1.51 (3.11)
with a σ of 0.85 for 226 early-type galaxies from E to Sb.In Fig. 3.7, one can note that many galaxies with high blue luminosity,
indication of high masses and of recent star formation, lie quite far from themean line, with different behaviour than late-type galaxies.
This disagreement with behaviour found for the late-type galaxies be-comes even more evident considering the link between the X-ray fluxes andthe FIR luminosities. This behaviour is clearly shown in Fig. (3.8). Tounderstand this apparent disagreement we used a theoretical analysis of theFIR emission, discussed later.
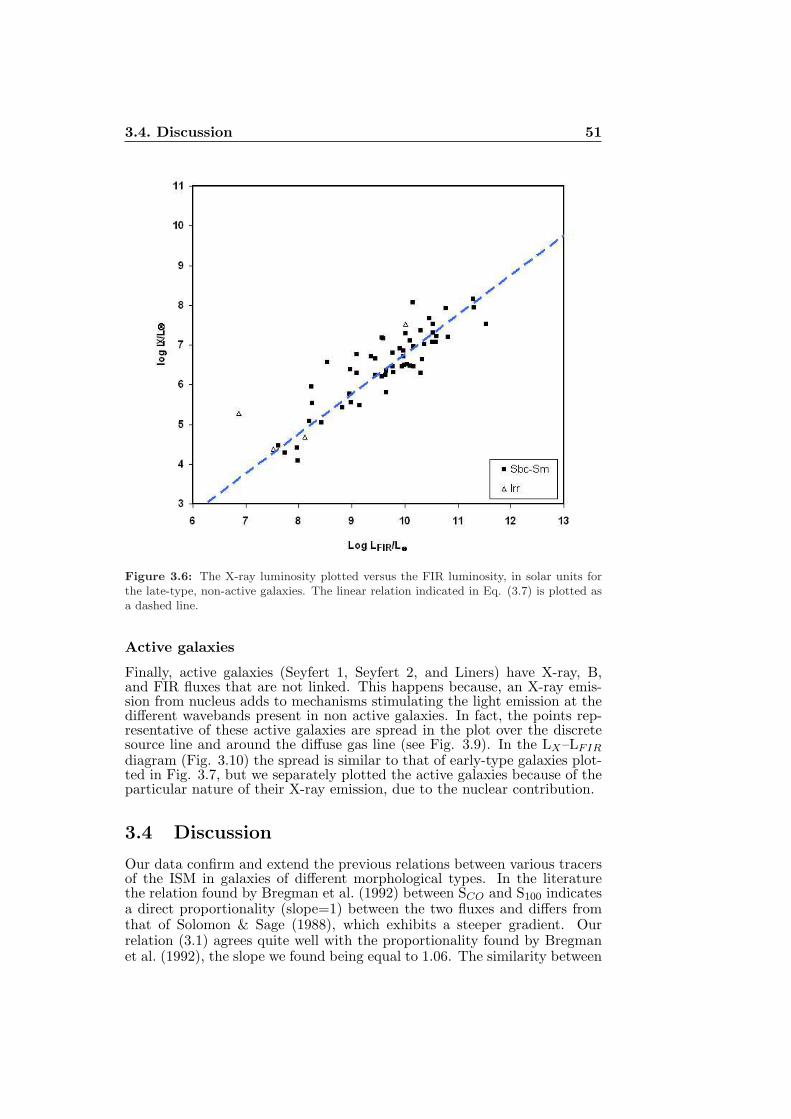
3.4. Discussion 51
Figure 3.6: The X-ray luminosity plotted versus the FIR luminosity, in solar units forthe late-type, non-active galaxies. The linear relation indicated in Eq. (3.7) is plotted asa dashed line.
Active galaxies
Finally, active galaxies (Seyfert 1, Seyfert 2, and Liners) have X-ray, B,and FIR fluxes that are not linked. This happens because, an X-ray emis-sion from nucleus adds to mechanisms stimulating the light emission at thedifferent wavebands present in non active galaxies. In fact, the points rep-resentative of these active galaxies are spread in the plot over the discretesource line and around the diffuse gas line (see Fig. 3.9). In the LX–LFIR
diagram (Fig. 3.10) the spread is similar to that of early-type galaxies plot-ted in Fig. 3.7, but we separately plotted the active galaxies because of theparticular nature of their X-ray emission, due to the nuclear contribution.
3.4 Discussion
Our data confirm and extend the previous relations between various tracersof the ISM in galaxies of different morphological types. In the literaturethe relation found by Bregman et al. (1992) between SCO and S100 indicatesa direct proportionality (slope=1) between the two fluxes and differs fromthat of Solomon & Sage (1988), which exhibits a steeper gradient. Ourrelation (3.1) agrees quite well with the proportionality found by Bregmanet al. (1992), the slope we found being equal to 1.06. The similarity between
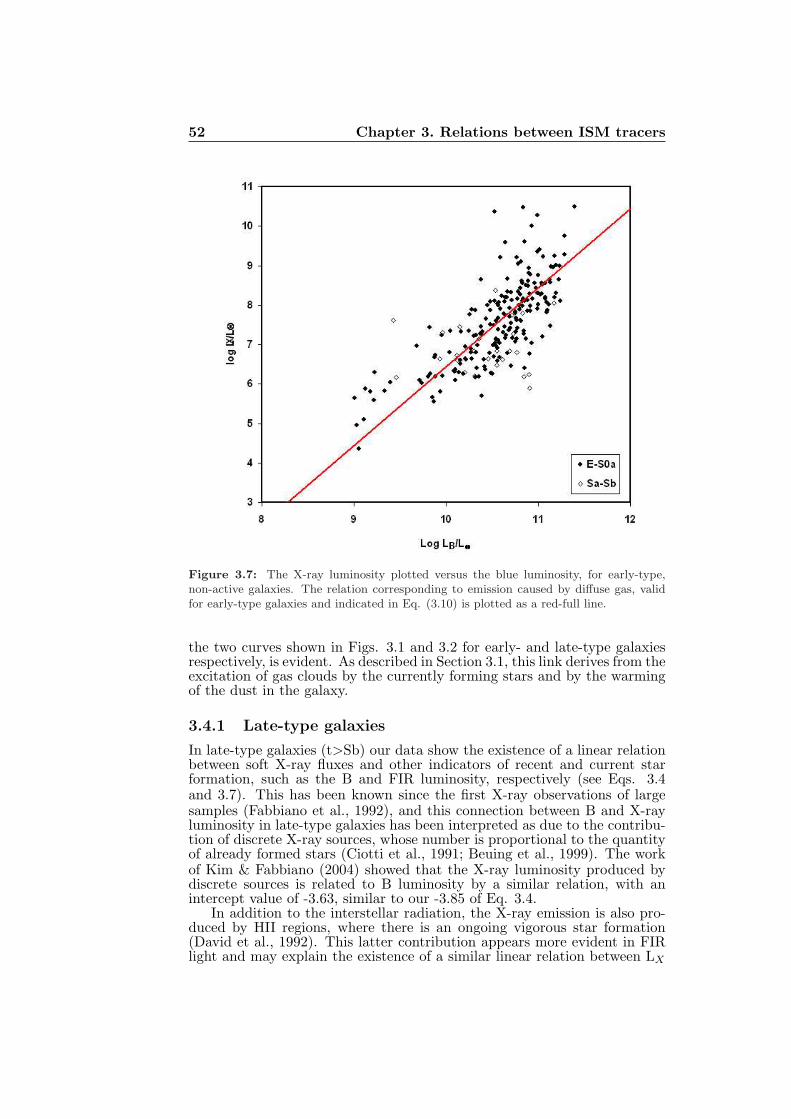
52 Chapter 3. Relations between ISM tracers
Figure 3.7: The X-ray luminosity plotted versus the blue luminosity, for early-type,non-active galaxies. The relation corresponding to emission caused by diffuse gas, validfor early-type galaxies and indicated in Eq. (3.10) is plotted as a red-full line.
the two curves shown in Figs. 3.1 and 3.2 for early- and late-type galaxiesrespectively, is evident. As described in Section 3.1, this link derives from theexcitation of gas clouds by the currently forming stars and by the warmingof the dust in the galaxy.
3.4.1 Late-type galaxies
In late-type galaxies (t>Sb) our data show the existence of a linear relationbetween soft X-ray fluxes and other indicators of recent and current starformation, such as the B and FIR luminosity, respectively (see Eqs. 3.4and 3.7). This has been known since the first X-ray observations of largesamples (Fabbiano et al., 1992), and this connection between B and X-rayluminosity in late-type galaxies has been interpreted as due to the contribu-tion of discrete X-ray sources, whose number is proportional to the quantityof already formed stars (Ciotti et al., 1991; Beuing et al., 1999). The workof Kim & Fabbiano (2004) showed that the X-ray luminosity produced bydiscrete sources is related to B luminosity by a similar relation, with anintercept value of -3.63, similar to our -3.85 of Eq. 3.4.
In addition to the interstellar radiation, the X-ray emission is also pro-duced by HII regions, where there is an ongoing vigorous star formation(David et al., 1992). This latter contribution appears more evident in FIRlight and may explain the existence of a similar linear relation between LX
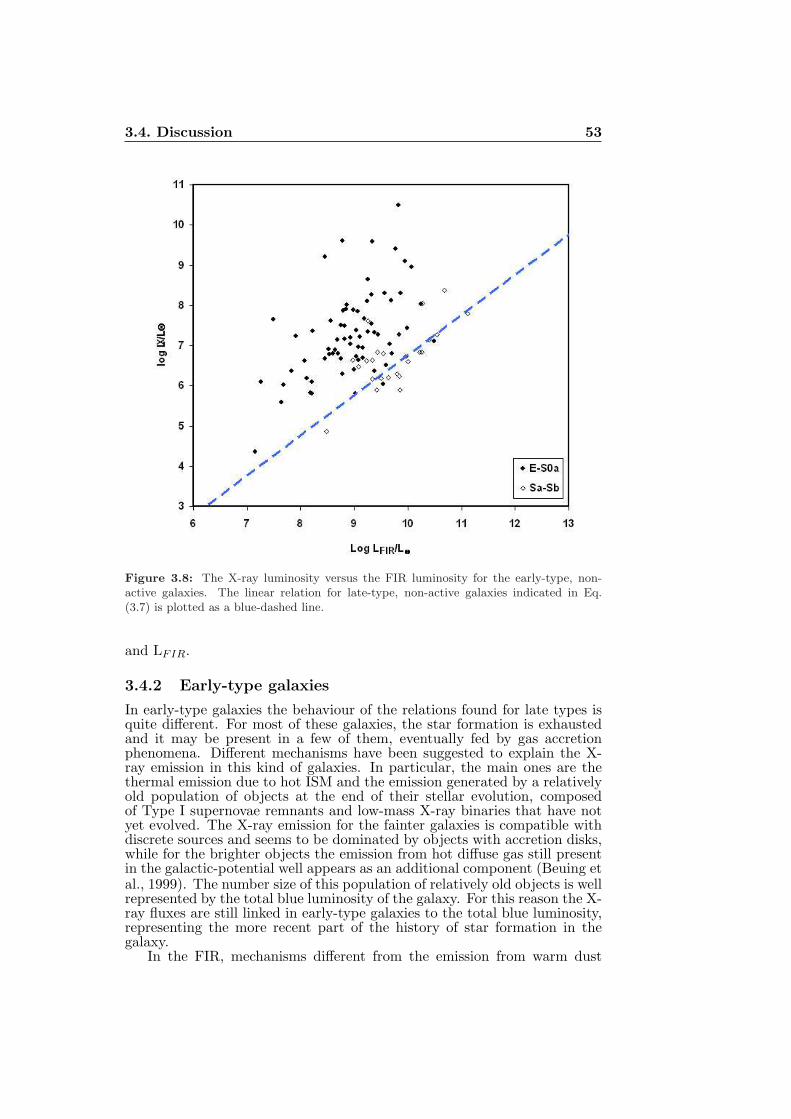
3.4. Discussion 53
Figure 3.8: The X-ray luminosity versus the FIR luminosity for the early-type, non-active galaxies. The linear relation for late-type, non-active galaxies indicated in Eq.(3.7) is plotted as a blue-dashed line.
and LFIR.
3.4.2 Early-type galaxies
In early-type galaxies the behaviour of the relations found for late types isquite different. For most of these galaxies, the star formation is exhaustedand it may be present in a few of them, eventually fed by gas accretionphenomena. Different mechanisms have been suggested to explain the X-ray emission in this kind of galaxies. In particular, the main ones are thethermal emission due to hot ISM and the emission generated by a relativelyold population of objects at the end of their stellar evolution, composedof Type I supernovae remnants and low-mass X-ray binaries that have notyet evolved. The X-ray emission for the fainter galaxies is compatible withdiscrete sources and seems to be dominated by objects with accretion disks,while for the brighter objects the emission from hot diffuse gas still presentin the galactic-potential well appears as an additional component (Beuing etal., 1999). The number size of this population of relatively old objects is wellrepresented by the total blue luminosity of the galaxy. For this reason the X-ray fluxes are still linked in early-type galaxies to the total blue luminosity,representing the more recent part of the history of star formation in thegalaxy.
In the FIR, mechanisms different from the emission from warm dust
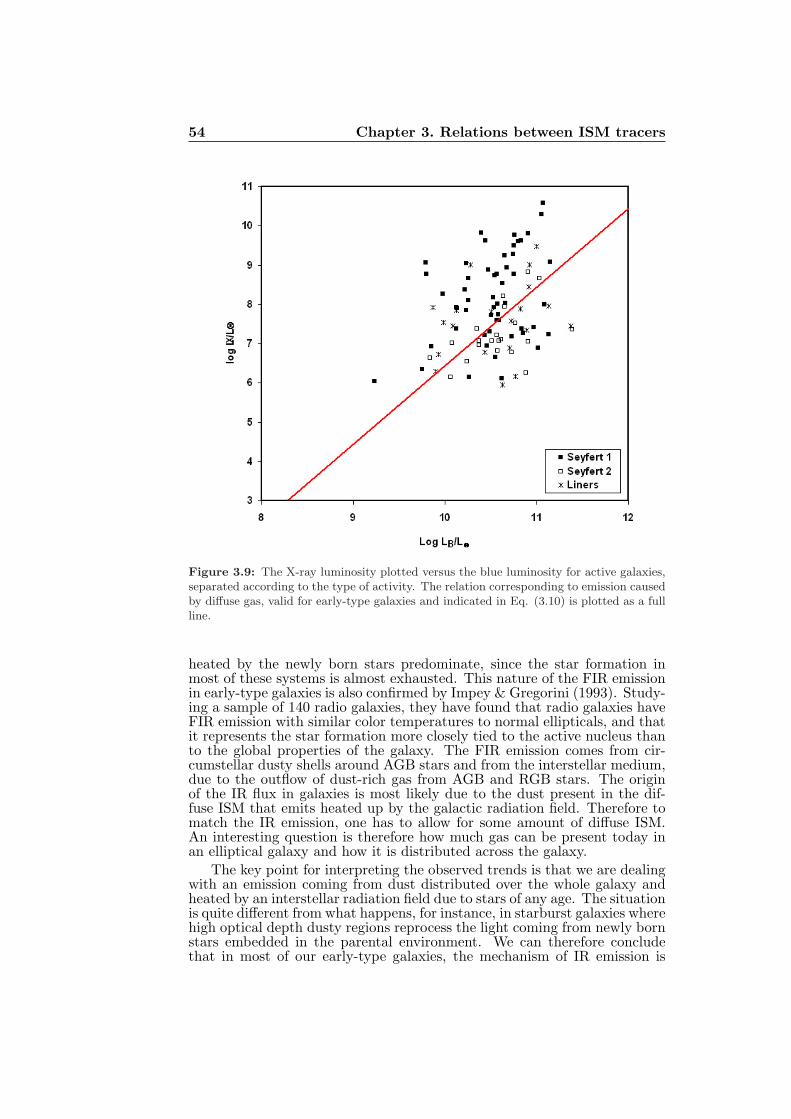
54 Chapter 3. Relations between ISM tracers
Figure 3.9: The X-ray luminosity plotted versus the blue luminosity for active galaxies,separated according to the type of activity. The relation corresponding to emission causedby diffuse gas, valid for early-type galaxies and indicated in Eq. (3.10) is plotted as a fullline.
heated by the newly born stars predominate, since the star formation inmost of these systems is almost exhausted. This nature of the FIR emissionin early-type galaxies is also confirmed by Impey & Gregorini (1993). Study-ing a sample of 140 radio galaxies, they have found that radio galaxies haveFIR emission with similar color temperatures to normal ellipticals, and thatit represents the star formation more closely tied to the active nucleus thanto the global properties of the galaxy. The FIR emission comes from cir-cumstellar dusty shells around AGB stars and from the interstellar medium,due to the outflow of dust-rich gas from AGB and RGB stars. The originof the IR flux in galaxies is most likely due to the dust present in the dif-fuse ISM that emits heated up by the galactic radiation field. Therefore tomatch the IR emission, one has to allow for some amount of diffuse ISM.An interesting question is therefore how much gas can be present today inan elliptical galaxy and how it is distributed across the galaxy.
The key point for interpreting the observed trends is that we are dealingwith an emission coming from dust distributed over the whole galaxy andheated by an interstellar radiation field due to stars of any age. The situationis quite different from what happens, for instance, in starburst galaxies wherehigh optical depth dusty regions reprocess the light coming from newly bornstars embedded in the parental environment. We can therefore concludethat in most of our early-type galaxies, the mechanism of IR emission is
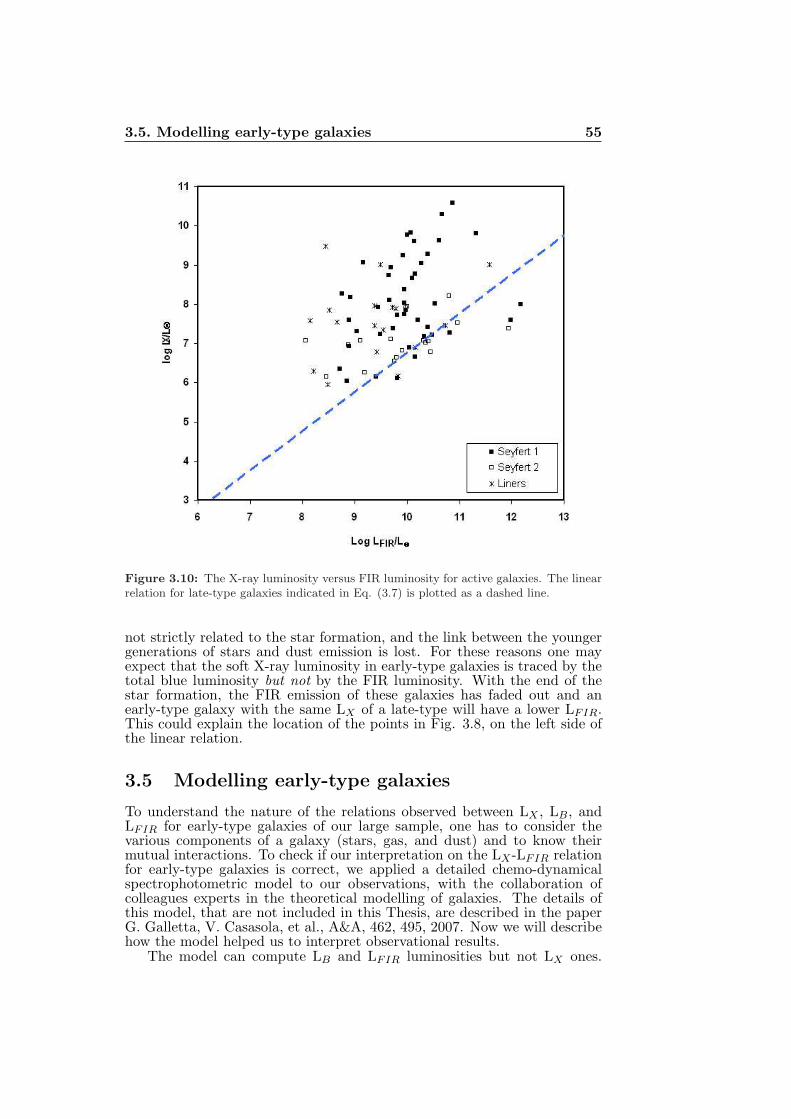
3.5. Modelling early-type galaxies 55
Figure 3.10: The X-ray luminosity versus FIR luminosity for active galaxies. The linearrelation for late-type galaxies indicated in Eq. (3.7) is plotted as a dashed line.
not strictly related to the star formation, and the link between the youngergenerations of stars and dust emission is lost. For these reasons one mayexpect that the soft X-ray luminosity in early-type galaxies is traced by thetotal blue luminosity but not by the FIR luminosity. With the end of thestar formation, the FIR emission of these galaxies has faded out and anearly-type galaxy with the same LX of a late-type will have a lower LFIR.This could explain the location of the points in Fig. 3.8, on the left side ofthe linear relation.
3.5 Modelling early-type galaxies
To understand the nature of the relations observed between LX , LB, andLFIR for early-type galaxies of our large sample, one has to consider thevarious components of a galaxy (stars, gas, and dust) and to know theirmutual interactions. To check if our interpretation on the LX -LFIR relationfor early-type galaxies is correct, we applied a detailed chemo-dynamicalspectrophotometric model to our observations, with the collaboration ofcolleagues experts in the theoretical modelling of galaxies. The details ofthis model, that are not included in this Thesis, are described in the paperG. Galletta, V. Casasola, et al., A&A, 462, 495, 2007. Now we will describehow the model helped us to interpret observational results.
The model can compute LB and LFIR luminosities but not LX ones.
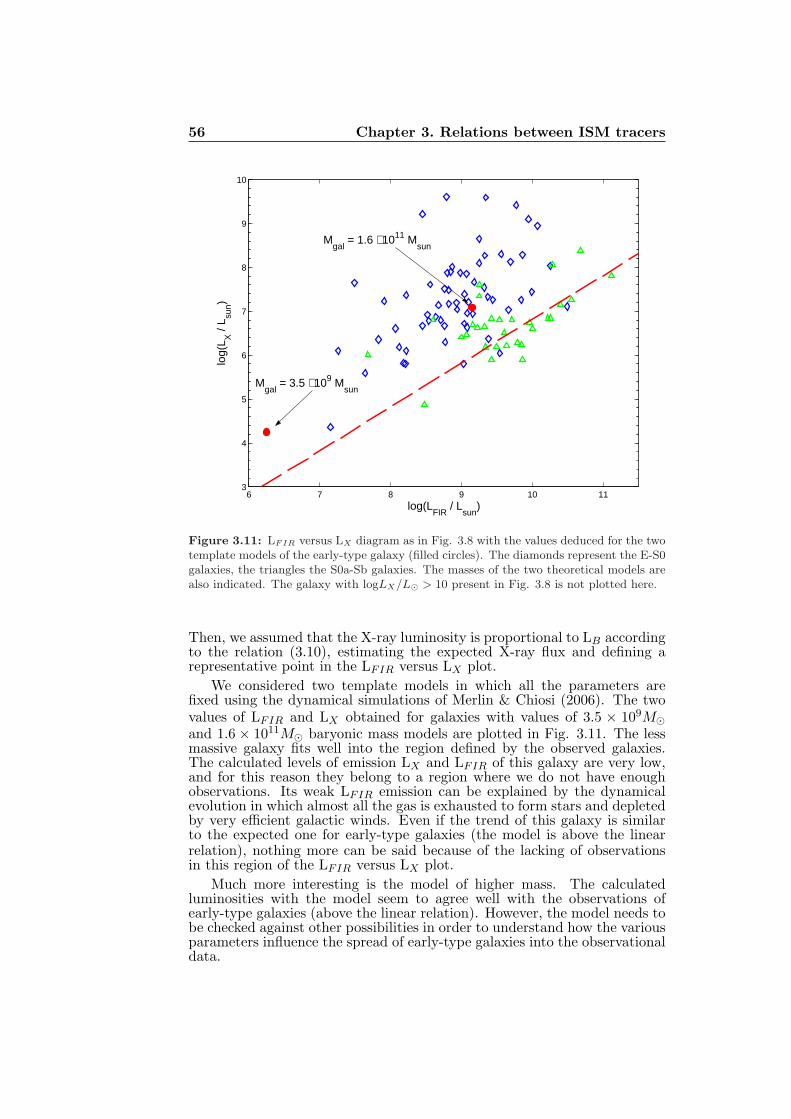
56 Chapter 3. Relations between ISM tracers
6 7 8 9 10 113
4
5
6
7
8
9
10
Mgal
= 1.6 ⋅ 1011 Msun
Mgal
= 3.5 ⋅ 109 Msun
log(LFIR
/ Lsun
)
log(
L X /
L sun)
Figure 3.11: LFIR versus LX diagram as in Fig. 3.8 with the values deduced for the twotemplate models of the early-type galaxy (filled circles). The diamonds represent the E-S0galaxies, the triangles the S0a-Sb galaxies. The masses of the two theoretical models arealso indicated. The galaxy with logLX/L⊙ > 10 present in Fig. 3.8 is not plotted here.
Then, we assumed that the X-ray luminosity is proportional to LB accordingto the relation (3.10), estimating the expected X-ray flux and defining arepresentative point in the LFIR versus LX plot.
We considered two template models in which all the parameters arefixed using the dynamical simulations of Merlin & Chiosi (2006). The twovalues of LFIR and LX obtained for galaxies with values of 3.5 × 10⁹M⊙
and 1.6 × 10¹¹M⊙ baryonic mass models are plotted in Fig. 3.11. The lessmassive galaxy fits well into the region defined by the observed galaxies.The calculated levels of emission LX and LFIR of this galaxy are very low,and for this reason they belong to a region where we do not have enoughobservations. Its weak LFIR emission can be explained by the dynamicalevolution in which almost all the gas is exhausted to form stars and depletedby very efficient galactic winds. Even if the trend of this galaxy is similarto the expected one for early-type galaxies (the model is above the linearrelation), nothing more can be said because of the lacking of observationsin this region of the LFIR versus LX plot.
Much more interesting is the model of higher mass. The calculatedluminosities with the model seem to agree well with the observations ofearly-type galaxies (above the linear relation). However, the model needs tobe checked against other possibilities in order to understand how the variousparameters influence the spread of early-type galaxies into the observationaldata.
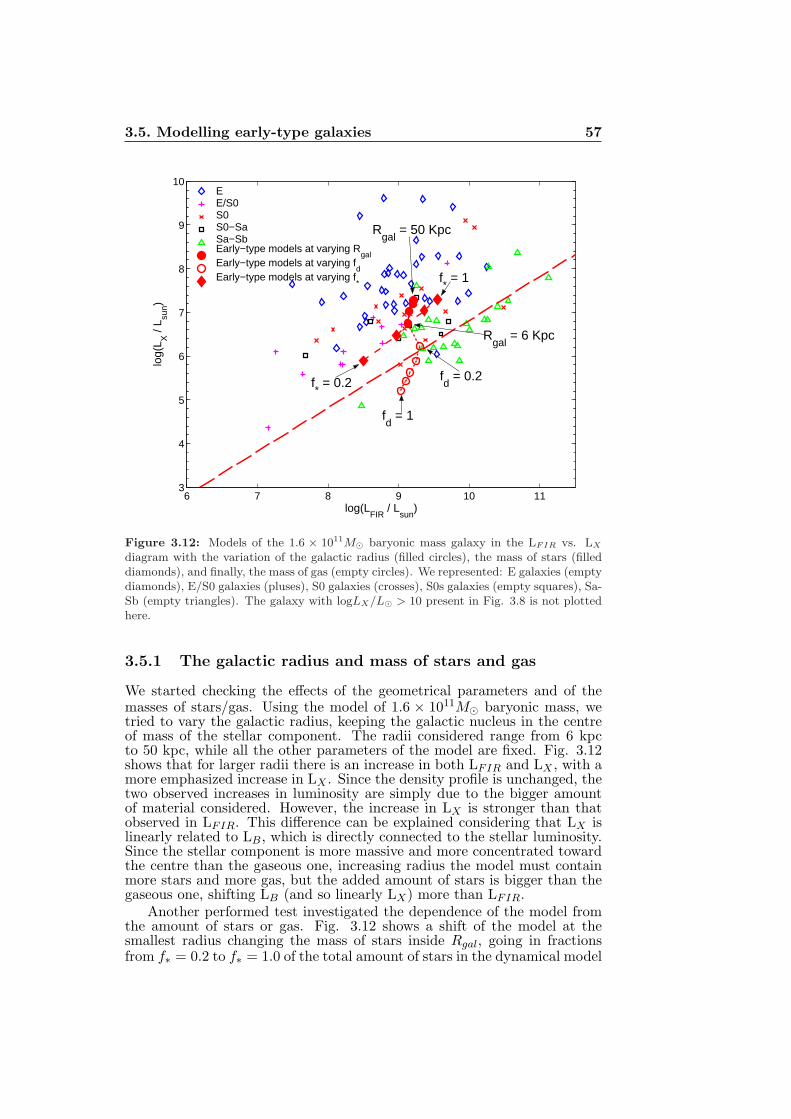
3.5. Modelling early-type galaxies 57
6 7 8 9 10 113
4
5
6
7
8
9
10
Rgal
= 50 Kpc
Rgal
= 6 Kpc
f* = 1
f* = 0.2
fd = 1
fd = 0.2
log(LFIR
/ Lsun
)
log(
L X /
L sun)
EE/S0S0S0−SaSa−SbEarly−type models at varying R
galEarly−type models at varying f
dEarly−type models at varying f
*
Figure 3.12: Models of the 1.6 × 10¹¹M⊙ baryonic mass galaxy in the LFIR vs. LX
diagram with the variation of the galactic radius (filled circles), the mass of stars (filleddiamonds), and finally, the mass of gas (empty circles). We represented: E galaxies (emptydiamonds), E/S0 galaxies (pluses), S0 galaxies (crosses), S0s galaxies (empty squares), Sa-Sb (empty triangles). The galaxy with logLX/L⊙ > 10 present in Fig. 3.8 is not plottedhere.
3.5.1 The galactic radius and mass of stars and gas
We started checking the effects of the geometrical parameters and of themasses of stars/gas. Using the model of 1.6 × 10¹¹M⊙ baryonic mass, wetried to vary the galactic radius, keeping the galactic nucleus in the centreof mass of the stellar component. The radii considered range from 6 kpcto 50 kpc, while all the other parameters of the model are fixed. Fig. 3.12shows that for larger radii there is an increase in both LFIR and LX , with amore emphasized increase in LX . Since the density profile is unchanged, thetwo observed increases in luminosity are simply due to the bigger amountof material considered. However, the increase in LX is stronger than thatobserved in LFIR. This difference can be explained considering that LX islinearly related to LB, which is directly connected to the stellar luminosity.Since the stellar component is more massive and more concentrated towardthe centre than the gaseous one, increasing radius the model must containmore stars and more gas, but the added amount of stars is bigger than thegaseous one, shifting LB (and so linearly LX) more than LFIR.
Another performed test investigated the dependence of the model fromthe amount of stars or gas. Fig. 3.12 shows a shift of the model at thesmallest radius changing the mass of stars inside Rgal, going in fractionsfrom f∗ = 0.2 to f∗ = 1.0 of the total amount of stars in the dynamical model
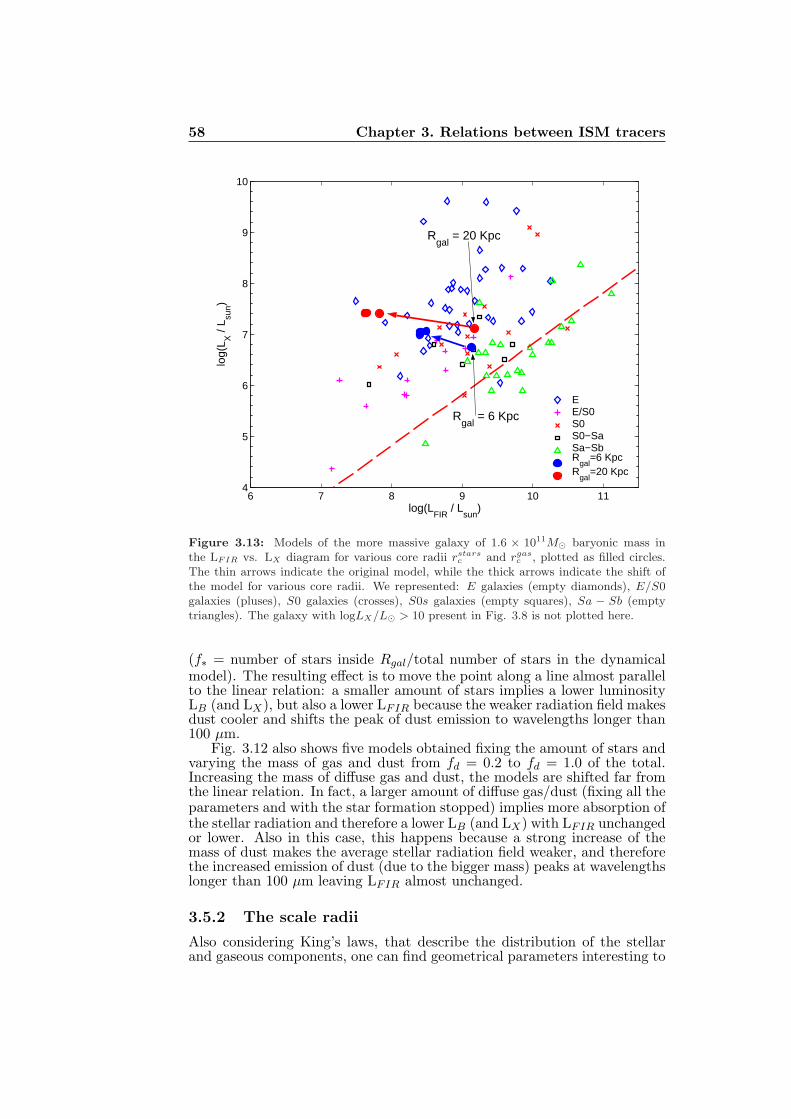
58 Chapter 3. Relations between ISM tracers
6 7 8 9 10 114
5
6
7
8
9
10
Rgal
= 20 Kpc
Rgal
= 6 Kpc
log(LFIR
/ Lsun
)
log(
L X /
L sun)
EE/S0S0S0−SaSa−SbR
gal=6 Kpc
Rgal
=20 Kpc
Figure 3.13: Models of the more massive galaxy of 1.6 × 10¹¹M⊙ baryonic mass inthe LFIR vs. LX diagram for various core radii rstars
c and rgasc , plotted as filled circles.
The thin arrows indicate the original model, while the thick arrows indicate the shift ofthe model for various core radii. We represented: E galaxies (empty diamonds), E/S0galaxies (pluses), S0 galaxies (crosses), S0s galaxies (empty squares), Sa − Sb (emptytriangles). The galaxy with logLX/L⊙ > 10 present in Fig. 3.8 is not plotted here.
(f∗ = number of stars inside Rgal/total number of stars in the dynamicalmodel). The resulting effect is to move the point along a line almost parallelto the linear relation: a smaller amount of stars implies a lower luminosityLB (and LX), but also a lower LFIR because the weaker radiation field makesdust cooler and shifts the peak of dust emission to wavelengths longer than100 µm.
Fig. 3.12 also shows five models obtained fixing the amount of stars andvarying the mass of gas and dust from fd = 0.2 to fd = 1.0 of the total.Increasing the mass of diffuse gas and dust, the models are shifted far fromthe linear relation. In fact, a larger amount of diffuse gas/dust (fixing all theparameters and with the star formation stopped) implies more absorption ofthe stellar radiation and therefore a lower LB (and LX) with LFIR unchangedor lower. Also in this case, this happens because a strong increase of themass of dust makes the average stellar radiation field weaker, and thereforethe increased emission of dust (due to the bigger mass) peaks at wavelengthslonger than 100 µm leaving LFIR almost unchanged.
3.5.2 The scale radii
Also considering King’s laws, that describe the distribution of the stellarand gaseous components, one can find geometrical parameters interesting to
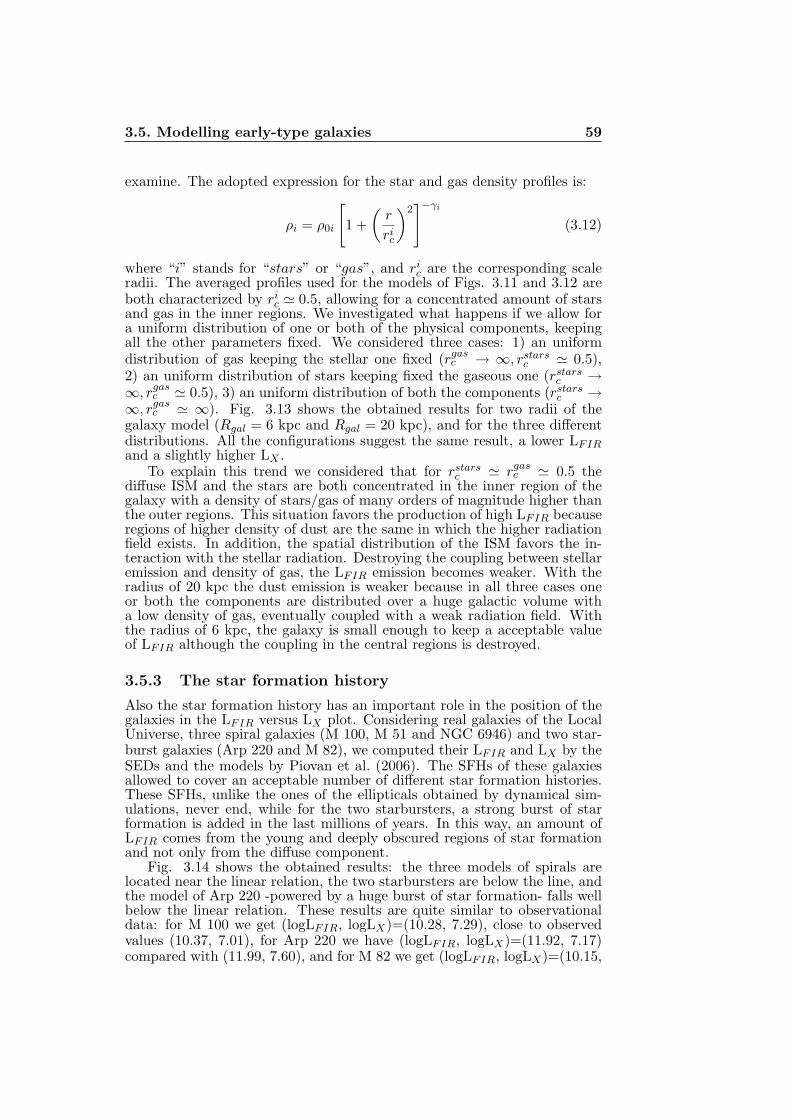
3.5. Modelling early-type galaxies 59
examine. The adopted expression for the star and gas density profiles is:
ρi = ρ0i
[
1 +
(
r
ric
)2]−γi
(3.12)
where “i” stands for “stars” or “gas”, and ric are the corresponding scale
radii. The averaged profiles used for the models of Figs. 3.11 and 3.12 areboth characterized by ri
c ≃ 0.5, allowing for a concentrated amount of starsand gas in the inner regions. We investigated what happens if we allow fora uniform distribution of one or both of the physical components, keepingall the other parameters fixed. We considered three cases: 1) an uniformdistribution of gas keeping the stellar one fixed (rgas
c → ∞, rstarsc ≃ 0.5),
2) an uniform distribution of stars keeping fixed the gaseous one (rstarsc →
∞, rgasc ≃ 0.5), 3) an uniform distribution of both the components (rstars
c →∞, rgas
c ≃ ∞). Fig. 3.13 shows the obtained results for two radii of thegalaxy model (Rgal = 6 kpc and Rgal = 20 kpc), and for the three differentdistributions. All the configurations suggest the same result, a lower LFIRand a slightly higher LX .
To explain this trend we considered that for rstarsc ≃ rgas
c ≃ 0.5 thediffuse ISM and the stars are both concentrated in the inner region of thegalaxy with a density of stars/gas of many orders of magnitude higher thanthe outer regions. This situation favors the production of high LFIR becauseregions of higher density of dust are the same in which the higher radiationfield exists. In addition, the spatial distribution of the ISM favors the in-teraction with the stellar radiation. Destroying the coupling between stellaremission and density of gas, the LFIR emission becomes weaker. With theradius of 20 kpc the dust emission is weaker because in all three cases oneor both the components are distributed over a huge galactic volume witha low density of gas, eventually coupled with a weak radiation field. Withthe radius of 6 kpc, the galaxy is small enough to keep a acceptable valueof LFIR although the coupling in the central regions is destroyed.
3.5.3 The star formation history
Also the star formation history has an important role in the position of thegalaxies in the LFIR versus LX plot. Considering real galaxies of the LocalUniverse, three spiral galaxies (M 100, M 51 and NGC 6946) and two star-burst galaxies (Arp 220 and M 82), we computed their LFIR and LX by theSEDs and the models by Piovan et al. (2006). The SFHs of these galaxiesallowed to cover an acceptable number of different star formation histories.These SFHs, unlike the ones of the ellipticals obtained by dynamical sim-ulations, never end, while for the two starbursters, a strong burst of starformation is added in the last millions of years. In this way, an amount ofLFIR comes from the young and deeply obscured regions of star formationand not only from the diffuse component.
Fig. 3.14 shows the obtained results: the three models of spirals arelocated near the linear relation, the two starbursters are below the line, andthe model of Arp 220 -powered by a huge burst of star formation- falls wellbelow the linear relation. These results are quite similar to observationaldata: for M 100 we get (logLFIR, logLX)=(10.28, 7.29), close to observedvalues (10.37, 7.01), for Arp 220 we have (logLFIR, logLX)=(11.92, 7.17)compared with (11.99, 7.60), and for M 82 we get (logLFIR, logLX)=(10.15,
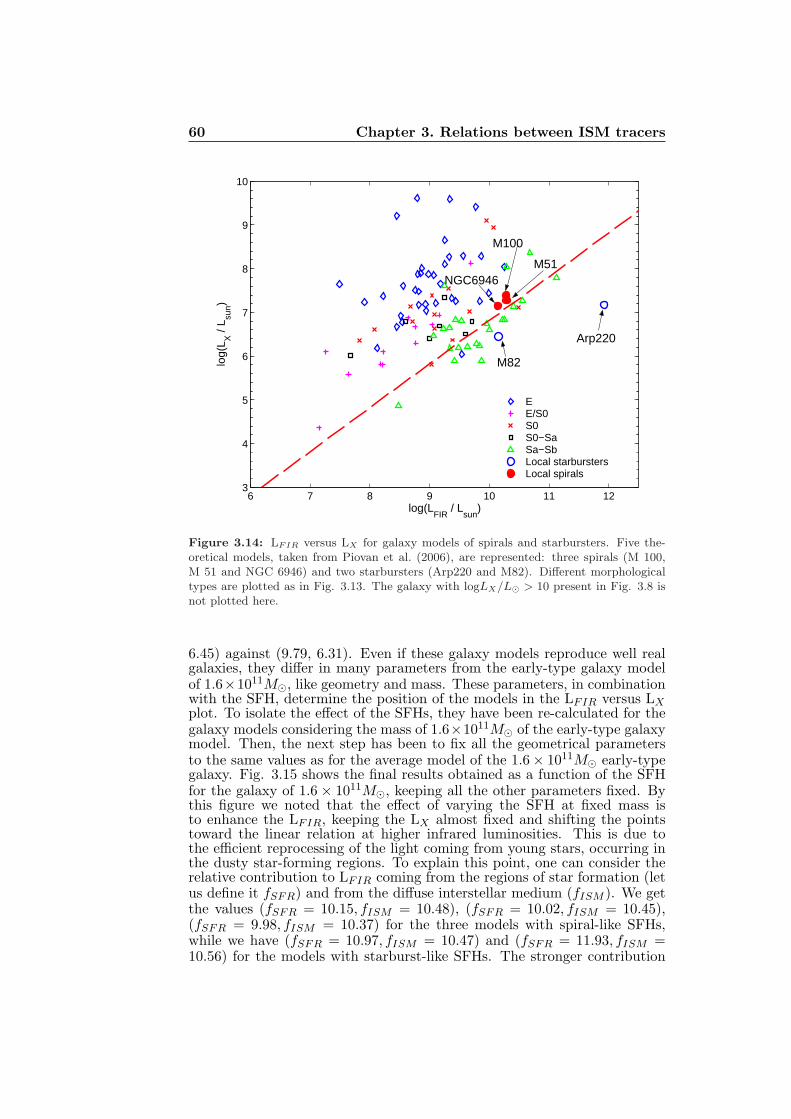
60 Chapter 3. Relations between ISM tracers
6 7 8 9 10 11 123
4
5
6
7
8
9
10
M82
Arp220
NGC6946
M100
M51
log(LFIR
/ Lsun
)
log(
L X /
L sun)
EE/S0S0S0−SaSa−SbLocal starburstersLocal spirals
Figure 3.14: LFIR versus LX for galaxy models of spirals and starbursters. Five the-oretical models, taken from Piovan et al. (2006), are represented: three spirals (M 100,M 51 and NGC 6946) and two starbursters (Arp220 and M82). Different morphologicaltypes are plotted as in Fig. 3.13. The galaxy with logLX/L⊙ > 10 present in Fig. 3.8 isnot plotted here.
6.45) against (9.79, 6.31). Even if these galaxy models reproduce well realgalaxies, they differ in many parameters from the early-type galaxy modelof 1.6×10¹¹M⊙, like geometry and mass. These parameters, in combinationwith the SFH, determine the position of the models in the LFIR versus LXplot. To isolate the effect of the SFHs, they have been re-calculated for thegalaxy models considering the mass of 1.6×10¹¹M⊙ of the early-type galaxymodel. Then, the next step has been to fix all the geometrical parametersto the same values as for the average model of the 1.6× 10¹¹M⊙ early-typegalaxy. Fig. 3.15 shows the final results obtained as a function of the SFHfor the galaxy of 1.6 × 10¹¹M⊙, keeping all the other parameters fixed. Bythis figure we noted that the effect of varying the SFH at fixed mass isto enhance the LFIR, keeping the LX almost fixed and shifting the pointstoward the linear relation at higher infrared luminosities. This is due tothe efficient reprocessing of the light coming from young stars, occurring inthe dusty star-forming regions. To explain this point, one can consider therelative contribution to LFIR coming from the regions of star formation (letus define it fSFR) and from the diffuse interstellar medium (fISM ). We getthe values (fSFR = 10.15, fISM = 10.48), (fSFR = 10.02, fISM = 10.45),(fSFR = 9.98, fISM = 10.37) for the three models with spiral-like SFHs,while we have (fSFR = 10.97, fISM = 10.47) and (fSFR = 11.93, fISM =10.56) for the models with starburst-like SFHs. The stronger contribution
3.6. Conclusions 61
6 7 8 9 10 11 123
4
5
6
7
8
9
10
1.6 ⋅ 1011 Msun
1.6 ⋅ 1010 Msun1.6 ⋅ 109 M
sun
1.6 ⋅ 108 Msun
SFHs + early type relation LB−L
X
log(LFIR
/ Lsun
)
log(
L X /
L sun)
EE/S0S0S0−SaSa−SbEarly−type modelStarburst−like SFHsSpiral−like SFHsSpiral−like SFH at varying mass
Figure 3.15: LFIR versus LX for galaxy models of fixed 1.6 × 10¹¹M⊙ baryonic massfor various SFHs (large circles and squares) or at fixed SFH for various masses from1.6 × 108M⊙ to 1.6 × 10¹¹M⊙ (large filled diamonds). Large circles and squares repre-sent, respectively, models with spiral-like SFH and starburst-like SFH. Large filled circlesand squares are obtained using Eq. 3.4, while large open circles and squares depend onEq. 3.10. Different morphological types are plotted as in Fig. 3.13. The galaxy withlogLX/L⊙ > 10 present in Fig. 3.8 is not plotted here.
arises from star forming regions, and the higher LFIR is obtained when LB(and LX) are almost unchanged. Fig. 3.15 also shows both the resultsobtained by applying the early-type linear relation between LX and LB (Eq.3.10) and the late-type one (Eq. 3.4). However, the SFHs used are typicalof late-type galaxies (or starbursters), while it is physically much sounder toapply Eq. (3.4) to obtain the LX luminosity. Finally, we also calculated asequence of models in which one of the SFHs of the spirals has been chosen(NGC6946) with all the parameters fixed and only the mass varied. Fig.3.15 shows that the effect of varying the mass is to diagonally shift theobject by almost along the relation. This shift is due to the smaller amountof emission from stars and gas.
3.6 Conclusions
Considering a large sample of galaxies of all the morphologies, activity, andinteraction, we re-defined the relations existing in a galaxy between varioustracers of the ISM. Studying the known relationship between the CO andthe 100 µm fluxes for early-type galaxies, we found that it is also valid forlate-type systems. In these galaxies, the X-ray flux also appears linked to B
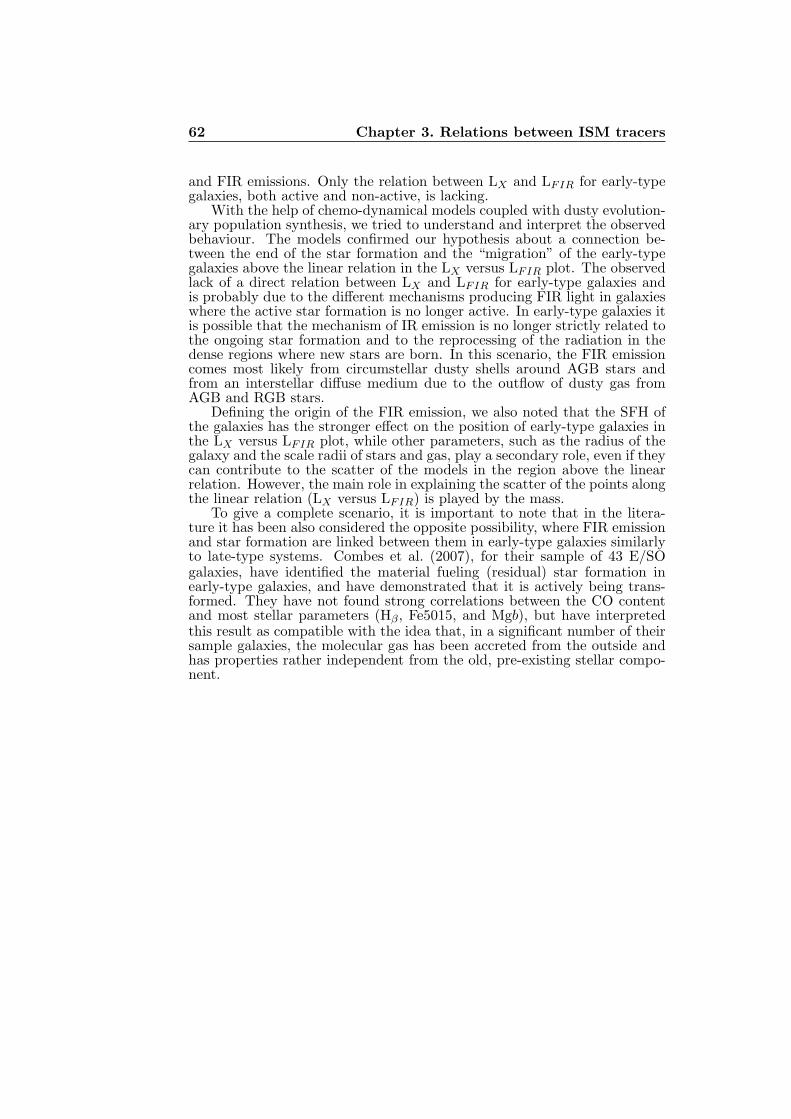
62 Chapter 3. Relations between ISM tracers
and FIR emissions. Only the relation between LX and LFIR for early-typegalaxies, both active and non-active, is lacking.
With the help of chemo-dynamical models coupled with dusty evolution-ary population synthesis, we tried to understand and interpret the observedbehaviour. The models confirmed our hypothesis about a connection be-tween the end of the star formation and the “migration” of the early-typegalaxies above the linear relation in the LX versus LFIR plot. The observedlack of a direct relation between LX and LFIR for early-type galaxies andis probably due to the different mechanisms producing FIR light in galaxieswhere the active star formation is no longer active. In early-type galaxies itis possible that the mechanism of IR emission is no longer strictly related tothe ongoing star formation and to the reprocessing of the radiation in thedense regions where new stars are born. In this scenario, the FIR emissioncomes most likely from circumstellar dusty shells around AGB stars andfrom an interstellar diffuse medium due to the outflow of dusty gas fromAGB and RGB stars.
Defining the origin of the FIR emission, we also noted that the SFH ofthe galaxies has the stronger effect on the position of early-type galaxies inthe LX versus LFIR plot, while other parameters, such as the radius of thegalaxy and the scale radii of stars and gas, play a secondary role, even if theycan contribute to the scatter of the models in the region above the linearrelation. However, the main role in explaining the scatter of the points alongthe linear relation (LX versus LFIR) is played by the mass.
To give a complete scenario, it is important to note that in the litera-ture it has been also considered the opposite possibility, where FIR emissionand star formation are linked between them in early-type galaxies similarlyto late-type systems. Combes et al. (2007), for their sample of 43 E/SOgalaxies, have identified the material fueling (residual) star formation inearly-type galaxies, and have demonstrated that it is actively being trans-formed. They have not found strong correlations between the CO contentand most stellar parameters (Hβ , Fe5015, and Mgb), but have interpretedthis result as compatible with the idea that, in a significant number of theirsample galaxies, the molecular gas has been accreted from the outside andhas properties rather independent from the old, pre-existing stellar compo-nent.
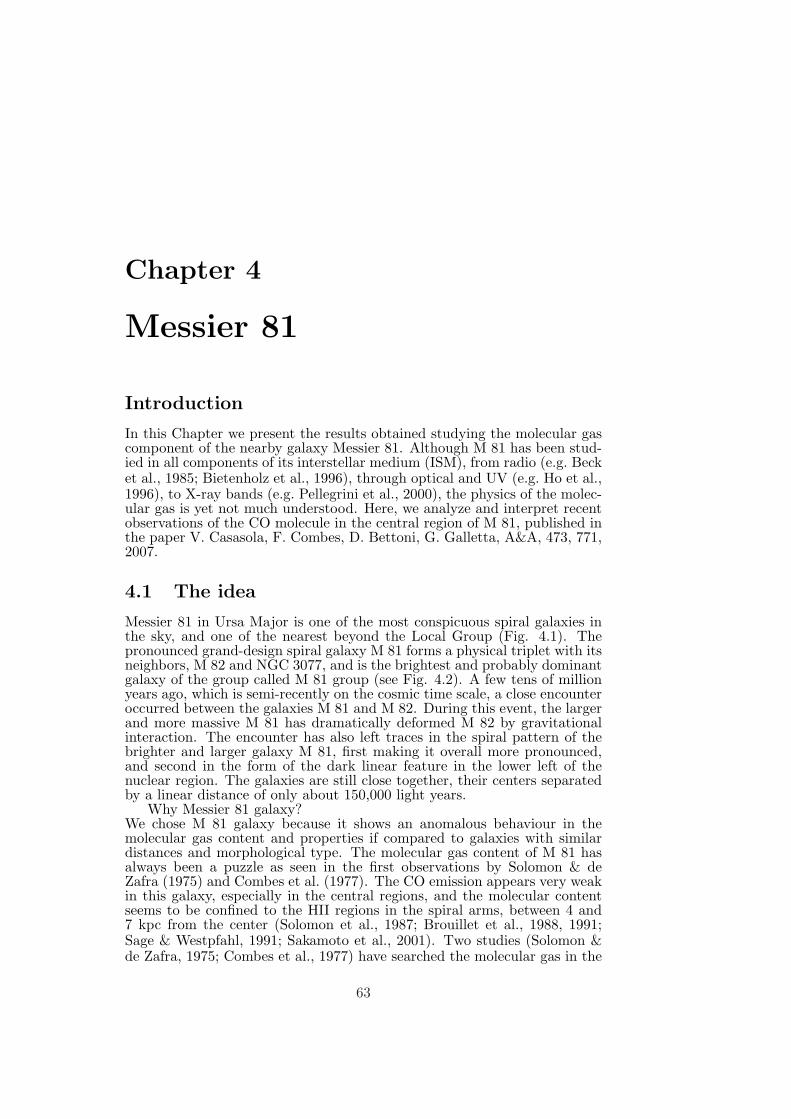
Chapter 4
Messier 81
Introduction
In this Chapter we present the results obtained studying the molecular gascomponent of the nearby galaxy Messier 81. Although M 81 has been stud-ied in all components of its interstellar medium (ISM), from radio (e.g. Becket al., 1985; Bietenholz et al., 1996), through optical and UV (e.g. Ho et al.,1996), to X-ray bands (e.g. Pellegrini et al., 2000), the physics of the molec-ular gas is yet not much understood. Here, we analyze and interpret recentobservations of the CO molecule in the central region of M 81, published inthe paper V. Casasola, F. Combes, D. Bettoni, G. Galletta, A&A, 473, 771,2007.
4.1 The idea
Messier 81 in Ursa Major is one of the most conspicuous spiral galaxies inthe sky, and one of the nearest beyond the Local Group (Fig. 4.1). Thepronounced grand-design spiral galaxy M 81 forms a physical triplet with itsneighbors, M 82 and NGC 3077, and is the brightest and probably dominantgalaxy of the group called M 81 group (see Fig. 4.2). A few tens of millionyears ago, which is semi-recently on the cosmic time scale, a close encounteroccurred between the galaxies M 81 and M 82. During this event, the largerand more massive M 81 has dramatically deformed M 82 by gravitationalinteraction. The encounter has also left traces in the spiral pattern of thebrighter and larger galaxy M 81, first making it overall more pronounced,and second in the form of the dark linear feature in the lower left of thenuclear region. The galaxies are still close together, their centers separatedby a linear distance of only about 150,000 light years.
Why Messier 81 galaxy?We chose M 81 galaxy because it shows an anomalous behaviour in themolecular gas content and properties if compared to galaxies with similardistances and morphological type. The molecular gas content of M 81 hasalways been a puzzle as seen in the first observations by Solomon & deZafra (1975) and Combes et al. (1977). The CO emission appears very weakin this galaxy, especially in the central regions, and the molecular contentseems to be confined to the HII regions in the spiral arms, between 4 and7 kpc from the center (Solomon et al., 1987; Brouillet et al., 1988, 1991;Sage & Westpfahl, 1991; Sakamoto et al., 2001). Two studies (Solomon &de Zafra, 1975; Combes et al., 1977) have searched the molecular gas in the
63
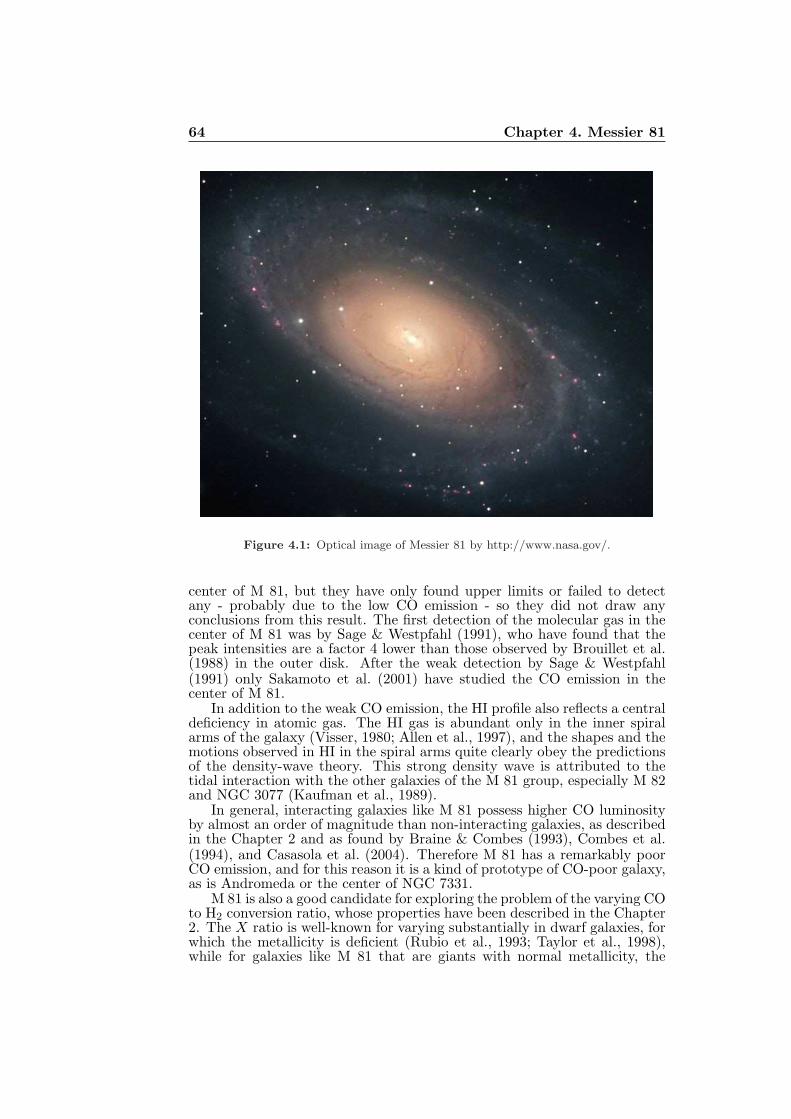
64 Chapter 4. Messier 81
Figure 4.1: Optical image of Messier 81 by http://www.nasa.gov/.
center of M 81, but they have only found upper limits or failed to detectany - probably due to the low CO emission - so they did not draw anyconclusions from this result. The first detection of the molecular gas in thecenter of M 81 was by Sage & Westpfahl (1991), who have found that thepeak intensities are a factor 4 lower than those observed by Brouillet et al.(1988) in the outer disk. After the weak detection by Sage & Westpfahl(1991) only Sakamoto et al. (2001) have studied the CO emission in thecenter of M 81.
In addition to the weak CO emission, the HI profile also reflects a centraldeficiency in atomic gas. The HI gas is abundant only in the inner spiralarms of the galaxy (Visser, 1980; Allen et al., 1997), and the shapes and themotions observed in HI in the spiral arms quite clearly obey the predictionsof the density-wave theory. This strong density wave is attributed to thetidal interaction with the other galaxies of the M 81 group, especially M 82and NGC 3077 (Kaufman et al., 1989).
In general, interacting galaxies like M 81 possess higher CO luminosityby almost an order of magnitude than non-interacting galaxies, as describedin the Chapter 2 and as found by Braine & Combes (1993), Combes et al.(1994), and Casasola et al. (2004). Therefore M 81 has a remarkably poorCO emission, and for this reason it is a kind of prototype of CO-poor galaxy,as is Andromeda or the center of NGC 7331.
M 81 is also a good candidate for exploring the problem of the varying COto H2 conversion ratio, whose properties have been described in the Chapter2. The X ratio is well-known for varying substantially in dwarf galaxies, forwhich the metallicity is deficient (Rubio et al., 1993; Taylor et al., 1998),while for galaxies like M 81 that are giants with normal metallicity, the
4.2. Observations 65
Figure 4.2: Left : Stellar light distribution of the M 81 group (from the Digital SkySurvey), shown in a reversed greyscale (dark regions are brighter). Most of the light in thisimage comes from stars in the galaxies. Right : 21 cm HI distribution of the M 81 group.This radio image, obtained with the VLA, shows the hydrogen gas, including streamersof gas connecting the galaxies. From this radio image, it becomes apparent that this is aninteracting group of galaxies, not isolated objects. Image courtesy of NRAO/AUI.
problem of the low CO emission has not been yet explored much. The COto H2 conversion ratio for M 81 is suspected - on the base of the observationsthat are already available - of departing significantly from the mean (X =2.3 × 10²⁰ mol cm−2 (K km s−1)−1, Strong et al., 1988), because galaxieswith low CO content, such as M 31, NGC 55, or LMC, show a much largerX factor (Nakai & Kuno, 1995).
4.2 Observations
The observations were made from 2 from 6 January 2006 and from 31 Marchto 1 April 2006 at the IRAM 30 m telescope at Pico Veleta (Fig. 4.3),near Granada (Spain). The receiver cabin of the 30 m offers 8 spectral linereceivers for the 3 mm, 2 mm, 1.3 mm (low), and 1.3 mm (high) bands.The 8 receivers are installed in 4 cryostats and are called A, B, C, and D.The nomenclature uses the letter of the cryostat and the band center inGHz, e.g. A100 is the 3 mm receiver in A cryostat, and C270 is the 1.3mm receiver (upper part of the band) in C cryostat. Up to 4 receivers cansimultaneously be used and possible combinations are given by the opticallayout in the receiver cabin. The half power beam widths (HPBW) for thesereceivers range from 9′′ to 34′′1. Recently another receiver has been added,the HEterodyne Receiver Array (HERA)2, with 9 dual polarisation pixels(18 channels) arranged in the form of a square center-filled 3× 3 array. Thedistance between pixels on the sky is 24′′, i.e. close to twice the beam width
1For details on A, B, C, and D receivers see Wild (1999), The 30 m Manual-IRAM.2For details on the HERA receiver see Schuster et al. (2004).
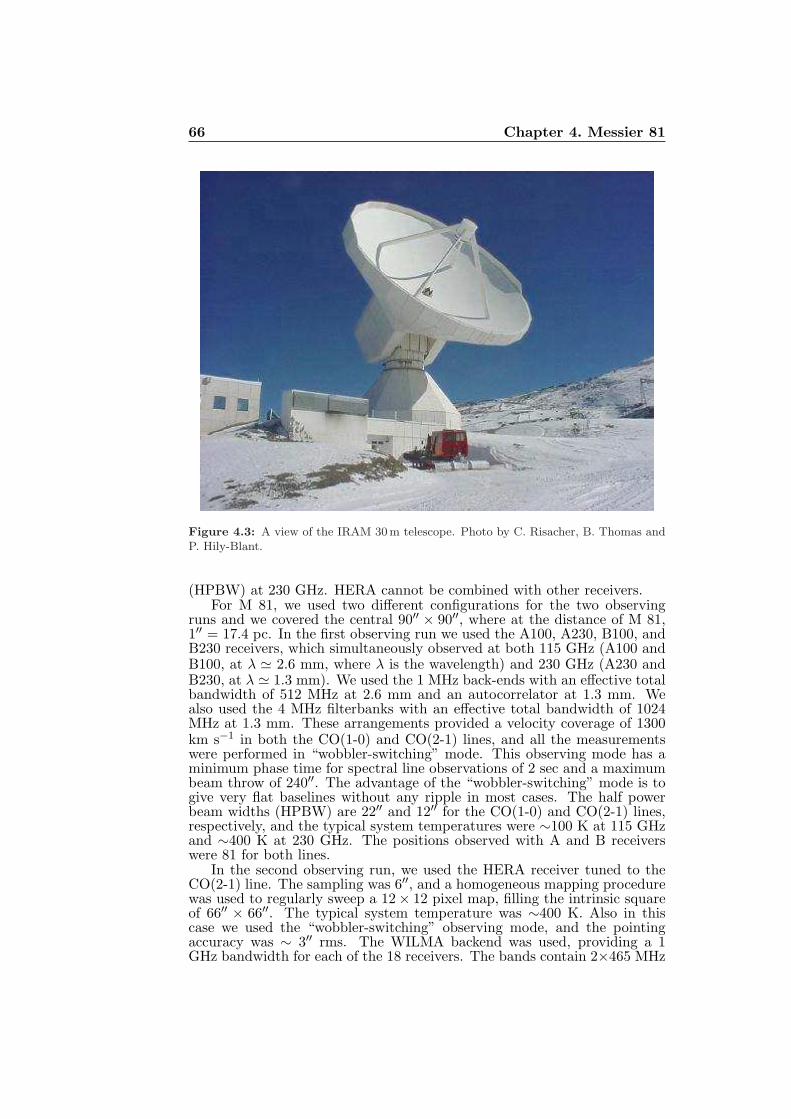
66 Chapter 4. Messier 81
Figure 4.3: A view of the IRAM 30 m telescope. Photo by C. Risacher, B. Thomas andP. Hily-Blant.
(HPBW) at 230 GHz. HERA cannot be combined with other receivers.For M 81, we used two different configurations for the two observing
runs and we covered the central 90′′ × 90′′, where at the distance of M 81,1′′ = 17.4 pc. In the first observing run we used the A100, A230, B100, andB230 receivers, which simultaneously observed at both 115 GHz (A100 andB100, at λ ≃ 2.6 mm, where λ is the wavelength) and 230 GHz (A230 andB230, at λ ≃ 1.3 mm). We used the 1 MHz back-ends with an effective totalbandwidth of 512 MHz at 2.6 mm and an autocorrelator at 1.3 mm. Wealso used the 4 MHz filterbanks with an effective total bandwidth of 1024MHz at 1.3 mm. These arrangements provided a velocity coverage of 1300km s−1 in both the CO(1-0) and CO(2-1) lines, and all the measurementswere performed in “wobbler-switching” mode. This observing mode has aminimum phase time for spectral line observations of 2 sec and a maximumbeam throw of 240′′. The advantage of the “wobbler-switching” mode is togive very flat baselines without any ripple in most cases. The half powerbeam widths (HPBW) are 22′′ and 12′′ for the CO(1-0) and CO(2-1) lines,respectively, and the typical system temperatures were ∼100 K at 115 GHzand ∼400 K at 230 GHz. The positions observed with A and B receiverswere 81 for both lines.
In the second observing run, we used the HERA receiver tuned to theCO(2-1) line. The sampling was 6′′, and a homogeneous mapping procedurewas used to regularly sweep a 12 × 12 pixel map, filling the intrinsic squareof 66′′ × 66′′. The typical system temperature was ∼400 K. Also in thiscase we used the “wobbler-switching” observing mode, and the pointingaccuracy was ∼ 3′′ rms. The WILMA backend was used, providing a 1GHz bandwidth for each of the 18 receivers. The bands contain 2×465 MHz
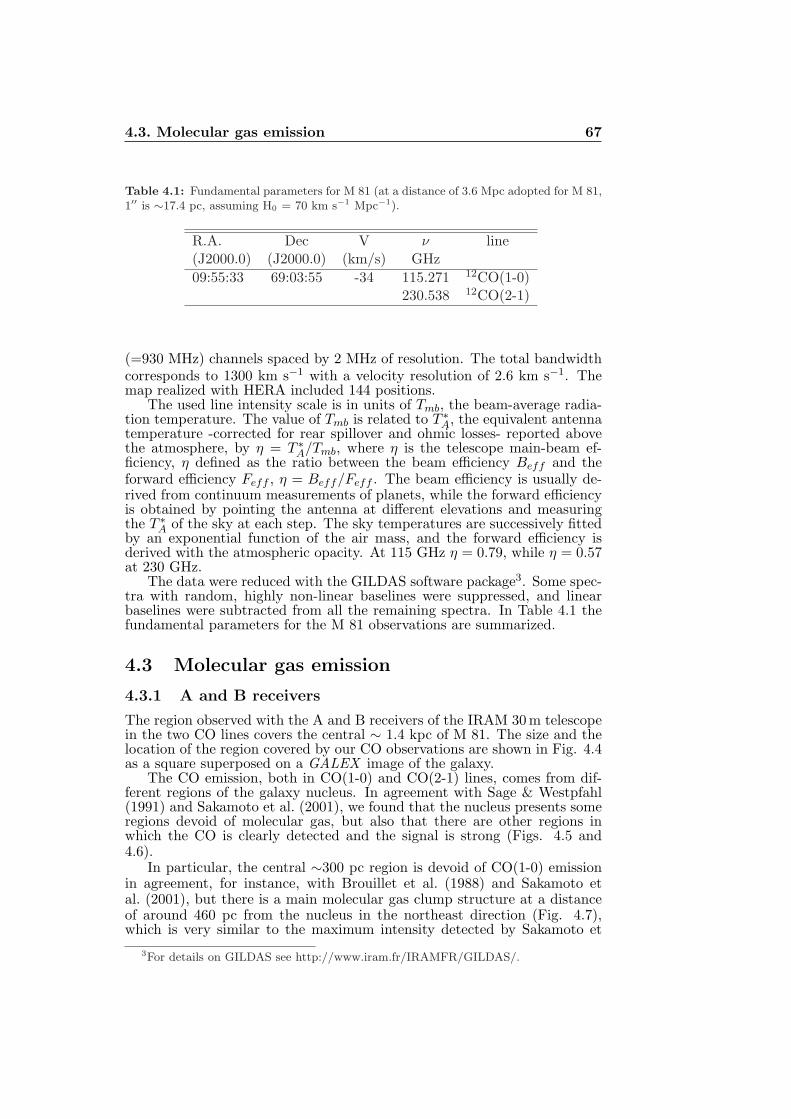
4.3. Molecular gas emission 67
Table 4.1: Fundamental parameters for M 81 (at a distance of 3.6 Mpc adopted for M 81,1′′ is ∼17.4 pc, assuming H0 = 70 km s−1 Mpc−1).
R.A. Dec V ν line(J2000.0) (J2000.0) (km/s) GHz
09:55:33 69:03:55 -34 115.271 12CO(1-0)230.538 12CO(2-1)
(=930 MHz) channels spaced by 2 MHz of resolution. The total bandwidthcorresponds to 1300 km s−1 with a velocity resolution of 2.6 km s−1. Themap realized with HERA included 144 positions.
The used line intensity scale is in units of Tmb, the beam-average radia-tion temperature. The value of Tmb is related to T ∗
A, the equivalent antennatemperature -corrected for rear spillover and ohmic losses- reported abovethe atmosphere, by η = T ∗
A/Tmb, where η is the telescope main-beam ef-ficiency, η defined as the ratio between the beam efficiency Beff and theforward efficiency Feff , η = Beff/Feff . The beam efficiency is usually de-rived from continuum measurements of planets, while the forward efficiencyis obtained by pointing the antenna at different elevations and measuringthe T ∗
A of the sky at each step. The sky temperatures are successively fittedby an exponential function of the air mass, and the forward efficiency isderived with the atmospheric opacity. At 115 GHz η = 0.79, while η = 0.57at 230 GHz.
The data were reduced with the GILDAS software package3. Some spec-tra with random, highly non-linear baselines were suppressed, and linearbaselines were subtracted from all the remaining spectra. In Table 4.1 thefundamental parameters for the M 81 observations are summarized.
4.3 Molecular gas emission
4.3.1 A and B receivers
The region observed with the A and B receivers of the IRAM 30 m telescopein the two CO lines covers the central ∼ 1.4 kpc of M 81. The size and thelocation of the region covered by our CO observations are shown in Fig. 4.4as a square superposed on a GALEX image of the galaxy.
The CO emission, both in CO(1-0) and CO(2-1) lines, comes from dif-ferent regions of the galaxy nucleus. In agreement with Sage & Westpfahl(1991) and Sakamoto et al. (2001), we found that the nucleus presents someregions devoid of molecular gas, but also that there are other regions inwhich the CO is clearly detected and the signal is strong (Figs. 4.5 and4.6).
In particular, the central ∼300 pc region is devoid of CO(1-0) emissionin agreement, for instance, with Brouillet et al. (1988) and Sakamoto etal. (2001), but there is a main molecular gas clump structure at a distanceof around 460 pc from the nucleus in the northeast direction (Fig. 4.7),which is very similar to the maximum intensity detected by Sakamoto et
3For details on GILDAS see http://www.iram.fr/IRAMFR/GILDAS/.
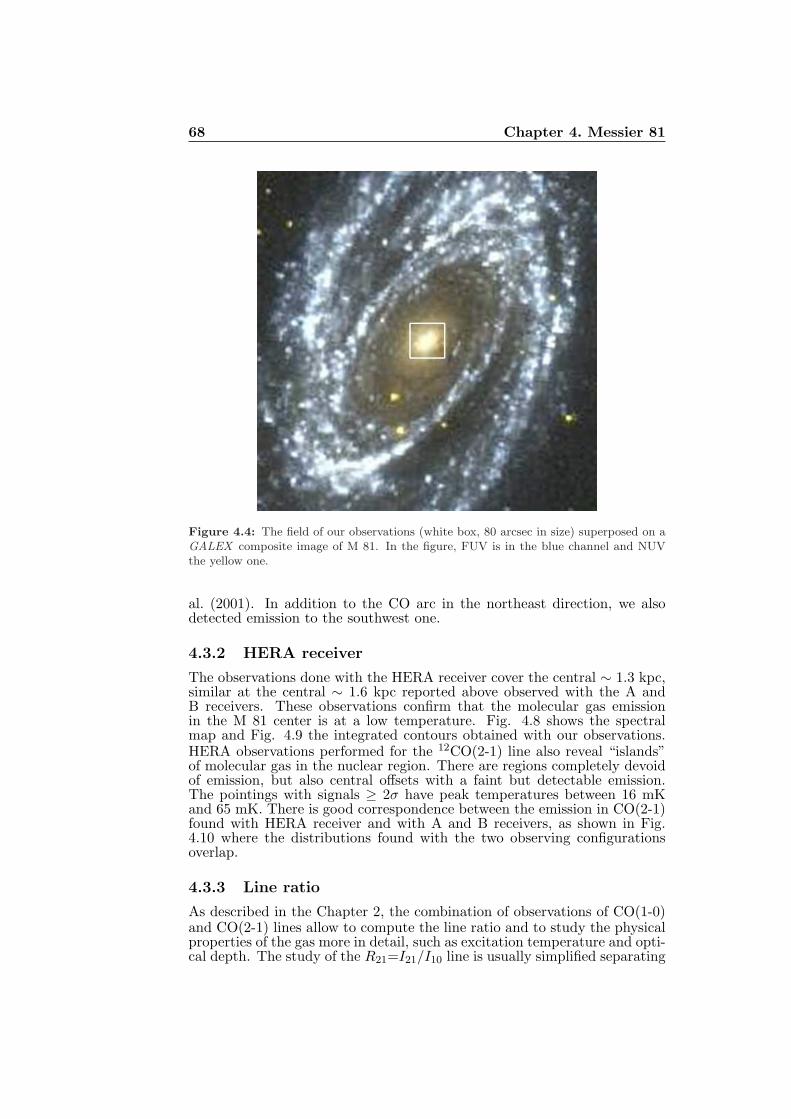
68 Chapter 4. Messier 81
Figure 4.4: The field of our observations (white box, 80 arcsec in size) superposed on aGALEX composite image of M 81. In the figure, FUV is in the blue channel and NUVthe yellow one.
al. (2001). In addition to the CO arc in the northeast direction, we alsodetected emission to the southwest one.
4.3.2 HERA receiver
The observations done with the HERA receiver cover the central ∼ 1.3 kpc,similar at the central ∼ 1.6 kpc reported above observed with the A andB receivers. These observations confirm that the molecular gas emissionin the M 81 center is at a low temperature. Fig. 4.8 shows the spectralmap and Fig. 4.9 the integrated contours obtained with our observations.HERA observations performed for the 12CO(2-1) line also reveal “islands”of molecular gas in the nuclear region. There are regions completely devoidof emission, but also central offsets with a faint but detectable emission.The pointings with signals ≥ 2σ have peak temperatures between 16 mKand 65 mK. There is good correspondence between the emission in CO(2-1)found with HERA receiver and with A and B receivers, as shown in Fig.4.10 where the distributions found with the two observing configurationsoverlap.
4.3.3 Line ratio
As described in the Chapter 2, the combination of observations of CO(1-0)and CO(2-1) lines allow to compute the line ratio and to study the physicalproperties of the gas more in detail, such as excitation temperature and opti-cal depth. The study of the R21=I21/I10 line is usually simplified separating
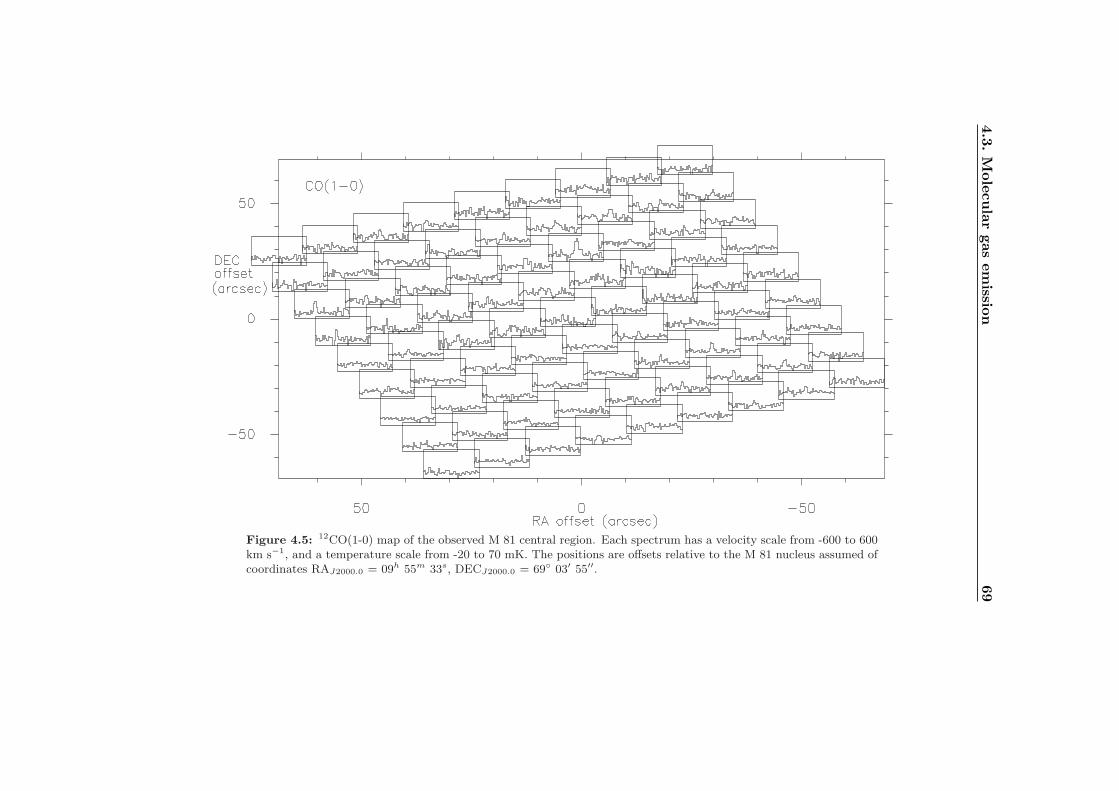
4.3
.M
ole
cula
rgas
em
issio
n69
Figure 4.5: 12CO(1-0) map of the observed M 81 central region. Each spectrum has a velocity scale from -600 to 600km s−1, and a temperature scale from -20 to 70 mK. The positions are offsets relative to the M 81 nucleus assumed ofcoordinates RAJ2000.0 = 09h 55m 33s, DECJ2000.0 = 69 03′ 55′′.
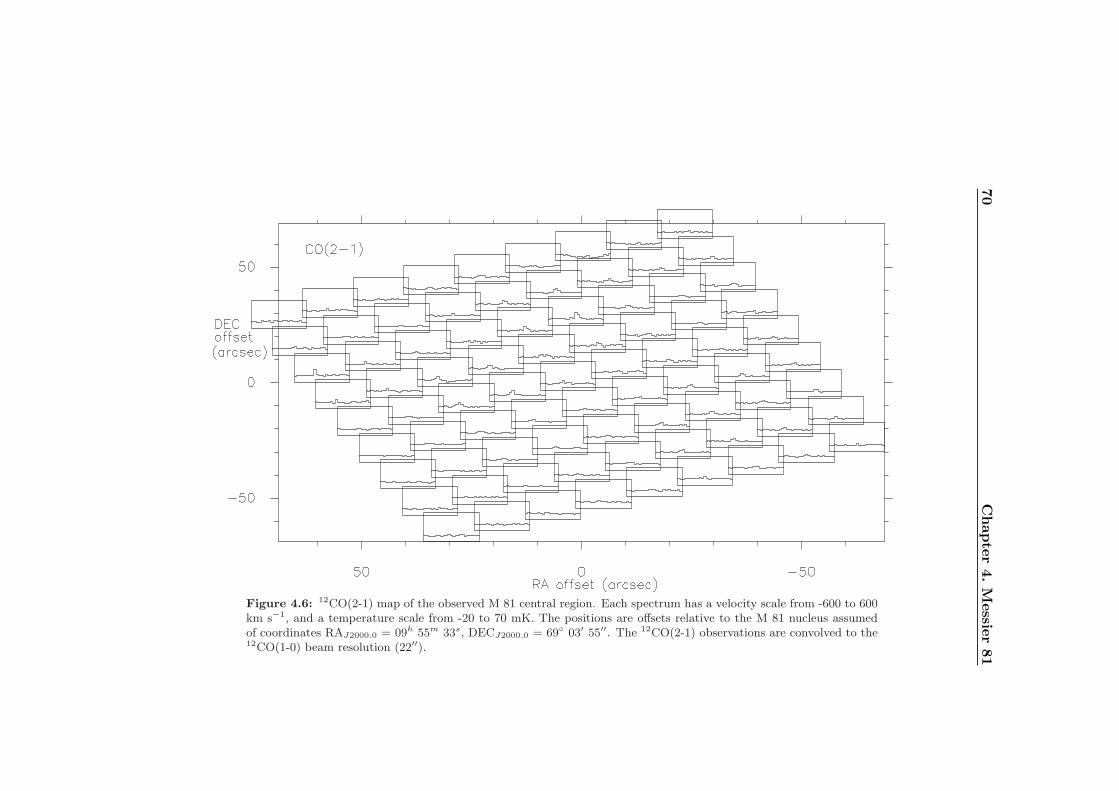
70
Chapte
r4.M
essie
r81
Figure 4.6: 12CO(2-1) map of the observed M 81 central region. Each spectrum has a velocity scale from -600 to 600km s−1, and a temperature scale from -20 to 70 mK. The positions are offsets relative to the M 81 nucleus assumedof coordinates RAJ2000.0 = 09h 55m 33s, DECJ2000.0 = 69 03′ 55′′. The 12CO(2-1) observations are convolved to the12CO(1-0) beam resolution (22′′).
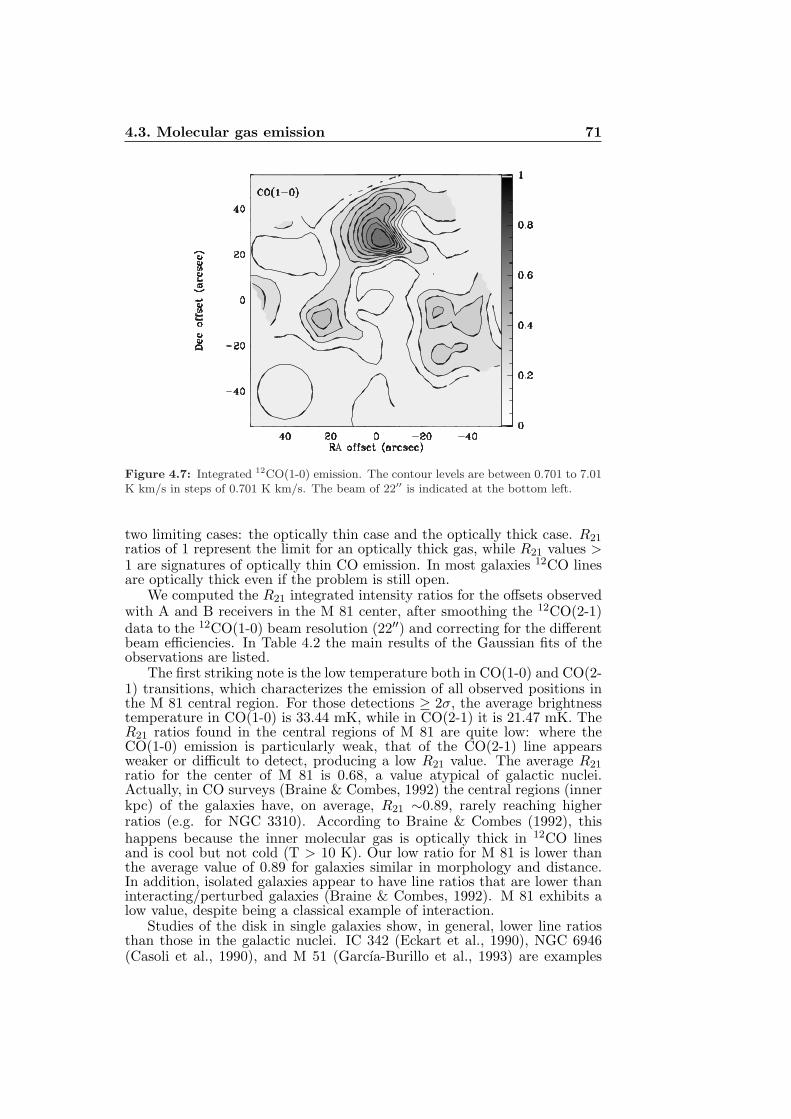
4.3. Molecular gas emission 71
Figure 4.7: Integrated 12CO(1-0) emission. The contour levels are between 0.701 to 7.01K km/s in steps of 0.701 K km/s. The beam of 22′′ is indicated at the bottom left.
two limiting cases: the optically thin case and the optically thick case. R21ratios of 1 represent the limit for an optically thick gas, while R21 values >1 are signatures of optically thin CO emission. In most galaxies 12CO linesare optically thick even if the problem is still open.
We computed the R21 integrated intensity ratios for the offsets observedwith A and B receivers in the M 81 center, after smoothing the 12CO(2-1)data to the 12CO(1-0) beam resolution (22′′) and correcting for the differentbeam efficiencies. In Table 4.2 the main results of the Gaussian fits of theobservations are listed.
The first striking note is the low temperature both in CO(1-0) and CO(2-1) transitions, which characterizes the emission of all observed positions inthe M 81 central region. For those detections ≥ 2σ, the average brightnesstemperature in CO(1-0) is 33.44 mK, while in CO(2-1) it is 21.47 mK. TheR21 ratios found in the central regions of M 81 are quite low: where theCO(1-0) emission is particularly weak, that of the CO(2-1) line appearsweaker or difficult to detect, producing a low R21 value. The average R21ratio for the center of M 81 is 0.68, a value atypical of galactic nuclei.Actually, in CO surveys (Braine & Combes, 1992) the central regions (innerkpc) of the galaxies have, on average, R21 ∼0.89, rarely reaching higherratios (e.g. for NGC 3310). According to Braine & Combes (1992), thishappens because the inner molecular gas is optically thick in 12CO linesand is cool but not cold (T > 10 K). Our low ratio for M 81 is lower thanthe average value of 0.89 for galaxies similar in morphology and distance.In addition, isolated galaxies appear to have line ratios that are lower thaninteracting/perturbed galaxies (Braine & Combes, 1992). M 81 exhibits alow value, despite being a classical example of interaction.
Studies of the disk in single galaxies show, in general, lower line ratiosthan those in the galactic nuclei. IC 342 (Eckart et al., 1990), NGC 6946(Casoli et al., 1990), and M 51 (Garcıa-Burillo et al., 1993) are examples
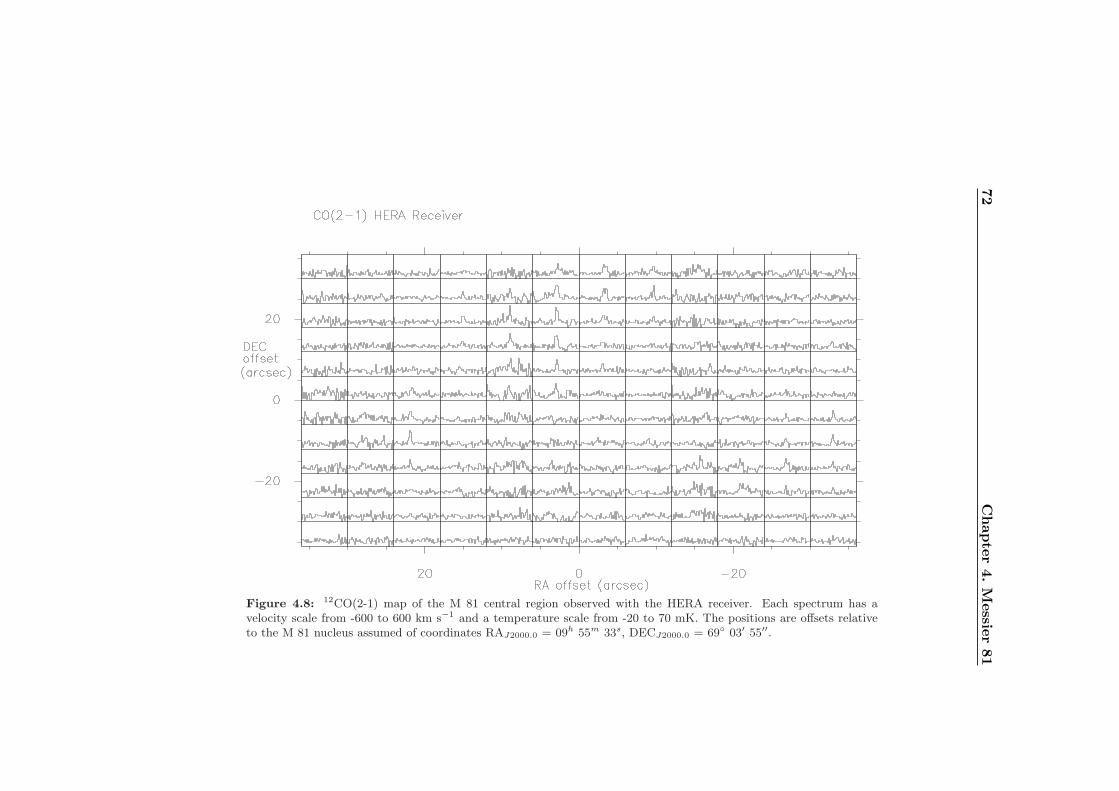
72
Chapte
r4.M
essie
r81
Figure 4.8: 12CO(2-1) map of the M 81 central region observed with the HERA receiver. Each spectrum has avelocity scale from -600 to 600 km s−1 and a temperature scale from -20 to 70 mK. The positions are offsets relativeto the M 81 nucleus assumed of coordinates RAJ2000.0 = 09h 55m 33s, DECJ2000.0 = 69 03′ 55′′.
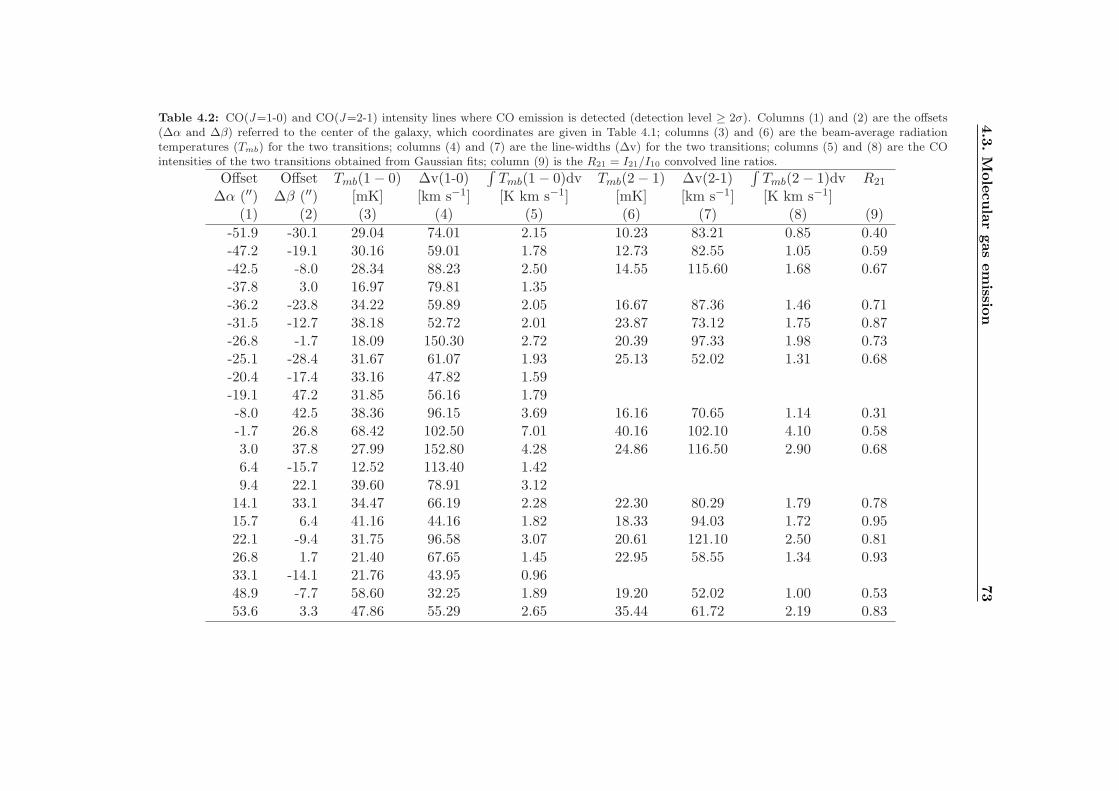
4.3
.M
ole
cula
rgas
em
issio
n73
Table 4.2: CO(J=1-0) and CO(J=2-1) intensity lines where CO emission is detected (detection level ≥ 2σ). Columns (1) and (2) are the offsets(∆α and ∆β) referred to the center of the galaxy, which coordinates are given in Table 4.1; columns (3) and (6) are the beam-average radiationtemperatures (Tmb) for the two transitions; columns (4) and (7) are the line-widths (∆v) for the two transitions; columns (5) and (8) are the COintensities of the two transitions obtained from Gaussian fits; column (9) is the R21 = I21/I10 convolved line ratios.
Offset Offset Tmb(1 − 0) ∆v(1-0)∫
Tmb(1 − 0)dv Tmb(2 − 1) ∆v(2-1)∫
Tmb(2 − 1)dv R21
∆α (′′) ∆β (′′) [mK] [km s−1] [K km s−1] [mK] [km s−1] [K km s−1](1) (2) (3) (4) (5) (6) (7) (8) (9)
-51.9 -30.1 29.04 74.01 2.15 10.23 83.21 0.85 0.40-47.2 -19.1 30.16 59.01 1.78 12.73 82.55 1.05 0.59-42.5 -8.0 28.34 88.23 2.50 14.55 115.60 1.68 0.67-37.8 3.0 16.97 79.81 1.35-36.2 -23.8 34.22 59.89 2.05 16.67 87.36 1.46 0.71-31.5 -12.7 38.18 52.72 2.01 23.87 73.12 1.75 0.87-26.8 -1.7 18.09 150.30 2.72 20.39 97.33 1.98 0.73-25.1 -28.4 31.67 61.07 1.93 25.13 52.02 1.31 0.68-20.4 -17.4 33.16 47.82 1.59-19.1 47.2 31.85 56.16 1.79-8.0 42.5 38.36 96.15 3.69 16.16 70.65 1.14 0.31-1.7 26.8 68.42 102.50 7.01 40.16 102.10 4.10 0.583.0 37.8 27.99 152.80 4.28 24.86 116.50 2.90 0.686.4 -15.7 12.52 113.40 1.429.4 22.1 39.60 78.91 3.12
14.1 33.1 34.47 66.19 2.28 22.30 80.29 1.79 0.7815.7 6.4 41.16 44.16 1.82 18.33 94.03 1.72 0.9522.1 -9.4 31.75 96.58 3.07 20.61 121.10 2.50 0.8126.8 1.7 21.40 67.65 1.45 22.95 58.55 1.34 0.9333.1 -14.1 21.76 43.95 0.9648.9 -7.7 58.60 32.25 1.89 19.20 52.02 1.00 0.5353.6 3.3 47.86 55.29 2.65 35.44 61.72 2.19 0.83
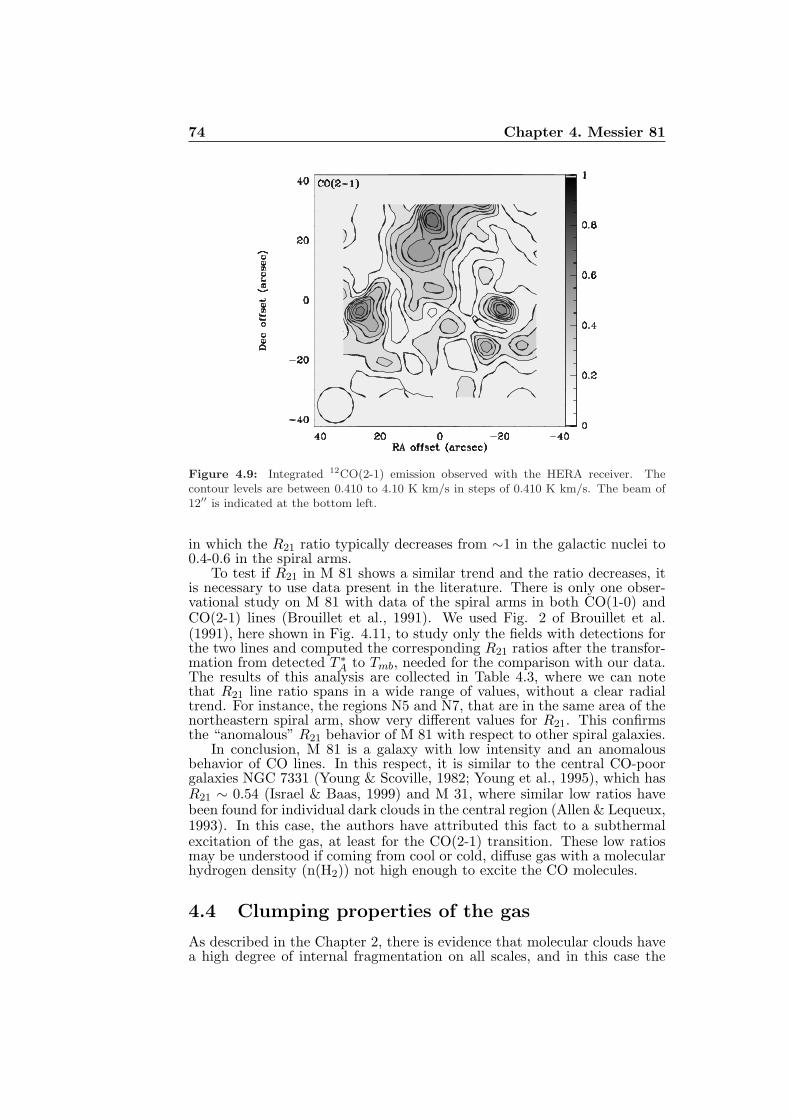
74 Chapter 4. Messier 81
Figure 4.9: Integrated 12CO(2-1) emission observed with the HERA receiver. Thecontour levels are between 0.410 to 4.10 K km/s in steps of 0.410 K km/s. The beam of12′′ is indicated at the bottom left.
in which the R21 ratio typically decreases from ∼1 in the galactic nuclei to0.4-0.6 in the spiral arms.
To test if R21 in M 81 shows a similar trend and the ratio decreases, itis necessary to use data present in the literature. There is only one obser-vational study on M 81 with data of the spiral arms in both CO(1-0) andCO(2-1) lines (Brouillet et al., 1991). We used Fig. 2 of Brouillet et al.(1991), here shown in Fig. 4.11, to study only the fields with detections forthe two lines and computed the corresponding R21 ratios after the transfor-mation from detected T ∗
A to Tmb, needed for the comparison with our data.The results of this analysis are collected in Table 4.3, where we can notethat R21 line ratio spans in a wide range of values, without a clear radialtrend. For instance, the regions N5 and N7, that are in the same area of thenortheastern spiral arm, show very different values for R21. This confirmsthe “anomalous” R21 behavior of M 81 with respect to other spiral galaxies.
In conclusion, M 81 is a galaxy with low intensity and an anomalousbehavior of CO lines. In this respect, it is similar to the central CO-poorgalaxies NGC 7331 (Young & Scoville, 1982; Young et al., 1995), which hasR21 ∼ 0.54 (Israel & Baas, 1999) and M 31, where similar low ratios havebeen found for individual dark clouds in the central region (Allen & Lequeux,1993). In this case, the authors have attributed this fact to a subthermalexcitation of the gas, at least for the CO(2-1) transition. These low ratiosmay be understood if coming from cool or cold, diffuse gas with a molecularhydrogen density (n(H2)) not high enough to excite the CO molecules.
4.4 Clumping properties of the gas
As described in the Chapter 2, there is evidence that molecular clouds havea high degree of internal fragmentation on all scales, and in this case the
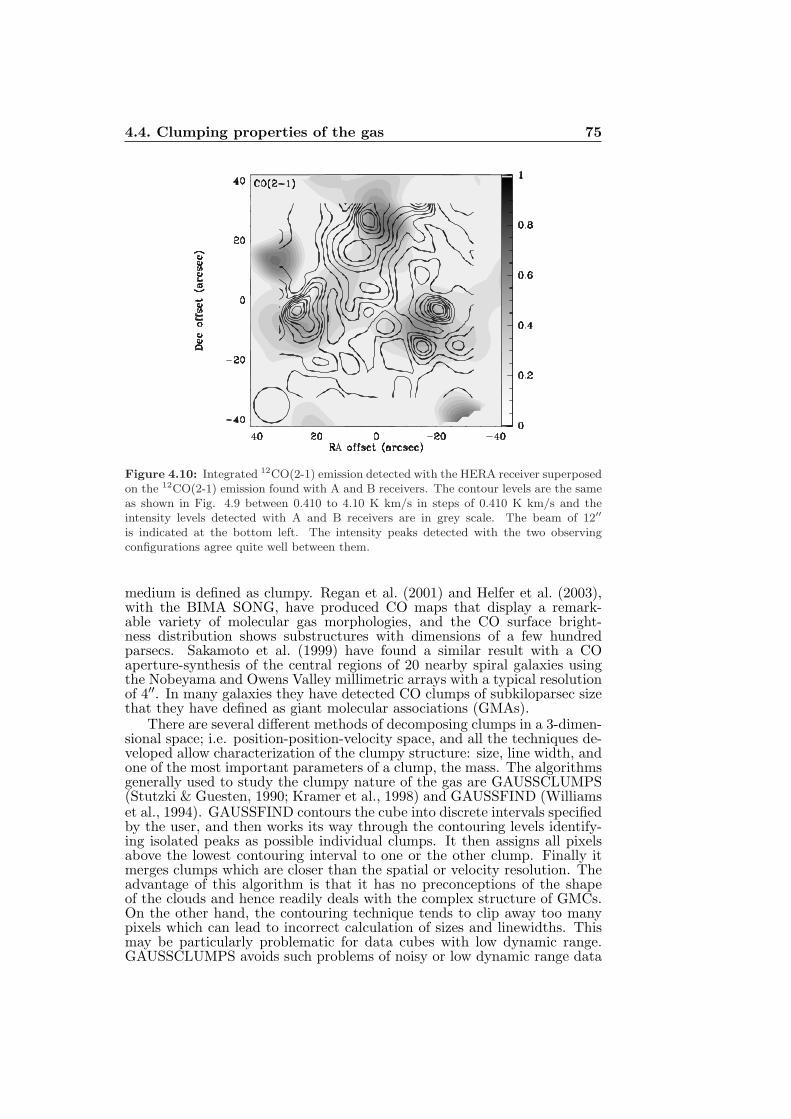
4.4. Clumping properties of the gas 75
Figure 4.10: Integrated 12CO(2-1) emission detected with the HERA receiver superposedon the 12CO(2-1) emission found with A and B receivers. The contour levels are the sameas shown in Fig. 4.9 between 0.410 to 4.10 K km/s in steps of 0.410 K km/s and theintensity levels detected with A and B receivers are in grey scale. The beam of 12′′
is indicated at the bottom left. The intensity peaks detected with the two observingconfigurations agree quite well between them.
medium is defined as clumpy. Regan et al. (2001) and Helfer et al. (2003),with the BIMA SONG, have produced CO maps that display a remark-able variety of molecular gas morphologies, and the CO surface bright-ness distribution shows substructures with dimensions of a few hundredparsecs. Sakamoto et al. (1999) have found a similar result with a COaperture-synthesis of the central regions of 20 nearby spiral galaxies usingthe Nobeyama and Owens Valley millimetric arrays with a typical resolutionof 4′′. In many galaxies they have detected CO clumps of subkiloparsec sizethat they have defined as giant molecular associations (GMAs).
There are several different methods of decomposing clumps in a 3-dimen-sional space; i.e. position-position-velocity space, and all the techniques de-veloped allow characterization of the clumpy structure: size, line width, andone of the most important parameters of a clump, the mass. The algorithmsgenerally used to study the clumpy nature of the gas are GAUSSCLUMPS(Stutzki & Guesten, 1990; Kramer et al., 1998) and GAUSSFIND (Williamset al., 1994). GAUSSFIND contours the cube into discrete intervals specifiedby the user, and then works its way through the contouring levels identify-ing isolated peaks as possible individual clumps. It then assigns all pixelsabove the lowest contouring interval to one or the other clump. Finally itmerges clumps which are closer than the spatial or velocity resolution. Theadvantage of this algorithm is that it has no preconceptions of the shapeof the clouds and hence readily deals with the complex structure of GMCs.On the other hand, the contouring technique tends to clip away too manypixels which can lead to incorrect calculation of sizes and linewidths. Thismay be particularly problematic for data cubes with low dynamic range.GAUSSCLUMPS avoids such problems of noisy or low dynamic range data
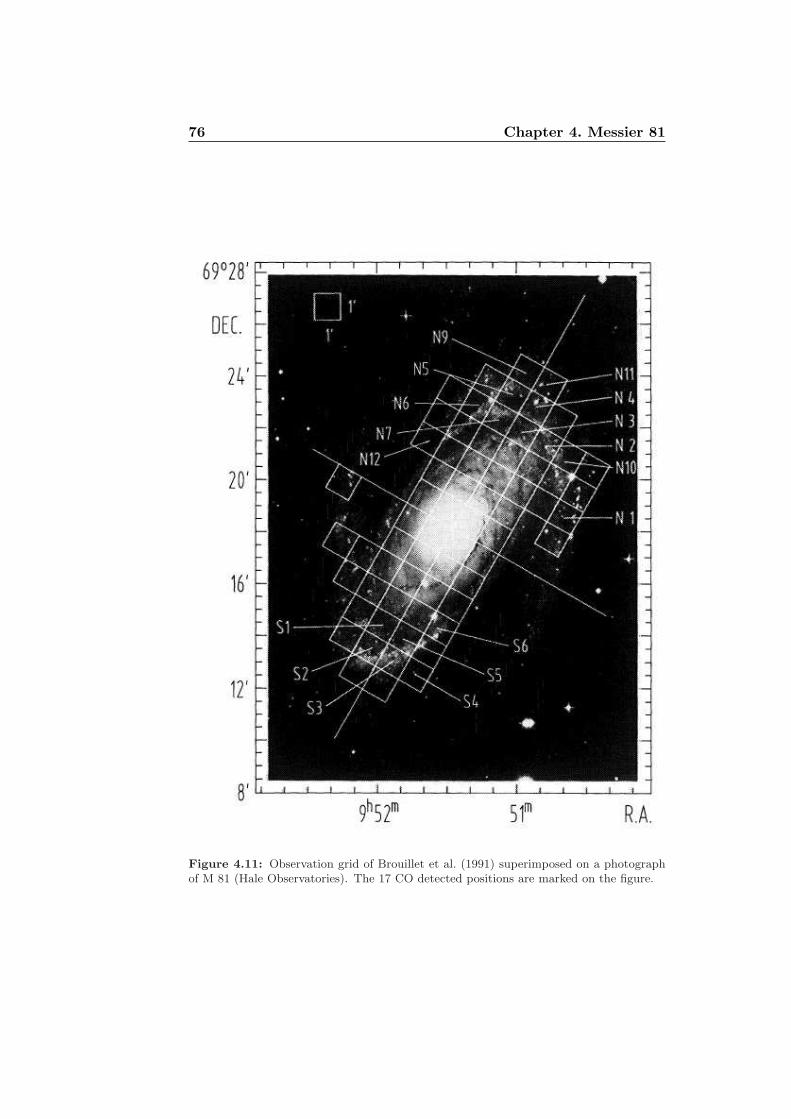
76 Chapter 4. Messier 81
Figure 4.11: Observation grid of Brouillet et al. (1991) superimposed on a photographof M 81 (Hale Observatories). The 17 CO detected positions are marked on the figure.
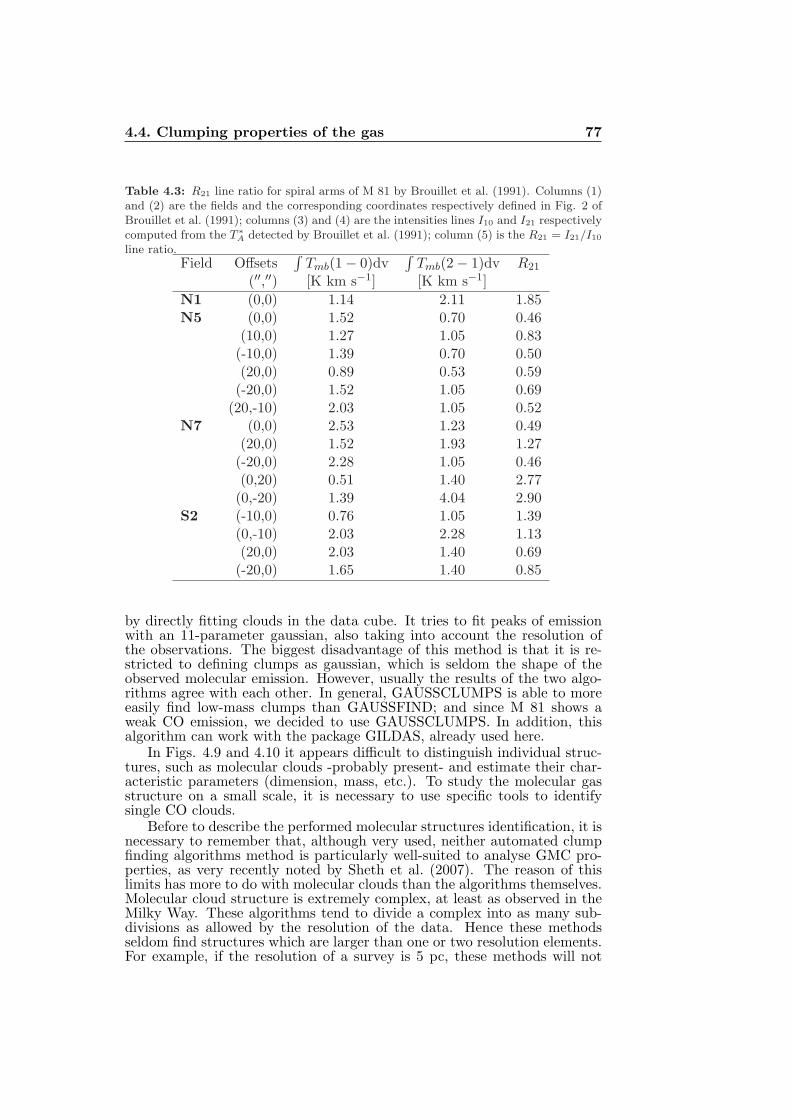
4.4. Clumping properties of the gas 77
Table 4.3: R21 line ratio for spiral arms of M 81 by Brouillet et al. (1991). Columns (1)and (2) are the fields and the corresponding coordinates respectively defined in Fig. 2 ofBrouillet et al. (1991); columns (3) and (4) are the intensities lines I10 and I21 respectivelycomputed from the T ∗
A detected by Brouillet et al. (1991); column (5) is the R21 = I21/I10
line ratio.Field Offsets
∫
Tmb(1 − 0)dv∫
Tmb(2 − 1)dv R21
(′′,′′) [K km s−1] [K km s−1]
N1 (0,0) 1.14 2.11 1.85N5 (0,0) 1.52 0.70 0.46
(10,0) 1.27 1.05 0.83(-10,0) 1.39 0.70 0.50(20,0) 0.89 0.53 0.59
(-20,0) 1.52 1.05 0.69(20,-10) 2.03 1.05 0.52
N7 (0,0) 2.53 1.23 0.49(20,0) 1.52 1.93 1.27
(-20,0) 2.28 1.05 0.46(0,20) 0.51 1.40 2.77
(0,-20) 1.39 4.04 2.90S2 (-10,0) 0.76 1.05 1.39
(0,-10) 2.03 2.28 1.13(20,0) 2.03 1.40 0.69
(-20,0) 1.65 1.40 0.85
by directly fitting clouds in the data cube. It tries to fit peaks of emissionwith an 11-parameter gaussian, also taking into account the resolution ofthe observations. The biggest disadvantage of this method is that it is re-stricted to defining clumps as gaussian, which is seldom the shape of theobserved molecular emission. However, usually the results of the two algo-rithms agree with each other. In general, GAUSSCLUMPS is able to moreeasily find low-mass clumps than GAUSSFIND; and since M 81 shows aweak CO emission, we decided to use GAUSSCLUMPS. In addition, thisalgorithm can work with the package GILDAS, already used here.
In Figs. 4.9 and 4.10 it appears difficult to distinguish individual struc-tures, such as molecular clouds -probably present- and estimate their char-acteristic parameters (dimension, mass, etc.). To study the molecular gasstructure on a small scale, it is necessary to use specific tools to identifysingle CO clouds.
Before to describe the performed molecular structures identification, it isnecessary to remember that, although very used, neither automated clumpfinding algorithms method is particularly well-suited to analyse GMC pro-perties, as very recently noted by Sheth et al. (2007). The reason of thislimits has more to do with molecular clouds than the algorithms themselves.Molecular cloud structure is extremely complex, at least as observed in theMilky Way. These algorithms tend to divide a complex into as many sub-divisions as allowed by the resolution of the data. Hence these methodsseldom find structures which are larger than one or two resolution elements.For example, if the resolution of a survey is 5 pc, these methods will not
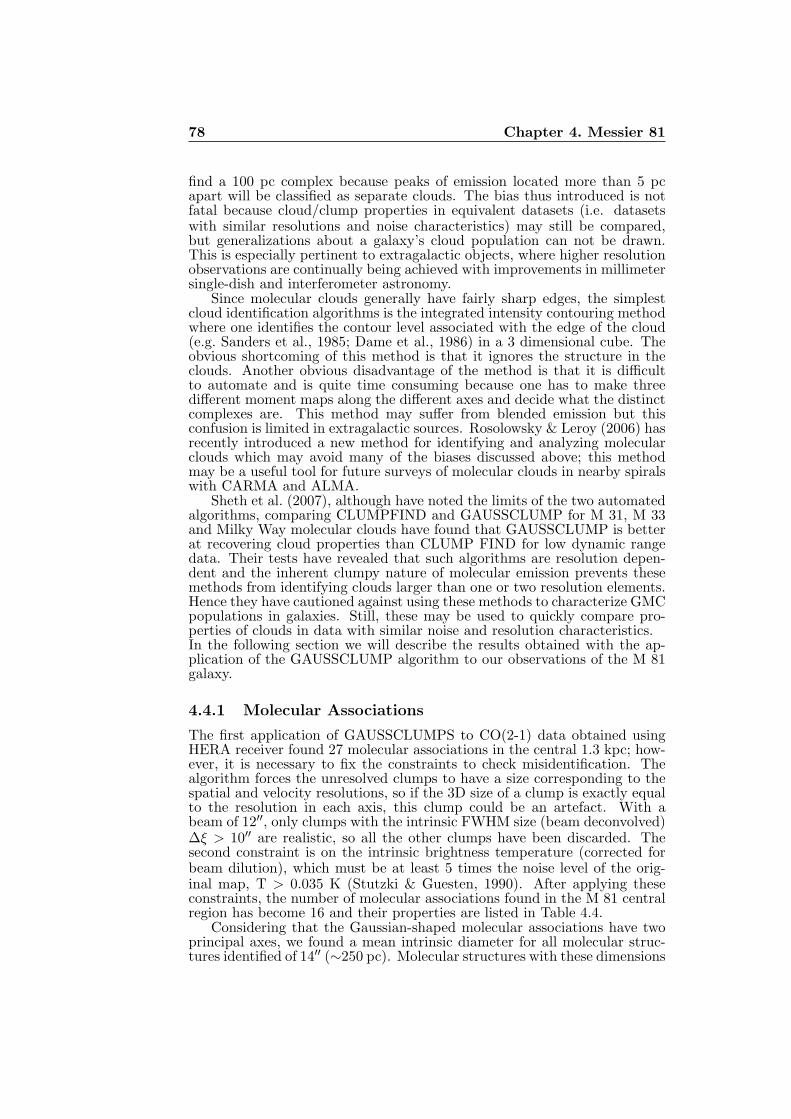
78 Chapter 4. Messier 81
find a 100 pc complex because peaks of emission located more than 5 pcapart will be classified as separate clouds. The bias thus introduced is notfatal because cloud/clump properties in equivalent datasets (i.e. datasetswith similar resolutions and noise characteristics) may still be compared,but generalizations about a galaxy’s cloud population can not be drawn.This is especially pertinent to extragalactic objects, where higher resolutionobservations are continually being achieved with improvements in millimetersingle-dish and interferometer astronomy.
Since molecular clouds generally have fairly sharp edges, the simplestcloud identification algorithms is the integrated intensity contouring methodwhere one identifies the contour level associated with the edge of the cloud(e.g. Sanders et al., 1985; Dame et al., 1986) in a 3 dimensional cube. Theobvious shortcoming of this method is that it ignores the structure in theclouds. Another obvious disadvantage of the method is that it is difficultto automate and is quite time consuming because one has to make threedifferent moment maps along the different axes and decide what the distinctcomplexes are. This method may suffer from blended emission but thisconfusion is limited in extragalactic sources. Rosolowsky & Leroy (2006) hasrecently introduced a new method for identifying and analyzing molecularclouds which may avoid many of the biases discussed above; this methodmay be a useful tool for future surveys of molecular clouds in nearby spiralswith CARMA and ALMA.
Sheth et al. (2007), although have noted the limits of the two automatedalgorithms, comparing CLUMPFIND and GAUSSCLUMP for M 31, M 33and Milky Way molecular clouds have found that GAUSSCLUMP is betterat recovering cloud properties than CLUMP FIND for low dynamic rangedata. Their tests have revealed that such algorithms are resolution depen-dent and the inherent clumpy nature of molecular emission prevents thesemethods from identifying clouds larger than one or two resolution elements.Hence they have cautioned against using these methods to characterize GMCpopulations in galaxies. Still, these may be used to quickly compare pro-perties of clouds in data with similar noise and resolution characteristics.In the following section we will describe the results obtained with the ap-plication of the GAUSSCLUMP algorithm to our observations of the M 81galaxy.
4.4.1 Molecular Associations
The first application of GAUSSCLUMPS to CO(2-1) data obtained usingHERA receiver found 27 molecular associations in the central 1.3 kpc; how-ever, it is necessary to fix the constraints to check misidentification. Thealgorithm forces the unresolved clumps to have a size corresponding to thespatial and velocity resolutions, so if the 3D size of a clump is exactly equalto the resolution in each axis, this clump could be an artefact. With abeam of 12′′, only clumps with the intrinsic FWHM size (beam deconvolved)∆ξ > 10′′ are realistic, so all the other clumps have been discarded. Thesecond constraint is on the intrinsic brightness temperature (corrected forbeam dilution), which must be at least 5 times the noise level of the orig-inal map, T > 0.035 K (Stutzki & Guesten, 1990). After applying theseconstraints, the number of molecular associations found in the M 81 centralregion has become 16 and their properties are listed in Table 4.4.
Considering that the Gaussian-shaped molecular associations have twoprincipal axes, we found a mean intrinsic diameter for all molecular struc-tures identified of 14′′ (∼250 pc). Molecular structures with these dimensions
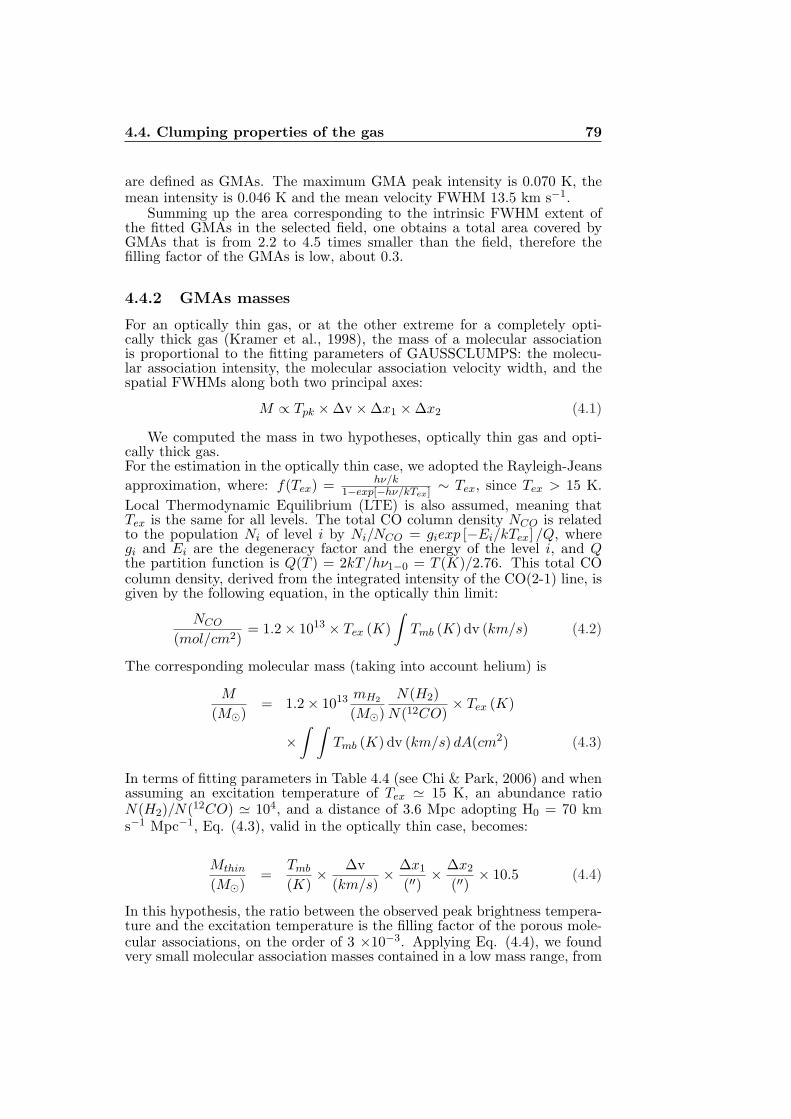
4.4. Clumping properties of the gas 79
are defined as GMAs. The maximum GMA peak intensity is 0.070 K, themean intensity is 0.046 K and the mean velocity FWHM 13.5 km s−1.
Summing up the area corresponding to the intrinsic FWHM extent ofthe fitted GMAs in the selected field, one obtains a total area covered byGMAs that is from 2.2 to 4.5 times smaller than the field, therefore thefilling factor of the GMAs is low, about 0.3.
4.4.2 GMAs masses
For an optically thin gas, or at the other extreme for a completely opti-cally thick gas (Kramer et al., 1998), the mass of a molecular associationis proportional to the fitting parameters of GAUSSCLUMPS: the molecu-lar association intensity, the molecular association velocity width, and thespatial FWHMs along both two principal axes:
M ∝ Tpk × ∆v × ∆x1 × ∆x2 (4.1)
We computed the mass in two hypotheses, optically thin gas and opti-cally thick gas.For the estimation in the optically thin case, we adopted the Rayleigh-Jeans
approximation, where: f(Tex) = hν/k1−exp[−hν/kTex] ∼ Tex, since Tex > 15 K.
Local Thermodynamic Equilibrium (LTE) is also assumed, meaning thatTex is the same for all levels. The total CO column density NCO is relatedto the population Ni of level i by Ni/NCO = giexp [−Ei/kTex] /Q, wheregi and Ei are the degeneracy factor and the energy of the level i, and Qthe partition function is Q(T ) = 2kT/hν1−0 = T (K)/2.76. This total COcolumn density, derived from the integrated intensity of the CO(2-1) line, isgiven by the following equation, in the optically thin limit:
NCO
(mol/cm2)= 1.2 × 10¹³ × Tex (K)
∫
Tmb (K) dv (km/s) (4.2)
The corresponding molecular mass (taking into account helium) is
M
(M⊙)= 1.2 × 10¹³ mH2
(M⊙)
N(H2)
N(12CO)× Tex (K)
×∫ ∫
Tmb (K) dv (km/s) dA(cm2) (4.3)
In terms of fitting parameters in Table 4.4 (see Chi & Park, 2006) and whenassuming an excitation temperature of Tex ≃ 15 K, an abundance ratioN(H2)/N(12CO) ≃ 104, and a distance of 3.6 Mpc adopting H0 = 70 kms−1 Mpc−1, Eq. (4.3), valid in the optically thin case, becomes:
Mthin
(M⊙)=
Tmb
(K)× ∆v
(km/s)× ∆x1
(′′)× ∆x2
(′′)× 10.5 (4.4)
In this hypothesis, the ratio between the observed peak brightness tempera-ture and the excitation temperature is the filling factor of the porous mole-cular associations, on the order of 3 ×10⁻³. Applying Eq. (4.4), we foundvery small molecular association masses contained in a low mass range, from
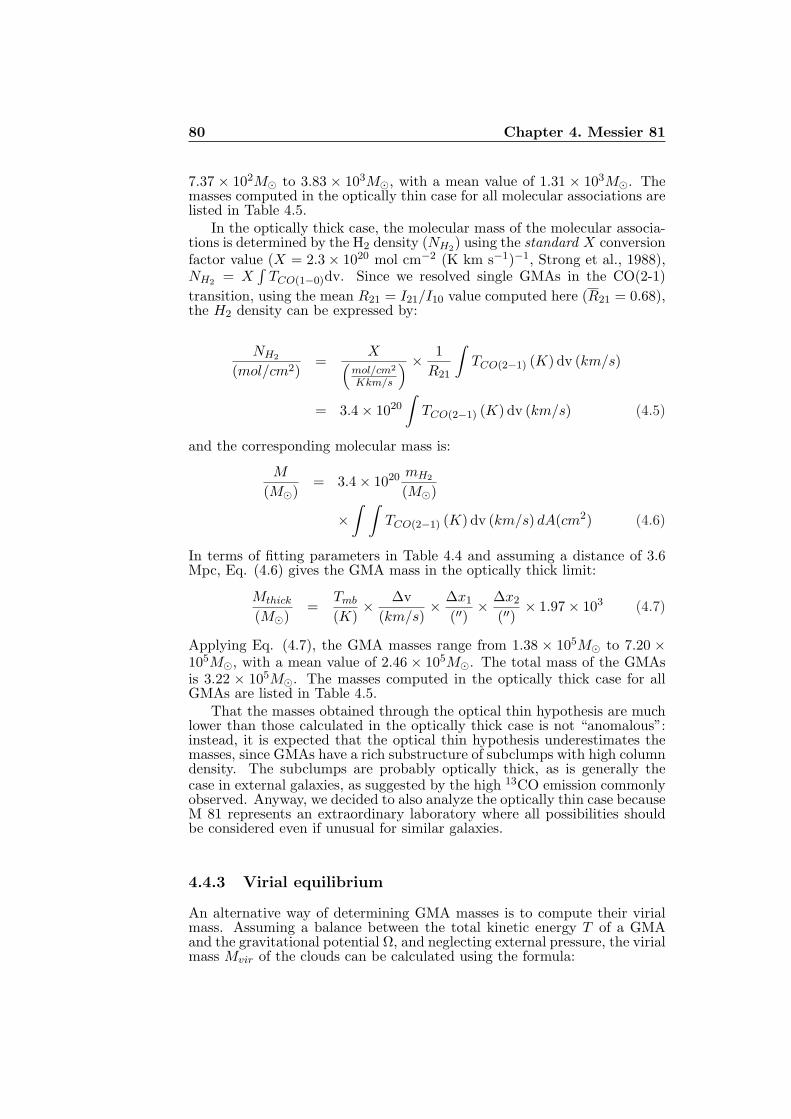
80 Chapter 4. Messier 81
7.37 × 10²M⊙ to 3.83 × 10³M⊙, with a mean value of 1.31 × 10³M⊙. Themasses computed in the optically thin case for all molecular associations arelisted in Table 4.5.
In the optically thick case, the molecular mass of the molecular associa-tions is determined by the H2 density (NH2
) using the standard X conversionfactor value (X = 2.3 × 10²⁰ mol cm−2 (K km s−1)−1, Strong et al., 1988),NH2
= X∫
TCO(1−0)dv. Since we resolved single GMAs in the CO(2-1)
transition, using the mean R21 = I21/I10 value computed here (R21 = 0.68),the H2 density can be expressed by:
NH2
(mol/cm2)=
X(
mol/cm2
Kkm/s
) × 1
R21
∫
TCO(2−1) (K) dv (km/s)
= 3.4 × 10²⁰
∫
TCO(2−1) (K) dv (km/s) (4.5)
and the corresponding molecular mass is:
M
(M⊙)= 3.4 × 10²⁰ mH2
(M⊙)
×∫ ∫
TCO(2−1) (K) dv (km/s) dA(cm2) (4.6)
In terms of fitting parameters in Table 4.4 and assuming a distance of 3.6Mpc, Eq. (4.6) gives the GMA mass in the optically thick limit:
Mthick
(M⊙)=
Tmb
(K)× ∆v
(km/s)× ∆x1
(′′)× ∆x2
(′′)× 1.97 × 10³ (4.7)
Applying Eq. (4.7), the GMA masses range from 1.38 × 10⁵M⊙ to 7.20 ×10⁵M⊙, with a mean value of 2.46 × 10⁵M⊙. The total mass of the GMAsis 3.22 × 10⁵M⊙. The masses computed in the optically thick case for allGMAs are listed in Table 4.5.
That the masses obtained through the optical thin hypothesis are muchlower than those calculated in the optically thick case is not “anomalous”:instead, it is expected that the optical thin hypothesis underestimates themasses, since GMAs have a rich substructure of subclumps with high columndensity. The subclumps are probably optically thick, as is generally thecase in external galaxies, as suggested by the high 13CO emission commonlyobserved. Anyway, we decided to also analyze the optically thin case becauseM 81 represents an extraordinary laboratory where all possibilities shouldbe considered even if unusual for similar galaxies.
4.4.3 Virial equilibrium
An alternative way of determining GMA masses is to compute their virialmass. Assuming a balance between the total kinetic energy T of a GMAand the gravitational potential Ω, and neglecting external pressure, the virialmass Mvir of the clouds can be calculated using the formula:
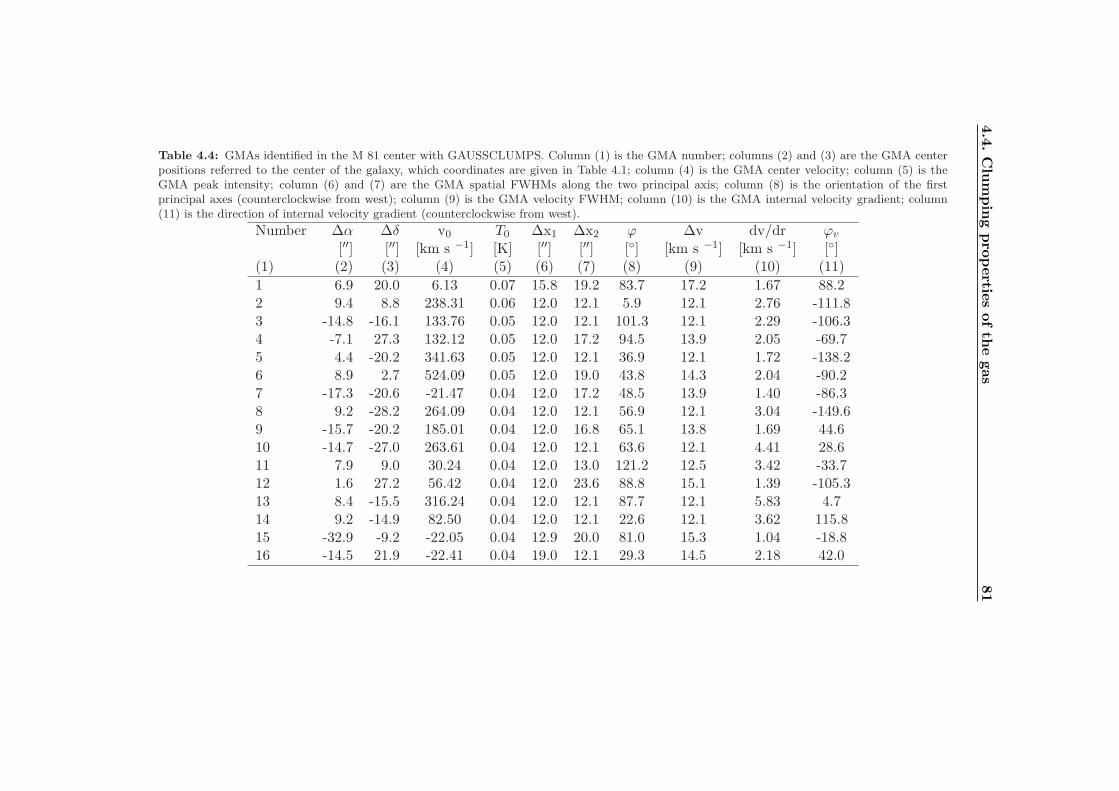
4.4
.C
lum
pin
gpropertie
softh
egas
81
Table 4.4: GMAs identified in the M 81 center with GAUSSCLUMPS. Column (1) is the GMA number; columns (2) and (3) are the GMA centerpositions referred to the center of the galaxy, which coordinates are given in Table 4.1; column (4) is the GMA center velocity; column (5) is theGMA peak intensity; column (6) and (7) are the GMA spatial FWHMs along the two principal axis; column (8) is the orientation of the firstprincipal axes (counterclockwise from west); column (9) is the GMA velocity FWHM; column (10) is the GMA internal velocity gradient; column(11) is the direction of internal velocity gradient (counterclockwise from west).
Number ∆α ∆δ v0 T0 ∆x1 ∆x2 ϕ ∆v dv/dr ϕv
[′′] [′′] [km s −1] [K] [′′] [′′] [] [km s −1] [km s −1] [](1) (2) (3) (4) (5) (6) (7) (8) (9) (10) (11)
1 6.9 20.0 6.13 0.07 15.8 19.2 83.7 17.2 1.67 88.22 9.4 8.8 238.31 0.06 12.0 12.1 5.9 12.1 2.76 -111.83 -14.8 -16.1 133.76 0.05 12.0 12.1 101.3 12.1 2.29 -106.34 -7.1 27.3 132.12 0.05 12.0 17.2 94.5 13.9 2.05 -69.75 4.4 -20.2 341.63 0.05 12.0 12.1 36.9 12.1 1.72 -138.26 8.9 2.7 524.09 0.05 12.0 19.0 43.8 14.3 2.04 -90.27 -17.3 -20.6 -21.47 0.04 12.0 17.2 48.5 13.9 1.40 -86.38 9.2 -28.2 264.09 0.04 12.0 12.1 56.9 12.1 3.04 -149.69 -15.7 -20.2 185.01 0.04 12.0 16.8 65.1 13.8 1.69 44.610 -14.7 -27.0 263.61 0.04 12.0 12.1 63.6 12.1 4.41 28.611 7.9 9.0 30.24 0.04 12.0 13.0 121.2 12.5 3.42 -33.712 1.6 27.2 56.42 0.04 12.0 23.6 88.8 15.1 1.39 -105.313 8.4 -15.5 316.24 0.04 12.0 12.1 87.7 12.1 5.83 4.714 9.2 -14.9 82.50 0.04 12.0 12.1 22.6 12.1 3.62 115.815 -32.9 -9.2 -22.05 0.04 12.9 20.0 81.0 15.3 1.04 -18.816 -14.5 21.9 -22.41 0.04 19.0 12.1 29.3 14.5 2.18 42.0
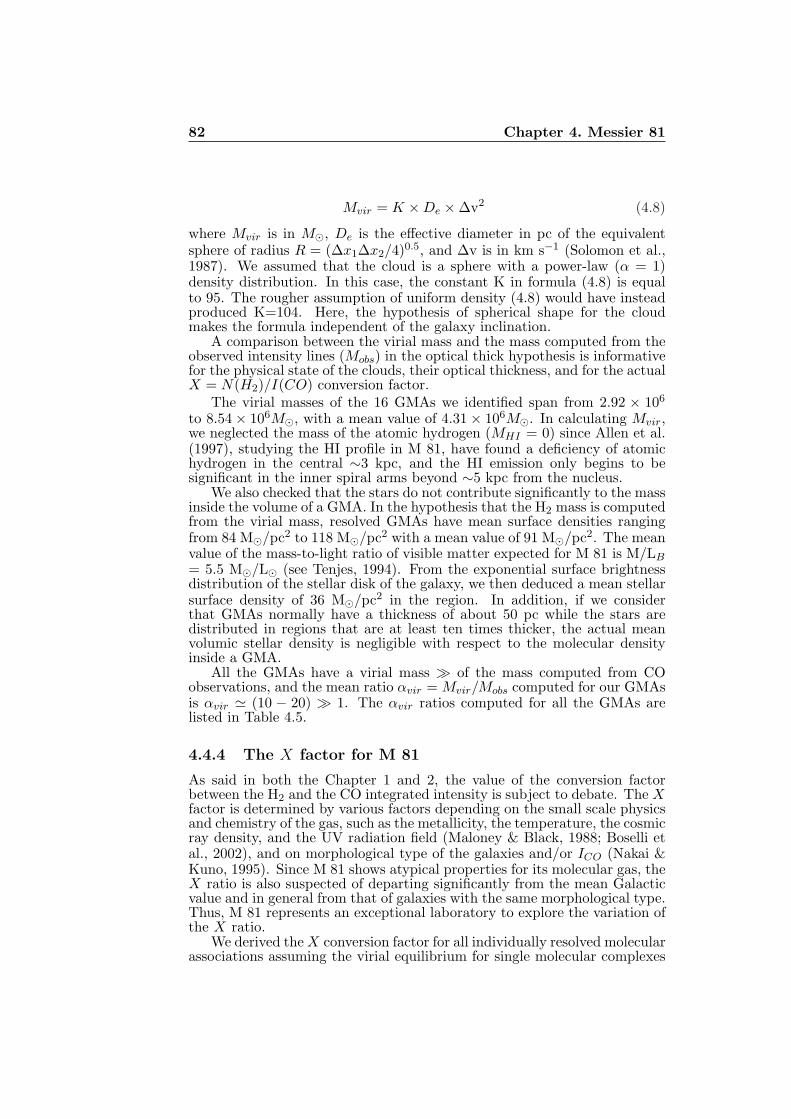
82 Chapter 4. Messier 81
Mvir = K × De × ∆v2 (4.8)
where Mvir is in M⊙, De is the effective diameter in pc of the equivalentsphere of radius R = (∆x1∆x2/4)0.5, and ∆v is in km s−1 (Solomon et al.,1987). We assumed that the cloud is a sphere with a power-law (α = 1)density distribution. In this case, the constant K in formula (4.8) is equalto 95. The rougher assumption of uniform density (4.8) would have insteadproduced K=104. Here, the hypothesis of spherical shape for the cloudmakes the formula independent of the galaxy inclination.
A comparison between the virial mass and the mass computed from theobserved intensity lines (Mobs) in the optical thick hypothesis is informativefor the physical state of the clouds, their optical thickness, and for the actualX = N(H2)/I(CO) conversion factor.
The virial masses of the 16 GMAs we identified span from 2.92 × 10⁶
to 8.54 × 10⁶M⊙, with a mean value of 4.31 × 10⁶M⊙. In calculating Mvir,we neglected the mass of the atomic hydrogen (MHI = 0) since Allen et al.(1997), studying the HI profile in M 81, have found a deficiency of atomichydrogen in the central ∼3 kpc, and the HI emission only begins to besignificant in the inner spiral arms beyond ∼5 kpc from the nucleus.
We also checked that the stars do not contribute significantly to the massinside the volume of a GMA. In the hypothesis that the H2 mass is computedfrom the virial mass, resolved GMAs have mean surface densities rangingfrom 84 M⊙/pc2 to 118 M⊙/pc2 with a mean value of 91 M⊙/pc2. The meanvalue of the mass-to-light ratio of visible matter expected for M 81 is M/LB
= 5.5 M⊙/L⊙ (see Tenjes, 1994). From the exponential surface brightnessdistribution of the stellar disk of the galaxy, we then deduced a mean stellarsurface density of 36 M⊙/pc2 in the region. In addition, if we considerthat GMAs normally have a thickness of about 50 pc while the stars aredistributed in regions that are at least ten times thicker, the actual meanvolumic stellar density is negligible with respect to the molecular densityinside a GMA.
All the GMAs have a virial mass ≫ of the mass computed from COobservations, and the mean ratio αvir = Mvir/Mobs computed for our GMAsis αvir ≃ (10 − 20) ≫ 1. The αvir ratios computed for all the GMAs arelisted in Table 4.5.
4.4.4 The X factor for M 81
As said in both the Chapter 1 and 2, the value of the conversion factorbetween the H2 and the CO integrated intensity is subject to debate. The Xfactor is determined by various factors depending on the small scale physicsand chemistry of the gas, such as the metallicity, the temperature, the cosmicray density, and the UV radiation field (Maloney & Black, 1988; Boselli etal., 2002), and on morphological type of the galaxies and/or ICO (Nakai &Kuno, 1995). Since M 81 shows atypical properties for its molecular gas, theX ratio is also suspected of departing significantly from the mean Galacticvalue and in general from that of galaxies with the same morphological type.Thus, M 81 represents an exceptional laboratory to explore the variation ofthe X ratio.
We derived the X conversion factor for all individually resolved molecularassociations assuming the virial equilibrium for single molecular complexes
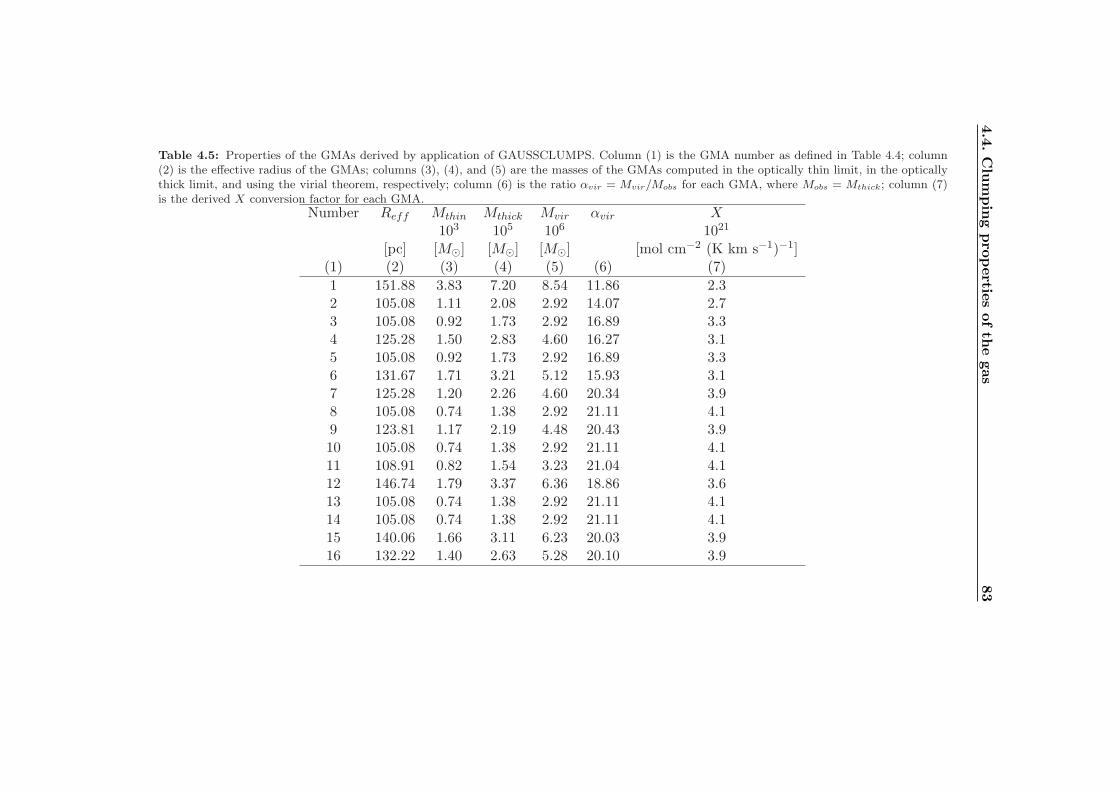
4.4
.C
lum
pin
gpropertie
softh
egas
83
Table 4.5: Properties of the GMAs derived by application of GAUSSCLUMPS. Column (1) is the GMA number as defined in Table 4.4; column(2) is the effective radius of the GMAs; columns (3), (4), and (5) are the masses of the GMAs computed in the optically thin limit, in the opticallythick limit, and using the virial theorem, respectively; column (6) is the ratio αvir = Mvir/Mobs for each GMA, where Mobs = Mthick; column (7)is the derived X conversion factor for each GMA.
Number Reff Mthin Mthick Mvir αvir X103 105 106 1021
[pc] [M⊙] [M⊙] [M⊙] [mol cm−2 (K km s−1)−1](1) (2) (3) (4) (5) (6) (7)
1 151.88 3.83 7.20 8.54 11.86 2.32 105.08 1.11 2.08 2.92 14.07 2.73 105.08 0.92 1.73 2.92 16.89 3.34 125.28 1.50 2.83 4.60 16.27 3.15 105.08 0.92 1.73 2.92 16.89 3.36 131.67 1.71 3.21 5.12 15.93 3.17 125.28 1.20 2.26 4.60 20.34 3.98 105.08 0.74 1.38 2.92 21.11 4.19 123.81 1.17 2.19 4.48 20.43 3.910 105.08 0.74 1.38 2.92 21.11 4.111 108.91 0.82 1.54 3.23 21.04 4.112 146.74 1.79 3.37 6.36 18.86 3.613 105.08 0.74 1.38 2.92 21.11 4.114 105.08 0.74 1.38 2.92 21.11 4.115 140.06 1.66 3.11 6.23 20.03 3.916 132.22 1.40 2.63 5.28 20.10 3.9
84 Chapter 4. Messier 81
and using the large velocity gradient (LVG) approximation for the formationof the CO line (Sanders et al., 1984; Young & Scoville, 1984). This methodhas also been used to derive the conversion factor in nearby spiral galaxiessuch as M 31, M 33, and the Magellanic Clouds (Wilson & Scoville, 1990,1992; Arimoto et al., 1996).
In practice, we computed the X ratio (X = N(H2)/ICO) deriving the H2
density from the virial masses (N(H2) = Mvir/(mH2× dA), where mH2
isthe mass of the hydrogen molecule and dA the area occupied by the cloud),and ICO is the CO observed intensity. For the individually resolved GMAsof M 81, assumed virialized, we found that the X conversion factor takesa much higher value than the mean Galactic value for all clouds, rangingfrom ∼10 to ∼18 times higher than the standard X and a mean value ofX = 3.6 × 10²¹ mol cm−2 (K km s−1)−1. The X conversion factor valuescomputed for all the GMAs are listed in Table 4.5.
Our X factor values are high, not only if compared to the standardGalactic factor, but also with respect to values found in other nearby gal-axies where the X ratio has been obtained with the same method we used.Studying a sample of nearby spiral and dwarf irregular galaxies, Arimotoet al. (1996) have derived X values using CO data found in the literatureand computed the corresponding virial mass. They have found galaxieswith both X values lower and higher than in the Galaxy, such as M 31 withX = 1.8×10²⁰ mol cm−2 (K km s−1)−1, M 33 with X = 4.1×10²⁰ mol cm−2
(K km s−1)−1, and IC 10 where X = 6.6 × 10²⁰ mol cm−2 (K km s−1)−1.Even if they have found high X values, these H2-to-CO conversion factorsare smaller than our X ratios obtained for M 81. Arimoto et al. (1996) havefound a X ratio (=3.1 × 10²¹ mol cm−2 (K km s−1)−1) only for the SMCwithin the same order of magnitude of M 81. They have specified that thisvalue has been obtained by considering virial masses and CO luminositiesfor larger-scale complexes in the SMC and that this high X would be dueto a smaller amount of CO in a diffuse medium that is metal dependent, aswell as photo-dissociated by the strong UV field, and can be present only indense molecular clouds.
4.5 Comparison with previous works
Our molecular gas detections in the center of M 81 agree with the onlytwo works present in the literature that report CO emission in the nuclearregion of this galaxy (Sage & Westpfahl, 1991; Sakamoto et al., 2001). Incomparison with the GMCs in the outer regions of M 81 (Taylor & Wilson,1998; Brouillet et al., 1998), the CO emission that we detected in the M 81center is particularly cold and unusual. The masses we found for GMAs inthe CO(2-1) map are similar to the higher masses observed in M 33 (Wilson& Scoville, 1990), and higher than what is measured in the SMC (Rubio etal., 1993; Bot et al., 2007).
Our first result is that the nuclear region of M 81 (within ∼300 pc)appears devoid of CO emission, in agreement with Brouillet et al. (1988)and Sakamoto et al. (2001). However, we detected CO emission outside the300 pc radius. This supports the claims of Sage & Westpfahl (1991) who,found CO emission when observing one offset towards the center galaxywith the NRAO 12m telescope and a beam of 55′′ (see Fig. 1 of Sage &Westpfahl, 1991, here shown in Fig. 4.12). There is a good correspondence
4.5. Comparison with previous works 85
Figure 4.12: The reduced 12CO spectra for the offset (0,0) in M 81 galaxy observedwith the NRAO 12m telescope by Sage & Westpfahl (1991). The assumed center positionis R.A.(1950) = 09h 51m 27.5s, DEC(1950) = 69 18′ 10′′. The abscissa shows velocitywith respect to the local standard of rest and the ordinate shows antenna temperaturecorrected for atmospheric absorption and antenna losses.
between our velocity profile and theirs.A more useful and interesting comparison can be done between our re-
sults and those of Sakamoto et al. (2001). In detail, the “pseudoring” thatwe detected at ∼ 460 pc from the nucleus in the northeast direction (Fig.4.7) corresponds to the maximum intensity of Sakamoto et al. (2001). Ob-serving the central kiloparsec with the Nobeyama Millimetric Array-NMA(resolution of 6.9 ′′× 5.8 ′′ that corresponds to ∼ 120×100 pc at the distanceof M 81), they have produced maps only for the 12CO(1-0) line. Since theyhave made interferometric measurements, with an FWHM primary beam of1′ and a beam of ∼ 7′′, extended emission seen with the 22′′ IRAM CO(1-0)beam is filtered out.
In spite of this, the total mass of molecular gas that we found, assumingthe same standard X factor value of Strong et al. (1988), is quite comparableto that of Sakamoto et al. (2001): our resolved GMAs in CO(2-1) emissionhave a total mass of 3.22× 10⁶M⊙, only a little bit lower than ∼ 1 ×10⁷M⊙
found by Sakamoto et al. (2001) for the “pseudoring” in CO(1-0) emission.In addition to the result of Sakamoto et al. (2001), who have found themolecular gas mainly located in a lopsided distribution in the northeastdirection (see Fig. 2 by Sakamoto et al. (2001), here shown in Fig. 4.13), wealso detected some emission towards the southwest. Our peak temperaturesfor the 12CO(1-0) line are very low, ranging from ∼15 to ∼64 mK, lowerthan the average peak brightness temperature (∼0.3 K) of each GMA foundby Sakamoto et al. (2001). This is compatible with the different beam sizes,
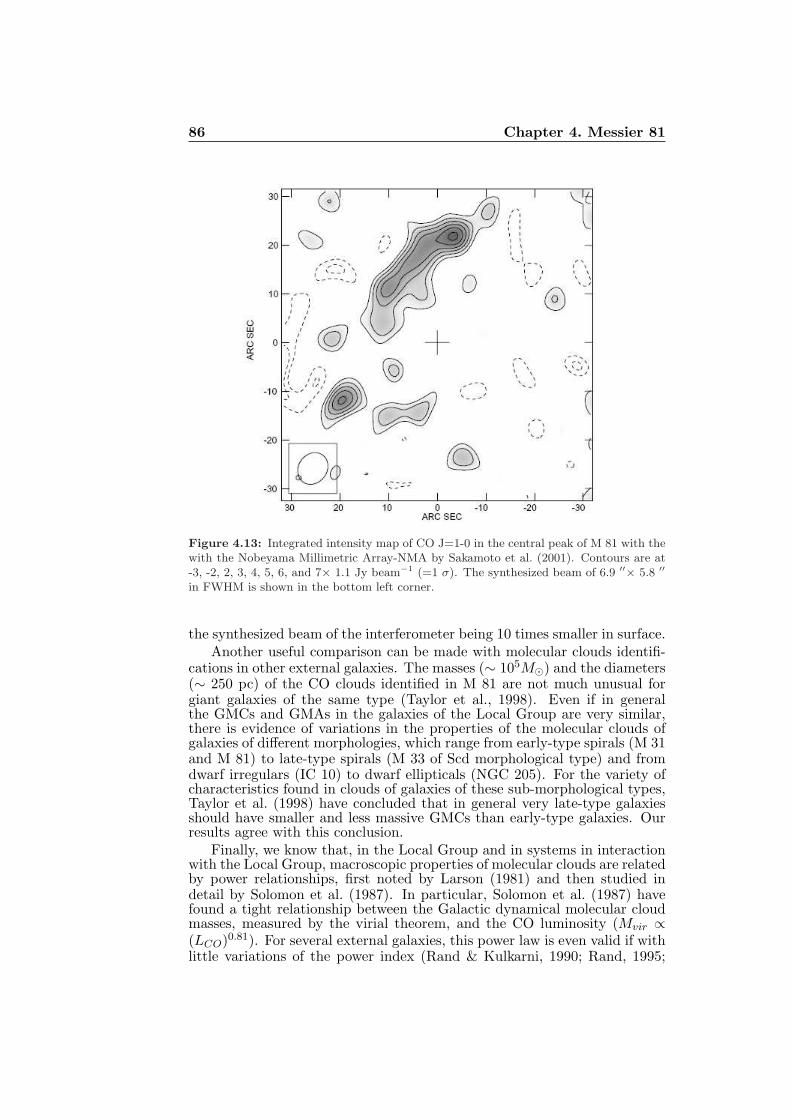
86 Chapter 4. Messier 81
Figure 4.13: Integrated intensity map of CO J=1-0 in the central peak of M 81 with thewith the Nobeyama Millimetric Array-NMA by Sakamoto et al. (2001). Contours are at-3, -2, 2, 3, 4, 5, 6, and 7× 1.1 Jy beam−1 (=1 σ). The synthesized beam of 6.9 ′′
× 5.8 ′′
in FWHM is shown in the bottom left corner.
the synthesized beam of the interferometer being 10 times smaller in surface.Another useful comparison can be made with molecular clouds identifi-
cations in other external galaxies. The masses (∼ 105M⊙) and the diameters(∼ 250 pc) of the CO clouds identified in M 81 are not much unusual forgiant galaxies of the same type (Taylor et al., 1998). Even if in generalthe GMCs and GMAs in the galaxies of the Local Group are very similar,there is evidence of variations in the properties of the molecular clouds ofgalaxies of different morphologies, which range from early-type spirals (M 31and M 81) to late-type spirals (M 33 of Scd morphological type) and fromdwarf irregulars (IC 10) to dwarf ellipticals (NGC 205). For the variety ofcharacteristics found in clouds of galaxies of these sub-morphological types,Taylor et al. (1998) have concluded that in general very late-type galaxiesshould have smaller and less massive GMCs than early-type galaxies. Ourresults agree with this conclusion.
Finally, we know that, in the Local Group and in systems in interactionwith the Local Group, macroscopic properties of molecular clouds are relatedby power relationships, first noted by Larson (1981) and then studied indetail by Solomon et al. (1987). In particular, Solomon et al. (1987) havefound a tight relationship between the Galactic dynamical molecular cloudmasses, measured by the virial theorem, and the CO luminosity (Mvir ∝(LCO)0.81). For several external galaxies, this power law is even valid if withlittle variations of the power index (Rand & Kulkarni, 1990; Rand, 1995;
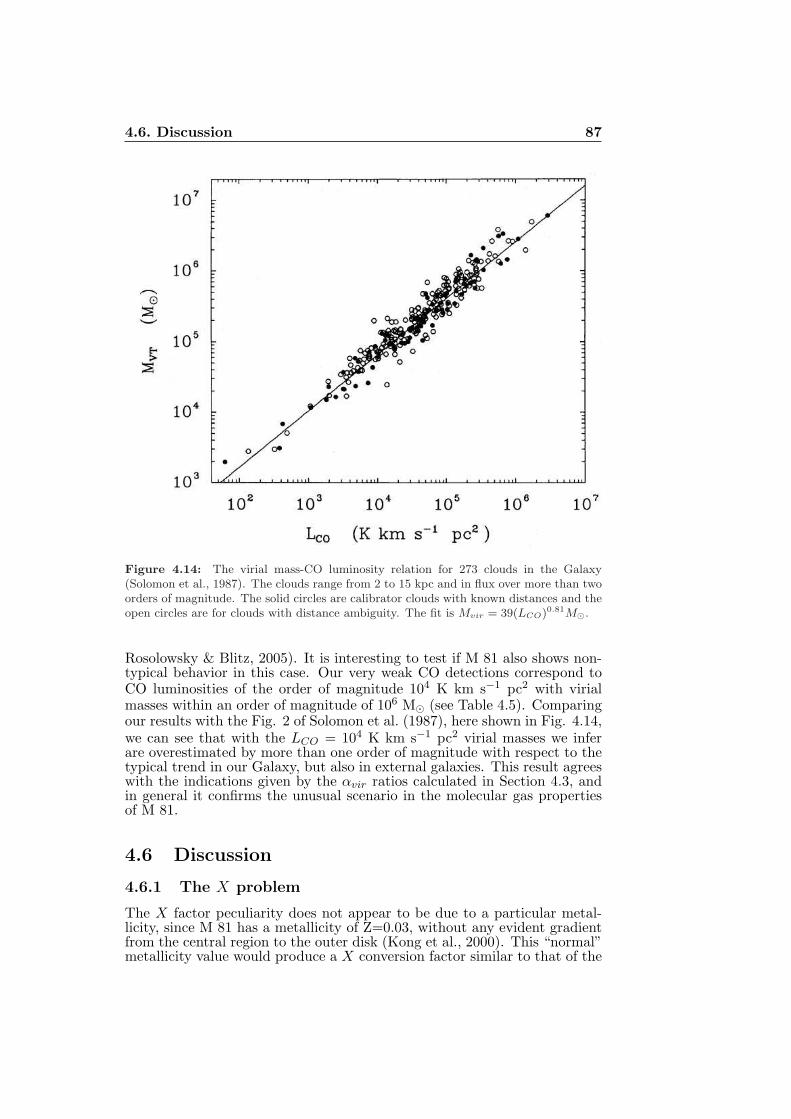
4.6. Discussion 87
Figure 4.14: The virial mass-CO luminosity relation for 273 clouds in the Galaxy(Solomon et al., 1987). The clouds range from 2 to 15 kpc and in flux over more than twoorders of magnitude. The solid circles are calibrator clouds with known distances and theopen circles are for clouds with distance ambiguity. The fit is Mvir = 39(LCO)0.81M⊙.
Rosolowsky & Blitz, 2005). It is interesting to test if M 81 also shows non-typical behavior in this case. Our very weak CO detections correspond toCO luminosities of the order of magnitude 104 K km s−1 pc2 with virialmasses within an order of magnitude of 106 M⊙ (see Table 4.5). Comparingour results with the Fig. 2 of Solomon et al. (1987), here shown in Fig. 4.14,we can see that with the LCO = 104 K km s−1 pc2 virial masses we inferare overestimated by more than one order of magnitude with respect to thetypical trend in our Galaxy, but also in external galaxies. This result agreeswith the indications given by the αvir ratios calculated in Section 4.3, andin general it confirms the unusual scenario in the molecular gas propertiesof M 81.
4.6 Discussion
4.6.1 The X problem
The X factor peculiarity does not appear to be due to a particular metal-licity, since M 81 has a metallicity of Z=0.03, without any evident gradientfrom the central region to the outer disk (Kong et al., 2000). This “normal”metallicity value would produce a X conversion factor similar to that of the
88 Chapter 4. Messier 81
Milky Way. Some regions in M 81, however, have higher metallicity andare mostly located in the spiral arms and HII regions. But in general, ourestimate of the X factor appears significantly high.
A possible source of error may be the assumption of a fully virial equi-librium for the observed clouds. Under this hypothesis, we calculated the Xfactor using X = Mvir/LCO, where the Mvir has been computed with Eq.(4.8), and LCO is the CO luminosity derived from our observations. Theapplication of the virial theorem to complex molecular structures may notbe completely appropriate, even if the expected deviation cannot be higherthan a factor ∼2. However, if the GMAs are not virialized and the standardX factor is applied, the molecular content of M 81 would be exceptionallylow, so M 81 would be peculiar in both cases.
4.6.2 Heating of the gas
The reason for the non-typical results on the molecular gas in M 81 isprobably the exceptionally low CO excitation temperature that seems tocharacterize the center of this galaxy. Why is the molecular gas absent orsubthermally excited in the M 81 center?
A possible link could exist between low CO emission and the lack ofultraviolet emission that appears to characterize the M 81 central region.The ultraviolet image of M 81 realized with the satellite Galaxy EvolutionExplorer (GALEX ) clearly shows a lack of recent star formation, traced bythe UV emission, in the nuclear region that we observed in CO (see Fig.4.4).
The existence of a link between molecular gas and far-ultraviolet (FUV)emission can be justified considering that the interstellar medium is excited,dissociated, and ionized by the FUV photons produced by young O andB stars. Atomic gas in the ISM recombines into molecular form mainlythrough the catalytic action of dust grain surfaces. Hydrogen nuclei cyclerepeatedly from the molecular (H2) to the atomic phase and back again atrates that depend on the incident FUV flux, the total volume density of thegas, and the dust-to-gas ratio. The action of the FUV flux that interactswith the surface of the molecular clouds can strongly affect their physicsand chemistry by heating, dissociating, and exciting the gas.
In regions of the ISM where the physics is dominated by FUV photons -called photodissociation regions (PDRs)- useful information can be obtainedon the physical state of the gas from observations of the spectral lines emittedby the excited atoms and molecules in those regions.
In M 81 the possibility that low CO emission and weak FUV flux arecorrelated has already been proposed by Knapen et al. (2006). When ob-serving a region of the western spiral arm in M 81, they have explained thelack of or very weak CO(1-0) emission, observed far from FUV sources, asa consequence of insufficient heating and excitation of the molecular gas.Usually, a lack in the CO emission is instead interpreted as due to the ab-sence of measurable quantities of molecular gas or due to a low density gasnot heated sufficiently to detect it. The limit of this interpretation, basedon the linear proportionality between the CO surface brightness and the col-umn density of the molecular hydrogen, is to neglect effects linked to localheating mechanisms. If the explanation of Knapen et al. (2006) is correct,the flux of cosmic rays and the FUV surface brightness would be too lowto heat the ISM, and in particular, the molecular component. It is possiblethat this correlation of low-FUV/low-CO is also applicable to the centralregion that we observed.
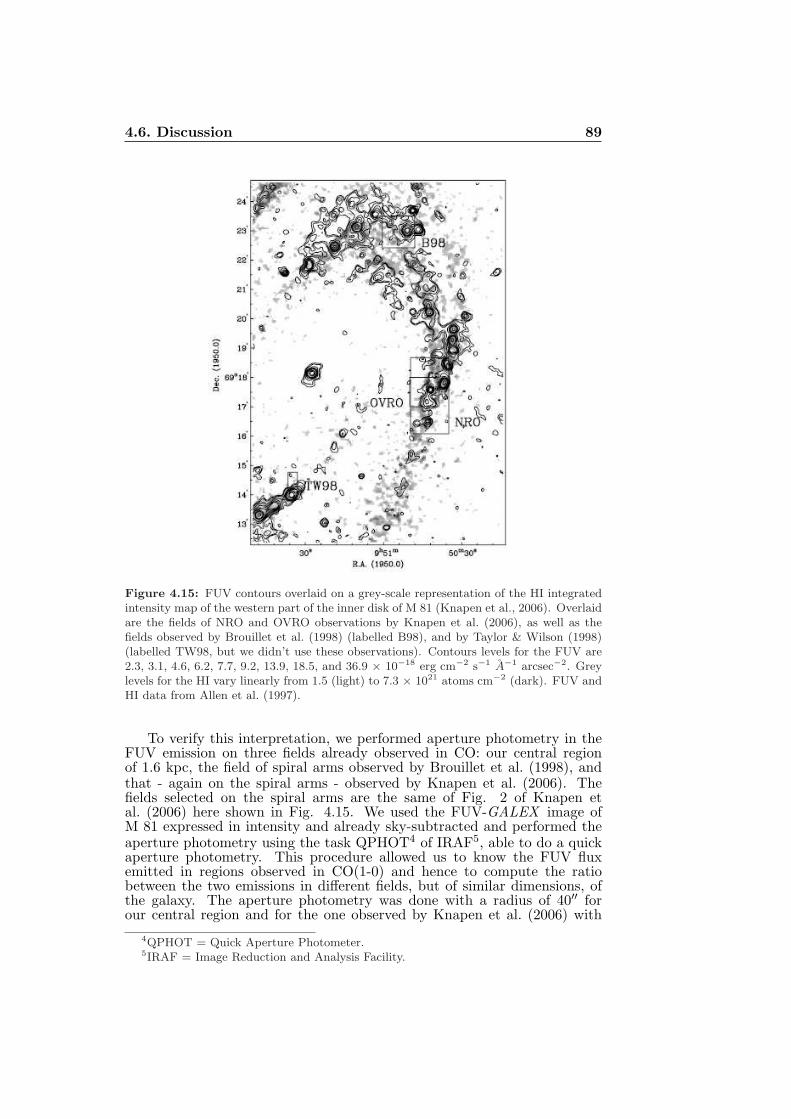
4.6. Discussion 89
Figure 4.15: FUV contours overlaid on a grey-scale representation of the HI integratedintensity map of the western part of the inner disk of M 81 (Knapen et al., 2006). Overlaidare the fields of NRO and OVRO observations by Knapen et al. (2006), as well as thefields observed by Brouillet et al. (1998) (labelled B98), and by Taylor & Wilson (1998)(labelled TW98, but we didn’t use these observations). Contours levels for the FUV are2.3, 3.1, 4.6, 6.2, 7.7, 9.2, 13.9, 18.5, and 36.9 × 10⁻¹⁸ erg cm−2 s−1 A−1 arcsec−2. Greylevels for the HI vary linearly from 1.5 (light) to 7.3 × 10²¹ atoms cm−2 (dark). FUV andHI data from Allen et al. (1997).
To verify this interpretation, we performed aperture photometry in theFUV emission on three fields already observed in CO: our central regionof 1.6 kpc, the field of spiral arms observed by Brouillet et al. (1998), andthat - again on the spiral arms - observed by Knapen et al. (2006). Thefields selected on the spiral arms are the same of Fig. 2 of Knapen etal. (2006) here shown in Fig. 4.15. We used the FUV-GALEX image ofM 81 expressed in intensity and already sky-subtracted and performed theaperture photometry using the task QPHOT4 of IRAF5, able to do a quickaperture photometry. This procedure allowed us to know the FUV fluxemitted in regions observed in CO(1-0) and hence to compute the ratiobetween the two emissions in different fields, but of similar dimensions, ofthe galaxy. The aperture photometry was done with a radius of 40′′ forour central region and for the one observed by Knapen et al. (2006) with
4QPHOT = Quick Aperture Photometer.5IRAF = Image Reduction and Analysis Facility.
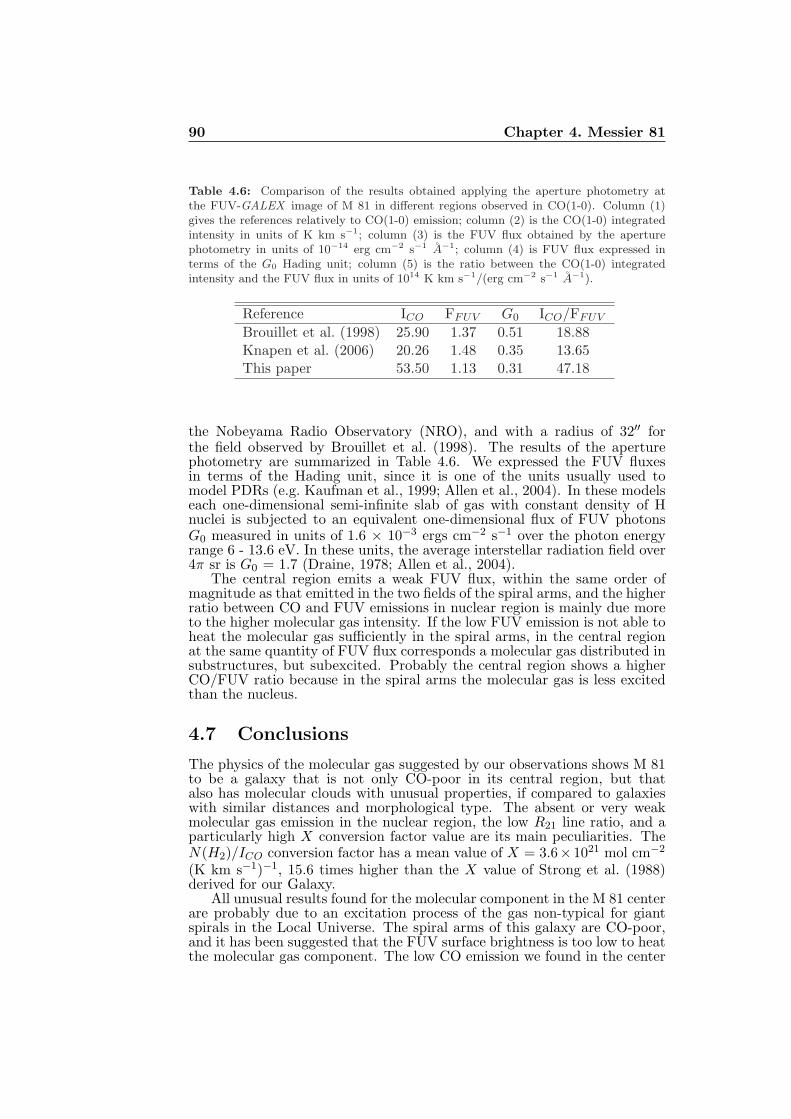
90 Chapter 4. Messier 81
Table 4.6: Comparison of the results obtained applying the aperture photometry atthe FUV-GALEX image of M 81 in different regions observed in CO(1-0). Column (1)gives the references relatively to CO(1-0) emission; column (2) is the CO(1-0) integratedintensity in units of K km s−1; column (3) is the FUV flux obtained by the aperturephotometry in units of 10−14 erg cm−2 s−1 A−1; column (4) is FUV flux expressed interms of the G0 Hading unit; column (5) is the ratio between the CO(1-0) integratedintensity and the FUV flux in units of 1014 K km s−1/(erg cm−2 s−1 A−1).
Reference ICO FFUV G0 ICO/FFUV
Brouillet et al. (1998) 25.90 1.37 0.51 18.88Knapen et al. (2006) 20.26 1.48 0.35 13.65This paper 53.50 1.13 0.31 47.18
the Nobeyama Radio Observatory (NRO), and with a radius of 32′′ forthe field observed by Brouillet et al. (1998). The results of the aperturephotometry are summarized in Table 4.6. We expressed the FUV fluxesin terms of the Hading unit, since it is one of the units usually used tomodel PDRs (e.g. Kaufman et al., 1999; Allen et al., 2004). In these modelseach one-dimensional semi-infinite slab of gas with constant density of Hnuclei is subjected to an equivalent one-dimensional flux of FUV photonsG0 measured in units of 1.6 × 10⁻³ ergs cm−2 s−1 over the photon energyrange 6 - 13.6 eV. In these units, the average interstellar radiation field over4π sr is G0 = 1.7 (Draine, 1978; Allen et al., 2004).
The central region emits a weak FUV flux, within the same order ofmagnitude as that emitted in the two fields of the spiral arms, and the higherratio between CO and FUV emissions in nuclear region is mainly due moreto the higher molecular gas intensity. If the low FUV emission is not able toheat the molecular gas sufficiently in the spiral arms, in the central regionat the same quantity of FUV flux corresponds a molecular gas distributed insubstructures, but subexcited. Probably the central region shows a higherCO/FUV ratio because in the spiral arms the molecular gas is less excitedthan the nucleus.
4.7 Conclusions
The physics of the molecular gas suggested by our observations shows M 81to be a galaxy that is not only CO-poor in its central region, but thatalso has molecular clouds with unusual properties, if compared to galaxieswith similar distances and morphological type. The absent or very weakmolecular gas emission in the nuclear region, the low R21 line ratio, and aparticularly high X conversion factor value are its main peculiarities. TheN(H2)/ICO conversion factor has a mean value of X = 3.6× 10²¹ mol cm−2
(K km s−1)−1, 15.6 times higher than the X value of Strong et al. (1988)derived for our Galaxy.
All unusual results found for the molecular component in the M 81 centerare probably due to an excitation process of the gas non-typical for giantspirals in the Local Universe. The spiral arms of this galaxy are CO-poor,and it has been suggested that the FUV surface brightness is too low to heatthe molecular gas component. The low CO emission we found in the center
4.8. Future perspectives 91
suggests that the gas in the nucleus is also subexcited, with even weakerFUV emission. We concluded that the lack of excitation of the gas, morethan the absence of molecular gas, is the cause of the low CO emission there.
4.8 Future perspectives
We are yet interested to explore the CO emission found for the nuclear re-gion of M 81 to understand the reason of this atypical result. To analyzethis aspect more in detail, a higher (for instance interferometric) resolu-tion study is needed. Since the excitation of the molecular gas could beperturbed by the low-luminosity AGN, we would map a region relativelyfar from the center, within the central 1 kpc. To this aim we will plan toobserve the region found with IRAM 30 m observations having the majoremission, that is in the NE direction far from the nucleus (see Fig. 4.9).With interferometric observations, thanks to a better resolution, we couldresolve the substructures of the GMAs already detected and verify if forthese structures the condition of the virial equilibrium is valid, and in thiscase recompute the X ratio. In the literature there are other interferometricstudies of M 81, all without an explanation to the problem of the low mole-cular gas emission, especially for the nuclear area (Sakamoto et al., 2001;Knapen et al., 2006). New interferomeric observations could be comparedto other interferometric maps of both galaxies with “normal” behaviour inthe gas molecular physics (such as M 51) and with weak CO emission (suchas M 31) in order to understand where and why the physical conditions ofthe molecular gas in M 81 are different.
In addition to the “classical” CO transitions, other ones are very usefulto go deeper on the nature of the gas in M 81 central region. The high Xratio that we found can be explained as due not only to very low excitationor very low temperature of the gas. We can suspect that there is a largerthan usual clumpiness factor, where small dense clumps, optically thick inCO are spatially diluted in the CO beam. In this last scenario, it is possiblethat the gas locally collapses, to a much clumpier state than normal ISMconditions, generating regions with higher density than those usually tracedby CO. In that case, the true molecular content will be overlooked. Since theCO molecule is not sufficient to study in detail the physics of the moleculargas, it is necessary to explore dense molecular tracers, such as HCN. We alsowould like to explore the optical thickness in mapping the isotopic molecule13CO.
Alternatively, the molecular content might be a strong function of theexternal pressure (Pext), which favors fragmentation of dense clumps, asproposed recently by Blitz & Rosolowsky (2006). However, the externalpressure in the center of M 81 is rather high, and the molecular to atomicratio in this region does not fit in the general correlation involving Pext (seeFig. 4.16). The pressure is essentially depending on the HI gas and on thesurface density of the stars, which is comparable to the values of the centerof the Milky Way. Pext can be estimated Pext/k ∼ 104-105 cm−3 K, andso M 81, also considering this aspect, shows an atypical behaviour in thisdiagram. Observations of HCN and 13CO can bring essential argumentsin this interpretation, determining the true molecular surface density, andtherefore the true pressure.
Then, the HCN molecule has been shown to be linearly correlated to theFIR emission, since the dense cores are the most relevant for star formation,while the more diffuse CO is a non-linear tracer (Gao & Solomon, 2004b).
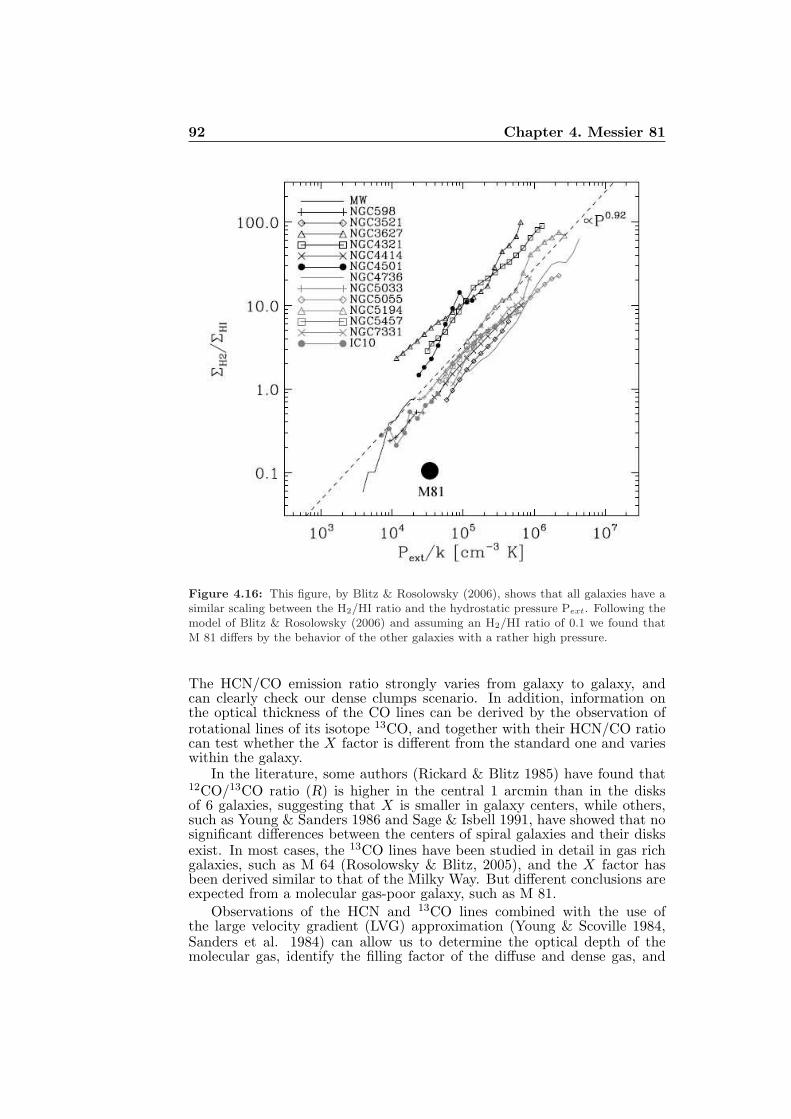
92 Chapter 4. Messier 81
Figure 4.16: This figure, by Blitz & Rosolowsky (2006), shows that all galaxies have asimilar scaling between the H2/HI ratio and the hydrostatic pressure Pext. Following themodel of Blitz & Rosolowsky (2006) and assuming an H2/HI ratio of 0.1 we found thatM 81 differs by the behavior of the other galaxies with a rather high pressure.
The HCN/CO emission ratio strongly varies from galaxy to galaxy, andcan clearly check our dense clumps scenario. In addition, information onthe optical thickness of the CO lines can be derived by the observation ofrotational lines of its isotope 13CO, and together with their HCN/CO ratiocan test whether the X factor is different from the standard one and varieswithin the galaxy.
In the literature, some authors (Rickard & Blitz 1985) have found that12CO/13CO ratio (R) is higher in the central 1 arcmin than in the disksof 6 galaxies, suggesting that X is smaller in galaxy centers, while others,such as Young & Sanders 1986 and Sage & Isbell 1991, have showed that nosignificant differences between the centers of spiral galaxies and their disksexist. In most cases, the 13CO lines have been studied in detail in gas richgalaxies, such as M 64 (Rosolowsky & Blitz, 2005), and the X factor hasbeen derived similar to that of the Milky Way. But different conclusions areexpected from a molecular gas-poor galaxy, such as M 81.
Observations of the HCN and 13CO lines combined with the use ofthe large velocity gradient (LVG) approximation (Young & Scoville 1984,Sanders et al. 1984) can allow us to determine the optical depth of themolecular gas, identify the filling factor of the diffuse and dense gas, and
4.8. Future perspectives 93
derive the fraction of the molecules at high density, to derive its clumpiness.We could be able to test the various possibilities: either a low pressure of theISM prevents the formation of dense clouds, or on the contrary, the collapseof the molecular gas in small and dense clumps have led us to underestimatethe H2 content, from the CO emission only.
This dense gas study, together with the high resolution CO emissionabove described, can help us to understand the physical origin of the atyp-ical low CO emission and the consequent high X = N(H2/ICO) conversionfactor, much higher that the Galactic value.

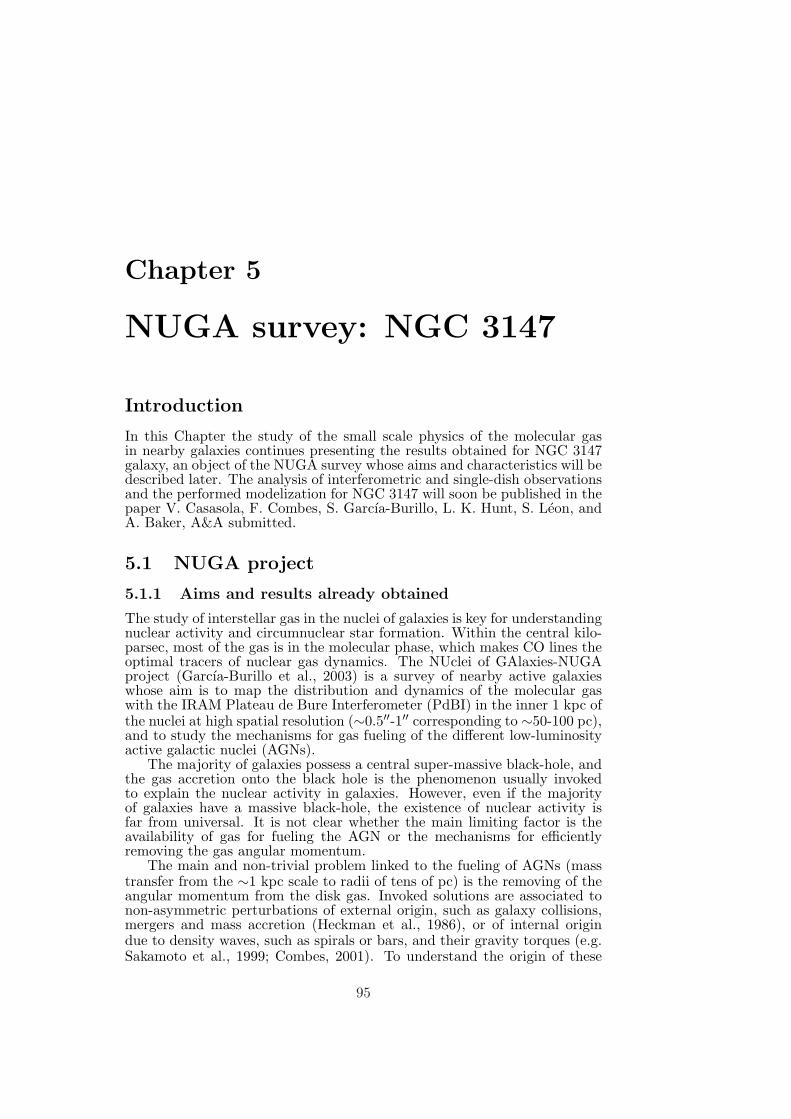
Chapter 5
NUGA survey: NGC 3147
Introduction
In this Chapter the study of the small scale physics of the molecular gasin nearby galaxies continues presenting the results obtained for NGC 3147galaxy, an object of the NUGA survey whose aims and characteristics will bedescribed later. The analysis of interferometric and single-dish observationsand the performed modelization for NGC 3147 will soon be published in thepaper V. Casasola, F. Combes, S. Garcıa-Burillo, L. K. Hunt, S. Leon, andA. Baker, A&A submitted.
5.1 NUGA project
5.1.1 Aims and results already obtained
The study of interstellar gas in the nuclei of galaxies is key for understandingnuclear activity and circumnuclear star formation. Within the central kilo-parsec, most of the gas is in the molecular phase, which makes CO lines theoptimal tracers of nuclear gas dynamics. The NUclei of GAlaxies-NUGAproject (Garcıa-Burillo et al., 2003) is a survey of nearby active galaxieswhose aim is to map the distribution and dynamics of the molecular gaswith the IRAM Plateau de Bure Interferometer (PdBI) in the inner 1 kpc ofthe nuclei at high spatial resolution (∼0.5′′-1′′ corresponding to ∼50-100 pc),and to study the mechanisms for gas fueling of the different low-luminosityactive galactic nuclei (AGNs).
The majority of galaxies possess a central super-massive black-hole, andthe gas accretion onto the black hole is the phenomenon usually invokedto explain the nuclear activity in galaxies. However, even if the majorityof galaxies have a massive black-hole, the existence of nuclear activity isfar from universal. It is not clear whether the main limiting factor is theavailability of gas for fueling the AGN or the mechanisms for efficientlyremoving the gas angular momentum.
The main and non-trivial problem linked to the fueling of AGNs (masstransfer from the ∼1 kpc scale to radii of tens of pc) is the removing of theangular momentum from the disk gas. Invoked solutions are associated tonon-asymmetric perturbations of external origin, such as galaxy collisions,mergers and mass accretion (Heckman et al., 1986), or of internal origindue to density waves, such as spirals or bars, and their gravity torques (e.g.Sakamoto et al., 1999; Combes, 2001). To understand the origin of these
95
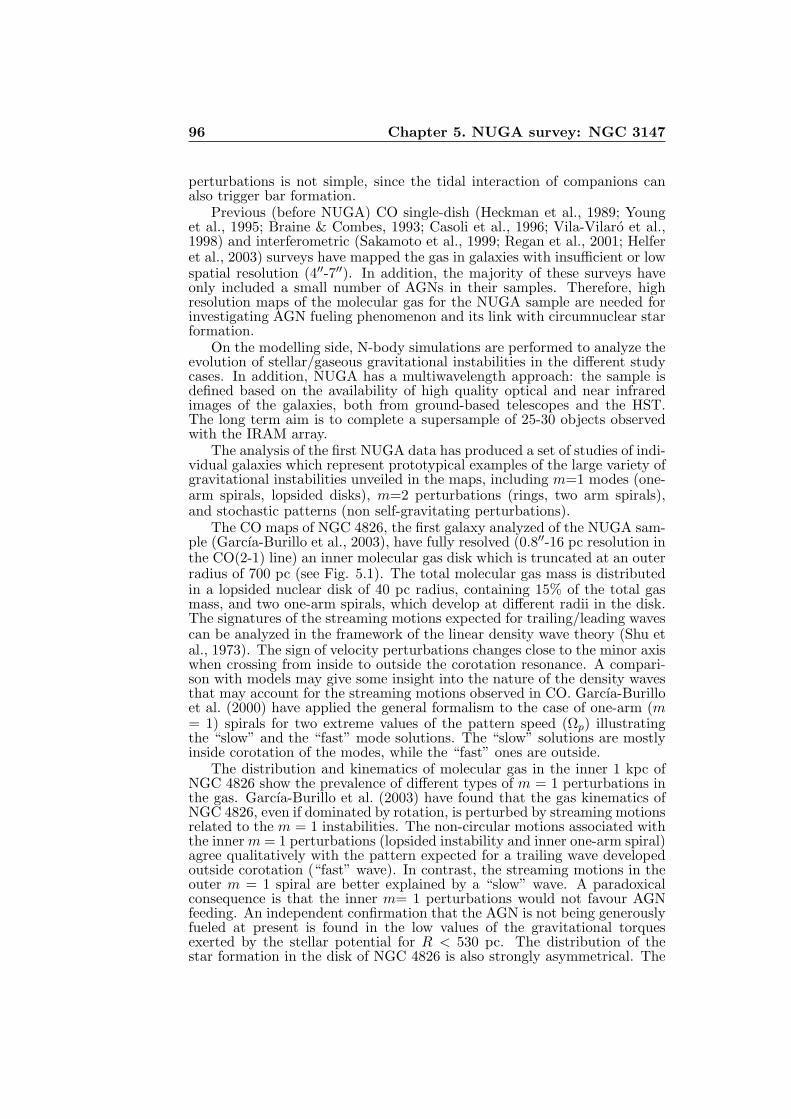
96 Chapter 5. NUGA survey: NGC 3147
perturbations is not simple, since the tidal interaction of companions canalso trigger bar formation.
Previous (before NUGA) CO single-dish (Heckman et al., 1989; Younget al., 1995; Braine & Combes, 1993; Casoli et al., 1996; Vila-Vilaro et al.,1998) and interferometric (Sakamoto et al., 1999; Regan et al., 2001; Helferet al., 2003) surveys have mapped the gas in galaxies with insufficient or lowspatial resolution (4′′-7′′). In addition, the majority of these surveys haveonly included a small number of AGNs in their samples. Therefore, highresolution maps of the molecular gas for the NUGA sample are needed forinvestigating AGN fueling phenomenon and its link with circumnuclear starformation.
On the modelling side, N-body simulations are performed to analyze theevolution of stellar/gaseous gravitational instabilities in the different studycases. In addition, NUGA has a multiwavelength approach: the sample isdefined based on the availability of high quality optical and near infraredimages of the galaxies, both from ground-based telescopes and the HST.The long term aim is to complete a supersample of 25-30 objects observedwith the IRAM array.
The analysis of the first NUGA data has produced a set of studies of indi-vidual galaxies which represent prototypical examples of the large variety ofgravitational instabilities unveiled in the maps, including m=1 modes (one-arm spirals, lopsided disks), m=2 perturbations (rings, two arm spirals),and stochastic patterns (non self-gravitating perturbations).
The CO maps of NGC 4826, the first galaxy analyzed of the NUGA sam-ple (Garcıa-Burillo et al., 2003), have fully resolved (0.8′′-16 pc resolution inthe CO(2-1) line) an inner molecular gas disk which is truncated at an outerradius of 700 pc (see Fig. 5.1). The total molecular gas mass is distributedin a lopsided nuclear disk of 40 pc radius, containing 15% of the total gasmass, and two one-arm spirals, which develop at different radii in the disk.The signatures of the streaming motions expected for trailing/leading wavescan be analyzed in the framework of the linear density wave theory (Shu etal., 1973). The sign of velocity perturbations changes close to the minor axiswhen crossing from inside to outside the corotation resonance. A compari-son with models may give some insight into the nature of the density wavesthat may account for the streaming motions observed in CO. Garcıa-Burilloet al. (2000) have applied the general formalism to the case of one-arm (m= 1) spirals for two extreme values of the pattern speed (Ωp) illustratingthe “slow” and the “fast” mode solutions. The “slow” solutions are mostlyinside corotation of the modes, while the “fast” ones are outside.
The distribution and kinematics of molecular gas in the inner 1 kpc ofNGC 4826 show the prevalence of different types of m = 1 perturbations inthe gas. Garcıa-Burillo et al. (2003) have found that the gas kinematics ofNGC 4826, even if dominated by rotation, is perturbed by streaming motionsrelated to the m = 1 instabilities. The non-circular motions associated withthe inner m = 1 perturbations (lopsided instability and inner one-arm spiral)agree qualitatively with the pattern expected for a trailing wave developedoutside corotation (“fast” wave). In contrast, the streaming motions in theouter m = 1 spiral are better explained by a “slow” wave. A paradoxicalconsequence is that the inner m= 1 perturbations would not favour AGNfeeding. An independent confirmation that the AGN is not being generouslyfueled at present is found in the low values of the gravitational torquesexerted by the stellar potential for R < 530 pc. The distribution of thestar formation in the disk of NGC 4826 is also strongly asymmetrical. The
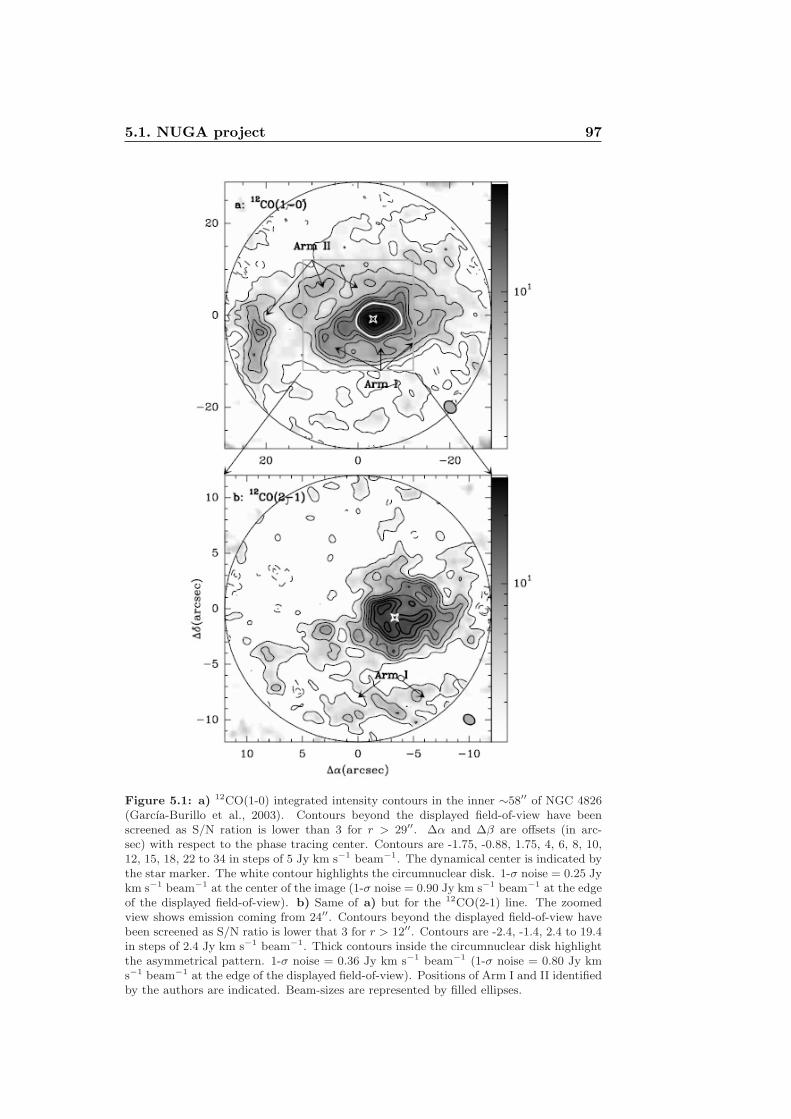
5.1. NUGA project 97
Figure 5.1: a) 12CO(1-0) integrated intensity contours in the inner ∼58′′ of NGC 4826(Garcıa-Burillo et al., 2003). Contours beyond the displayed field-of-view have beenscreened as S/N ration is lower than 3 for r > 29′′. ∆α and ∆β are offsets (in arc-sec) with respect to the phase tracing center. Contours are -1.75, -0.88, 1.75, 4, 6, 8, 10,12, 15, 18, 22 to 34 in steps of 5 Jy km s−1 beam−1. The dynamical center is indicated bythe star marker. The white contour highlights the circumnuclear disk. 1-σ noise = 0.25 Jykm s−1 beam−1 at the center of the image (1-σ noise = 0.90 Jy km s−1 beam−1 at the edgeof the displayed field-of-view). b) Same of a) but for the 12CO(2-1) line. The zoomedview shows emission coming from 24′′. Contours beyond the displayed field-of-view havebeen screened as S/N ratio is lower that 3 for r > 12′′. Contours are -2.4, -1.4, 2.4 to 19.4in steps of 2.4 Jy km s−1 beam−1. Thick contours inside the circumnuclear disk highlightthe asymmetrical pattern. 1-σ noise = 0.36 Jy km s−1 beam−1 (1-σ noise = 0.80 Jy kms−1 beam−1 at the edge of the displayed field-of-view). Positions of Arm I and II identifiedby the authors are indicated. Beam-sizes are represented by filled ellipses.
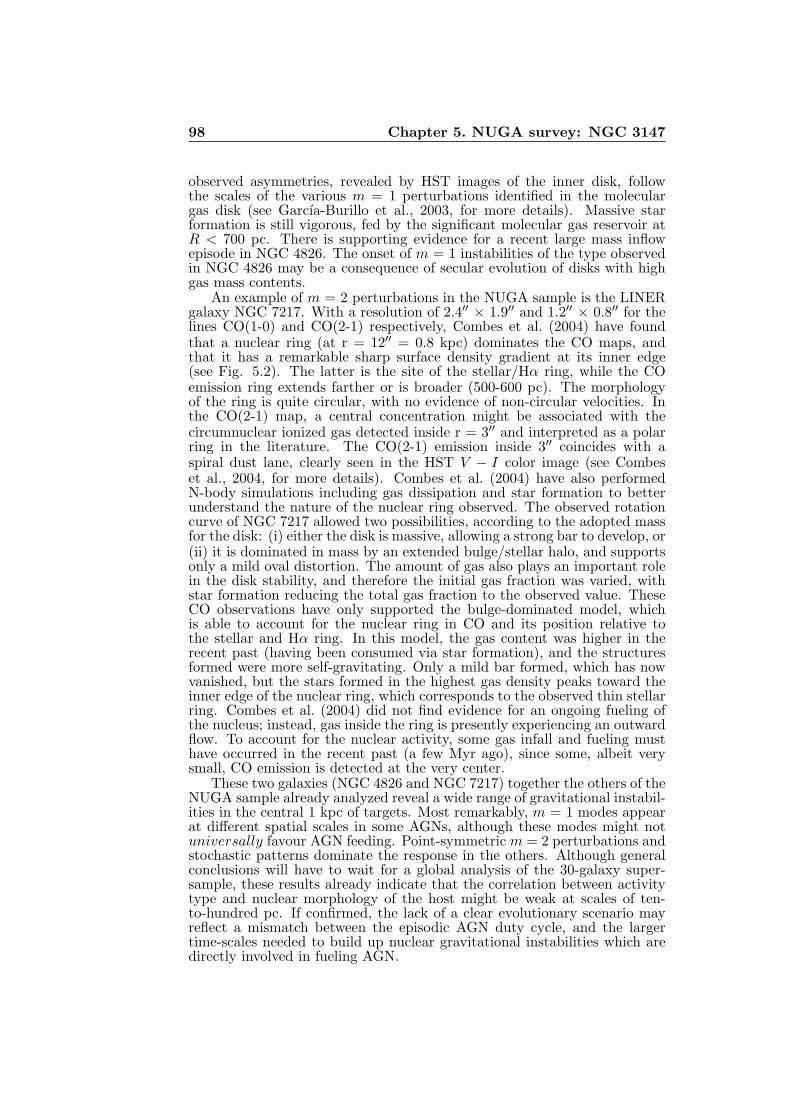
98 Chapter 5. NUGA survey: NGC 3147
observed asymmetries, revealed by HST images of the inner disk, followthe scales of the various m = 1 perturbations identified in the moleculargas disk (see Garcıa-Burillo et al., 2003, for more details). Massive starformation is still vigorous, fed by the significant molecular gas reservoir atR < 700 pc. There is supporting evidence for a recent large mass inflowepisode in NGC 4826. The onset of m = 1 instabilities of the type observedin NGC 4826 may be a consequence of secular evolution of disks with highgas mass contents.
An example of m = 2 perturbations in the NUGA sample is the LINERgalaxy NGC 7217. With a resolution of 2.4′′ × 1.9′′ and 1.2′′ × 0.8′′ for thelines CO(1-0) and CO(2-1) respectively, Combes et al. (2004) have foundthat a nuclear ring (at r = 12′′ = 0.8 kpc) dominates the CO maps, andthat it has a remarkable sharp surface density gradient at its inner edge(see Fig. 5.2). The latter is the site of the stellar/Hα ring, while the COemission ring extends farther or is broader (500-600 pc). The morphologyof the ring is quite circular, with no evidence of non-circular velocities. Inthe CO(2-1) map, a central concentration might be associated with thecircumnuclear ionized gas detected inside r = 3′′ and interpreted as a polarring in the literature. The CO(2-1) emission inside 3′′ coincides with aspiral dust lane, clearly seen in the HST V − I color image (see Combeset al., 2004, for more details). Combes et al. (2004) have also performedN-body simulations including gas dissipation and star formation to betterunderstand the nature of the nuclear ring observed. The observed rotationcurve of NGC 7217 allowed two possibilities, according to the adopted massfor the disk: (i) either the disk is massive, allowing a strong bar to develop, or(ii) it is dominated in mass by an extended bulge/stellar halo, and supportsonly a mild oval distortion. The amount of gas also plays an important rolein the disk stability, and therefore the initial gas fraction was varied, withstar formation reducing the total gas fraction to the observed value. TheseCO observations have only supported the bulge-dominated model, whichis able to account for the nuclear ring in CO and its position relative tothe stellar and Hα ring. In this model, the gas content was higher in therecent past (having been consumed via star formation), and the structuresformed were more self-gravitating. Only a mild bar formed, which has nowvanished, but the stars formed in the highest gas density peaks toward theinner edge of the nuclear ring, which corresponds to the observed thin stellarring. Combes et al. (2004) did not find evidence for an ongoing fueling ofthe nucleus; instead, gas inside the ring is presently experiencing an outwardflow. To account for the nuclear activity, some gas infall and fueling musthave occurred in the recent past (a few Myr ago), since some, albeit verysmall, CO emission is detected at the very center.
These two galaxies (NGC 4826 and NGC 7217) together the others of theNUGA sample already analyzed reveal a wide range of gravitational instabil-ities in the central 1 kpc of targets. Most remarkably, m = 1 modes appearat different spatial scales in some AGNs, although these modes might notuniversally favour AGN feeding. Point-symmetric m = 2 perturbations andstochastic patterns dominate the response in the others. Although generalconclusions will have to wait for a global analysis of the 30-galaxy super-sample, these results already indicate that the correlation between activitytype and nuclear morphology of the host might be weak at scales of ten-to-hundred pc. If confirmed, the lack of a clear evolutionary scenario mayreflect a mismatch between the episodic AGN duty cycle, and the largertime-scales needed to build up nuclear gravitational instabilities which aredirectly involved in fueling AGN.
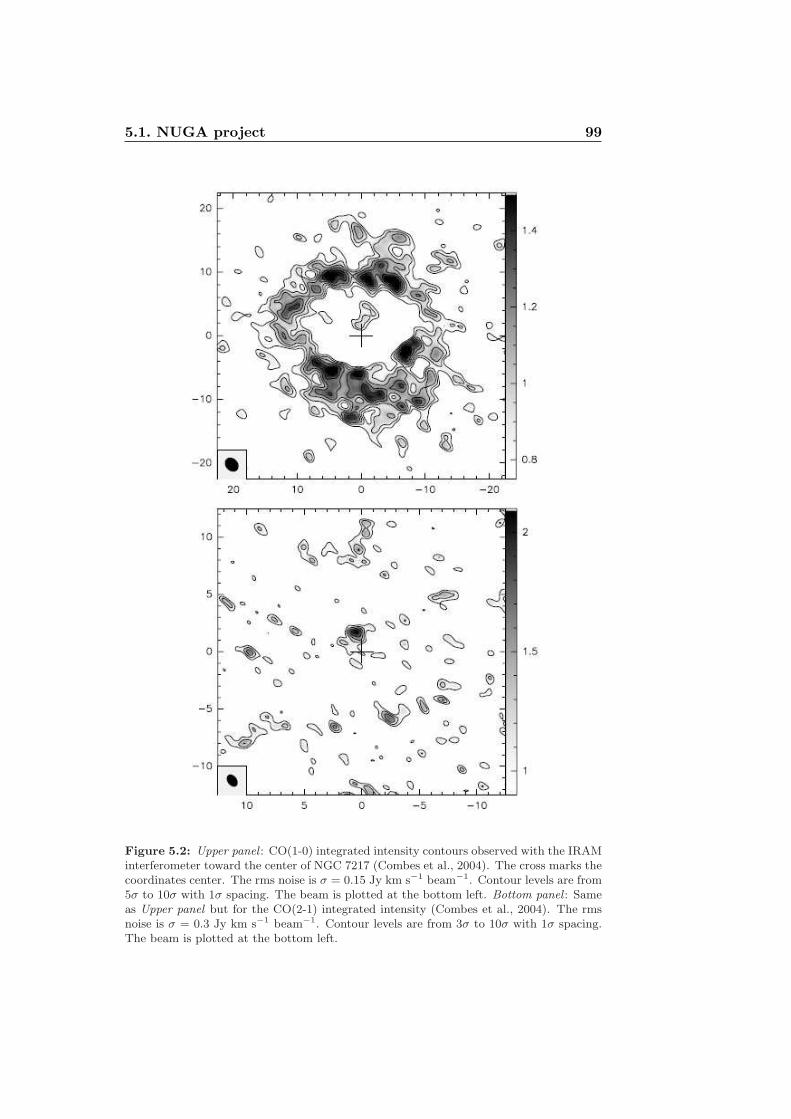
5.1. NUGA project 99
Figure 5.2: Upper panel : CO(1-0) integrated intensity contours observed with the IRAMinterferometer toward the center of NGC 7217 (Combes et al., 2004). The cross marks thecoordinates center. The rms noise is σ = 0.15 Jy km s−1 beam−1. Contour levels are from5σ to 10σ with 1σ spacing. The beam is plotted at the bottom left. Bottom panel : Sameas Upper panel but for the CO(2-1) integrated intensity (Combes et al., 2004). The rmsnoise is σ = 0.3 Jy km s−1 beam−1. Contour levels are from 3σ to 10σ with 1σ spacing.The beam is plotted at the bottom left.
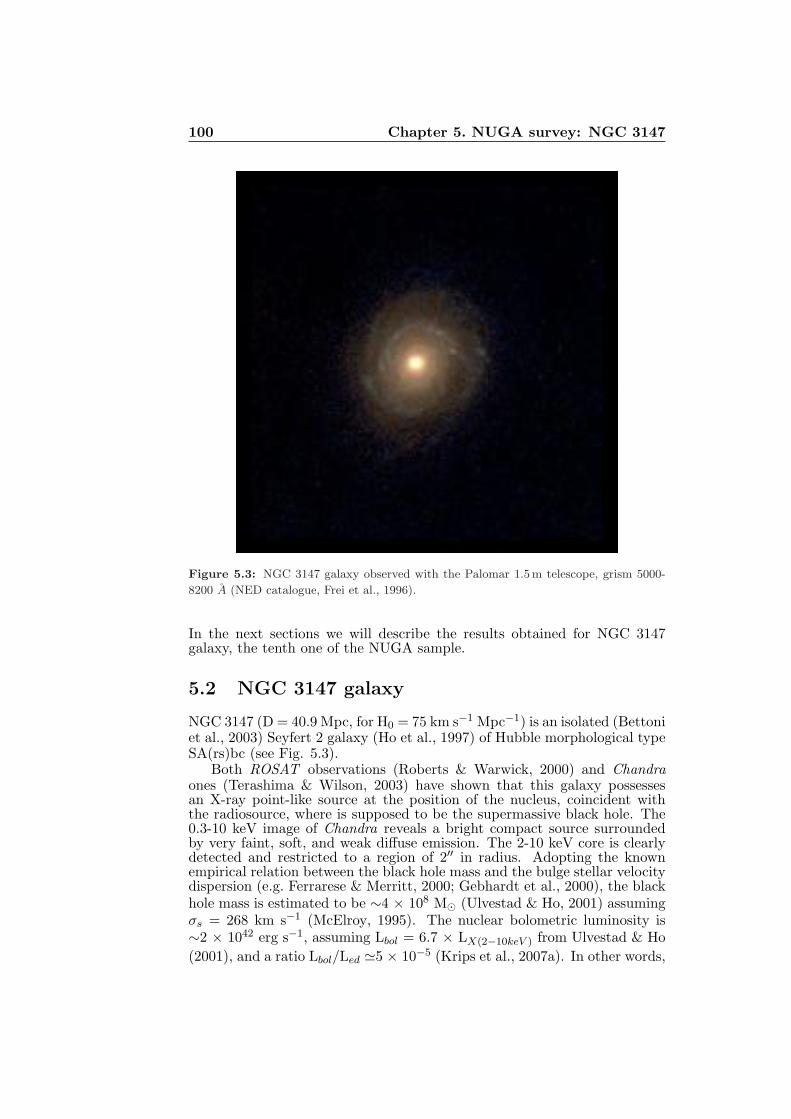
100 Chapter 5. NUGA survey: NGC 3147
Figure 5.3: NGC 3147 galaxy observed with the Palomar 1.5 m telescope, grism 5000-
8200 A (NED catalogue, Frei et al., 1996).
In the next sections we will describe the results obtained for NGC 3147galaxy, the tenth one of the NUGA sample.
5.2 NGC 3147 galaxy
NGC 3147 (D = 40.9 Mpc, for H0 = 75 km s−1 Mpc−1) is an isolated (Bettoniet al., 2003) Seyfert 2 galaxy (Ho et al., 1997) of Hubble morphological typeSA(rs)bc (see Fig. 5.3).
Both ROSAT observations (Roberts & Warwick, 2000) and Chandraones (Terashima & Wilson, 2003) have shown that this galaxy possessesan X-ray point-like source at the position of the nucleus, coincident withthe radiosource, where is supposed to be the supermassive black hole. The0.3-10 keV image of Chandra reveals a bright compact source surroundedby very faint, soft, and weak diffuse emission. The 2-10 keV core is clearlydetected and restricted to a region of 2′′ in radius. Adopting the knownempirical relation between the black hole mass and the bulge stellar velocitydispersion (e.g. Ferrarese & Merritt, 2000; Gebhardt et al., 2000), the blackhole mass is estimated to be ∼4 × 10⁸ M⊙ (Ulvestad & Ho, 2001) assumingσs = 268 km s−1 (McElroy, 1995). The nuclear bolometric luminosity is∼2 × 1042 erg s−1, assuming Lbol = 6.7 × LX(2−10keV ) from Ulvestad & Ho
(2001), and a ratio Lbol/Led ≃5 × 10⁻⁵ (Krips et al., 2007a). In other words,
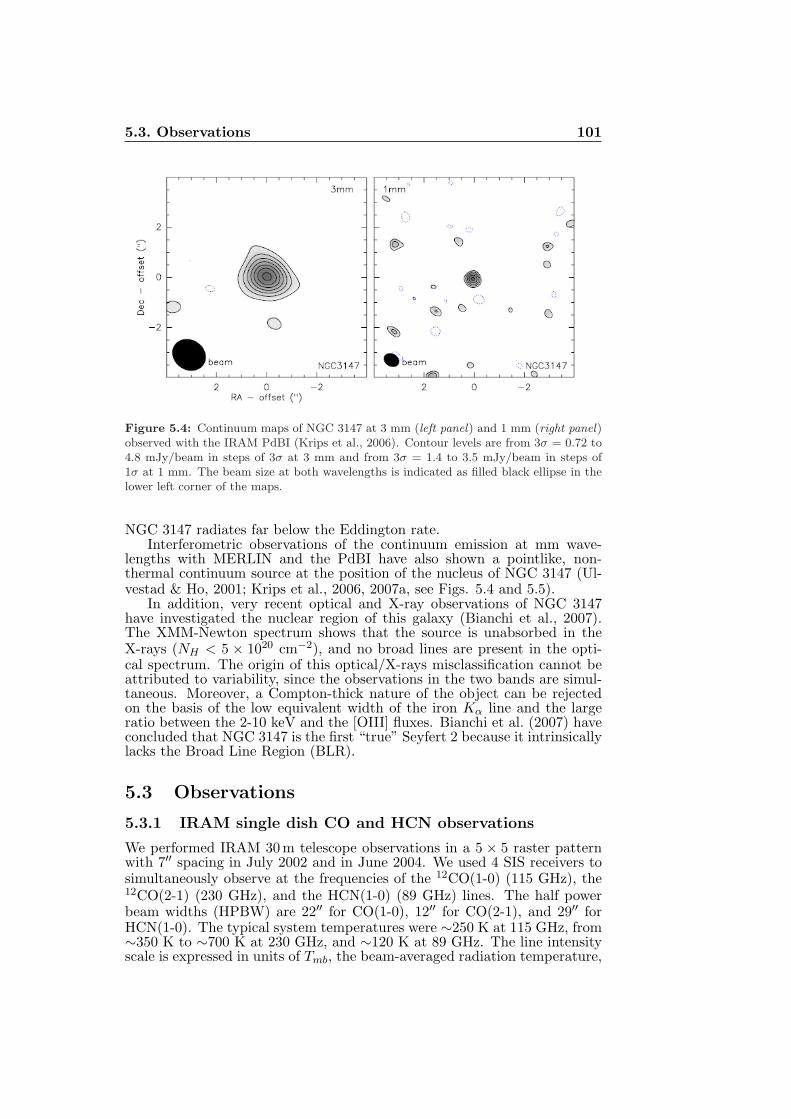
5.3. Observations 101
Figure 5.4: Continuum maps of NGC 3147 at 3 mm (left panel) and 1 mm (right panel)observed with the IRAM PdBI (Krips et al., 2006). Contour levels are from 3σ = 0.72 to4.8 mJy/beam in steps of 3σ at 3 mm and from 3σ = 1.4 to 3.5 mJy/beam in steps of1σ at 1 mm. The beam size at both wavelengths is indicated as filled black ellipse in thelower left corner of the maps.
NGC 3147 radiates far below the Eddington rate.Interferometric observations of the continuum emission at mm wave-
lengths with MERLIN and the PdBI have also shown a pointlike, non-thermal continuum source at the position of the nucleus of NGC 3147 (Ul-vestad & Ho, 2001; Krips et al., 2006, 2007a, see Figs. 5.4 and 5.5).
In addition, very recent optical and X-ray observations of NGC 3147have investigated the nuclear region of this galaxy (Bianchi et al., 2007).The XMM-Newton spectrum shows that the source is unabsorbed in theX-rays (NH < 5 × 1020 cm−2), and no broad lines are present in the opti-cal spectrum. The origin of this optical/X-rays misclassification cannot beattributed to variability, since the observations in the two bands are simul-taneous. Moreover, a Compton-thick nature of the object can be rejectedon the basis of the low equivalent width of the iron Kα line and the largeratio between the 2-10 keV and the [OIII] fluxes. Bianchi et al. (2007) haveconcluded that NGC 3147 is the first “true” Seyfert 2 because it intrinsicallylacks the Broad Line Region (BLR).
5.3 Observations
5.3.1 IRAM single dish CO and HCN observations
We performed IRAM 30 m telescope observations in a 5 × 5 raster patternwith 7′′ spacing in July 2002 and in June 2004. We used 4 SIS receivers tosimultaneously observe at the frequencies of the 12CO(1-0) (115 GHz), the12CO(2-1) (230 GHz), and the HCN(1-0) (89 GHz) lines. The half powerbeam widths (HPBW) are 22′′ for CO(1-0), 12′′ for CO(2-1), and 29′′ forHCN(1-0). The typical system temperatures were ∼250 K at 115 GHz, from∼350 K to ∼700 K at 230 GHz, and ∼120 K at 89 GHz. The line intensityscale is expressed in units of Tmb, the beam-averaged radiation temperature,
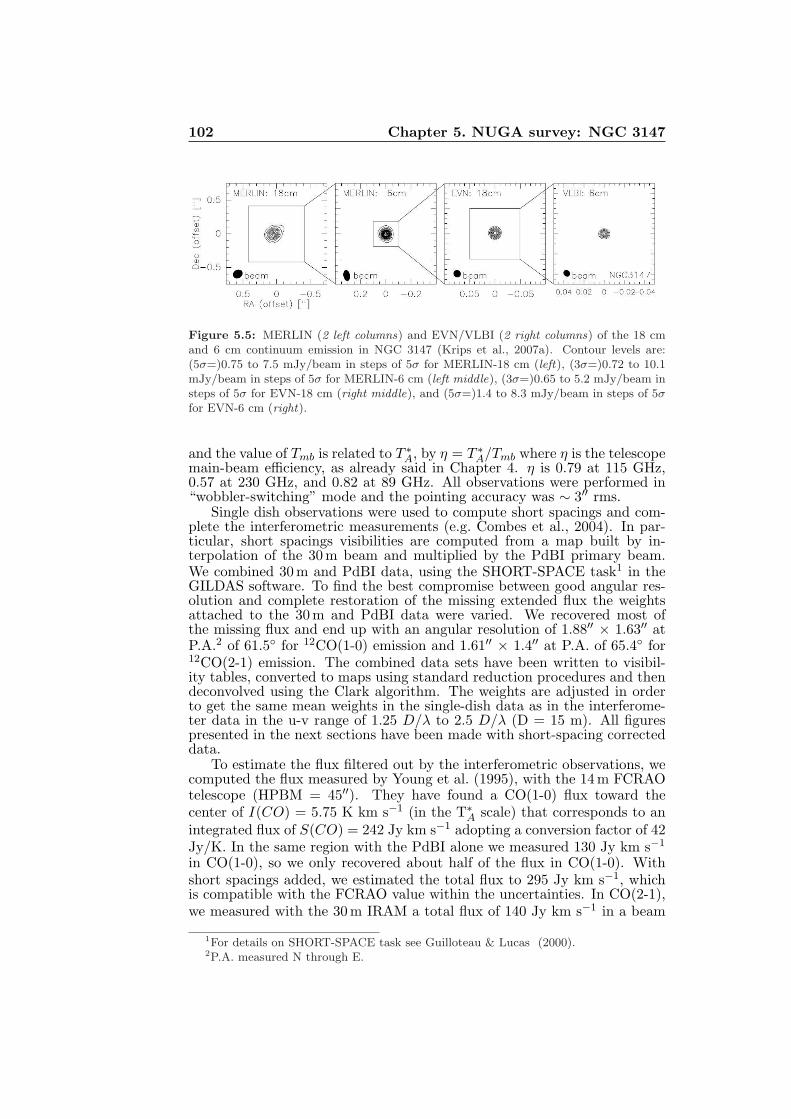
102 Chapter 5. NUGA survey: NGC 3147
Figure 5.5: MERLIN (2 left columns) and EVN/VLBI (2 right columns) of the 18 cmand 6 cm continuum emission in NGC 3147 (Krips et al., 2007a). Contour levels are:(5σ=)0.75 to 7.5 mJy/beam in steps of 5σ for MERLIN-18 cm (left), (3σ=)0.72 to 10.1mJy/beam in steps of 5σ for MERLIN-6 cm (left middle), (3σ=)0.65 to 5.2 mJy/beam insteps of 5σ for EVN-18 cm (right middle), and (5σ=)1.4 to 8.3 mJy/beam in steps of 5σfor EVN-6 cm (right).
and the value of Tmb is related to T ∗
A, by η = T ∗
A/Tmb where η is the telescopemain-beam efficiency, as already said in Chapter 4. η is 0.79 at 115 GHz,0.57 at 230 GHz, and 0.82 at 89 GHz. All observations were performed in“wobbler-switching” mode and the pointing accuracy was ∼ 3′′ rms.
Single dish observations were used to compute short spacings and com-plete the interferometric measurements (e.g. Combes et al., 2004). In par-ticular, short spacings visibilities are computed from a map built by in-terpolation of the 30 m beam and multiplied by the PdBI primary beam.We combined 30 m and PdBI data, using the SHORT-SPACE task1 in theGILDAS software. To find the best compromise between good angular res-olution and complete restoration of the missing extended flux the weightsattached to the 30 m and PdBI data were varied. We recovered most ofthe missing flux and end up with an angular resolution of 1.88′′ × 1.63′′ atP.A.2 of 61.5 for 12CO(1-0) emission and 1.61′′ × 1.4′′ at P.A. of 65.4 for12CO(2-1) emission. The combined data sets have been written to visibil-ity tables, converted to maps using standard reduction procedures and thendeconvolved using the Clark algorithm. The weights are adjusted in orderto get the same mean weights in the single-dish data as in the interferome-ter data in the u-v range of 1.25 D/λ to 2.5 D/λ (D = 15 m). All figurespresented in the next sections have been made with short-spacing correcteddata.
To estimate the flux filtered out by the interferometric observations, wecomputed the flux measured by Young et al. (1995), with the 14 m FCRAOtelescope (HPBM = 45′′). They have found a CO(1-0) flux toward thecenter of I(CO) = 5.75 K km s−1 (in the T∗
A scale) that corresponds to anintegrated flux of S(CO) = 242 Jy km s−1 adopting a conversion factor of 42Jy/K. In the same region with the PdBI alone we measured 130 Jy km s−1
in CO(1-0), so we only recovered about half of the flux in CO(1-0). Withshort spacings added, we estimated the total flux to 295 Jy km s−1, whichis compatible with the FCRAO value within the uncertainties. In CO(2-1),we measured with the 30 m IRAM a total flux of 140 Jy km s−1 in a beam
1For details on SHORT-SPACE task see Guilloteau & Lucas (2000).2P.A. measured N through E.
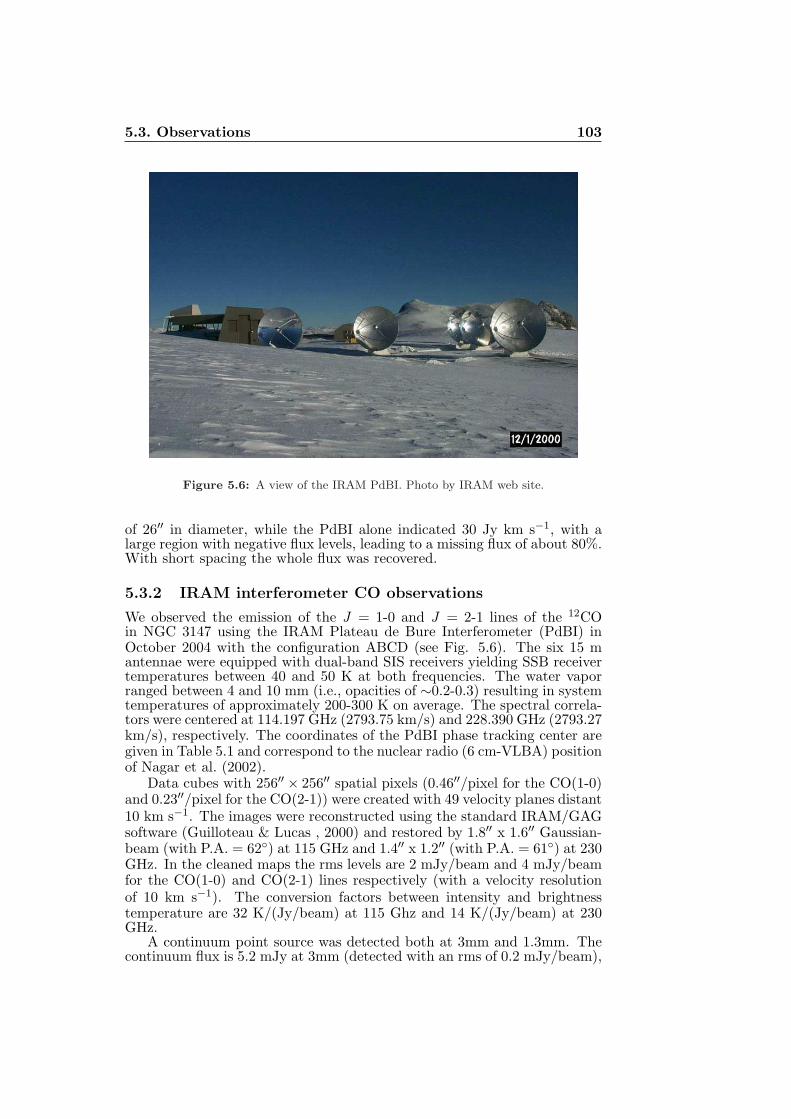
5.3. Observations 103
Figure 5.6: A view of the IRAM PdBI. Photo by IRAM web site.
of 26′′ in diameter, while the PdBI alone indicated 30 Jy km s−1, with alarge region with negative flux levels, leading to a missing flux of about 80%.With short spacing the whole flux was recovered.
5.3.2 IRAM interferometer CO observations
We observed the emission of the J = 1-0 and J = 2-1 lines of the 12COin NGC 3147 using the IRAM Plateau de Bure Interferometer (PdBI) inOctober 2004 with the configuration ABCD (see Fig. 5.6). The six 15 mantennae were equipped with dual-band SIS receivers yielding SSB receivertemperatures between 40 and 50 K at both frequencies. The water vaporranged between 4 and 10 mm (i.e., opacities of ∼0.2-0.3) resulting in systemtemperatures of approximately 200-300 K on average. The spectral correla-tors were centered at 114.197 GHz (2793.75 km/s) and 228.390 GHz (2793.27km/s), respectively. The coordinates of the PdBI phase tracking center aregiven in Table 5.1 and correspond to the nuclear radio (6 cm-VLBA) positionof Nagar et al. (2002).
Data cubes with 256′′ × 256′′ spatial pixels (0.46′′/pixel for the CO(1-0)and 0.23′′/pixel for the CO(2-1)) were created with 49 velocity planes distant10 km s−1. The images were reconstructed using the standard IRAM/GAGsoftware (Guilloteau & Lucas , 2000) and restored by 1.8′′ x 1.6′′ Gaussian-beam (with P.A. = 62) at 115 GHz and 1.4′′ x 1.2′′ (with P.A. = 61) at 230GHz. In the cleaned maps the rms levels are 2 mJy/beam and 4 mJy/beamfor the CO(1-0) and CO(2-1) lines respectively (with a velocity resolutionof 10 km s−1). The conversion factors between intensity and brightnesstemperature are 32 K/(Jy/beam) at 115 Ghz and 14 K/(Jy/beam) at 230GHz.
A continuum point source was detected both at 3mm and 1.3mm. Thecontinuum flux is 5.2 mJy at 3mm (detected with an rms of 0.2 mJy/beam),
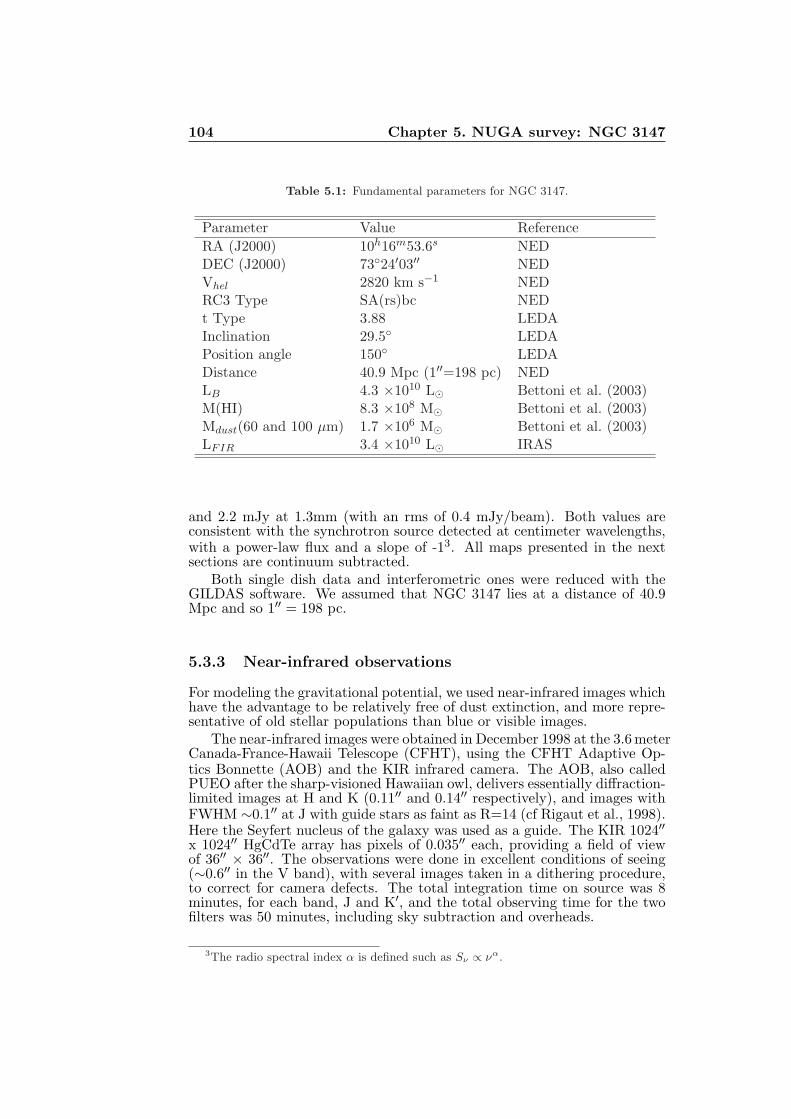
104 Chapter 5. NUGA survey: NGC 3147
Table 5.1: Fundamental parameters for NGC 3147.
Parameter Value Reference
RA (J2000) 10h16m53.6s NEDDEC (J2000) 7324′03′′ NEDVhel 2820 km s−1 NEDRC3 Type SA(rs)bc NEDt Type 3.88 LEDAInclination 29.5 LEDAPosition angle 150 LEDADistance 40.9 Mpc (1′′=198 pc) NEDLB 4.3 ×10¹⁰ L⊙ Bettoni et al. (2003)M(HI) 8.3 ×10⁸ M⊙ Bettoni et al. (2003)Mdust(60 and 100 µm) 1.7 ×10⁶ M⊙ Bettoni et al. (2003)LFIR 3.4 ×10¹⁰ L⊙ IRAS
and 2.2 mJy at 1.3mm (with an rms of 0.4 mJy/beam). Both values areconsistent with the synchrotron source detected at centimeter wavelengths,with a power-law flux and a slope of -13. All maps presented in the nextsections are continuum subtracted.
Both single dish data and interferometric ones were reduced with theGILDAS software. We assumed that NGC 3147 lies at a distance of 40.9Mpc and so 1′′ = 198 pc.
5.3.3 Near-infrared observations
For modeling the gravitational potential, we used near-infrared images whichhave the advantage to be relatively free of dust extinction, and more repre-sentative of old stellar populations than blue or visible images.
The near-infrared images were obtained in December 1998 at the 3.6 meterCanada-France-Hawaii Telescope (CFHT), using the CFHT Adaptive Op-tics Bonnette (AOB) and the KIR infrared camera. The AOB, also calledPUEO after the sharp-visioned Hawaiian owl, delivers essentially diffraction-limited images at H and K (0.11′′ and 0.14′′ respectively), and images withFWHM ∼0.1′′ at J with guide stars as faint as R=14 (cf Rigaut et al., 1998).Here the Seyfert nucleus of the galaxy was used as a guide. The KIR 1024′′
x 1024′′ HgCdTe array has pixels of 0.035′′ each, providing a field of viewof 36′′ × 36′′. The observations were done in excellent conditions of seeing(∼0.6′′ in the V band), with several images taken in a dithering procedure,to correct for camera defects. The total integration time on source was 8minutes, for each band, J and K′, and the total observing time for the twofilters was 50 minutes, including sky subtraction and overheads.
3The radio spectral index α is defined such as Sν ∝ να.
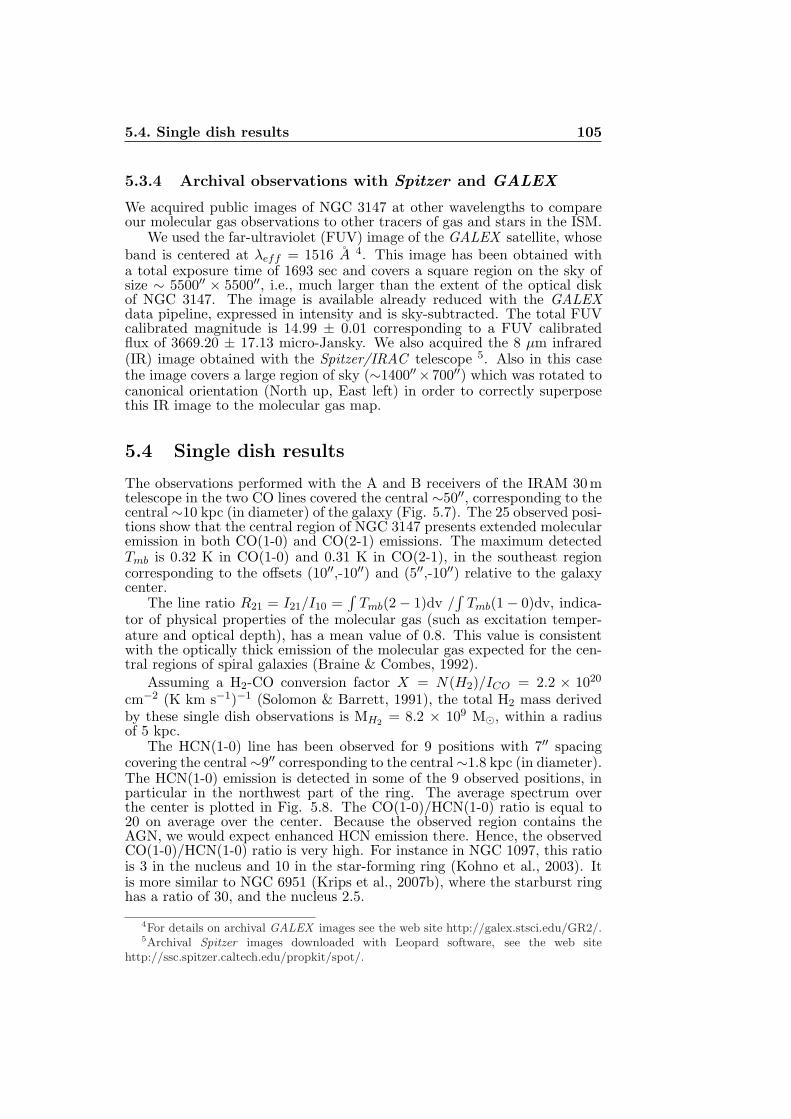
5.4. Single dish results 105
5.3.4 Archival observations with Spitzer and GALEX
We acquired public images of NGC 3147 at other wavelengths to compareour molecular gas observations to other tracers of gas and stars in the ISM.
We used the far-ultraviolet (FUV) image of the GALEX satellite, whoseband is centered at λeff = 1516 A 4. This image has been obtained witha total exposure time of 1693 sec and covers a square region on the sky ofsize ∼ 5500′′ × 5500′′, i.e., much larger than the extent of the optical diskof NGC 3147. The image is available already reduced with the GALEXdata pipeline, expressed in intensity and is sky-subtracted. The total FUVcalibrated magnitude is 14.99 ± 0.01 corresponding to a FUV calibratedflux of 3669.20 ± 17.13 micro-Jansky. We also acquired the 8 µm infrared(IR) image obtained with the Spitzer/IRAC telescope 5. Also in this casethe image covers a large region of sky (∼1400′′×700′′) which was rotated tocanonical orientation (North up, East left) in order to correctly superposethis IR image to the molecular gas map.
5.4 Single dish results
The observations performed with the A and B receivers of the IRAM 30 mtelescope in the two CO lines covered the central ∼50′′, corresponding to thecentral ∼10 kpc (in diameter) of the galaxy (Fig. 5.7). The 25 observed posi-tions show that the central region of NGC 3147 presents extended molecularemission in both CO(1-0) and CO(2-1) emissions. The maximum detectedTmb is 0.32 K in CO(1-0) and 0.31 K in CO(2-1), in the southeast regioncorresponding to the offsets (10′′,-10′′) and (5′′,-10′′) relative to the galaxycenter.
The line ratio R21 = I21/I10 =∫
Tmb(2 − 1)dv /∫
Tmb(1 − 0)dv, indica-tor of physical properties of the molecular gas (such as excitation temper-ature and optical depth), has a mean value of 0.8. This value is consistentwith the optically thick emission of the molecular gas expected for the cen-tral regions of spiral galaxies (Braine & Combes, 1992).
Assuming a H2-CO conversion factor X = N(H2)/ICO = 2.2 × 10²⁰
cm−2 (K km s−1)−1 (Solomon & Barrett, 1991), the total H2 mass derivedby these single dish observations is MH2
= 8.2 × 10⁹ M⊙, within a radiusof 5 kpc.
The HCN(1-0) line has been observed for 9 positions with 7′′ spacingcovering the central ∼9′′ corresponding to the central ∼1.8 kpc (in diameter).The HCN(1-0) emission is detected in some of the 9 observed positions, inparticular in the northwest part of the ring. The average spectrum overthe center is plotted in Fig. 5.8. The CO(1-0)/HCN(1-0) ratio is equal to20 on average over the center. Because the observed region contains theAGN, we would expect enhanced HCN emission there. Hence, the observedCO(1-0)/HCN(1-0) ratio is very high. For instance in NGC 1097, this ratiois 3 in the nucleus and 10 in the star-forming ring (Kohno et al., 2003). Itis more similar to NGC 6951 (Krips et al., 2007b), where the starburst ringhas a ratio of 30, and the nucleus 2.5.
4For details on archival GALEX images see the web site http://galex.stsci.edu/GR2/.5Archival Spitzer images downloaded with Leopard software, see the web site
http://ssc.spitzer.caltech.edu/propkit/spot/.
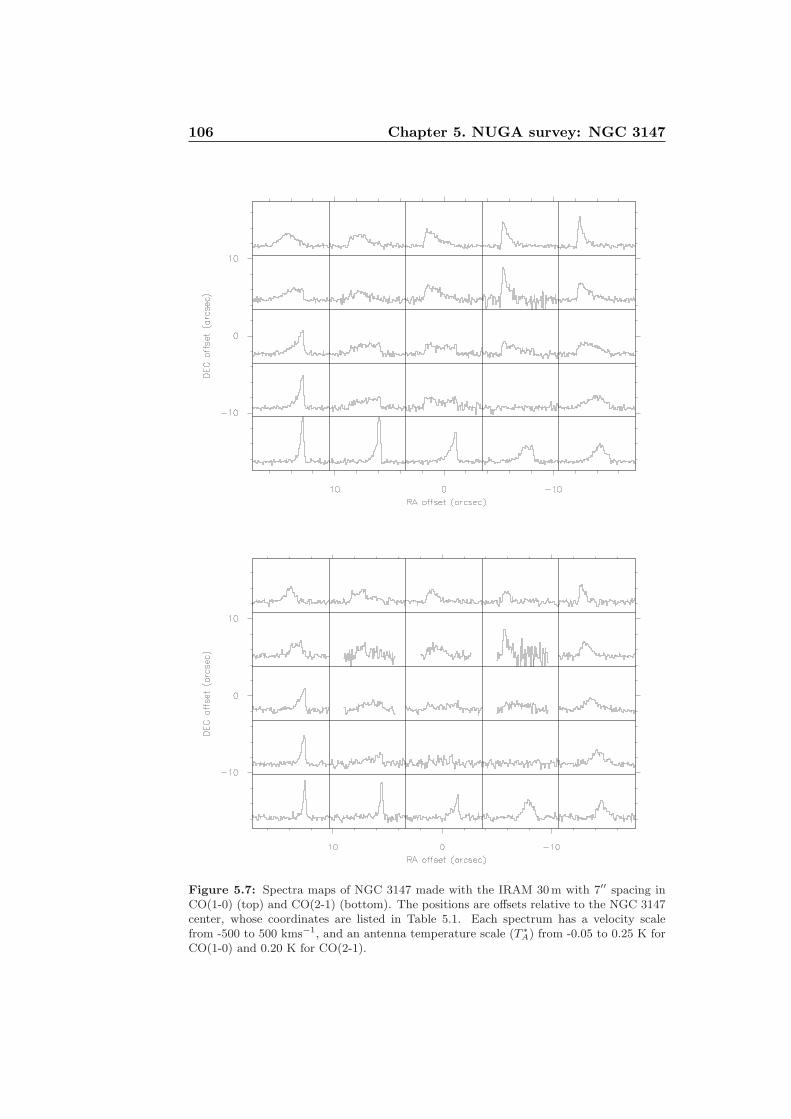
106 Chapter 5. NUGA survey: NGC 3147
Figure 5.7: Spectra maps of NGC 3147 made with the IRAM 30m with 7′′ spacing inCO(1-0) (top) and CO(2-1) (bottom). The positions are offsets relative to the NGC 3147center, whose coordinates are listed in Table 5.1. Each spectrum has a velocity scalefrom -500 to 500 kms−1, and an antenna temperature scale (T ∗
A) from -0.05 to 0.25 K forCO(1-0) and 0.20 K for CO(2-1).
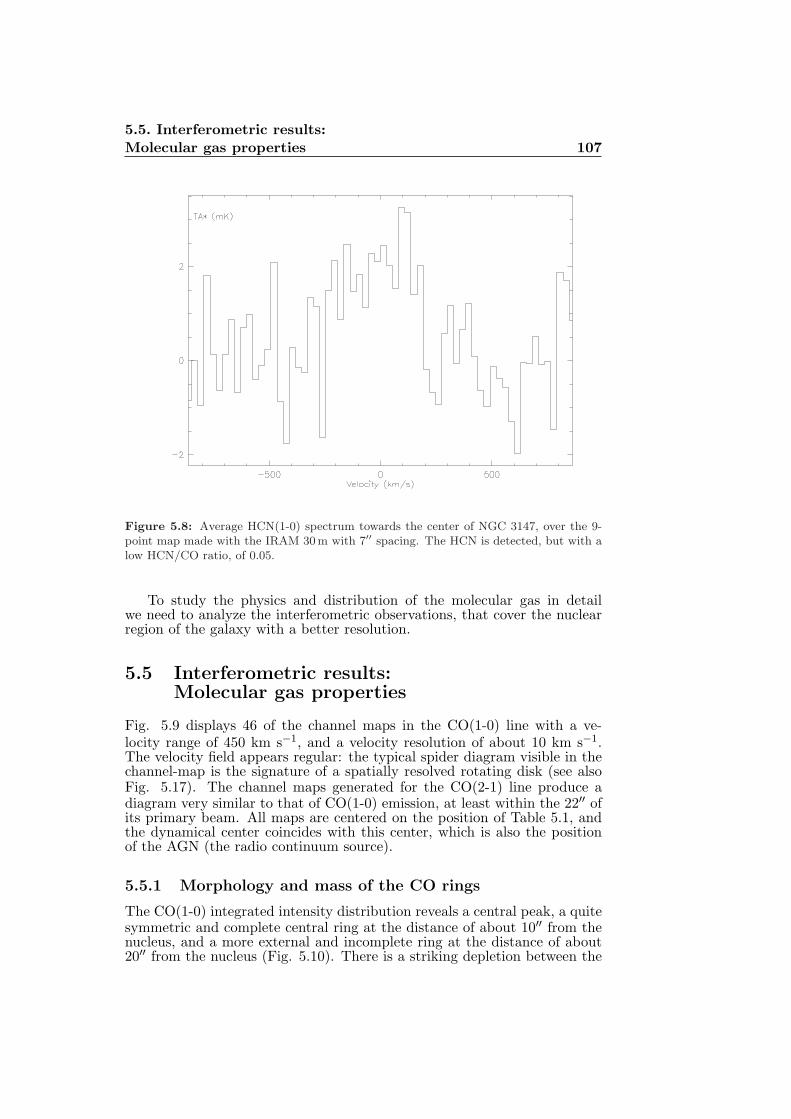
5.5. Interferometric results:
Molecular gas properties 107
Figure 5.8: Average HCN(1-0) spectrum towards the center of NGC 3147, over the 9-point map made with the IRAM 30 m with 7′′ spacing. The HCN is detected, but with alow HCN/CO ratio, of 0.05.
To study the physics and distribution of the molecular gas in detailwe need to analyze the interferometric observations, that cover the nuclearregion of the galaxy with a better resolution.
5.5 Interferometric results:Molecular gas properties
Fig. 5.9 displays 46 of the channel maps in the CO(1-0) line with a ve-locity range of 450 km s−1, and a velocity resolution of about 10 km s−1.The velocity field appears regular: the typical spider diagram visible in thechannel-map is the signature of a spatially resolved rotating disk (see alsoFig. 5.17). The channel maps generated for the CO(2-1) line produce adiagram very similar to that of CO(1-0) emission, at least within the 22′′ ofits primary beam. All maps are centered on the position of Table 5.1, andthe dynamical center coincides with this center, which is also the positionof the AGN (the radio continuum source).
5.5.1 Morphology and mass of the CO rings
The CO(1-0) integrated intensity distribution reveals a central peak, a quitesymmetric and complete central ring at the distance of about 10′′ from thenucleus, and a more external and incomplete ring at the distance of about20′′ from the nucleus (Fig. 5.10). There is a striking depletion between the
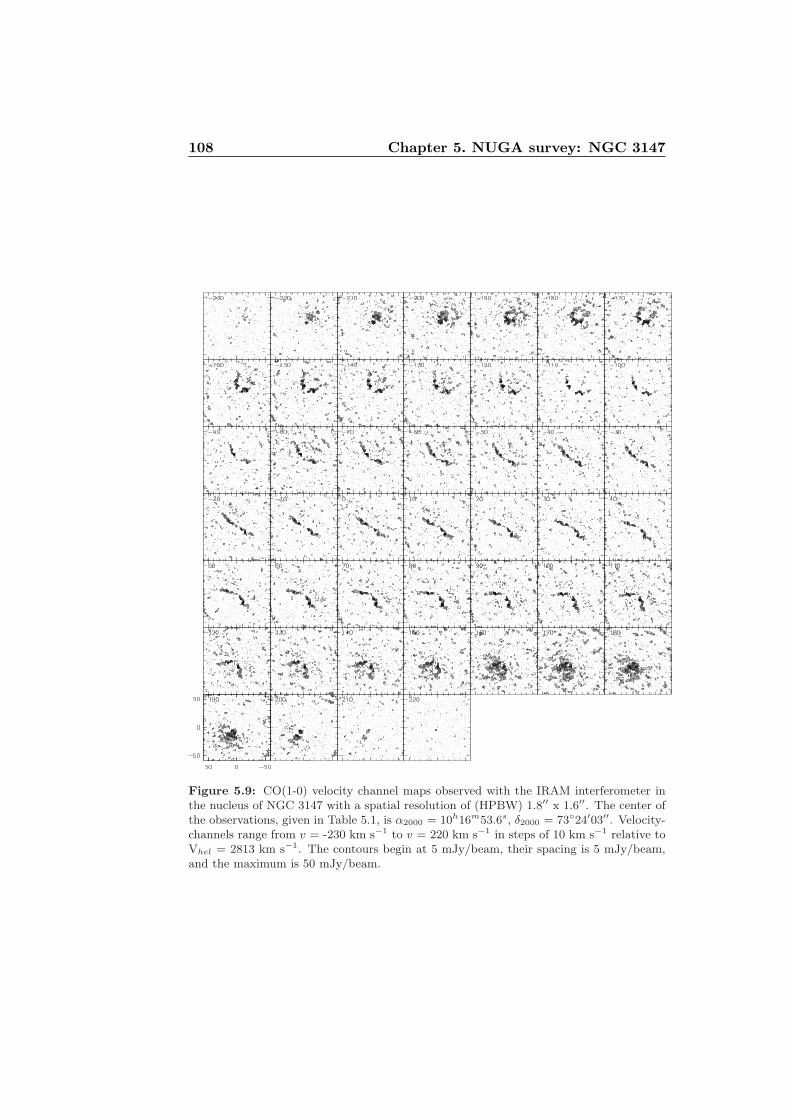
108 Chapter 5. NUGA survey: NGC 3147
Figure 5.9: CO(1-0) velocity channel maps observed with the IRAM interferometer inthe nucleus of NGC 3147 with a spatial resolution of (HPBW) 1.8′′ x 1.6′′. The center ofthe observations, given in Table 5.1, is α2000 = 10h16m53.6s, δ2000 = 7324′03′′. Velocity-channels range from v = -230 km s−1 to v = 220 km s−1 in steps of 10 km s−1 relative toVhel = 2813 km s−1. The contours begin at 5 mJy/beam, their spacing is 5 mJy/beam,and the maximum is 50 mJy/beam.
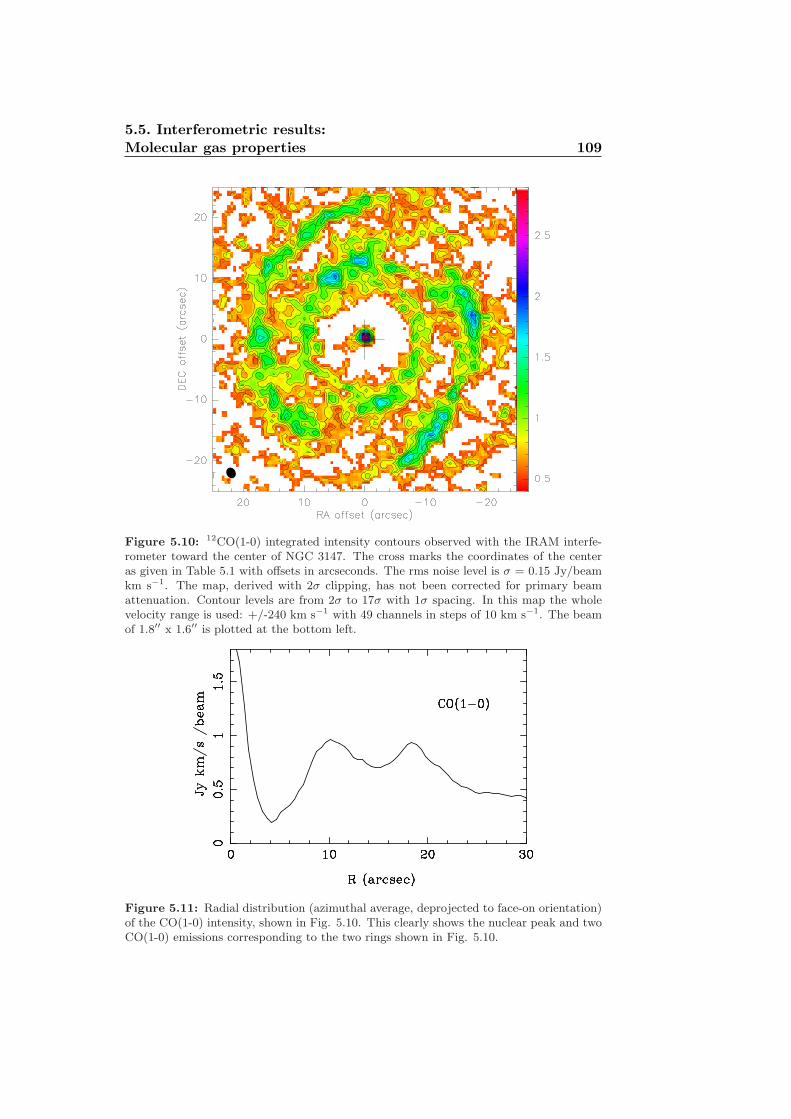
5.5. Interferometric results:
Molecular gas properties 109
Figure 5.10: 12CO(1-0) integrated intensity contours observed with the IRAM interfe-rometer toward the center of NGC 3147. The cross marks the coordinates of the centeras given in Table 5.1 with offsets in arcseconds. The rms noise level is σ = 0.15 Jy/beamkm s−1. The map, derived with 2σ clipping, has not been corrected for primary beamattenuation. Contour levels are from 2σ to 17σ with 1σ spacing. In this map the wholevelocity range is used: +/-240 km s−1 with 49 channels in steps of 10 km s−1. The beamof 1.8′′ x 1.6′′ is plotted at the bottom left.
Figure 5.11: Radial distribution (azimuthal average, deprojected to face-on orientation)of the CO(1-0) intensity, shown in Fig. 5.10. This clearly shows the nuclear peak and twoCO(1-0) emissions corresponding to the two rings shown in Fig. 5.10.
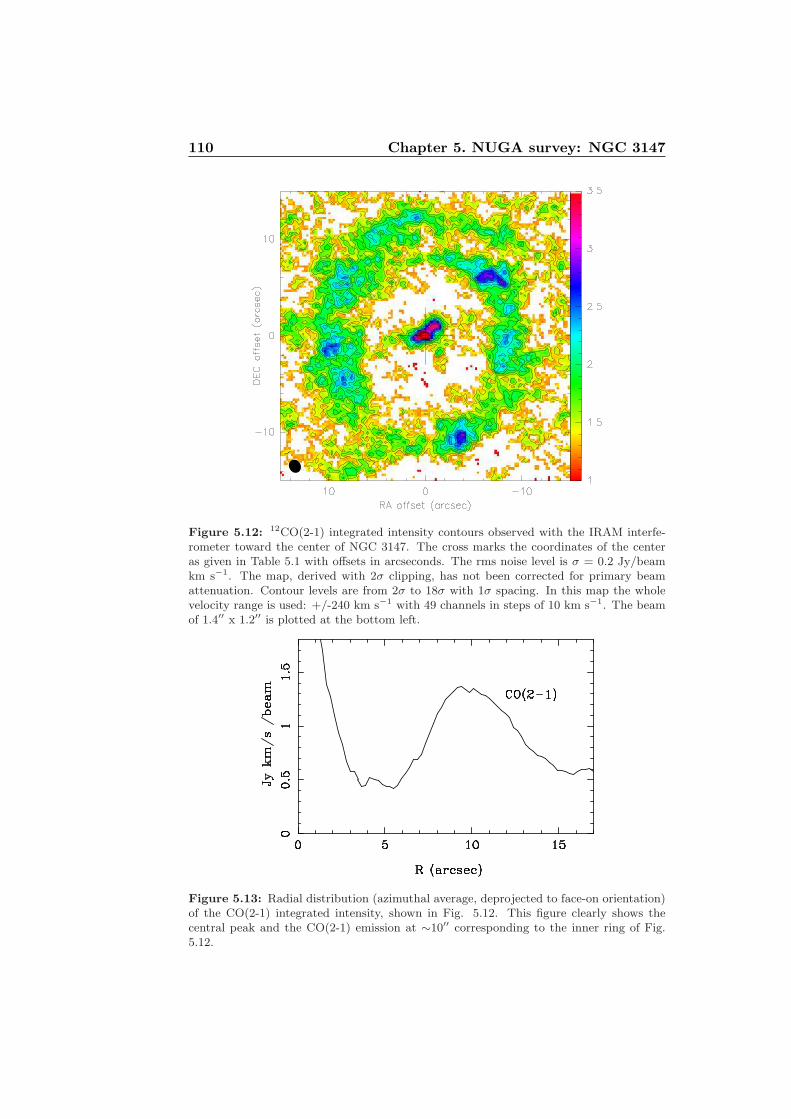
110 Chapter 5. NUGA survey: NGC 3147
Figure 5.12: 12CO(2-1) integrated intensity contours observed with the IRAM interfe-rometer toward the center of NGC 3147. The cross marks the coordinates of the centeras given in Table 5.1 with offsets in arcseconds. The rms noise level is σ = 0.2 Jy/beamkm s−1. The map, derived with 2σ clipping, has not been corrected for primary beamattenuation. Contour levels are from 2σ to 18σ with 1σ spacing. In this map the wholevelocity range is used: +/-240 km s−1 with 49 channels in steps of 10 km s−1. The beamof 1.4′′ x 1.2′′ is plotted at the bottom left.
Figure 5.13: Radial distribution (azimuthal average, deprojected to face-on orientation)of the CO(2-1) integrated intensity, shown in Fig. 5.12. This figure clearly shows thecentral peak and the CO(2-1) emission at ∼10′′ corresponding to the inner ring of Fig.5.12.
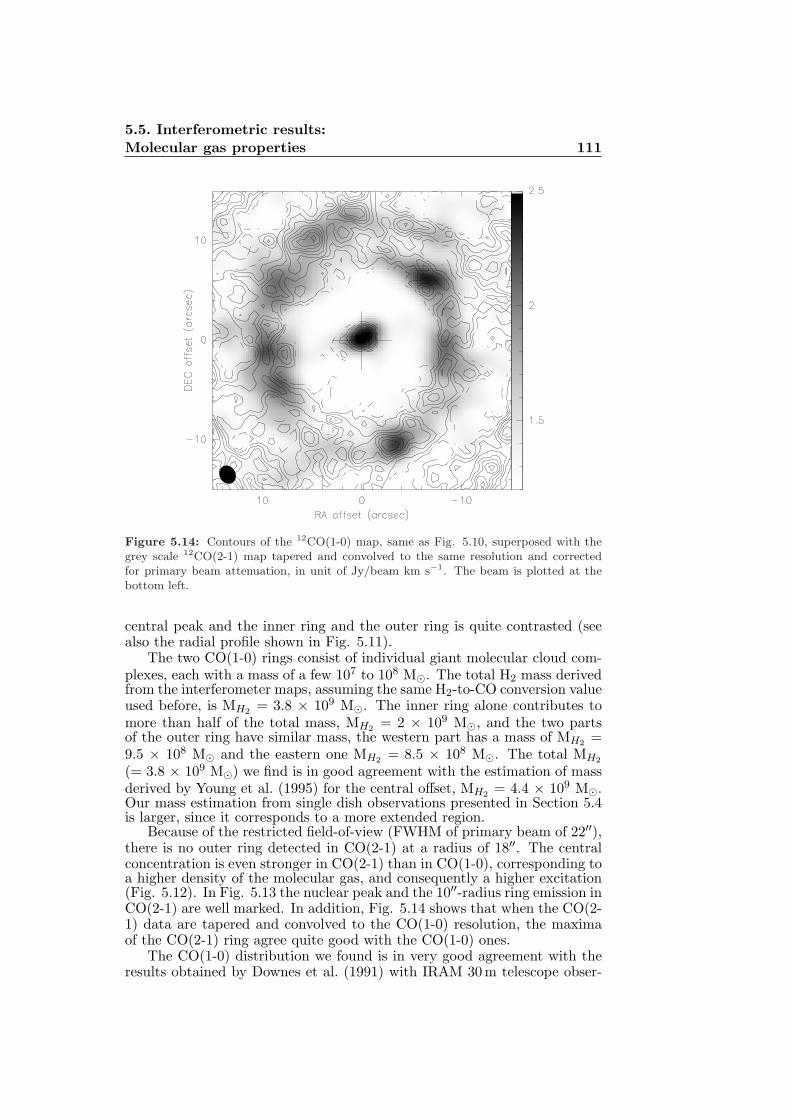
5.5. Interferometric results:
Molecular gas properties 111
Figure 5.14: Contours of the 12CO(1-0) map, same as Fig. 5.10, superposed with thegrey scale 12CO(2-1) map tapered and convolved to the same resolution and correctedfor primary beam attenuation, in unit of Jy/beam km s−1. The beam is plotted at thebottom left.
central peak and the inner ring and the outer ring is quite contrasted (seealso the radial profile shown in Fig. 5.11).
The two CO(1-0) rings consist of individual giant molecular cloud com-plexes, each with a mass of a few 107 to 108 M⊙. The total H2 mass derivedfrom the interferometer maps, assuming the same H2-to-CO conversion valueused before, is MH2
= 3.8 × 10⁹ M⊙. The inner ring alone contributes tomore than half of the total mass, MH2
= 2 × 10⁹ M⊙, and the two partsof the outer ring have similar mass, the western part has a mass of MH2
=9.5 × 10⁸ M⊙ and the eastern one MH2
= 8.5 × 10⁸ M⊙. The total MH2
(= 3.8 × 10⁹ M⊙) we find is in good agreement with the estimation of massderived by Young et al. (1995) for the central offset, MH2
= 4.4 × 10⁹ M⊙.Our mass estimation from single dish observations presented in Section 5.4is larger, since it corresponds to a more extended region.
Because of the restricted field-of-view (FWHM of primary beam of 22′′),there is no outer ring detected in CO(2-1) at a radius of 18′′. The centralconcentration is even stronger in CO(2-1) than in CO(1-0), corresponding toa higher density of the molecular gas, and consequently a higher excitation(Fig. 5.12). In Fig. 5.13 the nuclear peak and the 10′′-radius ring emission inCO(2-1) are well marked. In addition, Fig. 5.14 shows that when the CO(2-1) data are tapered and convolved to the CO(1-0) resolution, the maximaof the CO(2-1) ring agree quite good with the CO(1-0) ones.
The CO(1-0) distribution we found is in very good agreement with theresults obtained by Downes et al. (1991) with IRAM 30 m telescope obser-
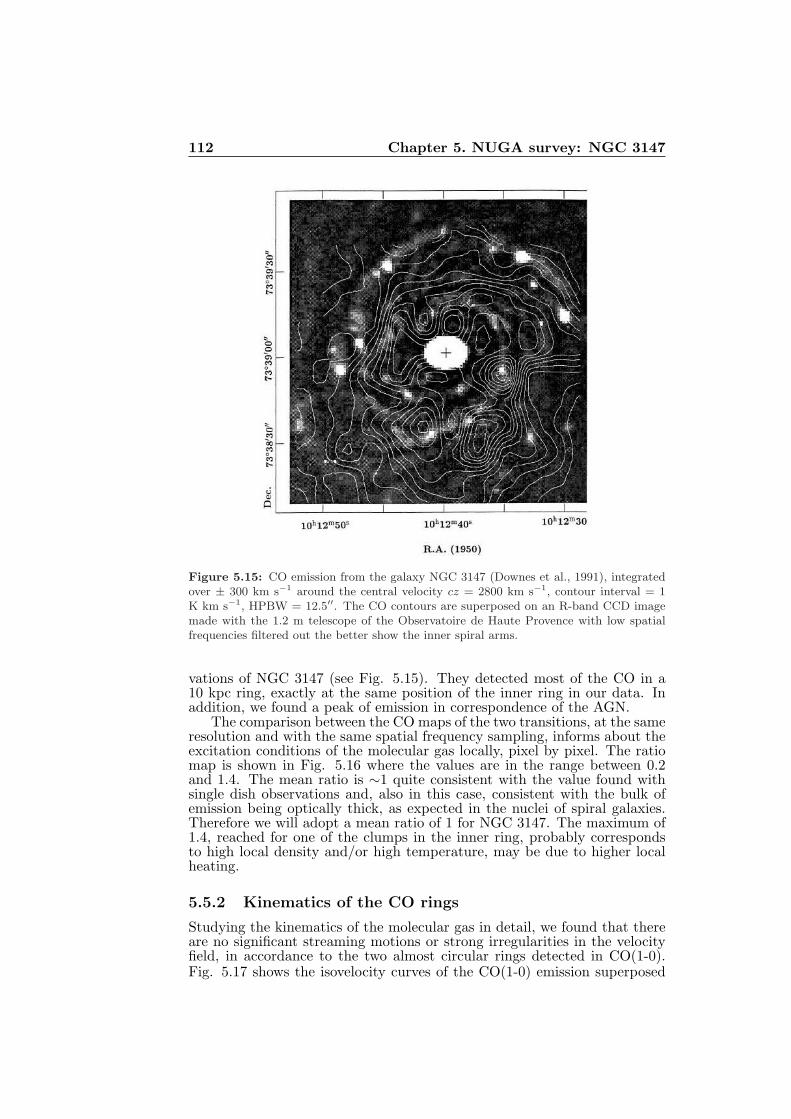
112 Chapter 5. NUGA survey: NGC 3147
Figure 5.15: CO emission from the galaxy NGC 3147 (Downes et al., 1991), integratedover ± 300 km s−1 around the central velocity cz = 2800 km s−1, contour interval = 1K km s−1, HPBW = 12.5′′. The CO contours are superposed on an R-band CCD imagemade with the 1.2 m telescope of the Observatoire de Haute Provence with low spatialfrequencies filtered out the better show the inner spiral arms.
vations of NGC 3147 (see Fig. 5.15). They detected most of the CO in a10 kpc ring, exactly at the same position of the inner ring in our data. Inaddition, we found a peak of emission in correspondence of the AGN.
The comparison between the CO maps of the two transitions, at the sameresolution and with the same spatial frequency sampling, informs about theexcitation conditions of the molecular gas locally, pixel by pixel. The ratiomap is shown in Fig. 5.16 where the values are in the range between 0.2and 1.4. The mean ratio is ∼1 quite consistent with the value found withsingle dish observations and, also in this case, consistent with the bulk ofemission being optically thick, as expected in the nuclei of spiral galaxies.Therefore we will adopt a mean ratio of 1 for NGC 3147. The maximum of1.4, reached for one of the clumps in the inner ring, probably correspondsto high local density and/or high temperature, may be due to higher localheating.
5.5.2 Kinematics of the CO rings
Studying the kinematics of the molecular gas in detail, we found that thereare no significant streaming motions or strong irregularities in the velocityfield, in accordance to the two almost circular rings detected in CO(1-0).Fig. 5.17 shows the isovelocity curves of the CO(1-0) emission superposed
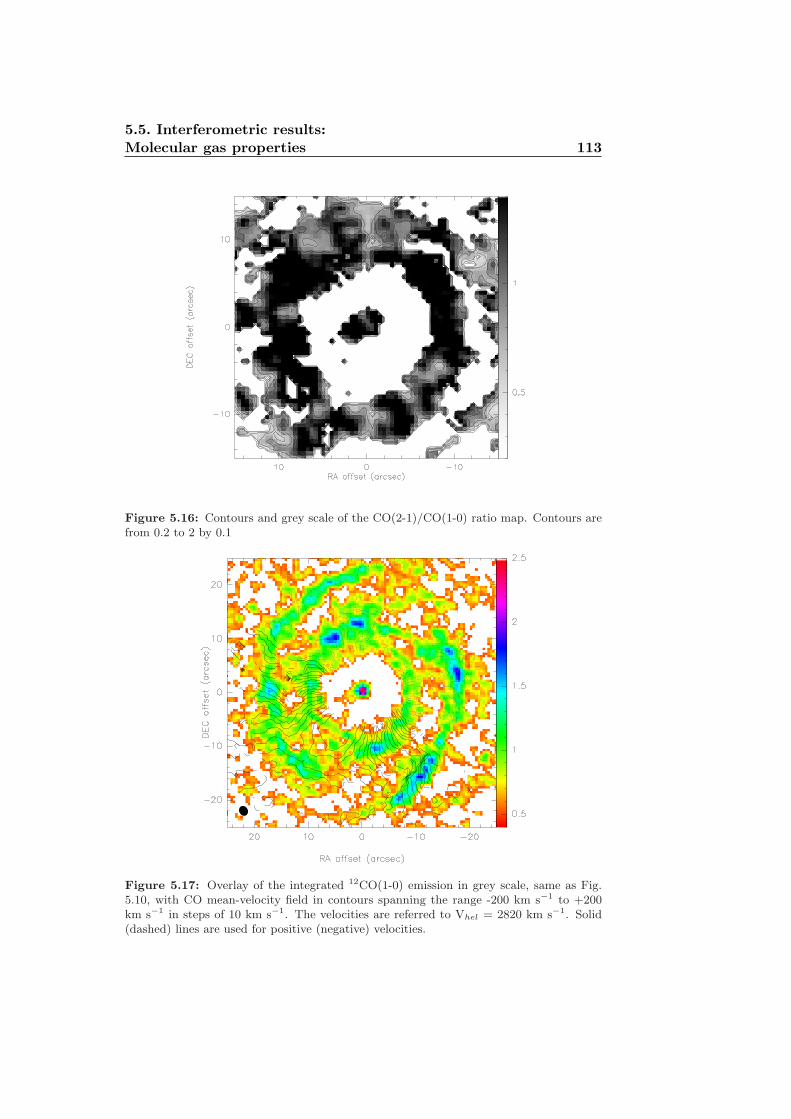
5.5. Interferometric results:
Molecular gas properties 113
Figure 5.16: Contours and grey scale of the CO(2-1)/CO(1-0) ratio map. Contours arefrom 0.2 to 2 by 0.1
Figure 5.17: Overlay of the integrated 12CO(1-0) emission in grey scale, same as Fig.5.10, with CO mean-velocity field in contours spanning the range -200 km s−1 to +200km s−1 in steps of 10 km s−1. The velocities are referred to Vhel = 2820 km s−1. Solid(dashed) lines are used for positive (negative) velocities.
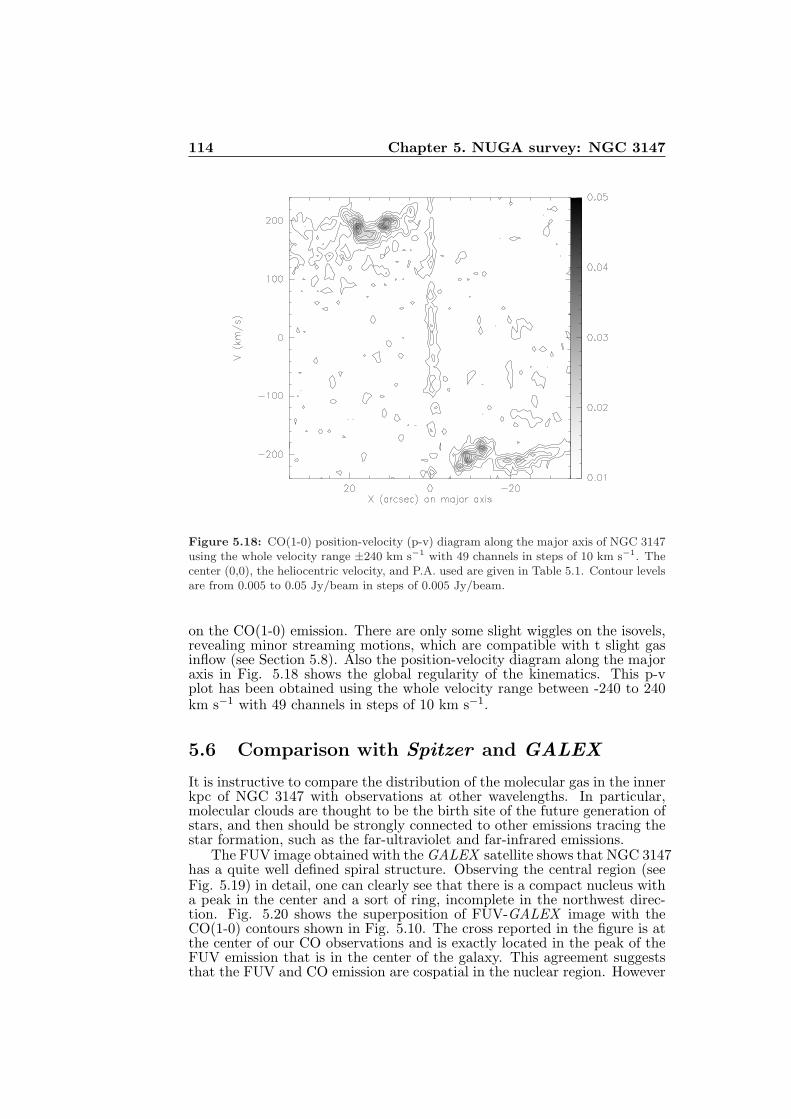
114 Chapter 5. NUGA survey: NGC 3147
Figure 5.18: CO(1-0) position-velocity (p-v) diagram along the major axis of NGC 3147using the whole velocity range ±240 km s−1 with 49 channels in steps of 10 km s−1. Thecenter (0,0), the heliocentric velocity, and P.A. used are given in Table 5.1. Contour levelsare from 0.005 to 0.05 Jy/beam in steps of 0.005 Jy/beam.
on the CO(1-0) emission. There are only some slight wiggles on the isovels,revealing minor streaming motions, which are compatible with t slight gasinflow (see Section 5.8). Also the position-velocity diagram along the majoraxis in Fig. 5.18 shows the global regularity of the kinematics. This p-vplot has been obtained using the whole velocity range between -240 to 240km s−1 with 49 channels in steps of 10 km s−1.
5.6 Comparison with Spitzer and GALEX
It is instructive to compare the distribution of the molecular gas in the innerkpc of NGC 3147 with observations at other wavelengths. In particular,molecular clouds are thought to be the birth site of the future generation ofstars, and then should be strongly connected to other emissions tracing thestar formation, such as the far-ultraviolet and far-infrared emissions.
The FUV image obtained with the GALEX satellite shows that NGC 3147has a quite well defined spiral structure. Observing the central region (seeFig. 5.19) in detail, one can clearly see that there is a compact nucleus witha peak in the center and a sort of ring, incomplete in the northwest direc-tion. Fig. 5.20 shows the superposition of FUV-GALEX image with theCO(1-0) contours shown in Fig. 5.10. The cross reported in the figure is atthe center of our CO observations and is exactly located in the peak of theFUV emission that is in the center of the galaxy. This agreement suggeststhat the FUV and CO emission are cospatial in the nuclear region. However
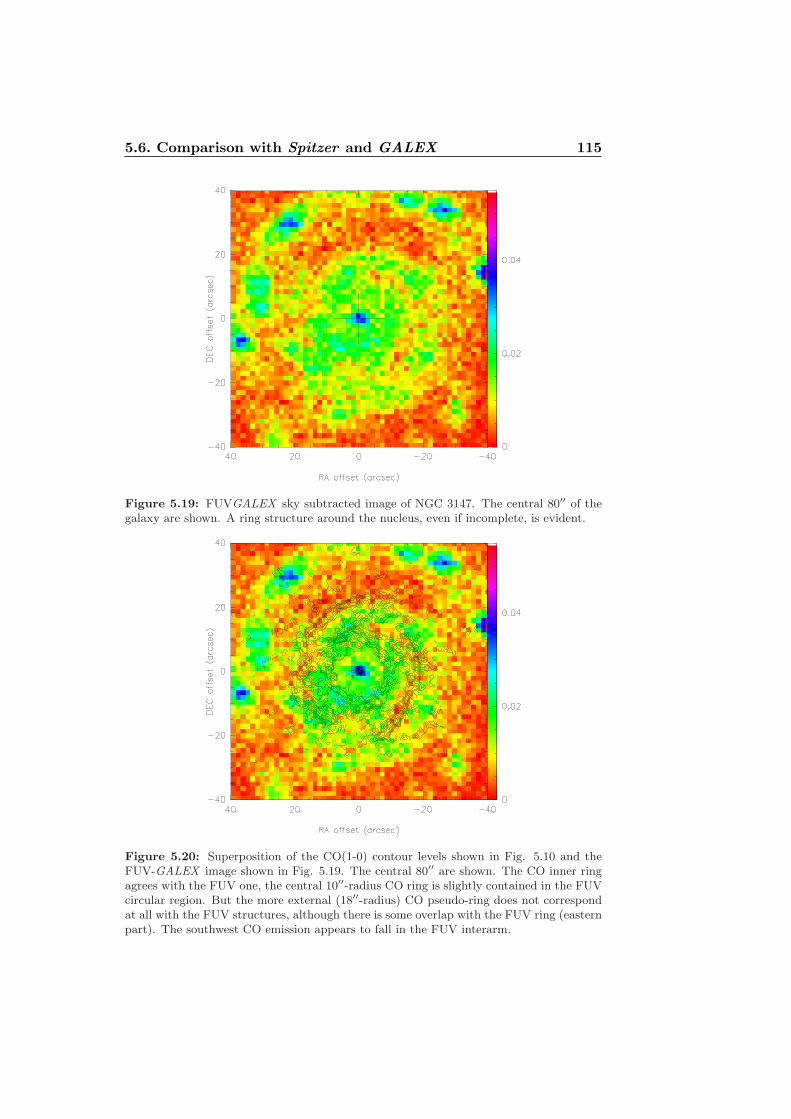
5.6. Comparison with Spitzer and GALEX 115
Figure 5.19: FUVGALEX sky subtracted image of NGC 3147. The central 80′′ of thegalaxy are shown. A ring structure around the nucleus, even if incomplete, is evident.
Figure 5.20: Superposition of the CO(1-0) contour levels shown in Fig. 5.10 and theFUV-GALEX image shown in Fig. 5.19. The central 80′′ are shown. The CO inner ringagrees with the FUV one, the central 10′′-radius CO ring is slightly contained in the FUVcircular region. But the more external (18′′-radius) CO pseudo-ring does not correspondat all with the FUV structures, although there is some overlap with the FUV ring (easternpart). The southwest CO emission appears to fall in the FUV interarm.
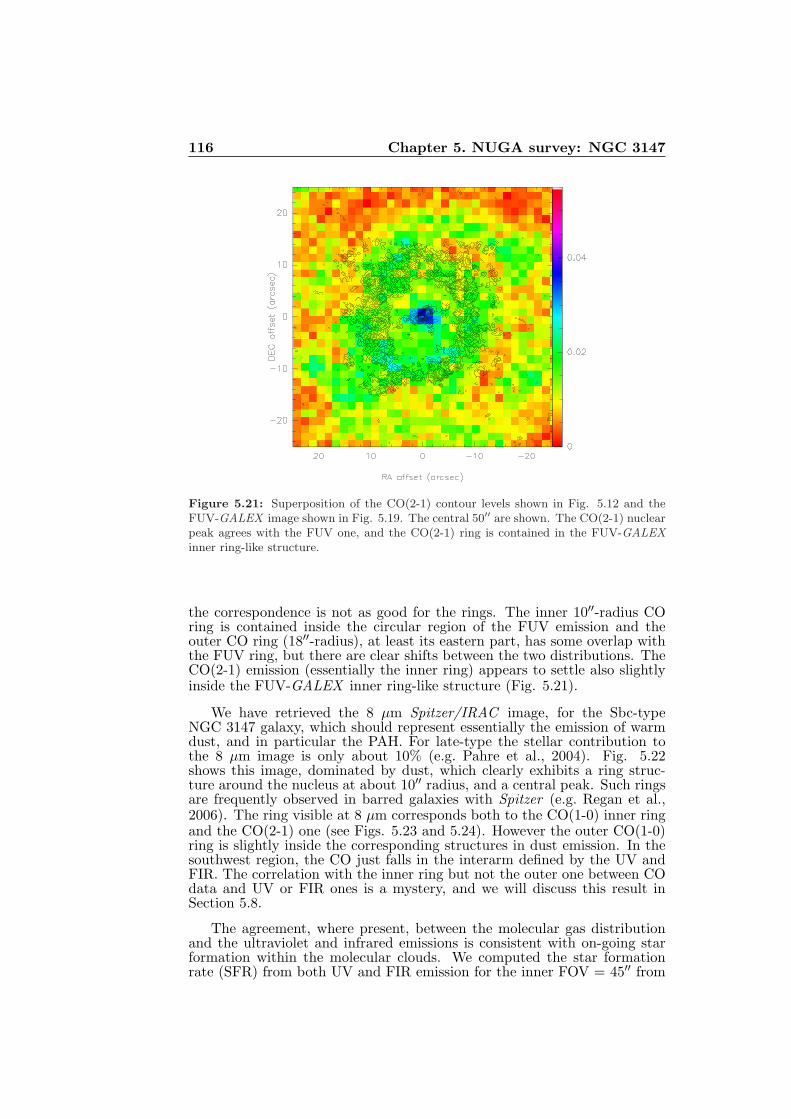
116 Chapter 5. NUGA survey: NGC 3147
Figure 5.21: Superposition of the CO(2-1) contour levels shown in Fig. 5.12 and theFUV-GALEX image shown in Fig. 5.19. The central 50′′ are shown. The CO(2-1) nuclearpeak agrees with the FUV one, and the CO(2-1) ring is contained in the FUV-GALEXinner ring-like structure.
the correspondence is not as good for the rings. The inner 10′′-radius COring is contained inside the circular region of the FUV emission and theouter CO ring (18′′-radius), at least its eastern part, has some overlap withthe FUV ring, but there are clear shifts between the two distributions. TheCO(2-1) emission (essentially the inner ring) appears to settle also slightlyinside the FUV-GALEX inner ring-like structure (Fig. 5.21).
We have retrieved the 8 µm Spitzer/IRAC image, for the Sbc-typeNGC 3147 galaxy, which should represent essentially the emission of warmdust, and in particular the PAH. For late-type the stellar contribution tothe 8 µm image is only about 10% (e.g. Pahre et al., 2004). Fig. 5.22shows this image, dominated by dust, which clearly exhibits a ring struc-ture around the nucleus at about 10′′ radius, and a central peak. Such ringsare frequently observed in barred galaxies with Spitzer (e.g. Regan et al.,2006). The ring visible at 8 µm corresponds both to the CO(1-0) inner ringand the CO(2-1) one (see Figs. 5.23 and 5.24). However the outer CO(1-0)ring is slightly inside the corresponding structures in dust emission. In thesouthwest region, the CO just falls in the interarm defined by the UV andFIR. The correlation with the inner ring but not the outer one between COdata and UV or FIR ones is a mystery, and we will discuss this result inSection 5.8.
The agreement, where present, between the molecular gas distributionand the ultraviolet and infrared emissions is consistent with on-going starformation within the molecular clouds. We computed the star formationrate (SFR) from both UV and FIR emission for the inner FOV = 45′′ from
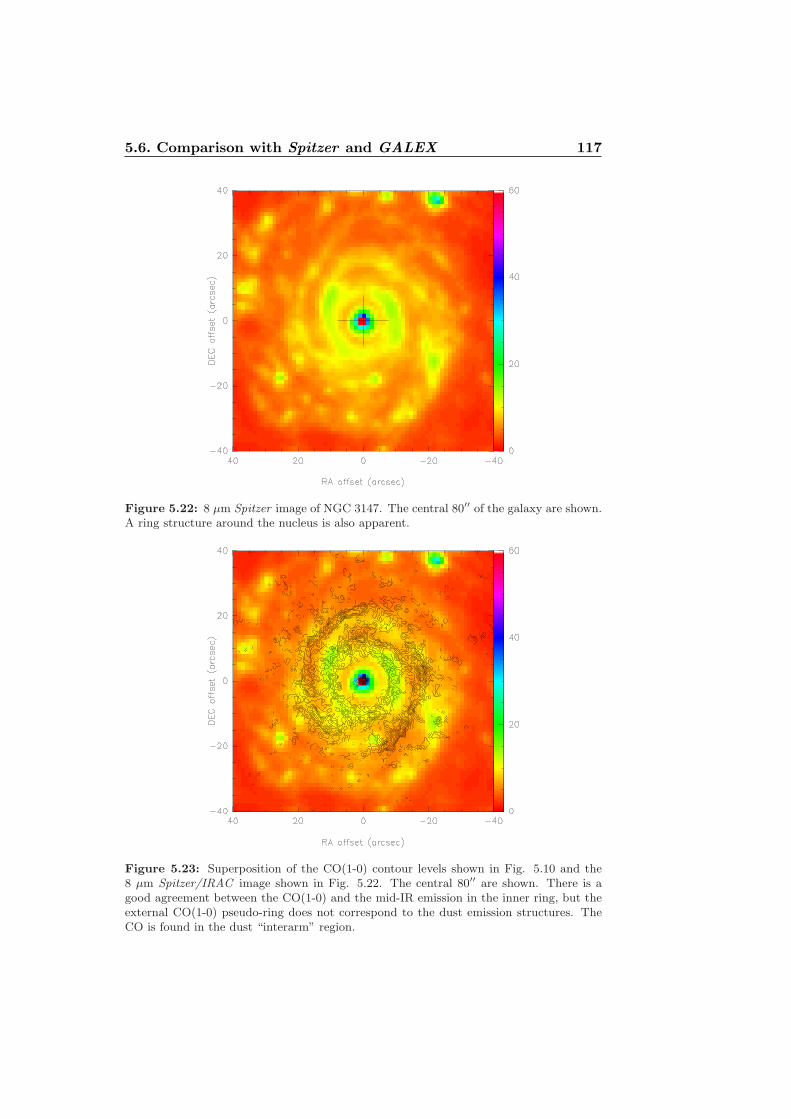
5.6. Comparison with Spitzer and GALEX 117
Figure 5.22: 8 µm Spitzer image of NGC 3147. The central 80′′ of the galaxy are shown.A ring structure around the nucleus is also apparent.
Figure 5.23: Superposition of the CO(1-0) contour levels shown in Fig. 5.10 and the8 µm Spitzer/IRAC image shown in Fig. 5.22. The central 80′′ are shown. There is agood agreement between the CO(1-0) and the mid-IR emission in the inner ring, but theexternal CO(1-0) pseudo-ring does not correspond to the dust emission structures. TheCO is found in the dust “interarm” region.
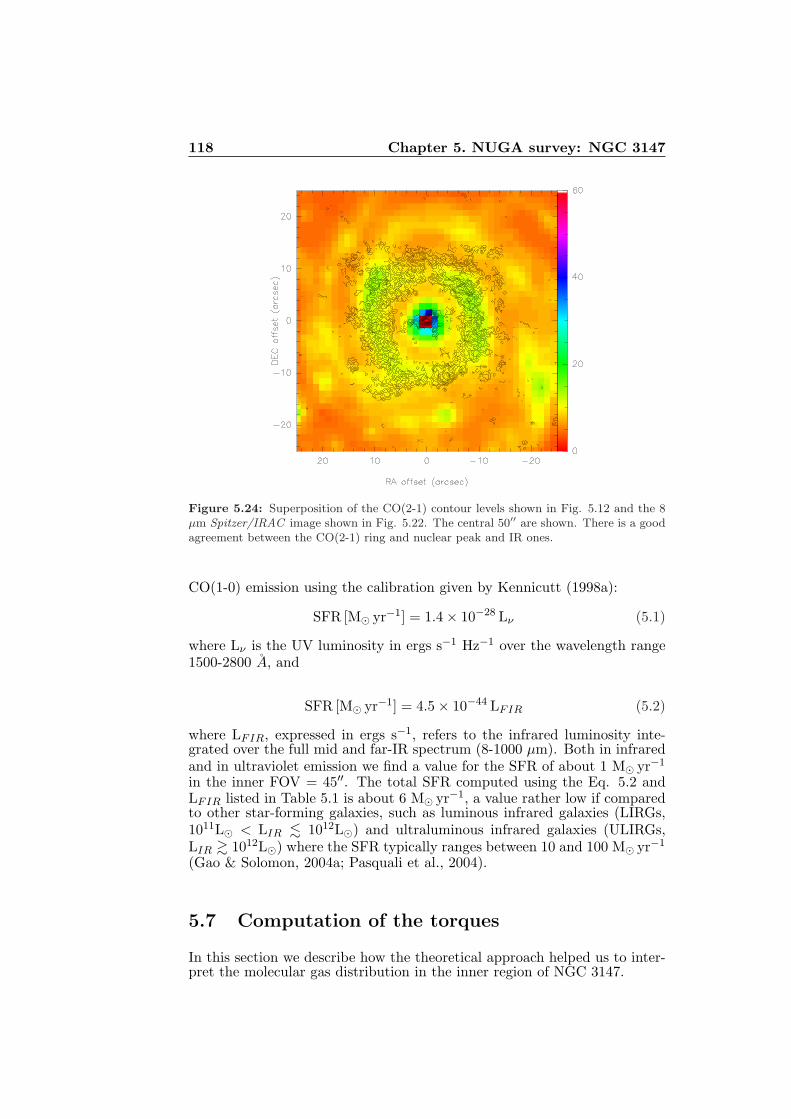
118 Chapter 5. NUGA survey: NGC 3147
Figure 5.24: Superposition of the CO(2-1) contour levels shown in Fig. 5.12 and the 8µm Spitzer/IRAC image shown in Fig. 5.22. The central 50′′ are shown. There is a goodagreement between the CO(2-1) ring and nuclear peak and IR ones.
CO(1-0) emission using the calibration given by Kennicutt (1998a):
SFR [M⊙ yr−1] = 1.4 × 10⁻²⁸ Lν (5.1)
where Lν is the UV luminosity in ergs s−1 Hz−1 over the wavelength range1500-2800 A, and
SFR [M⊙ yr−1] = 4.5 × 10−44 LFIR (5.2)
where LFIR, expressed in ergs s−1, refers to the infrared luminosity inte-grated over the full mid and far-IR spectrum (8-1000 µm). Both in infraredand in ultraviolet emission we find a value for the SFR of about 1 M⊙ yr−1
in the inner FOV = 45′′. The total SFR computed using the Eq. 5.2 andLFIR listed in Table 5.1 is about 6 M⊙ yr−1, a value rather low if comparedto other star-forming galaxies, such as luminous infrared galaxies (LIRGs,1011L⊙ < LIR . 1012L⊙) and ultraluminous infrared galaxies (ULIRGs,LIR & 1012L⊙) where the SFR typically ranges between 10 and 100 M⊙ yr−1
(Gao & Solomon, 2004a; Pasquali et al., 2004).
5.7 Computation of the torques
In this section we describe how the theoretical approach helped us to inter-pret the molecular gas distribution in the inner region of NGC 3147.
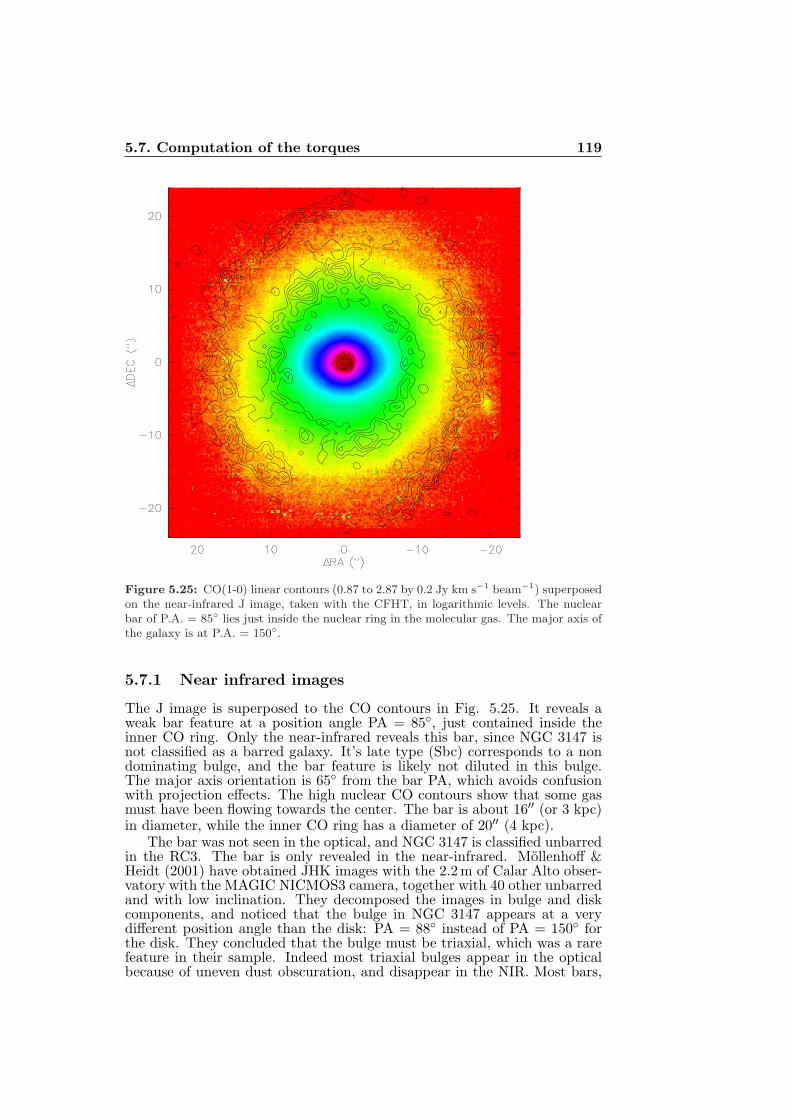
5.7. Computation of the torques 119
Figure 5.25: CO(1-0) linear contours (0.87 to 2.87 by 0.2 Jy km s−1 beam−1) superposedon the near-infrared J image, taken with the CFHT, in logarithmic levels. The nuclearbar of P.A. = 85 lies just inside the nuclear ring in the molecular gas. The major axis ofthe galaxy is at P.A. = 150.
5.7.1 Near infrared images
The J image is superposed to the CO contours in Fig. 5.25. It reveals aweak bar feature at a position angle PA = 85, just contained inside theinner CO ring. Only the near-infrared reveals this bar, since NGC 3147 isnot classified as a barred galaxy. It’s late type (Sbc) corresponds to a nondominating bulge, and the bar feature is likely not diluted in this bulge.The major axis orientation is 65 from the bar PA, which avoids confusionwith projection effects. The high nuclear CO contours show that some gasmust have been flowing towards the center. The bar is about 16′′ (or 3 kpc)in diameter, while the inner CO ring has a diameter of 20′′ (4 kpc).
The bar was not seen in the optical, and NGC 3147 is classified unbarredin the RC3. The bar is only revealed in the near-infrared. Mollenhoff &Heidt (2001) have obtained JHK images with the 2.2 m of Calar Alto obser-vatory with the MAGIC NICMOS3 camera, together with 40 other unbarredand with low inclination. They decomposed the images in bulge and diskcomponents, and noticed that the bulge in NGC 3147 appears at a verydifferent position angle than the disk: PA = 88 instead of PA = 150 forthe disk. They concluded that the bulge must be triaxial, which was a rarefeature in their sample. Indeed most triaxial bulges appear in the opticalbecause of uneven dust obscuration, and disappear in the NIR. Most bars,
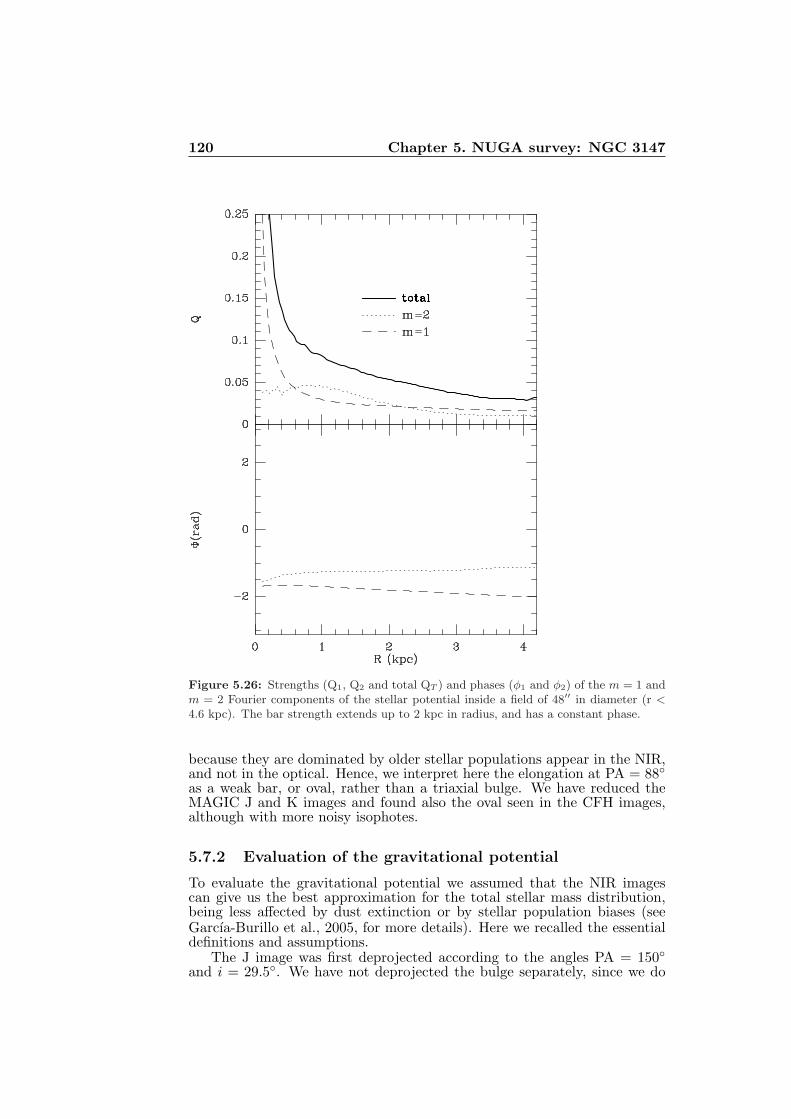
120 Chapter 5. NUGA survey: NGC 3147
Figure 5.26: Strengths (Q1, Q2 and total QT ) and phases (φ1 and φ2) of the m = 1 andm = 2 Fourier components of the stellar potential inside a field of 48′′ in diameter (r <4.6 kpc). The bar strength extends up to 2 kpc in radius, and has a constant phase.
because they are dominated by older stellar populations appear in the NIR,and not in the optical. Hence, we interpret here the elongation at PA = 88
as a weak bar, or oval, rather than a triaxial bulge. We have reduced theMAGIC J and K images and found also the oval seen in the CFH images,although with more noisy isophotes.
5.7.2 Evaluation of the gravitational potential
To evaluate the gravitational potential we assumed that the NIR imagescan give us the best approximation for the total stellar mass distribution,being less affected by dust extinction or by stellar population biases (seeGarcıa-Burillo et al., 2005, for more details). Here we recalled the essentialdefinitions and assumptions.
The J image was first deprojected according to the angles PA = 150
and i = 29.5. We have not deprojected the bulge separately, since we do
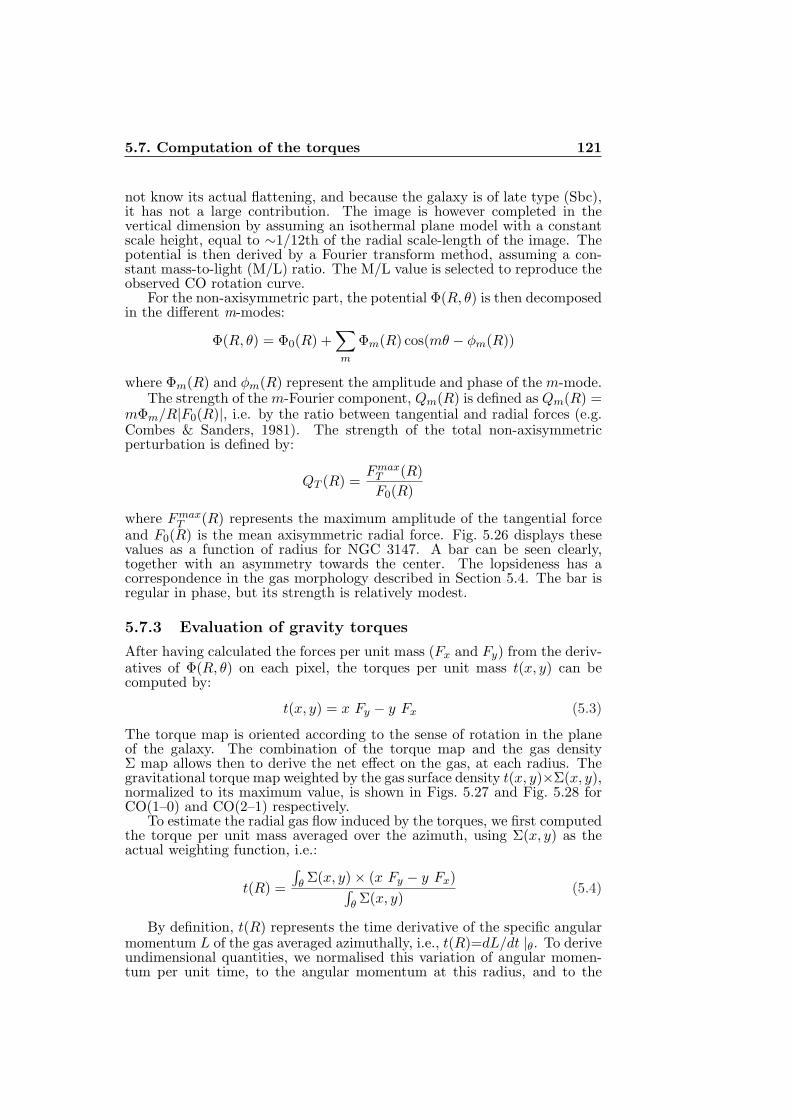
5.7. Computation of the torques 121
not know its actual flattening, and because the galaxy is of late type (Sbc),it has not a large contribution. The image is however completed in thevertical dimension by assuming an isothermal plane model with a constantscale height, equal to ∼1/12th of the radial scale-length of the image. Thepotential is then derived by a Fourier transform method, assuming a con-stant mass-to-light (M/L) ratio. The M/L value is selected to reproduce theobserved CO rotation curve.
For the non-axisymmetric part, the potential Φ(R, θ) is then decomposedin the different m-modes:
Φ(R, θ) = Φ0(R) +∑
m
Φm(R) cos(mθ − φm(R))
where Φm(R) and φm(R) represent the amplitude and phase of the m-mode.The strength of the m-Fourier component, Qm(R) is defined as Qm(R) =
mΦm/R|F0(R)|, i.e. by the ratio between tangential and radial forces (e.g.Combes & Sanders, 1981). The strength of the total non-axisymmetricperturbation is defined by:
QT (R) =Fmax
T (R)
F0(R)
where FmaxT (R) represents the maximum amplitude of the tangential force
and F0(R) is the mean axisymmetric radial force. Fig. 5.26 displays thesevalues as a function of radius for NGC 3147. A bar can be seen clearly,together with an asymmetry towards the center. The lopsideness has acorrespondence in the gas morphology described in Section 5.4. The bar isregular in phase, but its strength is relatively modest.
5.7.3 Evaluation of gravity torques
After having calculated the forces per unit mass (Fx and Fy) from the deriv-atives of Φ(R, θ) on each pixel, the torques per unit mass t(x, y) can becomputed by:
t(x, y) = x Fy − y Fx (5.3)
The torque map is oriented according to the sense of rotation in the planeof the galaxy. The combination of the torque map and the gas densityΣ map allows then to derive the net effect on the gas, at each radius. Thegravitational torque map weighted by the gas surface density t(x, y)×Σ(x, y),normalized to its maximum value, is shown in Figs. 5.27 and Fig. 5.28 forCO(1–0) and CO(2–1) respectively.
To estimate the radial gas flow induced by the torques, we first computedthe torque per unit mass averaged over the azimuth, using Σ(x, y) as theactual weighting function, i.e.:
t(R) =
∫
θ Σ(x, y) × (x Fy − y Fx)∫
θ Σ(x, y)(5.4)
By definition, t(R) represents the time derivative of the specific angularmomentum L of the gas averaged azimuthally, i.e., t(R)=dL/dt |θ. To deriveundimensional quantities, we normalised this variation of angular momen-tum per unit time, to the angular momentum at this radius, and to the
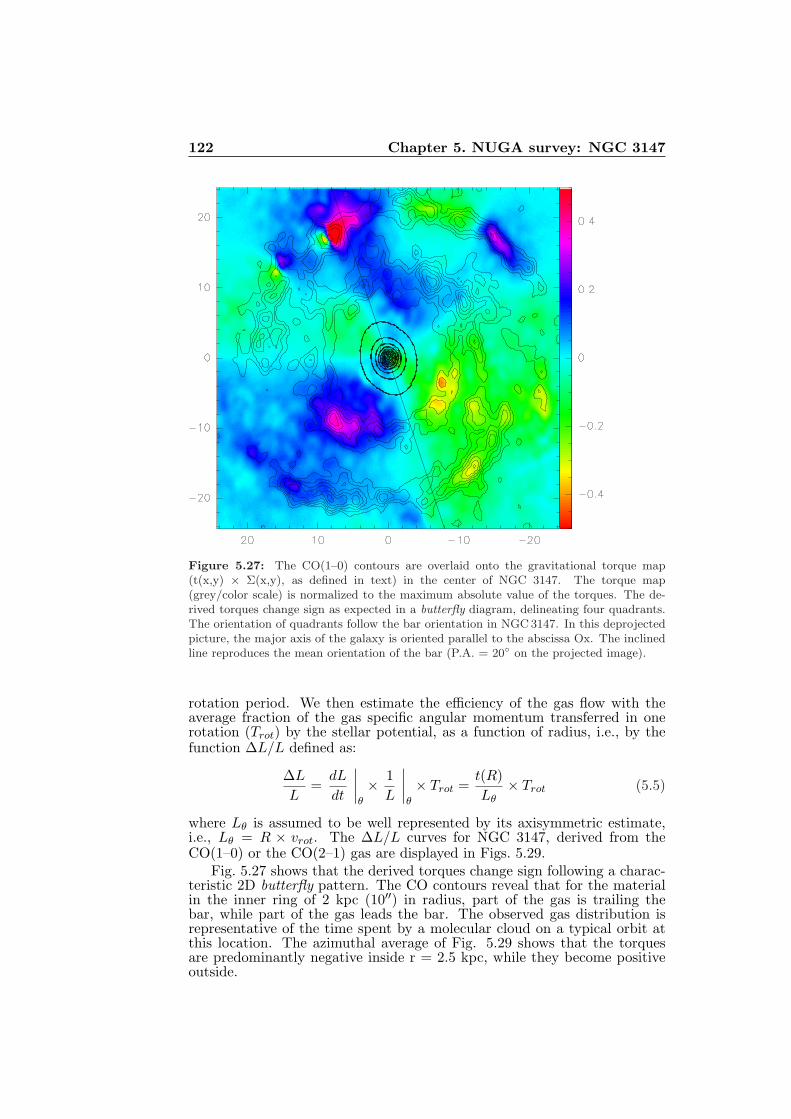
122 Chapter 5. NUGA survey: NGC 3147
Figure 5.27: The CO(1–0) contours are overlaid onto the gravitational torque map(t(x,y) × Σ(x,y), as defined in text) in the center of NGC 3147. The torque map(grey/color scale) is normalized to the maximum absolute value of the torques. The de-rived torques change sign as expected in a butterfly diagram, delineating four quadrants.The orientation of quadrants follow the bar orientation in NGC 3147. In this deprojectedpicture, the major axis of the galaxy is oriented parallel to the abscissa Ox. The inclinedline reproduces the mean orientation of the bar (P.A. = 20 on the projected image).
rotation period. We then estimate the efficiency of the gas flow with theaverage fraction of the gas specific angular momentum transferred in onerotation (Trot) by the stellar potential, as a function of radius, i.e., by thefunction ∆L/L defined as:
∆L
L=
dL
dt
∣
∣
∣
∣
θ
× 1
L
∣
∣
∣
∣
θ
× Trot =t(R)
Lθ× Trot (5.5)
where Lθ is assumed to be well represented by its axisymmetric estimate,i.e., Lθ = R × vrot. The ∆L/L curves for NGC 3147, derived from theCO(1–0) or the CO(2–1) gas are displayed in Figs. 5.29.
Fig. 5.27 shows that the derived torques change sign following a charac-teristic 2D butterfly pattern. The CO contours reveal that for the materialin the inner ring of 2 kpc (10′′) in radius, part of the gas is trailing thebar, while part of the gas leads the bar. The observed gas distribution isrepresentative of the time spent by a molecular cloud on a typical orbit atthis location. The azimuthal average of Fig. 5.29 shows that the torquesare predominantly negative inside r = 2.5 kpc, while they become positiveoutside.
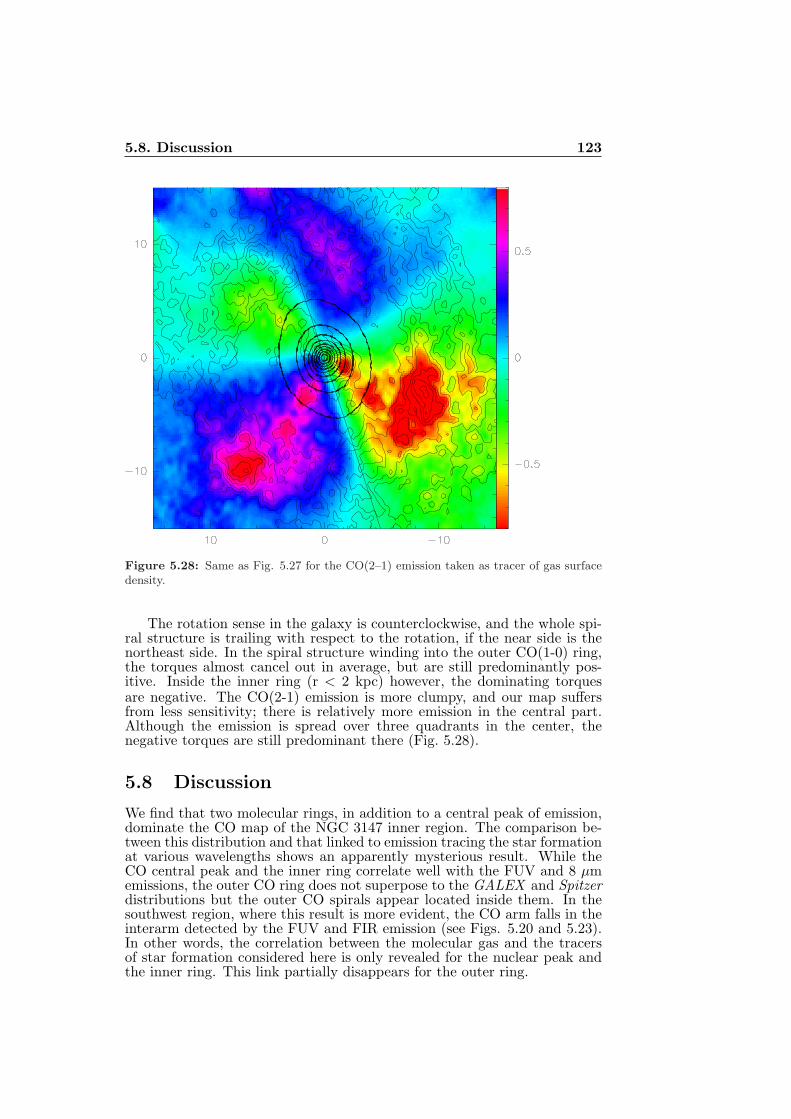
5.8. Discussion 123
Figure 5.28: Same as Fig. 5.27 for the CO(2–1) emission taken as tracer of gas surfacedensity.
The rotation sense in the galaxy is counterclockwise, and the whole spi-ral structure is trailing with respect to the rotation, if the near side is thenortheast side. In the spiral structure winding into the outer CO(1-0) ring,the torques almost cancel out in average, but are still predominantly pos-itive. Inside the inner ring (r < 2 kpc) however, the dominating torquesare negative. The CO(2-1) emission is more clumpy, and our map suffersfrom less sensitivity; there is relatively more emission in the central part.Although the emission is spread over three quadrants in the center, thenegative torques are still predominant there (Fig. 5.28).
5.8 Discussion
We find that two molecular rings, in addition to a central peak of emission,dominate the CO map of the NGC 3147 inner region. The comparison be-tween this distribution and that linked to emission tracing the star formationat various wavelengths shows an apparently mysterious result. While theCO central peak and the inner ring correlate well with the FUV and 8 µmemissions, the outer CO ring does not superpose to the GALEX and Spitzerdistributions but the outer CO spirals appear located inside them. In thesouthwest region, where this result is more evident, the CO arm falls in theinterarm detected by the FUV and FIR emission (see Figs. 5.20 and 5.23).In other words, the correlation between the molecular gas and the tracersof star formation considered here is only revealed for the nuclear peak andthe inner ring. This link partially disappears for the outer ring.
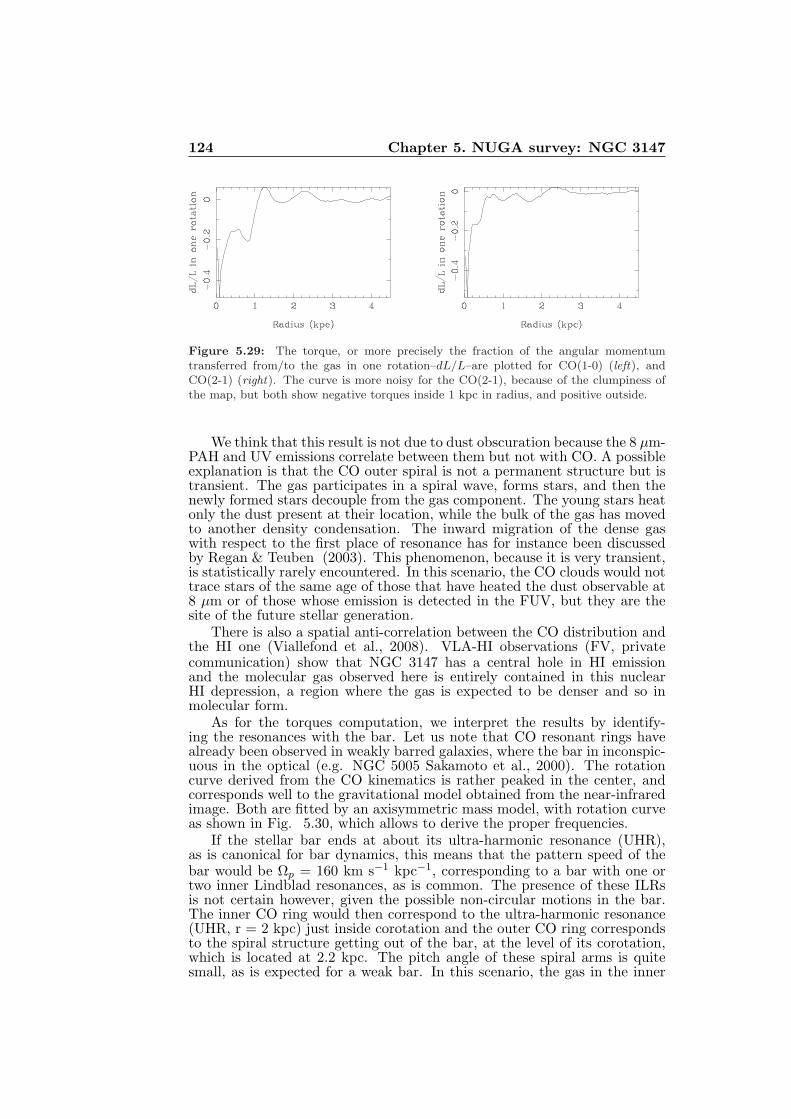
124 Chapter 5. NUGA survey: NGC 3147
Figure 5.29: The torque, or more precisely the fraction of the angular momentumtransferred from/to the gas in one rotation–dL/L–are plotted for CO(1-0) (left), andCO(2-1) (right). The curve is more noisy for the CO(2-1), because of the clumpiness ofthe map, but both show negative torques inside 1 kpc in radius, and positive outside.
We think that this result is not due to dust obscuration because the 8 µm-PAH and UV emissions correlate between them but not with CO. A possibleexplanation is that the CO outer spiral is not a permanent structure but istransient. The gas participates in a spiral wave, forms stars, and then thenewly formed stars decouple from the gas component. The young stars heatonly the dust present at their location, while the bulk of the gas has movedto another density condensation. The inward migration of the dense gaswith respect to the first place of resonance has for instance been discussedby Regan & Teuben (2003). This phenomenon, because it is very transient,is statistically rarely encountered. In this scenario, the CO clouds would nottrace stars of the same age of those that have heated the dust observable at8 µm or of those whose emission is detected in the FUV, but they are thesite of the future stellar generation.
There is also a spatial anti-correlation between the CO distribution andthe HI one (Viallefond et al., 2008). VLA-HI observations (FV, privatecommunication) show that NGC 3147 has a central hole in HI emissionand the molecular gas observed here is entirely contained in this nuclearHI depression, a region where the gas is expected to be denser and so inmolecular form.
As for the torques computation, we interpret the results by identify-ing the resonances with the bar. Let us note that CO resonant rings havealready been observed in weakly barred galaxies, where the bar in inconspic-uous in the optical (e.g. NGC 5005 Sakamoto et al., 2000). The rotationcurve derived from the CO kinematics is rather peaked in the center, andcorresponds well to the gravitational model obtained from the near-infraredimage. Both are fitted by an axisymmetric mass model, with rotation curveas shown in Fig. 5.30, which allows to derive the proper frequencies.
If the stellar bar ends at about its ultra-harmonic resonance (UHR),as is canonical for bar dynamics, this means that the pattern speed of thebar would be Ωp = 160 km s−1 kpc−1, corresponding to a bar with one ortwo inner Lindblad resonances, as is common. The presence of these ILRsis not certain however, given the possible non-circular motions in the bar.The inner CO ring would then correspond to the ultra-harmonic resonance(UHR, r = 2 kpc) just inside corotation and the outer CO ring correspondsto the spiral structure getting out of the bar, at the level of its corotation,which is located at 2.2 kpc. The pitch angle of these spiral arms is quitesmall, as is expected for a weak bar. In this scenario, the gas in the inner
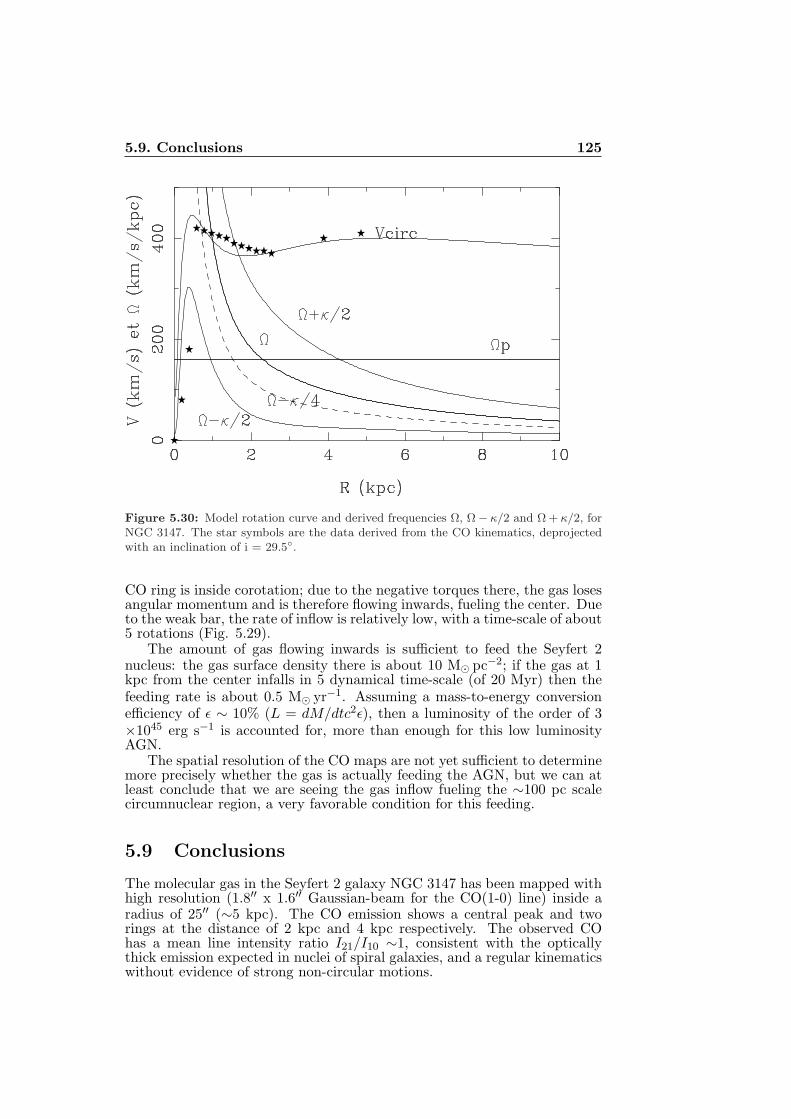
5.9. Conclusions 125
Figure 5.30: Model rotation curve and derived frequencies Ω, Ω − κ/2 and Ω + κ/2, forNGC 3147. The star symbols are the data derived from the CO kinematics, deprojectedwith an inclination of i = 29.5.
CO ring is inside corotation; due to the negative torques there, the gas losesangular momentum and is therefore flowing inwards, fueling the center. Dueto the weak bar, the rate of inflow is relatively low, with a time-scale of about5 rotations (Fig. 5.29).
The amount of gas flowing inwards is sufficient to feed the Seyfert 2nucleus: the gas surface density there is about 10 M⊙ pc−2; if the gas at 1kpc from the center infalls in 5 dynamical time-scale (of 20 Myr) then thefeeding rate is about 0.5 M⊙ yr−1. Assuming a mass-to-energy conversionefficiency of ǫ ∼ 10% (L = dM/dtc2ǫ), then a luminosity of the order of 3×1045 erg s−1 is accounted for, more than enough for this low luminosityAGN.
The spatial resolution of the CO maps are not yet sufficient to determinemore precisely whether the gas is actually feeding the AGN, but we can atleast conclude that we are seeing the gas inflow fueling the ∼100 pc scalecircumnuclear region, a very favorable condition for this feeding.
5.9 Conclusions
The molecular gas in the Seyfert 2 galaxy NGC 3147 has been mapped withhigh resolution (1.8′′ x 1.6′′ Gaussian-beam for the CO(1-0) line) inside aradius of 25′′ (∼5 kpc). The CO emission shows a central peak and tworings at the distance of 2 kpc and 4 kpc respectively. The observed COhas a mean line intensity ratio I21/I10 ∼1, consistent with the opticallythick emission expected in nuclei of spiral galaxies, and a regular kinematicswithout evidence of strong non-circular motions.
126 Chapter 5. NUGA survey: NGC 3147
Comparing the molecular gas distribution with other tracers of star for-mation, we find that central emission and the inner CO ring superpose wellto the FUV (GALEX ) and 8 µm emissions (Spitzer), while the outer COring does not superpose, but is contained inside the second interarm (SW)detected by GALEX and Spitzer. We interpret this partial disagreement asdue to the transient nature of the outer CO ring. It would be a structure inre-condensation that traces the future stellar generation, but decoupled fromthe recent and ongoing star formation traced by FUV and FIR emissions.
We have identified the presence of a weak bar in NGC 3147, galaxyclassified as non-barred in the optical, with a NIR image obtained with theCanada-France-Hawaii Telescope. This stellar bar acting on the gas pro-duces gravity torques. A part of gas present in the inner CO(1-0) ring istrailing the bar, while part of the gas leads the bar. The gravity torquesare negative inside a radius of 2.5 kpc, while they become positive outside.In the outer CO(1-0) ring the torques almost cancel out in average, but arepositive. In the more clumpy inner CO(2-1) ring, the predominant torquesare negative. We interpret these results by identifying the resonances withthe bar. The inner CO ring would correspond to the ultra-harmonic reso-nance (r = 2 kpc) just inside corotation, and the outer CO ring correspondsto the spiral structure getting out of the bar, at the level of its corotation,which is located at 2.2 kpc. In the inner CO ring the gas is inside corotationdue to the negative torques there, it loses angular momentum and is flowinginwards, fueling the center.
NGC 3147 is not the first case in the NUGA sample where gas has beenfound inflowing: NGC 2782 (Hunt et al., 2008), and NGC 6574 (Lindt-Krieget al., 2008) also show this feature. However, among them, only NGC 2782has a strong and significant inflow, due to a nuclear bar embedded in theprimary one, and with gas aligned with the nuclear bar. The amount of gasinflowing in NGC 3147, quantified from the gravity torques computation,is weak, but yet sufficient to feed the Seyfert 2 nucleus of NGC 3147 witha feeding rate of about 0.5 M⊙ yr−1. Even if higher spatial resolution isneeded to determine whether the gas is actually feeding the AGN, we areobserving the gas inflow fueling the ∼100 pc central region, a condition thatsurely favors the fueling of the AGN.
Chapter 6
Conclusions and FutureApplications
6.1 Conclusions and obtained results
In this Thesis we studied the small scale physics of the molecular gas innearby galaxies. The study of the interstellar medium in galaxies, in partic-ular the molecular gas component, is a subject currently in a strong technicaland scientific development.
A detailed work on the molecular component of the ISM must be facedstudying the spectral energy distribution with observations in a wide rangeof the galaxy spectrum. Each spectral range (for instance near infraredor microwaves) shows lines produced by different physical conditions. Theobservation of these lines in nearby galaxies allows to map the distributionof temperature, density and ionisation sources within the galaxy. If peculiarphenomena are present in a galaxy, they can modify the physical conditionsand their effect can be also mapped in comparison with normal galaxies.We produced detailed maps of molecular gas in galaxies close enough toseparate the single components, such as molecular clouds, diffuse gas, andionisation sources.
We started with the nearby galaxy Messier 81. We chose this galaxybecause considered interesting for its molecular gas content and physics ifcompared to galaxies with similar distances and morphological type. Byprevious studies the CO emission of M 81 appears remarkably weak, espe-cially in the central regions, and the molecular content is confined to the HIIregions in the spiral arms. The HI profile also reflects a central deficiency inatomic gas: the atomic gas is abundant only in the inner spiral arms of thegalaxy and the shapes and the motions observed in HI in the spiral armsquite clearly obey the predictions of the density-wave theory. This strongdensity wave is attributed to the tidal interaction with the other galaxies ofthe M 81 group. In addition, interacting galaxies exhibit higher CO lumi-nosity than non-interacting galaxies, but M 81 is different also consideringthis aspect. Finally, M 81 is also a good candidate for studying the variationof the H2 to CO conversion ratio in external galaxies. Performing IRAM30 m observations of the CO molecule in the central region of M 81, wefound that it is not only CO-poor, but that also has molecular clouds withnon-typical properties for similar galaxies. In addition to the absent or veryweak molecular gas emission, we found a low R21 (=0.68) line ratio and aparticularly high X conversion factor, 15.6 times higher than the standard
127
128 Chapter 6. Conclusions and Future Applications
X derived for our Galaxy and usually adopted for external galaxies. Thelow CO emission in the center suggests that the gas is subexcited, with evenweaker FUV emission. We concluded that the lack of excitation of the gas,more than the absence of molecular gas, is the cause of the low CO emissionin the center of M 81 (Casasola et al., 2007a).
In this Thesis we studied in detail the molecular gas content of anothergalaxy, the Seyfert 2 NGC 3147, an object of the NUGA survey (Garcıa-Burillo et al., 2003; Combes et al., 2004). NUGA was born with the ideato map the distribution and dynamics of the molecular gas with the IRAMPlateau de Bure Interferometer in the inner 1 kpc of the nuclei at highspatial resolution and to study the mechanisms for gas fueling of the differ-ent low-luminosity AGNs. Analyzing both interferometric and single-dishobservations performed in the central region of NGC 3147, we detected anuclear emission and two molecular rings or pseudo-rings at r∼10 kpc andr∼20 kpc respectively in the CO(1-0) map, and a nuclear emission and asingle central ring at r∼10 kpc in the CO(2-1) map. Comparing the two COtransitions we found a mean line ratio I21/I10 ∼ 1, consistent with the ma-jority of the expected emission optically thick in the nuclei of spiral galaxies.Studying the kinematics we found that the detected rings are quite regularwithout evidence of non-circular motions. Since molecular clouds are thesite of the future generation of stars, we compared the detected CO distri-bution with observations at wavelengths tracing the star formation, such asthe far-ultraviolet and far-infrared emissions. We found that the moleculargas distribution has counterparts in the infrared emission (Spitzer) and inthe ultraviolet one (GALEX ). Then, identifying the presence of a bar inNGC 3147 (classified as non-barred galaxy in the optical) by a NIR image,we computed the gravity torques exerted from this stellar bar on the gas.We found that the gas in the main central CO pseudo-ring is subject toa dominant negative torque and loses angular momentum. This conditionis expected for gas at ultra-harmonic resonance, just inside the corotationof the stellar bar. On the contrary, the gas outside the corotation, in spi-ral arms forming the external pseudoring, suffers positive torques and isdriven outwards. We concluded that the gas inflow fueling the ∼100 pcscale circumnuclear region is active, and that this condition is favorable forthe feeding of the low-luminosity Seyfert 2 observed in NGC 3147 (Casasolaet al., 2007b).
In combination with these two specific studies on the molecular gas,in this Thesis we also analyzed the relations between different components(also the molecular one) of the ISM for a large sample of galaxies of all themorphologies, activity, and interaction. We found that the known relation-ship between the CO and the 100 µm fluxes for early-type galaxies is alsovalid for late-type systems, and that in spiral galaxies the X-ray flux appearslinked to B and FIR emissions. On the contrary, the relation between LXand LFIR for early-type galaxies, both active and non-active, is lacking. Weinterpreted the observed lack of a direct relation between LX and LFIR forearly-type galaxies like probably due to the different mechanisms produc-ing FIR light in galaxies where the active star formation is no longer active(Galletta et al., 2007). In elliptical galaxies the infrared emission can be nostrongly related to the ongoing star formation and to the reprocessing of theradiation in the dense regions where new stars are born. In this picture, theFIR emission comes most likely from circumstellar dusty shells around AGBstars and from an interstellar diffuse medium due to the outflow of dustygas from AGB and RGB stars. However, it is important also to rememberthat in the literature it has been considered the opposite scenario, where the
6.2. The future: ALMA 129
FIR emission and the star formation are linked between them in early-typegalaxies similarly to late-type systems (Combes et al., 2007).
6.2 The future: ALMA
Why a Thesis on the molecular gas in external galaxies?We decided to analyze the small scale physics of the molecular gas in nearbygalaxies because submillimeter/millimeter astronomy is entering a period ofgreat discovery. These wavebands are unique in astronomy in containingmore than 1000 radio spectral lines of interstellar and circumstellar mole-cules as well as the thermal continuum spectrum of cold dust in space. Theyare also the only bands in the electromagnetic spectrum in which we candetect cold dust and molecules far away in young, high-redshift galaxies inthe early Universe, and nearby in low-temperature cocoons of protostars inour own Galaxy. They are the only bands that can give us the fine-scalekinematic details in young stellar disks that can potentially form planets,and in old ejected stellar envelopes that are forming dust grains and enrich-ing the interstellar medium with carbon, oxygen and nitrogen. Millimeterbands lie at the crossroads between the radio and infrared/optical wave-bands, containing both the synchrotron emission extending from the radioand the thermal emission extending from the optical/infrared. They containthe peak of the microwave background.
On the basis of these considerations it was born the idea of a new tele-scope for millimeter astronomy: the Atacama Large Millimeter Array -ALMA. Advanced projects of large interferometers were first simultaneouslystudied in early 1990 in the United States (MMA), Europe (LSA) and Japan(LMSA). It was then decided to merge them in a unique world-wide projectwith much improved capabilities, ALMA. The latter is currently a jointproject between Europe (ESO), North America & Canada (NRAO) andJapan (NAOJ) with the participation of Chile. The ALMA interferome-ter will be installed in an exceptional site for submillimeter observations,at Chajnantor, Atacama, Chile, at 5010 m elevation. It will include up to64×12m-dishes, providing a very good coverage in the uv interferometricplane (see Figs. 6.1 and 6.2). It will operate in four frequency bands, cover-ing four of the main atmospheric windows between 0.4 mm and 4 mm, andwill be equipped with very broad band heterodyne receivers and correlators.Compared to existing facilities, its sensitivity and angular resolution will beincreased by almost two orders of magnitude. The construction of ALMAstarted in 2003 and will be completed in 2012; it will become incremen-tally operational from 2010 on. ALMA will operate at wavelengths of 0.3to 9.6 millimeters, where the Earth’s atmosphere above a high, dry site islargely transparent, and will provide astronomers unprecedented sensitivityand resolution. The array will have reconfigurable baselines ranging from150 m to 18 km. Resolutions as fine as 0.005′′ will be achieved at the highestfrequencies, a factor of ten better than HST.
ALMA will be a great step for astronomy, and will bring a revolutionin millimeter astronomy. ALMA will play a role similar to HST in theoptical by opening a completely new range of observational possibilities.There will be no equivalent until ALMA is operational, and it will cover allmajor topics in astronomy from comets to cosmology, from astrometry toexo-biology, with a special impact in understanding the origins of galaxies,stars, and planets.
This PhD Thesis had the aim to prepare ourselves on a very important
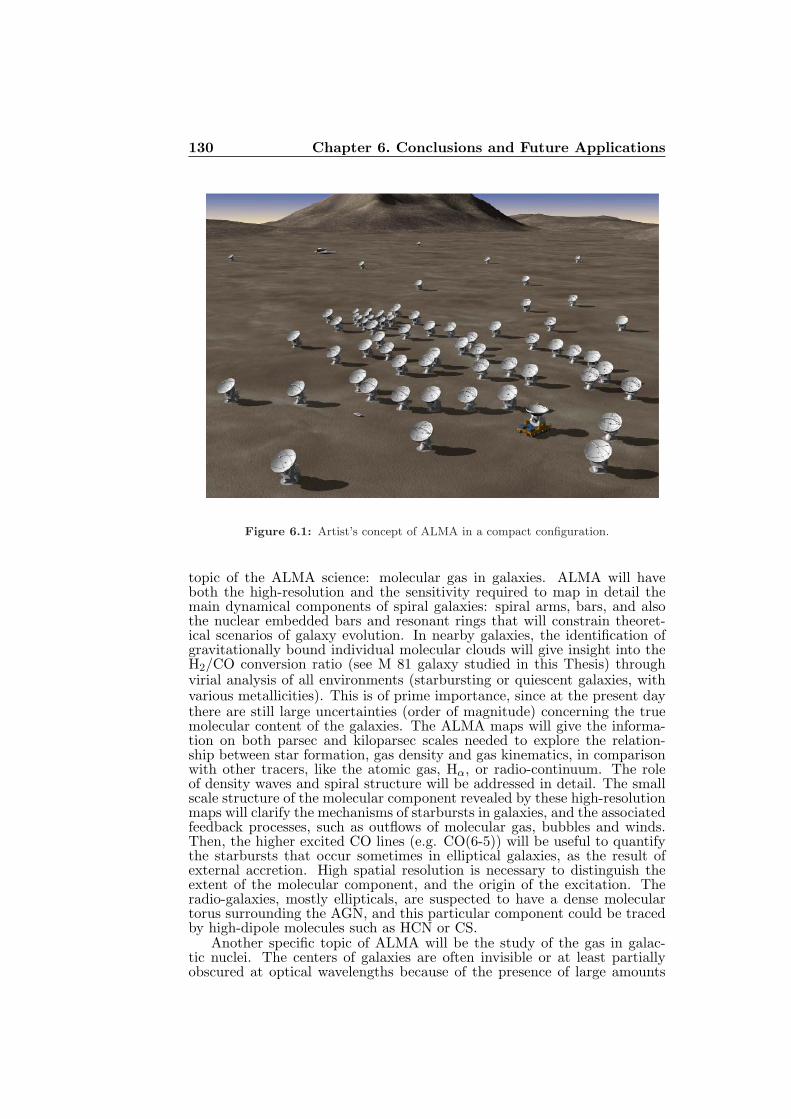
130 Chapter 6. Conclusions and Future Applications
Figure 6.1: Artist’s concept of ALMA in a compact configuration.
topic of the ALMA science: molecular gas in galaxies. ALMA will haveboth the high-resolution and the sensitivity required to map in detail themain dynamical components of spiral galaxies: spiral arms, bars, and alsothe nuclear embedded bars and resonant rings that will constrain theoret-ical scenarios of galaxy evolution. In nearby galaxies, the identification ofgravitationally bound individual molecular clouds will give insight into theH2/CO conversion ratio (see M 81 galaxy studied in this Thesis) throughvirial analysis of all environments (starbursting or quiescent galaxies, withvarious metallicities). This is of prime importance, since at the present daythere are still large uncertainties (order of magnitude) concerning the truemolecular content of the galaxies. The ALMA maps will give the informa-tion on both parsec and kiloparsec scales needed to explore the relation-ship between star formation, gas density and gas kinematics, in comparisonwith other tracers, like the atomic gas, Hα, or radio-continuum. The roleof density waves and spiral structure will be addressed in detail. The smallscale structure of the molecular component revealed by these high-resolutionmaps will clarify the mechanisms of starbursts in galaxies, and the associatedfeedback processes, such as outflows of molecular gas, bubbles and winds.Then, the higher excited CO lines (e.g. CO(6-5)) will be useful to quantifythe starbursts that occur sometimes in elliptical galaxies, as the result ofexternal accretion. High spatial resolution is necessary to distinguish theextent of the molecular component, and the origin of the excitation. Theradio-galaxies, mostly ellipticals, are suspected to have a dense moleculartorus surrounding the AGN, and this particular component could be tracedby high-dipole molecules such as HCN or CS.
Another specific topic of ALMA will be the study of the gas in galac-tic nuclei. The centers of galaxies are often invisible or at least partiallyobscured at optical wavelengths because of the presence of large amounts
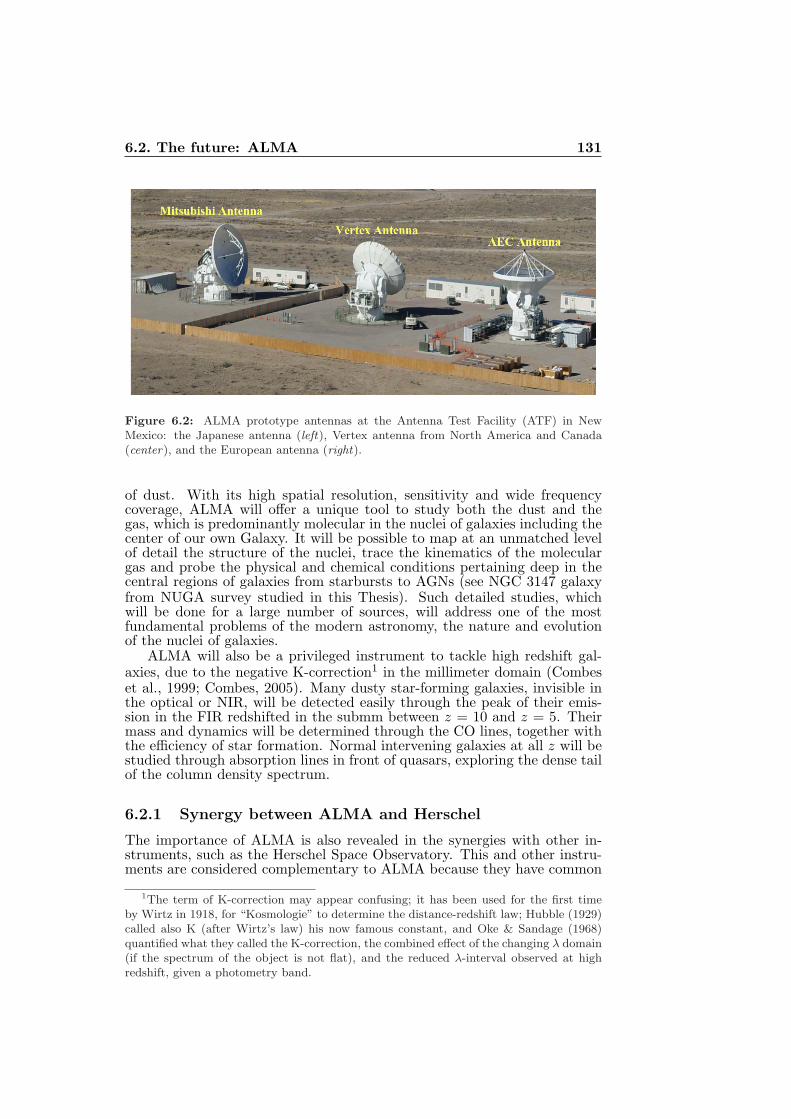
6.2. The future: ALMA 131
Figure 6.2: ALMA prototype antennas at the Antenna Test Facility (ATF) in NewMexico: the Japanese antenna (left), Vertex antenna from North America and Canada(center), and the European antenna (right).
of dust. With its high spatial resolution, sensitivity and wide frequencycoverage, ALMA will offer a unique tool to study both the dust and thegas, which is predominantly molecular in the nuclei of galaxies including thecenter of our own Galaxy. It will be possible to map at an unmatched levelof detail the structure of the nuclei, trace the kinematics of the moleculargas and probe the physical and chemical conditions pertaining deep in thecentral regions of galaxies from starbursts to AGNs (see NGC 3147 galaxyfrom NUGA survey studied in this Thesis). Such detailed studies, whichwill be done for a large number of sources, will address one of the mostfundamental problems of the modern astronomy, the nature and evolutionof the nuclei of galaxies.
ALMA will also be a privileged instrument to tackle high redshift gal-axies, due to the negative K-correction1 in the millimeter domain (Combeset al., 1999; Combes, 2005). Many dusty star-forming galaxies, invisible inthe optical or NIR, will be detected easily through the peak of their emis-sion in the FIR redshifted in the submm between z = 10 and z = 5. Theirmass and dynamics will be determined through the CO lines, together withthe efficiency of star formation. Normal intervening galaxies at all z will bestudied through absorption lines in front of quasars, exploring the dense tailof the column density spectrum.
6.2.1 Synergy between ALMA and Herschel
The importance of ALMA is also revealed in the synergies with other in-struments, such as the Herschel Space Observatory. This and other instru-ments are considered complementary to ALMA because they have common
1The term of K-correction may appear confusing; it has been used for the first timeby Wirtz in 1918, for “Kosmologie” to determine the distance-redshift law; Hubble (1929)called also K (after Wirtz’s law) his now famous constant, and Oke & Sandage (1968)quantified what they called the K-correction, the combined effect of the changing λ domain(if the spectrum of the object is not flat), and the reduced λ-interval observed at highredshift, given a photometry band.
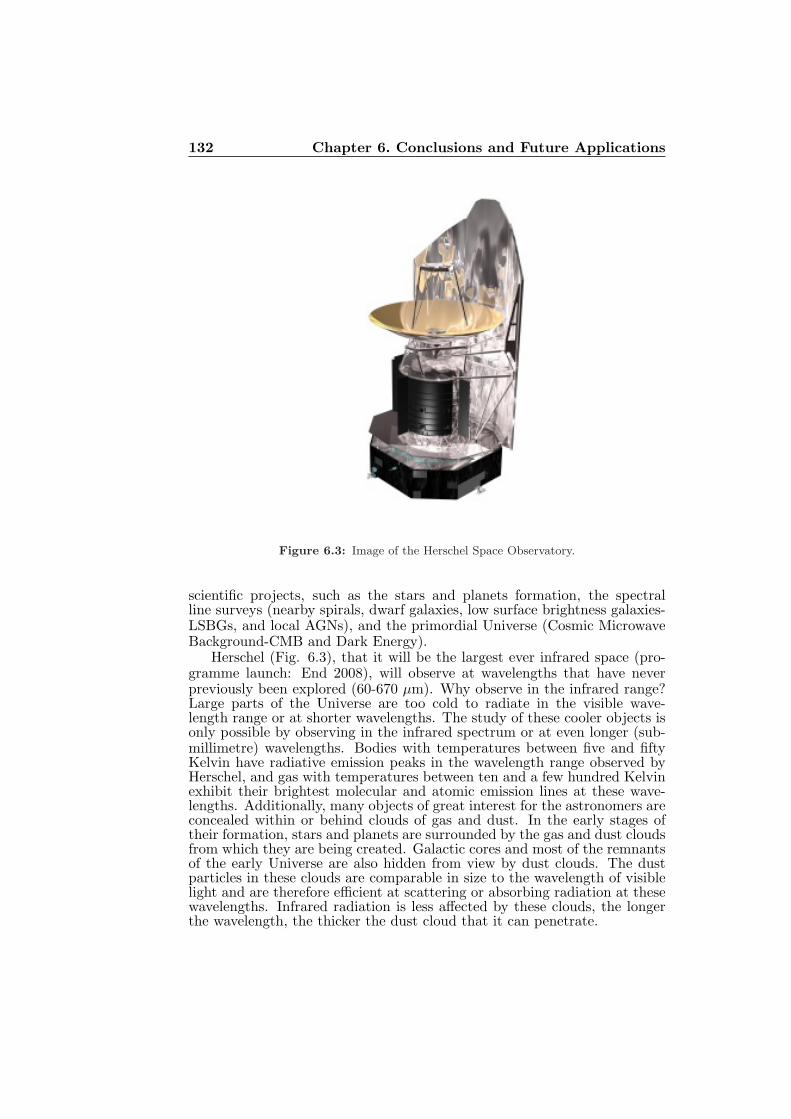
132 Chapter 6. Conclusions and Future Applications
Figure 6.3: Image of the Herschel Space Observatory.
scientific projects, such as the stars and planets formation, the spectralline surveys (nearby spirals, dwarf galaxies, low surface brightness galaxies-LSBGs, and local AGNs), and the primordial Universe (Cosmic MicrowaveBackground-CMB and Dark Energy).
Herschel (Fig. 6.3), that it will be the largest ever infrared space (pro-gramme launch: End 2008), will observe at wavelengths that have neverpreviously been explored (60-670 µm). Why observe in the infrared range?Large parts of the Universe are too cold to radiate in the visible wave-length range or at shorter wavelengths. The study of these cooler objects isonly possible by observing in the infrared spectrum or at even longer (sub-millimetre) wavelengths. Bodies with temperatures between five and fiftyKelvin have radiative emission peaks in the wavelength range observed byHerschel, and gas with temperatures between ten and a few hundred Kelvinexhibit their brightest molecular and atomic emission lines at these wave-lengths. Additionally, many objects of great interest for the astronomers areconcealed within or behind clouds of gas and dust. In the early stages oftheir formation, stars and planets are surrounded by the gas and dust cloudsfrom which they are being created. Galactic cores and most of the remnantsof the early Universe are also hidden from view by dust clouds. The dustparticles in these clouds are comparable in size to the wavelength of visiblelight and are therefore efficient at scattering or absorbing radiation at thesewavelengths. Infrared radiation is less affected by these clouds, the longerthe wavelength, the thicker the dust cloud that it can penetrate.
Chapter 7
Candidate’s list of papers
• Casasola, V., Bettoni, D., & Galletta, G. 2004, VizieR Online DataCatalog, 342, 20941
• Casasola, V., Bettoni, D., & Galletta, G. 2004, A&A, 422, 941
• Casasola, V., Piovan, L., Galletta, G., Bettoni, D., & Merlin, E.2006, Proceedings of the Conference “From Stars to Galaxies: Buildingthe Pieces to Build Up the Universe”, Vallenari et al. eds., ASP Conf.Series, arXiv:astro-ph/0612131
• Galletta, G., Casasola, V., Piovan, L., Merlin, E., & Bettoni, D.2007, A&A, 462, 495
• Casasola, V., Combes, F., Bettoni, D., Pohlen, M., Galletta, G., &Tenaglia, F. 2007, Astrophysics and Space Science (Apss), special issueof “Science with ALMA: a new era for Astrophysics” Conference, ed.Dr. Bachiller, arXiv:astro-ph/0702018
• Casasola, V., Combes, F., Galletta, G., & Bettoni, D. 2007, Pro-ceedings of the Conference “Pathways through an eclectic Universe”,J. H. Knapen, T. J. Mahoney, and A. Vazdekis (Eds.), ASP Conf.Ser., 2007, arXiv:0706.3769
• Casasola, V., Combes, F., Bettoni, D., & Galletta, G. 2007, A&A,473, 771
• Casasola, V., Combes, F, Garcıa-Burillo, S., Hunt, L. K., Leon,S., Baker, A. J. 2007, Proceedings of the Conference “Formation andEvolution of galaxy disks”, J. G. Funes, and E. M. Corsini eds., ASPConf. Series, arXiv:astro-ph/0712.0294
• Casasola, V., Combes, F, Garcıa-Burillo, S., Hunt, L., Leon, S.,Baker, A. J. 2008, A&A submitted
133

Bibliography
Allen, R. J., & Lequeux, J. 1993, ApJL, 410, L15
Allen, R. J., Knapen, J. H., Bohlin, R., & Stecher, T. P. 1997, ApJ, 487,171
Allen, R. J., Heaton, H. I., & Kaufman, M. J. 2004, ApJ, 608, 314
Arimoto, N., Sofue, Y., & Tsujimoto, T. 1996, PASJ, 48, 275
Arp, H. 1966, Atlas of peculiar galaxies, Pasadena: California Inst. Tech-nology, 1966
Arp, H. C., & Madore, B., A catalogue of southern peculiar galaxies andassociations, New York : Cambridge University Press, 1987
Bally, J., Stark, A. A., Wilson, R. W., & Langer, W. D. 1987, ApJL, 312,L45
Barvainis, R., Antonucci, R., & Coleman, P. 1992, ApJL, 399, L19
Barvainis, R., Tacconi, L., Antonucci, R., Alloin, D., & Coleman, P. 1994,Nature, 371, 586
Beck, R., Krause, M., & Klein, U. 1985, A&A, 152, 237
Beck, R. 2000, Astronomy, physics and chemistry of H+3 , 358, 777
Beck, R. 2001, Space Science Reviews, 99, 243
Beck, R., & Krause, M. 2005, Astronomische Nachrichten, 326, 414
Beelen, A., et al. 2004, A&A, 423, 441
Benson, P. J., & Myers, P. C. 1989, ApJS, 71, 89
Bertoldi, F., & McKee, C. F. 1992, ApJ, 395, 140
Bettoni, D., Galletta, G., Garcıa-Burillo, S., & Rodrıguez-Franco, A. 2001,A&A, 374, 421
Bettoni, D., Galletta, G., & Garcıa-Burillo, S. 2003, A&A, 405, 5
Beuing, J., Dobereiner, S., Bohringer, H., & Bender, R. 1999, MNRAS, 302,209
Bianchi, S., Corral, A., Panessa, F., Barcons, X., Matt, G., Bassani, L., Car-rera, F. J., & Jimenez-Bailon, E. 2007, ArXiv e-prints, 710, arXiv:0710.4226
135
136 BIBLIOGRAPHY
Bietenholz, M. F., et al. 1996, ApJ, 457, 604
Binney, J., & Merrifield, M. 1998, Galactic astronomy / James Binneyand Michael Merrifield. Princeton, NJ : Princeton University Press,1998. (Princeton series in astrophysics) QB857 .B522 1998 ($35.00)
Biskamp, D. 2003, Magnetohydrodynamic Turbulence, by Dieter Biskamp,pp. 310. ISBN 0521810116. Cambridge, UK: Cambridge University Press,September 2003.
Blitz, L., & Shu, F. H. 1980, ApJ, 238, 148
Blitz, L., Magnani, L., & Mundy, L. 1984, ApJL, 282, L9
Blitz, L., & Stark, A. A. 1986, ApJL, 300, L89
Blitz, L. 1990, The Evolution of the Interstellar Medium, 12, 273
Blitz, L. 1993, Back to the Galaxy, 278, 98
Blitz, L., & Rosolowsky, E. 2006, ApJ 650, 933
Bonnell, I. A., Bate, M. R., Clarke, C. J., & Pringle, J. E. 1997, MNRAS, 285,201
Boselli, A., Lequeux, J., & Gavazzi, G. 2002, A&A, 384, 33
Boselli, A., Lequeux, J., & Gavazzi, G. 2002, Ap&SS, 281, 127
Bot, C., Boulanger, F., Rubio, M., & Rantakyro, F. 2007, A&A, 471, 103
Bregman, J. N., Hogg, D. E., & Roberts, M. S. 1992, ApJ, 387, 484
Braine, J., & Combes, F. 1992, A&A, 264, 433
Braine, J., & Combes, F. 1993, A&A, 269, 7
Braine, J., Lisenfeld, U., Duc, P.-A., & Leon, S. 2000, Nature, 403, 867
Brouillet, N., Baudry, A., & Combes, F. 1988, A&A, 196, L17
Brouillet, N., Baudry, A., Combes, F., Kaufman, M., & Bash, F. 1991, A&A,242, 35
Brouillet, N., Kaufman, M., Combes, F., Baudry, A., & Bash, F. 1998, A&A,333, 92
Brown, R. L., & Vanden Bout, P. A. 1991, AJ, 102, 1956
Brown, R. L., & Vanden Bout, P. A. 1992, ApJL, 397, L19
Boulares, A., & Cox, D. P. 1990, ApJ, 365, 544
Burbidge, G. R. 1956, ApJ, 124, 416
Burstein, D., Jones, C., Forman, W., Marston, A. P., & Marzke, R. O. 1997,ApJS, 111, 163
Calzetti, D., Kinney, A. L., & Storchi-Bergmann, T. 1994, ApJ, 429, 582
BIBLIOGRAPHY 137
Calzetti, D. 2001, PASP, 113, 1449
Calzetti, D., et al. 2005, ApJ, 633, 871
Carilli, C. L., et al. 2001, ApJ, 555, 625
Carlstrom, J. E., & Kronberg, P. P. 1991, ApJ, 366, 422
Carpenter, J. M., Snell, R. L., & Schloerb, F. P. 1995, ApJ, 445, 246
Casasola, V., Bettoni, D., & Galletta, G. 2004, A&A, 422, 941
Casasola, V., Combes, F., Bettoni, D., & Galletta, G. 2007, A&A, 473, 771
Casasola, V., Combes, F., Garcıa-Burillo, S., Hunt, L. K., Leon, S., & andBaker, A., A&A submitted
Casoli, F., Clausset, F., Combes, F., Viallefond, F., & Boulanger, F. 1990,A&A, 233, 357
Casoli, F., Dickey, J., Kazes, I., Boselli, A., Gavazzi, G., & Jore, K. 1996,A&APS, 116, 193
Casoli, F., et al. 1998, A&A, 331, 451
Chabrier, G. 2003, PASP, 115, 763
Charlot, S., & Fall, S. M. 2000, ApJ, 539, 718
Charmandaris, V., Combes, F., & van der Hulst, J. M. 2000, A&A, 356, L1
Chi, X., & Wolfendale, A. W. 1993, Nature, 362, 610
Chi, S., & Park, Y.-S. 2006, Journal of Korean Astronomical Society, 39, 9
Chini, R., Kreysa, E., Kruegel, E., & Mezger, P. G. 1986, A&A, 166, L8
Ciotti, L., Pellegrini, S., Renzini, A., & D’Ercole, A. 1991, ApJ, 376, 380
Clemens, D. P., & Barvainis, R. 1988, ApJS, 68, 257
Cohen, R. S., Cong, H., Dame, T. M., & Thaddeus, P. 1980, ApJL, 239, L53
Combes, F., Encrenaz, P. J., Lucas, R., & Weliachew, L. 1977, A&A, 55, 311
Combes, F., & Sanders, R. H. 1981, A&A, 96, 164
Combes, F., Prugniel, P., Rampazzo, R., & Sulentic, J. W. 1994, A&A, 281,725
Combes, F., & Becquaert, J.-F. 1997, A&A, 326, 554
Combes, F., Maoli, R., & Omont, A. 1999, A&A, 345, 369
Combes, F. 2001, Advanced Lectures on the Starburst-AGN, 223
Combes, F., et al. 2004, A&A, 414, 857
Combes, F. 2005, SF2A-2005: Semaine de l’Astrophysique Francaise, 697
138 BIBLIOGRAPHY
Combes, F., Young, L. M., & Bureau, M. 2007, MNRAS, 377, 1795
Condon, J. J., & Yin, Q. F. 1990, ApJ, 357, 97
Condon, J. J. 1992, ARA&A, 30, 575
Cox, P., Deharveng, L., & Leene, A. 1990, A&A, 230, 181
Cram, L., Hopkins, A., Mobasher, B., & Rowan-Robinson, M. 1998, ApJ, 507,155
Crutcher, R. M., Mouschovias, T. C., Troland, T. H., & Ciolek, G. E. 1994,ApJ, 427, 839
Crutcher, R. M. 1999, ApJ, 520, 706
Dame, T. M., Elmegreen, B. G., Cohen, R. S., & Thaddeus, P. 1986, ApJ,305, 892
David, L. P., Jones, C., & Forman, W. 1992, ApJ, 388, 82
Devereux, N. A., & Young, J. S. 1991, ApJ, 371, 515
Dickman, R. L., Snell, R. L., & Schloerb, F. P. 1986, ApJ, 309, 326
Digel, S. W., Lyder, D. A., Philbrick, A. J., Puche, D., & Thaddeus, P. 1996,ApJ, 458, 561
Downes, D., Radford, S. J. E., & Solomon, P. M. 1991, Dynamics of Galaxiesand Their Molecular Cloud Distributions, 146, 295
Draine, B. T. 1978, ApJS, 36, 595
Duc, P.-A., & Mirabel, I. F. 1998, A&A, 333, 813
Eckart, A., Downes, D., Genzel, R., Harris, A. I., Jaffe, D. T., & Wild, W.1990, ApJ, 348, 434
Elmegreen, B. G., & Lada, C. J. 1977, ApJ, 214, 725
Elmegreen, B. G. 1985, Protostars and Planets II, 33
Elmegreen, B. G. 1993, ApJ, 411, 170
Fabbiano, G. 1989, ARA&A, 27, 87
Fabbiano, G., Kim, D.-W., & Trinchieri, G. 1992, ApJS, 80, 531
Ferrarese, L., & Merritt, D. 2000, ApJL, 539, L9
Frei, Z., Guhathakurta, P., Gunn, J. E., & Tyson, J. A. 1996, AJ, 111, 174
Galletta, G., Casasola, V., Piovan, L., Merlin, E., & Bettoni, D. 2007, A&A,462, 495
Gao, Y., & Solomon, P. M. 2004a, Apj, 606, 271
Gao, & Solomon, 2004b, ApJS, 152, 63G
Garcıa-Burillo, S., Guelin, M., & Cernicharo, J. 1993, A&A, 274, 123
BIBLIOGRAPHY 139
Garcıa-Burillo, S., Sempere, M. J., Combes, F., Hunt, L. K., & Neri, R. 2000,A&A, 363, 869
Garcıa-Burillo, S., et al. 2003, A&A, 407, 485
Garcıa-Burillo, S., Combes, F., Schinnerer, E., Boone, F., & Hunt, L. K. 2005,A&A, 441, 1011
Gebhardt, K., et al. 2000, ApJL, 539, L13
Gracia-Carpio, J., Garcıa-Burillo, S., Planesas, P., & Colina, L. 2006, ApJL,640, L135
Graham, J. A. 1998, ApJ, 502, 245
Graham, J. A. 1999, Bulletin of the American Astronomical Society, 31, 950
Greve, T. R., et al. 2005, MNRAS, 359, 1165
Griffiths, R. E., & Padovani, P. 1990, ApJ, 360, 483
Gioia, I. M., Gregorini, L., & Klein, U. 1982, A&A, 116, 164
Gordon, K. D., Calzetti, D., & Witt, A. N. 1997, ApJ, 487, 625
Gordon, K. D., et al. 2004, ApJS, 154, 215
Guilloteau, S., & Lucas, R. 2000, in Imaging at Radio through SubmillimeterWavelengths, ed. J. G. Mangum, S. J. Radford (San Francisco: ASP), 299
Heckman, T. M., Smith, E. P., Baum, S. A., et al.: 1986, ApJ, 311, 526
Heckman, T. M., Blitz, L., Wilson, A. S., Armus, L., & Miley, G. K. 1989,ApJ, 342, 735
Heiles, C. 1996, ApJ, 462, 316
Helfer, T. T., Thornley, M. D., Regan, M. W., Wong, T., Sheth, K., Vogel,S. N., Blitz, L., & Bock, D. C.-J. 2003, ApJS, 145, 259
Henkel, C., Chin, Y.-N., Mauersberger, R., & Whiteoak, J. B. 1998, A&A,329, 443
Heyer, M. H., Carpenter, J. M., & Ladd, E. F. 1996, ApJ, 463, 630
Heyer, M. H., & Terebey, S. 1998, ApJ, 502, 265
Hildebrand, R. H. 1983, QJRAS, 24, 267
Ho, L. C., Filippenko, A. V., & Sargent, W. L. W. 1996, ApJ, 462, 183
Ho, L. C., Filippenko, A. V., & Sargent, W. L. W. 1997, ApJS, 112, 315
Horellou, C., & Booth, R. 1997, A&AS, 126, 3
Hunt L., Combes F., Garcıa-Burillo S. et al., A&A, submitted
Impey, C., & Gregorini, L. 1993, AJ, 105, 853
Iono, D., et al. 2006, PASJ 58, 957
140 BIBLIOGRAPHY
Iono, D., et al. 2007, ApJ, 659, 283
Israel, F. P., & Baas, F. 1999, A&A, 351, 10
Kamphuis, J., & Briggs, F. 1992, A&A, 253, 335
Kaufman, M., Bash, F. N., Hine, B., Rots, A. H., Elmegreen, D. M., & Hodge,P. W. 1989, ApJ, 345, 674
Kaufman, M. J., Wolfire, M. G., Hollenbach, D. J., & Luhman, M. L. 1999,ApJ, 527, 795
Kenney, J. D. P., Wilson, C. D., Scoville, N. Z., Devereux, N. A., & Young,J. S. 1992, ApJL, 395, L79
Kennicutt, R. C., Jr. 1998a, The Stellar Initial Mass Function (38th Herst-monceux Conference), 142, 1
Kennicutt, R. C., Jr., et al. 1998b, ApJ, 498, 181
Kennicutt, R. C., Jr. 1998c, ApJ, 498, 541
Kim, D.-W., & Fabbiano, G. 2004, ApJ, 611, 846
Klein, U., Wielebinski, R., & Morsi, H. W. 1988, A&A, 190, 41
Knapen, J. H., Allen, R. J., Heaton, H. I., Kuno, N., & Nakai, N. 2006, A&A,455, 897
Knapp, G. R., Turner, E. L., & Cunniffe, P. E. 1985, AJ, 90, 454
Knapp, G. R., Guhathakurta, P., Kim, D.-W., & Jura, M. A. 1989, ApJS, 70,329
Kneib, J.-P., Neri, R., Smail, I., Blain, A., Sheth, K., van der Werf, P., &Knudsen, K. K. 2005, A&A, 434, 819
Knudsen, K. K., Walter, F., Weiss, A., Bolatto, A., Riechers, D. A., & Menten,K. 2007, ApJ, 666, 156
Kohno, K., Kawabe, R., & Vila-Vilaro, B. 1999, ApJ, 511, 157
Kohno, K., Ishizuki, S., Matsushita, S., Vila-Vilaro, B., Kawabe, R.: 2003,PASJ, 55, L1
Kong, X., et al. 2000, AJ, 119, 2745
Kong, X., Charlot, S., Brinchmann, J., & Fall, S. M. 2004, MNRAS, 349, 769
Kramer, C., Stutzki, J., Rohrig, R., & Corneliussen, U. 1998, A&A, 329, 249
Krips, M., Eckart, A., Neri, R., Schodel, R., Leon, S., Downes, D., Garcıa-Burillo, S., & Combes, F. 2006, A&A, 446, 113
Krips, M., Eckart A., Krichbaum T.P. et al. 2007, A&A, 464, 553
Krips, M., Neri R., Garcıa-Burillo, S.,: 2007b, A&A 468, L63
Kroupa, P., Tout, C. A., & Gilmore, G. 1993, MNRAS, 262, 545
BIBLIOGRAPHY 141
Lada, C. J. 1991, NATO ASIC Proc. 342: The Physics of Star Formation andEarly Stellar Evolution, 329
Lada, E. A. 1992, ApJL, 393, L25
Lada, C. J., Lada, E. A., Clemens, D. P., & Bally, J. 1994, ApJ, 429, 694
Laird, E. S., Nandra, K., Adelberger, K. L., Steidel, C. C., & Reddy, N. A.2005, MNRAS, 359, 47
Larson, R. B. 1981, MNRAS, 194, 809
Leisawitz, D., & Hauser, M. G. 1988, ApJ, 332, 954
Lisenfeld, U., & Volk, H. J. 2000, A&A, 354, 423
Lees, J. F., Knapp, G. R., Rupen, M. P., & Phillips, T. G. 1991, ApJ, 379,177
Leger, A., & Puget, J. L. 1984, A&A, 137, L5
Lindt-Krieg, E., Eckart, A., Neri, R., Krips, M., Pott, J. -., Garcia-Burillo, S.,& Combes, F. 2008, arXiv:0712.3133, A&A accepted
Loinard, L., Dame, T. M., Koper, E., Lequeux, J., Thaddeus, P., & Young,J. S. 1996, ApJL, 469, L101
Loiseau, N., Nakai, N., Sofue, Y., Wielebinski, R., Reuter, H.-P., & Klein, U.1990, A&A, 228, 331
McElroy, D. B. 1995, ApJS, 100, 105
Merlin, E., & Chiosi, C. 2006, A&A, 457, 437
McMahon, R. G., Omont, A., Bergeron, J., Kreysa, E., & Haslam, C. G. T.1994, MNRAS, 267, L9
Maddalena, R. J., & Thaddeus, P. 1985, ApJ, 294, 231
Magnani, L., Caillault, J.-P., Buchalter, A., & Beichman, C. A. 1995, ApJS,96, 159
Maloney, P., & Black, J. H. 1988, ApJ, 325, 389
Mauersberger, R., Henkel, C., Weiß, A., Peck, A. B., & Hagiwara, Y. 2003,A&A, 403, 561
McKee, C. F. 1989, ApJ, 345, 782
McLaughlin, D. E., & Pudritz, R. E. 1996, ApJ, 469, 194
McKee, C. F., & Zweibel, E. G. 1992, ApJ, 399, 551
McKee, C. F., Zweibel, E. G., Goodman, A. A., & Heiles, C. 1993, Protostarsand Planets III, 327
Mollenhoff, C., & Heidt, J. 2001, A&A, 368, 16
Morganti, R., et al. 2006, MNRAS, 371, 157
142 BIBLIOGRAPHY
Moriarty-Schieven, G. H., Andersson, B.-G., & Wannier, P. G. 1997, ApJ, 475,642
Motte, F., Andre, P., & Neri, R. 1998, A&A, 336, 150
Myers, P. C., & Benson, P. J. 1983, ApJ, 266, 309
Nagar, N. M., Falcke, H., Wilson, A. S., & Ulvestad, J. S. 2002, A&A, 392, 53
Nakanishi, K., Okumura, S. K., Kohno, K., Kawabe, R., & Nakagawa, T. 2005,PASJ, 57, 575
Nakai, N., & Kuno, N. 1995, PASJ, 47, 761
Neri, R., et al. 2003, ApJL, 597, L113
Oke, J. B., & Sandage, A. 1968, Apj, 154, 21
Omont, A., McMahon, R. G., Cox, P., Kreysa, E., Bergeron, J., Pajot, F., &Storrie-Lombardi, L. J. 1996, A&A, 315, 1
Omont, A., Cox, P., Bertoldi, F., McMahon, R. G., Carilli, C., & Isaak, K. G.2001, A&A, 374, 371
Omont, A., Beelen, A., Bertoldi, F., Cox, P., Carilli, C. L., Priddey, R. S.,McMahon, R. G., & Isaak, K. G. 2003, A&A, 398, 857
Pahre, M. A., Ashby, M. L. N., Fazio, G. G., & Willner, S. P. 2004, ApJS,154, 235
Papadopoulos, P. P. 2007, ApJ, 656, 792
Pasquali, A., Gallagher, J. S., & de Grijs, R. 2004, A&A, 415, 103
Patel, N. A., Goldsmith, P. F., Snell, R. L., Hezel, T., & Xie, T. 1995, ApJ,447, 721
Paturel, G., et al. 1997, A&AS, 124, 109
Peletier, R. F., et al. 2001, New Astronomy Review, 45, 83
Pellegrini, S., Cappi, M., Bassani, L., Malaguti, G., Palumbo, G. G. C., &Persic, M. 2000, A&A, 353, 447
Petitpas, G. R., & Wilson, C. D. 1998, ApJ, 503, 219
Phillips, T. G., Wannier, P. G., Scoville, N. Z., & Huggins, P. J. 1979, ApJ,231, 720
Phillips, M. M., Jenkins, C. R., Dopita, M. A., Sadler, E. M., & Binette, L.1986, AJ, 91, 1062
Piovan, L., Tantalo, R., & Chiosi, C. 2006, MNRAS, 370, 1454
Popescu, C. C., Misiriotis, A., Kylafis, N. D., Tuffs, R. J., & Fischera, J. 2000,A&A, 362, 138
Popescu, C. C., Tuffs, R. J., Volk, H. J., Pierini, D., & Madore, B. F. 2002,ApJ, 567, 221
BIBLIOGRAPHY 143
Quinn, P. J. 1984, ApJ, 279, 596
Ranalli, P., Comastri, A., & Setti, G. 2003, A&A, 399, 39
Rand, R. J., & Kulkarni, S. R. 1990, ApJL, 349, L43
Rand, R. J. 1993, ApJ, 410, 68
Rand, R. J. 1995, AJ, 109, 2444
Regan, M. W., Thornley, M. D., Helfer, T. T., Sheth, K., Wong, T., Vogel,S. N., Blitz, L., & Bock, D. C.-J. 2001, ApJ, 561, 218
Regan, M. W., Teuben P., ApJ, 582, 723
Regan, M. W., Thornley, M. D., Vogel S.N., et al., 2006, ApJ, 652, 1112
Reuter, H.-P., Krause, M., Wielebinski, R., & Lesch, H. 1991, A&A, 248, 12
Rieke, G. H., Lebofsky, M. J., Thompson, R. I., Low, F. J., & Tokunaga, A. T.1980, ApJ, 238, 24
Rigaut, F., Salmon, D., Arsenault, R. et al. 1998, PASP, 110, 152
Roberts, M. S., Hogg, D. E., Bregman, J. N., Forman, W. R., & Jones, C.1991, ApJS, 75, 751
Roberts, T. P., & Warwick, R. S. 2000, MNRAS, 315, 98
Rohlfs, K., & Wilson, T. L. 1996, Tools of Radio Astronomy, XVI, 423 pp. 127figs., 20 tabs.. Springer-Verlag Berlin Heidelberg New York. Also Astronomyand Astrophysics Library
Romano, D., Chiappini, C., Matteucci, F., & Tosi, M. 2005, A&A, 430, 491
Rosolowsky, E., & Blitz, L. 2005, ApJ, 623, 826
Rosolowsky, E., & Leroy, A. 2006, PASP, 118, 590
Rubio, M., Lequeux, J., & Boulanger, F. 1993, A&A, 271, 9
Sadler, E. M. 1987, Structure and Dynamics of Elliptical Galaxies, 127, 125
Sage, L. J., & Westpfahl, D. J. 1991, A&A, 242, 371
Sakamoto, K., Okumura, S. K., Ishizuki, S., & Scoville, N. Z. 1999, ApJS, 124,403
Sakamoto, K., Baker A.J., Scoville N.Z., 2000, ApJ, 533, 149
Sakamoto, K., Fukuda, H., Wada, K., & Habe, A. 2001, AJ, 122, 1319
Salpeter, E. E. 1955, ApJ, 121, 161
Sanders, D. B., Solomon, P. M., & Scoville, N. Z. 1984, ApJ, 276, 182
Sanders, D. B., Scoville, N. Z., & Solomon, P. M. 1985, ApJ, 289, 373
Sanders, D. B., & Mirabel, I. F. 1985, ApJL, 298, L31
144 BIBLIOGRAPHY
Sanders, D. B., Scoville, N. Z., Young, J. S., Soifer, B. T., Schloerb, F. P.,Rice, W. L., & Danielson, G. E. 1986, ApJL, 305, L45
Scalo, J. M. 1986, Fundamentals of Cosmic Physics, 11, 1
Scalo, J. 1990, Physical Processes in Fragmentation and Star Formation, 162,151
Scalo, J. 1998, The Stellar Initial Mass Function (38th Herstmonceux Confer-ence), 142, 201
Schinnerer, E., Eckart, A., Tacconi, L. J., Genzel, R., & Downes, D. 2000,ApJ, 533, 850
Schmidt, M. 1959, ApJ, 129, 243
Schiminovich, D., van Gorkom, J. H., van der Hulst, J. M., & Kasow, S. 1994,ApJL, 423, L101
Schneider, N., Stutzki, J., Winnewisser, G., & Blitz, L. 1996, ApJL, 468, L119
Schuster, K.-F., et al. 2004, A&A, 423, 1171
Schweizer, F., & Seitzer, P. 1992, AJ, 104, 1039
Shu, F. H., Milione, V., & Roberts, W. W., Jr. 1973, ApJ, 183, 819
Shu, F. H., Lizano, S., & Adams, F. C. 1987, Star Forming Regions, 115, 417
Smith, D. A., Allen, R. J., Bohlin, R. C., Nicholson, N., & Stecher, T. P. 2000,ApJ, 538, 608
Sheth, K., Vogel, S. N., Regan, M. W., Teuben, P. J., Harris, A. I., & Thornley,M. D. 2002, AJ, 124, 2581
Sheth, K., Vogel, S. N., Wilson, C. D., & Dame, T.M., AJ accepted,arXiv:astro-ph/07104559
Solomon, P. M., & de Zafra, R. 1975, ApJL, 199, L79
Solomon, P. M., Rivolo, A. R., Barrett, J., & Yahil, A. 1987, ApJ, 319, 730
Solomon, P. M., & Sage, L. J. 1988, ApJ, 334, 613
Solomon, P. M., & Rivolo, A. R. 1989, ApJ, 339, 919
Solomon, P. M., & Barrett, J. W. 1991, Dynamics of Galaxies and TheirMolecular Cloud Distributions, 146, 235
Solomon, P. M., Radford, S. J. E., & Downes, D. 1992, Nature, 356, 318
Solomon, P. M., & Vanden Bout, P. A. 2005, ARA&A, 43, 677
Spitzer, L. 1978, New York Wiley-Interscience, 1978, 333,
Strong, A. W., et al. 1988, A&A, 207, 1
Strong, A. W., Moskalenko, I. V., & Reimer, O. 2000, ApJ, 537, 763
BIBLIOGRAPHY 145
Stutzki, J., & Guesten, R. 1990, ApJ, 356, 513
Sullivan, M., Mobasher, B., Chan, B., Cram, L., Ellis, R., Treyer, M., &Hopkins, A. 2001, ApJ, 558, 72
Tacconi, L. J., et al. 2006, ApJ, 640, 228
Taylor, C. L., Kobulnicky, H. A., & Skillman, E. D. 1998, AJ, 116, 2746
Taylor, C. L., & Wilson, C. D. 1998, ApJ, 494, 581
Telesco, C. M., & Harper, D. A. 1980, ApJ, 235, 392
Tenjes, P. 1994, Baltic Astronomy, 3, 180
Terashima, Y., & Wilson, A. S. 2003, ApJ, 583, 145
Testi, L., & Sargent, A. I. 1998, ApJL, 508, L91
Thornley, M., et al. 1999, Ap&SS, 269, 391
Thronson, H. A., Jr., & Telesco, C. M. 1986, ApJ, 311, 98
Tinsley, B. M. 1980, Fundamentals of Cosmic Physics, 5, 287
Tuffs, R. J., & Popescu, C. C. 2003, Exploiting the ISO Data Archive. InfraredAstronomy in the Internet Age, 511, 239
Ulvestad, J. S., & Ho, L. C. 2001, ApJL, 562, L133
van Dishoeck, E. F., & Black, J. H. 1988, ApJ, 334, 771
van Gorkom, J., & Schiminovich, D. 1997, The Nature of Elliptical Galaxies;2nd Stromlo Symposium, 116, 310
Veron-Cetty, M.-P., & Veron, P. 2003, A&A, 412, 399
Viallefond, F., et al., 2008, in preparation
Vila-Vilaro, B., Taniguchi, Y., & Nakai, N. 1998, AJ, 116, 1553
Visser, H. C. D. 1980, A&A, 88, 159
Vogel, S. N., Kulkarni, S. R., & Scoville, N. Z. 1988, Nature, 334, 402
Vorontsov-Velyaminov, B. A. 1959, Atlas and catalog of interacting galaxies(1959)
Weil, M. L., & Hernquist, L. 1993, ApJ, 405, 142
Wiklind, T., Combes, F., & Henkel, C. 1995, A&A, 297, 643
Wild, W. 1999, The 30 m Manual-IRAM, Granada
Williams, J. P., de Geus, E. J., & Blitz, L. 1994, ApJ, 428, 693
Williams, J. P., Blitz, L., & Stark, A. A. 1995, ApJ, 451, 252
Williams, J. P., & Maddalena, R. J. 1996, ApJ, 464, 247
146 BIBLIOGRAPHY
Williams, J. P., & Blitz, L. 1998, ApJ, 494, 657
Wilson, C. D., & Scoville, N. 1990, ApJ, 363, 435
Wilson, C. D., & Scoville, N. 1992, ApJ, 385, 512
Wilson, C. D. 1995, ApJL, 448, L97
Williams, J. P., Blitz, L., & McKee, C. F. 2000, Protostars and Planets IV, 97
Willott, C. J., Martınez-Sansigre, A., & Rawlings, S. 2007, AJ, 133, 564
Wood, D. O. S., Myers, P. C., & Daugherty, D. A. 1994, ApJS, 95, 457
Young, J. S., & Scoville, N. 1982, ApJL, 260, L41
Young, J. S., & Scoville, N. Z. 1984, ApJ, 287, 153
Young, J. S., & Knezek, P. M. 1989, ApJL, 347, L55
Young, J. S., & Scoville, N. Z. 1991, ARA&A, 29, 581
Young, J. S., et al. 1995, ApJS, 98, 219
Zaritsky, D., Harris, J., Thompson, I. B., & Grebel, E. K. 2004, AJ, 128, 1606
Acknowledgements
The work presented in this Thesis has been carried out thanks to the logisticand financial support of:
• Padova University, Astronomy Department;
• Paris Observatory-LERMA;
• Pierre et Marie Curie University, Paris 6;
• Italian-France University;
• Grant Vinci for my stay in Paris, February-July 2006;
• European Association For Research In Astronomy (EARA) agreementfor my stay in Paris, January-July 2007;
• RadioNet Networking Activities-Travel Funds.
This Thesis was developed at the Padova Astronomy Department andParis Observatoy-LERMA. I wish to thank all the people whom I collab-orated with during these three years of PhD studies. Special thanks goto:
• my supervisors, Prof. Giuseppe Galletta and Prof. Francoise Combes.Giuseppe encouraged me to have my French experience, giving methe change to know and work together with Francoise, astronomer ofinternational renown. Thanks to Francoise I worked at a very highscientific level and in a stimulating environment. My gratefulness to-wards Francoise is enormous;
• Prof. Loretta Gregorini, the referee of this Thesis, for her very helpfulsuggestions and for reading the whole Thesis;
• Prof. Eduardo Battaner and Prof. Werner W. Zeilinger, the refereesof this Thesis for the Doctor Europeaus degree;
• Dr. Leslie Kipp Hunt, Dr. Santiago Garcıa-Burillo, Dr. AndrewBaker, and Dr. Stephane Leon for their teaching and collaboration inthe NUGA project;
• Dr. Daniela Bettoni, for her constant support;
• Prof. Cesare Chiosi and Dr. Lorenzo Piovan, for the useful discussionsespecially concerning theoretical models of galaxies;
147
148 ACKNOWLEDGEMENTS
• Jacopo Fritz and Giulia Rodighiero, for their friendship and for all theinteresting and useful discussions;
• Paola Di Matteo, for her friendship, hospitality in Paris and Rome,and for interesting discussions especially concerning interacting gal-axies, LaTeX style, but also concerning Boulangeries, Brasseries andCreperies in Paris;
• Chiara Ferrari, for her constant availability and for the personal andprofessional suggestions;
• PhD Students of the XX Cycle in Padova, especially Elena Ricciardelliand Carlo Giocoli;
• Anna Romano, Alessia Moretti, Sara Magrin, Mattia Vaccari, and allthe friends of the Padova Astronomy Department and Observatory fortheir friendship and availability.
A very special thank goes to my family, Benito, Carmen, Simone andMicia, and to my friends (Cristina, Roberto, Rosso, Maba, Guido, Elena,Martina, . . .)
Many friends I met during these years and you are all in my mind!