the role of body size in complex food webs
TRANSCRIPT

Provided for non-commercial research and educational use only. Not for reproduction, distribution or commercial use.
This chapter was originally published in the book Advances in Ecological Research, Vol. 45 published by Elsevier, and the attached copy is provided by Elsevier for the author's benefit and for the benefit of the author's institution, for non-commercial research and educational use including without limitation use in instruction at your institution, sending it to specific colleagues who know you, and providing a copy to your institution’s administrator.
All other uses, reproduction and distribution, including without limitation commercial reprints, selling or licensing copies or access, or posting on open internet sites, your personal or institution’s website or repository, are prohibited. For exceptions, permission may be sought for such use through Elsevier's permissions site at:
http://www.elsevier.com/locate/permissionusematerial
From: Ute Jacob, Aaron Thierry, Ulrich Brose, Wolf E. Arntz, Sofia Berg, Thomas Brey, Ingo Fetzer, Tomas Jonsson, Katja Mintenbeck, Christian Möllmann, Owen Petchey, Jens O. Riede and Jennifer A. Dunne, The Role of Body Size in Complex
Food Webs: A Cold Case. In Andrea Belgrano and Julia Reiss, editors: Advances in Ecological Research, Vol. 45,
Amsterdam, The Netherlands, 2011, pp. 181-223. ISBN: 978-0-12-386475-8
© Copyright 2011 Elsevier Ltd. Academic press.
Author's personal copy
The Role of Body Size in Complex FoodWebs: A Cold Case
UTE JACOB,1,* AARON THIERRY,2,3 ULRICH BROSE,4
WOLF E. ARNTZ,5 SOFIA BERG,6 THOMAS BREY,5
INGO FETZER,7 TOMAS JONSSON,6 KATJA MINTENBECK,5
CHRISTIAN MOLLMANN,1 OWEN L. PETCHEY,8 JENS O. RIEDE4
AND JENNIFER A. DUNNE9,10
1Institute for Hydrobiology and Fisheries Science, University of Hamburg, Grosse
Elbstrasse 133, Hamburg, Germany2Department of Animal and Plant Sciences, Alfred Denny Building, University of
Sheffield, Western Bank, Sheffield, United Kingdom3Microsoft Research, JJ Thompson Avenue, Cambridge, United Kingdom4J.F. Blumenbach Institute of Zoology and Anthropology, Systemic Conservation
Biology Group, Georg-August University Gottingen, Gottingen, Germany5Alfred Wegener Institute for Polar and Marine Research, P.O. Box 120161,
Bremerhaven, Germany6Ecological Modelling Group, Systems Biology Research Centre, University of
Skovde, Skovde, Sweden7Department of Environmental Microbiology, Helmholtz Centre for Environmental
Research—UFZ, Permoserstr. 15, Leipzig, Germany8Institute of Evolutionary Biology and Environmental Studies, University of Zurich,
Winterthurerstrasse 190, Zurich, Switzerland9Santa Fe Institute, Santa Fe, New Mexico, USA10Pacific Ecoinformatics and Computational Ecology Lab, Berkeley, California, USA
A
*Corr
ADVAN
# 2011
bstract . . . . . . . . . . . . . . . . . . . . . . . . . . . . . . . . . . . . . . . . . . . . . . . . . .
esponding author. E-mail: [email protected]
CES IN ECOLOGICAL RESEARCH VOL. 45 0065-250
Elsevier Ltd. All rights reserved DOI: 10.1016/B978-0-12-38647
1
4/11
5-8.0
82
I. I ntroduction . . . . . . . . . . . . . . . . . . . . . . . . . . . . . . . . . . . . . . . . . . . . . . . 1 83$35.0
0005-
II. M
ethods . . . . . . . . . . . . . . . . . . . . . . . . . . . . . . . . . . . . . . . . . . . . . . . . . . 1 86 A . T he Weddell Sea Data Set . . . . . . . . . . . . . . . . . . . . . . . . . . . . . . . . 1 86 B . F unctional Consumer Classification of the Weddell Sea FoodWeb 1 89 C . F ood Web Parameters . . . . . . . . . . . . . . . . . . . . . . . . . . . . . . . . . . . 1 90 D . D ata Analysis: Statistics, Extinction Scenarios and Robustnessof Weddell Sea Food Web . . . . . . . . . . . . . . . . . . . . . . . . . . . . . . . .
191 III. R esults . . . . . . . . . . . . . . . . . . . . . . . . . . . . . . . . . . . . . . . . . . . . . . . . . . . 1 92A
. T he Weddell Sea Food Web Data Set. . . . . . . . . . . . . . . . . . . . . . . 1 920
8
182 UTE JACOB ET AL.
Author's personal copy
B
. F unctional Consumer Classification of the Weddell Sea FoodWeb 1 94 C . E xtinction Scenarios and Robustness of the WeddellSea Food Web . . . . . . . . . . . . . . . . . . . . . . . . . . . . . . . . . . . . . . . . .
197 IV. D iscussion . . . . . . . . . . . . . . . . . . . . . . . . . . . . . . . . . . . . . . . . . . . . . . . . 1 98A
. I mplications of This Study. . . . . . . . . . . . . . . . . . . . . . . . . . . . . . . . 1 98 B . T he Weddell Sea Food Web and Functional ConsumerClassification . . . . . . . . . . . . . . . . . . . . . . . . . . . . . . . . . . . . . . . . . .
200 C . E xtinction Scenarios the Robustness of theWeddell Sea FoodWeb 2 03V. C
onclusion . . . . . . . . . . . . . . . . . . . . . . . . . . . . . . . . . . . . . . . . . . . . . . . . 2 05 Ackno wledgements . . . . . . . . . . . . . . . . . . . . . . . . . . . . . . . . . . . . . . . . . . . . . . 2 06 Appen dix . . . . . . . . . . . . . . . . . . . . . . . . . . . . . . . . . . . . . . . . . . . . . . . . . . . . . . 2 06 Refere nces . . . . . . . . . . . . . . . . . . . . . . . . . . . . . . . . . . . . . . . . . . . . . . . . . . . . . 2 16ABSTRACT
Human-induced habitat destruction, overexploitation, introduction of alien
species and climate change are causing species to go extinct at unprecedented
rates, from local to global scales. There are growing concerns that these kinds
of disturbances alter important functions of ecosystems. Our current under-
standing is that key parameters of a community (e.g. its functional diversity,
species composition, and presence/absence of vulnerable species) reflect an
ecological network’s ability to resist or rebound from change in response to
pressures and disturbances, such as species loss. If the food web structure is
relatively simple, we can analyse the roles of different species interactions in
determining how environmental impacts translate into species loss. However,
when ecosystems harbour species-rich communities, as is the case in most
natural systems, then the complex network of ecological interactions makes
it a far more challenging task to perceive how species’ functional roles
influence the consequences of species loss. One approach to deal with such
complexity is to focus on the functional traits of species in order to identify
their respective roles: for instance, large species seem to be more susceptible
to extinction than smaller species. Here, we introduce and analyse the marine
food web from the high Antarctic Weddell Sea Shelf to illustrate the role of
species traits in relation to network robustness of this complex food web. Our
approach was threefold: firstly, we applied a new classification system to all
species, grouping them by traits other than body size; secondly, we tested the
relationship between body size and food web parameters within and across
these groups and finally, we calculated food web robustness. We addressed
questions regarding (i) patterns of species functional/trophic roles, (ii) rela-
tionships between species functional roles and body size and (iii) the role of
species body size in terms of network robustness. Our results show that when
THE ROLE OF BODY SIZE IN COMPLEX FOOD WEBS: A COLD CASE 183
Author's personal copy
analyzing relationships between trophic structure, body size and network
structure, the diversity of predatory species types needs to be considered in
future studies.
I. INTRODUCTION
Human activity is affecting ecosystems on a global scale to such an extent
that few, if any, pristine ecosystems remain. This begs the question as to what
characterises an undisturbed food web and how human induced disturbances
such as habitat destruction, overexploitation, introduction of alien species
and climate change might be expected to affect the structure and functioning
of ecosystems (Dirozo and Raven, 2003). Indeed, there are growing concerns
that disturbances on ecosystems, via changes in species richness, species
composition and trophic structure will affect and seriously threaten impor-
tant ecosystem functions (Thomas et al., 2004). In the light of these potential
threats, a key question ecologists must now answer is how will such losses
affect the diversity, structure and functioning of the world’s ecosystems?
Attempting to answer this question has stimulated much of the interest in
understanding the relationships between biodiversity and ecosystem func-
tioning (Schulze and Mooney, 1993) and has led to numerous experimental
studies over the past couple of decades (Balvanera et al., 2006; Cardinale
et al., 2006; Loreau et al., 2001, 2002; Naeem et al., 1994; Petchey and
Gaston, 2006; Petchey et al., 2004a; Tilman, 1991). These and other studies
have shown that there is not necessarily a simple linear relationship between
biodiversity and ecosystem function and have led to a more recent focus on
functional diversity instead of species richness per se and on how to identify
and characterise functionally significant components of biodiversity (Dıaz
and Cabido, 2001; Petchey et al., 2004b; Reiss et al., 2009).
Clearly, the effects of species loss ultimately have to be studied in natural
systems to understand the full range of possible responses within the com-
plex, multispecies networks of interacting taxa, such as described within the
context of food web research (Reiss et al., 2009). Here, loss of a few species
can potentially trigger a cascade of extinctions and other marked changes in
food web structure (Bascompte et al., 2005; Borer et al., 2005).
There is increasing evidence that unexpected cascades of species extinc-
tions and the pathways of restoration and recovery depend on the complex
nature of species-rich communities (Bascompte and Stouffer, 2009; Dunne
et al., 2004). From a conservation perspective, information on species func-
tional roles is therefore desirable if we are to predict the likelihood of species
extinctions and their potential effects on structure and function of the entire
ecosystem (Memmott, 2009).

184 UTE JACOB ET AL.
Author's personal copy
Dynamical and structural food web models, which describe the interactions
between multiple species, have often focused on the relationship between
complexity and stability in ecological communities, and this approach has a
long history (e.g.MacArthur, 1955;May, 1972;McCann, 2000;McCann et al.,
1998, Tilman and Downing, 1994). They have the potential to increase our
understanding of the effects of perturbations on the structure and functioning
of ecosystems and can be used as predictive tools in ecosystem management,
but only recently have such models ceased to be based on networks that are
randomly ordered and parameterized (Brose et al., 2008; Otto et al., 2007).
Traditionally, food webs are illustrated by a food web graph and described by
various statistical foodwebmetrics (such as average food chain length, number/
fraction of basal, intermediate and top species, etc.). These are used to capture
the trophic complexity of these webs and, as such, they are useful, but they also
have limitations. First of all, these tools may capture important aspects of
trophic structure but might reveal little about the functioning of the system.
For example, how robust is the food web to disturbances and what is the
contribution of individual species to community robustness? To address this
issue, species characteristics that affect community-level properties need to be
identified, and the distribution of these characteristics among the constituent
species needs to be described and analyzed. This calls for augmenting tradition-
al food web descriptions with additional information on species characteristics
that affect community-level properties. There are now growing efforts to
incorporate data on organismal traits into food web analyses. Recent
approaches include the trivariate or so-called MN-web (a food web with data
on body sizes,M, and abundance,N, of species; after Brown et al., 2011; Cohen
et al., 2003; Jonsson et al., 2005; Layer et al., 2010, 2011; McLaughlin et al.,
2010; Mulder et al., 2011; O’Gorman et al., 2010), the trophochemical web (a
food web with stoichiometric data on species, Sterner and Elser, 2002) and a
growing awareness of the importance of body size for many species traits and,
by extension, food web attributes (e.g. Brose et al., 2006a,b; Riede et al., 2011;
Woodward et al., 2005). Several size-based approaches to estimate trophic
interaction strengths and to parameterize food web models have also recently
been developed (e.g. Berg et al., 2011; Brose et al., 2008; O’Gorman and
Emmerson, 2010; Otto et al., 2007) as well as new techniques to analyse
community viability (Ebenman and Jonsson, 2005) and the contribution of
every species to community robustness (Berg et al., 2011). Taken together, these
new developments in food web ecology have the potential for yielding an
improved understanding of controls on food web structure, as well as elucidat-
ing the ways in which perturbations may affect natural ecosystems (Woodward
et al., 2010a). Much of this work is still in its infancy, and the possible insights
gained from these approaches have only started to be explored.We assume that
the functional characteristics of the species that make up a food web (i.e.
foraging behaviour and feeding strategy) will affect the properties of the entire
THE ROLE OF BODY SIZE IN COMPLEX FOOD WEBS: A COLD CASE 185
Author's personal copy
community, and this should therefore enable us to develop a classification
scheme for the functional roles of consumers.
Recent research has shown that species from higher trophic levels (Pauly
et al., 1998), large-bodied or slow-growing species, with late maturity tend to
decline or go extinct more rapidly than those that are smaller (Cardillo, 2003;
Layer et al., 2011; McKinney, 1997). This suggests that some life-history
traits like body size are linked to susceptibility to extinction and thus may be
more likely to trigger secondary extinctions. Body size is a useful ‘super-trait’
for collapsing many functional attributes of a given species into a single,
relatively easy to measure dimension. Along with temperature, it largely
determines an individual’s basal metabolic rate and its growth rate, which
in turn are associated with natural mortality rates, longevity, age at maturity
and reproductive output (Brose et al., 2005a,b; Castle et al., 2011; Ings et al.,
2009; Peters, 1983; Woodward et al., 2010a; Yvon-Durocher et al., 2011).
A recent study (Riede et al., 2011) has shown that predator body mass
increases with trophic level across a variety of predator types and across
ecosystems (marine, stream, lake and terrestrial). These results supported
theoretical predictions that predators are, on an average, larger then their
prey and that they are, on average, more similar in size to their prey at higher
trophic levels than at the base of the food web (Jonsson et al., 2005; Layman
et al., 2005; Romanuk et al., 2011). There are some apparent exceptions,
including interactions between herbivore and plants, parasite–host relation-
ships and benthic stream invertebrates as well as some marine benthic
invertebrates, for which a different kind of size–structure seems to apply,
that is, different feeding strategies enable most benthic invertebrates to feed
on prey items larger then themselves (Riede et al., 2011).
Most food web studies are from relatively species-poor networks (i.e. low
species/node numbers), and thus fairly simply structured networks, such
as Tuesday Lake (Cohen et al., 2003; Jonsson et al., 2005), and/or from
communities that to some extent have been disturbed, such as the acidic
Broadstone stream (Woodward et al., 2005). Few studies are from species-
rich, highly complex communities, and for this reason, our knowledge about
what characterises such systems is poor. Further, for large, species-rich food
webs, a food web graph and traditional food web statistics can do little more
than conveying a fraction of the immense complexity of these entangled webs
(e.g. Woodward et al., 2008), and new complementary ways of describing
food web structure that are linked to functional attributes are needed.
We aimed to address this gap in our current knowledge by characterising the
species-rich and pristine Weddell Sea food web and developing a new classifi-
cation scheme for the functional roles of consumers to describe and analyse the
trophic complexity of this system. The Weddell Sea food web data represent a
unique opportunity to analyse an exceptionally large and relatively undisturbed
complex community from a large and globally important three-dimensional
186 UTE JACOB ET AL.
Author's personal copy
ecosystem within the marine Antarctic (Arntz et al., 1994; 1997). In contrast to
the previous pioneering trophic studies of the Weddell Sea ecosystem, which
focused on a simple pelagic food chain (Tranter, 1982), the data set analyzed
here reveals an extraordinarily complex foodweb that includes the benthos (see
Brose et al., 2006a,b; Jacob, 2005). This complexity reflects the high species
numbers (Brey et al., 1994; Gutt et al., 2004), the great variety of foraging
strategies (e.g. Brenner et al., 2001; Dahm, 1996; Nyssen et al., 2002), the
enormous range in body mass of species and the large proportion of omnivo-
rous species in the system (Jacob et al., 2003; 2005).
Because of the highly resolved nature of the data, we were able to classify the
key functional roles of many species. We did this by focussing on consumers in
this food web and developing a new classification scheme (i.e. sorting consu-
mers into 11 different categories) which takes different consumer traits into
account and includes feeding strategy (predator, grazer, etc.), prey type (herbi-
vore, etc.), motility and habitat. Based on the recent theoretical advances
described above, we assume that these consumer characteristics and their
body size will determine food web properties and that we can therefore analyse
the contribution of different species categories to community robustness.
Food web robustness estimates the impact of species loss on one aspect of
food web stability: that is, its potential to experience secondary extinctions
based on its topology (sensuDunne et al., 2002). To investigate how robust the
Weddell Sea food web is to the loss of species, we carried out a topological
extinction analysis (Dunne et al., 2002, 2004; Staniczenko et al., 2010). In this
approach, computer simulations are used to investigate how susceptible a food
web is to sequential collapse as a result of secondary extinction cascades.
To summarize, we focus on what traits characterise the consumers in a
large pristine food web and how the robustness of this food web depends on
the sequence in which these species are assumed to go extinct. We aimed to
explore (i) how body size is correlated with network structure (i.e. the trophic
level of a species or its generality/vulnerability) over all species in theWeddell
Sea and across a variety of consumer feeding types and (ii) the role of species
characteristics such as body size regarding network robustness to provide
first steps towards the understanding on how body size of a species con-
straints the likelihood of extinctions.
II. METHODS
A. The Weddell Sea Data Set
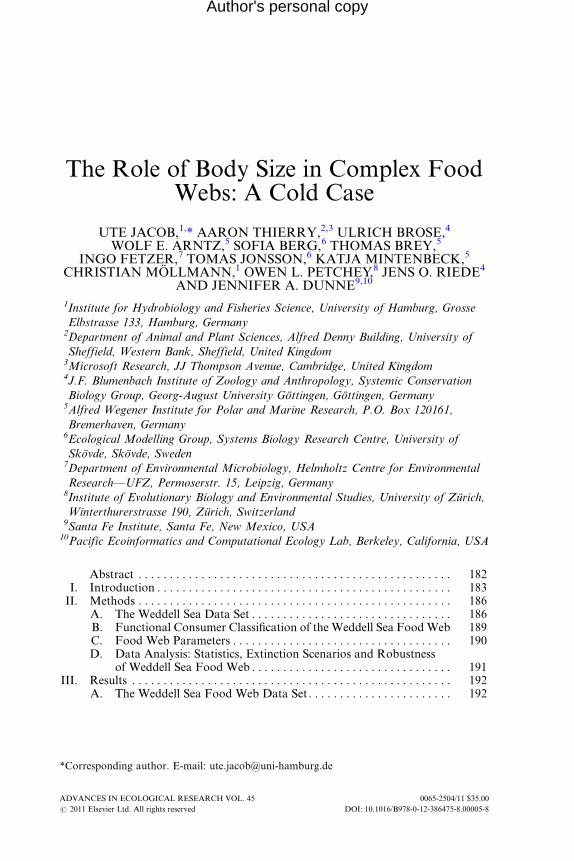
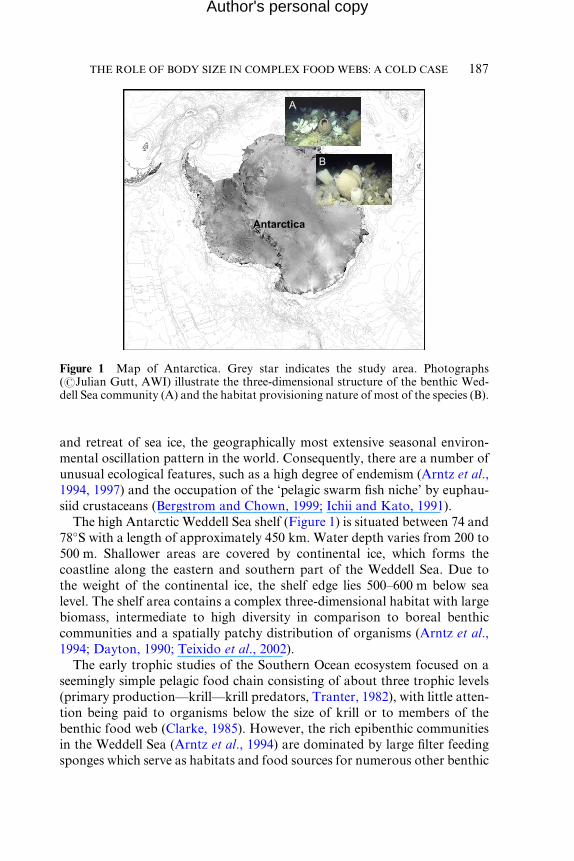
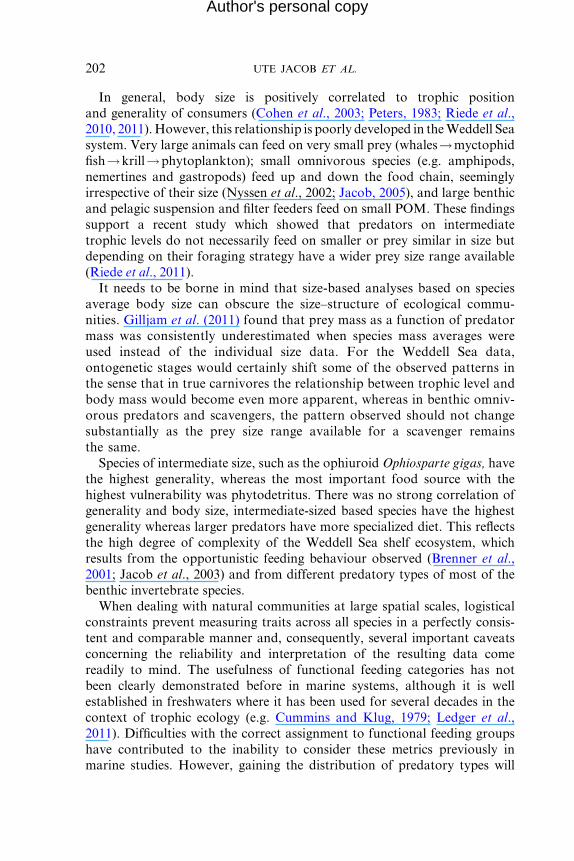
The Southern Ocean (Figure 1) ecosystem exhibits a number of unique
features, including �25 million years of bio-geographic isolation (Barnes,
2005; Clarke, 1985; Hempel, 1985) and, in the form of the annual formation
A
Antarctica
B
Figure 1 Map of Antarctica. Grey star indicates the study area. Photographs(#Julian Gutt, AWI) illustrate the three-dimensional structure of the benthic Wed-dell Sea community (A) and the habitat provisioning nature of most of the species (B).
THE ROLE OF BODY SIZE IN COMPLEX FOOD WEBS: A COLD CASE 187
Author's personal copy
and retreat of sea ice, the geographically most extensive seasonal environ-
mental oscillation pattern in the world. Consequently, there are a number of
unusual ecological features, such as a high degree of endemism (Arntz et al.,
1994, 1997) and the occupation of the ‘pelagic swarm fish niche’ by euphau-
siid crustaceans (Bergstrom and Chown, 1999; Ichii and Kato, 1991).
The high Antarctic Weddell Sea shelf (Figure 1) is situated between 74 and
78�S with a length of approximately 450 km. Water depth varies from 200 to
500 m. Shallower areas are covered by continental ice, which forms the
coastline along the eastern and southern part of the Weddell Sea. Due to
the weight of the continental ice, the shelf edge lies 500–600 m below sea
level. The shelf area contains a complex three-dimensional habitat with large
biomass, intermediate to high diversity in comparison to boreal benthic
communities and a spatially patchy distribution of organisms (Arntz et al.,
1994; Dayton, 1990; Teixido et al., 2002).
The early trophic studies of the Southern Ocean ecosystem focused on a
seemingly simple pelagic food chain consisting of about three trophic levels
(primary production—krill—krill predators, Tranter, 1982), with little atten-
tion being paid to organisms below the size of krill or to members of the
benthic food web (Clarke, 1985). However, the rich epibenthic communities
in the Weddell Sea (Arntz et al., 1994) are dominated by large filter feeding
sponges which serve as habitats and food sources for numerous other benthic
188 UTE JACOB ET AL.
Author's personal copy
invertebrates and vertebrates and which therefore support the high species
richness observed (e.g. see photographs in Figure 1A and B). Most of the
Weddell Sea food web consumers are benthic invertebrates and fish species,
with four trophic entities (phytodetritus, sediment, bacteria and particulate
organic matter (POM)), forming important basal resources (Hall and
Raffaelli, 1991; Warren, 1989).
We compiled a species list that encompasses 489 consumer and resource
species from the high Antarctic Weddell Sea (over 500 publications were
analyzed and standardized: for a full description of the methods used and a
full list of these publications see Jacob, 2005). This marine food web, which
includes all the food web data available for the high Antarctic Weddell Sea
collected since 1983, is one of the most highly resolved marine food webs
documented to date, although it is a summary web that ignores seasonal
changes. Diet composition of each species was observed from a combination
of field observations and stomach content analyses performed between 2001
and 2004 (see Jacob, 2005). Expert ecologists specialized in different species
assisted with identification and sample provision. A list of taxonomic keys
used can be found in Jacob (2005). In some species, that is, benthic grazers
and suspension feeders, poor taxonomic resolution of prey items would have
biased estimates. Here, we used information obtained in the laboratory
about these species’ size, behaviour and stable isotope signatures (Brose
et al., 2005a; Jacob et al., 2005) to deduce their feeding habits. Stable isotope
analysis was performed for �600 species and �3100 individuals in total and
included mainly sponges, fishes and benthic invertebrates. In brief, stable
isotope (d13C and d15N) signatures serve as proxies of the trophic distance of
an organism from the primary food source of the corresponding food chain
(Fry, 1988). d13C signatures are commonly used as carbon source tracers,
whereas d15N values are a useful tool for detecting the trophic position and
therefore the trophic hierarchy of the system (Post, 2002). Samples were
lyophilisated for 24 h in a Finn-Aqua Lyovac GT2E and then ground to a
fine powder. Each sample was acidified to remove CaCO3 in accordance with
Fry (1988) and Jacob et al. (2005). Stable isotope analysis and concentration
measurements of nitrogen and carbon were performed simultaneously with a
THERMO/Finnigan MAT Delta plus isotope ratio mass spectrometer, cou-
pled to a THERMO NA2500 elemental analyzer via a THERMO/Finnigan
Conflo II-interface. Stable isotope ratios are given in the conventional delta
notation (d13C; d15N) relative to atmospheric nitrogen and PDB (PeeDee
Belemnite standard).
For the food web construction, following the approach of Martinez
(1991), a directional feeding link was assigned to any pair of species A and
B whenever an investigator reports that A consumes B. Species were not
divided further into larvae, juveniles or adults but treated as ‘adults’: conse-
quently, with the data used here, we cannot address ontogenetic diet shifts.

THE ROLE OF BODY SIZE IN COMPLEX FOOD WEBS: A COLD CASE 189
Author's personal copy
The average body mass of the species populations was either directly
measured (>90%) or in case of marine mammals and seabirds taken from
published accounts (Brose et al., 2005a).
B. Functional Consumer Classification of theWeddell Sea Food Web
Although characterising the relationship between ecosystem functioning and
biodiversity is a challenging task, it is widely accepted that functional diversity
of organisms sustains ecosystem functioning (e.g. Loreau et al., 2001; Reiss
et al., 2009; Schulze andMooney, 1993). This, however, raises the fundamental
issue of how best to classify a functional species and how to assign functional
traits. That is, what are the characteristics that determine the effect of a species
on an ecosystem? Categorising different types of predation is one way to
classify the extent to which species interact with each other. Instead of focusing
on what they eat (which is covered by the traditional food web approach of
who-eats-whom), we here classify consumers by feeding mode, and the general
nature of the interaction (i.e. herbivorous, carnivorous or omnivorous) be-
tween predator and prey species. More specifically, we consider the feeding
strategy, habitat, andmobility of the consumer and trophic type/position of the
prey as important characteristics of consumer species.We suggest that these are
useful additions to traditional descriptions of foodweb structure thatwill aid in
linking food web structure to ecosystem functioning.
In this chapter, consumer species are grouped into 11 categories based on
four suites of traits: feeding strategy, prey type, motility and habitat. Within
each of these four groupings, four sub-groups were identified, outlined
below.
The four main feeding strategies considered are:
(1) Predator: If the consumer feeds upon the prey species that it has directly
killed, either via an active hunt for prey or via a sit-and-wait strategy for
prey to approach within striking distance, it is considered a predator.
Such a consumer need not consume the entirety of their prey to fall into
this category but only parts of the prey. In contrast, parasites do not
necessarily kill their hosts.
(2) Scavenger: If, in at least some of the feeding interactions that the con-
sumer takes part, the prey species has already been killed by some
previous event, then the consumer is considered a scavenger. As above,
the entire prey item need not to be consumed entirely during the
interaction.
(3) Grazer: A consumer species that feeds by grazing. In the process, they
may either kill their prey species (like zooplankton species preying on

190 UTE JACOB ET AL.
Author's personal copy
unicellular algae) or merely damage it (as in the case of herbivorous
urchins only preying on a small part of benthic macroalgae).
(4) Filtering: A consumer that actively or passively filters their prey species
out of the water column, that is, a suspension feeder.
A second set of traits that encompasses four main prey types, which are:
(1) Herbivore: A consumer that feeds on plant material only.
(2) Carnivore: A consumer that feeds on other animals only.
(3) Omnivore: A consumer that feeds on both animals and plants, as well as
dead and alive material and therefore on more than one trophic level.
(4) Detritivore: A consumer that feeds on dead animals and plants and/or
dissolved organic matter only.
The third trait set deals with mobility and habitat measures and distin-
guishes the various mechanisms for maintaining position and moving around
in the marine environment. Each species was assigned to a mobility category
according to whether it is (1) a ‘sessile or passive floater’, (2) a ‘crawler’, (3) a
‘facultative swimmer’, or (4) an ‘obligate swimmer’.
The fourth and last trait set describes the physical position of a species within
the environment. The species are described as (1) benthic, if the species lives on
the seafloor; (2) pelagic, if the species lives close to the surface; (3) benthopela-
gic, if it moves between and links both environments; or (4) land-based, if the
consumer is not aquatic but feeds predominantly in the marine realm.
Applying these classifications, we derived 11 groups, (bearing in mind that
not all combinations are possible): carnivorous benthic predators (e.g. most
fish species and nemertines), carnivorous benthic suspension feeders (e.g. the
hydrozoan Tubularia ralphii or copepods, Orejas, 2001), carnivorous pelagic
predators (e.g. squids and fishes), carnivorous land-based predators (e.g. the
Leopard seal), detritivorous/herbivorous grazers (e.g. most sea urchins),
herbivorous/detritivorous benthic suspension feeders (e.g. all Porifera),
omnivorous benthic predators (e.g. amphipods), omnivorous benthic
predator/scavengers (e.g. most seastars), omnivorous benthopelagic preda-
tors (e.g. fishes), omnivorous land-based predators/scavengers (e.g. seabirds)
and omnivorous pelagic predators (e.g. omnivorous copepods).
C. Food Web Parameters
Many summarizing indices or food web metrics have been proposed previ-
ously to allow for comparisons between different food webs across ecosys-
tems (e.g. Cohen et al., 1993; Jonsson et al., 2005; Pimm, 1982; Pimm et al.,
1991). Conventional descriptors of food webs are based on the number of
THE ROLE OF BODY SIZE IN COMPLEX FOOD WEBS: A COLD CASE 191
Author's personal copy
nodes or species, S, in a food web and the number of links, L, between them
(Hall and Raffaelli, 1993).
A food chain is an ordered sequence of at least two species that runs from a
basal species (i.e. a primary producer or detritus) to a top predator. Food
chain length is the number of links within this particular path (Hall and
Raffaelli, 1993; Pimm, 1982).
Linkage density (L/S) is the number of links per species (S), connectance (C),
the proportion of realised links within a web, is calculated as 2�L/(S2�S)
(Hall and Raffaelli, 1993; Warren, 1989), linkage complexity is calculated by
S�C (Briand, 1985). Trophic vulnerability (V) and trophic generality (G) of
a species are the numbers of its predator and prey species, respectively
(Schoener, 1989).
With respect to the number of links from detritus to its consumers, we
followed a conservative approach here as we introduced a single virtual
‘phytodetritus species’. As there are 59 phytoplankton species in our system,
one could argue that there exist 59 feeding links between phytodetritus and
any species that feeds upon it. This would change all parameters significantly
and make the Weddell Sea system even more unique in terms of linkage
density and generality.
There are various ways to calculate the trophic height of a species within a
food web. The prey averaged trophic height is the TL calculation many prior
studies have used, which is equal to 1 plus the mean trophic height of all the
consumer’s trophic resources (Williams and Martinez, 2004). Here, we use
the short-weighted trophic height, where the prey averaged trophic height is
weighted by the shortest chain within the network, as it is a better estimate of
trophic height (Williams and Martinez, 2008).
D. Data Analysis: Statistics, Extinction Scenarios andRobustness of Weddell Sea Food Web
To explore whether species body mass was correlated with trophic level as
well as whether a consumer’s trophic generality and vulnerability (e.g.
Memmott et al., 2000) are related to the functional consumer classifications,
we conducted simple pairwise correlations between body size and trophic
level for all parameters for the entire set of species. We also conducted this
analysis for all consumers combined (i.e. ignoring categories). The analysis
was performed using R.
To investigate robustness of the Weddell Sea food web, we carried out
computer simulations that quantified how susceptible the food web was to
collapse as a result of secondary extinction cascades. The method employed
is as follows: first, a species is removed from the network; following this, any
non-basal species that loses all of its prey items, or cannibalistic species that

192 UTE JACOB ET AL.
Author's personal copy
loses all of its prey items except itself, are deemed to have gone secondarily
extinct and are then removed from the web (Dunne et al., 2002). The
simulation next checks to see if any further extinctions occur as a conse-
quence of the loss of those species which went secondarily extinct. Once the
cascade ends, another species is selected for removal (using criteria described
below) and the process repeats itself until the web is reduced to half its
original species richness. Given this algorithm, basal species may experience
primary removals but not secondary extinctions.
The propensity of the web to suffer secondary extinctions (its robustness)
is then quantified as the fraction of species that had to be removed in order to
result in a loss of at least 50% of the species (i.e. primary species removals
plus secondary extinctions). A value of robustness for the web was calculated
in the following way:
Robustness ¼ N � 112S � 1
where N is the number of removals and S is the original species richness. The
value of robustness can range from 0 where the web collapsed to half its
original species richness following the first removal to 1 in the case where
there are no secondary extinctions.
The sequential orders of the species removed (the primary extinctions)
are based on specific species traits. In this study, we based the orders on three
traits: a species’ generality (the number of its prey species), vulnerability (the
number of its predator species) and average body mass, removing species in
both increasing and decreasing order of each trait. There was also a random
order (1000 implementations of which were run), which served as a reference
point. Consequently, in total, we had seven distinct extinction orders. Those
orders based on a species’ links updated the sequence following each round
of extinction to take into account links lost in the previous round. If trait
values were tied (e.g. if two species had the same number of prey), then the
one to be removed was chosen at random. All computer simulations were
carried out using R (Code: Thierry unpublished).
III. RESULTS
A. The Weddell Sea Food Web Data Set
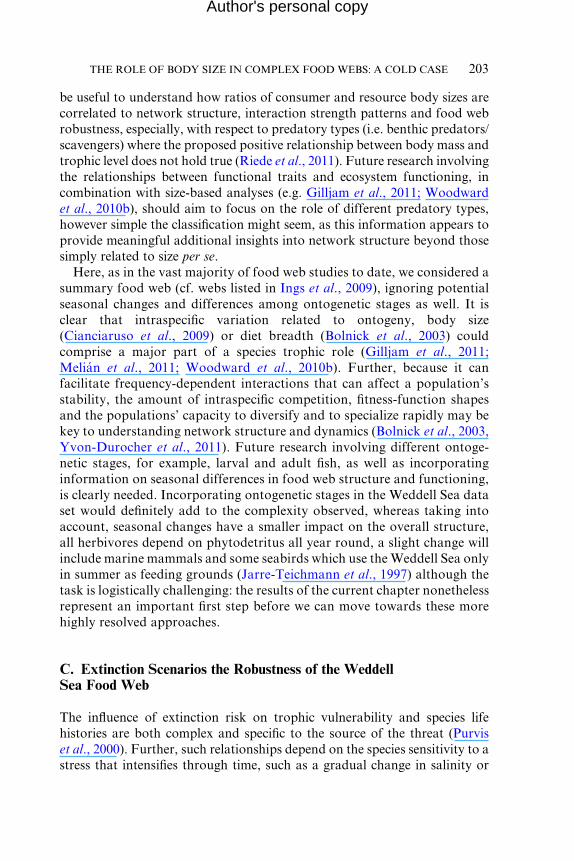
The Weddell Sea food web dataset consisted of 488 species (out of which 420
species are consumers, see Appendix), and 16,200 feeding links were docu-
mented (Figure 2). This included all the food web data available for the high

Figure 2 Food web of the high Antarctic Weddell Sea. The vertical axis displays theshort-weighted trophic level (Williams and Martinez, 2008). Nodes are scaled relativeto body size. Image created with FoodWeb3D (Williams, 2010; Yoon et al., 2004).
THE ROLE OF BODY SIZE IN COMPLEX FOOD WEBS: A COLD CASE 193
Author's personal copy
Antarctic Weddell Sea collected since the 1983. The web had a relatively low
connectance of 0.067 in comparison with other marine webs (Table 1), where
connectance varied between 0.22 for the Northeast US Shelf system (Dunne
et al., 2004; Link, 2002) and 0.24 for the Benguela food web (Yodzis, 1998;
food web analyzed in Dunne et al., 2004). Linkage density was the highest
reported so far with 33.19, in comparison with 7.0 for the Benguela web
and 17.8 for the Northeastern US Shelf. In the Weddell Sea food web, 6.7%
of the Weddell Sea species were top predators, (species with no consumers),
79.7 % were intermediate species (with predators and prey) and 13.6% species
were basal species (primary producers which are only prey). The percentages
of intermediate and top species were well in the range with the Benguela and
Northeastern US Shelf system, but in comparison, the higher percentage of
basal species (13.6% vs. 3–7%) reflected the better resolution at the basal
level (i.e. Dunne et al., 2004). The high degree of omnivory (67.8%)
was comparable with omnivory values reported for other marine webs
(Dunne et al., 2004).
These results reflected common features of the Weddell Sea system, differ-
ences in foraging behaviour and the extreme high degree of omnivory of
marine consumers, and explained the high linkage density observed. Most
fish and marine invertebrate species were opportunistic generalists with a
high trophic generality (Brenner et al., 2001; Dahm, 1996; Jacob et al., 2003,
2005) as indicated by the high number of documented feeding links.

Table 1 Topological food web properties for four marine food webs(Taxa¼number of taxa, C¼connectance (L/S2), L/S¼ links per species, TL¼meantrophic level, T¼% top species, I¼% intermediate species, B¼% basal species,Omn¼% omnivorous species)
S C L/S TL T I B Omn Reference
Benguela 29 0.24 7.0 3.2 0 93 7 76 Yodzis (1998)Caribbean Reef 50 0.22 11.1 2.9 0 94 6 86 Opitz (1996)NE US Shelf 81 0.22 17.8 3.1 4 94 3 78 Link (2002)Weddell Sea 492 0.07 33.19 2.5 6.7 79.7 13.6 67.27 Jacob (2005)
Data analyzed in Dunne et al. (2004).
194 UTE JACOB ET AL.
Author's personal copy
B. Functional Consumer Classification ofthe Weddell Sea Food Web
Average body mass of Weddell Sea shelf species stretched across 22 orders of
magnitude, from 1.53�10�14 g in small unicellular algae to 8.58�108 g in
baleen whales. The trophic level calculated via the diet matrix ranged from 1
in the primary producers up to 4.9 in a predatory scavenging seabird.
Detritus and planktonic copepods had the highest vulnerability (220 preda-
tors for detritus and 146 for copepods) whereas the nemertean Parborlasia
corrugatus had no reported predators at all due to its toxic skin (i.e. Jacob,
2005). The species with the highest generality was an omnivorous benthic
ophiuroid with 246 prey items. Species with the lowest generality were either
benthic grazers who only preyed on detritus, which was problematic, as
detritus may consist of an unconsolidated mixture of dead material from
many sources.
All mobility levels were represented; sessile or floating species, such as
Porifera, bryozoans, detritus and diatoms; crawlers, such as asteroids, echi-
noids and holothurians; facultative swimmers, such as some amphipods,
crinoids and octopods; and obligate swimmers such as copepods, euphau-
siids, squids, fishes and whales.
The assignment of predatory, feeding type and environmental classifica-
tions (i.e. our 11 groups) resulted in five major combined consumer cate-
gories and/or species trophic roles. The first group included carnivorous
crawling and swimming benthic predators (n¼34), swimming carnivorous
benthopelagic (n¼19), swimming pelagic predators (n¼35) and swimming
land-based predators (n¼17): this group included all those species that only
feed on alive prey of trophic heights higher than one.
The second group encompassed omnivorous crawling benthic predators
(n¼24), swimming omnivorous benthopelagic (n¼19) and swimming
pelagic predators (n¼35): this category included all those species that
THE ROLE OF BODY SIZE IN COMPLEX FOOD WEBS: A COLD CASE 195
Author's personal copy
feed on alive prey of higher trophic levels but also at lower trophic levels
(i.e. plants and detritus).
A third group was made up of herbivorous crawling benthic predators
(n¼34), swimming omnivorous benthopelagic (n¼1) and swimming pelagic
predators (n¼23): this included all those species that feed on lower trophic
levels (i.e. plants and detritus).
The fourth groups were omnivorous crawling benthic predators and sca-
vengers (n¼75), swimming benthopelagic (n¼40), swimming pelagic (n¼22)
and swimming land-based (n¼4) omnivorous benthic predators and scaven-
gers, which included all those species that feed on alive prey but also recently
killed prey items.
Finally, there was a fifth group that included herbivorous/detritivorous
crawling benthic grazers (n¼39), swimming herbivorous/detritivorous pelag-
ic grazers (n¼12) and sessile herbivorous/detritivorous benthic suspension
feeders (n¼112).
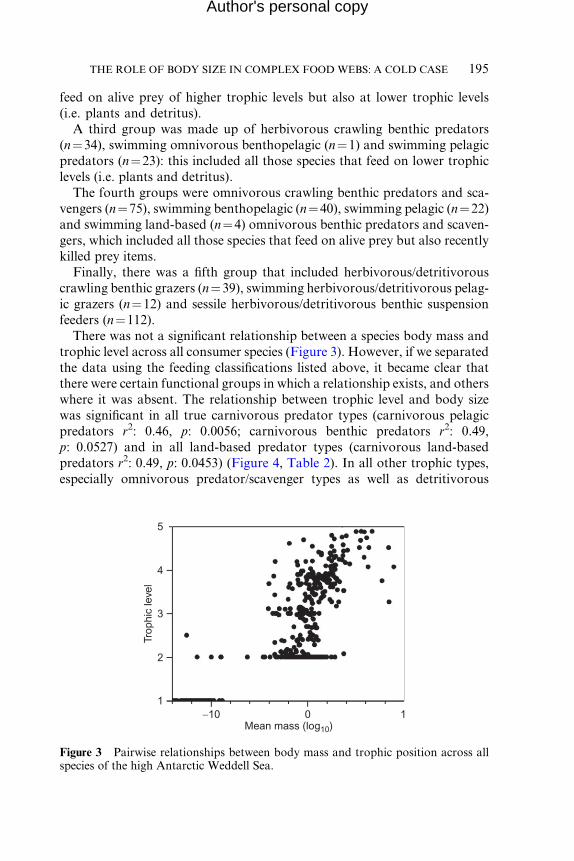
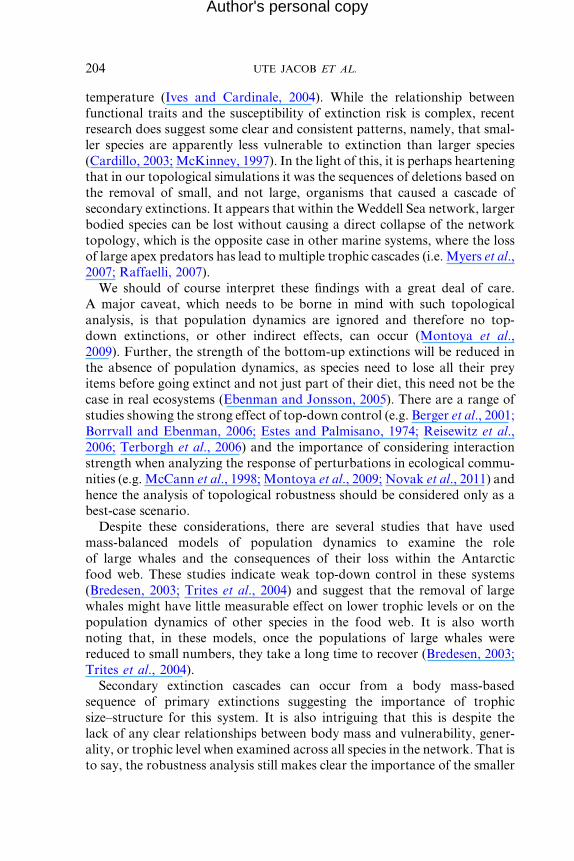
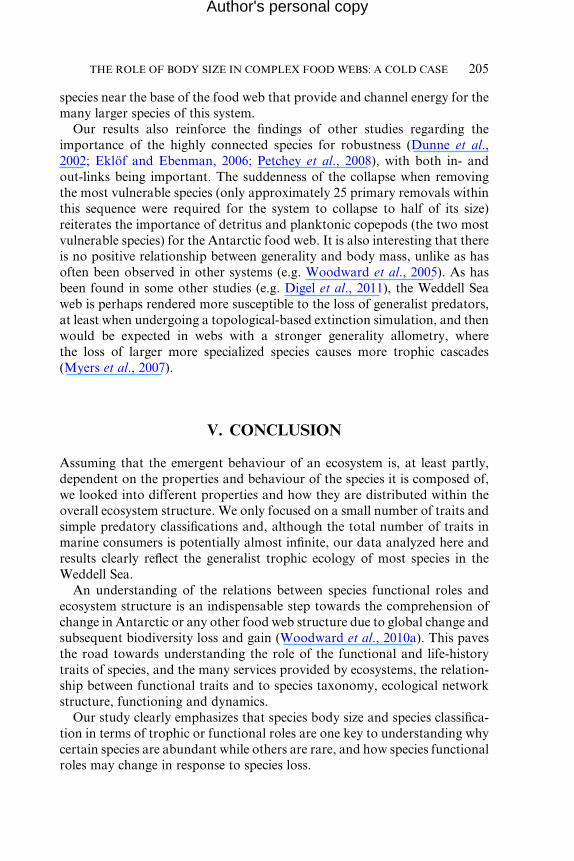
There was not a significant relationship between a species body mass and
trophic level across all consumer species (Figure 3). However, if we separated
the data using the feeding classifications listed above, it became clear that
there were certain functional groups in which a relationship exists, and others
where it was absent. The relationship between trophic level and body size
was significant in all true carnivorous predator types (carnivorous pelagic
predators r2: 0.46, p: 0.0056; carnivorous benthic predators r2: 0.49,
p: 0.0527) and in all land-based predator types (carnivorous land-based
predators r2: 0.49, p: 0.0453) (Figure 4, Table 2). In all other trophic types,
especially omnivorous predator/scavenger types as well as detritivorous
Mean mass (log10)
Trop
hic
leve
l
-10 0 11
2
3
4
5
Figure 3 Pairwise relationships between body mass and trophic position across allspecies of the high Antarctic Weddell Sea.

Mean mass (log10)-4 -3 -2 -1 0 1 2 3 4 5
1
2
3
4
5
6 7
Trop
hic
leve
l
Mean mass (log10)-4 -3 -2 -1 0 1 2 3 4 5
1
2
3
4
5
6 7
Trop
hic
leve
l
Mean mass (log10)-4 -3 -2 -1 0 1 2 3 4 5
1
2
3
4
5
6 7
Trop
hic
leve
l
Mean mass (log10)-4 -3 -2 -1 0 1 2 3 4 5
1
2
3
4
5
6 7
Trop
hic
leve
l
Mean mass (log10)-4 -3 -2 -1 0 1 2 3 4 5
1
2
3
4
5
6 7
Trop
hic
leve
l
Mean mass (log10)-4 -3 -2 -1 0 1 2 3 4 5
1
2
3
4
5
6 7
Trop
hic
leve
l
Mean mass (log10)-4 -3 -2 -1 0 1 2 3 4 5
1
2
3
4
5
6 7
Trop
hic
leve
l
Mean mass (log10)-4 -3 -2 -1 0 1 2 3 4 5
1
2
3
4
5
6 7
Trop
hic
leve
l
A B
DC
E
G
F
H
Figure 4 Pairwise relationships between species body size and trophic positionseparated according predatory types, (A–D) illustrating the albeit weak but signifi-cant relationships between trophic level and body mass (A: carnivorous benthicpredators, B: carnivorous benthopelagic predators, C: carnivorous land-based andD: carnivorous pelagic predators), (E–H), illustrating the non-significant relation-ships for the E: suspension feeders, F: omnivorous pelagic predators, G: omnivorouspredators and scavengers and H: omnivorous benthic predators.
Author's personal copy
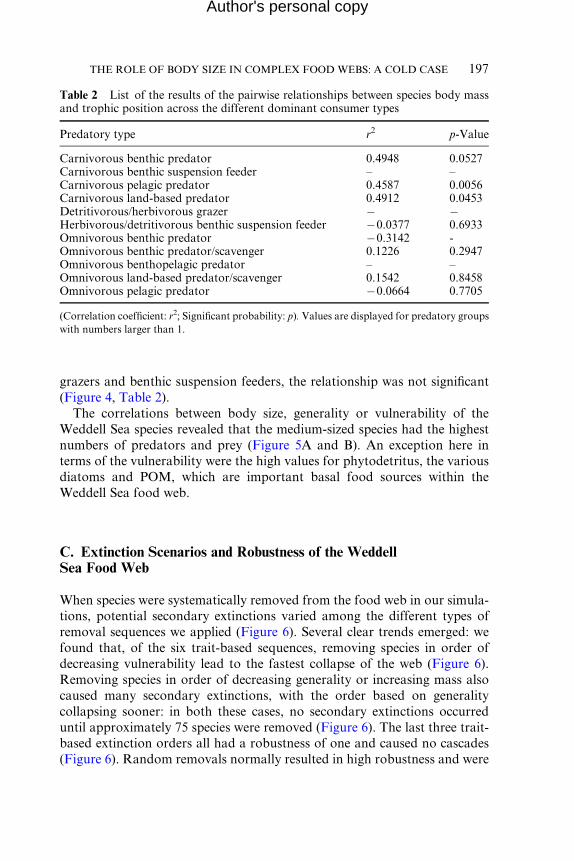
Table 2 List of the results of the pairwise relationships between species body massand trophic position across the different dominant consumer types
Predatory type r2 p-Value
Carnivorous benthic predator 0.4948 0.0527Carnivorous benthic suspension feeder – –Carnivorous pelagic predator 0.4587 0.0056Carnivorous land-based predator 0.4912 0.0453Detritivorous/herbivorous grazer � �Herbivorous/detritivorous benthic suspension feeder �0.0377 0.6933Omnivorous benthic predator �0.3142 -Omnivorous benthic predator/scavenger 0.1226 0.2947Omnivorous benthopelagic predator – –Omnivorous land-based predator/scavenger 0.1542 0.8458Omnivorous pelagic predator �0.0664 0.7705
(Correlation coefficient: r2; Significant probability: p). Values are displayed for predatory groups
with numbers larger than 1.
THE ROLE OF BODY SIZE IN COMPLEX FOOD WEBS: A COLD CASE 197
Author's personal copy
grazers and benthic suspension feeders, the relationship was not significant
(Figure 4, Table 2).
The correlations between body size, generality or vulnerability of the
Weddell Sea species revealed that the medium-sized species had the highest
numbers of predators and prey (Figure 5A and B). An exception here in
terms of the vulnerability were the high values for phytodetritus, the various
diatoms and POM, which are important basal food sources within the
Weddell Sea food web.
C. Extinction Scenarios and Robustness of the WeddellSea Food Web
When species were systematically removed from the food web in our simula-
tions, potential secondary extinctions varied among the different types of
removal sequences we applied (Figure 6). Several clear trends emerged: we
found that, of the six trait-based sequences, removing species in order of
decreasing vulnerability lead to the fastest collapse of the web (Figure 6).
Removing species in order of decreasing generality or increasing mass also
caused many secondary extinctions, with the order based on generality
collapsing sooner: in both these cases, no secondary extinctions occurred
until approximately 75 species were removed (Figure 6). The last three trait-
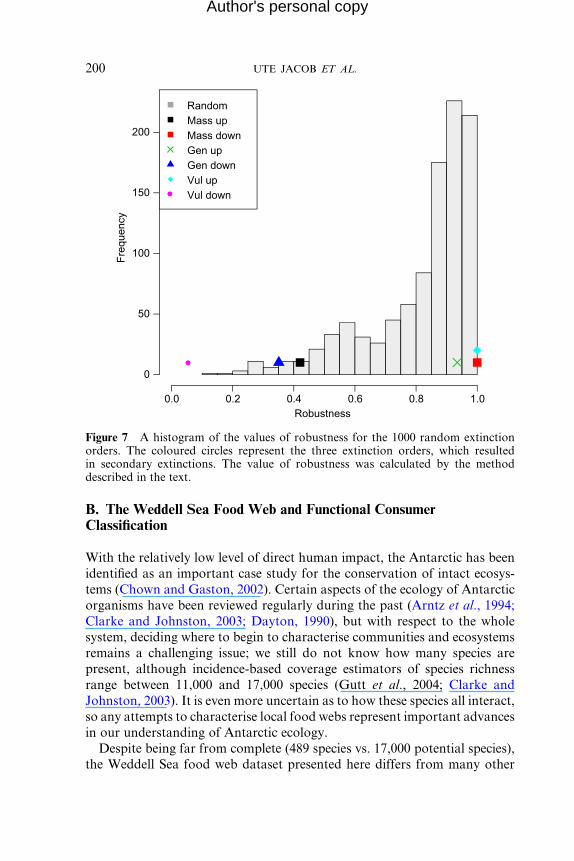
based extinction orders all had a robustness of one and caused no cascades
(Figure 6). Random removals normally resulted in high robustness and were

-10 0Mean mass (log10)
10
50
100
150
200
250
300
0
Gen
eral
ity
-10 0Mean mass (log10)
10
20
10
40
30
50
60
70
80
90
100
0
Vul
nera
bilit
y
Figure 5 Pairwise relationships between species body mass and generality and bodymass and vulnerability.
198 UTE JACOB ET AL.
Author's personal copy
very rarely found to result in robustness as low as the trait-based orders,
which caused collapse due to cascades (Figure 7).
IV. DISCUSSION
A. Implications of This Study
Here, we have demonstrated that grouping species by their traits (other
than simply body size) is an ecological meaningful way to approach the
complexity found in natural food webs. We have used a popular approach

0 50 100 150 200 250
0
50
100
150
200
250
Number of primary extinctionns
Cum
ulat
ive
num
ber
of e
xtin
ctio
ns
RandomMass upMass downGen upGen downVul upVul down
Figure 6 The relationship between the number of species removed and the cumula-tive number of extinctions (both removals and species which went secondary extinct).The dashed lines indicate the point at which half of the original species richness isreached. The different colours indicate the different extinction orders. Gen stands forgenerality and Vul for vulnerability. Up stands for removing the species with thelowest value of the trait to the highest. Down stands for removing the species with thehighest value of the trait to the lowest.
THE ROLE OF BODY SIZE IN COMPLEX FOOD WEBS: A COLD CASE 199
Author's personal copy
to analyse this food web complexity by regressing body size of species
against food web parameters (trophic height) and found that when we
separated the data according to our classification system, that is, when
we added additional traits to the information on body size, stronger food
web patterns emerged.
Our extinction simulations have shown that it has been the removal of
small to medium-sized, and not large, organisms that caused a cascade of
secondary extinctions. It appears that larger-bodied species can be lost
without causing a direct collapse of the network topology that will affect
other species. This finding is surprising given that large species are assumed
and have been proven to cause trophic cascades (Raffaelli, 2007).
Robustness
Fre
quen
cy
0.0 0.2 0.4 0.6 0.8 1.0
0
50
100
150
200
RandomMass upMass downGen upGen downVul upVul down
Figure 7 A histogram of the values of robustness for the 1000 random extinctionorders. The coloured circles represent the three extinction orders, which resultedin secondary extinctions. The value of robustness was calculated by the methoddescribed in the text.
200 UTE JACOB ET AL.
Author's personal copy
B. The Weddell Sea Food Web and Functional ConsumerClassification
With the relatively low level of direct human impact, the Antarctic has been
identified as an important case study for the conservation of intact ecosys-
tems (Chown and Gaston, 2002). Certain aspects of the ecology of Antarctic
organisms have been reviewed regularly during the past (Arntz et al., 1994;
Clarke and Johnston, 2003; Dayton, 1990), but with respect to the whole
system, deciding where to begin to characterise communities and ecosystems
remains a challenging issue; we still do not know how many species are
present, although incidence-based coverage estimators of species richness
range between 11,000 and 17,000 species (Gutt et al., 2004; Clarke and
Johnston, 2003). It is even more uncertain as to how these species all interact,
so any attempts to characterise local food webs represent important advances
in our understanding of Antarctic ecology.
Despite being far from complete (489 species vs. 17,000 potential species),
the Weddell Sea food web dataset presented here differs from many other
THE ROLE OF BODY SIZE IN COMPLEX FOOD WEBS: A COLD CASE 201
Author's personal copy
well-known food webs in general in three of its key properties: (i) there are
many more feeding links detected than previously reported for marine food
webs (e.g. Dunne et al., 2004; Woodward et al., 2010b); (ii) the basal species
of the food web are (relatively) highly resolved and not lumped as phyto-
plankton or primary producers (but see Brown et al., 2011; Layer et al., 2010,
2011) and (iii) detritus is one of the most important food sources as reflected
by its high trophic vulnerability (Jacob, 2005; see also Layer et al., 2011,
Mulder et al., 2011).
The high number of feeding links can be explained by the generalist feeding
nature of most of the species of the Weddell Sea shelf and their well-docu-
mented capacity of diet shifting in response to availability (e.g. Brenner et al.,
2001; Jacob et al., 2003). This confirms early suggestions by Glasser (1983)
that if resource abundances are highly variable and frequently tend to be
scarce, as in the high Antarctic indicated by the pulsed phytoplankton
bloom, consumers will be more likely be adapted to use many alternative
resources, as reflected by the high trophic vulnerability of detritus which is
also true for Broadstone Stream (Layer et al., 2011) where all primary
consumers depend on detritus as the most important food source.
Here, we use body size as a trait and a number of functional classifica-
tions of predatory types to understand the trophic role of the Weddell Sea
consumer species. The ‘trophic level’ of a species is the vertical position
within a food web, as defined by all links to or from this species (Gilljam
et al., 2011), and as such is typically described by a continuous, rather than
an integer, scale. Research on trophic levels focuses on (i) patterns common
to all ecological networks (Elton, 1927; Pimm et al., 1991; Riede et al.,
2011; Yodzis, 1998); (ii) patterns that distinguish types of systems (Riede
et al., 2011) and (iii) patterns that distinguish an organism’s role within
ecological networks (Elton, 1927; Riede et al., 2011; Williams and
Martinez, 2004). Usually, predators are between one and three orders of
magnitude larger than their prey (Cohen et al., 2003; Jonsson et al., 2005;
Woodward and Hildrew, 2002), and the trophic level is positively corre-
lated with body size, and although there are some notable exceptions (e.g.
host–parasite and some host–parasitoid systems; see Henri and Van Veen,
2011, pack hunters and baleen whales), this general biological phenomenon
illustrates the links between the trophic structure of whole communities and
body size (Brown et al., 2004; Riede et al., 2011). Across the whole food
web, trophic level and body size are often positively related (Jennings et al.,
2002; Riede et al., 2011). Although species with a similar maximum body
size can evolve to feed at different trophic levels, there are fewer small
species feeding at high trophic levels than at low trophic levels (Jennings
et al., 2002), and many of these ‘unusual’ patterns may be due to artefacts
arising from the common practice of using species-averaged data (Gilljam
et al., 2011; Woodward et al., 2010b).
202 UTE JACOB ET AL.
Author's personal copy
In general, body size is positively correlated to trophic position
and generality of consumers (Cohen et al., 2003; Peters, 1983; Riede et al.,
2010, 2011).However, this relationship is poorly developed in theWeddell Sea
system. Very large animals can feed on very small prey (whales!myctophid
fish!krill!phytoplankton); small omnivorous species (e.g. amphipods,
nemertines and gastropods) feed up and down the food chain, seemingly
irrespective of their size (Nyssen et al., 2002; Jacob, 2005), and large benthic
and pelagic suspension and filter feeders feed on small POM. These findings
support a recent study which showed that predators on intermediate
trophic levels do not necessarily feed on smaller or prey similar in size but
depending on their foraging strategy have a wider prey size range available
(Riede et al., 2011).
It needs to be borne in mind that size-based analyses based on species
average body size can obscure the size–structure of ecological commu-
nities. Gilljam et al. (2011) found that prey mass as a function of predator
mass was consistently underestimated when species mass averages were
used instead of the individual size data. For the Weddell Sea data,
ontogenetic stages would certainly shift some of the observed patterns in
the sense that in true carnivores the relationship between trophic level and
body mass would become even more apparent, whereas in benthic omniv-
orous predators and scavengers, the pattern observed should not change
substantially as the prey size range available for a scavenger remains
the same.
Species of intermediate size, such as the ophiuroid Ophiosparte gigas, have
the highest generality, whereas the most important food source with the
highest vulnerability was phytodetritus. There was no strong correlation of
generality and body size, intermediate-sized based species have the highest
generality whereas larger predators have more specialized diet. This reflects
the high degree of complexity of the Weddell Sea shelf ecosystem, which
results from the opportunistic feeding behaviour observed (Brenner et al.,
2001; Jacob et al., 2003) and from different predatory types of most of the
benthic invertebrate species.
When dealing with natural communities at large spatial scales, logistical
constraints prevent measuring traits across all species in a perfectly consis-
tent and comparable manner and, consequently, several important caveats
concerning the reliability and interpretation of the resulting data come
readily to mind. The usefulness of functional feeding categories has not
been clearly demonstrated before in marine systems, although it is well
established in freshwaters where it has been used for several decades in the
context of trophic ecology (e.g. Cummins and Klug, 1979; Ledger et al.,
2011). Difficulties with the correct assignment to functional feeding groups
have contributed to the inability to consider these metrics previously in
marine studies. However, gaining the distribution of predatory types will
THE ROLE OF BODY SIZE IN COMPLEX FOOD WEBS: A COLD CASE 203
Author's personal copy
be useful to understand how ratios of consumer and resource body sizes are
correlated to network structure, interaction strength patterns and food web
robustness, especially, with respect to predatory types (i.e. benthic predators/
scavengers) where the proposed positive relationship between body mass and
trophic level does not hold true (Riede et al., 2011). Future research involving
the relationships between functional traits and ecosystem functioning, in
combination with size-based analyses (e.g. Gilljam et al., 2011; Woodward
et al., 2010b), should aim to focus on the role of different predatory types,
however simple the classification might seem, as this information appears to
provide meaningful additional insights into network structure beyond those
simply related to size per se.
Here, as in the vast majority of food web studies to date, we considered a
summary food web (cf. webs listed in Ings et al., 2009), ignoring potential
seasonal changes and differences among ontogenetic stages as well. It is
clear that intraspecific variation related to ontogeny, body size
(Cianciaruso et al., 2009) or diet breadth (Bolnick et al., 2003) could
comprise a major part of a species trophic role (Gilljam et al., 2011;
Melian et al., 2011; Woodward et al., 2010b). Further, because it can
facilitate frequency-dependent interactions that can affect a population’s
stability, the amount of intraspecific competition, fitness-function shapes
and the populations’ capacity to diversify and to specialize rapidly may be
key to understanding network structure and dynamics (Bolnick et al., 2003,
Yvon-Durocher et al., 2011). Future research involving different ontoge-
netic stages, for example, larval and adult fish, as well as incorporating
information on seasonal differences in food web structure and functioning,
is clearly needed. Incorporating ontogenetic stages in the Weddell Sea data
set would definitely add to the complexity observed, whereas taking into
account, seasonal changes have a smaller impact on the overall structure,
all herbivores depend on phytodetritus all year round, a slight change will
include marine mammals and some seabirds which use theWeddell Sea only
in summer as feeding grounds (Jarre-Teichmann et al., 1997) although the
task is logistically challenging: the results of the current chapter nonetheless
represent an important first step before we can move towards these more
highly resolved approaches.
C. Extinction Scenarios the Robustness of the WeddellSea Food Web
The influence of extinction risk on trophic vulnerability and species life
histories are both complex and specific to the source of the threat (Purvis
et al., 2000). Further, such relationships depend on the species sensitivity to a
stress that intensifies through time, such as a gradual change in salinity or
204 UTE JACOB ET AL.
Author's personal copy
temperature (Ives and Cardinale, 2004). While the relationship between
functional traits and the susceptibility of extinction risk is complex, recent
research does suggest some clear and consistent patterns, namely, that smal-
ler species are apparently less vulnerable to extinction than larger species
(Cardillo, 2003; McKinney, 1997). In the light of this, it is perhaps heartening
that in our topological simulations it was the sequences of deletions based on
the removal of small, and not large, organisms that caused a cascade of
secondary extinctions. It appears that within theWeddell Sea network, larger
bodied species can be lost without causing a direct collapse of the network
topology, which is the opposite case in other marine systems, where the loss
of large apex predators has lead to multiple trophic cascades (i.e. Myers et al.,
2007; Raffaelli, 2007).
We should of course interpret these findings with a great deal of care.
A major caveat, which needs to be borne in mind with such topological
analysis, is that population dynamics are ignored and therefore no top-
down extinctions, or other indirect effects, can occur (Montoya et al.,
2009). Further, the strength of the bottom-up extinctions will be reduced in
the absence of population dynamics, as species need to lose all their prey
items before going extinct and not just part of their diet, this need not be the
case in real ecosystems (Ebenman and Jonsson, 2005). There are a range of
studies showing the strong effect of top-down control (e.g. Berger et al., 2001;
Borrvall and Ebenman, 2006; Estes and Palmisano, 1974; Reisewitz et al.,
2006; Terborgh et al., 2006) and the importance of considering interaction
strength when analyzing the response of perturbations in ecological commu-
nities (e.g. McCann et al., 1998; Montoya et al., 2009; Novak et al., 2011) and
hence the analysis of topological robustness should be considered only as a
best-case scenario.
Despite these considerations, there are several studies that have used
mass-balanced models of population dynamics to examine the role
of large whales and the consequences of their loss within the Antarctic
food web. These studies indicate weak top-down control in these systems
(Bredesen, 2003; Trites et al., 2004) and suggest that the removal of large
whales might have little measurable effect on lower trophic levels or on the
population dynamics of other species in the food web. It is also worth
noting that, in these models, once the populations of large whales were
reduced to small numbers, they take a long time to recover (Bredesen, 2003;
Trites et al., 2004).
Secondary extinction cascades can occur from a body mass-based
sequence of primary extinctions suggesting the importance of trophic
size–structure for this system. It is also intriguing that this is despite the
lack of any clear relationships between body mass and vulnerability, gener-
ality, or trophic level when examined across all species in the network. That is
to say, the robustness analysis still makes clear the importance of the smaller
THE ROLE OF BODY SIZE IN COMPLEX FOOD WEBS: A COLD CASE 205
Author's personal copy
species near the base of the food web that provide and channel energy for the
many larger species of this system.
Our results also reinforce the findings of other studies regarding the
importance of the highly connected species for robustness (Dunne et al.,
2002; Eklof and Ebenman, 2006; Petchey et al., 2008), with both in- and
out-links being important. The suddenness of the collapse when removing
the most vulnerable species (only approximately 25 primary removals within
this sequence were required for the system to collapse to half of its size)
reiterates the importance of detritus and planktonic copepods (the two most
vulnerable species) for the Antarctic food web. It is also interesting that there
is no positive relationship between generality and body mass, unlike as has
often been observed in other systems (e.g. Woodward et al., 2005). As has
been found in some other studies (e.g. Digel et al., 2011), the Weddell Sea
web is perhaps rendered more susceptible to the loss of generalist predators,
at least when undergoing a topological-based extinction simulation, and then
would be expected in webs with a stronger generality allometry, where
the loss of larger more specialized species causes more trophic cascades
(Myers et al., 2007).
V. CONCLUSION
Assuming that the emergent behaviour of an ecosystem is, at least partly,
dependent on the properties and behaviour of the species it is composed of,
we looked into different properties and how they are distributed within the
overall ecosystem structure. We only focused on a small number of traits and
simple predatory classifications and, although the total number of traits in
marine consumers is potentially almost infinite, our data analyzed here and
results clearly reflect the generalist trophic ecology of most species in the
Weddell Sea.
An understanding of the relations between species functional roles and
ecosystem structure is an indispensable step towards the comprehension of
change in Antarctic or any other food web structure due to global change and
subsequent biodiversity loss and gain (Woodward et al., 2010a). This paves
the road towards understanding the role of the functional and life-history
traits of species, and the many services provided by ecosystems, the relation-
ship between functional traits and to species taxonomy, ecological network
structure, functioning and dynamics.
Our study clearly emphasizes that species body size and species classifica-
tion in terms of trophic or functional roles are one key to understanding why
certain species are abundant while others are rare, and how species functional
roles may change in response to species loss.
206 UTE JACOB ET AL.
Author's personal copy
ACKNOWLEDGEMENTS
This work was stimulated by fruitful discussions with members of the ESF
Network SIZEMIC, especially with members of the three European Science
Foundation funded SIZEMIC Working Groups led by O. P., U. T., Frank
van Veen and Julia Reiss. Katja Mintenbeck is funded by the German
Research Foundation (DFG, SSP 1158 Antarktisforschung, Project MI
1391/1).
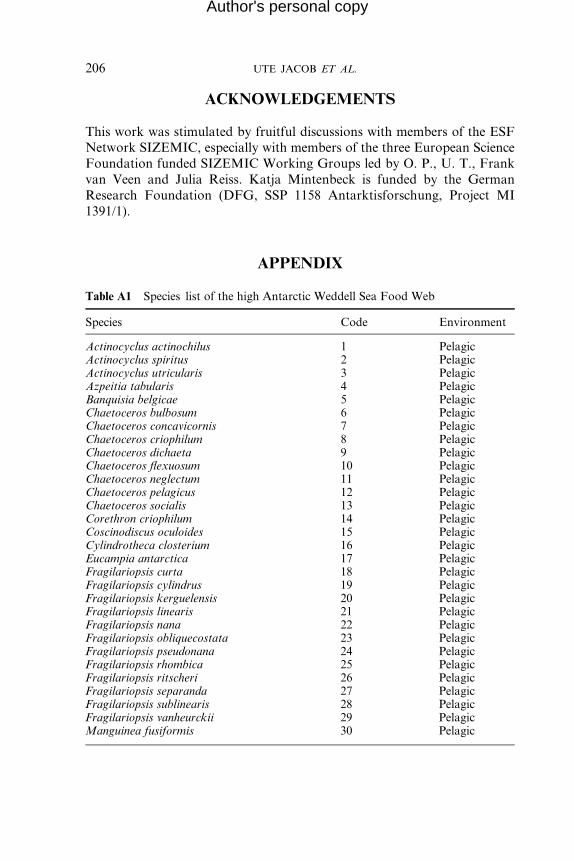
APPENDIX
Table A1 Species list of the high Antarctic Weddell Sea Food Web
Species Code Environment
Actinocyclus actinochilus 1 PelagicActinocyclus spiritus 2 PelagicActinocyclus utricularis 3 PelagicAzpeitia tabularis 4 PelagicBanquisia belgicae 5 PelagicChaetoceros bulbosum 6 PelagicChaetoceros concavicornis 7 PelagicChaetoceros criophilum 8 PelagicChaetoceros dichaeta 9 PelagicChaetoceros flexuosum 10 PelagicChaetoceros neglectum 11 PelagicChaetoceros pelagicus 12 PelagicChaetoceros socialis 13 PelagicCorethron criophilum 14 PelagicCoscinodiscus oculoides 15 PelagicCylindrotheca closterium 16 PelagicEucampia antarctica 17 PelagicFragilariopsis curta 18 PelagicFragilariopsis cylindrus 19 PelagicFragilariopsis kerguelensis 20 PelagicFragilariopsis linearis 21 PelagicFragilariopsis nana 22 PelagicFragilariopsis obliquecostata 23 PelagicFragilariopsis pseudonana 24 PelagicFragilariopsis rhombica 25 PelagicFragilariopsis ritscheri 26 PelagicFragilariopsis separanda 27 PelagicFragilariopsis sublinearis 28 PelagicFragilariopsis vanheurckii 29 PelagicManguinea fusiformis 30 Pelagic
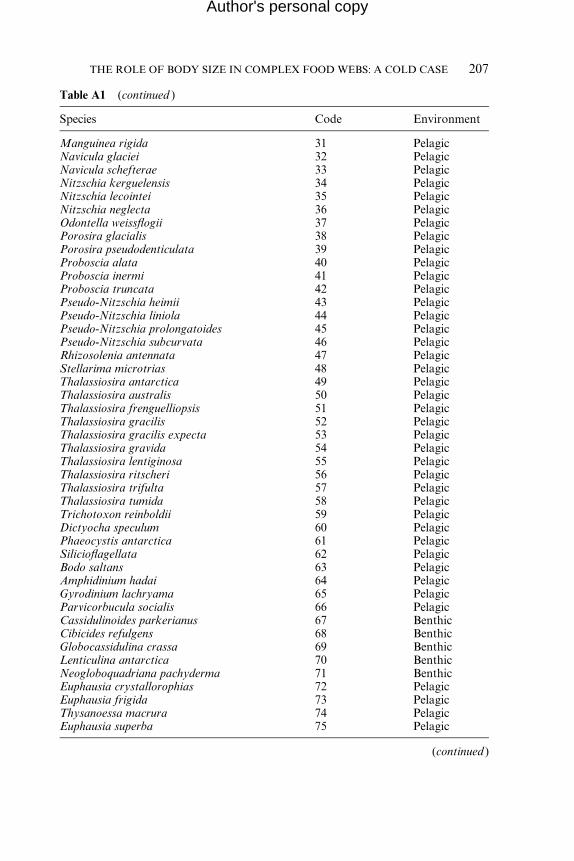
Table A1 (continued )
Species Code Environment
Manguinea rigida 31 PelagicNavicula glaciei 32 PelagicNavicula schefterae 33 PelagicNitzschia kerguelensis 34 PelagicNitzschia lecointei 35 PelagicNitzschia neglecta 36 PelagicOdontella weissflogii 37 PelagicPorosira glacialis 38 PelagicPorosira pseudodenticulata 39 PelagicProboscia alata 40 PelagicProboscia inermi 41 PelagicProboscia truncata 42 PelagicPseudo-Nitzschia heimii 43 PelagicPseudo-Nitzschia liniola 44 PelagicPseudo-Nitzschia prolongatoides 45 PelagicPseudo-Nitzschia subcurvata 46 PelagicRhizosolenia antennata 47 PelagicStellarima microtrias 48 PelagicThalassiosira antarctica 49 PelagicThalassiosira australis 50 PelagicThalassiosira frenguelliopsis 51 PelagicThalassiosira gracilis 52 PelagicThalassiosira gracilis expecta 53 PelagicThalassiosira gravida 54 PelagicThalassiosira lentiginosa 55 PelagicThalassiosira ritscheri 56 PelagicThalassiosira trifulta 57 PelagicThalassiosira tumida 58 PelagicTrichotoxon reinboldii 59 PelagicDictyocha speculum 60 PelagicPhaeocystis antarctica 61 PelagicSilicioflagellata 62 PelagicBodo saltans 63 PelagicAmphidinium hadai 64 PelagicGyrodinium lachryama 65 PelagicParvicorbucula socialis 66 PelagicCassidulinoides parkerianus 67 BenthicCibicides refulgens 68 BenthicGlobocassidulina crassa 69 BenthicLenticulina antarctica 70 BenthicNeogloboquadriana pachyderma 71 BenthicEuphausia crystallorophias 72 PelagicEuphausia frigida 73 PelagicThysanoessa macrura 74 PelagicEuphausia superba 75 Pelagic
(continued )
THE ROLE OF BODY SIZE IN COMPLEX FOOD WEBS: A COLD CASE 207
Author's personal copy
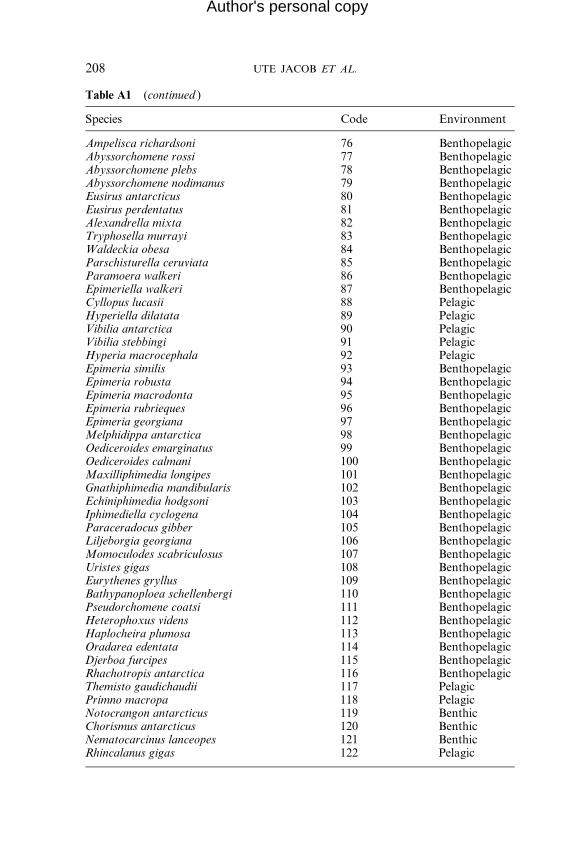
Table A1 (continued )
Species Code Environment
Ampelisca richardsoni 76 BenthopelagicAbyssorchomene rossi 77 BenthopelagicAbyssorchomene plebs 78 BenthopelagicAbyssorchomene nodimanus 79 BenthopelagicEusirus antarcticus 80 BenthopelagicEusirus perdentatus 81 BenthopelagicAlexandrella mixta 82 BenthopelagicTryphosella murrayi 83 BenthopelagicWaldeckia obesa 84 BenthopelagicParschisturella ceruviata 85 BenthopelagicParamoera walkeri 86 BenthopelagicEpimeriella walkeri 87 BenthopelagicCyllopus lucasii 88 PelagicHyperiella dilatata 89 PelagicVibilia antarctica 90 PelagicVibilia stebbingi 91 PelagicHyperia macrocephala 92 PelagicEpimeria similis 93 BenthopelagicEpimeria robusta 94 BenthopelagicEpimeria macrodonta 95 BenthopelagicEpimeria rubrieques 96 BenthopelagicEpimeria georgiana 97 BenthopelagicMelphidippa antarctica 98 BenthopelagicOediceroides emarginatus 99 BenthopelagicOediceroides calmani 100 BenthopelagicMaxilliphimedia longipes 101 BenthopelagicGnathiphimedia mandibularis 102 BenthopelagicEchiniphimedia hodgsoni 103 BenthopelagicIphimediella cyclogena 104 BenthopelagicParaceradocus gibber 105 BenthopelagicLiljeborgia georgiana 106 BenthopelagicMomoculodes scabriculosus 107 BenthopelagicUristes gigas 108 BenthopelagicEurythenes gryllus 109 BenthopelagicBathypanoploea schellenbergi 110 BenthopelagicPseudorchomene coatsi 111 BenthopelagicHeterophoxus videns 112 BenthopelagicHaplocheira plumosa 113 BenthopelagicOradarea edentata 114 BenthopelagicDjerboa furcipes 115 BenthopelagicRhachotropis antarctica 116 BenthopelagicThemisto gaudichaudii 117 PelagicPrimno macropa 118 PelagicNotocrangon antarcticus 119 BenthicChorismus antarcticus 120 BenthicNematocarcinus lanceopes 121 BenthicRhincalanus gigas 122 Pelagic
208 UTE JACOB ET AL.
Author's personal copy
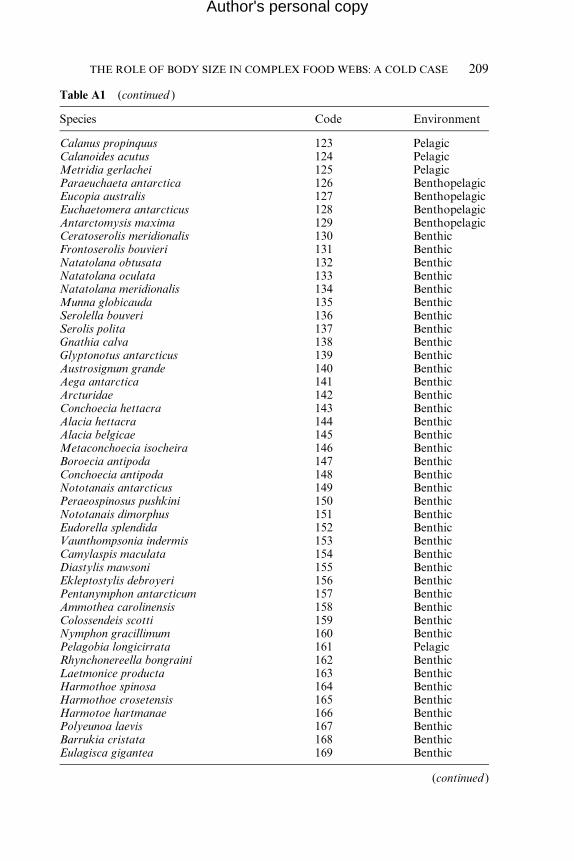
Table A1 (continued )
Species Code Environment
Calanus propinquus 123 PelagicCalanoides acutus 124 PelagicMetridia gerlachei 125 PelagicParaeuchaeta antarctica 126 BenthopelagicEucopia australis 127 BenthopelagicEuchaetomera antarcticus 128 BenthopelagicAntarctomysis maxima 129 BenthopelagicCeratoserolis meridionalis 130 BenthicFrontoserolis bouvieri 131 BenthicNatatolana obtusata 132 BenthicNatatolana oculata 133 BenthicNatatolana meridionalis 134 BenthicMunna globicauda 135 BenthicSerolella bouveri 136 BenthicSerolis polita 137 BenthicGnathia calva 138 BenthicGlyptonotus antarcticus 139 BenthicAustrosignum grande 140 BenthicAega antarctica 141 BenthicArcturidae 142 BenthicConchoecia hettacra 143 BenthicAlacia hettacra 144 BenthicAlacia belgicae 145 BenthicMetaconchoecia isocheira 146 BenthicBoroecia antipoda 147 BenthicConchoecia antipoda 148 BenthicNototanais antarcticus 149 BenthicPeraeospinosus pushkini 150 BenthicNototanais dimorphus 151 BenthicEudorella splendida 152 BenthicVaunthompsonia indermis 153 BenthicCamylaspis maculata 154 BenthicDiastylis mawsoni 155 BenthicEkleptostylis debroyeri 156 BenthicPentanymphon antarcticum 157 BenthicAmmothea carolinensis 158 BenthicColossendeis scotti 159 BenthicNymphon gracillimum 160 BenthicPelagobia longicirrata 161 PelagicRhynchonereella bongraini 162 BenthicLaetmonice producta 163 BenthicHarmothoe spinosa 164 BenthicHarmothoe crosetensis 165 BenthicHarmotoe hartmanae 166 BenthicPolyeunoa laevis 167 BenthicBarrukia cristata 168 BenthicEulagisca gigantea 169 Benthic
(continued )
THE ROLE OF BODY SIZE IN COMPLEX FOOD WEBS: A COLD CASE 209
Author's personal copy
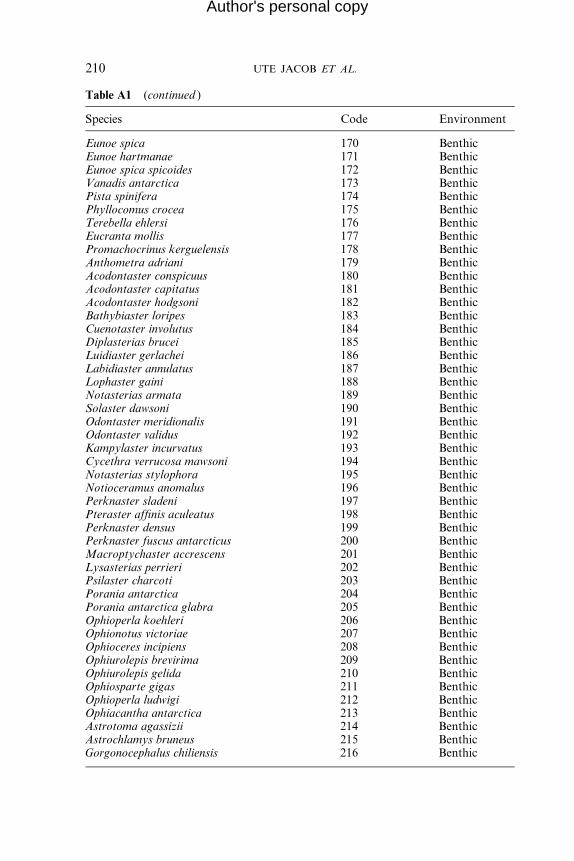
Table A1 (continued )
Species Code Environment
Eunoe spica 170 BenthicEunoe hartmanae 171 BenthicEunoe spica spicoides 172 BenthicVanadis antarctica 173 BenthicPista spinifera 174 BenthicPhyllocomus crocea 175 BenthicTerebella ehlersi 176 BenthicEucranta mollis 177 BenthicPromachocrinus kerguelensis 178 BenthicAnthometra adriani 179 BenthicAcodontaster conspicuus 180 BenthicAcodontaster capitatus 181 BenthicAcodontaster hodgsoni 182 BenthicBathybiaster loripes 183 BenthicCuenotaster involutus 184 BenthicDiplasterias brucei 185 BenthicLuidiaster gerlachei 186 BenthicLabidiaster annulatus 187 BenthicLophaster gaini 188 BenthicNotasterias armata 189 BenthicSolaster dawsoni 190 BenthicOdontaster meridionalis 191 BenthicOdontaster validus 192 BenthicKampylaster incurvatus 193 BenthicCycethra verrucosa mawsoni 194 BenthicNotasterias stylophora 195 BenthicNotioceramus anomalus 196 BenthicPerknaster sladeni 197 BenthicPteraster affinis aculeatus 198 BenthicPerknaster densus 199 BenthicPerknaster fuscus antarcticus 200 BenthicMacroptychaster accrescens 201 BenthicLysasterias perrieri 202 BenthicPsilaster charcoti 203 BenthicPorania antarctica 204 BenthicPorania antarctica glabra 205 BenthicOphioperla koehleri 206 BenthicOphionotus victoriae 207 BenthicOphioceres incipiens 208 BenthicOphiurolepis brevirima 209 BenthicOphiurolepis gelida 210 BenthicOphiosparte gigas 211 BenthicOphioperla ludwigi 212 BenthicOphiacantha antarctica 213 BenthicAstrotoma agassizii 214 BenthicAstrochlamys bruneus 215 BenthicGorgonocephalus chiliensis 216 Benthic
210 UTE JACOB ET AL.
Author's personal copy

Table A1 (continued )
Species Code Environment
Sterechinus neumayeri 217 BenthicSterechinus antarcticus 218 BenthicCtenocidaris gigantea 219 BenthicCtenocidaris spinosa 220 BenthicNotocidaris mortenseni 221 BenthicAbatus curvidens 222 BenthicAbatus cavernosus 223 BenthicAbatus nimrodi 224 BenthicAbatus shackeltoni 225 BenthicAustrocidaris canaliculata 226 BenthicAporocidaris milleri 227 BenthicCtenocidaris perrieri 228 BenthicCtenocidaris gilberti 229 BenthicMesothuria lactea 230 BenthicAchlyonice violaecuspidata 231 BenthicBathyplotes gourdoni 232 BenthicBathyplotes bongraini 233 BenthicScotoplanes globosa 234 BenthicMolpadia musculus 235 BenthicYpsilocucumis turricata 236 BenthicPsolidium incertum 237 BenthicTrachythyone parva 238 BenthicLaetmogone wyvillethompsoni 239 BenthicPseudostichopus mollis 240 BenthicPseudostichopus villosus 241 BenthicElpidia glacialis 242 BenthicChiridota weddellensis 243 BenthicEkmocucumis steineni 244 BenthicEkmocucumis turqueti 245 BenthicAbyssocucumis liouvillei 246 BenthicPsolus dubiosus 247 BenthicPsolus charcoti 248 BenthicPsolus antarcticus 249 BenthicEchinopsolus acanthocola 250 BenthicEkmocucumis turqueti turqueti 251 BenthicTaeniogyrus contortus 252 BenthicSilicularia rosea 253 BenthicTubularia ralphii 254 BenthicOswaldella antarctica 255 BenthicMonocaulus parvula 256 BenthicRhodalia miranda 257 PelagicAtolla wyvillei 258 PelagicDimophyes arctica 259 PelagicDiphyes antarctica 260 PelagicBargmannia 261 PelagicSolmundella bitentaculata 262 PelagicDipulmaris antarctica 263 Pelagic
(continued )
THE ROLE OF BODY SIZE IN COMPLEX FOOD WEBS: A COLD CASE 211
Author's personal copy
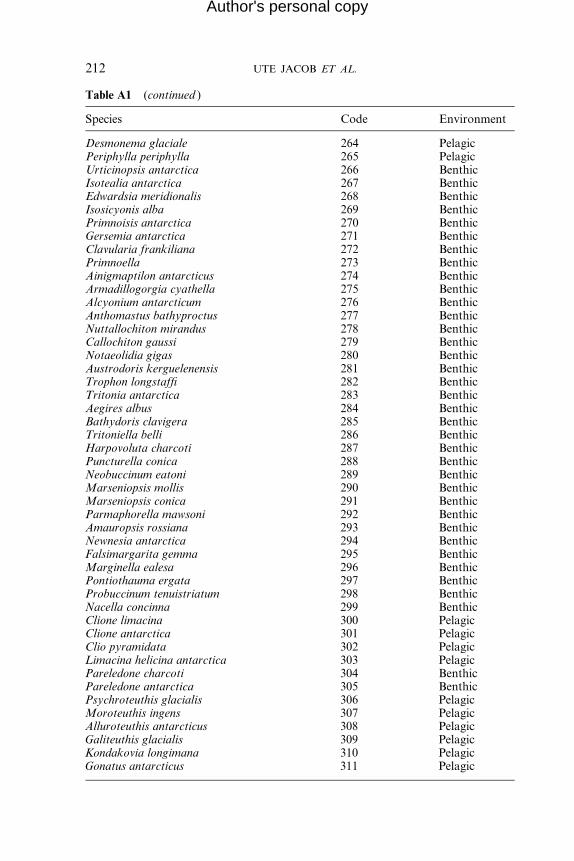
Table A1 (continued )
Species Code Environment
Desmonema glaciale 264 PelagicPeriphylla periphylla 265 PelagicUrticinopsis antarctica 266 BenthicIsotealia antarctica 267 BenthicEdwardsia meridionalis 268 BenthicIsosicyonis alba 269 BenthicPrimnoisis antarctica 270 BenthicGersemia antarctica 271 BenthicClavularia frankiliana 272 BenthicPrimnoella 273 BenthicAinigmaptilon antarcticus 274 BenthicArmadillogorgia cyathella 275 BenthicAlcyonium antarcticum 276 BenthicAnthomastus bathyproctus 277 BenthicNuttallochiton mirandus 278 BenthicCallochiton gaussi 279 BenthicNotaeolidia gigas 280 BenthicAustrodoris kerguelenensis 281 BenthicTrophon longstaffi 282 BenthicTritonia antarctica 283 BenthicAegires albus 284 BenthicBathydoris clavigera 285 BenthicTritoniella belli 286 BenthicHarpovoluta charcoti 287 BenthicPuncturella conica 288 BenthicNeobuccinum eatoni 289 BenthicMarseniopsis mollis 290 BenthicMarseniopsis conica 291 BenthicParmaphorella mawsoni 292 BenthicAmauropsis rossiana 293 BenthicNewnesia antarctica 294 BenthicFalsimargarita gemma 295 BenthicMarginella ealesa 296 BenthicPontiothauma ergata 297 BenthicProbuccinum tenuistriatum 298 BenthicNacella concinna 299 BenthicClione limacina 300 PelagicClione antarctica 301 PelagicClio pyramidata 302 PelagicLimacina helicina antarctica 303 PelagicPareledone charcoti 304 BenthicPareledone antarctica 305 BenthicPsychroteuthis glacialis 306 PelagicMoroteuthis ingens 307 PelagicAlluroteuthis antarcticus 308 PelagicGaliteuthis glacialis 309 PelagicKondakovia longimana 310 PelagicGonatus antarcticus 311 Pelagic
212 UTE JACOB ET AL.
Author's personal copy

Table A1 (continued )
Species Code Environment
Mesonychoteuthis hamiltoni 312 PelagicMartialia hyadesi 313 PelagicCyclocardia astartoides 314 BenthicYolida eightsi 315 BenthicLaternula elliptica 316 BenthicLimopsis lillei 317 BenthicLimopsis marionensis 318 BenthicLissarca notorcadensis 319 BenthicPropeleda longicaudata 320 BenthicCadulus dalli antarcticum 321 BenthicFissidentalium majorinum 322 BenthicCinachyra antarctica 323 BenthicCinachyra barbata 324 BenthicBathydorus spinosus 325 BenthicIophon radiatus 326 BenthicKirkpatrickia variolosa 327 BenthicRossella racovitzae 328 BenthicStylocordyla borealis 329 BenthicHomaxinella balfourensis 330 BenthicScolymastra joubini 331 BenthicLatrunculia apicalis 332 BenthicLatrunculia brevis 333 BenthicTetilla leptoderma 334 BenthicHaliclona dancoi 335 BenthicMycale acerata 336 BenthicRossella antarctica 337 BenthicRossella tarenja 338 BenthicHaliclona tenella 339 BenthicClathria pauper 340 BenthicCalyx arcuarius 341 BenthicIsodyctia toxophila 342 BenthicIsodyctia cavicornuta 343 BenthicIsodyctia steifera 344 BenthicAxociella nidificata 345 BenthicRossella nuda 346 BenthicTentorium papillatum 347 BenthicTentorium semisuberites 348 BenthicTedania oxeata 349 BenthicTedania tantulata 350 BenthicTedania vanhoeffeni 351 BenthicPhorbas areolatus 352 BenthicPhorbas glaberrima 353 BenthicPolymastia invaginata 354 BenthicPolymastia isidis 355 BenthicAnoxycalyx joubini 356 BenthicBeroe cucumis 357 PelagicLyrocteis flavopallidus 358 PelagicCallianira antarctica 359 Pelagic
(continued )
THE ROLE OF BODY SIZE IN COMPLEX FOOD WEBS: A COLD CASE 213
Author's personal copy
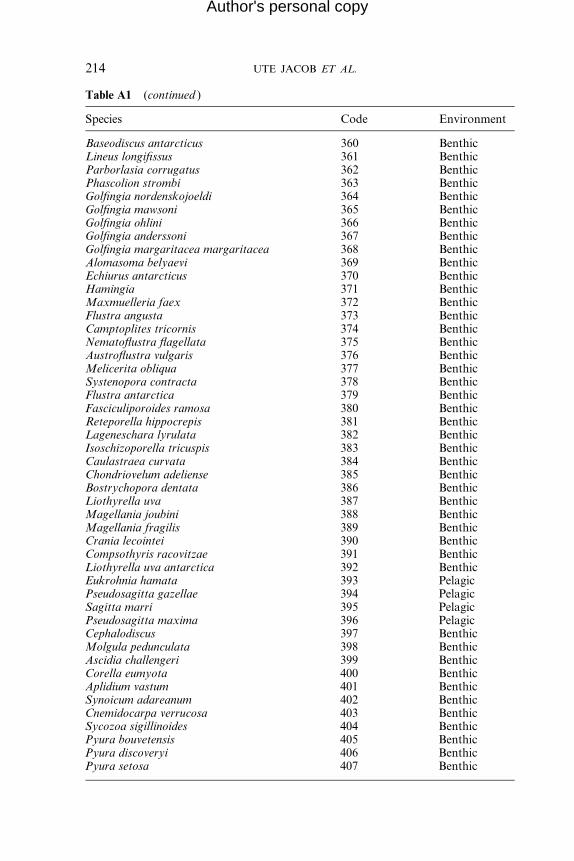
Table A1 (continued )
Species Code Environment
Baseodiscus antarcticus 360 BenthicLineus longifissus 361 BenthicParborlasia corrugatus 362 BenthicPhascolion strombi 363 BenthicGolfingia nordenskojoeldi 364 BenthicGolfingia mawsoni 365 BenthicGolfingia ohlini 366 BenthicGolfingia anderssoni 367 BenthicGolfingia margaritacea margaritacea 368 BenthicAlomasoma belyaevi 369 BenthicEchiurus antarcticus 370 BenthicHamingia 371 BenthicMaxmuelleria faex 372 BenthicFlustra angusta 373 BenthicCamptoplites tricornis 374 BenthicNematoflustra flagellata 375 BenthicAustroflustra vulgaris 376 BenthicMelicerita obliqua 377 BenthicSystenopora contracta 378 BenthicFlustra antarctica 379 BenthicFasciculiporoides ramosa 380 BenthicReteporella hippocrepis 381 BenthicLageneschara lyrulata 382 BenthicIsoschizoporella tricuspis 383 BenthicCaulastraea curvata 384 BenthicChondriovelum adeliense 385 BenthicBostrychopora dentata 386 BenthicLiothyrella uva 387 BenthicMagellania joubini 388 BenthicMagellania fragilis 389 BenthicCrania lecointei 390 BenthicCompsothyris racovitzae 391 BenthicLiothyrella uva antarctica 392 BenthicEukrohnia hamata 393 PelagicPseudosagitta gazellae 394 PelagicSagitta marri 395 PelagicPseudosagitta maxima 396 PelagicCephalodiscus 397 BenthicMolgula pedunculata 398 BenthicAscidia challengeri 399 BenthicCorella eumyota 400 BenthicAplidium vastum 401 BenthicSynoicum adareanum 402 BenthicCnemidocarpa verrucosa 403 BenthicSycozoa sigillinoides 404 BenthicPyura bouvetensis 405 BenthicPyura discoveryi 406 BenthicPyura setosa 407 Benthic
214 UTE JACOB ET AL.
Author's personal copy
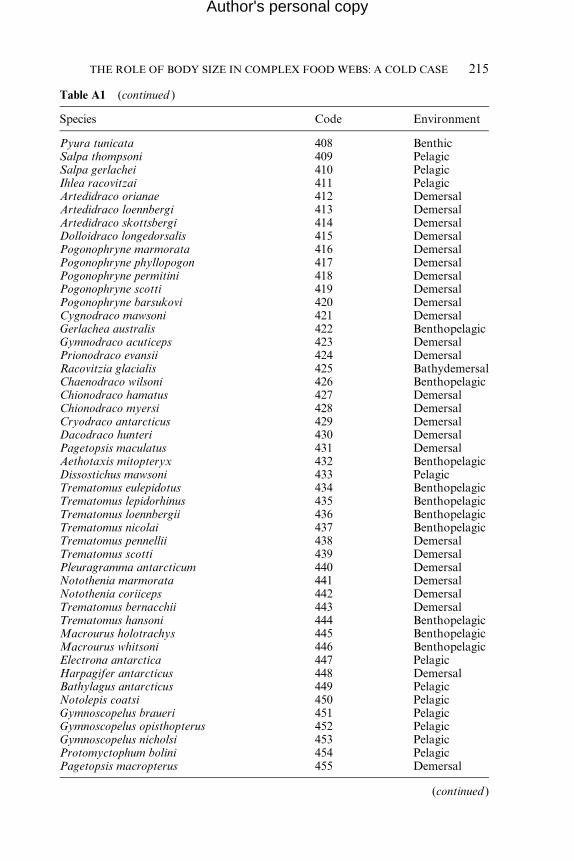
Table A1 (continued )
Species Code Environment
Pyura tunicata 408 BenthicSalpa thompsoni 409 PelagicSalpa gerlachei 410 PelagicIhlea racovitzai 411 PelagicArtedidraco orianae 412 DemersalArtedidraco loennbergi 413 DemersalArtedidraco skottsbergi 414 DemersalDolloidraco longedorsalis 415 DemersalPogonophryne marmorata 416 DemersalPogonophryne phyllopogon 417 DemersalPogonophryne permitini 418 DemersalPogonophryne scotti 419 DemersalPogonophryne barsukovi 420 DemersalCygnodraco mawsoni 421 DemersalGerlachea australis 422 BenthopelagicGymnodraco acuticeps 423 DemersalPrionodraco evansii 424 DemersalRacovitzia glacialis 425 BathydemersalChaenodraco wilsoni 426 BenthopelagicChionodraco hamatus 427 DemersalChionodraco myersi 428 DemersalCryodraco antarcticus 429 DemersalDacodraco hunteri 430 DemersalPagetopsis maculatus 431 DemersalAethotaxis mitopteryx 432 BenthopelagicDissostichus mawsoni 433 PelagicTrematomus eulepidotus 434 BenthopelagicTrematomus lepidorhinus 435 BenthopelagicTrematomus loennbergii 436 BenthopelagicTrematomus nicolai 437 BenthopelagicTrematomus pennellii 438 DemersalTrematomus scotti 439 DemersalPleuragramma antarcticum 440 DemersalNotothenia marmorata 441 DemersalNotothenia coriiceps 442 DemersalTrematomus bernacchii 443 DemersalTrematomus hansoni 444 BenthopelagicMacrourus holotrachys 445 BenthopelagicMacrourus whitsoni 446 BenthopelagicElectrona antarctica 447 PelagicHarpagifer antarcticus 448 DemersalBathylagus antarcticus 449 PelagicNotolepis coatsi 450 PelagicGymnoscopelus braueri 451 PelagicGymnoscopelus opisthopterus 452 PelagicGymnoscopelus nicholsi 453 PelagicProtomyctophum bolini 454 PelagicPagetopsis macropterus 455 Demersal
(continued )
THE ROLE OF BODY SIZE IN COMPLEX FOOD WEBS: A COLD CASE 215
Author's personal copy
Table A1 (continued )
Species Code Environment
Muraenolepis marmoratus 456 BenthopelagicMuraenolepis microps 457 BenthopelagicPachycara brachycephalum 458 DemersalChampsocephalus gunnari 459 PelagicFulmarus glacialoides 460 Land-basedThalassoica antarctica 461 Land-basedHalobaena caerulea 462 Land-basedDaption capense 463 Land-basedPagodroma nivea 464 Land-basedAphrodroma brevirostris 465 Land-basedMacronectes halli 466 Land-basedMacronectes giganteus 467 Land-basedProcellaria aequinoctialis 468 Land-basedOceanites oceanicus 469 Land-basedSterna vittata 470 Land-basedSterna paradisaea 471 Land-basedPachyptila desolata 472 Land-basedAptenodytes forsteri 473 Land-basedPygoscelis adeliae 474 Land-basedLobodon carcinophaga 475 Land-basedHydrurga leptonyx 476 Land-basedArctocephalus gazella 477 Land-basedMirounga leonina 478 Land-basedOmmatophoca rossii 479 Land-basedLeptonychotes weddelli 480 Land-basedBalaenoptera musculus 481 BenthopelagicBalaenoptera physalus 482 BenthopelagicBalaenoptera acutorostrata 483 BenthopelagicPhyseter macrocephalus 484 BenthopelagicMegaptera novaeangliae 485 BenthopelagicOrcinus orca 486 BenthopelagicLagenorhynchus cruciger 487 BenthopelagicTursiops truncatus 488 Benthopelagic
216 UTE JACOB ET AL.
Author's personal copy
REFERENCES
Arntz, W.E., Brey, T., and Gallardo, V.A. (1994). Antarctic marine zoobenthos.Oceanogr. Mar. Biol. Annu. Rev. 32, 241–304.
Arntz, W.E., Gutt, J., and Klages, M. (1997). Antarctic marine biodiversity: Anoverview. In: Antarctic Communities. Species, Structure and Survival (Ed. byB. Battaglia, J. Valencia and D.W.H. Walton), pp. 3–39. Cambridge UniversityPress, Cambridge.
Balvanera, P., Pfisterer, A.B., Buchmann, N., He, J.S., Nakashizuka, T., Raffaelli, D.,and Schmid, B. (2006). Quantifying the evidence for biodiversity effects on ecosys-tem functioning and services. Ecol. Lett. 9, 1146–1156.
THE ROLE OF BODY SIZE IN COMPLEX FOOD WEBS: A COLD CASE 217
Author's personal copy
Barnes, D.K.A. (2005). Changing chain: Past, present and future of the Scotia Arc’sand Antarctica’s shallow benthic communities. Sci. Mar. 69, 65–89.
Bascompte, J., and Stouffer, Daniel B. (2009). The assembly and disassembly ofecological networks. Philos. Trans. R. Soc. B 364, 1781–1787.
Bascompte, J., Melian, C.J., and Sala, E. (2005). Interaction strength combinations andthe overfishing of a marine food web. Proc. Natl. Acad. Sci. USA 102, 5443–5447.
Berg, S., Christianou, M., Jonsson, T., and Ebenman, B. (2011). Using sensitivityanalysis to identify keystone species. Oikos 120, 510–519.
Berger, J., Stacey, P.B., Bellis, L., and Johnson, M.P. (2001). A mammalian predator-prey imbalance: Grizzly bear and wolf extinction affect avian neotropical migrants.Ecol. Appl. 11, 947–960.
Bergstrom, D.M., and Chown, S.L. (1999). Life at the front: History, ecology andchange on Southern Ocean islands. Trends Evol. Ecol. 14, 472–477.
Bolnick, D.I., Svanback, R., Fordyce, J.A., Yang, L.H., Davis, J.M., Hulsey, C.D.,and Forister, M.L. (2003). The ecology of individuals: Incidence and implicationsof individual specialization. Am. Nat. 161, 1–28.
Borer, E.T., Seabloom, E.W., Shurin, J.B., Anderson, K.E., Blanchette, C.A.,Broitman, B., Cooper, S.D., and Halpern, B.S. (2005). What determines thestrength of a trophic cascade? Ecology 86, 528–537.
Borrvall, C., and Ebenman, B. (2006). Early onset of secondary extinctions in ecolog-ical communities following the loss of top predators. Ecol. Lett. 9, 435–442.
Bredesen, E.L. (2003). Krill and the Antarctic: Finding the balance. Master thesis.University of British Columbia.
Brenner, M., Buck, B.H., Cordes, S., Dietrich, L., Jacob, U., Mintenbeck, K.,Schroder, A., Brey, T., Knust, R., and Arntz, W.E. (2001). The role of icebergscours in niche separation within the Antarctic fish genus Trematomus. Polar Biol.24, 502–507.
Brey, T., Klages, M., Dahm, C., Gorny, M., Gutt, J., Hain, S., Stiller, M., Arntz, W.E., Wagele, J.A., and Zimmermann, A. (1994). Antarctic benthic diversity. Nature368, 297.
Briand, F. (1985). Structural singularities of freshwater food-webs. Verh. Int. VerTheor. Angew. Limnol. 22, 3356–3364.
Brose, U., Cushing, L., Banasek-Richter, C., Berlow, E., Bersier, L.F., Blanchard, J.,Brey, T.J.L., Carpenter, S.R., Cattin-Blandenier, M.F., Cohen, J.E., Dell, T.,Edwards, F., et al. (2005a). Empirical consumer-resource body size ratios. Ecology86, 2545.
Brose, U., Berlow, E.L., and Martinez, N.D. (2005b). Scaling up keystone effectsfrom simple to complex ecological networks. Ecol. Lett. 8, 1317–1325.
Brose, U., Jonsson, T., Berlow, E.L., Warren, P., Banasek-Richter, C., Bersier, L.-F.,Blanchard, J.L., Brey, T., Carpenter, S.R., Cattin Blandenier, M.-F., Cushing, L.,Dawah, H.A., et al. (2006a). Consumer-resource body-size relationships in naturalfood webs. Ecology 87, 2411–2417.
Brose, U., Williams, R.J., and Martinez, N.D. (2006b). Allometric scaling enhancesstability in complex food webs. Ecol. Lett. 9, 1228–1236.
Brose, U., Ehnes, R.B., Rall, B.C., Vucic-Pestic, O., Berlow, E.L., and Scheu, S.(2008). Foraging theory predicts predator-prey energy fluxes. J. Anim. Ecol. 77,1072–1078.
Brown, J.H., Gillooly, J.F., Allen, A.P., Savage, V.M., and West, G.B. (2004).Toward a metabolic theory of ecology. Ecology 85, 1771–1789.

218 UTE JACOB ET AL.
Author's personal copy
Brown, L., Edwards, F., Milner, A., Woodward, G., and Ledger, M. (2011). Foodweb complexity and allometric-scaling relationships in stream mesocosms: Impli-cations for experimentation. J. Anim. Ecol. 80, 884–895.
Cardillo, M. (2003). Biological determinants of extinction risk: Why are smallerspecies less vulnerable? Anim. Conserv. 6, 63–69.
Cardinale, B.J., Srivastava, D.S., Duffy, J.E., Wright, J.P., Downing, A.L.,Sankaran, M., and Jouseau, C. (2006). Effects of biodiversity on the functioningof trophic groups and ecosystems. Nature 443, 989–992.
Castle, M.D., Blanchard, J.L., and Jennings, S. (2011). Predicted effects of beha-vioural movement and passive transport on individual growth and community sizestructure in marine ecosystems. Adv. Ecol. Res. 45, 41–66.
Chown, S.L., and Gaston, K.J. (2002). Island-hopping invaders hitch a ride withtourists in South Georgia. Nature 408, 637.
Cianciaruso, M.V., Batalha, M.A., Gaston, K.J., and Petchey, O.L. (2009). Includingintraspecific variability in functional diversity. Ecology 90, 81–89.
Clarke, A. (1985). Food webs and interactions: An overview of the antarctic ecosys-tem. In:Key Environments: Antarctica (Ed. by W.N. Bonner and D.W.H.Walton),pp. 329–349. Pegramon Press, Oxford.
Clarke, A., and Johnston, N. (2003). Antarctic marine benthic diversity. Oceanogr.Mar. Biol. Annu. Rev. 41, 47–114.
Cohen, J.E., Pimm, S.L., Yodzis, P., and Saldana, J. (1993). Body sizes of animalpredators and animal prey in food webs. J. Anim. Ecol. 62, 67–78.
Cohen, J.E., Jonsson, T., and Carpenter, S.R. (2003). Ecological community descrip-tion using the food web, species abundance, and body size. Proc. Natl. Acad. Sci.USA 100, 1781–1786.
Cummins, K.W., and Klug, M.J. (1979). Feeding ecology of stream invertebrates.Annu. Rev. Ecol. 10, 147–172.
Dahm, C. (1996). Ecology and population dynamics of Antarctic Ophiuroids(Echinodermata). Rep. Polar Res. 194, 1–289.
Dayton,P.K. (1990).Polarbenthos. In:PolarOceanography,PartB:Chemistry,Ecologyand Geology (Ed. by W.O. Smith, Jr.), pp. 631–685. Academic Press, London.
Dıaz, S., and Cabido, M. (2001). Vive la difference: Plant functional diversity mattersto ecosystem processes. Trends Ecol. Evol. 16, 646–655.
Digel, C., Riede, J.O., and Brose, U. (2011). Body sizes, cumulative and allometricdegree distributions across natural food webs. Oikos 120, 503–509.
Dirozo, R., and Raven, P.H. (2003). Global state of biodiversity and species loss.Annu. Rev. Environ. Resour. 28, 137–167.
Dunne, J.A., Williams, R.J., and Martinez, N.D. (2002). Network structure andbiodiversity loss in food webs: Robustness increases with connectance. Ecol. Lett.5, 558–567.
Dunne, J.A., Williams, R.J., and Martinez, N.D. (2004). Network structure androbustness of marine food webs. Mar. Ecol. Prog. Ser. 273, 291–302.
Ebenman, B., and Jonsson, T. (2005). Using community viability analysis to identifyfragile systems and keystone species. Trends Ecol. Evol. 20, 568–575.
Eklof, A., and Ebenman, B. (2006). Species loss and secondary extinctions in simpleand complex model communities. J. Anim. Ecol. 75, 239–246.
Elton, C. (1927).Animal Ecology. Reprint, 2001, University of Chicago Press, 1st edn.Sidgewick & Jackson, London.
Estes, J.A., and Palmisano, J.F. (1974). Sea Otters: Their role in structuring nearshorecommunities. Science 185, 1058–1060.
THE ROLE OF BODY SIZE IN COMPLEX FOOD WEBS: A COLD CASE 219
Author's personal copy
Fry, B. (1988). Food web structure on Georges Bank from stable C, N, and S isotopiccompositions. Limnol. Oceanogr. 33, 1182–1190.
Gilljam, D., Thierry, A., Edwards, F.K., Figueroa, D., Ibbotson, A., Jones, J.I.,Lauridsen, R.B., Petchey, O.L., Woodward, G., and Ebenman, B. (2011). Seeingdouble: Size-based versus taxonomic views of food web structure. Adv. Ecol. Res.45, 67–133.
Glasser, J.W. (1983). Variation in niche breadth with trophic position: On thedisparity between expected and observed species packing. Am. Nat. 122, 542–548.
Gutt, J., Sirenko, B.I., Smirnov, I.S., and Arntz, W.E. (2004). How many macro-benthic species might inhabit the Antarctic Shelf? Antarct. Sci. 16, 11–16.
Hall, S.J., and Raffaelli, D. (1991). Food-web patterns: Lessons from a species—Richweb. J. Anim. Ecol. 60, 823–842.
Hall, S.J., and Raffaelli, D. (1993). Food webs: Theory and reality.Adv. Ecol. Res. 24,187–239.
Hempel, G. (1985). Antarctic marine food webs. In: Antarctic Nutrient Cycles andFood Webs (Ed. by W.R. Siegfried, P.R. Condy and R.M. Laws), pp. 266–270.Springer-Verlag, Berlin, Heidelberg.
Henri, D.C., and Van Veen, F.J.F. (2011). Body size, life history and the structure ofhost-parasitoid networks. Adv. Ecol. Res. 45, 135-180.
Ichii, T., and Kato, H. (1991). Food and daily food consumption of southern minkewhales in the Antarctic. Polar Biol. 11, 479–487.
Ings, T.C., Montoya, J.M., Bascompte, J., Bluthgen, N., Brown, L., Dormann, C.F.,Edwards, F., Figueroa,D., Jacob,U., Jones, J.I., Laurisden,R.B., Ledger,M.E., et al.(2009). Ecological networks—Foodwebs and beyond. J. Anim. Ecol. 78, 253–269.
Ives, A.R., and Cardinale, B.J. (2004). Food web interactions govern the resistance ofcommunities after non-random extinctions. Nature 429, 174–177.
Jacob, U. (2005). Trophic Dynamics of Antarctic Shelf Ecosystems—Food Webs andEnergy Flow Budgets. PhD thesis, University of Bremen, Bremen.
Jacob, U., Terpstra, S., and Brey, T. (2003). High Antarctic regular sea urchins—Therole of depth and feeding in niche separation. Polar Biol. 26, 99–104.
Jacob, U., Mintenbeck, K., Brey, T., Knust, R., and Beyer, K. (2005). Stable isotopefood web studies: A case for standardized sample treatment. Mar. Ecol. Prog. Ser.287, 251–253.
Jarre-Teichmann, A., Brey, T., Bathmann, U.V., Dahm, C., Dieckmann, G.S.,Gorny, M., Klages, M., Pages, F., Plotz, J., Schnack-Schiel, S.B., Stiller, M., andArntz, W.E. (1997). Trophic flows in the benthic shelf community of the easternWeddell Sea, Antarctica. In:Antarctic Communities: Species, Structure and Survival(Ed. by B. Battaglia, J. Valencia and D.W.H. Walton), pp. 118–134. CambridgeUniversity Press, Cambridge.
Jennings, S., Warr, K.J., and Mackinson, S. (2002). Use of size-based production andstable isotope analyses to predict trophic transfer efficiencies and predator-preybody mass ratios in food webs. Mar. Ecol. Prog. Ser. 240, 11–20.
Jonsson, T., Cohen, J.E., and Carpenter, S.R. (2005). Food webs, body size andspecies abundance in ecological community description. Adv. Ecol. Res. 36, 1–83.
Layer, K., Riede, J.O., Hildrew, A.G., andWoodward, G. (2010). Food web structureand stability in 20 streams across a wide pH gradient. Adv. Ecol. Res. 42, 265–301.
Layer, K., Hildrew, A.G., Jenkins, G.B., Riede, J., Rossiter, S.J., Townsend, C.R.,and Woodward, G. (2011). Long-term dynamics of a well-characterised food web:Four decades of acidification and recovery in the Broadstone Streammodel system.Adv. Ecol. Res. 44, 69–117.
220 UTE JACOB ET AL.
Author's personal copy
Layman, C.A., Winemiller, K.O., Arrington, D.A., and Jepsen, D.B. (2005).Body size and trophic position in a diverse tropical food web. Ecology 86,2530–2535.
Ledger, M.E., Edwards, F., Brown, L.E., Woodward, G., and Milner, A.M. (2011).Impact of simulated drought on ecosystem biomass production: an experimentaltest in stream mesocosms. Global Change Biol. 17, 2288–2297.
Link, J.S. (2002). Does food web theory work for marine ecosystems? Mar. Ecol.Prog. Ser. 230, 1–9.
Loreau, M., Naeem, S., Inchausti, P., Bengtsson, J., Grime, J.P., and Hector, A.(2001). Biodiversity and ecosystem functioning: Current knowledge and futurechallenges. Science 294, 804–808.
Loreau, M., Naeem, S., and Inchausti, P. (2002). Biodiversity and EcosystemFunctioning. Synthesis and Perspectives. Oxford University Press, Oxford.
MacArthur, Robert (1955). Fluctuations of animal populations and a measure ofcommunity stability. Ecology 36, 533–536.
Martinez, N.D. (1991). Artifacts or attributes? Effects of resolution on the LittleRock Lake food web. Ecol. Monogr. 61, 367–392.
May, R.M. (1972). Will a large complex system be stable? Nature 238, 413–414.McCann, K.S. (2000). The diversity-stability debate. Nature 405, 228–233.McCann, K.S., Hastings, A., and Huxel, G.R. (1998). Weak trophic interactions and
the balance of nature. Nature 395, 794–798.McKinney, M.L. (1997). Extinction vulnerability and selectivity: Combining
ecological and paleontological views. Annu. Rev. Ecol. Syst. 28, 495–516.McLaughlin, O., Jonsson, T., and Emmerson, M.C. (2010). Temporal variability
in predator-prey relationships of a forest floor food web. Adv. Ecol. Res. 42,171–264.
Melian, C.J., Vilas, C., Baldo, F., Gonzalez-Ortegon, E., Drake, P., andWilliams, R.J.(2011). Eco-evolutionary dynamics of individual-based foodwebs.Adv. Ecol. Res. 45,225–268.
Memmott, J. (2009). Food webs: A ladder for picking strawberries or a practical toolfor practical problems? Philos. Trans. R. Soc. Lond. B 364, 1693–1699.
Memmott, J., Martinez, N.D., and Cohen, J.E. (2000). Predators, parasitoids andpathogens: Species richness, trophic generality and body sizes in a natural foodweb. J. Anim. Ecol. 69, 1–15.
Montoya, J.M., Woodward, G., Emmerson, M.C., and Sole, R. (2009). Pressperturbations and indirect effects in real food webs. Ecology 90, 2426–2433.
Mulder, C., Boit, A., Bonkowski, M., De Ruiter, P.C., Mancinelli, G., Van derHeijden, M.G.A., van Wijnen, H.J., Vonk, J.A., and Rutgers, M. (2011). A below-ground perspective on Dutch Agroecosystems: How soil organisms interact tosupport ecosystem services. Adv. Ecol. Res. 44, 277–358.
Myers, R.A., Baum, J.K., Shepherd, T.D., Powers, S.P., and Peterson, C.H. (2007).Cascading effects of the loss of apex predatory sharks from a coastal ocean. Science315, 1846–1850.
Naeem, S., Thompson, L.J., Lawler, S.P., Lawton, J.H., and Woodfin, R.M. (1994).Declining biodiversity can alter the performance of ecosystems. Nature 368,734–737.
Novak,M.,Wootton, J.T., Doak, D.F., Emmerson,M., Estes, J.A., and Tinker,M.T.(2011). Predicting community response to perturbations in the face of imperfectknowledge and network complexity. Ecology 92, 836–846.

THE ROLE OF BODY SIZE IN COMPLEX FOOD WEBS: A COLD CASE 221
Author's personal copy
Nyssen, F., Brey, T., Lepoint, G., Bouquegneau, J.M., De Broyer, C., and Dauby, P.(2002). A stable isotope approach to the easternWeddell Sea trophic web: Focus onbenthic amphipods. Polar Biol. 25, 280–287.
O’Gorman, E.J., Jacob, U., Jonsson, T., and Emmerson, M.C. (2010). Interactionstrength, food web topology and the relative importance of species in food webs.J. Anim. Ecol. 79, 682–692.
O’Gorman, E.J., and Emmerson, M.C. (2010). Manipulating interaction strengths andthe consequences for trivariate patterns in a marine food web. Adv. Ecol. Res. 42,301–419.
Orejas, C. (2001). Role of benthic cnidarians in energy transfer processes in theSouthern Ocean marine ecosystem (Antarctica). Rep. Polar Res. 395, 186 pp.
Otto, S., Rall, B.C., and Brose, U. (2007). Allometric degree distributions facilitatefood web stability. Nature 450, 1226–1229.
Pauly, D., Christensen, V., Dalsgaard, J., Froese, R., and Torres, F., Jr. (1998).Fishing down marine food webs. Science 279, 860–863.
Petchey, O.L., and Gaston, K.J. (2006). Functional diversity: Back to basics andlooking forward. Ecol. Lett. 9, 741–758.
Petchey, O.L., Downing, A.L., Mittelbach, G.G., Persson, L., Steiner, C.F., andWarren, P.H. (2004a). Species loss and the structure and functioning ofmultitrophic aquatic ecosystems. Oikos 104, 467–478.
Petchey, O.L., Hector, A., and Gaston, K.J. (2004b). How do different measures offunctional diversity perform? Ecology 85, 847–857.
Petchey, O.L., Eklof, A., Borrvall, C., and Ebenman, B. (2008). Trophically uniquespecies are vulnerable to cascading extinction. Am. Nat. 171, 568–579.
Peters, R.H. (1983). The Ecological Implications of Body Size. Cambridge UniversityPress, New York, NY, USA.
Pimm, S.L. (1982). Food Webs. Chapman and Hall, London, UK.Pimm, S.L., Lawton, J.H., and Cohen, J.E. (1991). Food web patterns and theirconsequences. Nature 350, 660–674.
Post, D.M. (2002). Using stable isotopes to estimate trophic position: Models,methods and assumptions. Ecology 83, 703–718.
Purvis, A., Agapow, P.-M., Gittleman, J.L., and Mace, G.M. (2000). Nonrandomextinction and the loss of evolutionary history. Science 288, 328–330.
Raffaelli, D. (2007). Food webs, body size and the curse of the Latin binomial.In: From Energetics to Ecosystems: The Dynamics and Structure of EcologicalSystems (Ed. by N. Rooney, K.S. McCann and D.L.G. Noakes), pp. 53–64.Springer, Dordrecht.
Reisewitz, S.E., Estes, J.A., and Simenstad, C.A. (2006). Indirect food web interac-tions: Sea otters and kelp forest fishes in the Aleutian archipelago. Oecologia 146,623–631.
Reiss, J., Bridle, J., Montoya, J.M., and Woodward, G. (2009). Emerging horizons inbiodiversity and ecosystem functioning research. Trends Ecol. Evol. 24, 505–514.
Riede, J.O., Rall, B.C., Banasek-Richter, C., Navarrete, S.A., Wieters, E.A.,Emmerson, M.C., Jacob, U., and Brose, U. (2010). Scaling of food-web propertieswith diversity and complexity across ecosystems. Adv. Ecol. Res. 42, 139–170.
Riede, J.O., Brose, U., Ebenman, B., Jacob, U., Thompson, R., Townsend, C., andJonsson, T. (2011). Stepping in Elton’s footprints: A general scaling model for bodymasses and trophic levels across ecosystems. Ecol. Lett. 14, 169–178.
Romanuk, T.N., Hayward, A., and Hutchings, J.A. (2011). Trophic level scalespositively with body size in fishes. Glob. Ecol. Biogeogr. 20, 231–240.
Schoener, T.W. (1989). Food webs from the small to the large. Ecology 70, 1559–1589.

222 UTE JACOB ET AL.
Author's personal copy
Schulze, E.D., and Mooney, H.A. (1993). Biodiversity and Ecosystem Function.Springer Verlag, New York, NY.
Staniczenko, P.P.A., Lewis, O.T., Jones, N.S., and Reed-Tsochas, F. (2010).Structural dynamics and robustness of food webs. Ecol. Lett. 13, 891–899.
Sterner, R.W., and Elser, J.J. (2002). Ecological Stoichiometry: The Biology of Ele-ments from Molecules to the Biosphere. Princeton University Press, Princeton.
Teixido, N., Garrabou, J., and Arntz, W.E. (2002). Spatial pattern quantification ofAntarctic benthic communities using landscape indices. Mar. Ecol. Prog. Ser. 242,1–14.
Terborgh, J., Feeley, K., Silman, M., Nunez, P., and Balukjian, B. (2006). Vegetationdynamics of predator-free land-bridge island. J. Ecol. 94, 253–263.
Thomas, C.D., Cameron, A., Green, R.E., Bakkenes, M., Beaumont, L.J.,Collingham, Y.C., Erasmus, B.F.N., DeSiqueira, M.F., Grainger, A.,Hannah, L., Hughes, L., Huntley, B., et al. (2004). Extinction risk from climatechange. Nature 427, 145–148.
Tilman, D. (1991). Relative growth-rates and plant allocation patterns. Am. Nat. 138,1269–1275.
Tilman, D., and Downing, J.A. (1994). Biodiversity and stability in grasslands.Nature 367, 363–365.
Tranter, D.J. (1982). Interlinking of physical and biological processes in the AntarcticOcean. Oceanogr. Mar. Biol. Annu. Rev. 20, 11–35.
Trites, A.W., Bredesen, E.L., and Coombs, A.P. (2004). Whales, whaling and ecosys-tem change in the Antarctic and Eastern Bering Sea: Insights from ecosystemmodels. In: Investigating the Roles of Cetaceans in Marine Ecosystems (Ed. byFrederic Briand), pp. 85–92. CIESM Workshop Monographs, Monaco.
Warren, P.H. (1989). Spatial and temporal variation in the structure of a freshwaterfood web. Oikos 55, 299–311.
Williams, R.J. (2010). Network3D Software. Microsoft Research, Cambridge, UK.Williams, R.J., and Martinez, N.D. (2004). Limits to trophic levels and omnivory in
complex food webs: Theory and data. Am. Nat. 163, 458–468.Williams, R.J., and Martinez, N.D. (2008). Success and its limits among structural
models of complex food webs. J. Anim. Ecol. 77, 512–519.Woodward, G., and Hildrew, A.G. (2002). Body-size determinants of niche overlap
and intraguild predation within a complex food web. J. Anim. Ecol. 71, 1063–1074.Woodward, G., Ebenman, B., Emmerson, M., Montoya, J.M., Olesen, J.M.,
Valido, A., and Warren, P.H. (2005). Body size in ecological networks. TrendsEcol. Evol. 20, 402–409.
Woodward, G., Papantoniou, G., Edwards, F.E., and Lauridsen, R. (2008).Trophic trickles and cascades in a complex food web: Impacts of a keystonepredator on stream community structure and ecosystem processes. Oikos 117,683–692.
Woodward, G., Benstead, J.P., Beveridge, O.S., Blanchard, J., Brey, T., Brown, L.E.,Cross, W.F., Friberg, N., Ings, T.C., Jacob, U., Jennings, S., Ledger, M.E., et al.(2010a). Ecological networks in a changing climate. Adv. Ecol. Res. 42, 71–138.
Woodward, G., Friberg, N., and Hildrew, A.G. (2010b). Science and non-science inthe biomonitoring and conservation of fresh waters. In: Freshwater Ecosystems andAquaculture Research (Ed. by F. deCarlo and A. Bassano). 978-1-60741-707-1.Nova Science Publishing, New York, USA.
Yodzis, P. (1998). Local trophodynamics and the interaction of marine mammals andfisheries in the Benguela ecosystem. J. Anim. Ecol. 67, 635–658.
THE ROLE OF BODY SIZE IN COMPLEX FOOD WEBS: A COLD CASE 223
Author's personal copy
Yoon, I., Williams, R.J., Levine, E., Yoon, S., Dunne, J.A., and Martinez, N.D.(2004). Webs on the Web (WoW): 3D visualization of ecological networks on theWWW for collaborative research and education. In: Proceedings of the IS&T/SPIESymposium on Electronic Imaging, Visualization and Data Analysis 5295,pp. 124–132.
Yvon-Durocher, G., Reiss, J., Blanchard, J., Ebenman, B., Perkins, D.M.,Reuman, D.C., Thierry, A., Woodward, G., and Petchey, O.L. (2011). Acrossecosystem comparison of size structure: Methods, approaches and prospects.Oikos 120, 550–563.