the role and relevance of domain knowledge, perceptions of planning importance, and risk tolerance...
TRANSCRIPT

Edith Cowan UniversityResearch Online
ECU Publications Pre. 2011
2010
The role and relevance of domain knowledge,perceptions of planning importance, and risktolerance in predicting savings intentionsPeter CroyEdith Cowan University
Paul GerransEdith Cowan University
Craig SpeelmanEdith Cowan University
This article was originally published as: Croy, P. G., Gerrans, P. A., & Speelman, C. P. (2010). The role and relevance of domain knowledge, perceptionsof planning importance, and risk tolerance in predicting savings intentions . Journal of Economic Psychology, 31(6), 860-871. NOTICE: this is theauthor’s version of a work that was accepted for publication in Journal of Economic Psychology. Changes resulting from the publishing process, such aspeer review, editing, corrections, structural formatting, and other quality control mechanisms may not be reflected in this document. Changes may havebeen made to this work since it was submitted for publication. A definitive version was subsequently published in Journal of Economic Psychology, 31,6 (2010) DOI#” .This Journal Article is posted at Research Online.http://ro.ecu.edu.au/ecuworks/6308
1
The Role and Relevance of Domain Knowledge, Perceptions of Planning
Importance, and Risk Tolerance in Predicting Savings Intentions
Gerry Croya, Paul Gerransa, and Craig Speelmanb
aSchool of Accounting, Finance and Economics, Edith Cowan University
bSchool of Psychology and Social Science, Edith Cowan University
Corresponding author. Name: Gerry Croy. Address: School of Accounting, Finance
and Economics, Edith Cowan University, 270 Joondalup Drive, Joondalup 6027,
Western Australia. Tel.: +61 893806551; E-mail address: [email protected]
2
The Role and Relevance of Domain Knowledge, Perceptions of Planning
Importance, and Risk Tolerance in Predicting Savings Intentions
Abstract
The need for individuals to increase retirement savings has been widely promoted, yet
our understanding of the motivations of individuals to save at a higher rate remains
sparse. This paper reports the findings of a survey of 2300 retirement savings fund
members and their motivations to contribute more to savings and to actively manage
their investment strategy. Utilising the theory of planned behaviour, the study reveals
respondent’s self-reported attitudes, subjective norms and perceptions of behavioural
control account for a high proportion of the variance in behavioural intention.
Contrary to expectations, the study finds that respondent’s risk tolerance adds little to
the prediction of behavioural intention. By contrast, perceptions of planning
importance and self-assessed planning preparedness (domain knowledge) are found to
exert powerful indirect influences on behavioural intentions via the perceived
behavioural control construct. This novel finding confirms the relevance of planning
constructs and financial literacy to an understanding of retirement savings behaviour,
and establishes a need to improve levels of financial literacy in society.
Keywords: Savings, Planning, Knowledge, Risk Tolerance, Intention
JEL Classification: D91; PsycINFO Classification: 3920
3
1. Introduction
One of the most pressing economic issues to face global society over coming
decades is how retirement incomes will be funded for an increasing proportion of
retirees. In this research, we use data from Australia to investigate important
psychological antecedents of key retirement savings behaviours.
It is estimated that by 2050 there will be 23.5% of the Australian population
aged 65 and over, compared to 10.7% currently (Australian Treasury, 2002, 2007).
Moreover, the proportion of people aged 65 and over relative to people of traditional
labour force age, 15 to 64 years, is projected to increase from the 2002 level of 19%
to almost 41% by 2042 (Australian Treasury, 2002). It has also been identified that
more than three million Australians are below targeted retirement savings adequacy
levels (Access, 2008; see also, Rothman, 2007; Russell, Brooks, Nair, & Fredline,
2006). These statistics are not peculiar to Australia as a similar demographic shift is
forecast for many other developed countries.
An obvious approach to improve the quality of life for individuals in
retirement, and to alleviate the forecast Australian government budget burden, is to
induce people to save through superannuation.1
1 Retirement income provision in Australia is predicated on three pillars: (1) the age pension; (2)
mandatory contributions under the Superannuation Guarantee (administration) Act 1992, which
currently requires employers contribute a minimum of 9% of employee wages to a complying
superannuation fund; and (3) voluntary savings, primarily through, but not restricted to the tax-
preferred superannuation system.
The focus of the present research is
the motivations of individuals to contribute to superannuation beyond the mandated
employer-level contribution, together with individuals’ motivations to manage the
manner in which accumulated savings are invested. Investment strategy management

4
is reflected in choices made by the individual when choosing risk/return-dependent
investment portfolios, or when modifying asset allocations within the chosen
portfolio. Investment strategy change by an individual is indicative of fine tuning of
one's investment account, and thus, it represents a likely improvement in one's
portfolio performance.
Reporting on a 2006 survey of 2300 superannuation fund members, the aim of
the present paper was to identify the relative importance of key determinants of
behavioural intentions and to relate these to intervention possibilities. The theory of
planned behaviour (TPB, Ajzen, 1988) was used for these purposes as it has been
widely applied in past research and shown to be robust across diverse behavioural
contexts. The paper draws on several studies (discussed in Section 2.2) which find
roles in retirement savings decision making for retirement planning constructs, such
as perceived planning importance and planning preparedness, and risk tolerance, as
well as demographic variables such as gender, age, and income. Better understanding
of the influence of planning constructs, risk tolerance and demographic variables in
retirement savings decision making is clearly important to practitioners and to social
welfare planning policy. Moreover, important to a broader understanding of the
motivations for prescribed retirement savings behaviours is the need to place
behavioural antecedents studied by the field in a theoretical context. Thus, use of the
TPB framework was expected to provide a basis for understanding the relative
predictive importance among TPB constructs, and the planning and risk tolerance
constructs, which are of particular interest to this study.
2. Literature review 2.1. The Theory of Planned Behaviour
5
The theory of planned behaviour (TPB) is predicated on three variables found
to adequately predict the intention to perform a given behaviour (Ajzen & Fishbein,
2004). These variables are one’s attitude towards the behaviour, one’s perception of
social pressure as a consequence of the views and actions of significant others
(subjective or social norms), and one’s perceptions of control over performance of the
behaviour (perceived behavioural control). Measurement of these constructs is
performed directly, according to multi-item scales. Intention and perceived
behavioural control together predict actual performance of the behaviour in question;
however, the focus of this paper is on the antecedents of intention. The TPB has
explained, on average across various contexts, 39% of the variance in intention and
27% of the variance in behaviour (Ajzen & Fishbein, 2004).
According to Ajzen and Fishbein (2000), variables external to his theory either
add little in terms explaining additional variance, or the so-called external variables
tend to be mediated in their influence on intention by standard TPB predictors.
Therefore, an important element of our present design was to control for the influence
of TPB variables in the attempt to establish causal roles for the external variables of
interest. Perceived planning importance, planning preparedness, and risk tolerance (as
well as demographic variables) were not expected to directly influence intentions.
However, whether their influence is more distal to the TPB’s predictors was a
question of fundamental interest to contextualizing temporal causality of intention for
intervention purposes.
2.2. Variables external to the TPB
2.2.1. Planning constructs
In the US population, Lusardi and Mitchell (2006, 2009b) provide evidence
that financial illiteracy in the context of retirement planning is widespread,

6
particularly among vulnerable demographic groups such as the least educated,
women, and minorities. Similarly, Lusardi (2008) finds that close to half of older
workers do not know which type of pensions they have and the large majority of
workers know little about the rules governing social security benefits. Lusardi (2008)
argues ignorance about basic financial concepts is linked to lack of retirement
planning and lack of wealth. The importance of retirement planning is further
emphasised by Lusardi and Mitchell (2007a) who find planners arrive close to
retirement with much higher wealth levels and display higher financial literacy than
non-planners. Focusing on gender issues, Lusardi and Mitchell (2008) also find that
older women display much lower levels of financial literacy than the older population
as a whole. Moreover, women of lower financial literacy are less likely to plan for
retirement and to carry through on their plans.
Other researchers find similar results for the nexus between knowledge
(financial literacy) and planning. For example, Clark, d'Ambrosio, McDermed and
Sawant (2003) find that after participation in a financial education seminar a
significant proportion of the respondents indicated that they had revised their goals
and planned to modify their saving and investments. Moreover, Stawski, Hershey and
Jacobs-Lawson (2007) find that retirement goal clarity is a significant predictor of
planning practices, and planning, in turn, predicts savings tendencies. Further,
Hershey and Mowen (2000) find both personality constructs and financial knowledge
to be significant predictors of pre-retirement planning.
Constructs variously described as future time perspective, future orientation,
propensity to plan, and planning mindset have been studied in relation to retirement
saving. Jacobs-Lawson, Hershey and Neukam (2004) assess the influence of future
time perspective as a surface level personal trait. Results revealed that women spent
7
less time thinking about retirement than men, suggesting that separate retirement
intervention programs are warranted that meet the unique needs of working men and
women. Moreover, Deaves, Theodore Veit, Bhandari and Cheney (2007) find that
pension contributions are positively correlated with the propensity to plan. And,
Bhandari and Deaves (2008) find that younger, more-educated, higher-earning
advice-receiving males with a planner mindset hold more equity, and an
understanding of asset allocation accentuates the impact of the key factors age,
income and a planner mindset. Finally, Howlett, Kees and Kemp (2008) find that self-
regulatory state, future orientation, and financial knowledge can influence consumer
evaluations and intentions related to retirement fund investments. Findings suggest
that consumers who express higher levels of future orientation are more likely to
participate in a retirement plan, an effect moderated by self-regulatory state.
In Australia, Worthington (2008) attempted to predict knowledge and
perceptions of superannuation on the basis of demographic, socioeconomic and
financial characteristics. Knowledge of superannuation was defined in terms of
understanding superannuation fees, charges and statements, recognising the voluntary
and compulsory nature of additional employee and employer contributions, and being
aware of the lower taxation of superannuation compared to other investments.
Overall, about 60% of respondents could correctly answer only 50% or less of the
questions posed. Similar results are reported by Mercer (2008) from an Australian
survey that found 72% of respondents expected their superannuation to have grown
over the year to June 2008, 76% didn’t see a link between superannuation and the
investment markets, and nearly one in three (29%) were unsure of their investment
strategy. Other Australian studies have focused on issues of confidence, finding that
that employees report feeling ill-informed and ill-equipped for the decisions presented
8
to them relating to their superannuation decisions (Clare, 2002; Clark-Murphy &
Gerrans, 2001).
2.2.2. Risk tolerance.
In a study which linked propensity to plan with risk tolerance, Deaves et al.
(2007) find that those with a higher propensity to plan are more risk tolerant. Deaves
et al. also find risk taking to be positively associated with income, and negatively
associated with age. Controlling for age, income, and education, Watson and
McNaughton (2007) examine the impact of gender on superannuation fund risk
preferences. Findings suggest that women choose more conservative investment
strategies than men. Similarly, Speelman, Clark-Murphy and Gerrans (2007) find that,
with some exceptions, females are more risk-averse than males. However, questioning
the stereotype that women are more risk averse than men in their investment
decisions, Badunenko, Barasinska and Schäfer (2009) used data from five European
countries to examine gender differences by explicitly controlling for investors’ self-
perceived willingness to take financial risk. Results confirm the gender stereotype
only partially. Women were found less likely to hold risky financial assets. However,
conditional on ownership, females allocate an equal or even a higher share of their
wealth to these assets than men. The authors suggest that especially in case of women,
the declared attitude toward financial risks may be misleading as it does not
necessarily reflect the actual willingness to bear risks.
3. Research objectives
Several studies have demonstrated associations between the variables of
interest to this study, but a lesser number of studies has established causal paths.
However, Lusardi and Mitchell (2009a) argue that financial literacy (domain
knowledge) is antecedent to planning, rather than the other way around. Accordingly,
9
attention is increasingly being directed at the nature of financial literacy education
interventions and their effectiveness (Lusardi, 2008; Lusardi, Keller, & Keller, 2009;
Lusardi & Mitchell, 2007b, 2009a, 2009b).
The aim of the present study was to investigate the causal relations among
perceived planning importance, planning preparedness (operationalised here as self-
rated domain knowledge), perceived risk tolerance, and behavioural intention, which
are variables of much interest to researchers in the field of retirement savings and
preparedness for retirement. In investigating temporal causality among the variables
we control for the influence of TPB variables, as these have been shown to be
important predictors of intention across diverse behavioural contexts. Thus, a further
objective of the study was to provide perspective to future research efforts by
describing the relevance of key antecedents of retirement savings intentions in terms
of predictive importance. To our knowledge, this is a first attempt to describe
temporal causality and predictive strength among the variables of interest, and to
couch the study within a theoretical framework such as the TPB.
4. Method
4.1. Participants
Participants were randomly selected from four Australian superannuation fund
member-databases. Respondents required 30 minutes to complete and return
questionnaires. Of a total of 20,000 questionnaires distributed by mail 2,339 (12%)
were returned, raising the possibility of bias in the data (Moser & Kalton, 1972;
Oppenheim, 1966). It is not possible to compare the demographic characteristics of
survey respondents with those of non-respondents. However, the population of
interest was the Australia working population. Inspection of labour force survey
information revealed that average worker-age is 39 years, males comprise 54% of the
10
work force and average worker annual earnings are $43654 (Commonwealth of
Australia, 2006a). Table 1 displays summary demographic characteristics of the
questionnaire sample. Females were over represented in the sample relative to the
overall Australian population, though it is reflective of the overall fund membership
profile of the four funds. The middle-aged were similarly over represented and
average participant income was slightly lower than the population average. The
opportunity to perform gender and age-based analyses of the data alleviated some
concerns about over/under representation of demographic groups. Nevertheless, the
generalisability of some aspects of results remains subject to qualification.
<Insert Table 1>
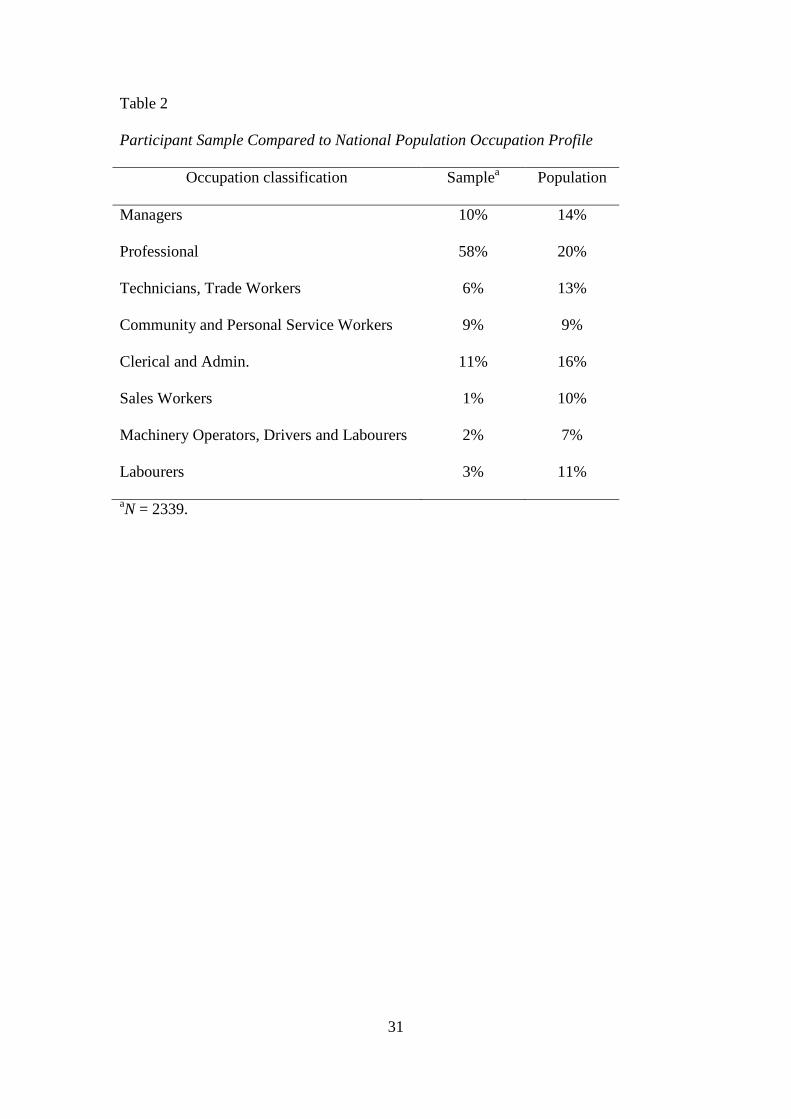
Table 2 presents the range and proportion of occupation in the participant
sample. When compared to the Australian population (Commonwealth of Australia,
2006b), the most notable differences in the sample were the over-representation of
professionals and under-representation of Technicians, Sales Workers, and Labourers.
To the extent that the data were not analysed for inter-group differences relating to
these demographics, the results are subject to qualification.
<Insert Table 2>
A low survey response rate might also be associated with differences in
psychological dimensions of respondents compared to non-respondents. Respondents
have, on average, larger superannuation balances than the general population, and this
may not be fully explained by the comparatively higher mean age of respondents.2
2 The average superannuation balance in the general population is approximately $70000
(Commonwealth of Australia, 2002), and average worker age is 40 years. If the population balance
were simply doubled, the resultant estimation of the average population household superannuation
11
Thus, argument could be made that respondents may be more involved in the
superannuation system than non-respondents. In turn, being more involved may
indicate differences in the mean levels of the predictor variables in the present model
between respondents and non-respondents. If this were so, the differences in mean
levels and relative predictive power of predictors may hold implications for
generalisability of results and for intervention design.
4.2. Measures for TPB variables
All TPB measures were based on Ajzen’s (2002a) method. Substantial bodies
of theory and research support the validity of TPB constructs (for reviews see
Armitage & Connor, 2001; Connor & Armitage, 1998). Responses were required for
the intention to perform two key retirement savings behaviours: “to contribute extra to
superannuation within the next 12 months” and “to change superannuation investment
strategy within the next 12 months”.
All TPB constructs were measured by 7-point unipolar item scales. Attitude
toward performing the two target behaviours was assessed by means of five
evaluative semantic differential scales (Osgood, Suci, & Tannenbaum, 1957). The
anchors of these scales were: harmful-beneficial, unpleasant-pleasant, bad-good,
worthless-valuable, unenjoyable-enjoyable and wrong-right. Coefficients alpha for
attitude toward contributing extra and managing investment strategy respectively
were 0.85 and 0.88. To measure subjective norm, respondents were asked to indicate
the extent to which they believe that most people who are important to them, or whose
opinion they value, think that: they should not-should perform the target behaviours;
would expect them to perform the behaviours (extremely unlikely-extremely likely);
balance ($140000) is somewhat less than that of the sample ($190000; average respondent age 45
years).

12
would disapprove-approve of them performing the behaviours; would-would not
perform the behaviours themselves; and intend to perform the behaviours themselves
(completely false-completely true). Coefficients alpha for subjective norm toward
contributing extra and managing investment strategy respectively were 0.80 and 0.78.
Three items assessed perceived control over the target behaviours. Respondents were
asked whether performance of the two behaviours would be impossible-possible,
whether, if the respondent wanted to, he or she could perform the behaviour
(definitely false-definitely true), and the respondent’s perception of the degree of
control possessed over performing the behaviour (no control-complete control).
Coefficients alpha for perceived behavioural control toward contributing extra and
managing investment strategy respectively were 0.78 and 0.76. Finally, three items
assessed intentions to perform each of the focal behaviours. Participants indicated to
what extent they intend to (extremely unlikely-extremely likely), will try to (definitely
false-definitely true) and plan to (strongly disagree-strongly agree) perform the target
behaviours. Coefficients alpha for the intention to contribute extra and manage
investment strategy respectively were 0.78 and 0.76.
4.3. Measures for variables external to the TPB
Three items were used to measure respondents’ perceptions of the importance
of planning. Respondents were asked to state their strong agreement or strong
disagreement on 7-point unipolar scales in response to each of the following items: “I
regard myself as a person preoccupied with ensuring that myself and my family can
retire on a good income”; “I think of myself as a person who is very concerned with
building adequate wealth for retirement”; and “I think of myself as a long-term
financial planner”. Coefficient alpha for perceived planning importance was 0.75.
13
The planning preparedness construct is equivalent to a domain knowledge
construct. The measure comprised aspects of the superannuation system in Australia
and aspects of investing in the share market. Participants were asked to rate their
knowledge on 7-point unipolar scales anchored at the low end by extremely poor and,
at the high end, by extremely good in response to each of the following items:
“investing in shares and other financial securities”; “how I can make changes to the
amount I contribute to superannuation”; “how I can make changes to my
superannuation investment strategy”; “the rate at which my superannuation savings
are likely to grow over time”; “the amount that I will eventually need to have saved
for a comfortable retirement”; and “potential risks versus returns when investing in
the share market”.
The risk tolerance measure was based on a scale widely used by research in
the field (US Federal Reserve Board Tri-Annual Survey of Consumer Finances, see
Sung & Hanna, 1996). Respondents were asked “Which of the following statements
comes closest to the amount of financial risk that you are willing to take when you
save or make investments,” from the list of five options: Take substantial financial
risk expecting to earn substantial returns; Take above average financial risks
expecting to earn above average returns; Take average financial risks expecting to
earn average returns; Prepared to minimise financial risk and accept a lower return; or
Not willing to take any financial risks.
4.4. Survey procedure
The survey questionnaire was designed to minimize participant response
ordering effects and participant fatigue effects. Fatigue effects were considered likely
given the length of the questionnaire. Different items assessing a given construct were
separated and presented in a non-systematic order, interspersed with items for the

14
other constructs. Additionally, the sequence of questions was rotated by dividing the
questions into four equal sets and rotating these questionnaire segments across
participants. Moreover, care was taken in the questionnaire to counterbalance high
and low endpoints of scales in order to counteract possible response sets. The
questionnaire was distributed by the four superannuation funds with a covering letter
of support from the fund. Before processing, questionnaire responses were checked
for completeness and data were entered into spreadsheets, which were, in turn,
checked for accuracy of data entry. Prior to data analysis, scale counterbalancing was
reversed so that high-score endpoints reflected positive intentions in all cases.
5. Results
5.1. Descriptive statistics
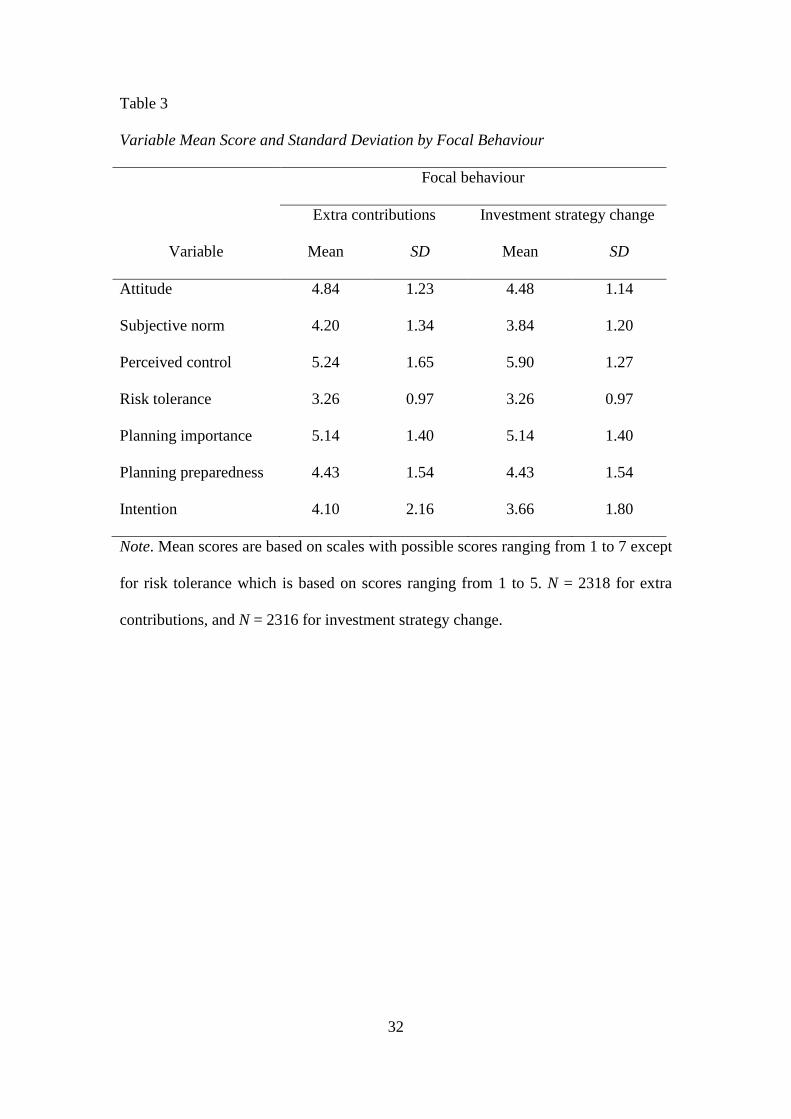
Inspection of mean scores in Table 3 reveals respondents assessed the
importance of planning and tolerance for risk moderately highly, whereas
respondents’ belief in their preparedness for planning, according to self-assessed
domain knowledge, was rated as neither good nor bad. Mean intention scores were
ambivalent, but they reflect a greater preparedness to contribute extra to
superannuation than to change investment strategy.
<Insert Table 3>
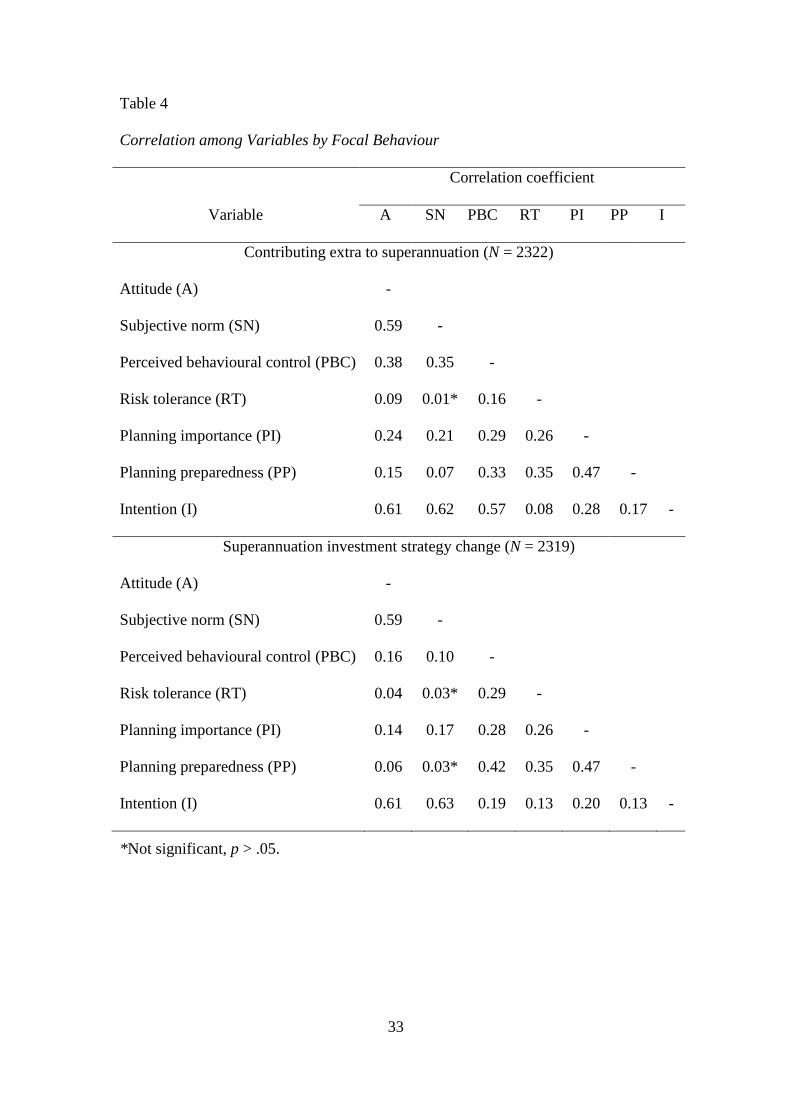
Of particular note from inspection of Table 4 were medium to good
correlation3
3 Cohen’s (1988) guidance was adopted, wherein a correlation coefficient of between 0.10 and 0.29
was taken as a small relation, between 0.30 and 0.49 as medium, and between 0.50 and 1.00 as large.
between planning importance (PI) and planning preparedness (PP); small
to medium correlation between PI and perceived behavioural control (PBC), and PP
and PBC; and medium, and small to medium correlations respectively between risk
tolerance (RT) and PP and between RT and PI. Inspection of Table 4 reveals RT to
15
be, understandably, more strongly related to PBC for investment strategy decisions
compared to extra contribution decisions. The strength of correlations were
considered to be favourable in terms of the potential to establish significant causal
paths by modeling covariance among the variables, which was undertaken in the next
stage of the analysis.
<Insert Table 4>
5.2. Model estimation
Testing of planning constructs and RT within a TPB framework is a novel
approach, but an approach which supports the important objective of discerning
relative predictive importance among the antecedents of intention, including the
robust antecedents represented by the TPB. Structural Equation Modelling was used
to test the causal relations among variables. To control for direct effects of TPB
predictors, the attitude, subjective norm and PBC variables were allowed to directly
influence intention. Given Ajzen’s (2001) view that determinants external to his
theory are likely to be more distal in their influence, we reasoned that PP would
predict PBC (an approach also informed by Frick, Kaiser, & Wilson, 2004 who link
knowledge with PBC), thus, PP was allowed to directly influence PBC. In turn, we
reasoned that PP would be antecedent to an individual’s sense of planning
importance. This view reflects that of Hershey and Mowen (2000), who find the
kindred variable Future Time Perspective antecedent to perceived financial
knowledge and retirement involvement. We therefore allowed PI to directly influence
PP. We also reasoned that higher scores in both planning constructs would predict
greater willingness to adopt investment risk (see, for example, Corter & Chen, 2006).
Accordingly, both PI and PP were allowed to directly influence RT. In order to
account for partial mediation by PP, RT, and PBC, PI was allowed to directly
16
influence PBC and both PI and PP to directly influence intention. Lastly, we reasoned
that RT would be positively associated with intention, and the association would be
more evident with respect to the intention to change investment strategy (e.g., Corter
& Chen, 2006).
These relationships are shown diagrammatically in Figure 1 (extra
contributions) and Figure 2 (investment strategy change). Estimation of the models
revealed good fit to the data4
<Insert Figure 1>
for each of the target behaviours (see Figures 1 and 2).
<Insert Figure 2>
5.3. Predictive importance
Inspection of standardised regression coefficients in Figures 1 and 2 reveals
TPB variables were highly influential antecedents of intention for both target
behaviours. Moreover, as expected, relative importance among the predictors of
intention varied across the two target behaviours. Of particular note in relation to this
paper were the causal relations among risk tolerance, planning constructs, perceived
behavioural control and intention. We now discuss results for the modelling of these
variables.
5.3.1. The influence of risk tolerance
4 Good model fit is indicated by levels for the comparative fit index (CFI) of 0.95 (or close to 0.95) and
above (Hu & Bentler, 1999). Guidelines for using the root mean square error of approximation
(RMSEA) are that it should be at or below 0.05 for a well-fitting model, and at or below 0.08 for a
reasonably fitting model (Hu & Bentler, 1995). The root mean square residual (RMSR) value for good
model fit is 0.08 (Byrne, 1989), with lower values representing better fit. Good model fit is also
reflected in a non-significant chi-square statistic. However, the chi-square fit index is highly sensitive
to sample size, such that with large sample size it is unlikely that the chi-square will achieve non-
significance (Kline, 1998).
17
Risk tolerance was a significant predictor only of the intention to change
investment strategy, which reflects the greater relevance of risk cognitions for
decisions about sharemarket investing compared to decisions about contributing extra.
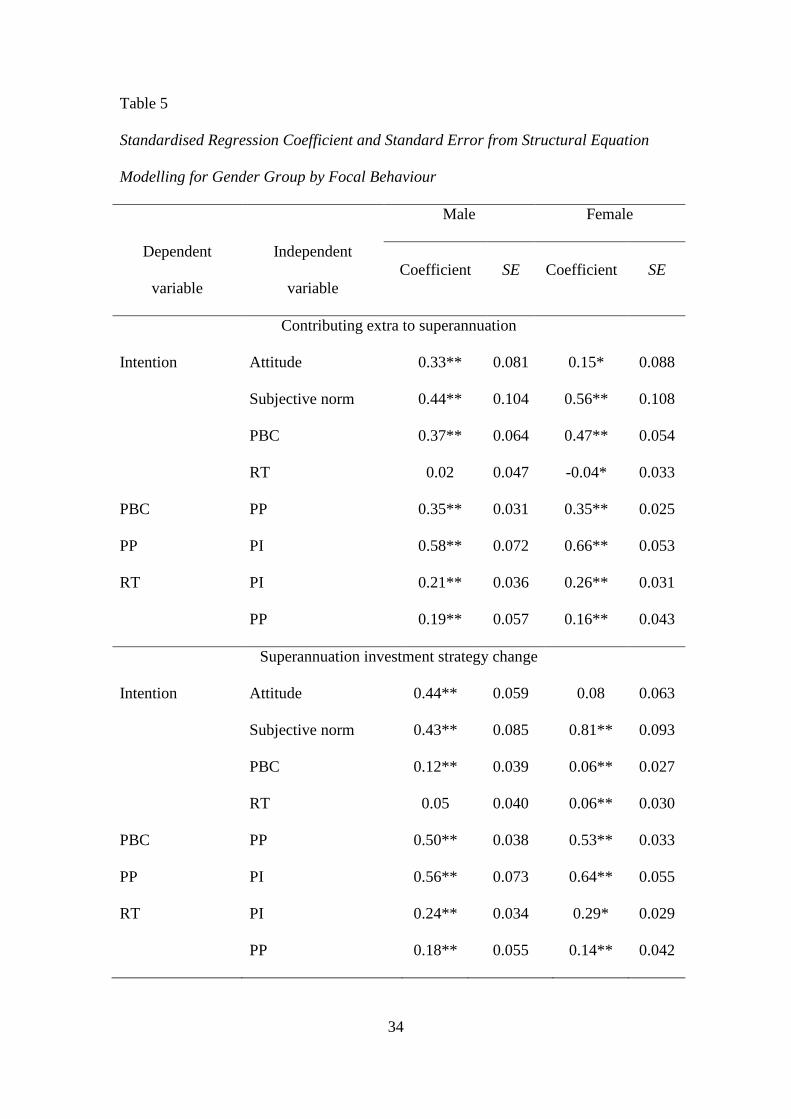
Inspection of Table 5 reveals that, when tested for gender difference in relation to the
intention to contribute extra, RT was significant (p < .05, and negative) for females
and not significant for males. However, coefficient size for females suggests a very
minor role for RT compared to other predictors of intention. No significant paths were
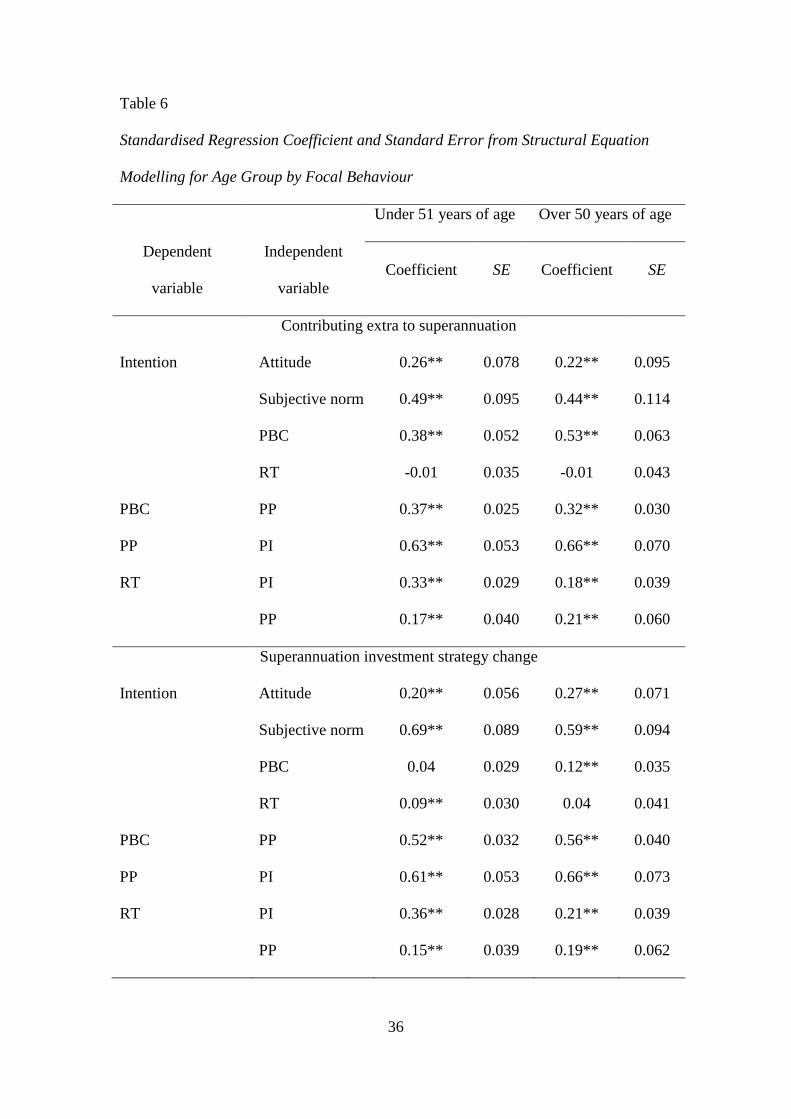
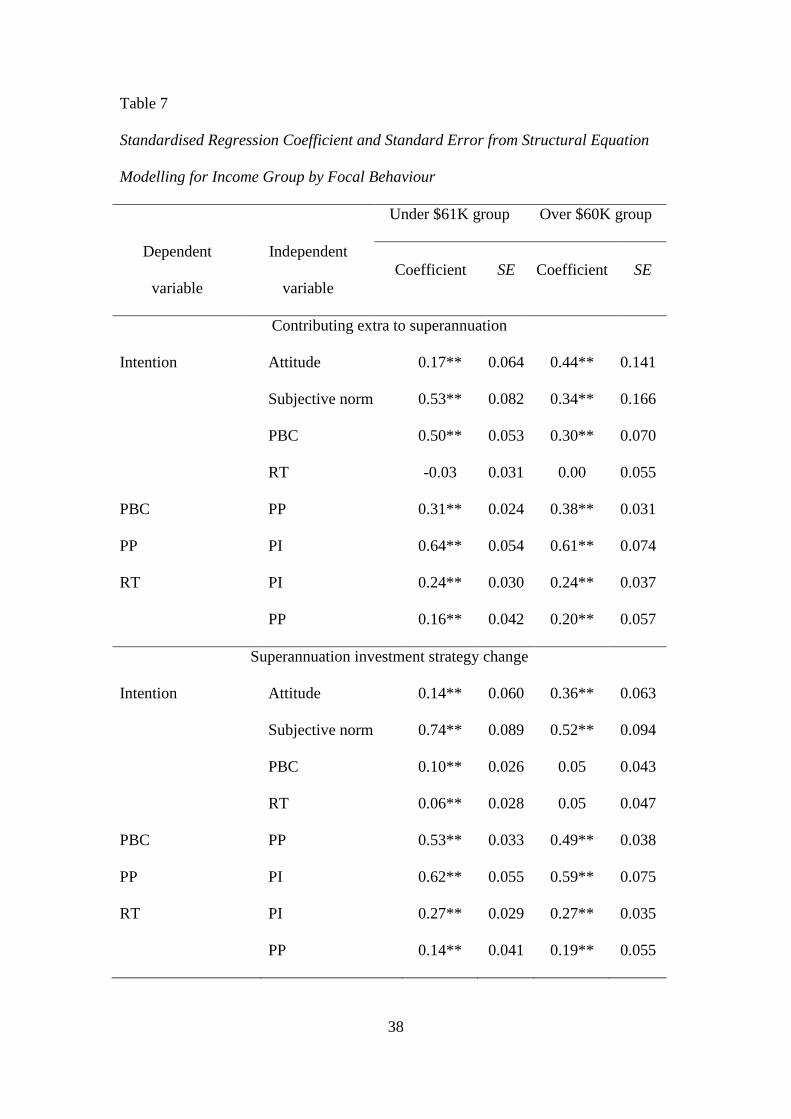
encountered across age (Table 6) or income groups (Table 7) for the influence of RT
on the intention to contribute extra to superannuation.
<Insert Table 5>
<Insert Table 6>
<Insert Table 7>
The influence of RT on the intention to change superannuation investment
strategy was positive across gender (see Table 5), but significant (p < .01) only for
females. Thus, females appear more inclined than males to consider investment risk
when contemplating investment strategy decisions. Coefficients were significant (p <
.01) for the younger age group (Table 6) and the lower income group (Table 7). Thus,
the significance observed in the pooled data for RT in predicting the intention to
change superannuation investment strategy appears confined to females in the lower
age and income groups. For these respondents, higher (lower) self-assessed risk
tolerance promotes greater (lesser) intention to change investment strategy.
Inspection of Figures 1 and 2 reveals that, for both behaviours of interest,
coefficients for the regression of PI and PP on RT were significant (p < .01).
Inspection of coefficient size suggests PP has greater influence than PI in predicting
RT. These results were consistent across gender, age and income groups (see Tables
18
5, 6, and 7). However, relative strength of coefficients suggests difference in
responses to scales by respondents in age and income groups. This was tested by
modelling age and income as independent variables (not reported here). In this
analysis, both age and income were found to be significant predictors of risk
tolerance—younger age predicted greater risk tolerance as did higher income. For
both behaviours of interest (scales were generic to both behaviours), PI and PP
explained 16% of the variance in RT, suggesting roles for determinants of RT beyond
those tested here.
Interpretation of the relevance of RT in predicting intention in the present
domain should be tempered by the finding that RT exerts no significant influence on
the intention to contribute extra (Figure 1). However, when compared to the influence
of TPB predictors, RT appears to exert small, yet significant (p <. 01) direct influence
on the intention to change investment strategy (Figure 2).
5.3.2. The influence of planning constructs
As expected, the effects of PI and PP on intention are mainly transferred to
intention by the PBC construct. Of the direct relations between PI, PP and intention,
the path from PP to the intention to contribute extra produced the sole significant (and
negative, p < .01) regression coefficient. For both behaviours, the influence of PI on
PBC was partially conveyed by PP, as direct paths between PI and PBC were
significant for both behaviours of interest (Figures 1 and 2). Nonetheless, a large
portion of the variance in PP was explained by PI in both models: 41% for
contributing extra and 38% for investment strategy change. Thus, perceptions of
planning importance appear to exert a powerful influence on the acquisition of
knowledge. When the influence of PI was investigated for gender, age and income
19
group differences, results revealed consistent direction, strength and significance of
coefficients across all groups (see Tables 5, 6, and 7).
Together, PI and PP accounted for 21% of the variance in extra contribution
control perceptions and 28% of the variance in investment strategy change control
perceptions. These relations are strong and they confirm key roles for planning
constructs in the prediction of perceptions of behavioural control. When investigated
across gender, age and income groups (see Tables 5, 6, and 7), results confirm that the
influence of PP on PBC for both extra contributions and investment strategy change
was consistently positive and significant at the p < .01 level. Moreover, observed
differences in the size of standardised regression coefficients between gender, age and
income groupings were minor. Thus, knowledge appears ubiquitous across
demographic groups in its influence on control perceptions for the behaviours studied
here. Interpretation of these outcomes should be moderated by the influence that PBC
exerts on intention. According to standardised regression coefficients (Figures 1 and
2), the influence of PBC on intention is much greater for extra contributions than for
investment strategy change.
6. Discussion
Results confirm the TPB to be a powerful model by which to predict
behavioural intentions in the retirement savings domain. We studied the intention to
perform two key retirement savings behaviours within an Australian superannuation
context. The amount of variance explained in intentions compares favourably to
results from application of the theory in other behavioural domains (see, Armitage &
Connor, 2001).
The TPB was used as a framework by which to meet the aims of this paper,
which were to better understand the relationships among behavioural intentions, PI,

20
PP (operationalised as domain knowledge), and RT. Our findings suggest that, rather
than direct antecedents of intentions, PI and PP variables are less proximal in their
influence. Indeed, their influence is mainly transferred to intention via the more
proximal PBC construct. Results suggest that, across gender, age and income groups,
a sense of planning importance predicts planning preparedness through the acquisition
of domain knowledge which, in turn, predicts perceptions of behavioural control and
intention. This is an important finding because it places PI and PP variables within the
context of the broader PBC construct, which is dependent upon a wider set of
determinants.
The PI and PP variables were found to be causally related to respondents’ self-
reported RT. Both PI and PP, when modelled as antecedents of RT, were significant
across all gender, age and income groupings. When modelled as independent
variables, age and income were found also to significantly predict RT. Younger
respondents with higher income predicted greater tolerance for investment risk. These
outcomes must be tempered by the findings that RT significantly (and positively)
predicted the intention to change superannuation investment strategy for females of
lower age in the lower income range, but not for other females or males in any
demographic group. Thus, RT appears to play a minor role in predicting intention.
However, predictive significance in investment decisions being confined to the
younger, lower income female group is a novel finding, which may have implications
for the financial advice industry.
6.1. Future work
According to Lusardi and Mitchell (2007b), financial illiteracy is widespread.
Young and older people alike in the United States and other countries appear
seriously under-informed about basic financial concepts, with serious implications for
21
saving, retirement planning, mortgages, and other financial decisions. Fundamental to
the illiteracy issue is the question of how literacy is to be measured, as this should
guide education efforts. One of the lessons from the study of motivations to perform
any given behaviour is the need for specificity of measurement (Ajzen, 2005). Thus,
measures of literacy will need to be specific to the particular behaviour of interest,
and education program content will need to be accordingly tailored. For example, in
the retirement savings field, literacy about the risks of credit card use will not
necessarily influence advocated retirement savings behaviours. Thus, parsing of
relevant behaviours in the retirement savings domain and developing measurement
scales and education programs specific to those behaviours remains an important task
for future research efforts.
Because perception of planning importance appears to be a strong antecedent
of planning preparedness as well as a direct antecedent of perceived behavioural
control, future study of the planning importance construct may benefit from
examination the underlying cognitions (beliefs) that shape its valence and strength.
Moreover, the field may benefit from future research designed to discriminate
differential construct and predictive validity associated with constructs such as
perceived planning importance as employed here, compared to other kindred
constructs such as future time perspective (Jacobs-Lawson et al., 2004), future
orientation (Howlett et al., 2008), propensity to plan (Deaves et al., 2007), and
planner mindset (Bhandari & Deaves, 2008).
6.2. Concluding remarks
By mandating employer contributions to superannuation, the Australian
government has exercised a paternalistic approach to the problem of retirement
savings. Notwithstanding improvements in aggregate and average superannuation
22
savings levels, a large proportion of Australians remains below targeted retirement
savings adequacy levels. The research in this paper examined the motivational
antecedents of two key retirement savings behaviours: making extra voluntary
contributions and changing savings investment strategy.
The study reveals that greater perceived planning importance and greater
planning preparedness (operationalised as domain knowledge) promotes greater
perception of behavioural control and that greater control perception promotes greater
intention to perform the focal behaviours. Although the two planning constructs were
found here to promote greater tolerance for investment risk, the influence of risk
tolerance on behavioural intentions was very minor relative to the importance of other
predictors of intention. This is an important outcome of the research. The risk
tolerance construct is widely employed in the financial advice industry to inform
retirement plan asset allocation. These findings suggest that individuals are guided in
their behavioural intentions in only modest degree by their self-assessed risk
tolerance.
An individual’s sense of planning importance and planning preparedness
(financial literacy) represent important areas for interventions designed to influence
retirement savings behaviour. The present research adds to research in the field by
assessing the relative importance of these variables and their causal paths in relation
to behavioural intention. The study identifies a powerful mediating role by
perceptions of behavioural control for the influences of planning preparedness and
planning importance on behavioural intention. A broader view of influencing
behaviour in the advocated direction requires paying attention to other influential
behavioural antecedents. This paper has highlighted the relevance of perceptions of
planning importance and of planning preparedness in influencing perceptions of

23
behavioural control and intention in the present behavioural domain. However, by
varying degrees for each of the behaviours of interest, the mean scores and beta
weights of attitude and subjective norm indicate that these two antecedents of
intention are also worthy of focus in prospective intervention efforts.

24
Acknowledgments
The authors gratefully acknowledge the support of GESB, UniSuper, STA
(AustralianSuper), and HESTA in the conduct of this research.
25
References
Access. (2008). The AMP Superannuation Adequacy Index Report. A Report Prepared by Access Economics Pty Ltd for AMP, from http://accesseconomics.com/publicationsreports/search.php?searchfor=ad
Ajzen, I. (1988). Attitudes, personality, and behavior. Chicago, IL: Dorsey. Ajzen, I. (2001). The nature and operation of attitudes. Annual Review of Psychology,
52, 27-58. Ajzen, I. (2002a). Construction of a standard questionnaire for the theory of planned
behavior. from http://www-unix.oit.umass.edu/~aizen/ Ajzen, I. (Ed.). (2005). Laws of human behavior: Symmetry, compatibility, and
attitude- behavior correspondence. Aachen: Shaker Verlag. Ajzen, I., & Fishbein, M. (Eds.). (2000). Attitudes and the attitude-behavior relation:
Reasoned and automatic processes.: John Wiley & Sons. Ajzen, I., & Fishbein, M. (Eds.). (2004). Attitudes and the attitude-behavior relation:
reasoned and automatic processes: John Wiley & Sons. Armitage, C. J., & Connor, M. (2001). Efficacy of the theory of planned behaviour: a
meta-analytic review. The British Journal of Social Psychology, 40(4), 471-500.
Australian Treasury. (2002). Intergenerational Report, Commonwealth of Australia Budget Paper No. 5, 2002-03 Budget.
Australian Treasury. (2007). Intergenerational Report. In C. o. Australia (Ed.). Badunenko, O., Barasinska, N., & Schäfer, D. (2009). Risk attitude and Investment
Decisions across European Countries – Are women more conservative investors than men? (Vol. Working Paper D. 6.2): European Commission 7th Framework Programme.
Bhandari, G., & Deaves, R. (2008). Misinformed and informed asset allocation decisions of self-directed retirement plan members. Journal of Economic Psychology 29, 473-490.
Byrne, B. M. (1989). Multigroup comparisons and the assumption of equivalent construct validity across groups: methodological and substantive issues. Multivariate Behavioral Research, 24(4), 503-523.
Clare, R. (2002). Mind the gaps. Superfunds, 45-47. Clark-Murphy, M., & Gerrans, P. (2001). Choices and retirement savings: some
preliminary results on superannuation fund member decisions. Economic Papers, 20(3), 29-42.
Clark, R. L., d'Ambrosio, M. B., McDermed, A. A., & Sawant, K. (2003). Retirement Plans and Savings Decisions: The Role of Information and Education. Paper presented at the Sustainable community development: what works, what doesn't, and why, Washington, DC.
Cohen, J. (1988). Statistical power analysis for the behavioral sciences (Second ed.). Hillsdale: Lawrence Erlbaum Associates.
Commonwealth of Australia. (2002). Retirement Income Modelling: Inquiry into Superannuation and Standards of Living in Retirement. Retrieved. from http://rim.treasury.gov.au/content/submission/ERContribution-02.asp.
Commonwealth of Australia. (2006a). Average Weekly Earnings, Australia. (No. ABS Cat. No. 6302.0). Canberra: Commonwealth of Australia: Australian Bureau of Statistics.
26
Commonwealth of Australia. (2006b). Australia (C) (Statistical Local Area). 20680-Occupation - 2006 ANZSCO (sub-major groups) by Sex - Australia., from http://www.censusdata.abs.gov.au
Connor, M., & Armitage, C. J. (1998). Extending the theory of planned behavior: a review and avenues for further research. Journal of Applied Social Psychology, 28, 1429-1464.
Corter, J. E., & Chen, Y. (2006). Do Investment Risk Tolerance Attitudes Predict Portfolio Risk? . Journal of Business and Psychology, 20(3), 369-381.
Deaves, R., Theodore Veit, E., Bhandari, G., & Cheney, J. (2007). The savings and investment decisions of planners: a cross-sectional study of college employees. Financial Services Review, 16(2), 107-133.
Frick, J., Kaiser, F. G., & Wilson, M. (2004). Environmental knowledge and conservation behavior: exploring prevalence and structure in a representative sample. [In Press]. Personality and Individual Differences, In Press.
Hershey, D. A., & Mowen, J. C. (2000). Psychological determinants of financial preparedness for retirement. The Gerontologist, 40(6), 687-697.
Howlett, E., Kees, J., & Kemp, E. (2008). The role of self-regulation, future orientation, and financial knowledge in long term financial decisions. The Journal of Consumer Affairs, 42(2), 223-242.
Hu, L. T., & Bentler, P. (Eds.). (1995). Evaluating model fit. London: Sage. Hu, L. T., & Bentler, P. M. (1999). Cutoff criteria for fit indexes in covariance
structure analysis: Conventional criteria versus new alternatives. Structural Equation Modeling, 6, 1-55.
Jacobs-Lawson, J. M., Hershey, D. A., & Neukam, K. A. (2004). Gender differences in factors that influence time spent planning for retirement. Journal of Women & Aging, 16, 55-70.
Kline, R. B. (1998). Principles and Practice of Structural Equation Modeling. New York: Guilford Press.
Lusardi, A. (2008). Household Saving Behavior: The Role of Literacy, Information and Financial Education Programs (No. NBER Working Paper No. 13824): NBER Working Paper No. 13824.
Lusardi, A., Keller, P. A., & Keller, A. M. (2009). New Ways to Make People Save: A Social Marketing Approach: NBER Working Paper No. 14715.
Lusardi, A., & Mitchell, O. S. (2006). Financial Literacy and Planning: Implications for Retirement Wellbeing: Working Paper, Pension Research Council, Wharton School, University of Pennsylvania.
Lusardi, A., & Mitchell, O. S. (2007a). Baby Boomer retirement security: The roles of planning, financial literacy, and housing wealth. Journal of Monetary Economics, 54(1), 205-224.
Lusardi, A., & Mitchell, O. S. (2007b). Financial Literacy and Retirement Preparedness: Evidence and Implications for Financial Education. Business Economics, 42(1), 35-44.
Lusardi, A., & Mitchell, O. S. (2008). Planning and Financial Literacy: How Do Women Fare? (No. NBER Working Paper No. 13750): NBER Working Paper No. 13750.
Lusardi, A., & Mitchell, O. S. (2009a). Financial Literacy, Retirement Planning, and Retirement Wellbeing: Lessons and Research Gaps. from http://www.retirementsecurityproject.org/pubs/File/LusardiMitchell.FinancialLiteracy,RetirementPlanningandRetirementWellbeing.LessonsandResearchGaps.pdf
27
Lusardi, A., & Mitchell, O. S. (2009b). Financial Literacy: Evidence and Implications for Financial Education: TIAA-CREF Institute.
Mercer. (2008). Superannuation Sentiment Index. from https://www.mercerwealthsolutions.com.au/files/mercerwealthsolution/documents/2009218164911weskmamnd27625.pdf
Moser, C. A., & Kalton, G. (1972). Survey Methods in Social Investigation. London: Heinemann.
Oppenheim, N. A. (1966). Questionnaire design and attitude measurement. London: Heinemann.
Osgood, C. E., Suci, G. J., & Tannenbaum, P. H. (1957). The Measurement of Meaning. Chicago: University of Illinois Press.
Rothman, G. (2007). The Adequacy of Retirement Incomes: New Estimates Incorporating The Better Superannuation Reforms. Paper presented at the Fifteenth Colloquium of Superannuation Researchers, University of New South Wales.
Russell, R., Brooks, R., Nair, A., & Fredline, E. D. (2006). The Initial Impacts of a Matched Savings Program: the Saver Plus Program. Economic Papers, 25(1), 32-40.
Speelman, C. P., Clark-Murphy, M., & Gerrans, P. (2007). Decision making clusters and gender issues in retirement savings. Journal. Retrieved from http://www.biz.uwa.edu.au/home/research/seminars_and_conferences/research_seminars_2007?f=154168.
Stawski, R. S., Hershey, D. A., & Jacobs-Lawson, J. M. (2007). Goal clarity and financial planning activities as determinants of retirement savings contributions. The International Journal of Aging and Human Development 64(1), 13-32.
Sung, J., & Hanna, S. (1996). Factors Related to Risk Tolerance. Financial Counseling and Planning, 7, 11-20.
Watson, J., & McNaughton, M. (2007). Gender Differences in Risk Aversion and Expected Retirement Benefits. Financial Analysts Journal, 63(4), 52-62.
Worthington, A. C. (2008). Knowledge and perceptions of superannuation in Australia. Journal of Consumer Policy, 31(3), 349-368.

28
29
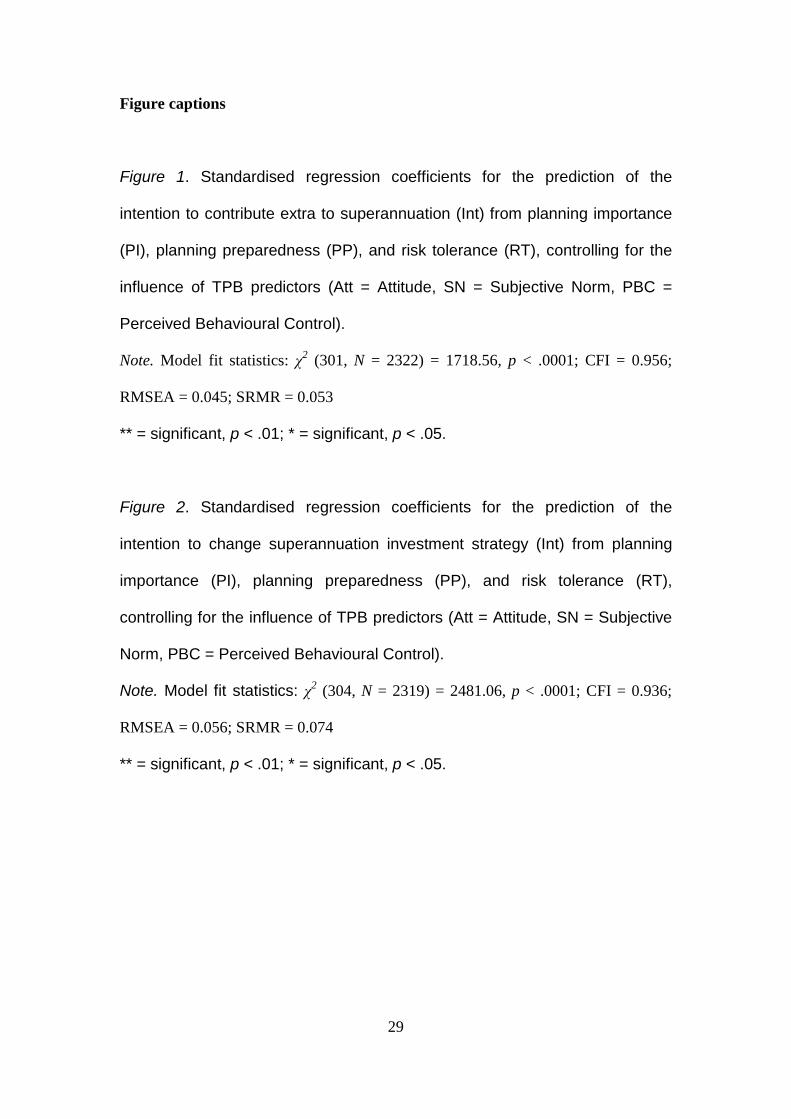
Figure captions
Figure 1. Standardised regression coefficients for the prediction of the
intention to contribute extra to superannuation (Int) from planning importance
(PI), planning preparedness (PP), and risk tolerance (RT), controlling for the
influence of TPB predictors (Att = Attitude, SN = Subjective Norm, PBC =
Perceived Behavioural Control).
Note. Model fit statistics: χ2 (301, N = 2322) = 1718.56, p < .0001; CFI = 0.956;
RMSEA = 0.045; SRMR = 0.053
** = significant, p < .01; * = significant, p < .05.
Figure 2. Standardised regression coefficients for the prediction of the
intention to change superannuation investment strategy (Int) from planning
importance (PI), planning preparedness (PP), and risk tolerance (RT),
controlling for the influence of TPB predictors (Att = Attitude, SN = Subjective
Norm, PBC = Perceived Behavioural Control).
Note. Model fit statistics: χ2 (304, N = 2319) = 2481.06, p < .0001; CFI = 0.936;
RMSEA = 0.056; SRMR = 0.074
** = significant, p < .01; * = significant, p < .05.

30
Table 1
Participant Sample Demographic Profile
Demographic Sample profile
Males:Females percentage ratioa 39:61
Couples:Singles percentage ratio 78:22
Average years of age 45
Average annual income $55000
Average household income $87000
Average household mortgage $70000
Average household net wealth $404000
Average household superannuation
savings balance
$190000
aMales, N = 916; Females, N = 1423.
31
Table 2
Participant Sample Compared to National Population Occupation Profile
Occupation classification Samplea Population
Managers 10% 14%
Professional 58% 20%
Technicians, Trade Workers 6% 13%
Community and Personal Service Workers 9% 9%
Clerical and Admin. 11% 16%
Sales Workers 1% 10%
Machinery Operators, Drivers and Labourers 2% 7%
Labourers 3% 11%
aN = 2339.
32
Table 3
Variable Mean Score and Standard Deviation by Focal Behaviour
Focal behaviour
Extra contributions Investment strategy change
Variable Mean SD Mean SD
Attitude 4.84 1.23 4.48 1.14
Subjective norm 4.20 1.34 3.84 1.20
Perceived control 5.24 1.65 5.90 1.27
Risk tolerance 3.26 0.97 3.26 0.97
Planning importance 5.14 1.40 5.14 1.40
Planning preparedness 4.43 1.54 4.43 1.54
Intention 4.10 2.16 3.66 1.80
Note. Mean scores are based on scales with possible scores ranging from 1 to 7 except
for risk tolerance which is based on scores ranging from 1 to 5. N = 2318 for extra
contributions, and N = 2316 for investment strategy change.
33
Table 4
Correlation among Variables by Focal Behaviour
Correlation coefficient
Variable A SN PBC RT PI PP I
Contributing extra to superannuation (N = 2322)
Attitude (A) -
Subjective norm (SN) 0.59 -
Perceived behavioural control (PBC) 0.38 0.35 -
Risk tolerance (RT) 0.09 0.01* 0.16 -
Planning importance (PI) 0.24 0.21 0.29 0.26 -
Planning preparedness (PP) 0.15 0.07 0.33 0.35 0.47 -
Intention (I) 0.61 0.62 0.57 0.08 0.28 0.17 -
Superannuation investment strategy change (N = 2319)
Attitude (A) -
Subjective norm (SN) 0.59 -
Perceived behavioural control (PBC) 0.16 0.10 -
Risk tolerance (RT) 0.04 0.03* 0.29 -
Planning importance (PI) 0.14 0.17 0.28 0.26 -
Planning preparedness (PP) 0.06 0.03* 0.42 0.35 0.47 -
Intention (I) 0.61 0.63 0.19 0.13 0.20 0.13 -
*Not significant, p > .05.
34
Table 5
Standardised Regression Coefficient and Standard Error from Structural Equation
Modelling for Gender Group by Focal Behaviour
Male Female
Dependent
variable
Independent
variable Coefficient SE Coefficient SE
Contributing extra to superannuation
Intention Attitude 0.33** 0.081 0.15* 0.088
Subjective norm 0.44** 0.104 0.56** 0.108
PBC 0.37** 0.064 0.47** 0.054
RT 0.02 0.047 -0.04* 0.033
PBC PP 0.35** 0.031 0.35** 0.025
PP PI 0.58** 0.072 0.66** 0.053
RT PI 0.21** 0.036 0.26** 0.031
PP 0.19** 0.057 0.16** 0.043
Superannuation investment strategy change
Intention Attitude 0.44** 0.059 0.08 0.063
Subjective norm 0.43** 0.085 0.81** 0.093
PBC 0.12** 0.039 0.06** 0.027
RT 0.05 0.040 0.06** 0.030
PBC PP 0.50** 0.038 0.53** 0.033
PP PI 0.56** 0.073 0.64** 0.055
RT PI 0.24** 0.034 0.29* 0.029
PP 0.18** 0.055 0.14** 0.042

35
Note. Contributing extra to superannuation: male, N = 897, female, N = 1389.
Superannuation investment strategy change: male, N = 894, female, N = 1389. PBC =
perceived behavioural control; RT = risk tolerance; PP = planning preparedness; PI =
planning importance.
* p < .05; ** p < .01.
36
Table 6
Standardised Regression Coefficient and Standard Error from Structural Equation
Modelling for Age Group by Focal Behaviour
Under 51 years of age Over 50 years of age
Dependent
variable
Independent
variable Coefficient SE Coefficient SE
Contributing extra to superannuation
Intention Attitude 0.26** 0.078 0.22** 0.095
Subjective norm 0.49** 0.095 0.44** 0.114
PBC 0.38** 0.052 0.53** 0.063
RT -0.01 0.035 -0.01 0.043
PBC PP 0.37** 0.025 0.32** 0.030
PP PI 0.63** 0.053 0.66** 0.070
RT PI 0.33** 0.029 0.18** 0.039
PP 0.17** 0.040 0.21** 0.060
Superannuation investment strategy change
Intention Attitude 0.20** 0.056 0.27** 0.071
Subjective norm 0.69** 0.089 0.59** 0.094
PBC 0.04 0.029 0.12** 0.035
RT 0.09** 0.030 0.04 0.041
PBC PP 0.52** 0.032 0.56** 0.040
PP PI 0.61** 0.053 0.66** 0.073
RT PI 0.36** 0.028 0.21** 0.039
PP 0.15** 0.039 0.19** 0.062

37
Note. Contributing extra to superannuation: under 51 age group, N = 1412; over 50
age group, N = 863. Superannuation investment strategy change: under 51 age group,
N = 1411; over 50 age group, N = 861. PBC = perceived behavioural control; RT =
risk tolerance; PP = planning preparedness; PI = planning importance.
* p < .05; ** p < .01.
38
Table 7
Standardised Regression Coefficient and Standard Error from Structural Equation
Modelling for Income Group by Focal Behaviour
Under $61K group Over $60K group
Dependent
variable
Independent
variable Coefficient SE Coefficient SE
Contributing extra to superannuation
Intention Attitude 0.17** 0.064 0.44** 0.141
Subjective norm 0.53** 0.082 0.34** 0.166
PBC 0.50** 0.053 0.30** 0.070
RT -0.03 0.031 0.00 0.055
PBC PP 0.31** 0.024 0.38** 0.031
PP PI 0.64** 0.054 0.61** 0.074
RT PI 0.24** 0.030 0.24** 0.037
PP 0.16** 0.042 0.20** 0.057
Superannuation investment strategy change
Intention Attitude 0.14** 0.060 0.36** 0.063
Subjective norm 0.74** 0.089 0.52** 0.094
PBC 0.10** 0.026 0.05 0.043
RT 0.06** 0.028 0.05 0.047
PBC PP 0.53** 0.033 0.49** 0.038
PP PI 0.62** 0.055 0.59** 0.075
RT PI 0.27** 0.029 0.27** 0.035
PP 0.14** 0.041 0.19** 0.055

39
Note. Contributing extra to superannuation: under $61K income group, N = 1473:
over $60K income group, N = 798. Superannuation investment strategy change: under
$61K income group, N = 1472; over $60K income group, N = 796. PBC = perceived
behavioural control; RT = risk tolerance; PP = planning preparedness; PI = planning
importance.
* p < .05; ** p < .01.