the residential preferences of blacks and whites: a four‐metropolis analysis
TRANSCRIPT

This article was downloaded by: [128.199.165.238]On: 26 August 2015, At: 23:57Publisher: RoutledgeInforma Ltd Registered in England and Wales Registered Number: 1072954 Registered office: 5 Howick Place,London, SW1P 1WG
Housing Policy DebatePublication details, including instructions for authors and subscription information:http://www.tandfonline.com/loi/rhpd20
The residential preferences of blacks and whites: Afour‐metropolis analysisReynolds Farley a , Elaine L. Fielding b & Maria Krysan ca Vice President of the Russell Sage Foundationb Assistant Research Scientist in the Population Studies Center , University of Michiganc Assistant Professor of Sociology , Pennsylvania State UniversityPublished online: 31 Mar 2010.
To cite this article: Reynolds Farley , Elaine L. Fielding & Maria Krysan (1997) The residential preferences of blacks andwhites: A four‐metropolis analysis, Housing Policy Debate, 8:4, 763-800, DOI: 10.1080/10511482.1997.9521278
To link to this article: http://dx.doi.org/10.1080/10511482.1997.9521278
PLEASE SCROLL DOWN FOR ARTICLE
Taylor & Francis makes every effort to ensure the accuracy of all the information (the “Content”) containedin the publications on our platform. However, Taylor & Francis, our agents, and our licensors make norepresentations or warranties whatsoever as to the accuracy, completeness, or suitability for any purpose of theContent. Any opinions and views expressed in this publication are the opinions and views of the authors, andare not the views of or endorsed by Taylor & Francis. The accuracy of the Content should not be relied upon andshould be independently verified with primary sources of information. Taylor and Francis shall not be liable forany losses, actions, claims, proceedings, demands, costs, expenses, damages, and other liabilities whatsoeveror howsoever caused arising directly or indirectly in connection with, in relation to or arising out of the use ofthe Content.
This article may be used for research, teaching, and private study purposes. Any substantial or systematicreproduction, redistribution, reselling, loan, sub-licensing, systematic supply, or distribution in anyform to anyone is expressly forbidden. Terms & Conditions of access and use can be found at http://www.tandfonline.com/page/terms-and-conditions

The Residential Preferences of Blacks and Whites 763Housing Policy Debate • Volume 8, Issue 4 763© Fannie Mae Foundation 1997. All Rights Reserved.
The Residential Preferences of Blacks andWhites: A Four-Metropolis Analysis
Reynolds FarleyRussell Sage Foundation
Elaine L. FieldingUniversity of Michigan
Maria KrysanPennsylvania State University
Abstract
Three hypotheses seek to explain the persistence of residential segregationbetween blacks and whites in the United States: economic differentials,discrimination in housing and lending markets, and neighborhood preferences.The preferences hypothesis posits that both races wish to live in raciallyhomogeneous neighborhoods. This article examines the preferences hypothesisby using recent interview data from metropolitan Atlanta, Boston, Detroit,and Los Angeles.
Race continues to be significant in the residential decision-making process.Whites’ willingness to move into a neighborhood is inversely related to thedensity of blacks living there. Blacks prefer integrated neighborhoods, butones with a substantial representation of blacks. Preferences differ signifi-cantly from one metropolis to another, with Detroit representing the extreme.In the other three metropolises, the preferences of blacks and whites dooverlap sufficiently to offer hope for a decline in segregation, provided that theinfluence of other forces, particularly discrimination, also declines.
Keywords: Minorities; Housing; Neighborhood
Introduction
In American Apartheid, Douglas Massey and Nancy Denton(1993) describe the persistence of black-white residential segre-gation and its many negative consequences for equal racialopportunities. They report that it is a deliberate creation of thiscentury and that blacks have been and continue to be much moresegregated from whites than Asians, Hispanics, or other ethnicminorities are. They believe, as do Lawrence Bobo and CamilleZubrinsky (1996), that residential segregation is the “structurallinchpin” of the nation’s racial hierarchy. The concentration of
Dow
nloa
ded
by [
128.
199.
165.
238]
at 2
3:57
26
Aug
ust 2
015

764 Reynolds Farley, Elaine L. Fielding, and Maria Krysan
blacks in largely black urban neighborhoods limits their acquisi-tion of financial capital, narrows employment opportunities,maintains the Jim Crow system of public schools, and may di-minish the political power of African Americans by concentratingthem into largely black districts (Cutler and Glaeser 1997; Swain1993). Massey and Denton (1993, 183) contend that the constel-lation of social and economic problems afflicting many blacks,now often referred to as the “urban underclass issue,” is theinevitable outcome of residential segregation:
Once a group’s segregation in society has been ensured,the next step in building an underclass is to drive up itsrate of poverty. Segregation thus makes it politicallyeasy to limit the number of governmental jobs withinthe ghetto, to reduce public services, to keep its schoolsunderstaffed and underfunded, to lower the transferpayments on which its poor depend, and to close itshospitals, clinics, employment offices, and other socialsupport institutions.
Why does residential segregation persist 28 years after Congressenacted the Fair Housing Act and after the Supreme Court’s1968 Jones v. Mayer decision (392 U.S. 409) proscribed racialdiscrimination in the housing market? Why does it persist at atime when the views of whites have shifted overwhelmingly sothat they now almost universally endorse the right of blacks tolive wherever they can afford? For example, in the early 1960s,60 percent of national samples of whites agreed with the proposi-tion that white people had a right to keep blacks out of theirneighborhoods if they wished to and that blacks should respectthat right, but only 13 percent of whites agreed with that prin-ciple of segregation 36 years later (Bobo, Schuman, and Steeh1986; Farley 1993; Schuman et al. 1997).
While there were declines in residential segregation in the 1970sand 1980s, they were modest, and they left blacks and whiteshighly segregated in our major population centers (Farley andFrey 1994). Three theories explaining persistent black-whitesegregation have been investigated since they were first statedby Myrdal (1944) half a century ago.
Economic differentials
The economic hypothesis contends that segregation results fromthe economic differentials between blacks and whites: Segrega-tion came about and persists because people live where they can
Dow
nloa
ded
by [
128.
199.
165.
238]
at 2
3:57
26
Aug
ust 2
015
The Residential Preferences of Blacks and Whites 765
afford. While there is strong theoretical support for this view(Becker 1957), empirical investigations unambiguously reject it.Numerous studies report that high-income black households arejust about as segregated from high-income whites as low-incomeblacks are segregated from low-income whites (Denton andMassey 1988; Erbe 1975; Farley 1977; Fielding and Taeuber1992; Massey 1979; Simkus 1978; Taeuber 1965). If residentialpatterns were based solely on social or economic factors, such asincome, educational attainment, or occupational prestige, racialsegregation would be much lower than currently observed. Twocorollaries support this assertion. One is that economic segrega-tion is not complete; most neighborhoods are relatively heteroge-neous in their social and economic composition. The other is thatcurrent economic differentials between blacks and whites are notgreat enough to explain existing levels of residential segregation.
Discrimination in lending and housing markets
The racial discrimination hypothesis argues that segregationpersists because of the differential treatment of whites andblacks in the housing market. Many studies report discrimina-tion in the rental, sale, and financing of housing. In the late1970s, two investigations (one private and one governmentsponsored) uncovered apparent violations of the Fair HousingAct by using matched pairs of home seekers to determinewhether real estate brokers treated blacks and whites identically(Pearce 1979; Wienk et al. 1979). A recent governmental studydocuments continued discrimination against blacks in the hous-ing market. While blacks were generally shown homes or apart-ments, treated politely, and given information, there was clearevidence of differential treatment by race. For example, blackswere less likely than whites to be encouraged to return for fur-ther information about available homes (Turner 1992, 1993;Yinger 1986, 1991, 1995). (For a description of how pervasivediscrimination isolates blacks and whites in the housing market,see Social Science Panel 1972, chap. 3.)
Other investigations analyzed racial discrimination in the fi-nancing of home buying, using data that the 1975 Home Mort-gage Disclosure Act (HMDA) and its revisions required lendersto report. In 1993, 34 percent of blacks, 25 percent of Hispanics,and only 15 percent of whites seeking mortgages from federallyfunded chartered institutions were turned down (Goering andWienk 1996; Tootell 1996; Yinger 1995). Newspaper reportersand university investigators consistently report that banks makeloans in middle-income white neighborhoods more often than in
Dow
nloa
ded
by [
128.
199.
165.
238]
at 2
3:57
26
Aug
ust 2
015

766 Reynolds Farley, Elaine L. Fielding, and Maria Krysan
similar middle-income black neighborhoods (Blossom, Everett,and Gallagher 1988; Dedman 1988; Feins and Bratt 1983; Leahy1985; Pol, Guy, and Bush 1982; Shlay 1988; Taggart and Smith1981). One of the most frequently cited recent studies, conductedby the Boston Federal Reserve Bank, found that applications forconventional mortgages in the early 1990s were rejected for10 percent of white applicants and for 18 percent of blacks andHispanics with similar financial and demographic characteristics(Carr and Megbolugbe 1993; Munnell et al. 1992; Yinger 1995).Other proponents of the racial discrimination hypothesis haveargued that marketing practices, which differ dramatically forhomes in black, white, and integrated neighborhoods, are animportant source of residential segregation (Turner and Wienk1993). Thus, the discrimination hypothesis posits that the keycauses of continued segregation are a web of institutionalizedpractices that ultimately steer whites and blacks in differentdirections when they seek housing and the lending practices thatgive whites greater access to mortgage money (Galster andKeeney 1988; Yinger 1995).
Neighborhood preferences
The preferences hypothesis argues that segregation results notso much from discriminatory practices as from the differentpreferences of blacks and whites (Clark 1986, 1988, 1989, 1992;Muth 1969, 1986). According to this hypothesis, both races desireto live in neighborhoods where they are numerically dominant.Thus, even if blacks and whites had similar incomes and assetsand if there were no racial discrimination in the marketing ofhousing, blacks and whites would live in different neighborhoodsbecause segregation reflects differing tastes, not discrimination.
Among scholars who investigate racial residential preferences,there are key differences in assumptions about what underliespreferences. Some argue that racial preferences are derived from“neutral ethnocentrism” (e.g., Clark 1988; Thernstrom andThernstrom 1997). Others argue that racial prejudice and con-flict underlie preferences of whites and that blacks’ preferencesare largely a function of their concerns about the hostility theymight face in a white neighborhood (Bobo and Zubrinsky 1996;Farley et al. 1994). Preferences, then, are both a cause and aneffect of racial discrimination, and they can thus be seen as apart of the web of simultaneous forces generating and sustainingresidential segregation.
Dow
nloa
ded
by [
128.
199.
165.
238]
at 2
3:57
26
Aug
ust 2
015

The Residential Preferences of Blacks and Whites 767
What we know about residential preferences: Scopeof this article
How strongly do blacks and whites prefer to live with others oftheir own race? Do both races have an aversion to living with theother race? Is the future for residential integration bleak—asThernstrom and Thernstrom (1997) contend—because the prefer-ences of blacks and whites do not overlap?
While there is a long history of national surveys asking whitesabout their support for the principle of residential integration,only a few explicitly ask respondents about their preferredneighborhood racial composition. Beginning in the early 1940s,national samples of whites were asked whether it would make adifference to them if a black family with income and educationsimilar to theirs moved into their block. In 1942, 65 percent saidit would make a difference, but by the 1970s, just 15 percent ofwhites said it would make a difference (Farley 1993). Anotherquestion posed to whites asked whether they would try to moveaway if black people came to live next door. In the 1950s, aboutone-quarter of whites said they would definitely move away;when the question was asked most recently, in 1997, only 2 per-cent said they would or might move. This substantial changeover time reflects the pervasive trend toward more liberal racialattitudes among whites (Schuman et al. 1997, table 3.3). Whileinformative, these questions provide only limited informationabout the neighborhood preferences of whites. There is a muchshorter history of questions seeking to determine the preferencesof blacks.
One early effort was the 1976 Detroit Area Study, which used aninnovative approach to assess the preferences of blacks andwhites. All interviewing was done face to face in the respondent’shome or apartment, with interviewers and respondents matchedby race. For white respondents, a series of five cards was pre-pared showing a range from an all-white neighborhood to aneighborhood with eight homes occupied by black families andsix occupied by white families (see figure 1). White respondentswere first shown the all-white card (scenario 1) and then werepresented with cards showing progressively greater densities ofblacks (scenarios 2 through 5). With each card, they were askedto express how comfortable they would feel with living in such aracially mixed neighborhood, using a four-point scale rangingfrom “very comfortable” to “very uncomfortable.” If white respon-dents said they would feel somewhat or very uncomfortable, theywere asked whether they would try to move out if their ownneighborhood came to have a racial composition similar to the
Dow
nloa
ded
by [
128.
199.
165.
238]
at 2
3:57
26
Aug
ust 2
015

768 Reynolds Farley, Elaine L. Fielding, and Maria Krysan
Fig
ure
1. C
ard
s U
sed
wit
h W
hit
e R
esp
on
den
ts
Sce
nar
io 2
Sce
nar
io 1
Sce
nar
io 3
Sce
nar
io 4
Sce
nar
io 5
You
rH
ouse
You
rH
ouse
You
rH
ouse
You
rH
ouse
You
rH
ouseDow
nloa
ded
by [
128.
199.
165.
238]
at 2
3:57
26
Aug
ust 2
015

The Residential Preferences of Blacks and Whites 769
one depicted on that card. If they said they would not try to moveout, they were shown cards with higher densities of blacks untilthey said they would try to move out or until they reached thefifth card, showing a majority-black neighborhood. Subsequently,whites were given the same five cards, told they had found anattractive, affordable home in each area, and asked which neigh-borhoods they would be willing to move into. The study therebydetermined what degree of residential integration—if any—madea white respondent feel uncomfortable, what degree provokedthe respondent to consider moving away, and what degree wasacceptable when the respondent sought an attractive new home(Farley et al. 1978).
At the outset, the researchers planned to use identical cards andidentical questions for whites and blacks, but pretests demon-strated that this would be a waste of interview time. Blackrespondents had no objection to whites moving into their neigh-borhoods, and that type of demographic change was extremelyrare in Detroit. Furthermore, asking whites about neighborhoodswith more than 11 black families out of 14 provided no newinformation because few whites were comfortable with thisdensity of blacks or willing to consider moving into such an area.For those reasons, black respondents were shown a differentarray of five cards, ranging from an all-black neighborhood to anall-white neighborhood (see figure 2). They were given thesecards and asked to arrange them so that their most preferredneighborhood was at the top and their least preferred neighbor-hood at the bottom. Later, black respondents were given thesame five cards and told that they had found an attractive,affordable home in each area. They were asked which, if any, ofthe neighborhoods they would not be willing to move into be-cause of its racial composition.
Findings from this 1976 study of Detroit have frequently beencited as supporting the hypothesis that the residential prefer-ences of whites and blacks do not overlap. Whites in the Detroitarea reported that they were quite uncomfortable when morethan token numbers of blacks moved into their neighborhood.For example, 42 percent of whites said they would be uncomfort-able if blacks constituted one-fifth of their neighborhood, andone-quarter said they would try to move away in such a circum-stance. Whites had an aversion to moving into integrated neigh-borhoods; 27 percent said they would not consider an attractive,affordable home if it were located in a neighborhood where only1 home in 15 was occupied by a black family (Farley et al. 1978,figure 7).
Dow
nloa
ded
by [
128.
199.
165.
238]
at 2
3:57
26
Aug
ust 2
015

770 Reynolds Farley, Elaine L. Fielding, and Maria Krysan
Fig
ure
2.
Ca
rds
Use
d w
ith
Bla
ck R
esp
on
den
ts
Sce
nar
io 2
Sce
nar
io 1
Sce
nar
io 3
Sce
nar
io 4
Sce
nar
io 5
You
rH
ouse
You
rH
ouse
You
rH
ouse
You
rH
ouse
You
rH
ouseDow
nloa
ded
by [
128.
199.
165.
238]
at 2
3:57
26
Aug
ust 2
015

The Residential Preferences of Blacks and Whites 771
Detroit-area blacks overwhelmingly preferred integrated neigh-borhoods, specifically those in which there were roughly equalnumbers of blacks and whites. That is, 82 percent said their firstor second choice was the neighborhood containing 7 black and7 white families or the one containing 10 black and 4 whitefamilies. Blacks favored racially integrated neighborhoods, butwith a representation of blacks so great that most whites wouldfeel uncomfortable and try to move away; thus, the prospects forresidential integration in Detroit seemed dim. These resultshave entered the mainstream and are sometimes assumed toapply to the entire United States. Writing for a unanimousSupreme Court in 1992, Associate Justice Anthony Kennedyhelped justify the minimization of school integration programs inDe Kalb County, GA—suburban Atlanta—on the basis that“whites prefer a racial mix of 80 percent white and 20 percentblack, while blacks prefer a 50 percent mix” (Freeman v. Pitts[1992] 112 S. Ct. 1430).
Results from a second Detroit Area Study, conducted in 1992,show a considerable moderation of whites’ preferences relative to1976. Whites in 1992 were more willing to move into integratedneighborhoods and less likely to move away when blacks arrived(Farley et al. 1993). These results are also referred to as if theyapply to the country as a whole. For example, in their recentbook, Thernstrom and Thernstrom (1997) argue that the prefer-ences of blacks for evenly mixed neighborhoods drive continuedsegregation nationwide.
Is it appropriate to generalize the results from Detroit to othersites in the United States? We investigate this question by usingdata based on a replication of the methods of the 1976 DetroitArea Study and focusing on three interrelated analyses:
1. A comparison of the neighborhood preferences of blacksand whites across four metropolitan areas: Atlanta,Boston, Detroit, and Los Angeles
2. An investigation of the key demographic determinants(educational attainment, birth cohort, gender, andfamily income) of neighborhood preferences of blacksand whites
3. An assessment of the extent to which the key determi-nants of neighborhood preferences differ from one cityto another
Dow
nloa
ded
by [
128.
199.
165.
238]
at 2
3:57
26
Aug
ust 2
015

772 Reynolds Farley, Elaine L. Fielding, and Maria Krysan
Study sites: Atlanta, Boston, Detroit, and Los Angeles
Our first aim in this article is to compare the racial residentialpreferences of blacks and whites in Atlanta, Boston, Detroit, andLos Angeles. Each of these metropolises has a unique economic,social, and racial history. By looking at these varying contexts,we gain an improved understanding of beliefs and preferencesrelated to residential segregation (see table 1 for characteristicsof the four metropolises). That is, much of our knowledge ofneighborhood preferences is based on Detroit, which is a classicrust-belt metropolis. For decades, blue-collar jobs offeredDetroit-area blacks good employment opportunities, but sincethe 1970s the number of such jobs and their pay levels havefallen, leading to higher poverty rates and a much increasedblack-white gap on economic indicators. This gap is higher inDetroit than in any of the other areas. For instance, the ratio ofblack to white unemployment rates in 1990 was 3.6 in Detroit,and the next highest among the four areas was 2.7 for Atlanta.Detroit, where the index of dissimilarity measuring the segrega-tion of blacks from whites at the block-group level was a veryhigh 89 in 1990, represents the quintessential “Chocolate City,Vanilla Suburbs” pattern (Darden et al. 1987; Everett 1992;Farley and Frey 1994, table 1). Blacks are heavily concentratedin the city (83 percent of blacks in the metropolitan area live inDetroit itself), while nearly all area whites (93 percent) liveoutside the city (U.S. Bureau of the Census 1992, table 5). Theother three metropolises had lower levels of black-white segrega-tion in 1990, with indices of 73 for Atlanta, 75 for Los Angeles,and 71 for Boston. Many other differences among these metropo-lises make them interesting comparisons with both Detroit andeach other.
For example, Atlanta’s residential patterns have changed inrecent years but still reflect southern Jim Crow practices(Keating, Brazen, and Fitterman 1992). Like Detroit, Atlantahas a population that is one-quarter black, but in Atlanta, unlikeDetroit, the majority of blacks (65 percent) live outside the city.Atlanta has grown rapidly since World War II and is now seen asthe dynamic financial capital of a new, more prosperous and lessracist South. It appears poised for continued growth and furthereconomic transformation. Indeed, of the four metropolises, At-lanta had the lowest unemployment rate in 1990. The relativelylow unemployment rate for blacks (7.5 percent) in Atlanta isespecially notable.
Boston, despite its substantially smaller black population of just6 percent, has a long history of bitter black-white strife (Campen
Dow
nloa
ded
by [
128.
199.
165.
238]
at 2
3:57
26
Aug
ust 2
015

The Residential Preferences of Blacks and Whites 773
Table 1. Characteristics of Four Metropolises in the Multi-City Studyof Urban Inequality
Atlanta Boston Detroit Los Angeles
Population in 1990(in thousands) 2,834 3,784 4,382 8,863
Percent of metropolitanpopulation living withincentral city in 1990a
Total 13 26 24 39 White 6 13 7 36 Black 35 69 83 49 Hispanic 13 45 34 42 Asian 7 31 15 36
Indexes of racialresidential segregationin 1990a,b
Black v. white 73 71 89 75 Hispanic v. white 41 63 44 64 Asian v. white 47 50 51 49
Composition ofpopulation in 1990(in percent)a
Total 100 100 100 100 White 70 86 75 41 Black 26 6 22 11 Hispanic 2 5 2 38 Asian 2 3 1 10
Population change inthe 1980s (in percent)a
Total +33 +3 –2 +19 White +25 –4 –6 –8 Black +39 +23 +5 +1 Hispanic +138 +108 +16 +62 Asian +325 +178 +68 +109
Social and economiccharacteristics in 1990 Percent foreign-born 4 11 6 33
Percent with collegedegree or higherc
White 45 52 32 46 Black 27 29 19 28
Median householdincome in 1989
White $42,000 $42,000 $38,300 $41,500 Black $24,700 $26,000 $20,000 $26,000
Dow
nloa
ded
by [
128.
199.
165.
238]
at 2
3:57
26
Aug
ust 2
015

774 Reynolds Farley, Elaine L. Fielding, and Maria Krysan
Table 1. Characteristics of Four Metropolises in the Multi-City Studyof Urban Inequality (continued)
Atlanta Boston Detroit Los Angeles
Unemployment ratein 1990 (in percent)d
White 2.8 4.8 5 4.1 Black 7.5 10.9 18.1 10.0
Source: U.S. Bureau of the Census (1992).a Data refer to non-Hispanic whites, non-Hispanic blacks, and non-Hispanic Asians.b Indices of dissimilarity computed from block group data.c Persons aged 25 to 54 with college degrees, including two-year degrees.d Persons aged 25 to 54.
1992; Lukas 1985). As with Detroit, Boston-area blacks areconcentrated in the central city (69 percent). Whereas Atlantaand Detroit are primarily black-white cities with little recentimmigration, Boston has become a metropolis of entry for Carib-bean immigrants. Recently, its economy rose and fell with theMassachusetts miracle—the economic boom that briefly ben-efited that state during the 1980s.
Finally, Los Angeles epitomizes the multiethnic metropolis. Itsburgeoning economy in the 1970s and 1980s attracted a millionor more new residents from Asia and Latin America, as well asfrom all corners of the United States (Grigsby 1994). Indeed, in1990, 48 percent of Los Angeles residents were either Hispanicor Asian, 11 percent (which is about the national average) wereblack, and the remaining 41 percent were white. Los Angeles isemerging as the leading financial center for the Pacific Rim, andif current domestic and international migration trends continue,Los Angeles may be a template for what other large metropolisesmay become by the middle of the next century (Zubrinsky andBobo 1996). It is another place on the growing list of metropo-lises in which the majority of black residents (in this case,51 percent) live in the suburban ring. As in Boston, the black-white gap on economic indicators (as of 1990) was smaller in LosAngeles than in Detroit and Atlanta.
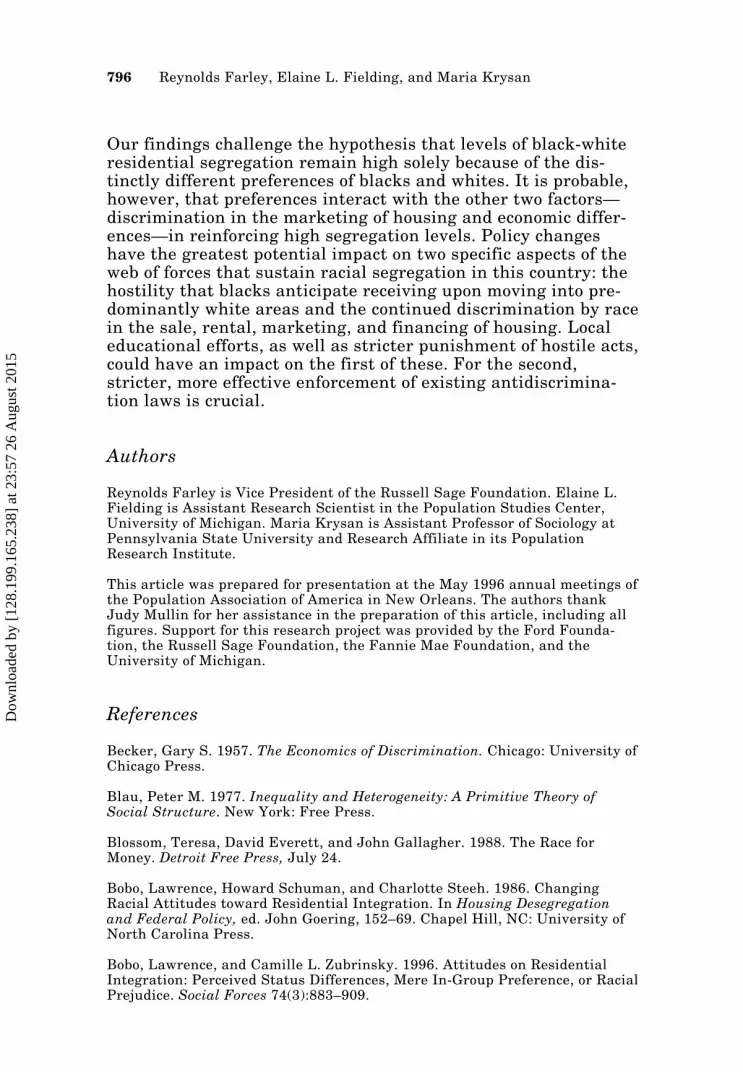
Further evidence of differences in residential segregation amongthe four metropolises can be seen in figure 3, which shows theracial makeup of the block group of residence of the typicalmember of each race. Block groups contain an average of about690 residents. In Detroit, the most segregated of the four sites,blacks live in block groups where, on average, 83 percent of theresidents are black. Atlanta is the next most segregated by thismeasure; blacks there live in neighborhoods that average 69 per-cent black. There is noticeably more residential exposure of
Dow
nloa
ded
by [
128.
199.
165.
238]
at 2
3:57
26
Aug
ust 2
015

The Residential Preferences of Blacks and Whites 775
Fig
ure
3.
Ra
cia
l C
om
po
siti
on
of
Blo
ck G
rou
p o
f T
yp
ica
l R
esid
ent
of
Fo
ur
Met
rop
oli
ses,
199
0
Not
e : T
his
fig
ure
sh
ows
the
r ac i
al c
ompo
siti
on o
f th
e bl
ock
gro
up
of r
esid
ents
of
a r a
ndo
mly
sel
ecte
d pe
rson
of
a de
sign
ated
gro
up.
Th
e u
nde
r ly-
ing
c om
puta
tion
s ar
e of
ten
ref
err e
d to
as
P*
indi
c es
of e
xpos
ure
an
d is
olat
ion
. N
um
bers
in
par
enth
eses
rep
ort
aver
age
popu
lati
on f
or b
loc k
grou
ps i
n t
hat
met
r opo
lis.
�� ������0%
10%
20%
30%
40%
50%
Atl
anta
(82
2)
Bos
ton
(67
4)
Non
-His
pan
ic W
hit
e
Nei
ghb
orh
ood
of
Typ
ical
:
Non
-His
pan
ic B
lack
Non
-His
pan
ic W
hit
e
Non
-His
pan
ic B
lack
Non
-His
pan
ic W
hit
e
Non
-His
pan
ic B
lack
Non
-His
pan
ic W
hit
e
Non
-His
pan
ic B
lack
Det
roit
(58
8)
Los
An
gele
s (6
76)
60%
70%
80%
90%
100%
�N
on-H
isp.
Wh
ite
Non
-His
p. B
lack
Asi
anH
ispa
nic
Am
er. I
ndi
an/O
ther
Dow
nloa
ded
by [
128.
199.
165.
238]
at 2
3:57
26
Aug
ust 2
015
776 Reynolds Farley, Elaine L. Fielding, and Maria Krysan
blacks to whites in Boston and Los Angeles, where fewer thanhalf (about 45 percent) of the residents in the typical blackperson’s neighborhood are also black. Across all four cities,whites tend to be isolated from blacks. In Boston and Detroit,whites live in block groups that are, on average, 92 percentwhite, and the figure for Atlanta is just slightly lower, about80 percent white. The multiethnic character of Los Angeles isreflected by the fact that the typical white lives in a block groupwith a much lower white percentage—65 percent.
With respect to our second and third aims, there is much empiri-cal and theoretical evidence that the racial attitudes of whitesare strongly influenced by two variables: their educationalattainment and their birth cohort. In addition to assessing therole of these and other demographic characteristics in racialpreferences, we will explore whether site differences in racialresidential preferences hold after we control for suchcharacteristics.
With respect to educational attainment, whites who have spentmany years in school typically endorse more egalitarian racialviews than those who have completed just a few years. Presum-ably, our educational system encourages students to think aboutthe nature of racial differences, leading them to reject hypoth-eses that group differences are innate. Indeed, a major emphasisin many educational programs has been the equality of the racesand the virtues of racial and ethnic diversity.
The civil rights revolution marks a key turning point in thenation’s racial history. Before the 1960s, the nation’s leadinginstitutions—schools, federal and local governments, and themilitary—explicitly and emphatically upheld the Jim Crowpolicies that were justified by the Supreme Court’s 1896 Plessyv. Ferguson decision (163 U.S. 537). As a result, a system ofracial stratification with white dominance was widely endorsedand supported by most Americans. This changed as a growingemphasis on equal racial opportunity led to new and differentviews about the nature of race relations. As indicated previously,the modal response of whites in the 1960s to a question aboutresidential integration was that whites had a right to keepblacks out of their neighborhoods and that blacks should respectthat right. By the 1990s, the modal response was that blacksshould not be denied the opportunity to live where they wish onthe basis of their skin color. Older persons, who went throughtheir adolescence and completed their educations when JimCrow practices were the norm, typically give less egalitariananswers to questions about equal racial opportunities than
Dow
nloa
ded
by [
128.
199.
165.
238]
at 2
3:57
26
Aug
ust 2
015

The Residential Preferences of Blacks and Whites 777
younger persons, who came of age during and after the civilrights revolution (Schuman et al. 1997, chap. 4).
This analysis of the residential preferences of whites takes intoaccount the educational attainment of the respondent and his orher age or birth cohort. A smaller number of studies suggestthat, among whites, there are some gender differences in racialattitudes, with women typically endorsing equal opportunitymore than men (Schuman et al. 1997, chap. 4). Thus, we includegender as an explanatory variable. Finally, we consider theeffects of family income (or personal income, for those who livealone) in this analysis.
Less is known about the determinants of blacks’ residentialpreferences. We begin by testing the same five demographicfactors used in the analysis for whites. We expect site to besignificantly associated with blacks’ residential preferences.Based on previous work (Farley et al. 1993), we expect a positiverelationship for blacks between education and preference forintegrated neighborhoods or willingness to enter all-white neigh-borhoods. Blacks may gain more exposure to whites during theeducation process and thus feel more comfortable in exclusivelywhite neighborhoods. Arguments for the effects of age and gen-der parallel those for whites. Blacks with higher family incomesmay have access to a wider spectrum of the housing market thanthose with lower incomes. The perception of more options mayinfluence the residential preferences of these blacks: They maybe more willing to pioneer in an all-white neighborhood.
Finally, we will consider whether the determinants of prefer-ences differ among the four sites, given their different social,economic, and racial compositions and histories.
Source of data: The Multi-City Study of UrbanInequality
This analysis of site differences in residential preferences drawson the Multi-City Study of Urban Inequality (MCSUI), whichinvestigated the beliefs, perceptions, and attitudes of largesamples of adults in Atlanta, Boston, Detroit, and Los Angeles.The survey consisted of a two-stage area probability sample ofadult household residents in each metropolis, with block datafrom the 1990 census used as the sampling frame. In all loca-tions, blacks were oversampled. Interviewing was conducted inthe spring and summer of 1992 in Detroit, in 1993 in Atlanta,and in 1994 in Boston and Los Angeles. Sample sizes are as
Dow
nloa
ded
by [
128.
199.
165.
238]
at 2
3:57
26
Aug
ust 2
015

778 Reynolds Farley, Elaine L. Fielding, and Maria Krysan
follows (all exclude Hispanics): Atlanta—white 641, black 821;Boston—white 585, black 440; Detroit—white 721, black 728;Los Angeles—white 863, black 1,119. Not included in this analy-sis, but appearing in the MCSUI sample, are oversamples ofHispanics in Boston and Los Angeles and Asians in Los Angeles.
Questions assessing racial residential preferences asked in the1976 Detroit Area Study—those involving the manipulation ofcards shown in figures 1 and 2—were repeated at each site in theMCSUI. This analysis is limited to those respondents in theMCSUI who identified themselves as white or black by race,excluding those who went on to identify themselves as Hispanics.
In Boston and Los Angeles, a split-ballot technique was used, inwhich some respondents were asked to rank neighborhoods withblacks or whites while others were asked to consider integrationwith Hispanics or Asians. Because the focus of this article is onblack and white preferences for living with black or white neigh-bors, our sample sizes are reduced from those reported above.(Sample sizes for all variables used in this analysis are reportedin table 2.) Thus, the effective sample sizes for Boston and LosAngeles are much smaller than those for Detroit and Atlanta. Toprevent this from biasing the results, we weighted the cases toproduce equal sample sizes across sites. Additional weights areused in the descriptive analyses. These weights reflect poststrat-ification adjustments to achieve a sample with age, sex, and racedistributions similar to those of the sampled area’s total popula-tion in the 1990 census.
Residential preferences of whites
Our inquiry about the residential preferences of whites repli-cates the 1976 neighborhood cards procedure described earlier.Panel 1 of figure 4 shows the basic site comparisons in the re-sponses of whites to varying degrees of hypothetical residentialintegration. The bottom portion of each bar indicates the per-centage of whites who said they would be comfortable if theirneighborhood came to be majority black. This proportion waslowest in Detroit (35 percent) and highest in Boston (42 percent).Note that in all places, the majority of whites would be uncom-fortable if their neighborhood became majority black. Moving upeach bar, we indicate the proportion of whites who would becomfortable with smaller representations of blacks. The moststriking pattern in figure 4 is that Detroit becomes increasinglydifferent from the other three cities as lower levels of integrationare considered, such that minimal integration is objected to by
Dow
nloa
ded
by [
128.
199.
165.
238]
at 2
3:57
26
Aug
ust 2
015

The Residential Preferences of Blacks and Whites 779
Tab
le 2
. S
am
ple
Siz
es f
or
Stu
dy
of
Res
iden
tia
l P
refe
ren
ces
Wh
ite
Res
pon
den
ts S
how
n B
lack
/Wh
ite
Bla
ck R
espo
nde
nts
Sh
own
Bla
ck/W
hit
eN
eigh
borh
ood
Car
dsN
eigh
borh
ood
Car
ds
Atl
anta
Bos
ton
Det
roit
Los
An
gele
sA
tlan
taB
osto
nD
etro
itL
os A
nge
les
Tot
al s
ampl
e68
328
475
826
181
724
572
535
8
Edu
cati
on
< 1
2 ye
ars
9755
108
2421
763
219
72
12
year
s16
884
242
5727
977
248
119
1
3 to
15
year
s19
455
231
8718
067
194
118
1
6 ye
ars
133
5497
6084
2234
42
> 1
6 ye
ars
8736
7833
4913
247
N
ot r
epor
ted
40
20
83
60
Age
U
nde
r 25
5319
3217
5622
4829
2
5 to
34
151
7118
749
226
6014
889
3
5 to
44
162
5919
163
197
7518
990
4
5 to
54
105
4011
340
129
3692
61
55
to 6
468
3477
4591
1973
41
65
and
over
131
6115
647
106
3317
048
N
ot r
epor
ted
130
20
120
50
Gen
der
M
ale
303
131
353
127
256
8525
612
1
Fem
ale
379
153
425
134
560
160
469
237
N
ot r
epor
ted
10
00
10
00
Dow
nloa
ded
by [
128.
199.
165.
238]
at 2
3:57
26
Aug
ust 2
015

780 Reynolds Farley, Elaine L. Fielding, and Maria Krysan
Tab
le 2
. S
am
ple
Siz
es f
or
Stu
dy
of
Res
iden
tia
l P
refe
ren
ces
(con
tin
ued
)
Wh
ite
Res
pon
den
ts S
how
n B
lack
/Wh
ite
Bla
ck R
espo
nde
nts
Sh
own
Bla
ck/W
hit
eN
eigh
borh
ood
Car
dsN
eigh
borh
ood
Car
ds
Atl
anta
Bos
ton
Det
roit
Los
An
gele
sA
tlan
taB
osto
nD
etro
itL
os A
nge
les
An
nu
al f
amil
y in
com
e
Un
der
$20,
000
142
9814
360
325
117
314
184
$
20,0
00 t
o $3
9,99
917
268
218
6919
666
138
74
$40
,000
to
$59,
999
116
4816
553
6031
6632
$
60,0
00 t
o $7
9,99
963
2486
1723
1021
13
$80
,000
or
mor
e58
2675
3215
616
14
Not
rep
orte
d13
220
7130
198
1517
041
Dow
nloa
ded
by [
128.
199.
165.
238]
at 2
3:57
26
Aug
ust 2
015

The Residential Preferences of Blacks and Whites 781
Fig
ure
4.
Co
mfo
rt o
f W
hit
es I
f T
hei
r N
eig
hb
orh
oo
ds
Ca
me
to H
av
e In
dic
ate
d D
ensi
ties
of
Bla
ck R
esid
ents
100 90 80 70 60 50 40 30 20 10 0
Sit
e*E
duca
tion
*A
ge*
Gen
der
Fam
ily
Inco
me*
Atlanta Bosto
n Detroit
Los Angeles < 12 Years 12 Years
13–15 Years 16 Years > 16 YearsUnder 2
5 25–34
45–54
35–44
55–6465 and Over
< $20,000
$20,000–$39,999$60,000–$79,999
$40,000–$59,999$80,000 or M
ore
Men Women
Com
fort
able
in m
ajor
ity
blac
k n
eigh
borh
ood
Com
fort
able
in 2
0% t
o 32
% b
lack
nei
ghbo
rhoo
d
Com
fort
able
in 8
% t
o 19
% b
lack
nei
ghbo
rhoo
d
Com
fort
able
in 3
3% t
o 52
% b
lack
nei
ghbo
rhoo
d
Un
com
fort
able
if 7
% o
f re
side
nts
are
bla
ck
Percent
*χ2
test
in
dic a
tes
this
var
iabl
e is
sig
nif
ican
tly
lin
ked
to
c om
for t
of
wh
ites
wit
h i
nte
grat
ion
.
Dow
nloa
ded
by [
128.
199.
165.
238]
at 2
3:57
26
Aug
ust 2
015

782 Reynolds Farley, Elaine L. Fielding, and Maria Krysan
twice as many whites in Detroit as in the other three sites. InDetroit, 16 percent of whites would be uncomfortable in a neigh-borhood with one black family, compared with 7 percent in bothAtlanta and Los Angeles and 4 percent in Boston. Thus, relianceon findings in Detroit alone yields more opposition to integrationamong whites than is the case in Atlanta, Boston, and LosAngeles.
Turning to the next two panels in figure 4, we observe the ex-pected effects of education and age on the residential preferencesof whites. That is, as years spent in school increased, whiteswere more comfortable with higher levels of residential integra-tion. Only 5 percent of whites with more than 16 years ofschooling reported they would be uncomfortable when the firstblack family entered their neighborhood, whereas among thosewith less than a complete high school education, 16 percentwould be uncomfortable. Thus, the continuing secular trendtoward greater educational attainment implies a continuedliberalization of the racial attitudes of whites and a growingacceptance of residential integration.
As expected, age of white respondents was also linked to comfortwith residence in an integrated neighborhood. Only 22 percent ofpersons ages 65 and over would be comfortable if their ownneighborhood came to be majority black, but nearly half (46 per-cent) of all those under age 45 would be comfortable in such aneighborhood.
Differences in comfort with integration by family income werestatistically significant but cannot readily be summarized.Whites in the two highest income categories (over $60,000 peryear) are less likely to report discomfort with neighborhoodsgaining their first black families. With respect to gender, there isan interesting pattern: Whereas men are more comfortable thanwomen in a majority-black neighborhood, men are also morelikely to report discomfort in a neighborhood with only 7 percentblack residents. The finding that women report more discomfortwith majority-black neighborhoods is consistent with the conclu-sions of Schuman et al. (1997, chap. 4) that women, while gener-ally more liberal than men on racial attitudes pertaining toegalitarian treatment, were less liberal on questions of socialdistance, such as integrated schools and racial intermarriage.
A residential preference index for whites
To draw on the full array of questions posed to whites abouttheir preferences, we computed a residential preference index
Dow
nloa
ded
by [
128.
199.
165.
238]
at 2
3:57
26
Aug
ust 2
015

The Residential Preferences of Blacks and Whites 783
(RPI). This index incorporates the entire series of questionsfocusing on the neighborhood preference cards (figure 1), includ-ing assessments of levels of comfort with and willingness to moveinto racially mixed areas, as well as views on moving out of aneighborhood with a particular racial composition. Respondents’scores on this index depended on their reactions to the fourdifferent integrated neighborhoods (scenarios 2 through 5 infigure 1). For example, respondents who said they would be verycomfortable living in a neighborhood with a particular percent-age of blacks got a score of 25 points for that neighborhood.Respondents who chose the “somewhat comfortable” responsereceived a score of 20 points for that neighborhood. Whiterespondents who would be uncomfortable in a neighborhood butwould consider moving into an attractive, affordable home lo-cated there were given a score of 12.5 points for that neighbor-hood. Finally, there are many whites who reported they would beuncomfortable in an integrated neighborhood and would notconsider moving there. They were given a score of 0 for thatarea. We assumed that a white person who would be uncomfort-able with one black neighbor and would not move into such aminimally integrated area also would not tolerate a higherdensity of blacks, and thus assigned scores for more integratedareas accordingly. Scores for the four scenarios, computed in thismanner, were then summed. The RPI ranges from a low of 0,indicating an unwillingness to live with blacks, to a maximum of100, indicating an acceptance of majority-black areas and awillingness to move there (Zubrinsky and Bobo 1996). Over thewhole white sample, this index has a mean value of 65 with astandard deviation of 30.
Figure 5 presents average values for the RPI for whites in thefour sites (first panel) and for each category of the independentvariables. Again, Detroit stands out. Whites in Detroit hadsignificantly lower scores, indicating a lower level of acceptanceof residential integration. The average RPI for metropolitanDetroit whites is 59, compared with 66 to 68 for those in theother three cities.
The results for the other characteristics parallel those previouslyidentified in the comfort analysis. That is, education and agewere strongly linked to this index, with increased schoolingresulting in a greater acceptance of racial integration and in-creased age associated with lower index scores. Scores rangedfrom 73 for those with more than 16 years of education to 54 forthose not achieving 12 years, and from about 70 for the youngestthree age groups (under 45) to 50 for those ages 65 and over.Gender did not have a significant relationship to the residential
Dow
nloa
ded
by [
128.
199.
165.
238]
at 2
3:57
26
Aug
ust 2
015

784 Reynolds Farley, Elaine L. Fielding, and Maria Krysan
Fig
ure
5.
Res
iden
tia
l P
refe
ren
ce I
nd
ex f
or
Wh
ite
Res
po
nd
ents
*An
alys
is o
f va
r ian
ce t
est
indi
c ate
s th
is v
aria
ble
is r
elat
ed t
o r e
side
nti
al p
r efe
r en
ce i
nde
x at
0.0
1 le
vel.
100 90 80 70 60 50 40 30 20 10 0
Sit
e*E
duca
tion
*A
ge*
Gen
der
Fam
ily
Inco
me*
Atlanta Bosto
n Detroit
Los Angeles < 12 Years 12 Years
13–15 Years 16 Years > 16 YearsUnder 2
5 25–34
45–54
35–44
55–6465 and Over
< $20,000
$20,000–$39,999$60,000–$79,999
$40,000–$59,999$80,000 or M
ore
Men Women
Res
iden
tial
Pre
fere
nce
Inde
x fo
r To
tal
Sam
ple
of W
hite
s
Dow
nloa
ded
by [
128.
199.
165.
238]
at 2
3:57
26
Aug
ust 2
015

The Residential Preferences of Blacks and Whites 785
preferences of whites, though this lack could be due to the differ-ences at the two extremes of integration, which were apparent infigure 4. Income was significantly linked to RPI as before, withwhites in the two highest income categories being more accept-ing of residential integration.
Next, we determined whether site had an independent effectupon the residential preferences of whites, after controlling forsite differences in these demographic characteristics. That is, astable 1 indicates, Detroit-area whites were less educated andsomewhat older than whites in the other locations. We testedwhether the effect of site—and the uniqueness of Detroit—woulddisappear if we controlled for the impact of demographic charac-teristics on RPI. Table 3 reports parameters from ordinary leastsquares (OLS) regression equations in which a white respon-dent’s RPI score is regressed on the five independent variables,with each treated as a series of dichotomous variables.
The results in table 3 imply that site has a strong independenteffect and that whites in Atlanta, Boston, and Los Angeles aremore accepting of residential integration than whites in Detroit,even after controlling for demographic differences. Whites in theother three sites have residential preference scores 6 to 9 pointshigher than in Detroit. Beyond site, the two most importanteffects on whites’ attitudes come from education and age. Forthese two variables, multivariate results are similar to bivariateresults: Those with higher educational attainment and those whoare young have the highest predicted RPI scores. For example,predicted RPI scores are 14 to 17 points lower for those 55 yearsof age or over than for those under 25. Income has a negativeeffect in the multivariate analysis, suggesting that the positiverelationship observed at the bivariate level was primarily due tothe correlation between education and income.
The four right-hand columns of table 2 display the regression onRPI for each site separately. The relationships between demo-graphic characteristics and RPI are quite similar across the foursites. Results for Atlanta, Boston, and Detroit mirror thoseshown in the first column for the total sample. The educationeffect is particularly strong for Detroit; whites with more than16 years of schooling have predicted RPI scores 21 points higherthan those with the least education. The age effect is especiallystrong in Boston and Detroit, with those over age 54 havingscores from 16 to 28 points lower than those under age 25.
Dow
nloa
ded
by [
128.
199.
165.
238]
at 2
3:57
26
Aug
ust 2
015

786 Reynolds Farley, Elaine L. Fielding, and Maria Krysan
Table 3. Determinants of Residential Preference Index for Whites(OLS Regression Models)a
Total LosSample Atlanta Boston Detroit Angeles
Intercept 67.4 67.3 83.6 72.1 86.6
Site Atlanta 6.3b,c
Boston 9.3b
Los Angeles 9.0b
Educational attainment 12 years –1.3c 1.6c –4.9c 2.7c –18.8 13 to 15 years 0.9 0.8 –0.2 4.3 –12.8 16 years 7.6b 13.0b 9.3 6.7 –10.1 > 16 years 12.6b 12.8b 15.0 20.9b –16.8
Age 25 to 34 –2.1c –3.9 –5.8c –7.9c 8.2 35 to 44 –2.8 –1.6 –3.7 –10.1 3.4 45 to 54 –6.1 –0.9 –12.7 –14.7 –2.1 55 to 64 –14.1b –9.1 –16.2 –23.8b –7.2 65 and over –17.2b –6.8 –28.2b –27.0b –11.0
Gender Female 3.1 1.8 3.9 5.3 –1.8
Family income $20,000 to $39,999 –4.2 –0.2 –8.2 –5.6 –3.0 $40,000 to $59,999 –6.7b +2.7 –13.2b –8.1 –3.0 $60,000 to $79,999 –7.4b –1.4 –11.7 –12.8b 1.7 $80,000 or more –7.1 –9.9 –2.4 –7.5 –5.8
Adjusted R2 0.08 0.03 0.14 0.07 0.03
Dependent variable Mean 65.4 67.8 70.6 60.0 70.0 s 31.0 28.4 29.1 33.4 29.2 Sample size 1,700 532 261 677 230
a Omitted categories for the independent variables are Detroit for site, < 12 years foreducational attainment, under 25 for age, male for gender, and under $20,000 for familyincome.b This particular regression coefficient is significant at 0.01 level.c F test indicates this variable is significant at 0.01 level.
Residential preferences of blacks
One of the major advantages of the MCSUI data set is the largesample size for blacks. The richness of the MCSUI data set alsoallows many different perspectives on the residential preferencesof blacks. In this article, we discuss three aspects: the racial
Dow
nloa
ded
by [
128.
199.
165.
238]
at 2
3:57
26
Aug
ust 2
015

The Residential Preferences of Blacks and Whites 787
composition of the neighborhoods that black respondents foundmost attractive, the average number of whites in their two mostpreferred neighborhoods, and the willingness of blacks to moveinto all-white neighborhoods. We test hypotheses about the samefive demographic factors used in the analysis of whites.
Blacks were presented with the cards shown in figure 2 andasked to rank those neighborhoods in terms of their personalpreferences, ordering them from most attractive to leastattractive as places to live. Blacks were highly likely to preferintegrated environments but ones with substantial black repre-sentation. More than half the blacks in the sample (57 percent)chose scenario 3 (7 black and 7 white households before theymoved in) as the most attractive neighborhood, indicating thegreat popularity of 50-50 neighborhoods to blacks. The next mostpopular neighborhood, chosen by 19 percent, was scenario 2(10 black and 4 white households before they entered). Followingthat, 16 percent ranked the all-black neighborhood first inattractiveness. The two neighborhoods dominated by whites(scenarios 4 and 5, containing 2 and no black households, respec-tively) were not highly preferred by blacks; just 8 percent choseone of these two as most attractive.
These conclusions about the distribution of black respondents bymost preferred neighborhood are generally applicable acrosscategories of site, education, age, gender, and family income (seefigure 6). All variables are significantly associated with theneighborhood preferences of blacks, according to �2 tests. Resultsfor Atlanta are distinctive; nearly one-quarter of Atlanta blacksranked the all-black neighborhood as most attractive, and veryfew put the cards showing white-dominated neighborhoodstoward the top of their preferences. Boston is distinctive in theother direction, with only 9 percent preferring the all-blackneighborhood. In Boston and Los Angeles, relatively more blacksindicated a strong preference for living in the two predominantlyor exclusively white neighborhoods. These site results are consis-tent with the population compositions of these metropolises;Atlanta has the highest proportion of blacks, and Los Angelesand especially Boston have relatively low proportions of blacks.
Education is negatively associated with preferring all-blackneighborhoods and positively associated with preferring theequally split neighborhood (7 black and 7 white households).For example, preference for all-black neighborhoods is especiallystrong among blacks with less than 12 years of education(25 percent) and especially weak among those with graduateeducation (6 percent). Among blacks, age is not systematically
Dow
nloa
ded
by [
128.
199.
165.
238]
at 2
3:57
26
Aug
ust 2
015

788 Reynolds Farley, Elaine L. Fielding, and Maria Krysan
Fig
ure
6.
Dis
trib
uti
on
of
Bla
cks
by
Ra
cia
l C
om
po
siti
on
of
Mo
st P
refe
rred
Nei
gh
bo
rho
od
*χ2
test
in
dic a
tes
this
var
iabl
e is
sig
nif
ican
tly
lin
ked
to
mos
t pr
efer
r ed
nei
ghbo
rhoo
d at
0.0
1 le
vel.
100 90 80 70 60 50 40 30 20 10 0
Sit
e*E
duca
tion
*A
ge*
Gen
der*
Fam
ily
Inco
me*
Atlanta Bosto
n Detroit
Los Angeles < 12 Years 12 Years
16 Years
13–15 Years> 16 YearsUnder 2
5 25–34
45–54
35–44
55–6465 and Over
< $20,000
$20,000–$39,999$60,000–$79,999
$40,000–$59,999$80,000 or M
ore
Men Women
All
Bla
ck
7 B
lack
s, 7
Wh
ites
2 B
lack
s, 1
2 W
hit
es
10 B
lack
s, 4
Wh
ites
All
Wh
ite
Percent
Dow
nloa
ded
by [
128.
199.
165.
238]
at 2
3:57
26
Aug
ust 2
015

The Residential Preferences of Blacks and Whites 789
related to residential preferences, but the effects of incomeparallel those for education in the sense that the two extremecategories are distinctive. Nearly half (45 percent) of the blackswith very low incomes (less than $20,000 per year) show strongpreferences for the neighborhoods with the most black families,and among those with the highest incomes, a disproportionatepercentage (26 percent) prefer the neighborhoods with the mostwhite families.
We next computed an indicator of blacks’ preference for inte-grated neighborhoods based on the neighborhoods that blackrespondents found most attractive. This indicator is simply theaverage of the number of whites in the most attractive neighbor-hood and the number in the second most attractive. It rangesfrom 2 for blacks who preferred to live in the neighborhoods withthe most blacks to 13 for those preferring the neighborhoodswith the most whites (figure 7). Results in figure 7 confirm thosefrom the previous figure in that blacks show a preference forliving in integrated neighborhoods; on average, black respon-dents would like to live in neighborhoods more than one-thirdwhite (the average over the whole sample is 5.7 out of 15). Thenumber of whites in blacks’ preferred neighborhoods was partic-ularly low in Atlanta (average 5.1) but high in Boston (average6.4). Again, this finding parallels the differences among theareas in racial composition.
Results of an OLS regression on this indicator mirror thebivariate results (data not shown). The strongest effect in themultivariate model is the negative one for Atlanta. Statisticallysignificant effects also emerge for two income categories. Asdisplayed in figure 7, blacks with moderate incomes ($20,000to $40,000 per year) and those with very high incomes (over$80,000) preferred neighborhoods with greater whiterepresentation.
Given the high levels of residential segregation in the MCSUIsites and the aversion many whites have to entering black orracially mixed neighborhoods, desegregation will occur only ifblacks enter largely white neighborhoods. Are blacks willing todo so? A major focus in the residential segregation literature hasbeen on those blacks who are or are not willing to pioneer in all-white areas. Recall that after black respondents ranked the fivecards, we returned the cards to them and asked whether therewere any neighborhoods they would not consider moving into. Ifthey said yes, we asked them which ones they would not enter.From these responses, we constructed a dichotomous variable
Dow
nloa
ded
by [
128.
199.
165.
238]
at 2
3:57
26
Aug
ust 2
015

790 Reynolds Farley, Elaine L. Fielding, and Maria Krysan
Fig
ure
7.
Av
era
ge
Nu
mb
er o
f W
hit
e R
esid
ents
in
Tw
o M
ost
Pre
ferr
ed N
eig
hb
orh
oo
ds
of
Bla
ck R
esp
on
den
ts
Not
e : T
his
mea
sure
of
r esi
den
tial
pr e
fer e
nce
s r a
nge
s fr
om a
low
of
2.0
for
blac
ks
wh
o pr
efer
r ed
to l
ive
in t
he
hig
hes
t-de
nsi
ty b
lac k
nei
ghbo
r -h
oods
to
13.0
for
th
ose
pref
err i
ng
the
hig
hes
t-de
nsi
ty w
hit
e n
eigh
borh
oods
.*A
nal
ysis
of
var i
ance
tes
t in
dic a
tes
this
var
iabl
e is
rel
ated
to
nu
mbe
r of
wh
ites
in
tw
o m
ost
pref
err e
d n
eigh
borh
oods
at
0.01
lev
el.
13 12 11 10 9 8 7 6 5 4 3 2
Sit
e*E
duca
tion
*A
ge*
Gen
der
Ove
rall
Mea
n
Fam
ily
Inco
me*
Atlanta Bosto
n Detroit
Los Angeles < 12 Years 12 Years
13–15 Years 16 Years > 16 YearsUnder 2
5 25–34
45–54
35–44
55–6465 and Over
< $20,000
$20,000–$39,999$60,000–$79,999
$40,000–$59,999 $80,000 or More
Men Women
Dow
nloa
ded
by [
128.
199.
165.
238]
at 2
3:57
26
Aug
ust 2
015

The Residential Preferences of Blacks and Whites 791
indicating whether they would be willing to move into an all-white neighborhood in which they had found an attractive,affordable home.
Overall, 35 percent of the black sample were willing to move intoan all-white neighborhood, meaning that almost two-thirdswould not pioneer. Bivariate and multivariate results for thisvariable are similar; thus, we show only the results of the logis-tic regression on willingness to pioneer. Displayed in figure 8 arethe net relative odds of willingness to pioneer for each categoryof the independent variables (with omitted categories as in table3). Site was the most important predictor of blacks’ willingnessto pioneer. For example, after controlling for education, age,gender, and income, we found blacks in Boston and Los Angeleswere about 1.4 times as likely to be willing to move into an all-white neighborhood as blacks in Detroit. Atlanta blacks appearto be extraordinarily willing to pioneer, but this effect may havebeen biased upward by a methodological artifact.1 None of theother variables in this model were significant, yet older blacks(especially those over 65) were more likely to report a willing-ness to pioneer.
Conclusion and summary
Race continues to be significant in the residential decision-making process. If this were a color-blind society and if race hadno salience, blacks would more or less randomly rank the neigh-borhood cards we presented, and thus about as many would put
1Willingness to pioneer in an all-white neighborhood was assessed in twosteps. The first was a filter question, in which black respondents were asked tolook at all five neighborhood cards and indicate whether there were anyneighborhoods they would not consider moving into. If respondents answeredno to this question, it implied that there were no neighborhoods they would beunwilling to move into. They were thus considered willing to pioneer. Ifrespondents answered yes to this question, they were then asked to identifywhich neighborhoods they would be unwilling to move into. When presentedwith the all-white neighborhood card for this second question, if respondentsanswered no, they were also considered willing to pioneer. This two-stepprocess—and somewhat indirect assessment of willingness to pioneer—createsthe possibility that the interviewer will affect the answer by wanting to rushthrough the interview. Closer inspection of the Atlanta responses by inter-viewer identified two Atlanta interviewers who were unusually likely to elicita “no” response to the filter question. Specifically, “no” responses were elicitedby these two interviewers in 85 percent of their interviews; the average for allother interviewers was closer to 34 percent. Moreover, taken together, thesetwo interviewers conducted nearly one-fifth of the Atlanta interviews. Thus,we are cautious about making substantive interpretations about the Atlantaanomaly, given this strong evidence that it may be a methodological artifact.
Dow
nloa
ded
by [
128.
199.
165.
238]
at 2
3:57
26
Aug
ust 2
015

792 Reynolds Farley, Elaine L. Fielding, and Maria Krysan
Fig
ure
8.
Net
Rel
ati
ve
Od
ds
of
Wil
lin
gn
ess
of
Bla
cks
to P
ion
eer
in a
n A
ll-W
hit
e N
eig
hb
orh
oo
d
2.80
2.60
2.40
2.20
2.00
1.80
1.60
1.40
1.20
1.00
0.80
0.60
0.40
Sit
e*E
duca
tion
Age
Gen
der
Bas
elin
e
Fam
ily
Inco
me
Atlanta Bosto
n Detroit
Los Angeles < 12 Years 12 Years
13–15 Years 16 Years > 16 YearsUnder 2
5 25–34
45–54
35–44
55–6465 and Over
< $20,000
$20,000–$39,999$60,000–$79,999
$40,000–$59,999 $80,000 or More
Men Women
Bas
elin
e C
ateg
orie
s:S
ite:
E
duca
tion
: A
ge:
Gen
der:
In
com
e:
Det
roit
< 12
Yea
rs<
25
Mal
e<
$20,
000
*χ2
test
com
par i
ng
logi
stic
mod
els
indi
c ate
s th
is v
aria
ble
is s
ign
ific
ant
at 0
.01
leve
l.
Dow
nloa
ded
by [
128.
199.
165.
238]
at 2
3:57
26
Aug
ust 2
015

The Residential Preferences of Blacks and Whites 793
the all-white neighborhood at the top as would put the all-blackneighborhood there. And the proportion of whites who reporteddiscomfort would not steadily increase with a rising density ofblack neighbors. These MCSUI results indicate that race isimportant when neighborhoods are chosen, although this impor-tance varies in degree from one metropolis to another.
There are significant site differences in the racial residentialpreferences of blacks and whites. We conclude that it is notappropriate to generalize to the entire United States from the1976 and 1992 Detroit Area Studies. Site was consistently thestrongest predictor of residential preferences, and the Detroitresults were the most distinctive. After controlling for theirdemographic characteristics, whites in metropolitan Detroit havean unusually strong preference for white neighborhoods and anunusual reluctance to move into racially integrated neighbor-hoods. Blacks in Detroit displayed less willingness to move intoexclusively white neighborhoods. The Detroit metropolis has along history of extreme segregation, and suburban whites therehave a reputation for hostility toward the entry of blacks. Thus,Detroit provides a potentially strong example of the hypothesisthat high levels of segregation, prejudice, and discrimination,and the residential preferences of blacks and whites, are allparts of a mutually reinforcing system. Prospects for residentialintegration may be much dimmer in Detroit than in the othersites.
Another notable site difference was the preference among blacksin Atlanta for all-black or majority-black neighborhoods. Whilethis reflects in part the higher black proportion in Atlanta (com-pared with the other three metropolises), it also reflects theperceived availability of affluent black neighborhoods, as well asthe long-established concentrations of blacks in the suburbanring. Findings for Boston and Los Angeles were also consistentwith the demographic compositions of those metropolises. Forexample, blacks in Boston preferred living in neighborhoods withmore whites than blacks in the other three areas did, reflectingthe relatively small black population in the Boston area.
Educational attainment and age are related to the neighborhoodpreferences of whites but not to those of blacks. The secular trendtoward a liberalization of whites’ racial attitudes is encouraged,we believe, by the continuing rise in educational attainment andby the cohort replacement process, and this leads to the differ-ences in preferences we describe. While younger whites are morewilling to live in racially mixed neighborhoods than older whites,there is no evidence that younger blacks have a greater prefer-ence for residential integration than older blacks. Indeed, it is
Dow
nloa
ded
by [
128.
199.
165.
238]
at 2
3:57
26
Aug
ust 2
015

794 Reynolds Farley, Elaine L. Fielding, and Maria Krysan
the oldest blacks who were most willing to pioneer in whiteneighborhoods.
The racial residential preferences of blacks and whites overlapconsiderably, offering some hope for an eventual decline in segre-gation. Black respondents in all sites favored living in raciallymixed neighborhoods, strongly preferring them to either all-black or all-white neighborhoods. In addition, more than one-third of the blacks were willing to be the first black family tomove into an exclusively white neighborhood with attractive,affordable housing. As demonstrated by Schelling (1971) andconfirmed by Fielding (1997), the tolerance of the numericallysmaller group for living with members of the larger group iscrucial to whether integration is possible or likely. The findingsfrom this analysis as well as that of Fielding (1997) suggest thatthe majority of blacks would be comfortable living in and arewilling to move into neighborhoods much more racially inte-grated than those now found in these metropolises. (For anotheranalysis of how the relative size of two groups influences theirsocial interaction and inequality, see Blau 1977.)
As noted by Bobo and Zubrinsky (1996), studies of racialattitudes often report high levels of tolerance for residentialintegration among whites, levels that are inconsistent with theextensive segregation indicated by census data. This analysis isno exception. For example, more than four-fifths of whites inAtlanta, Boston, and Los Angeles and more than two-thirds ofthose in Detroit would be comfortable in a neighborhood thatwas 20 percent black. In the nation as a whole, only 13 percentof the metropolitan population was black in 1990 (U.S. Bureau ofthe Census 1992, table 3), and the highest percentage of blacksin the sampled sites was 26 percent in Atlanta. Therefore, ourresults for whites imply that if blacks and whites were evenlydistributed in most U.S. metropolitan areas, the majority ofwhites would be comfortable with the racial composition of theirneighborhood. Perhaps the most extreme test of whites’ willing-ness to accept residential integration involves moving into amajority-black neighborhood. Approximately one-third of thewhite respondents said they would be willing to do so if theyfound an attractive, affordable home there (see figure 9). Twospecific aspects of the results shown in figure 9 are worth noting.Whites with higher educational levels and those who are youngare more accepting of integrated environments. Thus, as older,less educated cohorts are replaced, the distribution of prefer-ences may change over time.
Dow
nloa
ded
by [
128.
199.
165.
238]
at 2
3:57
26
Aug
ust 2
015

The Residential Preferences of Blacks and Whites 795
*χ2
test
in
dic a
tes
this
var
iabl
e is
sig
nif
ican
tly
lin
ked
to
wil
lin
gnes
s to
en
ter
an e
igh
t bl
ack
an
d si
x w
hit
e n
eigh
borh
ood
at 0
.01
leve
l.
100 90 80 70 60 50 40 30 20 10 0
Sit
e*E
duca
tion
*A
ge*
Gen
der*
Fam
ily
Inco
me
Atlanta Bosto
n Detroit
Los Angeles < 12 Years 12 Years
16 Years
13–15 Years> 16 YearsUnder 2
5 25–34
45–54
35–44
55–6465 and Over
< $20,000
$20,000–$39,999$60,000–$79,999
$40,000–$59,999$80,000 or M
ore
Men Women
Ove
rall
:31
Per
cent
Percent
Fig
ure
9.
Per
cen
t o
f W
hit
es W
illi
ng
to
En
ter
a N
eig
hb
orh
oo
d w
ith
Eig
ht
Bla
ck a
nd
Six
Wh
ite
Fa
mil
ies
Dow
nloa
ded
by [
128.
199.
165.
238]
at 2
3:57
26
Aug
ust 2
015
796 Reynolds Farley, Elaine L. Fielding, and Maria Krysan
Our findings challenge the hypothesis that levels of black-whiteresidential segregation remain high solely because of the dis-tinctly different preferences of blacks and whites. It is probable,however, that preferences interact with the other two factors—discrimination in the marketing of housing and economic differ-ences—in reinforcing high segregation levels. Policy changeshave the greatest potential impact on two specific aspects of theweb of forces that sustain racial segregation in this country: thehostility that blacks anticipate receiving upon moving into pre-dominantly white areas and the continued discrimination by racein the sale, rental, marketing, and financing of housing. Localeducational efforts, as well as stricter punishment of hostile acts,could have an impact on the first of these. For the second,stricter, more effective enforcement of existing antidiscrimina-tion laws is crucial.
Authors
Reynolds Farley is Vice President of the Russell Sage Foundation. Elaine L.Fielding is Assistant Research Scientist in the Population Studies Center,University of Michigan. Maria Krysan is Assistant Professor of Sociology atPennsylvania State University and Research Affiliate in its PopulationResearch Institute.
This article was prepared for presentation at the May 1996 annual meetings ofthe Population Association of America in New Orleans. The authors thankJudy Mullin for her assistance in the preparation of this article, including allfigures. Support for this research project was provided by the Ford Founda-tion, the Russell Sage Foundation, the Fannie Mae Foundation, and theUniversity of Michigan.
References
Becker, Gary S. 1957. The Economics of Discrimination. Chicago: University ofChicago Press.
Blau, Peter M. 1977. Inequality and Heterogeneity: A Primitive Theory ofSocial Structure. New York: Free Press.
Blossom, Teresa, David Everett, and John Gallagher. 1988. The Race forMoney. Detroit Free Press, July 24.
Bobo, Lawrence, Howard Schuman, and Charlotte Steeh. 1986. ChangingRacial Attitudes toward Residential Integration. In Housing Desegregationand Federal Policy, ed. John Goering, 152–69. Chapel Hill, NC: University ofNorth Carolina Press.
Bobo, Lawrence, and Camille L. Zubrinsky. 1996. Attitudes on ResidentialIntegration: Perceived Status Differences, Mere In-Group Preference, or RacialPrejudice. Social Forces 74(3):883–909.
Dow
nloa
ded
by [
128.
199.
165.
238]
at 2
3:57
26
Aug
ust 2
015

The Residential Preferences of Blacks and Whites 797
Campen, James T. 1992. The Struggle for Community Investment in Boston,1989–1991. In From Redlining to Reinvestment: Community Responses toUrban Disinvestment, ed. Gregory D. Squires, 38–72. Philadelphia: TempleUniversity Press.
Carr, James H., and Isaac F. Megbolugbe. 1993. The Federal Reserve Bank ofBoston Study on Mortgage Lending Revisited. Journal of Housing Research4(2):277–313.
Clark, William A. V. 1986. Residential Segregation in American Cities: AReview and Interpretation. Population Research and Policy Review 5:95–127.
Clark, William A. V. 1988. Understanding Residential Segregation in Ameri-can Cities: Interpreting the Evidence, a Reply to Galster. Population Researchand Policy Review 7:113–21.
Clark, William A. V. 1989. Residential Segregation in American Cities:Common Ground and Differences in Interpretation. Population Research andPolicy Review 8:193–97.
Clark, William A. V. 1992. Residential Preferences and Residential Choices ina Multiethnic Context. Demography 29(3):451–66.
Cutler, David M., and Edward L. Glaeser. 1997. Are Ghettos Good or Bad?Quarterly Journal of Economics (August):827–72.
Darden, Joe T., Richard Child Hill, June Thomas, and Richard Thomas. 1987.Detroit: Race and Uneven Development. Philadelphia: Temple UniversityPress.
Dedman, William. 1988. The Color of Money. Atlanta Journal-Constitution,May 1–4.
Denton, Nancy A., and Douglas S. Massey. 1988. Residential Segregation ofBlacks, Hispanics, and Asians by Socioeconomic Status and Generation. SocialScience Quarterly 69:797–818.
Erbe, Brigitte Mach. 1975. Race and Socioeconomic Segregation. AmericanSociological Review 40 (December):801–12.
Everett, David. 1992. Confrontation, Negotiation, and Collaboration: Detroit’sMultibillion-Dollar Deal. In From Redlining to Reinvestment: CommunityResponses to Urban Disinvestment, ed. Gregory D. Squires, 109–32. Philadel-phia: Temple University Press.
Farley, Reynolds. 1977. Residential Segregation in Urbanized Areas of theUnited States in 1970: An Analysis of Social Class and Racial Differences.Demography 14 (November):497–518.
Farley, Reynolds. 1993. Neighborhood Preferences and Aspirations amongBlacks and Whites. In Housing Markets and Residential Mobility, ed.G. Thomas Kingsley and Margery Austin Turner, 161–91. Washington, DC:Urban Institute Press.
Farley, Reynolds, and William H. Frey. 1994. Changes in the Segregation ofWhites from Blacks during the 1980s: Small Steps toward a More RaciallyIntegrated Society. American Sociological Review 59:1–23.
Dow
nloa
ded
by [
128.
199.
165.
238]
at 2
3:57
26
Aug
ust 2
015

798 Reynolds Farley, Elaine L. Fielding, and Maria Krysan
Farley, Reynolds, Howard Schuman, Suzanne Bianchi, Diane Colasanto, andShirley Hatchett. 1978. Chocolate City, Vanilla Suburbs: Will the Trendtoward Racially Separate Communities Continue? Social Science Re-search 7:319–44.
Farley, Reynolds, Charlotte Steeh, Tara Jackson, Maria Krysan, and KeithReeves. 1993. Continued Racial Residential Segregation in Detroit: “ChocolateCity, Vanilla Suburbs” Revisited. Journal of Housing Research 4(1):1–38.
Farley, Reynolds, Charlotte Steeh, Maria Krysan, Tara Jackson, and KeithReeves. 1994. Stereotypes and Segregation: Neighborhoods in the DetroitArea. American Journal of Sociology 100(3):750–80.
Feins, Judith D., and Rachel G. Bratt. 1983. Barred in Boston: Racial Dis-crimination in Housing. Journal of the American Planning Association43(3):344–55.
Fielding, Elaine L. 1997. How Low Can It Go? Applying Survey Data toSchelling’s Model of Segregation. Paper presented at the annual meetings ofthe Population Association of America, March, Washington, DC.
Fielding, Elaine, and Karl Taeuber. 1992. Spatial Isolation of a BlackUnderclass: An American Case Study. New Community 19(1):113–27.
Galster, George C., and W. Mark Keeney. 1988. Race, Residence, Discrimina-tion, and Economic Opportunity: Modeling the Nexus of Urban Racial Phenom-ena. Urban Affairs Quarterly 24:87–117.
Goering, John, and Ron Wienk. 1996. Mortgage Lending, Racial Discrimina-tion, and Federal Policy. Washington, DC: Urban Institute Press.
Grigsby, J. Eugene. 1994. African American Mobility and Residential Qualityin Los Angeles. In Residential Apartheid: The American Legacy, ed. Robert D.Bullard, J. Eugene Grigsby, and Charles Lee, 122–49. Los Angeles: Universityof California at Los Angeles.
Keating, Larry E., Lynn M. Brazen, and Stan F. Fitterman. 1992. ReluctantResponse to Community Pressure in Atlanta. In From Redlining to Reinvest-ment: Community Responses to Urban Disinvestment, ed. Gregory D. Squires,170–93. Philadelphia: Temple University Press.
Leahy, Peter J. 1985. Are Racial Factors Important for the Allocation ofMortgage Money? American Journal of Economics and Sociology 44:185–96.
Lukas, J. Anthony. 1985. Common Ground: A Turbulent Decade in the Lives ofThree American Families. New York: Knopf.
Massey, Douglas S. 1979. Effects of Socioeconomic Factors on the ResidentialSegregation of Blacks and Spanish Americans in United States UrbanizedAreas. American Sociological Review 44:1015–22.
Massey, Douglas S., and Nancy A. Denton. 1993. American Apartheid: Segre-gation and the Making of the Underclass. Cambridge, MA: Harvard UniversityPress.
Dow
nloa
ded
by [
128.
199.
165.
238]
at 2
3:57
26
Aug
ust 2
015

The Residential Preferences of Blacks and Whites 799
Munnell, Alicia H., Lynn E. Browne, James McEneaney, and Geoffrey M. B.Tootell. 1992. Mortgage Lending in Boston: Interpreting HMDA Data. WorkingPaper 92-7. Boston: Federal Reserve Bank of Boston.
Muth, Richard. 1969. Cities and Housing. Chicago: University of ChicagoPress.
Muth, Richard. 1986. The Causes of Housing Segregation. In Issues in HousingDiscrimination. U.S. Commission on Civil Rights. Washington, DC: U.S.Government Printing Office.
Myrdal, Gunnar. 1944. An American Dilemma: The Negro Problem andModern Democracy. New York: Harper.
Pearce, Diana. 1979. Gatekeepers and Homeseekers: Institutionalized Pat-terns of Racial Steering. Social Problems 26:325–42.
Pol, Louis G., Rebecca F. Guy, and Andrew J. Bush. 1982. Discrimination inthe Home Lending Market: A Macro Perspective. Social Science Quarterly63:716–28.
Schelling, Thomas C. 1971. Dynamic Models of Segregation. Journal ofMathematical Sociology 1:143–86.
Schuman, Howard C., Charlotte Steeh, Lawrence Bobo, and Maria Krysan.1997. Racial Attitudes in America: Trends and Interpretations. Revised ed.Cambridge, MA: Harvard University Press.
Shlay, Anne B. 1988. Not in That Neighborhood: The Effects of Population andHousing on the Distribution of Mortgage Finance within the Chicago SMSA.Social Science Research 17:137–63.
Simkus, Albert A. 1978. Residential Segregation by Occupation and Race inTen Urbanized Areas. American Sociological Review 43(1):81–93.
Social Science Panel. 1972. Freedom of Choice in Housing: Opportunities andConstraints. Washington, DC: National Academy of Sciences, Advisory Com-mittee to the U.S. Department of Housing and Urban Development.
Swain, Carol M. 1993. Black Faces, Black Interests: The Representation ofAfrican Americans in Congress. Cambridge, MA: Harvard University Press.
Taeuber, Karl E. 1965. The Effect of Income Redistribution on Racial Residen-tial Segregation. Urban Affairs Quarterly 4:5–14.
Taggart, Harriet, and Kevin W. Smith. 1981. Redlining: An Assessment of theEvidence of Disinvestment in Metropolitan Boston. Urban Affairs Quarterly17(1):91–107.
Thernstrom, Stephan, and Abigail Thernstrom. 1997. America in Black andWhite: One Nation, Indivisible: Race in Modern America. New York: Simon andSchuster.
Tootell, Geoffrey M. B. 1996. Turning a Critical Eye on the Critics. In Mort-gage Lending, Racial Discrimination, and Federal Policy, ed. John Goeringand Ron Wienk, 143–82. Washington, DC: Urban Institute Press.
Dow
nloa
ded
by [
128.
199.
165.
238]
at 2
3:57
26
Aug
ust 2
015

800 Reynolds Farley, Elaine L. Fielding, and Maria Krysan
Turner, Margery Austin. 1992. Discrimination in Urban Housing Markets:Lessons from Fair Housing Audits. Housing Policy Debate 3:185–215.
Turner, Margery Austin. 1993. Limits on Neighborhood Choice: Evidence ofRacial and Ethnic Steering in Urban Housing Markets. In Clear and Convinc-ing Evidence: Measurement of Discrimination in America, ed. Michael Fix andRaymond J. Struyk, 117–52. Washington, DC: Urban Institute Press.
Turner, Margery Austin, and Ronald Wienk. 1993. The Persistence of Segrega-tion in Urban Areas: Contributing Causes. In Housing Markets and Residen-tial Mobility, ed. G. Thomas Kingsley and Margery Austin Turner, 193–218.Washington, DC: Urban Institute Press.
U.S. Bureau of the Census. 1992. Census of Population and Housing, 1990.CP-1-1B. Public Use Microdata Sample. Washington, DC.
Wienk, Ronald E., Clifford E. Reid, John C. Simonson, and Frederick J.Eggers. 1979. Measuring Racial Discrimination in American Housing Markets:The Housing Market Practices Survey. Washington, DC: U.S. Department ofHousing and Urban Development.
Yinger, John. 1986. Measuring Racial Discrimination with Fair HousingAudits: Caught in the Act. American Economic Review 76(5):881–93.
Yinger, John. 1991. Housing Discrimination Study: Incidence of Discrimina-tion and Variations in Discriminatory Behavior. Prepared for the U.S. Depart-ment of Housing and Urban Development. Washington, DC: Urban Institute.
Yinger, John. 1995. Closed Doors, Opportunities Lost: The Continuing Cost ofHousing Discrimination. New York: Russell Sage Foundation.
Zubrinsky, Camille, and Lawrence Bobo. 1996. Prismatic Metropolis: Race andResidential Segregation in the City of Angels. Social Science Research25(4):335–74.
Dow
nloa
ded
by [
128.
199.
165.
238]
at 2
3:57
26
Aug
ust 2
015