the reliability of statistical functions in four software packages freely used in numerical...
TRANSCRIPT
Brazilian Journal of Probability and Statistics2009, Vol. 23, No. 2, 107–119DOI: 10.1214/08-BJPS017© Brazilian Statistical Association, 2009
The reliability of statistical functions in four softwarepackages freely used in numerical computation
Marcelo G. Almiron, Eliana S. Almeida and Marcio N. MirandaUniversidade Federal de Alagoas
Abstract. This work presents a comparison of results about the accuracyof statistical routines from four statistical software packages that are freelyused: Octave, academic Ox, Python, and R. Having extensive functionallibraries for statistical computing with applications in image processing, thesesoftware packages are useful for data analysis and visualization. The NationalInstitute of Standards and Technology datasets and McCullough’s methodol-ogy are used for assessing these packages. As to the statistical analysis hereinperformed, R yielded the best results and had the most comprehensive library.
1 Introduction
Estimators with good properties are only half the way to the practice of good dataanalysis. They need to be implemented with care in order to provide dependableresults on a variety of situations. This requirement is valid even for simple estima-tors as, for example, measures of the mean, standard deviation, and autocorrelationcoefficient.
These estimators may be used in principal component analysis (PCA) or in com-puting statistical distances (Fukunaga (1990)). They are also commonly employedin texture extraction, image segmentation, and image classification. Autocorrela-tion functions and histogram features are some examples of the measures used toclassify textures.
The importance of accuracy in statistical packages can be observed in ecosys-tem monitoring software, which uses remote sensing imagery to assess the impactof global changes on land surface attributes. Most of these changes are digitallydetected using satellite images that determine the type and extent of the damageto the environment (Coppin et al. (2004)). Satellite imagery is more efficient thanvisual determination since, among other reasons, the visual assessment of changesis difficult to replicate: different interpreters usually produce different results. Fur-thermore, visual detection is costly. Differently, digital methods can incorporatefeatures from the nonoptical parts of the electromagnetic spectrum.
Change detection methods pose some challenges, such as detecting modifica-tions, monitoring rapid or abrupt changes, and understanding and correcting sta-tistical estimates derived from remote sensing data at different spatial resolutions.
Key words and phrases. Statistical software, numerical computation, software accuracy.Received April 2008; accepted October 2008.
107
108 M. G. Almiron, E. S. Almeida and M. N. Miranda
These challenges require accurate software in order to obtain good and reliableresults. There is a wide variety of change detection algorithms for ecosystem mon-itoring. They usually combine procedures for change extraction (change detectionalgorithms) and change classification routines. Algorithms applied to change de-tection are based on methods that use per-pixel classifiers and pixel-based changeinformation contained in the domains of the images so as to pinpoint changes be-tween images.
Coppin et al. (2004) present a survey comparing algorithms for change detectionand highlight the need for accurate software. Some have suggested reducing scene-dependent effects and using band-to-band normalization before differentiating datain order to yield bands with comparable means and standard deviations. Otheralgorithm proposals use linear data transformation techniques based on PCA. Mostof the proposals in Coppin et al. (2004) suggest taking into account the accuracyof statistical measures used to produce the results.
In view of the importance of accuracy in any quantitative research, such as inimage processing and remote sensing, this sort of analysis is crucial.
In order to measure the accuracy of statistical functions, McCullough (1998)and Knüsel (1989, 1998) developed the first thorough studies in this field. Theirwork has lent support to several other studies aimed at finding accuracy errors instatistical computation and proposing guidelines for the selection of reliable sta-tistical software (see, for instance, McCullough and Wilson (1999); McCullough(2000); Altman (2002); McCullough and Wilson (2002); McCullough and Wil-son (2005); Bustos and Frery (2006); Keeling and Pavur (2007); Yalta and Yalta(2007); Yalta (2007)). All of these authors illustrate the need for improved accu-racy and pinpoint situations in which packages failed.
Recent works by McCullough and Heiser (2008) and Yalta (2008) conduct ac-curacy tests in Microsoft Excel 2007. They show that Excel 2007 keeps failingto give good answers and advises that each new version must be tested since Mi-crosoft did not correct the errors of older tested versions (McCullough and Wilson(1999, 2002, 2005)).
We analyzed the numeric quality of four well-known software packages that canbe freely used. These software packages are Octave (version 2.9.12), Ox (freeacademic version 4.10a), Python (version 2.5.2), and R (version 2.6.2). This ap-proach differs from previous studies in that it shows the results of assessing theaccuracy of statistical routines in four packages widely used for numerical compu-tation and that are compatible with most operating systems (Windows, Unix-like,and Macintosh). Some older versions have already been tested for accuracy. Weused the latest stable versions available for each package.
In order to assess the reliability of the packages, McCulloughs’ procedures wereemployed in three kinds of tests: linear and nonlinear models, random numbergeneration, and statistical distributions. It must be emphasized that only prede-fined routines were considered when determining the statistical measures: mean,standard deviation, autocorrelation coefficient, ANOVA, and linear and nonlinear
Reliability of statistical functions 109
regressions. We did not implement any routine to certify the fidelity of the platformanalysis.Octave (www.octave.org) is an interpreted programming language. It is avail-
able as Free Software under the terms of the Free Software Foundation’s GNUGeneral Public License in source code. It provides a command line interface forperforming numerical experiments. It has extensive tools for solving commonnumerical linear algebra problems, finding the roots of nonlinear equations,integrating ordinary functions, manipulating polynomials, and integrating ordinarydifferential and differential-algebraic equations. It is easily extensible and custo-mizable via user-defined functions written in Octave’s own language, or using dy-namically loaded modules written in other languages like C++, C, and Fortran.Ox (www.doornik.com) is an object-oriented language. It is considered a power-
ful matrix platform and includes a library containing comprehensive mathematicaland statistical functions. Some of its best features are high performance, well-designed syntax, and graphical facilities. Ox syntax is very similar to C, C++, andJava. It can be used as a front end for languages such as C and C++. Most versionsare free for educational purposes and academic research.Python (www.python.org) is a remarkably dynamic programming language.
It can be used in numerical work, statistical computing, and visualization. It hasan open source license by the Python Software Foundation. It can be freely usedand distributed, even for commercial purposes. Python’s syntax is clear, with anindented structure and an interface with languages such as C and C++. The codecan interact with R functions, allowing data to be manipulated using its tools.R (www.r-project.org) is a well-known environment for statistical computing
and graphics. Like Octave, it is also available as Free Software under the termsof the Free Software Foundation’s GNU General Public License in source code. Awide variety of statistical and graphical functions are provided by this platform, in-cluding storage facilities and a suite of operators on arrays functions, especially onmatrices. It has its own programming language. R can call C, C++, and Fortrancode at runtime.
The next section presents the methodology adopted for the purpose of this pa-per. Section 3 brings the main results, as follows: Section 3.1 presents the resultson univariate summary statistics, while Sections 3.2 and 3.3 discuss the results onanalysis of variance and regression, respectively. The quantiles for tail probabili-ties of the Gaussian, χ2, F , and t-student distributions are analyzed in Section 3.4.Section 3.5 briefly discusses the pseudorandom number generators and their al-gorithms. Finally, Section 4 discusses the results and lays down some general re-marks.
2 Methodology
In order to assess the reliability of each software, we have followed the method-ology suggested by McCullough (1998, 2000) and by McCullough and Wilson
110 M. G. Almiron, E. S. Almeida and M. N. Miranda
(1999, 2002). The Statistical Reference Data sets (StRD) used were provided bythe National Institute of Standards and Technology (NIST (2000)). Each dataset in-cludes either generated or “real world” data and certified (correct) values of mean,standard deviation, first lag correlation, etc. These datasets are classified in threelevels of difficulty denoted in the tables by ‘L’ (low), ‘A’ (average), and ‘H’ (high).
The statistical measures of interest are the mean, the standard deviation, thecoefficient of autocorrelation (first lag), and the ANOVA F-statistic. Additionally,linear regression, nonlinear least squares regression, and the quantiles for the tailprobabilities of frequently used distributions are computed. When performing re-gression on multiple variables several coefficients are estimated. We adopt themetodology employed by McCullough and Wilson (1999) and by Bustos and Frery(2006), which consists of a pessimistic assessment based on the worst estimatedparameter. The pseudorandom number generators are also discussed.
For the univariate summary statistics, NIST provides real world data: Lew, Lot-tery, Mavro, and Michelso. They differ from each other in the number of observa-tions and in their range. Lew has 200 integer observations ranging from −579 to300, Lottery 218 integer observations ranging from 4 to 999, Mavro 50 observa-tions with five leading digits ranging from 2.00130 to 2.00270, and Michelso 100observations ranging from 299.620 to 300.070.
Generated data for univariate summary statistics are NumAcc1, NumAcc2,NumAcc3, NumAcc4, and PiDigits. The dataset NumAcc1 has only the values10000001, 10000003, and 10000002. In NumAcc2 there are 1001 observations ar-ranged as follows: the value 1.2, 500 occurrences of the value 1.1 alternating with500 occurrences of the value 1.3. In NumAcc3 there is one value 1000000.2, 500occurrences of the value 1000000.1 alternating with 500 occurrences of the value1000000.3. NumAcc4 has the value 10000000.2, 500 occurrences of the value10000000.1 alternating with 500 occurrences of the value 10000000.3. Finally,dataset PiDigits is made up of the first 5000 digits of the number π .
To assess the accuracy of ANOVA (F-statistic) calculations, NIST provideseleven datasets, nine generated and two observed (“real world” data) ordered bylevel of difficulty (Low, Average, and High). NIST also provides several datasetsto evaluate linear and nonlinear regression functions that have been used in eachpackage. For linear regression, the datasets differ from each other in the conver-gence level of difficulty (Low, Average, and High) and in the class of the model (3linear, 1 quadratic, 6 polynomial, and 1 multilinear). Similarly, there are datasetswith different convergence levels of difficulty and different classes of models (16exponential, 7 miscellaneous, and 4 rational) to evaluate nonlinear regression. Ta-bles 4, 5, and 6 show the results for ANOVA, linear regression, and nonlinearregression, respectively.
The datasets for nonlinear least squares evaluation have two sets of startingvalues in addition to the certified solution: start 1, far from the certified solution,making the problem more difficult to solve, and start 2, near to the certified solu-tion, making the problem easier to solve. Only start 1 values were used to arrive
Reliability of statistical functions 111
at the solution, since these values represent the worst case. Following McCulloughand Wilson (1999), the start 2 set is used only when start 1 does not converge toan approximate solution.
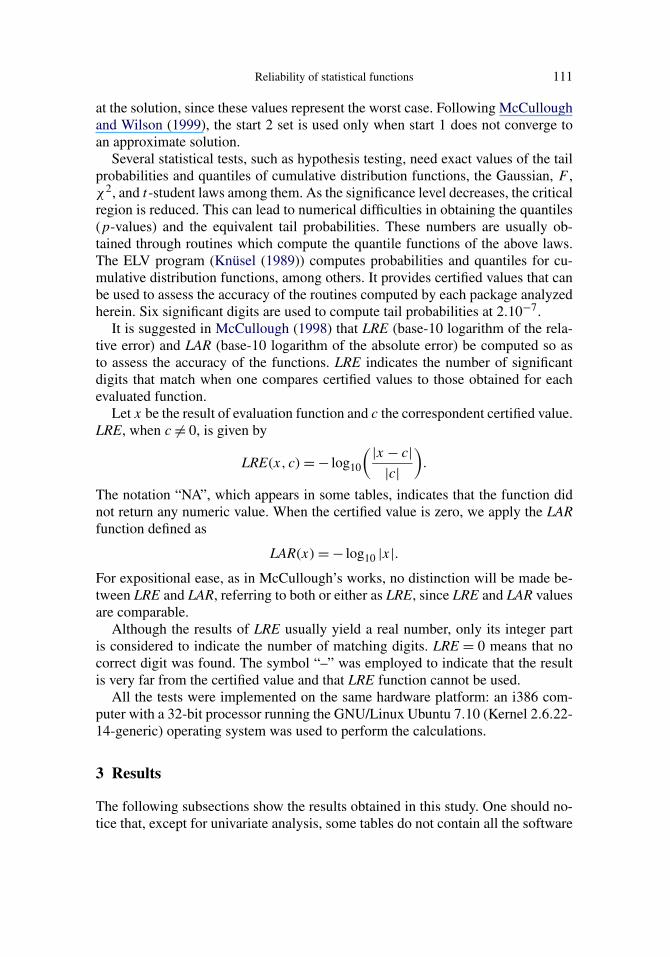
Several statistical tests, such as hypothesis testing, need exact values of the tailprobabilities and quantiles of cumulative distribution functions, the Gaussian, F ,χ2, and t-student laws among them. As the significance level decreases, the criticalregion is reduced. This can lead to numerical difficulties in obtaining the quantiles(p-values) and the equivalent tail probabilities. These numbers are usually ob-tained through routines which compute the quantile functions of the above laws.The ELV program (Knüsel (1989)) computes probabilities and quantiles for cu-mulative distribution functions, among others. It provides certified values that canbe used to assess the accuracy of the routines computed by each package analyzedherein. Six significant digits are used to compute tail probabilities at 2.10−7.
It is suggested in McCullough (1998) that LRE (base-10 logarithm of the rela-tive error) and LAR (base-10 logarithm of the absolute error) be computed so asto assess the accuracy of the functions. LRE indicates the number of significantdigits that match when one compares certified values to those obtained for eachevaluated function.
Let x be the result of evaluation function and c the correspondent certified value.LRE, when c �= 0, is given by
LRE(x, c) = − log10
( |x − c||c|
).
The notation “NA”, which appears in some tables, indicates that the function didnot return any numeric value. When the certified value is zero, we apply the LARfunction defined as
LAR(x) = − log10 |x|.For expositional ease, as in McCullough’s works, no distinction will be made be-tween LRE and LAR, referring to both or either as LRE, since LRE and LAR valuesare comparable.
Although the results of LRE usually yield a real number, only its integer partis considered to indicate the number of matching digits. LRE = 0 means that nocorrect digit was found. The symbol “–” was employed to indicate that the resultis very far from the certified value and that LRE function cannot be used.
All the tests were implemented on the same hardware platform: an i386 com-puter with a 32-bit processor running the GNU/Linux Ubuntu 7.10 (Kernel 2.6.22-14-generic) operating system was used to perform the calculations.
3 Results
The following subsections show the results obtained in this study. One should no-tice that, except for univariate analysis, some tables do not contain all the software
112 M. G. Almiron, E. S. Almeida and M. N. Miranda
evaluation. This is due to the absence of such a function in the official site of thesoftware. The best function results for each table are highlighted using boldfacefont.
3.1 Univariate summary statistics
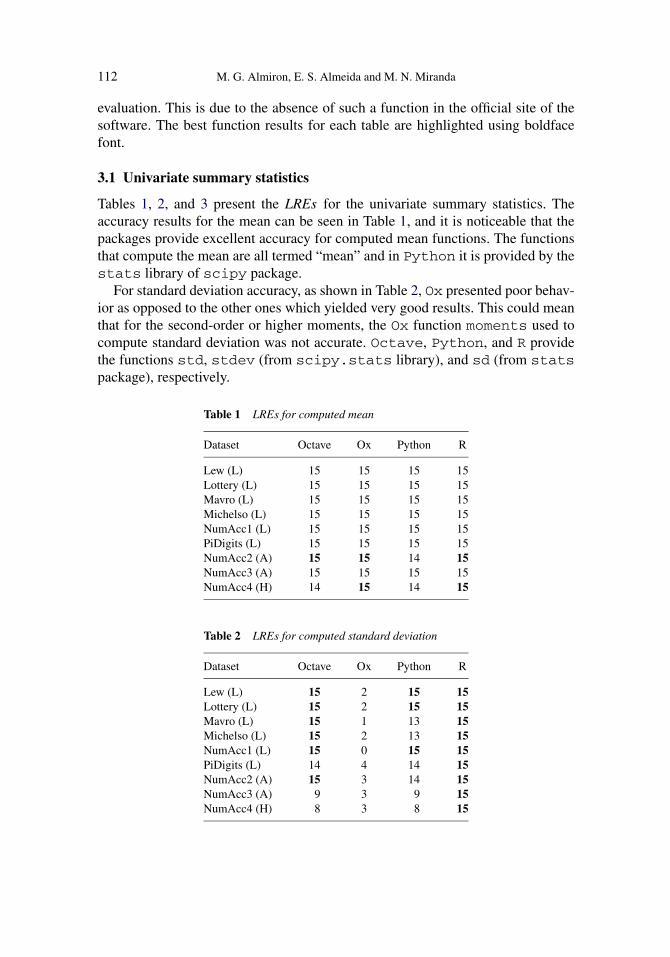
Tables 1, 2, and 3 present the LREs for the univariate summary statistics. Theaccuracy results for the mean can be seen in Table 1, and it is noticeable that thepackages provide excellent accuracy for computed mean functions. The functionsthat compute the mean are all termed “mean” and in Python it is provided by thestats library of scipy package.
For standard deviation accuracy, as shown in Table 2, Ox presented poor behav-ior as opposed to the other ones which yielded very good results. This could meanthat for the second-order or higher moments, the Ox function moments used tocompute standard deviation was not accurate. Octave, Python, and R providethe functions std, stdev (from scipy.stats library), and sd (from statspackage), respectively.
Table 1 LREs for computed mean
Dataset Octave Ox Python R
Lew (L) 15 15 15 15Lottery (L) 15 15 15 15Mavro (L) 15 15 15 15Michelso (L) 15 15 15 15NumAcc1 (L) 15 15 15 15PiDigits (L) 15 15 15 15NumAcc2 (A) 15 15 14 15NumAcc3 (A) 15 15 15 15NumAcc4 (H) 14 15 14 15
Table 2 LREs for computed standard deviation
Dataset Octave Ox Python R
Lew (L) 15 2 15 15Lottery (L) 15 2 15 15Mavro (L) 15 1 13 15Michelso (L) 15 2 13 15NumAcc1 (L) 15 0 15 15PiDigits (L) 14 4 14 15NumAcc2 (A) 15 3 14 15NumAcc3 (A) 9 3 9 15NumAcc4 (H) 8 3 8 15
Reliability of statistical functions 113
Table 3 LREs for computed autocorrelation coeffi-cient
Dataset Octave Ox Python R
Lew (L) 5 14 2 15Lottery (L) 4 14 2 15Mavro (L) 4 13 1 13Michelso (L) 8 13 3 13NumAcc1 (L) 0 15 – 15PiDigits (L) 3 15 3 13NumAcc2 (A) 7 15 3 14NumAcc3 (A) 3 12 – 14NumAcc4 (H) 3 11 2 14
Table 4 ANOVA: F-statistic
Dataset Octave Python R
SiRstv (L) 12 8 13SmLs01 (L) 14 13 15SmLs02 (L) 13 11 15SmLs03 (L) 12 11 15AtmWtAg (A) 8 0 9SmLs04 (A) 8 0 10SmLs05 (A) 8 – 10SmLs06 (A) 6 – 10SmLs07 (H) 2 – 4SmLs08 (H) 2 – 4SmLs09 (H) – – 4
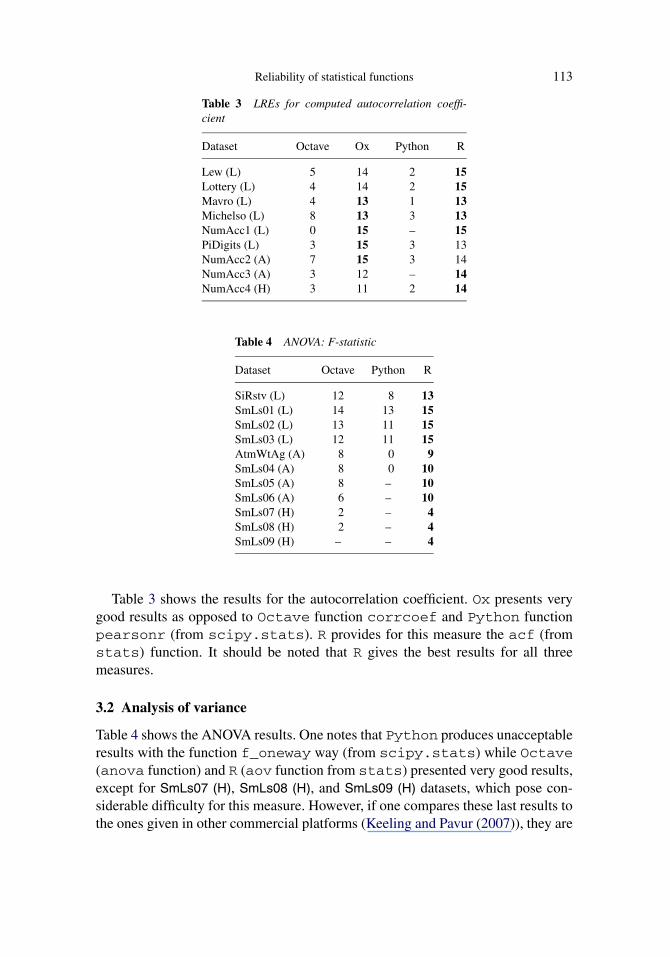
Table 3 shows the results for the autocorrelation coefficient. Ox presents verygood results as opposed to Octave function corrcoef and Python functionpearsonr (from scipy.stats). R provides for this measure the acf (fromstats) function. It should be noted that R gives the best results for all threemeasures.
3.2 Analysis of variance
Table 4 shows the ANOVA results. One notes that Python produces unacceptableresults with the function f_oneway way (from scipy.stats) while Octave(anova function) and R (aov function from stats) presented very good results,except for SmLs07 (H), SmLs08 (H), and SmLs09 (H) datasets, which pose con-siderable difficulty for this measure. However, if one compares these last results tothe ones given in other commercial platforms (Keeling and Pavur (2007)), they are
114 M. G. Almiron, E. S. Almeida and M. N. Miranda
competitive. It should also be noted that the R version used here provides betterresults to those obtained with version 1.9.1 in the previous cited work.
3.3 Regression
In this section, the results obtained for linear and nonlinear regression are pre-sented. It should be mentioned that the datasets provided by NIST for linear re-gression are different from the datasets provided for nonlinear regression, and themodels are linear, quadratic, polynomial, and multilinear. For nonlinear regressionNIST provides the exponential and rational models among others. Moreover, thedegree of difficulty for each dataset may be Low, Average, or High.
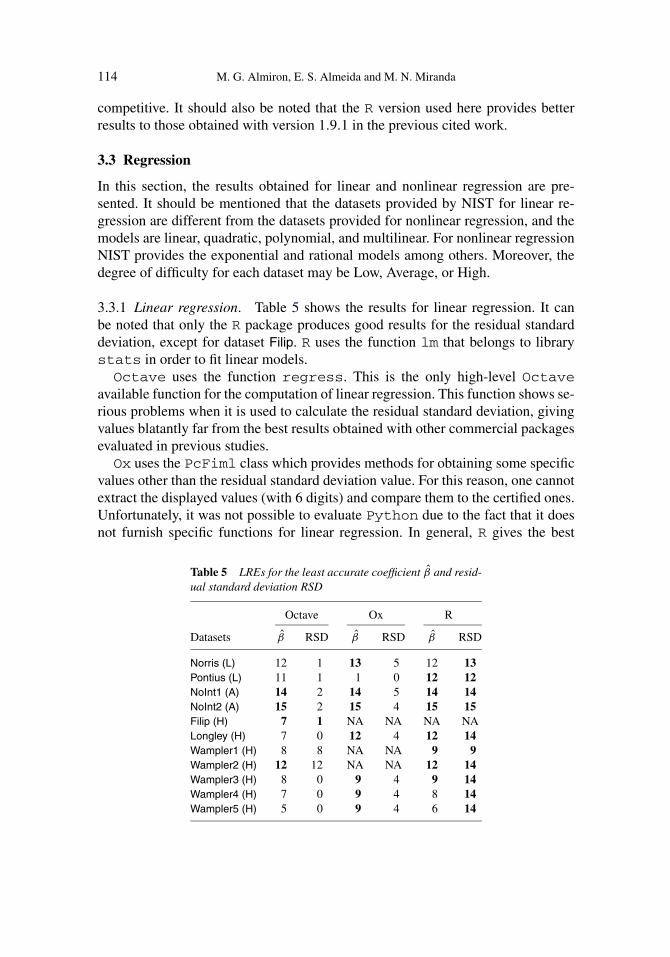
3.3.1 Linear regression. Table 5 shows the results for linear regression. It canbe noted that only the R package produces good results for the residual standarddeviation, except for dataset Filip. R uses the function lm that belongs to librarystats in order to fit linear models.Octave uses the function regress. This is the only high-level Octave
available function for the computation of linear regression. This function shows se-rious problems when it is used to calculate the residual standard deviation, givingvalues blatantly far from the best results obtained with other commercial packagesevaluated in previous studies.Ox uses the PcFiml class which provides methods for obtaining some specific
values other than the residual standard deviation value. For this reason, one cannotextract the displayed values (with 6 digits) and compare them to the certified ones.Unfortunately, it was not possible to evaluate Python due to the fact that it doesnot furnish specific functions for linear regression. In general, R gives the best
Table 5 LREs for the least accurate coefficient β̂ and resid-ual standard deviation RSD
Octave Ox R
Datasets β̂ RSD β̂ RSD β̂ RSD
Norris (L) 12 1 13 5 12 13Pontius (L) 11 1 1 0 12 12NoInt1 (A) 14 2 14 5 14 14NoInt2 (A) 15 2 15 4 15 15Filip (H) 7 1 NA NA NA NALongley (H) 7 0 12 4 12 14Wampler1 (H) 8 8 NA NA 9 9Wampler2 (H) 12 12 NA NA 12 14Wampler3 (H) 8 0 9 4 9 14Wampler4 (H) 7 0 9 4 8 14Wampler5 (H) 5 0 9 4 6 14
Reliability of statistical functions 115
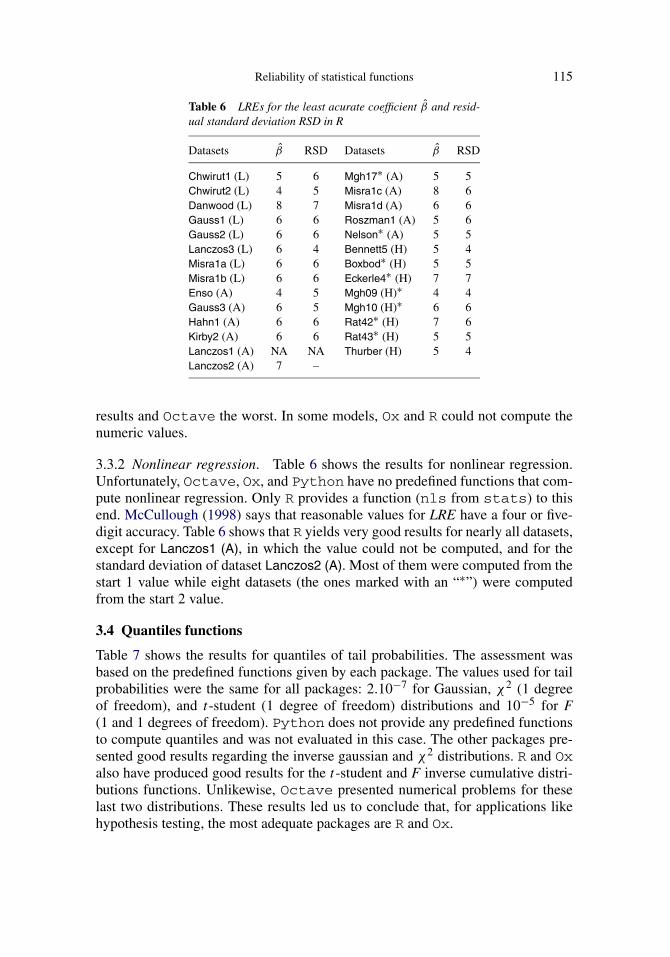
Table 6 LREs for the least acurate coefficient β̂ and resid-ual standard deviation RSD in R
Datasets β̂ RSD Datasets β̂ RSD
Chwirut1 (L) 5 6 Mgh17∗ (A) 5 5Chwirut2 (L) 4 5 Misra1c (A) 8 6Danwood (L) 8 7 Misra1d (A) 6 6Gauss1 (L) 6 6 Roszman1 (A) 5 6Gauss2 (L) 6 6 Nelson∗ (A) 5 5Lanczos3 (L) 6 4 Bennett5 (H) 5 4Misra1a (L) 6 6 Boxbod∗ (H) 5 5Misra1b (L) 6 6 Eckerle4∗ (H) 7 7Enso (A) 4 5 Mgh09 (H)∗ 4 4Gauss3 (A) 6 5 Mgh10 (H)∗ 6 6Hahn1 (A) 6 6 Rat42∗ (H) 7 6Kirby2 (A) 6 6 Rat43∗ (H) 5 5Lanczos1 (A) NA NA Thurber (H) 5 4Lanczos2 (A) 7 –
results and Octave the worst. In some models, Ox and R could not compute thenumeric values.
3.3.2 Nonlinear regression. Table 6 shows the results for nonlinear regression.Unfortunately, Octave, Ox, and Python have no predefined functions that com-pute nonlinear regression. Only R provides a function (nls from stats) to thisend. McCullough (1998) says that reasonable values for LRE have a four or five-digit accuracy. Table 6 shows that R yields very good results for nearly all datasets,except for Lanczos1 (A), in which the value could not be computed, and for thestandard deviation of dataset Lanczos2 (A). Most of them were computed from thestart 1 value while eight datasets (the ones marked with an “∗”) were computedfrom the start 2 value.
3.4 Quantiles functions
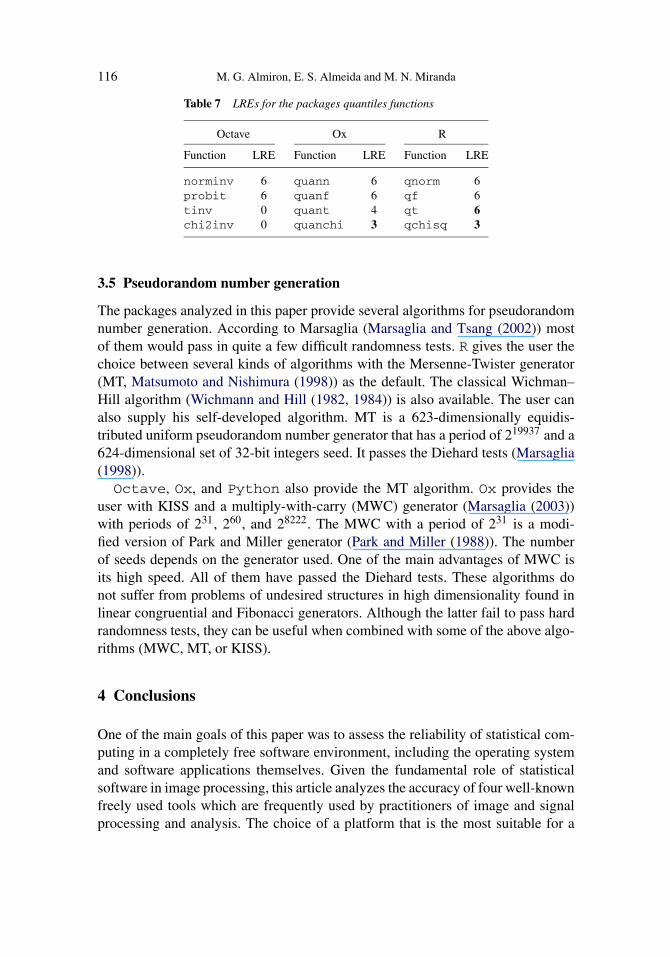
Table 7 shows the results for quantiles of tail probabilities. The assessment wasbased on the predefined functions given by each package. The values used for tailprobabilities were the same for all packages: 2.10−7 for Gaussian, χ2 (1 degreeof freedom), and t-student (1 degree of freedom) distributions and 10−5 for F(1 and 1 degrees of freedom). Python does not provide any predefined functionsto compute quantiles and was not evaluated in this case. The other packages pre-sented good results regarding the inverse gaussian and χ2 distributions. R and Oxalso have produced good results for the t-student and F inverse cumulative distri-butions functions. Unlikewise, Octave presented numerical problems for theselast two distributions. These results led us to conclude that, for applications likehypothesis testing, the most adequate packages are R and Ox.
116 M. G. Almiron, E. S. Almeida and M. N. Miranda
Table 7 LREs for the packages quantiles functions
Octave Ox R
Function LRE Function LRE Function LRE
norminv 6 quann 6 qnorm 6probit 6 quanf 6 qf 6tinv 0 quant 4 qt 6chi2inv 0 quanchi 3 qchisq 3
3.5 Pseudorandom number generation
The packages analyzed in this paper provide several algorithms for pseudorandomnumber generation. According to Marsaglia (Marsaglia and Tsang (2002)) mostof them would pass in quite a few difficult randomness tests. R gives the user thechoice between several kinds of algorithms with the Mersenne-Twister generator(MT, Matsumoto and Nishimura (1998)) as the default. The classical Wichman–Hill algorithm (Wichmann and Hill (1982, 1984)) is also available. The user canalso supply his self-developed algorithm. MT is a 623-dimensionally equidis-tributed uniform pseudorandom number generator that has a period of 219937 and a624-dimensional set of 32-bit integers seed. It passes the Diehard tests (Marsaglia(1998)).Octave, Ox, and Python also provide the MT algorithm. Ox provides the
user with KISS and a multiply-with-carry (MWC) generator (Marsaglia (2003))with periods of 231, 260, and 28222. The MWC with a period of 231 is a modi-fied version of Park and Miller generator (Park and Miller (1988)). The numberof seeds depends on the generator used. One of the main advantages of MWC isits high speed. All of them have passed the Diehard tests. These algorithms donot suffer from problems of undesired structures in high dimensionality found inlinear congruential and Fibonacci generators. Although the latter fail to pass hardrandomness tests, they can be useful when combined with some of the above algo-rithms (MWC, MT, or KISS).
4 Conclusions
One of the main goals of this paper was to assess the reliability of statistical com-puting in a completely free software environment, including the operating systemand software applications themselves. Given the fundamental role of statisticalsoftware in image processing, this article analyzes the accuracy of four well-knownfreely used tools which are frequently used by practitioners of image and signalprocessing and analysis. The choice of a platform that is the most suitable for a
Reliability of statistical functions 117
specific application depends on the measures that each researcher is more inter-ested in.
In a brief overview of univariate summary statistical functions, all software ap-plications yield reliable values computing the sample mean. The Ox momentsfunction shows the poorest results when employed to compute standard deviation.Octave corrcoef and Python pearsonr functions do not provide good ac-curacy when computing the autocorrelation coefficient. The Python f_onewayfunction has serious problems with the F -statistic of ANOVA in nearly all averageand highly complex datasets. Differently, Octave anova and R aov functionsgive good results. R 2.6.2 introduces improvements over previous versions (seeKeeling and Pavur (2007)). For linear regression, Octave regress functionpresents unacceptable results; bad results were also obtained with Ox (with thePcFiml class), although slightly better. As expected when using high qualitysoftware, R offers no local solutions for nonlinear regression when the initial-ized parameters are substandard. In this latter case, the software needs a newstart point closer to the solution. If we proceed accordingly, wrong results areavoided.
We must emphasize that only the R package has presented predefined functionsobtained from the official site (www.r-project.org) to all the measures used foraccuracy evaluation, yielding satisfactory results in most cases. Octave also pro-duces good results in most cases, but with problems in quantile functions. Octavehas no predefined functions for nonlinear regression. Phyton also lacks severalimportant predefined functions as, for instance, for nonlinear regression and quan-tiles. We found it extremely difficult to uncover freely official documentation aboutfunctions in Octave, Ox, and Python, as opposed to the well-documented Rplatform. The pseudorandom number generators used by all the packages weredeemed reliable and did pass the most difficult tests of randomness.
This research will be useful for future developments of new versions of statis-tical functions. It helps users choose among the statistical free software packagescurrently available. In order to improve the platforms, some functions not yet sup-ported by the official sites should be added in the next versions as, for instance,nonlinear regression in Octave, Ox, and Python.
Acknowledgments
The authors are grateful to CAPES for their invaluable support given to this re-search, to the referees for the comments and to Alejandro C. Frery for constructivesuggestions.
References
Altman, M. (2002). A review of JMP 4.03 with special attention to its numerical accuracy. AmericanStatistician 56 72–75. MR1939397
118 M. G. Almiron, E. S. Almeida and M. N. Miranda
Bustos, O. H. and Frery, A. C. (2006). Statistical functions and procedures in IDL 5.6 and 6.0.Computational Statistics & Data Analysis 50 301–310. MR2201864
Coppin, P., Jonckheere, I., Nackaerts, K., Muys, B. and Lambin, E. (2004). Digital change detectionmethods in ecosystem monitoring: A review. International Journal of Remote Sensing 25 1565–1596.
Fukunaga, K. (1990). Introduction to Statistical Pattern Recognition, 2nd ed. Academic Press,Boston, MA. MR1075415
Keeling, K. B. & Pavur, R. J. (2007). A comparative study of the reliability of nine statistical softwarepackages. Computational Statistics & Data Analysis 51 3811–3831. MR2364493
Knüsel, L. (1989). Computation of statistical distributions. Available at http://www.stat.uni-muenchen.de/~knuesel/, last visited in April 2008.
Knüsel, L. (1998). On the accuracy of statistical distributions in Microsoft Excel 97. ComputationalStatistics & Data Analysis 26 375–377.
Marsaglia, G. (1998). The diehard battery of tests of randomness. Available at http://www.stat.fsu.edu/pub/diehard, last visited in April 2008.
Marsaglia, G. (2003). Random number generators. Journal of Modern Applied Statistical Methods 22–13.
Marsaglia, G. and Tsang, W. W. (2002). Some difficult-to-pass tests of randomness. Journal of Sta-tistical Software 7 1–8.
Matsumoto, M. and Nishimura, T. (1998). Mersenne-Twister: A 623-dimensionally equidistributeduniform pseudradom number generetor. ACM Transactions on Modeling and Computer Simula-tion 8 3–30.
McCullough, B. D. (1998). Assessing the reliability of statistical software: Part I. American Statisti-cian 52 358–366.
McCullough, B. D. (2000). The accurary of Mathematica 4 as a statistical package. ComputationalStatistics 15(2) 279–299.
McCullough, B. D. and Heiser, D. A. (2008). On the accuracy of statistical procedures in MicrosoftExcel 2007. Computational Statistics & Data Analysis 52 4570–4578.
McCullough, B. D. and Wilson, B. (1999). On the accuracy of statistical procedures in MicrosoftExcel 97. Computational Statistics & Data Analysis 31 27–37.
McCullough, B. D. and Wilson, B. (2002). On the accuracy of statistical procedures in MicrosoftExcel 2000 and Excel XP. Computational Statistics & Data Analysis 40 713–721. MR1933481
McCullough, B. D. and Wilson, B. (2005). On the accuracy of statistical procedures in MicrosoftExcel 2003. Computational Statistics & Data Analysis 49 1244–1252. MR2143068
NIST (2000). National Institute of Standards and Technology: The statistical reference datasets.Available at http://www.itl.nist.gov/div898/strd/, last visited in april 2008.
Park, S. and Miller, K. (1988). Random number generators: Good ones are hard to find. Communi-cations of the ACM 31 1192–1201. MR1022039
Wichmann, B. A. and Hill, I. D. (1982). Algorithm as 183: An efficient and portable pseudo-randomnumber generator. Applied Statistics 31 188–190.
Wichmann, B. A. and Hill, I. D. (1984). Correction: Algorithm as 183: An efficient and portablepseudo-random number generator. Applied Statistics 33 123–123.
Yalta, A. T. (2007). The numerical reliability of GAUSS 8.0. American Statistician 61 262–268.
Yalta, A. T. (2008). The accuracy of statistical distributions in microsoft (r) excel 2007. Computa-tional Statistics & Data Analysis 52 4579–4586.

Reliability of statistical functions 119
Yalta, A. T. and Yalta, A. Y. (2007). GRETL 1.6.0 and its numerical accuracy. Journal of AppliedEconometrics 22 849–854. MR2370977
M. G. AlmironM. N. MirandaCPMATInstituto de ComputaçãoUniversidade Federal de AlagoasBR 104 Norte km 97Maceió/AL, 57072–970BrazilE-mail: [email protected]
E. S. AlmeidaLCCV & CPMATInstituto de ComputaçãoUniversidade Federal de AlagoasBR 104 Norte km 97Maceió/AL, 57072–970BrazilE-mail: [email protected]