the relationship of perceived instructor performance - ttu
TRANSCRIPT
THE RELATIONSHIP OF PERCEIVED INSTRUCTOR PERFORMANCE
RATINGS AND PERSONALITY TRAIT CHARACTERISTICS
OF U.S. AIR FORCE INSTRUCTOR PILOTS
by
JOHN DOUGLAS GARVIN, B.S., M.A.
A DISSERTATION
IN
HIGHER EDUCATION
Submitted to the Graduate Faculty of Texas Tech University in
Partial Fulfillment of the Requirements for
the Degree of
DOCTOR OF EDUCATION
Approved
May, 1995
UT 7 3 APOSSI'^
'^ ,,i ACKNOWLEDGMENTS J A - / /c /f
I would like to express my gratitude to Dr. Ron Opp for
his extraordinary support and guidance throughout my
doctoral studies. I would like to also acknowledge Ms.
Barbi Dickensheet at the Graduate School for her support and
flexibility in the coordination of this document.
My appreciation is also extended to my Air Force
comrades in the Behavioral Sciences and Leadership
Department at the U.S. Air Force Academy. They have covered
classes, proofed, and encouraged my doctoral work while I
was in absentia from Texas Tech.
Special acknowledgment to my children, Samantha, Ross,
Austin and Jacob. For all the times we couldn't play
together. Somehow they seemed to understand. My deepest
appreciation goes to my wife, Julie. She has, and always
will be, the wind beneath my wings.
11
TABLE OF CONTENTS
• • ACKNOWLEDGMENTS n
ABSTRACT vi
LIST OF TABLES ix
CHAPTER
I. INTRODUCTION 1
Background 5
Statement of the Problem 8
Purpose Statement 8
Significance of the Study 9
Thesis Statement 11
Assumptions 12
Research Questions 12
Overall Research Questions 12
Hypotheses 13
Limitations of the Study 14
Delimitations 15
Terms and Definitions 16
Summary 20
II. REVIEW OF THE LITERATURE 22
Personality Theory 22
Background 24
Type Theory 3 0
Trait Theory 35
Aviation Personality Research 39
Early Military Development 39
• t •
111
Recent Renewed Interest 43
The Personality Characteristics
Inventory 45
The Big Five 49
Job Performance Assessment 52
Aviation 52
Performance Criterion 56
Performance Rating 60
Higher Education 61
Summary 65
III. METHODOLOGY 67
Research Design 67
Scope of the Study 7 0
Subjects 71
Instrumentation 73
Performance Measurement 74
Personality Assessment 77
Demographic Data 81
Research Procedures 82
Variables 85
Statistical Analysis 87
Research Concerns 89
Significance for Policy and Theory 90
IV. ANALYSIS OF DATA AND DISCUSSION 92
Performance Ratings 97
Personality Trait Measures n o
Demographic Measures 120 iv
Summary 127
V. SUMMARY, CONCLUSIONS, DISCUSSION
AND RECOMMENDATIONS 129
Summary of the Study 13 0
Conclusions 132
Discussion and Implications 133
Perceived Performance 133
Personality 139
Demographics 144
Observations 147 Implications for Higher Education 149
Recommendations 151
Recommendations for Instructor Pilots .. 151
Recommendations for Future Research ... 152
Conclusions 153
REFERENCES 157
APPENDIX
A. TESTING INSTRUMENTS 172
B. LETTERS OF COORDINATION 183
C. PCI CONSTRUCT COMPOSITION 186
D - DATA ANALYSES TABLES 191
ABSTRACT
This research furthers the field of knowledge in the
use of personality trait theory with aircrew classification
and training. It was an exploratory study in the use of
personality trait characteristics and demographic background
characteristics to predict perceived instructor pilot
performance effectiveness. Performance effectiveness was
measured using a 360-degree performance rating technique, a
process which includes perceived instructor effectiveness
appraisals from three distinct groups: students, peer-
instructors, and supervisors. Three stepwise regression
equations were developed to predict perceived instructor
pilot performance using: personality traits, demographic
variables, and a combination of personality traits and
demographic variables. The subjects included 152 U.S. Air
Force Air Training Command instructor pilots from two
undergraduate pilot training bases. Cluster sampling of
entire flights (classrooms) was employed to obtain
comprehensive performance assessment for each instructor. A
typical instructor's performance was rated by 15 students, 8
peers, and one supervisor. A total of 423 students and 19
supervisors participated. This constitutes approximately
35% of the population of U.S. Air Force Undergraduate
Instructor Pilots. Performance appraisal criteria included
seven dimensions identified through a pilot study: Job
vi
Competence-Knowledge, Job Competence-Performance, Job
Competence-Performance under Pressure, Leadership, Teamwork,
Personality, and Communication Skills. The performance
assessment instrument was a modified version of the NASA/UT
Astronaut Assessment Survey. Personality traits were
measured with the Personality Characteristics Inventory
(PCI). The first assessment established the validity of the
performance appraisal criteria. The various rating groups
evaluated the appropriateness of each performance criterion
scale on the NASA/UT performance assessment instrument for
instructor pilot applicability. All groups agreed or
strongly agreed on all performance scale applicability.
Regression results using multiple stepwise regression
accounted for 5% of the variance in the personality trait
only equation with two significant variables: Negative
Communion (P=-.16), and Impatience/IrriteLbility (P=-.17).
The demographic equation accounted for 11% of the variance
with two significant variables: Number of Children (P=.22),
and Military Rank (P=.24). The combined regression equation
accounted for 14% of the variance and included three
variables: Number of Children (Ps=.22), Military Rank
(P=.23), and Verbal Aggression (P=-.19). Although the
prediction portion of the research resulted in marginal
findings, the performance appraisal portion was very
successful. All rating groups identified the new
• fl
Vll
performance appraisal criteria as good to very good. The
360-degree rating technique was well received with many
instructor pilots reporting eagerness for this type of
unique feedback. The implications of this study include the
contribution and development of a new performance appraisal
method for instructor pilots that is more comprehensive and
insightful. Additionally, personality research in aviation
is further explored. Future research should continue the
performance prediction design investigation by applying the
new Big Five personality assessment measure and by studying
specific
Vlll
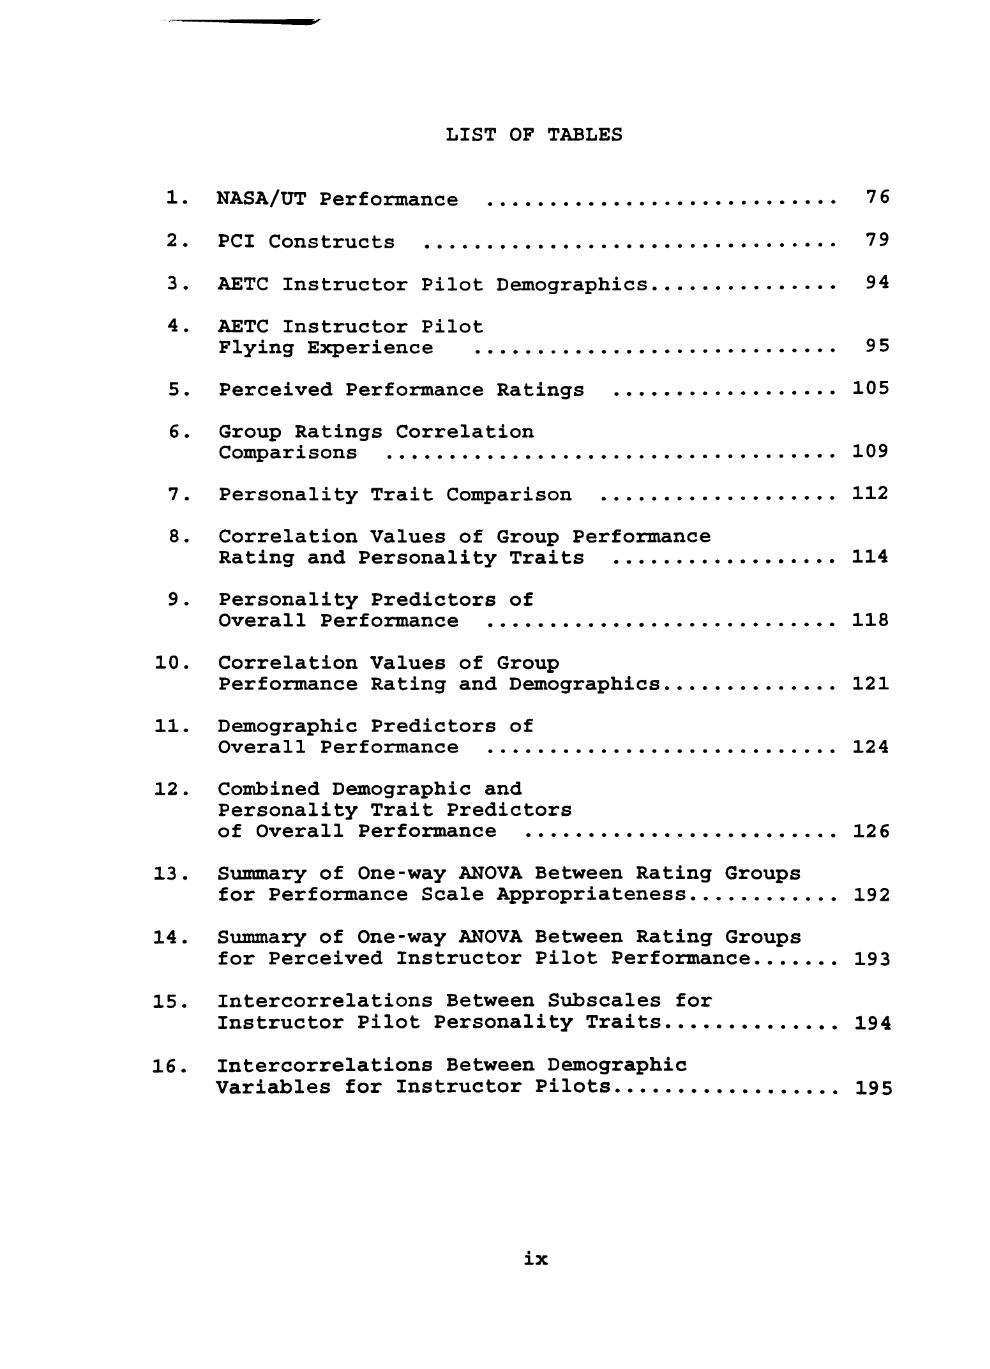
LIST OF TABLES
1. NASA/UT Performance 7 6
2. PCI Constructs 79
3 . AETC Instructor Pilot Demographics 94
4. AETC Instructor Pilot
Flying Experience 9 5
5. Perceived Performance Ratings 105
6. Group Ratings Correlation
Comparisons 109
7. Personality Trait Comparison 112
8. Correlation Values of Group Performance Rating and Personality Traits 114
9. Personality Predictors of Overall Performance 118
10. Correlation Values of Group Performance Rating and Demographics 121
11. Demographic Predictors of Overall Performance 124
12. Combined Demographic and Personality Trait Predictors of Overall Performance 12 6
13. Summary of One-way ANOVA Between Rating Groups for Performance Scale Appropriateness 192
14. Summary of One-way ANOVA Between Rating Groups for Perceived Instructor Pilot Performance 193
15. Intercorrelations Between Subscales for Instructor Pilot Personality Traits 194
16. Intercorrelations Between Demographic Variables for Instructor Pilots 195
IX
CHAPTER I
INTRODUCTION
One of the most vital and costly higher education
programs in the U.S. military is Undergraduate Pilot
Training (UPT). This twelve month graduate level course is
an extensive and rigorous training progreun that transforms a
college graduate into a military jet pilot. The curriculum
is highly technical and delivered at a rapid pace. The
application of newly learned skills Is practiced and
evaluated daily in a unforgiving flying environment that
constantly threatens the safety of the student and
instructor. If the student is unable to learn required
skills in a timely fashion or unable to maintain the
demanding pace of the technical curriculum, he is eliminated
from training.
Each student elimination from pilot training directly
impedes the program's ability to produce the needed military
pilot quota, and compromises the program's cost
effectiveness. Siem (1988) estimated each student failure
in the U.S. Air Force UPT program costs taxpayers $65,000 to
$80,000. This becomes Increasingly important as student
pilot attrition rates in the U.S. Air Force reach the
current level of approximately 20% (HAF-DPP-A, 1992). This
attrition rate equates to approximately 200 U.S. Air Force
pilot candidate failures annually, with an overall economic 1
loss of around 14 million dollars. Attrition clearly
affects the efficiency of the Air Force in carrying out its
mission to train pilots.
The historical and continuing effort to reduce
attrition rates in aviation has focused on student pilot
selection. A recent Air Force commissioned study underlines
the selection screening emphasis:
High training costs associated with attrition rate at Undergraduate Pilot Training (UPT), and the impending transition from a single-track UPT system to a multi-track Specialized Undergraduate Pilot Training (SUPT), have underscored the need for improving methods of selection and classifying pilot trainees. (Kantor & Carretta, 1988, p.14)
The selection process attempts to screen candidates in
physical. Intellectual, and emotional areas. The physical
aspect requires 20/20 eyesight and an overall physical
conditioning that will withstand the stresses inherent in a
high performance aircraft. The intellectual aspect attempts
to identify those who have both the aptitude for technical
learning and the fine motor coordination that complements
required cockpit skills. The intellectual assessment is
perhaps the most effective predictor in the screening
process (R. Davis, 1989). Researchers from the Air Force
Human Resources Laboratory (AFHRL) have found a modest
correlation (r=.31) between flying aptitude (intelligence)
as defined and measured by the Air Force Officer Qualifying
Test (AFOQT), and success in UPT (Borderlon & Kantor, 1986).
The weakest and most subjective measure in the
selection screening process is the personality measure.
Recent studies have attempted to apply personality theory in
the pilot screening process to help improve selection, but
have failed to yield significant results (R. Davis, 1989).
Part of the reason for previous personality measure failures
is the lack of an aviation-specific personality tool.
Despite the intensive screening process that has
evolved over the past 50 years in military aviation, there
still remains a substantial 20% student pilot attrition
rate. The emphasis in reducing student-pilot attrition
rates continues to focus on the up-front process of
selecting the candidate before any costs are invested into
their training. This may be the reason that progress in
lowering attrition has stagnated for the past 14 years. It
is the opinion of this researcher that an environmental
aspect in UPT, specifically perceptions of instructor
effectiveness, will provide better potential in reducing
future student pilot attrition rates. Bowers (1958)
indicated in his report on factors related to achievement in
instructor's training syllabus that there was a wide
divergence eunong a group of instructors with respect to
experience and effectiveness. If the quality of instruction
increases, perhaps there will be fewer students that wash
out during training. Although student pilot attrition is
not measured in this study, the present research furthered
the effort in developing personality trait measures in
aviation, but targets those chosen to be instructor pilots,
instead of student pilot screening. By identifying
personality characteristics of successful instructor pilots
rather than merely student selection, student pilot
attrition may be decreased by identifying behavior that is
perceived as increasing instructor performance.
According to R. Davis (1989), there are three
alternative approaches to solving student pilot attrition
problems other than selection screening: (1) increase
candidate selection to compensate for an expected attrition
rate, (2) lower training standards, or (3) Improve the
instructional process and instructor effectiveness.
Increasing the number of candidates may solve the pilot
production quota requirement, but it does not promote cost-
effectiveness. This approach would increase the number of
failures which would result in an even higher per capita
cost of each graduate. Davis' second alternative, lowering
training standards, simply reduces the quality of the
graduating pilot and compromises safety concerns. Both of
these alternatives are unaccepteible to the nation's military
and the overall aviation industry. The final alternative,
improving the Instructional process and instructor
effectiveness, is the most plausible. This study attempts
to improve the instructor effectiveness in UPT by
identifying a new Instructor performance measurement
instrument and by identifying instructor pilot personality
traits that complement perceived effectiveness from various
rating groups of students, peer-instructors, and
supervisors.
Previous aviation-related research has defined the
instructional process as consisting of three basic factors:
the student's capacity for learning, the course sylleibus,
and the instructor's teaching ability. Although all of
these factors overlap, they are generally assessed
individually. The student's learning capacity is assessed
during the application and selection process. Only those
students with proven ability in technical curricula and
flying aptitude are admitted. The training syllabus is
currently under drastic revision to better incorporate the
introduction of new types of training aircraft, the T-1 and
AT-38. The redesigned syllabus will produce a new operating
policy in conducting advanced training, but will have little
impact on the basic phase of training (where over 80% of
attrition occurs) (Siem, 1988). The final aspect of the
instructional process, the instructor's teaching ability and
effectiveness, appears to be the most neglected factor in
recent years and is the focus of this research.
Background
Undergraduate Pilot Training (UPT) instructor pilots
are selected by Air Education Training Command (AETC)
Headquarters, Randolph AFB, San Antonio, Texas. The
instructor pilot (IP) population is composed of two distinct
types of instructors: the First Assignment IP (FAIP), and
the Major Weapons System (MWS) pilot. A FAIP is unique in
military pilot training to the Air Force and they
historically represent the majority of the instructor pilot
population. FAIPs are recent graduates from UPT with no
operational experience. Most have approximately 2 00 hours
total flying time and are newly commissioned officers.
Generally, FAIPs perform within the top 25% of their pilot
training class. Currently, Air Education Training Command
is drastically changing the instructor pilot population
composition. It is reducing the number of FAIP instructors
in favor of MWS pilots. The latest command target figure
for instructor composition is 95% MWS instructors and 5%
FAIPs by the year 2000 (Barone, 1993).
MWS candidates possess years of operational flying
experience. They must submit an application package to
Headquarters AETC to be considered for an instructor pilot
position. A selection board reviews the applications and
selects, not necessarily the most qualified, but rather the
most eligible (Barone, 1993). Eligibility Is based on
possessing the minimum requirements and the maximum time on
station. Once a candidate is selected, FAIP or MWS, they
are sent to Randolph AFB for three months of Pilot
Instructor Training (PIT).
PIT trains a pilot in specific aircraft systems,
introduces the student training syllabus, and builds a
minim\im proficiency of instructor flying skills. Out of the
entire training only two hours are devoted to communication
and human relation skills and no training is attempted
concerning student learning or teaching. The neglect of
personal communication skills and instruction methods during
instructor training dilutes instructor effectiveness and is
further compromised by the attitudes of many of the future
instructors. Many of the instructor pilots appear resentful
being assigned instructor duty and only applied because it
was the final opportunity to remain in a flying position.
They have left, or are forced out of, more attractive flying
positions and offered a UPT instructor job as a last chance
to serve in a flying role. Their lack of commitment to the
student may be reflected in poor instruction.
While recently serving as an instructor, this
researcher noticed that many of the '*non-volunteers" become
effective instructors, and many of the "volunteers" were
non-effective instructors. Motives, attitudes, and
personality often distinguished between the effective and
non-effective instructors. Many of the perceived best
instructors seemed to be "naturals" exhibiting specific and
similar personality traits. This study investigates the
personality profiles of instructor pilots and will identify
8
the relationship between perceived effectiveness and
personality traits that complement performance ratings.
Statement of the Problem
Military student pilot attrition rates during
undergraduate pilot training remains high, costing taxpayers
millions of dollars each year. Past and current military
efforts to control student attrition focuses on student
selection screening; however, student attrition rates have
stagnated near 20% for over the past 14 years (Davis, 1989).
Previous research suggested that instructor pilot
performance may provide further control over student
attrition (W. Davis, 1990). This study proposes the more
effective instructor pilots possess a certain personality
profile that is more conducive and accommodating to the
instructor role. Therefore, personality trait research
should be redirected from pilot candidate selection to
instructor pilot classification and placement.
Purpose Statement
The purpose of this study is to identify a new
instructor performance assessment instrument and to examine
the relationship between the personality trait
characteristics of Air Force Instructor Pilots and their
perceived performance ratings as determined by three groups:
students, peer instructors, and supervisors. The three
rating groups provide a global performance assessment
(officership, flying, and instructional). The perceived
validity of a new performance appraisal instrument, the
NASA/UT Astronaut Assessment Survey, is explored; along with
a novel 360 degree performance rating technique which
develops performance feedback from the multiple perspectives
students, peers, and supervisors. The study additionally
develops a demographic model predicting perceived
performance effectiveness of instructor pilots, and a
combined personality trait with demographic factors
prediction equation.
Significance of the Study
This research makes a contribution to two higher
education issues facing the aviation industry: provides a
starting point in exploring a possible alternative solution
to reducing student pilot attrition with a new instrument to
assess Instructor pilot performance, and adding new
knowledge to the application of personality theory to
instructor selection and performance assessment.
Current efforts to lower student pilot attrition are
predominately focused on candidate selection. The
overemphasis of a single input variable in the learning
process is an incomplete analysis that ignores other vital
input factors which may affect failures. Astin (1991)
defines inputs as ^ referring to those personal qualities the
10
student brings initially to the educational program
(including the student's initial level of developed talent
at the time of entry)" (p. 17). This study uniquely
investigates a key twist to Astin's definition of input by
investigating the input variable of the instructor.
Educational input qualities of the instructor pilot appear
ignored in UPT. Additionally, the outcome variable of
instructor effectiveness also appears neglected. By
exploring the input varieible of instructors and correlating
these characteristics to an outcome variable of perceived
instructor performance, a better Tinderstanding will be
developed. This could lead to improvements in the
instructional process and decrease student attrition.
The second significant contribution of this study is
its application of personality theory to instructor
selection. Studies are quite extensive in projective
personality testing of varying groups to assure quality
selection (Mischel, 1968) . However, little research has
been aimed at flight instructor classification and desirable
personality types in relation to perceptions of effective
instruction (W. Davis, 1990). The literature is very
limited and lacks empirical evidence in identifying a
preferred type for the role of instructor pilots.
Performance criteria have yielded either weak effects,
equivocal results, insufficiently studied relationship
variables, or inexplicaible findings from cross-validation
11
(Joaquin, 1980). This study establishes a new performance
criteria and further contributes to the development of
personality trait theory applied specifically for aircrews.
Unfortunately, there is neither an agreed upon definition of
"effective teaching" nor any single, all-embracing
criterion. However, according to Cross, students do a
pretty good job distinguishing among teachers on the basis
of how much they have learned (Cross, 1988). Perceived
effectiveness is further strengthened by incorporating
perceived ratings from multiple groups (e.g., students,
peer-instructors, and supervisors). This study uniquely
utilizes perceived performance ratings from multiple groups
to establish an overall performance assessment rating. The
triangulation of perceived performance rating from various
groups also adds a form of cross-validation to the perceived
ratings.
The results will provide a new tool for instructor
performance appraisal and a predictive model that may be
used in building future constructs for selection, training,
and performance measurement of military instructor pilots.
It will also further develop the credible use of personality
theory for aviation selection and classification.
Thesis Statement
The principal investigator contends that instructor
pilots with various levels of perceived performance ratings
12
have common personality trait profiles. These profiles can
be identified with self-reporting personality inventories
and perceived performance ratings from students, peer
instructors, and supervisors.
Assumptions
The following are a list of assumptions used for this
study.
1. Increased effectiveness of instructor pilots will
lead to decreases in student pilot attrition (R. Davis,
1989) .
2. Self-reported personality trait scores are
accurate reflections of true personality trait scores
(Digman, 1990).
3. Overall perceived instructor performance may be
represented by a uniform weighted rating that combines
scores from three direct customer groups: students, peer
instructors, and supervisors (Marsh, 1987).
4. Demographic variables are not significantly
interactive with personality trait measures, as determined
by Hogan (1977), Conley (1985).
13
Research Ouestions
Overall Research Questions
There were two research questions explored in this
study.
1. Do perceived effectiveness ratings establish a
valid assessment of instructor pilot performance?
2. Are personality traits predictive of perceived
instructor performance ratings?
Hypotheses
The research questions were further refined to the
following testable hypotheses.
1. There will be no difference in the appropriateness
ratings of the seven scales from the NASA/UT Astronaut
Assessment Instrument between the three rating groups.
2. There will be no difference in perceived
performance ratings of instructors between students, peer
instructors, supervisors, and self.
3. There will be a significant relationship between
perceived effectiveness ratings of instructor pilots at UPT
and the following personality trait scale scores:
instrumentality, expressivity, mastery, work,
competitiveness, achievement striving.
4. There will be a significant relationship between
the following personality trait scale scores and perceived
effectiveness ratings of instructor pilots at UPT: negative
14
instrumentality, verbal aggression, impatience/irritability,
negative communion.
5. Personality traits can be used to create a
predictive profile of perceived instructor pilot
performance.
6. Demographic characteristics can be used to create
a predictive profile of perceived instructor pilot
performance.
7. Personality traits and demographic characteristics
can be used to create a predictive profile of perceived
instructor pilot performance.
Limitations of the Study
The limitations to this study include the cluster
sampling technique and the personality assessment
instrument, the Personality Characteristics Inventory (PCI).
The most recent Air Force studies by Pedersen, Allan, Laue,
and Johnson (1992) recommends that future personality
measures in aircrew selection should utilize the five-factor
theory, which is currently under development. Parallel
studies by the Naval Aviation Medical Lsiboratories are also
pursuing the development of a five-factor instr\unent. These
instruments are not yet developed and are years away from
being validated. Currently, the most validated and widely
accepted personality instrument in the aviation field for
aircrew assessment is the PCI.
15
The PCI was developed specifically for the aviation
field and modified to assess aircrew relationships. A
review of the literature fo\ind few studies that correlated
personality assessment with aviation instructor performance.
Because the PCI does measure inter-personal relationships
unique to the aviation industry, it represents the best
potential assessment tool for this pioneering application of
instructor pilot assessment. A final limitation is
measuring instructor performance with "perceived
effectiveness." Cohen (1981) determined a marginal
correlation (r=.47) between actual instructor performance
and perceived student rating of instructor performance in a
comprehensive meta-analysis of student course critiques.
Perceived effectiveness ratings of performance may not
provide an accurate representation of actual performance.
This study uses perceived performance ratings from multiple
groups (supervisors, students, peers) to provide a more
relieible indication of actual performance.
Delimitations
This study is limited to the performance assessment
factors measured by the seven scales on the NASA/UT
Astronaut Assessment Inventory: job competence-knowledge,
job competence-performance, job competence-under pressure,
leadership, teamwork, communication skills, personality.
16
Additionally, the study focuses only on U.S. Air Force
Instructor Pilots.
Terms and Definitions
360 degree Performance Feedback. A performance
appraisal technique that uses perceived performance feedback
from multiple groups possess unique perspectives and access
to the subjects work behavior. The rating groups usually
include subordinates, supervisors, and peers.
(AETC) Air Education Training Command. All U.S. Air
Force undergraduate flying training is conducted by this
command. Currently, there are four Undergraduate Pilot
Training bases that are regulated and controlled by ATC
Headquarters at Randolph AFB, Texas.
Achievement Striving. A cluster of characteristics
related to hard work, activity, and seriousness in
approaching work tasks ("How much does your job stir you
into action?" "Compared to others, how much work do you put
forth?") (Chidester, Helmreich, Gregory & Gels, 1991).
Competitiveness. A preference for tasks with clear
winners and losers and a desire to outperform others ("It
annoys me when other people perform better than I do.")
(Chidester et al., 1991).
17 Expressivity. A measure of interpersonal warmth and
sensitivity (gentle, kind, aware of the feelings of others),
(Chidester et al., 1991).
First Assignment Instructor Pilot (FAIP). A recent
graduate of undergraduate pilot training whose first
operational assignment is as an instructor for UPT.
Generally, a FAIP is a Second Lieutenant with a total of 200
hours military flying time and no exposure to operational
flying missions.
Flight. The Air Force structural unit of instructor
and student assignment. In this study a Flight is
synonymous with classroom. A Flight consists of
approximately 15 students, 10 instructors, and a supervisor.
Impatience/Irritability. ("How easily do you get
irritated?" "When a person is talking and takes too long to
come to a point, how often do you feel like hurrying the
person along?") (Chidester et al., 1991).
Instructor Pilot. A pilot qualified in a specific
training aircraft who has completed Pilot Instructor
Training. Generally an IP is assigned two or three
students, however, currently a 1:1 ratio.
Instrumentality. Refers to overall goal-orientation
and independence (active, self-confident, can stand up to
pressure) (Chidester et al., 1991).
18 Major Weapon System (MWS). An experienced pilot from
an operational flying backgro\ind such as: fighters, bombers,
tankers, transports. Generally, MWS IPs are a Captain grade
with approximately 1000 total military flying hours.
Mastery. A preference for challenging tasks and
striving for excellence ("If I am not good at something, I
would rather keep struggling to master it than move on to
something I may be good at.") (Chidester et al., 1991).
Negative Commimion. Self-subordinating, subservient,
or \inassertive characteristics (gullible, spineless,
subordinates self to others) (Chidester et al., 1991).
Negative Instrumentality. Negative characteristics
reflecting arrogance, hostility, and interpersonal
invulnerability (boastful, egotistical, dictatorial),
(Chidester et al., 1991).
Personality Characteristics Inventory (PCI). The test
battery NASA/UT Project found most useful in the
identification of meaningful subpopulations eunong aviators.
The PCI captures two broad trait dimensions: instrumentality
or goal orientation and expressivity or interpersonal
orientation.
Pilot Instructor Training (PIT). A 12-week program
located at AETC Headc[uarters where all instructor pilot
candidates are trained and qualified as instructor pilots in
specific aircraft (i.e., T-37, T-38) .
19 Student Pilot. A commissioned officer selected for
UPT. Selection is based on intense competition including
extensive screening in mental, physical, and basic aviation
skills. Average profile, 95% male, age 23, rank of 2 Lt.
T-37 "Tweet". Twin jet engine, subsonic, side by side
seating, basic jet trainer. The first four months of UPT
flight training occurs in this aircraft. Typical student
attrition in this phase of training is approximately 15
percent.
T-38 Talon. Twin jet engine, centerline thrust, high
performance supersonic, tandem seating, century series style
fighter trainer. Final seven months of UPT training occur
in this aircraft. Typical student attrition of eODOut 5
percent.
Undergraduate Pilot Training (UPT). A 52 week course
to train basic and advanced jet aviation skills to
commissioned officers. Conducted with a common syllabus by
four Air Force bases: Reese AFB, TX; Laughlin AFB, TX; Vance
AFB, OK; Columbus AFB, MS; supervised by Headquarters AETC,
Randolph AFB, TX.
Verbal Aggression. Verbal passive-aggressive
characteristics (complaining, nagging, fussy) (Chidester et
al., 1991).
Work. A desire to work hard and do a good job ("I find
satisfaction in working as well as I can.") (Chidester et
al., 1991).
20
Sunanary
Chapter I introduced a problem regarding the attrition
rate among military student pilots. It was suggested that
input and outcome variables concerning personality trait
characteristics of the instructors and perceived instructor
effectiveness may play a significant role in instructional
effectiveness and thus impact student attrition rates.
Perceived performance ratings are a vulnerable and
subjective measure of true performance. This study utilizes
multiple observer groups with different insights into the
overall instructor job, to establish a weighted overall
perceived performance rating for each instructor. This
feedback is useful for Instructor development baseline data
and possible future evaluation.
Field observation also identified common personality
profiles among perceived "quality" instructors. It appeared
the commonly identified best instructors had similar
personality traits that complemented learning. This study
investigates the relationship of personality traits and
perceived performance effectiveness. The purpose is to
identify specific personality characteristics that foster
student learning and success, and to explore the validity of
a new performance assessment instrument and rating
technique.
Chapter II presents a review of relevant literature
concerning perceived performance ratings, personality trait
21
theory, and past studies of the topics in both education and
aviation environments. Chapter III explains the procedures
and methodology utilized to conduct the study. Chapter IV
presents the research findings. Chapter V discusses the
interpretation of the findings and contains recommendations
for future research.
CHAPTER II
REVIEW OF THE LITERATURE
This chapter contains a review of the literature
concerned with personality trait prediction in perceived
instructor pilot performance. The first section reviews the
use of personality theory in predicting job performance,
which provides the theoretical basis for the present study.
It includes discussions illustrating the background of
personality psychology development, defining "Type" theory
and its application, and defining "Trait" theory and its use
in the present research. The second section discusses
aviation personality research, its beginning, development
and recent renewed interest. It includes two prominent
personality assessment tools in aviation selection: the
Personality Characteristics Inventory and the Big-Five
factor model. The third section examines job performance
assessment, covering performance appraisal criteria and the
360-degree rating technique. The final section reviews
faculty assessment techniques ranging from student critiques
to peer reviews.
Personality Theory
Personality theory is a subdiscipline of psychology.
It became an empirically based scientific field of
psychology with the release of G. W. Allport's book (1937),
22
23 Personality: A Psychological Interpretation. Allport used
the labels "nomothetic" and "idiographic" to explain two
different and distinct approaches currently used in
psychological inquiry. Nomothetic describes the search for
general laws, whereas, idiographic describes what is
particular to the individual case. Allport believed
psychology had developed exclusively into a nomothetic
discipline ignoring the \inique consideration and importance
of individual. He advocated the psychology of personality
should employ both nomothetic and idiographic approaches to
understand people as well as particular individuals
(Allport, 1937). As a result, personality theory has
developed into two disciplines with two different
objectives, one that studies human nature, and another that
studies the unique individual case. This present research
investigates personality from a human nature perspective.
Generalizations across a homogeneous group of subjects are
explored.
The field of personality has evolved to include five
tasks: describing, generalizing about, explaining,
predicting, and intentionally changing behavior at each of
the three levels of (1) persons-in-general; (2) groups of
persons; and (3) individuals (Runyan, 1983). The common
observation of all of these tasks is behavior. In
personality psychology behavior is attempted to be
explained, predicted, or controlled. The difficulty in
24 assessing or manipulating behavior is inconsistency.
Individual behavior differences across various situations
over time are inconsistent, at least in the short-run (Weiss
& Adler, 1984). Recently, Epstein and O'Brien (1985)
esteQjlished a new aggregation technique that provides cross-
situational stability for behavior when applied
longitudinally. The new credibility of reliably measuring
behavior has renewed interest in personality research.
Background
Personality psychology has suffered an erratic and
turbulent history. Allport's emphasis in individuality
remained controversial for over a decade. Finally being
accepted as a credible field of psychology, new questions
arose concerning generalizations of personality findings.
Psychologists began to arcfue the appropriateness of mixing
nomothetic and idiographic conclusions. Runyan (1983)
cautioned that learning what is true about persons-in-
general often has substantial limitations in eneibling one to
understand and predict the behavior of individuals. This
premise was underscored by the very influential writing of
Mischel's (1968) Personality and Assessment.
In what is now considered a classical reference in
personality research, Mischel reached some very critical and
pessimistic conclusions concerning the prediction potential
of personality research. He examined the methods and
25 conclusions of post-World War II personality research and
challenged the recent development and use of personality
findings. Mischel (1968) concluded personality measures
were very limited in predicting behavior. In his research,
he found poor correlation ranging between .20 and .30 among
personality dimensions and predicted behaviors. He
additionally found a poor consistency in the ability of a
personality dimension to predict behavior across similar
situations. Mischel successfully attacked the validity and
reliability of past personality measures and predictions. A
screeching stop and ridicule were cast upon personality
research that would last a decade.
Mischel believed the small correlation between
personality and behaviors implied the situation was
significantly more dominant. He changed the emphasis in
personality research to a cross-situational debate. Instead
of defining the task of personality research as inferring
global, steLble dispositions as individual differences,
Mischel redefined it in terms of predicting specific
behaviors across different situations. He specifically
questioned the pre-existing premise that self-reported
personality measures correlated with observations and noted
the low (r=.30) relationship. He attributed this poor
relationship to his belief that behavior is situationally
determined and preferred social learning theory explanations
rather than personality.
26 Shortly after Mischel's critique, privacy issues
temporarily terminated the use of personality measures in
the workplace. Ethical responsibility to protect an
individual's right to privacy and confidentiality dominated
over the use of personality research. Researchers and
industry were intimidated by the class-action lawsuits
concerning privacy and chose instead to cease personality
assessment (Barrett & Kernan, 1987). By the mid-197 0s,
personality research was all but abandoned.
Not until the early 1980s did personality researchers
respond to Mischel's writings. A collage of research began
to emerge and address Mischel's critiques. The first issue
to be addressed was the small correlation. Although
Thorndike (1906) and Mischel (1968) pointed to the small
correlation between behavior at different times, Epstein
(1979, 1980, 1983, 1984) identified an error in their
aggregation technique. Epstein cited the Spearman-Brown
prophecy formula which told that the correlation between any
two single behaviors was necessarily low. However, when
assessed across several situations correlation rapidly
increases. This tendency was duplicated by personality and
behavior correlation (McGowen & Gormly, 197 6).
Additionally, Mischel's critique of the small correlation
was refuted by studies that produced personality/behavior
correlation exceeding .30 (R. Hogan, DeSoto, & Solano,
1975). Mischel's criticisms were finally answered using the
27 same argument he used on earlier personality research, his
conclusions were incomplete and based on faulty research
techniques.
About the same time Mischel's statistical and
behavioral critiques were addressed, privacy issues were
resolved. Extensive costs and responsibilities associated
with employee selection and training stimulated industry to
re-instate personality assessment techniques. Professions
such as nuclear security and law enforcement emphasized the
need for employees with proven stable personalities (Gough,
1969) . Personality assessment was re-integrated in industry
by including it in a series of selection batteries. Privacy
issues were circumnavigated by making the testing process
volxintary, but mandatory for employment consideration in
certain security related positions. Furthermore, an
applicant was not refused employment due to scores on any
one testing battery, but scores based on several instruments
along with an interview (Barrett & Kernan, 1987) . The
personality testing was not a sole source for refusing
selection, but instead highlighted areas of concern for the
interviewer to further explore. Privacy issues were
resolved by integrating personality assessment as a series
of testing batteries that complemented an interview process
in screening employee selection.
Personality research has thus evolved through a stormy
process to become a credible s\ibdiscipline of psychology.
28 It has grown to represent two different and distinct
paradigms, one based on human nature and another concerned
more specifically with the individual. Concerned with
explaining, predicting, or controlling behavior, personality
research is dependent on behavioral observation and
reliability. Withstanding volatile critiques concerning low
correlation and inconstancies with behavioral situations,
and privacy issues in the workplace, personality psychology
has emerged as a stronger, credible field of psychology.
A further distinction in defining personality involves
perspective. How personality is defined depends upon whose
perspective is viewed, the individual or the observer. The
individual perspective is based on an inner nature of
individuals which explain "why" an individual behaves in a
characteristic way. The innate characteristics provide
structures, dynamics and processes that are useful in
describing why an individual behaves in the manner
perceived. This type of personality is private, innate
information and must be inferred. On the other hand, the
"observer" perspective refers to a person's "social
reputation" and how that individual is perceived by others.
This concerns the eunount of esteem, regard, or status that
person has within a social group. It includes descriptive
terms such as dominant, passive, considerate, and ruthless.
This perspective of personality is based on reputations and
past behaviors. It is both public and veriflcLble. Hogan
29 (19 87) reports that personality from an observer's
perspective may be very useful in performance prediction,
"Because reputations summarize a person's past behavior, and
because many writers believe that the best predictor of
future behavior is past behavior, reputations may be a
useful way to forecast trends in a person's performance" (p.
145) .
Like personality, trait also has two meanings which
correspond to the two meanings of personality. Based on the
social reputation aspect, trait is a neutral descriptive
measure (i.e., aggressive) that tells how we may expect an
individual to behave, but not why (Buss & Craik, 19 83).
From the inner structure perspective, trait is an innate
psychological feature such as attitudes and emotions. This
use of trait can be used to explain behavior, but must be
inferred (Allport, 1961).
Thus, defining personality involves another
distinction, perspective. An observer's perspective
involves an Individual's social reputation and may be
measured empirically using trait descriptives that describe
neutral measures such as aggression. The individual
perspective explores an inner structure that can be used to
explain or account for that reputation using another form of
trait descriptives that measure more subjective items such
as attitude and emotions. The present study explores
personality measures through the observer's perspective
30 using associated neutral and empirically measured trait
descriptives.
Type Theory
From an observer's perspective of personality we
attempt to describe and predict other people's behavior by
classifying them into categories. These categories are
called "Types," which simply consist of trait conglomerates.
Two people in the same type category will share
approximately the same traits, but will rarely have the
precise same traits. A common example of the usage of type
categories are Type A and B personalities. Type A
individuals are classified as excessively competitive,
having exaggerated time urgency, and a high level of
hostility and aggression (Glass, 1977; Matthews, 1982).
Although two individuals may fit the Type A behavior
pattern, both will have distinctly different traits (i.e.,
introversion/extroversion, assertiveness, etc.).
The first systematic type theory is credited to Galen,
a Greek philosopher in the second century A.D.. He
identified four types of people in the world: the sanguine,
who is always cheerful and upbeat; the choleric, who is hot-
tempered and self-dramatizing; the melancholic, who is
lugubrious and fretful; and the phlegmatic, who is stolid
and unflappSLble (Roback, 1927). Galen's types were based on
31 a crude biochemical theory framed in terms of four humors:
black bile, yellow bile, phlegm, and blood.
Type theories are the oldest and most consistent means
of classifying personalities of other people. Throughout
history, personality type has constantly been rediscovered
and revised. Galen's theory was revitalized and cited in
Immanuel Kant's Anthropologie (1798). Wilhelm Wundt (1874)
sophisticated Galen's theory, stating the types were based
on neurological mechanisms rather than humors. Revisions
and expansion of Type theory continued with many interesting
conceptual variations being developed in this century.
Jung's (1923) theory of psychological types stimulated the
development of the Myers-Briggs Type Indicator (MBTI; Myers
& McCaulley, 1985). Spranger's (1928) theory of types led
to the development of the Study of Values (Allport, Vernon,
& Lindzey, 1951). Holland's theory of personality and
vocational types lead to the Self-Directed Search (SDS;
Holland, 1985). Perhaps Holland's work with matching
personality types with vocations is the most popular use of
Type theory today.
In his RIASEC model, Holland proposes six ideal
personality types, each defined in terms of a distinctive
pattern of interests, competencies, vocational choices, and
problem solving styles (Holland, 19 85). The Realistic type
(an engineer or technician) is mildly introverted and
conforming, has concrete practical interests, and prefers
32 traditionally masculine careers. The investigative type (a
scientist or researcher) is mildly introverted and
nonconforming, has abstract theoretical interests, and
enjoys intellectual work. The Artistic type (a writer or
musician) is unconventional and sometimes nonconforming, and
enjoys working on open-ended desicrn problems. The Social
type (a minister or human resource person) is
unconventional, extroverted, idealistic, and enjoys helping
people. The Enterprising type (a salesperson or manager) is
extroverted, aunbitious, and enjoys leadership positions and
manipulating others. The Conventional type (an accountant
or data processor) is conforming, orderly, and pragmatic,
and enjoys problems that have clear-cut solutions.
Especially powerful of Holland's model is the overlap
between types. He describes individuals in terms of two or
more of the type categories. Holland has successfully used
personality types to match vocations based on their
psychological demands (Driskell, R. Hogan, & Salas, 19 87).
Education has also made valueible use of classification
and type theory. For decades students have been categorized
in education based on intelligence, skill level, handicaps,
and most recently, learning style. Educational
psychologists have used type theory to help match the
individual needs and cLbillties of students with specifically
engineered teaching and learning processes. A typical
learning style typology considers four major dimension of an
33 individual student: overt behavior, cognitive behavior,
motivational attitudes and affective attitudes (Golay,
19 82) . The student is then categorized using learning style
(type theory) based on their optimal learning profile. One
contemporary type theory which is based of student
personalities is Keirseian Temperament Theory (KTT).
KTT is a holistic personality approach which attempts
to match student personality types with specific classroom
environments which best facilitate learning for that type of
student (R. Dunn & K. Dunn, 197 8). There are four basic
temperament styles in the KTT paradigm: The Dionysian, The
Epimethean, The Promethean, and The Apollonian. Each type
displays characteristic patterns of thinking and behavior.
The Dionysian is action oriented and must be free to act.
Their learning is best described by the phrase, "To do is to
Learn." The Epimethean is duty oriented and prefers an
established hierarchy of control. This type of student
prefers structure, order, and planning. The Promethean is
described as having an insatieible desire to acquire
intelligence and to become competent. To them life is a
riddle waiting to be solved. Finally, the Apolloniem is an
individualist searching for their own way amd is very
people-oriented. Relationships and emotions are very
dominant learning media for the Apollonian.
The use of type theory in education has recently
extended to include the instructor and teacher. The most
34 common application is matching the student to an instructor
with a similar learning type (Robinson & Gary, 1974). A
recent extension to this approach was developed by Broudy
and extended by Hudak and Anderson (1984) suggesting
teacher's personalities cause them to place different
emphases on students' knowledge, thinking skills and
enjoyment (attitude). This typology places teachers into
four types based on their greatest classroom emphasis among
enjoyment, thinking, and knowledge: The Philetic instructor
prefers an enjoyment emphasis. The Didactive instructor
expresses a knowledge emphasis. The Heuristic instructor
displays a thinking emphasis, and The Normative instructor
has an equal emphasis of all three dimensions (Porter,
1991).
Personality type theory today is well established in
modem organizational psychology paradigms. It is commonly
used in career choice, person-environment fit, and personnel
selection (J. Hogan & R. Hogan, 1986). Holland's integration
of personality and vocation highly complement this project's
research. It appears there "ideal," or better suited
personalities, for various vocations. This study attempts
to identify the ideal personality trait profile for a
military instructor pilot.
35 Trait Theory
It is important to note the difference between traits
(personality dispositions) and types. Allport opposed the
notion of types because it ignored individual differences,
and an individual could be fitted into several different
types, pending the category. For instance, an individual
could be the intellectual type, the witty type, a fastidious
type, and many more. Allport preferred trait descriptives
because they were custom aggregation descriptives that
describe the whole individual.
In the early 1930's, Allport began developing a trait
lexicon, a listing of English trait words (Allport & Odbert,
1933) . The lexicon contains all the terms that English-
speaking people use to describe one another. The structure
of the trait vocabulary is related at some degree to the
structure of personality from the observer's perspective
(Wittgenstein, 1953). Cattell (1947) used factor analysis
to collapsed the trait lexicon of 23,000 terms into a 140-
item structure of personality. Further correlational study
reduced the structure from 140 items to 16 factors. Fiske
(1949) furthered the investigation and streamlining of the
lexicon to ultimately resolve five factors describing the
structure of personality (Big Five). These five factors
have been replicated over decades across various
populations, age groups, and languages (Borgatta, 1964;
Botwin & Buss, 19 89; Digman & Takemoto-Chock, 19 81;
36 Goldberg, 19 82; John, Goldberg, & Angleitner, 19 84; McCrae &
Costa, 1985; Peabody & Goldberg, 1989) .
The Big Five personality trait model is composed of
five factors: Neuroticism, Extroversion, Conscientiousness,
AgreeadDleness, and Culture. The first, Neuroticism or
Adjustment, is defined at one end by terms like nervous,
self-doubting, and moody and at the other by terms like
stable, confident, and effective. The second factor.
Extroversion or SociaOjility, is characterized at one end by
such terms as gregarious, energetic, and self-dramatizing
and at the other by such terms as shy, unassertive, and
withdrawn. The third factor is usually called
Conscientiousness. It is anchored at one end by traits like
planful, neat, and dependeible and at the other by impulsive,
careless, and irresponsible. The fourth factor is generally
called Agreeableness. One end is marked by such words as
warm, tactful, and considerate; the other end reflects a
combination of hostility and unsociability and is denoted by
words like independent, cold, and rude. The final factor.
Culture is defined by trait terms such as imaginative,
curious, and original; it is defined at the other end by
terms such as dull, unimaginative, and literal-minded.
(Hogan, 1987).
The application of personality trait theory in
education has produced very marginal results. Numerous
types of instruments have been explored consisting chiefly
37 of two mainline "off-the-shelf" surveys, the California
Personality Instrument (CPI) and Catell's 16 Personality
Factor Survey (16PF). Although a bit dated, Getzels and
Jackson (1963) concluded after reviewing over 2 00 studies on
teacher personality that:
Despite the critical importance of the problem and a half- century of prodigious research effort, very little is known for certain about the nature and measurement of teacher personality, or about the relation between teacher personality and teaching effectiveness. The regrettaible fact is that many of the studies so far have not produced significant results, (p. 574)
Medley (1973) and Gephart (1979) updated Getzels and
Jackson's earlier work, only to echo the same findings of no
significance.
The most encouraging results were obtained with a
survey customized specifically for teacher personality
assessment, called the Personality Research Form (PRF). The
PRF was developed by Douglas Jackson in 1974 as a general
personality research instrument (Jackson, 1974). The PRF
was subsequently reviewed and found to have sound
psychometric validity (Anastasi, 1972, 1976; Hogan, 1978).
One version of the PRF was modified specifically for teacher
personality assessment. Like previous teacher personality
research, it also determined weak correlations between
teacher personality and student classroom performance. In
19 82 the PRF was applied to a special type of teacher, one
who performs a more mentoring role such as music teachers,
tutors, and skills instructors. Seven of the 17 trait
38 measures on the PRF repeatedly indicated significant
correlations with student performance (p<.01), when applied
to these type of instructors (Bridgewater, 1982). The
findings were replicated over many designs with the same
seven personality traits emerging significant: Achievement,
Autonomy, Dominance, Endurance, Desirability, Aggression,
and Social Recognition. Additionally, two demographic
variables also resulted in moderate correlations with
student performance: Age (r=.51, p<.01), and Years of
teaching experience (r=.86, p<.001).
Due to its accepted validity and apparent success the
PRF became part of a Teacher Characteristics Study designed
to assess teaching effectiveness across various education
levels. Disappointingly, no significant findings resulted.
The PRF appears only effective when applied to mentoring
instructors with smaller student groups. This is exactly
the role of instructor pilots in undergraduate pilot
training. The PRF, or excerpts of some of its previously
significant trait measures, may be ideal for instructor
pilot personality assessment. Researchers at Armstrong
LaJDoratories, the U.S. Air Force Human Performance Research
Center, are using the PRF to build a new Five Factor
instrument. Personality trait measures from the PRF have
provided the starting point for new research in personality.
The Big Five trait model is the leading edge of
personality trait research today. Due to its recent
39 development, it is still relatively unexplored for many
applications. The five-factor trait theory's most potential
application may parallel Holland's work by matching vocation
with personality. Job analyses typically reveal that
certain personal attributes are necessary to perform a
particular job adequately (Gottfredson, Holland, & Ogawa,
1982) . Job performance appraisal are not only job specific,
but also include judgments about interpersonal performances
-- these judgments are often what is meant by personality
from the observer's perspective (J. Hogan & R. Hogan, 1986).
This study explores a personality trait theory applied to a
specific aviation vocation.
Aviation Personality Research
Early Military Development
When the United States entered World War I, the Army
had no selection or classification system to efficiently
build a large standing fighting force. As a result, a group
of psychologists were called upon to develop a series of
testing batteries that could determine an individual's
training aptitude. After the War ended, several
psychologists continued selection assessment research and
additionally began investigating hximan error causes of
aviation accidents. In 1919, at Kelly Field, Texas, a new
aviation candidate selection instrument was developed,
consisting of: an intelligence test, a test for emotional
40 Stability after shooting a handgun, and a test for measuring
one's sense of balance (Henmon, 1919). The United States
military aviation selection and screening assessment was
officially established.
Progress in aviation selection instriaments stagnated
until World War II. Once again war created a new and
greater demand for aviators. The need for selection
screening and classification of recruits was even greater
due to the rapidly progressing aviation technology demanding
greater technical knowledge of recruits, and the addition of
new aircrew positions. The criteria for aviator selection
evolved beyond simple physical qualifications and desire. A
low cost screening program was needed not only to select
recruits, but to also classify candidates into positions in
which they had a high probability of success in training.
The Army Air Force School of Aviation Medicine' s Departiment
of Psychology was tasked with creating a new selection
instrument. Their subsequent product was called the Army
Air Force Qualifying Examination (AAFQE). The AAFQE tested
aptitude, attitude, and motivation. Aviation candidates who
scored high on the AAFQE were then given an additional
aircrew classification battery, which consisted of 14 more
tests. The use of the AAFQE and aviation classification
battery reduced by more than 50 percent the number of
preflight school entrants necessary to maintain the same
41 number of advanced pilot training graduates (North &
Griffin, 1977) .
The new selection batteries were a tremendous
improvement; however, they were only effective with a large
number of candidates, since individuals were "selected out"
if considered unsuitable for training. In other words, from
the pool of recruits individuals were selected out not to
continue consideration for aviation selection based on some
form of potentially disabling psychopathology. The
batteries would not be suitable in today's environment where
a small number are "selected in" from a large pool of
candidates where candidates are selected in based on the
optimal qualifications. The "select in" is a more efficient
and effective process of identifying future success (Spence
& Helmreich, 1983). At the end of the war, efforts were
made to replace the AAFQE and aircrew selection battery due
to extensive costs associated with their "select out"
design. Over 20 studies investigated commercial instrument
alternatives, but with little success. Part of the reason
may have been the commercial instruments were designed to
identify abnormal psychological conditions, rather than to
predict success in performance (Anastasi, 1976). The
commercial alternatives were reliable when used against
psychiatric criteria (clinical evaluations), but were not
reliable when used against performance criteria (Rossander,
1980).
42 Personality assessment in aviation selection since
post-World War II has experienced a very limited success.
Jet Age assessment concentrated on pilot selection criteria
rather than classification, emphasizing intelligence
measures and previous flying experience. Numerous
personality measures were explored, but revealed little
validity. In a review of Navy selection research. Griffin
and North (1977) found that approximately 40 different
personality paper-and-pencil test devices had been evaluated
from 1970 to 1976 for pilot selection without any
appreciable impact on training success for the selection of
aviator candidates. They contended one of the major reasons
for this lack of success was that applicants were prone to
select answers that made them appear more desireible than
answers that reflected their personalities. The respondent
may be motivated to "fake good" or choose answers that
create a favoreJ3le impression (Anastasi, 197 6). Demand
characteristics have compromised the use of commercial
personality instruments in aviation selection as applicants
competed to be selected. A more effective application, and
better controls on "faking," in aviation personality
assessment may be found in the classification process. The
classification process is less threatening to candidates
than selection because it simply tries to match a candidate
skills with the most appropriate job. This present study
explores the potential use of personality in military
instructor pilot placement. Rather than focus on the
initial pilot candidate selection process, this study
investigates the use of personality measures to match an
already existing military pilot with the instructor pilot
vocation. By matching a military pilot's personality
profile with personality profiles that best complement
effective instructor pilots, student pilot attrition may
decrease.
43
Recent Renewed Interest
In the past 20 years, validity of self-reported
personality instruments has improved by incorporating more
sophisticated "lie scale" detectors (Graham & Lilly, 1984).
This, along with new personality instruments designed
specifically for aviation, has increased validity and
correlations of personality measures in aircrew selection
thereby renewing interest in its potential application.
Robert L. Helmreich, Department of Psychology, University of
Texas at Austin, championed the re-integration of
personality assessment in aviation by advocating,
"Personality may be a limiting factor on an individual's
flying performance potential and that personality research
may not only improve selection, but may also help in the
design of training" (1986, p. 87). Not only was selection
underscored, but Helmreich astutely identified the future
potential of personality in the classification process.
44 This perspective was officially echoed by the Air Force
Human Resources Laboratory (AFHRL) which cited:
personality factors were found to predict pilot training
outcome measures...(and) different combinations of
characteristics, rather than the simple presence or aLbsence
of a key personality trait, appeared to be a better
predictor of pilot training outcomes (Siem, 1989).
All branches of the U.S. military are in agreement,
personality measures are again needed in aircrew selection
and training. The Naval Aviation Medical Research
Laboratory (NAMRL) has officially concluded it is no longer
desirable to rely on aptitude alone for pilot selection and
the personality factor is rapidly emerging in importance
(Dolgin & Gibb, 19 88). The Army has similar conclusions
citing its official integration of personality assessment in
Army Fixed and Rotary Wing selection batteries (North &
Griffin, 1977). Personality measures are recognized
predictors in specific aspects of military selection
criteria. McHenry et al. (1990), while investigating
personality and aptitude predictors, concluded that
personality measures were the best predictors of criterion
measures such as leadership, personal discipline, and
military bearing, whereas aptitude measures were the best
predictors of criteria such as technical proficiency and
soldiering proficiency.
45 Both military aviation laboratories, NAMRL and AFHRL,
are actively pursuing new personality measures and
applications in aircrew selection, classification, and
training. In developing their new personality research
programs, both lahs have unilaterally subscribed to future
personality research criteria recommended by Steven
Kozlowski: (1) the selection of traits to be measured should
be based on sound research; (2) a clear relationship should
be shown between those traits and successful job
performance; (3) the test measuring these traits should show
high reliability and validity and not be susceptible to
response bias (faking); and (4) conclusions should be based
on a sound research strategy in order to explain the
validity of these personality traits as success predictors
(Kozlowski, 1978; Dolgin, & Gibb, 1988).
The Personality Characteristics Inventory
Robert Helmreich is a pioneer in developing aviation
personality measures to meet Kozlowski's recommendations.
He developed one of the aviation industry's most accepted
personality assessment instruments, the Personality
Characteristics Inventory, PCI (Appendix A) (Siem, 1987).
The PCI is modified specifically for aviation selection and
is derived from two other personality tools, the Extended
Personal Attributes Questionnaire (EPAQ) and the Work and
Family Orientation Questionnaire (WFOQ). The PCI measures
46 both positive and negative personality traits. Positive
traits include assertiveness, interpersonal orientation, and
aggressiveness; negative traits include verbal
aggressiveness, hostility, and submissiveness (Helmreich &
Wilhelm, 19 89). Assertiveness reflects an individual's
feeling for independence, performance under pressure, and
decision making ability; interpersonal orientation reflects
concern for and interaction with others; aggressiveness
reflects a need for security, reaction in a crisis
situation, and need for approval of others; hostility
reflects arrogance, greed, and cynicism; verbal
aggressiveness reflects need to nag and complain; and
submissiveness reflects gullibility and servility. The WFOQ
contribution to the PCI scales assesses achievement
motivation. The three scales used are mastery, work
orientation, and competitiveness. Mastery represents the
desire to undertake new and challenging tasks; work
orientation is the motivation to do a task well; and
competitiveness measures the desire to outdo the performance
of others. Mastery and work orientation are positive
predictors of success and performance; competitiveness has
been shown to correlate negatively.
A majority of the PCI was developed in 197 8 using
academic scientists. Initial research explored specific
trait constructs of the "Type A" behavior pattern. Results
indicated two constructs best identified Type A behavior.
47 Achievement Striving, and Impatience/Irritability. A second
major finding identified an artificial personality
phenomenon called "the honeymoon effect." Essentially, the
honeymoon effect accounts for why personality measures may
have marginal to weak correlations with job performance.
During training or the first few months on the job, negative
personality measures are suppressed by the individual. The
novelty or newness of the job masks negative personality
measures such as Mastery. Helmreich and Wilhelm (1989)
found these negative personality measures to significantly
emerge as predictors in later performance.
The PCI results were replicated in the aviation
environment. A national airline implemented a longitudinal
study using the PCI for selection and subsequent job
performance follow-up. Their results emulated Helmreich's
and Wilhelm's. There was a difference in significant
personality predictors between selection and job
performance. The job performance predictors included more
of the negative personality measures. These negative
personality measures remained as stable predictors over the
few years of job performance assessment whereas the
screening predictors rapidly lost validity a few months
after selection (Chlldester, 1988).
Helmreich developed and tested the PCI in direct
subscription to Kozlowski's four recommendations for
maximizing future personality research success: (1) the
48 selection of traits were identified from initial research of
scientific attainment and academic performance (Helreich &
Spence, 197 8); (2) a clear relationship was shown between
traits and successful job performance (Helmreich, Spence,
Beane, Lucker, & Matthews, 1980), Helmreich found a
significant correlation between the PCI and pilot
personality as measured by Federal Aviation Administration
(FAA) flight inspectors (Helmreich, 1982, 1987); (3) the
test shows high reliaibility (Bluen, Barling, & Bums, 1989) ,
the instriiment includes a "lie scale" based on statistical
combinations of improbable answers on different subscales
(Helmreich & Wilhelm, 1989) ; (4) conclusions are based on
sound research strategy validated by a national airline and
specially trained Check Airmen (Chlldester, 1988).
At the time of this research, the PCI is the aviation
industry standard in personality assessment. For over a
decade, the PCI has established credibility in validity and
relicLbllity measures. Correlations have increased, "faking"
minimized, and new applications explored. Helmreich's PCI
has clearly estadDlished recognition for personality
assessment in commercial aviation, but does the PCI apply in
military aviation? Most of the baseline for the PCI was
estcUDlished using commercial transport pilots. Helmreich's
initial research implies there should be no difference
between the two groups of pilots (Gregorich, Helmreich,
Wilhelm, & Chlldester, 1989).
49 The Big Five
Personality and job performance research over the past
25 years has resulted in small correlations and low
validities (Ghiselli, 1973; Guion & Gottier, 1965; Locke &
Hulin, 1962; Schmitt, Gooding, Noe, & Kirsch, 1984). At the
time of this research, however, there was no uniform or
well-accepted taxonomy for classifying personality. Various
studies explored different traits with different
definitions. As a result, it was not possible to determine
if there were consistent findings between specific
personality constructs and performance criteria in different
occupations (Barrick & Mount, 1991). During the past 10
years, many personality psychologists have come to accept
five general factors to represent the structure of
personality.
There is some controversy concerning the personality
construct composition of the five factor model. The most
commonly accepted structure is called the "Big Five" based
on Norman's Big Five which include: Extroversion, Emotional
Stability, Agreeableness, Conscientiousness, and Culture
(Norman, 1963). There are some researchers that disagree
with the simplistic five-factor model. They believe the
factors are in^recise and lack specification of the
personality dimensions (Briggs, 1989; John, 1989; Livneh,
1989; Waller & Ben-Porath, 1987). Other researchers are
under much smaller disagreement and believe simply that
50 another factor should be added to the model to create a six
dimension model (Hogan, 19 86). The sixth dimension is
created by splitting the Extroversion dimension into two
more specific factors. Sociability and Ambition.
Current five-factor research has resulted in some very
promising findings. Tett, Jackson, and Rothstein (1991)
used a meta-anlaysls review of 494 previous personality
studies applying the five factor model. Personality scale
prediction means more than doubled in validity from (.12) to
(.29); and an even higher mean (.38) was obtained using job
classification. Correlation mean validities across the five
factors used in the meta-analysis ranged from .16 to .33.
Additional five-factor research specifically
investigating job performance criteria (job proficiency,
training, proficiency, and personnel data) had similar
successful results. Barrick and Mount (1991) investigated
the five factor constructs related to five occupational
groups (professionals, police, managers, sales, and
skilled/semi-skilled). They found the Conscientiousness
dimension consistent with all job performance criteria for
all occupational groups. The Extroversion dimension was a
valid predictor for two occupations involving social
interaction, managers and sales representatives.
Additionally, the Extroversion dimension was a valid
predictor across all occupations for training proficiency.
51 Significant potential of the Big Five has also been
identified in the military aviation environment. Siem and
Murray (1994) had 100 USAF pilots rate the appropriateness
of 60 personality traits concerning performance of flying
skills and crew management. They identified
Conscientiousness as the most important determinant of
performance across the personality dimensions. The findings
acknowledge the ambiguity of the five factor definitions and
recommended further study to accurately define and measure
the five dimensions. Although promising, Siem and Murray's
findings underscore the ambiguity of the five-factor model.
The vagueness and oversimplistic structure of the five-
factor model is a common concern among personality
researchers. The strongest critique is its limitation in
prediction (Hough, 1988, 1989; Hough, Eaton, Dunnette, Kamp,
& McCloy, 1990). Researchers argue the Big Five is too
broad and heterogeneous, and more dimensions are needed for
accurate prediction of job performance. Hough (1992),
investigating the job performance of Army soldiers with the
five-factor model, discovered severe limitations and
omissions with the model. Hough identified nine trait
scales were needed to accurately predict performance rather
than five. Missing from the five-factor design were scales
that measured Dependability, Achievement, Potency, and
Affiliation. Also mentioned in the findings were
observations that Locus of Control and Rugged Individualism
52 were important attributes in military performance, but also
missing from the five factor model.
This present study assessed over 20 personality
instruments in selecting an appropriate measure for military
instructor pilots. Because the Big Five is still being
refined by military psychologist and lacks longitudinal
validity and reliability measures, psychologists at both the
NAMRL and AFHRL recommended the PCI for this study. The PCI
offered three important and unique aspects over other
instruments: (1) the PCI is "off the shelf" with established
reliability and validity measures; (2) the PCI is widely
accepted in the commercial aviation industry and is
considered credible, (3) the PCI has been refined to control
for the temporary effect of training, "the honeymoon
effect," and is considered a good measure of long-term job
performance.
Job Performance Assessment
Aviation
Previous U. S. military aviation selection research has
yielded low correlations with job performance and training
success. Predictive validities based on intelligence tests
and personality assessment are typically in the 0.15 to 0.25
range (Damos & Gibb, 1986; Greuter & Herman, 1992). Adding
further measures to the selection process such as
psychomotor tests, and information processing tests have
53 increased correlations to 0.20 to 0.40 range, but the range
is too variable to be considered reliable (Carretta, 1992a).
Researchers in contemporary aviation selection research
believe the low correlations from previous studies are in
large part due to the method used in measuring job
performance or training success. They attribute four
reasons for weak predictive validity: (1) range restrictions
of partially screened populations, (2) artificial success
rates imposed by military manpower needs, (3) dichotomized
pass/fail criterion variable, (4) inappropriate performance
test development.
Due to the extensive costs associated with flight
training, the military as well as commercial carriers pre-
screen aviation candidates based on intelligence and
aviation experience before accepting and processing an
application. This pre-screening process imposes a range
restriction in siibsequent selection instruments (Blower &
Dolgin, 1991). Decreasing the range in the predictor
variables will result in a decreased correlation with
criterion varieibles.
A second compromise to correlation values is the
artificial success rate in military pilot training based on
military manpower needs. If the need for the number of
pilots increases, candidates scoring below the usual
selection cutoff criteria may be accepted into flight
training (McFarland, 1953; Hoffelt & Gress, 1993), the
54 flight evaluation may be changed, or the training process
may be extended for weaker students to increase success
rate. The variability of selection criteria, training
process, and success would certainly affect correlations
adversely.
A third explanation for low correlations is the use of
pass/fail success criterion. Although there are specialized
techniques for processing correlations with non-interval
data (i.e.. Spearman-Brown), correlation values may be
substantially lower. Cohen (1983) noted that dichotomizing
the criterion variable at the mean results in a 38%
reduction of effective Seunple size when the population
correlation is between 0.20 and 0.50. As the
dichotomization departs from the mean, the decrease in power
and loss of effective sample size becomes increasingly
severe. Thus, the high success rate in undergraduate pilot
training (75%) effectively limits the correlation (Carreta,
1992b).
A final possible reason cited for low correlations, and
the primary concern for this research, is performance
assessment test development. Thorndike (1949, p. 6) notes
"The tests to be used for selection of aircraft pilots can
be determined only by relating test scores to some later
index of skill in the actual job of piloting a plane."
Regardless of this early and classical guidance, no military
studies predicting operational performance were found
55 (Griffin, Morrison, Amerson, & Hamilton, 19 87). Some
studies have examined the validity of selection tests with
operational performance of fighter pilots and other have
used selection batteries to predict advanced levels of
training performance in fighter type aircraft (Brictson,
Burger, & Gallagher, 1972; Bale, Rickus, & Ambler, 1973,
Blower, 1992); but there was still an obvious lack of
prediction of personality with operational performance,
especially outside the fighter commxinity (Griffin & Shull,
1990). The basic premise of relating aviation selection to
later operational performance requirements suggested by
Thorndike appears to be ignored in military aviation.
This study specifically investigated the relationship
between personality and operational job performance of
instructor pilots, otherwise known as aircrew
classification. Instructor pilots are from a pre-screened
population, but are beyond the control of this research.
Additionally, current IP performance assessment criteria
appears to have inflated success rates, and a dichotomized
performance variable. Therefore, the major consideration
for this study was estSLblishing an appropriate performance
assessment criterion and testing technique. Three primary
factors were involved in this process: identifying the tasks
comprising the instructor pilot's job, determining the
levels of performance for each of the tasks, and identifying
reliable measures of performance on each of the tasks.
56 Performance Criterion
Conventional military aviation performance assessment
instruments are flying skill specific and lack variability.
Current instructor pilot performance evaluation includes an
annual flight check and procedural knowledge test. There is
very little varicJaility in these assessments since the
flight check is a dichotomous variable (pass/fall), with
over 85% in the pass category annually. The procedural
knowledge examination is published and accessible to all
pilots; therefore, it has an even higher pass rate. To best
measure the multiple job aspects of an instructor pilot,
both in and out of the cockpit, a new instrument was needed
that could show more variability and be more comprehensive.
After consultation with Dr. Helmreich concerning development
requirements for a global perforznance assessment of
instructor pilots (IPs), he recommended using a modified
version of the NASA/UT Astronaut Assessment Survey. This
recommendation was endorsed by experts from NAMRL and AFHRL.
The NASA/UT Astronaut Assessment Survey offered four
distinct strengths in assessing IP performance: (1) it is an
"off-the-shelf" instriunent requiring minor modification to
assess the instructor portion of job duties; (2) it has
established developmental validities and relisLbilties based
on multiple astronaut samples; (3) it assesses operational
performance in the three primary IP duties, officership,
piloting, and Instructing; (4) it offers 360 degree rater
57 assessment, allowing perceived performance appraisal from
students, peers, and supervisors.
A copy of the NASA/UT survey is in Appendix A and a
complete description of the survey can be found in Chapter
III under Instrumentation-Performance Measurement. The
instriunent was developed in 1990 under a NASA grant intended
to empirically assess astronaut compatibility for space
station living. It was developed using 84 astronaut
subjects rated for job effectiveness over nine job
dimensions, by 65 supervisors and 22 peers. The job
dimensions included: Communications, Group Living, Job
Competence-Performance, Job Competence-Performance under
Pressure, Leadership, Liking, Personality, Space Station,
Teamwork, and Knowledge. The mean correlations for all the
dimensions ranged from 0.60 to 0.70. An exploratory factor
analysis reduced the nine dimensions to three: Socio-
Emotional, Knowledge and Perforniance, and Leadership. Of
these factors, only the Knowledge and Performance factor
significantly related with operational performance (r=.43),
as rated by peers. Additional findings indicated a high
interobserver agreement among peer ratings ranging from 0.60
to 0.70. Supervisor rating, however, ranged dramatically
and showed weak inter-observer agreement (r=.21) . The two
primary findings that resulted from the NASA/UT Astronaut
Assessment Survey development were the valid performance
criteria dimensions, and a high inter-observer agreement
58 among peer ratings (Rose, Helmreich, Fogg, & McFadden,
1993) .
Minor development modifications of the instrxunent for
military instructor pilot performance assessment was
identified with a pilot study and literature review- Based
on feedback from supervisors, students, and instructor
pilots, performance criteria requirements needed to measure
three primary IP responsibilities: officership, flying
skills, and instructional abilities. Many of the original
NASA/UT survey constructs already measured areas assessing
officership and flying skills. The original Job Knowledge
and Performance constructs (Job Competence-Knowledge, Job
Competence-Performance, Job Competence-Performance Under
Pressure) were retained due to their obvious connection to
performance assessment and their significant correlation
identified in the instrument's initial development.
Additionally, Leadership and Teamwork were specifically
identified as officership measures by the pilot study.
Instructional abilities, however, were more ambiguously
defined.
A review of the literature suggested Communication
Skills and Student/Instruetor relationships were the
predominant factors affecting flight instruction (Bowers,
1953; R. Davis, 1989). Both previous studies investigated
military aviation training environments and concluded that
students with specially trained communicators or instructors
59 trained with good communication skills progressed more
rapidly in training, retained knowledge longer, and
performed more successfully on flight evaluations. The
communication skills of the instructor obviously impacted
student performance. Commimication is considered an
essential skill for instruction, yet instructor pilots
receive very little formal training in communication, and
even less operational feedback assessing their ability to
commTinicate with the student (ATC Study Guide F-V5A-A/B-ID-
SG, 1990). Therefore, Communication Skills was also
retained on the NASA/UT performance assessment instrument.
The only construct added to the NASA/UT performance
appraisal tool was Personality. Student/Instructor
relationships were identified by the pilot study as
important variables in assessing IP performance. Appearing
obvious, the impact of student/instructor relationships were
empirically reinforced by R. Davis (1989) when he Identified
that 12% of student pilots self-eliminate from pilot
training due to stresses and anxieties caused by
relationships with instructor pilots. Additionally, Hopson
(1978) concluded that a large proportion of Naval aviation
attrition can be attributed to motivational factors. It
would appear that approximately ten percent of student pilot
attrition may be prevented if instructor pilots were more
motivational and improved student/instructor relationships.
Motivation and student/instructor relationships were
60 collapsed into a general "Personality" assessment construct
as recommended by Helmreich (Rose, Helmreich, Fogg, &
McFadden, 1993).
The final composition of the NASA/UT Astronaut
Assessment Survey included eight of the original constructs
with only a personality measures added. Levels of
performance were assessed the same as in the previous
NASA/UT format using a Likert scale ranging from Poor to
Excellent with a "Not Observed" category.
Performance Rating
The NASA/UT Astronaut Assessment Survey was designed to
solicit performance ratings from multiple perspectives.
This technique is referred to as a 360 degree rating format
which uses raters from multiple observational perspectives
to describe overall perceived performance. A 360-degree
rating decreases perception error and increases behavioral
observation stability (Schwarz, Barton-Henry, & Pruzinsky,
1985). Many organizational psychologists prefer 360-degree
evaluation techniques, because they represent perceptions
and observations from many diverse settings by informants
with \inique insights (Woodruffe, 1984) . Meta-analytic
results have shown that observers are probably in a better
position to judge an individual's reputation and
performance; as peer-peer, peer-s\ibordinate, and peer-
superior ratings of an individual's behavior had
, 61
substantially higher correlations than self-peer, self-
subordinate, or self-superior ratings of behavior (Harris &
Schraubroeck, 1988). Similarly, Hazucha (1991) reported
that self-ratings of managerial skills failed to
differentiate high performing from ineffective managers, but
observers' ratings of managerial skills clearly identified
both types of managers. Thus, recent research seems to
conclude that multiple perspectives strengthen performance appraisal validity and reliability.
This research incorporates perspectives from superiors,
subordinates (students), and peer instructors to develop an
overall global measure of perceived performance.
Higher Education
There are many purposes to performance appraisal of
faculty in higher education, such as improving teacher
performance, aiding administrative decisions, guiding
students in course selections, meeting state and
institutional mandates, and promoting research on teaching
(Millman, 1987). For this study, improving teacher
performance was the focus. The role of the teacher in
higher education has evolved to place the teacher and the
learning conditions as primarily responsible for pupil
achievement and not the pupil (Travers, 1987). This change
in philosophy occurred at the turn of the twentieth century
and changed the criterion for teacher effectiveness. Early
62 attempts to measure teacher effectiveness under the new
paradigm concentrated initially on test scores of students.
Over the past fifty years this criterion for teacher
effectiveness has again evolved from student test scores to
aspects of teacher behavior related to the growth of pupils
in achievement. By 1973, Roesenshine and Furst summarized
the ideal teacher behavior:
Teachers most effective in producing learning are clear in the expression of their ideas, variable and flexible in their approaches to teaching, enthusiastic, and task oriented, (p. 19)
Over the past decade, research in teacher effectiveness
is again shifting back to the student and away from the
teacher. Although real knowledge has been obtained
concerning teaching effectiveness criteria, measurements are
less clear. Recent research has concluded that pupils adapt
well to many different approaches to teaching, and
quantifying student progress in learning remains ambiguously
defined and dependent on the situation and material (Hoge &
Luce, 1979). It is widely accepted in higher education
today, that teacher performance appraisal is multi
dimensional and reflective of multiple appraisal groups
possessing unique insights to the teachers behavior (Marsh,
1987) . As a result, teacher development and effectiveness
in higher education is primarily measured with student
ratings, peer reviews, and indirect measures of teacher
competence (Travers, 1987). This same criterion provides
63 the basis of instructor pilot performance assessment for the
present study.
One of the more controversial measures of teacher
performance is student ratings. Faculty objections cited
students lack subject expertise and are influenced by course
difficulty and grading practices, which would imply students
are neither qualified, nor reliable as judges of teacher
performance. These concerns have been empirically addressed
over the past thirty years. Aleamoni (1976) found:
Students frankly praised instructors for their warm, friendly, hximorous manner in the classroom, but if their courses were not well-organized or their methods of stimulating students to learn were poor, the students equally frankly criticized them in those areas, (p. 112)
This conclusion was replicated with similar conclusions that
students are informed and relieible judges of teacher
performance (Costin, 1971; Frey, 197 8; Perry, 1979; Ware &
Williams, 1977).
Historically, peer review of a faculty member's work
was used for appointment, promotion, the granting of tenure,
the selection of manuscripts for pxiblication, and the
approval for research grants (Lazovik, 1987). Although peer
review has been widely used in evaluation of research
scholarship, its role in evaluating teaching has been widely
ignored (Batista, 197 6). This trend is rapidly reversing
due to the unique qualification peers can offer to faculty
development and appraisal. According to Lazovik (1987)
faculty peers are uniquely qualified to judge the sxibstance
64 of teaching because: "(1) their knowledge of the discipline
being taught provides the background against which
comparison can occur and (2) their long training in the
evaluation of evidence eneibles them to weigh what is
revealed through docxmentation" (p. 75). Peer-instructors
possess STibject expertise and judgment experience which fill
the gap of student appraisals only. This study utilized
both student and peer appraisals of instructor pilot
performance to provide a comprehensive perspective and
appraisal.
Before student and peer ratings were esteiblished and
accepted as valid faculty performance appraisals, indirect
measures provided primary faculty performance criteria.
Mitzel (1960) labeled this criteria as presage variables
which included "(a) teacher personality attributes, (b)
characteristics of teachers in training, (c) teacher
knowledge and achievement, and (d) in-service teacher status
characteristics" (p.1484). Borich (1977) updated these
leLbels to personality, aptitude/achievement, attitude, and
experience. Although well established in higher education
faculty assessment, presage variedsles are under professional
scrutiny and a bases of polarizing controversy. Educators
contend indirect measures may predict retention in a
teaching position, rather than instructional effectiveness
(McNeil & Popham, 1973). This study utilizes presage
variables of personality and demographics to explore
65 teaching effectiveness and cross correlates the results with
student and peer ratings. It should be underscored that
correlations may illustrate relationships, they do not prove
causation. The present study is an extension to the
application of presage variables in faculty assessment.
Summary
In summary, a review of the literature showed renewed
interest and support in using personality theory to predict
job performance. Previous low correlations are attributed
to poor instruments, improper methodology, and inadequate
job performance appraisal. New personality instruments such
as the PCI are yielding promising potential, especially in
the aviation environment. The PCI, along with the five-
factor model, are the leading edge of personality research.
Improper methodology focused personality research on
selection criteria rather than classification. Several
confoTinds occur when applying personality theory to the
selection process which compromises potential correlations
with future job performance: pre-selection range
restrictions, honeymoon effect, and "faking." This may be
why student pilot attrition remains constant at 20 percent
for the past 40 years. If personality trait theory is
applied to the classification process, as originally
suggested by Thorndike (1949), these confounds are better
controlled. Primary concerns and controls required for the
66 classification process hinge on controlling "faking,"
honeymoon effect, and developing appropriate job performance
appraisal. For this study "faking" was controlled by
associating the personality assessment tool as the same used
in airline hiring. IPs were warned about detecting "lie"
scales and were offered airline hiring desiraLbility feedback
at the end of this study. The honeymoon effect was
controlled by assessing flight that have been established
for a minimxim of two months. Job performance appraisal was
more difficult to control. Previous job criterion and
appraisal techniques for instructor pilots have been
underdeveloped. No studies were found that specifically
investigated the relationship of personality traits with
comprehensive job performance of instructor pilots.
Therefore, the present study will attempt to add to
personality theory research and job performance appraisal
development by investigating perceived job performance
relationship with personality traits.
CHAPTER III
METHODOLOGY
There were three purposes to this study: to measure the
perceived validity of a new performance assessment
instr\iment, the NASA/UT Astronaut Survey, applied to
military flight instructors; to develop a global measurement
of Instructor pilot performance; to construct regression
equations that predict overall (officership, flying, and
instructional) perceived instructor pilot performance using
personality traits, demographic characteristics, and a
combination of personality traits and demographic
characteristics. This chapter discusses the following: (a)
research design, (b) scope of the study, (c) subjects, (c)
instrumentation, (d) procedures, (e) variables, (f) data
analysis, (g) research concerns, (h) significance for policy
and theory.
Research Design
This is a complex predictive study that utilized
multiple survey instruments. The first objective was to
determine the validity of the dependent variable of the
regression equation, perceived performance. Perceived
performance was measured with the NASA/UT Astronaut
Assessment Instrument that assesses perceived performance on
seven scales: job competence-knowledge, job competence-
67
68 performance, job competence-performance under pressure,
leadership, teamwork, personality, communication skills.
Scale ratings are siibsequently combined to provide a single,
overall performance measure. The survey and construct
definitions are shown in Appendix A. Perceived external
validity of the performance instrument was accomplished by
asking students, peer-instructors, and supervisors to rate
each of the seven performance constructs using a Likert
scaled question on the construct's appropriateness in
assessing UPT instructor pilots. All instructor pilots were
rated on this instrument by three groups: student pilots,
peer instructors, and a supervisor. These groups were
chosen because of their xinique insights on the various job
characteristics of an instructor pilot. On average, each
instructor was rated by approximately 15 students, 8 peer
instructors, and 1 supervisor. Rating group scores were
averaged and then combined with the other groups' ratings
through a weighted formula to achieve a single overall
performance score (OPS) for each instructor. Equation 1.
OPS = [student ratings x (0.40)
+ peer instructor ratings x (0.40) (Eq. 1)
+ supervisor rating x (0.20)].
This weighted equation provided an overall performance
rating for each instructor comprised of perceived job
effectiveness insights from all three groups. Supervisor
ratings have a lower weighting due to the fact that
69 supervisors have less interaction with the IP. The equation
weighting was adopted from a similar performance appraisal
model used to evaluate student pilot overall class standing
(ATCR 51-10, Attachments 1 & 2). Therefore, the dependent
variable of perceived performance is a single score
representing an overall perceived performance rating from
three groups assessing instructor performance over seven
scales.
The second objective of the study was to identify
personality traits that predict perceived performance
ratings. An aviation specific personality assessment
instrument, the Personality Characteristics Inventory (PCI),
was used. The PCI is a self-reporting personality
assessment instr\2ment that measures 11 specific personality
traits. The 11 personality traits were used as independent
variables to predict the overall perceived performance
rating. This and the succeeding demographic model were
built on a comprehensive cluster sample.
The final objective of this research was to identify
demographic characteristics that may predict instructor
pilot perceived performance. This model was built the same
way as the personality predictor regression equation. It
utilized a modified demographic survey soliciting key
professional development, and individual description
criteria. Additional information about the demographic
70 characteristics model and all of the surveys used are found
later in this chapter under "Instrumentation."
Prior to the selection of survey instruments or
collection of any data, a pilot study was undertaken.
Forty-five student pilots near UPT completion, 10
supervisors ranging from squadron commanders to flight
commanders, and 20 peer instructors were asked to identify
characteristics of "good" and "bad" instructors. Analysis
of group responses revealed common themes and distinct group
concerns. All groups listed "job knowledge" and "aircraft
flying ability" as predominant characteristics of a good
instructor pilot. Students and peer instructors further
identified student/instructor relationships as an important
attribute. Students commonly labeled this desired
characteristic as "sincerity," while peer-instructors called
it "dedication." Supervisors distinctly identified
"leadership" or "officership" as trademarks of good
instructors. All groups identified similar characteristics
of a poor instructor: self-serving, arrogant, eibrasive, and
ignorant of duties or knowledge. These characteristics were
later used in identifying appropriate performance and
personality assessment Instruments.
Scope of the Study
This study reflects the responses of the entire
population of student pilots and line-instructor pilots at
71 Reese Air Force Base, TX, from January to March 1993.
Additionally, a second cluster sample from Vance Air Force
Base, OK, was also used to increase the sample size for the
regression models. The cluster seunpling was achieved by
assessing all flights at Vance that have been established a
minimum of 2 months with their associated IP force. Each
base represents approximately 25% of the total population.
Comprehensively the sample consists of roughly 33% of the
entire AETC population. The study specifically includes
approximately 350 student pilots and 150 instructor pilots.
The cluster sampling used should be representative of the
universe of Air Force instructor pilots since all are
homogeneously selected, trained, assigned duty stations, and
implement a common student syllabus. The students also are
from a homogeneous pool and are trained similarly. The most
significant differences between the four training population
groups are the weather conditions \inder which they operate.
This is a negligible difference since the training syllabus
narrowly defines the requirements for continuity of
training.
Subjects
The population for the present study consisted of all
U.S. Air Force instructor pilots involved in Undergraduate
Pilot Training. This amoiints to approximately 500
instructors stationed at four different training bases. It
72 was not feasible to coordinate and implement the survey to
the entire population. Therefore, a representative sample
was used for the purpose of the study. Two training bases
participated: Reese AFB, TX and Vance AFB, OK. Twenty-two
flights (classrooms) were sampled from the two bases,
providing a sample of 150 instructors; which represented 33%
of the population. In order to achieve comprehensive
classroom ratings and a stratified sampling of the various
instructor and student compositions in UPT (FAIPs/MWS IPs,
Academy/ROTC/OTS students); entire flights, or classrooms
were selected. This sampling process provides a form of
cluster seunpling and provides a good representation of the
population and a sufficient niimber of subjects to
successfully complete a regression study.
Selecting the sample in such a non-random manner
threatens the external validity of the study if the sample
group is significantly different from the population. This
is not the case for this study. The subjects in this study
are from a homogeneous pool. All instructors receive
identical training at Randolph AFB for three months before
becoming instructors, and they teach from a standardized
syllabus. They share relatively similar professional and
demographic backgrounds throughout their distribution over
the four UPT training bases (Air Training Command, 1984).
The students are also from a homogeneous pool of
candidates, representing similar backgrounds and
73 qualifications (Air Training Command, 1984; R. Davis, 1989).
The training syllabus is xiniform for all bases and directed
by the headquarters agency at Randolph AFB. The similar
representation of both students and instructors, along with
a uniform training syllabus, make cluster sampling a
credible estimate of the population.
Requirements for participation in the study were: (1)
all instructors and students in a flight must participate
together; (2) students and instructors must have been
assigned a minimxun of two months to the flight to insure
familization with the instructor; and (3) all instructors
must be currently teaching students in the aircraft. The
reasons for these requirements were: to ensure a
comprehensive assessment of each instructor, to ensure
enough time had elapsed for a student/instructor
relationship to evolve, and to ensure all instructors were
proficient in their instructor duties. Data related to
instructors from partial and special duty flights, such as
evaluators, were collected but not used in this study.
Instrumentation
The study consists of three distinct survey
instruments: the performance rating measurement, the
Personality Characteristics Inventory, and the demographics
data collection (Appendix A). The following sections will
detail each of these instruments.
74 Performance Measurement
The perceived performance rating of each instructor was
the dependent variable for this study. There are two key
considerations when using a performance rating variedDle: (1)
Who will do the rating?, and (2) What will be the criteria?
Subscribing to the currently emphasized philosophy in the
Air Force of Total Quality Management, the "who will do the
ranking?" was identified as the customer base of AETC
Instructor Pilots. These customers compose three specific
groups: the student pilots, supervisors or flight
commanders, and associated peer instructors. Each group has
a unique insight into the overall performance of individual
instructors and possess different expectations of what
constitutes quality performance. The method used in
combining ratings from these groups into an overall score
was illustrated in Equation 1.
The criteria for rating performance was identified from
students, peers, and supervisors during the exploratory
pilot study. An instrument was needed that would measure an
instructor's perceived job knowledge, flying ability,
instructor/student relationship, leadership, and
personality. Current pilot assessment and evaluation
instruments focus on flying ability and lack quantifiable
measures of instructor/student relationship, leadership, and
personality. Furthermore, most existing rating instruments
were completed solely by supervisors or evaluators. Experts
75 throughout military and commercial aviation did not know of
any empirical performance assessment measure that included
multiple groups ratings such as peers and students. As a
result, a new instrument was required. After consultation
with the Behavioral Science Department at the U.S. Air Force
Academy, a newly developed NASA/UT performance measurement
instrument was identified and recommended.
The NASA/UT astronaut assessment project recently
developed a performance effectiveness survey which is based
on peer and supervisor ratings. The instrument measures
perceived performance effectiveness over nine dimensions.
These scales are: Leadership, Teamwork, Group Living,
Personality, Space Station Compatibility, Communication
Skills, and three scales associated with job competence- Job
Knowledge, Job Performance, and Performance under Pressure.
Labels of these scales and inter-observer agreement values
are provided in Table 1. The inter-observer agreement means
are means of the various peer rating groups correlations.
The NASA/UT project team estadslished the peer rating
scale categories for a high pressure, aviation environment
similar to the one in which AETC Instructor Pilots operate.
The performance measurement survey in this study borrows the
astronaut rating criteria elements using seven of the nine
categories. The categories not used were specifically
concerned with space station living conditions. The
modified astronaut effectiveness elements have been
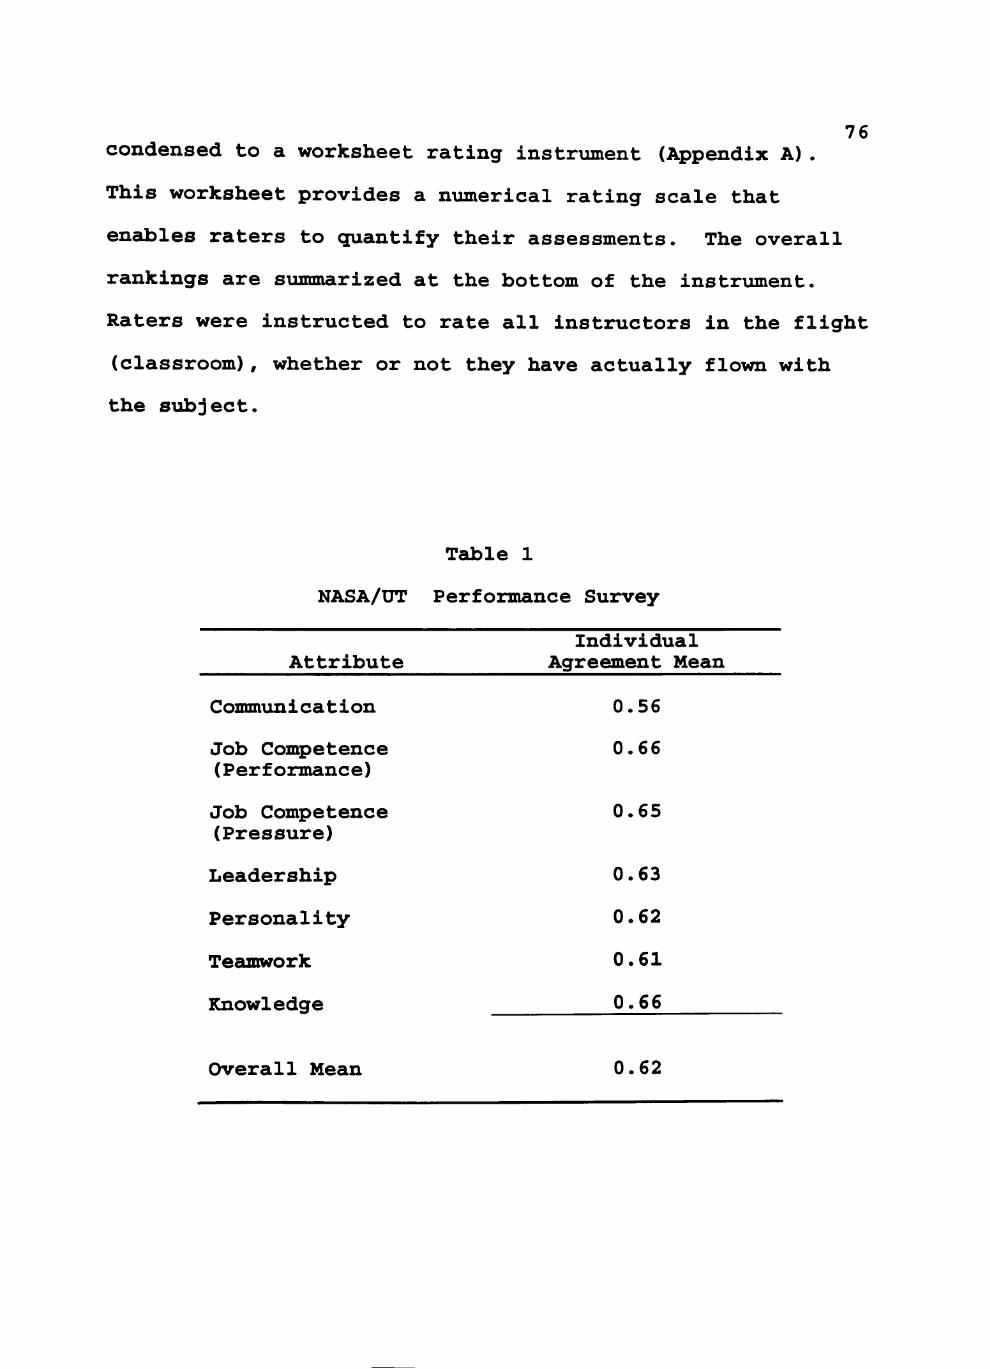
76 condensed to a worksheet rating instrument (Appendix A).
This worksheet provides a numerical rating scale that
enables raters to quantify their assessments. The overall
rankings are summarized at the bottom of the instrument.
Raters were instructed to rate all instructors in the flight
(classroom) , whether or not they have actually flown with
the s\2bject.
Table 1
NASA/UT Performance Survey
Attribute Individual
Agreement Mean
Communication
Job Competence (Performance)
Job Competence (Pressure)
Leadership
Personality
Teaunwork
Knowledge
0 . 5 6
0 . 6 6
0 . 6 5
0.
0.
0.
0.
.63
.62
. 6 1
.66
Overall Mean 0.62
77
The worksheet and rating criteria elements provide a
uniform and focused assessment of each instructor.
Soliciting ratings from the three separate customer groups
provides a comprehensive appraisal of the overall
performance of the instructor. Pooling the ratings of each
group and then formulating a weighting across groups
provided a comprehensive and quantifieJsle dependent varieible
for the study. This method of developing a universal
measure of perceived performance from multiple rating groups
(Equation 1) was duplicated from a similar performance
assessment prograun used to determine student pilot class
standings (ATCR 51-10, Attachments 1 & 2) .
Personality Assessment
In order to accommodate the timeline of this study, an
existing and validated personality assessment instrument was
required. Several "off-the-shelf" personality assessment
instriments were available, but few specifically apply to
the unique aviation environment. The "Big-Five" personality
theory, discussed in Chapter II, that was recommended by the
Air Force for future consideration in aircrew screening, is
still at a fledgling stage of development and lacks a
validity and reliability record. Because of the constraints
of this study, experts in aviation psychology at the United
States Air Force Academy's Department of Behavioral Sciences
and Leadership recommended the use of an existing
78
personality survey, the Personality Characteristics
Inventory (PCI). Their recommendation was endorsed by both
the Naval Aerospace Medicine Research LsUsoratories and the
Air Force Armstrong Laiboratorles.
The PCI (Appendix A) was developed by the NASA/UT team
to specifically assess aircrew personality. It contains
scales from three psychometric instruments, the Work and
Family Orientation Questionnaire (Helmreich & Spence, 197 8);
the Extended Personal Attributes Questionnaire (Spence,
Helmreich, & Holahan, 1979); and the Impatience/Irritability
and Achievement Striving Sxibscales (Predmore, Spence, &
Helmreich, 1988) . The PCI is widely used and highly
recognized in the aviation industry and has established the
highest reli€Lbility record for aircrew personality
appraisal. RelisLbility coefficients for most scales ranged
from 0.60 to 0.75 with only one scale below .60 having a low
value of 0.46. Table 2 illustrates the various personality
trait scale compositions in the PCI along with the
associated test/retest reliability coefficients.
The operational unit in measuring personality is the
trait. The PCI instrument is targeted to assess two broad
personality trait dimensions. Instrumentality or goal
orientation, and Expressivity or interpersonal capacities.
Because instriimental and expressive attributes are
considered by behavioral scientist to conflict and to be
mutually exclusive, they are measured independently.
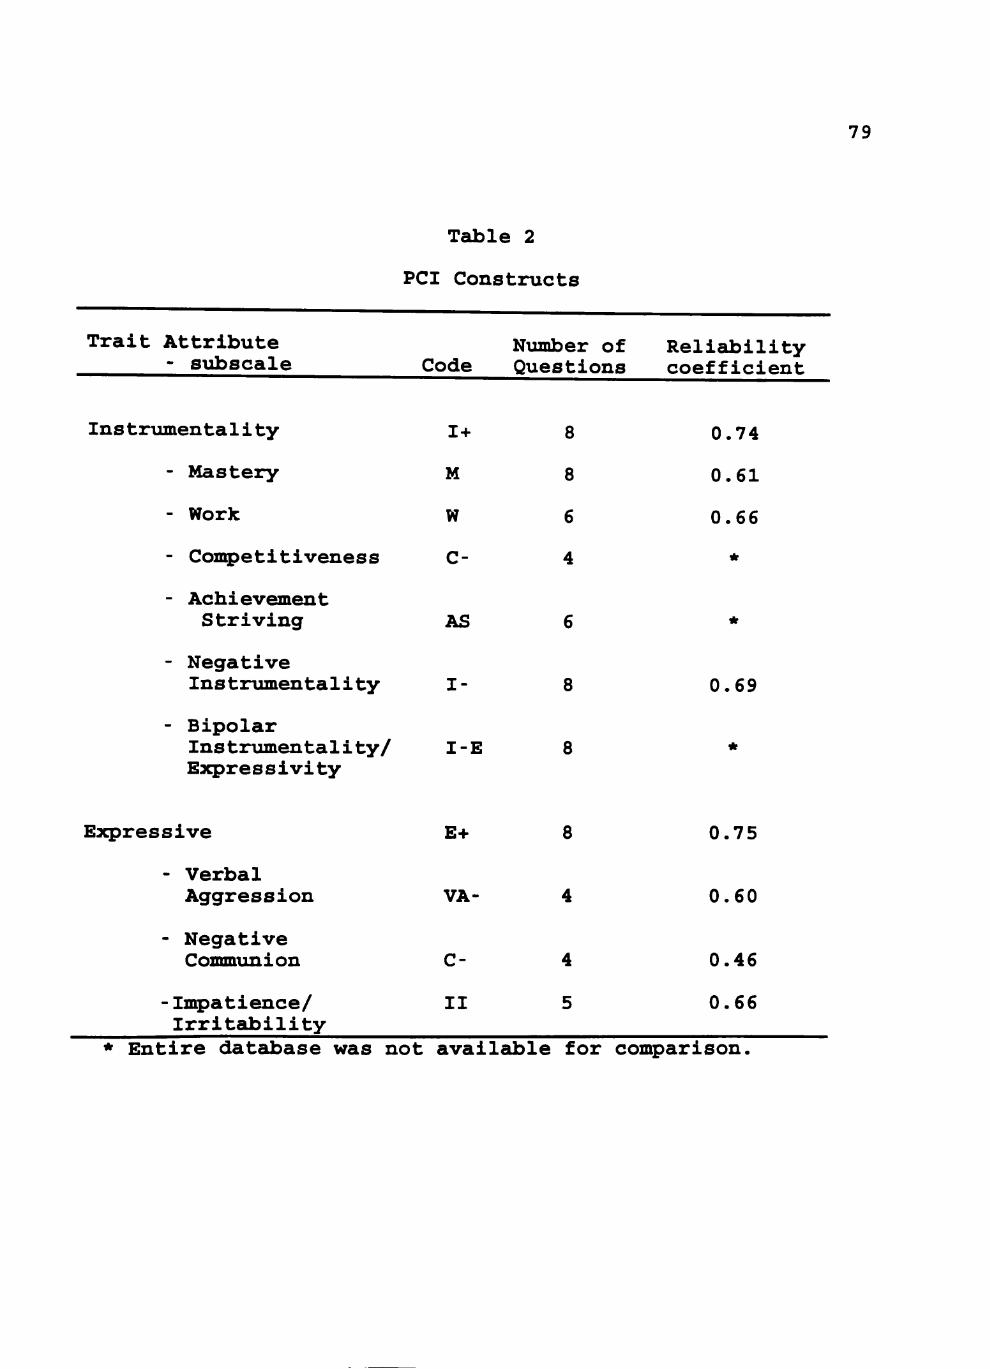
79
Trait Attribute - subscale
Instrumentality
- Mastery
- Work
- Competitiveness
- Achievement Striving
- Negative Instrumental: Lty
Tabli e 2
PCI Constructs
Code
1+
M
W
C-
AS
I-
Number of Questions
8
8
6
4
6
8
Reliability coefficient
0.74
0.61
0.66
*
*
0.69
Bipolar Instrumentality/ Expressivity
I-E 8
Expressive E+ 8 0.75
- Verbal Aggression VA- 0.60
- Negative Communion C- 0.46
-Impatience/ Irritability
II 0.66
* Entire database was not available for comparison.
80
Much of the following narrative describing the
constructs of each scale has been borrowed directly from
NASA/UT documentation (Gregorich et al., 19 89).
Instrumentality contains a central element of achievement
motivation, which is defined as motivation directed at the
attainment of goals. This construct is further broken down
into three distinct components: Mastery needs or the desire
to undertake new and challenging tasks; Work needs or
satisfaction and pride in working well; and Competitiveness
or the desire to surpass others in all areas of endeavors.
The achievement motivation constructs are further
supplemented with two more universal scales. Instrumentality
and Achievement Striving, which address the motivation for
attainment. Instrumentality is also measured on a negative
scale which reflects an autocratic, dictatorial orientation.
Individuals that rate high on this scale tend to achieve
goals at the expense of others and without regard for their
sensitivities.
The Expressive attributes contain four Subscales, one
positive and three negative. Expressivity consists of
traits reflecting warmth and sensitivity to others. Verbal
Aggression refers to a type of nagging hostility directed
toward others. Negative Communion refers to a passivity in
interpersonal relations. Impatience/Irritability refers to
a pattern of drive and annoyance in dealing with others.
81
The labels for the various scales range as follows: very
poor, poor, average, good, very good. These are arranged so
the "very good" always has the most positive score on that
scale, even though some of the scales measure negative
characteristics. Thus "very good" on the verbal aggression
scale means the client has "less" of this bad trait. PCI
factor composition by specific questions is illustrated in
Appendix C.
Demographic Data
Each subject instructor pilot was asked to complete a
"Demographic Data" questionnaire (Appendix A). This
instriunent was used to obtain data relative to biographical
information, professional development, educational
background, and family structure. The demographic survey
provides the independent variables for the second regression
model. This is an exploratory feature of the study that
attempts to validate future Air Force intent to emphasize a
more mature, experienced instructor force. Since the Air
Force has decided to select future instructors with
operational backgroiind rather than FAIPs (Curry, 1993), this
may provide key indicators as to what specific operational
backgrounds best con^lament instructor pilot positions.
VaricLbles from the demographic survey were compiled
from: previous aviation instr\unents. Air Training Command
surveys, higher education surveys desigrned by Dr. Alexander
82
Astin at UCLA, and recommendations from senior Air Wing
officers. The validity of the instrument was established
through a pilot study where recently graduated students,
senior supervising officers and peer instructors listed
demographic varieOjles that influenced instructors'
attitudes, behavior, and performance.
Research Procedures
The research procedure for this study consisted of
three key objectives: permission to survey the sample
population, implementation of the survey, and statistical
analysis of the data collected. This section covers the
permission and implementation of the survey. Statistical
analysis is covered later in this chapter under Statistical
Analysis. Permission to conduct the survey was obtained
from the Air Force Military Personnel Center (AFMPC/DPYMOS) .
A copy of the approval letter is in Appendix B. After Air
Force approval. Wing Commanders of the four training bases
were contacted soliciting participation and support for the
study. Appendix B illustrates a sample of a personalized
letter to the Wing Commanders. Two of the four Commanders
contacted felt they had the time to support the study, those
from Reese AFB, TX and Vance AFB, OK. The two Wing
Commanders introduced the study's objective to appropriate
staff and significantly paved the way for full cooperation
by their flying organizations.
83
Survey implementation was personally administered by
the researcher and required three weeks. Operations
Officers from the flying squadrons directed short-notice
mandatory flight meetings. All instructors and students were
required to attend. The study was introduced and the survey
was subsequently implemented, requiring approximately 30
minutes of instructor's time and 10 minutes from students.
The students were placed in different rooms than the
instructors. Instructors completed the full survey, while
the students simply completed the instructor performance
assessment section. Although participation was announced as
voluntary, almost all sample target subjects participated.
Only those students and instructors that were eibsent from
the mandatory meeting were omitted. Most of these subjects
were later included in a make-up session.
Instructors were briefed and surveyed before students
since their participation required the greatest amount of
time. They were introduced to one section of the survey at
a time in a blind research desicfn fashion and did not begin
the next sections until all peers were complete. This was
done to achieve focused and honest self-reporting. It was
assumed that if the instructors knew the study was attached
to perceived performance ratings it may have biased the
self-reporting personality section of the survey. The first
section completed by Instructors was the demographic data
collection followed by the personality characteristics
84
inventory. Personality assessment is one of the key tools
used in airline hiring, so instructor pilots were eager to
cooperate in this part of the survey to learn the
characteristics of their profiles. Instructors were briefed
on the perils of over- and underreporting on a self-reported
personality assessment and clearly understood the importance
of an honest reporting.
The final section of the survey, peer performance
appraisal, was met with some resistance by the instructors.
They were reluctant to report on peers or have peers report
on them for fear the results may be incriminating. Privacy
Act statements were distributed at this time and the
identification coding operation escplained. The first step
for all subjects in completing the NASA/UT Astronaut
Assessment Survey was validating the scales. Each rater was
directed to the second page of the instrument where each
scale was escplicitly defined. The raters were then
instructed to rate the appropriateness of each scale in
assessing instructor pilot performance. They used a Likert
scale to respond to the following statement: "I feel this
scale is appropriate in assessing instructor pilot
performance." The raters then listed the names of all
Instructor in their flight on the top of the rating matrix
on the first page. The names were read by the
administrators, ordered by rank. After the names were
listed each rated proceeded to rate as many instructors on
85
as many scales as possible. After completing the
performance appraisal section, instructors placed a random
four digit coding number on the top of the survey and the
names on the performance appraisal instrument were replaced
by the researcher with codes. This operation was done in
front of the instructors so anonymity of their participation
was convincingly reinforced.
While instructors completed the first two sections of
the survey, students were briefed on their participation in
a separate room. Students first wrote in the names of all
instructors in the flight across the top of the appraisal
matrix (Appendix A) . The order of instructor names were
provided by the administrator and was arranged by order of
rank. The students simply filled out the performance
appraisal section assessing all the instructors in the
flight. There was no identification of the student attached
to the instrument so participation was completely anonymous.
VarieJjles
The multiple regression portion of the study used
personality traits and demographic characteristics to
predict perceived performance. The dependent (criterion)
vari£Lble was the overall perceived performance rating. It
consists of a continuous interval scale: 1 (poor), 2 (below
average), 3 (average), 5 (above average), 6 (good), and 7
(excellent) . A unicnie distinction in the scale is the
86
missing value response of 4. This feature was added after
the pilot study to help control perceived rating bias. If
an instructor was new to the flight, not all students or
peers may know him/her well enough to evaluate. The 4 value
was then used to indicate an inability to assess, or missing
value. The 3 and 4 values were highlighted on the survey to
distinctly differentiate between an average rating score and
a missing value. In the regression design, the 4 value was
treated as missing data.
The three regression equations used illustrate the
relationship between the dependent variable of perceived
performance of three different sets of predictors:
personality traits, demographic characteristics, and a
combination of personality traits with demographics. The
first regression model used the eleven self-reported
personality trait scores as predictors. These scales all
contained a continuous interval scale and ranged from a 1
(strongly agree) to a 5 (strongly disagree). Some of these
questions were a reverse scoring scale. In all cases,
however, a high score indicated more of the desirable or
good quality. The second regression model used demographic
characteristics as the independent variable to predict
overall perceived performance rating. Both regression
models were developed from the comprehensive cluster
sampling collected from Reese and Vance Air Force Bases.
This procedure is further defined in the following section.
87
Statistical Analvsis
The major research question of this study is concerned
with the prediction potential that personality traits may
have on perceived instructor pilot performance. Prediction
studies require the use of regression, and in this case
since multiple independent variables are involved, multiple
regression. A stepwise multiple regression equation was
developed using the eleven independent variables of
personality trait scores to predict an overall perceived
performance score. There are three features in this design
that require further explanation: the validity assessment of
the dependent variable (perceived performance), the
computation of an overall perceived performance score, and
the stepwise regression technique used to construct the
prediction equations.
The initial concern of this study was the valid
representation of the dependent variable, perceived
performance. Perceived performance was measured with the
NASA/UT Astronaut Assessment Survey. The validity of this
instrument was established by asking the various rating
groups (students, supervisors, peers) to rate each
performance scale for appropriateness in assessing an IP's
job performance. Each rating construct had explicit
definition and examples of what it included. A Likert scale
ranging from Strongly Agree to Strongly Disagree was used to
respond to following question for each scale: "I feel this
88
scale is appropriate in assessing instructor pilot
performance." The Likert scale ratings of each scale were
then averaged for each group. An ANOVA was used to
distinguish significant statistical differences between the
group ratings. The results identified the perceived
appropriateness of the performance scales in measuring
instructor pilot performance and were contrasted with
findings from the literature.
The seven performance scales were combined to create a
single performance score. Each instructor would therefore
have a single performance score from each of the three
rating groups. The overall performance score, which
represents the dependent varieible in the regression
equation, was computed from a weighted computation using the
ratings from three groups (Equation 1). Each group
(students, supervisors, and peers) rated an instructor in
seven categories on a seven point scale. The student and
peer groups each represented 40 percent of the weighting
with supervisors constituting the remaining 20 percent.
This weighting proportion is based on a similar ATC student
pilot assessment design (ATCR 51-10, Attachments 1 & 2) . An
ANOVA was also used to distiguish statistical significant
differences among the group ratings.
Stepwise regression is a technique used to control the
order in which the independent variables are entered and
removed in the regression model. The independent variable
89
with the largest Pearson correlation with the dependent
variable is entered into the equation first. The second
independent variable selected, is the one that results in
the largest increase in R2 beyond that of the first
variable. At each step after a new predictor variable is
added to the model, a second significance test is conducted
to determine the contribution of each of the previously
selected predictor variables, and a predictor variable may
be removed if it looses its effectivesness when combined
with the additonal variables. The advantage of this stepwise
regression technique is that some of the possible overlap
between variables is moderately controlled, and the
strongest relationships between predictor and criterion
variables are entered first.
Research Concerns
The performance computation representing the dependent
variable of the regression equation presents a major concern
to the study. It is derived from a seven-scale performance
assessment instrument, where the mean scores from the scales
are averaged to provide a single performance measurement
value. The scales are combined to create a comprehensive
measure of performance in the regression design. The
combining of performance scales, however, may dilute or
"cloud" the actual performance rating. A better method to
investigate a multiple factor dependent varicdDle is
90
structural modeling. This method was not used in this study
due to its complexity and time constraints.
Another concern in the performance variaible is its
multiple group weighting. The overall score represents
combined ratings from three distinctly different groups.
This procedure was accomplished in an effort to create a
comprehensive, \iniversal performance measurement
representing all the customer groups associated with an
instructor pilot performance.
Significance for Policy and Theory
This study contributes to the use of personality trait
theory in aviation training, and further develops
performance assessment criteria for Air Force instructor
pilots. Historically, personality theory application in
aviation has focused on pilot selection screening. This
study extends beyond simple selection application and
explores the use of personality theory applied to instructor
pilot assessment and classification. It adheres and
possibly pioneers the original recommendation of Thorndike
(1946) that personality research should be used for
performance assessment of pilots in their operational
aircraft. Additionally, the study further explores presage
variaibles of faculty performance by developing relationship
correlates between personality, and demographic
characteristics with student and peer instructional ratings.
91
The contribution to the applied nature of this research
is even greater. Visibility of the personality findings
will underscore the need for special instructor skills in
communication and instructor/student relationships. The
instructor pilot training syllabus may be enhaced to expand
and include further development of these skills. The
performance appraisal section may offer a new tool for both
formal and development feedback and assessment of instructor
pilots. The instrument provides new job performance
criterion that is currently either subjectively measured or
not measured at all. Additionally, the performance
assessment from this study will highlight the 360 degree
performance appraisal technique for instructor pilot
assessment. Such a technique adds validity to performance
ratings by accounting for multiple, unique perspectives of
an instructor's performance. The 360-degree feedback is
more comprehensive which may provide instructors more
detailed and astute performance critiques that will enable
them to better adjust their teaching styles, therby
increasing the instructional process.
CHAPTER IV
ANALYSIS OF DATA AND DISCUSSION
This study investigated the use of self-reported
personality trait scores and demographic variables in
predicting instructor pilot perceived performance ratings.
Three regression equations were developed to predict
perceived performance using: personality traits, demographic
characteristics, and a final equation using both personality
traits and demographic characteristics. Perceived
instructor pilot (n=152) performance ratings were determined
by three groups of raters: students (n=271), peer-
instructors (n=133), and supervisors (n=19). Each group
rated instructors using seven behavioral performance
assessment dimensions. These seven behavioral dimensions
were then collapsed to derive an overall perceived
performance rating called the "Grand Mean" for each
individual instructor pilot. An "Overall Grand Mean" was
then computed by combining the Grand Mean ratings from the
three rating groups. The Overall Grand Mean served as the
dependent variaible in the regression equations and
represented a global performance measure of instructor pilot
performance.
The following research hypotheses were investigated.
1. There will be no difference in the appropriateness
ratings of the seven behavioral assessment scales from the
92
93
groups (students, peer-instructors, and supervisors).
2. There will be no difference in perceived
performance ratings of instructors by students, peer
Instructors, supervisors and self.
3. There will be a significant relationship between
perceived effectiveness ratings of instructor pilots at UPT
and the following personality trait scale scores:
instrumentality, expressivity, mastery, work,
competitiveness, achievement striving.
4. There will be a significant relationship between
the following personality trait scale scores and perceived
effectiveness ratings of instructor pilots at UPT: negative
instrumentality, verbal aggression, impatience/
irritability, negative communion.
5. Personality traits can be used to create a
predictive profile of instructor pilot performance.
6. Demographic characteristics can be used to create
a predictive profile of instructor pilot performance.
7. Personality traits and demographic characteristics
can be used to create a predictive profile of perceived
instructor pilot performance.
In order to test these hypotheses, the investigator
collected data from two UPT bases. The cluster sampling
provided a comprehensive and stratified representation of
the population. Specific descriptions and comparisons of
the subjects to the population are listed in Tables 3 and 4.
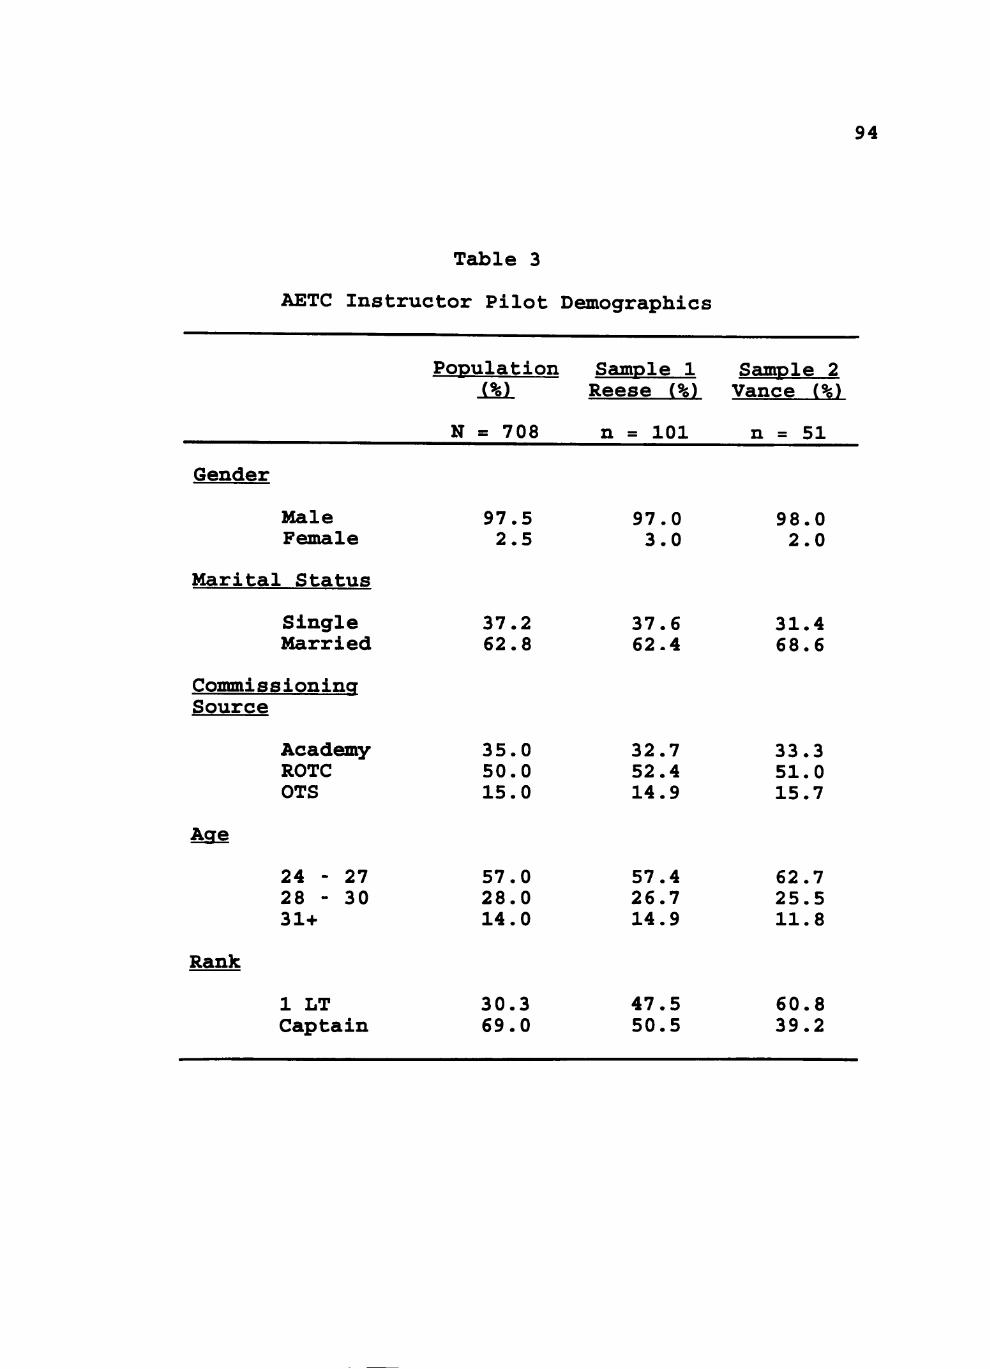
94
Table 3
AETC Instructor Pilot Demographics
Population Sample 1 Sample 2 i%l Reese (%) Vance (%)
Gender
Male Female
Marital Status
Single Married
Commissioning Source
Aqe
Rank
Academy ROTC OTS
24 - 27 28 - 30 31+
1 LT Captain
N = 708
97.5 2.5
37.2 62.8
35.0 50.0 15.0
57.0 28.0 14.0
30.3 69.0
n = 101
97.0 3.0
37.6 62.4
32.7 52.4 14.9
57.4 26.7 14.9
47.5 50.5
n = 51
98.0 2.0
31.4 68.6
33.3 51.0 15.7
62.7 25.5 11.8
60.8 39.2
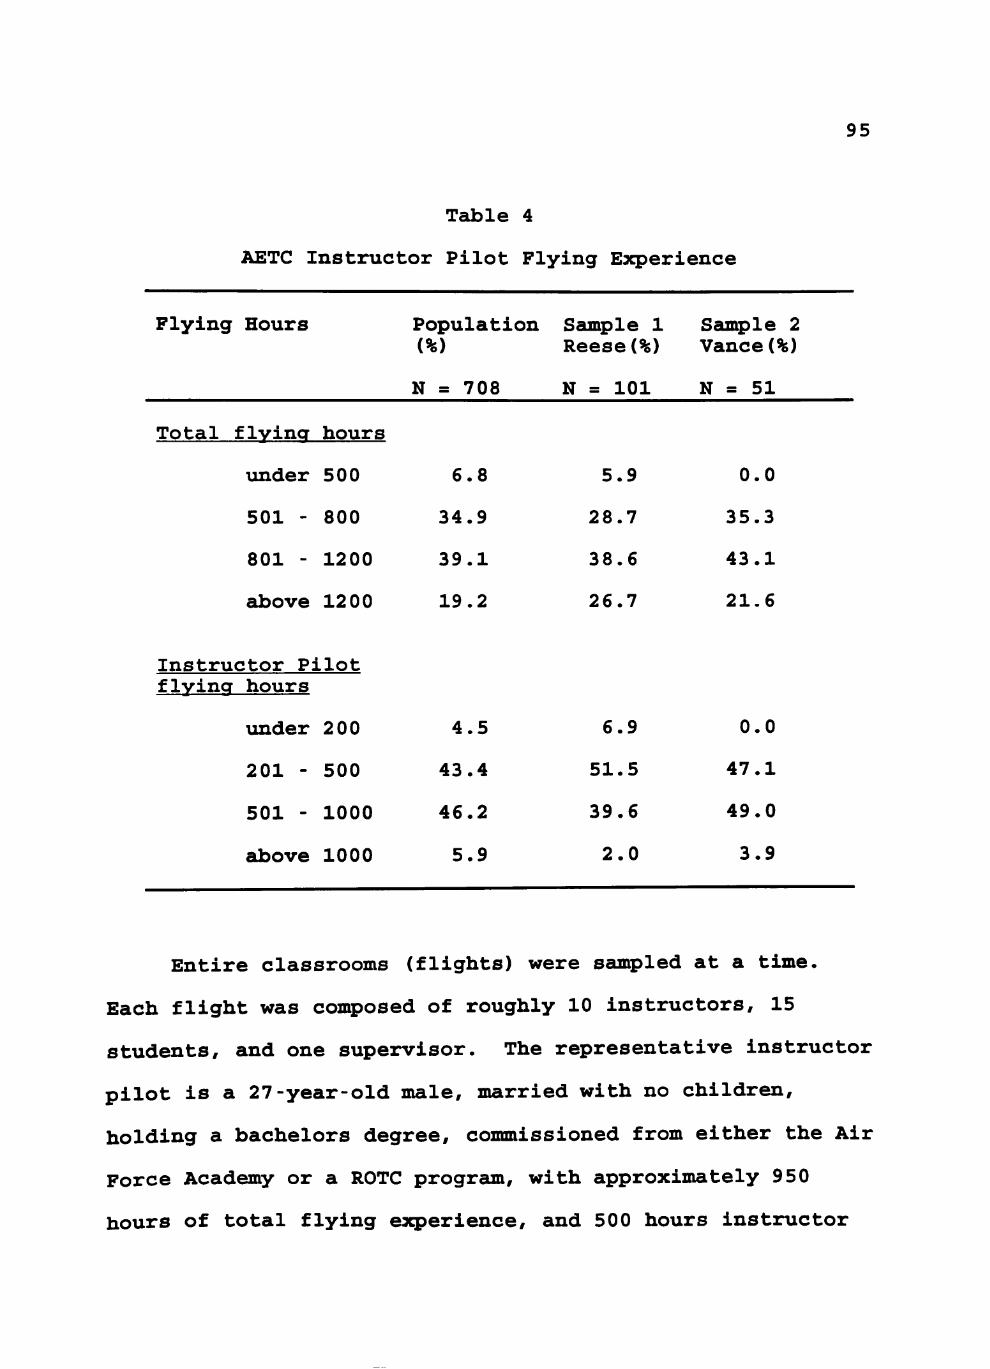
95
Table 4
AETC Instructor Pilot Flying Experience
Flying Hours Population Sample 1 Sample 2 (%) Reese(%) Vance(%)
Total flying hours
\inder 500
501 - 800
801 - 1200
above 1200
Instructor Pilot flying hours
under 200
201 - 500
501 - 1000
above 1000
N = 708
6.8
34.9
39.1
19.2
4.5
43.4
46.2
5.9
N = 101
5.9
28.7
38.6
26.7
6.9
51.5
39.6
2.0
N = 51
0.0
35.3
43.1
21.6
0.0
47.1
49.0
3.9
Entire classrooms (flights) were sampled at a time.
Each flight was composed of roughly 10 instructors, 15
students, and one supervisor. The representative instructor
pilot is a 27-year-old male, married with no children,
holding a bachelors degree, commissioned from either the Air
Force Academy or a ROTC prograun, with approximately 950
hours of total flying experience, and 500 hours instructor
96 pilot flying time. Specific population parameters for the
AETC instructor force were obtained from AETC Headcjuarters
and help illustrate typical profiles of the homogeneous
group (see Tables 3 and 4).
The samples for this study closely paralleled the
populations' demographic pareimeters. The Reese sample was
slightly older, and more were married than the population
and the Vance sample. The combination of Reese and Vance
minimizes this variance. Both samples were of higher
military rank and flying experience. This was expected due
to the assignment stagnation caused by the military
drawdown. Instructor pilots are rotated almost 18 months
later than previously to follow on assigrument. AETC has
confirmed this recent practice as drawdown driven and
indicated the entire population is rapidly indicating more
experience and higher age. AETC has confirmed the sample
demographic statistics are representative of the changing
population parameters.
Instructors completed a demographic survey followed by
a self-reporting personality inventory. After completion of
the first two instruments, the instructors and students were
given a perceived performance rating instriunent. Until this
time all subjects were blind to the performance assessment
objective. Instructors and students were then instructed to
use a Likert scale to rate each instructor in the flight
across seven defined performance dimensions.
97 Performance Ratings
The first analysis was conducted on the dependent
variable of performance rating. The following hypothesis
was investigated.
1. There will be no difference in the appropriateness
ratings of the seven behavioral assessment scales from the
NASA/UT Astronaut Assessment Instrument by the three rating
groups.
This hypothesis was rejected. The rating groups
differed on the appropriateness of four of the seven scales
contained in the NASA/UT performance assessment instrument.
In preparing to test the first hypothesis, the overall face
validity of the NASA/UT instrument was explored. The first
analysis simply explored the perceived external validity of
the NASA/UT Astronaut Assessment Instrument using an ANOVA
process with a significance test of a=.05. Since this was
a new performance assessment in the aviation training
environment, expert opinion was required concerning its
appropriateness in measuring instructor pilot performance.
Each group of raters (students, peer-instructors, and
supervisors) were asked to rate the seven performance scales
for applicability to instructor pilot duties and job
expectations. Figure 1 illustrates the mean responses of
the individual groups. All seven performance dimensions
were rated eibove a 5, or "agree," in scale appropriateness
for instructor pilot assessment. These ratings indicated
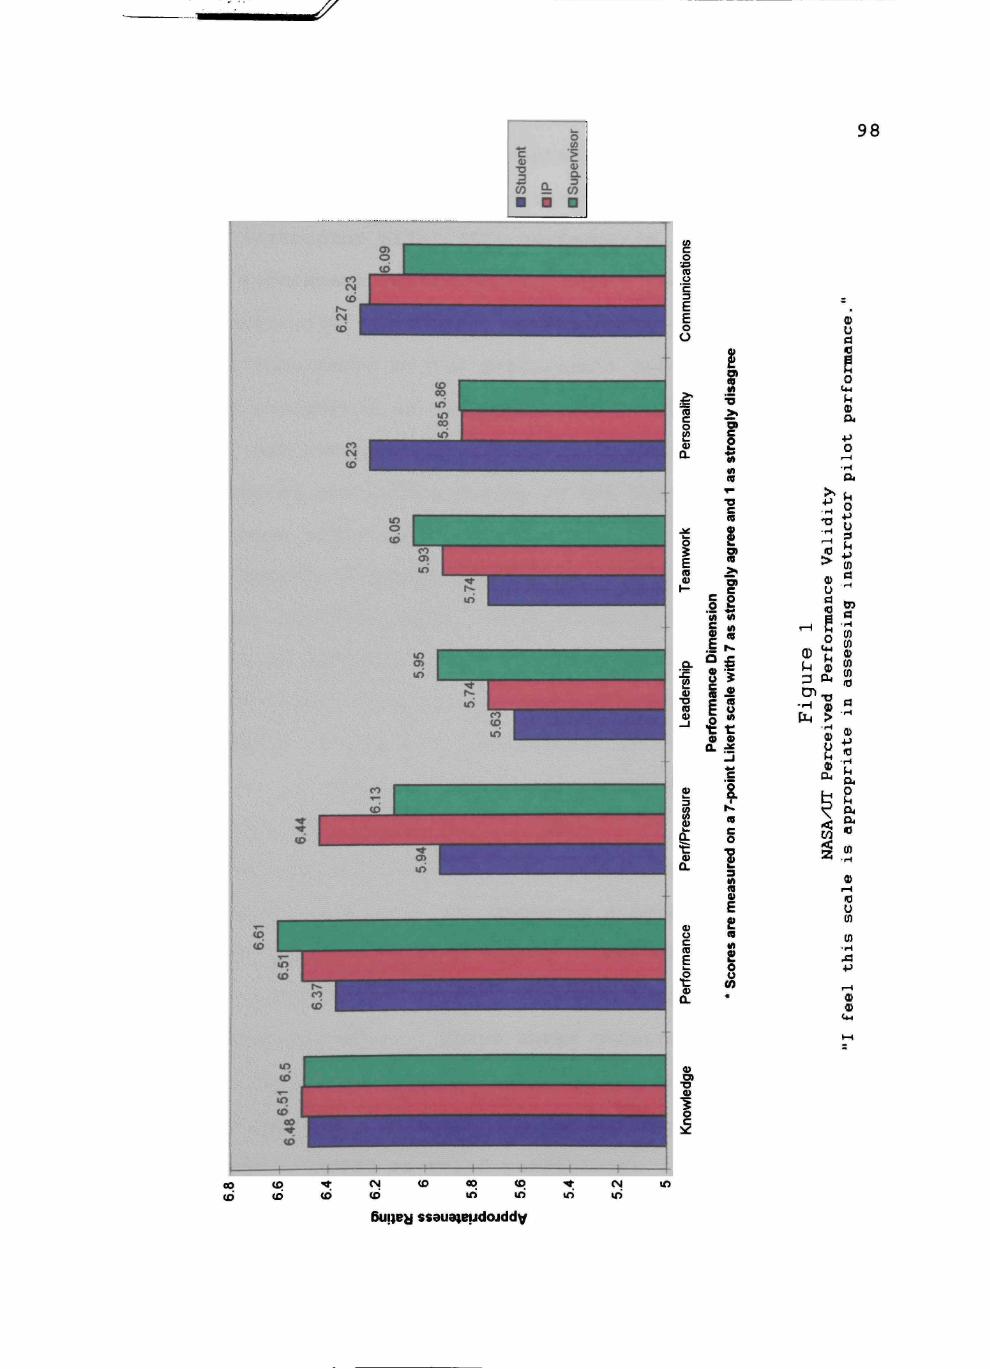
^
c «
CO 9 :
o (0
•g Q. 3 w
98
(/> c o (0
o "c E E o O
§»
I
.•^ (0 r o
ers
Q.
j£
o ^ F (D 0) \—
Q.
(0 9)
ead
—I
ess
Q.
erf
a
Q) O C (D
F u. p t :
c 0 M uaiui
ce
D
c a rf
orn
i
« a
dis
>« o
ron
and
1 a
s st
s SI O) 10 > l
m e o M
ith
$ «
sea
t o
int L
ik
^
C o 7,
mea
sur
S. a
res
o u 0)
ffi u a c e o
C4rf i-l a>
•p o
04
• 2 "
1-1
0) ^J
o en
-H PM
10 >
u
erfo
rman
04
XJ <l> >
'UT P
erce
i < Ui
S
•P to a
• r - (
essi
ng
as
s
a
pro
pri
ate
fe
el
this
sc
ale
is
00 to
(O
u> •* (O
(V4 U>
(O 00 ID
<o in
•* *o
eg lO
lO
6u!)e;d ssauaietJdojddv
99 that all three rating groups accepted all seven dimensions
of the performance appraisal instrument as valid in
assessing instructor pilot (IP) performance. The NASA/UT
astronaut assessment instrument appears to be a valid and
accepted instructor pilot performance appraisal instrument.
Three constructs of the performance instrument were
especially recognized as significant in IP appraisal. Job
knowledge, job performance, and communication were clustered
near the top of the rating scales by all three rating
groups. These constructs were rated near an average of 6.4,
"strongly agree" in appropriateness for measuring IP
performance. Interestingly, these constructs also compose
the current IP appraisal criteria. The existing technique
of IP performance appraisal consists of a written multiple
choice examination, an oral situational critical thinking
scenario, an in-flight maneuver assessment, and an
instructional phase of flight critique. The written and
oral exeunination was represented by the NASA/UT construct of
job knowledge. The in-flight maneuver assessment paralleled
the NASA/UT job performance construct, and the Instructional
critique component was represented by the NASA/UT
communication construct. These three constructs (job
knowledge, job performance, and communication), emulate the
current IP appraisal criteria which are currently in
practice and accepted as valid performance appraisal
measures. Additionally, the other four NASA/UT constructs
100 (performance-iinder-pressure, leadership, teamwork, and
personality) were also recognized as important performance
appraisal criteria by all three rating groups. These four
dimensions are currently not measured in Air Force IP
performance evaluations.
Although the NASA/UT astronaut assessment instrument
appears to have been a valid measure of perceived instructor
pilot performance, the first hypothesis was not supported.
The three rating groups statistically differed in
appropriateness rating across four scales: personality,
performance under pressure, teamwork, and leadership. The
ANOVA tcLbles are in Appendix D. The sample size for this
analysis was larger than the sxibsequent regressions, and the
other ANOVA procedure that examined differences in
instructor pilot rating among groups. The appropriateness
assessment uniquely included evaluator pilots that are not
associated with flights, but are some of the most
experienced and expert pilots in the squadron. It should
also be underscored that although the rating groups differed
on the magnitude of the importance for these constructs, all
three groups agreed the constructs were appropriate in
measuring IP performance. This finding complements the
literature review of the 360-degree performance appraisal
technique, which states each rating group has unique
Insights about an individual's performance (Woodruffe, 1984;
Harris & Schraubroeck, 1988). Thus, the various rating
101 groups would exercise their unique needs in assessing the
appropriateness of the various criterion.
The differences in group appropriateness ratings
confirmed expectations that the various groups had different
performance needs and expectations. The student group rated
personality higher in appropriateness (M s 6.23) than the
other rating groups; M = 5.85, F (2,492) = 7.23, p < .001.
Students appear concerned with the personality of their
instructor pilot. The student spends hours alone with a
single instructor, enduring both complex instruction and
personal critiques. An instructor pilot with a more
accommodating personality would make this time more
tolerable and possibly more enjoyable. This observation was
first highlighted by Getzels and Jackson (1963) who cited
the teacher-as-a person (personality traits, attitudes,
sense of humor) may radically affect student ratings due to
certain behaviors in the classroom. The long, personalized
instruction a student receives from a single, one-on-one,
instructor process underscores the importance of
instruetor/student compatibility. It would naturally follow
that students would emphasize personality as an important
performance criterion for instructors.
Peer-instructors also have a unique need and insight to
performance expectations. They rated performance under
pressure (M = 6.44) as more appropriate than the other
rating groups; supervisors M = 6.13, students M = 5.94, F
102 (2,492) = 11.21, p < .001. The peer-instructor understands
the grave severity of performing the right action at the
right time in a cockpit. They have witnessed how quickly
overloaded a pilot may become during a pressure situation,
and the consequences of inappropriate actions. Often the
lives of wingmen and students depend on the immediate and
decisive action by a single instructor pilot. Since peer-
instructors fly everyday, much more than the supervisor or
students, they have a greater awareness and tangible
appreciation for the "good airsense" in a pressure
situation. It would follow, to the peer-instructor,
performance under pressure is a daily threat, and thus, a
more important performance criterion.
Management responsibilities often remove the supervisor
from many of the daily events and routine tasks on the
flightline. Supervisors often depend on delegation to
subordinates in achieving daily operations. It would follow
for supervisors to emphasize teamwork and leadership as
important performance criterion for subordinate instructors.
Hogan (1978) determined supervisors often value more global
values (teamwork, dedication, vision, and leadership) in
the workplace than due workers. Indeed, for this study, the
supervisors rated teamwork (M = 6.05) much higher in
appropriateness than the other two rating groups; M - 5.93
and 5.74, F (2,492) = 3.28, p < .038; and leadership (M =
103 5.95) was also rated higher by supervisors than the other
groups; M = 5.74 and 5.63, F (2,492) = 4.77, p < .015.
Two important notes concerning these results: (1) the n
value is higher for this analysis than the regression
equation because the appropriateness assessment included
evaluator pilot opinions that could not be matched to a
flight, and therefore were excluded from the regression
equation sample; (2) although there are significant
differences between the group ratings on these scales, there
may be little practical significance. All the scales
appropriateness ratings were at a minimum Likert scale value
of 5, "agree," in appropriateness for assessing instructor
pilot performance. It is difficult to qualitatively
differentiate between a "5.0" agree rating and an "5.5"
agree rating. The significant statistical differences do,
however, illustrate the different job performance needs of
the different groups.
With the external validity of the performance appraisal
instrument established, the following second performance
hypothesis was tested.
2. There will be no difference in perceived
performance ratings of instructors by students, peer
instructors, supervisors and self.
This hypothesis was rejected; there is a difference in
perceived performance ratings for an instructor between the
various rating groups. The mean perceived performance
104 ratings across the various rating groups ranged from 5.05 to
6.1, the equivalent of "good" to "very good" on the
corresponding Likert scale (Table 5). The ANOVA tables of
this analyses are found in Appendix D. Students rated
instructor pilots higher on the Job Competence (Knowledge)
scale (M = 6.1; F(2,572)=7.89, p<.001). Peers rated
instructor pilot performance higher on Teamwork (M = 5.67;
F(2,572)=18.33, p<.001). Personality (M = 5.62;
F(2,572)=18.72, p<.001), and Commimication Skills (M = 5.64;
F(2,572)=15.33, E<.001). Finally, Supervisors rated
instructor pilots lower on Leadership (M = 5.05;
F(2,572)=12.64, p<.001). Although there are small
statistical differences between group ratings, all groups
rated instructor pilots between "good" and "very good."
Students rated instructors higher on their job
knowledge than did the peers and supervisors. Student
inflation of this dimension was expected from the literature
review which attributes inflated ratings of an instructor's
subject knowledge to the student's naive knowledge base
(Lazovik, 1987). Compared to the student's own knowledge,
IPs appear to be very knowledgeable. However, when other
IPs are consulted who are more qualified to judge
professional job knowledge (expert opinion), IP knowledge
ratings decrease. The inflation by students of instructor's
job or course material knowledge is a typical occurrence in
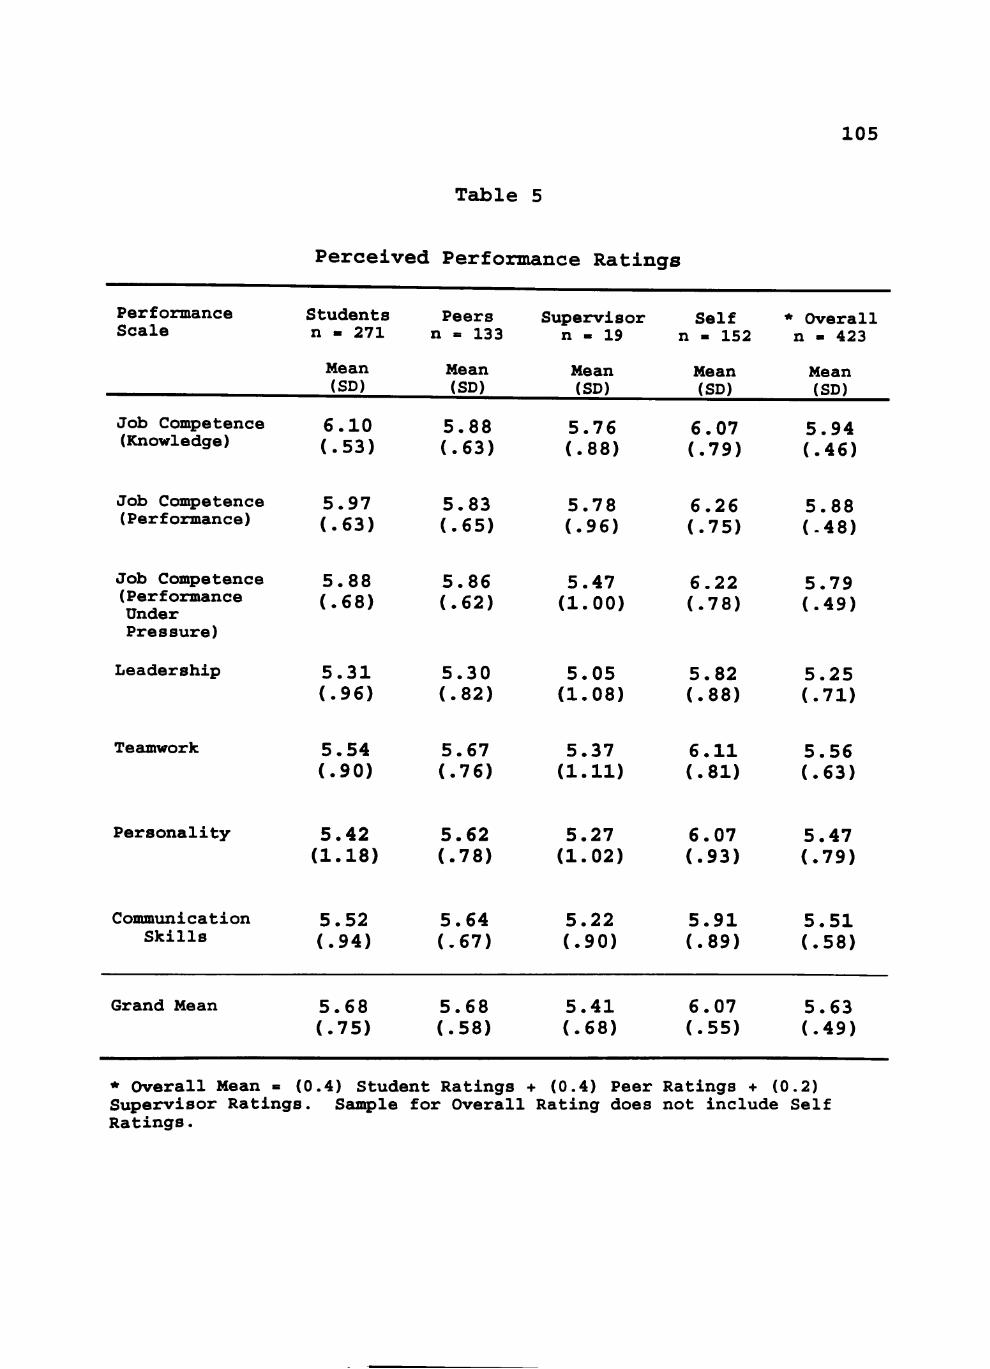
Table 5
105
Perceived Performance Ratings
Performance Scale
Job Competence (Knowledge)
Job Competence (Performance)
Job Competence (Performance Under Pressure)
Leadership
Teamwork
Personality
Communication Skills
Grand Mean
Students n - 271
Mean (SD)
6.10 (.53)
5.97 (.63)
5.88 (.68)
5.31 (.96)
5.54 (.90)
5.42 (1.18)
5.52 (.94)
5.68 (.75)
Peers n - 133
Mean (SD)
5.88 (.63)
5.83 (.65)
5.86 (.62)
5.30 (.82)
5.67 (.76)
5.62 (.78)
5.64 (.67)
5.68 (.58)
Supervisor n - 19
Mean (SD)
5.76 (.88)
5.78 (.96)
5.47 (1.00)
5.05 (1.08)
5.37 (1.11)
5.27 (1.02)
5.22 (.90)
5.41 (.68)
Self n - 152
Mean (SD)
6.07 (.79)
6.26 (.75)
6.22 (.78)
5.82 (.88)
6.11 (.81)
6.07 (.93)
5.91 (.89)
6.07 (.55)
* Overall n - 423
Mean (SD)
5.94 (.46)
5.88 (.48)
5.79 (.49)
5.25 (.71)
5.56 (.63)
5.47 (.79)
5.51 (.58)
5.63 (.49)
* Overal l Mean » (0 .4) Student Ratings ••• (0.4) Peer Ratings -i- (0.2) Supervisor Rat ings . Sample for Overall Rating does not inc lude Se l f R a t i n g s .
106 student classroom critiques and instructor performance
appraisal (Marsh, 19 87).
Peer-instructors rated IPs higher on teamwork,
personality, and communication skills than did students and
supervisors. Much of this difference is likely due to
familiarity. The peer instructors form a cohort group which
know, and understand one another better than would the
supervisor or students. Due to the close daily interaction
with one another, the peers have more opportunity to observe
each other's behavior. The high ratings in the performance
dimensions of teamwork and communication are indicative of
cohesive, elite groups (Hogan, 197 8).
Across all seven performance dimensions supervisors
rated IP performance lower than did students and peers.
Only on the leadership scale, however, were supervisor
ratings of IPs significantly lower than the other two
groups. The comparative conservative ratings by
supervisors are most likely due to their more developed
experience in performance appraisal. Supervisors have been
formally trained in subordinate performance evaluations.
Appraisal Inflation control and specific criterion
observations are part of a supervisor's formal training and
practice. This formal training, and their previous
experience would account for the lower ratings given by
supervisors.
107 A fourth group rating (Self) was provided in Table 5 to
provide a baseline comparison to later measure the need for
feedback. The self-rating group is simply the instructor
pilots rating their own performance. Across all seven
behavioral assessment scales, self-ratings were higher than
the three actual rating groups. The ANOVA tables for these
analyses are found in Appendix D.
Performance: F (2,572) = 26.44, p < .001
Knowledge: F (2,572) = 7.89, p < .001
Pressure: F (2,572) = 12.64, p < .001
Leadership: F (2,572) = 23.32, p < .001
Teamwork: F (2,572) = 18.33, p < .001
Personality: F (2,572) = 18.72, p < .001
Commxinication: F (2,572) = 15.33, p < .001
The self-rating inflations are illustrative of the need for
performance feedback. Individuals typically overrate their
performance compared to perceptions from others (Hazucha,
1991; Harris & Schraxibroeck, 1988) . Instructor pilots
significantly over-rated their own performance on all
dimensions.
Beside testing the first two hypotheses, the
performance analysis developed an overall performance rating
that provided the criterion variable in subsequent
regression models. Perceived performance for each
instructor was measured across seven dimensions that were
then collapsed Into a single performance measure called the
108 Grand Mean. The Grand Mean was further collapsed to reflect
measures from the various rating groups. This value is
referred to as the Overall Grand mean and is derived through
the following equation: Overall performance mean = 0-4
(student rating) + 0.4 (peer rating) + 0.2 (supervisor
rating), as defined by ATC (ATCR 51-10, Attachments 1 & 2).
The final assessment of perceived performance involved
comparing the overall perceived performance rating (Overall
Grand Mean) to the various rating groups. Teible 6
illustrates the relationship between the collapsed overall
performance rating and the various rating groups. As
suspected, rating groups with the largest sample size and
with the higher weighting in the overall equation have the
highest relationship with the overall performance rating.
The single exception is the rating from the self group.
Self-assessments which were not included in the overall
performance computation are marginally related (r = .29) to
the overall rating. This weak relationship between self and
perceived performance ratings underscore the need for
multiple perspectives in job performance feedback.
In summary, the performance appraisal analyses
determined a valid performance assessment criteria and
instrument. Various rating groups differed on magnitude of
importance for the various criterion, but agreed overall the
entire instrument was appropriate in measuring instructor
pilot performance. The performance ratings of instructors
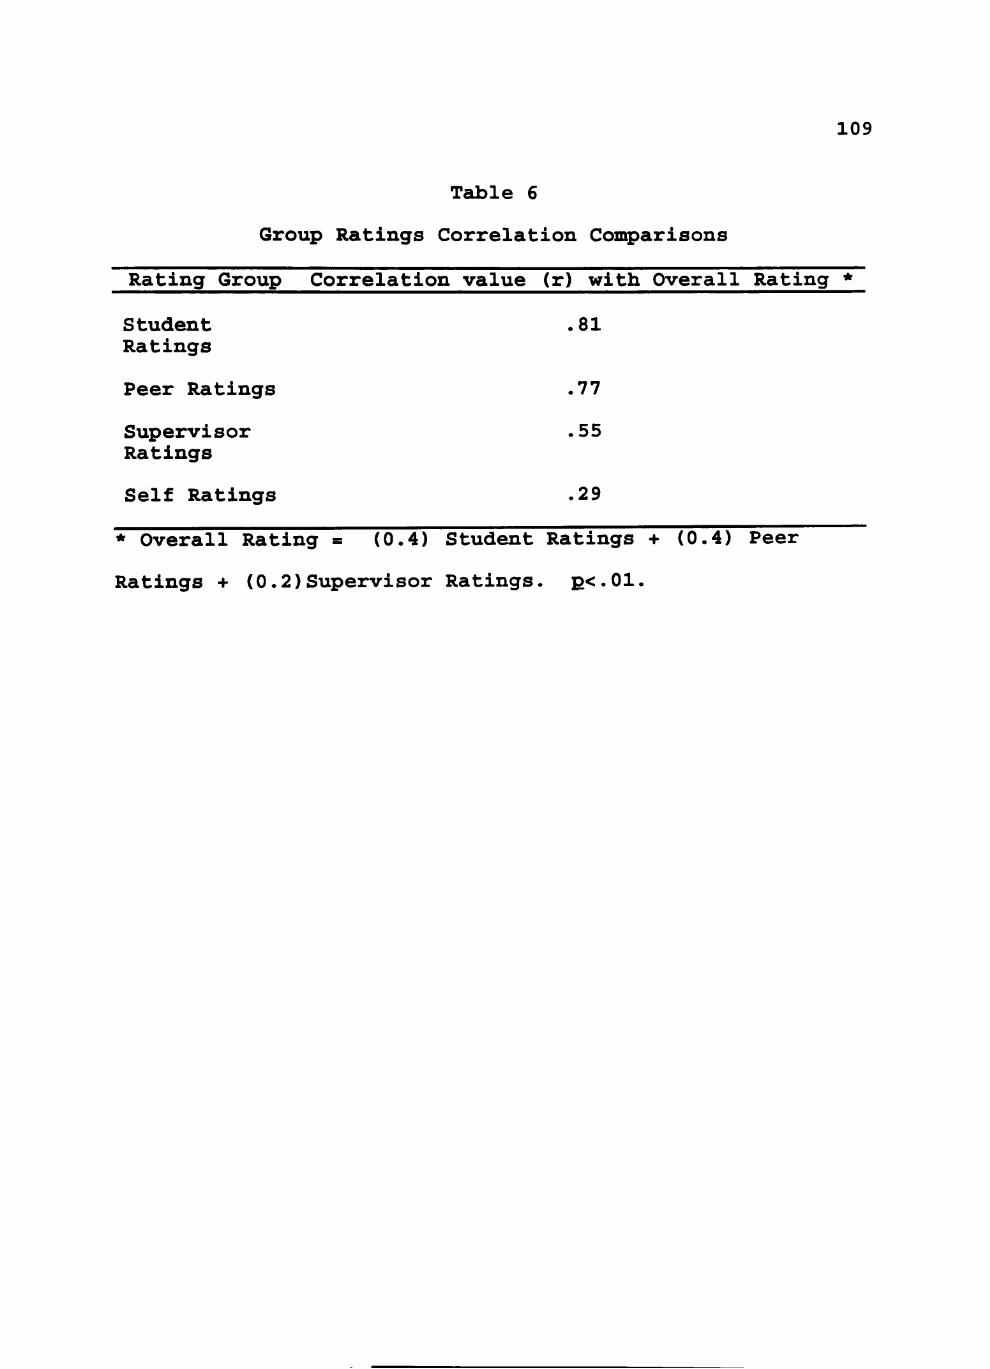
109
Table 6
Group Ratings Correlation Comparisons
Rating Group Correlation value (r) with Overall Rating *
Student .81
Ratings
Peer Ratings .77
Supervisor .55 Ratings Self Ratings .29
* Overall Rating = (0.4) Student Ratings + (0.4) Peer
Ratings + (0.2)Supervisor Ratings. p<.01.
110 were also different between the rating groups, indicating
the unique insights to an instructor's performance the
various groups possess. Finally, there was a weak
relationship determined between self and perceived
performance ratings. This finding illustrates the critical
need for performance feedback and the valuable insights
multiple perspectives may offer.
Personality Trait Measures
After analyzing the dependent variable of perceived
performance, the first set of independent variables
concerning personality traits were assessed and used to
construct the first prediction equation. This analysis
investigated the next set of hypotheses.
3. There will be a significant relationship between
perceived effectiveness ratings of instructor pilots at UPT
and the following personality trait scale scores:
instrumentality, expressivity, mastery, work,
competitiveness, achievement striving.
4. There will be a significant relationship between
the following personality trait scale scores and perceived
effectiveness ratings of instructor pilots at UPT: negative
instrumentality, verbal aggression, impatience/
irritability, negative communion.
5. Personality traits can be used to predict the
perceived effectiveness of instructor pilot performance.
Ill
The first assessment of the instructor pilot's self-
reported personality trait scores involved a comparison of
trait mean scores with the instruments' developmental
baseline of Airline pilots, as recommended from Gregorich,
Helmreich, and Wilhelm (1989) . This was accomplished to
assess for valid self-reporting. UPT instructor pilot (IP)
trait scores closely paralleled those from the airline pilot
data base. Table 7 illustrates the comparison of
personality trait score means between the two samples.
From a 5-point scale with 5 representing the most
desirable score, IPs differed only slightly from airline
pilots. Positive personality trait attribute comparison
revealed that IPs reported small increases in trait scores
(range = .20 to .48) towards the more desirable direction.
One exception was a decrease in IP scores of .1 in
Expressivity. Negative personality trait attributes also
contained marginal differences with the exception of one
scale, Impatience/Irritability (I/I). IPs reported an I/I
score of almost an entire point (M = .96) lower than the
airline sample, indicating a less desirable score. This may
be reflective of a "non-volunteer" attitude for their
present assignment. As discussed in Chapter I, many
instructor pilots are resentful of their current flying
position as instructors. Overall PCI scores for the
instructor pilot s£unple closely paralleled the airline
sample database. Significant differences could not be
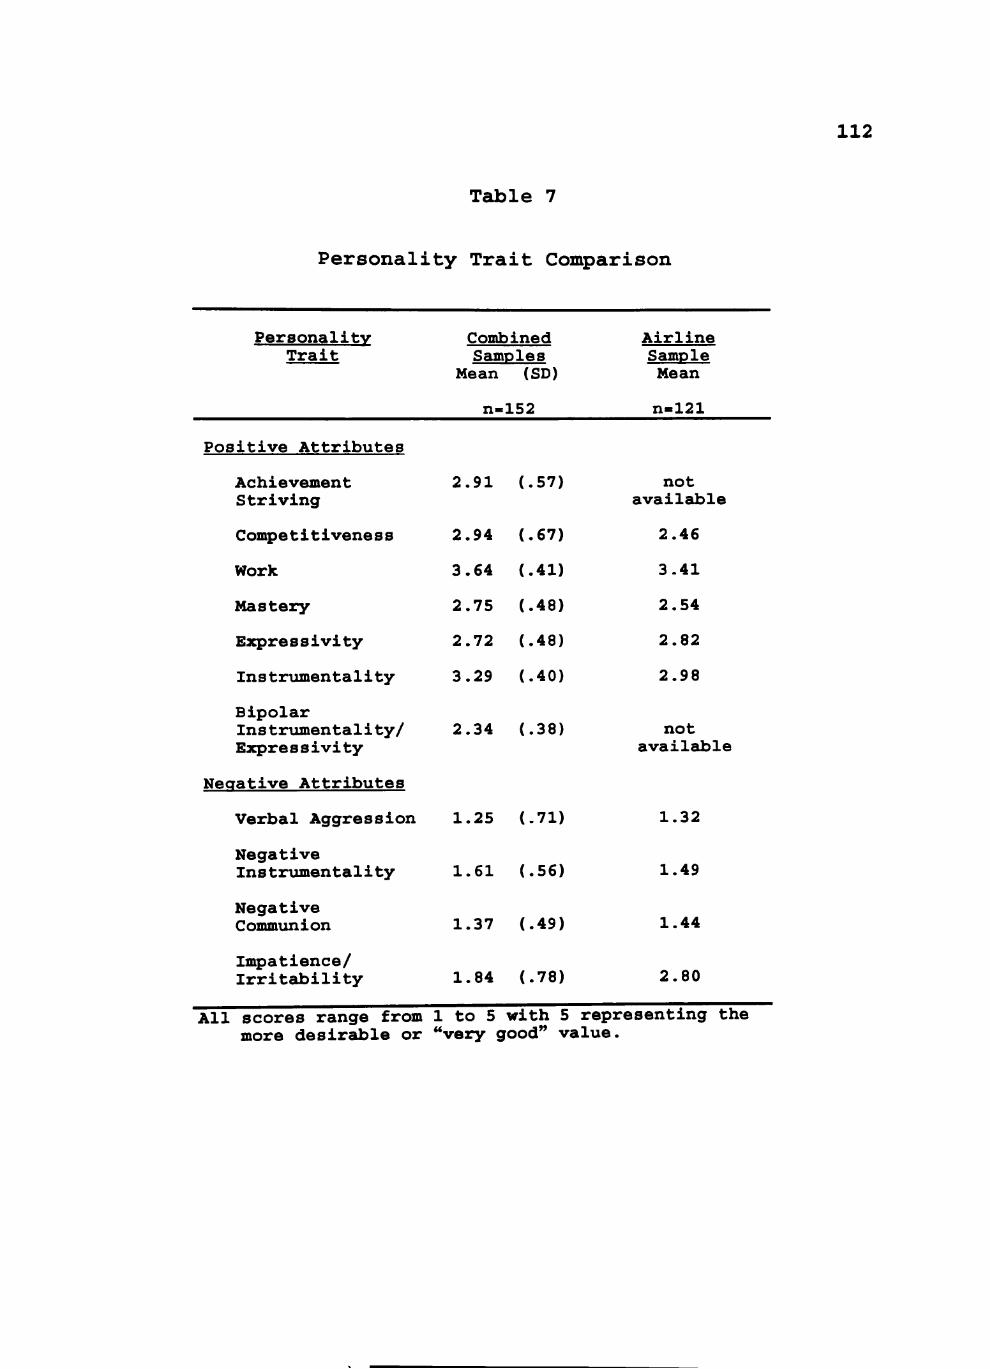
Table 7
Personality Trait Comparison
112
Personalitv Trait
Positive Attributes
Achievement Striving
Competitiveness
Work
Mastery
Expressivity
Instrumentality
Bipolar Instrumentality/ Expre s s ivi ty
Neaative Attributes
Verbal Aggression
Negative Instrumentality
Negative Communion
Impatience/ Irritability
Combined SamDles
Mean (SD)
n-
2.91
2.94
3.64
2.75
2.72
3.29
2.34
1.25
1.61
1.37
1.84
152
(.57)
(.67)
(.41)
(.48)
(.48)
(.40)
(.38)
(.71)
(.56)
(.49)
(.78)
Airline Sample Mean
n-121
not available
2.46
3.41
2.54
2.82
2.98
not available
1.32
1.49
1.44
2.80
All scores range from 1 to 5 with 5 representing the more desirable or "very good" value.
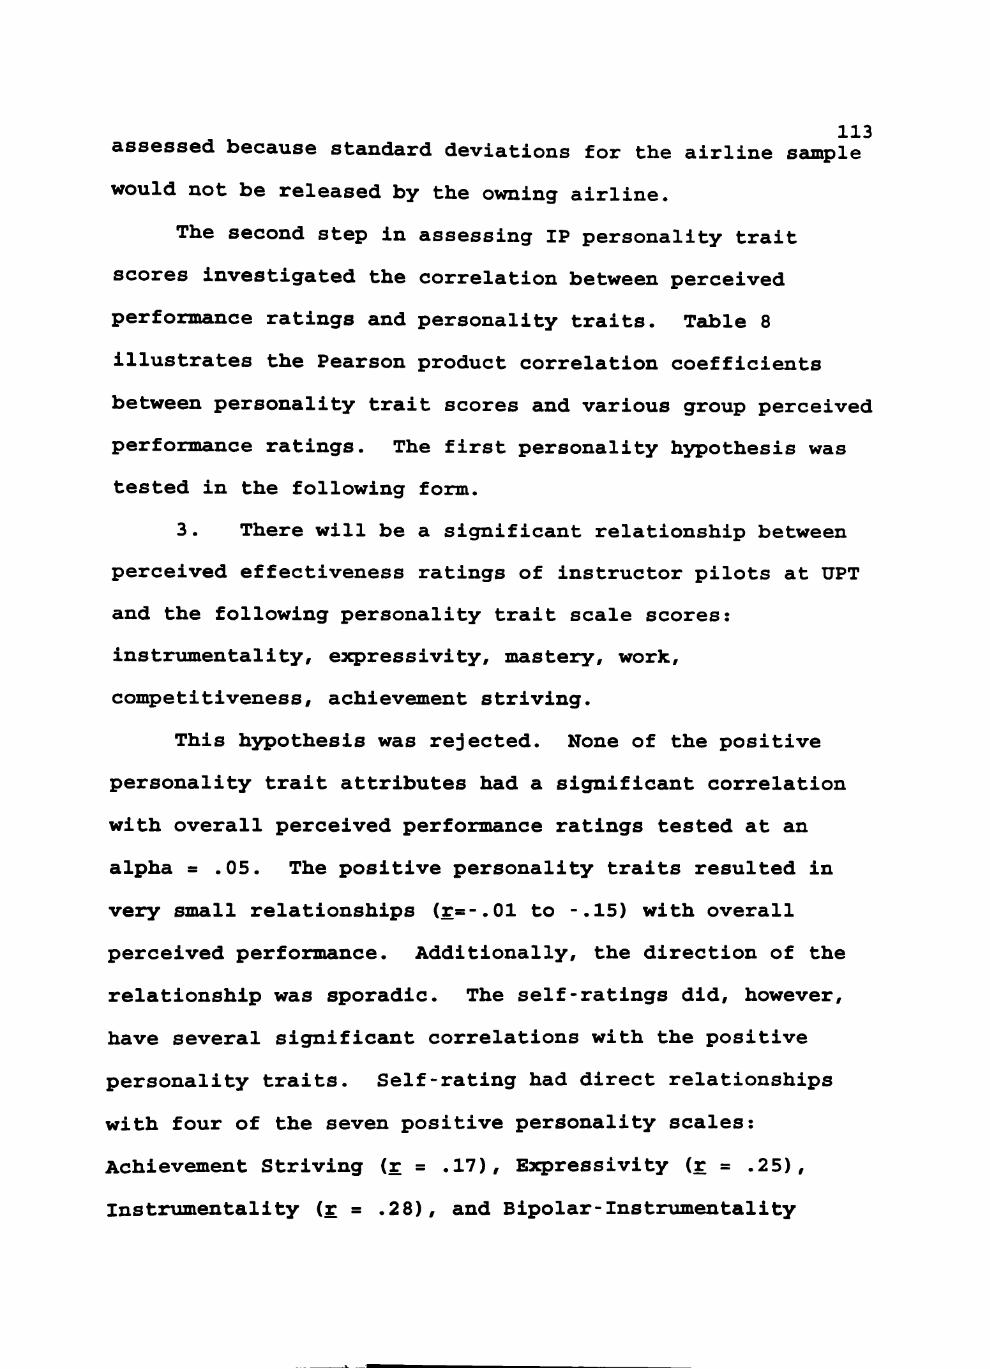
113 assessed because standard deviations for the airline sample
would not be released by the owning airline.
The second step in assessing IP personality trait
scores investigated the correlation between perceived
performance ratings and personality traits. T2dDle 8
illustrates the Pearson product correlation coefficients
between personality trait scores and various group perceived
performance ratings. The first personality hypothesis was
tested in the following form.
3. There will be a significant relationship between
perceived effectiveness ratings of instructor pilots at UPT
and the following personality trait scale scores:
instrumentality, expressivity, mastery, work,
competitiveness, achievement striving.
This hypothesis was rejected. None of the positive
personality trait attributes had a significant correlation
with overall perceived performance ratings tested at an
alpha = .05. The positive personality traits resulted in
very small relationships (r=-.01 to -.15) with overall
perceived performance. Additionally, the direction of the
relationship was sporadic. The self-ratings did, however,
have several significant correlations with the positive
personality traits. Self-rating had direct relationships
with four of the seven positive personality scales:
Achievement Striving (r = .17), Expressivity (r = .25),
Instrumentality (r = .28), and Bipolar-Instrumentallty
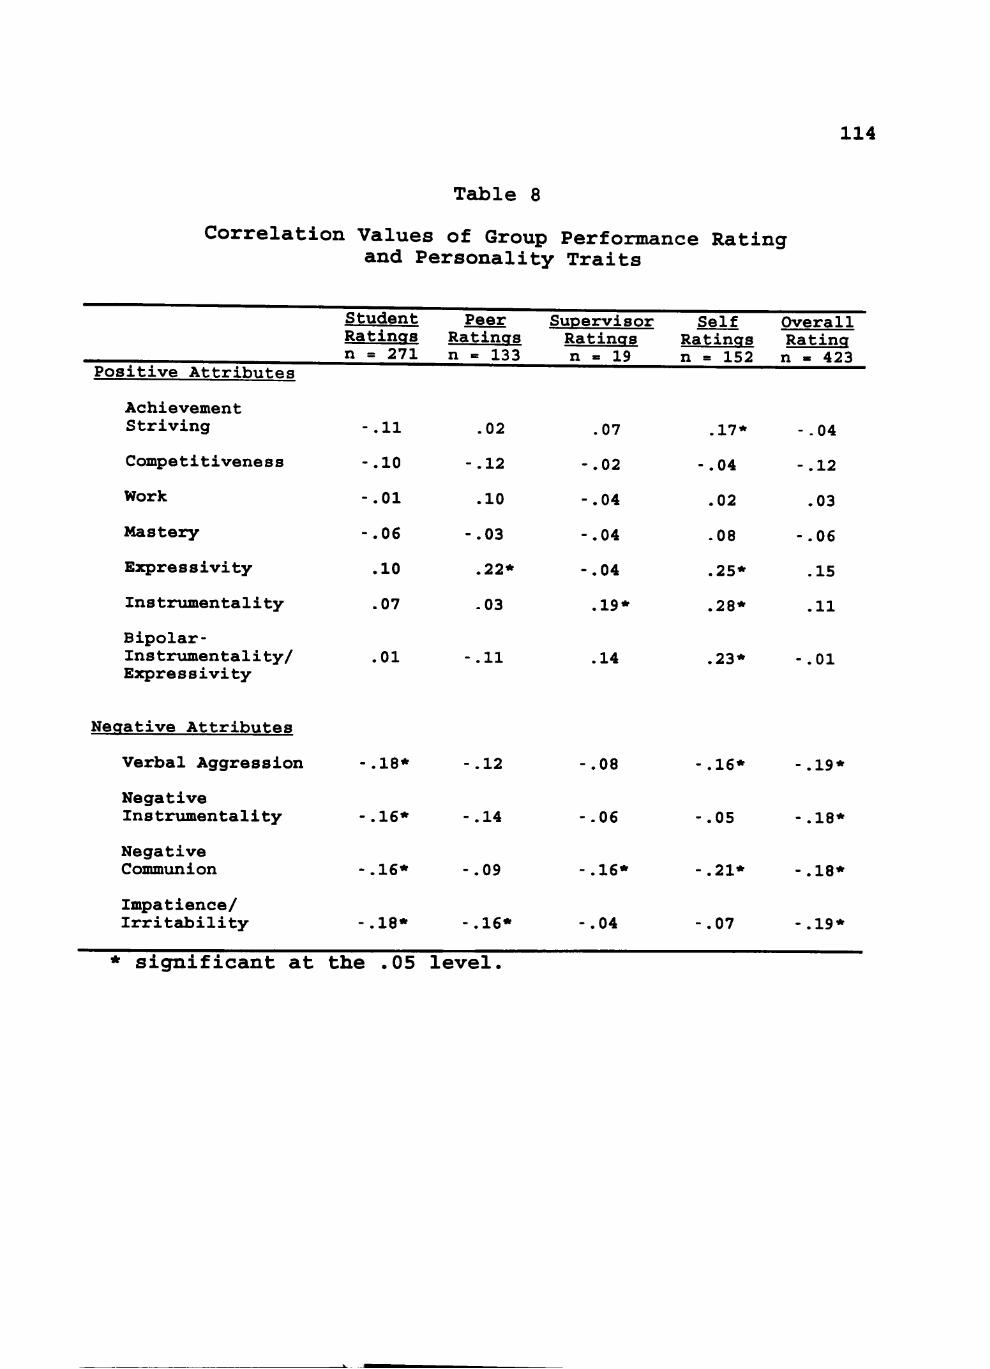
114
Table 8
Correlation Values of Group Performance Rating and Personality Traits
Positive Attributes
Achievement Striving
Competitiveness
Work
Mastery
Expressivity
Instrumentality
Bipolar-Ins triimen tali ty/ Expressivity
Negative Attributes
Verbal Aggression
Negative Instrijmentality
Negative Communion
Impatience/ Irritability
Student Ratings n = 271
-.11
-.10
-.01
-.06
.10
.07
.01
-.18*
-.16*
-.16*
-.18*
Peer Ratings n = 133
.02
-.12
.10
-.03
.22*
.03
-.11
-.12
-.14
-.09
-.16*
Supervisor Ratings n = 19
.07
-.02
-.04
-.04
-.04
.19*
.14
-.08
-.06
-.16*
-.04
Self Ratings n » 152
.17*
-.04
.02
.08
.25*
.28*
.23*
-.16*
-.05
-.21*
-.07
Overall Rating n - 423
- .04
-.12
.03
-.06
.15
.11
-.01
-.19*
-.18*
-.18*
-.19*
* significant at the .05 level.
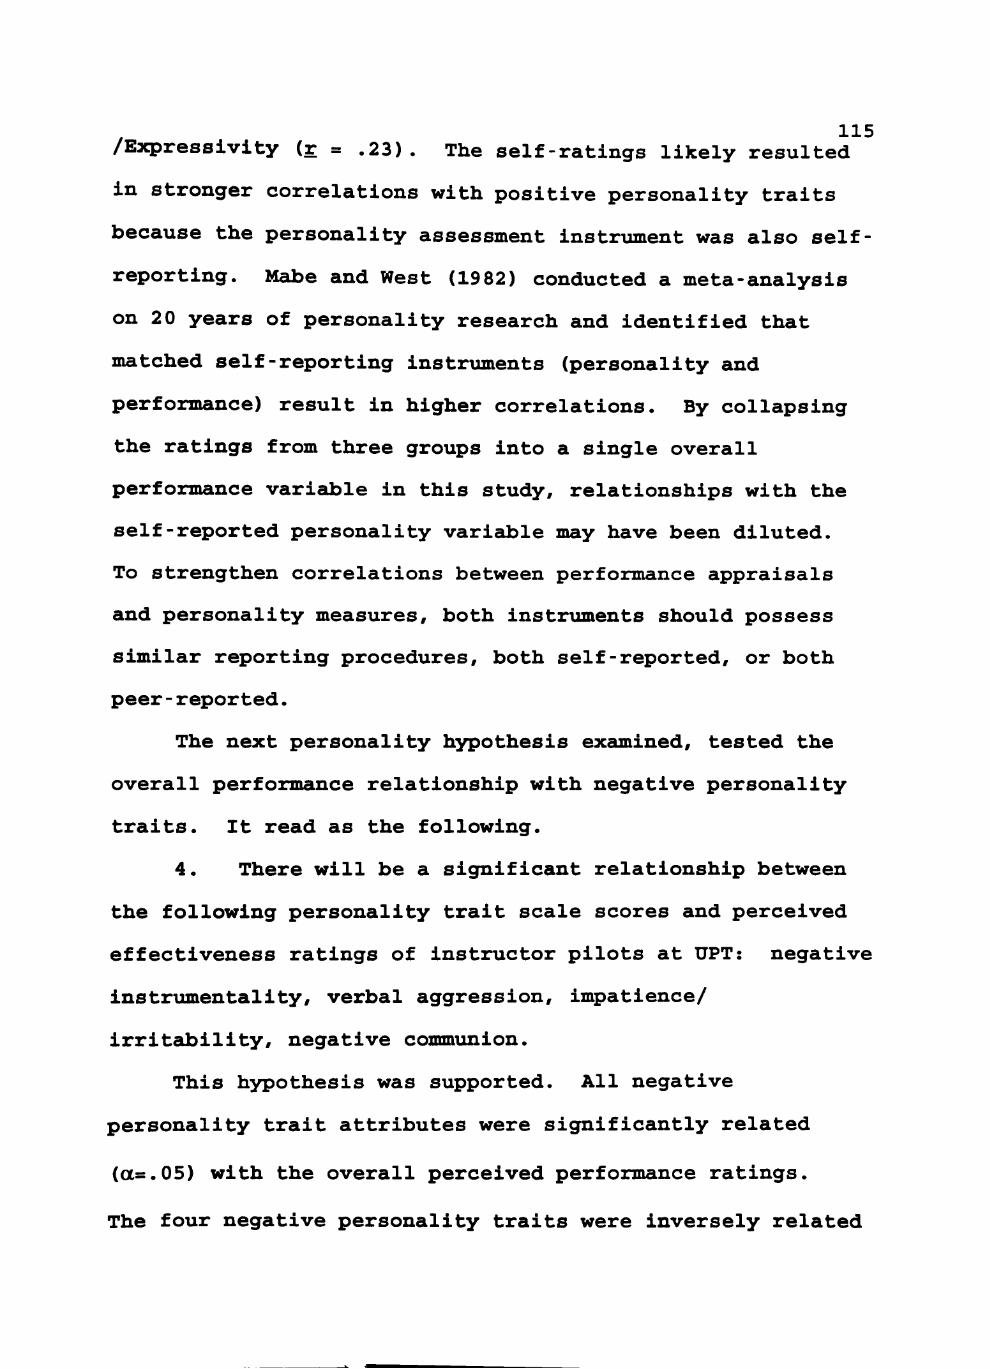
115 /Expressivity (r = .23). The self-ratings likely resulted
in stronger correlations with positive personality traits
because the personality assessment instrxunent was also self-
reporting. Meibe and West (1982) conducted a meta-analysis
on 20 years of personality research and identified that
matched self-reporting instruments (personality and
performance) result in higher correlations. By collapsing
the ratings from three groups into a single overall
performance variable in this study, relationships with the
self-reported personality variable may have been diluted.
To strengthen correlations between performance appraisals
and personality measures, both instruments should possess
similar reporting procedures, both self-reported, or both
peer-reported.
The next personality hypothesis examined, tested the
overall performance relationship with negative personality
traits. It read as the following.
4. There will be a significant relationship between
the following personality trait scale scores and perceived
effectiveness ratings of instructor pilots at UPT: negative
instrumentality, verbal aggression, impatience/
irritability, negative communion.
This hypothesis was supported. All negative
personality trait attributes were significantly related
(a=.05) with the overall perceived performance ratings.
The four negative personality traits were inversely related
116 (r = -.18 to -.19) to overall perceived performance. The
overall performance correlations again reflect the dominant
sized student sample (n = 271). Perry (1979), while
assessing teacher personality correlates with student
critiques, determined students are likely to remember and
evaluate negative personality attributes of teachers more
than positive attributes. Such is likely the case for this
study. Students easily identify negative attributes of
instructor pilots and exaggerate the associated negative
performance rating. This would account for the significant
correlations with negative personality attributes and the
absence of significance with positive attributes.
In summary, positive personality traits had no
significant relationships with overall ratings. Self-
ratings, however, did have a moderate positive relationship
with the self-reported positive personality trait scores.
In contrast, all of the negative personality traits were
moderately related to overall performance ratings. Student
rating groups appeared to be especially instrumental in
driving the significant negative personality attribute
correlations. A personality trait inter-correlation table
can be found in Appendix D.
The final personality assessment established a stepwise
regression model. The following hypothesis was tested.
5. Personality traits can be used to predict the
perceived effectiveness of instructor pilot performance.
117 This hypothesis was marginally supported with a
regression equation. Results of regressing the overall
perceived performance rating on personality traits are
reflected in Table 9. The overall perceived performance
prediction model included two significant predictor
variables. Negative Communion (P = -.16), and
Impatience/Irritability (P = -.17). Both variables are
negative personality attributes indicating an inverse
relationship with weak magnitude. Personality traits
accounted for five percent of the variance in the perceived
performance prediction equation.
As expected from the previous correlation table, only
the negative personality trait measures entered as
significant variables in the stepwise regression equation.
The magnitude values (P = -.17) are typical of personality
assessment in aviation selection, which normally range from
0.15 to 0.25 (Damos & Gibb, 1986; Greuter & Herman, 1992).
Four reasons were cited in the literature review for
previous low personality correlations in aviation selection
studies: (1) range restrictions of partially screened
populations, (2) artificial success rates imposed by
military manpower needs, (3) dichotomized pass/fail
criterion variable, (4) Inappropriate performance test
development (Damos & Gibb, 1986) . Of these reasons, the
most likely contributors to the low correlations in this
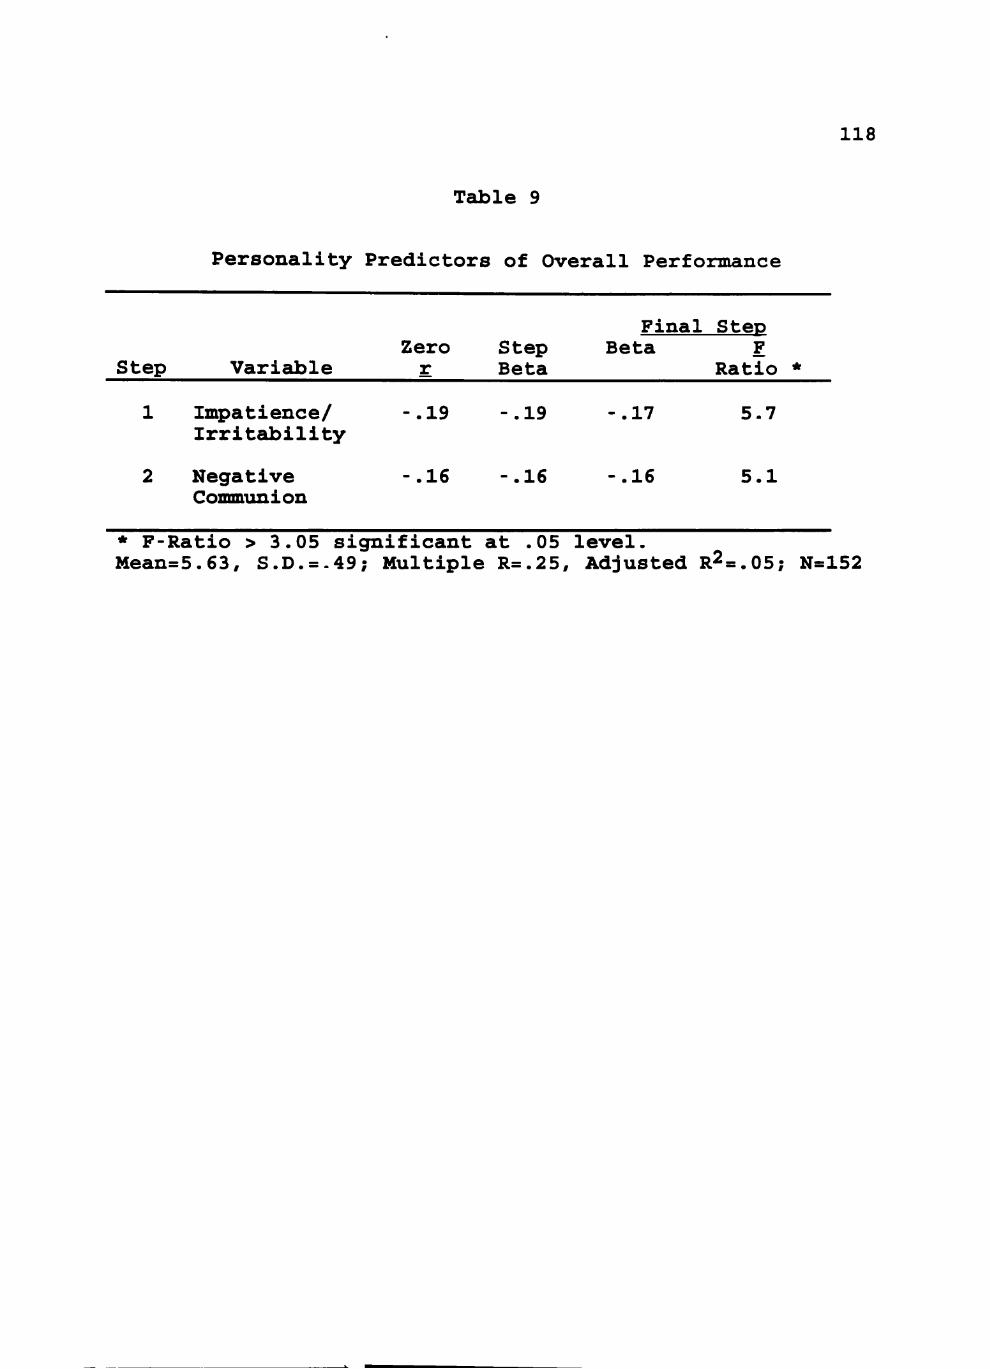
118
Table 9
Personality Predictors of Overall Performance
Step
1
2
Variable
Impatience/ Irritability
Negative Communion
Zero r
-.19
-.16
Step Beta
-.19
-.16
Final Beta
-.17
-.16
Step F
Ratio *
5.7
5.1
* F-Ratio > 3.05 significant at .05 level. Mean=5.63, S.D.=.49; Multiple R=.25, Adjusted R2=.05; N=152
119 study are (1) range restrictions of partially screened
populations, and (4) inappropriate performance test
development. The IP force is currently composed of a
largely homogeneous sample. Referring to Tables 3 and 4,
the IP cadre is 97.5% male, 85% between the ages of 24 and
30, and 94% with less than 1000 hours flying time as an IP
(cLbout 2.5 years' experience). These demographic figures
illustrate a relatively homogeneous group which may have
contributed to the low correlations.
The other likely contributor to the low correlations
may be the performance test development. The performance
test itself, the NASA/UT astronaut assessment survey, was
not so much the likely contributor, as was the 360-degree
testing technique. The NASA survey was determined to
possess strong external validity as determined by the expert
opinions of supervisors, instructors, and students in the
\indergraduate pilot training environment. The 360-degree
assessment technique, however, may have diluted potential
correlations. The technique provided a single global
performance measure representing perceptions from multiple
groups. The global aspect of the technique may compromise
the self-reporting relationship with the self-reporting
personality assessment. Meta-analysis research conducted by
Mabe and West (1982) indicated that matched self-reporting
instruments (personality and performance) result in higher
correlations. Collapsing the ratings from three groups into
120 a single overall performance variable may have diluted the
self-reporting correlations.
Demographic Measures
The final analysis investigated relationships between
various demographic variables and perceived performance.
The following research question was investigated.
6. Demographic characteristics can be used to create
a predictive profile of instructor pilot performance.
This hypothesis was marginally supported. Demographic
questions were designed to solicit instructor pilot personal
profile information concerning areas of family structure,
professional development/experience, and career intentions.
Table 10 reflects the correlations between the various
rating groups demographic variables and overall perceived
performance ratings. Several variables had a significant
positive relationship with overall perceived performance:
age (r = .23), number of children (r = .26), time in service
(r = .21), rank (r = .28), and total flying time (r = .21).
Once again various rating groups differed in opinion on
which demographic variables are most indicative of
performance. Supervisor rating emphasized variables
reflecting family structure and maturity, such as age,
number of children, time in service, rank, and total flying
time. In contrast, students and self-ratings emphasized
flying and professional experience as being the most related
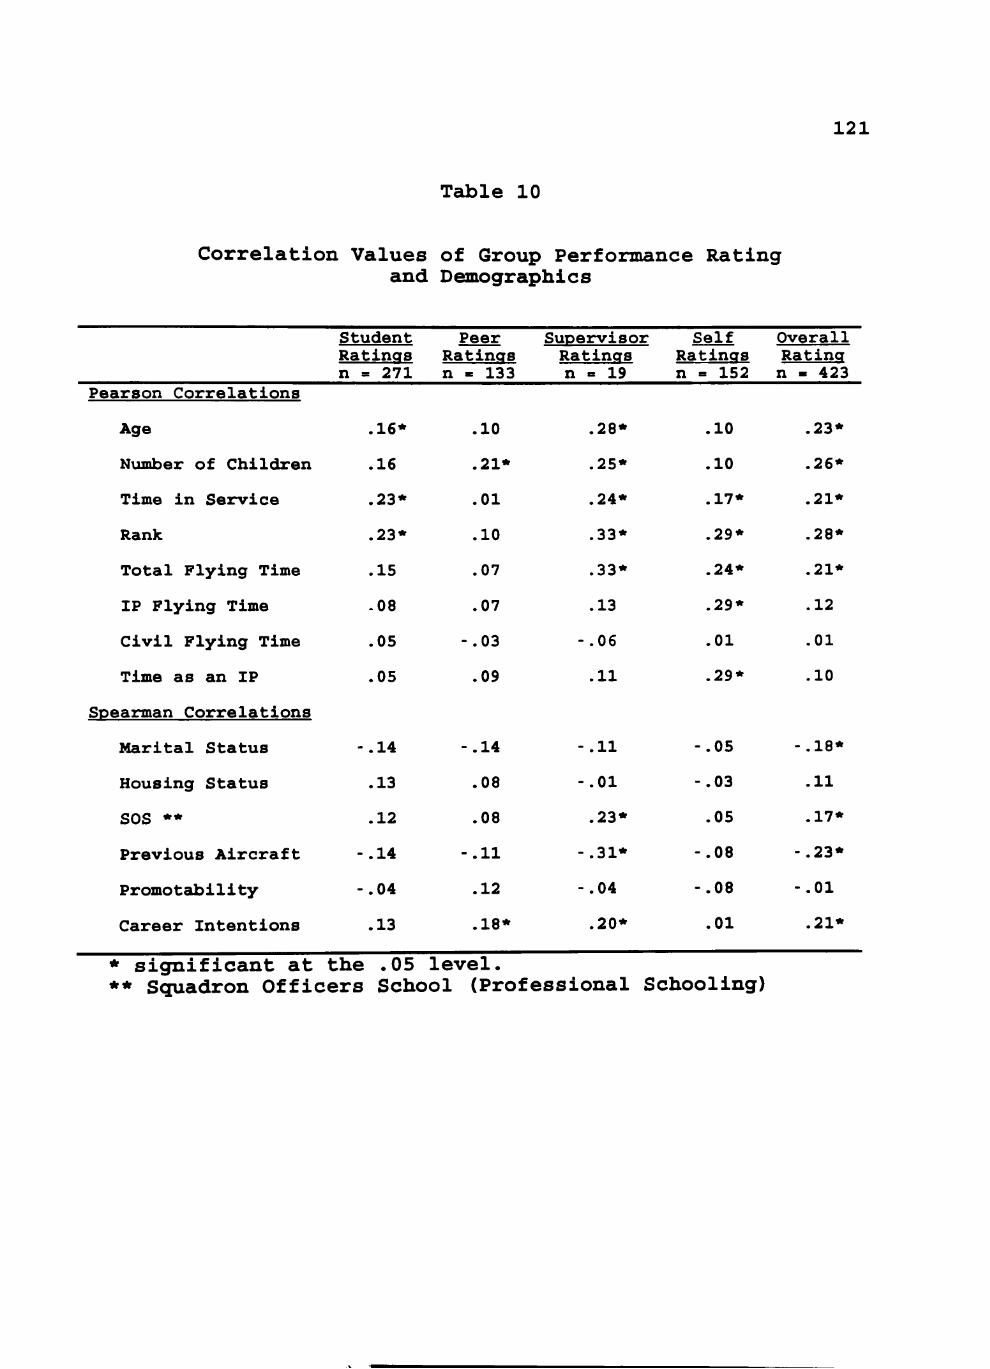
121
Table 10
Correlation Values of Group Performance Rating and Demographics
Student Peer Supervisor Se l f Overall Ratings Ratings Ratings Ratings Rating n » 271 n - 133 n « 19 n « 152 n - 423
Pearson Corre la t ions
Age
Number of Children
Time in Service
Rank
Total Flying Time
IP Flying Time
Civil Flying Time
Time as an IP
Spearman Correlations
Marital Status
Housing Status
SOS **
Previous Aircraft
Promotabillty
Career Intentions
.16*
.16
.23*
.23*
.15
.08
.05
.05
-.14
.13
.12
-.14
-.04
.13
.10
.21*
.01
.10
.07
.07
-.03
.09
-.14
.08
.08
-.11
.12
.18*
.28*
.25*
.24*
.33*
.33*
.13
-.06
.11
-.11
-.01
.23*
-.31*
-.04
.20*
.10
.10
.17*
.29*
.24*
.29*
.01
.29*
-.05
-.03
.05
-.08
-.08
.01
.23*
.26*
.21*
.28*
.21*
.12
.01
.10
-.18*
.11
.17*
-.23*
-.01
.21*
* s ign i f i cant at the .05 l e v e l . ** Squadron Officers School (Professional Schooling)
122 to performance, such as Instructor Pilot (IP) and total
flying time, rank, time in service. There appears to be a
difference in emphases between supervisor performance
criteria and instructor performance criteria. Perhaps the
real reasons are artificially driven by the military
hierarchy of command. The higher ranking officers are
generally older with established families and more diverse
experiences. These higher ranking officers are given more
opportunity to command and thus impact the greater whole of
the Instructor mission. This may be what the supervisors
are recognizing as performance, the contribution towards an
Air Force mission of training hundreds of pilots. The
instructor pilot on the other hand, has an "in the trenches"
outlook, with greater concern regarding individual students
and the daily administration of flight training. To the
instructor, performance is the "nuts and bolts" of producing
one pilot, with that being further limited to the days'
training objectives. The difference between the groups may
simply be their daily mission tasking and the big picture
outlook of what performance is measure against. A
demographic inter-correlation table may be foimd in Appendix
D.
A second stepwise regression method was applied to
determine a regression equation using demographic varieibles
to predict overall perceived performance ratings. The
regression equation included two significant predictor
123 variables. Number of Children (p = .22), and Rank (P = .24).
Table 11 illustrates specific results of the model. Both
predictor variables had a marginal magnitude and indicated a
direct relationship with perceived performance. Rank had a
significant correlation with performance for both the
student and supervisor rating groups. Its inclusion in the
regression equation is obviously due to the dominant sample
size of the student rating group (representing 64% of the
entire sample), and the high correlation (r=.33) from the
supervisor rating group. Number of children resulted in
moderate correlations (r=.21 to .25) for both peer and
supervisor rating groups. Beyond the statistical mechanics
of why these two variables entered the regression equation,
is the speculation of a wider, more comprehensive factor
representing both demographic variables of rank and number
of children. This factor may be labeled as social maturity.
Both rank and children imply more responsibility and
accountability. Friedlander (1963) determined older workers
with families are generally perceived as more stable and
productive performers by co-workers. He identified specific
perceived traits of these older workers as being
responsible, considerate, sincere, forgiving, and
accountcLble. Friedlander labeled these traits as social
maturity. The senior ranking IPs in this study appear to be
perceived as more socially mature and are recognized with
increased rating in perceptions of performance.
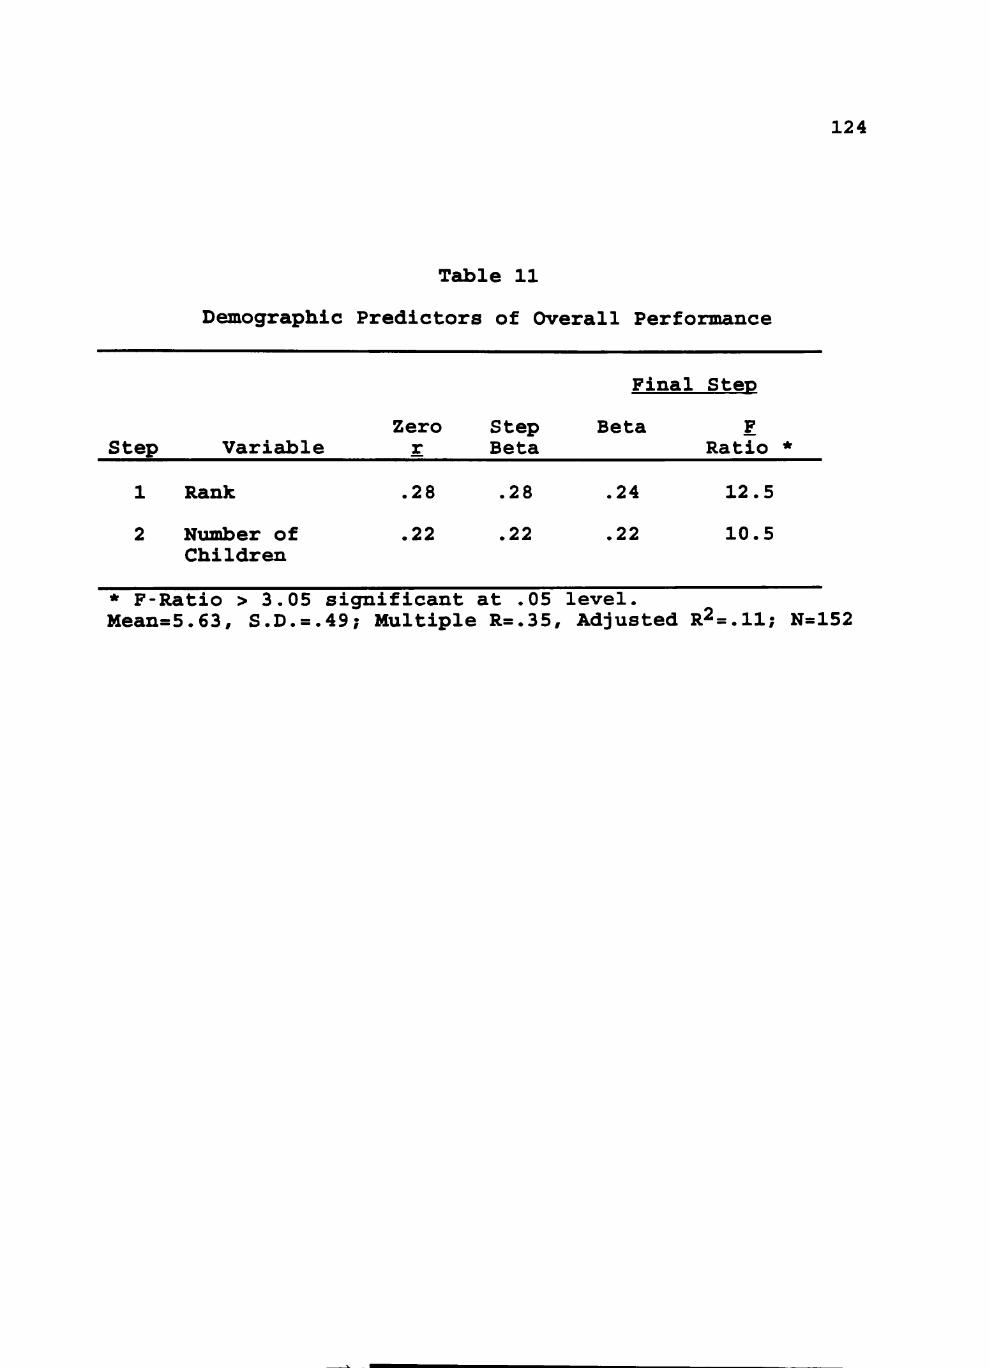
124
Table 11
Demographic Predictors of Overall Performance
Step
1
2
Variable
Rank
Number of Children
Zero r
.28
.22
Step Beta
.28
.22
Final SteD
Beta F Ratio *
.24 12.5
.22 10.5
* F-Ratio > 3.05 sigrnifleant at .05 level. Mean=5.63, S.D.=.49; Multiple R=.35, Adjusted R2=.11; N=152
125 A third and final regression equation was developed
combining personality traits and demographics to test the
final hypothesis.
7. Personality traits and demographic characteristics
can be used to create a predictive profile of perceived
instructor pilot performance.
This hypothesis was marginally supported. Teible 12
illustrates the results. When both sets of independent
variaibles were combined to predict overall perceived
performance, only three varieJ les proved significant: Number
of Children (P = .13), Rank (P = .22), and Verbal Aggression
(P = -.13). This regression model acco\inted for 14 percent
of the variance between overall perceived performance and
demographics combined with personality traits.
The original two predictor variables from the previous
personality regression equation dropped out of the new
equation: Impatience/Irritability, and Negative Communion.
These traits were replaced in the new equation by Verbal
Aggression. There was a significant correlation between
Verbal Aggression and Impatience/Irritability (r=.48), and
Negative Communion (r=.19). The overlap between the
varizUDles indicates the instability of the construct, and
ambiguity of the factor distinctions.
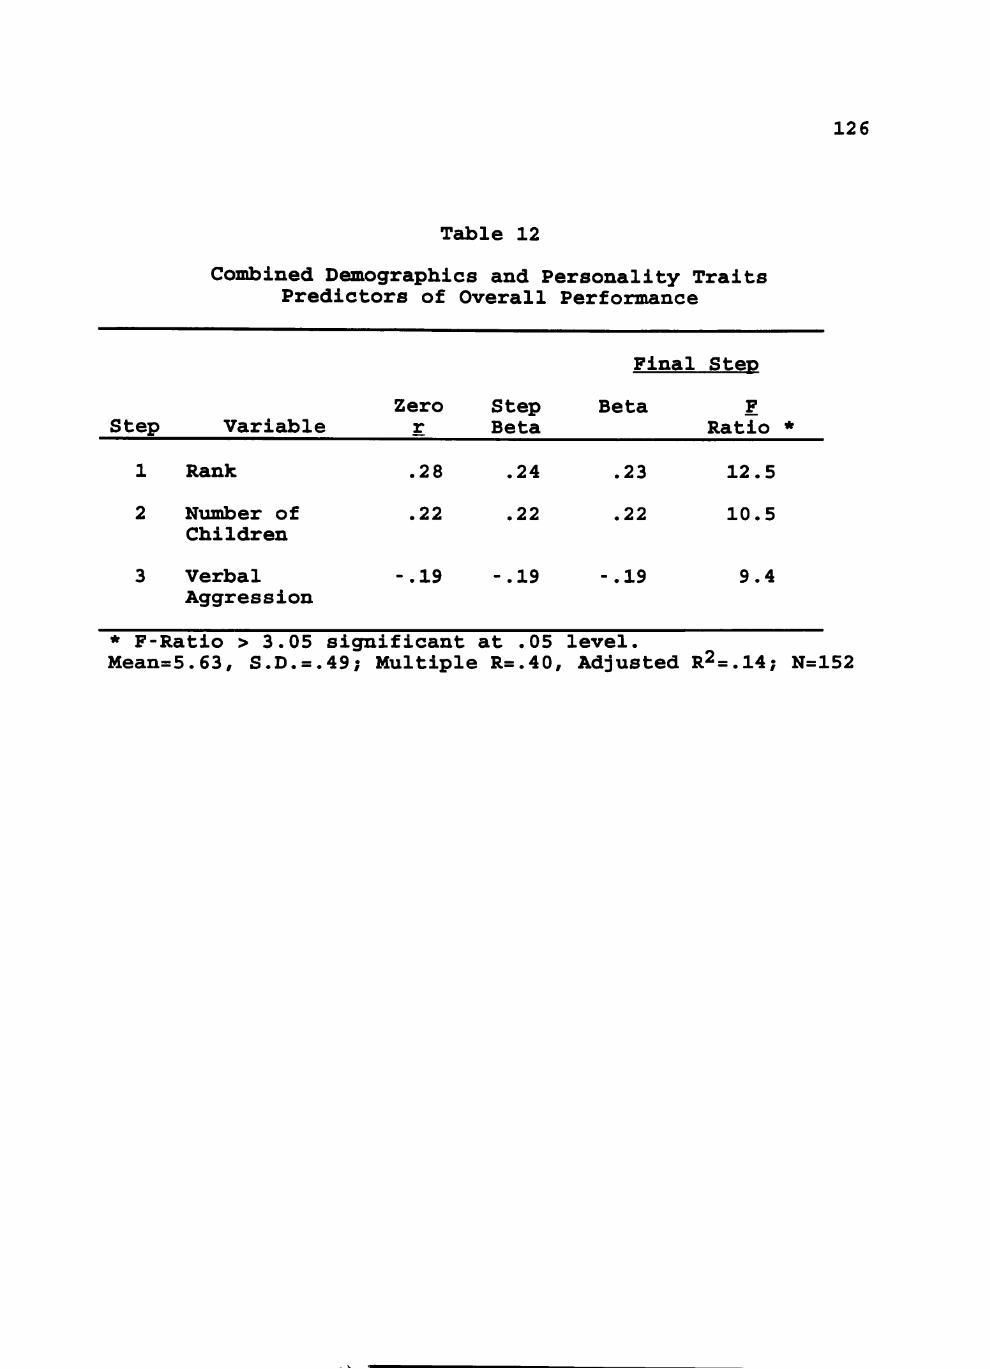
Table 12
Combined Demographics and Personality Traits Predictors of Overall Performance
126
Step
1
2
3
Variable
Rank
Nxunber of Children
Verbal Aggression
Zero r
.28
.22
-.19
Step Beta
.24
.22
-.19
Final
Beta
.23
.22
-.19
Step
F Ratio *
12.5
10.5
9.4
* F-Ratio > 3.05 significant at .05 level. Mean=5.63, S.D.=.49; Multiple R=.40, Adjusted R2=.14; N=152
127 Summary
The first analysis of the data assessed the perceived
performance measurement. Three major findings were
determined. First, external validity of the instrument was
estsiblished. All three rating groups agreed that the
performance measurement instrument was valid in measuring
instructor pilot performance. Second, an overall
performance rating was established. Seven behavioral
performance dimensions across three rating groups were
collapsed to derive an individual overall performance score.
The ratings from the various groups clustered very near the
derived overall rating score with various rating groups
emphasizing different behavioral performance dimensions.
The second analysis of data assessed personality trait
scores. The first assessment investigated the validity of
self-reported personality scores. Results indicated the
self-reported scores from IPs closely emulate the existing
database of airline pilots. The second assessment of
personality traits provided correlations with overall
perceived performance ratings. No positive personality
traits were significantly related with overall performance,
however, self-ratings of performance were significantly
related to the positive personality measures. On the other
hand, all negative personality traits were related to
overall perceived performance, reflecting small inverse
relationships.
128 The final analysis of data provide three regression
equations predicting overall perceived performance. The
first equation entered only personality traits. Two
significant variables: Negative Communion, and Impatience/
Irritability emerged. The second regression entered
demographic variables only and resulted in two significant
varieibles: Rank and Nxunber of Children. The final
regression equation combined personality traits and
demographic varieibles in predicting perceived performance.
Three significant variables resulted: Number of Children,
Rank, and Verbal Aggression. Conclusions and
recommendations are presented in Chapter V.
CHAPTER V
SUMMARY, CONCLUSIONS, DISCUSSION
AND RECOMMENDATIONS
There were three purposes to this study: to measure the
perceived validity of a new performance assessment
instrument, the NASA/UT Astronaut Survey, applied to
military flight instructors; to develop a global measurement
of instructor pilot performance; to construct regression
equations that predict overall (officership, flying, and
instructional) perceived instructor pilot performance using
personality traits, demographic characteristics, and a
combination of personality traits and demographic
characteristics. The following research hypotheses were
investigated:
1. There will be no difference in the appropriateness
ratings of the seven behavioral assessment scales from the
NASA/UT Astronaut Assessment Instrument by the three rating
groups (students, peer-instructors, and supervisors).
2. There will be no difference in perceived
performance ratings of instructors by students, peer
instructors, supervisors, and self.
3. There will be a significant relationship between
perceived effectiveness ratings of instructor pilots at UPT
and the following personality trait scale scores:
instrumentality, expressivity, mastery, work.
129
130
competitiveness, achievement striving.
4. There will be a significant relationship between
the following personality trait scale scores and perceived
effectiveness ratings of instructor pilots at UPT: negative
instrumentality, verbal aggression, impatience/
irritability, negative communion.
5. Personality traits can be used to create a
predictive profile of instructor pilot performance.
6. Demographic characteristics can be used to create a
predictive profile of instructor pilot performance.
7. Personality traits and demographic characteristics
can be used to create a predictive profile of perceived
instructor pilot performance.
Summary of the Study
In order to test these hypotheses, the investigator
collected data from two UPT bases. The cluster sampling
provided a comprehensive and stratified representation of
the population. Entire classrooms (flights) were sampled at
a time (n=22). Each flight was composed of roughly 10
instructors, 15 students, and one supervisor. Instructors
(n=152) completed a demographic survey followed by a self-
reporting personality inventory. After completion of the
first two instruments, the instructors and students (n=423)
were given a perceived performance rating instrument to
assess performance of all instructor pilots in the flight.
131
Until this time all subjects were blind to the performance
assessment objective. Instructors and students were then
instructed to use a Likert scale to rate each instructor in
the flight across the following seven defined performance
dimensions: job competence-knowledge, job competence-
performance, job competence-performance under pressure,
leadership, teamwork, personality, and communication skills.
The perceived performance appraisal instrument was
modified from the astronaut performance assessment survey
developed by a NASA/University of Texas project. A self-
reporting personality survey, the Personality
Characteristics Inventory (PCI), was also borrowed from the
University of Texas. The PCI is targeted to assess two
broad personality trait dimensions. Instrumentality or goal
orientation, and Expressivity or interpersonal capacities.
A demographic survey was also used to collect data on the
backgrounds of the instructor pilots. It was compiled from
previous aviation and higher education instruments and was
designed to collect information on: professional
development, education, and family structure.
The first analysis of data established the validity of
the performance assessment instrument. The three rating
groups, plus evaluator pilots, assessed the appropriateness
of the performance measures defined on the NASA/UT Astronaut
Survey.
132
The second analysis of data established the dependent
variable of an overall perceived performance rating. Three
groups (students, peer-instructors, and supervisors) rated
each instructor across seven performance dimensions. The
performance dimensions were then combined to provide a Grand
Mean performance rating. The Grand Mean for each rating
group was then combined through a weighted equation, [(0.4)
Student Grand Mean + (0.4) Peer-instructor Grand Mean +
(0.2) Supervisor Grand Mean], to derive a single overall
perceived performance rating, the Overall Grand Mean. The
dependent variable, therefore, represents the perceived
performance rating from three rating groups rating an
individual instructor across seven performance dimensions.
The final analysis of data established stepwise
regression equations predicting an instructor's overall
perceived performance. Three equations were developed using
the various independent variables of personality traits,
demographics, and a combination of both. A summary of the
data analysis are reported in the next section. Impressions
and implications are also noted from the researcher's
observations documented during the study.
Conclusions
The following conclusions are based upon the results of
this study. All groups reported "agree" to "strongly agree"
that the measurement constructs on the NASA/UT Survey were
133
appropriate in measuring Air Education Training Command
(AETC) Instructor Pilot performance. Additionally, subjects
repeatedly were enthusiastic in their support of the new
measure and its format. The findings additionally indicated
that the multiple group rating technique of perceived
performance was well received by the ratees and provided
valuable insights to perceived performance normally not
observed using other methods. The three regression
equations provided weak to marginal prediction of perceived
performance. Demographic variables were better predictors
of instructor pilot perceived performance than personality
trait variables. Two demographic variables (Number of
Children, and Military Rank) accounted for eleven percent of
the predictive model's variance. Only five percent of the
predictive model's variance was accounted for by two
significant personality traits. Negative Communion and
Impatience/Irritability. Combining demographic and
personality trait variables resulted in three significant
variables (Number of Children, Military Rank, and Verbal
Aggression), accounting for 14 percent of the model's
variance.
Discussion and Implications
Perceived Performance
Results from the first analysis of data indicated that
the three rating groups agreed the NASA/UT Astronaut
134
Assessment instrument was an appropriate performance measure
for instructor pilots. Moreover, two major findings of the
study were: (1) Various rating groups possess different
emphases of perceived performance criteria, (2) all types of
rating groups have biases that affect performance ratings.
The first finding impacts performance criteria policy
and theory. In this study, the three rating groups agreed
that all seven performance appraisal dimensions from the
NASA/UT instrument were appropriate in IP assessment. Three
dimensions (job knowledge, job performance, and
communication) received the highest appropriateness rating
by all rating groups. These dimensions closely parallel
formal IP performance evaluation criteria currently
practiced by the Air Force. The contribution of this study
is to identify four other performance appraisal dimensions
recognized as appropriate in IP appraisal, but not currently
measured by the Air Force. These dimensions include: job
performance under pressure, leadership, teamwork, and
personality.
Although these four dimensions were unanimously agreed
upon by the three rating groups as appropriate measures, the
emphases (magnitude of appropriateness) varied on the
different scales for the various rating groups. Students
highlighted "personality" as an important IP measure, peer-
instructors stressed "performance-under-pressure," and
supervisors identified "leadership" and "teamwork" as the
135
more important IP evaluation criteria. These findings
suggests that the three groups have different opinions of
what criteria constitutes quality performance. This
complements Boreman's (1974) conclusions that peers,
superiors, and subordinates hold unique pieces of the puzzle
which portrays an individual's job performance. The first
theoretical implication of this study supports Boreman's
observation that different groups possess different values
of performance criteria and different insights. It also
supports the 360-degree performance feedback technique. By
including multiple group perspectives and their associated
criteria emphases, a more comprehensive and representative
performance appraisal is achieved.
The policy implications of this finding suggests that
current IP performance appraisal criteria may be incomplete.
These four dimensions are not at the current time directly
observed, measured, nor documented in formal instructor
pilot job performance appraisal. Only supervisors'
perspectives of job performance, knowledge, and
communication is officially assessed. Not only may the
current criteria be deficient, but supervisors may also be
biased in their observations. This leads to the second
major finding from this research.
The second finding from the performance appraisal
analyses complements the literature review that each type of
rater possess specific rating bias. Four trends were
136
established. First, self-ratings were always higher than
the three formal rating groups across all seven assessment
scales. This finding emulates classical performance
appraisal theory that self-ratings tend to be more favorable
than ratings from other groups (Kirchner, 1965; Parker,
Taylor, Barrett, & Martens, 1959; Steel & Ovalle, 1984).
The inflated self-perceptions of performance highlight the
need for job performance feedback. Second, supervisors
always rated instructors lower on all scales than did peer-
instructors and students. This again complements classical
performance theory that supervisors' ratings tend to be less
favorable than other rating groups (Rothaus, Morton, &
Hanson, 19 65; Springer, 1953; Zedeck, Imparato, Krausz, &
Oleno, 1974). Third, students rate instructors higher on
the job competence scales of knowledge, performance, and
performance under pressure. This is most likely due to the
bias caused by the student's naive subject knowledge, as
suggested in previous studies by Rosenshine (197 0). Fourth,
peers rate instructors higher on the more sxibjective scales
of leadership, teamwork, and communication skills. This may
be due to the more direct, daily observation made by peers,
or this finding may fall prey to Muchinsky's (1990) theory
that peer ratings are often biased by friendships and
popularity.
These trends imply that all types of rating groups have
some form of bias. The theoretical implication of this
137
finding supports the 3 60-degree performance appraisal
technique. To best control, or at a minimum identify
biases, instructors should be provided ratings from each
group. This would allow the instructor and supervisor more
options in choosing the appropriate rating group for a given
performance criteria and would generate more potential areas
for discussion during performance debriefing sessions. The
theoretical strength of the 360-degree appraisal technique
is its representation of various work-level insights, and
its ability to identify bias and rating discrepancies
between rating groups.
The final policy implication from the performance
analyses, and bias identification, concerns the utility of
performance appraisal. Performance appraisal literature
cautions that certain criteria and rating groups should be
used for developmental feedback appraisal only, and not
official documented evaluations. Specific examples in this
study were the personality criterion and the peer-instructor
rating group. Peer review is generally perceived as a
popularity contest when applied to formal job performance
evaluation (Gephart, 1979). This is especially true in
higher education settings where tenure and appointments are
awarded (Batista, 1976). Peer review is widely accepted and
encouraged for informal faculty development and mentoring
programs. However, if official documentation is involved,
researchers contend the bias of friendships and popularity
13 8
compromise the developmental and accuracy potential of peer
insights (Gephart, 1979; Kane & Lawler, 1979; Millman,
19 87) . If peer review is to be used for instructor pilot
performance evaluations, it is important to keep it an
informal, undocumented process where the concentration is
developmental and not formal evaluation.
The second concern in the utility of performance
appraisal is the use of subjective criterion such as
personality. Until more reliable and stronger measurements
are validated, suspected performance criterion such as
personality should be used as a feedback tool only and not a
part of formal evaluation (Weiss & Adler, 19 84). Current
personality measures are still marginal predictors with
typical correlation values of r=.20. Such low correlations
are not valid, nor reliable enough to support formal
performance appraisal application. This study certainly
illustrates the practical application concern over
personality measures. Although, the personality findings
indicated significant correlation for four personality
traits, there is little practical significance. Weak
correlations as reported in this study (r=.19) may be
statistically significant, but are hardly of practical
significance. The correlations are far too weak to support
any tangible application. The trends, however, may
facilitate discussion and informal performance debrief
counseling. Weiss and Adler (19 84) advocate that although
139
personality correlations remain low, personality assessment
may still provide excellent performance appraisal debrief
topics in a strictly informal setting.
In summary, the performance appraisal analyses achieved
the first two purposes of this study. The NASA/UT astronaut
assessment survey was determined as a valid IP performance
appraisal tool, and a global performance rating was achieved
which represented seven performance appraisal dimensions and
three rating groups. Additionally, the 3 60-degree feedback
technique was supported by highlighting the different
performance criteria emphases by various rating groups, and
identifying the innate biases associated with the different
rating groups. This additional finding underscores the
shortcoming of the present IP performance evaluation
technique which concentrates on supervisor only perspectives
using very limited criteria.
Personality
The second analysis of data revealed modest correlation
values between personality traits and perceived performance.
The study separated personality traits into positive and
negative attributes for the investigation. None of the
positive personality attributes were significant with
overall performance. They had a wide range of variability
(r = -.12 to .15), and were variable in relationship
direction. The most significant relationships
140
for positive personality attributes occurred when measured
solely against self-ratings of performance. Four
personality traits (Achievement Striving, Expressivity,
Instriunentality, and Bipolar Instrumentivity/Expressivity)
had significant positive relationships (r = .17 to .28) with
the self-rating group.
Higher correlations between personality traits and
self-ratings probably occurred due to the imique insights of
performance motives the self possesses. Campbell (1991),
Mabe and West (19 82) have shown self raters may better
understand the motivation underlying their behavioral
patterns and are in a better position to see how their
behaviors change across time and situations. This
privileged information would affect the self-reported
performance rating and the self-reported personality
assessment. Isaacson, McKeachie and Milholland (1963)
further determined that self-reporting was not a valid
method of measuring performance/personality relationships.
Due to the self's unique insight into motives, self-
reporting of personality may have caused the high
correlations with self-rating in this study.
The relationships between negative personality trait
attributes and overall perceived performance were much more
predictable and consistent. They all had an inverse
relationship with small variation (range = -.18 to -.19;
141
p<.05), with three of the four negative attribute
correlations significant.
Two possible explanations of why negative attributes
had such high correlations with perceived performance can be
identified under two psychological paradigms -- learning
theory, and social behavior. Under learning theory,
negative personality attributes may be viewed as a form of
punishment. Verbal aggression for instance is simply
shouting or making demeaning comments/critiques. In a
learning environment this can be very detrimental. Skinner
(1984) identified multiple reasons for not using punishment:
(1) it causes unfortunate emotional byproducts, and (2)
punishment elicits aggression toward the punishing agent.
If students perceived the negative personality attributes as
a form of punishment then it would logically follow they
responded by rating appropriate instructors lower on
performance. Assessing student critiques, Azrin and Holz
(1966) confirmed the retaliatory reaction of students to
instructional forms of punishment. They found students
rated instructors lower in performance when punitive forms
of discipline were used in the classroom. The negative
personality traits in this study can easily be associated
with instructional forms of punishment and may account for
the significant inverse relationship with perceived
performance.
142
A second interpretation of the significant relationship
between negative personality traits and perceived
performance is from a social behavior paradigm. Gilbert
(1989, 1991, 1993) contends that people go through two steps
when making attributions or appraisals. They begin by
making an internal attribution based on the person's
previous behavior, and then adjust that attribution based on
the situation. Most people, however, fail to reach the
second step and base the attribution solely on previous
experience. This mental shortcut process is called the
anchoring/adjustment heuristic and is greatly biased by
first impressions or experience (Aronson, Wilson, & Akert,
1994) . The heuristic process is greatly affected by
negative perceptions (Levenson, Carstensen, & Gottman,
1994) . Negative personality traits may be regarded by
observers the same as negative perceptions and thus
influence performance appraisal. Instructor pilots with
pronounced negative personality trait scores may have been
rated based on biased heuristic perceptions by observers.
Thus, the relationship between negative personality traits
and perceived performance would be amplified by a biased
attribution process. Raters need to be informed in advance
of this natural bias process and reminded to assess the
whole person across a period of time rather than a single
situation.
143
Other explanations to the personality trait results
involve two statistical considerations. First, due to the
dominant sample size and the factor weighting, overall
perceived performance ratings closely mirrored the student
group ratings (Table 8). For the most part, student rating
correlations and overall rating correlations matched in
direction of the relationship, and significance. If the
student rating group weighting in the overall performance
computation was changed, there would certainly be a
difference in both significant correlations and the
subsequent regression model. The weighting of the overall
performance computation currently reflects AETC's criteria
in student assessment, but may not be appropriate for
instructor assessment. Further research should explore the
factor weighting of the overall performance computation and
make adjustments to better define and represent AETC's
criteria of instructor pilot performance assessment.
A second statistical consideration is the extreme
values in negative personality traits scores (Table 7). The
positive trait scores clustered near the center of the
rating scale (3). The negative trait scores, however, were
skewed to the left near the lower scores (1.5). The
skewness of the negative trait distribution would promote
significant correlations. Implications of this
consideration are simply to recognize that negative traits
have a higher potential of producing significant
144
correlations. Positive personality attribute scores have a
natural tendency to cluster near the middle of the
distribution and, therefore, are less likely to produce
significant correlations.
Demographics
The final analysis of data examined the relationship
between demographic variables and perceived performance.
The stepwise regression equation accounted for eleven
percent of the variance and was composed of two significant
demographic variables. Number of Children and Military Rank.
Closer inspection of the significant demographic variables
correlations revealed three trends (Table 10). There were
nine significant demographic correlations with overall
performance (Age, Marital Status, Number of Children, Time
in Service, Military Rank, Total Flying Time, Squadron
Officers School (2 month professional schooling), Previous
Aircraft, and Career Intentions. These correlations ranged
in magnitude from .17 to .28. Many of these variables
overlap and could be combined into a categorical factor
called "Social Maturity" or "Social Experience." It appears
the more "socially experienced" the instructor pilot is, the
higher their performance rating. This may be due to the
emphases on the social environment in the workplace by the
more mature individual. Friedlander (1963) found that the
older supervisors tended to derive more satisfaction from
145
the social and technical aspects of their work and less
satisfaction from self-actualization than did the younger
supervisors. Older, more mature instructor pilots may be
more socially in tune with student and peer needs and less
consumed with their own. Whether labeled maturity or simply
social experience, the older instructors are perceived as
better performers.
A second trend among demographic correlations appear
among supervisor ratings only. Significant correlations
with supervisor ratings solely, again identified "social
experience" variables and also identified a new set of
"professional experience" variables. Large and significant
correlation magnitudes occurred with variables such as Total
Flying Time, Military Rank, Previous Aircraft Experience,
Career Intentions, and SOS (Professional education). These
variables congregate and overlap into a "professional
experience" factor. Supervisors appear to heavily weight
previous military experience and professional education with
perceived performance. Part of this practice is
artificially imposed by the military structure and may be
another form of rating bias. Officers of higher rank are
placed in jobs with more responsibility and generally higher
visibility. The more senior officers will naturally work
closer with supervisors and thereby their performance may be
more noticeably observed or credited for their increased
responsibilities. This may bias ratings simply by providing
146
increased exposure and opportunity of senior ranking
officers to performance evaluators.
The final demographic trend was with self ratings.
Significant demographic correlations for self-ratings
appeared to cluster around a type of "hands on experience"
factor. The experience factor this time was weighted toward
time and experience as an instructor pilot. Self-ratings
resulted in the highest correlations (r = .29) with
variables such as Time as an IP, Total Flying Time, IP
Flying Time, and Rank. Instructors base their own
performance level with the amount of "instructional hands
on" experience. It appears the self recognizes performance
based on how well one can do the primary job at hand,
instruct student pilots.
All three trends of the demographic variables imply
some type of experience factor. Overall perceived
performance ratings appear related to "social" experience.
Supervisor recognition of performance appears slanted
towards "professional" experience. Self-ratings of
performance appear to emphasize "hands on" instructional
experience. These trends complement the new AETC instructor
pilot hiring philosophy of replacing younger inexperienced
IPs with more operationally experienced pilots.
147
Observations
From informal interviews with the three rating groups
and from observing the rating process, the researcher
discovered ancillary information that complement the
empirical findings. Instructor pilots wanted specific
performance feedback, and feedback from multiple groups.
They liked the performance appraisal instrument because it
included specific performance criteria instructors felt were
related to being an instructor pilot and Air Force officer.
They felt the constructs reinforced and emphasized "the
mission," or "why" they were there. Instructors also liked
the multiple rating groups technique because it reinforced
the different customer groups of the instructor pilot's
work. The instructors recognized these various groups have
different insights and priorities, and wanted to know how
these groups perceived their performance along with specific
instances of "why." There were, however, some concerns
about implementation and how the performance information
would be used.
Instructors were, at first, reluctant to report on
peers. Two concerns surfaced during the interview. First,
peers were apprehensive about how the ratings would be used
and who would see them. Anonymity and Privacy Act
statements assured the confidential nature of this study,
but the concern remained valid for future potential
application of the process. The instructors were willing to
148
critique peers and to receive peer critiques, but only under
non-threatening circumstances. The instructor's reaction
are best described by Kane and Lawler (197 8) conclusions
that peer appraisals are accepted, and perceived valid, if
they are used unofficially and solely for the purpose of
providing detailed and accurate feedback to workers.
Second, some instructors were concerned with the
validity of peer ratings. They felt it would simply reflect
popularity contests and did not believe peer ratings would
be accurate assessments. This is a classical concern by
peers. Cederblom and Lounsbury (1980) found a lack of user
acceptance in peer rating in a study of college professors.
The professors resisted peer rating reviews because of the
perceived threat of friendship and popularity bias. McEvoy
and Buller (19 87) suggested bias on peer appraisal can be
controlled, and peer rating validity increased if the
ratings are only used for informal feedback.
The key to acceptability and validity in peer ratings
is utilization. Peer ratings must be unofficial and
undocumented. They should be implemented as developmental
forms of feedback only. If these conditions are met,
instructors indicated they would accept the multi-group
rating process.
149
Implications for Higher Education
Higher education implications of this study apply
directly to faculty performance appraisal. The personality
assessment feature resulted in weak correlations with no
practical significance. The 3 60-degree feedback technique,
however, resulted in the identification of a new performance
assessment technique, criteria, and a potential indicator of
rating group bias. It was found that various rating groups
possess different expectations and criteria of faculty
performance. A student, for example, may have no interest
in a faculty member's research activity, but instead
emphasize the faculty member's teaching ability.
Administrators, on the other hand, interested in scholarly
representation of the institution may place an emphases on
faculty research. This study highlighted those group
differences in perceived faculty performance criteria. If
faculty performance is to be holistic, then various rating
groups need to be consulted to provide representative
criteria. Millman, (19 87) highlights the unique insights of
peers and students in teacher evaluation, but overlooks the
important inputs these groups can contribute to establishing
performance criteria. This study suggests that various
rating groups should be consulted to establish a holistic
criteria for faculty performance assessment.
The second higher education implication from this
research highlights the bias from various rating groups in
150
faculty appraisal. It validates previous findings by
Batista (1976) who indicated that students and peers inflate
different performance evaluation scales on course critiques.
Batista attributed the discrepancy in scale inflation to
differences between student and peer-instructors in subject
knowledge and familiarity with the instructor. This study
emulated these findings, highlighting the classical rating
pattern inflation from various rating groups. The group
rating bias found in this study underscores the need and use
for 3 60-degree appraisal. Such a technique provides the
opportunity to identify scale inflation and allows faculty
member to better process performance ratings.
Future faculty appraisal should strongly consider the
360-degree feedback technique. The process can provide
comprehensive criteria which represents the unique needs and
concerns from various customers of the higher education
process. Application of the 360-degree process also helps
identify various group bias in typical instructor and
classroom performance appraisals. The comparison of rating
scores across the various rating groups facilitates
discrepancy discussions for faculty development and
highlights scale inflation indicative of various rating
group bias.
151
Recommendations
The following recommendations are made based upon the
results of this research.
Recommendations for Instructor Pilots
1. More mature and experienced Air Force pilots should
be selected for instructor pilot duty. A more socially
mature pilot appears to interact better with students and
provide a more credible real world experience to their
instruction.
2. Performance assessment of instructor pilots should
include other perceptions than just the supervisor.
Supervisors have a limited, biased perception that may not
accurately assess all facets or insights of an instructor's
performance.
3. More periodic, holistic feedback should be provided
to instructors. Instructors want to do well, but do not
have an accurate baseline to judge their current
performance. This baseline should include perceptions from
peers and students as well as the current system of
supervisor feedback.
4. Instructor pilots should be expected to provide
performance feedback to peers which would increase peer
development opportunity and responsibility.
5. Counseling and training should be established to
help instructors interpret and improve performance feedback
152
results, thereby keeping performance rating feedback
developmental.
6. The PCI does not appear sensitive enough to
discriminate among the homogenous group of instructor
pilots. The instrument should be modified for peer
reporting, or more specific questions should be developed
for the military instructor pilot work arena.
Recommendations for Future Research
1. This study used a self-reporting personality survey
consisting of eleven traits. The potential overlap and
duplication of these traits may dilute the results. A
future study should be conducted using a simpler,
streamlined personality measure, such as the five-factor
model, or observer reporting instruments.
2. Although well defined, the seven performance
measures used in this study should include more specific
examples for the various ratings. Further research should
develop specific behaviors and examples for each rating,
i.e.. Communication: (7) always debriefs the student in a
positive manner, (1) no debrief accomplished.
3. The dependent variable in this study may have been
diluted by combining the performance constructs. Future
studies should investigate the influence of personality
traits with specific performance scale measures, i.e.,
leadership, teeum« ork, etc..
153
4. Future research should investigate the potential
impact of various instructor training programs, such as a
comparison of perceived performance ratings between an
experimental group receiving developmental 360-degree
feedback and a control group which receives no feedback.
5. In this study, experience emerged as a significant
predictor of performance. Future studies should investigate
the relationship between maturity, flight experience,
personality, and performance.
Conclusions
This study identified a new performance measure and
technique for ATC instructor pilot performance appraisal.
It identified and validated new performance criterion (the
NASA/UT Astronaut Assessment Survey) that provides a single
global measure for the broad duties of instructor pilots.
It also explored a new performance rating technique (the
360-degree feedback) that provides more in-depth, and unique
insights to an instructor pilot's daily performance. Both
of these developments contributed significantly to the
practical assessment of instructor pilots, and to the
theoretical development of performance appraisal.
This study also explored the relationship of
personality traits and demographics to perceived
performance. Although no significant implications to
personality research were found, the importance of
154
experience was identified in perceived instructor pilot
effectiveness. This finding is the first empirical support
of the new ATC direction to replace First Assignment
Instructor Pilots (FAIPs) with more operationally
experienced Major Weapon Systems (MWS) pilots.
The influence of personality traits on perceptions of
performance was quite small in this study, but
instrumentation remains suspect. Although four personality
trait scale resulted in small statistical significance, the
relationships were very weak and did not provide any
practical significance. Three confounds to the personality
regression included the mixed self-reporting of the
personality instrximent with the observer rating of perceived
performance, the largely homogeneous sample of instructor
pilots, and the lack of variability in the dependent
variable of overall perceived performance. Factors
composing the PCI appear to overlap and dilute the
significance of any single personality trait. The study
should be replicated with a new Big-Five personality measure
rather than the PCI. Additionally, observers' reporting of
an individual's personality should be explored versus the
self-reported personality measure used in this study.
Policy implications of the study resulted in multiple
performance assessment findings. First, the current
criteria for IP performance assessment appears incomplete.
Four additional criteria (performance-under-pressure.
155
leadership, teamwork, personality) were unanimously
identified by the various rating groups as appropriate, and
needed, measures of IP performance. Second, self-ratings of
performance were significantly higher than all other rating
groups. This underscores the need for IP feedback, and the
skewed perceptions of the instructor. The 3 60-degree
feedback method provides comprehensive feedback to the
instructor which highlights the unique perceptions of
various rating groups. Third, demographics indicating
flying and military experience were predictors of perceived
performance. All rating groups recognized pilots with more
experience, such as the MWS pilots, as better performers.
It appears the proposed IP composition change to increase
Major Weapons Systems(MWS) pilots at UPT is justified.
Theoretical implications also pivoted around the
performance appraisal part of the study. Personality traits
were of minimal statistical significance and of no practical
significance. This confirms current personality research
which cites the difficulty of achieving measurable
difference in self-reported personality measures. The
performance appraisal technique, however, resulted in very
encouraging findings. Multiple rating groups which
participate in the 360-degree feedback technique, do provide
unique insights to the performance appraisal process and
diffei"ent emphases of criteria for rating performance.
Their diverse representation of various work level
156
perspectives provide a more comprehensive and accurate
picture of an instructor's all-around performance.
Additionally, the various rating help identify rating group
bias of various performance appraisal scales. Different
rating group bias was found in this study to emulate
previous research. Self-ratings were always higher than
other groups, supervisors were lower, student inflated job-
knowledge scales, and peers inflated teamwork, personality,
and communication.
This study did not support personality predictors of
perceived performance as originally proposed. Instead,
demographic predictors were found to be the more significant
predictor. The greatest contribution from this research
concerns the performance appraisal technique. The 360-
degree feedback process was very successful at identifying
comprehensive performance criteria, and illustrated
differences in rating group perspectives. The 360-degree
technique may have promising potential in future faculty
performance appraisal. Its diverse perspectives may provide
assessments that go far beyond the classroom and typical
course critique. Future studies should explore this
opportunity to assess faculty using the 360-degree process
and criteria from the NASA/UT Astronaut Assessment Survey.
REFERENCES
Air Training Command. Historical Research Paper, Major Changes in Pilot Training 1939-1984. Randolph AFB, TX: Air Training Command, History and Research Office, October 19 84.
Aleamoni, L. M. (1976). Typical faculty concerns about student evaluation on instruction. National Association of Colleges and Teachers of Agriculture Journal. 20: 111-121.
Allport, G. W. (1937). Personality. New York: Holt.
Allport, G. W. (1961). Pattern and Growth in Personality. New York: Holt.
Allport, G. W., & Odbert, H. S. (1933). Trait-names: A psycho-lexical study. Psychological Monographs. 47, 171-220 (1, Whole No. 211).
Allport, G. W., Vernon, P. E., & Lindzey, G. (1951). Study of values. Boston: Houghton-Mifflin.
Anastasi, A. (1972). Personality Research Form. In O. K. Buros (Ed.), The seventh mental measurements yearbook. Highland Park: Gryphon Press.
Anastasi, A. (1976). Psychological Testing. New York: Macmillan.
Aronson, E., Wilson, T. D., & Akert, R. M. (1994). Social Psychology: The heart and the mind. New York: Harper Collins.
Astin, A. W. (1991). Assessment for Excellence: The philosophy and practice of assessment and evaluation in higher education. New York: Macmillan.
ATC Study Guide. (1990). Pilot Instructor Training-Instructor Development (ATC Study Guide F-V5A-A/B-ID-SG). Randolph AFB, TX: DCS Operations and Readiness.
Azrin, N. H., & Holz, W. C. (1966). Punishment. In W. K. Honig (Ed.). Operant Behavior: Areas of research and application. Englewood Cliffs, NJ: Prentice-Hall.
Bale, R., Rickus, G., & Ambler, R. (1973). Prediction of advanced level aviation performance criteria from early training and selection variables. Journal of Applied Psychology. 58, 347-350.
157
_ 158 Barone, J. Maj. (1993). Major weapon systems instructor
pilot advantages. Headquarters AETC Public Release. Release No.93-11-02, Randolph AFB, TX: November.
Barrett, G. V., & Kernan, M. C. (1987). Performance appraisal and terminations: A review of court decisions since Brito v. Zia with implications for personnel practices. Personnel Psychology. 40, 489-503.
Barrick, M. R., & Mount, M. K. (1991). The Big Five personality dimensions and job performance: A metaanalysis. Personnel Psychology. 44, 1-21.
Batista, E. E. (1976). The place of colleague evaluation in the appraisal of college teaching. Research in Higher Education, 4: 257-271.
Blower, D. (1992) . Performance-based testing and success in naval advanced flight training. (Tech. Report NAMRL-13 63) . Pensacola, FL: Naval Aerospace Medical Research Laboratory.
Blower, D., & Dolgin, D. (1991). An evaluation of performance-based tests designed to improve naval aviation selection. (Tech. Report NAMRL-1363). Pensacola, FL: Naval Aerospace Medical Research Laboratory.
Bluen, S. D., Barling, J., & Burns, W. (1989). Predicting job satisfaction and depression using the Impatience and Achievement Striving dimensions of Type A behavior. Journal of Applied Psychology. 44: 112-121.
Borderlon, V. P., & Kantor, J. E. (1986). Utilization of Psychomotor Screening for USAF Pilot Candidates: Independent and Integrated Selection Methodologies. AFHRL-TR-86-4. Brooks AFB, TX: Air Force Systems Command.
Borgatta, E. F. (19 64). The structure of personality characteristics. Behavioral Science. 9, 8-17.
Borich, G. D. (1977). The Appraisal of Teaching; Concepts and Process. Reading, MA: Addison-Wesley.
Borman, W. (1974). The rating of individuals in organizations: An alternative approach. Organizational Behavior and Human Performance. 12, 105-124.
159 Botwin, & Buss, D. M. (1989). The structure of act report
data: Is the five factor model of personality recaptured? Journal of Personality and Social Psychology. 56, 988-1001.
Bowers, N. D. (1953). An evaluation of instructor's ground school training in the Naval Air Basic Training Command (Special Report No 58-4) Pensacola, FL: U.S. Naval School of Aviation Medicine.
Brictson, C , Burger, W., £e Gallagher, T. (1972). Prediction of pilot performance during initial carrier landing qualification. Aerospace Medicine. 43, 483-487.
Bridgwater, C. A. (1982). Personality characteristics of ski instructors and predicitng teacher effectiveness using the PRF. Journal of Personality Assessment. 46, 2, 164-168.
Briggs, S. R. (1989) . The optimal level of measurement for personality constructs. In D. M. Buss, N. Cantor (Eds.), Personality Psychology; Recent trends and emerging directions. New York: Springer-Verlag.
Buss, D. M., & Craik, K. H. (1983). Act prediction and the conceptual analysis of personality scales. Journal of Personality and Social Psychology. 45, 1081-1095.
Campbell, D. P. (1991). Manual for Campbell Leadership Index. Minneapolis, MN: National Computer Systems.
Carretta, T. (1992a). Recent developments in U. S. Air Force pilot candidate selection and classification. Aviation. Space, and Environmental Medicine. 63, 112-114.
Carretta, T. (1992b). Understanding the relations between selection factors and pilot training performance: Does the criterion make a difference? International Journal of Aviation Psychology. 2, 95-106.
Cattell, R. B. (1947). Confirmation and clarification of primary personality factors. Psvchometrika, 12, 197-220.
Cederblom, D., & Lounsbury, J. W. (1980). An investigation of user acceptance of peer evaluations. Personnel Psychology. 33, 567-580.
160 Chlldester, T. R. (1988). Leader personality and crew
effectiveness: Factors influencing performance in full-mission air transport simulation. In Proceedings of the 66th Meeting of the Aerospace Medical Panel on Human Stress Situations in Aerospace Operations. Advisory Group for Aerospace Research and Development, The Hague, Netherlands, 7-1 - 7-9.
Cohen, J. (1983). The cost of dichotomization. Applied Psychological Measurement. 7, 249-253.
Cohen, P. A. (19 81). Student ratings of instruction and student achievement: A meta-analysis of multisection validity studies. Review of Educational Research. 51, 281-309.
Conley, J. (19 85). Longitudinal stability of personality traits; A multitrait-multimethod-multioccasion analysis. Journal of Personality and Social Psychology, 49, 1266-1282.
Costin, F. (1971). Student ratings of college teaching: Reliability, validity, and usefulness. Review of Educational Research. 41, 511-535.
Cross, K. P. (1988). Classroom Assessment Techniques: A Handbook for Faculty. Ann Arbor, MI: National Center for Research on the Improvement of Postsecondary Teaching and Learning.
Dcunos, D., & Gibb, G. (1986). Development of a computer-based naval aviation selection test battery (Tech. Report NAMRL-1319). Pensacola, FL: Naval Aerospace Medical Research Laboratory.
Davis, R. A. (1989). Personality: Its use in selecting candidates for US Air Force Undergraduate Pilot Training. Air University Report AU-ARI-88-8. Air University Press, Maxwell Air Force Base, AL.
Davis, W. A. (1990). Analysis of the Coast Guard Flight Instructor Profile. Unpublished dissertation, Detroit, MI; Wayne State University.
Digman, J. M. (1990). Personality structure: Emergence of the five-factor model. In M. R. Rosenzwieg & L. W. Porter (Eds.), Annual Review of Psychology. 41, 417-440.
Digman, J. M., & Takemoto-Chock, N. K. (1981). Factors in the natural language of personality. Multivariate Behavioral Research. 16, 149-170.
161 Dolgin, D. L., & Gibb, G. D. (1988). Personality Assessment
in Aviation Selection; Past. Present, and Future. Nava1 Aerospace Medical Research Laboratory, 21.
Driskell, J. E., Hogan, R., & Salas, E. (1987). Personality and group performance. In C. Hendrick (Ed.), Personality and social psychology review (pp. 91-112). Beverly Hills, CA: Sage.
Dunn, R., & Dunn, K. (1978). Teaching Students Through Their Learning Styles: A Practical Approach. Englewood Cliffs, NJ: Prentice-Hall.
Epstein, S. (1979). The stability of behavior: I. On predicting some of the people much of the time. Journal of Personality and Social Psychology. 37, 1097-1126.
Epstein, S. (1980). The stability of behavior: II. Implications for psychological research. American Psychologist. 35, 790-806.
Epstein, S. (19 83). Aggregation and beyond: Some basic issues on the prediction of behavior. Journal of Personality, 51, 360-392.
Epstein, S. (1984). The stability of behavior across time and situations. In R. Zucker, J. Aronoff, & A. I. Rabin (Eds.), Personality and the prediction of behavior (pp. 209-268). San Diego: Academic Press.
Fiske, D. W. (1949) . Consistency of the factorial structures of personality ratings from different sources. Journal of Abnormal and Social Psychology. 44, 329-344.
Frey, P. W. (1978). A two-dimensional analysis of student ratings of instruction. Research in Higher Education. 9, 69-91.
Friedlander, F. (1963). Underlying sources of job satisfaction. Journal of Applied Psychology, 47, 246-250.
Gephart, W. J. (1979). Practical applications of research on personal evaluation (editorial). Practical Applications of Research. 2; 3.
Getzels, J. W., & Jackson, P. W. (1963). The teacher's personality and characteristics. In N. L. Gage, (Ed.), Handbook of Research on Teaching, (pp. 506-582). Skokie, IL: Rand McNally.
162 Ghiselli, E. E. (1973). The validity of aptitude tests in
personnel selection. Personnel Psychology. 26,461-477.
Gilbert, D. T. (1989). Thinking lightly about others; Automatic components of the social influence process. In J.S. Uleman & J. A. Bargh (Eds.) Unintended thought (pp. 189-211). New York; Guilford Press.
Gilbert, D. T. (1991). How mental systems believe. American Psychologist. 46, 107-119.
Gilbert, D. T. (1993). The assent of man; Mental representation and the control of belief. In D. M. Wegner & J. w. Pennebaker, (Eds.), The handbook of mental control (pp. 57-87). Englewood Cliffs, NJ: Prentice-Hall.
Glass, D. C. (1977). Behavior patterns, stress, and coronary disease. Hillsdale, NJ: Erlbaum.
Goldberg, L. R. (19 82). From ace to zombie: Some explorations in the language of personality. In C. D. Speilberger & J. N. Butcher (Eds.), Advances in personality assessment (Vol. 1, pp. 203-234). Hillsdale, NJ; Erlbaum.
Gottfredson, G. D., Holland, J. L., & Ogawa, D. K. (1982). Dictionary of Holland occupational codes. Palo Alto, CA; Consulting Psychologist Press.
Gough, H. G. (1969). College attendance among high-aptitude students as predicted from the California Psychological Inventory. Journal of Counseling Psychology. 15, 2 69-278.
Graham, J. R., & Lilly, R. S. (1984). Psychological Testing. Englewood Cliffs, NJ: Prentice-Hall.
Gregorich, S., Helmreich, R. L., Wilhelm, J. A., & Chlldester, T. R. (1989). Personality based clusters as predictors of aviator attitudes and performance. In Proceedings of the Fifth International Symposium on Aviation Psychology. Columbus, OH, Ohio State University, April, 1989.
Greuter, M., & Herman, P. (1992). Validity and utility of assessment methods in civil aviation. In K. M. Goeters & N. Adams (Eds.), Proceedings of XX Conference of the Western European Association of Aviation Psychology WEAAP (pp. 59-61). Hamburg, Germany: DLR, Department of Aviation and Space Psychology.
163 Griffin, G., & Morrison, T., Amerson, T., & Hamilton, P.
(1987). Predicting air combat maneuvering (ACM) performance: fleet fighter ACM readiness program grades as performance criteria. (Tech. Report NAMRL-1333). Pensacola, FL; Naval Aerospace Medical Research Laboratory.
Griffin, G., & Shull, R. (1990). Predicting F/A-18 fleet replacement squadron performance using an automated battery of performance-based tests. (Tech. Report NAMRL-1354). Pensacola, FL; Naval Aerospace Medical Research Laboratory.
Guion, R. M., & Gottier, R. F. (1965). Validity of personality measures in personnel selection. Personnel Psychology. 18, 135-164.
HAF-DPP-A (1992). USAF Flying Program Flying Training. Vol I. HQ ATC/DOPR, Randolph AFB, TX: ATC 92-2, August 1991.
Harris, M. M., & Schraubroeck, J. (1988). A meta-analysis of self-supervisor, self-peer, and peer supervisor ratings. Personnel Psychology, 41, 43-62.
Hazucha, J. F. (1991). Success, ieapordv. and performance; Contrasting managerial outcomes and their predictors. Unpublished doctoral dissertation. University of Minnesota, Minneapolis.
Helmreich, R. L. (1982). Pilot selection and training. Paper Presentation at the American Psychological Association. Washington, DC.
Helmreich, R. L. (1986). Cockpit resource management; Exploring the attitude-performance linkage. Proceedings of the Fourth International Syposixm on Aviation Psychology. Ohio State University, Columbus.
Helmreich, R. L. (1987). Theory underlying CRM training: Psychological issues in flightcrew performance and crew coordination. In H.W. Orlady & H. C. Foushee (Eds.), Cockpit resource management training; Proceeding of the NASA/MAC Workshop. NASA-Ames Research Center: CP-2455.
Helmreich, R. L., Spence, J. T. (1978). The work and family orientation questionnaire: An objective instriunent to assess components of achievement motivation and attitudes toward family and career. JSAS Catalog of Selected Documents in Psychology, 8.
164 Helmreich, R. L., Spence, J. T., Beane, W. E., Lucker, G.
W., & Matthews, K. A. (1980). Making it in academic psychology; Demographic and personality correlates of attainment. Journal of Personalitv and Social Psychology. 39, 963-967.
Helmreich, R. L., Wilhelm, J. A. (1989). When training boomerangs: Negative outcomes associated with the Cockpit Resource Management Training. In Proceedings of the Fifth International Symposium on Aviation Psychology. Columbus, OH, Ohio State University, April, 1989.
Henmon, V. A. C. (1919) . Air services test of aptitude for flying. Journal of Applied Psychology 3, 2.
Hoffelt, W., & Gress, W. (1993). The GAF selection system for flying personnel. In R. Jensen and D. Neumeister (Eds.), Proceedings of the Seventh International Symposium on Aviation Psychology (pp. 39 8-403). Columbus, OH: Ohio State University.
Hogan, J. (1978). Personological dynamics of leadership-Journal of Research in Personality. 12, 390-395.
Hogan, R. (1986). Hogan Personality Inventory manual. Minneapolis, MN: National Computer Systems.
Hogan, R. (19 87) . Personality psychology: Back to basics. In J. Arnoff, A. I. Rabin, & R. A. Zucker (Eds.), The emergence of personality (pp. 141-188). New York; Springer.
Hogan, J., & Hogan, R. (1986). Manual for the Hogan Personnel Selection System. Minneapolis, MN: National Computer Systems.
Hogan, R., DeSoto, C. B., Solano, C. (1975). Traits, tests, and personality research. American Psychologist. 6, 255-264.
Hoge, R. D., & Luce, S. (1979). Predicting achievement from classroom behavior. Review of Educational Research. 49: 479-496.
Holland, J. L. (1985). The SDS professional manual--1985 revision. Odessa, FL; Psychological Assessment Resources.
165 Hopson, J. A. (1978). Development and evaluation of a naval
flight officer scoring key for the Naval Aviation Biographical Inventory (NAMRL Report No. 1256). Pensacola, FL; Naval Aerospace Medical Research Laboratory.
Hough, L. M. (19 88, April). Personality assessment for selection and placement decisions. Workshop presented at 3rd Annual Conference of the Society of Industrial and Organizational Psychology. Dallas.
Hough, L. M. (19 89). Development of personality measures to supplement selection decisions. In B. J. Fallon, H. P. Pfister, & J. Brebner (Eds.), Advances in industrial organizational psychology (pp. 365-375). New York: Elsevier.
Hough, L. M. (1992). The Big Five personality variables--construct confusion; Description versus prediction. Human Performance. 5, 139-155,
Hough, L. M., Eaton, N. K., Dunnette, M. D., Kamp, J. D., & McCloy, R. A. (1990). Criterion-related validates of personality constructs and the effect of response distortion on those validates. Journal of Applied Psychology, 75, 581-595.
Hudak, M. A. & Anderson, D. E. (1984). Teaching style and student ratings. Teaching of Psychology. 11, 177-178.
Isaacson, R., McKeachie, W., & Milholland, J. (1971). Correlation of teacher personality variables and student ratings. Journal of Educational Psychology. 54, 110-117.
Jackson, D. N. (1974). Personality Research Form. Port Huron, MI: Research Psychologist Press.
Joaquin, J. B. (1980). The Personality Research Form and its utility in prediciting undergraduate pilot training performance (Canadian Forces Report No. 80-12). Willowdale, Ontario: Canadian Forces Personnel Applied Research Unit.
John, O. P. (19 89). The Big Five factor taxonomy: Dimensions of personality in the natural language and in the questionnares. In L. A. Pervin (Eds.), Handbook of personality; Theory and Research. New York: Guilford.
166 John, O. P., Goldberg, L. R., & Angleitner, A. (1984).
Better than the alphabet; Taxonomies of personality descriptive terms in English, Dutch, and German. In H. C. J. Bonarius, G. L. M. van Heck, & N. G. Smid (Eds.), Personality psychology in Europe; Theoretical and empirical developments (Vol. 1. pp. 83-100). Lisse; Swets & Zeitlinger.
Jung, C. G. (1923). Psychological types. New York; Harcourt Brace Jovanovich.
Kane, J. S., & Lawler, E. E., III. (1979).Performance appraisal effectiveness and determinant. In B. M. Staw (ed.). Research in organizational behavior (vol. 1). Greenwich, CT: JAI Press.
Kant, I. (1974). Anthropology from a pragmatic point of view (M. J. Gregor, trans.). The Hague; Nijhoff. (Original work published 179 8).
Kantor, J. E., & Carretta, T. R. (1988). Aircrew selection systems. Aviation. Space, and Environmental Medicine. 59, II Supplement, A32-A38.
Kirchner, W. (1965). Relationships between supervisory and subordinate ratings for technical personnel. Journal of Industrial Psychology. 3, 57-60.
Kozlowski, S. W. (1978). The Validity of Personality Inventories for the Selection of Personnel: A Review of the Literature and Recommendations for Research, special report (State of Pennsylvania: State Civil Service Commission.
Lazovik, G. F. (1987). Documentary Evidence in the Evaluation of Teaching. In J. Millman (Ed.), Handbook of teacher evaluation. Beverly Hills,CA: Sage.
Levenson, R. W., Carstensen, L. L., & Gottman, J. M. (1994). The influence of age and gender on affect, physiology, and their interrelations. Journal of Personalitv and Social Psychology. 67, 56-68.
Livneh, H. (1989). The five-factor model of personality: Is evidence for its cross-media premature? Personality and Individual Differences. 10, 75-80.
Locke, E. A., Hulin, C. L. (1962). A review and evaluation of the validity studies of activity vector analysis. Personnel Psychology. 15, 25-42.
167 Mabe, P. A. Ill, & West, S. G. (1982). Validity of self-
evaluation of ability; A review and meta-analysis. Journal of Applied Psychology. 67, 280-296.
Marsh, H. W. (1987). Students' evaluations of university teaching: Research findings, methodological issues, and directions for future research. International Journal of Educational Research. 11, No. 3, 255-379.
Matthews, K. A. (1982). Psychological perspectives on Type A behavior pattern. Psychological Bulletin. 91, 293-323.
McCrae, R. R., & Costa, P. T., Jr. (1985). Updating Norman's adequate taxonomy: Intelligence and personality dimensions in natural language and questionaires. Journal of Personality and Social Psychology. 49, 710-721.
McEvoy, G- M., & Buller, P. F. (1987). User acceptance of peer appraisals in an industrial setting. Personnel Psychology. 40, 785-797.
McFarland, R. (1953). Hinnan factors in air transportation. New York: McGraw-Hill.
McGowen, J., & Gormly, J. (1976). Validation of personality traits: A multicriteria approach. Journal of Personality and Social Psychology, 34, 791-795.
McHenry, J. J., Hough, L. M., Toquam, J. L., Hanson, M. A. Ashworth, S. (1990). Project A validity results: the relationship between predictor and criterion domains. Personality Psychology. 43, 335-354.
McNeil, J. D., & Popham, W. J. (1973). The assessment of teacher competence. Second Handbook of Research on Teaching. Skokie, IL; Rand McNally.
Medley, D. M. (1973) . Closing the gap between research in teacher effectiveness and the teacher education curriculiun. Journal of Research and Development in Education, 7: 39-46.
Millman, J. (1987). Handbook of Teacher Evaluation. Beverly Hills, CA: Sage.
Mischel, W. (1968). Personality and assessment. New York: Wiley.
Mitzel, H. E. (1960). Teacher effectiveness. In C. W. Harris (Ed.), Encyclopedia of Educational Research. New York; Macmillan.
168 Muchinsky, P., (1990). Psychology applied to work (3rd ed.).
Pacific Grove, CA; Brooks/Cole Publishing.
Myers, I. B.., & McCaulley, M. H. (1985). Manual; A Guide to the development and use of the Mvers-Briggs Type Indicator. Palo Alto, CA: Consulting Psychologists Press.
Norman, W. T. (19 63) . Toward an adequate taxonomy of personality attributes: Replicated factor structure in peer nomination personality ratings. Journal of Abnormal and Social Psychology. 66, 574-583.
North, R. A., & Griffin, G. R. (1977). Aviator Selection 1919-1977. Special Report 77-2; Naval Aerospace Medical Research Laboratory. Pensacola NAS, FL.
Parker, J., Taylor, E., Barrett, R., & Martens, L. (1959). Rating scale content:3. Relationship between supervisory and self-ratings. Personnel Psychology. 12, 49-63.
Peabody, D., & Goldberg, L. R. (1989). Some determinants of factor structure from personality trait descriptors. Journal of Personalitv and Social Psychology. 57, 552-567.
Pederson, L. A., Allan, K. E., Laue, F. J., & Johnson, J. R. (1992) . Personality theory for aircrew selection and classification. Armstrong Laboratory Technical Report. AL-TR-1992-0021. Air Force Systems Command, Brooks AFB, TX, May.
Perry, R. P. (1979). Educational seduction: The effect of instructor expressiveness and lecture content on student ratings and achievement. Journal of Educational Psychology. 71: 107-116.
Porter, D. B. (1991). A perspective on College Learning. Journal of College Reading and Learning. 24, 1-15.
Roback, A. A. (1927). A bibliography of character and personality. Cambridge, MA; Sci-Art Publishers.
Robinson, J. E., & Gray, J. L. (1974). Cognitive styles as a variable in school learning. Journal of Educational Psychology. 66, 793-799.
Rose, R. M., Helmreich, R. L., Fogg, L., & McFadden, B. A. (1993). Assessments of astronauts effectiveness. Aviation, Space. & Environmental Medicine. 64, 789-794.
169 Rosenshine, B. (1970). Enthusiatic teaching: A research
review. School Review. 78, 499-514.
Rosenshine, B., & Furst, N. (1973). The use of direct observation to study teaching. In R. M. Travers (Ed.), Second handbook of research on teaching. Chicago: Rand McNally.
Rossander, P. (1980). Personality inventories and prediction of success in pilot training; State of the art. Willowdale, Ontario; Canadian Forces Applied Research Unit.
Rothaus, P., Morton, R., & Hanson, P. (1965). Performance appraisal and psychological distance. Journal of Applied Psychology. 49, 48-54.
Runyan, W. M. (19 83). Idiographic goals and methods in the study of lives. Journal of Personality, 51, 413-437.
Schmitt, N., Gooding, R. Z., Noe, R. A., & Kirsch, M. (1984) . Meta-analyses of validity studies pxiblished between 1964 and 19 82 and the investigation of study characteristics. Personnel Psychology. 37, 407-421.
Schwarz, J. C , Barton-Henry, M. L., & Pruzinsky, T. (1985). Assessing child-rearing behaviors; A comparison of ratings made by mother, father, child, and sibling on the CRPBI. Child Development. 56, 462-479.
Siem, F. M. (1987). The effects of aircrew members personality in interaction and performance. Unpublished dissertation, Austin, TX: University of Texas.
Siem, F. M. (1988). Characteristics associated with success in USAF pilot training. Brooks AFB, TX: Air Force Systems Command.
Siem, F. M., & Murray, B. S. (1994). Personality factors affecting pilot combat performance: A preliminary investigation. Aviation. Space, and Environmental Medicine. 65: A45-48.
Skinner, B. F. (19 84). The shame of American education. American Psychologist, 39, 947-977.
Spence, J. T. & Helmreich, R. L. (19 83). Achievement-related motives and behavior. In J. T. Spence, (Ed.), Achievement and Achievement Motives: Psychological and Sociological Approaches. San Francisco, CA; W. H. Freeman & Co.
170 Spranger, E. (192 8) . Types of men. Halle, Germany: Max
Niemeyer Verlag.
Springer, D. (1953). Ratings of candidates for promotion by co-workers and supervisors. Journal of Applied Psychology, 37, 347-351.
Steel, R., & Ovalle, N., 2nd. (1984). Self-appraisal based upon supervisory feedback. Personnel Psychology. 37, 667-685.
Tett, R. P., Jackson, D. N., & Rothstein, M. (1991). Personality measures as predictors of job performance; A meta-analytic review. Personnel Psychology. 44, 703-742.
Thorndike, R. (1949). Personnel selection. New York: Wiley.
Thorndike, E. L. (1906). Principles of teaching. New York; Seller.
Travers, R. W. (1987). Criteria of good teaching. In J. Millman (Ed.), Handbook of Teacher Evaluation. Beverly Hills, CA: Sage.
Waller, N. G., Beh-Porath, Y. S. (1987). Is it time for clinical psychology to embrace the five-factor model of personality? American Psychologist. 42, 887-889.
Ware, J. E., & Williams, R. G. (1977). Discriminant analysis of student ratings as a means of identifying lecturers who differ in enthusiasm or information giving. Educational and Psychological Measurements. 37: 627-639.
Weiss, H. M., & Adler, S. (1984). Personality and organizational behavior. Research in organizational behavior (Vol. 6). Greenwich, CT: JAI.
Wittgenstein, L. (1953). Philosophical investigations. New York: Macmillan.
Woodruffe, C. (19 84). The consistency of presented personality: Additional evidence from aggregation. Journal of Personalitv; 52, 307-317.
Wundt, W. (1874). Principles of physiological psychology. Leipzig: Engelmann.
171 Zedeck, S., Imparato, N., Krausz, M., & Oleno, T. (1974).
Development of behaviorally anchored rating scales as a function of organizational level. Journal of Applied Psychology, 59, 249-252.
APPENDIX A
TESTING INSTRUMENTS
This appendix contains the following materials: (a) the
Demographics Survey, (b) the Personality Characteristics
Instrument (PCI), (c) the NASA/UT Astronaut Assessment
Survey.
172
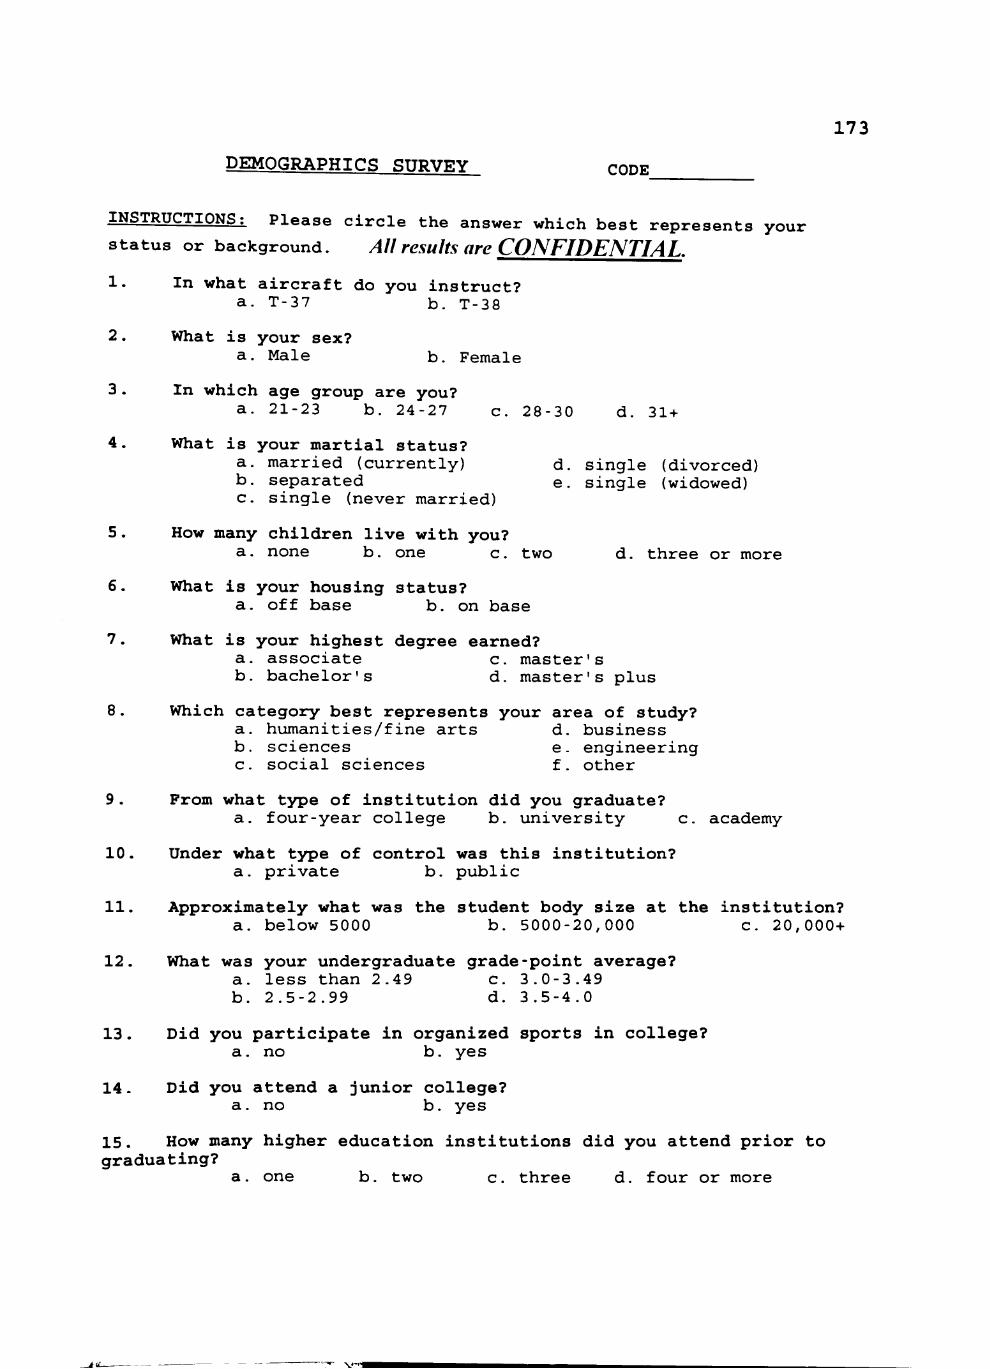
1 7 3
DEMOGRAPHICS SURVEY cODE
INSTRUCTIONS: P l e a s e c i r c l e the answer which b e s t r e p r e s e n t s your
status or background. All results are CONFIDENTIAL.
1. In what a ircraft do you instruct? a . T - 3 7 b . T - 3 8
2. What is your sex? a. Male b. Female
3. In which age group are you? a. 21-23 b. 24-27 c. 28-30 d. 31+
4. What is your martial status? a. married (currently) d. single (divorced) b. separated e. single (widowed) c. single (never married)
5. How many children live with you? a. none b. one c, two d. three or more
6. What is your housing status? a. off base b. on base
7. What is your highest degree earned? a. associate c. master's b. bachelor's d. master's plus
8. Which category best represents your area of study? a. humanities/fine arts d. business b. sciences e. engineering c. social sciences f. other
9. From what type of institution did you graduate? a. four-year college b. university c. academy
10. Under what type of control was this institution? a. private b. public
11. Approximately what was the student body size at the institution? a. below 5000 b. 5000-20,000 c. 20,000+
12. What was your undergraduate grade-point average? a. less than 2.49 c. 3.0-3.49 b. 2.5-2.99 d. 3.5-4.0
13. Did you participate in organized sports in college? a. no b. yes
14. Did you attend a junior college? a. no b. yes
15. How many higher education institutions did you attend prior to graduating?
a. one b. two c. three d. four or more
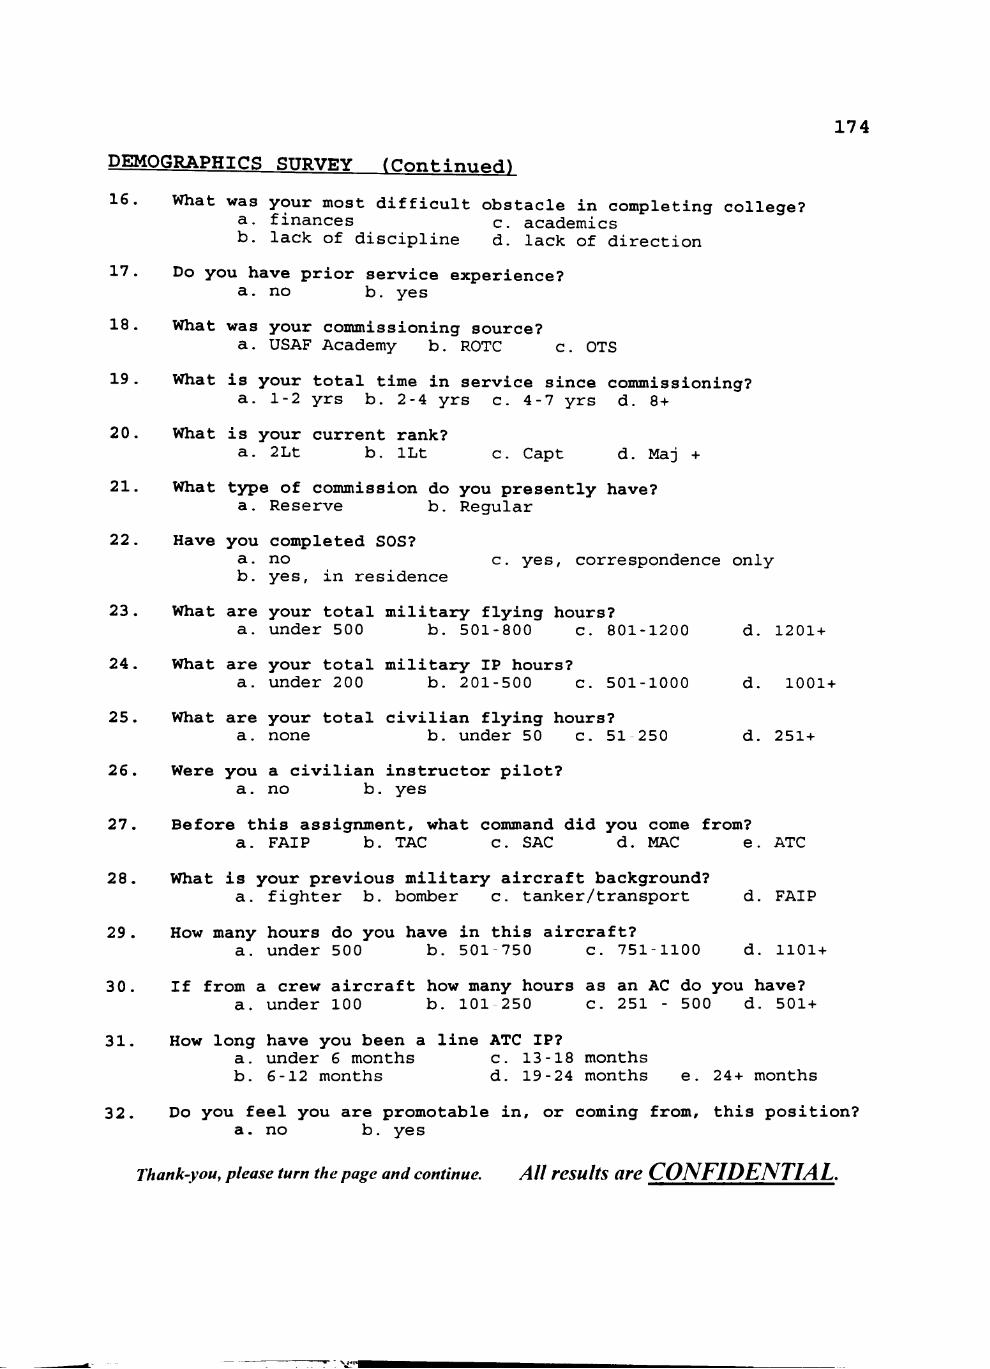
174
DEMOGRAPHICS SURVEY (Continued)
16. What was your most difficult obstacle in completing college? a. finances c. academics b. lack of discipline d. lack of direction
17. Do you have prior service experience? a. no b. yes
18. What was your commissioning source? a. USAF Academy b. ROTC c. OTS
19. What is your total time in service since commissioning? a. 1-2 yrs b. 2-4 yrs c. 4-7 yrs d. 8+
20. What is your current rank? a. 2Lt b. ILt c. Capt d. Maj +
21. What type of commission do you presently have? a. Reserve b. Regular
22. Have you completed SOS? a. no c. yes, correspondence only b. yes, in residence
23. What are your total military flying hours? a. under 500 b. 501-800 c. 801-1200 d. 1201+
24. What are your total military IP hours? a. under 200 b. 201-500 c. 501-1000 d. 1001+
25. what are your total civilian flying hours? a. none b. under 50 c. 51 250 d. 251+
26. Were you a civilian instructor pilot? a. no b. yes
27. Before this assignment, what command did you come from? a. FAIP b. TAC c. SAC d. MAC e. ATC
28. What is your previous military aircraft background? a. fighter b. bomber c. tanker/transport d. FAIP
29. How many hours do you have in this aircraft? a. under 500 b. 501 750 c. 7511100 d. 1101+
30. If from a crew aircraft how many hours as an AC do you have? a. under 100 b. 101 250 c. 251 - 500 d. 501+
31. How long have you been a line ATC IP? a. under 6 months c. 13-18 months b. 6-12 months d. 19-24 months e. 24+ months
32. Do you feel you are promotable in, or coming from, this position? a. no b. yes
Thank-you, please turn the page and continue. All results are CONFIDENTIAL.
> . ^ i ^
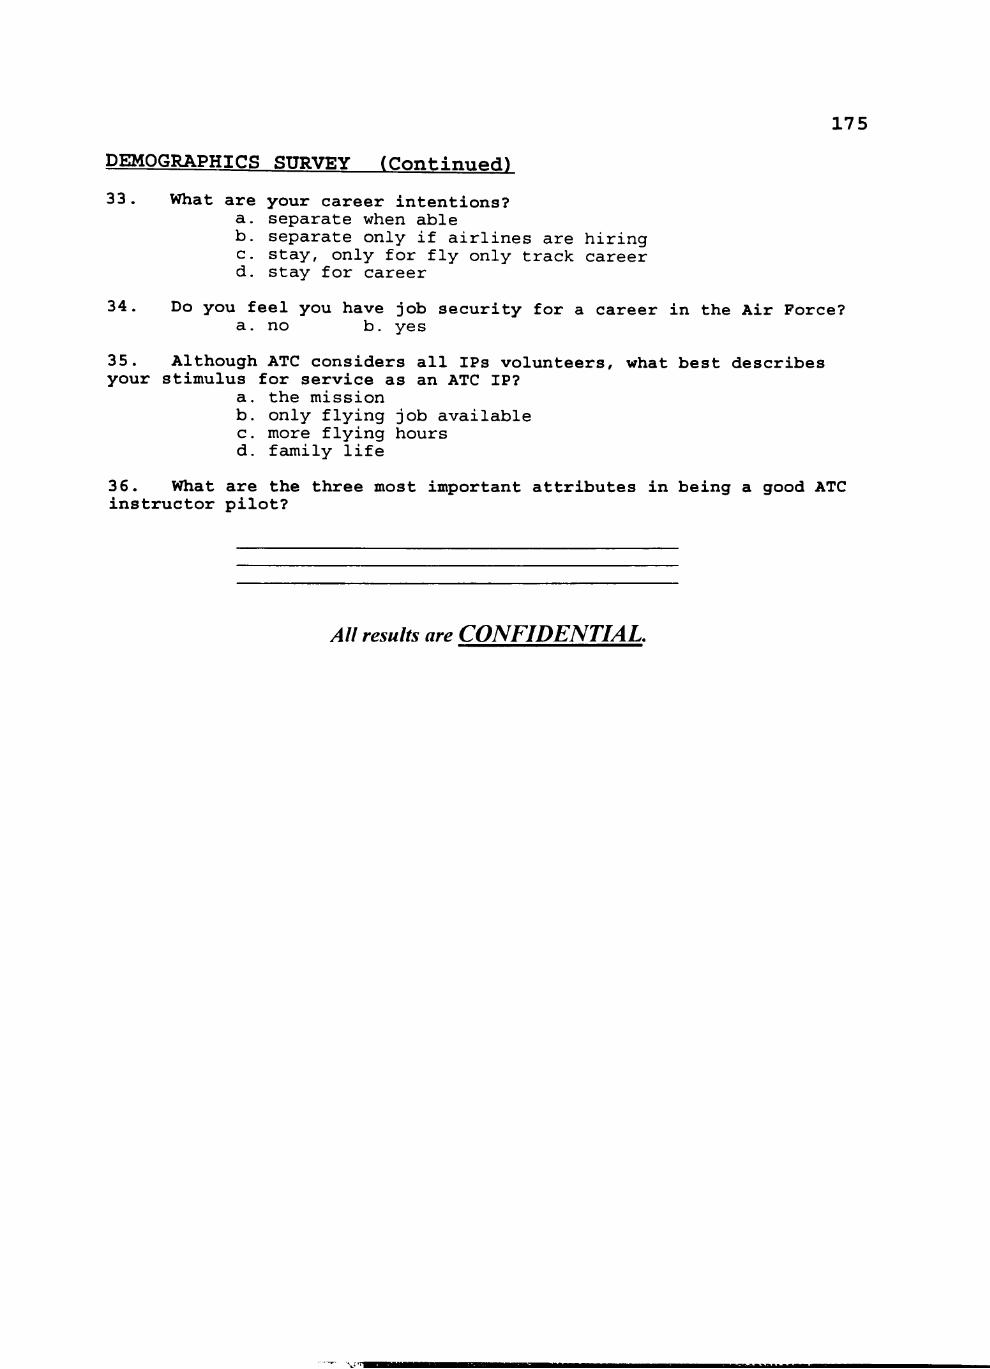
17 5
DEMOGRAPHICS SURVEY (Continued)
33. What are your career intentions? a. separate when able b. separate only if airlines are hiring c. stay, only for fly only track career d. stay for career
34. Do you feel you have job security for a career in the Air Force? a. no b. yes
35. Although ATC considers all IPs volunteers, what best describes your stimulus for service as an ATC IP?
a. the mission b. only flying job available c. more flying hours d. family life
36. What are the three most important attributes in being a good ATC instructor pilot?
All results are CONFIDENTIAL,
i^iaBft^^wi
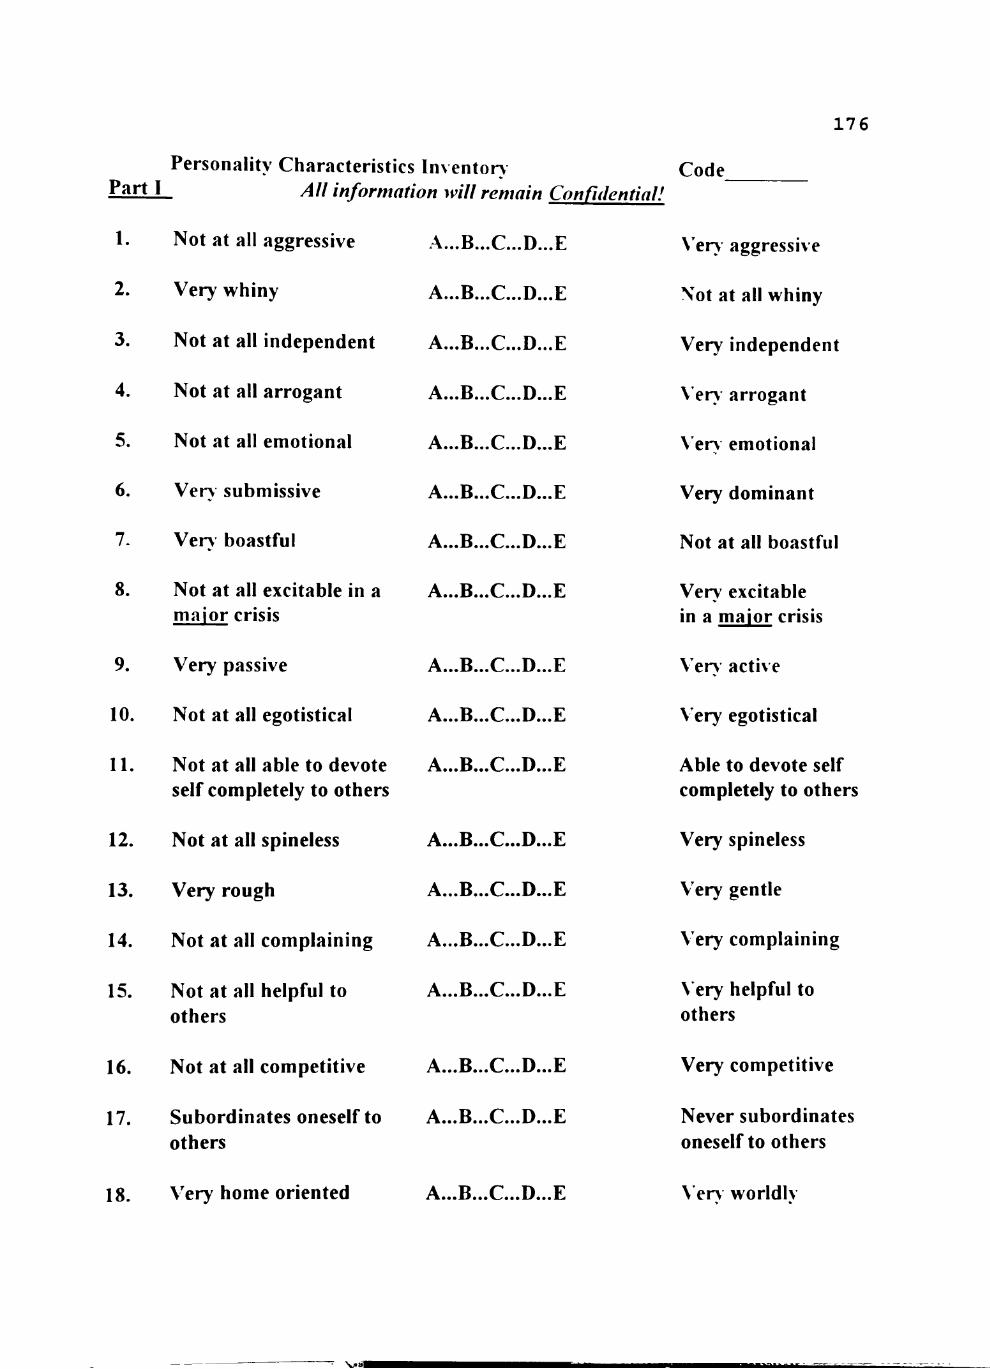
176
Personality Characteristics Inventor> Code ^^^ ^ All information will remain Confidential!
1. Not at all aggressive
2. Very whiny
3. Not at all independent
4. Not at all arrogant
5. Not at all emotional
6. Verv submissive
7. Ver\ boastful
•* » • • • -iJ • • • v_ • • • MJ • • • t (
•t\.fmMJ9 • • V.^aa« mJ % • • IL<
Xm» • • MJ» 9 • ^ ^ • • • MJ m • • SLd
^»*** AJ*«« \ _ ^ • • • MJ 9 99 £^
A~\« • • M^9 • • \ -• • • MJ 9 9 9 ILt
8. Not at all excitable in a A...B...C...D...E major crisis
9. Very passive
10. Not at all egotistical
x m • • • J J a » « ^ ^ « • • MJ 9 9 • Xl«
x \ • • • -D • • • ^ • • • . 1 . / • • • £ j
11. Not at all able to devote A...B...C...D...E self completely to others
12. Not at all spineless
13. Very rough
14. Not at all complaining
15. Not at all helpful to others
16. Not at all competitive
/ \ • • • .D • • • \ ^ • • • A^ • • • C>
/ m « « * A ) * * « V>'»*« MJ9»9 H J
A R r D F
/ \ • • • . D • • • V. • • • 1 ^ • • • •H'
17. Subordinates oneself to A...B...C...D...E others
18. Very home oriented x a . « « « J 3 » « « V.X*** mJ ••9 Mlri
\'er> aggressive
Not at all whiny
Very independent
Ver\ arrogant
Ver> emotional
Very dominant
Not at all boastful
Very excitable in a maior crisis
Ver> active
Very egotistical
Able to devote self completely to others
Very spineless
Very gentle
Very complaining
Very helpful to others
Very competitive
Never subordinates oneself to others
\ ' e n worldiv
v<ain
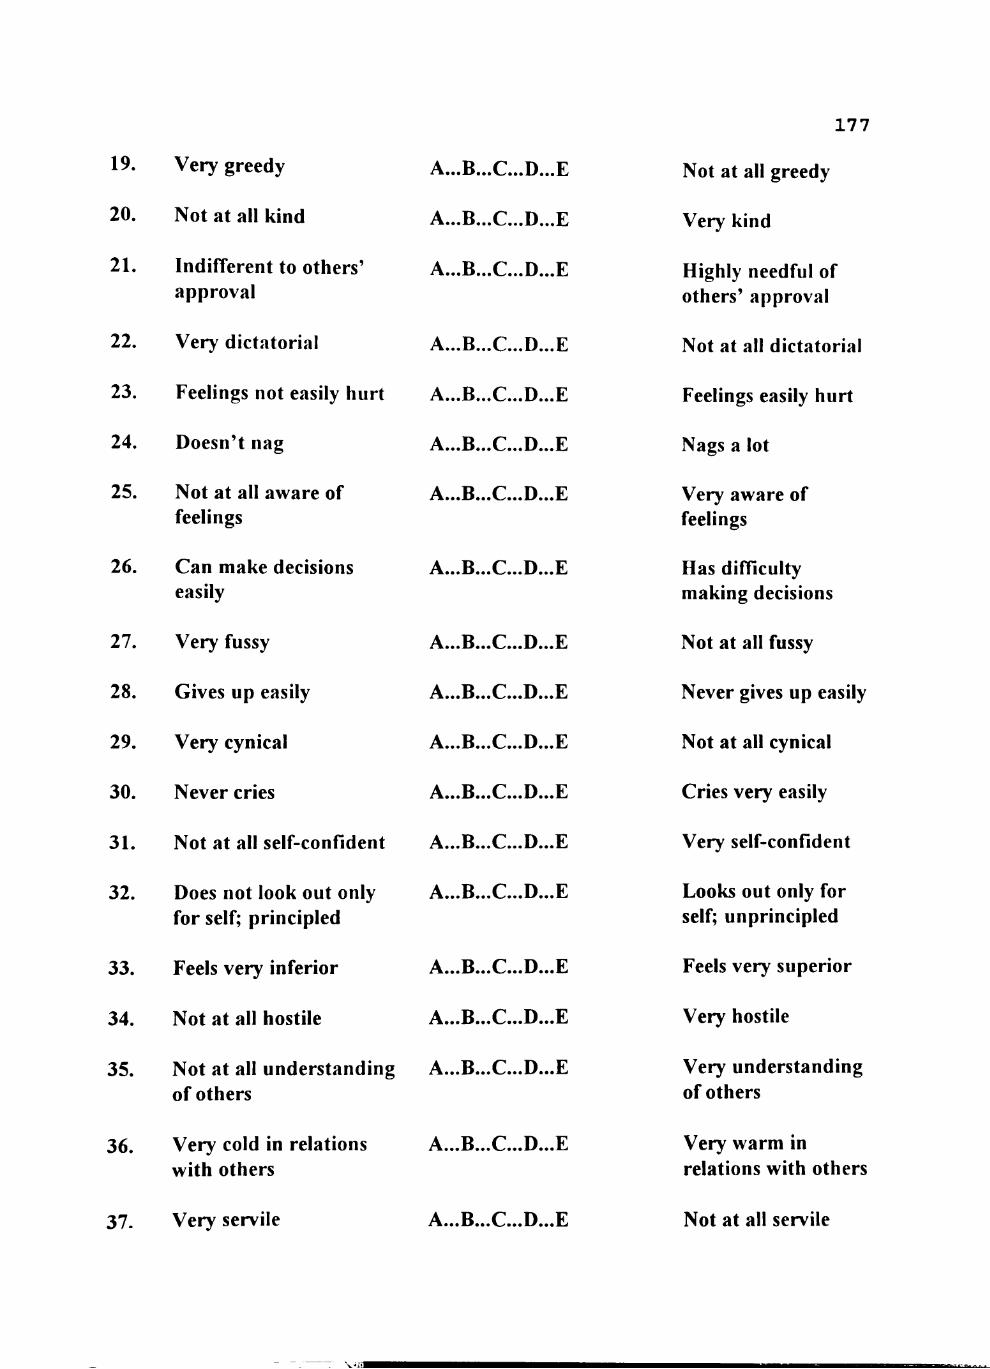
177
19.
20.
21.
22.
23.
24.
25.
26.
27.
28.
29.
30.
31.
32.
33.
34.
35.
36.
37.
Very greedy
Not at all kind
Indifferent to others' approval
Very dictatorial
Feelings not easily hurt
Doesn't nag
Not at all aware of feelings
Can make decisions easily
Very fussy
Gives up easily
Very cynical
Never cries
Not at all self-confident
Does not look out only for self; principled
Feels very inferior
Not at all hostile
Not at all understanding of others
Very cold in relations with others
Very servile
i\...15...1_^...Li...lL,
x \ . . . 15... \^. . . LI,,, Ht
'iV...xS...(^...LI,..ili
/ m . . . £ # . . . V ^ . . . l ^ . . * L.d
xm . . . X J . . . V . ^ . . . U »% . r.i
x \ . . . X# . . . \_,. . . U . . . HI
/ \ . . . D . . . v ^ . . . L f . . . Jli
. r \ . . . 1 3 . . . x ^ . . . L f . . . JL
/ \ . . . 0 . . . ^ . . . 1 ^ . . . l l i
x \ . . . l J . . . V ^ . . . J ^ . . . l L
/ \ . . . D . . . x^ . . . 1 ^ . . • HI
r \ . . . 1 J . . . \ ^ . . . L / . . . 1 L
/ \ . . . D . . . \ ^...L^...C>
/ \ . . . D . . . \ ^ . . . 1 ^ . . . H
/ ^ . . . . # . . . > . . . J./. . .-HI
/ \ . . . J j • . . x-<'. . . L/. . . .Hi
/ \ . . . D • . • ^^ . . . .L^. . . •HI
/ \ . . . D . . . V^ • . . X^ . . . HI
r \ . . • D • • • V^ . . . 1^ . . « HI
Not at all greedy
Very kind
Highly needful of others' approval
Not at all dictatorial
Feelings easily hurt
Nags a lot
Very aware of feelings
Has difficulty making decisions
Not at all fussy
Never gives up easily
Not at all cynical
Cries very easily
Very self-confident
Looks out only for self; unprincipled
Feels very superior
Very hostile
Very understanding of others
Very warm in relations with others
Not at all servile
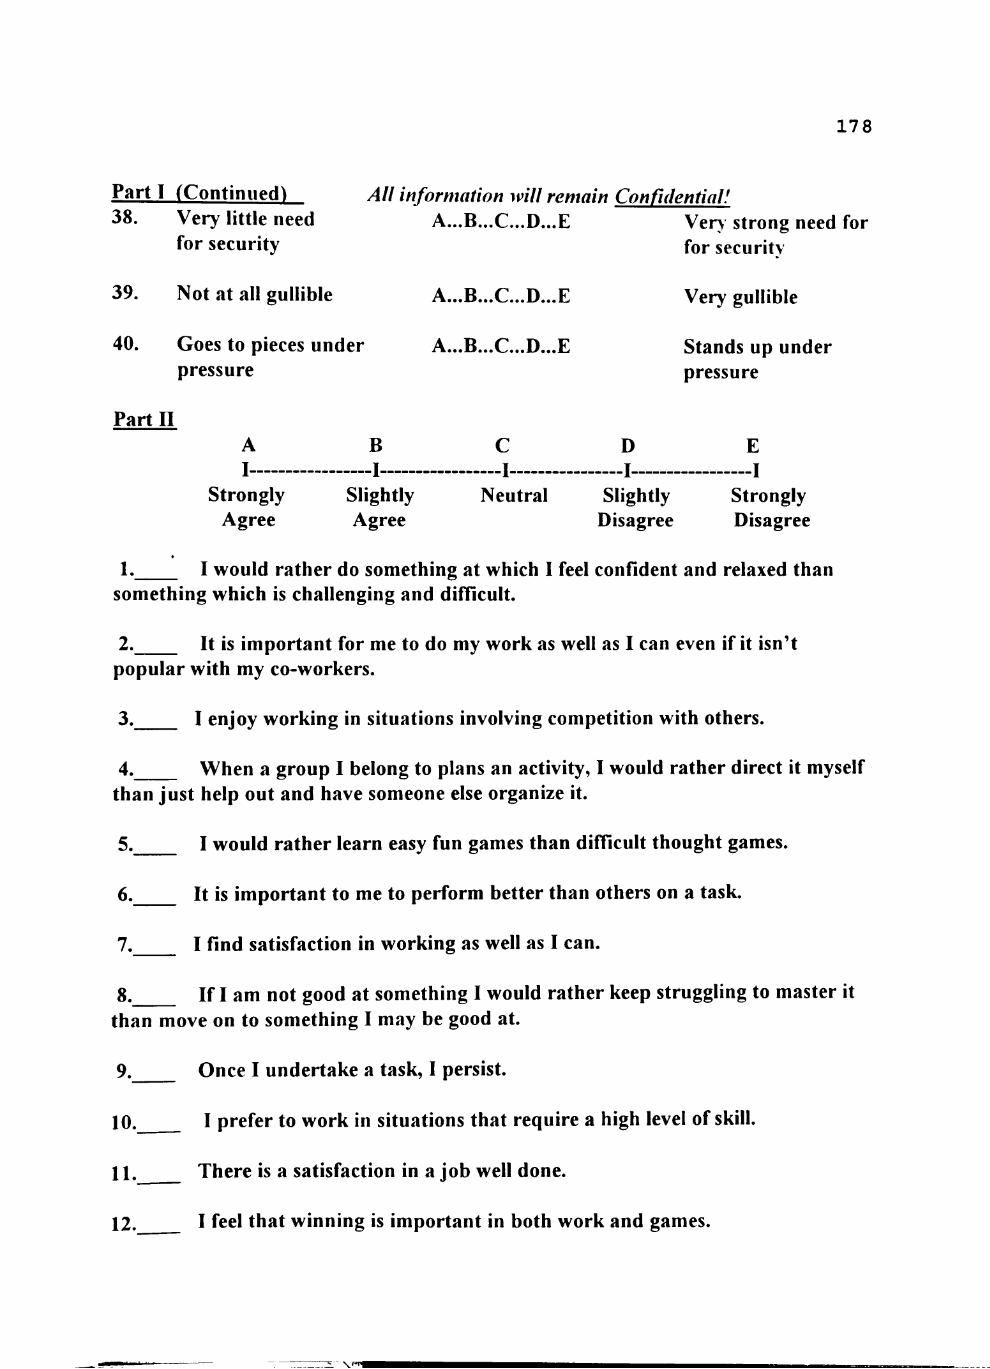
178
Parti (Continued) 38. Very little need
for security
All information will remain Confidential! A...B...C...D...E Ver> strong need for
for securitv
39. Not at all gullible
40. Goes to pieces under pressure
AM • • • JLM 9 9 9\.^ 9 9 9 MJ 9 9 9 MLd
X& • • • .D • • • V. • • • J - / • • • JL
Very gullible
Stands up under pressure
Partn A I
Strongly Agree
B 1
Slightly Agree
C —I Neutral
D 1
Slightly Disagree
E —I Strongly Disagree
1. I would rather do something at which I feel confident and relaxed than something which is challenging and difficult.
2. It is important for me to do my work as well as I can even if it isn't popular with my co-workers.
3. I enjoy working in situations involving competition with others.
4. When a group I belong to plans an activity, I would rather direct it myself than just help out and have someone else organize it.
5.
6.
I would rather learn easy fun games than difficult thought games.
It is important to me to perform better than others on a task.
7.
8.
I find satisfaction in working as well as I can.
If I am not good at something I would rather keep struggling to master it than move on to something I may be good at.
9.
10.
Once I undertake a task, I persist.
I prefer to work in situations that require a high level of skill.
11. There is a satisfaction in a job well done.
12. I feel that winning is important in both work and games.
V **T^
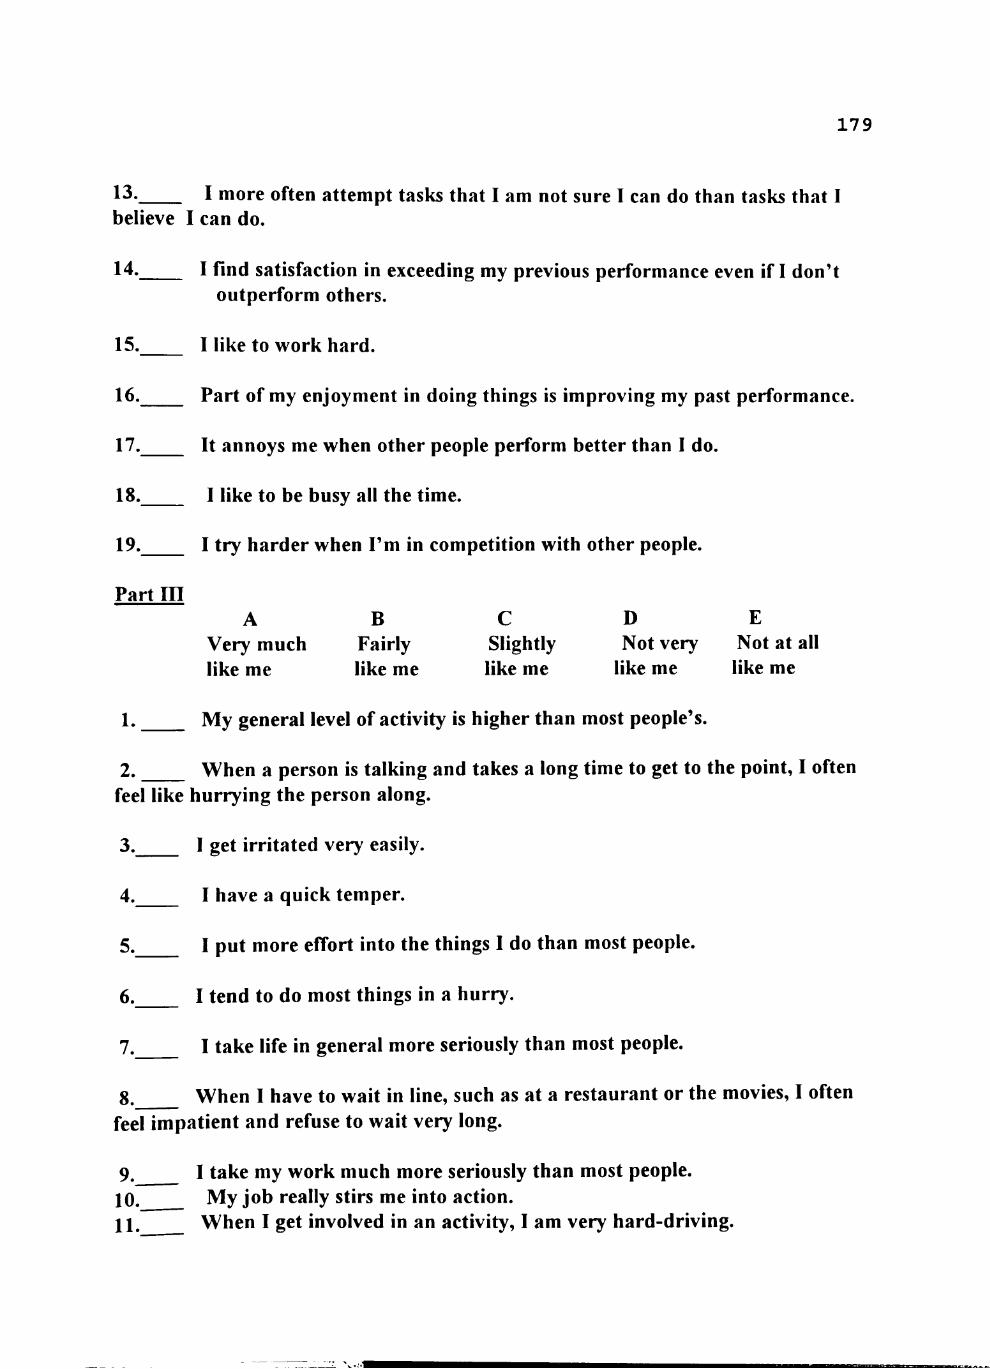
179
13. I more often attempt tasks that I am not sure I can do than tasks that I believe I can do.
14. I find satisfaction in exceeding my previous performance even if I don't outperform others.
15. I like to work hard.
16. Part of my enjoyment in doing things is improving my past performance.
17. It annoys me when other people perform better than I do.
18. I like to be busy all the time.
19. I try harder when I'm in competition with other people.
Part m A
Very much like me
B Fairly like me
C Slightly like me
D Not very
like me
E Not at all like me
1. My general level of activity is higher than most people's.
2. When a person is talking and takes a long time to get to the point, I often feel like hurrying the person along.
3. I get irritated very easily.
4. I have a quick temper.
5. I put more effort into the things I do than most people.
6. I tend to do most things in a hurry.
7.
8.
I take life in general more seriously than most people.
When I have to wait in line, such as at a restaurant or the movies, I often feel impatient and refuse to wait very long.
9. I take my work much more seriously than most people. 10. My job really stirs me into action. 11. When I get involved in an activity, I am very hard-driving.
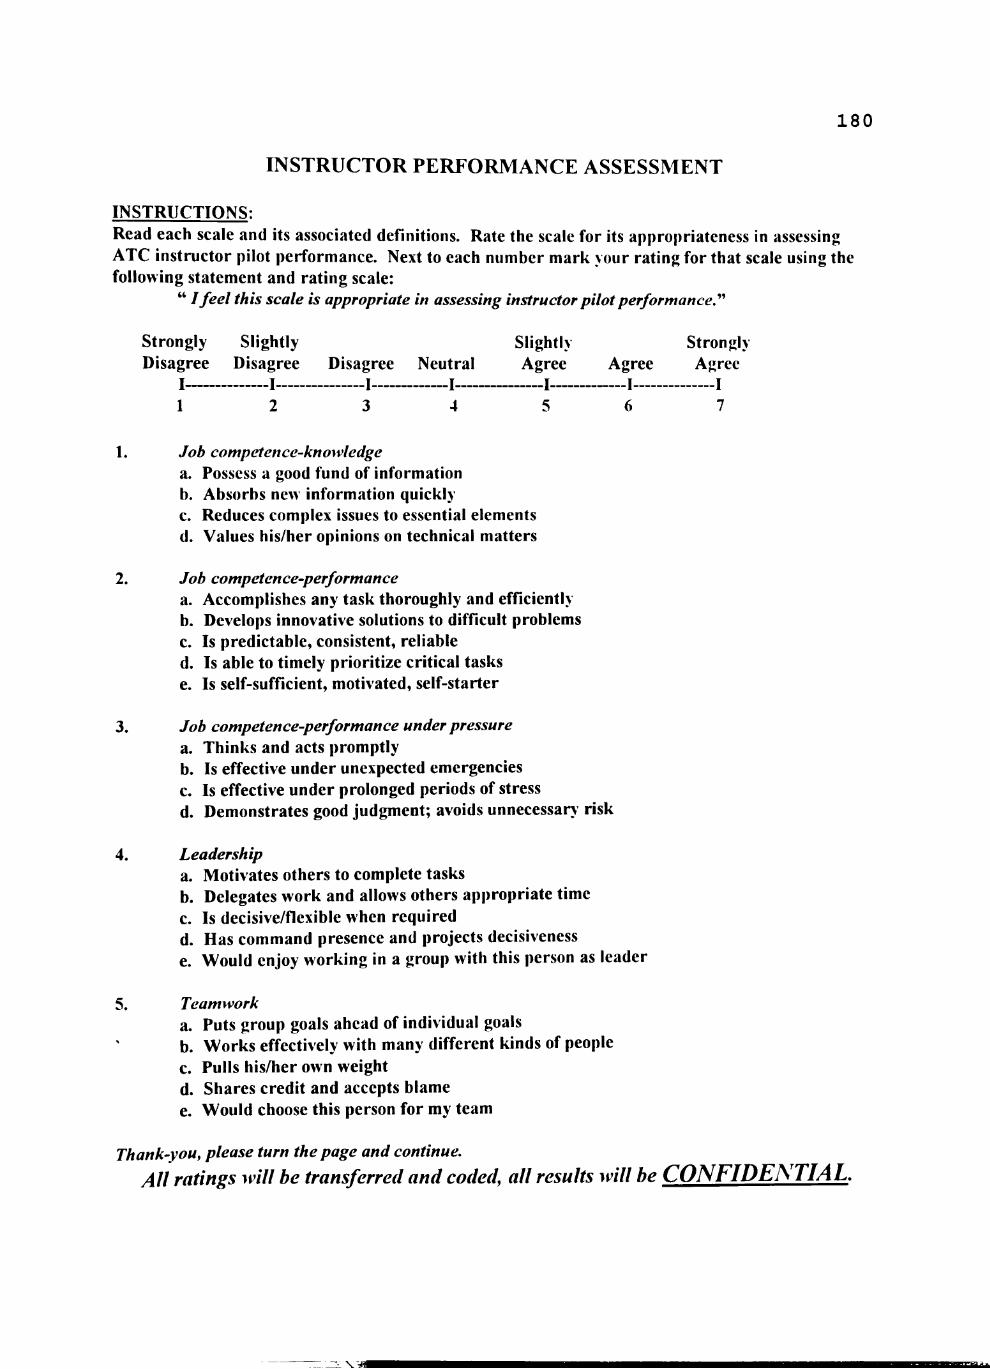
180
INSTRUCTOR PERFORMANCE ASSESSMENT
INSTRUCTIONS: Read each scale and its associated definitions. Rate the scale for its appropriateness in assessing ATC instructor pilot performance. Next to each number mark your rating for that scale using the following statement and rating scale:
" I feel this scale is appropriate in assessing instructor pilot performance.^"^
Strongly Slightly Slightly Strongly Disagree Disagree Disagree Neutral Agree Agree Agree
I 1 1 1 1 1 1
1 2 3 4 5 6 7
1. Job competence-knowledge a. Possess a good fund of information b. Absorbs new information quickly c. Reduces complex issues to essential elements d. Values his/her opinions on technical matters
2. Job competence-performance a. Accomplishes any task thoroughly and efficiently b. Develops innovative solutions to difficult problems c. Is predictable, consistent, reliable d. Is able to timely prioritize critical tasks e. Is self-sufficient, motivated, self-starter
3. Job competence-performance under pressure a. Thinks and acts promptly b. Is effective under unexpected emergencies c. Is effective under prolonged periods of stress d. Demonstrates good judgment; avoids unnecessary risk
4. Leadership a. Motivates others to complete tasks b. Delegates work and allows others appropriate time c. Is decisive/flexible when required d. Has command presence and projects decisiveness e. Would enjoy working in a group with this person as leader
5. Teamwork a. Puts group goals ahead of individual goals b. Works effectively with many different kinds of people c. Pulls his/her own weight d. Shares credit and accepts blame e. Would choose this person for my team
Thank-you, please turn the page and continue.
All ratings will be transferred and coded, all results will be CONFIDENTIAL.
\.WM
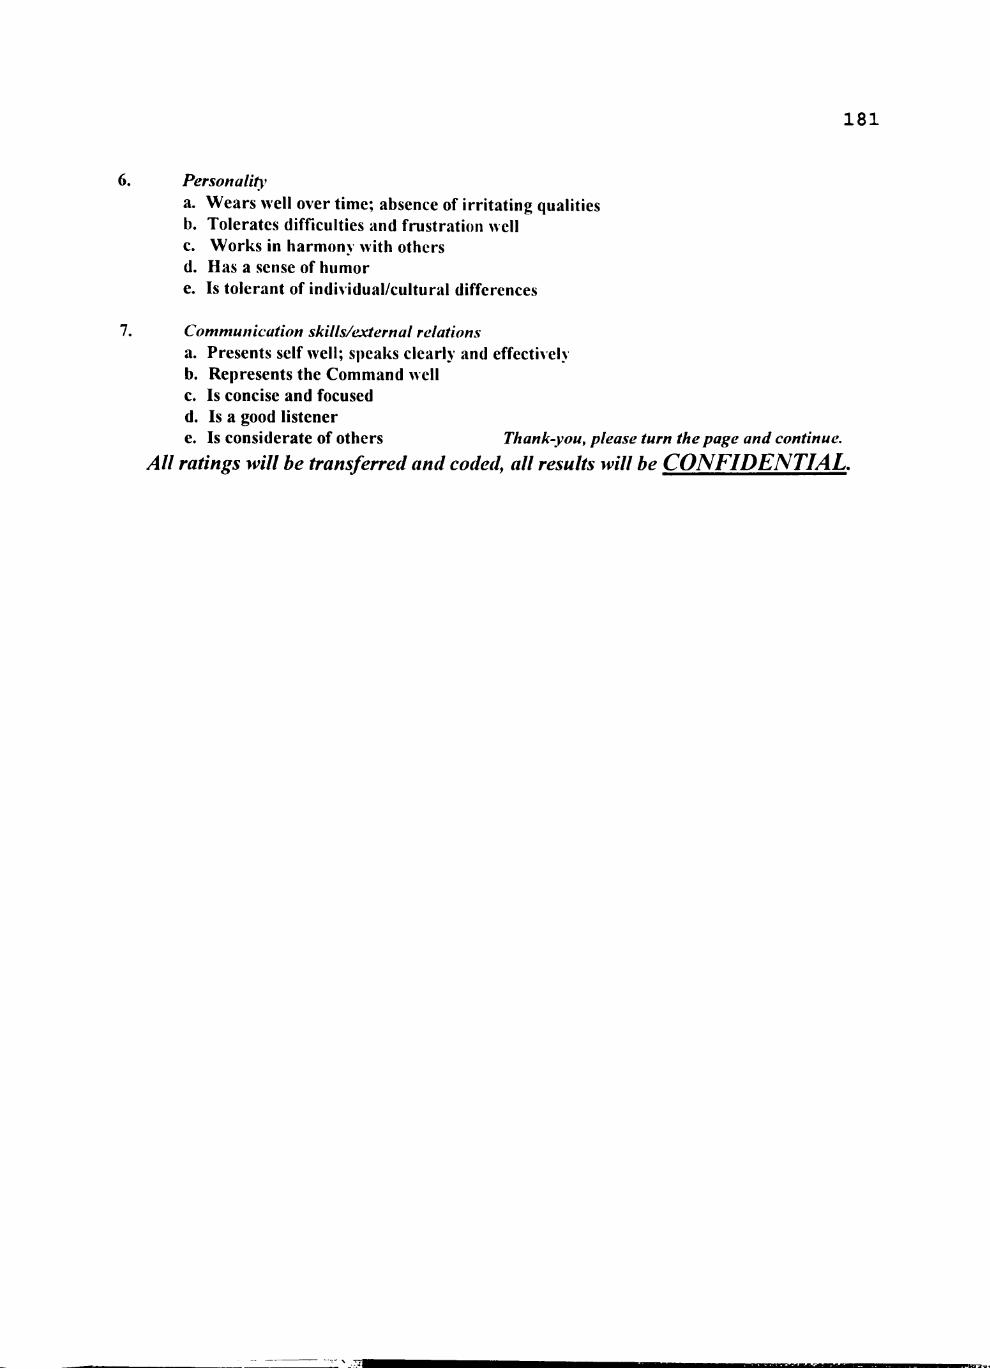
181
6. Personality a. Wears well over time; absence of irritating qualities b. Tolerates difficulties and frustration well c. Works in harmony with others d. Has a sense of humor e. Is tolerant of individual/cultural differences
7. Communication skills/external relations a. Presents self well; speaks clearly and effectively b. Represents the Command well c. Is concise and focused d. Is a good listener e. Is considerate of others Thank-you, please turn the page and continue.
All ratings will be transferred and coded, all results will be CONFIDENTIAL.
- - - . . - I . . ^ w — . n » _ , . , _
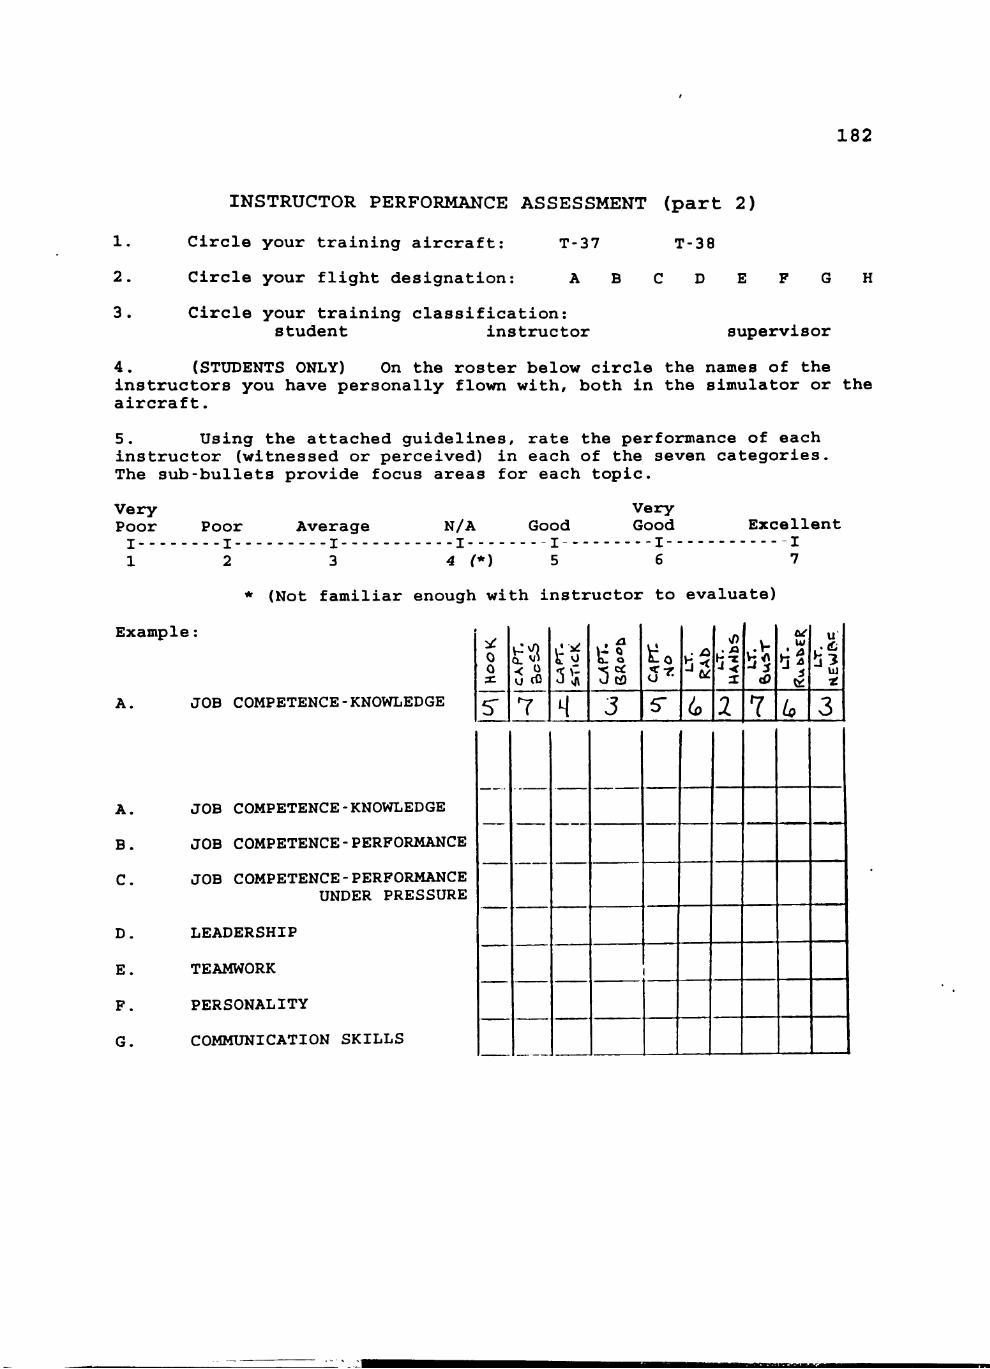
182
1 .
2 .
3 .
INSTRUCTOR PERFORMANCE ASSESSMENT ( p a r t 2)
C i r c l e your t r a i n i n g a i r c r a f t : T-37 T-38
C i r c l e your f l i g h t d e s i g n a t i o n : A B C D E F H
Circle your training classification: student instructor supervisor
4. (STUDENTS ONLY) On the roster below circle the names of the instructors you have personally flown with, both in the simulator or the aircraft.
5. Using the attached guidelines, rate the performance of each instructor (witnessed or perceived) in each of the seven categories. The sub-bullets provide focus areas for each topic.
Very Poor Poor Average N/A Good
Very Good Excellent
2 3 4 (*) S 6 7
* (Not familiar enough with instructor to evaluate)
Example
A,
B,
C,
D.
E,
F,
G.
JOB COMPETENCE-KNOWLEDGE
0 0 X
7 q J CO
3
^ 0
5"
b5
4 1 1
Ul
u
u
hi
3
JOB COMPETENCE-KNOWLEDGE
JOB COMPETENCE- PERFORMANCE
JOB COMPETENCE-PERFORMANCE UNDER PRESSURE
LEADERSHIP
TEAMWORK
PERSONALITY
COMMUNICATION SKILLS
APPENDIX B
LETTERS OF COORDINATION
This appendix contains the letters of coordination used
to obtain (a) U.S. Air Force approval for survey
Implementation, and (b) Wing Commander approval and
invitation to conduct the research at their training wing.
183
B M M H ^ t L ••:.• -^ , -•- -• • , , .;.«».r - . . ,m^vn,jmv>jij
184
CM HF MiQi (All I r r»s Am i f» i tc ' . m i i i /> I M ( • r m c > t i n r ' r - i rN»rn
II Af i f i ' »i r'l I A in f '111' r n/v '-.r i r x A« .
FFKIM: l iy ArM[M!/l)PnY/\S 550 (J St-reet: Wesl: S'VF. 36 Randolph AFB TX 78150-4738
SUHJ: Requesl . Uo CoiwiiJcM. SiirvRy wJl.li I n s t i r u c t o r P i l o t s ( I P ) and S t u d e n t s
TO: 6 4 MSSQ/MSP ATTN: Major Vlvori
1. We have rev.lev;ed the "Personal Ctiaracteristlca Inventory" submitted on behalf nf Cnpl: Gnrviii. We liave assigned a survey control number (SCtJ) of USAF SCN 92-91. This SCN expires on 31 December 93. Please Inform Cni)! Marvin that both SCN and expiration date should be placed In the upper right hand corner of the survey cover.
2. If you Ijpve any furtlier questions, please contact Mr Lou Da tkc*KDfln/4 87 - 56 do
:S H. HAMILTON Chief, Personnel Survey Branch
^**^Mi^ <«V
185
DEPARTMENT O n i l E AIR FORCE I I FAnOUAHI I ll'3 7 I 31 n n i H i mAI I I ING W I N G lATr.l
v A f j c r AIM r o n c E U A S E O K 7 3 7 0 5 - 5 0 0 0
RHPIV 10
AiiNor 7 1 OPG/CC
s»iBJ€ci ;^Tc IP P e r s o n a l i t y / P e r f o r m a n c e S u r v e y
2 4 FED 1993
to 8 FTS/CC 25 FTS/CC 7 1 OSS/CC
.1 . The I n f ormnt J on rv) iMnlned 111 t h e n t t n c h e d p a c k a g e i s a p r o p o s e d rlocTtornl I h e s I R l>y (.'apl n 111 . lohn (Jnrv ln from T e x a s T e c h l / n l v e r s i t y . Tlie tlier; I n I s c e t i L e r e d nroii iul r e s e a r c h i n p e r s o n a l i t y t r a J t t h e o r y n s J t re ln t i eH t o t h e p e r f o r m a n c e r a t i n g o f I P s .
2 . ( J n p t a i n ( J a i v l n inlorxlr . t o pnrfK>ii;i I I y n d m l n . l a t e r a s u r v e y t o a s many I n s t r u c t o r s aurl s t u d e n t s a s p o s s i b l e . l ie w i l l a s k i » i s t r u c t o r s , a s w e l l a s s t u d e n t s , t o s p e n d a few m i n u t e s o f t h e i r t i m e t o c o m p l e t e t h e s u r v e y on T u e s d a y , 2 March and W e d n e s d a y , 3 M a r c h . He p l a n s \:n s '? l )odule t l H s on a f l i g h t by f l i g h t b a s i s . R e q u e s t y o u r c o o p e r a t i o n t o h e l p Capt G a r v i n w i t h h i s s t u d y .
HE/ RY " Commander
y ) R. Y / ^ E Y d e r , 7 1 s t
o r t e l , USAF i o n s Group c c : 71 FTW/CC
AIK fORCt A ( iHtAI WAr OF IIFE
cr": .—— . J . . Jriii v i a
APPENDIX C
PCI CONSTRUCT COMPOSITION
This appendix contains the Personality Characteristics
Inventory construct question composition.
186
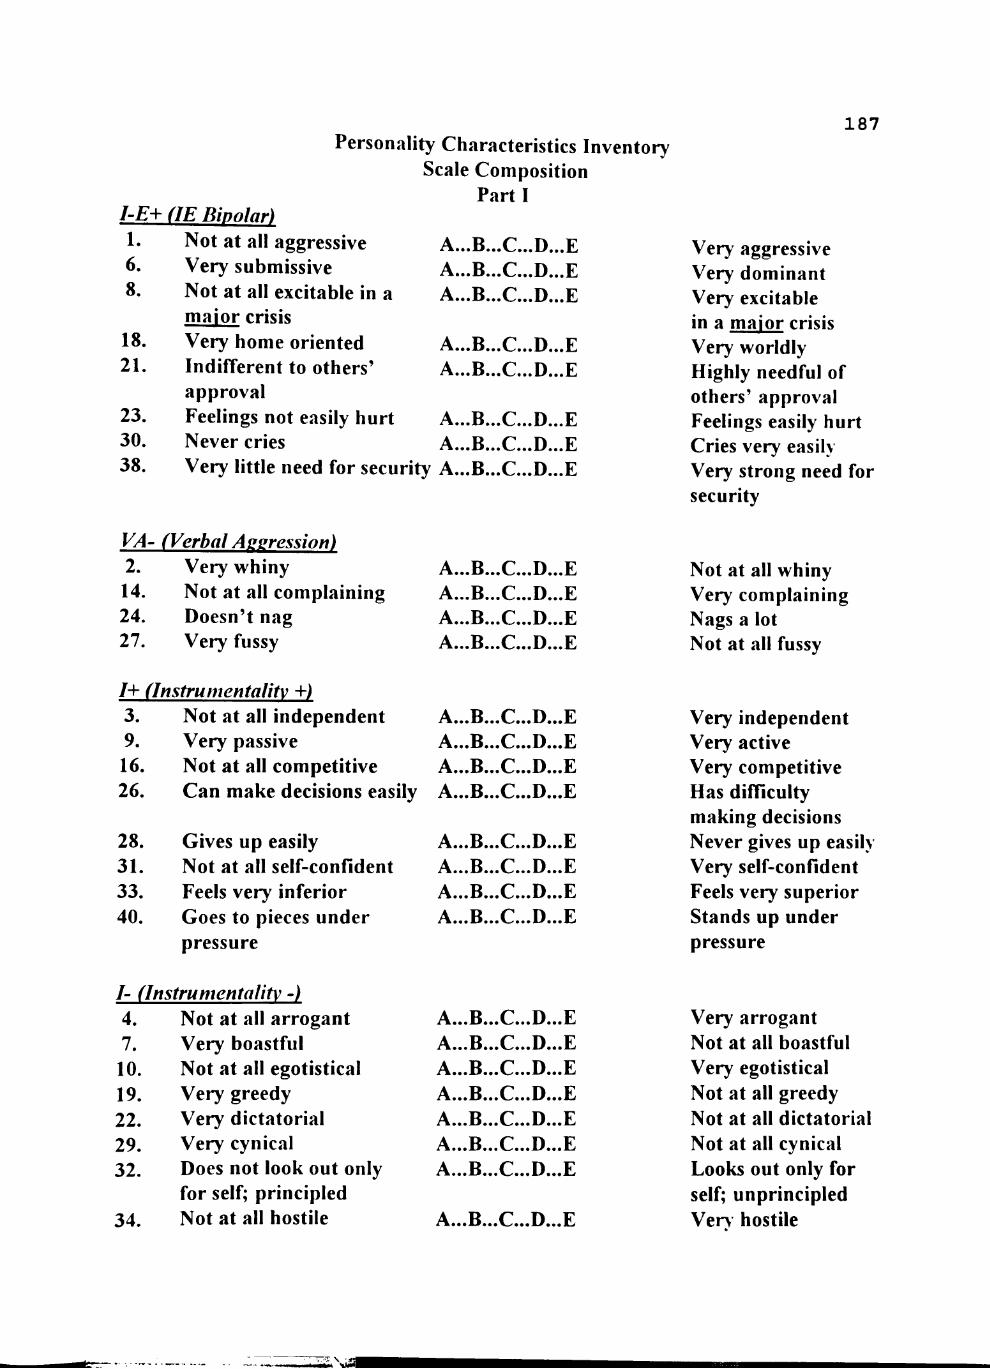
187 Personality Characteristics Inventory
/ -£+ (IE BiDolar) 1.
6. 8.
18. 21.
23. 30. 38.
VA-2. 14. 24. 27.
Not at all aggressive
Very submissive Not at all excitable in a maior crisis Very home oriented Indifferent to others' approval Feelings not easily hurt Never cries
Scale Composition P a r t i
A...D.,,\^,,.\j,.,tj
A...Mi...\^,,.lj...tL
A.,.Mi...\.^.,.l},,,t^
A...,Mi...\^...l)..,ML
A..,IJ., ,^^,.,LI,, .li ,
^ . . . JD . . . v^... LI... IL
i\...ri...\_,.,,lj..,Ej
Very little need for security A...B...C...D...E
(Verbal Assression) Very whiny Not at all complaining Doesn't nag Very fussy
/+ (Instrumentalitv +) 3. 9. 16. 26.
28. 31. 33. 40.
Not at all independent Very passive Not at all competitive Can make decisions easily
Gives up easily Not at all self-confident Feels very inferior Goes to pieces under pressure
/- (Instrumentalitv -) 4. 7. 10. 19. 22. 29. 32.
34.
Not at all arrogant Very boastful Not at all egotistical Very greedy Very dictatorial Very cynical Does not look out only for self; principled Not at all hostile
A...o...\^...Lf...ML
J\...Mi...K^...iJ..,Mlj
J\...i3...\^...Lf...iL
/V . . . i S . . . v^..»xJ... IL
r \ . . . l j . . . v ^ . . . l ^ . . . J L
r \ . . . D . . . \ _ y . . . l ^ . . . l L
r \ . . . j ) . . . ^ . . . X ^ . . . A L i
/ \ . . .D. . .v^. . .L/ . . . IL
/ \ . . . D • . . v ^ . . . l - / . . . Hi
/ \ . . . X ) . . . v ^ . . . 1-^... Hi
/ \ . . . J 3 . . . v ^ . . . L/• • . Hi
/ \ . . . Mj...\^... U...Mud
/ \ . . . J3 . . . v ^ . . . JL^... Hi
/ \ . . • D . . . x_^... H I . . . Hi
/ \ . . . X#. . . v^ . . . Hr . . . CJ
x \ . . . D . . . v ^ . . . H I . . . HJ
/ \ . . . D . . . \_x. . . H I . . . Hi
/ \ . . . XJ.. • v^. • . HI . . • Hi
X&. . . -D. . . \ .^ . . . U ... EJ
/ K . . . D • . . v^ . . • H I . . . Hi
Very aggressive Very dominant Very excitable in a maior crisis Very worldly Highly needful of others' approval Feelings easily hurt Cries very easily Very strong need for security
Not at all whiny Very complaining Nags a lot Not at all fussy
Very independent Very active Very competitive Has difficulty making decisions Never gives up easily Very self-confident Feels very superior Stands up under pressure
Very arrogant Not at all boastful Very egotistical Not at all greedy Not at all dictatorial Not at all cynical Looks out only for self; unprincipled Verv hostile
MM^VlM
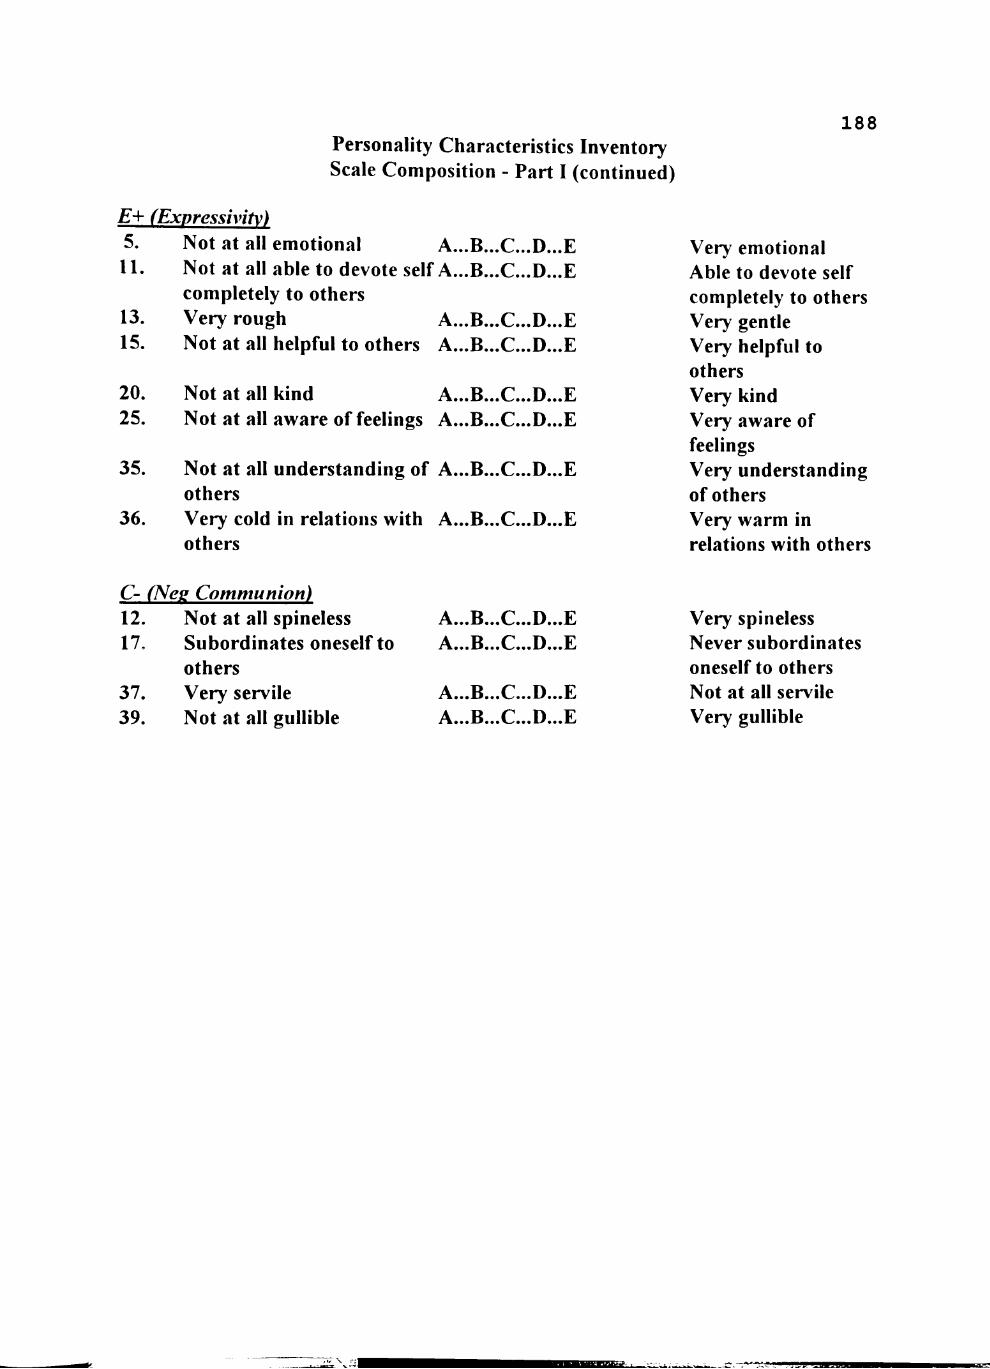
188 Personality Characteristics Inventory Scale Composition - Part I (continued)
E+ (Exyressivitv) 5. Not at all emotional A...B...C...D...E 11. Not at all able to devote self A...B...C...D...E
completely to others 13. Very rough A...B...C...D...E 15. Not at all helpful to others A...B...C...D...E
20. Not at all kind A...B...C...D...E 25. Not at all aware of feelings A...B...C...D...E
35. Not at all understanding of A...B...C...D...E others
36. Very cold in relations with A...B...C...D...E others
Very emotional Able to devote self completely to others Very gentle Very helpful to others Very kind Very aware of feelings Very understanding of others Very warm in relations with others
C- (Nes Communion) 12. Not at all spineless 17. Subordinates oneself to
others 37. Very servile 39. Not at all gullible
/ \ • • • D • • • v.^ • • • 1 ^ • • • J-j
Very spineless Never subordinates oneself to others Not at all servile Very gullible
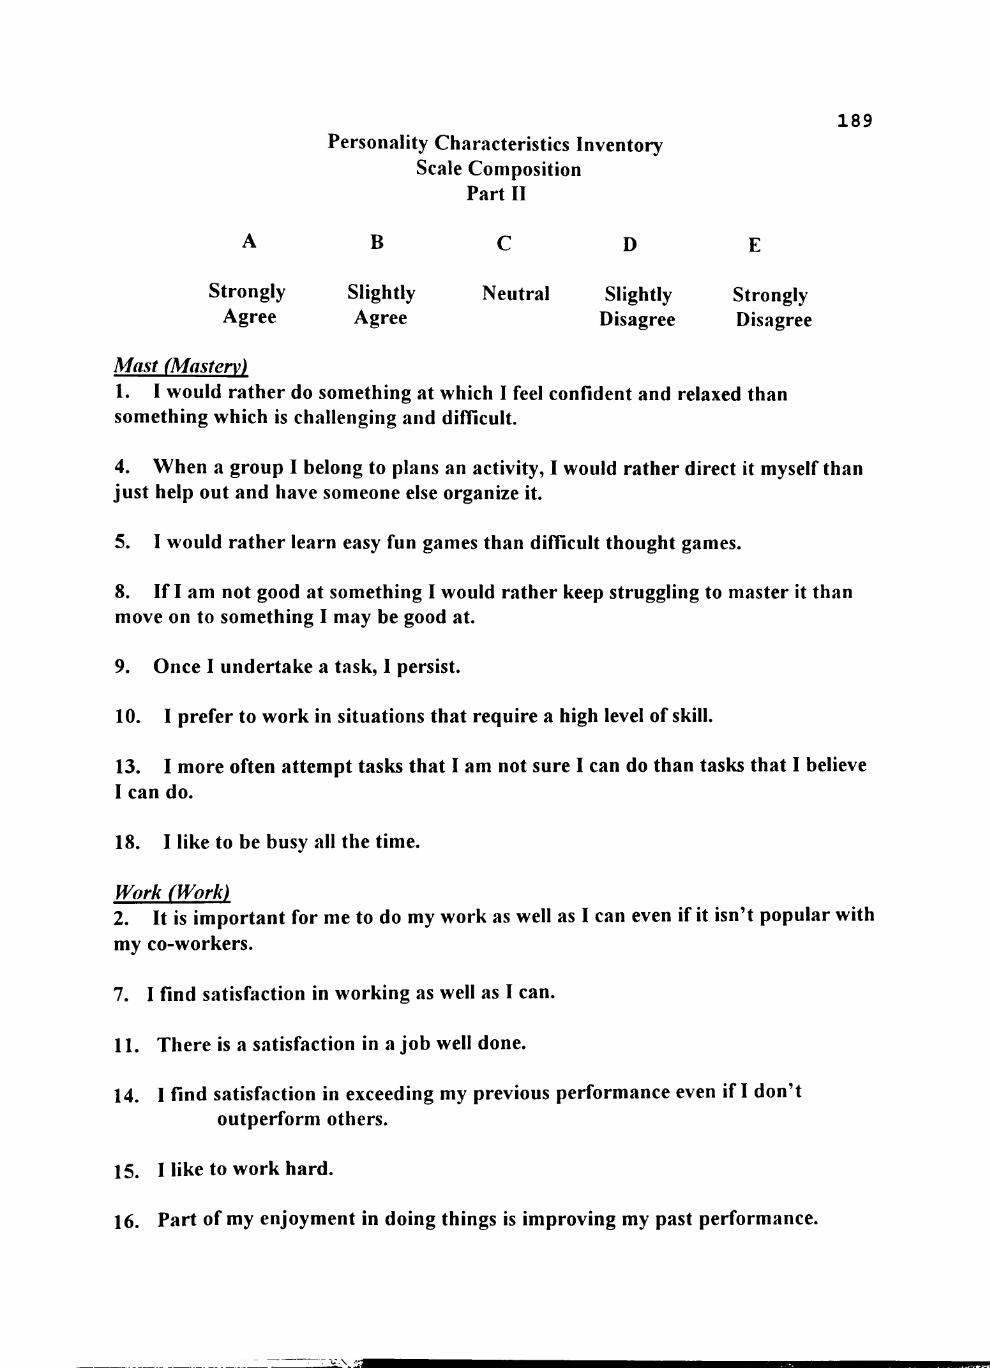
189 Personality Characteristics Inventory
Scale Composition Part II
A B C D E
Strongly Slightly Neutral Slightly Strongly Agree Agree Disagree Disagree
Mast (Mastery) 1. I would rather do something at which I feel confident and relaxed than something which is challenging and difficult.
4. When a group I belong to plans an activity, I would rather direct it myself than just help out and have someone else organize it.
5. I would rather learn easy fun games than difficult thought games.
8. If I am not good at something I would rather keep struggling to master it than move on to something I may be good at.
9. Once I undertake a task, I persist.
10. I prefer to work in situations that require a high level of skill.
13. I more often attempt tasks that I am not sure I can do than tasks that I believe I can do.
18. I like to be busy all the time.
Work (Work) 2. It is important for me to do my work as well as I can even if it isn't popular with my co-workers.
7. I find satisfaction in working as well as I can.
11. There is a satisfaction in a job well done.
14. I find satisfaction in exceeding my previous performance even if I don't
outperform others.
15. I like to work hard.
16. Part of my enjoyment in doing things is improving my past performance.
JrL-\. 'SI
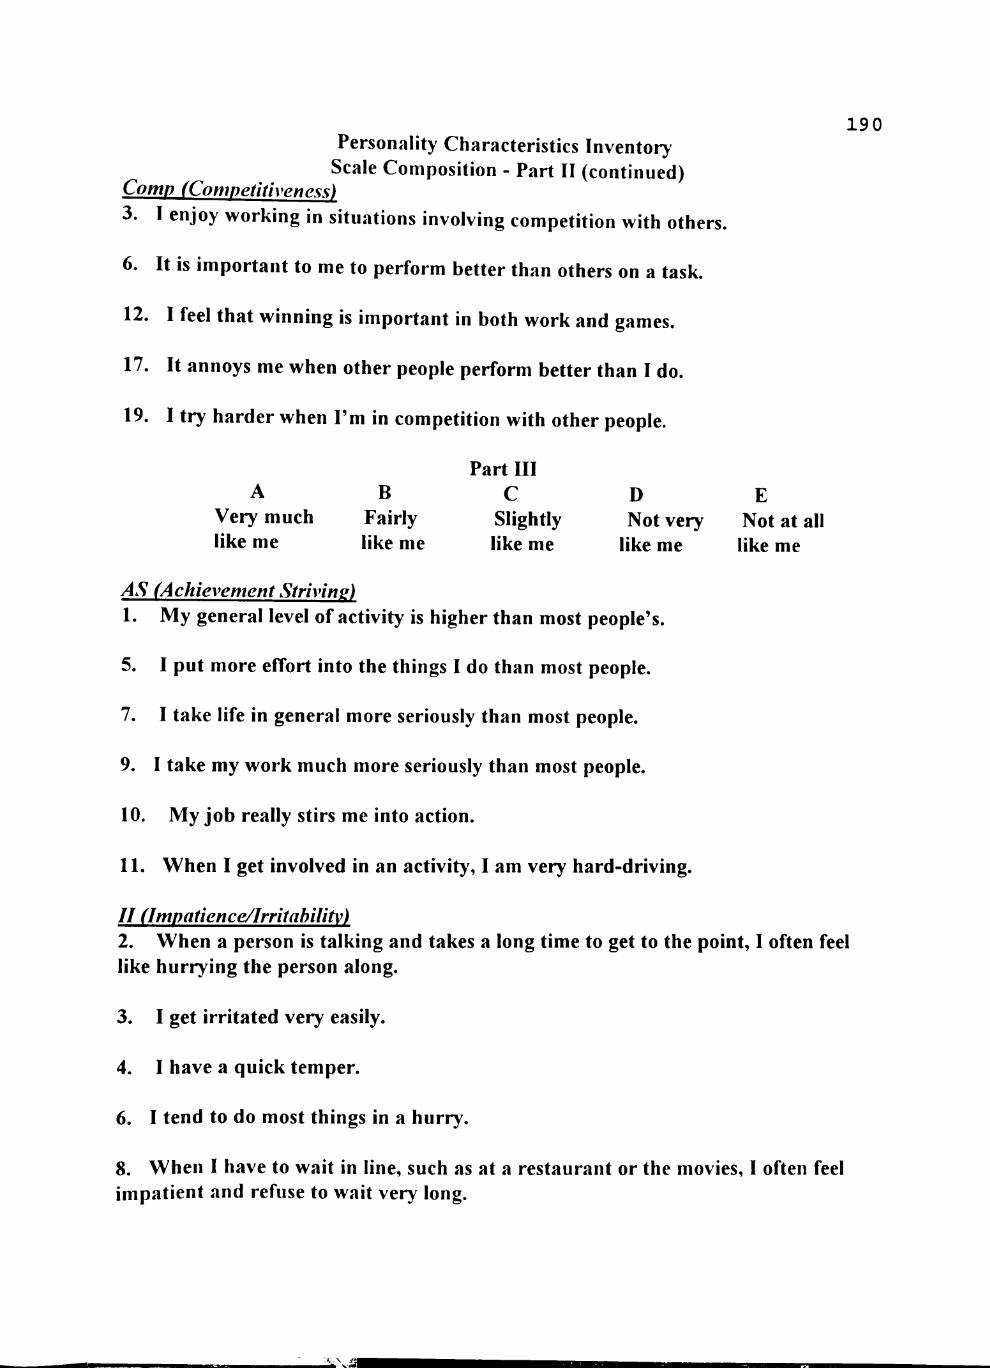
Personality Characteristics Inventory Scale Composition - Part II (continued)
Corny (Competitiveness)
3. I enjoy working in situations involving competition with others.
6. It is important to me to perform better than others on a task.
12. I feel that winning is important in both work and games.
17. It annoys me when other people perform better than I do.
19. I try harder when I'm in competition with other people.
Part III A B C D E
Very much Fairly Slightly Not very Not at all like me like me like me like me like me
AS (Achievement Striving)
I. My general level of activity is higher than most people's.
5. I put more effort into the things I do than most people.
7. I take life in general more seriously than most people.
9. I take my work much more seriously than most people.
10. My job really stirs me into action.
I I . When I get involved in an activity, I am very hard-driving.
II (Impatience/Irritability) 2. When a person is talking and takes a long time to get to the point, I often feel like hurrying the person along.
3. I get irritated very easily.
4. I have a quick temper.
6. I tend to do most things in a hurry.
8. When I have to wait in line, such as at a restaurant or the movies, I often feel impatient and refuse to wait very long.
190
APPENDIX D
DATA ANALYSES TABLES
This appendix contains additional data analyses tables
Included are: (1)ANOVA tables for the scale appropriateness
assessment of the NASA/UT Astronaut Assessment Survey,
(2)ANOVA tables determining differences among group ratings
in perceived performance for Instructor Pilots, (3)Inter-
correlation tables for personality traits, and (4)Inter-
correlation tables of the demographic variables.
191
iiLMm.uieuuiu'>'-<m-"^M-
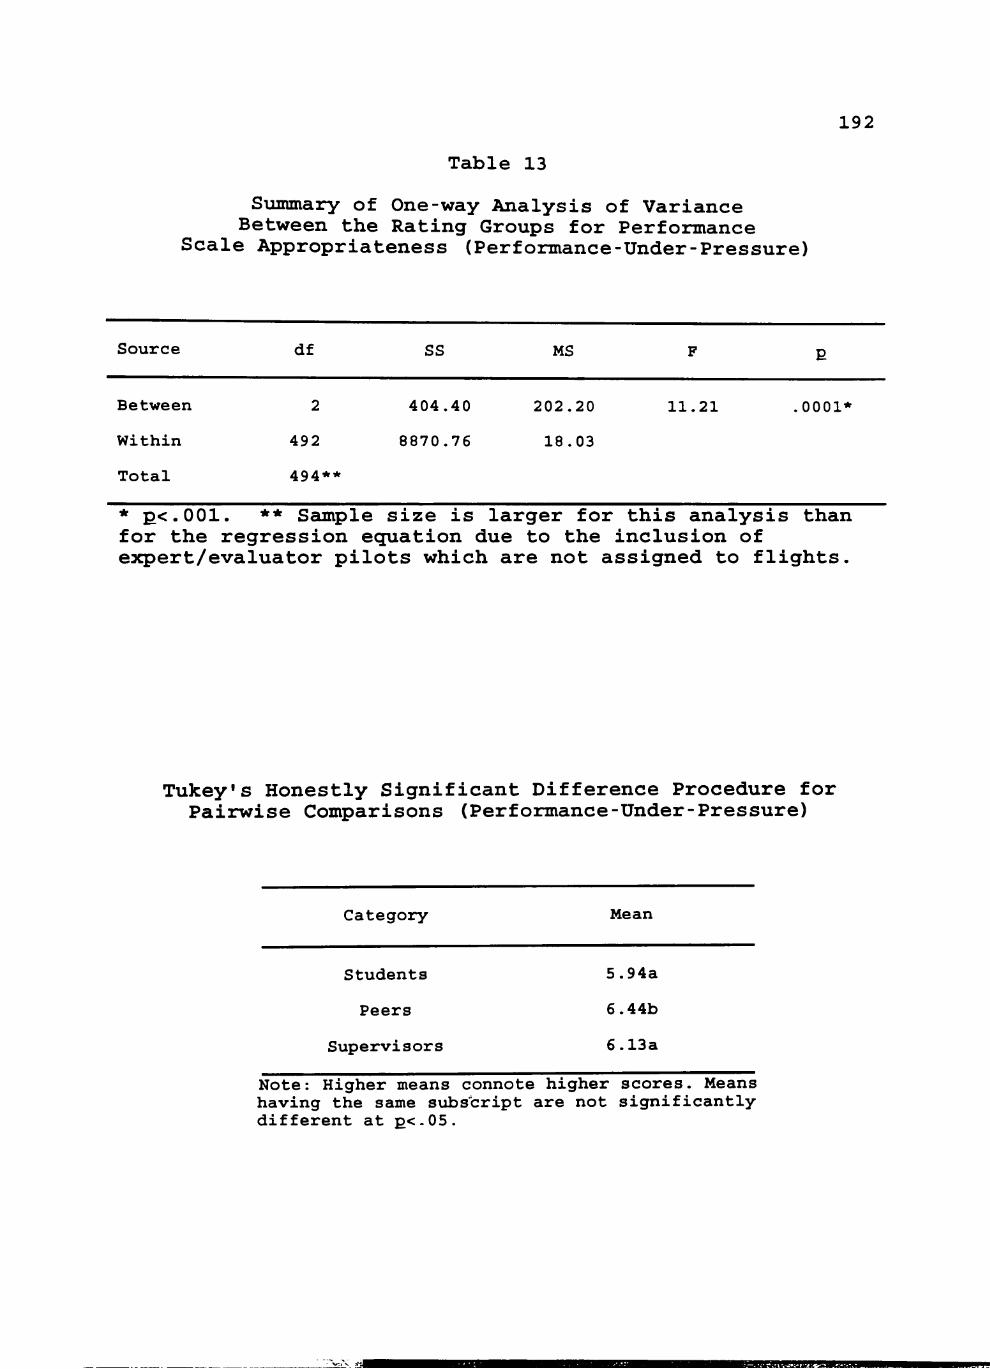
192
Table 13
Summary of One-way Analysis of Variance Between the Rating Groups for Performance
Scale Appropriateness (Performance-Under-Pressure)
Source df SS MS
Between 2 404.40 202.20 11.21 .0001*
Within 492 8870.76 18.03
Total 494**
* p<.001. ** Sample size is larger for this analysis than for the regression equation due to the inclusion of expert/evaluator pilots which are not assigned to flights.
Tukey's Honestly Significant Difference Procedure for Pairwise Comparisons (Performance-Under-Pressure)
Category Mean
Students 5.94a
Peers 6.44b
Supervisors 6.13a
Note: Higher means connote higher scores. Means having the same subscript are not significantly different at E<.05.
rsBBBBBB^am^am
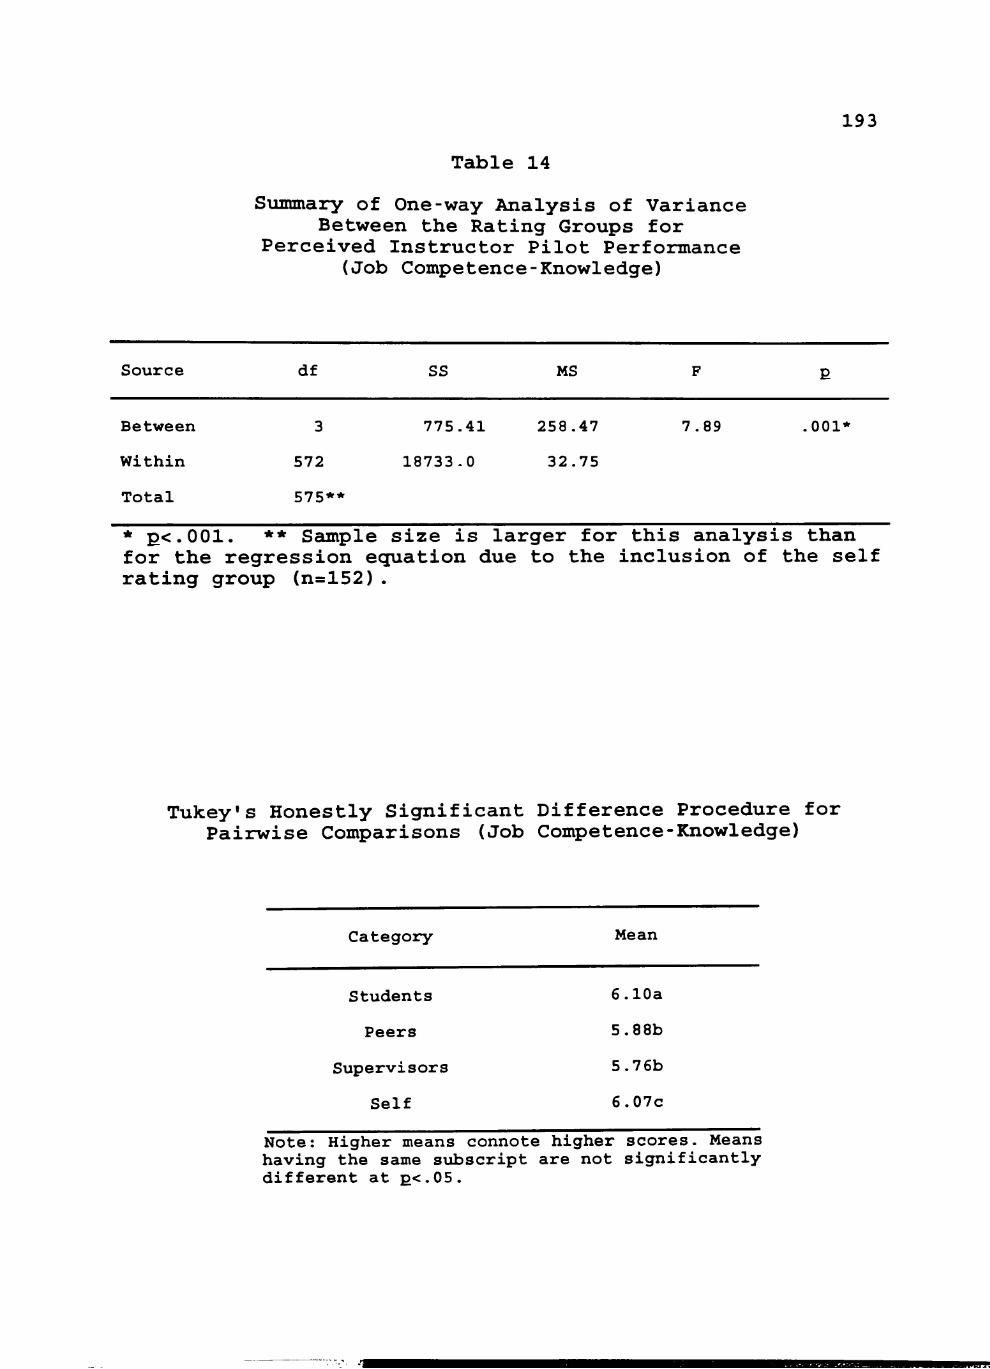
Table 14
Summary of One-way Analysis of Variance Between the Rating Groups for
Perceived Instructor Pilot Performance (Job Competence-Knowledge)
193
Source
Between
Within
Total
df
3
572
575**
SS
775.41
18733-0
MS
258.47
32.75
7.89 001'
* p<.001. ** Sample size is larger for this analysis than for the regression equation due to the inclusion of the self rating group (n=152).
Tukey's Honestly Significant Difference Procedure for Pairwise Comparisons (Job Competence-Knowledge)
Category Mean
Students
Peers
Supervisors
Self
6.10a
5.88b
5.76b
6.07c
Note: Higher means connote higher scores. Means having the same subscript are not significantly different at E<.05.
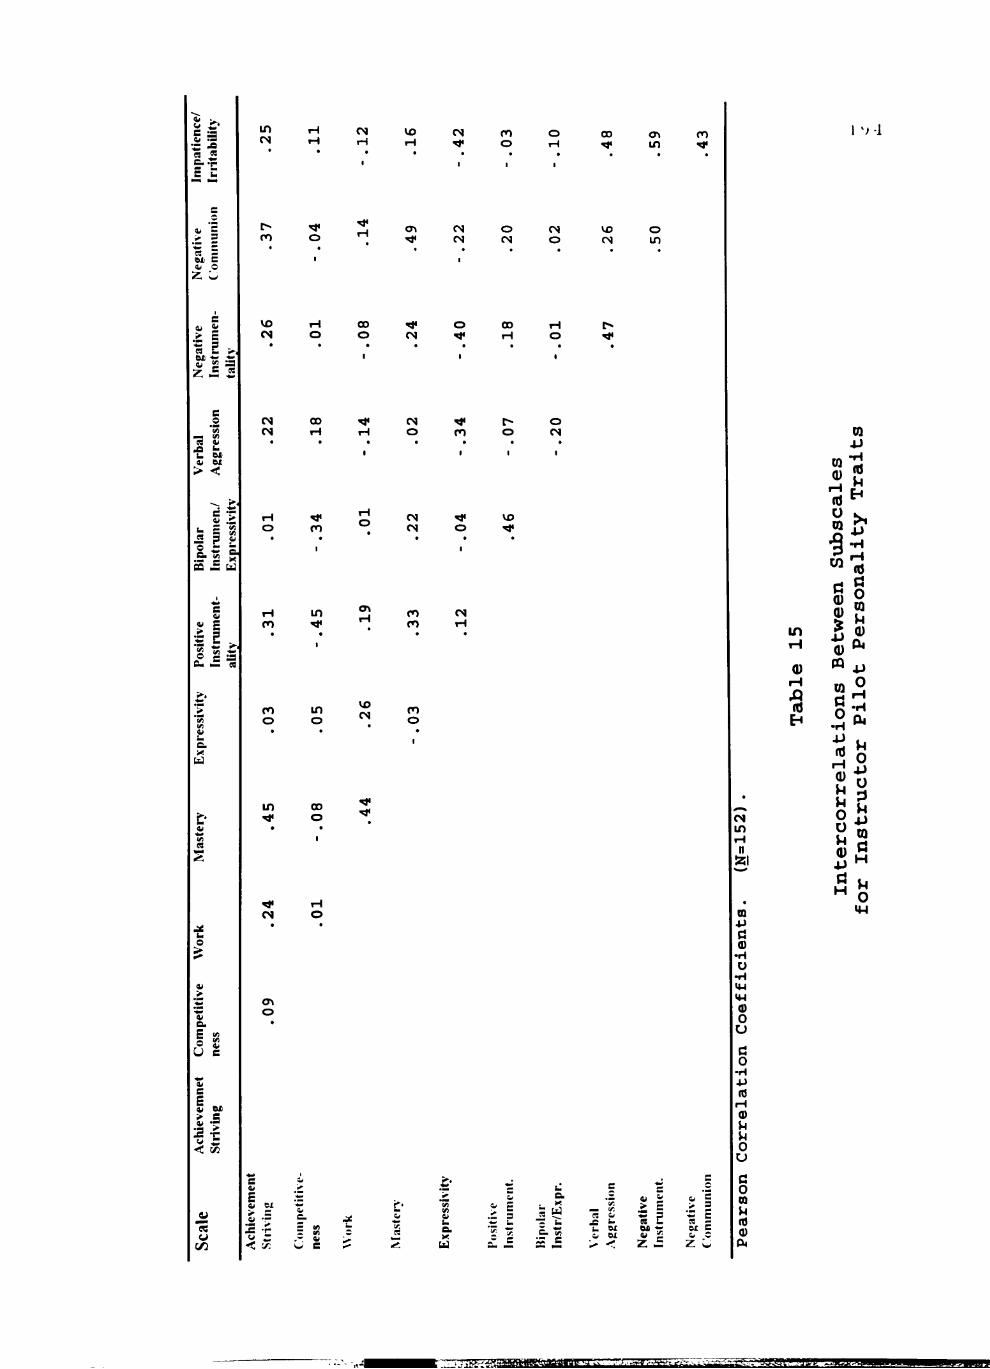
fl
j; 5 R -M C lb C
z, ;.
e
> <
S:E 5 a "> — p ^ 1.-= ft 09 ^ U
•- P 'I "K .-s' Cu • = es
in rH
VO m o
CO in
ro o a\ -^
cs M
o CN
CN O
yx> CN
o in
vo CN O
CO
o CN o CO
>
cssi
u e. X bi
ro o
•
in o
•
Ji o >
o S U c
it
e
< V3
ale
w c/3
•£ •? ' c < tr.
CN CN
CO ' l * C>1
o ro o
o I
o c>«
t^ ^
rH O ro
CN CN o vo
rH ro
in CO fO
CN
vo CN
ro o
in CO o
^ ^
in H
<D H A Id H
CN
O
i)
CS
2 X
> i w;
o ex z .£ • I er C b s
Z w
CN m rH n
SSI
m
a •H
o •H MH UH (D O U c o
-H
(d H 0)
u o u C o CQ u (d 0)
Cl4
1 v l
CQ (U
cd o CQ
CQ
- H
<d
H
15 en
PI 0) 0) ^ 0)
PQ
CQ ti O
•H 4J td
rH 0)
O o u 0)
ti H
(d
o CQ
u
o H -H
o o CQ
a H V4 O
--T-r?ig:73j>;»»v»,tini.Liiiiunuu.' j-rr- ,>. . , . . :y^-H-^ ^ , - : . - . v - ^ y . ^ rs«-wM?t-3tMess.??-;ct:-_i.-._
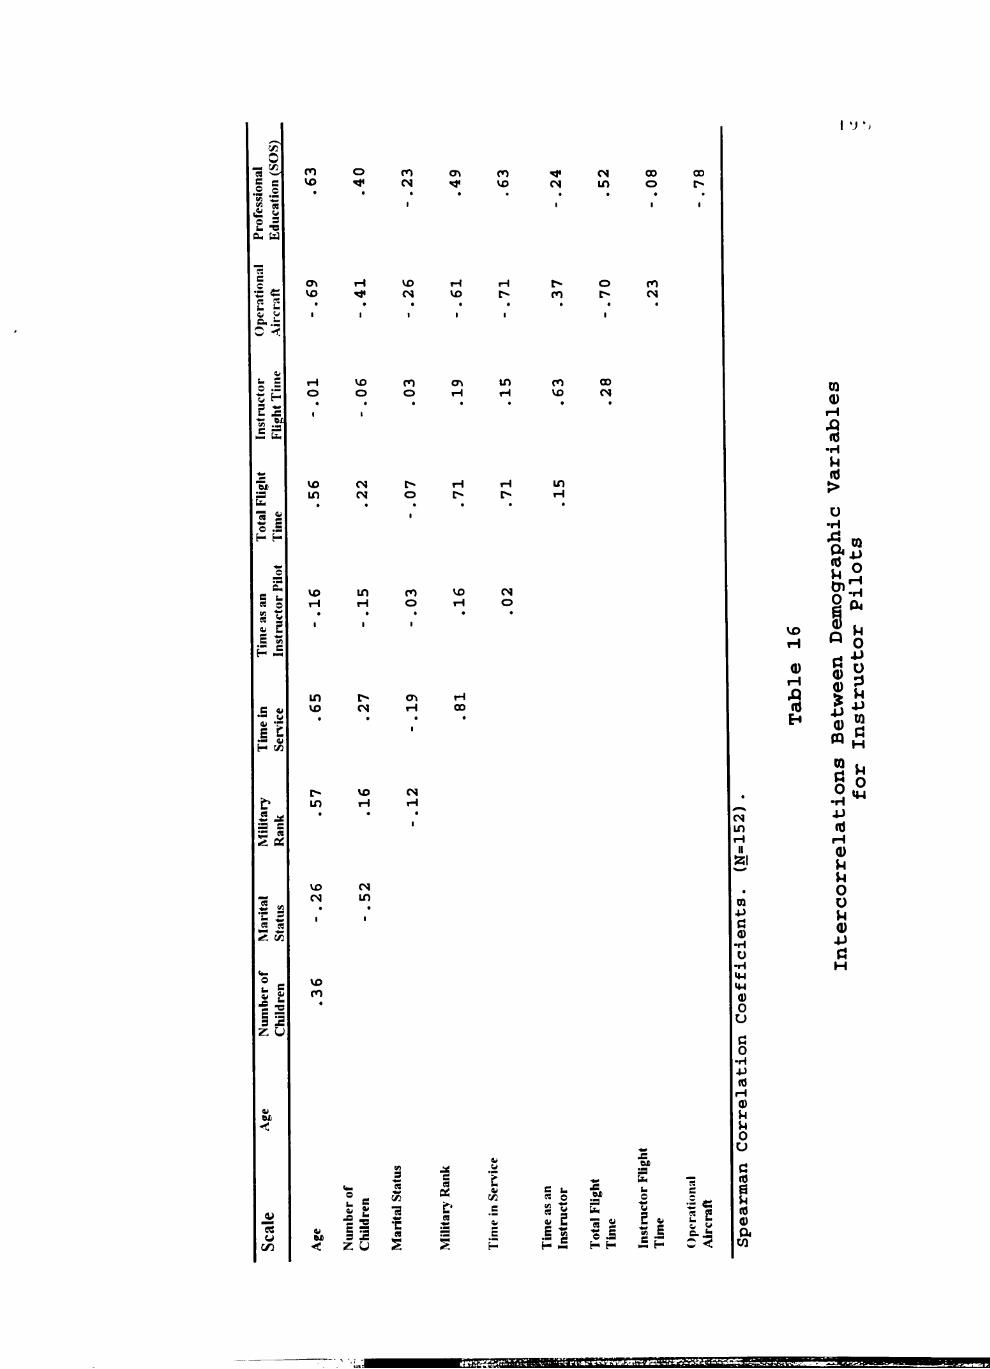
c/3
o
i % in S 2 « ® 5 a. u
1;
O .=
I -I
o
5 «<
ro vo
o ^
ro CN
Ol ' i l *
ro vo
^ CN
CN in
CO o
GO r»
en vo •
H ^
1
VO CN • 1
rH VO • 1
rH r> 1
t*> fO •
o r> • 1
ro r4 •
vo o
CO
o <n m ro
vo CO CN
vo in
CN o
m
vo rH
in rH
ro o
vo CN o
S OS
« es
3 2 z u
in vo CN rH CO
m vo rH
CN H
vo CN
CN m
vo ro
CAl
s
• f i n **
-< z u S
o
a
at
(S o
w E. E -S
et a u o -.. u
e
I 'J
vo H
0) H .Q Id
£ 2 «- Si
CN m H II
21
en • p C (1)
MH 0) o u c o
TH JJ
H 0)
0
u c n)
g (0 0)
w
CQ 0)
rH
Id -H u Id >
o
•H
I" o §
ti
0)
0)
n CQ a o
•H Id H <u u u o o 0)
04
o •p o
CQ
H
o
*«;!«»"--• - > - ^ ^ l - . -