the puzzling dredge-up pattern in ngc 1978
TRANSCRIPT

arX
iv:0
906.
1279
v1 [
astr
o-ph
.SR
] 6
Jun
2009
Astronomy & Astrophysicsmanuscript no. lederer-ngc1978 c© ESO 2009June 6, 2009
The puzzling dredge-up pattern in NGC 1978M. T. Lederer1, T. Lebzelter1, S. Cristallo2, O. Straniero2, K. H. Hinkle3, and B. Aringer1
1 University of Vienna, Department of Astronomy, Turkenschanzstrasse 17, A-1180 Vienna, Austriae-mail:[email protected],[email protected],[email protected]
2 INAF, Osservatorio Astronomico di Collurania, 64100 Teramo, Italye-mail:[email protected],[email protected]
3 National Optical Astronomy Observatories⋆, PO Box 26732, Tucson, AZ 85726, USAe-mail:[email protected]
Received February 17, 2009; accepted June 2, 2009
ABSTRACT
Context. Low-mass stars are element factories that efficiently release their products in the final stages of their evolution by meansof stellar winds. Since they are large in number, they contribute significantly to the cosmic matter cycle. To assess thiscontributionquantitatively, it is crucial to obtain a detailed picture of the stellar interior, particularly with regard to nucleosynthesis and mixingmechanisms.Aims. We seek to benchmark stellar evolutionary models of low-mass stars. In particular, we measure the surface abundance of12Cin thermally pulsing AGB stars with well-known mass and metallicity, which can be used to infer information about the onset andefficiency of the third dredge-up.Methods. We recorded high-resolution near-infrared spectra of AGB stars in the LMC cluster NGC 1978. The sample comprised bothoxygen-rich and carbon-rich stars, and is well-constrained in terms of the stellar mass, metallicity, and age. We derived the C/O and12C/13C ratio from the target spectra by a comparison to synthetic spectra. Then, we compared the outcomes of stellar evolutionarymodels with our measurements.Results. The M stars in NGC 1978 show values of C/O and12C/13C that can best be explained with moderate extra-mixing on the RGBcoupled to a moderate oxygen enhancement in the chemical composition. These oxygen-rich stars do not seem to have undergonethird dredge-up episodes (yet). The C stars show carbon-to-oxygen and carbon isotopic ratios consistent with the occurrence of thethird dredge-up. We did not find S stars in this cluster. None of the theoretical schemes that we considered was able to reproduce theobservations appropriately. Instead, we discuss some non-standard scenarios to explain the puzzling abundance pattern in NGC 1978.
Key words. stars: abundances – stars: AGB and post-AGB – stars: evolution
1. Introduction
Modelling the final phases in the evolution of a low-mass starisa demanding task. The stellar interior is a site of rich nucleosyn-thesis, particularly when the star evolves on the asymptotic gi-ant branch (AGB). The freshly synthesised elements are carriedto the outer layers of the star by means of thethird dredge-up(TDU, for a review see Busso et al. 1999). The onset and effi-ciency of this mixing mechanism depends on the mass and themetallicity of the star. Various stellar evolution models devel-oped in the recent past (e. g. Straniero et al. 1997; Herwig 2000;Stancliffe et al. 2004; Straniero et al. 2006; Karakas & Lattanzio2007) agree on the theoretical picture of the TDU, but details arestill subject to discussions. It is thus important to test the mod-els against observations and to derive constraints to improve ourunderstanding of the involved phenomena and related problems.AGB stars are tracers of intermediate-age stellar populations,which can only be modelled accurately when the evolution ofthe constituents is known. Moreover, evolved low-mass stars un-dergo strong mass loss in the late stages of their evolution.Theyenrich the interstellar medium with the products of nuclearburn-
Send offprint requests to: M. T. Lederer⋆ Operated by the Association of Universities for Research in
Astronomy, under cooperative agreement with the National ScienceFoundation.
ing and thus, as they are large in number, play a significant rolein the cosmic matter cycle.
The primary indicator of TDU is a carbon surface enhance-ment. An originally oxygen-rich star can be transformed into acarbon star by an efficient dredge-up of12C to the surface. Thecriterion to distinguish between an oxygen-rich and a carbon-rich chemistry is the number ratio of carbon to oxygen atoms,C/O. During the thermally pulsing (TP) AGB phase, while theC/O ratio is constantly rising as a consequence of the TDU,there are mechanisms that may counteract the increase in thecarbon isotopic ratio12C/13C. The radiative gap between theconvective envelope and the hydrogen burning shell can bebridged by a slow mixing mechanism (cf. Wasserburg et al.1995; Nollett et al. 2003). In this way,12C and isotopes of otherelements are fed back to nuclear processing. The physical originof this phenomenon is still not known, which is another argu-ment to establish observational data in order to benchmark theo-retical predictions.
Measurements of the carbon abundance and the carbonisotopic ratio have been done for a few bright field AGBstars (Lambert et al. 1986; Harris et al. 1987; Smith & Lambert1990). The direct comparison of the values inferred from fieldstar observations to evolutionary models is complicated bythefact that luminosity and mass of those targets can be determinedonly inaccurately, while both quantities are crucial inputpa-rameters for the models. A strategy to circumvent this prob-

2 Lederer et al.: The puzzling dredge-up pattern in NGC 1978
lem is to observe AGB stars in globular clusters (GC). Theyprovide a rather homogeneous sample with respect to distance,age, mass, and metallicity. Admittedly, this simplistic picture isslowly disintegrating. There is evidence that globular clustersoften harbour more than one population with abundance vari-ations among the constituents (Mackey & Broby Nielsen 2007;Piotto et al. 2007; Renzini 2008). The parameters like mass andmetallicity are, however, still much better constrained than forfield stars. For our purpose, i. e. investigating the abundance vari-ations due to the TDU, the old Milky Way globular clusters arenot well suited. The AGB stars of the current generation haveanenvelope mass too low for TDU to occur, while more massivestars have evolved beyond the AGB phase. The intermediate-ageglobular clusters in the Large Magellanic Cloud (LMC) serveour needs better. We started with an investigation of the AGBstars in NGC 1846 (Lebzelter et al. 2008, henceforth paper I)andindeed demonstrated the abundance variation along the AGB dueto the TDU.
In this paper, we pursue this idea and study the AGB stars inthe LMC globular cluster NGC 1978, deriving C/O and12C/13Cratios. We give an overview of previous studies of this clusterand our observations in Sect. 2. Details about the data analy-sis are given in Sect. 3. In Sect. 3.4 we describe the evolutionarymodels we use for a comparison to our observational results.Theresults follow in Sect. 4. We discuss our findings in Sect. 5, giv-ing scenarios on how to interpret the puzzling case of NGC 1978before we conclude in Sect. 6.
2. Observations
2.1. The target cluster: NGC 1978
The globular cluster NGC 1978 is a member of the intermediate-age (τ = 1 − 3 Gyr) cluster population (Girardi et al. 1995) inthe LMC. This population corresponds to one of the two peaksin the LMC metallicity distribution at [Fe/H] = −0.37 (with aspread ofσ = 0.15) reported by Cole et al. (2005). In a recentwork, Mucciarelli et al. (2007a) indeed derived a metallicity of[M/H] = −0.37 that is based on the findings from Ferraro et al.(2006), who claimed [Fe/H] = −0.38±0.02 and that [α/H] is al-most solar. In contrast to that, Hill et al. (2000) quoted a grosslydeviating value of [Fe/H] = −0.96±0.20. They investigated twostars from this cluster (LE8 and LE9, see also Sects. 3 and 4) andconcluded that [O/Fe] = +0.37± 0.10. These findings have notbeen reproduced by other groups. Mucciarelli et al. (2008) ratherfound a mild depletion in alpha elements on average and as-cribe the differences to Hill et al. (2000) to the deviating metal-licity. Mucciarelli et al. (2008), who performed detailed abun-dance studies of red giants with UVES spectra, also did not con-firm the results of Alcaıno et al. (1999), who concluded frommulticolour CCD photometry that NGC 1978 consists of twosub-populations differing by 0.2 dex in metallicity. According totheir work, the north-western half of the cluster is more metal-rich and younger than the south-eastern half (plus differencesof the sub-populations in the helium content). This result has tobe seen in conjunction with a peculiarity of the cluster, namelyits high ellipticity of ǫ = 0.301 which has been found inde-pendently by various groups and was most recently confirmedby Mucciarelli et al. (2007a). A merger event that could explainboth the elongated shape and the suspected two sub-populationswas, however, ruled out for example by Fischer et al. (1992).A
1 The flattening of a globular cluster is defined asǫ ≡ (a−b)/a, wherea is the major axis andb is the minor axis of the cluster.
tidal interaction with the host galaxy seems to be a more likelyexplanation for the high ellipticity (van den Bergh 2008, and ref-erences therein).
Mucciarelli et al. (2007a) derived the cluster age, distancemodulus, and turn-off mass by fitting isochrones to the clus-ter colour-magnitude diagram (CMD). The resulting values areτ = 1.9±0.1 Gyr, (m−M)0 = 18.50 andMTO = 1.49M⊙, respec-tively, for the best fit found when using isochrones from thePisaEvolutionary Library (PEL, Castellani et al. 2003). When adopt-ing other isochrones with different overshooting prescriptions,the parameters vary so that one could also derive a somewhatlower turn-offmass (MTO = 1.44M⊙), a lower distance modulus((m − M)0 = 18.38), and a cluster age from 1.7 to 3.2 Gyr.
The various radial velocity measurements quoted in the lit-erature widely agree within the error bars, e. g. Olszewski et al.(1991) and Schommer et al. (1992) derived〈vr〉 = +292 ±1.4 km s−1 whereas Ferraro et al. (2006) determined a mean he-liocentric velocity of NGC 1978 of〈vr〉 = +293.1± 0.9 km s−1
and with a velocity dispersionσ = 3.1 km s−1.
NGC 1978 harbours a number of red giant stars(Lloyd Evans 1980) some of which are known to be car-bon stars (Frogel et al. 1990). The easiest explanation for suchan occurrence is that these C stars are AGB stars undergoingthe third dredge-up or, alternatively, that they underwentmassaccretion from an old AGB companion, which subsequentlyevolved into a white dwarf. More exotic explanations will bediscussed in Sect. 5.2.
2.2. Spectroscopy
We recorded high-resolution near-infrared spectra of 12 AGBstars in the LMC globular cluster NGC 1978. Ten stars from ourtarget list were already identified by Lloyd Evans (1980) as redgiant stars (and are tagged LE in this work) but largely withoutinformation about the spectral type. Frogel et al. (1990) listed anumber of AGB stars in NGC 1978, comprising also the starsfrom LE, and gave information about the spectral type, the clus-ter membership, and near-infrared photometry data. Based onthis information, we selected ten targets that could be observedwith the Phoenix spectrograph mounted at the Gemini SouthTelescope (Hinkle et al. 1998, 2003) with reasonable exposuretimes. Additionally, we constructed a colour-magnitude diagramfrom Two Micron All Sky Survey (2MASS, Skrutskie et al.2006) data and picked two more stars that, judging from theirK magnitude and (J − K) colour index, are also located on theAGB of NGC 1978 (stars A and B). Details about the observa-tion targets together with the observing log are given in Table 1.The distribution of all the targets within the cluster is illustratedin Fig. 1.
Our observing programme required observations at two dif-ferent wavelengths, one in the H band and one in the K band.For this purpose, we utilised the Phoenix order sorting filtersH6420 and K4220. However, poor weather conditions in thelast of the 4 observing nights prohibited to record H-band spec-tra for the targets LE2 and LE7. For the star LE9, we ob-tained spectra from queue mode observations in the semester2008A. The exact wavelength settings are similar to the onesdescribed in Lebzelter et al. (2008), i. e. in the K band our spec-tra run approximately from 23 580 to 23 680 Å. In the H band(15 530− 15 600 Å), the spectral region observed was shifted toslightly higher wavelengths to cover a larger part of the CO 3-0band head at 15 581.6 Å = 6417.8 cm−1. The slit width was set

Lederer et al.: The puzzling dredge-up pattern in NGC 1978 3
Table 1. NGC 1978 targets and log of observations (LE stands for LloydEvans 1980)
ID Type J K RA Dec H band (λc = 15585 Å) (S/N)H K band (λc = 23670 Å) (S/N)K
2MASS J2000LE4 M 12.347 11.199 05 28 43.72 −66 14 03.7 2006 Dec 03: 3× 1000 s 65 2006 Dec 05: 3× 1000 s 65LE6 C 12.090 10.707 05 28 46.27−66 13 56.4 2006 Dec 07: 3× 800 s 70 2006 Dec 06: 3× 800 s 55A M 12.253 11.116 05 28 46.23 −66 13 24.8 2006 Dec 03: 3× 1000 s 55 2006 Dec 05: 3× 1000 s 65LE3 C 11.490 9.676 05 28 44.49 −66 14 03.9 2006 Dec 03: 3× 400 s 105 2006 Dec 05: 3× 400 s 120LE10 M 12.917 11.802 05 28 44.44 −66 13 59.9 2006 Dec 03: 3× 1800 s 60 2006 Dec 05: 3× 1800 s 70LE5 M 12.527 11.387 05 28 43.64 −66 13 53.0 2006 Dec 03: 3× 1200 s 50 2006 Dec 05: 3× 1200 s 60B C 12.367 11.078 05 28 43.65 −66 14 09.6 2006 Dec 07: 3× 700 s 50 2006 Dec 06: 3× 1000 s 55LE1 C 12.282 10.467 05 28 48.50−66 14 59.9 2006 Dec 03: 3× 600 s 50 2006 Dec 05: 3× 600 s 115LE2 C 12.967 11.266 05 28 48.62−66 15 18.7 - - 2006 Dec 06: 3× 1200 s 65LE7 C 12.764 11.214 05 28 47.85−66 14 44.0 - - 2006 Dec 06: 3× 1000 s 75LE8 M 13.018 11.916 05 28 48.47 −66 14 38.7 2006 Dec 03: 3× 2000 s 30 2006 Dec 05: 3× 2000 s 40LE9 M 13.315 12.259 05 28 50.73 −66 14 44.2 2008 Mar 19: 4× 1800 s 45 2006 Dec 06: 3× 2000 s 50
Fig. 1. Distribution of observed targets in the cluster NGC 1978.The picture was acquired from the 2MASS catalogue usingAladin (Bonnarel et al. 2000). Numbers refer to the nomencla-ture of Lloyd Evans (1980). The additional targets A and Bwere chosen according to their position in the 2MASS colour-magnitude diagram. The stars A, 4, 5, 8, 9, and 10 possessan oxygen-rich atmosphere while B, 1, 2, 3, 6, and 7 are car-bon stars. The cluster is elongated and its major axis stretchesroughly from south-east to north-west. The displayed sky regionis 5.′0× 5.′0 wide. The coordinates of the image centre (close toLE3) readα = 05h28m45.s00,δ = −66◦14′14.′′00 (J2000).
to 0.′′35 (the widest slit) which resulted in a spectral resolutionof R = λ/∆λ = 50 000.
The total integration time per target and wavelength settingranged between 20 (LE3) and 120 (LE9) minutes. For each targetwe observed at two or three different positions along the slit.Each night, we also recorded a spectrum of a hot star withoutintrinsic lines in the respective wavelength regions in order tocorrect the spectra of our programme stars for telluric lines. Theresulting signal-to-noise was from 50 to above 100 per resolutionelement (∼ 4 pixels). See Table 1 for details.
2.3. Data reduction
The data reduction procedure was carried out as described atlength for example in Smith et al. (2002) and in the Phoenix datareduction IRAF tutorial.2
To correct the AGB star spectra for telluric lines, we ac-quired the spectrum of an early type star without intrinsic lines.The telluric absorption features were removed using the IRAFtasktelluric in the K band. The H-band spectra are almostfree of telluric lines, they were, however, also processed inthe same way to remove the fringing. In the H band, we didthe wavelength calibration for a K-type radial velocity stan-dard (HD5457,vr = 5.1 km s−1, Wilson 1953) recorded along-side with the programme stars. Using the Arcturus atlas fromHinkle et al. (1995), we identified several features (OH, Fe,Ti,Si lines) in the spectrum and derived a dispersion solution.Therelation was then applied to the remaining spectra. This proce-dure allowed us to derive radial velocities from the H-band spec-tra. For the K-band spectra we did a direct calibration usingtheCO lines in the spectrum of an M-type target. That solution wasthen also applied to the carbon-star spectra.
3. Data analysis
3.1. Contents of the observed wavelength ranges
The wavelength ranges were chosen such that from the H bandspectra we could derive the stellar parameters and the C/O ra-tio. Subsequently, we inferred the carbon isotopic ratio12C/13Cfrom the K band. In practice, the parameters are tuned iteratively.The region in the H band is widely used in the literature (e. g.Smith et al. 2002; McSaveney et al. 2007; Yong et al. 2008) toderive oxygen abundances from the contained OH lines. Fromthe relative change of those features in comparison to the bandhead from the12C16O 3-0 vibration transition, it is possible todetermine the C/O ratio in the stellar atmosphere. A weak CNline and a few metal lines (Fe, Ti, Si) aid in the pinning down ofthe parameters, especially the effective temperature.
The K-band spectra comprise a number of CO lines from firstovertone (∆ν = 2) transitions. Beside features from the main iso-topomer12C16O, we also find some13C16O lines in this region.We derived the carbon isotopic ratio by fitting these lines. Apart
2 Available athttp://www.noao.edu/usgp/phoenix/. IRAF isdistributed by the National Optical Astronomy Observatories, whichare operated by the Association of Universities for Research inAstronomy, Inc., under cooperative agreement with the NationalScience Foundation.
4 Lederer et al.: The puzzling dredge-up pattern in NGC 1978
from the CO lines, there is also a single HF line blended with a13CO feature.
In Fig. 2, we give an overview about our observations. Forthe oxygen-rich stars, the key features in the H band are marked.In the K band, we indicate the position of the13CO lines. The se-lection of the wavelength ranges was driven by the oxygen-richcase. From Fig. 2 it is obvious that the regions are not well suitedfor the analysis of carbon-star spectra. Both H- and K-band spec-tra are crowded with features from the CN and C2 molecules,occurring in addition to the CO lines. The polyatomic moleculesC2H2, HCN, and also C3 contribute to the opacity by means ofmany weak lines that form a pseudo-continuum (see Sect. 3.3.2).The major part is due to C2H2 absorption that increases with de-creasing effective temperature. In the H band, the CO band headis strongly affected by neighbouring features. Generally speak-ing, there is not a single unblended line in the carbon-rich case.The situation in the K band, however, is not that bad. The12COlines are still visible, although blended with CN features,butthere are only a few C2 lines. The pseudo-continuum is essen-tially all due to C2H2, contributions from other molecules arenegligible.
3.2. Synthetic spectra
We compare our observations with synthetic spectra based onmodel atmospheres that were calculated with the COMARCScode (details will be given in a forthcoming paper byAringer et al. 2009). COMARCS is a modified versionof the MARCS code (originating from Gustafsson et al.1975; Jørgensen et al. 1992, recently extensively described byGustafsson et al. 2008). In the model calculations, we deducedthe temperature and, accordingly, pressure stratificationassum-ing a spherical configuration in hydrostatic and local thermody-namic equilibrium (LTE). For stars showing only a small vari-ability, LTE is a reasonable approximation. Possible deviationsfrom LTE have a smaller influence on the abundance determi-nation than large deviations from the hydrostatic equilibrium(see for example Johnson 1994 for a discussion of non-LTE ef-fects in cool star atmospheres). In the evaluation of the chemicalequilibrium, which is a consequence of LTE, we take all rele-vant opacity sources into account in both model calculationandspectral synthesis. In the oxygen-rich case H2O, TiO, CO, andCN are major opacity contributors, while HCN, C2H2, C2 (andothers) are important in the carbon-rich case. The opacity coef-ficients utilised by COMARCS are calculated with the COMAcode (Aringer 2000; Aringer et al. 2009). The atomic line datawere taken from VALD (Kupka et al. 2000), an overview of themolecular line lists used with all the sources documented canbe found in Lederer & Aringer (2009). Model atmospheres andsynthetic spectra that were calculated following the method out-lined above have been shown to describe the spectra of cool giantstars appropriately (e. g. Loidl et al. 2001; Aringer et al. 2002).We applied the same procedure successfully in paper I for ouranalysis of the AGB stars in the LMC cluster NGC 1846.
From the parameters that determine an atmospheric model,we held the mass and the metallicity constant. The respec-tive values areM = 1.5 M⊙ and [M/H] = −0.4, andwere taken from the literature (see Introduction). In the modelcalculations, the microturbulent velocity was set toξ =
2.5 km s−1, which is in the range that is found for atmospheresof low-mass giants (e. g. Aringer et al. 2002; Smith et al. 2002;Gautschy-Loidl et al. 2004). By varying the remaining parame-ters effective temperatureTeff [K], logarithm of the surface grav-ity log(g[cm s−2]), and carbon-to-oxygen ratio (C/O), we con-
structed a grid of model atmospheres and spectra. This was donesuch that we cover theTeff and logg range resulting from colour-temperature relations and bolometric corrections appliedto oursample stars. The step size in effective temperature was set to50 K, whilst the surface gravity was altered in steps of 0.25 ona logarithmic scale, i. e. for logg, ranging from 0.0 to+0.5. Forsome carbon stars in our sample we got logg < 0.0 from thecolour transformations and the adopted mass. The spectral fea-tures used in the analysis show only a minor dependence on thisparameter thus we fixed logg = 0.0 in the analysis of the carbonstars. In this way we also avoid convergence problems for theatmospheric models.
The element composition is scaled solar (Grevesse & Noels1993), but we assumed an oxygen over-abundance of+0.2 dexmotivated by the results of our work on NGC 1846 (paper I) andby the paper of Hill et al. (2000). We altered the C/O ratio insteps of 0.05 in the oxygen-rich case and 0.10 in the carbon-richcase. This was done by changing the carbon abundance whileleaving the other abundances untouched.
The synthetic spectra cover a wavelength range of 6400−6450 cm−1 (15 504− 15 625 Å) in the H band and of 4215−4255 cm−1 (23 500− 23 725 Å) in the K band. The spectra werefirst calculated with a resolution ofR = λ/∆λ = 300 000 andthen convolved with a Gaussian3 to match the resolution of ourobserved spectra (R = 50 000). By applying another convolutionwith a Gaussian profile we took the macroturbulent velocity intoaccount. To determine the carbon isotopic ratio12C/13C (whichis about 89.9 in the Sun according to Anders & Grevesse 1989),we altered this parameter as well. The carbon isotopic ratiohasvirtually no effect on the model structure and was consequentlyonly considered in the spectral synthesis calculations.
3.3. Determination of abundance ratios
We derive the effective temperatureTeff, the surface gravitylogg, the C/O and12C/13C ratio of our targets by fitting syntheticspectra to the observations. The initial guesses forTeff and loggwere obtained using colour-temperature relations and bolomet-ric corrections from the literature. We converted theK2MASS and(J − K)2MASS values into the Johnson system with the formulaegiven in Carpenter (2001). For the oxygen-rich targets, we esti-matedTeff and logg from the relations given by Houdashelt et al.(2000). In the case of the carbon stars, we utilised the work ofWood et al. (1983) and Bessell et al. (1983) to obtain bolomet-ric corrections (BCK) and effective temperatures, respectively.From theK magnitude together with BCK and the distance mod-ulus (see Sect. 2) we derived logL/L⊙, and subsequently loggwith the obtainedTeff and by assumingM = 1.5 M⊙. Thereddening of this cluster was taken into account, but it is low(E(B − V) = 0.05 andAK = 0.017, Grocholski et al. 2007) andhas no significant influence on the transformations.
For each target we fit the parameters in a two-step process.The idea is to fit the spectral ranges at once rather than tuningindividual abundances (except for carbon) to fit single spectralfeatures. From the H band, we could in this way constrain thestellar parameters (Teff and logg) and the C/O ratio. Variationsin logg had the smallest effect on the synthetic spectra. A smalluncertainty in the stellar mass or radius estimate has thus onlya minor influence on the derived abundance ratios. Using the
3 The Gaussian has the functional formG(∆λ, σ) =
exp{
−(∆λ/σ)2/2}
/(σ√
2π), whereby σR ≡ λ/(2R) to reduce theeffective resolution to a givenR, orσvt ≡ (λ/2)(vt/c) to account for themacroturbulent velocityvt.

Lederer et al.: The puzzling dredge-up pattern in NGC 1978 5
15530 15540 15550 15560 15570 15580 15590 15600
Nor
mal
ised
flux
+ c
onst
.
Wavelength [Å]
Fe12CO 3−0OHOHOH+Fe
CNOHSi+OHTiOHFe
23580 23590 23600 23610 23620 23630 23640 23650 23660 23670
Wavelength [Å]
LE9
LE10
A
LE5
LE4
B
LE6
LE7
LE2
LE3
LE1
13CO13CO13CO+HF13CO13CO13CO13CO13CO
12CO 2−0 P812CO 2−0 P712CO 2−0 P612CO 2−0 P5
Fig. 2. Overview about observations: H-band spectra are shown on the left side, K-band spectra on the right. The spectra are orderedby increasing infrared colour (J−K)2MASS (from top to bottom), respectively. Some features are identified for the oxygen-rich targets(top), for the carbon-star spectra we only indicate the position of the low-excitation CO lines. Data of the target LE8 are not shownas they are of poor quality and we did not derive abundances from them. H-band spectra for the targets LE2 and LE7 could not betaken due to poor weather conditions. See text for details.
parameters as obtained from the H band, we then calculated K-band spectra with a varying12C/13C ratio to determine this pa-rameter as well. The carbon isotopic ratio does not influencetheappearance of the H band spectrum significantly, as was verifiedby test calculations.
To match the shape of the spectral features we also had toassume a macroturbulent velocity which reduces the effectiveresolution of the spectra. This artificial broadening includes theinstrumental profile, but it is also used to imitate at least partlythe dynamical effects in the stellar atmosphere, which becomeincreasingly important for carbon stars. This is also why theadopted values were generally lower for the oxygen-rich tar-gets: they were fitted by applying a macroturbulent velocityofvt = 3 km s−1. The carbon stars displayed a stronger broadeningof the features (cf. Fig. 2). We needed values ofvt = 8 km s−1
and evenvt = 10 km s−1 (LE6) to fit the spectra (comparealso de Laverny et al. 2006 who find comparable values in theirstudy). We consistently applied the same value for the H and theK band.
We tried to objectify the search for the best fit by applying aleast-square fitting method. Although we were in this way ableto narrow down the possible solutions to a few candidate spec-tra quickly, the final decision about our best fit was done by vi-
sual inspection. The reason is that spectral features with afalsestrength or position (both due to imperfect line data) in thesyn-thetic spectrum, or spectral regions with a high noise leveldom-inateχ2 and confuse an automatic minimisation algorithm. Asthe last step in the fitting procedure is done by eye, we assignaformal error to the derived parameters. In the case that the bestfit parameters lie in-between our grid values, we quote the arith-metic mean of the candidate models as our fit result. The errorbars were estimated from the range of parameters of the modelspectra that still gave an acceptable fit.
The formal errors for the derived C/O and12C/13C ratiosgiven in Table 3 compare well with the uncertainties found bysome basic error estimates, as will be shown in the following.Therefore the quintessence of the discussion in Sect. 5 is onasound footing. We consider typical uncertainties in the stellarparameters and investigate the influence on the derived abun-dance ratios. The correlations between the stellar parameters andpossible systematic errors from the model syntheses have notbeen taken into account in the error analysis. For the oxygen-rich case, we start from a baseline model withTeff = 3750 K,vt = 3 km s−1, logg = 0.25, and C/O = 0.15. Changes of∆Teff = 100 K,∆ logg = 0.25, and∆vt = 2 km s−1 correspond

6 Lederer et al.: The puzzling dredge-up pattern in NGC 1978
to changes in∆(C/O) of 0.02, 0.03, and 0.01, respectively4.Summed in quadrature this results in a typical total uncertaintyof 0.04 for the C/O ratio of our M-type targets. The same ex-ercise for the carbon isotopic ratio results in∆(12C/13C) of 2,2, and 3 (parameter dependence as above), and thus a total un-certainty of 4. Concerning the carbon-rich case, we start from acarbon-rich model with parametersTeff = 3350 K, logg = 0.25,vt = 8 km s−1, C/O = 1.40, 12C/13C=175 and vary the pa-rameters as described above. This leads to a total∆(C/O) =√
0.12 + 0.052 + 0.12 = 0.15. For the carbon isotopic ratio wefind∆(12C/13C) =
√152 + 152 + 302 ≃ 37.
A considerable part of our discussion will be concerned withthe 12C/13C ratios of our targets. Since the derived isotopic ra-tios depend on the parameters of the13CO lines (taken from thelist of Goorvitch & Chackerian 1994, see also Appendix A), wewant to assess possible systematic errors in the line strengths. Inthe case that the predicted line strengths in the list are toolarge,one would have to increase12C/13C (equivalent to a decreaseof the 13C abundance) in order to fit a13CO feature comparedwith the case where the predicted strengths are correct. Theac-tual 12C/13C ratio would then be lower than the derived value.For some oxygen-rich stars in our sample we get carbon isotopicratios that are close to the value of the CN cycle equilibrium(4-5). A necessary further reduction is thus not very likely. Ifthetheoretical line strengths are too low, the above argument is re-versed. One would assume a lower12C/13C ratio to fit the13COfeatures, which means that one would underestimate the actualisotopic ratio. Since we, of course, use the same line list for theanalysis of both M and C stars, this would shift up the12C/13Cfor all targets in Figs. 7, 8, and 9. Similar to a logg uncertainty,the values for the carbon stars would be stronger affected. Hence,underestimated13CO line strengths would relax the necessity ofefficient additional mixing processes on the RGB as discussed inSect. 5.
In the next section, we discuss M and C stars separately. Thefeatures contained in the spectra depend on the chemistry regimeand some issues cannot be discussed in a general way.
3.3.1. M-type stars
In the search for a good fit we took advantage of the way featuresreact to parameter changes. An increasing temperature weakensall features in the H band. The OH/Fe blend at approximately15 570 Å is a good temperature indicator. The two neighbour-ing OH lines and the CO band head react less on temperaturechanges. The remaining lines show only a weak dependence onTeff. The K band is largely insensitive to temperature changes,only the 13CO lines show a weak dependence on temperaturewhich adds to the uncertainty in determining the isotopic ra-tio. The only feature strongly reacting when alteringTeff in themodel calculations is the blend including the HF line, its strengthdecreases when the temperature is increased.
An increase in C/O enhances the strength of the CO bandhead and causes stronger CN lines, while the OH lines getslightly weaker, especially the feature blended with an Fe line.Lowering C/O decreases the strength of the CO features in theK band.
The CO band head is also sensitive to changes in logg,while the other features practically are not. Changes in thesur-
4 Note that we also include changes of the macroturbulent velocityin the error analysis. The equivalent width of a spectral line is unaf-fected byvt, but in the spectrum synthesis method uncertainties in thisparameter influence the derived abundances.
face gravity also affect the measured carbon isotopic ratios (seeSect. 3.3). Two of the13CO lines in the spectra of the oxygen-rich stars are unblended (13CO 2-0 R18 and13CO 2-0 R19).Blended13CO features were used to check the isotopic ratio de-rived from the clean lines.
The continuum is well defined in the oxygen-rich case. Weutilised the least-square method in the process of finding the bestfit.
3.3.2. C-type stars
Several things make the fitting of carbon stars more difficultcompared with the case of M-type stars. Foremost, the qualityof the line data for the molecules appearing in the carbon-richcase hampers the qualitative analysis profoundly. For CN, C3,and C2H2 we used the SCAN database (Jørgensen 1997). Theline positions in the computed CN list are not accurate enoughfor modelling high-resolution spectra. With the help of mea-sured line positions for CN that were compiled by Davis et al.(2005), we were able to correct the wavelengths of the strongestlines. While the results were satisfying in the oxygen-richcase,in the carbon-star spectra many additional weak lines show upthat could not be corrected. The case of C2 (we used the linedata from Querci et al. 1974), producing a wealth of spectralfea-tures, is even more problematic: no observed reference linelist isavailable for this molecule, so both line positions and strengthsare subject to large uncertainties. We corrected the line list man-ually by removing strong features that did not appear in any ofour observations. Several features were shifted to other wave-lengths where it was evident from the observations that the linesare at the wrong position. Unlike for M stars, the H-band spec-tra of carbon stars are also affected by the carbon isotopic ra-tio. Lines from13C12C or 13C14N are important in some blends,however, the quality of the line data for these features could notbe assessed for the above described reasons.
The molecules C2H2 and C3 are incorporated into our cal-culations via low-resolution opacity sampling data. The absorp-tion thus becomes manifest as a pseudo-continuum in the spec-tra. A possible occurrence of strong lines or regions with par-ticularly low absorption cannot be reproduced with this ap-proach. The pseudo-continuum level reacts sensitively to tem-perature changes. In general, an increase inTeff reduces the fea-ture strength. The relative changes of different line strength canbe used to constrain the temperature range. The lower the tem-perature gets, the higher the contribution of C2H2 and C3 be-comes, whereas C2H2 dominates the absorption. An increase inthe C/O ratio has the same effect. The implications for abun-dance determination of the ill-defined continuum in carbon starsis discussed in detail in paper I. We want to stress here theconsequences for theχ2 method. The absorption in the pseudo-continuum varies with temperature requiring scaling of theob-served spectrum before a comparison. Due to this scaling thevalue ofχ2 changes in the same manner, so that model spectrawith lower effective temperatures (causing a lower flux level dueto an increased pseudo-continuum) always result in a lowerχ2,pretending to fit the observations better. This is of course an arti-ficial effect, and thus we cannot rely on the least-square methodas objective criterion.
A change in logg has only small effects on the carbon-starspectra. A higher surface gravity produces a higher pseudo-continuum in the K band. In general logg only marginally affectsthe spectral lines. However, in the determination of12C/13C theuncertainty in logg has to be taken into account. In the K band,all 13CO lines are blended with other features. The carbon iso-

Lederer et al.: The puzzling dredge-up pattern in NGC 1978 7
topic ratio is already so high that the strengths of the13CO lineshave become rather insensitive to changes in this parameter. Asa consequence, even the small uncertainties in logg correspondto large changes in the isotopic ratio, which adds to the errors.
Variations of the C/O ratio have the strongest impact on theH-band spectra when C/O is slightly above 1. The strength ofthe CO band head rapidly drops when C/O is increased to 1.3,approximately. Then a saturation sets in and the strength oftheCO band head varies slowly with C/O. This behaviour and strongCN features sitting in the band head hamper an accurate C/Odetermination. The lines of C2 and CN increase in strength whenC/O rises, both in the H and the K band. The CO lines in the Kband decrease in strength for higher values of C/O. The changesare, however, small and do not allow for a determination of theC/O ratio from the K-band spectra alone.
Figure 3 is, as an example, a fit for the star B, which is a car-bon star. The star has an effective temperature of about 3350 K(see also Table 3 for the other fit parameters). The pseudo-continuum contribution is relatively weak, although therearealmost no line-free regions in both spectral bands. A numberof features is successfully reproduced by our models, the devi-ations in other regions are most probably due to uncertain linedata.
To measure the12C/13C ratio in the carbon-star spectra, weutilised the13CO lines at 23 579.9, 23 590.2, and 23 601.0 Å (theleftmost lines indicated in the right panel of Fig. 2). In thevicin-ity of the other13CO lines, there are obviously absorption fea-tures missing in our synthetic spectra (see Fig. 3). We cannot ruleout that our analysis of a limited number of line blends couldin-troduce a systematic error in the inferred carbon isotopic ratios.Therefore, we emphasise that it would be worthwhile to reassessthe isotopic ratios in other wavelength regions, particulary in thelight of the discussion in Sect. 5.
We also identified four low-excitation12CO 2-0 lines in theK band (see also Fig. 2). According to Hinkle et al. (1982), low-excitation lines form in the outer atmospheric layers, oppositeto high-excitation lines that show characteristics similar to sec-ond overtone transitions (∆ν = 3). In all the carbon-star spectra,these lines could not be fitted with our synthetic spectra. Thecalculations underestimate the line strength, suggestingthat theextended atmospheres of luminous carbon stars are not well re-produced by our hydrostatic models.
3.4. Stellar evolutionary models
The stellar evolutionary models presented in this paper havebeen computed with the FRANEC code (Chieffi et al. 1998).The release we are currently using is optimised to properly com-pute low-mass models during their AGB phase. Up-to-date in-put physics, such as low-temperature carbon-enhanced opaci-ties, have been adopted (Cristallo et al. 2007; Lederer & Aringer2009). Physical phenomena, such as hydrodynamical instabil-ities at radiative–convective interfaces and the mass-loss rate,have been properly taken into account (Straniero et al. 2006;Cristallo et al. 2009). The inclusion of an additional mixingmechanism taking place below the convective envelope (usuallyreferred to asextra-mixing) during the RGB and the AGB phasewas described in paper I.
Table 2. Radial velocities of NGC 1978 targets
ID vr[km s−1]A +295.6 ± 1.0LE4 +296.4 ± 0.8LE5 +292.9 ± 0.9LE8 +290.4 ± 1.3LE10 +292.5 ± 0.7
B +290.6 ± 1.3LE1 +297.5 ± 1.6LE3 +291.5 ± 1.9LE6 +290.2 ± 1.7mean +292.9 ± 1.3velocity dispersion (σ) 2.6
4. Results
4.1. Cluster membership
We derived the heliocentric radial velocity by cross-correlatingthe H-band spectra with a template spectrum (using the IRAFtaskfxcor). Data for the star LE9 were taken in the semester2008A, and no radial velocity standard (K-type star) wasrecorded, so no information could be deduced for this target.While the quality of our LE8 data is too low to derive abundanceratios, it is still adequate to measure the radial velocity (onlywith a slightly larger error than for the other targets). Thesam-ple shows a relatively homogeneous radial velocity distribution,the spread is quite narrow, so we conclude that all our targets areactually cluster members. The results are summarised in Table 2.The valuevr = +292.9±1.3 km s−1 (with a velocity dispersion ofσv = 2.6 km s−1) we find is well in line with earlier determina-tions (see Introduction). As a comparison, Carrera et al. (2008)measured radial velocities in four fields with different distancesto the LMC centre. The mean values found in the individualfields range from+278 to+293 km s−1. The velocity dispersionin the metallicity bin with [Fe/H] ≥ −0.5 isσv = 20.5 km s−1.
The errors for the carbon stars are systematically larger thanfor the oxygen-rich stars. This can easily be understood by look-ing at Fig. 2. The features in the C-rich case are usually broaderand consequently the peak in the cross-correlation function (andthus the FWHM) is broader, too.
4.2. Stellar parameters and abundance ratios
We summarise our fit results in Table 3. In the first column,we list the star identifier (compare Fig. 1), followed by theK magnitude and the colour index (J − K) taken from the2MASS database. In the next two columns, we quote the effec-tive temperature and luminosity (rounded to 100L⊙) resultingfrom the respective colour calibrations and bolometric correc-tions (see Sect. 3.3). The parameters resulting from our fittingprocedure (Teff, logg, vt, C/O, 12C/13C) are listed in the subse-quent columns. We note that none of our target stars is a largeamplitude variable, thus the influence of variability on thestel-lar parameters can be safely ignored. A detailed discussionofthe small amplitude variability (1.5 mag inR) will be given else-where (Wood & Lebzelter, in preparation).
The derived effective temperatures are systematically higherthan theTeff values inferred from the infrared colour transfor-mations (compare the resultingTeff,c to Teff,f deduced from thefit in Table 3). Better agreement between the two temperaturescales is found when we adopt a scaled solar oxygen abundance

8 Lederer et al.: The puzzling dredge-up pattern in NGC 1978
0.2
0.4
0.6
0.8
1
15530 15535 15540 15545 15550 15555 15560 15565 15570 15575 15580 15585 15590 15595 15600
H band Observation: NGC1978 − BModel
0.2
0.4
0.6
0.8
1
23580 23585 23590 23595 23600 23605 23610 23615 23620 23625 23630 23635 23640 23645 23650 23655 23660 23665 23670 23675
Nor
mal
ised
flux
Wavelength [Å]
K band
Observation: NGC1978 − BModel
Fig. 3. Observation and fit of the carbon star B in NGC 1978. The fit parameters are given in Table 3. The relatively high effectivetemperature and low C/O ratio compared with the other carbon stars in our sample allowed a reasonable fit. Deviations can to a highfraction be ascribed to uncertain line data. The strong low-excitation CO lines in the K band are not reproduced by the models. Seetext for details.
Table 3. Data and fit results for oxygen-rich (first group) and carbon-rich (second group) targets in NGC 1978
ID K J − K Teff,c L/L⊙ Teff,f logg vt C/O 12C/13C2MASS [K] [K] [km s−1]
A 11.116 1.137 3600 5300 3825 0.50 3 0.23± 0.05 16± 3LE4 11.199 1.148 3600 5000 3725 0.38 3 0.18± 0.03 13± 4LE5 11.387 1.140 3600 4200 3775 0.25 3 0.18± 0.05 6± 2LE9 12.259 1.056 3800 2000 3900 0.38 3 0.13± 0.03 12± 2LE10 11.802 1.115 3700 3300 3900 0.38 3 0.18± 0.05 9± 3
B 11.078 1.289 3176 4400 3350 0.00 8 1.35± 0.10 175± 25LE1 10.467 1.815 2554 6200 2600 0.00 8 > 1.50 > 200LE3 9.676 1.814 2556 12900 2600 0.00 8 > 1.50 > 200LE6 10.707 1.383 3043 5800 3100 0.00 10 1.30± 0.10 150± 50
rather than an over-abundance of 0.2 dex, which was our stan-dard choice in the analysis (we refer to Sects. 1 and 3.2 fordetails). However, this is not too surprising since the colour-temperature relations from Houdashelt et al. (2000) were de-rived from synthetic spectra based on scaled solar abundances.We want to mention that the results from Smith et al. (2002, theirFig. 8) imply [O/Fe]≤ 0.0 for the LMC, contrary to our assump-tion. Also, Mucciarelli et al. (2008) found that the other alphaelement abundances are roughly scaled solar ([α/Fe] ≃ 0.0) inNGC 1978. However, in another recent work Goudfrooij et al.(2009) derived [α/Fe] = 0.2 for the LMC cluster NGC 1846.Apart from the influence on the temperature scale, a higher oxy-gen abundance would shift the derived C/O ratios only to slightlyhigher values (Fig. 4). The derived carbon isotopic ratios aremarginally affected by an oxygen over-abundance.
We found that for the five oxygen-rich stars within our sam-ple the C/O ratio is varying little, the values range from 0.13 to0.18 with a typical uncertainty of±0.05. The isotopic ratios varyin the range between 9 and 16 with an uncertainty ranging up to±4. Considering the error bars, all M stars occupy more or lessthe same region in Fig. 5, where we display the measured C/Oand12C/13C of our sample stars. No target is offset from the spotmarking the abundance ratios expected after the evolution on the
first giant branch (C/O ≃ 0.2, 12C/13C≃ 10). In other words,we do not find conclusive signs of third dredge-up among theoxygen-rich stars in the cluster. This is also consistent with theresults from Lloyd Evans (1983) who did not find S-type starsin NGC 1978. The total number of our targets is small, so gen-eral statements based on our results are rather weak due to thepoor statistics. However, the fact that we find oxygen-rich stars,in which the TDU does not seem to be active, does not excludethat this phenomenon is at work in other stars of the cluster.
In fact, we also identify a sub-sample of carbon-rich starsbelonging to NGC 1978. Satisfactory fits could only be achievedfor the two hottest carbon stars (B and LE6) in our sample. Wealso derived C/O and12C/13C. The error bars are larger thanfor the M stars, the reasons for that are outlined in the previ-ous sections. For the two cool objects LE1 and LE3, we couldonly derive lower limits for C/O and12C/13C. For an increas-ing carbon content, the features saturate, thus we cannot give areliable upper limit for C/O. The C/O ratios that we found arein line with the results obtained by other groups. Matsuura et al.(2005) adopted C/O ≥ 1.4 to explain molecular features in low-resolution spectra of LMC carbon stars. Investigations of plan-etary nebulae in the LMC exhibit a range of C/O ratios fromslightly above 1 up to even 5 (e. g. Stanghellini et al. 2005).We
Lederer et al.: The puzzling dredge-up pattern in NGC 1978 9
0.2
0.3
0.4
0.5
0.6
0.7
0.8
0.9
1
15535 15540 15545 15550 15555 15560 15565 15570 15575 15580 15585 15590 15595
Nor
mal
ised
flux
Wavelength [Å]
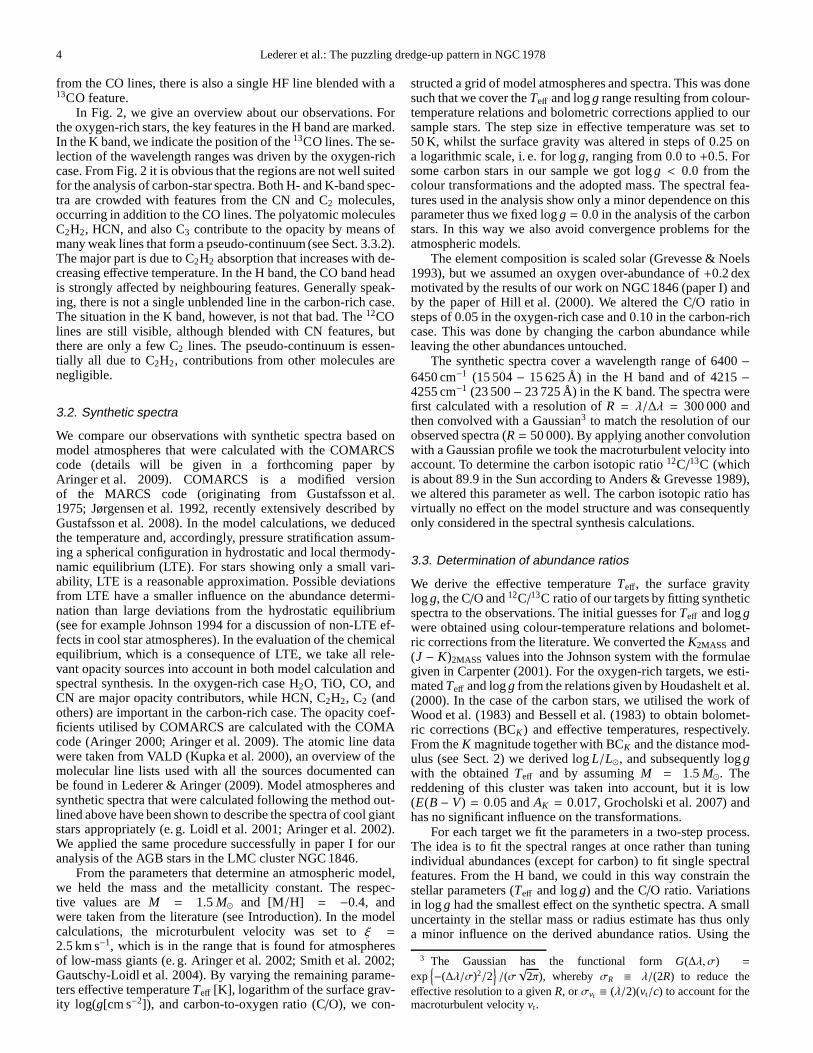
Observation: NGC 1978 − LE5Model: [O/H]=0.0, Teff=3700 K, log g=0.25, C/O=0.20Model: [O/H]=0.2, Teff=3800 K, log g=0.25, C/O=0.15
Fig. 4. Fit of the H band spectrum of the target LE5 adopting different oxygen abundances. A value of [O/Fe]= 0.2 (which we usedin our analysis) leads to a higher temperature and a lower C/O ratio compared with a scaled solar oxygen abundance ([O/Fe]= 0.0).The two model spectra both give reasonable fits to the observations, thus a decision about the actual oxygen abundance cannot bemade from our data. However, lower effective temperatures (and thus the “no oxygen over-abundance” scenario) agree better withthe values derived from colour-temperature relations.
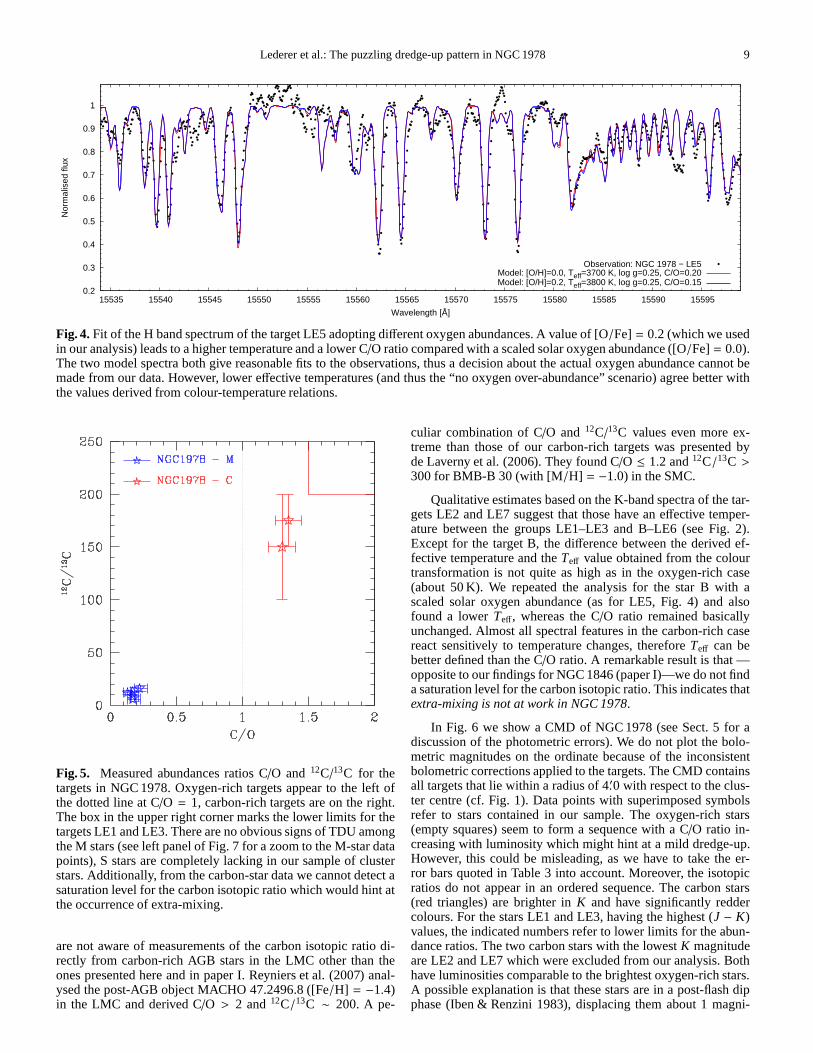
Fig. 5. Measured abundances ratios C/O and12C/13C for thetargets in NGC 1978. Oxygen-rich targets appear to the left ofthe dotted line at C/O = 1, carbon-rich targets are on the right.The box in the upper right corner marks the lower limits for thetargets LE1 and LE3. There are no obvious signs of TDU amongthe M stars (see left panel of Fig. 7 for a zoom to the M-star datapoints), S stars are completely lacking in our sample of clusterstars. Additionally, from the carbon-star data we cannot detect asaturation level for the carbon isotopic ratio which would hint atthe occurrence of extra-mixing.
are not aware of measurements of the carbon isotopic ratio di-rectly from carbon-rich AGB stars in the LMC other than theones presented here and in paper I. Reyniers et al. (2007) anal-ysed the post-AGB object MACHO 47.2496.8 ([Fe/H] = −1.4)in the LMC and derived C/O > 2 and12C/13C ∼ 200. A pe-
culiar combination of C/O and12C/13C values even more ex-treme than those of our carbon-rich targets was presented byde Laverny et al. (2006). They found C/O ≤ 1.2 and12C/13C >300 for BMB-B 30 (with [M/H] = −1.0) in the SMC.
Qualitative estimates based on the K-band spectra of the tar-gets LE2 and LE7 suggest that those have an effective temper-ature between the groups LE1–LE3 and B–LE6 (see Fig. 2).Except for the target B, the difference between the derived ef-fective temperature and theTeff value obtained from the colourtransformation is not quite as high as in the oxygen-rich case(about 50 K). We repeated the analysis for the star B with ascaled solar oxygen abundance (as for LE5, Fig. 4) and alsofound a lowerTeff, whereas the C/O ratio remained basicallyunchanged. Almost all spectral features in the carbon-richcasereact sensitively to temperature changes, thereforeTeff can bebetter defined than the C/O ratio. A remarkable result is that —opposite to our findings for NGC 1846 (paper I)—we do not finda saturation level for the carbon isotopic ratio. This indicates thatextra-mixing is not at work in NGC 1978.
In Fig. 6 we show a CMD of NGC 1978 (see Sect. 5 for adiscussion of the photometric errors). We do not plot the bolo-metric magnitudes on the ordinate because of the inconsistentbolometric corrections applied to the targets. The CMD containsall targets that lie within a radius of 4.′0 with respect to the clus-ter centre (cf. Fig. 1). Data points with superimposed symbolsrefer to stars contained in our sample. The oxygen-rich stars(empty squares) seem to form a sequence with a C/O ratio in-creasing with luminosity which might hint at a mild dredge-up.However, this could be misleading, as we have to take the er-ror bars quoted in Table 3 into account. Moreover, the isotopicratios do not appear in an ordered sequence. The carbon stars(red triangles) are brighter inK and have significantly reddercolours. For the stars LE1 and LE3, having the highest (J − K)values, the indicated numbers refer to lower limits for the abun-dance ratios. The two carbon stars with the lowestK magnitudeare LE2 and LE7 which were excluded from our analysis. Bothhave luminosities comparable to the brightest oxygen-richstars.A possible explanation is that these stars are in a post-flashdipphase (Iben & Renzini 1983), displacing them about 1 magni-

10 Lederer et al.: The puzzling dredge-up pattern in NGC 1978
Fig. 6. Colour-magnitude diagram based on 2MASS data forNGC 1978 (complete within a radius of 4.′0 with respect to thecluster centre). Empty squares refer to oxygen-rich objects inour sample, filled triangles depict carbon stars. Compare alsoTable 3. Details are discussed in the text.
tude down from the average luminosity in this evolutionary stagein the CMD (see also the discussion in paper I).
5. Discussion
We seek to explain the following observed features ofNGC 1978:
1. The cluster harbours carbon stars.2. The M stars do not show conclusive signs of third dredge-up.3. There is no saturation of the carbon isotopic ratio.
Except for the first point, this is more or less the opposite ofwhat we found for the cluster NGC 1846 (paper I), the composi-tion of which is similar to the one of NGC 1978, even if the GCis slightly younger and, as a consequence, harbours more mas-sive AGB stars (with a mass of about 1.8 M⊙). The M stars inNGC 1846 span a range in C/O from 0.2 to 0.65, and12C/13C—initially rising together with C/O—does not exceed 60 to 70,even in the carbon stars.
The first point in the list is a clear indication of ongoing TDUin the cluster. The second point may at first seem to contrast thisstatement, while low number statistics could resolve this appar-ent contradiction: the lifetime of a thermally pulsing AGB staris short, so in a sample of a few stars we do not necessarily haveto find a star with an enhanced carbon abundance. This possiblyexplains the large gap between the M and the C stars in terms ofC/O (see Fig. 5). An alternative scenario where the TDU is so ef-ficient that the star becomes carbon-rich after a single dredge-upepisode occurs only at much lower metallicity (e. g. Herwig et al.2000).
Let us put aside the C/O error bars for a moment and spec-ulate about the group of M stars. The 2MASS data come withuncertainties inK of lower than 0.05, except for LE10 where
the error is 0.076.5 In any case, the luminosity sequence thatthe stars form is conserved. The star LE9 is the faintest atK,with mK = 12.3, in the sample and also the star with the lowestC/O ratio. Cioni et al. (2000) identify the RGB tip in the LMCat K0 = 12.1 mag. According to this value, LE9 could as well bean RGB star or located at the early-AGB. The targets LE5 andLE10 are possibly at the very beginning of the thermally pulsingasymptotic giant branch (TP-AGB) star phase. The case of LE4and, in particular, A is more difficult. Comparing these stars withthose of similar luminosity in the sample of NGC 1846, we notethat the latter are classified as S stars and present C/O ratios of0.4 or even higher. The C/O ratio we find for the star A (0.23) isslightly higher than the average of the other stars, perhapscom-patible with just one (the first) TDU episode. The bolometricmagnitude of A also roughly corresponds to the limit we foundfor the onset of the TDU in NGC 1846 (mbol = 14.1 mag).
5.1. Stellar evolutionary models
In this section we present theoretical tracks computed withtheFRANEC code, and we compare them with observations. In theleft panel of Fig. 7, we report the evolution of the12C/13C ver-sus C/O curves from the pre-main sequence up to the early-AGBphase in the region where the M stars of NGC 1978 lie. In prac-tice, the end point of each curve (marked by a symbol in the leftpanel of Fig. 7) represents the value attained at the tip of theRGB phase, which is conserved up to the onset of the first ther-mal pulse. In the right panel, instead, we extend the axes to alsoinclude the C-rich stars. We plot the whole AGB evolutionarytracks and mark the values attained after each TDU episode.
We firstly concentrate on the O-rich stars of our sample.We carry on our analysis under the assumption that these starshave not experienced TDU, because they still are at the begin-ning of the TP-AGB phase or because they arrived on the AGBwith a too small envelope mass. In this case, their initial surfacecomposition has been modified by the occurrence of the FirstDredge-up (FDU) only and, eventually, by an additional slowmixing operating below the convective envelope during the RGBphase (the so calledextra-mixing, see e. g. Nollett et al. 2003;Charbonnel & Zahn 2007; Denissenkov & Pinsonneault 2008).Our reference model (ST, dash-dotted magenta curve) has aninitial mass M = 1.5 M⊙ with Z = 0.006, corresponding to[Fe/H] = −0.36. We assume an initial solar-scaled composition,which implies C/O = 0.5 and12C/13C = 90. After the FDU,the surface values attain C/O = 0.36 and12C/13C = 24. Thisis due to the fact that the convective envelope penetrates into re-gions where partial hydrogen-burningoccurred before. No extra-mixing has been included in the ST case. The values so obtainedclearly disagree with the M stars observations, which show anaverage C/O = 0.18 and an average12C/13C = 11. Thus, weexplored the possibility of an occurrence of extra-mixing on theRGB.
This hypothesis is supported by the bulk of observations ofRGB stars in the galactic field, as well as in open and globularclusters (see e. g. Gratton et al. 2000). These observationsshowthat this additional mixing occurs in low-mass stars (M < 2 M⊙)during the first ascent along the Red Giant Branch. Moreover,Eggleton et al. (2008) identified a mixing mechanism driven bya molecular weight inversion (δµ-mixing) in three-dimensionalstellar models that must operate in all low-mass stars whilethey
5 The errors for (J − K) are higher, ranging up to and being evengreater than 0.1. This could also affect the differences between the ef-fective temperature scales discussed in Sect. 4.

Lederer et al.: The puzzling dredge-up pattern in NGC 1978 11
Fig. 7. Comparison between observational data and theoretical models.12C/13C isotopic ratios vs. C/O ratios are reported. In theleft panel we report the range of O-rich stars only, while in the right panel the whole sample has been considered. The starsymbolswith error bars indicate our observations. The red dotted, the blue dashed, and the green long-dashed curves in the left panel arepartly covered by other tracks in the plot. The symbols in theleft panel mark the end point of the tracks after the RGB phase. In theright panel, the symbols indicate the values attained during the interpulse phases, which are on the order of 103 times longer thanthe TDU episodes. See text for details.
are on the RGB. The operation of this RGB extra-mixing is alsorequired to explain the relatively low12C/13C ratios in the Mstars of NGC 1846 (paper I).
As in paper I, we include this additional mixing right afterthe RGB luminosity bump. The extension of the zone in whichthis additional mixing takes place is fixed by prescribing themaximum temperature the material is exposed to (T max
RGB). Thecirculation rate is tuned by setting the mixing velocity to avaluethat is a small fraction (cf. paper I) of the typical convective ve-locities in the envelope of an RGB star. As discussed in paperI,the carbon isotopic ratio largely depends onT max
RGB. In Fig. 7 wereport two models, characterised byT max
RGB = 2.0 × 10⁷ K (reddotted curve) andT max
RGB = 2.5×10⁷ K (blue short-dashed curve).In the first case, the final12C/13C ratio decreases, reaching avalue in good agreement with those observed in the M stars ofNGC 1978. Notwithstanding, the C/O ratio remains unalteredand higher than the observed one. An increase ofT max
RGB up to2.5 × 107 K leads to a lower C/O ratio of about 0.21, which isin better agreement with the observations. However, the corre-sponding12C/13C ratio is 5, which is definitely lower than theaverage value (11). Note that only LE5 shows such a low value(12C/13C = 6).
Then, we explored the possible effect of an oxygen enhance-ment (see the discussion in Sect. 2.1). The black solid linein Fig. 7 represents a model similar to the ST case, but with[O/Fe] = 0.2. As for the ST case, the effects of the FDU areclearly recognisable. An additional model, as obtained by in-cluding an RGB extra-mixing (T max
RGB = 2.1× 10⁷ K) is also re-ported (green line). The final surface composition of this model(C/O = 0.23 and12C/13C = 13) is close to the average val-ues of the observed sample (C/O = 0.18 and12C/13C = 11).Thus, a first conclusion is that moderate RGB extra-mixing
(2.1× 10⁷ < T maxRGB < 2.3× 10⁷ K) coupled to moderate oxygen
enhancement appears to nicely reproduce the observed averagecomposition of the M stars in NGC 1978. The same conclusionhas been reached in the case of NGC 1846 (paper I).
What are the implications of this scenario when applied tothe whole observational sample (O-rich and C-rich stars)? Wecarry on our analysis assuming that the carbon stars are intrinsic,i. e. that their surface composition, in particular the highC/Oand carbon isotopic ratios, is the result of nucleosynthesis andmixing processes occurring during the thermally pulsing AGBevolution.
In the right panel of Fig. 7 we report the same models asshown in the left panel. None of the theoretical tracks can si-multaneously reproduce the abundance ratios of the M and Cstars. The high values of the C-star carbon isotopic ratio canonly be reproduced by the oxygen-enhancedmodel with no RGBextra-mixing. All the other models predict too low12C/13C ra-tios. The situation appears even more peculiar when comparedwith the case of NGC 1846, for which we found C stars withhigher values of C/O, but with 12C/13C between 60 and 70,so that an AGB extra-mixing (in addition to the RGB extra-mixing) was invoked to reproduce the observations. The vastdifference between the two clusters is illustrated in Fig. 8. Inthe left panel, data for NGC 1978 are compared with three mod-els computed under different assumptions for the RGB and theAGB extra-mixing, namely no extra-mixing (black-solid line),moderate RGB extra-mixing only (green-long-dashed line),andmoderate AGB extra-mixing only (blue-dashed line). All thethree models haveM = 1.5 M⊙ and [O/Fe] = 0.2. In the rightpanel, data for NGC 1846 are compared with similar models.In this case, the mass is 1.8 M⊙ and the red-dashed line refersto a model with both RGB and AGB extra-mixing (see paper I

12 Lederer et al.: The puzzling dredge-up pattern in NGC 1978
for more details on models with AGB extra-mixing). In sum-mary, the high carbon isotopic ratio observed for the C starsofNGC 1978 (12C/13C > 150) rules out both RGB and AGB extra-mixing, which are instead required to reproduce the evolutionarysequence of M, S, and C stars in NGC 1846.
5.2. Alternative scenarios
In the previous section, we did not identify a theoretical sce-nario that satisfactorily reproduces the whole set of starsbe-longing to NGC 1978 (including both the O-rich and the C-rich sub-sample). Moreover, the intermediate-age LMC clusterNGC 1846, which we investigated in paper I, presents a totallydifferent abundance pattern, which cannot be ascribed to thesame theoretical scenario. The lack of S stars is an additionalpeculiarity of NGC 1978. So far, our arguments have been basedon the assumption that the stars in our sample possess the sameinitial composition, mass, and age so that they form an evolution-ary sequence, in which the variations of the surface compositionare due to intrinsic processes only. In this section, we speculateabout possible alternative scenarios, namely:
1. the existence of two stellar populations having different ages;2. the existence of rejuvenated stars;3. the activation of additional mixing at the base of the convec-
tive zones generated by a thermal pulse.
The existence of two populations proposed by Alcaıno et al.(1999) is an attractive possibility, because it might explain thedichotomy between the M and the C stars. The M stars wouldthen belong to the older population. Their mass is sufficientlylow for the occurrence of the RGB extra-mixing, but too low forthe occurrence of the TDU during the AGB. On the contrary, theC stars are younger (less than 1 Gyr) and more massive (M >2 M⊙). For these stars, the persistence of theµ-barrier at the baseof the hydrogen-rich envelope prevented the RGB extra-mixing,whilst, during the AGB, TDU accounts for the observed largeC enhancement. However, this scenario seems unlikely. First ofall, a number of other studies did not find significant metallicity,mass or age differences. Second, a cluster merger creating twopopulations is not considered to be a valid option (see Sect.2).Alcaıno et al. (1999) argue that the north-western half could bemore metal-rich and maybe slightly younger. The distribution ofour targets in Fig. 1 does not support this idea. The M stars aredistributed equally around the cluster centre. The carbon stars inour sample lie either in the centre or in the south-eastern half ofthe cluster. According to Lloyd Evans (1980), there is anothercarbon star (LE11) located in the north-western half. Althoughthe C stars appear to line up along the cluster’s major axis, thereis no indication that they concentrate in a certain region. Awidespread in metallicity would have shown up in the fitting process,yet we were able to obtain reasonable results for both oxygen-rich stars and the hottest carbon-stars with a single value for themetallicity.
The scenario of a single age stellar population does not ex-clude the existence of rejuvenated stars. Merging, coalescence,or mass accretion processes are often invoked to explain theBlueStragglers observed in many GCs. Actually, a non-negligiblenumber of stars lie above the turn-off and the sub-giant branch inthe colour-magnitude diagram of NGC 1978 (Mucciarelli et al.2007a), although we cannot exclude that those are field starsor the result of unresolved pairs. If the product of one of theabove mentioned processes is a star with a mass larger than2 M⊙, or if the rejuvenating process leaves the envelope com-position enriched with heavy elements, the efficiency of the
Fig. 9. 12C/13C isotopic ratio vs. C/O ratio for a series of mod-els including an overshoot at the base of convective zone gener-ated by the TPs. The extension (in fraction of the pressure scaleheight) of the overshoot zone is indicated in the legend.
RGB extra-mixing is significantly reduced (Charbonnel & Zahn2007). Such a scenario might explain the high carbon isotopicratio of the C stars, but the lack of S stars remains a mystery.6
Moreover, even if we do not have a detailed statistics of the num-ber of binary systems in NGC 19787, it seems unlikely that twomerger events occur nearly simultaneously to produce the starsB and LE6, for instance.
The last alternative scenario we have investigated regardsthepossible modification of the efficiency of the mixing processestaking place during the AGB phase, which is responsible for theincrease of12C and16O in the envelope. A deeper TDU wouldincrease both the carbon isotopic ratio and the C/O ratio, thusleaving the slope of the curves in the right panel of Fig. 7 unal-tered. In this scenario, the possibility of producing S stars as aconsequence of the TDU is reduced, since the transition to theC-star stage is more rapid. We recall that the TDU depth ba-sically depends on the strength of the thermal pulses: strongerTPs push outward the external layers more easily, thereforein-ducing deeper dredge-up episodes. In turn, the strength of ather-mal pulse depends on many physical and chemical properties,such as the core and the envelope mass, or the CNO content inthe envelope (Straniero et al. 2003). On the other hand, an in-crease of the primary oxygen that is dredged up might limit theincrease of the C/O at the surface and steepen the12C/13C-C/Orelation. The fraction of oxygen produced by the12C + α reac-tion increases toward the centre. Therefore, an additionalmixingprocess, as due to a ballistic overshoot or to non-standard mech-anisms (such as rotation or magnetic kick), that moves primaryO (and C) from the deep interior to the He-rich inter-shell, may
6 Note that our sample contains almost all AGB stars in this cluster(see Fig. 6).
7 Estimated binary fractions in other LMC and SMC clusters rangefrom 10 (NGC 1783, Mucciarelli et al. 2007b) to≤ 30 per cent(Chiosi & Vallenari 2007).

Lederer et al.: The puzzling dredge-up pattern in NGC 1978 13
Fig. 8. Comparison between observational data and theoretical models.12C/13C isotopic ratios vs. C/O ratios are reported. In theleft panel, we report observational data of the cluster NGC 1978, accompanied by selected theoretical tracks. As a comparison, inthe right panel, we report the fitting curve for another LMC cluster (NGC 1846). The symbols along the tracks indicate the valuesattained during the interpulse phases (see also Fig. 7). Thestar symbols with error bars indicate our observations. Seetext for details.
indirectly explain the high carbon isotopic ratio of the carbonstars in NGC 1978. To shed light on this possibility, we com-puted some additional models, in which we applied an artificialovershoot at the base of the convective zone generated by theTPs. The initial mass adopted in the models is 1.5 M⊙, and theinitial composition is oxygen-enhanced (+0.2 dex). A moderateRGB extra-mixing (T max
RGB = 2.1 × 10⁷ K, corresponding to thecase of the green long-dashed line in Fig. 7) has been included.We parametrise the additional mixing by limiting the extensionof the overshoot layer to a fraction of the pressure scale heightof the most internal convective mesh point. In Fig. 9, we reportthe resulting12C/13C isotopic ratios as a function of C/O.
Even if these models apparently provide a simultaneous re-production of the composition of both M and C stars, we have tostress the theoretical and observational evidence againstsuch aprocess. At the He-flash peak, the inner border of the convectivezone already reaches the layer where the temperature attains itsmaximum value. Below this point, due to the neutrino energyloss, the temperature (and the entropy) decreases, so that thedeceleration due to the buoyancy is quite strong. Herwig et al.(2006) showed that even if the pressure and the entropy barrierat the base of the convective shell generated by a TP is stiff, con-vective plumes can penetrate into the underlying radiativelayersdue tog-mode oscillations. These structures reach down to about2×108 cm below the formal convective border (see their Fig. 24),and develop mean vertical velocities that are about 1000 timeslower than the average convective velocities. The extension ofthis penetration has the same order of magnitude as the over-shoot zone in our models, namely 1.0 × 107 cm, 1.2 × 108 cm,and 1.5 × 108 cm, for 0.25 HP, 0.35 HP, and 0.5 HP, respec-tively (these are mean values). However, if in our 1D modelsthe whole mass of the spherical overshoot region is efficientlymixed, the amount of mass contained in the penetrating plumesof the 3D model is certainly lower. In addition, the result ofthe
3D model may be affected by the assumed boundary conditions.As was stressed by Herwig et al. (2006), their models ignoreµ-gradients, which increase the stability and reduce mixing acrossthe formal convective boundaries. Moreover, they found that theamplitude of the gravity waves depends both on the resolutionadopted in the simulation and on the choice of the heating rate.
On the other hand, the bulk of the C stars in the Milky Wayas well as those in NGC 1846 have12C/13C ratios in the rangefrom 40 to 70, and only in a few cases up to 100 (Lambert et al.1986). This occurrence leads us to the conclusion that such anovershoot is supposedly an uncommon process. Note that theoccurrence of an overshoot below the convective zone generatedby a TP causes considerable changes of the physical conditionsin the He-rich inter-shell. In particular, higher temperatures de-velop at the pulse peak and, therefore, the22Ne(α, n)25Mg reac-tion rate becomes an important neutron source, even in low-massAGB stars. In such a case, the resultings-process nucleosynthe-sis would be characterised by an overproduction of neutron-richisotopes. For instance, the expected isotopic compositions ofstrontium, zirconium, molybdenum, and barium would substan-tially differ from those measured in pre-solar SiC grains, whichwere produced in the cool circumstellar envelope of a past gen-eration of C stars (see Lugaro et al. 2003). Additionally, calcu-lated element abundances ratios such as Rb/Sr would not matchobservations obtained from carbon stars (see Abia et al. 2001).For these reasons, if the overshoot from the base of the convec-tive zone generated by TPs is non-negligible, it should be a rareevent.
In summary, a clear and coherent picture of the AGB starsin the cluster NGC 1978 within the more general context of low-mass AGB stellar evolution and nucleosynthesis cannot be eas-ily achieved. Once again, we stress the uniqueness of the C starsample of NGC 1978 with respect to other LMC clusters.

14 Lederer et al.: The puzzling dredge-up pattern in NGC 1978
6. Conclusions
In this paper, we presented a sample of AGB stars belonging tothe LMC cluster NGC 1978. Where it was possible, we derivedthe C/O and the12C/13C ratios. The spectroscopic data revealthe presence of two sub-samples, one where C/O < 1 in the stel-lar atmosphere (oxygen-rich or M-type stars), and the otherwithC/O > 1 (carbon-rich or C-type stars). The oxygen-rich starspresent low values for the C/O ratio (mean value 0.18) and the12C/13C ratio (mean value 11). The spread in the C/O ratio is re-stricted, all values are consistent with the mean value within theerror bars. We observe a wider spread in the12C/13C ratios. Weconclude from the spectroscopic data in comparison to our evo-lutionary models that the TDU mechanism is not (yet) workingin these stars. The carbon-rich stars of our sample instead showC/O values and12C/13C ratios consistent with the occurrence ofTDU. A lack of S stars, with C/O ratios between those of theO-rich stars and the C-rich stars, has been highlighted.
We did not find a theoretical scheme that is able to satisfacto-rily reproduce the chemical abundance pattern in NGC 1978. Byclaiming the existence of a non-standard mixing mechanism,wepostulated some possible solutions. However, we are aware thattoo manyad hoc assumptions make our analysis objectionable,taking into account that some of them are strongly limited byobservational constraints. In particular, a more consistent pictureof all the additional mixing mechanisms, which are active duringthe RGB and the AGB phase, is required. We also discussed thescenario of multiple stellar populations and rejuvenated stars,and highlighted the differences to the abundance pattern in thecluster NGC 1846.
Narrower constraints for stellar evolutionary models couldbe derived from atmospheric models including a set of accu-rate molecular line data, especially in the case of carbon stars.Additionally, the more evolved a star is (thus having a higher lu-minosity and C/O ratio), the more dynamic effects influence thespectral appearance. From the observational point of view,im-provements could be achieved by means of the choice of the ob-served wavelength regions, some of which are less crowded withmolecular lines. Moreover a comparison between low-resolutiondata and high-resolution data should be explored further (cf.Wahlin et al. 2006). If low-resolution data deliver robust C/O ra-tios (and stellar parameters), the isotopic ratios could bederivedin the high-resolution spectra more accurately.
In conclusion, we affirm that there is much room for im-provement. As a first step, we are currently acquiring new datato increase our statistics by studying more AGB stars in otherLMC globular clusters. In this way, we could shed light on thepuzzling abundance pattern that we found in NGC 1978.
Acknowledgements. MTL and TL acknowledge funding by the Austrian ScienceFund FWF (projects P-18171 and P-20046). MTL has been supported by theAustrian Academy of Sciences (DOC programme). OS and SC havebeensupported by the MIUR Italian Grant Program PRIN 2006. BA acknowl-edges funding by the Austrian Science Fund FWF (project P-19503). Basedon observations obtained at the Gemini Observatory, which is operated by theAssociation of Universities for Research in Astronomy, Inc., under a coopera-tive agreement with the NSF on behalf of the Gemini partnership: the NationalScience Foundation (United States), the Science and Technology FacilitiesCouncil (United Kingdom), the National Research Council (Canada), CONICYT(Chile), the Australian Research Council (Australia), Ministerio da Cienciae Tecnologia (Brazil) and Ministerio de Ciencia, Tecnolog´ıa e InnovacionProductiva (Argentina). The observations were obtained with the Phoenix in-frared spectrograph, which was developed and is operated bythe NationalOptical Astronomy Observatory. The spectra were obtained as part of the pro-grams GS-2006B-C-6 and GS-2008A-Q-65. This publication makes use ofdata products from the Two Micron All Sky Survey, which is a joint projectof the University of Massachusetts and the Infrared Processing and Analysis
Center/California Institute of Technology, funded by the NationalAeronauticsand Space Administration and the National Science Foundation.
ReferencesAbia, C., Busso, M., Gallino, R., et al. 2001, ApJ, 559, 1117Alcaıno, G., Liller, W., Alvarado, F., et al. 1999, A&AS, 135, 103Anders, E. & Grevesse, N. 1989, Geochim. Cosmochim. Acta, 53, 197Aringer, B. 2000, PhD thesis, University of ViennaAringer, B., Girardi, L., Nowotny, W., Marigo, P., & Lederer, M. T. 2009, ArXiv
e-prints 0905.4415Aringer, B., Kerschbaum, F., & Jørgensen, U. G. 2002, A&A, 395, 915Bessell, M. S., Wood, P. R., & Evans, T. L. 1983, MNRAS, 202, 59Bonnarel, F., Fernique, P., Bienayme, O., et al. 2000, A&AS, 143, 33Busso, M., Gallino, R., & Wasserburg, G. J. 1999, ARA&A, 37, 239Carpenter, J. M. 2001, AJ, 121, 2851Carrera, R., Gallart, C., Hardy, E., Aparicio, A., & Zinn, R.2008, AJ, 135, 836Castellani, V., Degl’Innocenti, S., Marconi, M., Prada Moroni, P. G., & Sestito,
P. 2003, A&A, 404, 645Chandra, S., Maheshwari, V. U., & Sharma, A. K. 1996, A&AS, 117, 557Charbonnel, C. & Zahn, J.-P. 2007, A&A, 467, L15Chieffi, A., Limongi, M., & Straniero, O. 1998, ApJ, 502, 737Chiosi, E. & Vallenari, A. 2007, A&A, 466, 165Cioni, M.-R. L., van der Marel, R. P., Loup, C., & Habing, H. J.2000, A&A,
359, 601Cole, A. A., Tolstoy, E., Gallagher, III, J. S., & Smecker-Hane, T. A. 2005, AJ,
129, 1465Cristallo, S., Straniero, O., Gallino, R., et al. 2009, ApJ in pressCristallo, S., Straniero, O., Lederer, M. T., & Aringer, B. 2007, ApJ, 667, 489Davis, S., Wallace, L., Brault, J., & Engleman, R. 2005, The CN spectrum from
the infrared to the ultraviolet (NSO Technical Report)de Laverny, P., Abia, C., Domınguez, I., et al. 2006, A&A, 446, 1107Denissenkov, P. A. & Pinsonneault, M. 2008, ApJ, 684, 626Eggleton, P. P., Dearborn, D. S. P., & Lattanzio, J. C. 2008, ApJ, 677, 581Ferraro, F. R., Mucciarelli, A., Carretta, E., & Origlia, L.2006, ApJ, 645, L33Fischer, P., Welch, D. L., & Mateo, M. 1992, AJ, 104, 1086Frogel, J. A., Mould, J., & Blanco, V. M. 1990, ApJ, 352, 96Gautschy-Loidl, R., Hofner, S., Jørgensen, U. G., & Hron, J. 2004, A&A, 422,
289Girardi, L., Chiosi, C., Bertelli, G., & Bressan, A. 1995, A&A, 298, 87Goorvitch, D. 1994, ApJS, 95, 535Goorvitch, D. & Chackerian, Jr., C. 1994, ApJS, 91, 483Goudfrooij, P., Puzia, T. H., Kozhurina-Platais, V., & Chandar, R. 2009, AJ, 137,
4988Gratton, R. G., Carretta, E., Matteucci, F., & Sneden, C. 2000, A&A, 358, 671Grevesse, N. & Noels, A. 1993, Physica Scripta Volume T, 47, 133Grocholski, A. J., Sarajedini, A., Olsen, K. A. G., Tiede, G.P., & Mancone, C. L.
2007, AJ, 134, 680Gustafsson, B., Bell, R. A., Eriksson, K., & Nordlund, A. 1975, A&A, 42, 407Gustafsson, B., Edvardsson, B., Eriksson, K., et al. 2008, A&A, 486, 951Harris, M. J., Lambert, D. L., Hinkle, K. H., Gustafsson, B.,& Eriksson, K.
1987, ApJ, 316, 294Herwig, F. 2000, A&A, 360, 952Herwig, F., Blocker, T., & Driebe, T. 2000, Memorie della Societa Astronomica
Italiana, 71, 745Herwig, F., Freytag, B., Hueckstaedt, R. M., & Timmes, F. X. 2006, ApJ, 642,
1057Hill, V., Francois, P., Spite, M., Primas, F., & Spite, F. 2000, A&A, 364, L19Hinkle, K., Wallace, L., & Livingston, W. C. 1995, Infrared atlas of the Arcturus
spectrum, 0.9-5.3 microns (San Francisco, Calif.: Astronomical Society ofthe Pacific)
Hinkle, K. H., Blum, R. D., Joyce, R. R., et al. 2003, in Society of Photo-OpticalInstrumentation Engineers (SPIE) Conference Series, Vol.4834, Societyof Photo-Optical Instrumentation Engineers (SPIE) Conference Series, ed.P. Guhathakurta, 353–363
Hinkle, K. H., Cuberly, R. W., Gaughan, N. A., et al. 1998, in Presented atthe Society of Photo-Optical Instrumentation Engineers (SPIE) Conference,Vol. 3354, Proc. SPIE Vol. 3354, p. 810-821, Infrared AstronomicalInstrumentation, Albert M. Fowler; Ed., ed. A. M. Fowler, 810–821
Hinkle, K. H., Hall, D. N. B., & Ridgway, S. T. 1982, ApJ, 252, 697Houdashelt, M. L., Bell, R. A., Sweigart, A. V., & Wing, R. F. 2000, AJ, 119,
1424Iben, Jr., I. & Renzini, A. 1983, ARA&A, 21, 271Johnson, H. B. 1994, in Lecture Notes in Physics, Berlin Springer Verlag, Vol.
428, IAU Colloq. 146: Molecules in the Stellar Environment,ed. U. G.Jorgensen, 234

Lederer et al.: The puzzling dredge-up pattern in NGC 1978 15
Jørgensen, U. G. 1997, in IAU Symposium, Vol. 178, IAU Symposium, ed. E. F.van Dishoeck, 441–456
Jørgensen, U. G., Johnson, H. R., & Nordlund, A. 1992, A&A, 261, 263Karakas, A. & Lattanzio, J. C. 2007, Publications of the Astronomical Society
of Australia, 24, 103Kupka, F. G., Ryabchikova, T. A., Piskunov, N. E., Stempels,H. C., & Weiss,
W. W. 2000, BaltA, 9, 590Lambert, D. L., Gustafsson, B., Eriksson, K., & Hinkle, K. H.1986, ApJS, 62,
373Lebzelter, T., Lederer, M. T., Cristallo, S., et al. 2008, A&A, 486, 511Lederer, M. T. & Aringer, B. 2009, A&A, 494, 403Lloyd Evans, T. 1980, MNRAS, 193, 87Lloyd Evans, T. 1983, MNRAS, 204, 985Loidl, R., Lancon, A., & Jørgensen, U. G. 2001, A&A, 371, 1065Lugaro, M., Davis, A. M., Gallino, R., et al. 2003, ApJ, 593, 486Mackey, A. D. & Broby Nielsen, P. 2007, MNRAS, 379, 151Matsuura, M., Zijlstra, A. A., van Loon, J. T., et al. 2005, A&A, 434, 691McSaveney, J. A., Wood, P. R., Scholz, M., Lattanzio, J. C., &Hinkle, K. H.
2007, MNRAS, 378, 1089Mucciarelli, A., Carretta, E., Origlia, L., & Ferraro, F. R.2008, AJ, 136, 375Mucciarelli, A., Ferraro, F. R., Origlia, L., & Fusi Pecci, F. 2007a, AJ, 133, 2053Mucciarelli, A., Origlia, L., & Ferraro, F. R. 2007b, AJ, 134, 1813Nollett, K. M., Busso, M., & Wasserburg, G. J. 2003, ApJ, 582,1036Olszewski, E. W., Schommer, R. A., Suntzeff, N. B., & Harris, H. C. 1991, AJ,
101, 515Piotto, G., Bedin, L. R., Anderson, J., et al. 2007, ApJ, 661,L53Querci, F., Querci, M., & Tsuji, T. 1974, A&A, 31, 265Renzini, A. 2008, MNRAS, 391, 354Reyniers, M., Abia, C., van Winckel, H., et al. 2007, A&A, 461, 641Schommer, R. A., Suntzeff, N. B., Olszewski, E. W., & Harris, H. C. 1992, AJ,
103, 447Skrutskie, M. F., Cutri, R. M., Stiening, R., et al. 2006, AJ,131, 1163Smith, V. V., Hinkle, K. H., Cunha, K., et al. 2002, AJ, 124, 3241Smith, V. V. & Lambert, D. L. 1990, ApJS, 72, 387Stancliffe, R. J., Tout, C. A., & Pols, O. R. 2004, MNRAS, 352, 984Stanghellini, L., Shaw, R. A., & Gilmore, D. 2005, ApJ, 622, 294Straniero, O., Chieffi, A., Limongi, M., et al. 1997, ApJ, 478, 332Straniero, O., Domınguez, I., Cristallo, R., & Gallino, R.2003, Publications of
the Astronomical Society of Australia, 20, 389Straniero, O., Gallino, R., & Cristallo, S. 2006, Nuclear Physics A, 777, 311van den Bergh, S. 2008, AJ, 135, 1731Wahlin, R., Eriksson, K., Gustafsson, B., et al. 2006, Memorie della Societa
Astronomica Italiana, 77, 955Wasserburg, G. J., Boothroyd, A. I., & Sackmann, I.-J. 1995,ApJ, 447, L37Wilson, R. E. 1953, General catalogue of stellar radial velocities. (Washington,
[Carnegie Institution of Washington] 1953.)Wood, P. R., Bessell, M. S., & Fox, M. W. 1983, ApJ, 272, 99Yong, D., Melendez, J., Cunha, K., et al. 2008, ApJ, 689, 1020
Appendix A: Changes to the CO line list
To match the positions of the CO lines in the recorded K-bandspectra, we had to modify some transition frequencies as given inthe list of Goorvitch (1994)8. The wavenumbers were taken fromthe Infrared Atlas of the Arcturus Spectrum (Hinkle et al. 1995).The changes are documented in Table A.1. The given quantitiesare the old and new transition frequency (σ), the lower state termenergyEl , the logarithm of theg f -value (logg f ), the lower andupper state vibrational quantum numbers (vl andvu), the lowerstate angular momentum number (Jl), and the isotope identifica-tion.
At a later point in the analysis, we compared the correc-tions of the line positions to the CO data given by Chandra et al.(1996). The wavenumbers from the Arcturus atlas are in goodagreement with their transition frequencies. The differences areless than 0.04 cm−1 for the 1-3 vibration transitions and lessthan 0.01 cm−1 for the other lines. However, we did not usethe Chandra et al. (1996) data, because the line strengths ofthe12CO 3-0 band head in the H band from this list are severelyunderestimated and therefore unusable for the analysis.
8 Available at the CDS:http://vizier.cfa.harvard.edu/viz-bin/VizieR?-source=J/ApJS/95/535.

16 Lederer et al.: The puzzling dredge-up pattern in NGC 1978
Table A.1. Modified line positions of CO lines in the K band
σold [cm−1] σnew [cm−1] El [cm−1] log g f vl vu Jl Isotope4219.5583 4225.3630 19009.6550 4.865E-05 1 3 9512C16O4226.9718 4227.7190 14547.6172 6.569E-05 2 4 7412C16O4223.6261 4228.9450 18668.6535 4.782E-05 1 3 9412C16O4228.9365 4229.6010 14278.1804 6.439E-05 2 4 7312C16O4230.8124 4231.4030 14012.1198 6.310E-05 2 4 7212C16O4227.5739 4232.4430 18330.8030 4.701E-05 1 3 9312C16O4232.1241 4233.3140 11962.5127 1.167E-05 0 2 8113C16O4234.3009 4234.7650 13490.1716 6.057E-05 2 4 7012C16O4234.3757 4235.4470 11676.5472 1.144E-05 0 2 8013C16O4235.9151 4236.3250 13234.3055 5.932E-05 2 4 6912C16O4237.4434 4237.8040 12981.8588 5.809E-05 2 4 6812C16O4238.8865 4239.2040 12732.8418 5.687E-05 2 4 6712C16O4240.2450 4240.5230 12487.2648 5.566E-05 2 4 6612C16O4241.5194 4241.7630 12245.1376 5.447E-05 2 4 6512C16O