the protein-protein interaction tasks of biocreative iii: classification/ranking of articles and...
TRANSCRIPT
RESEARCH Open Access
The Protein-Protein Interaction tasks ofBioCreative III: classification/ranking of articlesand linking bio-ontology concepts to full textMartin Krallinger1*, Miguel Vazquez1, Florian Leitner1, David Salgado2, Andrew Chatr-aryamontri3, Andrew Winter3,Livia Perfetto4, Leonardo Briganti4, Luana Licata4, Marta Iannuccelli4, Luisa Castagnoli4, Gianni Cesareni4,5,Mike Tyers3, Gerold Schneider6, Fabio Rinaldi6, Robert Leaman7, Graciela Gonzalez8, Sergio Matos9, Sun Kim10,W John Wilbur10, Luis Rocha11, Hagit Shatkay12, Ashish V Tendulkar13, Shashank Agarwal14, Feifan Liu14,Xinglong Wang15, Rafal Rak15, Keith Noto16, Charles Elkan17, Zhiyong Lu10, Rezarta Islamaj Dogan10,Jean-Fred Fontaine18, Miguel A Andrade-Navarro18, Alfonso Valencia1
From The Third BioCreative – Critical Assessment of Information Extraction in Biology ChallengeBethesda, MD, USA. 13-15 September 2010
Abstract
Background: Determining usefulness of biomedical text mining systems requires realistic task definition and dataselection criteria without artificial constraints, measuring performance aspects that go beyond traditional metrics.The BioCreative III Protein-Protein Interaction (PPI) tasks were motivated by such considerations, trying to addressaspects including how the end user would oversee the generated output, for instance by providing ranked results,textual evidence for human interpretation or measuring time savings by using automated systems. Detectingarticles describing complex biological events like PPIs was addressed in the Article Classification Task (ACT), whereparticipants were asked to implement tools for detecting PPI-describing abstracts. Therefore the BCIII-ACT corpuswas provided, which includes a training, development and test set of over 12,000 PPI relevant and non-relevantPubMed abstracts labeled manually by domain experts and recording also the human classification times. TheInteraction Method Task (IMT) went beyond abstracts and required mining for associations between more than3,500 full text articles and interaction detection method ontology concepts that had been applied to detect thePPIs reported in them.
Results: A total of 11 teams participated in at least one of the two PPI tasks (10 in ACT and 8 in the IMT) and atotal of 62 persons were involved either as participants or in preparing data sets/evaluating these tasks. Per task,each team was allowed to submit five runs offline and another five online via the BioCreative Meta-Server. Fromthe 52 runs submitted for the ACT, the highest Matthew’s Correlation Coefficient (MCC) score measured was 0.55at an accuracy of 89% and the best AUC iP/R was 68%. Most ACT teams explored machine learning methods,some of them also used lexical resources like MeSH terms, PSI-MI concepts or particular lists of verbs and nouns,some integrated NER approaches. For the IMT, a total of 42 runs were evaluated by comparing systems againstmanually generated annotations done by curators from the BioGRID and MINT databases. The highest AUC iP/Rachieved by any run was 53%, the best MCC score 0.55. In case of competitive systems with an acceptable recall(above 35%) the macro-averaged precision ranged between 50% and 80%, with a maximum F-Score of 55%.
* Correspondence: [email protected] Biology and BioComputing Programme, Spanish National CancerResearch Centre (CNIO), Madrid, SpainFull list of author information is available at the end of the article
Krallinger et al. BMC Bioinformatics 2011, 12(Suppl 8):S3http://www.biomedcentral.com/1471-2105/12/S8/S3
© 2011 Krallinger et al. This is an open access article distributed under the terms of the Creative Commons Attribution License (http://creativecommons.org/licenses/by/2.0), which permits unrestricted use, distribution, and reproduction in any medium, provided theoriginal work is properly cited.
Conclusions: The results of the ACT task of BioCreative III indicate that classification of large unbalanced articlecollections reflecting the real class imbalance is still challenging. Nevertheless, text-mining tools that report rankedlists of relevant articles for manual selection can potentially reduce the time needed to identify half of the relevantarticles to less than 1/4 of the time when compared to unranked results. Detecting associations between full textarticles and interaction detection method PSI-MI terms (IMT) is more difficult than might be anticipated. This is dueto the variability of method term mentions, errors resulting from pre-processing of articles provided as PDF files,and the heterogeneity and different granularity of method term concepts encountered in the ontology. However,combining the sophisticated techniques developed by the participants with supporting evidence strings derivedfrom the articles for human interpretation could result in practical modules for biological annotation workflows.
BackgroundProviding access to information relevant to proteininteraction characterizations is of great importance bothin the field of experimental biology as well as from theperspective of systems biology and bioinformatics analy-sis. In case of experimental biology, a range of differentmethodologies have been developed to detect proteininteractions, showing different degrees of reliability orunderlying properties of the interactions. To enable sys-tematic analysis of interaction networks, the construc-tion of interaction databases such as BioGRID [1],MINT [2], or IntAct [3] - which store interaction anno-tations in form of well structured database records usingstandard formats - is essential. These databases rely onspecifically trained human curators who manuallyextract protein interactions from scientific articles, mak-ing use of controlled vocabulary terms (covering interac-tion detection experiments) from the PSI-MI ontologyto qualify each interaction [4]. Through such a struc-tured vocabulary, users are able to understand the gen-eral conditions underlying a particular interactionannotation, which can be used for selecting customizedinteraction networks based on experimental qualifiers.Manually generating literature annotations is very timeconsuming and there are increasing concerns that suchapproaches are only able to cope with a small fractionof the relevant information published in the growingamount of articles [5,6]. This has motivated a significantamount of research in the biomedical text mining com-munity devoted to the systematic extraction of protein-protein interaction (PPI) information from scientificarticles, mainly focusing on the detection of binary asso-ciations [7-13]. The detection of interacting proteinpairs using information extraction and literature miningtechniques has already been addressed carefully in boththe BioCreative II and II.5 challenges [14,15]. In orderto determine current bottlenecks in literature curationand understand where text mining can actually be ofpractical use, it is important to formalize the curationusing annotation workflows [16]. In case of proteininteraction annotation two important steps consist ofthe initial selection of relevant articles and the
association of these to experimental interaction meth-ods. When associations between proteins are retrievedautomatically from the literature, determining the corre-sponding experimental qualifier is crucial in order tocharacterize whether it actually corresponds to anexperimentally validated physical interaction or constitu-tes general background knowledge or even some othersort of relation (e.g. genetic/gene regulation interaction,indirect association or phenotypic relationship).
Classification/ranking of articles: Article Classification Task- ACTClassification and ranking of articles according to a par-ticular topic of interest, such as protein-protein interac-tion (PPI) is not only useful to improve subsequent bio-entity recognition and relation extraction approaches,but is labeled in itself important for more general pur-poses [17]. It has been used for prioritizing articles formanual literature curation and can improve the selec-tion of interaction characterizations described in articlesmentioning a particular protein or term of interest [18].This motivated the construction of automated systemsable to classify and rank large sets of potentially relevantabstracts for subsequent manual inspection [19-22].Choosing relevant articles for manual examination inorder to derive biological annotations is a general stepacross almost all biological annotation databases [23].Potentially relevant collections of articles are oftenrepresented by lists of PubMed entries resulting fromkeyword searches or in lists of recent articles from jour-nals of interest. For complex biological events like PPIs,simple keyword queries are often inefficient in detectingrelevant articles. For instance the following evidencesentence for an interaction event does not contain com-monly used interaction terms like bind or interact: ‘Acomplex containing Mus81p and Rad54p was identifiedin immunoprecipitation experiments’ (PMID:10905349).Using the term ‘complex’ as a query for interaction arti-cles would retrieve over 700 thousand PubMed hits,most of them not relevant for interactions. On the otherhand, detecting patterns used to express protein interac-tions like: ‘complex containing PROTEIN and PROTEIN’
Krallinger et al. BMC Bioinformatics 2011, 12(Suppl 8):S3http://www.biomedcentral.com/1471-2105/12/S8/S3
Page 2 of 31
together with a machine learning system that detectsthat ‘immunoprecipitation’ is a feature of PPI articleswould be able to score such a record as protein interac-tion relevant.The evaluation of article retrieval algorithms for anno-
tation databases has been studied in detail in the contextof the former TREC Genomics tracks [24-27], and sev-eral BioCreative challenges, namely BioCreative II [14]and II.5 [15]. In case of Biocreative III, the purpose ofthe (Interaction) Article Classification Task was to pro-mote the development of automated systems that areable to classify articles as relevant for protein-proteininteraction (PPI) database curation efforts. The resultingtext mining tools should be able to simplify the identifi-cation of relevant articles for a range of journals knownto publish protein interaction reports.These modifications included the use of PubMed
abstracts as opposed to full text articles as used in theprevious BioCreative II.5, as they do not have restric-tions in terms of availability. A large range of journalsconsidered as relevant by biological databases have beenutilized, avoiding inclusion of those not being used forcuration. For this task, large manually classified training,development and test data sets have been prepared tofacilitate the implementation of supervised learningmethods and to carry out a statistical sound evaluation.Additionally, we considered a publication time rangeselection criteria to focus on recent articles and providea more coherent data collection. Finally the samplingused for articles in the development and test setsreflects a more realistic class imbalance (proportion ofrelevant and non-relevant articles) encountered for thesejournals. The Gold Standard annotations were generatedby domain experts through inspection of a randomlysampled set of abstracts following classification guide-lines which were refined during several rounds of classi-fication based on the feedback of the BioGRID andMINT database curators (see additional file 1 for anno-tation guidelines). Preparing these guidelines requiredexamining a substantial collection of initial examplerecords in order to specifically describe aspects for con-sidering a particular record as PPI relevant. To supportthis, a set of interaction evidence passages was analyzed,and criteria for non-relevant articles were formalized.Additional example cases for both relevant and non-relevant records had to be discussed with domainexperts and feedback from PPI database curators wasrequested.
Linking bio-ontology concepts to full text: InteractionMethod Task - IMTIn the domain of biomedical sciences, the experimentalcontext is crucial for the interpretation of biologicalassertions as well as to determine the reliability of a
given biological finding [28]. An important aspect forthe annotation of protein interactions is to identify theexperimental techniques (’interaction detection meth-ods’) described in an article to support the interactions[29]. Annotation of experimental techniques or ‘evi-dence’ is also common with other annotation efforts,such as the Gene Ontology Annotations (GOA; in theform of evidence codes) [30]. Knowing the experimentalmethod that provided the evidence for an interactionserves as ‘credibility’ or likelihood indicator that thereported interaction actually occurs in a living organism(in vivo) or cell culture (in vitro). These types of textclassification tasks are based on associating standardizedterms from a controlled vocabulary to the text in ques-tion. In the case of protein-protein interaction annota-tions, efforts have been made to develop a controlledvocabulary (’ontology’) about interaction detectionmethods in order to standardize the terminology servingas experimental evidence support. Database curatorsspend a considerable amount of time determining whichexperimental evidence supports interaction pairsdescribed in articles [31]. A relevant work in this respectwas the implementation of a system for detectingexperimental techniques in biomedical articles byOberoi and colleagues [32]. Also the construction of atext mining system with a particular focus on interac-tion detection methods using statistical inference techni-ques has been explored recently [33], motivated by theInteraction Method Task of the BioCreative II challenge[14], where two different teams provided results [34,35].Even the use of a particular list of affixes correspondingto experimental tags used for labeling interactor proteins(PPI affix dictionary - PPIAD) has been analyzed [36].For instance the affixes ‘GST-’ and ‘TAP-’ show an asso-ciation to the interaction detection methods ‘pull down’and ‘tandem affinity purification’ respectively. For Bio-Creative III, participants were asked to provide a list ofinteraction detection method identifiers for a set of full-text articles, ordered by their likelihood of having beenused to detect the PPIs described in each article. Theseidentifiers belong to the set of standardized experimen-tal interaction detection method terms provided by thePSI-MI ontology. The aim of the evaluation was to esti-mate the facilitation of database curation efforts by pro-viding a list of the most likely PSI-MI identifiers andpossibly increase a curator’s performance.
Methods and dataData preparationOne important aspect of the Biocreative efforts is toprovide Gold Standard data collections that can be usedby system developers to implement and evaluate theirmethods during the challenges as well as afterwards.Preparing large enough and representative data samples
Krallinger et al. BMC Bioinformatics 2011, 12(Suppl 8):S3http://www.biomedcentral.com/1471-2105/12/S8/S3
Page 3 of 31
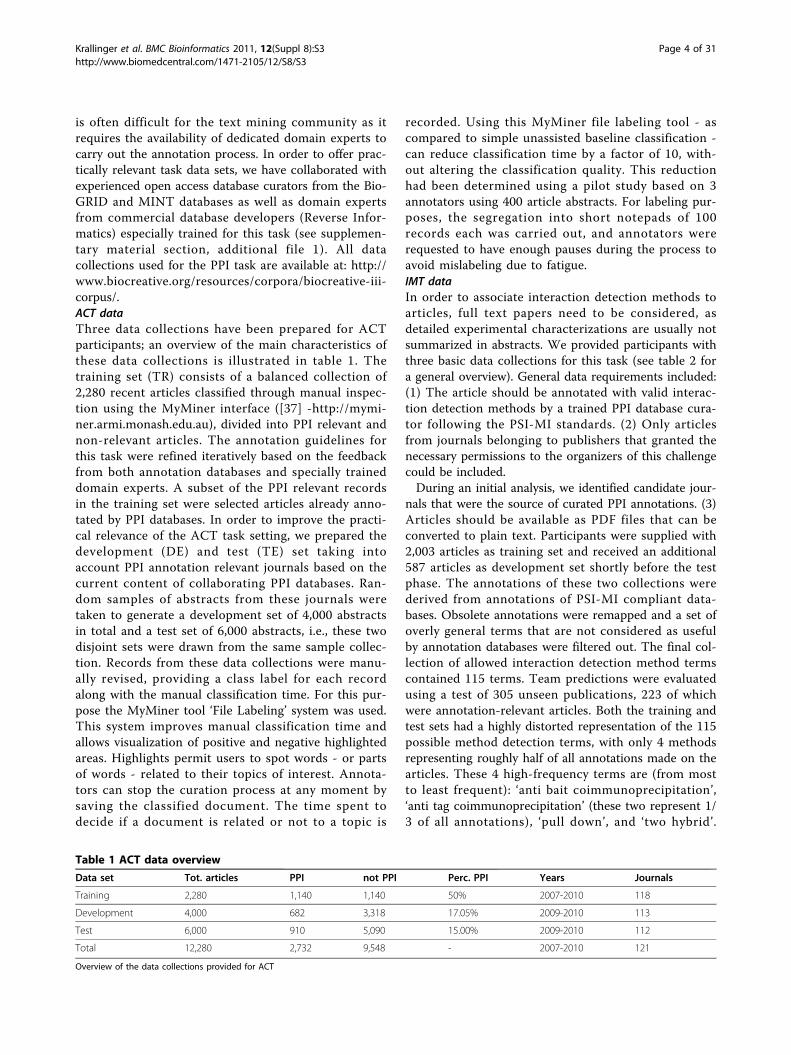
is often difficult for the text mining community as itrequires the availability of dedicated domain experts tocarry out the annotation process. In order to offer prac-tically relevant task data sets, we have collaborated withexperienced open access database curators from the Bio-GRID and MINT databases as well as domain expertsfrom commercial database developers (Reverse Infor-matics) especially trained for this task (see supplemen-tary material section, additional file 1). All datacollections used for the PPI task are available at: http://www.biocreative.org/resources/corpora/biocreative-iii-corpus/.ACT dataThree data collections have been prepared for ACTparticipants; an overview of the main characteristics ofthese data collections is illustrated in table 1. Thetraining set (TR) consists of a balanced collection of2,280 recent articles classified through manual inspec-tion using the MyMiner interface ([37] -http://mymi-ner.armi.monash.edu.au), divided into PPI relevant andnon-relevant articles. The annotation guidelines forthis task were refined iteratively based on the feedbackfrom both annotation databases and specially traineddomain experts. A subset of the PPI relevant recordsin the training set were selected articles already anno-tated by PPI databases. In order to improve the practi-cal relevance of the ACT task setting, we prepared thedevelopment (DE) and test (TE) set taking intoaccount PPI annotation relevant journals based on thecurrent content of collaborating PPI databases. Ran-dom samples of abstracts from these journals weretaken to generate a development set of 4,000 abstractsin total and a test set of 6,000 abstracts, i.e., these twodisjoint sets were drawn from the same sample collec-tion. Records from these data collections were manu-ally revised, providing a class label for each recordalong with the manual classification time. For this pur-pose the MyMiner tool ‘File Labeling’ system was used.This system improves manual classification time andallows visualization of positive and negative highlightedareas. Highlights permit users to spot words - or partsof words - related to their topics of interest. Annota-tors can stop the curation process at any moment bysaving the classified document. The time spent todecide if a document is related or not to a topic is
recorded. Using this MyMiner file labeling tool - ascompared to simple unassisted baseline classification -can reduce classification time by a factor of 10, with-out altering the classification quality. This reductionhad been determined using a pilot study based on 3annotators using 400 article abstracts. For labeling pur-poses, the segregation into short notepads of 100records each was carried out, and annotators wererequested to have enough pauses during the process toavoid mislabeling due to fatigue.IMT dataIn order to associate interaction detection methods toarticles, full text papers need to be considered, asdetailed experimental characterizations are usually notsummarized in abstracts. We provided participants withthree basic data collections for this task (see table 2 fora general overview). General data requirements included:(1) The article should be annotated with valid interac-tion detection methods by a trained PPI database cura-tor following the PSI-MI standards. (2) Only articlesfrom journals belonging to publishers that granted thenecessary permissions to the organizers of this challengecould be included.During an initial analysis, we identified candidate jour-
nals that were the source of curated PPI annotations. (3)Articles should be available as PDF files that can beconverted to plain text. Participants were supplied with2,003 articles as training set and received an additional587 articles as development set shortly before the testphase. The annotations of these two collections werederived from annotations of PSI-MI compliant data-bases. Obsolete annotations were remapped and a set ofoverly general terms that are not considered as usefulby annotation databases were filtered out. The final col-lection of allowed interaction detection method termscontained 115 terms. Team predictions were evaluatedusing a test of 305 unseen publications, 223 of whichwere annotation-relevant articles. Both the training andtest sets had a highly distorted representation of the 115possible method detection terms, with only 4 methodsrepresenting roughly half of all annotations made on thearticles. These 4 high-frequency terms are (from mostto least frequent): ‘anti bait coimmunoprecipitation’,‘anti tag coimmunoprecipitation’ (these two represent 1/3 of all annotations), ‘pull down’, and ‘two hybrid’.
Table 1 ACT data overviewData set Tot. articles PPI not PPI Perc. PPI Years Journals
Training 2,280 1,140 1,140 50% 2007-2010 118
Development 4,000 682 3,318 17.05% 2009-2010 113
Test 6,000 910 5,090 15.00% 2009-2010 112
Total 12,280 2,732 9,548 - 2007-2010 121
Overview of the data collections provided for ACT
Krallinger et al. BMC Bioinformatics 2011, 12(Suppl 8):S3http://www.biomedcentral.com/1471-2105/12/S8/S3
Page 4 of 31
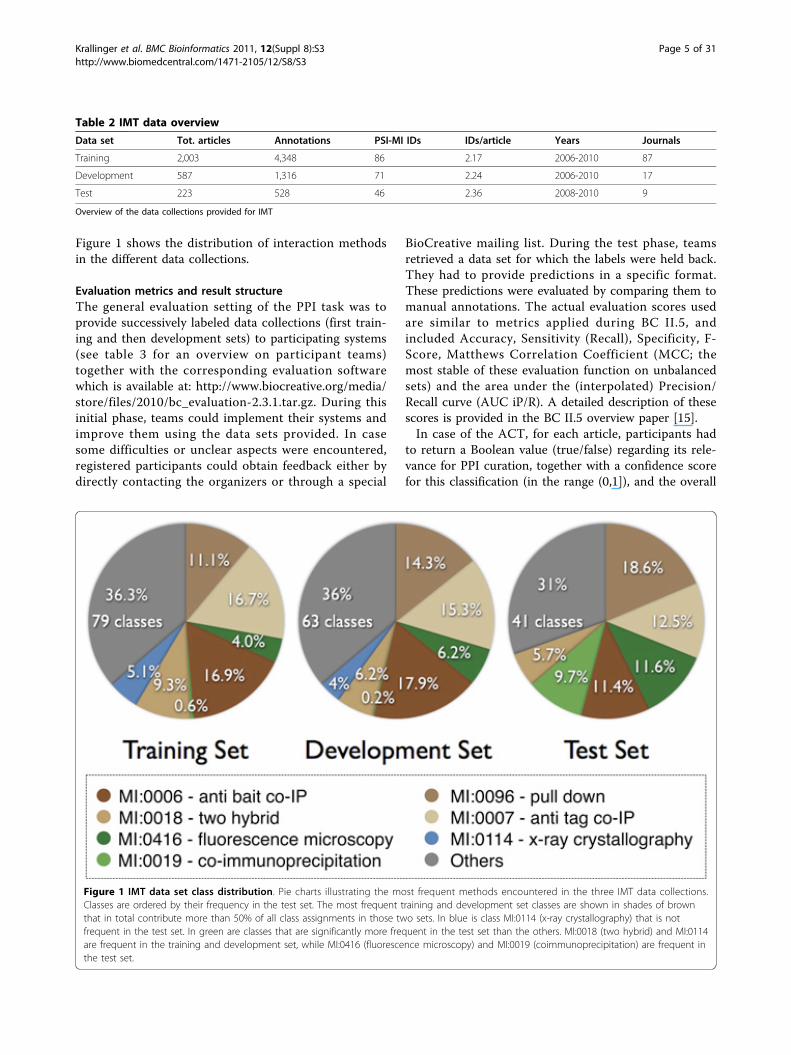
Figure 1 shows the distribution of interaction methodsin the different data collections.
Evaluation metrics and result structureThe general evaluation setting of the PPI task was toprovide successively labeled data collections (first train-ing and then development sets) to participating systems(see table 3 for an overview on participant teams)together with the corresponding evaluation softwarewhich is available at: http://www.biocreative.org/media/store/files/2010/bc_evaluation-2.3.1.tar.gz. During thisinitial phase, teams could implement their systems andimprove them using the data sets provided. In casesome difficulties or unclear aspects were encountered,registered participants could obtain feedback either bydirectly contacting the organizers or through a special
BioCreative mailing list. During the test phase, teamsretrieved a data set for which the labels were held back.They had to provide predictions in a specific format.These predictions were evaluated by comparing them tomanual annotations. The actual evaluation scores usedare similar to metrics applied during BC II.5, andincluded Accuracy, Sensitivity (Recall), Specificity, F-Score, Matthews Correlation Coefficient (MCC; themost stable of these evaluation function on unbalancedsets) and the area under the (interpolated) Precision/Recall curve (AUC iP/R). A detailed description of thesescores is provided in the BC II.5 overview paper [15].In case of the ACT, for each article, participants had
to return a Boolean value (true/false) regarding its rele-vance for PPI curation, together with a confidence scorefor this classification (in the range (0,1]), and the overall
Table 2 IMT data overviewData set Tot. articles Annotations PSI-MI IDs IDs/article Years Journals
Training 2,003 4,348 86 2.17 2006-2010 87
Development 587 1,316 71 2.24 2006-2010 17
Test 223 528 46 2.36 2008-2010 9
Overview of the data collections provided for IMT
Figure 1 IMT data set class distribution. Pie charts illustrating the most frequent methods encountered in the three IMT data collections.Classes are ordered by their frequency in the test set. The most frequent training and development set classes are shown in shades of brownthat in total contribute more than 50% of all class assignments in those two sets. In blue is class MI:0114 (x-ray crystallography) that is notfrequent in the test set. In green are classes that are significantly more frequent in the test set than the others. MI:0018 (two hybrid) and MI:0114are frequent in the training and development set, while MI:0416 (fluorescence microscopy) and MI:0019 (coimmunoprecipitation) are frequent inthe test set.
Krallinger et al. BMC Bioinformatics 2011, 12(Suppl 8):S3http://www.biomedcentral.com/1471-2105/12/S8/S3
Page 5 of 31
(unique) rank of the article in the whole set of articleswith respect to its PPI relevance. The main utility mea-sure of a system - i.e., the primary evaluation score forthis tasks - is based on measuring a system’s ability toprovide the best possible ranked list of relevantabstracts, sorted from the most relevant (i.e., highestranked article that is classified as true) to the most irre-levant article (i.e., highest ranked article classified asfalse). To this end, the area under the (interpolated) Pre-cision/Recall curve is measured (AUC iP/R score) byusing the results’ ranking. We also added the F-Scoresfor comparison to the BioCreative II results.In case of the IMT, for each article, participants had
to return zero or more PSI-MI detection method termidentifiers, and for each term annotation they had toprovide a confidence score (in the range (0,1]), and anoverall (unique) rank for each term annotated on anarticle, from the most to the least relevant. In addition,participants were asked to return the most decisive evi-dence text passage that gave rise to their annotation -data useful for human interpretation. The primarymetric used for the IMT was based on the average per-article annotation performance (macro-averaging) givenits ranking: The area under the (interpolated) Precision/Recall curve was measured (AUC iP/R) by averaging theAUC from the individual scores on each article. (Formore general information evaluation metric calculationsplease refer to the additional materials section).
ResultsACTACT inter-annotator and manual classification time analysisA set of 649 articles has been annotated by contracteddomain experts as well as MINT curators (developmentset, DE: 360; test set, TE: 289 articles), or by curatorsfrom BioGrid (DE: 365; TE: 284 articles), and 200 of
these double-annotated articles were annotated by onerepresentative of all three groups - domain expert,MINT, and BioGrid. Four annotations with curationtimes significantly over 10 minutes were discarded asoutliers in the following analysis (PMIDs: 19517012,19515822, 19718269, and 19774229) - the most extremeoutlier had a recorded annotation time of more than sixhours.Over the entire set, the average curation time was 43
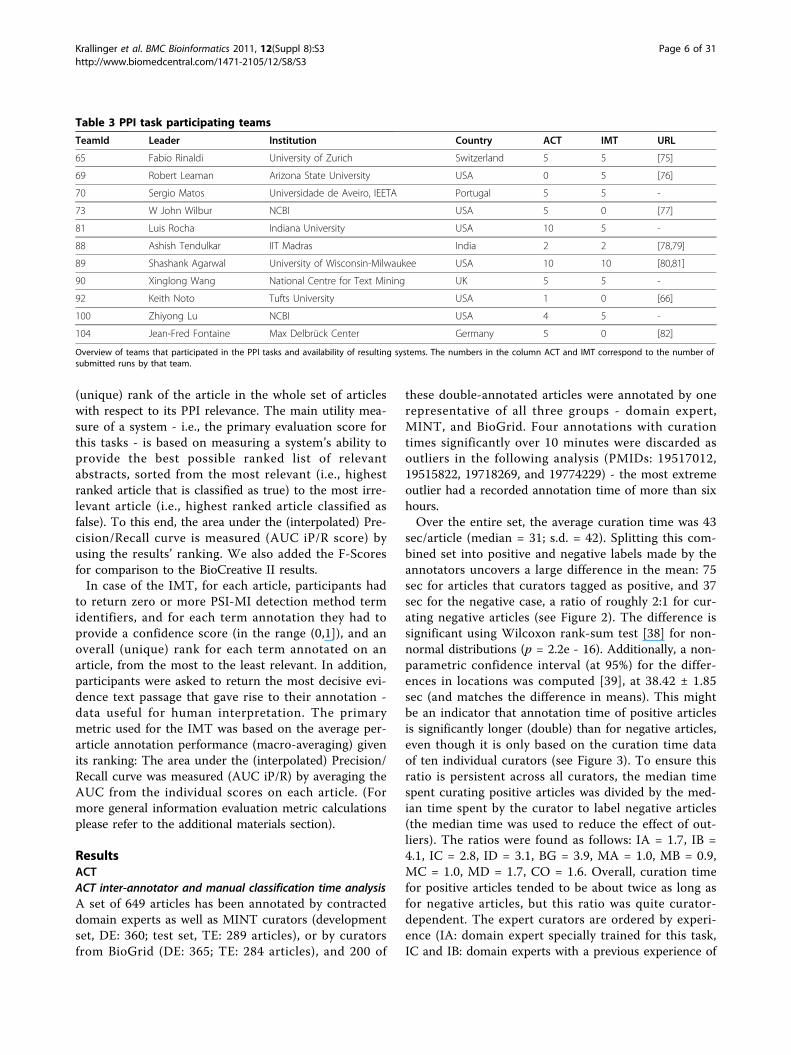
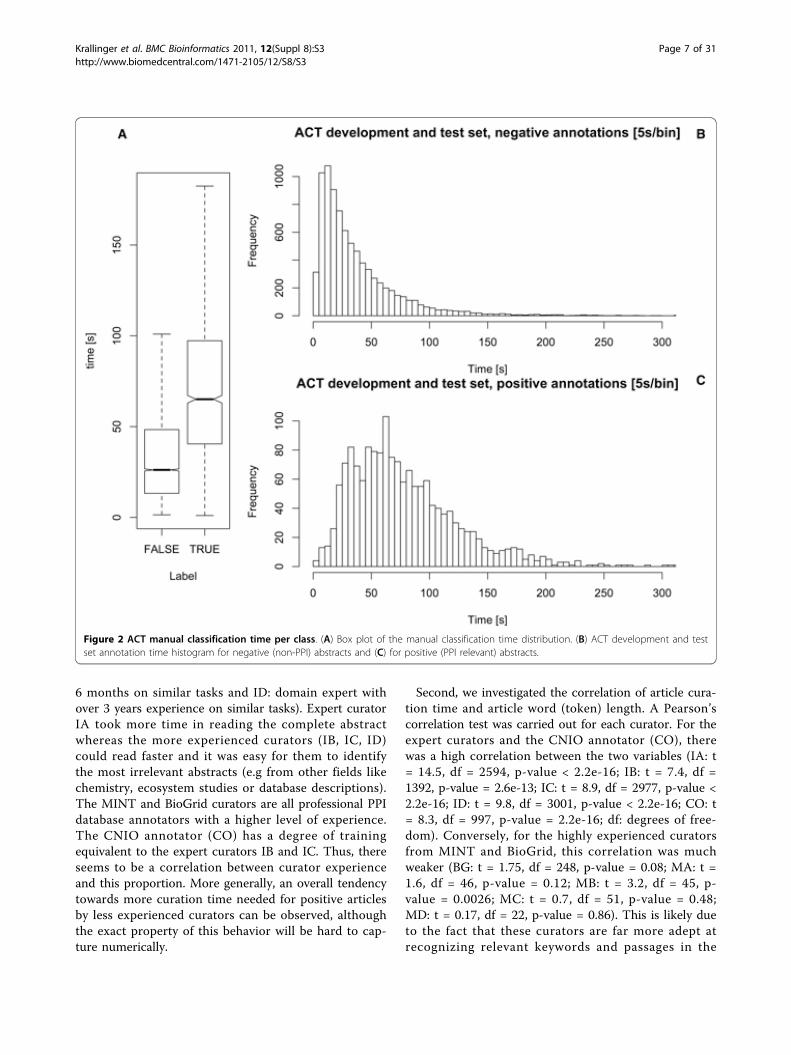
sec/article (median = 31; s.d. = 42). Splitting this com-bined set into positive and negative labels made by theannotators uncovers a large difference in the mean: 75sec for articles that curators tagged as positive, and 37sec for the negative case, a ratio of roughly 2:1 for cur-ating negative articles (see Figure 2). The difference issignificant using Wilcoxon rank-sum test [38] for non-normal distributions (p = 2.2e - 16). Additionally, a non-parametric confidence interval (at 95%) for the differ-ences in locations was computed [39], at 38.42 ± 1.85sec (and matches the difference in means). This mightbe an indicator that annotation time of positive articlesis significantly longer (double) than for negative articles,even though it is only based on the curation time dataof ten individual curators (see Figure 3). To ensure thisratio is persistent across all curators, the median timespent curating positive articles was divided by the med-ian time spent by the curator to label negative articles(the median time was used to reduce the effect of out-liers). The ratios were found as follows: IA = 1.7, IB =4.1, IC = 2.8, ID = 3.1, BG = 3.9, MA = 1.0, MB = 0.9,MC = 1.0, MD = 1.7, CO = 1.6. Overall, curation timefor positive articles tended to be about twice as long asfor negative articles, but this ratio was quite curator-dependent. The expert curators are ordered by experi-ence (IA: domain expert specially trained for this task,IC and IB: domain experts with a previous experience of
Table 3 PPI task participating teamsTeamId Leader Institution Country ACT IMT URL
65 Fabio Rinaldi University of Zurich Switzerland 5 5 [75]
69 Robert Leaman Arizona State University USA 0 5 [76]
70 Sergio Matos Universidade de Aveiro, IEETA Portugal 5 5 -
73 W John Wilbur NCBI USA 5 0 [77]
81 Luis Rocha Indiana University USA 10 5 -
88 Ashish Tendulkar IIT Madras India 2 2 [78,79]
89 Shashank Agarwal University of Wisconsin-Milwaukee USA 10 10 [80,81]
90 Xinglong Wang National Centre for Text Mining UK 5 5 -
92 Keith Noto Tufts University USA 1 0 [66]
100 Zhiyong Lu NCBI USA 4 5 -
104 Jean-Fred Fontaine Max Delbrück Center Germany 5 0 [82]
Overview of teams that participated in the PPI tasks and availability of resulting systems. The numbers in the column ACT and IMT correspond to the number ofsubmitted runs by that team.
Krallinger et al. BMC Bioinformatics 2011, 12(Suppl 8):S3http://www.biomedcentral.com/1471-2105/12/S8/S3
Page 6 of 31
6 months on similar tasks and ID: domain expert withover 3 years experience on similar tasks). Expert curatorIA took more time in reading the complete abstractwhereas the more experienced curators (IB, IC, ID)could read faster and it was easy for them to identifythe most irrelevant abstracts (e.g from other fields likechemistry, ecosystem studies or database descriptions).The MINT and BioGrid curators are all professional PPIdatabase annotators with a higher level of experience.The CNIO annotator (CO) has a degree of trainingequivalent to the expert curators IB and IC. Thus, thereseems to be a correlation between curator experienceand this proportion. More generally, an overall tendencytowards more curation time needed for positive articlesby less experienced curators can be observed, althoughthe exact property of this behavior will be hard to cap-ture numerically.
Second, we investigated the correlation of article cura-tion time and article word (token) length. A Pearson’scorrelation test was carried out for each curator. For theexpert curators and the CNIO annotator (CO), therewas a high correlation between the two variables (IA: t= 14.5, df = 2594, p-value < 2.2e-16; IB: t = 7.4, df =1392, p-value = 2.6e-13; IC: t = 8.9, df = 2977, p-value <2.2e-16; ID: t = 9.8, df = 3001, p-value < 2.2e-16; CO: t= 8.3, df = 997, p-value = 2.2e-16; df: degrees of free-dom). Conversely, for the highly experienced curatorsfrom MINT and BioGrid, this correlation was muchweaker (BG: t = 1.75, df = 248, p-value = 0.08; MA: t =1.6, df = 46, p-value = 0.12; MB: t = 3.2, df = 45, p-value = 0.0026; MC: t = 0.7, df = 51, p-value = 0.48;MD: t = 0.17, df = 22, p-value = 0.86). This is likely dueto the fact that these curators are far more adept atrecognizing relevant keywords and passages in the
Figure 2 ACT manual classification time per class. (A) Box plot of the manual classification time distribution. (B) ACT development and testset annotation time histogram for negative (non-PPI) abstracts and (C) for positive (PPI relevant) abstracts.
Krallinger et al. BMC Bioinformatics 2011, 12(Suppl 8):S3http://www.biomedcentral.com/1471-2105/12/S8/S3
Page 7 of 31
MEDLINE abstracts, as can also be seen by the verystrong agreement on labels between the two databases(overlap 96%, Cohen’s Kappa = 0.85).Agreement with the expert curators was lower, as
expected, but within acceptable ranges (for MINT vs.expert, 92% overlap, Kappa = 0.69; for BioGrid vs. expert,91%, Kappa = 0.69). There was an overall agreement onlabels (true, false) between all three groups (MINT, Bio-Grid, and expert) of 85.5% of all abstracts. This overlapshould be compared to the highest accuracy (TP + TN/number of all articles) measured in the ACT, 89%.Furthermore, BioGrid and MINT follow (similar) in-house protocols for labeling the abstracts, while theexpert annotations were done using a special protocoldesigned just for the challenge. This fact is likely toexplain the better agreement between database curatorsthan between the expert annotators and the curators.ACT team resultsIn total, ten teams participated in this task. The indivi-dual results of each run are shown in Table 4, the teamID associations are show in table 3. For each of theseparticipation methods, teams could submit five runs for
a total of ten if they participated both offline and online.The highest AUC iP/R achieved by any run was 68%,the best MCC score measured was 0.55. The iP/R curveof the best team (73, S. Kim and W. J. Wilbur) in theACT task is available in the supplementary material sec-tion (additional file 2). By using the BioCreative Meta-Server (BCMS) framework for participating online, wewere able to measure the time it took the systems toreport a classification.A simple consensus prediction was generated using
majority voting (see results in table 4), generating aranking based on the percentage agreement derivedfrom the different runs. This combined system returnedthe best MCC score (0.57), obtained a better AUC iP/Rresult than the best single run (68.98) and reached thebest f-score (63.16).The consensus prediction generates a ranking where
the top of the list is enriched in positive articles whilethe end of the list has mostly negative articles. Thismeans that the proportion of articles confirmed to bepositive through manual curation following this rankingwill be higher at the start of the process, which leads to
Figure 3 ACT manual classification time per curator. Box plot of manual classification time spent by each individual curator. The labelscorrespond to: four expert curators, ordered by experience (lowest = IA, highest = ID), a CNIO annotator (CO), a BioGRID curator (BG), and fourMINT curators (MA-MD).
Krallinger et al. BMC Bioinformatics 2011, 12(Suppl 8):S3http://www.biomedcentral.com/1471-2105/12/S8/S3
Page 8 of 31
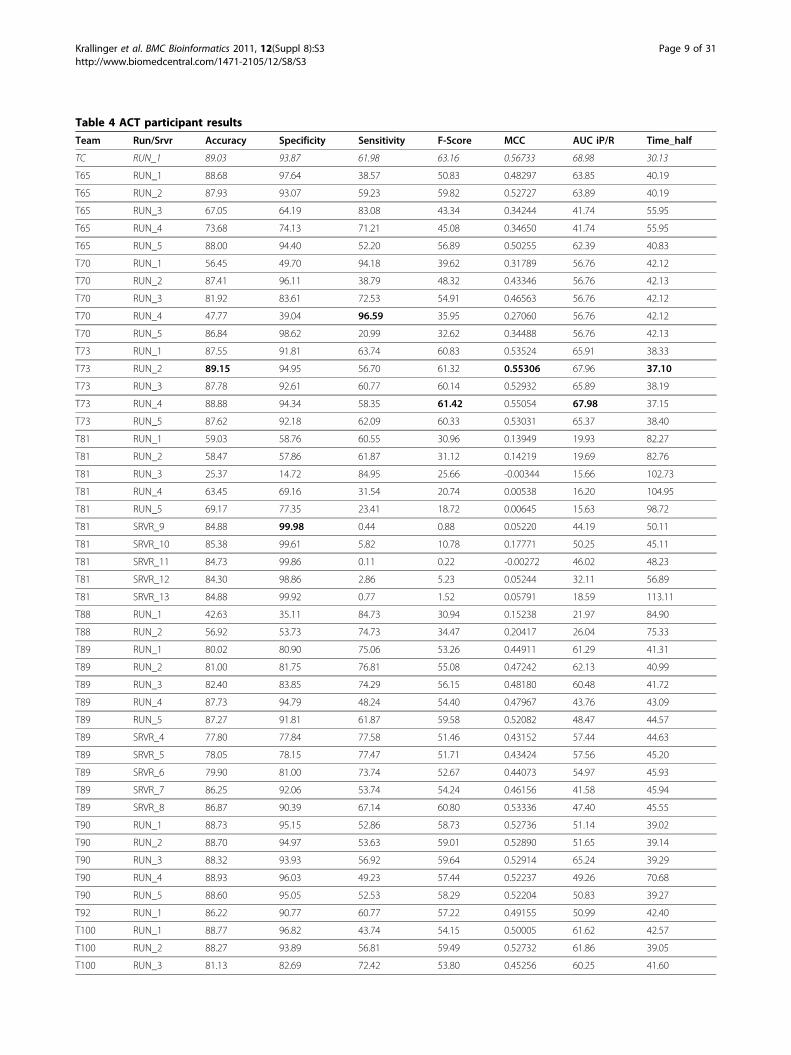
Table 4 ACT participant resultsTeam Run/Srvr Accuracy Specificity Sensitivity F-Score MCC AUC iP/R Time_half
TC RUN_1 89.03 93.87 61.98 63.16 0.56733 68.98 30.13
T65 RUN_1 88.68 97.64 38.57 50.83 0.48297 63.85 40.19
T65 RUN_2 87.93 93.07 59.23 59.82 0.52727 63.89 40.19
T65 RUN_3 67.05 64.19 83.08 43.34 0.34244 41.74 55.95
T65 RUN_4 73.68 74.13 71.21 45.08 0.34650 41.74 55.95
T65 RUN_5 88.00 94.40 52.20 56.89 0.50255 62.39 40.83
T70 RUN_1 56.45 49.70 94.18 39.62 0.31789 56.76 42.12
T70 RUN_2 87.41 96.11 38.79 48.32 0.43346 56.76 42.13
T70 RUN_3 81.92 83.61 72.53 54.91 0.46563 56.76 42.12
T70 RUN_4 47.77 39.04 96.59 35.95 0.27060 56.76 42.12
T70 RUN_5 86.84 98.62 20.99 32.62 0.34488 56.76 42.13
T73 RUN_1 87.55 91.81 63.74 60.83 0.53524 65.91 38.33
T73 RUN_2 89.15 94.95 56.70 61.32 0.55306 67.96 37.10
T73 RUN_3 87.78 92.61 60.77 60.14 0.52932 65.89 38.19
T73 RUN_4 88.88 94.34 58.35 61.42 0.55054 67.98 37.15
T73 RUN_5 87.62 92.18 62.09 60.33 0.53031 65.37 38.40
T81 RUN_1 59.03 58.76 60.55 30.96 0.13949 19.93 82.27
T81 RUN_2 58.47 57.86 61.87 31.12 0.14219 19.69 82.76
T81 RUN_3 25.37 14.72 84.95 25.66 -0.00344 15.66 102.73
T81 RUN_4 63.45 69.16 31.54 20.74 0.00538 16.20 104.95
T81 RUN_5 69.17 77.35 23.41 18.72 0.00645 15.63 98.72
T81 SRVR_9 84.88 99.98 0.44 0.88 0.05220 44.19 50.11
T81 SRVR_10 85.38 99.61 5.82 10.78 0.17771 50.25 45.11
T81 SRVR_11 84.73 99.86 0.11 0.22 -0.00272 46.02 48.23
T81 SRVR_12 84.30 98.86 2.86 5.23 0.05244 32.11 56.89
T81 SRVR_13 84.88 99.92 0.77 1.52 0.05791 18.59 113.11
T88 RUN_1 42.63 35.11 84.73 30.94 0.15238 21.97 84.90
T88 RUN_2 56.92 53.73 74.73 34.47 0.20417 26.04 75.33
T89 RUN_1 80.02 80.90 75.06 53.26 0.44911 61.29 41.31
T89 RUN_2 81.00 81.75 76.81 55.08 0.47242 62.13 40.99
T89 RUN_3 82.40 83.85 74.29 56.15 0.48180 60.48 41.72
T89 RUN_4 87.73 94.79 48.24 54.40 0.47967 43.76 43.09
T89 RUN_5 87.27 91.81 61.87 59.58 0.52082 48.47 44.57
T89 SRVR_4 77.80 77.84 77.58 51.46 0.43152 57.44 44.63
T89 SRVR_5 78.05 78.15 77.47 51.71 0.43424 57.56 45.20
T89 SRVR_6 79.90 81.00 73.74 52.67 0.44073 54.97 45.93
T89 SRVR_7 86.25 92.06 53.74 54.24 0.46156 41.58 45.94
T89 SRVR_8 86.87 90.39 67.14 60.80 0.53336 47.40 45.55
T90 RUN_1 88.73 95.15 52.86 58.73 0.52736 51.14 39.02
T90 RUN_2 88.70 94.97 53.63 59.01 0.52890 51.65 39.14
T90 RUN_3 88.32 93.93 56.92 59.64 0.52914 65.24 39.29
T90 RUN_4 88.93 96.03 49.23 57.44 0.52237 49.26 70.68
T90 RUN_5 88.60 95.05 52.53 58.29 0.52204 50.83 39.27
T92 RUN_1 86.22 90.77 60.77 57.22 0.49155 50.99 42.40
T100 RUN_1 88.77 96.82 43.74 54.15 0.50005 61.62 42.57
T100 RUN_2 88.27 93.89 56.81 59.49 0.52732 61.86 39.05
T100 RUN_3 81.13 82.69 72.42 53.80 0.45256 60.25 41.60
Krallinger et al. BMC Bioinformatics 2011, 12(Suppl 8):S3http://www.biomedcentral.com/1471-2105/12/S8/S3
Page 9 of 31
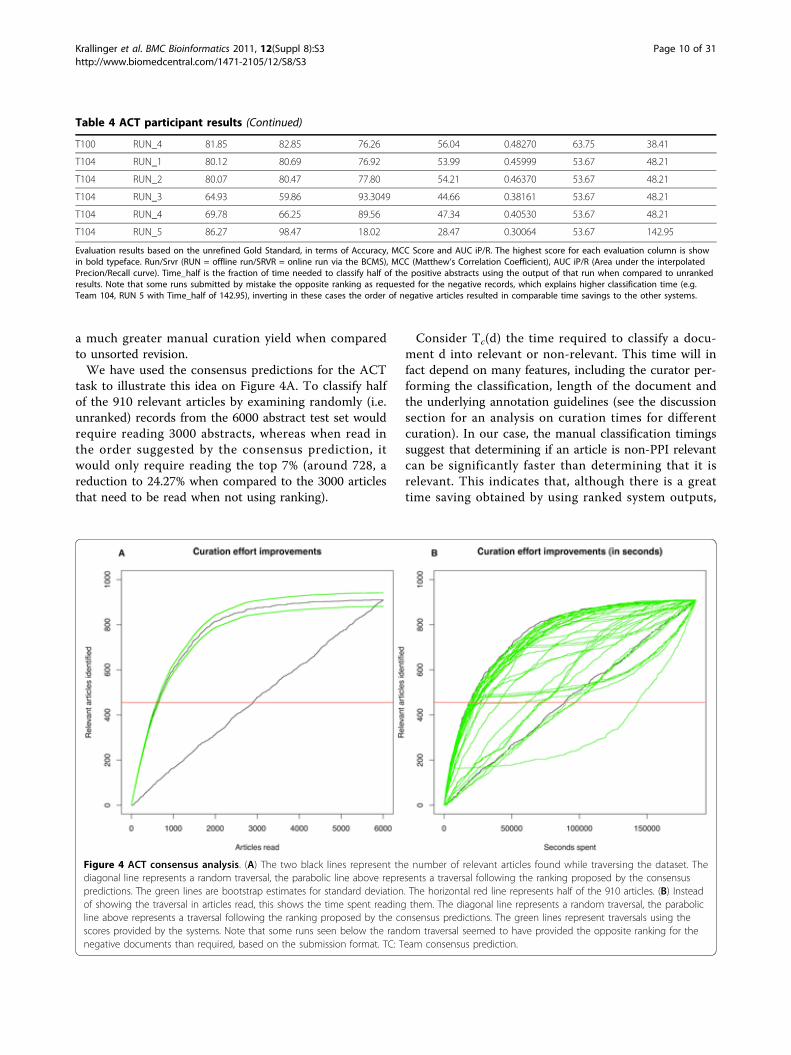
a much greater manual curation yield when comparedto unsorted revision.We have used the consensus predictions for the ACT
task to illustrate this idea on Figure 4A. To classify halfof the 910 relevant articles by examining randomly (i.e.unranked) records from the 6000 abstract test set wouldrequire reading 3000 abstracts, whereas when read inthe order suggested by the consensus prediction, itwould only require reading the top 7% (around 728, areduction to 24.27% when compared to the 3000 articlesthat need to be read when not using ranking).
Consider Tc(d) the time required to classify a docu-ment d into relevant or non-relevant. This time will infact depend on many features, including the curator per-forming the classification, length of the document andthe underlying annotation guidelines (see the discussionsection for an analysis on curation times for differentcuration). In our case, the manual classification timingssuggest that determining if an article is non-PPI relevantcan be significantly faster than determining that it isrelevant. This indicates that, although there is a greattime saving obtained by using ranked system outputs,
Figure 4 ACT consensus analysis. (A) The two black lines represent the number of relevant articles found while traversing the dataset. Thediagonal line represents a random traversal, the parabolic line above represents a traversal following the ranking proposed by the consensuspredictions. The green lines are bootstrap estimates for standard deviation. The horizontal red line represents half of the 910 articles. (B) Insteadof showing the traversal in articles read, this shows the time spent reading them. The diagonal line represents a random traversal, the parabolicline above represents a traversal following the ranking proposed by the consensus predictions. The green lines represent traversals using thescores provided by the systems. Note that some runs seen below the random traversal seemed to have provided the opposite ranking for thenegative documents than required, based on the submission format. TC: Team consensus prediction.
Table 4 ACT participant results (Continued)
T100 RUN_4 81.85 82.85 76.26 56.04 0.48270 63.75 38.41
T104 RUN_1 80.12 80.69 76.92 53.99 0.45999 53.67 48.21
T104 RUN_2 80.07 80.47 77.80 54.21 0.46370 53.67 48.21
T104 RUN_3 64.93 59.86 93.3049 44.66 0.38161 53.67 48.21
T104 RUN_4 69.78 66.25 89.56 47.34 0.40530 53.67 48.21
T104 RUN_5 86.27 98.47 18.02 28.47 0.30064 53.67 142.95
Evaluation results based on the unrefined Gold Standard, in terms of Accuracy, MCC Score and AUC iP/R. The highest score for each evaluation column is showin bold typeface. Run/Srvr (RUN = offline run/SRVR = online run via the BCMS), MCC (Matthew’s Correlation Coefficient), AUC iP/R (Area under the interpolatedPrecion/Recall curve). Time_half is the fraction of time needed to classify half of the positive abstracts using the output of that run when compared to unrankedresults. Note that some runs submitted by mistake the opposite ranking as requested for the negative records, which explains higher classification time (e.g.Team 104, RUN 5 with Time_half of 142.95), inverting in these cases the order of negative articles resulted in comparable time savings to the other systems.
Krallinger et al. BMC Bioinformatics 2011, 12(Suppl 8):S3http://www.biomedcentral.com/1471-2105/12/S8/S3
Page 10 of 31
this is affected by both the proportion of relevant casesas well as the difference in classification time betweenrelevant and non-relevant articles. Using the consensussystem predictions would require only 30.13% of thetime for finding half of the relevant documents in thetest set collection when compared to random ranking ofabstracts (no ordering/ranking). Figure 4B illustrates thisidea, showing the number of articles against the timespent in classifying them (using the Tc(d) from the realcurators). This also shows the advantages over baselineselection based for instance on the use of a set of expertdefined keywords for article selection, which moreoverobviously does not generate a proper relevance rankingof the resulting hits. Using the presence a set of key-words provided by MINT curators as a way of selectingrelevant articles resulted in a recall of 17.36%, a preci-sion of 61.96% with F-score of 27.12%. Although theprecision of this keyword-based selection is relativelyacceptable, the overall performance is significantly lowerthan the one obtained by participating teams in general.Participant technologies used for ACTParticipants were asked to fill in a short questionnaireafter the test phase. Interestingly, four teams (73, 81, 92,100) used other sources of training data than what wasprovided through the challenge itself (e.g., data fromformer BioCreative challenges or random likely-negativearticles). We also asked teams to evaluate the difficultyof the task (easy, medium, hard); no team thought theACT task was easy, four (73, 81, 100, 104) said it washard, while the others classified it as ‘medium’. Allteams did some amount of lexical analysis of the text(sentence splitting, tokenization and/or lemmatization/stemming was done by all teams), and many includedPart-of-Speech-tagging (POS) (teams 65, 73, 89, 90, 104)or even Named Entity Recognition (teams 65, 70, 73, 81,and 90). Teams 65 and 73 used dependency parsing onthe abstracts. For generating their predictions all teamsrelied on the title and abstract, half used the MeSHterms, too, and one team was even also able to explorefull text information for some of the articles. For featureselection or weighting purposes, approaches used byparticipating teams include statistical methods like Chi-Square, mutual information, frequency cut-off and Baye-sian weights as well as other selection criteria such asthe restriction to particular Part-of-Speech types. Teams81, 89, 100 and 104 also used dimensionality reductiontechniques on their features. A common characteristicof most of the participating teams was the use ofmachine learning techniques in general. Half of themused Support Vector Machines (SVM) for the classifica-tion (teams 81, 89, 90, 92, 100), and most of those com-bined the SVM with other supervised methods (81:(their own) Variable Trigonometric Threshold linearclassifier, 89: Naïve Bayes, 90: Logistic Regression, 100:
Nearest Neighbour). Team 70 used Nearest Neighbour,104 Naïve Bayes, 73 Large Margin class with Huber lossfunction, and team 65 used a Maximum Entropy classi-fier. For ACT, Team 90 devised two independent sys-tems one using SVM and the other using LogisticRegression.
IMTIMT annotation dataThe annotations provided for the IMT task test set hadbeen produced by the BioGRID and MINT databasecurators. Both follow a slightly different article selectioncriteria. In case of MINT, they carry out an exhaustivejournal curation, examining each article for a specifiedtime period given a selected journal, while BioGRID isprimarily interested in curation of articles for a particu-lar organism of interest. For this task, both databasesagreed to use the same curation standards. Due to theconsiderable workload associated with producing therequested interaction detection method annotations forfull text articles, the test set size was limited to 223 arti-cles (see table 2). Nevertheless, for implementing theirsystems we were able to compile a large collection oftraining and development set articles with annotations,enough to build supervised learning methods that basi-cally consider this task as a multi-class classification sce-nario. As only a small set of journals were used as testset, there were some differences in the distribution ofmethods across the three data collections provided, asshown in Figure 1.IMT team resultsIn total, eight teams participated in this task. The officialevaluation results of each run are shown in table 5,measuring the performance on the documents for whichthe system provided results (results averaged over theper-document scores are called “macro-averaged”results). The evaluation of the overall performance ofthe systems on the whole test set is shown in table 6 (i.e., calculated from the summed up true/false positiveand true/false negative counts over all documents -“micro-averaged” results), while the corresponding teaminformation details can be obtained from Table 3. Aswith the ACT, teams could participate offline, sendingthe results via e-mail, as well as online via the BioCrea-tive Meta-Server (BCMS) [40]. In case of the macro-averaged results the highest AUC iP/R achieved by anysubmission was 52.974%, obtained by run 3 of team 90(with an F-score of 54.616). Run 3 of team 70 reachedthe overall best precision of 80.00% at a recall of 41.50%(F-score of 51.508, but predictions are only available for30 documents). Run 5 of Team 65 was the only one toachieve full recall (100%) while at the same time man-taining an AUC of 50.11%, just marginally lower thanthe best one. The most competitive F-score was of 55.06
Krallinger et al. BMC Bioinformatics 2011, 12(Suppl 8):S3http://www.biomedcentral.com/1471-2105/12/S8/S3
Page 11 of 31
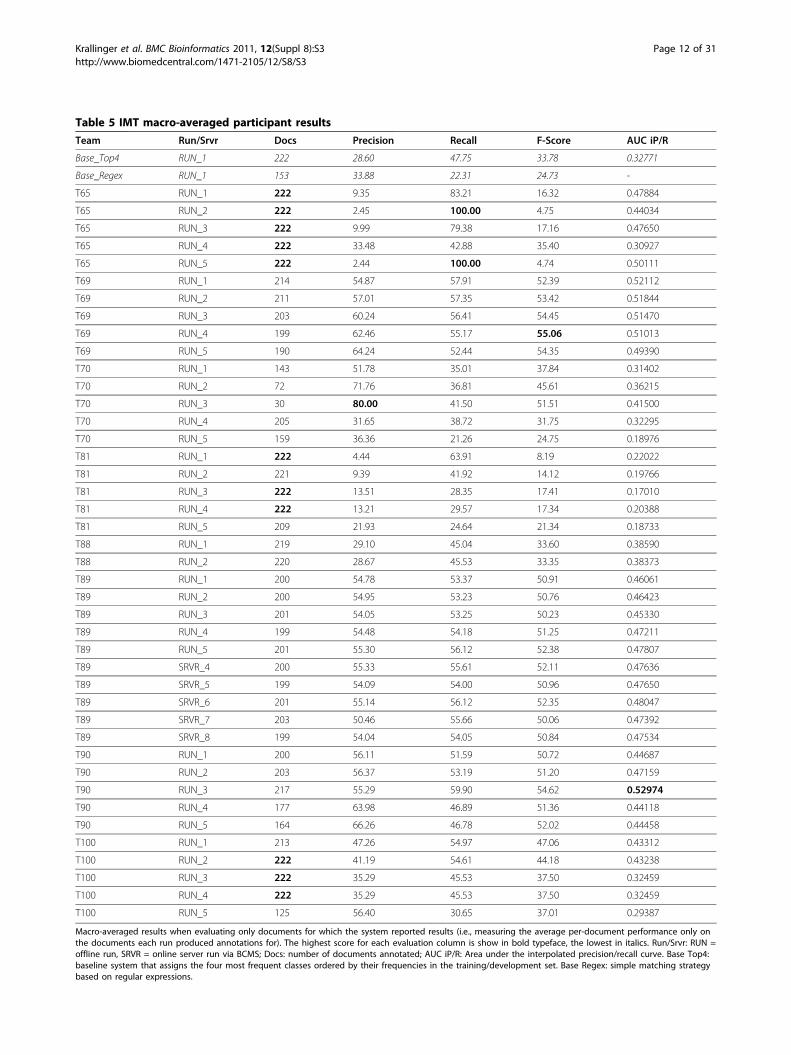
Table 5 IMT macro-averaged participant resultsTeam Run/Srvr Docs Precision Recall F-Score AUC iP/R
Base_Top4 RUN_1 222 28.60 47.75 33.78 0.32771
Base_Regex RUN_1 153 33.88 22.31 24.73 -
T65 RUN_1 222 9.35 83.21 16.32 0.47884
T65 RUN_2 222 2.45 100.00 4.75 0.44034
T65 RUN_3 222 9.99 79.38 17.16 0.47650
T65 RUN_4 222 33.48 42.88 35.40 0.30927
T65 RUN_5 222 2.44 100.00 4.74 0.50111
T69 RUN_1 214 54.87 57.91 52.39 0.52112
T69 RUN_2 211 57.01 57.35 53.42 0.51844
T69 RUN_3 203 60.24 56.41 54.45 0.51470
T69 RUN_4 199 62.46 55.17 55.06 0.51013
T69 RUN_5 190 64.24 52.44 54.35 0.49390
T70 RUN_1 143 51.78 35.01 37.84 0.31402
T70 RUN_2 72 71.76 36.81 45.61 0.36215
T70 RUN_3 30 80.00 41.50 51.51 0.41500
T70 RUN_4 205 31.65 38.72 31.75 0.32295
T70 RUN_5 159 36.36 21.26 24.75 0.18976
T81 RUN_1 222 4.44 63.91 8.19 0.22022
T81 RUN_2 221 9.39 41.92 14.12 0.19766
T81 RUN_3 222 13.51 28.35 17.41 0.17010
T81 RUN_4 222 13.21 29.57 17.34 0.20388
T81 RUN_5 209 21.93 24.64 21.34 0.18733
T88 RUN_1 219 29.10 45.04 33.60 0.38590
T88 RUN_2 220 28.67 45.53 33.35 0.38373
T89 RUN_1 200 54.78 53.37 50.91 0.46061
T89 RUN_2 200 54.95 53.23 50.76 0.46423
T89 RUN_3 201 54.05 53.25 50.23 0.45330
T89 RUN_4 199 54.48 54.18 51.25 0.47211
T89 RUN_5 201 55.30 56.12 52.38 0.47807
T89 SRVR_4 200 55.33 55.61 52.11 0.47636
T89 SRVR_5 199 54.09 54.00 50.96 0.47650
T89 SRVR_6 201 55.14 56.12 52.35 0.48047
T89 SRVR_7 203 50.46 55.66 50.06 0.47392
T89 SRVR_8 199 54.04 54.05 50.84 0.47534
T90 RUN_1 200 56.11 51.59 50.72 0.44687
T90 RUN_2 203 56.37 53.19 51.20 0.47159
T90 RUN_3 217 55.29 59.90 54.62 0.52974
T90 RUN_4 177 63.98 46.89 51.36 0.44118
T90 RUN_5 164 66.26 46.78 52.02 0.44458
T100 RUN_1 213 47.26 54.97 47.06 0.43312
T100 RUN_2 222 41.19 54.61 44.18 0.43238
T100 RUN_3 222 35.29 45.53 37.50 0.32459
T100 RUN_4 222 35.29 45.53 37.50 0.32459
T100 RUN_5 125 56.40 30.65 37.01 0.29387
Macro-averaged results when evaluating only documents for which the system reported results (i.e., measuring the average per-document performance only onthe documents each run produced annotations for). The highest score for each evaluation column is show in bold typeface, the lowest in italics. Run/Srvr: RUN =offline run, SRVR = online server run via BCMS; Docs: number of documents annotated; AUC iP/R: Area under the interpolated precision/recall curve. Base Top4:baseline system that assigns the four most frequent classes ordered by their frequencies in the training/development set. Base Regex: simple matching strategybased on regular expressions.
Krallinger et al. BMC Bioinformatics 2011, 12(Suppl 8):S3http://www.biomedcentral.com/1471-2105/12/S8/S3
Page 12 of 31
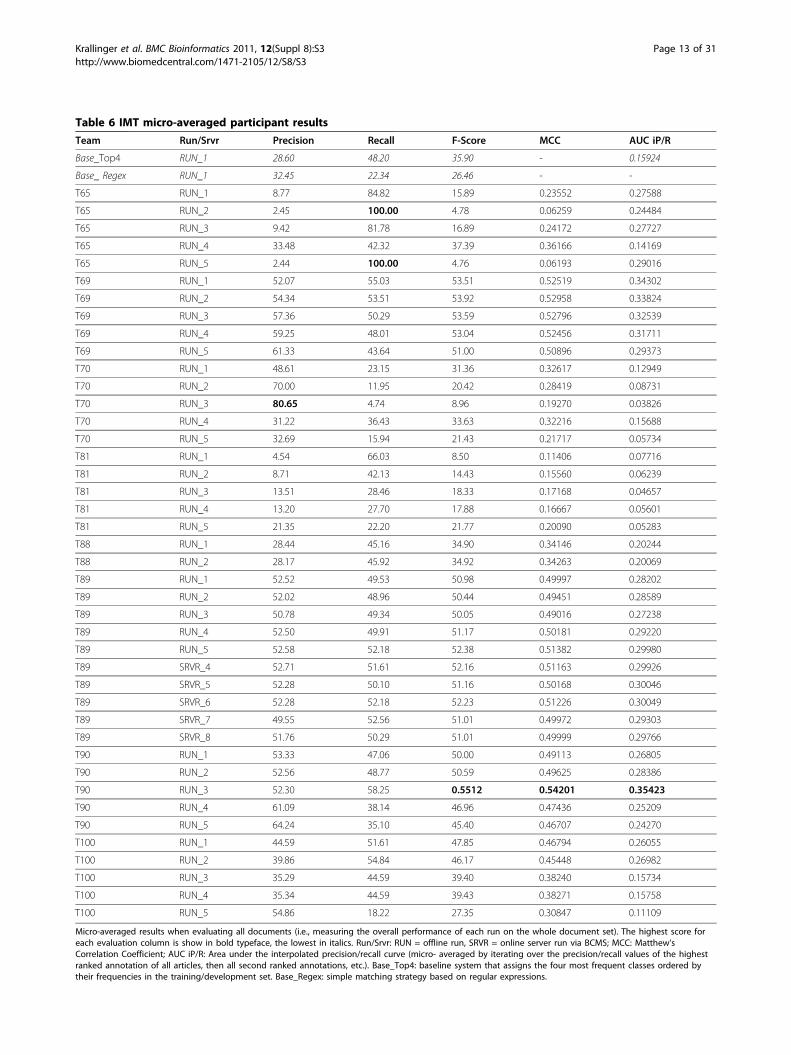
Table 6 IMT micro-averaged participant resultsTeam Run/Srvr Precision Recall F-Score MCC AUC iP/R
Base_Top4 RUN_1 28.60 48.20 35.90 - 0.15924
Base_ Regex RUN_1 32.45 22.34 26.46 - -
T65 RUN_1 8.77 84.82 15.89 0.23552 0.27588
T65 RUN_2 2.45 100.00 4.78 0.06259 0.24484
T65 RUN_3 9.42 81.78 16.89 0.24172 0.27727
T65 RUN_4 33.48 42.32 37.39 0.36166 0.14169
T65 RUN_5 2.44 100.00 4.76 0.06193 0.29016
T69 RUN_1 52.07 55.03 53.51 0.52519 0.34302
T69 RUN_2 54.34 53.51 53.92 0.52958 0.33824
T69 RUN_3 57.36 50.29 53.59 0.52796 0.32539
T69 RUN_4 59.25 48.01 53.04 0.52456 0.31711
T69 RUN_5 61.33 43.64 51.00 0.50896 0.29373
T70 RUN_1 48.61 23.15 31.36 0.32617 0.12949
T70 RUN_2 70.00 11.95 20.42 0.28419 0.08731
T70 RUN_3 80.65 4.74 8.96 0.19270 0.03826
T70 RUN_4 31.22 36.43 33.63 0.32216 0.15688
T70 RUN_5 32.69 15.94 21.43 0.21717 0.05734
T81 RUN_1 4.54 66.03 8.50 0.11406 0.07716
T81 RUN_2 8.71 42.13 14.43 0.15560 0.06239
T81 RUN_3 13.51 28.46 18.33 0.17168 0.04657
T81 RUN_4 13.20 27.70 17.88 0.16667 0.05601
T81 RUN_5 21.35 22.20 21.77 0.20090 0.05283
T88 RUN_1 28.44 45.16 34.90 0.34146 0.20244
T88 RUN_2 28.17 45.92 34.92 0.34263 0.20069
T89 RUN_1 52.52 49.53 50.98 0.49997 0.28202
T89 RUN_2 52.02 48.96 50.44 0.49451 0.28589
T89 RUN_3 50.78 49.34 50.05 0.49016 0.27238
T89 RUN_4 52.50 49.91 51.17 0.50181 0.29220
T89 RUN_5 52.58 52.18 52.38 0.51382 0.29980
T89 SRVR_4 52.71 51.61 52.16 0.51163 0.29926
T89 SRVR_5 52.28 50.10 51.16 0.50168 0.30046
T89 SRVR_6 52.28 52.18 52.23 0.51226 0.30049
T89 SRVR_7 49.55 52.56 51.01 0.49972 0.29303
T89 SRVR_8 51.76 50.29 51.01 0.49999 0.29766
T90 RUN_1 53.33 47.06 50.00 0.49113 0.26805
T90 RUN_2 52.56 48.77 50.59 0.49625 0.28386
T90 RUN_3 52.30 58.25 0.5512 0.54201 0.35423
T90 RUN_4 61.09 38.14 46.96 0.47436 0.25209
T90 RUN_5 64.24 35.10 45.40 0.46707 0.24270
T100 RUN_1 44.59 51.61 47.85 0.46794 0.26055
T100 RUN_2 39.86 54.84 46.17 0.45448 0.26982
T100 RUN_3 35.29 44.59 39.40 0.38240 0.15734
T100 RUN_4 35.34 44.59 39.43 0.38271 0.15758
T100 RUN_5 54.86 18.22 27.35 0.30847 0.11109
Micro-averaged results when evaluating all documents (i.e., measuring the overall performance of each run on the whole document set). The highest score foreach evaluation column is show in bold typeface, the lowest in italics. Run/Srvr: RUN = offline run, SRVR = online server run via BCMS; MCC: Matthew’sCorrelation Coefficient; AUC iP/R: Area under the interpolated precision/recall curve (micro- averaged by iterating over the precision/recall values of the highestranked annotation of all articles, then all second ranked annotations, etc.). Base_Top4: baseline system that assigns the four most frequent classes ordered bytheir frequencies in the training/development set. Base_Regex: simple matching strategy based on regular expressions.
Krallinger et al. BMC Bioinformatics 2011, 12(Suppl 8):S3http://www.biomedcentral.com/1471-2105/12/S8/S3
Page 13 of 31
(62.46% precision, 55.17% recall, based on 199 docu-ments), obtained by Team 69 run 4. With respect to themicro-averaged results, the best prediction correspondedto run 3 of team 90. It obtained a precision of 52.30%,recall of 58.25%, F-score of 55.117, MCC of 0.5420, andAUC iP/R of 0.3542. By using the BCMS framework forparticipating online, we were able to measure the time ittook the systems to report interaction method identifiersfor full-text articles. However, there was only one team(89) participating online in this task, albeit with 5 ser-vers and quite competitive results. This team annotateda full-text article on average in 3.7 seconds (sd: ±0.35sec), and achieved a maximum F-Score score of 52%with an AUC iP/R of 48%.In order to interpret the performance scores it is
important to put them into context. As already men-tioned, some of the interaction methods appear more fre-quently in the training and development sets. This mightlead to the assumption that such a distribution can beused to derive a sort of statistical baseline prediction,using the most frequent classes in the test/developmentset (brown colored classes in Figure 1) to establish abaseline qualifier. A simple statistical baseline was gener-ated by assigning the four most frequent classes, consti-tuting more than 50% of all assignments in the training/development set, to every test set articles, ranked/orderedby their frequency in the training/development set. Theresulting scores are shown in tables 5 and 6. Theimprovement over this distribution baseline when con-sidering submitted runs is +0.21283 (163%, from 0.33777to 0.55060) in case of F-score and +0.20203 (162%) incase of AUC iP/R (from 0.32771 to 0.52974) from macro-averaged scores. As for micro-averaged scores, evaluatedteam runs improve the F-score by +0.1922 (154%, from0.35901 to 0.55117) and AUC iP/R by +0.1950 (222%,from 0.15924 to 0.35423). However, the statistical base-line is not associated to any evidence text passages; Theannotations cannot be interpreted by human curators,and thus have only limited practical value.A very common approach to link lexical entries to free
text is by using term-lookup strategies, often by usingeither string matching or more competitive matching stra-tegies (e.g., regular expressions). To compare the value ofthe resulting tools to such a baseline regular expressionmethod, an additional comparative analysis has been car-ried out. For the Regex baseline system, a regular expres-sion is formed for each of the method names (conceptname, not synonyms). The text is matched against each ofthe regular expressions, and if there is a successful match,the association to the corresponding method is reported.This baseline system was included in the distribution fileson the BioCreative web page. The improvement of thebest run over the Regex baseline in terms of macro-aver-aged f-score was +0.2128 and for the micro-averaged f-
score even +0.2865. Aspects related to the method ranking(AUC iP/R) were not examined, as this system does notproduce a proper ranking.Participant technologies used for IMTThe participants were asked to fill in a short question-naire, and all participants responded. Only one team(81) used other sources of training data than what wasprovided through the challenge itself, one team madeuse of the UMLS (69) and two of MeSH terms (90,100). Most teams relied on the provided text weextracted using the UNIX tool ‘pdftotext’, while Team100 made use of the PDFs directly. Most teams incorpo-rated lexical analysis of the text (sentence splitting, toke-nization and/or lemmatization/stemming), quite a fewlooked at n-gram tokens (teams 81, 89, 90, 100), butonly one also included Part-of-Speech-tagging (team90), and, interestingly, some teams omitted a specializedNamed Entity Recognition approach (NER; teams 81,89, 100; instead using regex matching). Team 90 evenmade use of shallow parsing techniques. All teamsexcept 81 relied on Bag-of-Word vectors, and teams 70and 88 did not use any supervised classifiers. Teams 90and 69 were the only teams to use a Logistic Regressionclassifier trained on each term, team 90 also applied aSupport Vector Machine, and team 69 used MALLETfor NER. Other than that, no team reported use of exist-ing BioNLP libraries, instead relying mainly on in-housetools. Only teams 90 and 65 applied gene/protein men-tion detection. In order to weight unigrams and bigramsfeatures, team 89 calculated mutual information and chisquare values. This team reported that these featureswere ranked the highest for them after feature selection,and that an additional feature for node popularity wasvery useful for this task. Chi square statistics were alsoused to score collocations and bigrams in case of team65. We also asked teams to evaluate the difficulty of thetask (easy, medium, hard); No team thought the taskwas easy, half (70, 89, 90, 100) said is was hard, whilethe other four (65, 69, 81, 88) classified it as ‘medium’.
Online participationIn addition to offline participation (sending the systemresults by email), the BioCreative Meta-Server (BCMS)[40] framework was provided to participants, usingexactly the same setup as for BC II.5 [15]. This enabledonline participation, submitting results via web servicecalls. This online submission allows measuring the timeit takes systems to report results for the articles theyannotate. However, there was only one team (89) parti-cipating online in the method sub-task (IMT) and onlytwo (81 and 89) in the article classification sub-task(ACT). Team 89 annotated full-text articles (IMT) onaverage in a surprisingly short period of time - 3.7 sec-onds (sd: ±0.35 sec) - achieving a maximum F-Score
Krallinger et al. BMC Bioinformatics 2011, 12(Suppl 8):S3http://www.biomedcentral.com/1471-2105/12/S8/S3
Page 14 of 31
score of 52% with an AUC iP/R of 48%. Team 81 anno-tated ACT Medline abstracts on average in 20 seconds(sd: ±12 sec) and although the maximum MCC scorewas only 0.11, their best AUC iP/R was 50% (Server 10).The second team, 89, did even better in the online ACTwith an average of 1.9 seconds (sd: ±0.57 sec) perabstract, achieving a maximum MCC score of 0.61 (Ser-ver 8); their best AUC iP/R score was 58% (Server 5).The timing results match fairly well with the resultsfound during BC II.5, although the combined time andperformance of team 89 is an slight advancement overBC II.5 (best online ACT team in BC II.5, by MCCscore: Team 9, Server 29, with MCC 0.583, average time22 seconds/article). However, the results are not neces-sarily comparable, as the BC II.5 ACT was carried outon full-text articles, while for BC III Medline abstractswere used. Moreover, in BC II.5, a single journal with adifferent class imbalance was used as opposed to therange of curation relevant journals utilized in BC III. Onthe other hand, timing of annotating full-text IMT arti-cles compared to the interacting protein normalizationtask (INT) of BC II.5 - also on full-text - can be seen ascomparable on the basis of article sizes if one disregardsthe fact that the namespace of proteins (INT, II.5) isprobably much larger than that of method names (IMT,III). The fastest server in BC II.5 (T42, S20), performedat 14 sec/article - compared to 3.7 sec/article by T89(see above), a nearly 4-fold improvement.
Individual system descriptionsAll participating teams were requested to provide ashort technical summary on the strategy used for parti-cipation in the PPI task. Team summaries are orderedbased on the team identifier.Team 65: Gerold Schneider and Fabio Rinaldi (ACT, IMT)Team 65 (OntoGene) included the following members:Fabio Rinaldi, Gerold Schneider, Simon Clematide, Mar-tin Romacker, Therese Vachon. The OntoGene researchgroup at the University of Zurich has developed compe-titive tools for the extraction of mentions of protein-protein interactions (PPI) from the scientific literaturethrough participation in previous BioCreative editions[11,41]. While Team 65 had previously obtained goodresults in the task of extracting supporting informationabout the interactions, such as experimental methods[42], this team never considered before participation tothe ACT task, which appears at first sight a pure docu-ment classification task where an NLP-rich approachwould not be able to provide a significant contribution.The participation to the ACT task of BioCreative III
was motivated by the desire to dispel this negativeassumption through enrichment of a traditional machinelearning (ML) approach with features derived from theirPPI pipeline. Three of the Team 65 runs apply
Maximum Entropy optimization (using the MEGAMtool [43]). Features include lexical items, MeSH annota-tions, plus crucially a score delivered by their PPI detec-tion pipeline. Two runs used only results of theirprotein-protein interaction detection pipeline (as devel-oped for BC II.5), for comparison.The feature weights used for the test set were drawn
from the development set only. Including the balanced(but therefore biased) training set degraded the resultson the development set. To keep training efficient andprevent over-training, Team 65 used frequency thresh-olding and feature selection to cut the set of features to20,000. The submitted runs optimize for different eva-luation metrics. The results proved to be competitive,reaching 3rd or 4th rank for each of the measuresselected by the organizers.It is interesting to notice that the best system used a
similar approach, based on a dependency parser. How-ever, that team made a richer use of the features deliv-ered by the parser. These results prove that an NLP-based pipeline for PPI extraction definitely provides apositive contribution towards the solution of the ACTtask.For the PPI-IMT task, the OntoGene group developed
two statistical systems (called system A and system Bhere). Both are based on a Naïve Bayes approach butuse different optimizations and heuristics. System B is avery generic Naïve Bayes multiclass classifier, whereassystem A was optimized for IMT, taking into accountterminological information obtained from the PSI-MIontology.For each of the two systems, two runs aiming at maxi-
mizing AUC and F-score were submitted. Additionally, afifth run combining the max AUC runs of both systemswas submitted. Best precision can always be obtained bytaking only the best ranked method for each article, sono specific run aiming at optimizing precision wassubmitted.Nearly all of the runs have very high recall, two of
them even reaching 100% (no other participant systemcould reach full recall, the next best result was 66.03%).Run 5 is particularly remarkable as it combines fullrecall with high AUC iP/R (0.501), which is only mar-ginally less than the best results in the competition -0.5297, which however has much lower recall. For asemi-automated curation application, the configurationof near-total recall with good ranking is probably opti-mal. More details of this approach can be found inSchneider et al, same volume.Team 69: Robert Leaman and Graciela Gonzalez (IMT)Team 69 included the following members: Robert Lea-man, Ryan Sullivan, Graciela Gonzalez. The system ofteam 69 modeled the detection of interaction methodsin a document as a set of document-level classification
Krallinger et al. BMC Bioinformatics 2011, 12(Suppl 8):S3http://www.biomedcentral.com/1471-2105/12/S8/S3
Page 15 of 31
problems. For each interaction detection method Team69 trained one machine learning classifier to detectwhether the method was mentioned at least once in anentire document. Each interaction detection method wasclassified independently, without regard for any subtypesor supertypes of the method. System input consisted ofthe pdftotext version of each article, and system outputconsisted primarily of the probability that each interac-tion detection method was mentioned somewhere in thedocument according to the classifier for that interactionmethod. This system also found support statements byapplying the classifiers trained at the document level toeach sentence in the document, then taking the sen-tence from the document with the highest probabilityoutput by the classifier as the support for the corre-sponding interaction detection method.Preprocessing steps performed by this system include
sentence-breaking, tokenization, normalizing case andUnicode characters, stop word removal [44] and stem-ming [45]. All classifiers used the same feature set, con-sisting of term and lexicon membership features. Termfeatures are binary-valued and indicate the presence orabsence of a single stemmed token within the document.Strict lexicon membership features are also binary-valuedand indicate whether there was a sentence within thedocument that contained all of the tokens from any ofthe names of the detection method being located. Fuzzylexicon membership features are similar to strict lexiconmembership except that they are real-valued, represent-ing the proportion of the tokens of the interaction detec-tion method name that the sentence contains. Theirlexicon of interaction detection method names was com-piled primarily from the name, synonyms and uniqueidentifiers (e.g. ‘MI:0006’) from the PSI-MI ontology [46].Team 69 added approximately 40 additional synonymsby locating concepts in the UMLS Metathesaurus [47]from semantic types such as ‘Laboratory Procedure’which share a name with a concept in the PSI-MI ontol-ogy. All names in the lexicon were preprocessed in thesame manner as the document text.Logistic regression, as implemented by MALLET [48],
was used for all classifiers. Documents from the trainingdata annotated with a given interaction detectionmethod were taken as positive instances of that method,and all other documents were considered negativeinstances of the method. No data was used for trainingother than the data provided for the task. The classifierswere trained using L1 regularization, via the orthant-wise limited memory quasi-Newton algorithm (OWL-QT) [49]. L1 regularization typically creates a sparsemodel, meaning that the weight of most parameters isset to zero. This is in contrast to L2 regularization,which usually learns many weights that approach zeroasymptotically. L1 regularization therefore has many of
the same advantages as feature selection, such asincreased interpretability and allowing faster inference.In addition, L1 regularized models have been shown tobe more robust to irrelevant features than L2 regularizedmodels, since the amount of training data needed risesonly logarithmically in the number of irrelevant featurespresent [50]. Team 69 found in their experiments thattraining with L1 regularization resulted in approximately3.3% higher F-measure and 4.9% AUC iP/R than train-ing with L2 regularization.Team 70: Sérgio Matos (ACT, IMT)Team 70 included the following members: Sérgio Matos,David Campos, José L. Olivera. The proposed method ofTeam 70 for the ACT subtask makes use of the domainterminology in a vector-space classification approach[51]. Basically, the documents in the training set arerepresented as vectors of biologically relevant words, towhich the unclassified documents are compared. Theunderlying lexicon includes a list of interaction methodsfrom the Interaction Method Ontology (PSI-MI) [46],distributed by the organizers for the PPI-IMT task, andbiologically relevant words, extracted from the BioLexi-con resource [52]. Document vectors are stored as aLucene [53] index with the following structure: thedocument identifier, for referencing purposes, the docu-ment classification (1 for relevant; 0 for non-relevant),and two text fields, one for the textual occurrences ofthe lexicon terms and the other for the correspondinglemmas. The use of lemmas allows normalizing relatedterms to a single lexical entry. In this case, the BioLexi-con terms are normalized to the infinitive form of theverb (for example, ‘interacts’, ‘interacting’ and ‘interac-tion’ are all normalized to ‘interact’).During the classification of a new document, each
occurrence of a lexicon term (or the correspondinglemma) is added to the query string, which is then usedto search the index. From this search, the top M docu-ments are retrieved, together with the correspondingclassifications and Lucene similarity scores. The classprobability for the new document is then calculated asthe sum of the similarity scores for each class, normal-ized by the sum of the scores for the M documents. Athreshold, corresponding to the operating point of theclassifier, is then used by Team 70 to select the class forthat document. Term normalization, by using lemmas,allowed improvements in AUC iP/R between 3% (for M= 50) and 6% (for M = 500), compared to the use of thetextual occurrence of the lexicon terms.For the IMT subtask the approach followed by Team
70 was to find mentions of methods names and syno-nyms in the texts and apply a very simple heuristic tovalidate and rank the classifications. To facilitateapproximate string searches, all documents in the testset were added to a Lucene index. This index is then
Krallinger et al. BMC Bioinformatics 2011, 12(Suppl 8):S3http://www.biomedcentral.com/1471-2105/12/S8/S3
Page 16 of 31
searched for each entry in the dictionary of methodsnames - provided by the task organizers - and the top100 documents for each search are retrieved. For syno-nyms of the same method (same PSI-MI identifier), thedocument scores are added together. Finally, a methodID is assigned to a document if that document/methodscore is above a preset threshold.The use of domain terminologies and vector-space
models for classification of PPI relevant documents pro-vided encouraging results. The use of other lexical andontological resources (e.g. Gene Ontology terms) mayhelp improve the results obtained. Comparing to the useof classification models, such as SVMs, the proposedapproach has the advantage that adding more classifieddocuments as new information to the classifier onlyinvolves adding those documents, with the correspond-ing classification, to the index.Team 73: Sun Kim and W. John Wilbur (ACT)Team 73 included the following members: Sun Kim, W.John Wilbur. Protein-protein interactions (PPIs) in bio-medical literature can be interpreted as a series ofdependency relationships between words. Hence, captur-ing this information is key in detecting PPI informationat both the article and sentence level. The main focus ofTeam 73 in the ACT task was to explore the usefulnessof the syntactic information in addition to conventionalapproaches. The system proposed by Team 73 has threedifferent modules, gene mention detection, featureextraction, and classifiers. The feature extraction moduleconsists of two parts, word-based and relation-based fea-ture extraction. Word-based features include the com-mon feature sets such as n-grams and strings. Relation-based features are basically a set of dependency relation-ships between words at the sentence level.As the first step of the filtering process, gene and pro-
tein names are tagged using the Priority model [54].This step is essential because, in PPI events, proteinnames are the most important words triggering PPIdescriptions. The Priority model was developed in thegroup of Team 73 to overcome the pitfall of other sta-tistical approaches by emphasizing the right-most wordsin a candidate phrase. Next, gene-tagged articles arefurther processed to obtain features for a data-drivenclassifier. The highlighted feature in word-based extrac-tion is MeSH terms. MeSH is a thesaurus for indexingand searching biomedical literature, hence this con-trolled vocabulary is a good indicator of an article’stopic. Relation-based features investigate the dependencyrelationships between words. By using a dependencyparser [55], a head word and a dependent word aredetermined as a two-word combination. Furthermore,gene names are alternatively anonymized by replacing aspecific gene name with a common tag, e.g., ‘PROTEIN’,which reduces the total number of features while leaving
dependency information intact. Another aspect of fea-tures considered by Team 73 is to extract higher-orderpatterns by evaluating a set of feature combinations.This process adds combination features that aredetected as useful for the classifier. The last step of PPIarticle filtering is to learn to classify articles based onthe extracted features. The constraint here is to mini-mize computational cost and processing time with rea-sonable classification performance. To achieve thispurpose, a large margin classifier with Huber loss func-tion [56] was adopted by Team 73. The Huber classifieris a linear predictor using a simple gradient descentlearning algorithm, which results in excellent perfor-mance competitive with support vector machineclassifiers.Although the current approach has room for improve-
ment, it produced the top-ranked performance in theBioCreative III ACT task by achieving 89.15% accuracy,0.55306 MCC, 61.42% F-score, and 67.98% AUC in dif-ferent data/feature combinations. As a result, Team 73found that syntactic patterns along with word featurescan effectively help distinguish between PPI and non-PPI articles, in particular, with a limited training corpus.More details of this approach can be found in [57].Team 81: Luis Rocha (ACT, IMT)Team 81 included the following members: Luis M.Rocha, Anália Lourenço, Michael Conover, AzadehNematzadeh, Fengxia Pan, Andrew Wong, Hagit Shat-kay. For the ACT Team 81 participated in both theonline submission via the BioCreative MetaServer plat-form, as well as the offline component of the Challenge.Team 81 used three distinct classifiers: (1) the pre-viously developed Variable Trigonometric Threshold(VTT) linear classifier [58,59] which employs word-pairtextual features and protein counts extracted using theABNER tool [60], (2) a novel version of VTT thatincludes various NER features as well as various sourcesof textual features [61], and (3) a Support VectorMachine that takes as features various entity count fea-tures from the NER tools team 81 tested. In addition totesting the power of available NER tools for classifica-tion of documents relevant for Protein-Protein Interac-tion, members of Team 81 were interested ininvestigating the advantages of using full-text data onthe classification. Team 81 utilized the following NERtools and dictionaries: ABNER, NLProt, Oscar 3, ChEBI(Chemical names), PSI-MI, MeSH terms, and BRENDAenzyme names. Team 81 also used the output of theirInteraction Methods Task pipeline as an additionalannotation tool. While their submitted results sufferedfrom many errors due to NER pipeline integration,Team 81 has since fixed the errors and obtained excel-lent classification results on training data, even whenusing simply feature counts (e.g. number of methods
Krallinger et al. BMC Bioinformatics 2011, 12(Suppl 8):S3http://www.biomedcentral.com/1471-2105/12/S8/S3
Page 17 of 31
identified by PSI-MI in a document) from a few NERtools [61]. To address the IMT, Team 81 employed astatistical approach. Unlike most teams, which usedNLP and/or classification of documents into the manydifferent possible classes - corresponding to the manycandidate methods - team 81 looked directly within thetext for experimental evidence. That is, Team 81 lookedwithin the text for candidate short passages likely toindicate experimental methods, used simple patternmatching to identify the method within the passage, andranked candidate matches according to statistical con-siderations. To find candidate passages in text, Team 81used classifiers they have developed independently [62],which were trained on a corpus of 10,000 sentencesfrom full-text biomedical articles, tagged along fivedimensions: focus (methodological, scientific or generic),type of evidence (experimental, reference, and a fewother types), level of confidence (from 0 - no confi-dence, to 3 - absolute certainty), polarity (affirmative ornegative statement), and direction (e.g. up-regulation vs.down-regulation). This corpus is available at: http://www.ncbi.nlm.nih.gov/pmc/articles/PMC2678295/bin/pcbi.1000391.s002.zip. While this corpus was not con-cerned with protein-protein interactions, the classifiertrained on the Focus dimension showed high sensitivityand specificity in identifying Methods sentences. Usingthe text files provided by the BioCreative organizers,Team 81 broke the corpus into sentences (modifyingthe Lingua-EN-Sentence Perl module [63]), and elimi-nated bibliographic references using simple rules. Theremaining sentences were represented as term vectorsand classified according to their Focus, utilizing an SVMclassifier [62], thus identifying candidate sentences thatmay discuss methods. Method Identifiers were thenassociated with the latter sentences by simple pattern-matching to PSI-MI ontology terms. The matches werethen scored using a strategy described later in thisvolume, and high-scoring methods were reported alongwith the sentences as evidence.Team 88: Ashish V Tendulkar (ACT, IMT)Team 88 included the following members: Ashish VTendulkar, Aniket Rangrej, Vishal Raut. Team 88 devel-oped a maximum entropy classifier for PPI abstract clas-sification task. The goal was to develop a classifier thattakes biologically relevant clues as features while classi-fying the abstract. Team 88 used PSI-MI ontology forextracting features from the abstract and the title. Theydeveloped a dictionary based tagger for tagging men-tions of PSI-MI concepts from different levels. In addi-tion to these features, Team 88 used MESH termsprovided along with the abstract. On training data,Team 88 obtained 35% precision and 55% recall. Theybelieve that this is an interesting direction of classifyingabstracts by constructing biologically relevant features.
The ACT classification system will be available at thefollowing URL: http://www.cse.iitm.ac.in/~ashish/research/ACT/Team 88 developed dictionary based NER for detec-
tion of interaction method mentions from text con-verted PDF files as provided by the organizers. Thesystem has the following components: (i) Dictionaryconstruction; (ii) Pre-processing of scientific article,which includes sentence splitting and division into var-ious sections; (iii) Interaction method NER; (iv) Post-processing. The dictionary was constructed by extendingPSI-MI ontology to incorporate common variations ofinteraction methods used in scientific literature. Thecommon variations include lower case lexicons, repla-cing space with hyphen, etc. The analysis of trainingdata revealed that the interaction methods are definitelymentioned in the experimental method section and attimes in the abstract and title of the research papers.Team 88 further observed that the extraction from titleand abstract gives the best precision partly due to theiroriginal availability in text form and hence does notcontain noisy characters as introduced in other partsdue to PDF to text conversion. Thus, detecting thesementions reduces the number of false positives thatwould have been obtained from other sections of thepaper. Further, Team 88 also observed that detecting allmentions in experimental methods section is sufficientto ensure high recall of the system. In order to takeadvantage of these observations, Team 88 first dividedthe article into different parts along the section bound-aries. The standard division included abstract, introduc-tion, results, discussion and experimental method. Themain challenge here is to detect section headings fromthe article in text format obtained via PDF to text(pdftotext) conversion. Team 88 used several clues fordetecting them: (i) The section header is usually inupper case or capitalized; (ii) they have standard names,which vary from journal to journal. Ideally, Team 88would like to detect these names independent of jour-nals, but in this implementation, Team 88 relied on amanually constructed dictionary of journal-specific sec-tion headers. They first obtain the journal in which thepaper has appeared and use the appropriate sectionheaders. Team 88 ignored the list of references andother sections like acknowledgements, but notes thatthe acknowledgement section contains strong cluesabout interaction detection method, since it containsreferences to certain facilities used for conducting theprotein-protein interaction detection experiments. Team88, however, has not exploited these clues in their cur-rent implementation. Team 88 then divided each articleinto sentences and each sentence is assigned a tagdenoting the section in which it is appearing. Team 88implemented a dictionary based NER system for
Krallinger et al. BMC Bioinformatics 2011, 12(Suppl 8):S3http://www.biomedcentral.com/1471-2105/12/S8/S3
Page 18 of 31
detecting interaction method mentions. They firstdetected the mentions from the section describingexperimental procedure, then title and abstract, andthen from the remaining sections. The mentions fromabstract and experimental procedure section wereassigned highest confidence score. During the post-pro-cessing step, Team 88 disambiguated between the inter-action methods with overlapping tokens. They chose theinteraction method with longest match and discardedthe mention subsumed in the larger entity. The IMTextraction system will be made available at the followingURL: http://www.cse.iitm.ac.in/~ashish/research/IMT/Team 89: Shashank Agarwal and Feifan Liu (ACT, IMT)Team 89 included the following members: ShashankAgarwal, Feifan Liu, Hong Yu. Team 89 participated inboth PPI tasks. For the article classification task (ACT),supervised machine learning algorithms Support VectorMachines (SVMs) and multinomial Naïve Bayes (NB)algorithms were trained on the training data. Unigrams(individual words) and bigrams (two consecutive words)were used as features for the classifier. The mutualinformation between each feature and the class labelwas used to rank those features and either the top 400or top 1000 features were selected. For training, thetraining corpus of 2280 articles was combined with thedevelopment corpus of the 4000 articles. As the distri-bution of articles in the development corpus was thesame as the distribution expected in the test data, forsome runs, only the development corpus was used fortraining. The classifiers were trained using the freely-available Simple Classifier program https://sourceforge.net/projects/simpleclassify/ that was also developed byTeam 89, which is based on the Weka1 framework.The interaction methods task (IMT) was also
approached as a binary classification task. Each node inthe PSI-MI sub-ontology was considered to be indepen-dent of other nodes in the ontology, and an article-nodepair was considered as positive if the correspondinginteraction method was detected in that article, andnegative otherwise. The nodes were preprocessed; forsome nodes, synonyms were added manually, for exam-ple, ‘anti bait immunoprecipitation’ for ‘anti bait coim-munoprecipitation’. The concept name of a node and allsynonyms of the node were normalized (lowercased andlemmatized) and used separately. From each node’s con-cept name and synonym names, unigrams and bigramswere extracted. For each unigram and bigram, themutual information score and chi-square score were cal-culated. Machine learning classifiers were trained forIMT using 21 features. The features included checkingif the node’s concept or synonym name appears in thearticle, checking if the node’s concept or synonymnames’ unigrams or bigrams appear in the article, andthe sum of the mutual information score and chi-square
score of the unigrams and bigrams that appear in thearticle. The frequency with which a node appears in thetraining data was also used as a feature. Using these fea-tures, the OntoNorm framework https://sourceforge.net/projects/ontonorm/ was developed for this task, wheremachine learning algorithms Random Forest, RandomCommittee, Naïve Bayes Tree and J48 were explored.OntoNorm is based on the Weka [64] framework aswell.Team 90: Xinglong Wang and Rafal Rak (ACT, IMT)Team 90 included the following members: XinglongWang, Rafal Rak, Angelo Restificar, Chikashi Nobata, C.J. Rupp, Riza Theresa B. Batista-Navarro, Raheel Nawaz,Sophia Ananiadou. Pre-processing: Both IMT and ACTdocuments in plain-text format were pre-processedusing a number of linguistic processors, including toke-nisation, lemmatisation, part-of-speech tagging andchunking. The documents enriched by the linguistic fea-tures were then processed with a named entity recogni-ser, the same as used in our semantic search engineKleio [65], which exploits dictionaries and machinelearning methods to tag the following types of entities:genes, proteins, metabolites, organs, drugs, bacteria, dis-eases, symptoms, diagnostic/therapeutic procedures andphenomena.Additionally, for each IMT and ACT document, Team
90 retrieved its MeSH headings. The information ofinterest included descriptor names and identifiers, inboth their atomic and hierarchical form, with the lattermore closely representing the underlying structure ofMeSH. For IMT, Team 90 also manually constructed amapping from the 10 most frequent MI IDs (MolecularInteraction Ontology concept identifiers) as found in thetraining data to their corresponding MeSH descriptors.IMT: Team 90 approached IMT from two different
angles. One was based on a commonly used multi-class,multi-label document classification framework. Theother one involved translating the multi-class, multi-label classification to a binary classification problem byclassifying an exhaustive set of pairs of PSI-MI syno-nyms and text phrases (chunks) found in the docu-ments. Team 90 experimented with Logistic Regression(LR) and SVMs as underlying machine-learning methodsfor the former and SVM only for the latter, which werefer to hereafter as m-LR, m-SVM, and b-SVM, respec-tively. For m-LR and m-SVM they trained a series ofbinary classifiers, each corresponding to a single interac-tion method, using the one-vs-all strategy. For eachmodel the positive instances constitute the documentsthat are assigned the interaction method for which themodel is being built. The feature set used in trainingincluded the type and text of named entities, words sur-rounding the entities and the title of the section inwhich the entities occurred, as well as information
Krallinger et al. BMC Bioinformatics 2011, 12(Suppl 8):S3http://www.biomedcentral.com/1471-2105/12/S8/S3
Page 19 of 31
about whether word unigrams and character n-gramsfrom the MI definition and synonyms match those inthe surrounding context of the entities.During classification, a document is scored by all the
models and the decision whether it should be assignedan interaction method is based on a thresholding strat-egy. Team 90 primarily experimented with two thresh-olding strategies, the local (class-specific) score-basedoptimisation strategy, as well as its more commonlyused variant, the global (one for all classes) strategy.Both strategies assign a class to a document basedpurely on the score between the two and a given (localor global) threshold. Team 90 observed that the perfor-mance of their systems was improved considerably usingthe thresholding strategies when compared to applyingthe nominal threshold (probability equal to 0.5 in thecase of LR, and distance to a hyperplane equal to 0.0 inthe case of SVM).The b-SVM approach first explores noun phrases (NP)
and verb phrases (VP) in a document and collects thosethat are approximately similar to an interaction methodname in the PSI-MI ontology. The strength of similarityis determined by a string similarity measure. Aninstance - a pair chunk-method - is considered positiveif the document the chunk is coming from is assignedthe interaction method in the pair. Team 90 trained anSVM model by extracting a rich set of features fromeach pair in the training data.The features included the string similarity score, the
chunk’s adjacent words and named entities, informationabout whether the named entities occur in the definitionof the method, the title of the section where the textchunk occurs, and information whether the document’sMeSH headings match the interaction method based onthe manually created mapping. The analysis showed thatthe most valuable features were named entities.Team 90 also created simple ensemble systems by tak-
ing combinations of unions and intersections of classifi-cation outcomes produced by the above-mentionedsystems. As tested in a cross-validation setup, the threehighest performing ensemble systems were the union ofm-SVM and b-SVM, the intersection of m-LR and b-SVM, and the intersection of all the three systems.ACT: To get a better understanding of the task at
hand, Team 90 analysed a few randomly chosen positiveand negative sample abstracts from the training dataset,in terms of whether the presence of certain attributes inan abstract correlates with the assigned class (eitherpositive or negative). The attributes included proteinnames, verbs or nominalised verbs around proteinnames that signify protein interaction (involving morethan one participant), verbs or nominalised verbs nearprotein names signifying protein modification (involving
only one participant), as well as protein-related and bio-chemical-process-related MeSH headings.The features used in machine learning included the
bag of words, named entities, protein context words (insentences that contain at least one protein) with posi-tion information, and MeSH headings associated withthe document. Similarly to IMT, Team 90 adapted LRand SVM classifiers. The analysis showed that the mostdiscriminative features were the bags of words followedclosely by protein contextual features and MeSH head-ings, especially their hierarchical representation.Team 92: Keith Noto and Charles Elkan (ACT)Team 92 included the following members: Keith Noto,Charles Elkan. The submission for the ACT of team92 was the output from a system named PMAC(PubMed Article Classifier) [66] that classifies andranks biomedical articles based on features extractedfrom PubMed, and based only on positive trainingexamples. Because the submission was the result of afully automated system that needs no tuning of para-meters, only one run was submitted. The PMAC sys-tem is currently available free for public use at http://www.cs.tufts.edu/~noto/pmac. It is based on a tooldeveloped with NIH funding to help maintain andexpand TCDB, the Transporter Classification Databasehttp://www.tcdb.org[67].The PMAC system has wide utility because in many
article classification tasks, the only available labeledexamples are positive. Biomedical databases typically donot provide examples of articles that are not representa-tive of their domains of interest. PMAC uses a super-vised classification algorithm to distinguish betweenpositive and unlabeled articles. The system then adjuststhe trained model mathematically to account for thefact that a small fraction of unlabeled articles are actu-ally positive; for details see Elkan and Noto, KDD 2008[68]. The features that PMAC extracts from PubMed are
• Words in an article’s abstract,• Words in its title,• Author names and affiliations,• Journal name and publication type,• Chemical substances mentioned in the paper, and• MeSH descriptor and qualifier names.
Users may select some of these feature groups toexclude if desired, and they may select a subset ofjournals from which to present articles. For each arti-cle, the output of the classifier is the probability thatthe article is relevant. For classification, one maychoose a threshold probability. Or, if the class imbal-ance is known, PMAC returns the appropriate percen-tage of test set articles (this is what Team 92 did for
Krallinger et al. BMC Bioinformatics 2011, 12(Suppl 8):S3http://www.biomedcentral.com/1471-2105/12/S8/S3
Page 20 of 31
BioCreative III, ACT). Currently, PMAC uses an SVMclassifier with a linear kernel function, strength of reg-ularization selected using cross-validation on trainingdata, and Platt scaling to estimate probabilities ifnecessary. Feature weighting and feature selection arenot used. However, PMAC is compatible with anysupervised classifier that is capable of ranking articles.The classification and ranking time of PMAC is custo-mizable to a degree, because it depends on the size ofthe training set and in particular on how many unla-beled articles are included; the user may choose tolimit this number. In the BioCreative III article classifi-cation task, Team 92 used approximately 10,000 unla-beled articles and the classification and ranking wasdone in about 17 minutes (not including article down-load and feature extraction time, which may takeabout 1-2 seconds per article, but need only be exe-cuted once per article, and can be done separatelybeforehand). The process of retraining and reclassify-ing articles can take place periodically (e.g., overnight),so that PMAC users can look for relevant articlesinstantly as needed. Team 92 discusses the runningtime further and show the superior accuracy of thisapproach, in terms of precision and recall, comparedto hand-crafted rules in Sehgal et al., 2011 [69].The PMAC system automatically extracts article fea-
tures from PubMed, so the only input needed is a set ofPubMed ID numbers. Users of PMAC do not need toprovide any features, nor do they need to understandthe features used by PMAC. Compared to other submis-sions, there were two significant differences in the wayTeam 92 used the training data provided for the Bio-creative III article classification task. First, they did notuse the provided negative training instances (althoughthey did note the class imbalance). Second, they ignoredall the given training features, and used only featuresextracted from PubMed by PMAC.These differences presumably put the PMAC system
at a disadvantage, since it ignored a large amount ofrelevant information. However, PMAC performed betterthan the majority of participating systems, and achievedF-score within a few percent of the F-score of the bestsubmitted run. Therefore Team 92 can recommendwith confidence that biomedical researchers looking foran easy-to-use solution for classifying and ranking arti-cles should try PMAC.Team 100: Zhiyong Lu and Rezarta Islamaj Do!an (ACT,IMT)Team 100 included the following members: Zhiyong Lu,Rezarta Islamaj Do!an, Aurelie Neveol, Minlie Huang,Yi Yang. This team used machine learning for predictingwhether or not an article is about PPI in the ACT task.In addition to the training and development data sets ofBioCreative III, Team 100 used similar data sets from
BioCreative II and II.5. A noticeable aspect of theirwork is that in response to the class imbalance issue(ratio of positive/negative instances was roughly 1 to 5in the BioCreative III development set), they recruitedadditional negative instances by including MEDLINEarticles that are similar to the existing negatives usingPubMed related articles [70,71]. Their principle learnerfor machine learning is an SVM like classifier that usesmodified Huber loss function for handling large-scaledata [56]. In terms of features Team 100 experimentedwith various kinds, ranging from words to neighborhooddocuments. They first learned separate models for eachfeature type and then merged the results of differentfeatures when making final predictions. Team 100 sub-mitted a total of four offline runs. They investigatedthree types of word-based features with or without fea-ture selection. In addition to the traditional bag-of-words and bigrams (two consecutive words), this teamextended bigrams to any two co-occurring words in thesame sentence (co-occurring words). The 4th featuretype is a set of character strings of length 8 generatedby shifting an 8-character window from the beginningof a sentence to the end. For all these feature types,stop words were retained. In particular, stop words werefound useful in bigram features (e.g. interacting with).When feature selection was applied, Team 100 itera-tively evaluated the importance of each individual fea-ture through examination of their weights andsubsequently removed 1,000 features with the lowestweights (i.e. closest to zero). In the 1st run, only thebag-of-words feature was used along with feature selec-tion. In their 2nd and 3rd runs, the bigrams, co-occur-ring words and strings-of-length-8 features were usedindividually to yield three separate prediction results. Inmaking the final prediction, a test article was predictedto be PPI relevant if and only if all three individual pre-dicted classes were positive. Feature selection was usedin the 3rd run, but not in the 2nd. In the 4th run, Team100 combined 4 scores, two of which were produced bythe machine learner using the bag-of-words and bigramsfeatures. Two additional scores were computed: One isbased on the similarity scores of a test document to its10 closest neighbors. Specifically, the 10 scores wereseparated into two groups, indicating either a positive ornegative relation to PPI among those neighboring docu-ments. This team summed the scores of each group andused their difference as a score in the 4th run. Theother score is based on the pattern matching methodpreviously developed for detecting PPI methods (e.g.pull down) in the IMT task. Pattern matching wasapplied to an article’s title and abstract and the numberof PPI methods retrieved was used as a feature score.All four scores were fed to a log-linear model in produ-cing a final prediction in the 4th run. Their results on
Krallinger et al. BMC Bioinformatics 2011, 12(Suppl 8):S3http://www.biomedcentral.com/1471-2105/12/S8/S3
Page 21 of 31
the official test set show that they achieved the highestF-score of 59.49% and MCC of 0.527 in Run 2 while thebest AUC iP/R of 63.75% was achived in Run 4.Team 100 used two separate approaches (knowledge-
and learning-based) for the IMT task. They designedand conducted their experiments mainly on the Bio-Creative III data. This group also used BioCreative IIdata and additional annotations from the MINT data-base, resulting in a total of 3,764 additional articles withPSI-MI codes. For all these articles, title and abstracttext were extracted. Furthermore, when full text wasfreely available from PubMed Central, figure captionsand text from material and methods sections were alsoextracted. In the knowledge-based approach, Team 100investigated three individual methods and their perfor-mance on different text sections when applicable. Thethree methods are respectively based on directly match-ing PSI-MI terms and synonyms (Pattern Matching), onretrieving similar PSI-MI codes from neighboring docu-ments (Nearest Neighbors), and on inferring PSI-MIcodes from corresponding Medical Subject Headings(MeSH) indexing terms (MeSH to PSI-MI). Based onthe results on the BioCreative III training data, Team100 observed that prediction performance varied signifi-cantly from method to method for a given PSI-MI code.Therefore, their knowledge-based approach is code-spe-cific: for each code Team 100 selected the best-perform-ing method. For instance, the pattern matching methodwas selected for molecular sieving (MI:0071) while near-est neighbors method for two hybrid (MI:0018). Theirnovel learning-based approach formulates the predictionof PSI-MI task as a ranking problem such that the rele-vant codes should be ranked higher than those irrele-vant ones. In the IMT task, for a target document Team100 first obtained a pool of candidate codes from itssimilar neighboring documents. Next, for ranking, eachcode was represented by a vector of features, which ran-ged from word features (e.g. name feature indicating if acode name can be found in an article) to neighborhoodfeatures (e.g. how many neighboring documents areassigned a particular code). The ranking algorithm theyapplied is a listwise learning-to-rank algorithm namedListNet [71] because it naturally fits the problem in thateach article typically contains a list of relevant codes (asopposed to one per document). Team 100 optimized thelearning function by conducting cross validation experi-ments on the BioCreative III training and developmentsets. Finally, the ListNet algorithm produced a score foreach candidate code and they empirically determinedthe top K ranked codes to be the answers of the targetdocument. This team submitted five offline runs. Thefirst run was based on the knowledge-based approach.In the second run, they combined the pattern matchingand nearest neighbor methods by selecting PSI-MI
codes from neighboring documents if the PSI-MI codeswere also retrieved by pattern matching. The third andfourth runs were both based on the learning approachwith the minor difference in K (K is always 3 for run 3;K varied depending on a score threshold in run 4). Run5 of this group was optimized for precision by combin-ing the results of Runs 2 and 3. Official results on thetest set show that their first run yielded the best perfor-mance from all submissions of Team 100 (0.478 in F1-score when evaluated on the whole document set), indi-cating that it is somewhat helpful to choose methodsbased on individual PSI-MI codes.Team 104: Jean-Fred Fontaine and Miguel A. Andrade-Navarro (ACT)Team 104 included the following members: Jean-FredFontaine, Miguel A. Andrade-Navarro. Medline Ranker,implemented by Team 104, is a fast document retrievaltool that classifies the biomedical scientific bibliographyin the MEDLINE database according to any selectedtopic. It applies a linear Naïve Bayesian classifier(LNBC) on scientific abstracts with a high processingspeed (approximately 18000 abstracts per second) and ahigh precision [72]. The Medline Ranker web serverhttp://cbdm.mdc-berlin.de/tools/medlineranker offersalternative query mechanisms through PubMed queries,MeSH terms or custom PubMed identifier (PMID) lists.In particular, it allows the selection of a training set, abackground set, and a test set represented as PMIDs,which Team 104 used for the PPI abstracts classificationtask (ACT) of the BioCreative III challenge. To favourthe speed and flexibility of the Medline Ranker systemTeam 104 focused its implementation on data pre pro-cessing and storage [72]. The complete XML version ofMEDLINE is stored locally and weekly updated. Englishabstracts are stored in a MySQL database after part-of-speech processing used to define an abstract’s profile asits set of nouns. A stop word list is used to removecommon and non meaningful terms. Multiple occur-rences of nouns in a single abstract are not taken intoaccount [72,73]. A user’s request for classification of aquery set of abstracts requires the definition of a train-ing set of abstracts and to choose a background set ofabstracts. Upon a query, first, a LNBC is trained on thetraining set of abstracts by comparing their profiles tothose of the background set of abstracts. Secondly, theabstracts in the query set are scored with the trainedLNBC and P-values (based on a simulation on 10 000randomly chosen abstracts) are associated to abstractsrepresenting the confidence in classification. For theBioCreative III challenge, P-values were transformed inscores by subtracting the P-value to 1, after truncationof the P-value to ]0,1[. Medline Ranker uses for abstractclassification only words from abstracts and therefore itdoes not depend on the quality or comprehensiveness of
Krallinger et al. BMC Bioinformatics 2011, 12(Suppl 8):S3http://www.biomedcentral.com/1471-2105/12/S8/S3
Page 22 of 31
external data or annotations (i.e. MeSH or Gene Ontol-ogy terms). To produce fair results, Medline Ranker wasused to process BioCreative III PPI ACT task data bytraining its algorithm and tuning the parameters only onthe provided training set. Even if not as accurate asSVM classifiers, training a LNBC is significantly fasterand it allows the tool to process millions of abstractswith comparable performance in a practical time [73].For the PPI ACT task, the mean Medline Ranker runtotal duration was 1.29 seconds to process 8280abstracts. Notably, the running time also depends onthe MySQL search engine used for data access. Even ifnot specialised in the topic of PPI (e.g. using specificinformation extraction methods), the tool may be ofinterest in this task because it is freely available on theInternet and it can scan the ever growing scientific lit-erature in a few minutes.
DiscussionACTGiven the performance of systems, for example high-AUC-iP/R servers, it is likely that humans could makeuse of the results to quickly identify the most relevantarticles in a set. Therefore, the time spent by the textmining pipelines should be put in contrast to the time ahuman would need to select relevant articles. This exacttime will be established in future work with the annota-tors and curators who provided the Gold Standard. Wehave shown reasonable indications that online, auto-mated systems could have a strong impact on reducingthe time required to locate relevant articles. This aspectof quantifying automated versus manual classificationeffort constitutes a complementary approach to mea-sures of performance explored in the popular TRECGenomics tracks, such as the mean average precision(MAP), which measures precision after each relevantdocument is retrieved for a given query [24].As described in the data preparation section, during
the manual classification of abstracts, the MyMiner sys-tem allowed the use of positive and negative keywordhighlighting to improve text visualization. These termswere generated through inspection of instances duringthe training set construction and contained 374 negativeand 73 positive terms. In order to determine whetherthey are actually present in the test set, we used allwords in the test set collection, stemmed them, removedstopwords and generated unigrams and bigrams. Thenthe occurrences of each term (both unigrams andbigrams) were computed and their their frequenciesusing the Kullback-Leibler (KL) divergence were com-pared (smoothing 0 to 0.000001 and 1 to 0.999999). Thecorresponding formula is calculated by: pos · log(pos/neg) + neg · log(neg/pos); where pos and neg are the fre-quencies of documents containing the term in the
negative and positive sets. When analyzing the 3,000most significant terms resulting from this computationand comparing them to the set of terms used for man-ual highlighting, only 17.0% (361) of the manuallydefined negative terms were encountered in the top3,000 terms as opposed to 61.5% (52) of positive terms.This illustrates that in general there is a greater textualdiversity within the non-PPI relevant articles and thatfinding positive keywords and features that could beused for highlighting to improve manual inspection is ofgreater practical value.Additionally, we examined articles that were difficult
to classify correctly by automated systems. This analysiswas based on the number of runs predicting incorrectlabels on an article and shows how the agreementbetween automatic runs could actually be useful todetect wrong manual classifications. A total of 99records had been predicted by more than 80% of theruns incorrectly, out of which 74 records correspondedto false negative records (labeled true by the annotators)and 26 corresponded to false positive cases (labeledfalse). Examining the latter showed that 16 of these 26cases were incorrectly labelled by the annotators, andwere in fact true PPI articles as indicated by the runagreements. Some of these wrongly labeled cases corre-sponded to abstracts describing oligomerization of DNAbinding proteins and other cases where it was difficultto distinguish between an actual macromolecular struc-ture (e.g. some channel) and an individual protein form-ing this structure. Also, cases of very specific subtypesof interactions (phosphorylation, acetylation and ubiqui-tination) were more difficult for manual labeling. In casethe predictions were real false positives (i.e., correctlylabeled), they could be assigned to some general exam-ple cases: (1) interactions between proteins and RNA, e.g. PMID:19447915, (2) between proteins and cellularstructures (especially cell membrane, e.g.PMID:19690048), (3) complexes of proteins with inhibi-tor molecule compounds, e.g. PMID:19458048, (4) pro-tein-DNA binding, e.g. PMID:19605346, (5) protein-compound binding (e.g. lipopolysaccharide), (6) men-tions of components of a complex but without detailingPPIs, (7) genetic interactions and transcriptional activa-tion, e.g. PMID:19596907, (8) interaction of a particularresidue with some ion, (9) regulatory relations (phos-phorylation dependent on certain protein) where it isnot clear if an actual direct PPI is described and (10)relations between a pathway or signaling process and aphosphorylation event. Sometimes, several of thesetopics were found in a single abstract. In addition,among the false positives were abstracts dealing withdescriptions of the spliceosome and general ubiquitina-tion events. Interestingly, a number of these types offalse positives were precisely the cases that had to be
Krallinger et al. BMC Bioinformatics 2011, 12(Suppl 8):S3http://www.biomedcentral.com/1471-2105/12/S8/S3
Page 23 of 31
refined when preparing the annotation guidelines andhad been specifically added as criteria for classifyingabstracts as non-relevant for manual annotation duringthe initial rounds of annotation refinement. Looking atthe records classified as false negatives (by at least 80%of the runs) it became clear that many of these recordscorresponded to abstracts discussing aspects related tohost-pathogen interactions, inflammation and immunemechanisms. Unclear cases, even for humans, includedassociations of proteins with lipoproteins, certain typesof breakdown or cleavage of proteins, descriptions ofchimeric proteins and experimentally tagged fusion pro-teins. Commonly missed records included cases of areceptor protein binding to a ligand protein. This parti-cular topic was also added during the annotation guide-line refinement upon a request made by the expertcurator, where a specific question was whether the men-tion of ‘insulin receptor’ corresponds to an implicitinteraction of insulin with the insulin receptor. Amongthe false negative set are ambiguous cases that mentiona heterodimer but where it was not very clear who thebinding partner is, or records with very limited contextinformation requiring domain expert knowledge todetermine that a given protein pair mentioned isinvolved in a complex.Overall participating teams used a variety of different
features, many of them for training machine learningapproaches. Among the explored features one can pointout:1) Word token features: unigrams (Bag-of-words),
multi-word n-grams (mainly bigrams and trigrams), col-locations/co-occurring words (word-to-wordrelationships).2) Lexical features: exploiting the presence of particu-
lar term lists such as MeSH, PSI-MI, UMLS, BioLexi-con, or in house term lists, or filtering a set of wordsusing stop word lists.3) Textual pattern features: use of particular patterns
for expressing protein interactions, some of which hadbeen also applied for finding protein interaction pairs inBioCreative II and II.5 (e.g. ‘interacts with’, ‘binds to’).4) String features: using character strings of particular
length like strings-of-length-8 tokens used by team 100.5) Syntactic features: using dependency parser output,
grammatical patterns or shallow parsing derived phrasesas features.6) POS tags as features: selecting words with a particu-
lar POS tag as features for a classifier (as done by team104).7) Article metadata features: metadata provided for
each PubMed record (journal, MeSH annotation, authorname or affiliation fields).8) Semantic features (NER): Named entity recognition
has been used to identify mentions of genes and
proteins, which can be used as features or serve as con-straints for grammatical patterns. This feature seemedto be particularly important for specificity.
IMTIn case of the interaction method task, considerablecomplexity lies in differentiating between cases where aparticular method supports a protein interaction event,as opposed to some other experimental setting wherethat method is being used, and therefore goes farbeyond simple term look-up. Providing more detailedtraining data in form of representative collections of tex-tual evidence passages or marked method mentionswould be important to facilitate further the improve-ment of performance of text mining tools for associatingcorrectly full text article to interaction detection methodterms from a list of 115 potential candidate terms.Under this scenario the overall performance of the bestresult on the entire set of articles (F-Score 55%, AUCiP/R 35%, MCC 0.54) is quite promising, but also pointsout that totally automated annotation of interactionmethods is not yet solved, and that the resulting strate-gies would be more appropriate as systems aiding in themanual curation process by suggesting method termsbased on highlighting of potential evidence passages.The short time needed by the servers makes it seemreasonable that online, automated systems could beused for this task.A considerable fraction of the allowed method terms
appear with low frequency in all three data sets. Thismakes it particularly difficult to detect such methods bysupervised methods due to the lack of sufficiently large,representative training data. On the other hand, somemethods are more relevant for the curation process andaccount for a considerable amount of annotations. Wetherefore carried out a more granular analysis, examin-ing the performance of each run with respect to indivi-dual methods, determining those runs (systems) that aremost competitive for each of the relevant interactiondetection methods (see Figure 5, a more detailed ploton the method distributions is provided in the supple-mentary material section - additional file 3). When look-ing at the average F-scores obtained for each methodacross all runs, it becomes clear that the identificationof some methods is more difficult than others. Amongthe ‘easier’ methods terms across all runs are MI:0107(surface plasmon resonance, average F-score of 61.6%),MI:0055 (fluorescent resonance energy transfer, averageF-score of 54.2%) and MI:0018 (two hybrid, average F-score of 50.7%). In case of the maximum F-scoreobtained by participants, the most competitive resultswere obtained also for MI:0107 (maximum F-score90.0% by team 89, run 1), followed also by MI:0055(maximum F-score of 87.0% by team team 70 run 2)
Krallinger et al. BMC Bioinformatics 2011, 12(Suppl 8):S3http://www.biomedcentral.com/1471-2105/12/S8/S3
Page 24 of 31
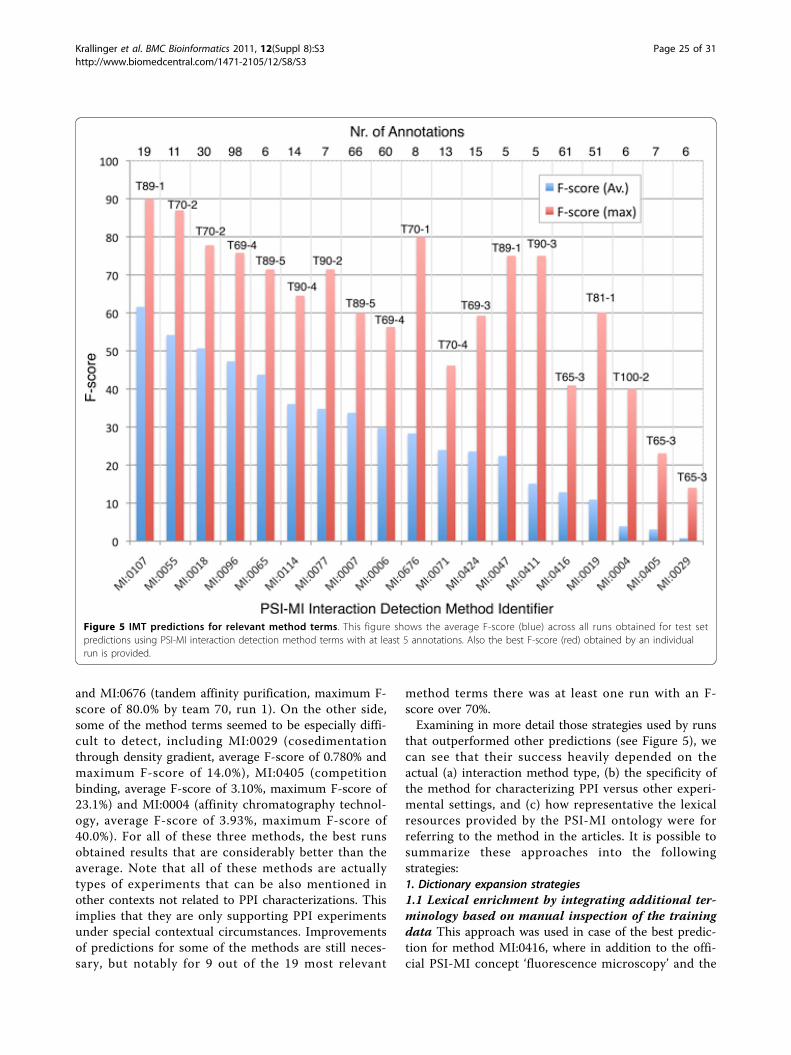
and MI:0676 (tandem affinity purification, maximum F-score of 80.0% by team 70, run 1). On the other side,some of the method terms seemed to be especially diffi-cult to detect, including MI:0029 (cosedimentationthrough density gradient, average F-score of 0.780% andmaximum F-score of 14.0%), MI:0405 (competitionbinding, average F-score of 3.10%, maximum F-score of23.1%) and MI:0004 (affinity chromatography technol-ogy, average F-score of 3.93%, maximum F-score of40.0%). For all of these three methods, the best runsobtained results that are considerably better than theaverage. Note that all of these methods are actuallytypes of experiments that can be also mentioned inother contexts not related to PPI characterizations. Thisimplies that they are only supporting PPI experimentsunder special contextual circumstances. Improvementsof predictions for some of the methods are still neces-sary, but notably for 9 out of the 19 most relevant
method terms there was at least one run with an F-score over 70%.Examining in more detail those strategies used by runs
that outperformed other predictions (see Figure 5), wecan see that their success heavily depended on theactual (a) interaction method type, (b) the specificity ofthe method for characterizing PPI versus other experi-mental settings, and (c) how representative the lexicalresources provided by the PSI-MI ontology were forreferring to the method in the articles. It is possible tosummarize these approaches into the followingstrategies:1. Dictionary expansion strategies1.1 Lexical enrichment by integrating additional ter-minology based on manual inspection of the trainingdata This approach was used in case of the best predic-tion for method MI:0416, where in addition to the offi-cial PSI-MI concept ‘fluorescence microscopy’ and the
Figure 5 IMT predictions for relevant method terms. This figure shows the average F-score (blue) across all runs obtained for test setpredictions using PSI-MI interaction detection method terms with at least 5 annotations. Also the best F-score (red) obtained by an individualrun is provided.
Krallinger et al. BMC Bioinformatics 2011, 12(Suppl 8):S3http://www.biomedcentral.com/1471-2105/12/S8/S3
Page 25 of 31
synonym ‘fluorescence imaging’ commonly known syno-nyms were included in the PSI-MI dictionary, such asthe term ‘immunofluorescence staining’. Some teamsalso relied on domain experts to add manually addi-tional synonyms based on their background knowledge.1.2 Lexical enrichment by cross ontology mappings Inorder to generate a lexical expansion of the originalinteraction method ontology, one strategy was manuallymapping between PSI-MI terms and MeSH identifiers,using the resulting relations as features to train super-vised classifiers. Another approach consisted of firstselecting a particular subset of UMLS concept types,and then finding those concepts that shared a namewith a term in the PSI-MI ontology and adding theresulting UMLS concept synonyms to the interactionmethod term dictionary.1.3 Rule based lexical expansion independent oftraining data A range of teams tried to improve therecall of their methods by automatically adding typogra-phical and lexical variants to the original set of methodterms, considering alternative use of hyphenation, capi-talization, uppercase/lowercase usage, alternative equiva-lent numeric expressions (arabic, roman and wordnumerals), substitution by synonymous words, and con-sideration of acronym and expanded long forms.2. Feature generation, extraction and selection strategies2.1 Detection of words, bigrams and collocations asso-ciated to ontology terms derived from training dataAnother approach to increase the recall of detectingassociations between documents and MI ontology termswas based on the initial extraction of n-grams and collo-cations from the collection of training documents, fol-lowed by the calculation of the probability of a methodgiven a particular n-gram or collocation. This strategyseemed to help boosting the results obtained by team 65in case of the terms MI:0405 (competition binding) andMI:0029 (cosedimentation through density gradient).2.2 Exploitation of exact and partial word tokensfound in the method terms For many methods there isonly a relatively poor association between the exact orpartial name of the interaction detection method andwhether the name indicates that the detection methodwas used in a PPI context. Nevertheless in some cases,exact, partial or merged tokens building the methodterm can be used by machine learning algorithms as fea-tures for scoring method-document associations. Forinstance in case of MI:0006 (anti bait coimmunoprecipi-tation) and MI:0096 (pull down), team 69 could detectseveral features with a strong positive correlation tothese methods corresponding to both the exact and par-tial name of the method. In case of MI:0006 positivefeatures included the partial stemmed tokens ‘precipit’and ‘immunoprecipit’ while for MI:0096 the mergedtoken ‘pulldown’ and the exact token ‘pull’ show a
relatively strong positive association. Team 90 on theother hand exploited the usage of matches betweenword unigrams and character n-grams (n={2,3,4}) fromthe PSI-MI definition and synonyms.2.3 Use of machine learning approaches exploitingfeatures with strong positive or negative correlationwith respect to a particular method Machine learningsystems are not only able to exploit tokens formingmethod terms, but also tokens derived from documentsprovided as training data in order to predict ontologyterms for a given input article. Considering the predic-tion of team 69 for MI:0424 (protein kinase assay), thestrongest notable positive features are the stemmedtokens ‘vitro’, ‘phosphoryl’, ‘kinase’ and ‘juxtamembrane’.The token ‘kinase’ is the only feature that relates to thename of the detection method, and all but ‘juxtamem-brane’ are relatively common terms. The only notablenegative features for this interaction method are thestemmed tokens ‘monom’ and ‘migrat’, which are alsorelatively common terms. These results also show thatsometimes the significance of some features is not parti-cularly transparent in terms of human interpretation.3. Pattern matching and rule based approachesCapturing variations of interaction method expressionscan be addressed by using regular expression matchesand heuristics. In case of team 100, their prediction forMI:0004 (affinity chromatography technology) requiredthat both their pattern-matching and kNN method gen-erated a positive hit. In case of the pattern-basedapproach a set of additional tokens were required to benot co-mentioned in order to distinguish this term fromMI:0676 (tandem affinity purification). Their pattern forextracting MI:0004 was:IF sentence contains “affinity” AND
“chromatography” AND “purification”IF sentence contains “tandem” OR
“tap”assign MI:0676 ELSE assign
MI:0004Our database curator collaborators have suggested
that it could be meaningful to carry out a grouping ofequivalent methods that are experimentally related. Forinstance the terms MI:0006 (anti bait coimmunoprecipi-tation), MI:0007 (anti tag coimmunoprecipitation),MI:0019 (coimmunoprecipitation), MI:0858 (immunode-pleted coimmunoprecipitation) and MI:0676 (tandemaffinity purification) could be grouped under the termMI:0004 (affinity chromatography technology) for analy-sis purposes, or MI:0028 (cosedimentation in solution)and MI:0029 (cosedimentation through density gradient)could be grouped under MI:0027 (cosedimentation).Unfortunately, the ontological structure of PSI-MI itselfdoes not directly provide sensible groupings and itwould require extensive manual classification and
Krallinger et al. BMC Bioinformatics 2011, 12(Suppl 8):S3http://www.biomedcentral.com/1471-2105/12/S8/S3
Page 26 of 31
discussions among different curators to generate aproper consensus on accurate method groupings.
ConclusionsThe PPI tasks of BioCreative III tried to address relevantaspects for both database curators as well as generalbiologists interested in improving the retrieval of inter-action relevant articles and association of ontologyterms and experimental techniques to full text papers.Large training, development and test set collectionswere provided to participating teams and these publiclyavailable corpora should represent a valuable resourcefor future implementations and evaluations of biomedi-cal text mining. From the results obtained, it seems thatclassification of PPI relevant abstracts using participatingsystems is able to improve the selection of relevant arti-cles for database curators and biologists, both in termsof number of items that need to be reviewed as well asin terms of time saving. In order to derive practicallyuseful applications from this task, the systems need tobe at least accessible online. Combining the differentruns for the ACT resulted in a consensus system withbetter performance than the best individual run, anaspect that already motivated the implementation of theBioCreative Meta-Server infrastructure [40]. We pre-sented a detailed analysis of curator classification timesand agreement between human annotators for the arti-cle classification task, which allows to estimate betterthe theoretical performance limit of text mining systems.It remains for the future to carry out this type of analy-sis in more complex scenarios, for instance, based onthe individual steps followed in biological annotationworkflows like the one used by interaction databases,and quantify the effect of integrating text mining mod-ules in terms of curation efficiency measured in timeunits or annotation records over some baseline manualannotation. To focus in the future on particular types ofinteractions such as phosphorylation relations, or parti-cular protein functional types (kinases or phosphatases)could be interesting for data consumers.In summary, current state-of-the-art systems are likely
to have a significant impact on simplifying (but notcompletely automating) the manual process of articleselection and could potentially be adapted not only toscore individual articles, but also to determine the mostrelevant journals for each biocuration type. The initialsetting of this task had to be slightly modified to makeresulting systems more practically relevant. Analyzingrecords from one month of PubMed abstracts with linksto free full text articles (which can be considered thefirst level approach) resulted in a collection that onlycovered a minor fraction of PPI relevant journals. Farless than 5% of the records were PPI relevant in general,
and even a smaller set was PPI annotation relevant, asmost articles are related to the clinical domain.In case of the IMT, participating systems did signifi-
cantly better than a baseline term-lookup approach. Themain difficulties for this second task arise from themany different ways of describing a given experimentalmethod, handling PDF articles, and the heterogeneousjournal composition. From the analysis of strategiesused for the IMT and the performance obtained forindividual methods, it seemed that certain techniqueswere more efficient for certain terms, which makessense under the assumptions that some of the terms canbe better identified using pattern based approaches,while others can be better detected using machine learn-ing or using some sort of expanded lexical resources.Moreover, some method terms are very general and canbe used in other contexts that are not PPI relevant.Note that a number of method terms/acronyms are alsohighly ambiguous (e.g. ‘2H’ or ‘CD’). Providing morecomplete lexical resources of method terms by the PSI-MI ontology developers could also have a positiveimpact on automated systems. Another challengingaspect, even for database curators, is the complexity inmapping annotations to the right granularity of terms inthe ontology. The distances in the ontological structurecan not be used to produce meaningful scores for calcu-lating semantic similarities between terms in the PSI-MIontology. A proposal to overcome this issue is based ongrouping method concepts together that are equivalentin terms of annotation purposes. This interesting strat-egy of a more coarse-level annotation nonethelessrequires a considerable manual effort in deriving suchmethod groupings, which illustrates that having evidencepassages derived from the text for the annotationswould aid the human interpretation of the assignedexperimental qualifiers for PPIs. Additional file 4 pro-vides an overview of external tools used by participatingteams.Performance will certainly increase with the amount of
readily available training data and as more interest inthis particular area of entity types is raised. Furtherimprovements of the task data settings would require toprovide participating teams with data at the level oflarge representative collections of support textual state-ments (e.g. individual evidence sentences) and truenegative statements, in addition to a better set of syno-nyms for the concepts, both of which could in principlebe provided as byproduct of the biocuration process.Another option for future settings would be to distin-guish between closed and open predictions, i.e. thosethat only use the provided training data and those thatmake use of external resources for generating their pre-dictions respectively, something that had been
Krallinger et al. BMC Bioinformatics 2011, 12(Suppl 8):S3http://www.biomedcentral.com/1471-2105/12/S8/S3
Page 27 of 31
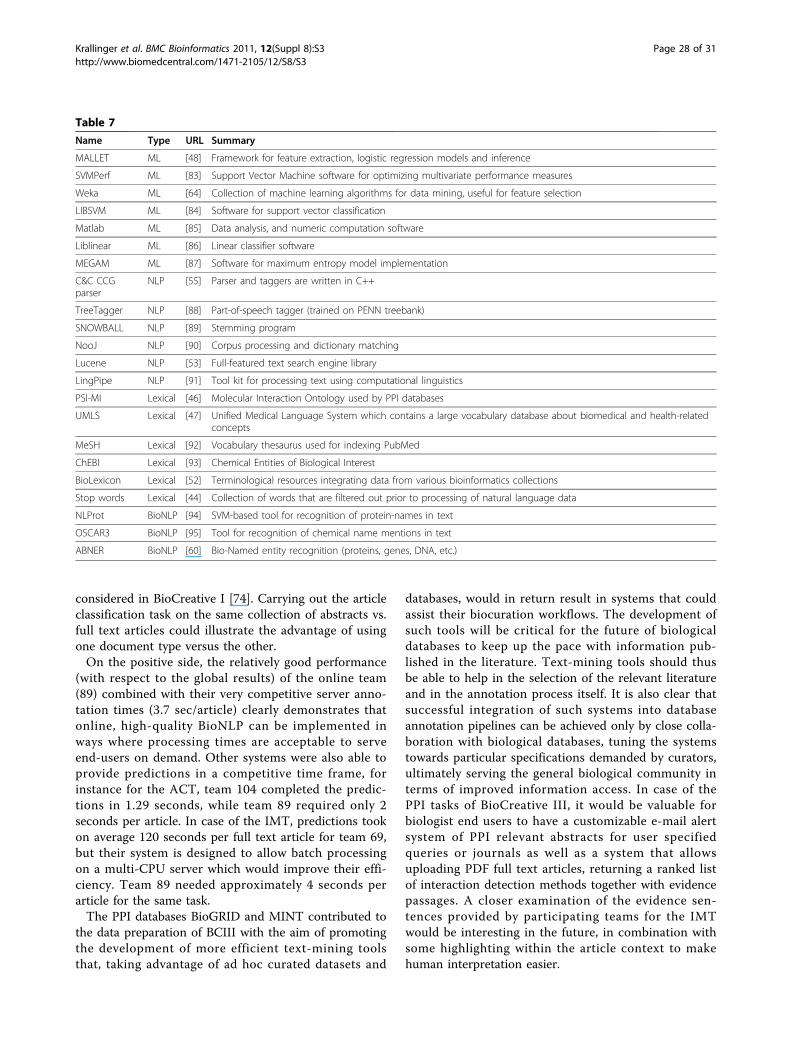
considered in BioCreative I [74]. Carrying out the articleclassification task on the same collection of abstracts vs.full text articles could illustrate the advantage of usingone document type versus the other.On the positive side, the relatively good performance
(with respect to the global results) of the online team(89) combined with their very competitive server anno-tation times (3.7 sec/article) clearly demonstrates thatonline, high-quality BioNLP can be implemented inways where processing times are acceptable to serveend-users on demand. Other systems were also able toprovide predictions in a competitive time frame, forinstance for the ACT, team 104 completed the predic-tions in 1.29 seconds, while team 89 required only 2seconds per article. In case of the IMT, predictions tookon average 120 seconds per full text article for team 69,but their system is designed to allow batch processingon a multi-CPU server which would improve their effi-ciency. Team 89 needed approximately 4 seconds perarticle for the same task.The PPI databases BioGRID and MINT contributed to
the data preparation of BCIII with the aim of promotingthe development of more efficient text-mining toolsthat, taking advantage of ad hoc curated datasets and
databases, would in return result in systems that couldassist their biocuration workflows. The development ofsuch tools will be critical for the future of biologicaldatabases to keep up the pace with information pub-lished in the literature. Text-mining tools should thusbe able to help in the selection of the relevant literatureand in the annotation process itself. It is also clear thatsuccessful integration of such systems into databaseannotation pipelines can be achieved only by close colla-boration with biological databases, tuning the systemstowards particular specifications demanded by curators,ultimately serving the general biological community interms of improved information access. In case of thePPI tasks of BioCreative III, it would be valuable forbiologist end users to have a customizable e-mail alertsystem of PPI relevant abstracts for user specifiedqueries or journals as well as a system that allowsuploading PDF full text articles, returning a ranked listof interaction detection methods together with evidencepassages. A closer examination of the evidence sen-tences provided by participating teams for the IMTwould be interesting in the future, in combination withsome highlighting within the article context to makehuman interpretation easier.
Table 7Name Type URL Summary
MALLET ML [48] Framework for feature extraction, logistic regression models and inference
SVMPerf ML [83] Support Vector Machine software for optimizing multivariate performance measures
Weka ML [64] Collection of machine learning algorithms for data mining, useful for feature selection
LIBSVM ML [84] Software for support vector classification
Matlab ML [85] Data analysis, and numeric computation software
Liblinear ML [86] Linear classifier software
MEGAM ML [87] Software for maximum entropy model implementation
C&C CCGparser
NLP [55] Parser and taggers are written in C++
TreeTagger NLP [88] Part-of-speech tagger (trained on PENN treebank)
SNOWBALL NLP [89] Stemming program
NooJ NLP [90] Corpus processing and dictionary matching
Lucene NLP [53] Full-featured text search engine library
LingPipe NLP [91] Tool kit for processing text using computational linguistics
PSI-MI Lexical [46] Molecular Interaction Ontology used by PPI databases
UMLS Lexical [47] Unified Medical Language System which contains a large vocabulary database about biomedical and health-relatedconcepts
MeSH Lexical [92] Vocabulary thesaurus used for indexing PubMed
ChEBI Lexical [93] Chemical Entities of Biological Interest
BioLexicon Lexical [52] Terminological resources integrating data from various bioinformatics collections
Stop words Lexical [44] Collection of words that are filtered out prior to processing of natural language data
NLProt BioNLP [94] SVM-based tool for recognition of protein-names in text
OSCAR3 BioNLP [95] Tool for recognition of chemical name mentions in text
ABNER BioNLP [60] Bio-Named entity recognition (proteins, genes, DNA, etc.)
Krallinger et al. BMC Bioinformatics 2011, 12(Suppl 8):S3http://www.biomedcentral.com/1471-2105/12/S8/S3
Page 28 of 31
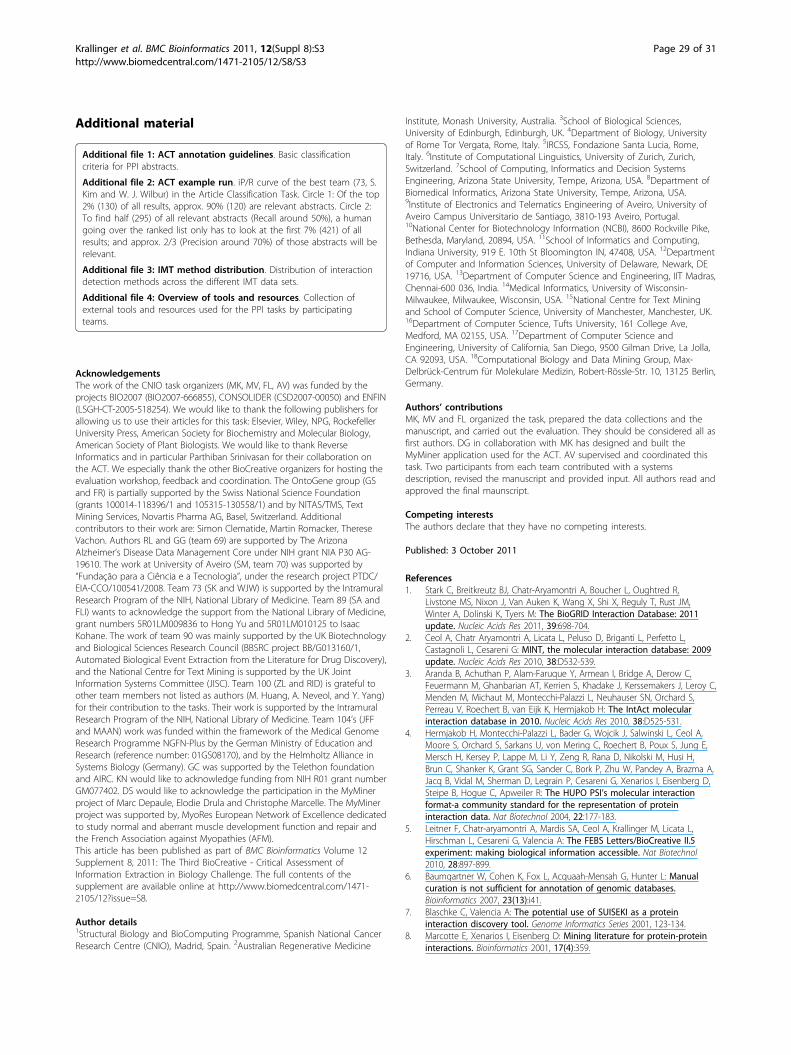
Additional material
Additional file 1: ACT annotation guidelines. Basic classificationcriteria for PPI abstracts.
Additional file 2: ACT example run. iP/R curve of the best team (73, S.Kim and W. J. Wilbur) in the Article Classification Task. Circle 1: Of the top2% (130) of all results, approx. 90% (120) are relevant abstracts. Circle 2:To find half (295) of all relevant abstracts (Recall around 50%), a humangoing over the ranked list only has to look at the first 7% (421) of allresults; and approx. 2/3 (Precision around 70%) of those abstracts will berelevant.
Additional file 3: IMT method distribution. Distribution of interactiondetection methods across the different IMT data sets.
Additional file 4: Overview of tools and resources. Collection ofexternal tools and resources used for the PPI tasks by participatingteams.
AcknowledgementsThe work of the CNIO task organizers (MK, MV, FL, AV) was funded by theprojects BIO2007 (BIO2007-666855), CONSOLIDER (CSD2007-00050) and ENFIN(LSGH-CT-2005-518254). We would like to thank the following publishers forallowing us to use their articles for this task: Elsevier, Wiley, NPG, RockefellerUniversity Press, American Society for Biochemistry and Molecular Biology,American Society of Plant Biologists. We would like to thank ReverseInformatics and in particular Parthiban Srinivasan for their collaboration onthe ACT. We especially thank the other BioCreative organizers for hosting theevaluation workshop, feedback and coordination. The OntoGene group (GSand FR) is partially supported by the Swiss National Science Foundation(grants 100014-118396/1 and 105315-130558/1) and by NITAS/TMS, TextMining Services, Novartis Pharma AG, Basel, Switzerland. Additionalcontributors to their work are: Simon Clematide, Martin Romacker, ThereseVachon. Authors RL and GG (team 69) are supported by The ArizonaAlzheimer’s Disease Data Management Core under NIH grant NIA P30 AG-19610. The work at University of Aveiro (SM, team 70) was supported by“Fundação para a Ciência e a Tecnologia”, under the research project PTDC/EIA-CCO/100541/2008. Team 73 (SK and WJW) is supported by the IntramuralResearch Program of the NIH, National Library of Medicine. Team 89 (SA andFLI) wants to acknowledge the support from the National Library of Medicine,grant numbers 5R01LM009836 to Hong Yu and 5R01LM010125 to IsaacKohane. The work of team 90 was mainly supported by the UK Biotechnologyand Biological Sciences Research Council (BBSRC project BB/G013160/1,Automated Biological Event Extraction from the Literature for Drug Discovery),and the National Centre for Text Mining is supported by the UK JointInformation Systems Committee (JISC). Team 100 (ZL and RID) is grateful toother team members not listed as authors (M. Huang, A. Neveol, and Y. Yang)for their contribution to the tasks. Their work is supported by the IntramuralResearch Program of the NIH, National Library of Medicine. Team 104’s (JFFand MAAN) work was funded within the framework of the Medical GenomeResearch Programme NGFN-Plus by the German Ministry of Education andResearch (reference number: 01GS08170), and by the Helmholtz Alliance inSystems Biology (Germany). GC was supported by the Telethon foundationand AIRC. KN would like to acknowledge funding from NIH R01 grant numberGM077402. DS would like to acknowledge the participation in the MyMinerproject of Marc Depaule, Elodie Drula and Christophe Marcelle. The MyMinerproject was supported by, MyoRes European Network of Excellence dedicatedto study normal and aberrant muscle development function and repair andthe French Association against Myopathies (AFM).This article has been published as part of BMC Bioinformatics Volume 12Supplement 8, 2011: The Third BioCreative - Critical Assessment ofInformation Extraction in Biology Challenge. The full contents of thesupplement are available online at http://www.biomedcentral.com/1471-2105/12?issue=S8.
Author details1Structural Biology and BioComputing Programme, Spanish National CancerResearch Centre (CNIO), Madrid, Spain. 2Australian Regenerative Medicine
Institute, Monash University, Australia. 3School of Biological Sciences,University of Edinburgh, Edinburgh, UK. 4Department of Biology, Universityof Rome Tor Vergata, Rome, Italy. 5IRCSS, Fondazione Santa Lucia, Rome,Italy. 6Institute of Computational Linguistics, University of Zurich, Zurich,Switzerland. 7School of Computing, Informatics and Decision SystemsEngineering, Arizona State University, Tempe, Arizona, USA. 8Department ofBiomedical Informatics, Arizona State University, Tempe, Arizona, USA.9Institute of Electronics and Telematics Engineering of Aveiro, University ofAveiro Campus Universitario de Santiago, 3810-193 Aveiro, Portugal.10National Center for Biotechnology Information (NCBI), 8600 Rockville Pike,Bethesda, Maryland, 20894, USA. 11School of Informatics and Computing,Indiana University, 919 E. 10th St Bloomington IN, 47408, USA. 12Departmentof Computer and Information Sciences, University of Delaware, Newark, DE19716, USA. 13Department of Computer Science and Engineering, IIT Madras,Chennai-600 036, India. 14Medical Informatics, University of Wisconsin-Milwaukee, Milwaukee, Wisconsin, USA. 15National Centre for Text Miningand School of Computer Science, University of Manchester, Manchester, UK.16Department of Computer Science, Tufts University, 161 College Ave,Medford, MA 02155, USA. 17Department of Computer Science andEngineering, University of California, San Diego, 9500 Gilman Drive, La Jolla,CA 92093, USA. 18Computational Biology and Data Mining Group, Max-Delbrück-Centrum für Molekulare Medizin, Robert-Rössle-Str. 10, 13125 Berlin,Germany.
Authors’ contributionsMK, MV and FL organized the task, prepared the data collections and themanuscript, and carried out the evaluation. They should be considered all asfirst authors. DG in collaboration with MK has designed and built theMyMiner application used for the ACT. AV supervised and coordinated thistask. Two participants from each team contributed with a systemsdescription, revised the manuscript and provided input. All authors read andapproved the final maunscript.
Competing interestsThe authors declare that they have no competing interests.
Published: 3 October 2011
References1. Stark C, Breitkreutz BJ, Chatr-Aryamontri A, Boucher L, Oughtred R,
Livstone MS, Nixon J, Van Auken K, Wang X, Shi X, Reguly T, Rust JM,Winter A, Dolinski K, Tyers M: The BioGRID Interaction Database: 2011update. Nucleic Acids Res 2011, 39:698-704.
2. Ceol A, Chatr Aryamontri A, Licata L, Peluso D, Briganti L, Perfetto L,Castagnoli L, Cesareni G: MINT, the molecular interaction database: 2009update. Nucleic Acids Res 2010, 38:D532-539.
3. Aranda B, Achuthan P, Alam-Faruque Y, Armean I, Bridge A, Derow C,Feuermann M, Ghanbarian AT, Kerrien S, Khadake J, Kerssemakers J, Leroy C,Menden M, Michaut M, Montecchi-Palazzi L, Neuhauser SN, Orchard S,Perreau V, Roechert B, van Eijk K, Hermjakob H: The IntAct molecularinteraction database in 2010. Nucleic Acids Res 2010, 38:D525-531.
4. Hermjakob H, Montecchi-Palazzi L, Bader G, Wojcik J, Salwinski L, Ceol A,Moore S, Orchard S, Sarkans U, von Mering C, Roechert B, Poux S, Jung E,Mersch H, Kersey P, Lappe M, Li Y, Zeng R, Rana D, Nikolski M, Husi H,Brun C, Shanker K, Grant SG, Sander C, Bork P, Zhu W, Pandey A, Brazma A,Jacq B, Vidal M, Sherman D, Legrain P, Cesareni G, Xenarios I, Eisenberg D,Steipe B, Hogue C, Apweiler R: The HUPO PSI’s molecular interactionformat-a community standard for the representation of proteininteraction data. Nat Biotechnol 2004, 22:177-183.
5. Leitner F, Chatr-aryamontri A, Mardis SA, Ceol A, Krallinger M, Licata L,Hirschman L, Cesareni G, Valencia A: The FEBS Letters/BioCreative II.5experiment: making biological information accessible. Nat Biotechnol2010, 28:897-899.
6. Baumgartner W, Cohen K, Fox L, Acquaah-Mensah G, Hunter L: Manualcuration is not sufficient for annotation of genomic databases.Bioinformatics 2007, 23(13):i41.
7. Blaschke C, Valencia A: The potential use of SUISEKI as a proteininteraction discovery tool. Genome Informatics Series 2001, 123-134.
8. Marcotte E, Xenarios I, Eisenberg D: Mining literature for protein-proteininteractions. Bioinformatics 2001, 17(4):359.
Krallinger et al. BMC Bioinformatics 2011, 12(Suppl 8):S3http://www.biomedcentral.com/1471-2105/12/S8/S3
Page 29 of 31
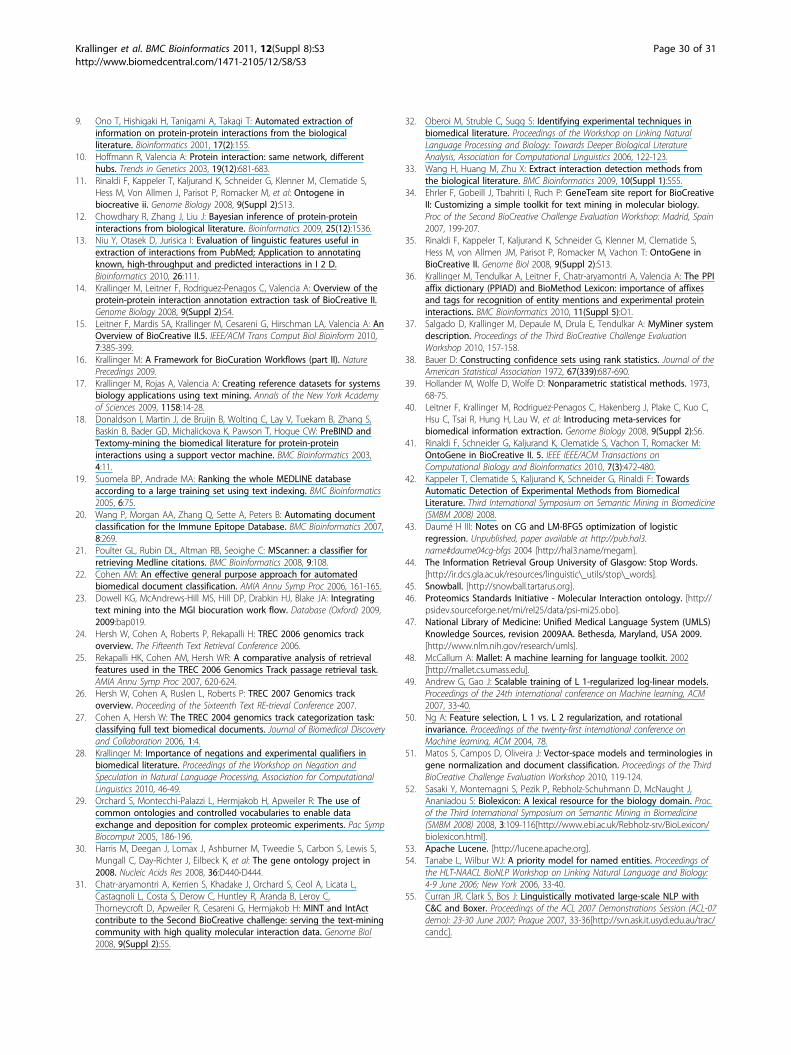
9. Ono T, Hishigaki H, Tanigami A, Takagi T: Automated extraction ofinformation on protein-protein interactions from the biologicalliterature. Bioinformatics 2001, 17(2):155.
10. Hoffmann R, Valencia A: Protein interaction: same network, differenthubs. Trends in Genetics 2003, 19(12):681-683.
11. Rinaldi F, Kappeler T, Kaljurand K, Schneider G, Klenner M, Clematide S,Hess M, Von Allmen J, Parisot P, Romacker M, et al: Ontogene inbiocreative ii. Genome Biology 2008, 9(Suppl 2):S13.
12. Chowdhary R, Zhang J, Liu J: Bayesian inference of protein-proteininteractions from biological literature. Bioinformatics 2009, 25(12):1536.
13. Niu Y, Otasek D, Jurisica I: Evaluation of linguistic features useful inextraction of interactions from PubMed; Application to annotatingknown, high-throughput and predicted interactions in I 2 D.Bioinformatics 2010, 26:111.
14. Krallinger M, Leitner F, Rodriguez-Penagos C, Valencia A: Overview of theprotein-protein interaction annotation extraction task of BioCreative II.Genome Biology 2008, 9(Suppl 2):S4.
15. Leitner F, Mardis SA, Krallinger M, Cesareni G, Hirschman LA, Valencia A: AnOverview of BioCreative II.5. IEEE/ACM Trans Comput Biol Bioinform 2010,7:385-399.
16. Krallinger M: A Framework for BioCuration Workflows (part II). NaturePrecedings 2009.
17. Krallinger M, Rojas A, Valencia A: Creating reference datasets for systemsbiology applications using text mining. Annals of the New York Academyof Sciences 2009, 1158:14-28.
18. Donaldson I, Martin J, de Bruijn B, Wolting C, Lay V, Tuekam B, Zhang S,Baskin B, Bader GD, Michalickova K, Pawson T, Hogue CW: PreBIND andTextomy-mining the biomedical literature for protein-proteininteractions using a support vector machine. BMC Bioinformatics 2003,4:11.
19. Suomela BP, Andrade MA: Ranking the whole MEDLINE databaseaccording to a large training set using text indexing. BMC Bioinformatics2005, 6:75.
20. Wang P, Morgan AA, Zhang Q, Sette A, Peters B: Automating documentclassification for the Immune Epitope Database. BMC Bioinformatics 2007,8:269.
21. Poulter GL, Rubin DL, Altman RB, Seoighe C: MScanner: a classifier forretrieving Medline citations. BMC Bioinformatics 2008, 9:108.
22. Cohen AM: An effective general purpose approach for automatedbiomedical document classification. AMIA Annu Symp Proc 2006, 161-165.
23. Dowell KG, McAndrews-Hill MS, Hill DP, Drabkin HJ, Blake JA: Integratingtext mining into the MGI biocuration work flow. Database (Oxford) 2009,2009:bap019.
24. Hersh W, Cohen A, Roberts P, Rekapalli H: TREC 2006 genomics trackoverview. The Fifteenth Text Retrieval Conference 2006.
25. Rekapalli HK, Cohen AM, Hersh WR: A comparative analysis of retrievalfeatures used in the TREC 2006 Genomics Track passage retrieval task.AMIA Annu Symp Proc 2007, 620-624.
26. Hersh W, Cohen A, Ruslen L, Roberts P: TREC 2007 Genomics trackoverview. Proceeding of the Sixteenth Text RE-trieval Conference 2007.
27. Cohen A, Hersh W: The TREC 2004 genomics track categorization task:classifying full text biomedical documents. Journal of Biomedical Discoveryand Collaboration 2006, 1:4.
28. Krallinger M: Importance of negations and experimental qualifiers inbiomedical literature. Proceedings of the Workshop on Negation andSpeculation in Natural Language Processing, Association for ComputationalLinguistics 2010, 46-49.
29. Orchard S, Montecchi-Palazzi L, Hermjakob H, Apweiler R: The use ofcommon ontologies and controlled vocabularies to enable dataexchange and deposition for complex proteomic experiments. Pac SympBiocomput 2005, 186-196.
30. Harris M, Deegan J, Lomax J, Ashburner M, Tweedie S, Carbon S, Lewis S,Mungall C, Day-Richter J, Eilbeck K, et al: The gene ontology project in2008. Nucleic Acids Res 2008, 36:D440-D444.
31. Chatr-aryamontri A, Kerrien S, Khadake J, Orchard S, Ceol A, Licata L,Castagnoli L, Costa S, Derow C, Huntley R, Aranda B, Leroy C,Thorneycroft D, Apweiler R, Cesareni G, Hermjakob H: MINT and IntActcontribute to the Second BioCreative challenge: serving the text-miningcommunity with high quality molecular interaction data. Genome Biol2008, 9(Suppl 2):S5.
32. Oberoi M, Struble C, Sugg S: Identifying experimental techniques inbiomedical literature. Proceedings of the Workshop on Linking NaturalLanguage Processing and Biology: Towards Deeper Biological LiteratureAnalysis, Association for Computational Linguistics 2006, 122-123.
33. Wang H, Huang M, Zhu X: Extract interaction detection methods fromthe biological literature. BMC Bioinformatics 2009, 10(Suppl 1):S55.
34. Ehrler F, Gobeill J, Tbahriti I, Ruch P: GeneTeam site report for BioCreativeII: Customizing a simple toolkit for text mining in molecular biology.Proc of the Second BioCreative Challenge Evaluation Workshop: Madrid, Spain2007, 199-207.
35. Rinaldi F, Kappeler T, Kaljurand K, Schneider G, Klenner M, Clematide S,Hess M, von Allmen JM, Parisot P, Romacker M, Vachon T: OntoGene inBioCreative II. Genome Biol 2008, 9(Suppl 2):S13.
36. Krallinger M, Tendulkar A, Leitner F, Chatr-aryamontri A, Valencia A: The PPIaffix dictionary (PPIAD) and BioMethod Lexicon: importance of affixesand tags for recognition of entity mentions and experimental proteininteractions. BMC Bioinformatics 2010, 11(Suppl 5):O1.
37. Salgado D, Krallinger M, Depaule M, Drula E, Tendulkar A: MyMiner systemdescription. Proceedings of the Third BioCreative Challenge EvaluationWorkshop 2010, 157-158.
38. Bauer D: Constructing confidence sets using rank statistics. Journal of theAmerican Statistical Association 1972, 67(339):687-690.
39. Hollander M, Wolfe D, Wolfe D: Nonparametric statistical methods. 1973,68-75.
40. Leitner F, Krallinger M, Rodriguez-Penagos C, Hakenberg J, Plake C, Kuo C,Hsu C, Tsai R, Hung H, Lau W, et al: Introducing meta-services forbiomedical information extraction. Genome Biology 2008, 9(Suppl 2):S6.
41. Rinaldi F, Schneider G, Kaljurand K, Clematide S, Vachon T, Romacker M:OntoGene in BioCreative II. 5. IEEE IEEE/ACM Transactions onComputational Biology and Bioinformatics 2010, 7(3):472-480.
42. Kappeler T, Clematide S, Kaljurand K, Schneider G, Rinaldi F: TowardsAutomatic Detection of Experimental Methods from BiomedicalLiterature. Third International Symposium on Semantic Mining in Biomedicine(SMBM 2008) 2008.
43. Daumé H III: Notes on CG and LM-BFGS optimization of logisticregression. Unpublished, paper available at http://pub.hal3.name#daume04cg-bfgs 2004 [http://hal3.name/megam].
44. The Information Retrieval Group University of Glasgow: Stop Words.[http://ir.dcs.gla.ac.uk/resources/linguistic\_utils/stop\_words].
45. Snowball. [http://snowball.tartarus.org].46. Proteomics Standards Initiative - Molecular Interaction ontology. [http://
psidev.sourceforge.net/mi/rel25/data/psi-mi25.obo].47. National Library of Medicine: Unified Medical Language System (UMLS)
Knowledge Sources, revision 2009AA. Bethesda, Maryland, USA 2009.[http://www.nlm.nih.gov/research/umls].
48. McCallum A: Mallet: A machine learning for language toolkit. 2002[http://mallet.cs.umass.edu].
49. Andrew G, Gao J: Scalable training of L 1-regularized log-linear models.Proceedings of the 24th international conference on Machine learning, ACM2007, 33-40.
50. Ng A: Feature selection, L 1 vs. L 2 regularization, and rotationalinvariance. Proceedings of the twenty-first international conference onMachine learning, ACM 2004, 78.
51. Matos S, Campos D, Oliveira J: Vector-space models and terminologies ingene normalization and document classification. Proceedings of the ThirdBioCreative Challenge Evaluation Workshop 2010, 119-124.
52. Sasaki Y, Montemagni S, Pezik P, Rebholz-Schuhmann D, McNaught J,Ananiadou S: Biolexicon: A lexical resource for the biology domain. Proc.of the Third International Symposium on Semantic Mining in Biomedicine(SMBM 2008) 2008, 3:109-116[http://www.ebi.ac.uk/Rebholz-srv/BioLexicon/biolexicon.html].
53. Apache Lucene. [http://lucene.apache.org].54. Tanabe L, Wilbur WJ: A priority model for named entities. Proceedings of
the HLT-NAACL BioNLP Workshop on Linking Natural Language and Biology:4-9 June 2006; New York 2006, 33-40.
55. Curran JR, Clark S, Bos J: Linguistically motivated large-scale NLP withC&C and Boxer. Proceedings of the ACL 2007 Demonstrations Session (ACL-07demo): 23-30 June 2007; Prague 2007, 33-36[http://svn.ask.it.usyd.edu.au/trac/candc].
Krallinger et al. BMC Bioinformatics 2011, 12(Suppl 8):S3http://www.biomedcentral.com/1471-2105/12/S8/S3
Page 30 of 31
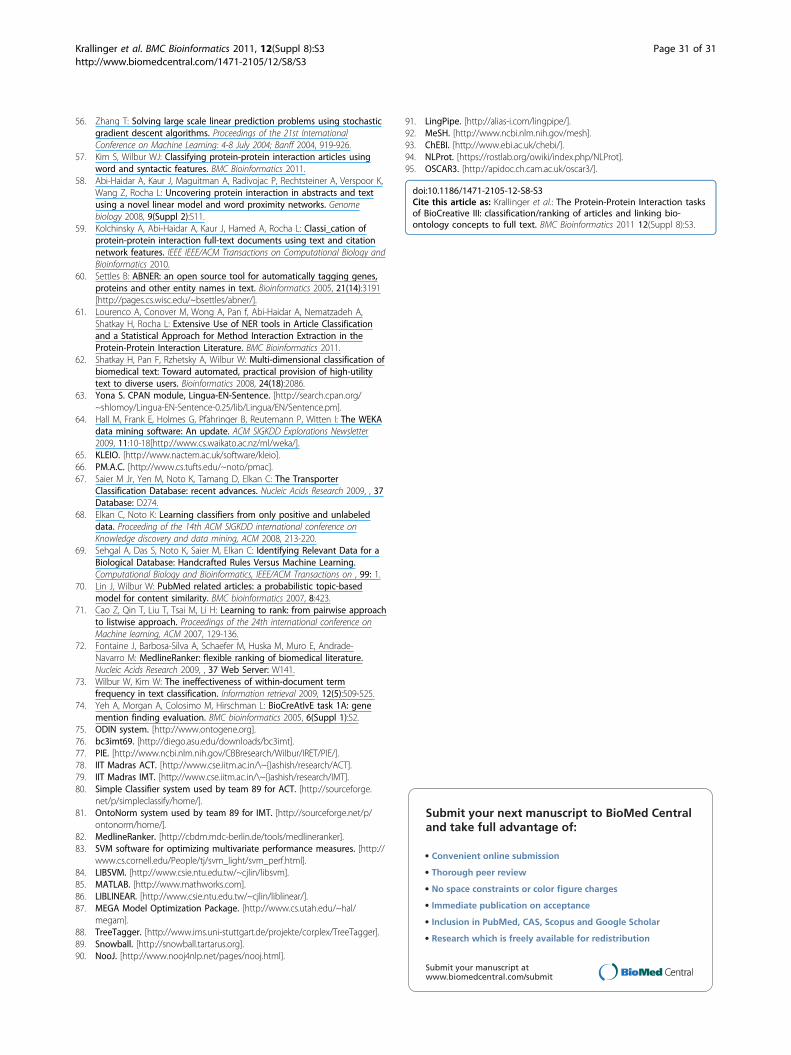
56. Zhang T: Solving large scale linear prediction problems using stochasticgradient descent algorithms. Proceedings of the 21st InternationalConference on Machine Learning: 4-8 July 2004; Banff 2004, 919-926.
57. Kim S, Wilbur WJ: Classifying protein-protein interaction articles usingword and syntactic features. BMC Bioinformatics 2011.
58. Abi-Haidar A, Kaur J, Maguitman A, Radivojac P, Rechtsteiner A, Verspoor K,Wang Z, Rocha L: Uncovering protein interaction in abstracts and textusing a novel linear model and word proximity networks. Genomebiology 2008, 9(Suppl 2):S11.
59. Kolchinsky A, Abi-Haidar A, Kaur J, Hamed A, Rocha L: Classi_cation ofprotein-protein interaction full-text documents using text and citationnetwork features. IEEE IEEE/ACM Transactions on Computational Biology andBioinformatics 2010.
60. Settles B: ABNER: an open source tool for automatically tagging genes,proteins and other entity names in text. Bioinformatics 2005, 21(14):3191[http://pages.cs.wisc.edu/~bsettles/abner/].
61. Lourenco A, Conover M, Wong A, Pan f, Abi-Haidar A, Nematzadeh A,Shatkay H, Rocha L: Extensive Use of NER tools in Article Classificationand a Statistical Approach for Method Interaction Extraction in theProtein-Protein Interaction Literature. BMC Bioinformatics 2011.
62. Shatkay H, Pan F, Rzhetsky A, Wilbur W: Multi-dimensional classification ofbiomedical text: Toward automated, practical provision of high-utilitytext to diverse users. Bioinformatics 2008, 24(18):2086.
63. Yona S. CPAN module, Lingua-EN-Sentence. [http://search.cpan.org/~shlomoy/Lingua-EN-Sentence-0.25/lib/Lingua/EN/Sentence.pm].
64. Hall M, Frank E, Holmes G, Pfahringer B, Reutemann P, Witten I: The WEKAdata mining software: An update. ACM SIGKDD Explorations Newsletter2009, 11:10-18[http://www.cs.waikato.ac.nz/ml/weka/].
65. KLEIO. [http://www.nactem.ac.uk/software/kleio].66. PM.A.C. [http://www.cs.tufts.edu/~noto/pmac].67. Saier M Jr, Yen M, Noto K, Tamang D, Elkan C: The Transporter
Classification Database: recent advances. Nucleic Acids Research 2009, , 37Database: D274.
68. Elkan C, Noto K: Learning classifiers from only positive and unlabeleddata. Proceeding of the 14th ACM SIGKDD international conference onKnowledge discovery and data mining, ACM 2008, 213-220.
69. Sehgal A, Das S, Noto K, Saier M, Elkan C: Identifying Relevant Data for aBiological Database: Handcrafted Rules Versus Machine Learning.Computational Biology and Bioinformatics, IEEE/ACM Transactions on , 99: 1.
70. Lin J, Wilbur W: PubMed related articles: a probabilistic topic-basedmodel for content similarity. BMC bioinformatics 2007, 8:423.
71. Cao Z, Qin T, Liu T, Tsai M, Li H: Learning to rank: from pairwise approachto listwise approach. Proceedings of the 24th international conference onMachine learning, ACM 2007, 129-136.
72. Fontaine J, Barbosa-Silva A, Schaefer M, Huska M, Muro E, Andrade-Navarro M: MedlineRanker: flexible ranking of biomedical literature.Nucleic Acids Research 2009, , 37 Web Server: W141.
73. Wilbur W, Kim W: The ineffectiveness of within-document termfrequency in text classification. Information retrieval 2009, 12(5):509-525.
74. Yeh A, Morgan A, Colosimo M, Hirschman L: BioCreAtIvE task 1A: genemention finding evaluation. BMC bioinformatics 2005, 6(Suppl 1):S2.
75. ODIN system. [http://www.ontogene.org].76. bc3imt69. [http://diego.asu.edu/downloads/bc3imt].77. PIE. [http://www.ncbi.nlm.nih.gov/CBBresearch/Wilbur/IRET/PIE/].78. IIT Madras ACT. [http://www.cse.iitm.ac.in/\~{}ashish/research/ACT].79. IIT Madras IMT. [http://www.cse.iitm.ac.in/\~{}ashish/research/IMT].80. Simple Classifier system used by team 89 for ACT. [http://sourceforge.
net/p/simpleclassify/home/].81. OntoNorm system used by team 89 for IMT. [http://sourceforge.net/p/
ontonorm/home/].82. MedlineRanker. [http://cbdm.mdc-berlin.de/tools/medlineranker].83. SVM software for optimizing multivariate performance measures. [http://
www.cs.cornell.edu/People/tj/svm_light/svm_perf.html].84. LIBSVM. [http://www.csie.ntu.edu.tw/~cjlin/libsvm].85. MATLAB. [http://www.mathworks.com].86. LIBLINEAR. [http://www.csie.ntu.edu.tw/~cjlin/liblinear/].87. MEGA Model Optimization Package. [http://www.cs.utah.edu/~hal/
megam].88. TreeTagger. [http://www.ims.uni-stuttgart.de/projekte/corplex/TreeTagger].89. Snowball. [http://snowball.tartarus.org].90. NooJ. [http://www.nooj4nlp.net/pages/nooj.html].
91. LingPipe. [http://alias-i.com/lingpipe/].92. MeSH. [http://www.ncbi.nlm.nih.gov/mesh].93. ChEBI. [http://www.ebi.ac.uk/chebi/].94. NLProt. [https://rostlab.org/owiki/index.php/NLProt].95. OSCAR3. [http://apidoc.ch.cam.ac.uk/oscar3/].
doi:10.1186/1471-2105-12-S8-S3Cite this article as: Krallinger et al.: The Protein-Protein Interaction tasksof BioCreative III: classification/ranking of articles and linking bio-ontology concepts to full text. BMC Bioinformatics 2011 12(Suppl 8):S3.
Submit your next manuscript to BioMed Centraland take full advantage of:
• Convenient online submission
• Thorough peer review
• No space constraints or color figure charges
• Immediate publication on acceptance
• Inclusion in PubMed, CAS, Scopus and Google Scholar
• Research which is freely available for redistribution
Submit your manuscript at www.biomedcentral.com/submit
Krallinger et al. BMC Bioinformatics 2011, 12(Suppl 8):S3http://www.biomedcentral.com/1471-2105/12/S8/S3
Page 31 of 31