the power of competition: reducing or reinforcing discrimination?
TRANSCRIPT

The power of competition: reducing or reinforcing discrimination?
Christiane Schwieren∗
(Universitat Pompeu Fabra)
Maarten Vendrik
(Universiteit Maastricht)
Peter de Gijsel
(Universiteit Utrecht)
Abstract
Economic theory argues that competition can diminish discrimination in the labor market,
while arguments from social psychology’s social-identity theory point into the opposite
direction. We ran two experiments to test the psychological predictions in an ‘economic’
setting. Participants were categorized artificially and played a team game, facing either strong
or weak competition. They further had to choose a new team member from either of the
categories, and pay for enactment of their preference. Only under strong competition, subjects
were willing to pay for their preference. The result gives qualified support to the prediction
from social-identity theory.
Keywords: discrimination, competition, social identity, experiment.
JEL Code: J71, C92
∗Corresponding author. Universitat Pompeu Fabra, Department of Economics and Business, Ramon Trias Fargas 25 – 17; 08005 Barcelona, Spain. Tel.: +34 93 542 2688; Fax: +34 93 542 1746; e-mail: [email protected]
Acknowledgements: We want to thank Joep Sonnemans, Jos Theelen, Jens Grosser, and other members of the CREED-team in Amsterdam for providing most valuable help conducting the experiments.

2
1 Introduction
Discrimination in the labor market is still surprisingly persistent. Because of this
persistence even in societies striving to eliminate it, a lot of research in economics, (social)
psychology, and related disciplines deals with this topic. One stream of research in economics
is interested in the question how product market competition influences discrimination. An
important argument is that under certain conditions competition has the power to diminish or
even stop discriminatory behavior [e.g., Becker (1957)]. However, a prominent social-
psychological theory, social-identity theory [SIT, e.g., Turner et al. (1986)], would rather
predict the contrary, but has not yet been applied in an economic context.
This paper incorporates SIT into a microeconomic model and presents two
experiments to test the predictions derived. Our model integrates Becker’s approach to
discrimination, statistical discrimination theory [e.g., Phelps (1972); Arrow (1973)], SIT, and
stereotyping research [e.g., Fiedler (2000)]. While economic approaches assume that
competition makes discriminatory behavior costly when no actual productivity differences
between groups exist, and thus will make it disappear in the long run, SIT makes the opposite
prediction. People are said to identify strongly with their ingroup when they are in a state of
self-relevant uncertainty1, and this can lead to strengthened discrimination against an
outgroup – especially if this outgroup is negatively stereotyped. Strong competition in the
product market can be such a situation of self-relevant uncertainty [see Vendrik & Schwieren
(2004)].
We describe two experiments conducted to test whether the ‘psychological’
predictions of the integrated model find any support in an economic setting. To our
knowledge this is a first attempt to directly analyze discrimination in the labor market
experimentally. In our experiments several teams were engaged in a task which represented
‘production’ of a product sold on a market. This market was either strongly competitive,
represented by low output prices, or weakly competitive, represented by higher output prices.
1 Self-relevant uncertainty is uncertainty about important things for the life and the self of a person, for example having a job, being able to make a living, or succeeding in some important task.

3
In both experiments subjects were categorized artificially, but some information was
given about performance of the two categories, to make participants develop a stereotype of
each category (see below). Discrimination was measured by asking participants two things:
First, whether they had a preference for a person of their own or the other category as a new
member for their team. Second, we asked whether and how much they were willing to pay for
getting the preferred new member with a higher probability than 50:50 (which was the default
probability). Consistent with the predictions from social-identity theory, the experiments
found a payment in the strongly competitive situation only, but it tended to be in favour of the
outgroup.
The organization of the paper is as follows. First, section two shortly describes the
theoretical background and model underlying the experiments, and develops the hypotheses.
Section three describes the two experiments and discusses their results. Section four
concludes with a general discussion.
2 Theoretical background and hypotheses
2.1 Theories The most influential economic theories on discrimination in the labor market are
Becker’s theory of employer discrimination and statistical discrimination theory (Phelps;
Arrow). Our research refers to both approaches, however assuming that there are no (longer)
actual differences in the distribution of productivities between the discriminated and non-
discriminated group. In Becker’s model, discrimination in hiring or wages is caused by a
‘taste for discrimination’ of the employer, which makes him willing to pay higher wages to
members of his preferred group to be able to work only with them. However, in a competitive
environment employers with such discriminatory tastes will have a cost disadvantage vis-à-
vis non-discriminating employers since the latter will hire (more) - equally qualified -
members of the discriminated group for lower wages. When increasing competition
suppresses profits to zero in the long run, this allows the non-discriminating employers to
drive the discriminating employers out of the market. Moreover, in a shorter run, an income
effect of falling profits (Comanor, 1973) induces discriminating employers to diminish their
discriminatory behavior.

4
However, employees may also have a taste for discrimination, and this discrimination
not necessarily disappears under competition in the product market. But many of today’s
firms are structured in teams, with flat hierarchies. This means that (high-skilled) employees
are also employers, taking part in hiring decisions and sharing in profits, i.e. being directly
affected by the situation of the firm. This may especially hold for jobs on the level of middle
or higher management. In such a situation employee discrimination is vulnerable to
competitive conditions in the product market as well. If there is imperfect information about
productivities of applicants, discriminatory tastes of employers and employees tend to be
rationalized into incorrect perceptions of a difference in average or variance of productivities
between the discriminated and non-discriminated groups (Arrow, p. 26). This renders the
discrimination statistical (i.e., it is discrimination against individuals because of (perceived)
differences between groups with respect to productivity), but since the perceptions are not
backed by actual differences in productivity between the two groups, this ‘weak’ variant of
statistical discrimination will be vulnerable to competition in the product market in the same
way as Becker’s discrimination.
Dealing with teams making hiring decisions, one is drawn to social-psychological
literature on discrimination. Social-Identity Theory [SIT, Turner et al.], and its extension
Self-Categorization Theory [SCT, e.g., Haslam et al. (1996)] are prominent social-
psychological theories dealing with discrimination. As they do not explicitly discuss labor
market situations, one has to extrapolate from their more general findings. Applying SIT to
labor market situations, the conclusion is very different from Becker’s. SIT states that self-
categorization in terms of a salient ingroup can, under certain circumstances, lead to
discriminatory attitudes and behavior. Circumstances leading to strong self-categorization are,
for example, situations of high self-relevant uncertainty, i.e. uncertainty about things, which
are important for a person, like profits for an employer. Situations of strong competition can,
in the eyes of an employee or employer, be perceived as giving rise to strong self-relevant
uncertainty, for several reasons. For the employer it is never sure whether he can stay in the
market – which is also (self-)relevant for his employees. Furthermore, we assume imperfect
information about productivities of employees, which constitutes self-relevant uncertainty in
situations of strong competition for the same reason – hiring badly performing employees can

5
reduce the chances of survival of the firm. Therefore, SIT would for discrimination in the
labor market rather predict more than less discrimination in the labor market when
competition gets stronger.
An important channel by which ingroup identification leads to more discrimination is
a stronger reliance on stereotypes [e.g., Turner et al.]. Discrimination on the basis of
stereotypes is basically the same as statistical discrimination – with the difference that
psychological research predicts that even when there are no longer any actual differences
between the two groups, the stereotype can persist. Reasons for this persistence can be,
among others, rationalization of prejudice (the emotional component of discrimination that
underlies Becker’s taste; see above) or a bias in the perception of bigger ingroup samples
versus smaller out-group samples [(Fiedler et al. (1999)]. In another paper, Vendrik and
Schwieren develop a theoretical model which integrates all these concepts and explains in
more detail how increasing competition in the product market may induce profit-sharing
teams (e.g. partnerships) to rely more on wrong stereotypes and prejudices about groups in
their hiring and pay decisions, and hence to discriminate more. It does so by showing that
‘psychological’ effects may dominate counteracting ‘economic’ effects. The current paper
presents a first experimental test of this theoretical model, which is therefore shortly
explained in the following section.
2.2 Model The kind of economic situation our experiments try to mimic is the following. A
number of firms produce the same homogeneous good and sell it in the same competitive
market. The number of competitors in this market is so large as to make them effectively
price takers. The internal structure of the firms is that of teams of partners who collectively
produce the good and collectively take decisions on, among other things, hiring of new
members. All team members receive a fixed base wage as well as an equal share in the profits
of the team. New team members can be hired from a certain ingroup as well as the
corresponding outgroup. Within these groups marginal team productivities qi, i.e. marginal
contributions of new team members to the prevailing team production, may differ, but

6
between the groups no actual differences in the distribution of qi exist2. Nevertheless, team
members have stereotypic perceptions Sq of the average marginal team productivity q of the
two groups in favor of the ingroup. (Emotional) prejudices may play a role in that and are
supposed to be fully rationalized into the incorrect stereotypic perceptions Sq . The
discrimination coefficient of a team D, i.e. the additional amount of money the team is willing
to pay on average for hiring a member of one group instead of the other, is then given by
product price p times the average expected difference q̂∆ in qi between candidate members
from the ingroup and the outgroup. This q̂∆ is based on the difference Sq∆ in stereotypic
perceptions Sq of ingroup and out-group, but also on indications that there is no actual
difference in q between the ingroup and outgroup. Then q̂∆ can be shown to equal SqS ∆ ,
where the extent of using stereotypes ]1,0[∈S is equal to the perceived reliability of Sq∆
relative to the sum of perceived reliabilities of Sq∆ and the indications of 0=∆q (see
Vendrik and Schwieren for a derivation for an analogous case).
Increasing competition is conceived as a rise in supply relative to demand in the
product market near the equilibrium price p. This leads to a fall in p. Increasing competition
elicits more self-relevant uncertainty, and hence more identification with the ingroup, and this
is assumed to raise S or Sq∆ , or both.3 The team discrimination coefficient SqSpD ∆= will
then rise as well if the relative rise in SqS ∆ is stronger than the relative fall in p. Results of
Vendrik and Schwieren suggest that this may especially hold for lower p, i.e. when
competition is strong. However, since it may not hold for all ranges of p, the experiments
only tested the direction of change in pDqS S /=∆ .4
In addition, the experiments measured the strengths of discriminatory preferences of
individual team members in a cardinal way since there may be a discrepancy between the
effects of competition on discriminatory preferences as stated by way of this measure and the
2 They might have existed in the past, when they were learned, but they have not persisted until today. 3 In the model of Vendrik and Schwieren there is also a counteracting ‘economic’ effect due to increases in screening expenditures on individual candidates. This ‘economic’ effect is not incorporated in the experiments reported here since information on individual candidates was not provided (see Sec. 3 for an explanation). 4 When competition increases in the other product markets of the economy as well, p can be interpreted as an indicator of the general price level. In that case D/p corresponds to the real discrimination coefficient.

7
effects of competition on discriminatory preferences as revealed in the willingness to pay
pD / .5 Notwithstanding this discrepancy, the stereotypic perceptions Sq in favor of the
ingroup are expected to lead to a stated preference for an ingroup member. Furthermore the
strength of this stated preference is supposed to rise with the expected productivity difference
between candidate members from the ingroup and the outgroup, SqSq ∆=∆ ˆ , when
competition increases.6
2.3 Hypotheses In the experiments the stated discriminatory preferences and the willingness to pay
pD / were measured under conditions of weak and strong competition. On the basis of the
theoretical analysis given above we formulate four hypotheses:
H1) In general, a new team member from the ingroup is preferred over a new team
member from the outgroup.
H2) Under strong as compared to weak competition, a new team member from the ingroup
is preferred more strongly over a new team member from the outgroup.
H3) In general, an additional payment is made for a new team member from the ingroup
rather than for a new team member from the outgroup.
H4) Under strong as compared to weak competition, a higher additional payment is made
for a new team member from the ingroup than for a new team member from the
outgroup.
5 Experimental psychologists often doubt whether there is a direct link between stated ‘attitudes’ and behavior (see, e.g., Eagly & Chaiken, 1998). Having to pay for the enactment of a preference is a ‘stronger’ test than just having to state a preference. 6 If the stated preferences were consistent with the revealed preferences, a theoretical measure for the stated preferences is the disutility DU of each team member’s discrimination coefficient ND / , where N is the number of team members. This DU is given by NqSpNUDU S /)/(' ∆Π= , where )/(' NU Π is each team member’s marginal utility of income as determined by the profit share N/Π . The product NpNU /)/(' Π indicates the
subjective importance of the expected productivity difference ingroup SqS ∆ in each team member’s discriminatory preferences. Approximating )/(' NU Π by a power function, Vendrik and Schwieren show that for the range of powers found in empirical research this subjective importance rises when competition increases. This then reinforces the positive effect of the assumed rise in pDqS S /=∆ on the discriminatory preferences.

8
Hypotheses 1 and 3 are supposed to hold because of the assumption of a more or less reliable
( 1S < ) stereotypic perception Sq∆ in favor of the ingroup. Hypotheses 2 and 4 are expected
to hold because an increase in competition is assumed to lead to higher self-relevant
uncertainty, and hence to stronger identification with the ingroup and consequently a higher SqS ∆ . The intermediating psychological processes were not tested during the experiments
since this could have influenced subjects’ behavior either in the direction of socially desirable
(i.e., not-discriminating) behavior, or as a demand-effect7. Still, to get indications about the
relevance of these processes, some of the pertinent variables were measured at the end of the
experiment. This cannot be counted as a real test, as they in turn could have been influenced
by the decisions taken.
3 The experiments To our knowledge this is the first attempt to directly analyze discrimination in the
labor market in a laboratory experiment. However, experiments on discrimination in general
have been done in social psychology as well as in experimental economics. Prominent
examples of social-psychological research on discrimination are the minimal-group
experiments developed by Tajfel et al. (1971), on which we partly rely for our design. Other
social-psychological experiments focused on prejudice, e.g. studies using the Implicit
Attitude Test [see, e.g., Greenwald & Banaji (1995)]. In experimental economics,
discrimination has been studied for example by Fershtman & Gneezy (2001) in the context of
trust games. Experiments on the influence of status in markets also can be seen as dealing
with discrimination of lower-status traders (and women), who have been found to get paid
less for the things they are selling in an auction ran by Bell et al. (2001).
3.1 Design
Our experiments were designed such that it would be possible to control the effect of
the stereotype of the categories. Participants were provided with a stereotype of the two
categories blue and red, the (evaluative) content of which was known to the researchers. This
7 Psychologists assume that participants in experiments try to find out how they are expected to behave and consequentially behave the way they are expected. An effect is called a demand effect if it was very obvious

9
was done following the mechanism proposed by Fiedler et al. (see below). Artificial
categories were used to avoid uncontrolled effects of existing stereotypes, such as a
stereotype becoming salient which is not relevant here, but influences behavior. Examples for
this would be the stereotype that women are worse than men in a mathematical task like the
one used in the experiment, but also a contrary stereotype that female students are more
cooperative and put more effort in everything they do at the university than male students. As
far as such stereotypes have some ground in reality, we want to avoid them in our
experiments since these focus on pure group discrimination in the absence of actual
productivity differences between the groups. Furthermore, the use of artificial categories
helped to reduce social-desirability concerns – the fact that subjects know that one should not
discriminate against women.
Discrimination was operationalized as any preference for a new member based on
belonging to a category in a situation where no actual difference in productivity distribution
between categories exists. Participants did not have any individual information about the
possible new members and also could not acquire it. This was the easiest way to guarantee
that subjects had the same average information about members of both groups. Giving
information about individual members of the two groups could lead to evaluative differences
between the categories, which of course would distort the mechanisms assumed.8 At no point
an explicit and clear link between performance and category membership was drawn.
Subjects first had to indicate a preference. In a second step they were asked to pay for
enactment of this preference. Payments raised the probability of getting a new team member
from the preferred category above the initial 50% chance. Since we wanted to measure the
direction of change in pDqS S /=∆ rather than that in D itself, the amounts of money D~ that
subjects were willing to pay (as a team) for getting a preferred new member with a higher
chance had to be expressed as fractions or percentages of the output price p. The relation
how subjects were supposed to behave and their behaviour was mainly influenced by the ‘demand’ characteristics of the design. 8 This could happen in an experiment with artificial categories and no a priori evaluative differences between the categories, because subjects would start to develop a picture of the categories in the experiment based on the individual information they get. This is not relevant for real-life situations, at least in the short run, as ‘real’ stereotypes have been developed over a long time and are quite resistant to change by exposure to inconsistent information.

10
between the experimental pD /~ and the theoretical pD / is derived in Appendix A. The
experimental pD /~ is likely to be a monotonously increasing function of the theoretical pD /
for not too low and not too high values of pD / . Conversely, this means that a higher value of
pD /~ found in the experiments implies a higher value of the underlying SqSpD ∆=/ . Thus,
under the assumptions made in Appendix A, a significant direction of change in pD /~ found
in the experiments gives an unambiguous indication of the direction of change in the
perceptions SqSq ∆∆ =ˆ . However, since we could not determine the size of change in SqSq ∆∆ =ˆ , we could not combine this with the information on the imposed variation in the
output price p (see below) to find the direction of change in the discrimination coefficient SqSpD ∆= . To approximately maximize the chance of finding significant differences in
pD /~ , and hence in pD / , under different strengths of competition, subjects had to pay 15%,
30%, 45%, 60% or 75% of the output price p of the last round to raise the probability of
hiring the preferred member by successive steps of 10% (see Appendix A for a derivation).
Thus, by paying 75% they got the preferred member for sure (see Table 1).
Table1: Percentages of p paid and corresponding probability changes
Percentage of p paid 0 15 30 45 60 75
Probability to get the preferred new member (in
%)
50 60 70 80 90 100
Competition was operationalized as either high or low output prices p. High p result from
weak competition on the supply side of the output market, while low p are a result of strong
competition on the supply side. Teams have to perform as well as possible to get as many
points (money) as possible. In a situation with high p, already for low output a relatively high
amount of money is earned. On the other hand, when p is low, a high level of output is
necessary to make some earnings. Self-relevant uncertainty then exists in the sense of ‘risk of
getting no (or low) rewards’ in both experiments.

11
The design of the experiments borrows from economic and psychological
experimental methodology, which differ in certain respects [see, e.g., Hertwig & Ortmann
(2001)]. In economic experiments subjects are usually paid depending on their performance,
and there is generally no (need for) deception of the subjects. In psychological
experimentation, often situations are studied were performance-based payment is not feasible,
because there is no clear performance criterion. In some cases deception of the subjects about
certain aspects or the real purpose of the experiment is necessary, because otherwise
measurement of the variables of interest is hardly or not at all possible. In our experiments it
was possible to pay subjects performance-based, though not directly for the most important,
the ‘hiring’ decision, but for general performance. To avoid getting only socially desirable
answers, and to link the experiments with the existing research on social-identity theory,
artificial categories were used, but no deception of the subjects.
3.2 Experiment 1 Subjects
80 students (54 males, 26 females) from various faculties of the University of
Amsterdam participated in teams of four members in four sessions of five teams each.
Material
The experiment was computerized using the software z-Tree developed by
Fischbacher (1999), and was conducted in the experimental laboratory of CREED at the
University of Amsterdam. All instructions were given on paper, but all tasks were done via
the computer.9 Division into categories (blue and red) was done by random assignment of
subjects to computers. The real-effort task consisted of multiplying pairs of numbers
randomly generated by the computer.
Procedure
Upon arrival, subjects were randomly assigned to a computer, which defined their
category (blue or red), and they got the first instructions. The first part of the experiment
consisted of a stereotype-generation task designed following Fiedler et al., in which subjects
had to practice the real-effort task they had to do later (the multiplications). They then got
9 Instructions will be made available on the first author’s web page.

12
selective feedback about the performance of members of the two categories in the following
way. Of all results of the practice period some were selected and presented sequentially on the
screen, such that for the blue category 16 instances of good and 8 instances of poor
performance were shown, compared to 8 instances of good and 4 instances of poor
performance for the red category. The information was presented on the screen in the
following way: ‘Calculation number x: someone of the category blue/red did this
correctly/wrongly’. With respect to the mean and higher-order moments of the distribution of
performance this information was the same for both categories. Fiedler et al. show how such a
pair of distributions can lead to the impression that the category with more information
available performs better. This results in a ‘wrong’ stereotype, which ‘rationally’ should not
play a role in decision-making.
After this stereotype-generation task, subjects were distributed into three
homogeneous ‘blue’ teams and two ‘spare’ teams (one ‘red’-only team and one mixed team).
The ‘discrimination’ measure consisted of one question asking subjects whether they would
prefer a new member to be rather from their own or the other category. The ‘spare’ teams
were necessary because ‘new members’ for later rounds were needed. They needed to have
some experience with the game, because otherwise they could be expected to perform worse
than ‘old’ members.
Teams first played two rounds of the real-effort game. In the strong-competition
treatment ‘output prices’, i.e., the money subjects got for each correct multiplication, varied
between 0.75 and 1.25 guilders (€ 0.34 - € 0.57). In the weak competition treatment, these
output prices varied between 1.25 and 1.75 guilders (€ 0.57 - € 0.79). Output prices were
given as a range to enhance uncertainty, while still giving subjects some information so that
they could develop expectations. This models a situation of competition with imperfect
information quite closely. Teams had one minute for ‘production’ in each round. Each team
started with a minus of four guilders (€ 1.80), representing wages for team members (€ 0.45
per team member and round). Any gains teams made were distributed equally among all
members. Subjects got feedback on group performance of the own group (not on exact output
prices) after each round.

13
After two rounds, members of the blue teams were asked to choose a new member for
their team, which they would get from the spare teams. They could indicate (the strength of)
their preference for either a red or a blue new member using a scrollbar from zero to 100, zero
meaning a very strong preference for a blue new member and 100 a very strong preference for
a red new member. Those who had indicated a preference for either a blue or a red new
member were then asked how much they were willing to pay to enhance the probability of
getting the preferred member. The four-person team had to make this payment together,
which means that each subject privately only had to pay one fourth of the price. After all
subjects had submitted their decisions, the computer randomly chose one team member of
each team whose decision was finally implemented. New teams were formed and payments
were made if applicable. Three more rounds were played in the new teams. After the fifth
round the experiment was concluded with a questionnaire, asking about, among other things,
sex of the participant, identification with the own category and subjective evaluations of each
category. Subjects were asked which category they thought performed on average better on
the task, using the same kind of scrollbar as for measuring the preference. This measure was
implemented to find out whether subjects did relate performance to category membership at
all. Identification was measured with one question, using a vertical scroll-bar ranging from
zero to four. We do not use answers to these questions for the main analysis, because they are
influenced by what happened during the experiment. They are only used to get a general
picture of how participants perceived the situation.
Finally, subjects were paid individually, based on their performance. There was no
show-up fee paid, but subjects could expect from the announcements to earn something
between 15 and 30 Dutch Guilders (about € 8 and € 15).
Results
Experiment 1 is analyzed using aggregate data on a team basis as members of one
team got the same feedback and data of individuals thus are not independent. All teams were
included in the analysis. As the sample still is rather small, non-parametric Man-Whitney-U
tests were used for comparisons between treatments. If not indicated otherwise, significance
tests for correlations were performed 1-tailed, following the specification of the hypotheses.

14
In the following, we refer to SCT when talking about the strong-competition (or low-output-
price) treatment and to WCT when talking about the weak-competition (or high-output-price)
treatment. Descriptive statistics of the results are shown in Table 2.
Table 2: Descriptive statistics for the most important variables
Treatment N Minimum Maximum Mean Std. Deviation
All data Preference for new member 12 29.00 73.25 49.06 13.29
Payment (in % of p) 12 .00 15.00 5.31 4.65
Evaluation of category 12 17.75 68.25 43.04 14.37
Identification 12 .25 2.50 1.23 .59
WCT Preference for new member 6 29.00 62.75 43.33 11.81
Payment (in % of p) 6 .00 11.25 3.75 4.11
Evaluation of category 6 17.75 68.25 41.04 16.20
Identification 6 .25 1.50 1.00 .45
SCT Preference for new member 6 38.00 73.25 54.79 13.05
Payment (in % of p) 6 3.75 15.00 6.88 4.98
Evaluation of category 6 26.25 61.25 45.04 13.51
Identification 6 .75 2.50 1.46 .66
Hypothesis 1 assumed that in general a new team member from the ingroup is
preferred over a new member from the outgroup. A t-test shows that overall the preference
measure does not differ significantly from 50, i.e., there is no significant preference for one of
the categories (t = -.24, p = .81 (2-tailed)). Looking at preferences for each category
separately, both preference for blue and preference for red differ significantly from zero
(blue: t = 2.9, p = .008; red: t = 2.28, p = .022). Together this indicates that there are
approximately as many participants preferring their own category as there are participants
preferring the other category. Thus, there is no evidence for Hypothesis 1.
Hypothesis 2 tested whether the effect proposed in Hypothesis 1 becomes stronger (or
appears) for stronger competition. To test this, preferences were compared between
treatments. No significant difference was found (Z = -1.44, as. sig. = .150 (2-tailed)).
However, there is a difference between treatments with respect to which preferences become

15
significantly different from zero10: Preference for a blue new member differs significantly
from zero in WCT, but only marginally significantly in SCT (WCT: t = 2.62, p = .023; SCT: t
= 1.51, p = .095). Preference for a red new member, on the other hand, differs significantly
from zero in SCT; but not in WCT (WCT: t = 1.00, p = .182; SCT: t = 2.17, p = .042).
Hypothesis 2 therefore did not find support either, and the additional test even shows that it is
rather new members from the outgroup which are preferred stronger when competition
strengthens, while preferences for ingroup members weakens.
Hypothesis 3 predicted that additional payment is made for a new team member from
the ingroup rather than for a new member from the outgroup: A U-test shows that there is no
significant difference in amount of payment for blue and red new members (Z = -.78, as. sig.
= .44 (2-tailed)). Payments for both categories separately differ significantly from zero
(payment for red: t = 2.16, p = .025, for blue t = 2.24, p = .02). Thus, there was no evidence
for Hypothesis 3 as payments are made for new ingroup and new outgroup members equally.
To test the prediction of Hypothesis 4 that strong competition leads to higher levels of
payment for ingroup members, it was tested between treatments whether there is a difference
in payment for each category. We find a marginally significant difference in payment for a
red new member between the two treatments, payment being higher in SCT (for red: Z = -
1.80, as. sig. = .072; for blue: Z = -.73, as. sig. = .465 (2-tailed)). A U-test for each of the
treatments testing whether there is more payment for the ingroup than for the outgroup could
not be calculated due to the small sample size. Payment for a blue new member differs
marginally significantly from zero in both treatments, whereas payment for red does not differ
from zero in WCT, but it significantly does so in SCT (WCT: Payment for red: t = 1.0, p =
.187; for blue t = 1.75, p = .070; SCT: For red t = 2.24, p = .035; for blue t = 1.58, p = .085).
Thus, Hypothesis 4 also does not find support as more payment is made for outgroup
members when competition is stronger. Table 3 shows descriptive statistics and U-tests for
these results.
10 This test was performed 1-tailed, as values below zero were not possible. This holds for all similar tests of difference from zero.
16
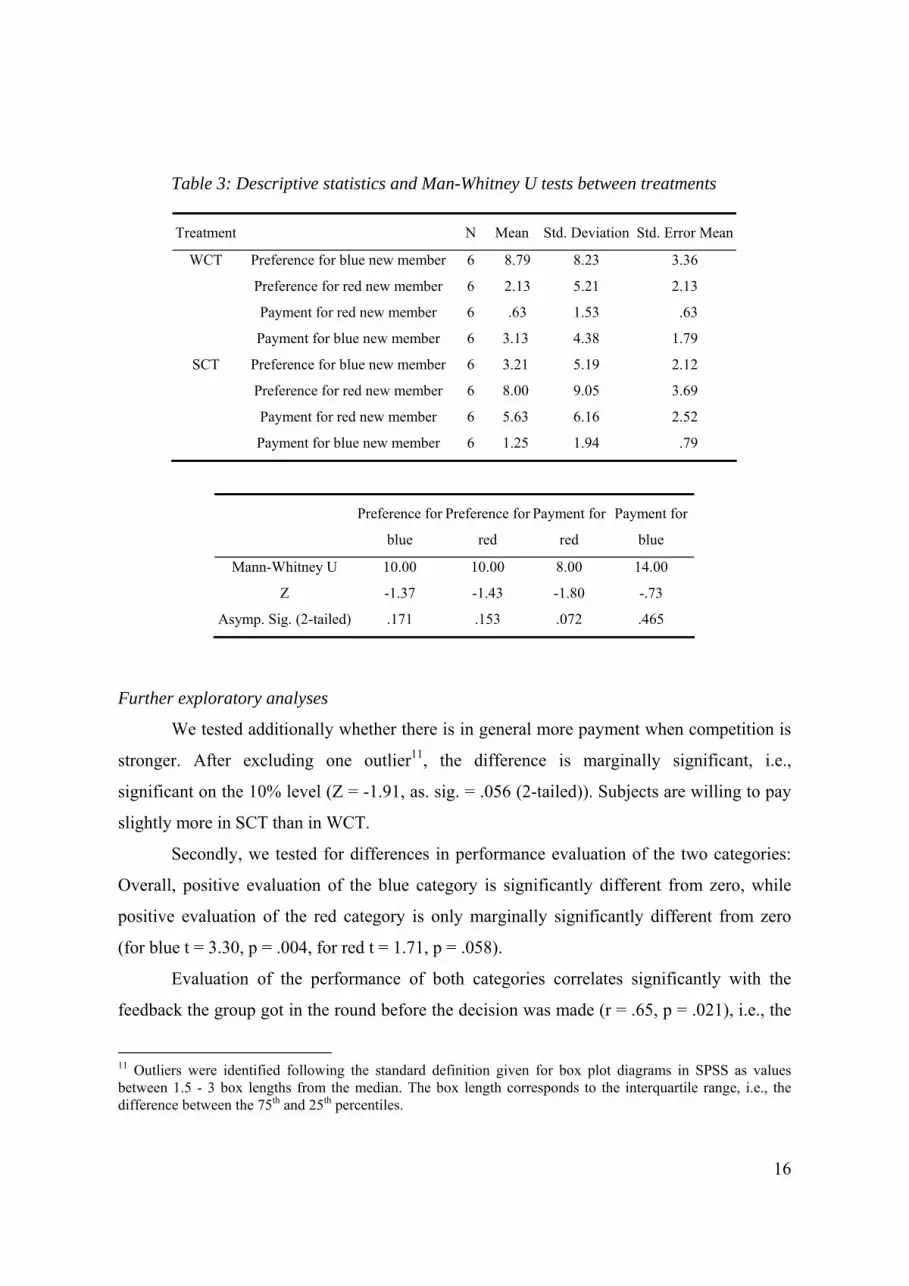
Table 3: Descriptive statistics and Man-Whitney U tests between treatments
Treatment N Mean Std. Deviation Std. Error Mean
WCT Preference for blue new member 6 8.79 8.23 3.36
Preference for red new member 6 2.13 5.21 2.13
Payment for red new member 6 .63 1.53 .63
Payment for blue new member 6 3.13 4.38 1.79
SCT Preference for blue new member 6 3.21 5.19 2.12
Preference for red new member 6 8.00 9.05 3.69
Payment for red new member 6 5.63 6.16 2.52
Payment for blue new member 6 1.25 1.94 .79
Preference for
blue
Preference for
red
Payment for
red
Payment for
blue
Mann-Whitney U 10.00 10.00 8.00 14.00
Z -1.37 -1.43 -1.80 -.73
Asymp. Sig. (2-tailed) .171 .153 .072 .465
Further exploratory analyses
We tested additionally whether there is in general more payment when competition is
stronger. After excluding one outlier11, the difference is marginally significant, i.e.,
significant on the 10% level (Z = -1.91, as. sig. = .056 (2-tailed)). Subjects are willing to pay
slightly more in SCT than in WCT.
Secondly, we tested for differences in performance evaluation of the two categories:
Overall, positive evaluation of the blue category is significantly different from zero, while
positive evaluation of the red category is only marginally significantly different from zero
(for blue t = 3.30, p = .004, for red t = 1.71, p = .058).
Evaluation of the performance of both categories correlates significantly with the
feedback the group got in the round before the decision was made (r = .65, p = .021), i.e., the
11 Outliers were identified following the standard definition given for box plot diagrams in SPSS as values between 1.5 - 3 box lengths from the median. The box length corresponds to the interquartile range, i.e., the difference between the 75th and 25th percentiles.

17
more positive the feedback, the more subjects thought that blue new members performed
better than red new members and vice versa. This feedback also correlates marginally
significantly with preference (r =.57, p = .053), i.e., the worse the own (blue) team did, the
stronger is the preference for a red (i.e., outgroup) new member.
Finally, identification with the own category was in general low (mean = 1.23, std.
dev. = .59; split by treatment: WCT: mean = 1.00, std. dev. = .45; SCT: mean = 1.46, std. dev.
= .66).
Discussion
For an interpretation of the results several problems of the data have to be considered.
First, feedback about performance of the own team was given after each round, and
this influenced the evaluation of the categories and probably also preferences, even if the
feedback was not relative, i.e., subjects did not know whether their team scored good or bad
in comparison to other teams. The influence of this feedback could well have been stronger
than the effect of the stereotype induction from the beginning of the experiment.
Secondly, as data had to be analyzed aggregated by group, the number of independent
observations per treatment was quite low. Therefore, non-parametric methods had to be used,
making it more difficult to detect existing effects.
Overall, the results show a quite complex pattern. Basically, none of the hypotheses
found support. In the strong-competition treatment, outgroup bias in the preferences was
found while in the weak competition treatment there was some ingroup bias in addition to
outgroup bias (with respect to preferences). However, this did hardly result in payment for
new members of this category, which illustrates that stated (ingroup) preferences do not
always translate into behavior. Hypothesis 4 did not find support in the current formulation,
but the underlying idea was confirmed: There was more payment in SCT than in WCT.
Spears et al. (2001) report that groups feeling lower in status or performance often
favor the outgroup, especially if they do not identify very strongly with their category –
which both probably was the case in the experiment reported here. Identification was in
general low. Subjects got overall quite negative feedback about their own performance – and
this feedback influenced their preferences. Outgroup bias was stronger when subjects got
more negative feedback about performance of their own group, i.e., when they felt lower in

18
performance (status). Outgroup bias therefore can be explained as economically rational
behavior. But, only under strong competition did subjects rely on the information about
performance of the categories they inferred from feedback.
Experiment 1 thus provided evidence for an interplay of ‘economic’ and
‘psychological’ factors, but not precisely in the way our theoretical model predicted: The role
of ‘economic’ factors became visible in that under strong competition all information which
could be seen as ‘diagnostic’ for performance of the new member was used ‘rationally’. As
subjects obviously believed that categories contained productivity-related information, this
could be interpreted as a weak form of statistical discrimination since there were no actual
productivity differences between the categories. However, subjects believed in the category-
related information only when competition was strong, which is in line with SIT´s prediction
that in situations of self-relevant uncertainty stronger identification leads to more use of
stereotypes. This is evidence that weak statistical discrimination based on wrong beliefs about
category differences strengthens when competition strengthens. Interestingly payment was
nearly only found in relation to outgroup bias. This suggests that subjects showing ingroup
bias in their preferences are more aware of the ‘non-economic’ motivations they might have
for preferring one category over the other.
A second computerized experiment was conducted without giving group feedback.
That way the influence of feedback on the perception of the categories could be avoided and a
larger amount of independent data was available, as we now could analyze the data by
individual subject. Furthermore, by pointing participants explicitly to the number of red and
blue members in the game (enabling them to relate the pieces of information to group size, if
they wanted), it was made easier for them to detect that the information was in general the
same for both groups. Doing this, we had a stronger test for the assumption that subjects
‘knowingly’ use ’irrelevant’ information to base their decisions on.
3.3 Experiment 2 Subjects

19
72 students from various faculties of the University of Amsterdam (47 males, 25
females) participated in four sessions of 20 res. 12 persons each.
Material
Basically the same material as in Experiment 1 was used.
Procedure
The two experiments differed with respect to the feedback subjects got after each
round: Now there was no feedback at all. A further difference was that participants were
explicitly pointed to the number of blue/red-category members in the game, as described
before.
Results
Unfortunately, for one session only twelve participants showed up. But, there were no
significant differences in any of the relevant variables between participants in this session and
those in the comparable 20-participants session. The session is therefore included in the
analysis. Some participants indicated in the final questionnaire that they already participated
in similar experiments, but as their data did not differ significantly from the other data in any
of the relevant variables, it was included in the analysis too.
This time data was analyzed on an individual basis, because there was no feedback
given to the teams during the experiment. Table 4 shows the descriptive statistics of the most
important variables for both treatments.
For a test of Hypothesis 1, we analyzed whether there is a difference in preferences
between the two treatments. A t-test shows that again general preference does not differ
significantly from 50 (indifference between red and blue; t = 1.18, p. = .25 (2-tailed)).When
analyzing preference for blue and preference for red separately, we find again that they both
differ highly significantly from zero (blue: t = 3.31, p = .002; red: t = 4.17, p = .000),
implying that subjects do have preferences for either of the categories. Again, we find no
evidence for Hypothesis 1.

20
Table 4: Descriptive statistics of the most important variables
treatment N Minimum Maximum Mean Std. Deviation
All data Preference for new member 44 0 100 54.93 27.84
Payment (in % of p) 44 0 45 4.09 9.36
Evaluation of category 44 9 100 50.77 22.53
Identification 44 0 4 1.20 1.27
SCT Preference for new member 24 0 100 51.75 29.92
Payment (in % of p) 24 0 45 6.25 11.63
Evaluation of category 24 9 100 49.79 22.37
Identification 24 0 4 1.13 1.23
WCT Preference for new member 20 4 100 58.75 25.36
Payment (in % of p) 20 0 15 1.50 4.62
Evaluation of category 20 11 100 51.95 23.24
Identification 20 0 4 1.30 1.3
Hypothesis 2 supposes that when competition is stronger, preference for an ingroup
member is stronger as well. However, the data show that preferences do not differ between
SCT and WCT (Z = –1.359, as. sig. = .174 (2-tailed)). Differences in preference for blue and
in preference for red between the two treatments do not become significant (for preference for
red: Z = -.756, as. sig. = .45; for preference for blue Z = .44, as. sig. = .66 (2-tailed); see
Table 5 for descriptive statistics). Contrary to the results of Experiment 1, in WCT only
preference for red differs significantly from zero (t = 2.89, p = .006), whereas in SCT
preferences for both categories differ significantly from zero (red: t = 2.92, p = .006; blue t =
2.88, p = .006).
Hypothesis 3 tested whether more payment is made for team members from the own
group in general. There is no difference in payment between red and blue new members (Z =
.00, as. sig. = 1.00). Payment for blue and for red new members differs significantly from
zero (blue: t = 1.95, p = .029; red: t = 2.01, p = .026). Hypothesis 3 thus again did not find
support.
Finally, to test Hypothesis 4 that stronger competition leads to more payment for new
members from the ingroup, we looked at payment in both treatments separately. As expected

21
after Experiment 1, the willingness to pay for any preference is marginally significantly
stronger in SCT than in WCT (Z = -1.61, as. sign. = .054). Only in SCT, general payment for
any of the categories differs significantly from zero (t = 2.63, p = .015). Split by category,
both payment for red and payment for blue new members are significantly different from zero
in SCT, but not in WCT (WCT: blue: t = 1.00, p = .17; red: t = 1.00, p = .17; SCT: blue: t =
1.70, p = .052; red: t = 1.81, p = .042; see Table 5 for descriptive statistics and U-tests).
Again, no U-test comparing statistically payment for red and payment for blue in each of the
treatments could be made because of the sample size. Thus, the same result for Hypothesis 4
as in the first experiment was achieved.
Table 5: Descriptive statistics and Man-Whitney U-tests between treatments
Treatment N Mean Std. Deviation
Low output prices Preference for red 24 11.04 19.97
Preference for blue 24 9.29 16.79
Payment for blue 24 2.50 7.22
Payment for red 24 3.75 10.13
High output prices Preference for red 20 12.55 20.37
Preference for blue 20 3.80 11.31
Payment for blue 20 .75 3.35
Payment for red 20 .75 3.35
Preference for red Preference for blue Payment for blue Payment for red
Mann-Whitney U 191.00 202.50 171.00 171.50
Z -1.30 -1.13 -1.01 -1.32
Asymp. Sig. (2-tailed) .193 .260 .310 .186
Further exploratory analyses
As in the second experiment no feedback about performance was given to participants
during the game, we could check not only whether subjects did relate category membership
and performance at all, but we could also test whether evaluations were related to preferences.

22
Relationships of preferences and payment with the evaluation of the categories: Both
the (positive) evaluation of the red and the blue category separately differ significantly from
zero (blue: t = 4.00, p = .000; red: t = 3.39, p = .001).
Overall, preferences are strongly correlated with the evaluation (made afterwards!)
that a certain category performed better on the task (r = .77, p = .000).
Payment for each category is (marginally) significantly correlated with (positive)
evaluation of both categories (blue: r = -.24, p = .056, red: r = .26, p = .042 (1-tailed)). Split
by treatment, these correlations remain significant in SCT, but not in WCT: Only one subject
in WCT wants to pay for a blue new member, and only few for red new members (SCT: blue:
r = -.34, p = .050; red: r = .49, p = .007; WCT: blue: r = -.05, p = .413; red: r = -.32, p = .082).
Identification again was low in general (all data mean = 1.2, std. dev. = 1.27; SCT
mean = 1.13, std. dev. = 1.23, WCT mean = 1.3, std. dev. = 1.3)
Sex differences: We also tested for sex differences, which in fact existed: In general,
women pay more for their preferences (Z = -3.04, as. sig. = .002), and they are also stronger
identifying than men (Z = -2.21, p = .027 (both 2-tailed)).
Discussion
In the second experiment most results from the first experiment could be replicated.
Again, when competition was stronger, more payments for the preferred member were made,
and preferences tended towards outgroup bias. Contrary to the first experiment, now in WCT
only outgroup bias with respect to preferences was found. This time, it was possible to see
whether preferences and payment are linked to performance expectations. Especially when
competition was strong, new members of the category perceived as performing better were
preferred. In SCT evaluation of the category correlated with payment, i.e., more payments
were made for the group perceived as performing better, which was not always the ingroup.
However, as evaluation has been assessed at the end of the experiment, this can also be an
indication of rationalization of behavior.
As there was no feedback given and the belief that the ingroup was performing badly
could not develop that easily, there was more ingroup bias with respect to stated preferences
and payment in SCT than in Experiment 1. Low opinion about the performance of one’s own
category could now not be derived from feedback on own-group performance, but may have
23
been based on the opinion subjects had about their personal performance. Again, in WCT
hardly any payments were made, and payment for blue new members was not or only
marginally significantly different from zero in any of the conditions.
In this second experiment, however, stronger competition did also lead to ingroup bias
with respect to preference and payment, which is more in line with the predictions of social-
identity theory. Overall, the results of Experiment 2 do again not confirm our hypotheses, but
they provide more evidence for a combination of ‘psychological’ and ‘economic’ factors
playing a role in the determination of discriminatory preferences and behavior.
4 General Discussion The two experiments provide evidence for a combination of psychological and
economic mechanisms, but not in the way our hypotheses predicted. In both experiments, a
significant number of subjects uses the – irrelevant – category information as basis for
decision-making, and more so, when competition is stronger. Subjects in the second
experiment also believe that the category they choose performs better than the other one. This
is in line with the predictions about the psychological mechanism of identification (which has
not been submitted to a direct test here). It can also be a sign of rationalization of behavior. In
both experiments, subjects under weak competition as well as under strong competition have
preferences for one of the categories, but under weak competition they are less willing to pay
for their preferences, probably because they know that these preferences are based on either
just ingroup identification or very unreliable information.
A general result therefore is that competition makes subjects believe in the
informational content of the categories and makes them use the categories as a proxy for
performance of the possible new member. This is some first evidence for the proposed
combination of psychological and economic mechanisms in determining discriminatory
behavior: The psychological mechanisms make subjects use the category information and
have preferences for any of the groups at all. Economically rational behavior makes them
refrain from paying for ‘irrational’ preferences - when competition is weak. When
competition is strong, psychological mechanisms seem to lead to a stronger belief in the
usefulness of the category information. ‘Economic’ mechanisms again make subjects use this
information in a ‘rational’ way. This can be described as a weak form of statistical

24
discrimination. Usually, it is assumed that statistical discrimination based on wrong
perceptions of productivity differences should disappear when competition gets stronger. The
different finding here is a new aspect with respect to weak statistical discrimination: it can
become stronger or just appear when competition becomes stronger.
Why did we find so much outgroup bias? One reason could be the fact that artificial
categories were used. Aspects like status of the categories and specific contents of stereotypes
of a category, which have a strong influence in real life, did not exist in this experimental
setting. Furthermore, only performance stereotypes, and not prejudice about the two
categories, played a role. The real-world categories labor market discrimination usually
applies to are stereotypically linked with good rather than bad ingroup performance of the
discriminating group. However, also in the real world minority groups sometimes do show
outgroup bias: An example is discrimination against female or black employees by female or
black employers. The finding that subjects in the experiments were more willing to pay for
outgroup preferences might result from a kind of self-deception: Subjects may realize when
perceiving ingroup bias that this might be a bias, but when they experience outgroup bias,
they might believe more in its reasonability.
Our results are in line with observations in the real world that, when information is
imperfect, people will make more use of the information they believe to be contained in a
category a person belongs to under strong(er) competition - no matter how relevant the
categories really are for an estimation of productivity. If categories contain real productivity-
related information, the result will be statistical discrimination against individuals. If
categories do not contain such information, the result will be group as well as individual
discrimination – the weak form of statistical discrimination.
The experiments also showed that outgroup bias is possible, especially when
competition is strong and the ingroup is perceived as performing badly. This is rarely
discussed in the psychological literature (but, see, e.g., Spears et al.). However, preconditions
for this to happen in the real world are probably (i) that decision makers assume that their
own group performs badly in the task at hand and (ii) that general identification with the
ingroup is not very high. In the real world, identification with one’s own category is stronger
than in the laboratory with artificial categories, and this might be even more so when

25
competition is strong. Precondition (i) also often does not hold with respect to real categories,
as it is not very probable that e.g. men really start to think that men in general perform worse
than women in a certain (male-dominated) task. Stressing positive aspects of the outgroup or
of diversity might help reducing discriminatory tendencies against outgroups when
competition is strong at the same time. It could, however, also be threatening for the ingroup.
Such a threat could then lead to stronger identification, or to focusing on other qualities of the
own group. In the end, stressing positive aspects of the outgroup might, by these
psychological effects, even lead to stronger discrimination.
For future research it would be important to do similar studies with real categories (to
allow for prejudice to influence behavior), and to construct experimental designs where
subjects have the possibility to search for individual information in addition to the category
information, to see in how far they still rely on category-based information.
To conclude, the experiments showed that it is very difficult to test for discriminatory
behavior in the labor market in experimental settings in the laboratory. They however also
showed that it is possible to do so, and that interesting results can be achieved both with
respect to theory testing and with respect to a better understanding of the processes
underlying discriminatory behavior. Therefore, we hope that in the future more experimental
research is done in this area, to complement theoretical and empirical studies analyzing
discrimination on the labor market both in economics and in social psychology.
Appendix Relation between experimental pD /~ and theoretical pD /
The relation between the experimental ‘real’ discrimination coefficient pD /~ and the
theoretical pD / can be derived as follows. Assume that the subjects choose pD /~
approximately in such a way that it maximizes the expected profit gain of their team from
getting a preferred new member or not, DREDRE ~]~[ −∆=−∆ .12 Here ∆R is the expected
12 Strictly speaking, subjects should maximize ]~)4/1()5/1[( DRE −∆ since revenues are shared among the five
members of the extended team including the new member, whereas the payment D~ is shared among the four

26
additional revenue from getting a preferred new member or not over the three rounds that are
played with the new member, i.e. SqpSqpR ∆=∆=∆ 3ˆ3 when a team member from the
preferred category is assigned to the team, and 0=∆R when a team member from the other
category is assigned. Thus, ∆R is stochastic. The probability ρ of getting a new member from
the preferred category depends on pD /~ as
pD /~5.0 βρ += for )2/(1/~/~max β=≤ pDpD , (A.1)
1=ρ for )2/(1/~/~max β=≥ pDpD ,
where β is a positive parameter. Hence,
SS
SS
qpSDqS
DqpSpDDqpSDRE
∆+−∆=
=−∆+=−−+∆=−∆
5.1~)13(
~)/~5.0(3~0)1(3~
β
βρρ (A.2)
for )2/(1/~ β≤pD , and DqpSDRE S ~3~ −∆=−∆ for )2/(1/~ β≥pD . The latter function is
decreasing in D~ , while function (A.2) is linearly increasing or decreasing in D~ , dependent
on the sign of the expression in front of D~ . Thus, we have three cases:
(i) 13 <∆ SqSβ or )3/(1 β<∆ SqS
(ii) 13 =∆ SqSβ or )3/(1 β=∆ SqS
(iii) 13 >∆ SqSβ or )3/(1 β>∆ SqS
In case (i) function (A.2) is linearly decreasing in D~ , implying that DRE ~−∆ is maximal for
0/~ =pD , so perception SqSq ∆=∆ ˆ is not large enough to make it advantageous to pay an
amount of money to raise the chance of getting a new team member from the preferred
category. In case (iii) function (A.2) is linearly increasing in D~ , implying that DRE ~−∆ is
maximal for )2/(1/~/~max β== pDpD , so perception SqSq ∆=∆ ˆ is large enough to make it
advantageous to pay the minimal amount of money that raises the chance of getting a new
team member from the preferred category to one. In the intermediate case (ii) function (A.2)
is constant with respect to D~ , implying that DRE ~−∆ is maximal for all values of pD /~
old members. However, we assume that subjects do not take this minor complication into account in their choice of D~ .

27
between 0 and 1/(2β). Plotting the optimal pD /~ as a function of pDqS S /=∆ we then get
the stepwise graph in Fig. 1.
PD /~
1/(2β)
0
1/(3β) D/P
Figure 1: The optimal PD /~ as a function of PDMPS /* =∆
However, we can safely presume that the subjects in the experiment chose their pD /~
not on the basis of such a precise calculation, but in a much more intuitive way. On the other
hand, we may assume that their intuition led to choices of pD /~ which form a smooth
approximation of the stepwise graph in Fig. 1. Such an approximation is indicated by the bold
smooth sigmoid curve in Fig. 1. A curve of this shape implies that the experimental pD /~ is a

28
monotonously increasing function of the theoretical pD / for not too low and not too high
values of pD / . Another implication of the sigmoid shape of the curve in Fig. 1 is that the
variation in pD /~ as a function of pD / is the strongest for values of pD / around 1/(3β).
Therefore, in order to make the probability of significant differences in pD /~ , and hence
in pD / , under different strengths of competition as high a possible, we chose the value of β
in such a way that 1/(3β) is roughly equal to an a priori guess of the order of magnitude of the
average value of SqSpD ∆=/ under the different strengths of competition. In the context of
the experiments our guess of this order of magnitude was 0.5 (point), implying a value of β of
1/1.5 = 2/3. The maximal value )2/(1/~max β=pD in Fig. 1, for which 1=ρ (see eq. (A.1)), is
then equal to 1/(4/3)= 0.75. Thus, by paying 15% of the output price ( 15.0/~ =pD in eq.
(A.1) the probability ρ of getting a new team member from the preferred category was raised
by %1015)3/2( =⋅ .
References
Arrow, Kenneth J., 1973. The Theory of Discrimination, In: O. Ashenfelter and A. Rees
(Eds.), Discrimination in Labor Markets. Princeton University Press, Princeton, pp. 3-33.
Becker, Gary, 1957. The Economics of Discrimination. The University of Chicago Press,
Chicago.
Bell, S., Eckel, C., Grossman, P. J., Zame, W., 2001. Status in Markets. The Quarterly Journal
of Economics 116, 161 – 188.
Comanor, W. S., 1973. Racial Discrimination in American Industry. Economica, 40, 363 –
378.
Eagly, A. H. and Chaiken, S., 1998. Attitude Structure and Function, In: S. T. Fiske, D. T.
Gilbert, G. Lindsay (Eds.), The Handbook of Social Psycchology, Vol. 1. McGraw Hill,
New York, pp. 269-322.
Fershtman, C., and Gneezy, U., 2001. Discrimination in a segmented society: An
experimental approach. The Quarterly Journal of Economics 166, 351 – 377.

29
Fiedler, Klaus, 2000. Beware of Samples! A Cognitive-Ecological Sampling Approach to
Judgment Biases. Psychological Review 107, 659 – 676.
Fiedler, K., Walther, E., Nickel, S., 1999. The Auto-Verification of Social Hypotheses:
Stereotyping and the Power of Sample Size. Journal of Personality and Social Psychology
77, 5 – 18.
Fischbacher, Urs, 1999. z-Tree: Toolbox for Readymade Economic Experiments. IEW
Working Paper 21, University of Zurich.
Greenwald, A. G., and Banaji, M. R., 1995. Implicit social cognition: Attitudes, self-esteem,
and stereotypes. Psychological Review 102, 4-27.
Haslam, S. A., Oakes, P., Turner, J. C., 1996. Social Identity, Self-Categorization, and the
Perceived Homogeneity of Ingroups and Outgroups: The interaction Between Social
Motivation and Cognition, In: R. M. Sorrentino and E. T. Higgins (Eds.), Handbook of
Motivation and Cognition, Vol. 3: The Interpersonal Context, Guildford, New York , pp.
182-222.
Hertwig, R. and Ortmann, A., 2001. Experimental practices in economics: A methodological
challenge for psychologists? Behavior and Brain Sciences 24, 383-451.
Mullin, B. A., and Hogg, M. A., 1998. Dimensions of subjective uncertainty in social
identification and minimal intergroup discrimination. British Journal of Social Psychology
37, 345-365.
Phelps, Edmund S., 1972. The Statistical Theory of Racism and Sexism. American Economic
Review 62, 659-661.
Vendrik, M. and Schwieren, C., 2004. Identification, screening and stereotyping in labor
market discrimination. Working paper, Department of Economics, Maastricht University.
Spears, R., Jetten, J., Doosje, B., 2001. The (il)legitimacy of ingroup bias: From social reality
to social resistance, In: B. Major and J. Jost (Eds.), The Psychology of Legitimacy:
Emerging Perspectives on Ideology, Justice, and Intergroup Relations. New York:
Cambridge University Press, New York, pp. 332 – 363.
Tajfel, H., Billig, M. G., Bundy, R. P., Flament, C., 1971. Social categorization and
intergroup behavior. European Journal of Social Psychology 1, 149-178.

30
Turner, J. C. and Oakes, P. J., 1986. The Significance of the Social Identity Concept for
Social Psychology with Reference to Individualism, Interactionism and Social Influence.
British Journal of Social Psychology 25, 237-252.