the potential of smart meter enabled programs to increase
TRANSCRIPT
Project funded by
Jessica Stromback
Christophe Dromacque
Mazin H. Yassin
VaasaETT, Global Energy Think Tank
The potential of smart meter enabled programs to
increase energy and systems efficiency: a mass
pilot comparison
Short name: Empower Demand

1 2011 VaasaETT Empower Demand
2 2011 VaasaETT Empower Demand
Executive Summary
The European Union has set ambitious objectives for the year 2020 to lower energy consumption by 20%,
lower CO2 emissions by 20% and ensure that 20% of energy is generated using renewable resources. At the
same time, it is actively engaged in creating road maps and investment plans for developing smart grids
throughout Europe. A core element of the smart grid is the active participation of the demand side and
only through the involvement and cooperation of the demand side can the 2020 objectives be met. Within
Europe and indeed globally, smart metering is viewed as a key building block in the smart grid and the most
cost/effective method for increasing end-consumer involvement and engagement.
The aim of the research whose results are presented in this report has been to discover the potential and
limitations of a range of feedback and dynamic pricing programs enabled through smart metering
technologies. VaasaETT’s findings and conclusions based on a large pool of pilots are designed to gauge
repeated results and surrounding requirements for success. The research involved collecting and
comparing about 100 pilots. Typically, organisers divide participants in a pilot into sub-groups in order to
test different solutions, for instance different feedback types, different dynamic pricing schemes, a group
with home automation and one without, etc. Hence, the pilots were broken down into 460 samples. The
samples were then analysed according to 22 different variables selected to gauge internal structural pilot
variables influencing success as well as outside market factors which might also impact a pilot outcome. In
total, over 450,000 residential consumers were involved in the reviewed pilots. Feedback pilots are
designed to help participants reduce their overall energy consumption, lowering distribution and supply
costs. In comparison with the other feedback channels, IHD resulted in the highest energy savings. The
remaining channels for feedback, webpage, and informative bills produced almost equal consumption
reduction levels. Quite possibly, the key advantage the IHD offers over the remaining channels for
feedback is the almost real-time and visible aspects of the delivery of feedback. TOU peak reductions are
the lowest, but they occur daily, while CPP and CPR produce the highest reductions but only for critical
peak periods. The main findings demonstrate that consumers do react to feedback and dynamic pricing
mechanisms positively, pilot results maintain over 2-3 years and they can also be effective in consumer
groups of over 1,000 households. In addition, post pilot surveys show that on average 75 – 90% of
participants were satisfied with the pilot with in which they took part. That said, results vary widely within
a given program type; an IHD pilot can attain 3% or 19% reductions. Therefore the research findings also
confirmed the assumption that surrounding variables have a substantial impact on program success levels
over and above the supportive technology used or program structure.
The findings of Empower Demand demonstrate that technology provides an important but enabling
function in creating a successful demand side program. It is one of five factors which decide success. These
factors are socioeconomic factors, participant consumption patterns, program content/structure,
supportive technology and household load sources. In this, socioeconomic factors and consumption
patterns can overcome supportive technology and program type. For example, a good informative billing
pilot can lead to higher savings than an IHD pilot depending on surrounding circumstances despite the fact
that on average an IHD is 50% more effective than an informative bill at reducing overall electricity
consumption. It is therefore important to perform a comprehensive analysis of markets when creating
demand side programs; matching the program structure with the market realities.

3 2011 VaasaETT Empower Demand
During piloting, there can be a technological focus or a preconceived opinion that the technology is what
decides program success. Our findings challenge this focus. The central difference we found between
pilot success and failure is the ability of the program designers to meet consumer needs through the
demand side program. Meeting a need is the foundation of consumer engagement and thereby of a
program success. The technology is the enabler within this value chain. Therefore, unless a technology is
equipped to act as a support to consumer engagement, it will not create savings or improve systems
efficiency. Smart meters fulfil their potential due to the fact that they can support consumer engagement
to a market-appropriate level through feedback and dynamic pricing and/or home automation. It is very
well expressed by Chris Johns, President of PG&E shortly after the company undertook the SmartRate
Pricing Program pilot project in 2010: “We thought we were undertaking an infrastructure project but it
turned out to be a customer project”1.
Program success is directly dependent on consumer involvement and the Empower Demand findings
indicate that "more is more" at every stage of the piloting and roll out process. For example, within
marketing, programs using consumer segmentation to create directed marketing messages for a particular
consumer group increase consumer uptake and results. In program structure, feedback and pricing
together tend to achieve better long-term overall results than either program type alone. Education
improves dynamic pricing and informative billing programs. Multiple types of information on a display or a
bill (current consumption, price, historical consumption, etc.) tend to achieve higher results than a display
or a bill with only one message. Program layering is little explored but there are signs that hidden potential
lies in starting with a relatively simple program and gradually creating offerings of increasing complexity
and value. Hence, we are far from having perfected program structures or perfectly matching program
structures to regional market realities. This should be seen as encouraging as even though program
development is not mature, results are already positive. This also puts into question the current tendency
to emphasise technological development over and above all other factors in European pilot schemes while
comparatively little funding is provided to studying the best messages to deliver to consumers, their cycles
of learning through program layering or the impact of surrounding socioeconomic and cultural factors.
Empower Demand has reviewed 100 pilots. The selected pilots alone included 450,000 consumers but the
resulting rollout from these pilots now includes over 4 million consumers. Smart meter enabled programs
are consistently effective when developed in accordance with the needs of end-consumers and enabled
through constructive regulation. Research questions set limits around what it is possible to learn from a
pilot; organizers will only get answers to the questions they ask. This is as much a limitation as it is a
resource. It is essential to move forward in pilot development through innovative questions, taking into
consideration the results of past pilots and comparative studies such as this one. Pilot organisers can now
focus their research on better understanding who is in the market and what can be done to maximise their
participation within that market’s reality. Long-term program success will require a comprehensive
combination of marketing, technological support, directed communication and a constructive regulatory
framework.
1 Proceeds of Trials & Tribulations of Smart Grid Deployment, A Case Study That Hits Home, BECC Conference, 2010.

4 2011 VaasaETT Empower Demand
Contents
1. Background to the study 6
2. Sources and provenance of the base information 8
2.1 Research categories and phases 8
2.2 Data and methodology 11
3. Program Definitions 12
3.1 Feedback Pilots 12
Background information 12
Samples and data 12
Feedback program types 13
Feedback information types 14
Overall results 15
3.2 Pricing Pilots 16
Background information 16
Samples and data 17
Dynamic pricing program types 17
Overall results 21
4. Research findings 23
4.1 Regional comparison 24
4.2 Climate and season of peaks 27
4.3 Length of pilot 27
4.4 Number of participants 31
4.5 Participant segmentation 35
4.6 Participant education 36
4.7 Interaction with participants (interviews, surveys and meetings) 44
4.8 Feedback information content 46
4.9 Dynamic pricing pilot design 52
4.10 Automation of appliances 57
5. Conclusions 62
5.1 Summary of findings 63
5.2 Ideal roll out strategies for utilities 69
5.3 Recommendations for future work 71
Sources & References 72
5 2011 VaasaETT Empower Demand
INDEX OF FIGURES
FIGURE 1: DISPLAY, ELECTRICITY SMART METERING CUSTOMER BEHAVIOUR TRIALS, IRELAND (2011) ................................................13
FIGURE 2 : THE ENERGY ORB, PG&E...................................................................................................................................13
FIGURE 3: EXAMPLE OF INFORMATIVE BILLING. SMUD POWER CHOICE LABEL PILOT, USA (2010) .....................................................14
FIGURE 4 : OVERALL CONSUMPTION REDUCTION AS PER FEEDBACK PILOT TYPE ...............................................................................16
FIGURE 5 : EXAMPLE OF A THREE LEVEL TOU PRICING SCHEME (BASED ON THE ELECTRICITY SMART METERING CUSTOMER BEHAVIOUR TRIALS,
CER, 2011). ........................................................................................................................................................17
FIGURE 6 : EXAMPLE OF CRITICAL PEAK PRICING SCHEME..........................................................................................................19
FIGURE 7: DYNAMIC PRICING’S POTENTIAL FOR PEAK CLIPPING ...................................................................................................21
FIGURE 8 : DYNAMIC PRICING’S POTENTIAL FOR CUSTOMER FINANCIAL SAVINGS .............................................................................22
FIGURE 9 : FEEDBACK PILOTS AND AREA OF TRIAL ....................................................................................................................24
FIGURE 10 : PEAK CLIPPING IN DIFFERENT REGIONS OF THE WORLD ..............................................................................................25
FIGURE 11 : PEAK SEASON AND PEAK CLIPPING .......................................................................................................................27
FIGURE 12 : DURATION OF IHD PILOTS AND ENERGY CONSERVATION ...........................................................................................28
FIGURE 13 : DURATION OF INFORMATIVE BILLING PILOTS AND ENERGY CONSERVATION .....................................................................28
FIGURE 15 : DURATION OF CPP AND CPR TRIAL AND PEAK CLIPPING ...........................................................................................29
FIGURE 14 : DURATION OF TOU TRIAL AND PEAK CLIPPING .......................................................................................................29
FIGURE 16 : SAMPLE SIZE AND ENERGY CONSERVATION IN IHD PILOTS .........................................................................................31
FIGURE 18 : SAMPLE SIZE AND PEAK CLIPPING IN TOU TRIALS ....................................................................................................32
FIGURE 17 : SAMPLE SIZE AND ENERGY CONSERVATION IN INFORMATIVE BILLING PILOTS ...................................................................32
FIGURE 19 : SAMPLE SIZE AND PEAK CLIPPING IN CPP AND CPR TRIALS ........................................................................................33
FIGURE 20: CURRENT UNDERSTANDING OF CONSEQUENCES OF ELECTRICITY CONSUMPTION ...............................................................36
FIGURE 21: KOLB’S EXPERIENTIAL LEARNING CYCLE ..................................................................................................................37
FIGURE 22 : INFLUENCE OF EDUCATION ON ENERGY CONSERVATION IN IHD TRIALS ..........................................................................38
FIGURE 23: INFLUENCE OF EDUCATION ON ENERGY CONSERVATION IN INFORMATIVE BILLING TRIALS ....................................................38
FIGURE 24 : INFLUENCE OF EDUCATION ON ENERGY CONSERVATION IN TOU TRIALS ........................................................................39
FIGURE 25 : INFLUENCE OF EDUCATION ON PEAK CLIPPING IN TOU TRIALS ....................................................................................39
FIGURE 26 : INFLUENCE OF EDUCATION ON PEAK CLIPPING IN CPP AND CPR TRIALS ........................................................................40
FIGURE 27 : INFLUENCE OF EDUCATION ON PEAK CLIPPING FOR PARTICIPANTS WITH AIR CONDITIONING (TOU TRIALS) .............................40
FIGURE 28 : INFLUENCE OF EDUCATION ON RESPONSE TO PRICE MULTIPLES IN TOU TRIALS................................................................41
FIGURE 29 : INFLUENCE OF EDUCATION ON RESPONSE TO PRICE MULTIPLES IN CPP TRIALS ................................................................41
FIGURE 30 : NUMBER OF FEEDBACK TYPE AND ENERGY CONSERVATION ........................................................................................47
FIGURE 31 : THREE MOST COMMON FEEDBACK TYPE COMBINATIONS IN IHD PILOTS AND ENERGY CONSERVATION ...................................48
FIGURE 32 : IMPACT OF FEEDBACK ON ENERGY CONSERVATION IN TOU TRIALS...............................................................................49
FIGURE 33 : IMPACT OF FEEDBACK ON PEAK CLIPPING IN TOU TRIALS...........................................................................................50
FIGURE 34 : INFLUENCE OF PEAK / OFF-PEAK PRICE MULTIPLES ON PEAK CLIPPING IN TOU TRIALS........................................................52
FIGURE 35 : INFLUENCE OF PEAK / OFF-PEAK PRICE MULTIPLES ON PEAK CLIPPING IN CPP TRIALS ........................................................52
FIGURE 36 : SIZE OF REBATE AND PEAK CLIPPING IN CPR PILOTS .................................................................................................53
FIGURE 37 : IMPACT OF LENGTH OF PEAK PERIODS ON ENERGY CONSERVATION FOR TOU TRIALS ........................................................54
FIGURE 38 : IMPACT OF LENGTH OF PEAK PERIODS ON PEAK CLIPPING FOR TOU TRIALS ....................................................................54
FIGURE 39 : FIVE MOST COMMON CRITICAL PEAK ALERT NOTIFICATIONS AND PEAK CLIPPING (CPP, CPR AND RTP TRIALS) ........................55
FIGURE 40 : IMPACT OF AUTOMATION ON PEAK CLIPPINGS ........................................................................................................58
FIGURE 41 : PEAK CLIPPING AND AUTOMATED LOAD (TOU TRIALS) .............................................................................................59
FIGURE 42 : PEAK CLIPPING AND AUTOMATED LOAD (CPP/CPR TRIALS).......................................................................................60
FIGURE 43: SUMMARY RESULTS OF FEEDBACK AND DYNAMIC PRICING PILOTS .................................................................................63
6 2011 VaasaETT Empower Demand
1. Background to the study
The European Union has set ambitious objectives for the year 2020 to lower energy consumption by 20%,
lower CO2 emissions by 20% and ensure 20% of energy is generated using renewable resources. At the
same time it is actively engaged in creating road maps and investment plans for developing smart grids
throughout Europe. The core of the smart grid is the active participation of the demand side and only
through the involvement and cooperation of the demand side can the 2020 objectives be met. Within
Europe2 and indeed globally, smart metering is viewed as a key building block in the smart grid and the
most cost/effective method for increasing end-consumer involvement and engagement.
Smart metering helps to enable consumption feedback and dynamic pricing programs directed at end-
consumers. Yet there is confusion and disagreement within the energy industry on exactly what can be
achieved through various smart meter enabled programs, how long they remain effective, if the pilots show
reliable results, if the programs can be cost effective, what type of feedback should be provided and in
what format etc.
The questions are creating an aura of uncertainty surrounding the potential of smart metering to further
the aims of the EU and its governments. It also raises questions as to whether smart meters are worth
their cost and whether they can bring lasting benefits to consumers. It lowers the willingness of regulators
to mandate smart metering deployment and for utilities to invest. The questions persist despite the fact
that well over 150 successful pilots involving smart meters have now been carried out globally. The
challenge lies in the fact that utilities and regulators do not have easy access to comparative data
demonstrating the results of a large number of pilots. They only see the results of one pilot at a time and
as any individual pilot leave many questions unanswered, overall trust in the technology remains an issue.
Therefore, ESMIG thought it necessary to fund an independent research study which collected and
compared a large enough number of pilots to demonstrate repeated and consistent results and give
answers to a wider variety of concerns. VaasaETT was selected by ESMIG to conduct such a large
comparative study designed to add weight to the results of any single pilot. The “Empower Demand” study
allows, for instance, utilities to know if their results are below or above average because they know the
average results of some 30-40 similar pilots done globally. It will also help them create better pilots as it
allows them to review the success factors in a wide range of other studies. From the point of view of
regulators and policy makers, such a wide-ranging pilot comparison can be a useful tool, as it allows to
identify proper support for smart metering in Europe and to stimulate demand driven programmes.
Empower Demand was designed to be an in-depth research project comparing 100 pilots according to 22
2 The EU’s “Third Energy Package” came into force on 9 September 2009 and consists of two Directives and three regulations which
are intended to complete the liberalisation and integration of the EU energy market, as well as strengthen consumer rights and
protection. The package includes Electricity and Gas Directives which require the EU Member States to ‘ensure the implementation
of intelligent metering systems.’ The Electricity Directive foresees full deployment by 2022 at the latest, with 80% of consumers
equipped with Smart Metering systems by 2020.

7 2011 VaasaETT Empower Demand
variables. The pilots were broken down into 460 samples and over 450,000 residential customers were
involved.
VaasaETT’s findings and conclusions as presented in the study are designed to gage any repeated results
and also surrounding requirements for success. The aim of the research has been to discover the potential
and limitations of a range of feedback and dynamic pricing programs enabled through smart metering
technologies using a large comparative sample. ESMIG solely provided the financial means to conduct the
present study and in future will fund further follow-up research into other related aspects which could not
be covered extensively in this study.
The Empower Demand study and its findings do represent VaasaETT’s own independent analysis and
opinion. The underlying methodology and sample base was developed by VaasaETT.

8 2011 VaasaETT Empower Demand
2. Sources and provenance of the base information
It is important to note that comparing pilots accurately contains many inherent complications. Pilots are
not constructed in order to be comparable. They are constructed to fit the needs and budget of the utility
or research institute and the methods as well as the quality differ substantially. For example, how energy
savings are calculated differs, it can be based upon households’ historical data or upon a control group’s
data. Sample sizes and selection methods also differ. Some pilots are large containing 30,000 customers
and are representative of the utilities customer base while others focus on one customer group for instance
customers with electric heating. Further differences will be discussed during the analysis this means that
the findings below can only be taken as useful indications of which elements influence pilot results, not as
an absolute recipe containing exact percentage numbers. They are meant to be seen as indications of what
tends to work and not work and to this extent they are useful.
Data from 100 pilots was used for the purpose of this research. These pilots were selected from a larger
pool which included pilots whose design or reporting of results were not sufficiently detailed or comparable
with the others to be included. Final reports, presentations and academic papers analyzing the selected
pilots were collected from numerous sources. Papers published in academic journals were collected from
academic databases. Public pilots' reports were collected directly from the organizer (often local regulators
or public utilities). In addition, VaasaETT drew on its extensive network of practitioners around the world
to collect pilots whose results were not made public usually from technology providers or investor-owned
Utilities.
2.1 Research categories and phases
The research involved collecting and comparing 100 pilots. Typically, pilot organisers divide participants to
a pilot into sub groups in order to tests different solutions; for instance different feedback types, different
dynamic pricing schemes, a group with home automation and one without. Hence, the pilots had to be
broken down into 460 samples. Each sample was therefore created and analysed as its own study. The
samples were then analysed according to 22 different variables selected to gage internal and structural
pilot variable influencing success as well as outside market factors which might also impact a pilot outcome.
In total, over 450,000 residential consumers were involved in the reviewed pilots.
Pilot structure variables:
1. Duration of pilots
2. Incentives to join pilots
3. Automation location
4. Education during pilot
5. Methods of communication for pricing alerts
6. Frequency of feedback

9 2011 VaasaETT Empower Demand
7. Format of feedback
8. Content of feedback
9. Pricing and feedback combined
10. Type of feedback
11. Questionnaires and Interviews
12. Length of peak hours
13. Multiple of peak price / base price
14. Number of participants
15. Pilot uptake rates
Market structure variables:
1. Climate/season of pilot
2. Regional differences between pilot results
3. Average national yearly Consumption Levels
4. Market competition levels
5. Capacity issues within market
6. Meter ownership
7. Data ownership
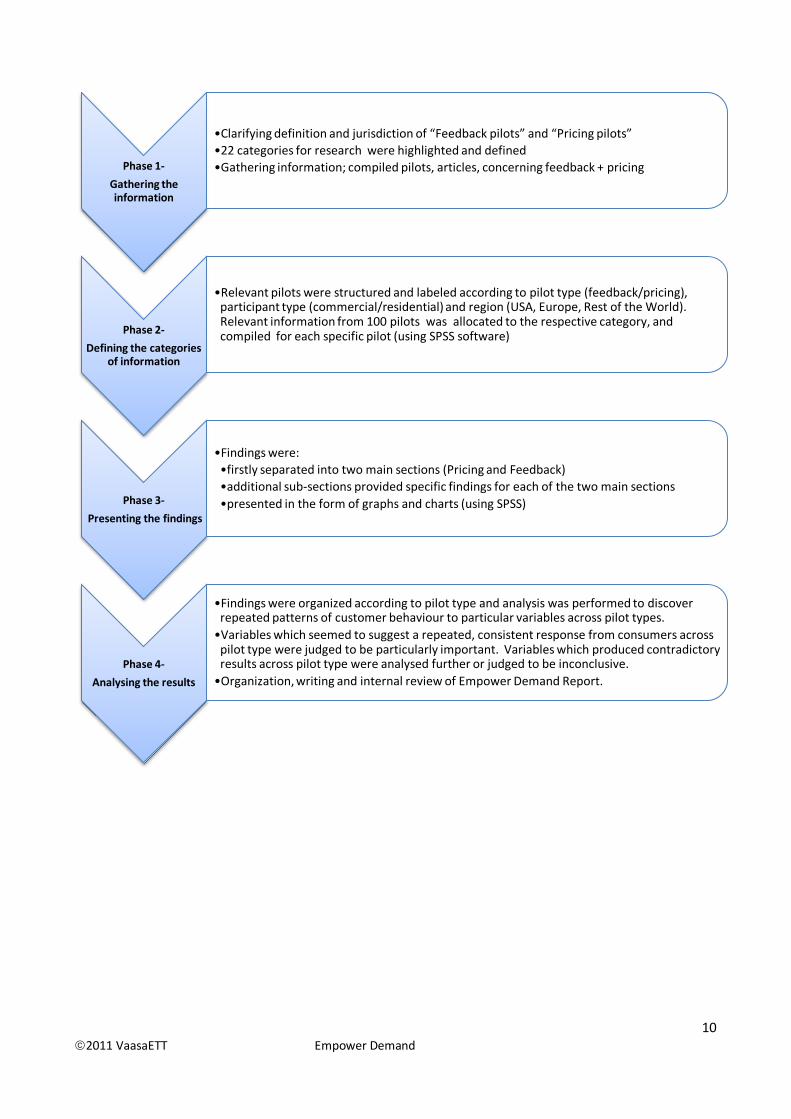
A four phase method was used to analyse the data and produce the results. The initial two phases,
gathering the information and defining the categories, formed the framework of our research and enabled
us to differentiate pilots and research articles, whereas phase 3-4 was geared towards our analysis and
findings.
10 2011 VaasaETT Empower Demand
Phase 1-
Gathering the information
•Clarifying definition and jurisdiction of “Feedback pilots” and “Pricing pilots”
•22 categories for research were highlighted and defined
•Gathering information; compiled pilots, articles, concerning feedback + pricing
Phase 2-
Defining the categories of information
•Relevant pilots were structured and labeled according to pilot type (feedback/pricing), participant type (commercial/residential) and region (USA, Europe, Rest of the World). Relevant information from 100 pilots was allocated to the respective category, and compiled for each specific pilot (using SPSS software)
Phase 3-
Presenting the findings
•Findings were:
•firstly separated into two main sections (Pricing and Feedback)
•additional sub-sections provided specific findings for each of the two main sections
•presented in the form of graphs and charts (using SPSS)
Phase 4-
Analysing the results
•Findings were organized according to pilot type and analysis was performed to discover repeated patterns of customer behaviour to particular variables across pilot types.
•Variables which seemed to suggest a repeated, consistent response from consumers across pilot type were judged to be particularly important. Variables which produced contradictory results across pilot type were analysed further or judged to be inconclusive.
•Organization, writing and internal review of Empower Demand Report.

11 2011 VaasaETT Empower Demand
2.2 Data and methodology
Impacts on pilot participants were assessed from three perspectives:
• Energy conservation: the extent to which the experiment led to a reduction in overall energy
consumption (in %)
• Peak clipping: the extent to which the experiment led to a reduction in energy consumption during
peak periods (in %)
• Bill reduction: the extent to which the experiment led to a reduction in customer energy bills (in
%).
Please note that pilot organizers rarely report the impacts of the experiments on all three perspectives.
They usually report on what is of interest given the ultimate purpose of their experiment. For instance,
critical peak pricing pilot organizers usually report on peak clipping whereas organizers of feedback pilots
typically report on energy conservation.
Pilots organisers usually form sub-groups within their pool of participants and try different solutions with
different groups. A typical case would be to measure the response of participants when given an IHD and
when given detailed informative bills. We call "samples" these sub-groups within a pilot. Impacts of trials
on individual samples were not calculated by VaasaETT. Instead they were calculated and reported by the
pilot organizers in their final reports, academic papers and presentations. VaasaETT collected and took into
account statistically significant results at a 90% confidence level and above. This review simply averaged
the individual impacts in order to understand what the key determinants of successful pilots are. The
average impacts are calculated by averaging the individual impacts on each sample with each sample
equally weighted. The average impact on a group of samples is therefore given by:
With:
I = Number of samples
si,t = Savings on sample i at time t
Please note that the numbers of samples the results relate to is of outmost importance in this report to
assess the significance of the findings. For each graph and category, the sample size is expressed as
“N=number of trials”
12 2011 VaasaETT Empower Demand
3. Program Definitions
3.1 Feedback Pilots
Background information
The role of feedback is to make energy visible and to make the consumption of energy visible, thus
sharpening the knowledge of residential consumers about how, and how much, energy circulates in the
household. Research indicates that households are scarcely knowledgeable on what energy efficiency
entails and how much energy they consume (and certainly not appliance specific consumption), how much
they actually pay for their energy, why and how they should save energy or when they should make energy
efficiency investments (Thorne et al. 2006). Feedback therefore provides an opportunity to offer
consumers a more direct, detailed, comparable and comprehensive information about their household’s
energy consumption pattern.
Feedback on energy consumption can influence the energy behaviour of residential consumers and lead to
a conserving behavioural effect (Darby 2006). However, in order to make feedback more than only a visual
reporting on the energy consumption, information given on display is just as vital as the device/display that
the consumers receive their feedback from. In this report each individual feedback pilot sample was
categorized into one of the following program types: informative billing, in-house displays (IHD), web
pages, ambient displays, and a mixture of the program types. The type of feedback on display was also
categorized into eight feedback type: peer comparison, historical comparison, up-to-date comparison, cost
of energy (bill), environment (CO2 emission), savings compared to previous periods, and appliance specific
consumption.
The above mentioned feedback formats enable us to research the feedback programs that resulted in the
highest levels of consumption reduction, as well as the specific content of feedback information that led to
the highest levels of consumption reduction. The assumption is that any reduction in overall consumption
by the participants would be largely because of the format of feedback and the content of feedback
information that the participants received.
Samples and data
A total of 74 feedback trials were analysed during this research. The total sample comprised of 290,000
residential households and were taken from five regions; Australia (3 samples), Canada (12 samples),
Europe (35 samples), Japan (3 samples) and USA (21 samples). The majority of the pilots from Europe were
conducted in Great Britain. Over 60% of the pilots took place within the last ten years and almost half after
2005.
13 2011 VaasaETT Empower Demand
Feedback program types
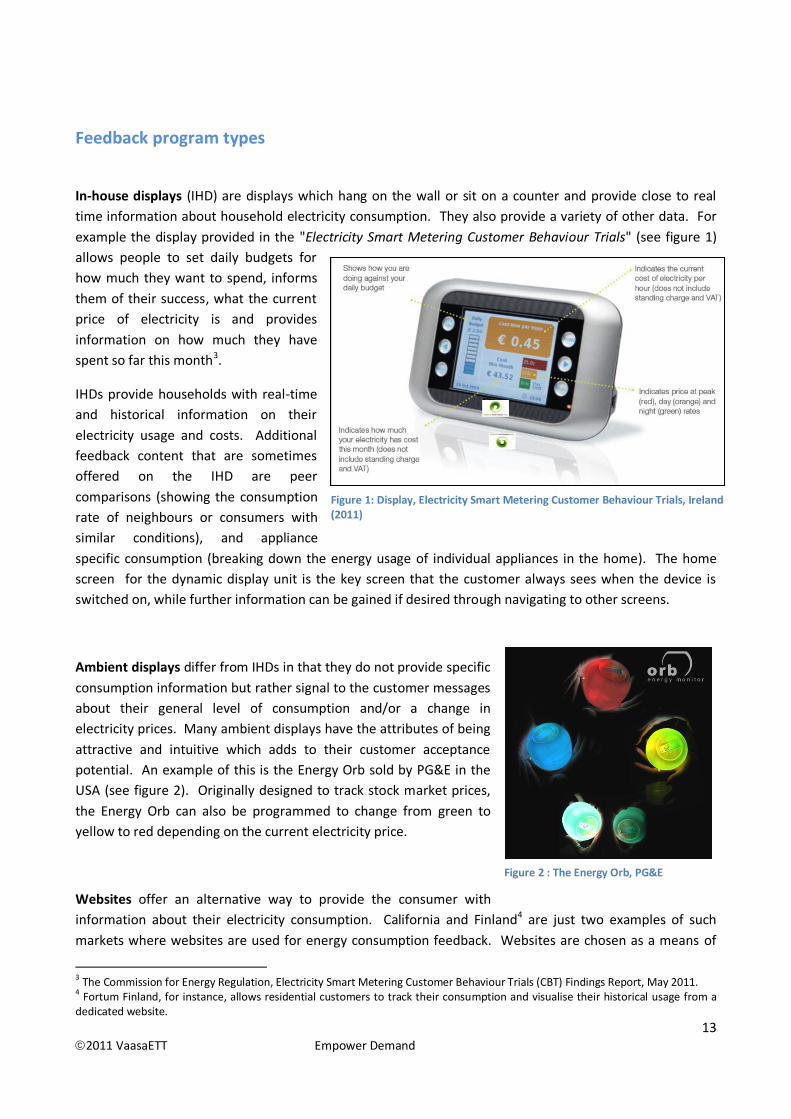
In-house displays (IHD) are displays which hang on the wall or sit on a counter and provide close to real
time information about household electricity consumption. They also provide a variety of other data. For
example the display provided in the "Electricity Smart Metering Customer Behaviour Trials" (see figure 1)
allows people to set daily budgets for
how much they want to spend, informs
them of their success, what the current
price of electricity is and provides
information on how much they have
spent so far this month3.
IHDs provide households with real-time
and historical information on their
electricity usage and costs. Additional
feedback content that are sometimes
offered on the IHD are peer
comparisons (showing the consumption
rate of neighbours or consumers with
similar conditions), and appliance
specific consumption (breaking down the energy usage of individual appliances in the home). The home
screen‖ for the dynamic display unit is the key screen that the customer always sees when the device is
switched on, while further information can be gained if desired through navigating to other screens.
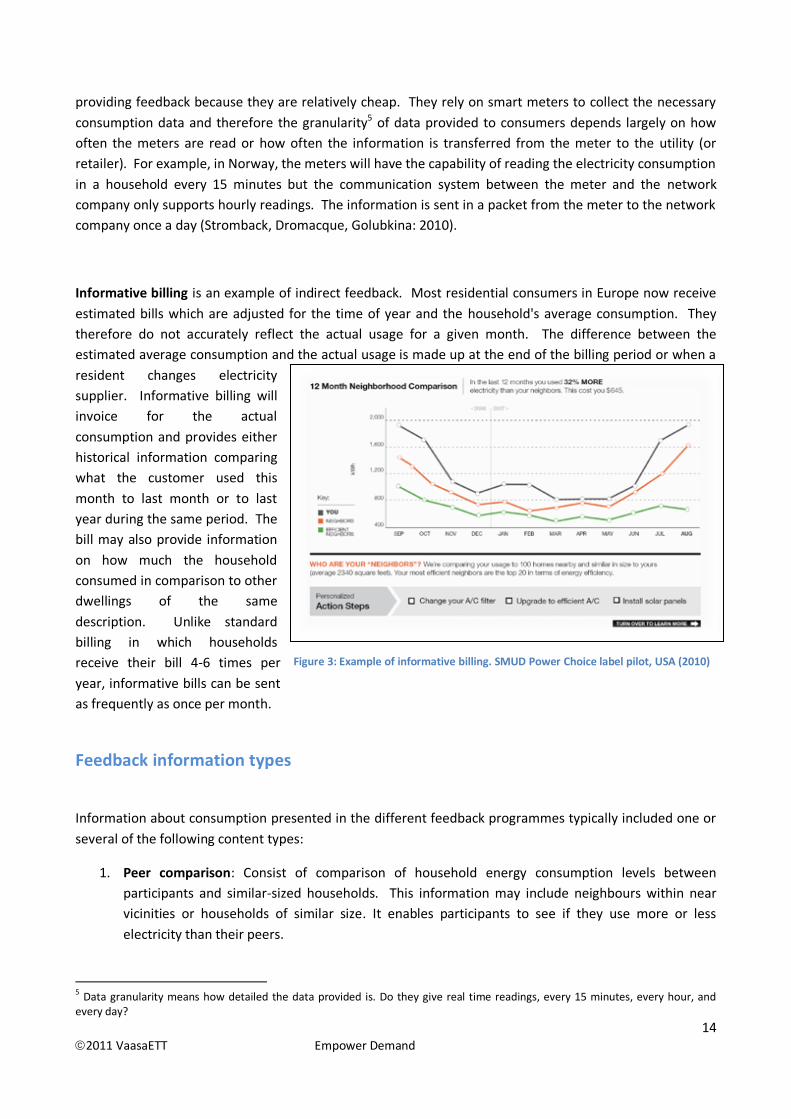
Ambient displays differ from IHDs in that they do not provide specific
consumption information but rather signal to the customer messages
about their general level of consumption and/or a change in
electricity prices. Many ambient displays have the attributes of being
attractive and intuitive which adds to their customer acceptance
potential. An example of this is the Energy Orb sold by PG&E in the
USA (see figure 2). Originally designed to track stock market prices,
the Energy Orb can also be programmed to change from green to
yellow to red depending on the current electricity price.
Websites offer an alternative way to provide the consumer with
information about their electricity consumption. California and Finland4 are just two examples of such
markets where websites are used for energy consumption feedback. Websites are chosen as a means of
3 The Commission for Energy Regulation, Electricity Smart Metering Customer Behaviour Trials (CBT) Findings Report, May 2011. 4 Fortum Finland, for instance, allows residential customers to track their consumption and visualise their historical usage from a dedicated website.
Figure 1: Display, Electricity Smart Metering Customer Behaviour Trials, Ireland (2011)
Figure 2 : The Energy Orb, PG&E
14 2011 VaasaETT Empower Demand
providing feedback because they are relatively cheap. They rely on smart meters to collect the necessary
consumption data and therefore the granularity5 of data provided to consumers depends largely on how
often the meters are read or how often the information is transferred from the meter to the utility (or
retailer). For example, in Norway, the meters will have the capability of reading the electricity consumption
in a household every 15 minutes but the communication system between the meter and the network
company only supports hourly readings. The information is sent in a packet from the meter to the network
company once a day (Stromback, Dromacque, Golubkina: 2010).
Informative billing is an example of indirect feedback. Most residential consumers in Europe now receive
estimated bills which are adjusted for the time of year and the household's average consumption. They
therefore do not accurately reflect the actual usage for a given month. The difference between the
estimated average consumption and the actual usage is made up at the end of the billing period or when a
resident changes electricity
supplier. Informative billing will
invoice for the actual
consumption and provides either
historical information comparing
what the customer used this
month to last month or to last
year during the same period. The
bill may also provide information
on how much the household
consumed in comparison to other
dwellings of the same
description. Unlike standard
billing in which households
receive their bill 4-6 times per
year, informative bills can be sent
as frequently as once per month.
Feedback information types
Information about consumption presented in the different feedback programmes typically included one or
several of the following content types:
1. Peer comparison: Consist of comparison of household energy consumption levels between
participants and similar-sized households. This information may include neighbours within near
vicinities or households of similar size. It enables participants to see if they use more or less
electricity than their peers.
5 Data granularity means how detailed the data provided is. Do they give real time readings, every 15 minutes, every hour, and every day?
Figure 3: Example of informative billing. SMUD Power Choice label pilot, USA (2010)

15 2011 VaasaETT Empower Demand
2. Price of electricity: Indicate the current price of electricity per kWh. This does not include the up-
to-date electricity bill.
3. Historical comparison: Shows the household's current electricity consumption levels in comparison
to pre-pilot consumption levels. Participants can know if they reduced or increased their
consumption compared to the same period last year for instance.
4. Disaggregation of consumption: The household's electricity consumption is broken down as per
household electrical appliances. The depth and degree of the breakdown can vary but in most
cases the consumption of the oven, the fridge, the TV, and the lighting are measured. It enables
participants to see how much electricity individual appliances use and act upon it (and maybe buy
more energy efficient ones).
5. Up-to-date consumption level: Presents the current up-to-date consumption level of the
household in kWh. In itself, it does not include the cost of electricity or the current level of the bill.
However, if coupled with consumption goals or targets not to exceed, it can be a powerful
incentive to reduce consumption.
6. Up-to-date Cost (bill): Presents the up-to-date bill which enables households to gauge their current
costs for their electricity and act upon it.
7. Savings compared to previous periods: Compares the energy savings of households to previous
periods. Households would have a certain target for their energy consumptions which would be a
percentage savings on previous energy consumptions.
8. Environment (CO2 emissions): This shows the amount of CO2 the households emits due to
electricity consumption. This presents the environmental costs or consequences of the
households’ energy consumption.
Overall results
Feedback pilots are designed to help consumers reduce their overall energy consumption, lowering
distribution and supply costs. In comparison with the other feedback channels, IHD resulted in the highest
energy savings67. The remaining channels for feedback; webpage, and informative billing; produced almost
equal consumption reduction levels (in some cases they were used together in combination). Quite
possibly, the key advantage the IHD offers over the remaining forms of feedback is the almost real-time
6 40% of all the samples in our research focused on IHD programs 7 The numbers of samples the results relate to is of outmost importance in this report to assess the significance of the findings. For each graph and category, the sample size is expressed as “N=number of trials”

16 2011 VaasaETT Empower Demand
aspect which enables participants to link their actions to their energy usage practically in real-time. These
are average pilot results. Success factors, such as the impact of average household consumption, location,
feedback content, etc. within a particular market are not reflected in the graph. In order to be able to
estimate the possible consumption reduction for a particular program, in a particular market, a larger
number of variables must be taken into account.
Figure 4 : Overall consumption reduction as per feedback pilot type
3.2 Pricing Pilots
Background information
Pricing pilots are designed to encourage customers shift consumption away from peak consumption
periods to lower consumption periods, lowering distribution and supply costs. This is achieved through
dynamic pricing mechanisms which better reflect the cost of supplying electricity. The prices are raised at
peak times and lowered (compared to single or flat tariffs) the rest of the time. There are several methods
and degrees of dynamic pricing. The most commonly piloted pricing schemes are Time-Of-Use (TOU),
Critical Peak Pricing (CPP) and to a lesser extend Critical Peak Rebate (CPR) and Real-Time Pricing (RTP).
With regards to sample size considerations, pilots testing the impacts of other pricing structures such as
pre-payment and increasing tariff blocks could not be included in our review.
17 2011 VaasaETT Empower Demand
Samples and data
As part of this research, we analysed 340 sample groups taken from pilots organised in the USA (186
samples), Canada (108 samples), different parts of Europe (30 samples), Australia (14 samples) and Japan (2
samples). The results are based on 250 TOU trials, 98 CPP trials, 27 CPR trials and 25 RTP trials (the total is
greater than the number of samples because dynamic pricing schemes can be combined, for instance TOU
and CPP). Over 60% of the samples were part of pilot organised after 2000 and 45% after 2005. Over
158,000 participants took part in the pricing pilots in total
Dynamic pricing program types
Time-of-Use (TOU): TOU tariffs induce people into using electricity during times when consumption is
lower. Prices are therefore set higher during high consumption periods, typically during working hours, and
lower during the rest of the day.
TOU usually includes one long peak daily period or two shorter daily peak periods.
TOU can have two level of prices (peak and off- peak prices) or three (peak, partial peak and off-peak prices) per day. The peak hours are known in advance by the customers. The prices may also vary according to the season.
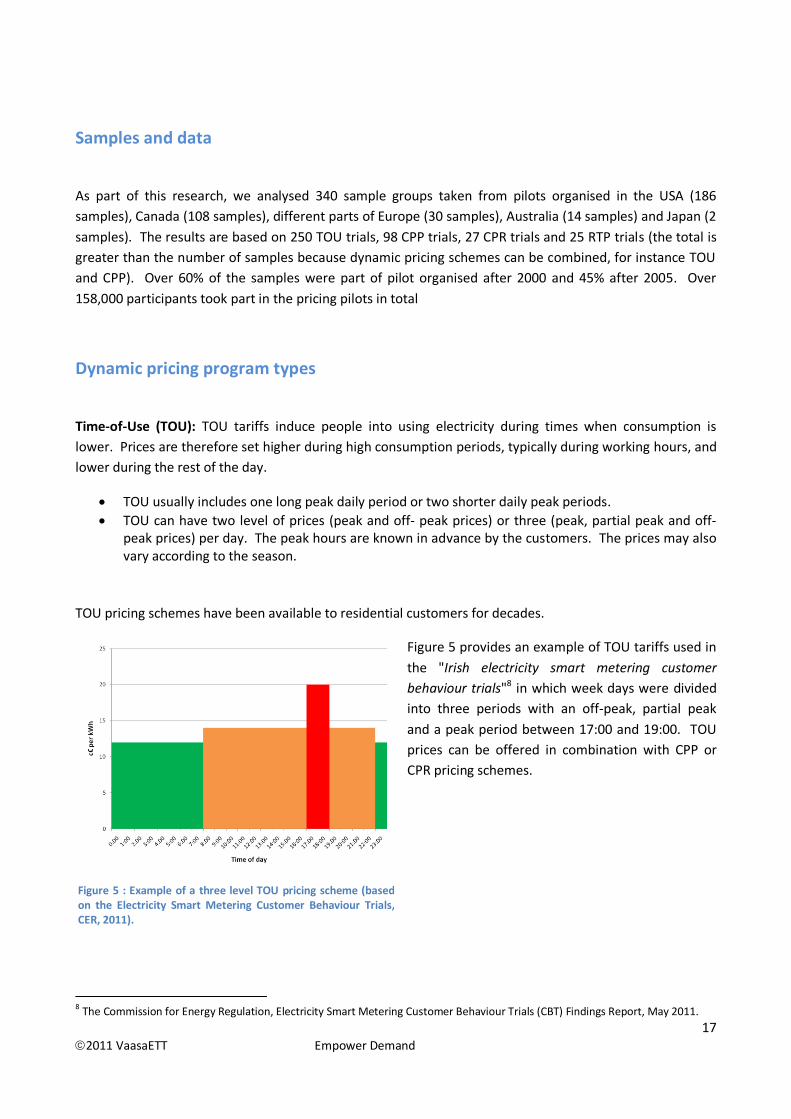
TOU pricing schemes have been available to residential customers for decades.
Figure 5 provides an example of TOU tariffs used in
the "Irish electricity smart metering customer
behaviour trials"8 in which week days were divided
into three periods with an off-peak, partial peak
and a peak period between 17:00 and 19:00. TOU
prices can be offered in combination with CPP or
CPR pricing schemes.
8 The Commission for Energy Regulation, Electricity Smart Metering Customer Behaviour Trials (CBT) Findings Report, May 2011.
Figure 5 : Example of a three level TOU pricing scheme (based on the Electricity Smart Metering Customer Behaviour Trials, CER, 2011).

18 2011 VaasaETT Empower Demand
Objective:
• Reduce energy demand during peak hours to avoid or defer investments in new production
capacity
• Better reflect the true cost of supplying electricity at different times of day
Customer participation:
• Defer certain household activities to off-peak periods (typically laundry, dishwashers, lower electric
heating and Air Conditioning (AC) usage, etc…)
Enablers:
• Smart metering technologies and automation of selected loads (AC/Electric heating/Electric water
heater)
• Feedback on energy use and price
Customer reward:
• Reduced energy bill due to shifting activities to lower price periods
• Reduced cross subsidies as the price of electricity better reflects its cost
• “Green” attitude – doing the “right thing”
Critical Peak Pricing (CPP): CPP pricing schemes involve substantially increased electricity prices during
times of heightened wholesale prices caused by heightened consumption (for example on very hot days) or
when the stability of the system is threatened and black-outs may occur.
In exchange for a lower tariff during non-peak hours (compared to customers on say single tariffs),
participants agree to have substantially higher tariffs during critical peak hours.
The number and length of critical peak periods which the utility is allowed to call is often agreed
upon in advance in order to lower participant risk.
The periods when critical peaks occur depend on conditions in the market and cannot be decided in
advance. Residential customers are usually notified the day before that the next day will be a
critical day.
19 2011 VaasaETT Empower Demand
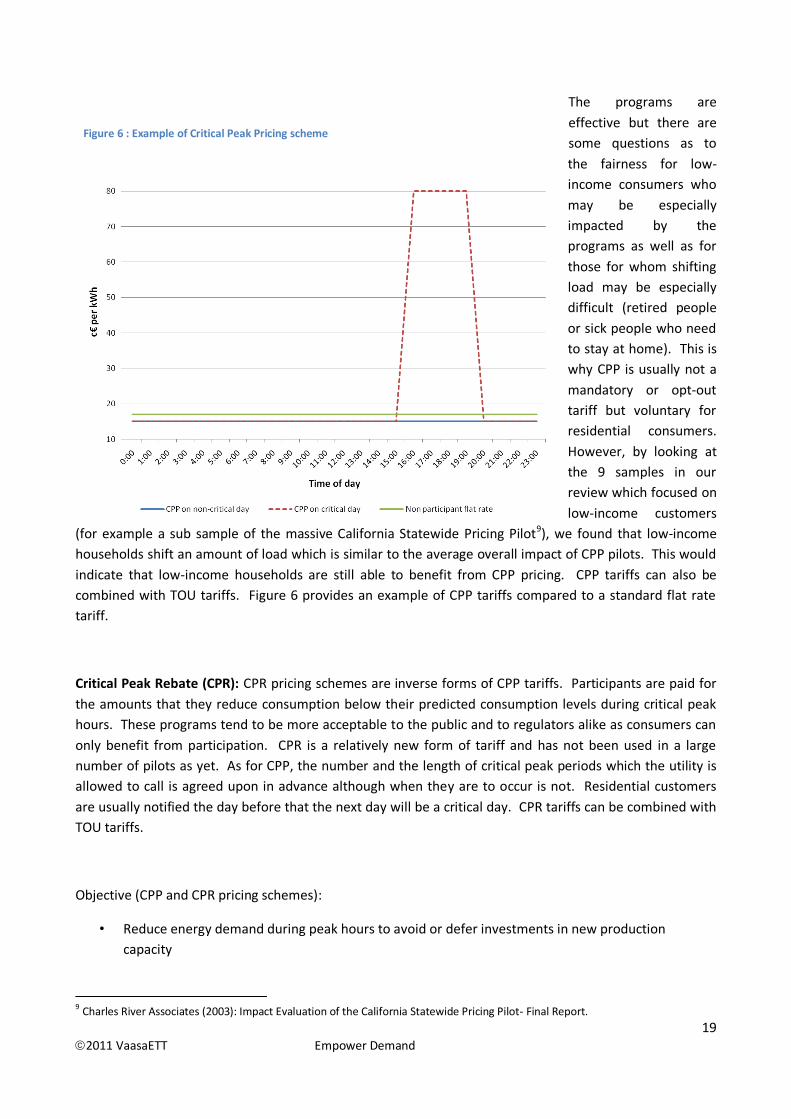
The programs are
effective but there are
some questions as to
the fairness for low-
income consumers who
may be especially
impacted by the
programs as well as for
those for whom shifting
load may be especially
difficult (retired people
or sick people who need
to stay at home). This is
why CPP is usually not a
mandatory or opt-out
tariff but voluntary for
residential consumers.
However, by looking at
the 9 samples in our
review which focused on
low-income customers
(for example a sub sample of the massive California Statewide Pricing Pilot9), we found that low-income
households shift an amount of load which is similar to the average overall impact of CPP pilots. This would
indicate that low-income households are still able to benefit from CPP pricing. CPP tariffs can also be
combined with TOU tariffs. Figure 6 provides an example of CPP tariffs compared to a standard flat rate
tariff.
Critical Peak Rebate (CPR): CPR pricing schemes are inverse forms of CPP tariffs. Participants are paid for
the amounts that they reduce consumption below their predicted consumption levels during critical peak
hours. These programs tend to be more acceptable to the public and to regulators alike as consumers can
only benefit from participation. CPR is a relatively new form of tariff and has not been used in a large
number of pilots as yet. As for CPP, the number and the length of critical peak periods which the utility is
allowed to call is agreed upon in advance although when they are to occur is not. Residential customers
are usually notified the day before that the next day will be a critical day. CPR tariffs can be combined with
TOU tariffs.
Objective (CPP and CPR pricing schemes):
• Reduce energy demand during peak hours to avoid or defer investments in new production
capacity
9 Charles River Associates (2003): Impact Evaluation of the California Statewide Pricing Pilot- Final Report.
Figure 6 : Example of Critical Peak Pricing scheme

20 2011 VaasaETT Empower Demand
• Better reflect the true cost of supplying electricity at different times of day
Customer participation (CPP and CPR pricing schemes):
• Turn off selected appliances and delay certain household activities when notified of a critical peak
period (typically laundry, dishwashers, lower electric heating and Air Conditioning usage, etc…)
Enablers (CPP and CPR pricing schemes):
• Smart metering technologies and automation of selected loads (AC/Electric heating/Electric water
heater)
• Feedback on energy use and price
• Notification of critical peak periods
Customer reward (CPP and CPR pricing schemes):
• Reduced energy bill due to shifting activities to off peak periods (CPP) / Receive payment for
lowering electricity usage during critical peak periods (CPR)
• Reduced cross subsidies as the price of electricity better reflects its cost
• “Green” attitude – doing the “right thing”
Real-Time Pricing (RTP): The price paid by participants is tied to the price of electricity on the wholesale
market. However they do not lead to consumption reductions without feedback. Even then customers will
sometimes tire of checking a price that only changes slightly from day to day. In order to encourage
reductions during high price periods and reduce risk of high bill, participants are warned when wholesale
prices reach a certain threshold decided upon in advance. A majority of household customers in Norway10
and a growing number in Sweden11 are currently on spot tied contracts.
Objective:
• Reduce energy demand during periods of high prices to avoid or deter investments in new
production capacity.
• Reflect the true cost of electricity and enhance its price signal.
Customer participation:
• Turn off selected appliances and delay certain household activities when notified of a period of high
prices (typically laundry, dishwashers, lower electric heating and Air Conditioning usage, etc…)
10 in its "Report on regulation and the electricity market 2010", the Norwegian Water Resources and Energy Directorate reports that roughly 52% of customers had a contract that offers the average monthly area spot price with a mark –up in 2009. 11 The Energy Markets Inspectorate reports in its latest review of the Swedish electricity and natural gas markets 2009 that 30% of residential customers have variable contracts in 2009 as opposed to 22% in 2008.
21 2011 VaasaETT Empower Demand
Enablers:
• Smart metering technologies and automation of selected loads (AC/Electric heating/Electric water
heater)
• Real-time feedback on energy use and price
• Notification of high price periods
Customer reward:
• Reduced energy bill due to shifting activities to lower price periods
• Reduced cross subsidies as the price of electricity reflects its cost
• “Green” attitude – doing the “right thing”
Overall results
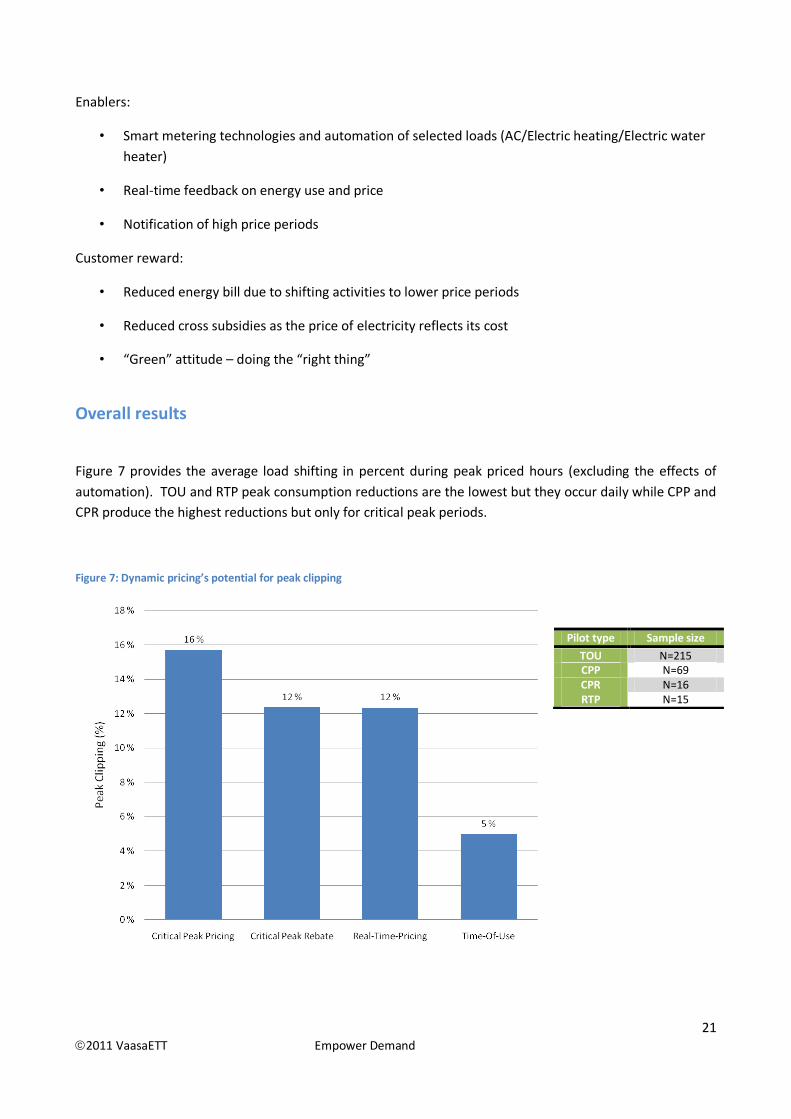
Figure 7 provides the average load shifting in percent during peak priced hours (excluding the effects of
automation). TOU and RTP peak consumption reductions are the lowest but they occur daily while CPP and
CPR produce the highest reductions but only for critical peak periods.
Figure 7: Dynamic pricing’s potential for peak clipping
Pilot type Sample size
TOU N=215 CPP N=69 CPR N=16 RTP N=15
22 2011 VaasaETT Empower Demand
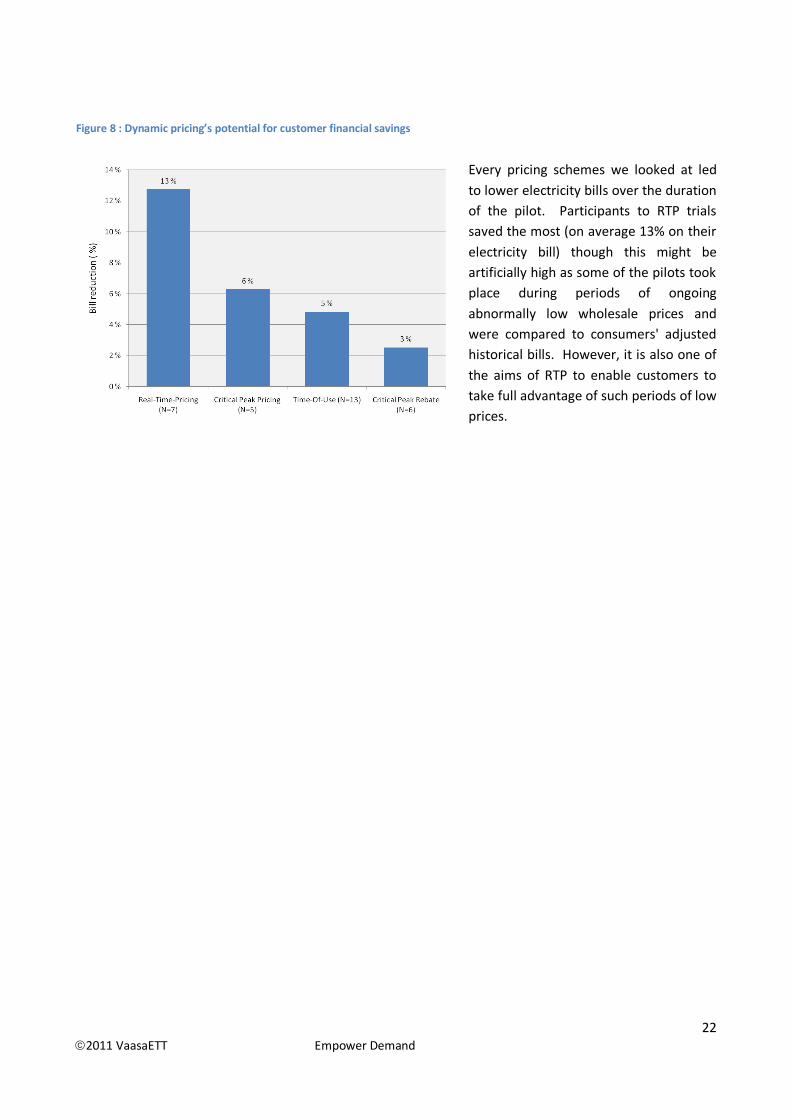
Every pricing schemes we looked at led
to lower electricity bills over the duration
of the pilot. Participants to RTP trials
saved the most (on average 13% on their
electricity bill) though this might be
artificially high as some of the pilots took
place during periods of ongoing
abnormally low wholesale prices and
were compared to consumers' adjusted
historical bills. However, it is also one of
the aims of RTP to enable customers to
take full advantage of such periods of low
prices.
Figure 8 : Dynamic pricing’s potential for customer financial savings

23 2011 VaasaETT Empower Demand
4. Research findings
In this section, we present detailed results for both feedback and pricing pilots. Additional analysis and
insight also accompany the graphs. The presentation of the results will focus on eight variables that played
a part in both the feedback as well as in the pricing pilots. These are geography, length of pilot, number of
participants, market characteristics, segmentation, education, and interactions with participants. In the
final two sections of this chapter, our results focus exclusively on feedback pilots (and the type of feedback
information), and pricing pilots (pricing scheme design and automation location). As with other similar
studies the number of direct comparisons which can be made between pilots is limited due to the
difference in the pilots’ design and the reporting of results.
As mentioned earlier, impacts on pilot participants were assessed from three perspectives:
• Energy conservation: the extent to which the experiment led to a reduction in overall energy
consumption (in %)
• Peak clipping: the extent to which the experiment led to a reduction in energy consumption during
peak periods (in %)
• Bill reduction: the extent to which the experiment led to a reduction in customers energy bills (in
%).
Please note that pilot organizers rarely report the impacts of the experiments on all three perspectives.
They usually report on what is of interest given the ultimate purpose of their experiment. For instance,
critical peak pricing pilot organizers usually report on peak clipping whereas organizers of feedback pilots
typically report on energy conservation.
One of Empower Demand's aims was to ascertain which variables may influence customer behaviour and
pilot success. However due to the fact that pilots are organized in varying ways, sample size varied widely,
and many factors can influence customer behaviour, a variable was considered significant if it
demonstrated a consistent impact across several pilot categories. Variables which produced a repeated,
consistent response across pilot type were judged to be particularly important. Variables which produced
contradictory results across pilot type were analysed further or judged to be inconclusive.
24 2011 VaasaETT Empower Demand
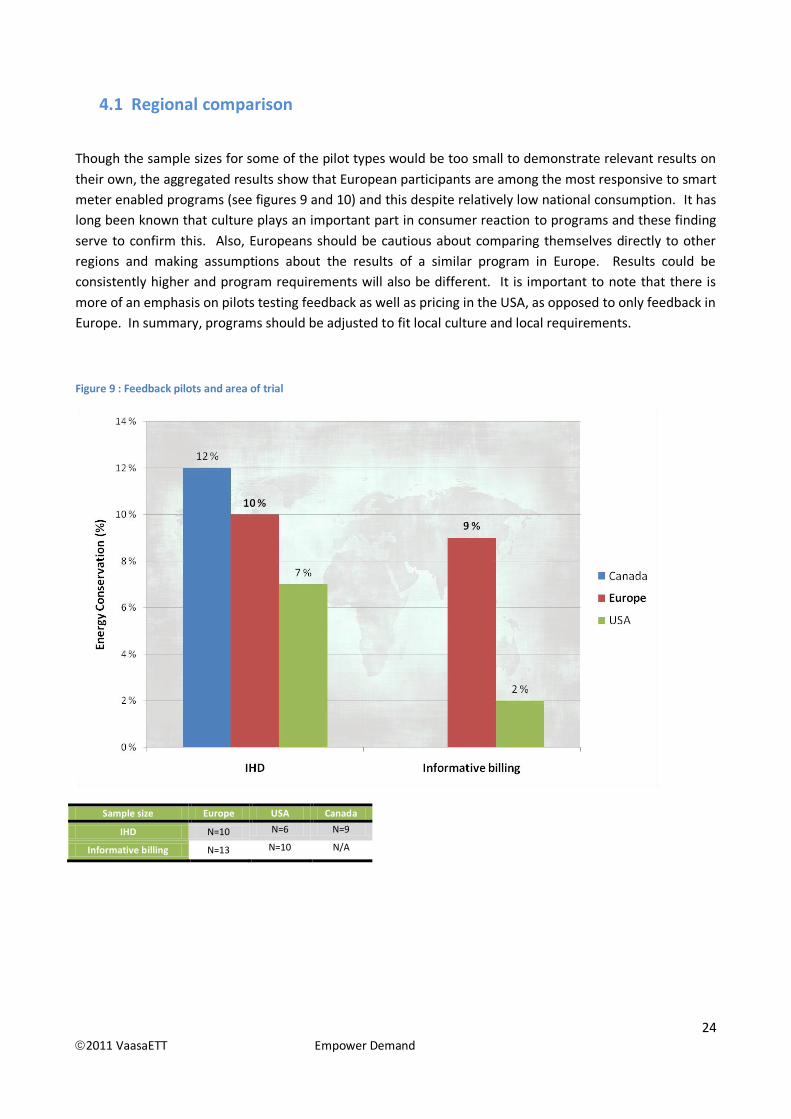
4.1 Regional comparison
Though the sample sizes for some of the pilot types would be too small to demonstrate relevant results on
their own, the aggregated results show that European participants are among the most responsive to smart
meter enabled programs (see figures 9 and 10) and this despite relatively low national consumption. It has
long been known that culture plays an important part in consumer reaction to programs and these finding
serve to confirm this. Also, Europeans should be cautious about comparing themselves directly to other
regions and making assumptions about the results of a similar program in Europe. Results could be
consistently higher and program requirements will also be different. It is important to note that there is
more of an emphasis on pilots testing feedback as well as pricing in the USA, as opposed to only feedback in
Europe. In summary, programs should be adjusted to fit local culture and local requirements.
Figure 9 : Feedback pilots and area of trial
Sample size Europe USA Canada
IHD N=10 N=6 N=9
Informative billing N=13 N=10 N/A
25 2011 VaasaETT Empower Demand
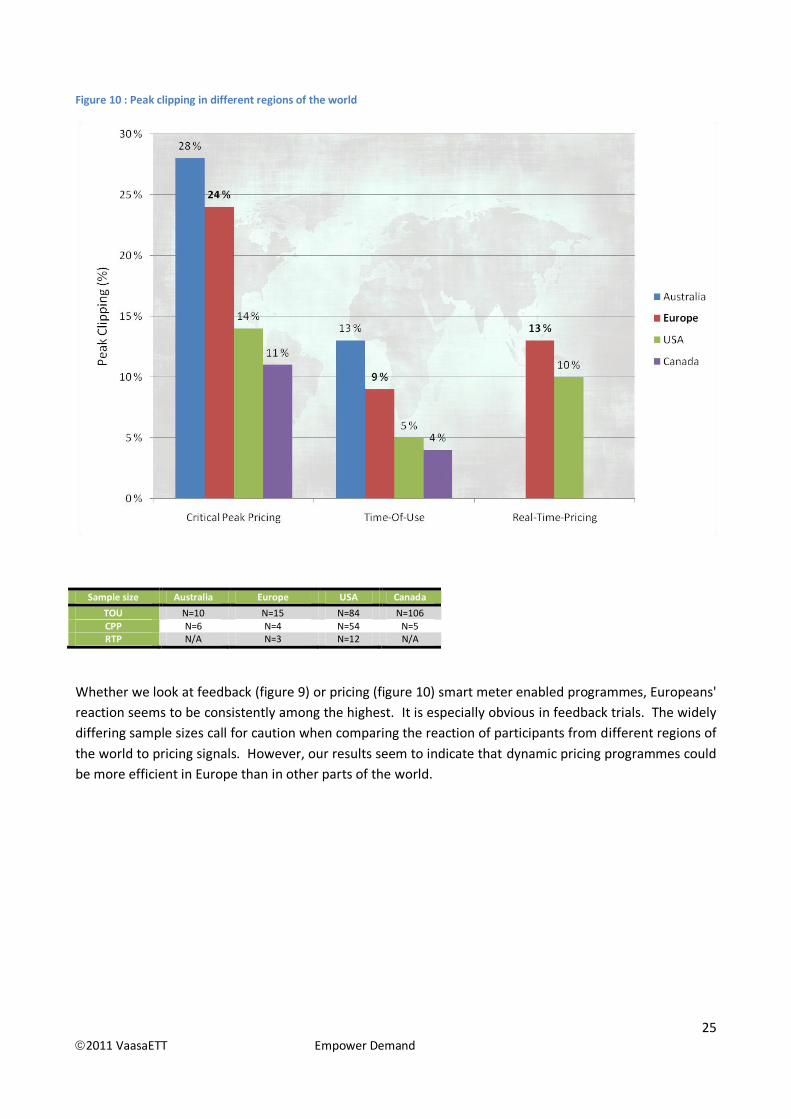
Figure 10 : Peak clipping in different regions of the world
Sample size Australia Europe USA Canada
TOU N=10 N=15 N=84 N=106 CPP N=6 N=4 N=54 N=5 RTP N/A N=3 N=12 N/A
Whether we look at feedback (figure 9) or pricing (figure 10) smart meter enabled programmes, Europeans'
reaction seems to be consistently among the highest. It is especially obvious in feedback trials. The widely
differing sample sizes call for caution when comparing the reaction of participants from different regions of
the world to pricing signals. However, our results seem to indicate that dynamic pricing programmes could
be more efficient in Europe than in other parts of the world.

26 2011 VaasaETT Empower Demand
CCaassee PPiilloott 11:: TThhee DDuuttcchh HHoommee EEnneerrggyy MMaannaaggeemmeenntt SSyysstteemm ((HHEEMMSS)) TTrriiaallss
Pilot Information: Conducted in 2008 for a period of 15 months and with a total of 304 residential participants. Offering/promotion: people were given the option either to keep the energy monitor or to return it and receive a gift certificate of €25 instead. Aims of the pilot: 1) What are the medium- to long-term results of Home Energy Management Systems (HEMS) on energy savings? 2) What is the influence of the design quality and usability of HEMS? 3) Is there a relationship between the amount of HEMS usage and achieved energy savings, and what role does the development of habitual behavior play? Feedback information: Education and interviews before and during pilot, IHD feedback (real-time updates), and feedback information consisted of current up-to-date consumption and savings compared to previous periods. Overall consumption reduction: 7.8% Participant feedback and information:
Proactive: 38.9% of the participants in the case study indicated that they looked at the monitor at least once a day
Future outlook: o 11 months after the initial trial, 264 participants received an e-mail asking them to
participate in an online follow-up questionnaire. Of the 189 respondents, 93 had kept the monitor after the trial, and 96 had returned it.
o Of the 93 respondents who kept the monitor, 80 indicated they still had a functional monitor in their homes, which was also in use
o 17 of the 80 respondents indicated they used the monitor less than during the initial four-month trial, but 53 respondents said they checked it daily at a fixed moment in time.
o Overall performance of Monitor: only 5% gave the monitor a negative’ or ‘very negative’ score on ease of use after installation
Source: Van Dam, S. S., Bakker, C. A., Van Hal, J. D. M. (2010). Home energy monitors: impact over the medium-term. Building Research & Information. 38:5, 458–469.
27 2011 VaasaETT Empower Demand
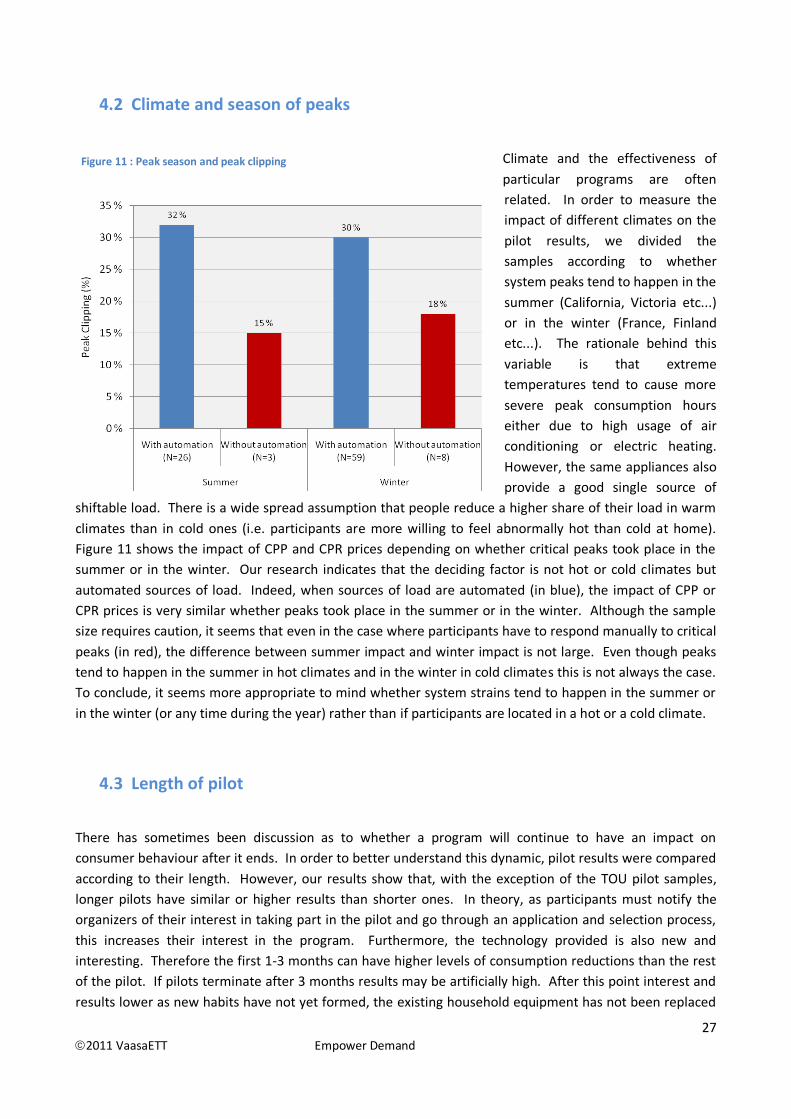
4.2 Climate and season of peaks
Climate and the effectiveness of
particular programs are often
related. In order to measure the
impact of different climates on the
pilot results, we divided the
samples according to whether
system peaks tend to happen in the
summer (California, Victoria etc...)
or in the winter (France, Finland
etc...). The rationale behind this
variable is that extreme
temperatures tend to cause more
severe peak consumption hours
either due to high usage of air
conditioning or electric heating.
However, the same appliances also
provide a good single source of
shiftable load. There is a wide spread assumption that people reduce a higher share of their load in warm
climates than in cold ones (i.e. participants are more willing to feel abnormally hot than cold at home).
Figure 11 shows the impact of CPP and CPR prices depending on whether critical peaks took place in the
summer or in the winter. Our research indicates that the deciding factor is not hot or cold climates but
automated sources of load. Indeed, when sources of load are automated (in blue), the impact of CPP or
CPR prices is very similar whether peaks took place in the summer or in the winter. Although the sample
size requires caution, it seems that even in the case where participants have to respond manually to critical
peaks (in red), the difference between summer impact and winter impact is not large. Even though peaks
tend to happen in the summer in hot climates and in the winter in cold climates this is not always the case.
To conclude, it seems more appropriate to mind whether system strains tend to happen in the summer or
in the winter (or any time during the year) rather than if participants are located in a hot or a cold climate.
4.3 Length of pilot
There has sometimes been discussion as to whether a program will continue to have an impact on
consumer behaviour after it ends. In order to better understand this dynamic, pilot results were compared
according to their length. However, our results show that, with the exception of the TOU pilot samples,
longer pilots have similar or higher results than shorter ones. In theory, as participants must notify the
organizers of their interest in taking part in the pilot and go through an application and selection process,
this increases their interest in the program. Furthermore, the technology provided is also new and
interesting. Therefore the first 1-3 months can have higher levels of consumption reductions than the rest
of the pilot. If pilots terminate after 3 months results may be artificially high. After this point interest and
results lower as new habits have not yet formed, the existing household equipment has not been replaced
Figure 11 : Peak season and peak clipping

28 2011 VaasaETT Empower Demand
and the newness has worn off. For longer periods of time, new habits have time to form and the incentive
to buy appliances able to adjust to different electricity prices increases.
Longer lasting IHD pilots seem to yield
better results than pilots lasting for half a
year and less. This may be due to the
technical nature of using an IHD. A new
IHD device requires time for participants
to adjust to the new display, understand
the information on show as well as
making it into a daily routine. It could
also be explained by the fact that the
longer the pilot went on, the easier it
was for participants to notice a trend in
energy consumption and directly link
their action to their energy usage which
might motivate them to continue or
increase their energy saving activities. More details about the learning process is given in section 4.6.
We can see from figure 13, that pilot
influence does not lower over the long-
term. There seems to be a slight dip
during the medium-term (13-24
months), however, energy conservation
peaks once again when the pilot lasts
more than 24 months. The potential
reasons for this could be that
customer’s habits change, and
increased awareness leads to more
energy efficient purchasing choice.
Apparently the learning process takes
more time for Informative billing as for
IHDs.
Figure 12 : Duration of IHD pilots and energy conservation
Figure 13 : Duration of informative billing pilots and energy conservation
29 2011 VaasaETT Empower Demand
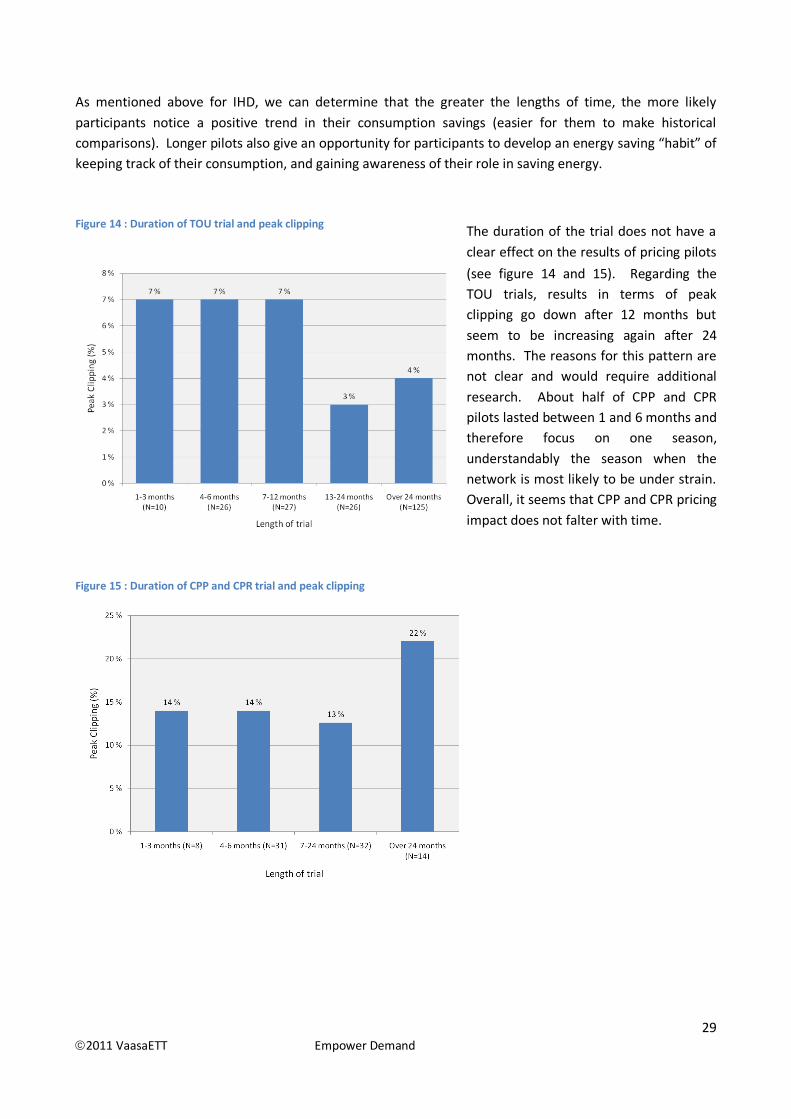
As mentioned above for IHD, we can determine that the greater the lengths of time, the more likely
participants notice a positive trend in their consumption savings (easier for them to make historical
comparisons). Longer pilots also give an opportunity for participants to develop an energy saving “habit” of
keeping track of their consumption, and gaining awareness of their role in saving energy.
The duration of the trial does not have a
clear effect on the results of pricing pilots
(see figure 14 and 15). Regarding the
TOU trials, results in terms of peak
clipping go down after 12 months but
seem to be increasing again after 24
months. The reasons for this pattern are
not clear and would require additional
research. About half of CPP and CPR
pilots lasted between 1 and 6 months and
therefore focus on one season,
understandably the season when the
network is most likely to be under strain.
Overall, it seems that CPP and CPR pricing
impact does not falter with time.
Figure 15 : Duration of CPP and CPR trial and peak clipping
Figure 14 : Duration of TOU trial and peak clipping

30 2011 VaasaETT Empower Demand
CCaassee PPiilloott 22:: TThhee CCaannaaddiiaann BBCC HHyyddrroo AAddvvaanncceedd MMeetteerriinngg IInniittiiaattiivvee ((AAMMII)) Pilot Information: was conducted in 2007 for a period of 6 months and with a total of 2,000 residential participants. Offering/promotion: "more control over electricity costs; and potential savings on electricity bills" and pilot "guaranteed" no increase in overall billing as part of the pilot agreement Aims of the pilot: Gain an understanding of customer needs for information about and acceptance of available and affordable ways to save energy Feedback information: Education and interviews during pilot, IHD feedback (hourly updates), and feedback information consisted of current up-to-date consumption and cost (bill). Overall consumption reduction: 8% Participant feedback and information: Uptake rate: n/a. However, 2,070 pre-pilot surveys were sent to participants and 1,720 pre-pilot surveys were completed for a response rate of 88%. 1,870 post-pilot surveys were sent to participants yielding 1,305 completions for a 70% response rate. Proactive: pilot participants were proactive in voluntary opting-in to the pilot. About 50% of them report having used the monitors at least several times each week in the first month of the pilot. This proportion, however, decreased to about 40% in the final two months. Participant satisfaction: 81% assess their overall experience with the pilot as either “excellent” or “good”. Future outlook: 83% of treatment group participants indicate that they either “definitely would” or “probably would” continue for a second year of the program next fall if it is offered under the very same set of conditions Overall performance of monitor: 43% rate it favourably and 31% rate in unfavourably. Source: Sulyma, I., Tiedemann, K., Pedersen, P., Rebman, M., Yu, M. (2008). Experimental Evidence: A Residential Time of Use Pilot. ACEEE Summer Study on Energy Efficiency in Buildings.

31 2011 VaasaETT Empower Demand
4.4 Number of participants
There is some concern that pilots do have enough participants to provide conclusive evidence about the
potential of smart meter enabled programs should they be offered to the general population. Many small
pilots, of 50 households or less, have been carried out in Europe and it has sometimes been questioned
whether the results can be translated into real programs for a large number of customers.
Figure 16 suggests that there is a direct
correlation between the number of
participants taking part in an IHD pilot
and the reduction in electricity
consumption. It may seem that the
smaller the number of participants, the
greater the level of consumption
reduction.
However, this does not automatically
mean that pilots with a large number of
participants are not successful and do not
provide a foundation for future
initiatives. Our research shows that the
largest pilots have mostly focused around
offering only one type of feedback
information to the participants (possibly as an attempt to limit costs). To the contrary, the vast majority of
the pilots with smaller number of participants offered at least two different forms of feedback on their
displays. Almost 40% of IHD pilots had less than 49 participants.
Further analysis should be performed on how to maximize response rates within larger groups of
customers, perhaps this could be achieved through offering a multi layered form of feedback such as that
which has so far usually been used in smaller trials.
Figure 16 : Sample size and energy conservation in IHD pilots
32 2011 VaasaETT Empower Demand
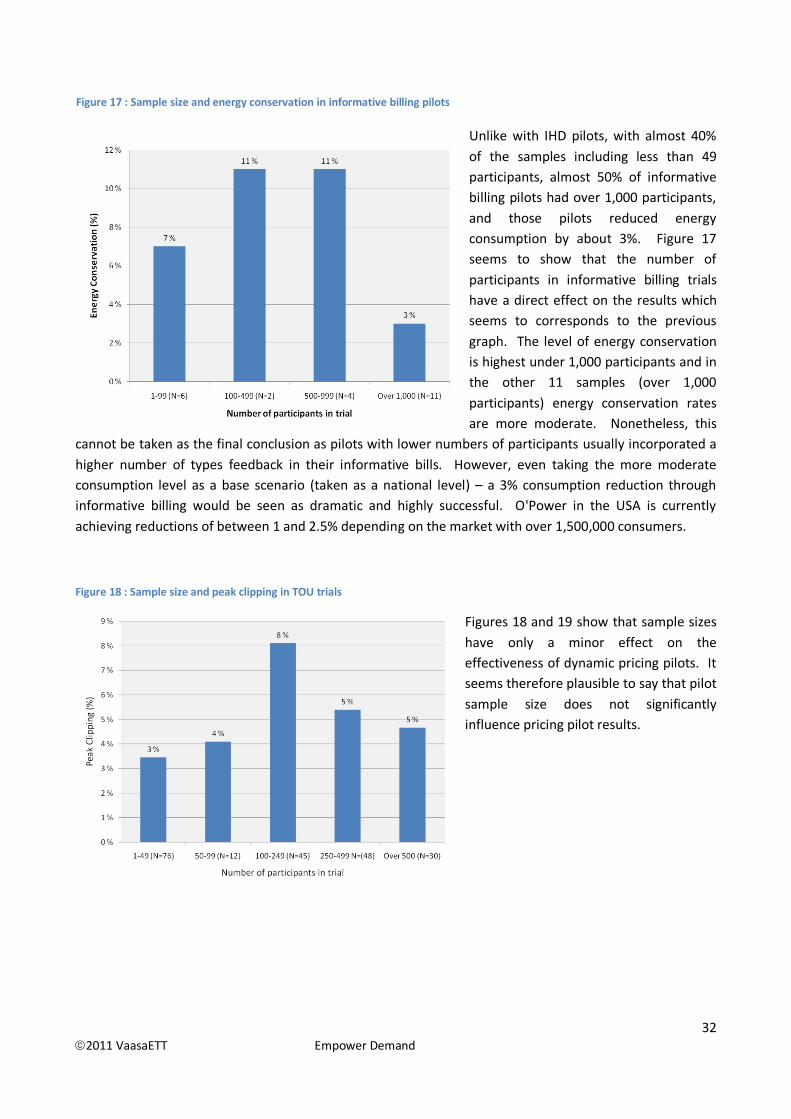
Unlike with IHD pilots, with almost 40%
of the samples including less than 49
participants, almost 50% of informative
billing pilots had over 1,000 participants,
and those pilots reduced energy
consumption by about 3%. Figure 17
seems to show that the number of
participants in informative billing trials
have a direct effect on the results which
seems to corresponds to the previous
graph. The level of energy conservation
is highest under 1,000 participants and in
the other 11 samples (over 1,000
participants) energy conservation rates
are more moderate. Nonetheless, this
cannot be taken as the final conclusion as pilots with lower numbers of participants usually incorporated a
higher number of types feedback in their informative bills. However, even taking the more moderate
consumption level as a base scenario (taken as a national level) – a 3% consumption reduction through
informative billing would be seen as dramatic and highly successful. O'Power in the USA is currently
achieving reductions of between 1 and 2.5% depending on the market with over 1,500,000 consumers.
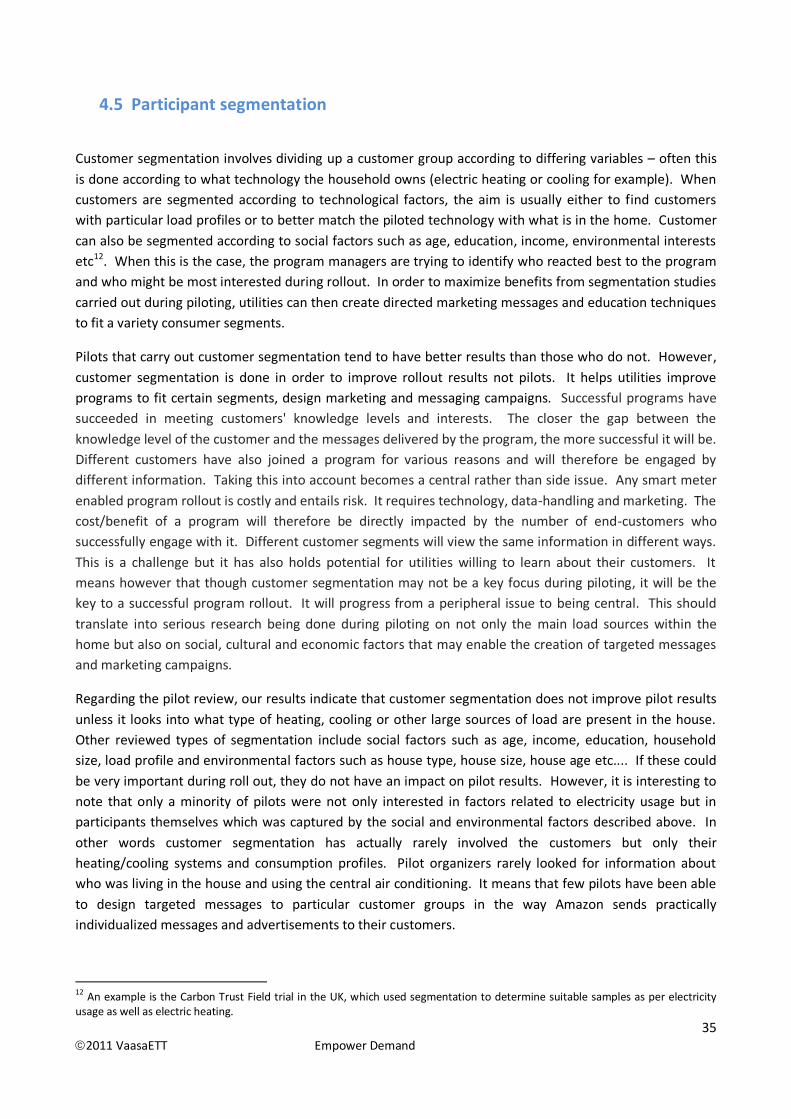
Figure 18 : Sample size and peak clipping in TOU trials
Figures 18 and 19 show that sample sizes
have only a minor effect on the
effectiveness of dynamic pricing pilots. It
seems therefore plausible to say that pilot
sample size does not significantly
influence pricing pilot results.
Figure 17 : Sample size and energy conservation in informative billing pilots

33 2011 VaasaETT Empower Demand
Figure 19 : Sample size and peak clipping in CPP and CPR trials
The results of the comparison found that feedback pilots seemed to be adversely effected by a large
sample size while pricing pilots were not. Further analysis of the pilots would be required to better
understand what about the large feedback pilots lowered their impact and why this trend was not repeated
in pricing pilots. One possibility may be that the larger IHD pilots tended to offer simpler less informative
display and less information on the their displays whereas smaller IHD pilots offered more detailed
informative on their displays. It may also be due to issues of mass marketing and engaging the interest of a
larger number of customers in feedback displays and informative bills. In contrast, it is interesting that
pricing pilots do not seem to be as impacted by pilot size. Pricing pilots offered a more even level of
services both in the larger and the smaller pilots. One conclusion to draw from this is that feedback to large
groups should avoid becoming “cheap feedback”. Even when offered to a large number of customers the
quality and detail should be maintained as far as possible. It also brings up the importance of program
uptake levels and appropriate consumer segmented marketing and education campaigns. This will be dealt
with in further details in the following sections.
There is a very interesting dynamic between offering feedback with pricing. Pricing mechanisms seem to
be an easier program type to communicate to large numbers of consumers, while including feedback in a
pricing program will enable participants to both shift peak consumption and lower total consumption.
More large pilots of 5,000 residents or more should be carried out in Europe with pricing and education
could be combined in an effort to learn how to best maximise customer involvement within a large
consumer group and at the same time maximize program results. Further research would also be needed
to better understand the mass-education and mass-marketing requirements for both feedback and pricing
programs.

34 2011 VaasaETT Empower Demand
CCaassee PPiilloott 33:: SSaaccrraammeennttoo’’ss RReessiiddeennttiiaall EEnneerrggyy UUssee BBeehhaavviioouurr CChhaannggee PPiilloott ((aallssoo kknnoowwnn aass tthhee
SSMMUUDD ttrriiaall))
Pilot Information: was conducted in 2008 for a period of 20 months and with a total of 35,000 residential participants Feedback information: Education was in the form of targeted tips that are customized based on the known demographic and housing type, and surveys were conducted at the beginning and at the end of the pilot. Feedback format was in IHDs and the feedback information was peer comparison, current up-to-date consumption, and historical comparison, presented in the forms of graphs and numbers. Overall consumption reduction: 2.5% Participant feedback and information: Uptake rate: 800 of 35,000 decided to opt out, demonstrating the broad reach of this type of program (as compared to opt‐in programs such as customer purchase/installation of in‐home feedback monitors) Proactive:
Program manager reports increased customer engagement, requests for additional tips
Taps into competitiveness (e.g., “I’m closing the gap between me and my neighbours”) Negative reactions: Few very negative reactions from customers that take offense to the comparative feedback-e.g. “you don’t have the right to tell me” Additional findings: Significantly higher savings achieved by:
Higher energy consumers
Green energy (renewable energy) customers
Indication of correlation of higher savings for lower income population Source: Summit Blue Consulting (2009). Impact Evaluation of Opower SMUD Pilot Study. Final report.
35 2011 VaasaETT Empower Demand
4.5 Participant segmentation
Customer segmentation involves dividing up a customer group according to differing variables – often this
is done according to what technology the household owns (electric heating or cooling for example). When
customers are segmented according to technological factors, the aim is usually either to find customers
with particular load profiles or to better match the piloted technology with what is in the home. Customer
can also be segmented according to social factors such as age, education, income, environmental interests
etc12. When this is the case, the program managers are trying to identify who reacted best to the program
and who might be most interested during rollout. In order to maximize benefits from segmentation studies
carried out during piloting, utilities can then create directed marketing messages and education techniques
to fit a variety consumer segments.
Pilots that carry out customer segmentation tend to have better results than those who do not. However,
customer segmentation is done in order to improve rollout results not pilots. It helps utilities improve
programs to fit certain segments, design marketing and messaging campaigns. Successful programs have
succeeded in meeting customers' knowledge levels and interests. The closer the gap between the
knowledge level of the customer and the messages delivered by the program, the more successful it will be.
Different customers have also joined a program for various reasons and will therefore be engaged by
different information. Taking this into account becomes a central rather than side issue. Any smart meter
enabled program rollout is costly and entails risk. It requires technology, data-handling and marketing. The
cost/benefit of a program will therefore be directly impacted by the number of end-customers who
successfully engage with it. Different customer segments will view the same information in different ways.
This is a challenge but it has also holds potential for utilities willing to learn about their customers. It
means however that though customer segmentation may not be a key focus during piloting, it will be the
key to a successful program rollout. It will progress from a peripheral issue to being central. This should
translate into serious research being done during piloting on not only the main load sources within the
home but also on social, cultural and economic factors that may enable the creation of targeted messages
and marketing campaigns.
Regarding the pilot review, our results indicate that customer segmentation does not improve pilot results
unless it looks into what type of heating, cooling or other large sources of load are present in the house.
Other reviewed types of segmentation include social factors such as age, income, education, household
size, load profile and environmental factors such as house type, house size, house age etc.... If these could
be very important during roll out, they do not have an impact on pilot results. However, it is interesting to
note that only a minority of pilots were not only interested in factors related to electricity usage but in
participants themselves which was captured by the social and environmental factors described above. In
other words customer segmentation has actually rarely involved the customers but only their
heating/cooling systems and consumption profiles. Pilot organizers rarely looked for information about
who was living in the house and using the central air conditioning. It means that few pilots have been able
to design targeted messages to particular customer groups in the way Amazon sends practically
individualized messages and advertisements to their customers.
12 An example is the Carbon Trust Field trial in the UK, which used segmentation to determine suitable samples as per electricity usage as well as electric heating.
36 2011 VaasaETT Empower Demand
All this seems to indicate that the reason behind the apparent irrelevance of social and environmental
factors to the success of a pilot is not the lack of potential but the fact that it has rarely been done and
when it has, it has rarely been used beyond statistical purposes in order to for instance develop targeted
messages delivered to specific groups of participants.
4.6 Participant education
One of the main findings of the research is the central place of successful communication techniques in
successful programs. An important element in this is customer education material and messaging, which
largely revolves around educating the customer about the program and energy conservation, as well as
providing tips and advice to better prepare the customer.
Understanding the experiential learning cycle of customers is not a purely academic exercise. Insight into
how consumers learn, why feedback and pricing work, maximizes the impact of pilot studies and will
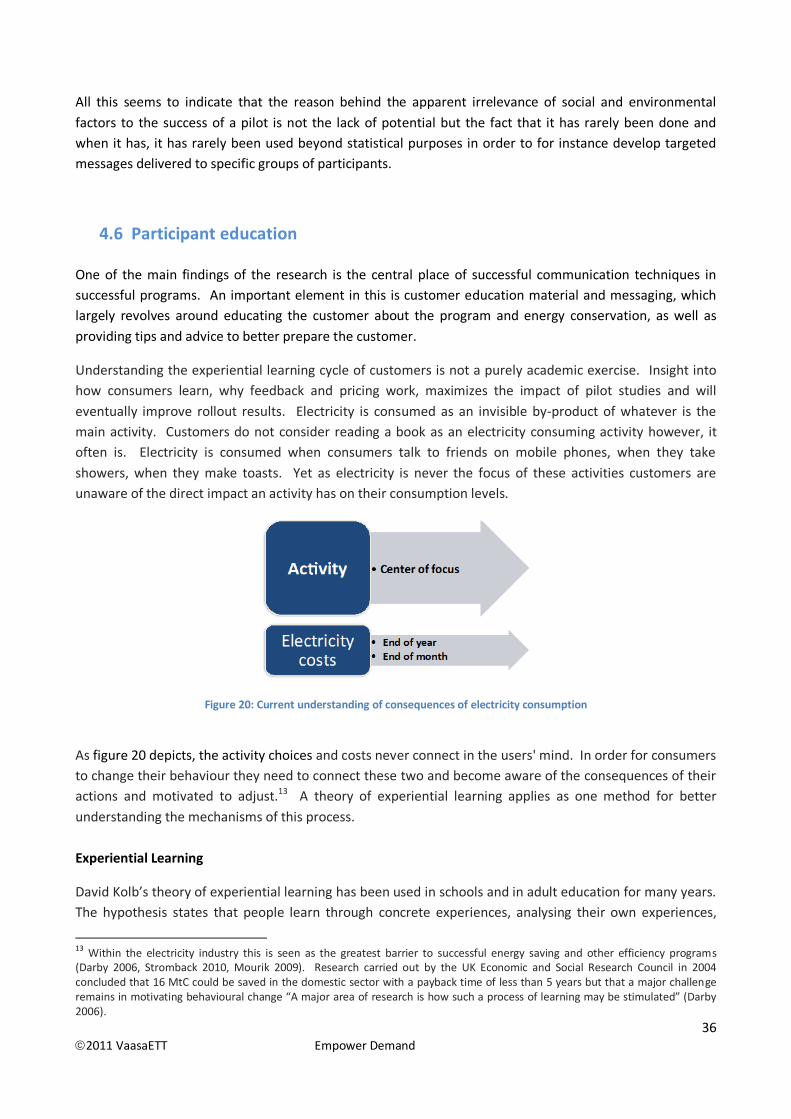
eventually improve rollout results. Electricity is consumed as an invisible by-product of whatever is the
main activity. Customers do not consider reading a book as an electricity consuming activity however, it
often is. Electricity is consumed when consumers talk to friends on mobile phones, when they take
showers, when they make toasts. Yet as electricity is never the focus of these activities customers are
unaware of the direct impact an activity has on their consumption levels.
Figure 20: Current understanding of consequences of electricity consumption
As figure 20 depicts, the activity choices and costs never connect in the users' mind. In order for consumers
to change their behaviour they need to connect these two and become aware of the consequences of their
actions and motivated to adjust.13 A theory of experiential learning applies as one method for better
understanding the mechanisms of this process.
Experiential Learning
David Kolb’s theory of experiential learning has been used in schools and in adult education for many years.
The hypothesis states that people learn through concrete experiences, analysing their own experiences,
13
Within the electricity industry this is seen as the greatest barrier to successful energy saving and other efficiency programs (Darby 2006, Stromback 2010, Mourik 2009). Research carried out by the UK Economic and Social Research Council in 2004 concluded that 16 MtC could be saved in the domestic sector with a payback time of less than 5 years but that a major challenge remains in motivating behavioural change “A major area of research is how such a process of learning may be stimulated” (Darby 2006).
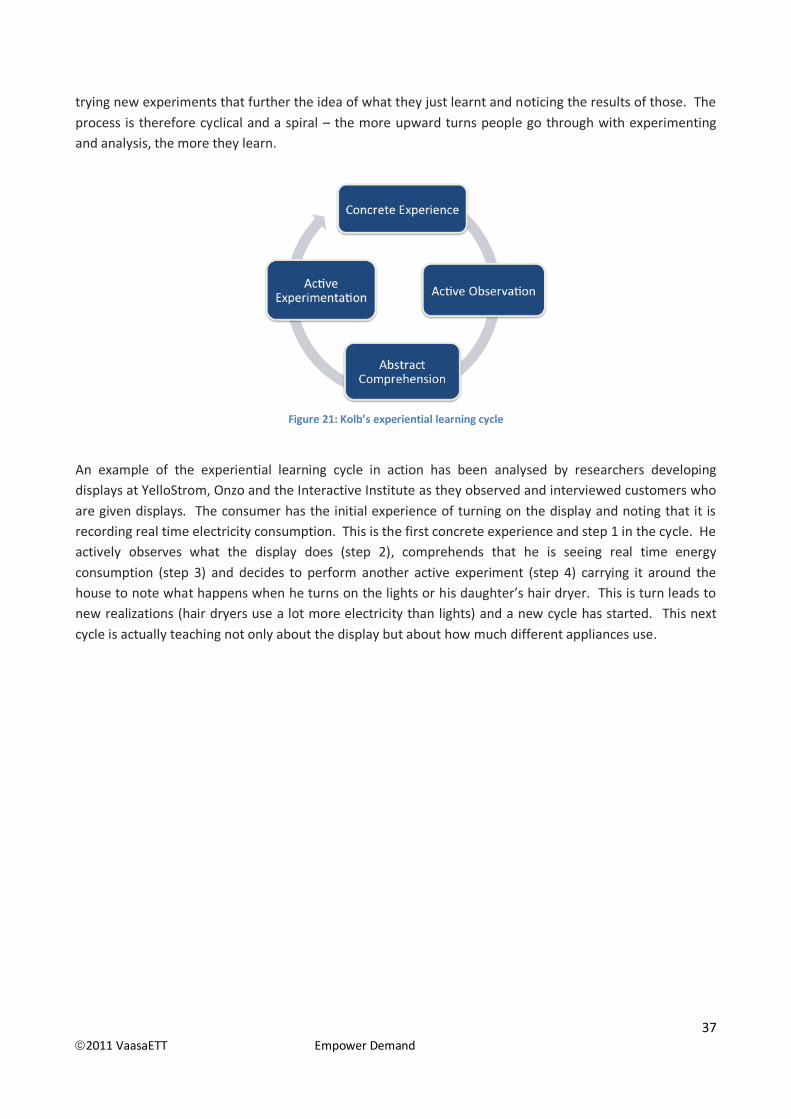
37 2011 VaasaETT Empower Demand
trying new experiments that further the idea of what they just learnt and noticing the results of those. The
process is therefore cyclical and a spiral – the more upward turns people go through with experimenting
and analysis, the more they learn.
Figure 21: Kolb’s experiential learning cycle
An example of the experiential learning cycle in action has been analysed by researchers developing
displays at YelloStrom, Onzo and the Interactive Institute as they observed and interviewed customers who
are given displays. The consumer has the initial experience of turning on the display and noting that it is
recording real time electricity consumption. This is the first concrete experience and step 1 in the cycle. He
actively observes what the display does (step 2), comprehends that he is seeing real time energy
consumption (step 3) and decides to perform another active experiment (step 4) carrying it around the
house to note what happens when he turns on the lights or his daughter’s hair dryer. This is turn leads to
new realizations (hair dryers use a lot more electricity than lights) and a new cycle has started. This next
cycle is actually teaching not only about the display but about how much different appliances use.
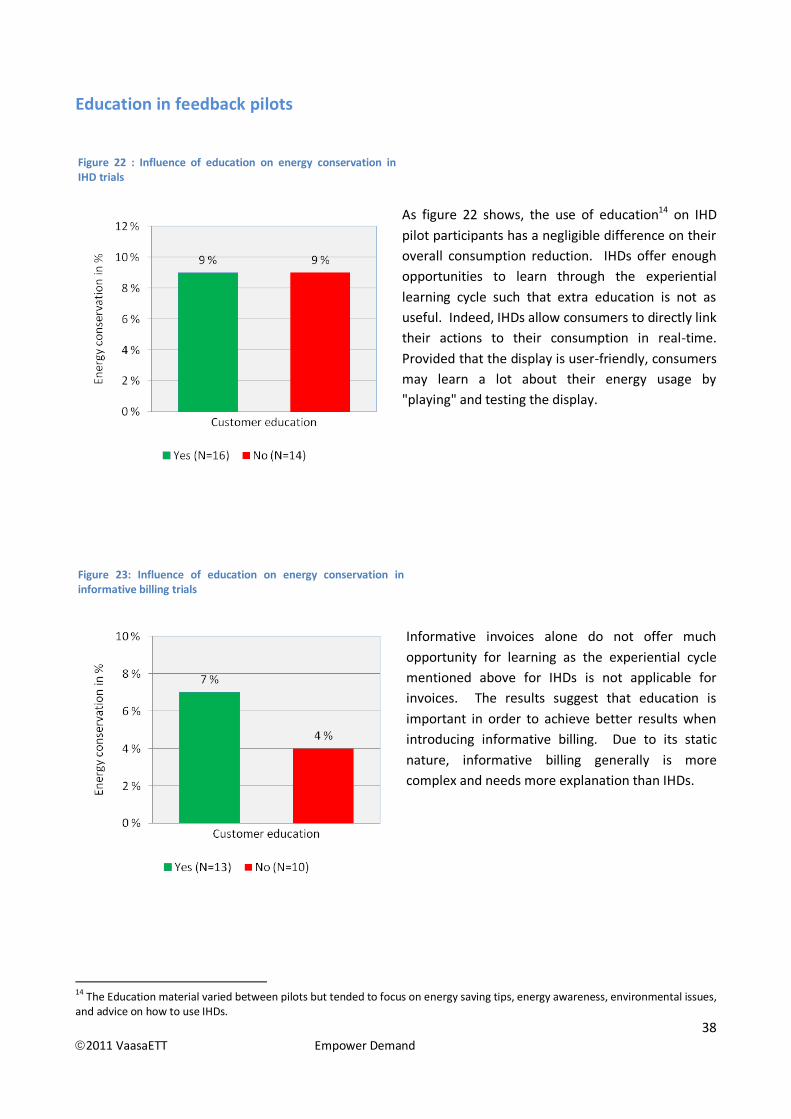
38 2011 VaasaETT Empower Demand
Education in feedback pilots
As figure 22 shows, the use of education14 on IHD
pilot participants has a negligible difference on their
overall consumption reduction. IHDs offer enough
opportunities to learn through the experiential
learning cycle such that extra education is not as
useful. Indeed, IHDs allow consumers to directly link
their actions to their consumption in real-time.
Provided that the display is user-friendly, consumers
may learn a lot about their energy usage by
"playing" and testing the display.
Informative invoices alone do not offer much
opportunity for learning as the experiential cycle
mentioned above for IHDs is not applicable for
invoices. The results suggest that education is
important in order to achieve better results when
introducing informative billing. Due to its static
nature, informative billing generally is more
complex and needs more explanation than IHDs.
14 The Education material varied between pilots but tended to focus on energy saving tips, energy awareness, environmental issues, and advice on how to use IHDs.
Figure 22 : Influence of education on energy conservation in IHD trials
Figure 23: Influence of education on energy conservation in informative billing trials
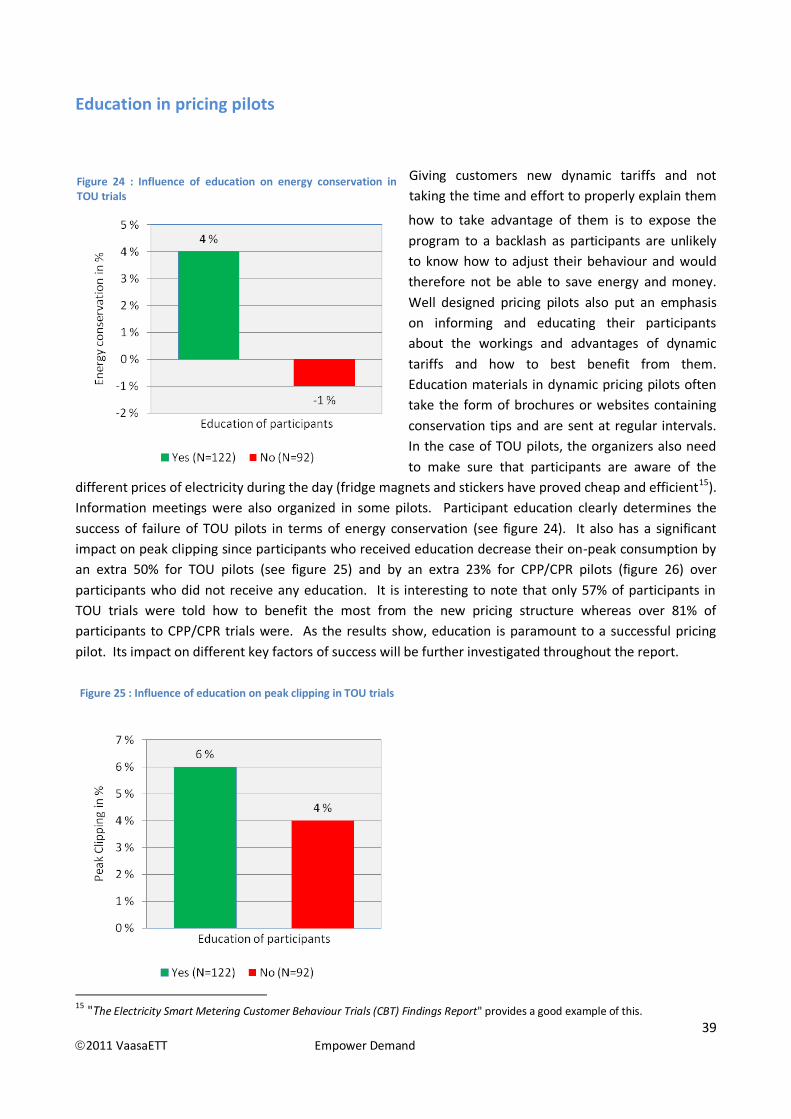
39 2011 VaasaETT Empower Demand
Education in pricing pilots
Giving customers new dynamic tariffs and not
taking the time and effort to properly explain them
how to take advantage of them is to expose the
program to a backlash as participants are unlikely
to know how to adjust their behaviour and would
therefore not be able to save energy and money.
Well designed pricing pilots also put an emphasis
on informing and educating their participants
about the workings and advantages of dynamic
tariffs and how to best benefit from them.
Education materials in dynamic pricing pilots often
take the form of brochures or websites containing
conservation tips and are sent at regular intervals.
In the case of TOU pilots, the organizers also need
to make sure that participants are aware of the
different prices of electricity during the day (fridge magnets and stickers have proved cheap and efficient15).
Information meetings were also organized in some pilots. Participant education clearly determines the
success of failure of TOU pilots in terms of energy conservation (see figure 24). It also has a significant
impact on peak clipping since participants who received education decrease their on-peak consumption by
an extra 50% for TOU pilots (see figure 25) and by an extra 23% for CPP/CPR pilots (figure 26) over
participants who did not receive any education. It is interesting to note that only 57% of participants in
TOU trials were told how to benefit the most from the new pricing structure whereas over 81% of
participants to CPP/CPR trials were. As the results show, education is paramount to a successful pricing
pilot. Its impact on different key factors of success will be further investigated throughout the report.
15 "The Electricity Smart Metering Customer Behaviour Trials (CBT) Findings Report" provides a good example of this.
Figure 24 : Influence of education on energy conservation in TOU trials
Figure 25 : Influence of education on peak clipping in TOU trials
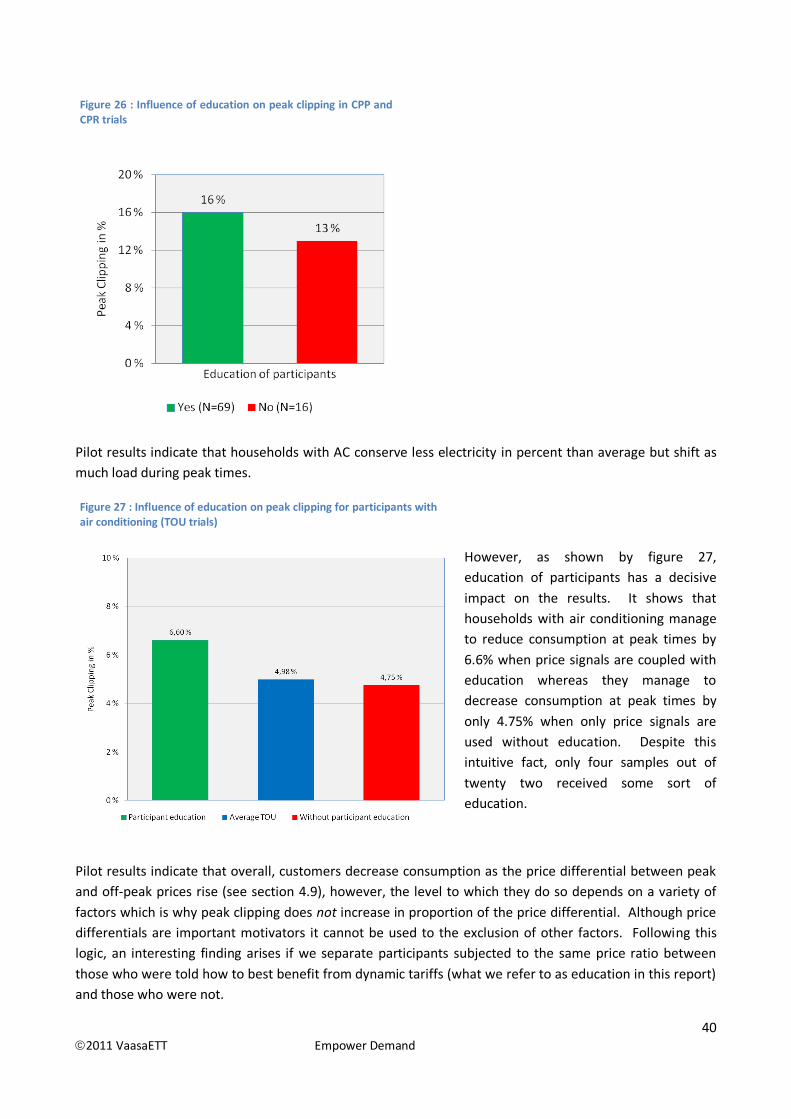
40 2011 VaasaETT Empower Demand
Pilot results indicate that households with AC conserve less electricity in percent than average but shift as
much load during peak times.
However, as shown by figure 27,
education of participants has a decisive
impact on the results. It shows that
households with air conditioning manage
to reduce consumption at peak times by
6.6% when price signals are coupled with
education whereas they manage to
decrease consumption at peak times by
only 4.75% when only price signals are
used without education. Despite this
intuitive fact, only four samples out of
twenty two received some sort of
education.
Pilot results indicate that overall, customers decrease consumption as the price differential between peak
and off-peak prices rise (see section 4.9), however, the level to which they do so depends on a variety of
factors which is why peak clipping does not increase in proportion of the price differential. Although price
differentials are important motivators it cannot be used to the exclusion of other factors. Following this
logic, an interesting finding arises if we separate participants subjected to the same price ratio between
those who were told how to best benefit from dynamic tariffs (what we refer to as education in this report)
and those who were not.
Figure 26 : Influence of education on peak clipping in CPP and CPR trials
Figure 27 : Influence of education on peak clipping for participants with air conditioning (TOU trials)
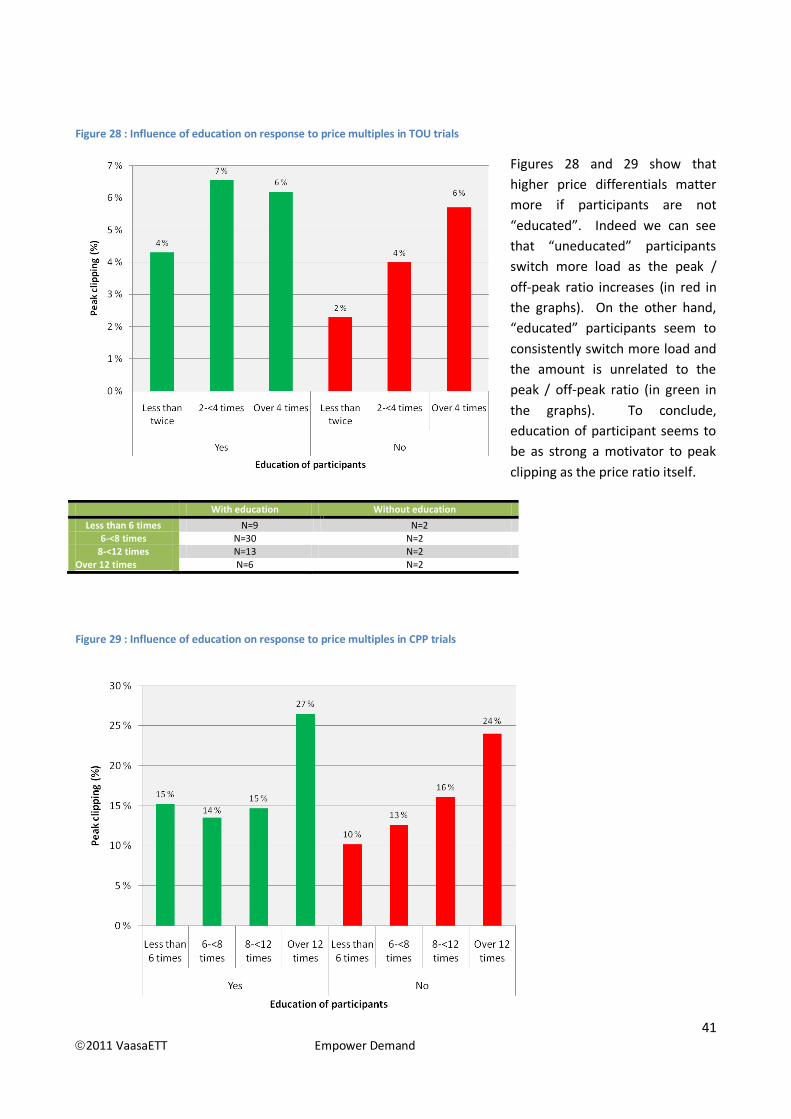
41 2011 VaasaETT Empower Demand
Figure 28 : Influence of education on response to price multiples in TOU trials
Figures 28 and 29 show that
higher price differentials matter
more if participants are not
“educated”. Indeed we can see
that “uneducated” participants
switch more load as the peak /
off-peak ratio increases (in red in
the graphs). On the other hand,
“educated” participants seem to
consistently switch more load and
the amount is unrelated to the
peak / off-peak ratio (in green in
the graphs). To conclude,
education of participant seems to
be as strong a motivator to peak
clipping as the price ratio itself.
Figure 29 : Influence of education on response to price multiples in CPP trials
With education Without education
Less than 6 times N=9 N=2 6-<8 times N=30 N=2
8-<12 times N=13 N=2 Over 12 times N=6 N=2

42 2011 VaasaETT Empower Demand
In Europe, creating dynamic pricing programs can be a challenge due to the fact that consumption patterns
are relatively flat and this may mean that the price differentials (the difference between base and peak
price) may not be strong enough to create motivating TOU or CPP programs. Thus, if customers are not
"educated", it may mean that in markets such as Great Britain and Germany where peak consumption is
relatively flat, dynamic pricing programs would be ineffective. However, provided that customers are
"educated", they will not react only to multiples of the base price and programs which do not have high
price differentials can still be effective.
With education Without education
Less than twice N=14 N=18 2-<4 times N=68 N=60
Over 4 times N=40 N=14

43 2011 VaasaETT Empower Demand
CCaassee PPiilloott 44:: EEdduuccaattiinngg ppaarrttiicciippaanntt hhooww ttoo bbeenneeffiitt ffrroomm ddyynnaammiicc pprriicciinngg
Pilots Information: Ontario Energy Board Smart Price Pilot (2007) with 375 participants Electricity Smart Metering Customer Behaviour Trials Findings (2011) with 3,958 participants PowerCents DC program (2010) with 900 participants As emphasized throughout this report, participant education is paramount to pilot’s success. Well designed pilots put an emphasis on informing and educating participants about the workings of the dynamic tariffs and how to best benefit from them. Education of participants in dynamic pricing pilots often takes the form of brochures or websites containing conservation tips. These are sent at regular intervals throughout the pilot. In the case of TOU pricing schemes, it also needs to make sure that participants are aware of the price of electricity at any time of the day. Information meetings are also organized as part of some pilots. The organizers of the above mentioned pilots ensured that participants understood the reason behind the pilot and how to adjust their behaviour to dynamic prices.
Recruitment package: During the recruitment process, eligible participants were provided with a recruitment package whose design was researched through focus groups. They included:
Invitation letter to provide a brief introduction to the pilot and to describe its key features.
Fact sheet to provide an explanation of all the key features of the pilot, show the specific prices, provide a sample of electricity usage statements to be received by participants and provide a sample of the final settlement that will be provided to participants.
Participant information package and meeting: Participants once enrolled received:
Cover letter to confirm that the participant is enrolled.
Refrigerator magnet and stickers provide prices, times and seasons for the participant’s price plan (see annex 2a).
Electricity conservation brochure and / or website access in which participants can find a variety of conservation tips and further description of the trial(see annex 2b).
User guide to electricity monitor if IHDs are tested in the trial.
In addition, the PowerCentsDC pilot organized in person meetings just before dynamic prices went live.
Sources:
IBM Global Business Services, eMeter Strategic Consulting (2007). Ontario Energy Board Smart Price Pilot. Final Report. Prepared for the Ontario Energy Board. Commission for Energy Regulation (2011). Electricity Smart Metering Customer Behaviour Trials (CBT) Findings Report. EMeter Strategic Consulting (2010). PowerCents DC Program Final Report. Prepared for the Smart Meter Pilot Program, Inc.

44 2011 VaasaETT Empower Demand
4.7 Interaction with participants (interviews, surveys and meetings)
Researchers sometimes conduct interviews with pilot participants to gage their reactions to the pilot and to
better understand how a pilot could potentially be improved16. Interviews might also be conducted during
a rollout in order to better understand customer reaction and perhaps to either improve the offering, gain
insight into potential new products or understand better how to improve the education or marketing
packages. In pricing pilots, the impact of interviews, surveys and group or individual meetings is
surprisingly similar to the effects of feedback. It is not to say that one can be a substitute to the other but
they have in common the attribute of keeping participants interested and motivated.
Most pilots interviewed participants over the phone or sent them one or more questionnaires by mail or e-
mail17. Some pilots organized focus groups or even individual interviews. These interviews often aimed at
gathering data about the households’ size, appliance ownership, etc… for statistical purposes. However the
better pilots18 took advantage of being in touch to gather participants’ views on the pilots looking for
problems that may have arisen, criticism and asked for opinions as to how to resolve them. It then
becomes possible to adjust for instance the way feedbacks are presented or the way participants are
notified of critical events over the course of the pilot. It has been demonstrated that conducting interviews
causes a peak in the interaction with IHD19. Overall pilots which included interviews with participants had
higher results than those which did not. However the results seemed to be somewhat different between
feedback pilot types and the results were seen as inconclusive as to when exactly an interview or
interaction was best carried out.
Though interaction with participants improves program results as it helps to maintain engagement,
interviews will not be stimuli which are repeatable during rollout. It may however encourage utilities to;
for example, have an extra education campaign or launch new services after a program has already been
launched which should help to maintain the cycle of learning and customer interest.
16 The majority of interactions with the participants during pilots were before and during the programme, only 18% of the samples researched conducted post-pilot interviews. 17
The “New approaches for household energy conservation” pilot in the Netherlands is an example of post-pilot interactions, with participants providing feedback via surveys. 18 See for example the “Final report for the Mypower pricing segments evaluation” prepared for the Public Service Electric and Gas Company. 19 An example of the experiential learning cycle in action has been recorded by researchers developing displays at YelloStröm, Onzo and the Interactive Institute, when they observe and interview customers who are given displays.

45 2011 VaasaETT Empower Demand
CCaassee PPiilloott 55:: IInntteerraaccttiioonn aanndd ppaarrttiicciippaanntt iinnvvoollvveemmeenntt ((ssuurrvveeyy,, iinntteerrvviieewwss,, mmeeeettiinngg,, ssuuppppoorrtt))
iinn pprriicciinngg ppiilloottss Pilots Information: Ontario Energy Board Smart Price Pilot (2007) with 375 participants Electricity Smart Metering Customer Behaviour Trials Findings (2011) with 3,958 participants MyPower pricing segments evaluation (2007) with 698 participants Involvement at an early stage: The organizers of the Irish Electricity Smart Metering Customer Behaviour Trial involved potential participants at a very early stage. Potential participants were involved in the design of the time of use tariffs, the energy usage statement and the electricity consumption monitor during focus groups.
Meetings: The Ontario Energy Board Smart Price Pilot organized three focus groups and a survey in order to gather participant feedback. In addition the implementation team provided both telephone and email support for participants.
Regular update: As the MyPower pilot progressed; participants received program updates and information via mail and/or email. Participants were reminded of steps they could take to save energy and shift usage to lower price time periods. Prior to the summer months, participants were sent reminder letters and asked to verify and/or update their contact information to ensure they would receive critical peak notifications. Participants with smart thermostat were provided with their thermostat set-points for cooling to enable them to review their settings and program their thermostat to maximize savings during the summer high and CPP periods.
Participant feedback: Regarding the Ontario Energy Board Smart Price Pilot, the majority (78%) of survey respondents would recommend the Time-Of-Use pricing plan to their friends, while only 6% would definitely not. Respondents most frequently cited more awareness of how to reduce their bill, gaining greater control over their electricity costs and environmental benefits as the top three reasons behind recommending time-of-use pricing. While interest in the CPP and CPR plans was only moderate, less than 20% prefer the existing two-tier pricing used by Hydro Ottawa before the pilot. Most would not want to go back to two-tier pricing
Sources: IBM Global Business Services, eMeter Strategic Consulting (2007). Ontario Energy Board Smart Price Pilot. Final Report. Prepared for the Ontario Energy Board. Commission for Energy Regulation (2011). Electricity Smart Metering Customer Behaviour Trials (CBT) Findings Report. Summit Blue Consulting (2007). Final report for the Mypower pricing segments evaluation. Prepared for the Public Service Electric and Gas Company.

46 2011 VaasaETT Empower Demand
4.8 Feedback information content
IHD trials as per feedback content
Every IHD pilot taken into account in the study offered up-to-date consumption levels as a form of feedback
to the participants. The second and third most offered form of feedback were historical comparison and
cost (bill) respectively. Though one can understand the advantages of offering up-to-date consumption
levels on an IHD, it is interesting to note that up-to-date cost (bill) was only offered by a little over half of
the pilots. However, historical comparisons has proven to be very useful information as they have achieved
10.4% energy conservation in comparison to pilots that did not (they achieved 6.8%), and several post-pilot
surveys highlighted the positive reaction from participants.
It also seems that peer comparison is less effective. This may be because often, especially on informative
bills, the categories are inappropriate. Households are compared to homes in a neighbourhood including
those of a different size, age, type, etc. If comparisons are to be made then it must be to households of a
like description and only for consumers who use more than their neighbours.
Almost without exception, every form of feedback information led to a higher level of consumption than
when it was not offered. In a sense, all forms of feedback enable participants to lower consumption, the
key issue being, what offers the most reduction and which ones did the participants react to favourably. An
additional point of note, 64% of the IHD pilots used a combination of 2-3 different forms of feedback
information. In only 12% of the cases, one type of feedback was offered (up-to-date consumption).
Energy conservation of IHD as per number of feedback type combinations
81% of the IHD pilot samples offered a combination of 2-4 types of feedback to the participants. In Figure
30, we can see that the best combination seems to be 4 different types of feedback. The three most
common types of feedback for IHD pilots that offered 3-5 different types of feedback were up-to-date
consumption, historical consumption, and cost (bill)20.
20 Up-to-date consumption was provided by every single IHD programme, historical consumption was offered by 56% of the IHD programmes, and cost(bill) was provided in 53% of all the IHD programmes.

47 2011 VaasaETT Empower Demand
Figure 30 : Number of feedback type and energy conservation
IHD trials as per three most used feedback contents
Figure 31 below, offers a further insight into the combinations of the three most used feedback type as used by IHD pilots. The highest level of consumption reduction is achieved when a combination of up-to-date consumption, historical consumption and cost (bill) are offered to participants. These three forms of feedback lead to the highest energy conservation level (10.3%) than any other combination, and more than any other feedback format (that was offered by more than 3 pilots). What participants respond to best, and what they value most in our review is:
1. Up-to-date consumption level (i.e. how much energy they have used between the last bill and now)
2. Up-to-date cost or bill (i.e. how high is their bill since they last paid) 3. Historical consumption (I.e. how much electricity have they used during this period compared to
the previous periods)
However, it must be emphasized that the pilot samples are too small to provide a definitive result between these particular feedback content variables and program results. What is indicated is that there may be a connection between content information and program type results and that this area should be researched further.
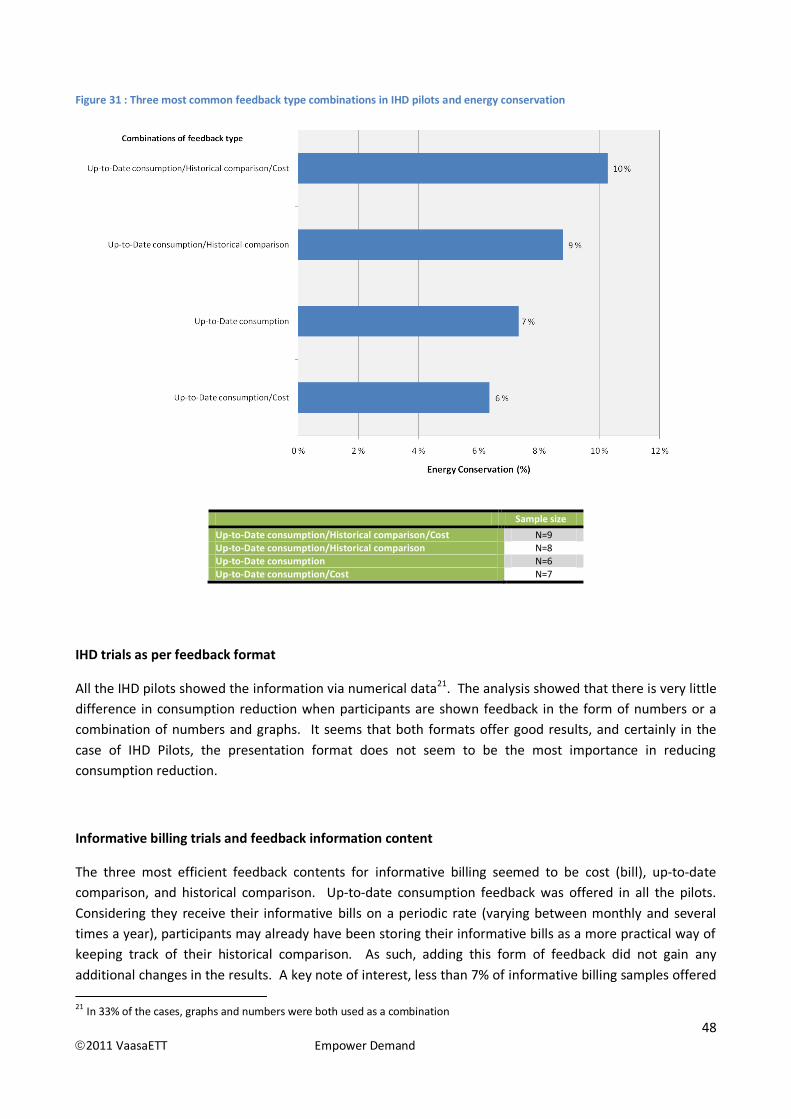
48 2011 VaasaETT Empower Demand
Figure 31 : Three most common feedback type combinations in IHD pilots and energy conservation
Sample size
Up-to-Date consumption/Historical comparison/Cost N=9 Up-to-Date consumption/Historical comparison N=8 Up-to-Date consumption N=6 Up-to-Date consumption/Cost N=7
IHD trials as per feedback format
All the IHD pilots showed the information via numerical data21. The analysis showed that there is very little
difference in consumption reduction when participants are shown feedback in the form of numbers or a
combination of numbers and graphs. It seems that both formats offer good results, and certainly in the
case of IHD Pilots, the presentation format does not seem to be the most importance in reducing
consumption reduction.
Informative billing trials and feedback information content
The three most efficient feedback contents for informative billing seemed to be cost (bill), up-to-date
comparison, and historical comparison. Up-to-date consumption feedback was offered in all the pilots.
Considering they receive their informative bills on a periodic rate (varying between monthly and several
times a year), participants may already have been storing their informative bills as a more practical way of
keeping track of their historical comparison. As such, adding this form of feedback did not gain any
additional changes in the results. A key note of interest, less than 7% of informative billing samples offered
21 In 33% of the cases, graphs and numbers were both used as a combination

49 2011 VaasaETT Empower Demand
cost (bill) as a form of feedback22. However, informative billing samples that received cost (bill), alongside
other forms of feedback, produced the highest results. Clearly this could be an avenue for future analysis.
Feedback in pricing pilots
The role of feedback in pricing pilots somewhat differs from its role in pure feedback pilots described
above. In pure feedback pilots, the role of feedback is primarily to raise awareness of overall consumption
patterns within a household and encourage consumption reductions. Feedback in pricing programs is often
seen as a tool which can raise awareness of critical peak periods thereby helping consumers to shift their
consumption away from peak periods. Dynamic pricing programs encourage consumers to lower their
consumption at certain times when prices are high. In practice, they may adjust the thermostat on an AC
unit or electric heater, when prices decrease the appliance is turned back on at extra high until the
temperature in the room is returned to normal. Also, they may put off turning on the dishwasher which
they will turn on after the peak hours are over. There is therefore little room for energy savings, the aim
being to shift load rather than lower total consumption.
Figure 32 : Impact of feedback on energy conservation in TOU trials
Figure 32 shows that providing participants with
feedbacks (be it information about the price they
are paying for electricity at different times of day,
how much they are using, how much is their bill at
regular intervals) seem to determine whether
participants to a TOU trial will conserve electricity
or not, in other words it determine the success or
failure of a TOU pilot. Furthermore, reduction at
peak hours is 40% higher when participants are
able to somehow connect their actions to their
level of consumption or their electricity bill
through feedback (figure 33). Perhaps surprisingly
given that the influence of feedback on customer
response is well documented, 54% of the samples did not receive any feedback about their usage besides
their regular bills. Following this logic, real time and hourly updates (often displayed on IHDs or ambient
displays) are most efficient at lowering overall energy usage in TOU trials as participants are able to see
immediately the link between their actions and their electricity consumption.
22 It seems that the participants would receive an informative bill (with consumption levels, historical comparison and/or peer comparison), and a separate bill that only included their cost (bill).
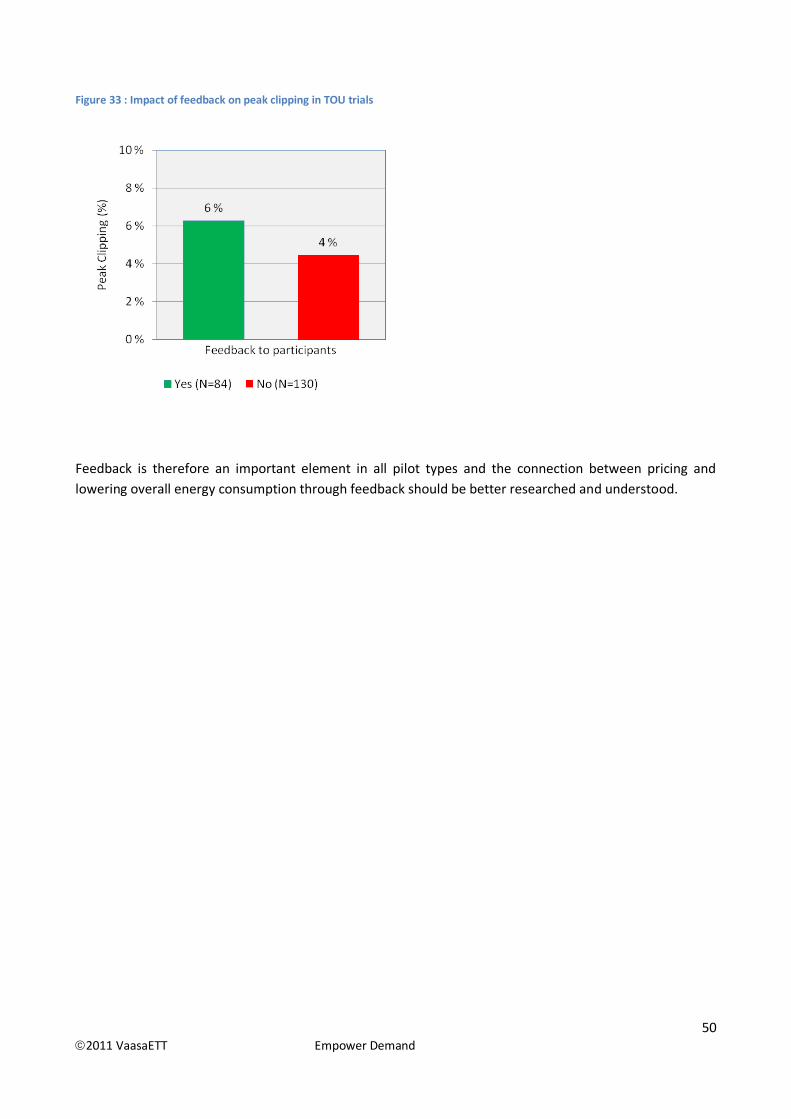
50 2011 VaasaETT Empower Demand
Figure 33 : Impact of feedback on peak clipping in TOU trials
Feedback is therefore an important element in all pilot types and the connection between pricing and
lowering overall energy consumption through feedback should be better researched and understood.

51 2011 VaasaETT Empower Demand
CCaassee PPiilloott 66:: TThhee IIrriisshh EElleeccttrriicciittyy SSmmaarrtt MMeetteerriinngg CCuussttoommeerr BBeehhaavviioouurr TTrriiaallss ((CCBBTT)) Pilot Information: was conducted in 2010 for a period of 12 months and with a total of 4,300 residential participants. Aims of the pilot: The overall objective of the Customer Behaviour Trial was to
1. Ascertain the potential for smart metering technology, when combined with time of use tariffs and different DSM stimuli.
2. To effect measurable change in consumer behaviour in terms of reductions in peak demand and overall electricity use.
3. The Residential Customer Behaviour Trial included the additional objective of seeking to identify a “Tipping Point” that is a point at which the price of electricity will significantly change usage.
4. Feedback Information Interview: A survey was used at the beginning of the pilot with a €25 credit on their energy bill for completing it Feedback format: A fridge sticker and magnet showing times of the day where electricity was the cheapest and most expensive. An electricity monitor was used too. In addition, informative billing was also used. Feedback type: kWh hours savings, cost savings, historical consumption, and peer comparison Overall consumption reduction: The data gathered from the Trial shows a reduction of 2.5% in overall electricity usage and 8.8% in peak electricity usage for residential participants on TOU tariffs and DSM stimuli relative to the control group. Participant feedback & information: Customer Behaviour: As a result of the trial,
74% of participants made minor changes to the way they used their electricity,
38% made major changes,
79% became more aware of the amount of electricity used by appliances,
78% became more aware of the cost of electricity used by appliances.
In addition, 75% found the fridge magnet to be useful and 63% found the stickers useful. Monitor feedback: The electricity monitor was found to be effective and easy to use by most participants with 84% stating that it helped them to reduce the amount of electricity they used and 84% stating it helped them to shift usage. Additional information: A finding of the qualitative research undertaken prior to the Trial was that residential customers are not good at estimating the proportion of their usage during peak or translating between a tariff and the bill impact. Therefore, it seems likely that the participants expect a much greater impact, not realizing the overall proportion of usage that occurs during the peak hours. Source: Commission for Energy Regulation (2011). Electricity Smart Metering Customer Behaviour Trials (CBT) Findings Report.
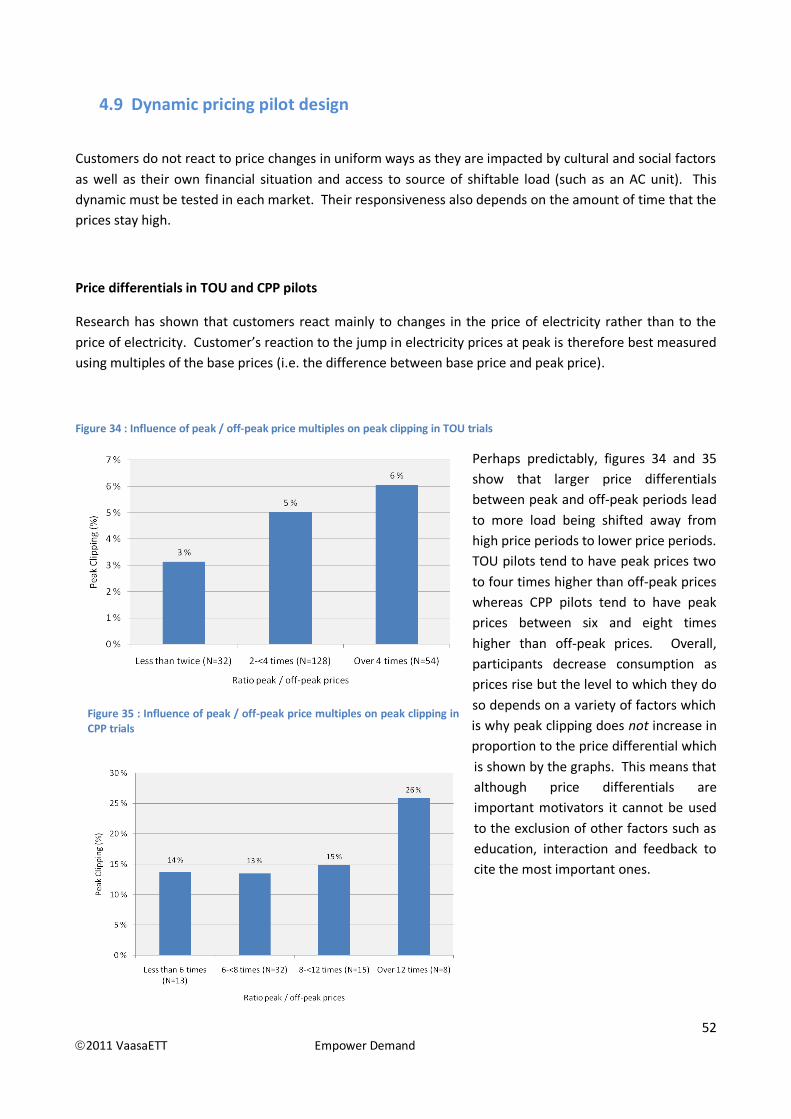
52 2011 VaasaETT Empower Demand
4.9 Dynamic pricing pilot design
Customers do not react to price changes in uniform ways as they are impacted by cultural and social factors
as well as their own financial situation and access to source of shiftable load (such as an AC unit). This
dynamic must be tested in each market. Their responsiveness also depends on the amount of time that the
prices stay high.
Price differentials in TOU and CPP pilots
Research has shown that customers react mainly to changes in the price of electricity rather than to the
price of electricity. Customer’s reaction to the jump in electricity prices at peak is therefore best measured
using multiples of the base prices (i.e. the difference between base price and peak price).
Figure 34 : Influence of peak / off-peak price multiples on peak clipping in TOU trials
Perhaps predictably, figures 34 and 35
show that larger price differentials
between peak and off-peak periods lead
to more load being shifted away from
high price periods to lower price periods.
TOU pilots tend to have peak prices two
to four times higher than off-peak prices
whereas CPP pilots tend to have peak
prices between six and eight times
higher than off-peak prices. Overall,
participants decrease consumption as
prices rise but the level to which they do
so depends on a variety of factors which
is why peak clipping does not increase in
proportion to the price differential which
is shown by the graphs. This means that
although price differentials are
important motivators it cannot be used
to the exclusion of other factors such as
education, interaction and feedback to
cite the most important ones.
Figure 35 : Influence of peak / off-peak price multiples on peak clipping in CPP trials
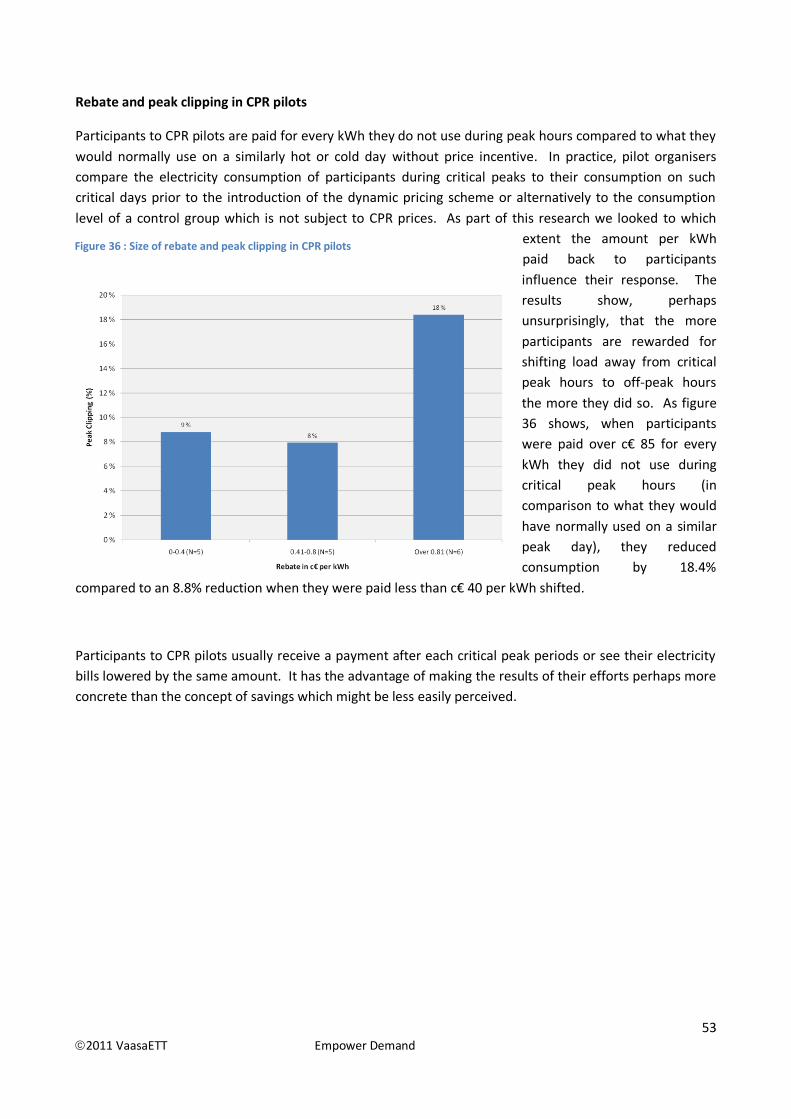
53 2011 VaasaETT Empower Demand
Rebate and peak clipping in CPR pilots
Participants to CPR pilots are paid for every kWh they do not use during peak hours compared to what they
would normally use on a similarly hot or cold day without price incentive. In practice, pilot organisers
compare the electricity consumption of participants during critical peaks to their consumption on such
critical days prior to the introduction of the dynamic pricing scheme or alternatively to the consumption
level of a control group which is not subject to CPR prices. As part of this research we looked to which
extent the amount per kWh
paid back to participants
influence their response. The
results show, perhaps
unsurprisingly, that the more
participants are rewarded for
shifting load away from critical
peak hours to off-peak hours
the more they did so. As figure
36 shows, when participants
were paid over c€ 85 for every
kWh they did not use during
critical peak hours (in
comparison to what they would
have normally used on a similar
peak day), they reduced
consumption by 18.4%
compared to an 8.8% reduction when they were paid less than c€ 40 per kWh shifted.
Participants to CPR pilots usually receive a payment after each critical peak periods or see their electricity
bills lowered by the same amount. It has the advantage of making the results of their efforts perhaps more
concrete than the concept of savings which might be less easily perceived.
Figure 36 : Size of rebate and peak clipping in CPR pilots
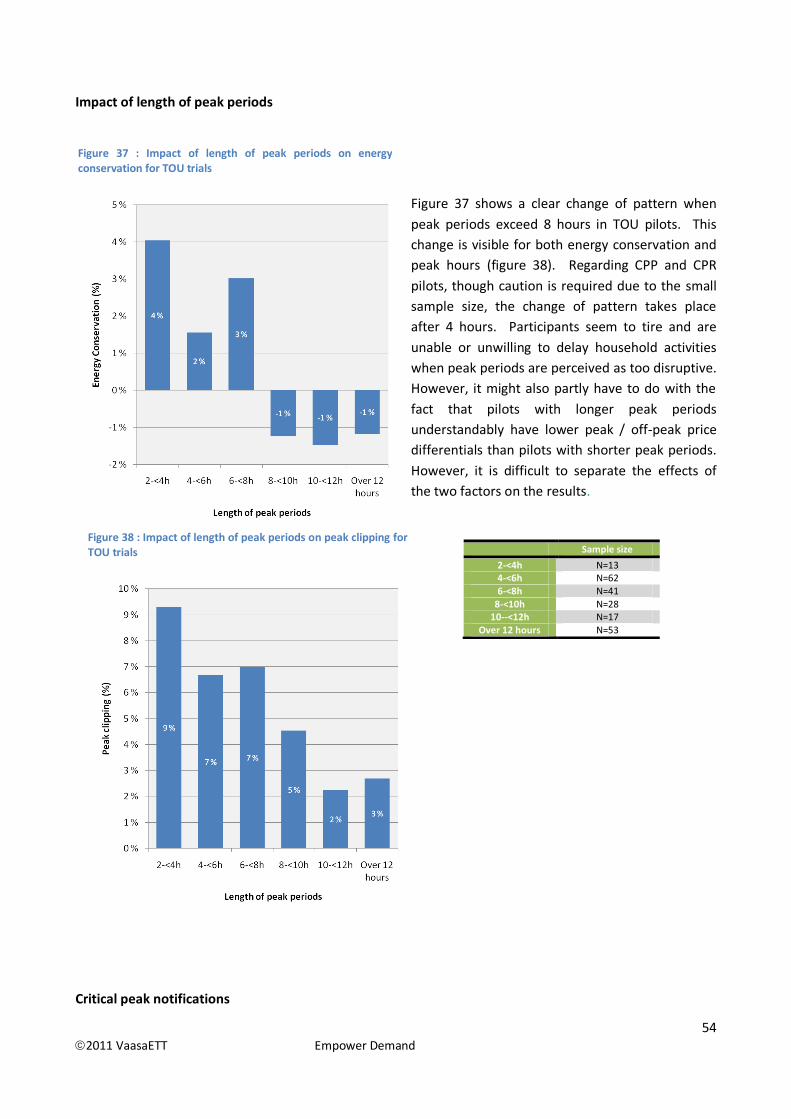
54 2011 VaasaETT Empower Demand
Impact of length of peak periods
Figure 37 shows a clear change of pattern when
peak periods exceed 8 hours in TOU pilots. This
change is visible for both energy conservation and
peak hours (figure 38). Regarding CPP and CPR
pilots, though caution is required due to the small
sample size, the change of pattern takes place
after 4 hours. Participants seem to tire and are
unable or unwilling to delay household activities
when peak periods are perceived as too disruptive.
However, it might also partly have to do with the
fact that pilots with longer peak periods
understandably have lower peak / off-peak price
differentials than pilots with shorter peak periods.
However, it is difficult to separate the effects of
the two factors on the results.
Critical peak notifications
Sample size
2-<4h N=13 4-<6h N=62 6-<8h N=41
8-<10h N=28 10--<12h N=17
Over 12 hours N=53
Figure 37 : Impact of length of peak periods on energy conservation for TOU trials
Figure 38 : Impact of length of peak periods on peak clipping for TOU trials
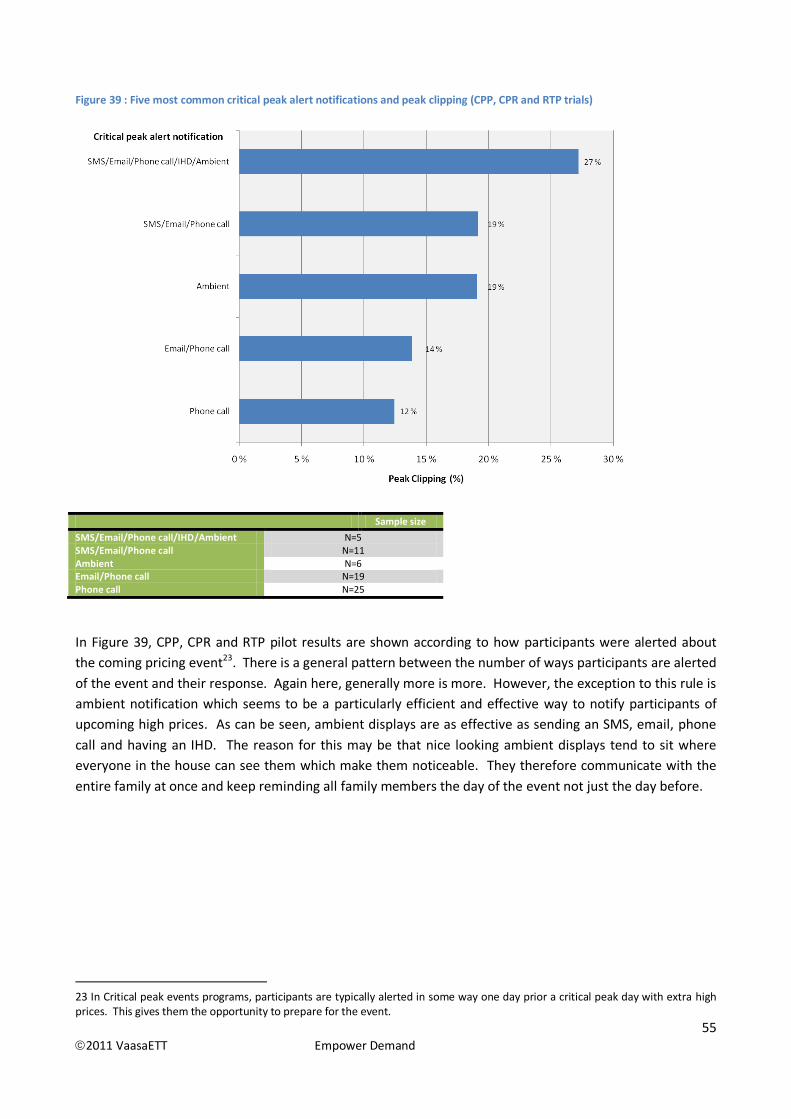
55 2011 VaasaETT Empower Demand
Figure 39 : Five most common critical peak alert notifications and peak clipping (CPP, CPR and RTP trials)
Sample size
SMS/Email/Phone call/IHD/Ambient N=5 SMS/Email/Phone call N=11 Ambient N=6 Email/Phone call N=19 Phone call N=25
In Figure 39, CPP, CPR and RTP pilot results are shown according to how participants were alerted about
the coming pricing event23. There is a general pattern between the number of ways participants are alerted
of the event and their response. Again here, generally more is more. However, the exception to this rule is
ambient notification which seems to be a particularly efficient and effective way to notify participants of
upcoming high prices. As can be seen, ambient displays are as effective as sending an SMS, email, phone
call and having an IHD. The reason for this may be that nice looking ambient displays tend to sit where
everyone in the house can see them which make them noticeable. They therefore communicate with the
entire family at once and keep reminding all family members the day of the event not just the day before.
23 In Critical peak events programs, participants are typically alerted in some way one day prior a critical peak day with extra high prices. This gives them the opportunity to prepare for the event.
56 2011 VaasaETT Empower Demand
CCaassee PPiilloott 77:: IInnffoorrmmaattiioonn DDiissppllaayy PPiilloott wwiitthhiinn tthhee CCaalliiffoorrnniiaa SSttaatteewwiiddee PPrriicciinngg PPiilloott Pilot information: The well documented California Statewide project tested one sub group Energy Orbs, one of the many ambient displays that have been developed and tested to inform customers of changes in electricity prices using colour signals. Real-time information on electricity prices: Energy Orbs are small glass globes that change colour to indicate the price the customer is paying for electricity in real-time. The orb was blue during off peak periods, green during daily peaks and red during super peak times. In addition, it also flashed as a warning for four hours before each critical peak price period. Such ambient displays have the advantage of being a constant reminder to reduce electricity consumption and if well designed can also be seen as “cool and trendy” and deserving a visible and central spot in the living room for everyone to see (and not at the bottom of a drawer).
Participant feedback: After using the orb, pilot customers were asked how they would prefer to be informed of changing electricity prices and super peak events in the future. Respondents were allowed to indicate more than one form of notification. The orb was the overwhelming preference of method notification, with some of these respondents also asking for both orb and telephone notification. Source: Nexus Energy Software, Opinion Dynamics Corporation, Primen (2005). Final Report. Information Display Pilot. California Statewide Pricing Pilot.
CCaassee PPiilloott 88:: TTeemmppoo bbyy EEDDFF Pilot information: Tempo was first tested by French utility EDF in 1989 and then offered to its residential customers starting from 1995. Pricing scheme: The utility experimented with a six-rate tariff which divides the year into three types of days and each day into two periods. The number of days of each type is known in advance but the type of any particular day is announced only at the end of the preceding day which is in effect similar to having a TOU coupled with a CPP price structure. The three groups of days are marked by colours; blue, white and red with blue being the cheapest and red the most expensive. Peak price notification: An interesting feature relates to the way participants are informed of the day-ahead price. Once the colour of the next day is decided, the signal is transmitted to the customer and displayed both on their meter and on a small box which can be plugged into any power socket. The box also indicates the day’s colour and the current hourly rating. This system of “traffic light” coupled with various energy control systems offer a cheap and efficient way to inform participants. Pilot results: On average, participants reduced daily consumption by 15 % on a white day and by 45 % on a red day compared with blue days. Participant feedback: A survey evaluated customer satisfaction's level with the following results:
84% of the customers have been quite or very satisfied with this option,
59% have said that they had made savings (average or substantial for ¾),
53% have considered the option as slightly restrictive or entirely unrestrictive,
87% have understood the tariff principle very well. Source: EFFLOCOM (2004). Energy efficiency and load curve impacts of commercial development in competitive markets. Results from the EFFLOCOM Pilots. 60-68.

57 2011 VaasaETT Empower Demand
4.10 Automation of appliances
There are limits to the speed with which customers can manually react to price signals. Less than half an
hour reaction time is considered too fast for commercial customers to participate manually in a demand-
response event. Virtually all CPP and CPR pilots notified participants that critical peak prices would be in
force one day in advance. This means that a utility can only ask residential customers to shift load manually
if they know this will be necessary a day in advance. This decreases the value of the load which is to be
shifted and might lower the profitability of a program. Through remote controllers in appliances which can
communicate with each other and react to outside information, such as electricity pricing signals, the
response of a household will approximately double (see figure 40). This is called automation. In most pilots
the automation are an AC or electric heating thermostat which is set to turn down or off during peak
periods. However, automation systems can be more advanced and include lighting, white goods and
entertainment equipment. Automation enables fast reactions as well as controllable levels of reduction
and has the advantage of being available during unplanned system emergencies. In addition, critical
situations do not always occur when residential customers are able to take action (when they are away or
asleep for instance).
In the review we conducted, two types of automation were used:
1. The most common type involved the Utility remotely-controlling some participant appliances and therefore did not require any customer involvement besides its agreement to participate.
2. The other type let participants freely choose the extent to which they want their appliances to react to price signals through more or less user-friendly interfaces such as smart thermostats or websites.
Letting companies control household appliances inside one’s home might be seen with suspicion even
though participants are always allowed to overrun the program. On the contrary, letting customers choose
if and how much they want to respond to price signals might be seen as less intrusive. Furthermore, there
is no evidence that the load shifted when participants choose the extent of their participation to critical
events was any lower than when appliances were controlled by the Utility. A good example of this is the
Gulf Power's Residential Select variable Pricing pilot (RSVP)24 in which the Floridian company tested a
locally controlled thermostat coupled with CPP prices on some of its large residential users. The pilot
achieved among the highest results in our review in terms of peak clipping and was praised by participants.
So much so in fact that the Utility now offers the thermostat together with CPP prices as part of a package
called "energy select" available to its large residential customers.
Figure 40 shows the impact of automating certain household appliances such as AC, electric heaters etc...
on peak clipping. TOU peak consumption reductions are the lowest (though still very high) but occur daily
whereas CPP and CPR pricing schemes produce greater reductions but only during critical peak periods.
With the exception of RTP, automation improves the results of the pilot by 60 – 200%.
24 Borenstein, S., Jaske, M., Rosenfeld, A. (2002). Dynamic Pricing, Advanced Metering and Demand Response in Electricity Markets. Center for the Study of Energy Markets, University of California Energy Institute, UC Berkeley. Appendix B.
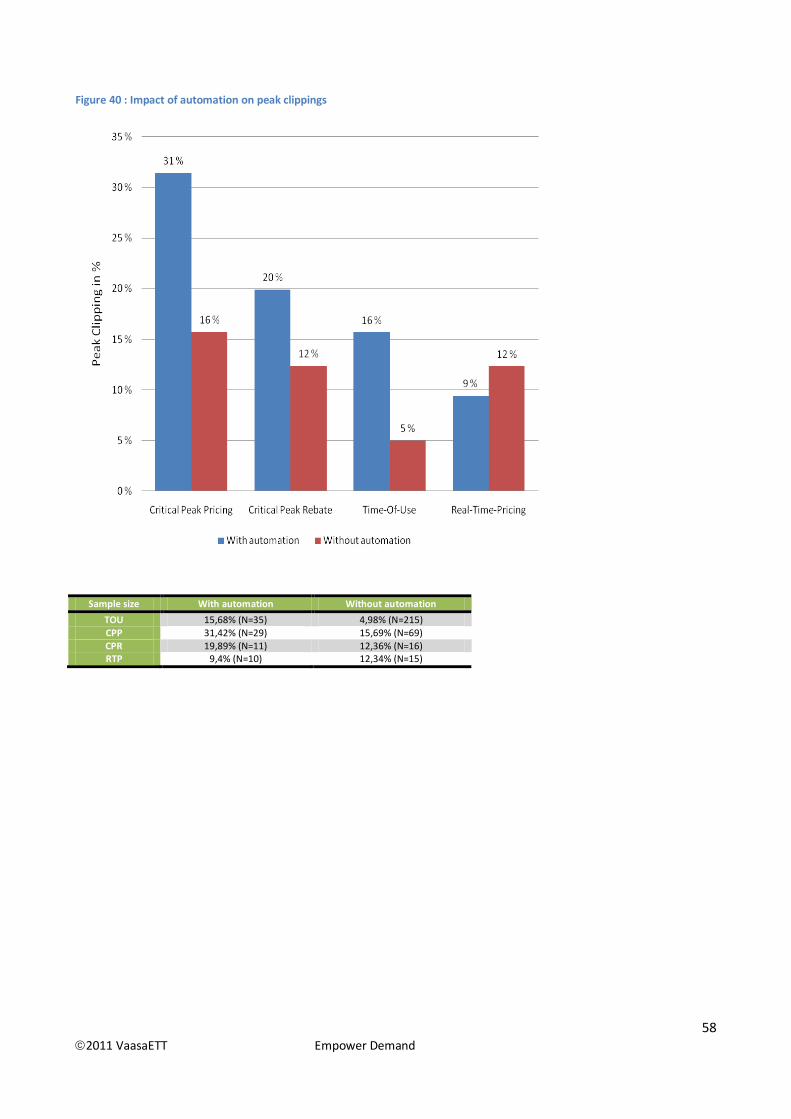
58 2011 VaasaETT Empower Demand
Figure 40 : Impact of automation on peak clippings
Sample size With automation Without automation
TOU 15,68% (N=35) 4,98% (N=215) CPP 31,42% (N=29) 15,69% (N=69) CPR 19,89% (N=11) 12,36% (N=16) RTP 9,4% (N=10) 12,34% (N=15)
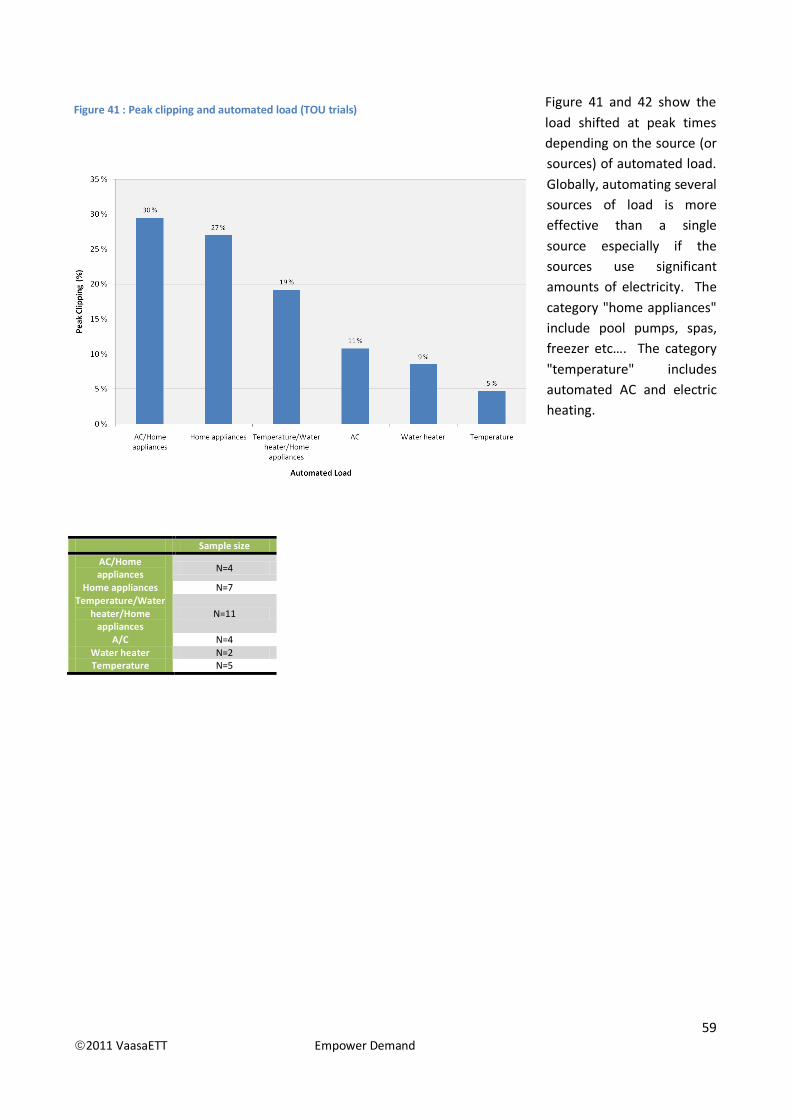
59 2011 VaasaETT Empower Demand
Figure 41 and 42 show the
load shifted at peak times
depending on the source (or
sources) of automated load.
Globally, automating several
sources of load is more
effective than a single
source especially if the
sources use significant
amounts of electricity. The
category "home appliances"
include pool pumps, spas,
freezer etc…. The category
"temperature" includes
automated AC and electric
heating.
Sample size
AC/Home appliances
N=4
Home appliances N=7 Temperature/Water
heater/Home appliances
N=11
A/C N=4 Water heater N=2 Temperature N=5
Figure 41 : Peak clipping and automated load (TOU trials)
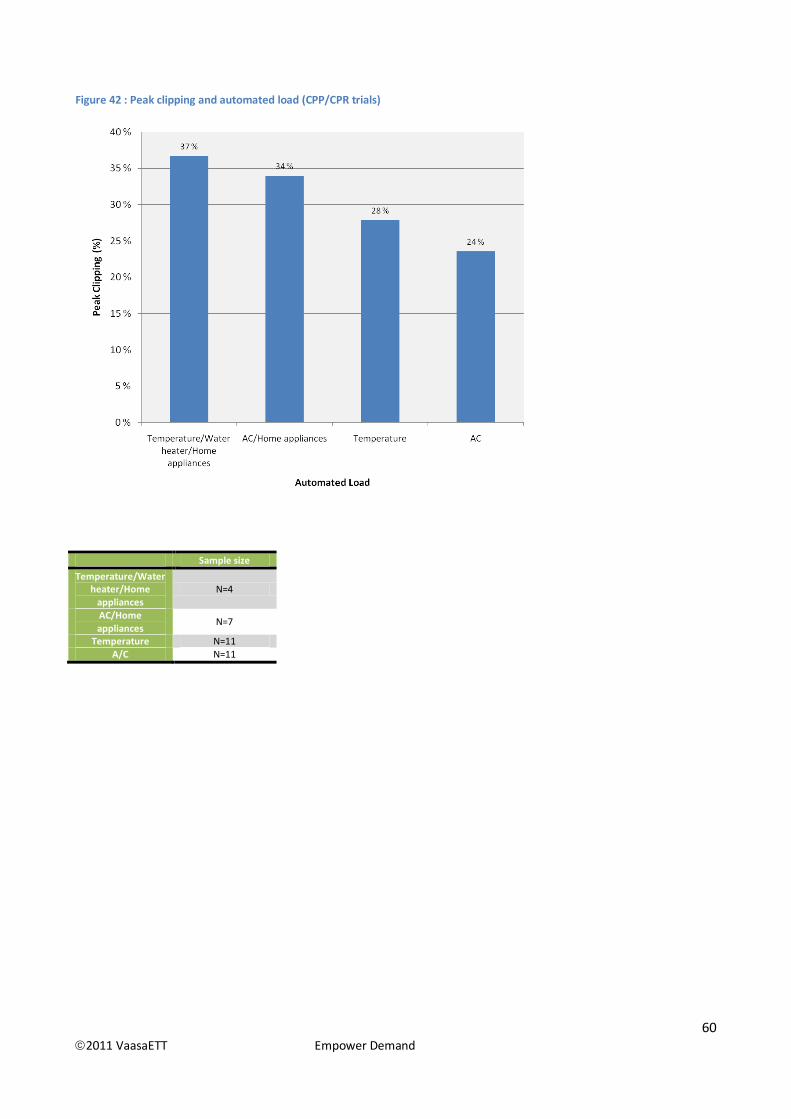
60 2011 VaasaETT Empower Demand
Figure 42 : Peak clipping and automated load (CPP/CPR trials)
Sample size
Temperature/Water heater/Home
appliances N=4
AC/Home appliances
N=7
Temperature N=11 A/C N=11
61 2011 VaasaETT Empower Demand
CCaassee PPiilloott 99:: AAuuttoommaattiioonn iinn pprriicciinngg ppiilloottss ((GGuullff PPoowweerr''ss RReessiiddeennttiiaall SSeelleecctt vvaarriiaabbllee PPrriicciinngg aanndd
EEffffllooccoomm NNoorrwweeggiiaann pprroojjeecctt))
Pilot Information: Gulf Power Company from Florida tested a customer controlled thermostat coupled to TOU and CPP prices with 2,300 participants in 2002. The settings could be programmed directly from the thermostat or from a secured webpage. Automated load: Two elements made this trial outstanding, first the degree of sophistication of the technology; all the major sources of load could be automated (air-conditioning, electric heating, spa, pool pumps, heat pumps and electric water heater) and second participants had to pay a participation fee of $4.53 a month to cover for equipment and operational expenses. Participant feedback: After the success of the different tests and pilots, Gulf Power started to offer the thermostat and the dynamic tariffs as part of a package to its residential customers for a fee which currently stands at $5 per month. Gulf Power Company said “to date, customers have not considered the fee a barrier to participation. In fact, they regard the automation and energy management benefits they receive as being well worth the monthly fee”. Pilot results:
Average energy reduction = 22% during high price period
Average energy reduction = 41% during critical period
Customer satisfaction = 96%, highest ever for Gulf Power program. Pilot Information: The European context is very different from Florida and the largest loads in European homes are often electric heaters and / or electric water heaters. In a 2004 Norwegian pilot, organizers installed remote control of electrical floor heaters and water boilers coupled with different options of dynamic network and electricity tariffs at 318 participants' premises. Pilot results: The organizers report that customers with remote control, TOU network tariffs and spot price based energy tariffs achieved savings of up to 35% during the morning and 31% during the afternoon. Source: Borenstein, S., Jaske, M., Rosenfeld, A. (2002). Dynamic Pricing, Advanced Metering and Demand Response in Electricity Markets. Center for the Study of Energy Markets, University of California Energy Institute, UC Berkeley. Appendix B. EFFLOCOM (2004). Energy efficiency and load curve impacts of commercial development in competitive markets. Results from the EFFLOCOM Pilots. 122-135.

62 2011 VaasaETT Empower Demand
5. Conclusions
The aim of Empower Demand has been to discover the potential and limitations of a range of smart meter enabled feedback and dynamic pricing programs using a large comparative sample. Due to the repeated findings within the 100 pilots and 460 samples involving 450,000 residential households, the project has been able to reach robust conclusions on the overall effectiveness of differing program types as well as central success factors. The findings of Empower Demand demonstrate that technology provides an important but enabling function in creating a successful demand side program. It is one of five factors we found which decide success. These factors are socioeconomic factors, consumer consumption patterns, program content/structure, supportive technology, and household load sources. In this, socioeconomic factors and consumption patterns can overcome supportive technology and program type. For example, a good informative billing pilot can lead to higher savings than an IHD pilot depending on surrounding circumstances despite the fact that on average an IHD is 50% more effective than an informative bill at reducing overall electricity consumption. It is therefore important to perform a holistic analysis of markets when creating demand side programs; matching the program structure with the market realities. During piloting, there can be a technological focus or a preconceived opinion that the technology is what decides program success. Our findings challenge this focus. The main difference we found between pilot success and failure is the ability of the program designers to meet consumer needs through the demand side program. Meeting a need is the foundation of consumer engagement and thereby of a program’s success. The technology is the enabler within this value chain. Therefore, unless a technology is equipped to act as a support to consumer engagement, it will not create savings or improve systems efficiency. Smart meters fulfil their potential due to the fact that they can support consumer engagement to a market-appropriate level through feedback and dynamic pricing and/or home automation. Program success is directly dependent on consumer involvement and the Empower Demand findings indicate that "more is more" at every stage of the piloting and roll out process. For example, within marketing, programs using consumer segmentation to create directed marketing messages for a particular consumer group increase consumer uptake and results. In the program structure, feedback and pricing together tend to achieve better long-term overall results than either program type alone. Education improves dynamic pricing and informative billing programs. Multiple types of information on a display or a bill (current consumption, price, historical consumption, etc.) tend to achieve higher results than a display or a bill with only one message. Program layering is little explored but there are signs that hidden potential lies in starting with a relatively simple program and gradually create offerings of increasing complexity and value. Hence, we are far from having perfected program structures or perfectly matching program structures to regional market realities. This should be seen as encouraging as even though program development is not mature, results are already positive.
Finally, it is important to emphasise the central place of program uptake during program rollout and the difference this creates between a successful pilot and a successful rollout. Pilot results reflect the response of customers who have agreed to participate in a given program. What is not accounted for in pilot results is the response of the people who would not be interested in the program. During rollout, the numbers of customers willing to take part in a feedback or in a pricing program will largely decide its success. The potential uptake rate of a program is therefore central. For example, a 10% electricity consumption reduction by 1% of the population will lead to a 0.1% total reduction whereas a 10% electricity consumption reduction by 10% of the population will lead to a 10% total reduction.
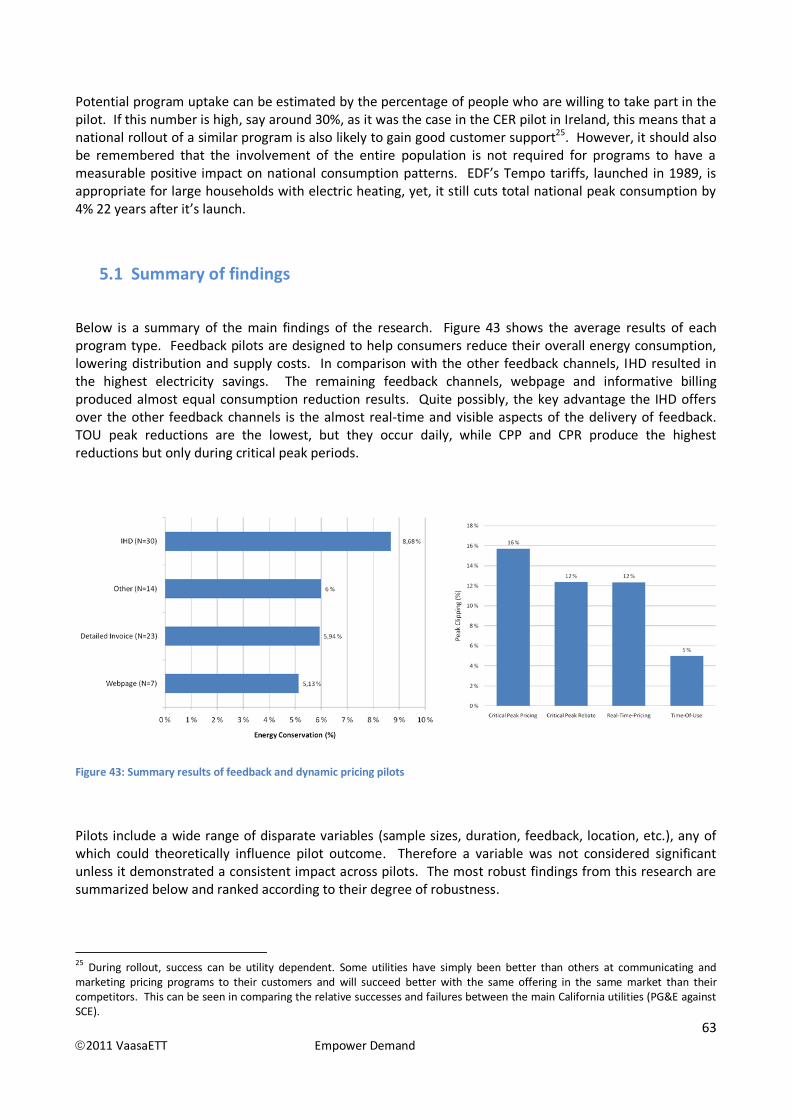
63 2011 VaasaETT Empower Demand
Potential program uptake can be estimated by the percentage of people who are willing to take part in the pilot. If this number is high, say around 30%, as it was the case in the CER pilot in Ireland, this means that a national rollout of a similar program is also likely to gain good customer support25. However, it should also be remembered that the involvement of the entire population is not required for programs to have a measurable positive impact on national consumption patterns. EDF’s Tempo tariffs, launched in 1989, is appropriate for large households with electric heating, yet, it still cuts total national peak consumption by 4% 22 years after it’s launch.
5.1 Summary of findings
Below is a summary of the main findings of the research. Figure 43 shows the average results of each program type. Feedback pilots are designed to help consumers reduce their overall energy consumption, lowering distribution and supply costs. In comparison with the other feedback channels, IHD resulted in the highest electricity savings. The remaining feedback channels, webpage and informative billing produced almost equal consumption reduction results. Quite possibly, the key advantage the IHD offers over the other feedback channels is the almost real-time and visible aspects of the delivery of feedback. TOU peak reductions are the lowest, but they occur daily, while CPP and CPR produce the highest reductions but only during critical peak periods.
Figure 43: Summary results of feedback and dynamic pricing pilots
Pilots include a wide range of disparate variables (sample sizes, duration, feedback, location, etc.), any of which could theoretically influence pilot outcome. Therefore a variable was not considered significant unless it demonstrated a consistent impact across pilots. The most robust findings from this research are summarized below and ranked according to their degree of robustness.
25 During rollout, success can be utility dependent. Some utilities have simply been better than others at communicating and marketing pricing programs to their customers and will succeed better with the same offering in the same market than their competitors. This can be seen in comparing the relative successes and failures between the main California utilities (PG&E against SCE).

64 2011 VaasaETT Empower Demand
Some variables were found to have produced a repeated and consistent response from consumers across pilot type (both feedback and pricing pilots) and were judged to be particularly important. Their chart is green. Some had a varied impact across pilot type but the results were nonetheless robust in one of the pilot types. Their chart is blue. Some variables provided interesting results but the findings were not robust enough to be judged definitive. They are presented here because we believe they deserve further research and the fact that they are not conclusive is in our opinion interesting in itself. Their summary chart is black.
Structural variables
Below is an overview of three structural variables and their impact on pilot results. These include the region in which the pilots were conducted, the length of the pilots and the number of participants. The variables in this section are considered robust though their impact may vary between feedback and pricing pilots.
Section 4.1: page 24
Findings: Australia carried out the most successful TOU and CPP pilots probably due to their high price
differentials. Canada was the most successful with IHDs with 12% reductions; Europe was second with
10% and the USA third with 7%. Informative billing in Europe was 4.5 times as effective as in the USA.
Dynamic pricing programs overall were again more successful in Europe.
Conclusion: Europeans should be cautious when comparing themselves directly to other regions and
making assumptions about the results a similar program in Europe would achieve. Results may be higher
and program requirements may also differ. Programs should be adjusted to fit local cultural specificities.
Section 4.3: page 27
Findings: The aim of this variable was to establish if pilots maintain their results when they last longer. In
all but TOU pilots, results were higher in pilots which lasted longer. This was true in CCP, CPR pilots and
also in IHD and billing pilots which rely on behavioural change and purchasing choices.
Region of pilot
Length of pilot duration

65 2011 VaasaETT Empower Demand
Conclusion: Program results usually maintain over extended periods of time (over two years). This is
significant as it means that behavioural changes can become permanent. Consumers’ learning cycles and
the potential of using this to introduce more and more advanced programs in order to establish a smart
grid should be researched further.
Section 4.4: page 31
Findings: Pricing pilots with over 1,000 participants were at least as successful as smaller pilots. Even with
very large populations (of over 1 million consumers), consumption reductions are still achieved and lower
the need for systems investment in generation and network capacity. Feedback pilots of over 1,000
participants had lower results than those with less than 1,000. This demonstrates the challenge of
successful communication with large groups of consumers in order to engage their interest in a program
and ensure success during rollout. It was also noticed that the IHDs and the bills provided in the larger
pilots tended to be simpler and provided less information. This may also partly explain the lower results,
however, further research is required to draw firm conclusions.
Conclusions: Dynamic pricing may be easier to communicate to a large number of consumers than
feedback. More knowledge is needed on segmented and directed messages for large consumer groups.
An increased number of large and robust pilots should be performed in Europe involving at least 5,000
participants.
Customer communication and segmentation variables
Program success is largely dependent on successful consumer engagement and acceptance. Programs will
increase consumer involvement if they can use a variety of program dynamics such as feedback, pricing,
education, interaction etc. The findings from SEAS-NVE’s social segmentation and marketing techniques
demonstrate that the same program should be marketed in a variety of ways to increase the number of
customers who engage with the smart meter enabled offering in much the same way as car companies will
market the same car to a variety of customer groups using a variety of sales messages26. The central
contribution of education on billing and pricing programs is reviewed.
26 Stromback and al (2010)
Number of participants

66 2011 VaasaETT Empower Demand
Section 4.5: page 35
Findings: Pilots that carry out customer segmentation tend to have better results than those who do
not. However, customer segmentation is done in order to improve rollout results not pilots. It helps
utilities improve programs to fit certain segments and design marketing and messaging campaigns.
Successful programs have succeeded in meeting customers' knowledge levels and interests.
Considering the decisive importance on successful customer communication and its direct impact on
public acceptance, uptake and long term engagement in smart meter enabled programs; customer
segmentation in pilots was either under-researched or under-reported. With a few exceptions, such as
SEAS-NVE, there is little evidence in utility program rollout that customer segmentation has been fully
exploited to create directed marketing messages and educational materials.
Conclusion: If customers do not find a program interesting, accessible and attractive, it will fail. This is
equally true for every type of smart meter enabled program. Customer segmentation offers utilities
and technology providers the opportunity to study which customer groups are reacting best and how
programs could be improved during rollout. This knowledge can then be used to create directed
marketing messages and educational material which have a direct and central impact on the number of
consumers who successfully engage with a program in a given market. Customer segmentation
techniques are improving, as the large CER pilot in Ireland attests, however this is still an under-
researched and underfunded area, and would require further research.
Section 4.6: page 36
Findings: Pilots which included customer education material performed better than those which did not.
However, almost all pilots that included education were of a higher overall quality and this may have
impacted the findings. Education seems to have a positive impact on both billing and pricing pilots. Billing
pilots with education were over 70% more effective than those without. TOU pilots without education
actually increased total energy consumption while TOU with education lowered total energy consumption
by 4% and improved peak consumption reductions as well. This in effect doubled the benefit of the TOU
pilot as they both lowered total consumption and peak consumption. Education material provided during
a pilot did not have a positive influence in IHD pilots. This may be due to the fact that IHDs are in
Participant education
Participant segmentation

67 2011 VaasaETT Empower Demand
themselves an effective form of education and extra printed material is not as important.
Conclusions: Education should be included within dynamic pricing programs, especially those involving
automation, as it helps to decrease total consumption rather than only peak consumption. Further
research should be carried out into the impact of education on pricing program development and
especially on the ability of one program type to educate and prepare consumers for more advanced
programs, involving for example electric vehicles or micro-generation. Further research should also be
performed on how to best educate various customer segments in order to maximize program results
across a wide range of consumers.
Section 4.7: page 44
Findings: This variable measured whether interaction between pilot organisers and participants in the
form of interviews, meetings and questionnaires improved results. In both pricing and feedback pilots,
where participant interaction was high, results were higher. However, more details are needed as to
what type of interaction works best, what type is most cost effective (it is hard to imagine utilities
organising meetings or interviews with all their customers) and when is it more effective.
Conclusions: Though interaction with consumers improves program results, it will not be a stimulus
which is 100% replicable during rollout. However the fact that interim interaction seems to improve
customer engagement should be studied further. It may encourage utilities to have an extra education
campaign or introduce new services after a program has already been launched. This could potentially
increase the cycle of learning and consumer interest.
Interaction with participants

68 2011 VaasaETT Empower Demand
Other variables specific to pricing or feedback pilots
Section 4.10: page 57
Findings: The inclusion of automation, whether it is controlled by participants or the utility, in a dynamic
pricing pilot can double or even quadruple the amount of load shifted. It also increases the amount
consumers save on their electricity bills.
Risk: Automation also increases the risk that total consumption increases (rather than decrease) in
combination with TOU, CPP and CPR programs as for instance the AC uses extra amount of electricity to
cool down the house once the peak period ends. This was successfully overcome in pilots that included
education and consumption feedback. It argues for the combination of feedback and automation and
points to the central role of technology contributing to consumer awareness. The larger the load which is
automated the more effective and cost effective is the automation. This is why AC units and electric
heating are effective sources of automation.
Conclusions: Automation is highly effective as a means of shifting or lowering load. Currently it can also be
difficult to pay for in low consumption markets. However this should change as the technology becomes
more affordable and/or the price of electricity increases. Automation designed to enable load shifting
should always be combined with education on how to lower total consumption in order to avoid increased
overall consumption levels which happened in a number of pricing pilots with automation.
Section 4.8: page 46
Findings: These findings were inconclusive but interesting. There seems to be a correlation between the
content of feedback (i.e. the messages provided) and the results. The most effective combination of
messages on an IHD was up-to-date consumption, historical feedback and current level of the bill. It also
seems that comparing consumption with neighbours was ineffective and perhaps had a negative impact
(this may be partially due to irrelevant comparisons between houses of differing sizes, ages, etc.).
Conclusion: If comparison to neighbours is made, the comparison should be directed and consumer
appropriate. It should be between houses of a similar size and age and the feedback message should be
avoided completely for households with below average consumption. Feedback content and consumption
reductions is an under researched area and should be explored further. It may mean that a lower priced
Automation
Feedback content

69 2011 VaasaETT Empower Demand
technology could produce higher results simply by refining the content of the feedback. This could have
important implications for smart meter enabled consumption reductions.
Findings: Dynamic pricing programs help consumers shift load during times of system strain. The rest of
the time, the household's electricity prices are slightly lower than average. It seems that this can
sometimes lead to households shifting peak load but actually consuming more electricity than they would
normally do. However when a pricing program is combined with feedback and education this tendency
seems to disappear and consumers tend to lower overall consumption as well as shift peak load. This is an
important finding. Feedback programs appear to have difficulty maintaining results as they get larger
which is not the case with pricing programs. Therefore, combining feedback with dynamic prices has the
potential to enhance the impact and uptake of program rollout.
Conclusion: The specific advantages of dynamic pricing and feedback seem to hold when the two are
combined. This should be explored further with large and robust European pilots which have yet to be
conducted. An increased number of large and robust pilots should be performed in Europe involving at
least 5,000 participants. In addition, pricing and feedback should be tested together. They seem to have a
mutually beneficial impact and help to engage larger populations in lowering overall consumption while at
the same time encouraging peak shifting.
5.2 Ideal roll out strategies for utilities
Ideal program structures are market specific and will depend on the requirements, regulatory structures and strategic goals of the utility. It would therefore be inappropriate to attempt to make a one-size-fits-all blue print of program best practice. With that being said, ten strategic points have emerged from the research.
1) Define "success": Before designing a program, a utility should decide exactly what success would
look like. Improved company image? Shave X % of peak load? Achieve XX amount of avoided investment. Demand side programs are tools appropriate for different aims and it is central to design the tool around the aim.
2) Creating a win/win situation through segmentation: After a utility begins to have a clear idea of their definition of success, for example, meet a government requirement to lower consumption, they need to match it with their customers’ needs and potential. The program must create a win/win situation through smart meter enabled programs. However, it is difficult to sell a product to a consumer who is not known. Therefore, it is important very early in the process to begin
Combining dynamic
pricing and feedback

70 2011 VaasaETT Empower Demand
thinking strategically about who are the utility’s customers and how they can contribute to the strategic requirements of the utility. This may lead to strategic program developments of a particular customer group or the development of several programs or products to allow customers to choose, thus reaching a wider population.
3) Mix and match consumer groups: Commercial and (small) industrial customers may be under-served although they have the best cost/benefit ratio for certain program types and may benefit most. It is possible to create programs for industrial and commercial customers or commercial and large residential customers such as lowering peak load through automation. Strategically directing smart metering programs at a cross cut of consumer groups is an under-explored area with a high potential.
4) Exploit segmentation in marketing: The same car can be advertised in different ways to attract different customers. For example, SEAS-NVE27 managed to accomplish this through their programme called “Meter Hunt”. The Danish Utility conducted segmentation research in their market and created four different advertising campaigns for one internet site. The work is highly successful.
5) Involve the media early on: Media response to a program will decide to a certain extent customer acceptance and engagement. Therefore, involving media during piloting is wise. It can potentially improve future marketing campaigns by helping the utility to hone marketing and education messages as well as avoid some future negative publicity.
6) Successful customer communication leads to successful programs: Positive messages, timely, directed, containing the appropriate information, combinations of information (bills, feedback displays), etc. all increase customer participation. They argue for using computing intelligence to offer consumers feedback at appropriate moments and content which is relevant to them. IHD’s have already shown good progress and the new mobile phone applications and use of other technologies hold good future potential.
7) Pricing should include education and feedback: Combinations of feedback and pricing programs strengthen the results of both. In this case more is more. Utilities could help increase responses and cost benefit in low consumption markets such as the UK, Denmark and Germany.
8) Be Cool - Remember the entire family and a range of consumer types: Whilst program design should be strategic and need not include the entire population, once a household is involved including the entire family and a range of consumer types is important. One reason ambient displays, such as coloured lights, may be effective is that everyone sees them and everyone can understand them. Many feedback and pricing program visuals are still designed to involve technically minded adults.
9) Be Cheap – get creative: It is not necessary to provide all services to all customers in a market if only a few will benefit and/or are willing to pay. However, it is good if costs can be hidden rather than upfront and obvious. Within dynamic pricing programs, utilities provide automation
27 Bisgaard (2011).

71 2011 VaasaETT Empower Demand
technology and then split the money from the resulting savings. In the end both the utility and the consumer win. Feedback displays may be “free” or paid off over an extended period of time. Sometime however, a utility will not rollout any programs at all because they will be too expensive for a significant portion of the population. This is often a strategic mistake.
10) Consumer growth and added services: Consumer knowledge when starting a program is low, however this changes and knowledge increases over time. What will be seen as too complicated one year will be appropriate the next. A key difference between piloting and rollouts is that rollouts do not end. If they are successful, they will continue. Utilities could make use of this by planning added services, which would capitalize on the increased knowledge of consumers, bringing them forward in a positive cycle of learning.
5.3 Recommendations for future work
When comparing a large group of pilots collected from many differing regions of the world and including a
wide range of variables, certain patterns are repeated and clarified. The findings of Empower Demand
demonstrate that technology provides an important but supportive function in creating a successful
demand side program. It is one of five factors which decide success. These are socioeconomic factors,
consumption patterns, program content/structure, supportive technology, and access to load sources28.
Socioeconomic factors and consumption patterns can overcome supportive technology and program type.
Informative billing has lowered consumption rates anywhere between 1% and 12%. Informative websites
have lowered consumption between 0.5% and 17%. It is not the website itself which create these shifts
and it is not the size of the pilot or longevity of the program. The 17% consumption reductions involved
55,000 households in Denmark over 3 years29. Our research has led us to conclude that the main difference
between pilot success and failure is the ability of the program designers to meet consumer needs through
the program. Meeting a need is the foundation of consumer engagement. The technology is a support. It
puts into question the current tendency to emphasise technological development over and above all other
factors in European pilot schemes while comparatively little funding is provided to studying the best
messages to deliver to consumers, their cycles of learning through program layering or the impact of
surrounding socioeconomic and cultural factors on program success.
Below are a few of the many areas of research which could be explored further:
Customer segmentation: European pilots tend to be small in comparison to their Australian, Japanese or American counterparts. More large pilots, involving between 4,000 and 5,000 participants should be conducted in Europe. The increased size and scope should be used to better understand customer segmentation and socioeconomic factors leading to improved marketing messages and program design.
Learning cycles’ impact: A large long lasting pilot could test the potential learning cycles of
28Accessible load sources are particularly important in dynamic pricing programs. 29 Bisgaard (2011).

72 2011 VaasaETT Empower Demand
consumers. This would mean that rather than offering one static program for the entire duration of the pilot, a group of participants would be brought through a cycle of programs starting with simple feedback and pricing and progressing towards becoming more sophisticated prosumers involved in electricity trading and smart grid activities. This would provide a more realistic understanding of the long-term potential of demand side participation in Europe.
Pricing pilots and feedback: Critical peak pricing is under-piloted in Europe. As peak consumption increases and wind intermittency creates large fluctuations with the wholesale market prices, dynamic pricing overall and critical peak pricing in particular will become more important. During these pilots, feedback and education should also be included to maximise the long-term influence of the pricing programs and encourage overall consumption reductions.
IHD analysis: The role of IHDs in reducing overall consumption has been well researched, however a deeper analysis concerning the messages and information provided on IHDs would allow for a more meaningful comparison of IHDs. The analysis should include consumer segmentation studies to verify and understand which socioeconomic factors influence consumer engagement through particular messages.
Opt-in vs. Opt-out: As governments are in the process of deciding what should be mandated for all consumers and what should be left to market development, additional research should be conducted regarding the effect that opt-in and opt-out program participation has on both dynamic pricing programs and feedback programs consumer engagement levels.
Education / feedback / interaction analysis: The importance of involving participants in both pure feedback and pricing pilots is not to be overlooked as they often make the difference between a successful and a failed pilot. Following this statement, research into what type of education material and feedback content and channel are most efficient as well as how to best keep participants motivated. The results would provide useful insights for the design of both future pilots and potential commercial offers by utilities. The research could be based on real life offerings and examples and results of pilots in terms of customer acceptance and preferences.
Move away from “Will consumers participate?” to “How do we maximise participation?” Empower Demand has reviewed 100 pilots. The selected pilots alone included 450,000 consumers but the resulting rollout from these pilots now includes over 4 million. Smart meter enabled programs are consistently effective when developed in accordance with the needs of end-consumers and enabled through constructive regulation. Research questions set limits around what it is possible to learn from a pilot - organisers will only get answers to the questions they ask. This is as much a limitation as it is a resource. It is essential to move forward in pilot development through innovative questions, taking into consideration the results of past pilots and comparative studies such as this one. Pilot organisers can now focus their research on better understanding who is in the market and what can be done to maximise their participation within that market’s reality. Smart meter enabled demand side programs successfully engage consumers in a wide range of market types and requirements. Long-term program success will require a holistic combination of marketing, technological support, directed communication and a constructive regulatory framework.

73 2011 VaasaETT Empower Demand
Sources & References Aalami, H., Moghaddam, P., Yousefi, G. (2010). Modeling and prioritizing demand response programs in power markets. Electric Power Systems Research. 80:4, 426-435. Alcott, H. (2009). Social norms and energy conservation. Journal of Public Economics. 95:9-10, 1082-1095. Allen, D., Janda, K. (2006). The Effects of Household Characteristics and Energy Use Consciousness on the Effectiveness of Real-Time Energy Use Feedback: A Pilot Study. ACEEE Summer Study on Energy Efficiency in Buildings. American Council for an Energy-Efficient Economy (1998). Graphical Displays and Comparative Energy Information: What do People Understand and Prefer? Anderson, W., White, V. (2009). Exploring consumer preferences for home energy display functionality. Report to the Energy Saving Trust. Arvola, A., Uutela, A., Antilla, U., (1993). Billing feedback as means to encourage household electricity conservation: A field experiment in Helsinki. Eceee 1993 summer study. 11-22. Aspen Systems Corporation (2005). Demand Response Enabling Technologies. Aubin, C., Fougere, D., Husson, E., Ivaldi, M. (1995): Real-Time Pricing of Electricity for Residential Customers: Econometric Analysis of an Experiment. Journal of Applied Econometrics. 10:Special Issue: The Microeconometrics of Dynamic Decision Making, 171-191. Ayres, I., Raseman, S., Shih, A. (2009). Evidence from Two Large Field Experiments that Peer Comparison Feedback can Reduce Residential Energy Usage. 5th Annual Conference on Empirical Legal Studies Paper. Baladi, S. M., Herriges, J. A., Sweeney, T. J. (1998). Residential response to voluntary time-of-use electricity rates. Resource and Energy Economics. 20, 225–244. Barbose, G., Goldman, C. (1995). A Survey of Utility Experience with Real Time Pricing. Battalio, R. C., Kagel, J. H., Winkler, R. C., Winett, R. A. (1979). Residential Electricity Demand: An Experimental Study. The Review of Economics and Statistics. 61:2, 180-189. Benders, R., Kok, R., Moll, H., Wiersma, G., Noorman, K. (2006). New Approaches for household energy conservation. Energy Policy. 34, 3612–3622. Bisgaard, B. (2011). SEAS-NVE-The Road to Customer Segmentation & Involvement. Presentation given on March 23rd. Boisvert, R, Cappers, P, Scott, B (1998). Industrial and Commercial Customer Response to Real Time Electricity Prices.

74 2011 VaasaETT Empower Demand
Borenstein, S., Jaske, M., Rosenfeld, A. (2002). Dynamic Pricing, Advanced Metering and Demand Response in Electricity Markets. Center for the Study of Energy Markets, University of California Energy Institute, UC Berkeley. Brandon, G., Lewis, A. (1999). Reducing household energy consumption: a qualitative and quantitative field study. Journal of Environmental Psychology. 19:1, 75-85. Carroll, E., Hatton, E., Brown, M. (2009). Residential Energy Use Behavior Change Pilot. Franklin Energy. Charles River Associates (2003). Impact Evaluation of the California Statewide Pricing Pilot- Final Report. Cialdini, R., Schultz, W. (2004). Understanding and Motivating Energy Conservation via social norms. Final report. William and Flora Hewlett Foundation. Commission for Energy Regulation (2011). Electricity Smart Metering Customer Behaviour Trials (CBT) Findings Report. Connecticut Light & Power Company (2009). Results of CL&P Plan-it wise Energy Pilot. Country Energy, Australian Institute of Energy (2006). The Country Energy Home Energy Efficiency Trial. Delivering real time information to residential customers. Presentation given in Lindfield, 5th June. Darby, S. (2006). The Effectiveness of Feedback on Energy Consumption. A review for DEFRA of the Literature on Metering, Billing and Direct Displays. University of Oxford: Environmental Change Institute. Demand Response Research Center (2008). Small Business Demand Response with communicating Thermostats: SMUD’s Summer Solutions Research Pilot. Demand Response Research Center (2000). Customer Response to RTP in Competitive Markets: A Study of Niagara Mohawk's Standard Offer Tariff. Dufty, G. (2008). Lessons learnt from Energy Australia’s Pricing Trials and issues for Victorian Consumers. St Vincent de Paul Society Victoria Inc. 1-11. Dulleck, U., Kaufmann, S. (2004). Do customer information programs reduce household electricity demand?—the Irish program. Energy Policy. 32, 1025–1032. Duke Power Company of North Carolina (1994). Industrial Response to Real-time prices: Short and long run. EFFLOCOM (2004). Energy efficiency and load curve impacts of commercial development in competitive markets. Results from the EFFLOCOM Pilots. 1-137.

75 2011 VaasaETT Empower Demand
Egan, C. (1999). Graphical Display and Comparative Energy Information: What Do People Understand and Prefer? Panels of the Eceee 1999 Summer Study. Egan, C., Kempton, W., Eide, A. (1996). How customers interpret and use comparative graphics of their energy use. American Council for an Energy-Efficient Economy. 8.39-8.45. Electric Power Research Institute (2009). Residential Electricity Use Feedback: A Research Synthesis and Economic Framework. Electric Power Research Institute (EPRI) (2005). Residential Electricity Use Feedback. EMeter Strategic Consulting (2010). PowerCents DC Program Final Report. Prepared for the Smart Meter Pilot Program, Inc. Energy Markets Inspectorate (2010). Review of the Swedish electricity and natural gas markets 2009. Ericson, T. (2006). Households' self-selection of a dynamic electricity tariff. Discussion Papers No. 446, Statistics Norway, Research Department. Ericson, T. (2006). Direct load control of residential water heaters. Discussion Papers No. 479, Statistics Norway, Research Department. Ericson, T. (2006). Time-differentiated pricing and direct load control of residential electricity consumption. Discussion Papers No. 461, Statistics Norway, Research Department. ESMA (2003). Control of small electricity demand with spot-market price signals. Faruqui, A. Sergici, S., The Brattle Group inc (2009). BGE’s Smart Energy Pricing Pilot Summer 2008 Impact Evaluation. Prepared for Baltimore Gas & Electric Company. Faruqui, A. Wood, L., The Brattle Group inc (2008). Impact of Dynamic Pricing On Low-income Customers, Quantifying the Benefits of Dynamic Pricing In the Mass Market. Prepared for Edison Electric Institute. Filippini, M. (1995). Electricity demand by time of use An application of the household AIDS model. Energy Economics. 17:3, 197-204. Fowler Energy Company, Frontier Associates (2009). Demand Response Pilot Project. Final Report. Prepared for the Center for Commercialization of Electric Technologies. Fry, T., Hinkle, R. (2004). Demand Response Program Design Preferences of Large Customers: Focus Group Results from Four States. Giraud, D. (2004). The tempo tariff, EDF. Presentation given at EFFLOCOM workshop in Trondheim Norway. 10 June. Giraud, D., Greiveldinger, C. (1993). Testing a new real-time tariff for the residential. Proceedings of the 12th International Conference on Electricity Distribution, CIRED. 5, 1-6.

76 2011 VaasaETT Empower Demand
Goldblatt, D, Hartmann, C, Durrenberger, G (2005).Combining interviewing and modeling for end-user energy conservation. Energy Policy. 33, 257–271. Goldman, C., Hopper, N., Sezgen, O., Moezzi, M., Bharvirkar, Neenan, B. (2001). Customer response to day-ahead wholesale market electricity prices: Case study of RTP program experience in New York. Goteborg Energy AB (2008). An analysis of a demand charge electricity grid tariff. Goldman, C., Hopper, N, Bharvirkar, R (1998). Customer strategies for responding to day-ahead market hourly pricing. Grande, O., Vognild, I., Wilberg, A. (2007). Market based Demand Response. End user involvement and experiences from Norwegian pilots. Proceedings from the 19th International Conference on Electricity Distribution Vienna, 21-24 May. Paper 0620. Grande, O., Sæle, H., Graabak, I. (2008). Market based Demand Response. Research project summary. SINTEF Energy Research, Trondheim, Norway. Grande, O., Sæle, H. (2007). Market based solution for increased flexibility in electricity consumption. SINTEF Energy Research, Trondheim, Norway. 1-6. Haakana, M., Sillanpää, L., Talsi, M. (1997). The Effect of Feedback and Focused Advice on Household Energy Consumption. Eceee 1997 Summer Study. Hamidi, V., Li, F., Robinson, F. (2009). Electric Power Systems Research. Electric Power Systems Research. 79, 1722–1726. Harrigan, M. S., Gregory, J. M. (1994). Do Savings from Energy Education persist? Alliance to Save Energy. Hartway, R., Price, S., Woo, C.K. (1999). Smart meter, customer choice and profitable time-of-use rate option. Energy. 24:10, 895–903. Hayes, S. C. C., Cone, J. D. D., (1977). Reducing residential electrical energy use: payments, information, and feedback. Journal of applied behavior analysis. 10:3, 425-435. Heberlein, T (1980). The influence of price and attitude on shifting residential electricity consumption from on-to-off-peak periods. Henley, A., Peirson, J. D. (1998). Residential energy demand and the interaction of price and temperature: British experimental evidence. Energy Economics. 20:2, 157-171. Hill, D. H., Ott, D. A., Taylor L. D., Walker J. M. (1983). Incentive Payments in Time-of-Day Electricity Pricing Experiments: The Arizona Experience. The Review of Economics and Statistics. 65:1, 59-65. Hirst, E. (2002). The Financial and Physical Insurance Benefits of Price-Responsive Demand. The Electricity Journal. 15:4, 66-73.

77 2011 VaasaETT Empower Demand
Hopper, N. ,Goldman, C., Bharvirkar, R., Neenan, B. (1998). Customer response to day-ahead market hourly pricing: Choices and performance. Hydro One Networks Inc. (2008). Time-of-Use Pricing Pilot Project Results. Hydro One Networks Inc. IBM Global Business Services, eMeter Strategic Consulting (2007). Ontario Energy Board Smart Price Pilot. Final Report. Prepared for the Ontario Energy Board. Idaho Power Company (2007). 2006 Time-of-day and energy watch pilot programs. Year two final report. Prepared for the Idaho Public Utilities Commission. Intelligent Energy Europe Programme (IEE), Association Maitrisez Votre Energy (MVE), (2009). Eco n’Home: Energy service for European households in the UK, Italy, Belgium, France, Portugal and Germany. Israel Electric Company (1990). The Response of Small and Medium-sized business companies to Time-of-use (TOU) electricity rates in Israel. Jensen, O., M. (2003). Visualisation turns down energy demand. ECEEE Summer study. Kallio, A. (1992). Research on Real-Time Pricing of Electricity. Proceedings of the Seventh International Conference on Metering Apparatus and Tariffs for Electricity Supply. 13-17. Koponen, P., Kärkkäinen, S., Farin, J., Pihala, H. (2006). Markkinahintasignaaleihin perustuva pienkuluttajien sähkönkäytön ohjaus. Loppuraportti [Control of small customer electricity demand with spot-market price signals. Final report]. Espoo 2006. VTT Tiedotteita – Research Notes 2362. 66 p. + app. 8 p. Kärkkäinen, S., Ikäheimo, J. (2000). Energy Efficiency & load curve impacts of commercial development in competitive markets. Lawrence Berkeley National Laboratory (2007). Auto-DR Assessment Study. Lawrence Berkeley National Laboratory (2006). Automated Critical Peak Pricing Field Tests: 2006 Pilot Program Description and Results. Lawrence Berkeley National Laboratory (2004). Findings from the 2004 Fully Automated Demand Response Tests in Large Facilities. Lawrence Berkeley National Laboratory (2003). Development and evaluation of fully automated Demand Response in Large facilities. Lutzenhiser, S., Peters, J., Moezzi, M., Woods, J. (2009). Beyond the Price Effect in Time-of-Use Programs: Results from a Municipal Utility Pilot, 2007-2008. Proceedings of the International Energy Program Evaluation Conference, Portland. August 12-14. Magnusson, M. (2007): Sustainable Energy Systems in Advanced Cities.
Magnusson, M. (2005). Demand side management in Valle Broar-Vaxjo.

78 2011 VaasaETT Empower Demand
Mansouri, I., Newborough, M. (1997): Dynamics of Energy Use in UK Households: End-use monitoring of Electric Cookers. Eceee 1999 Summer Study. 1-10. Matsukawa, I., Asano, H., Kakimoto, H. (2000). Household Response to Incentive Payments for Load Shifting: A Japanese Time-of-Day Electricity Pricing Experiment. The Energy Journal. 21:1, 73-96. McCalley, L., Midden, C. (2002). Energy conservation through product-integrated feedback: the roles of goal-setting and social orientation. Journal of Economic Psychology. 23, 589–603. McClelland, L., Cook, S. W. (1980). Promoting Energy Conservation in Master-Metered Apartments through Group Financial Incentives. Journal of Applied Social Psychology. 10:1, 20-31. Mountain, D., C. (2007). Real-Time Feedback and Residential Electricity Consumption: British Columbia and Newfoundland and Labrador Pilots. Economic Consulting and Associates Inc. Mountain, D. C., Lawson, E. L. (1995). Some initial evidence of Canadian responsiveness to time-of-use electricity rates: Detailed daily and monthly analysis. Resource and Energy Economics. 17, 189-212. Neenan Associates, Lawrence Berkeley National Laboratory, Pacific Northwest National Laboratory (2003). How and Why Customers Respond to Electricity Price Variability: A Study of NYISO and NYSERDA 2002 PRL Program Performance. Nemnich, D., Pengilly, P. (2008). Idaho Power Company Demand Response & Dynamic Pricing Programs. Presentation given at the PNDRP. December 5th. New Energy and Industrial Technology Development Organisation and Kyushu Electric Power Company (1996). The Benefits of Information on the Efficient Usage of Consumer Durables: Experimental Evidence. Nexus Energy Software, Opinion Dynamics Corporation, Primen (2005). Final Report. Information Display Pilot. California Statewide Pricing Pilot. Nordvik, H. (2000). Energy Efficiency & load curve impacts of commercial development in competitive markets. Norwegian Water Resources and Energy Directorate (2010). Report on regulation and the electricity market 2010. Ofgem (2009). Energy Demand Research Project. Report 2. Review of progress for period April 2008 – August 2008. Ontario Hydro (1991). Conservation Effect of Immediate Electricity Cost Feedback on Residential Consumption Behavior. Pacific Northwest National Laboratory (2007). Pacific Northwest Gridwise testbed Demonstration projects. Part 1 Olympic Peninsula Project. Prepared for the US Department of Energy.

79 2011 VaasaETT Empower Demand
Opinion Dynamics Corp (2003). California Statewide Pricing Pilot (SPP) Overview and results. Peters, J. S., Moezzi, M., Lutzenhiser, S., Woods, J., Dethman, L., Kunkle, R. (2009). PowerChoice Residential Customer Response to TOU Rates. California Energy Commission, PIER Energy Systems Integration / Buildings Program. Piette, M. A., Kiliccote, S. (2007). Summary of the 2006 automated demand response pilot. Proceedings from the International Conference for Enhanced Building Operations. Piette, M. A., Watson, D. S., Motegi, N., Kiliccote, S., Linkugel, E. (2005). Participation through Automation: Fully Automated Critical Peak Pricing in Commercial Buildings. Public Interest Energy Research Program (2006). Automating Demand Response: The Missing Link in the Electricity Value Chain. Riedy, C., Partridge, E. (2006). Study of Factors Influencing Electricity Use in Newington. Final Report. Institute for Sustainable Futures. Rocky Mountain Institute (2006). Automated Demand Response System Pilot. Final report. Volume 1. RWL Analytics (2004): AmerenUE. Residential TOU Pilot Study. Load Research Analysis. First Look Results. RWL Analytics (2004). Residential Time-Of-Use (RTOU) Pilot Study Load Research Analysis Report. Sauer, J., Schmeink, C., Wastell, W. (2007). Feedback quality and environmentally friendly use of domestic central heating systems. Ergonomics. 50:6, 795–813. Sernhed, K., Pyrko, J., Abaravicius, J., (2003). Bill me this way!-customer preferences regarding electricity bills in Sweden. ECEEE 2003 Summer study Sexton, R. J., Johnson, N. B., Konakayama, A. (1987). Consumer Response to Continuous-Display Electricity-Use Monitors in a Time- of-Use Pricing Experiment. The Journal of Consumer Research. 14:1, 55-62. Shippee, G, Gregory, W (1979). Public Commitment and Energy Conservation. Siero, F., Bakker, A., Dekker, G., Van Den Burg, M. (1996). Changing organizational energy consumption behavior through comparative feedback. SINTEF Energy Research (2005). Market based Demand Response Research Project Summary. Strombäck, J., Dromacque, C., Golubkina, D. (2010). Demand Response Pilot Comparison. VaasaETT Global Energy Think Tank, 2010 Report. Stokke, A. V., Doorman, G. L., Ericson, T. (2010). An analysis of a demand charge electricity grid tariff in the residential sector. Energy Efficiency. 3:267–282. Sulyma, I., Tiedemann, K., Pedersen, P., Rebman, M., Yu, M. (2008). Experimental Evidence: A Residential Time of Use Pilot. ACEEE Summer Study on Energy Efficiency in Buildings.

80 2011 VaasaETT Empower Demand
Summit Blue Consulting (2009). Impact Evaluation of Opower SMUD Pilot Study. Final report.
Summit Blue Consulting (2007). Final report for the Mypower pricing segments evaluation. Prepared for the Public Service Electric and Gas Company. Summit Blue Consulting (2007). Evaluation of the 2006 Energy-Smart Pricing Plan. Final Report. Prepared for CNT Energy. Summit Blue Consulting (2006). Evaluation of the 2005 Energy Smart Pricing Plan-Final Report. Prepared for Community Energy Cooperative. Sunderhauf S. (2009). National Town Meeting on Demand Response. Focus on Pepco’s Washington, DC Residential Smart Meter Pilot Program. Presentation given at the National Town Meeting. Washington, DC. July 14th. Sæle, H., Grande, O. (2011). Demand Response From Household Customers: Experiences From a Pilot Study in Norway. SINTEF Energy Research, Trondheim, Norway. 2:1, 102-109. Taylor, T., Schwarz, P., Cochell, J. (2001). 24/7 Hourly Response to Electricity Real-Time. Thorne, H., Strandbakken, P., Sto, E. (2006). Barriers, bottlenecks and potentials for energy savings in households. National Institute for Consumer Research, SIFO, Norway. Ueno, T., Inada, R., Saeki, O., Tsuji, K. (2006): Effectiveness of displaying energy consumption data in residential houses. Analysis on how the residents respond. ECEEE 2005 Summer study. Ueno, T., Sano, F., Saeki, O., Tsuji, K. (2006). Effectiveness of an energy-consumption information system on energy savings in residential houses based on monitored data. Applied Energy. 83, 166–183. Ueno, T., Inada, R., Saeki, O., Tsuji, K. (2006). Effectiveness of an energy-consumption information system for residential buildings. Applied Energy. 83, 868–883. Van Dam, S. S., Bakker, C. A., Van Hal, J. D. M. (2010). Home energy monitors: impact over the
medium-term. Building Research & Information. 38:5, 458–469.
Van Houwelingen, J. H., Van Raaij, W. F. (1989). The effect of goal-setting and daily electronic feedback on In-Home Energy Use. Journal of consumer research. 16, 98-105. Wilhite, H, Ling, R.(1995). Measured energy savings from a more informative energy bill. Energy and Buildings. 22,145-155. Winett, R. A., Kagel, J. H. (1984). Effects of Information Presentation Format on Resource Use in Field Studies. The Journal of Consumer Research. 11:2, 655-667.

81 2011 VaasaETT Empower Demand
Wolak, F. A. (2007). Residential Customer Response to Real-Time Pricing: The Anaheim Critical-Peak Pricing Experiment. UC Berkeley, Center for the Study of Energy Markets. Wood, G., Newborough, M. (2003). Dynamic energy-consumption indicators for domestic appliances: environment, behaviour and design Energy and Buildings. 35, 821–841.

82 2011 VaasaETT Empower Demand
Annex 1: Glossary of Terms
Ambient displays: Differ from IHDs in that they do not provide specific consumption information but rather signal to the customer messages about their general level of consumption and/or a change in electricity prices. Many ambient displays have the attributes of being attractive and intuitive which adds to their customer acceptance potential. Bill reduction: Extent to which the experiment led to a reduction in customers energy bills (in %). Critical Peak Pricing (CPP): CPP pricing schemes involve substantially increased electricity prices during times of heightened wholesale prices caused by heightened consumption (for example on very hot days) or when the stability of the system is threatened and black-outs may occur. In exchange for a lower tariff during non-peak hours (compared to customers on say flat tariffs), participants agree to have substantially higher tariffs during critical peak hours. The number and length of critical peak periods which the utility is allowed to call is often agreed upon in advance in order to lower participant risk. The periods when critical peaks occur depend on conditions in the market and cannot be decided in advance. Residential customers are usually notified the day before that the next day will be a critical day. Critical Peak Rebate (CPR): CPR pricing schemes are inverse forms of Critical Peak Pricing tariffs. Participants are paid for the amounts that they reduce consumption below their predicted consumption levels during critical peak hours. The number and length of critical peak periods which the utility is allowed to call is often agreed upon in advance in order to lower participant risk. The periods when critical peaks occur depend on conditions in the market and cannot be decided in advance. Residential customers are usually notified the day before that the next day will be a critical day. Customer, consumer, participants: Unless specified otherwise, these terms always refer to households. Data granularity: Level of details of the data provided. Do they give real time readings, every 15 minutes, every hour, and every day? Disaggregation of consumption: The household's electricity consumption is broken down as per household electrical appliances. The depth and degree of the breakdown can vary but in most cases the consumption of the oven, the fridge, the TV, and the lighting are measured. It helps participants see how much electricity individual appliances use and act upon it (and maybe buy more energy efficient ones). Energy conservation: Extent to which the experiment led to a reduction in overall energy consumption (in %). Environment (CO2 emissions): This shows the amount of CO2 the households emits due to electricity consumption. This presents the environmental costs or consequences of the households’ energy consumption. Historical comparison: Shows the household's current electricity consumption levels in comparison to pre-pilot consumption levels. Participants can know if they reduced or increased their consumption compared to the same period last year, for instance. Home Automation: Traditionally, homes have been wired for four systems: electrical power, telephones, TV outlets (cable or antenna), and a doorbell. With the invention of the electronic micro and auto controller and the widespread uptake of digital communication technology, the cost of electronic control

83 2011 VaasaETT Empower Demand
is falling rapidly and its uses are increasing. Through remote controllers in appliances, which can either communicate with each other and/or react to outside information, such as electricity pricing signals for example, the price responsiveness of a household will approximately double. This is called automation. In most pilots the automation are an AC or electric heating thermostat which is set to turn down or turn off during peak periods. However, automation systems can be more advanced and include lighting, appliances, and entertainment equipment. Residents can be informed when their equipment is malfunctioning or be able to turn it on and off remotely. Informative billing: Example of indirect feedback. They therefore do not accurately reflect the actual usage for a given month. The difference between the estimated average consumption and the actual usage is made up at the end of the billing period or when a resident changes electricity supplier. Informative billing will invoice for the actual consumption and provides either historical information comparing what the customer used this month to last month or to last year during the same period. The bill may also provide information on how much the household consumed in comparison to other dwellings of the same description. Unlike standard billing in which households receive their bill 4-6 times per year, informative bills can be sent as frequently as once per month. In-house displays (IHD): Displays which hang on the wall or sit on a counter and provide close to real time information about household electricity consumption. IHDs provide households with real-time and historical information on their electricity usage and costs. Additional feedback content that can be offered on the IHD are peer comparisons (showing the consumption rate of neighbours or consumers with similar conditions), and disaggregation of consumption (breaking down the energy usage of individual appliances in the home). Overall consumption reduction: Extent to which the experiment led to a reduction in overall energy consumption. Peak clipping: Extent to which the experiment led to a reduction in energy consumption during peak periods (in %). Peer comparison: Consist of comparison of household energy consumption levels between participants and similar-sized households. This information may include neighbours within near vicinities or households of similar size. It enables participants to see if they use more or less electricity than their peers. Price of electricity: Indicate the current price of electricity per kWh. This does not include the up-to-date electricity bill, only the current price of electricity per kWh. Real-Time Pricing (RTP): The price paid by participants is tied to the price of electricity on the wholesale market. However they do not lead to consumption reductions without feedback. Even then customers will sometimes tire of checking a price that only changes slightly from day to day. In order to encourage reductions during high price periods and reduce risk of high bill, participants are warned when wholesale prices reach a certain threshold decided upon in advance. Savings compared to previous periods: Compares the energy savings of households to previous periods. Households would have a certain target for their energy consumptions which would be a percentage savings on previous energy consumptions. Time-of-Use (TOU): TOU tariffs induce people into using electricity during times when consumption is lower. Prices are therefore set higher during high consumption periods, typically during working hours, and lower during the rest of the day. TOU usually includes one long peak daily period or two shorter

84 2011 VaasaETT Empower Demand
daily peak periods. TOU can have two level of prices (peak and off- peak prices) or three (peak, partial peak and off-peak prices) per day. The peak hours are known in advance by the customers. The prices may also vary according to the season. Up-to-date consumption level: Presents the current up-to-date consumption level of the household in kWh. In itself, it does not include the cost of electricity, or the current level of the bill. However, if coupled with consumption goals or targets not to exceed, it can be a powerful incentive to reduce consumption. Up-to-date Cost (bill): Presents the up-to-date bill which enables households to gauge their current costs for their electricity and act upon it. Websites: Offer an alternative way to provide the consumer with information about their electricity consumption. Websites are chosen as a means of providing feedback because they are relatively cheap. They rely on smart meters to collect the necessary consumption data and therefore the granularity of data provided to consumers depends largely on how often the meters are read or how often the information is transferred from the meter to the utility (or retailer).

85 2011 VaasaETT Empower Demand
Annex 2a: Fridge magnet showing different time bands
Source: Electricity Smart Metering Customer Behaviour Findings Report, CER (2011)

86 2011 VaasaETT Empower Demand
Annex 2b: Electricity conservation and trial guide brochure

87 2011 VaasaETT Empower Demand
Source: Electricity Smart Metering Customer Behaviour Findings Report, CER (2011)
88 2011 VaasaETT Empower Demand
About the VaasaETT Global Energy Think Tank
The VaasaETT Global Energy Think-Tank is a unique and
independent collaborative concept based on the
philosophy of mutuality. Through its network of thousands
of senior executives, officials, researchers and other
experts who are for the most part known and trusted
personally, the Think-Tank provides value-to-all by
combining an interactive Community and Collaborative
Projects. The Think-Tank focuses broadly on practical strategic business and market issues, as
well as envisioning state of the art innovations and developments. The VaasaETT Global Energy
Think Tank brings together utilities, authorities, universities, NGOs and other players in the
energy industry. More Information at www.vaasaett.com
The VaasaETT Global Energy Think-Tank offers knowledge sharing through its extensive online
knowledge centre, unique data sharing through various projects such as the Household Energy
Price Index for Europe and the Utility Customer Switching Research Project, networking
integration through its intimate high level events, the VaasaETT Community and world leading
round-tables and coalitions such as the Smart Energy Demand Coalition based in Brussels.

89 2011 VaasaETT Empower Demand
The VaasaETT Global Energy Think-Tank also publishes an array of free reports, on its own or in
partnership with other organizations such as Capgemini, and its collaborative projects such as the
renowned Respond 2010 smart metering and demand response project, and incorporating the
best partner organizations and experts that the world has to offer.
This knowledge sharing, best practice identification and collaboration ultimately leads to
outstandingly innovative strategies, solutions, methodologies, and tools and visions such as the
Utility Churn Radar, which is the most advanced loyalty/disloyalty prediction tool available in the
energy utilities market. It has been developed through 14 years of research and collaboration in
over 35 liberalized energy markets around the globe.
“We are particularly impressed with VaasaETT’s in-depth knowledge and
understanding of consumer related issues in European energy markets, the degree of
professionalism VaasaETT has shown and the attention to detail they demonstrated.
…We can highly recommend VaasaETT Global Energy Think Tank.”
Walter Boltz, Director General, E-Control (Austrian Energy Regulator)

90 2011 VaasaETT Empower Demand
About ESMIG
The European Smart Metering Industry Group (ESMIG) is the European industry association that provides
knowledge and expertise on Smart Metering and related communications at a European level. ESMIG's
members are the leading companies in the European Smart Metering Market: meter manufacturers, IT
companies and system integrators. ESMIG covers all aspects of Smart Metering, including electricity, gas,
water and heat measurement. Member companies cover the entire value chain from meter manufacturing,
software, installation and consulting to communications and system integration. By giving support to
European Union Institutions, Member States and Standardisation Organisations, the industry group aims to
assist in the development of national and European-wide introduction, roll-out and management of Smart
Metering solutions.
###
For further information contact:
ESMIG Secretariat
Phone: +32 2 7068257, Fax: +32 2 7068250
Email: [email protected]
European Smart Metering Industry Group
Boulevard A. Reyers 80, 1030 Brussels, Belgium
www.esmig.eu

91 2011 VaasaETT Empower Demand
Team and Authors
Project coordination
Jessica Stromback Office: +358 (0)92 516 6257 Mobile +358 (0)44 906 6821 [email protected]
Dynamic pricing and Feedback insights
Christophe Dromacque Office: +358 (0)9 2516 6257 Mobile: +358 (0)4 4906 6822 [email protected]
Mazin H. Yassin Office: +358 (0)9 2516 6257 Mobile: +358 (0)4 4906 6824 [email protected]
Contact us
VaasaETT Global Energy Think Tank Mannerheimintie 12 B, 5th Floor 00100 Helsinki Finland Office: +358 (0)9 2516 6257 www.vaasaett.com