the-pharmaceutical-industry-in-figures-2022.pdf - efpia
TRANSCRIPT
www.efpia.eu
The Pharmaceutical Industry in FiguresKey Data 2022
EFPIA Key Data | 2022
2
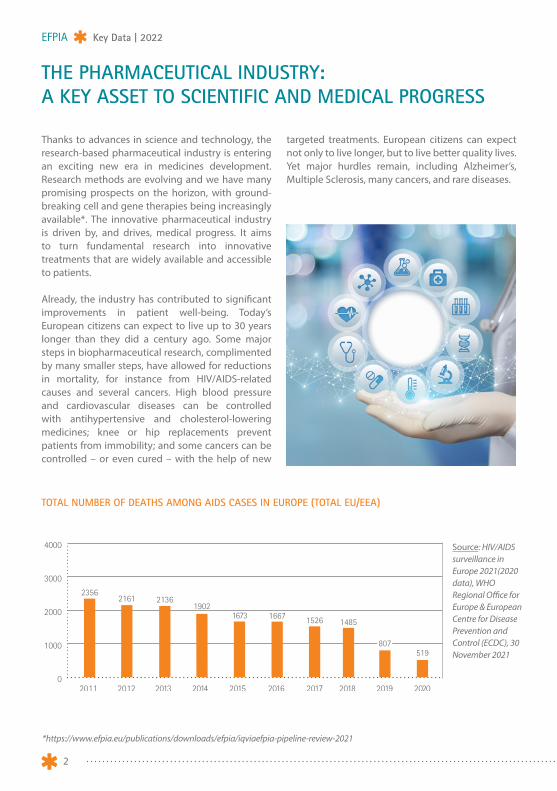
Thanks to advances in science and technology, the research-based pharmaceutical industry is entering an exciting new era in medicines development. Research methods are evolving and we have many promising prospects on the horizon, with ground-breaking cell and gene therapies being increasingly available*. The innovative pharmaceutical industry is driven by, and drives, medical progress. It aims to turn fundamental research into innovative treatments that are widely available and accessible to patients.
Already, the industry has contributed to significant improvements in patient well-being. Today’s European citizens can expect to live up to 30 years longer than they did a century ago. Some major steps in biopharmaceutical research, complimented by many smaller steps, have allowed for reductions in mortality, for instance from HIV/AIDS-related causes and several cancers. High blood pressure and cardiovascular diseases can be controlled with antihypertensive and cholesterol-lowering medicines; knee or hip replacements prevent patients from immobility; and some cancers can be controlled – or even cured – with the help of new
targeted treatments. European citizens can expect not only to live longer, but to live better quality lives. Yet major hurdles remain, including Alzheimer’s, Multiple Sclerosis, many cancers, and rare diseases.
THE PHARMACEUTICAL INDUSTRY: A KEY ASSET TO SCIENTIFIC AND MEDICAL PROGRESS
Source: HIV/AIDS surveillance in Europe 2021(2020 data), WHO Regional Office for Europe & European Centre for Disease Prevention and Control (ECDC), 30 November 2021
*https://www.efpia.eu/publications/downloads/efpia/iqviaefpia-pipeline-review-2021
TOTAL NUMBER OF DEATHS AMONG AIDS CASES IN EUROPE (TOTAL EU/EEA)
0
1000
2000
3000
4000
2020
519
2011 2012 2013 2014 2015 2016 2017
23562161 2136
19021673 1667 1526
2018
1485
2019
807
3
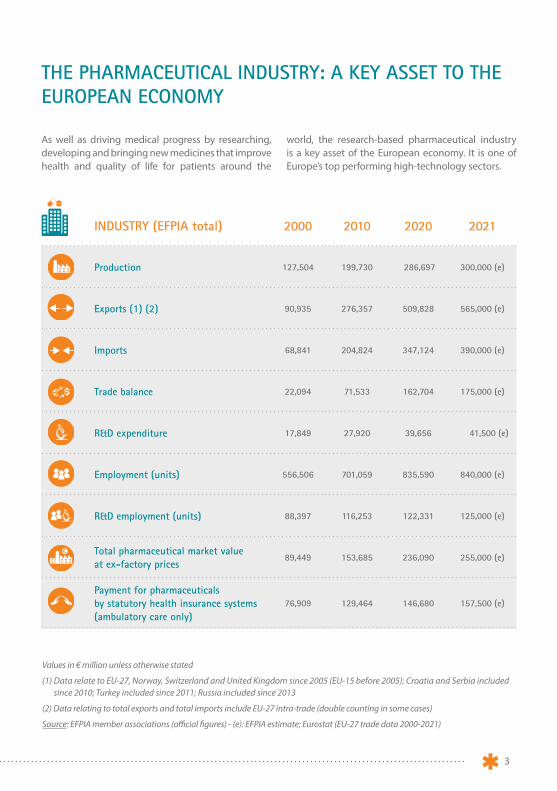
INDUSTRY (EFPIA total) 2000 2010 2020 2021
Production 127,504 199,730 286,697 300,000 (e)
Exports (1) (2) 90,935 276,357 509,828 565,000 (e)
Imports 68,841 204,824 347,124 390,000 (e)
Trade balance 22,094 71,533 162,704 175,000 (e)
R&D expenditure 17,849 27,920 39,656 41,500 (e)
Employment (units) 556,506 701,059 835,590 840,000 (e)
R&D employment (units) 88,397 116,253 122,331 125,000 (e)
Total pharmaceutical market value at ex-factory prices
89,449 153,685 236,090 255,000 (e)
Payment for pharmaceuticals by statutory health insurance systems (ambulatory care only)
76,909 129,464 146,680 157,500 (e)
THE PHARMACEUTICAL INDUSTRY: A KEY ASSET TO THE EUROPEAN ECONOMY
As well as driving medical progress by researching, developing and bringing new medicines that improve health and quality of life for patients around the
world, the research-based pharmaceutical industry is a key asset of the European economy. It is one of Europe’s top performing high-technology sectors.
Values in € million unless otherwise stated
(1) Data relate to EU-27, Norway, Switzerland and United Kingdom since 2005 (EU-15 before 2005); Croatia and Serbia included since 2010; Turkey included since 2011; Russia included since 2013
(2) Data relating to total exports and total imports include EU-27 intra-trade (double counting in some cases)
Source: EFPIA member associations (official figures) - (e): EFPIA estimate; Eurostat (EU-27 trade data 2000-2021)
EFPIA Key Data | 2022
4
64.4%
9.6%
6.0%
Pharmerging
Japan
Rest ofthe World
USA
3.2%
16.8 %Europe(Top 5)
MAIN TRENDS
The research-based pharmaceutical industry can play a critical role in restoring Europe to growth and ensuring future competitiveness in an advancing global economy. In 2021 it invested an estimated € 41,500 million in R&D in Europe. It directly employs some 840,000 people and generates about three times more employment indirectly – upstream and downstream – than it does directly (PwC, Economic and societal footprint of the pharmaceutical industry in Europe, June 2019). However, the sector faces real challenges. Besides the additional regulatory hurdles and escalating R&D costs, the sector has been severely hit by the impact of fiscal austerity measures introduced by governments across much of Europe since 2010.
There is rapid growth in the market and research environment in emerging economies such as Brazil, China and India, leading to a gradual migration of economic and research activities from Europe to these fast-growing markets.
During the period 2016-2021 the Brazilian, Chinese and Indian markets grew by 11.7%, 6.7% and 11.8% respectively compared to an average market growth of 5.8% for the top 5 European Union markets and 5.6% for the US market (source: IQVIA MIDAS, May 2022).
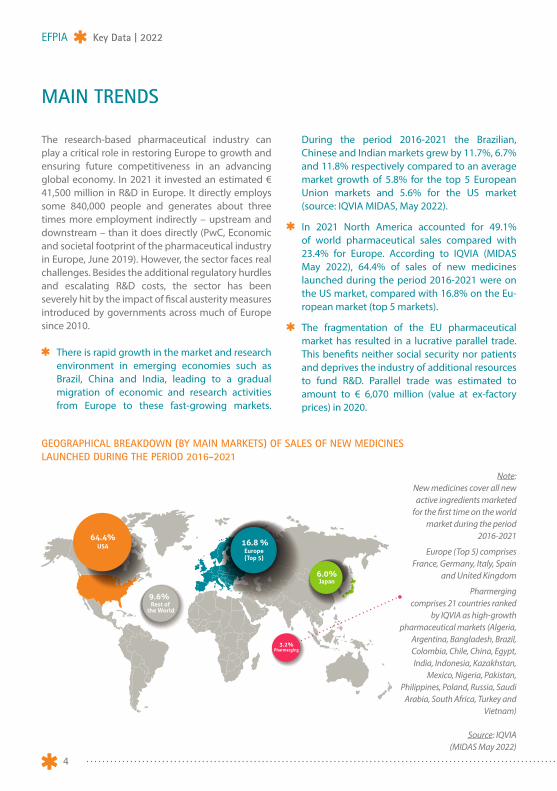
In 2021 North America accounted for 49.1% of world pharmaceutical sales compared with 23.4% for Europe. According to IQVIA (MIDAS May 2022), 64.4% of sales of new medicines launched during the period 2016-2021 were on the US market, compared with 16.8% on the Eu-ropean market (top 5 markets).
The fragmentation of the EU pharmaceutical market has resulted in a lucrative parallel trade. This benefits neither social security nor patients and deprives the industry of additional resources to fund R&D. Parallel trade was estimated to amount to € 6,070 million (value at ex-factory prices) in 2020.
GEOGRAPHICAL BREAKDOWN (BY MAIN MARKETS) OF SALES OF NEW MEDICINES LAUNCHED DURING THE PERIOD 2016-2021
Note: New medicines cover all new active ingredients marketed
for the first time on the world market during the period
2016-2021
Europe (Top 5) comprises France, Germany, Italy, Spain
and United Kingdom
Pharmerging comprises 21 countries ranked
by IQVIA as high-growth pharmaceutical markets (Algeria,
Argentina, Bangladesh, Brazil, Colombia, Chile, China, Egypt, India, Indonesia, Kazakhstan,
Mexico, Nigeria, Pakistan, Philippines, Poland, Russia, Saudi
Arabia, South Africa, Turkey and Vietnam)
Source: IQVIA (MIDAS May 2022)

5
PHARMACEUTICAL R&D EXPENDITURE IN EUROPE, USA, JAPAN AND CHINA(MILLION OF NATIONAL CURRENCY UNITS*), 1990-2020
* Note: € million; USA: $ million; Japan: ¥ million x 100 ; China : Yuan million (**2001 year)
Source: EFPIA member associations, PhRMA, JPMA, China Statistical Yearbook
SHARE OF PARALLEL IMPORTS IN PHARMACY MARKET SALES (%) – 2020
Note: U.K.: in % of pharmacy market sales at reimbursement pricesSource: EFPIA member associations (estimate)
0,000
10,000
20,000
30,000
40,000
50,000
60,000
70,000
80,000
Japan
USA
China
Europe
201020001990
17,8
49
27,9
20
40,6
88
12,7
60
21,3
64
7,46
2
2019
13,3
92
37,8
80
64,3
57
2020
13,2
16
39,6
56
72,4
12 78,4
60
60,9
56
12,2
63
1,92
5**7,76
6
6,80
3
5,16
1
Europe USA Japan China
0
2
4
6
8
10
12
14
16
18
20
22
24
26
28
U.K.SwedenPolandNetherlandsIrelandDenmarkBelgiumAustria Germany
8.3
6.2
Finland
4.2 3.5 2.8
7.5
1.7
10.9
9.1
26.9
EFPIA Key Data | 2022
6
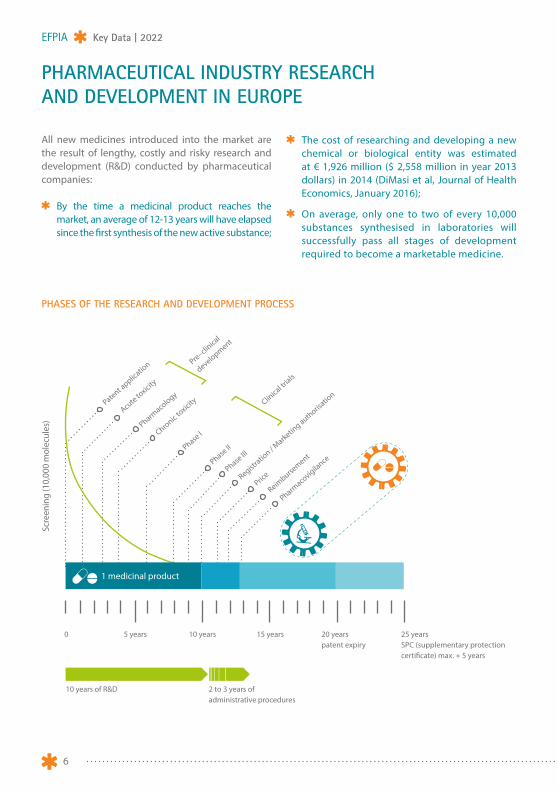
PHARMACEUTICAL INDUSTRY RESEARCH AND DEVELOPMENT IN EUROPE
All new medicines introduced into the market are the result of lengthy, costly and risky research and development (R&D) conducted by pharmaceutical companies:
By the time a medicinal product reaches the market, an average of 12-13 years will have elapsed since the first synthesis of the new active substance;
The cost of researching and developing a new chemical or biological entity was estimated at € 1,926 million ($ 2,558 million in year 2013 dollars) in 2014 (DiMasi et al, Journal of Health Economics, January 2016);
On average, only one to two of every 10,000 substances synthesised in laboratories will successfully pass all stages of development required to become a marketable medicine.
PHASES OF THE RESEARCH AND DEVELOPMENT PROCESS
Scre
enin
g (1
0,00
0 m
olec
ules
)
0 5 years
Patent applic
ation Pre–clin
ical
development
Clinical tr
ials
Acute toxicity
Pharmacology
Chronic toxicity
Phase I
Phase II
Phase III
Price
Reimburse
ment
Pharmacovigila
nce
Registratio
n / Marketin
g authorisatio
n
10 years
10 years of R&D 2 to 3 years of administrative procedures
15 years 20 years patent expiry
25 years SPC (supplementary protection certificate) max. + 5 years
1 medicinal product
7
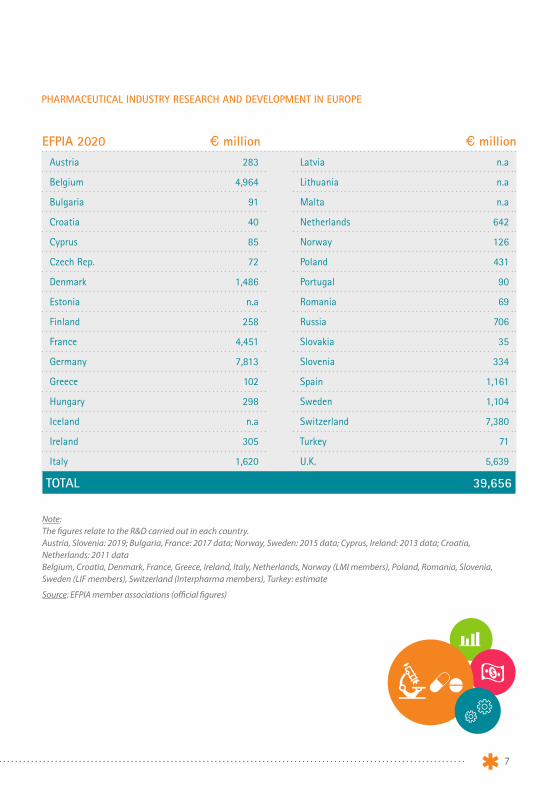
PHARMACEUTICAL INDUSTRY RESEARCH AND DEVELOPMENT IN EUROPE
EFPIA 2020 € million € millionAustria 283
Belgium 4,964
Bulgaria 91
Croatia 40
Cyprus 85
Czech Rep. 72
Denmark 1,486
Estonia n.a
Finland 258
France 4,451
Germany 7,813
Greece 102
Hungary 298
Iceland n.a
Ireland 305
Italy 1,620
Latvia n.a
Lithuania n.a
Malta n.a
Netherlands 642
Norway 126
Poland 431
Portugal 90
Romania 69
Russia 706
Slovakia 35
Slovenia 334
Spain 1,161
Sweden 1,104
Switzerland 7,380
Turkey 71
U.K. 5,639
TOTAL 39,656
Note: The figures relate to the R&D carried out in each country.Austria, Slovenia: 2019; Bulgaria, France: 2017 data; Norway, Sweden: 2015 data; Cyprus, Ireland: 2013 data; Croatia, Netherlands: 2011 dataBelgium, Croatia, Denmark, France, Greece, Ireland, Italy, Netherlands, Norway (LMI members), Poland, Romania, Slovenia, Sweden (LIF members), Switzerland (Interpharma members), Turkey: estimate
Source: EFPIA member associations (official figures)
EFPIA Key Data | 2022
8
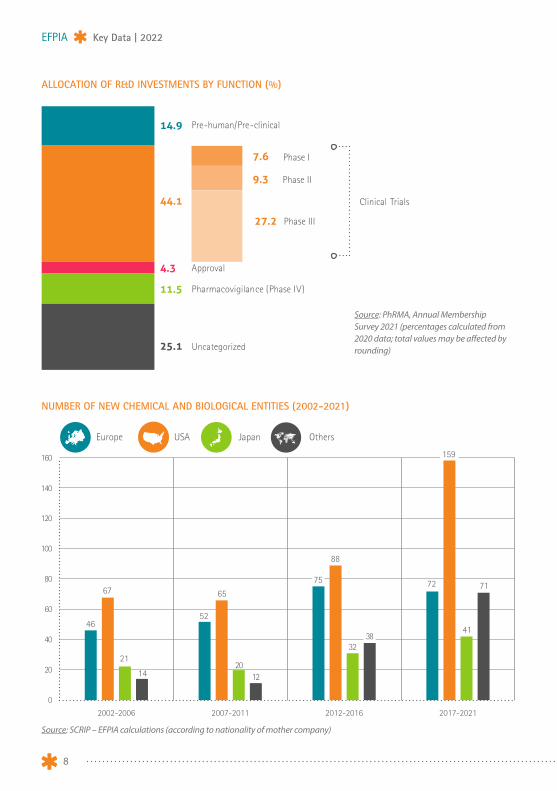
Allocation of R&D investments by function (%)
14.9
44.1
25.1
4.3
11.5
Pre-human/Pre-clinical
Approval
Pharmacovigilance (Phase IV)
Uncategorized
7.6
9.3
27.2
Phase I
Phase II
Phase III
Clinical Trials
Europe USA Japan Others
0
20
40
60
80
100
120
140
160
Others
Japan
USA
Europe
2017-20212012-20162007-20112002-2006
4652
65
1220
72
41
71
88
32
67
21
14
75
38
159
Source: PhRMA, Annual Membership Survey 2021 (percentages calculated from 2020 data; total values may be affected by rounding)
Source: SCRIP – EFPIA calculations (according to nationality of mother company)
ALLOCATION OF R&D INVESTMENTS BY FUNCTION (%)
NUMBER OF NEW CHEMICAL AND BIOLOGICAL ENTITIES (2002-2021)

9
Europe
USA
0
5
10
15
20
25
30
35
2017-20212012-20162007-2011
1.8 China3.1
33.3
3.1
7.7
18.6
4.0
8.5
12.9
IMPORTANCE OF PHARMACEUTICAL R&D
In 2020 the pharmaceutical industry invested more than € 39,600 million in R&D in Europe. A decade of strong US market dominance led to a significant shift of economic and research activity towards the US during the period 1995-2005, a trend that has been exacerbating since 2015. Additionally, Europe is now facing increasing competition from emerging economies: rapid growth in the market and research environments in countries such as China and Korea are contributing to the move of economic and research activities to non-European markets. In 2021 China nearly equalled Europe as originator of new active substances launched for the first time on the world market, with respectively 18 and 19 new substances, far behind the US leading with 35 on a total of 95. The geographical balance of the pharmaceutical market – and ultimately the R&D base – is likely to shift gradually towards fast-growing emerging economies.
ESTIMATED FULL COST OF BRINGING A NEW CHEMICAL OR BIOLOGICAL ENTITY TO MARKET ($ MILLION - YEAR 2013 $)
Source: Joseph. A. DiMasi, Henry G. Grabowski, Ronald W.Hansen, Innovation in the pharmaceutical industry: New estimates of R&D costs, Journal of Health Economics, 47 (2016), 20-33
Note: USA, China: data relating to period 2017-2020Source : EFPIA, PhRMA, China Statistical Yearbook 2002-2021
01970 -early 1980s
100
200
300
400
500
600
700
800
900
1,000
1,100
1,200
1,300
1,400
1,500
1980 -early 1990s
1990 -mid 2000s
2000s -mid 2010s
179
413
1,044
2,558
1,600
1,700
1,800
1,900
2,000
2,100
2,200
2,300
2,400
2,500
2,600
PHARMACEUTICAL R&D EXPENDITURE – ANNUAL GROWTH RATE (%)

EFPIA Key Data | 2022
10
RANKING OF INDUSTRIAL SECTORS BY OVERALL SECTOR R&D INTENSITY (R&D AS PERCENTAGE OF NET SALES – 2020)
According to EUROSTAT data, the pharmaceutical industry is the high technology sector with the highest added value per person employed, significantly higher than the average value for high-tech and manufacturing industries. The pharmaceutical industry is also the sector with the highest ratio of R&D investment to net sales.
According to the 2021 EU Industrial R&D Investment Scoreboard, health industries invested about €188.7 billion in R&D in 2020, accounting for 20.8% of total business R&D expenditure worldwide.
0 2 4 6 8 10 12 14 16
12.4%
8.7%
7.4%
5%
4.8%
4.0%
2.5%
2.4%
2.1%
0.7%
ICT services
Health Industries
Aerospace & defence
Total
Others
2.8%
Construction
Energy
Automobiles & other transports
Financial
Industrials
ICT products
2.7%Chemicals
Note: Data relate to the top 2,500 companies with registered offices in the EU-27 (401), Japan (293), the US (779), China (597) and the Rest of the World (430), ranked by total worldwide R&D investment (with investment in R&D above € 36.5 million).Companies are distributed by main sector according to the International Classification Benchmark (ICB); health industries include biotechnology, health providers, medical equipment, medical supplies and pharmaceuticals.
Source: The 2021 EU Industrial R&D Investment Scoreboard, European Commission - Joint Research Centre

11
PHARMACEUTICAL PRODUCTION
EFPIA 2020 € million € millionAustria 1,434
Belgium 20,245
Bulgaria 121
Croatia 451
Cyprus 253
Czech Rep. 880
Denmark 15,727
Estonia n.a
Finland 1,895
France 23,558
Germany 32,350
Greece 1,653
Hungary 3,422
Iceland 89
Ireland 19,305
Italy 34,300
Latvia 255
Lithuania n.a
Malta n.a
Netherlands 6,180
Norway 1,432
Poland 2,343
Portugal 1,857
Romania 655
Russia 6,459
Slovakia 356
Slovenia 2,546
Spain 16,246
Sweden 10,670
Switzerland 53,195
Turkey 3,497
U.K. 25,323
TOTAL 286,697
Note: All data based on SITC 54Spain, U.K.: 2019 data; Cyprus: 2018 data; Slovakia, Norway: 2017 data; Iceland: 2016 data; Bulgaria: 2015 data; Ireland: 2014 data; Romania: 2013 data; Netherlands: 2010 dataCroatia, Denmark, France, Ireland, Italy, Netherlands, Norway, Portugal, Slovakia, Slovenia, Spain, Sweden, Switzerland: estimateBulgaria, Croatia, Cyprus, France, Hungary, Ireland, Latvia, Norway, Poland, Portugal, Romania, Slovenia: veterinary products excluded
Source: EFPIA member associations (official figures) Graph 13 - à remplir
Austria
€ million
453Belgium
Austria
Belgium2,493
€ million
453
2,493
216,928TOTAL
Efpia 2 013
PHARMACEUTICAL PRODUCTION

EFPIA Key Data | 2022
12
EMPLOYMENT IN THE PHARMACEUTICAL INDUSTRY
The research-based pharmaceutical industry is one of Europe’s major high-technology industrial employers. Recent studies in some countries showed that the research-based pharmaceutical industry generates about three times more employment indirectly – upstream and downstream – than it does directly (PwC, Economic and societal
footprint of the pharmaceutical industry in Europe, June 2019). Furthermore, a significant proportion of these are valuable skilled jobs, for instance in the fields of academia or clinical science, which can help maintain a high-level knowledge base and prevent a European “brain drain”.
EFPIA 2020 Units UnitsAustria 16,335
Belgium 40,464
Bulgaria 15,500
Croatia 5,987
Cyprus 1,755
Czech Rep. 18,000
Denmark 25,686
Estonia 380
Finland 6,178
France 99,310
Germany 115,519
Greece 26,500
Hungary 28,300
Iceland 500
Ireland 42,000
Italy 66,400
Latvia 2,232
Lithuania 1,220
Malta 1,033
Netherlands 20,000
Norway 4,500
Poland 16,121
Portugal 9,100
Romania 35,000
Russia n.a
Slovakia 2,287
Slovenia 11,969
Spain 48,867
Sweden 13,156
Switzerland 47,000
Turkey 42,291
U.K. 72,000
TOTAL 835,590
Note: Austria, Spain: 2019 data; Cyprus, Latvia, Malta: 2018 data; Slovakia: 2017 data; Estonia: 2016 data; Lithuania: 2013 dataBelgium, Bulgaria, Croatia, Estonia, France, Ireland, Italy, Netherlands, Norway, Poland, Portugal, Romania, Slovenia, Sweden, Switzerland, Turkey, United Kingdom: estimate
Source: EFPIA member associations (official figures)

13
Note: Data includes Iceland (since 2017), Croatia, Lithuania and Turkey (since 2010), Bulgaria, Estonia and Hungary (since 2009), Czech Republic (since 2008), Cyprus (since 2007), Latvia, Romania & Slovakia (since 2005), Malta, Poland and Slovenia (since 2004)
Source: EFPIA member associations (official figures) - (e): EFPIA estimate
Note: Data includes Iceland (since 2017), Greece & Lithuania (since 2013), Bulgaria and Turkey (since 2012), Poland (since 2010), Czech Republic, Estonia and Hungary (since 2009), Romania (since 2005) and Slovenia (since 2004) Croatia, Cyprus, Latvia, Malta, Russia, Serbia, Slovakia: data not available
Source: EFPIA member associations - (e): EFPIA estimate
EMPLOYMENT IN THE PHARMACEUTICAL INDUSTRY (1990-2021)
EMPLOYMENT IN PHARMACEUTICAL R&D (1990-2021)
2020
2015
2021
2010
2005
2000
1995
1990
100,0000 200,000 300,000 400,000 500,000 600,000 700,000 800,000
500,879
499,482
556,506
636,684
701,059
746,873
835,590
840,000 (e)
2020
2015
2010
2005
2000
1995
1990
20,0000 40,000 60,000 80,000 100,000 120,000
76,126
82,618
88,397
100,636
116,253
113,163
122,331
2021 125,000 (e)
EFPIA Key Data | 2022
14
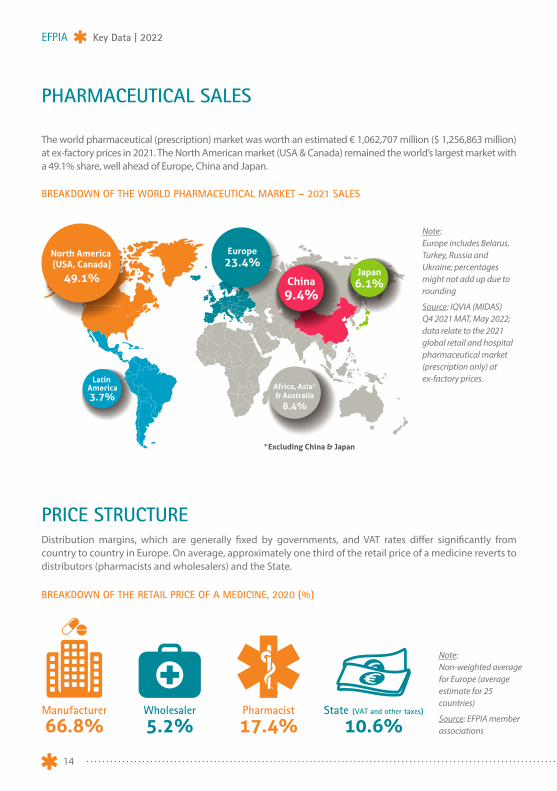
PHARMACEUTICAL SALES
PRICE STRUCTURE
The world pharmaceutical (prescription) market was worth an estimated € 1,062,707 million ($ 1,256,863 million) at ex-factory prices in 2021. The North American market (USA & Canada) remained the world’s largest market with a 49.1% share, well ahead of Europe, China and Japan.
Distribution margins, which are generally fixed by governments, and VAT rates differ significantly from country to country in Europe. On average, approximately one third of the retail price of a medicine reverts to distributors (pharmacists and wholesalers) and the State.
Note: Europe includes Belarus, Turkey, Russia and Ukraine; percentages might not add up due to rounding
Source: IQVIA (MIDAS) Q4 2021 MAT, May 2022; data relate to the 2021 global retail and hospital pharmaceutical market (prescription only) at ex-factory prices.
Note: Non-weighted average for Europe (average estimate for 25 countries)
Source: EFPIA member associations
BREAKDOWN OF THE WORLD PHARMACEUTICAL MARKET – 2021 SALES
BREAKDOWN OF THE RETAIL PRICE OF A MEDICINE, 2020 (%)
66.8%Manufacturer
17.4%Pharmacist
5.2%Wholesaler
10.6%State (VAT and other taxes)
North America (USA, Canada)
Europe
49.1%23.4%
Japan6.1%China
9.4%
Africa, Asia*& Australia
* Excluding China & Japan
8.4%3.7%
AmericaLatin
15
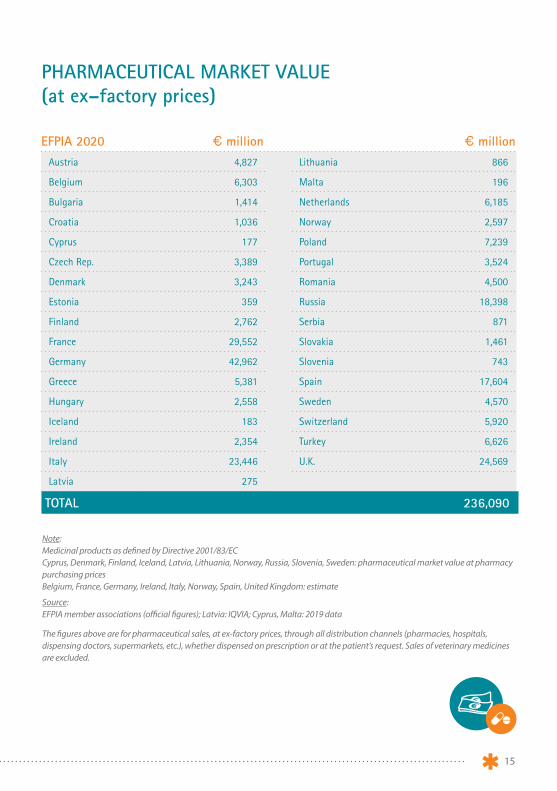
PHARMACEUTICAL MARKET VALUE(at ex–factory prices)
Graph 17
Graph 18
Breakdown of the world pharmaceutical market – 2014 sales
Breakdown of the retail price of a medicine, 2013 (%)
North America (USA, Canada)
North America (USA, Canada)
Europe
44.5%25.3%
Japan8.9%
Latin America4.7%
66.1%Manufacturer
19.2%Pharmacist
4.9%Wholesaler
9.8%State (VAT and other taxes)
Africa, Asia &Australia
* Excluding Japan
16.6%
EFPIA 2020 € million € millionAustria 4,827
Belgium 6,303
Bulgaria 1,414
Croatia 1,036
Cyprus 177
Czech Rep. 3,389
Denmark 3,243
Estonia 359
Finland 2,762
France 29,552
Germany 42,962
Greece 5,381
Hungary 2,558
Iceland 183
Ireland 2,354
Italy 23,446
Latvia 275
Lithuania 866
Malta 196
Netherlands 6,185
Norway 2,597
Poland 7,239
Portugal 3,524
Romania 4,500
Russia 18,398
Serbia 871
Slovakia 1,461
Slovenia 743
Spain 17,604
Sweden 4,570
Switzerland 5,920
Turkey 6,626
U.K. 24,569
TOTAL 236,090
Note: Medicinal products as defined by Directive 2001/83/ECCyprus, Denmark, Finland, Iceland, Latvia, Lithuania, Norway, Russia, Slovenia, Sweden: pharmaceutical market value at pharmacy purchasing prices Belgium, France, Germany, Ireland, Italy, Norway, Spain, United Kingdom: estimate
Source: EFPIA member associations (official figures); Latvia: IQVIA; Cyprus, Malta: 2019 data
The figures above are for pharmaceutical sales, at ex-factory prices, through all distribution channels (pharmacies, hospitals, dispensing doctors, supermarkets, etc.), whether dispensed on prescription or at the patient’s request. Sales of veterinary medicines are excluded.

EFPIA Key Data | 2022
16
VAT RATES APPLICABLE TO MEDICINESThe table below shows the VAT rates applied to medicines in European countries as of 1 January 2022.
Country Standard VAT rate (%) VAT rates applied to medicines Prescription (%) OTC (%)
Austria 20,0 10,0 10,0
Belgium 21,0 6,0 6,0
Bulgaria 20,0 20,0 20,0
Croatia 25,0 5,0 5,0
Cyprus 19,0 5,0 5,0
Czech Rep. 21,0 10,0 10,0
Denmark 25,0 25,0 25,0
Estonia 20,0 9,0 9,0
Finland 24,0 10,0 10,0
France (1) 20,0 2,1 10,0
Germany 19,0 19,0 19,0
Greece 24,0 6,0 6,0-13,0
Hungary 27,0 5,0 5,0
Iceland 24,0 24,0 24,0
Ireland (2) 23,0 0-23,0 0-23,0
Italy 22,0 10,0 10,0
Latvia 21,0 12,0 12,0
Lithuania (3) 21,0 5,0 21,0
Luxembourg 17,0 3,0 3,0
Malta 18,0 0,0 0,0
Netherlands 21,0 9,0 9,0
Norway 25,0 25,0 25,0
Poland 23,0 8,0 8,0
Portugal 23,0 6,0 6,0
Romania 19,0 9,0 19,0
Russia 20,0 10,0 10,0
Serbia 20,0 10,0 10,0
Slovakia 20,0 10,0 20,0
Slovenia 22,0 9,5 9,5
Spain 21,0 4,0 4,0
Sweden 25,0 0,0 25,0
Switzerland 7,7 2,5 2,5
Turkey 18,0 8,0 8,0
U.K. (4) 20,0 0-20,0 20,0
(1) France: reimbursable medicines 2.1%; non-reimbursable medicines 10.0% (2) Ireland: oral medication 0%; other medication 23%(3) Lithuania: reimbursable medicines 5.0%; non-reimbursable medicines 21.0% (4) U.K.: 0% for prescription medicines dispensed in the Community; 20% for prescription medicines consumed in the hospital setting

17
GENERICSThe term ‘generic’ is widely used but its definition is not always consistent between countries. Generics are usually produced by a manufacturer who is
not the inventor of the original product, and are marketed when intellectual property protection rights are exhausted.
Note: Croatia, Czech Republic, Denmark, Estonia, Finland, Ireland, Hungary, Slovenia, U.K.: share of generics in pharmacy market salesAustria, Belgium, France, Germany, Greece, Italy, Netherlands, Portugal, Spain: share of generics in reimbursable pharmacy market salesBulgaria, Latvia, Lithuania, Norway, Poland, Romania, Russia, Serbia, Slovakia, Sweden, Switzerland, Turkey: share of generics in total market salesLatvia: 2019 data; Cyprus, Iceland, Malta: data not available France: data relate only to those active substances listed on the official list of medicinesDefinition: ‘generic’ means a medicine based on an active substance that is out of patent and which is marketed under a different name from that of the original branded medicine.
Source: EFPIA member associations
SHARE (ESTIMATE - IN %) ACCOUNTED FOR BY GENERICS IN PHARMACEUTICAL MARKET SALES VALUE (AT EX-FACTORY PRICES), 2020
0% 10% 20% 30% 40% 50% 60%
49.0Austria
16.6Belgium
37.0Bulgaria
39.0Croatia
26.0Czech Republic
35.5Denmark
20.9Estonia
23.0Finland
19.5France
23.0Germany
26.0Greece
36.8Hungary
17.2Ireland
67.6Italy
44.0Latvia
22.5Netherlands
22.5Norway
24.0Lithuania
58.0Poland
22.9Portugal
21.0Romania
31.6 Russia
23.2Slovenia
39.6Serbia
19.2Slovakia
23.4Sweden
22.2Spain
13.7Switzerland
28.0U.K.
28.8Turkey
70% 80%

EFPIA Key Data | 2022
18
PHARMACEUTICAL EXPORTS
EFPIA 2020 € million € millionAustria 11,941
Belgium 56,210
Bulgaria 1,054
Croatia 1,052
Cyprus 381
Czech Republic 2,965
Denmark 18,529
Estonia 95
Finland 833
France 34,065
Germany 87,203
Greece 2,883
Hungary 6,739
Iceland 12
Ireland 62,092
Italy 33,112
Latvia 456
Lithuania 874
Luxembourg 132
Malta 367
Netherlands 45,000
Norway 680
Poland 4,377
Portugal 1,378
Romania 895
Slovakia 541
Slovenia 7,062
Spain 12,709
Sweden 10,897
Switzerland 81,899
Turkey 1,497
United Kingdom 21,898
TOTAL 509,828
Note: All data based on SITC 54
Source: Eurostat (COMEXT database – May 2022) Iceland: OECD; Norway: LMI; Switzerland: Swiss Federal Customs Administration; Turkey: Turkish Statistical Institute
19
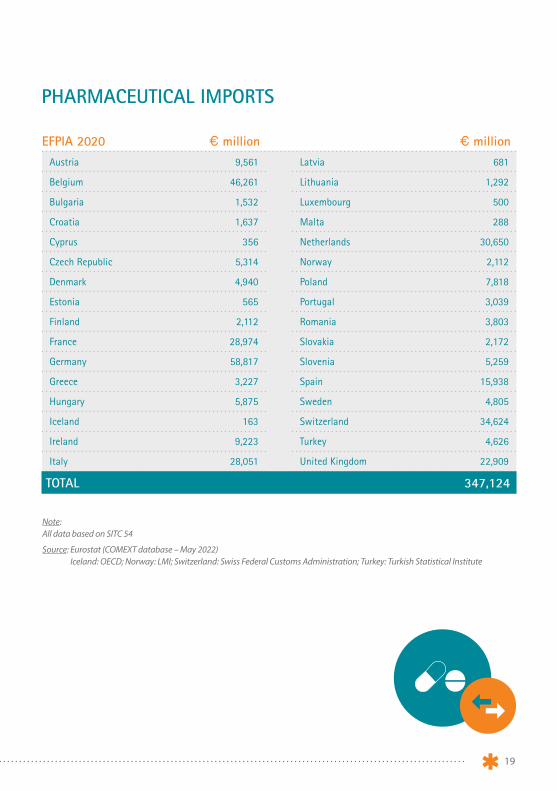
PHARMACEUTICAL IMPORTS
EFPIA 2020 € million € millionAustria 9,561
Belgium 46,261
Bulgaria 1,532
Croatia 1,637
Cyprus 356
Czech Republic 5,314
Denmark 4,940
Estonia 565
Finland 2,112
France 28,974
Germany 58,817
Greece 3,227
Hungary 5,875
Iceland 163
Ireland 9,223
Italy 28,051
Latvia 681
Lithuania 1,292
Luxembourg 500
Malta 288
Netherlands 30,650
Norway 2,112
Poland 7,818
Portugal 3,039
Romania 3,803
Slovakia 2,172
Slovenia 5,259
Spain 15,938
Sweden 4,805
Switzerland 34,624
Turkey 4,626
United Kingdom 22,909
TOTAL 347,124
Note: All data based on SITC 54
Source: Eurostat (COMEXT database – May 2022) Iceland: OECD; Norway: LMI; Switzerland: Swiss Federal Customs Administration; Turkey: Turkish Statistical Institute

EFPIA Key Data | 2022
20
PHARMACEUTICAL TRADE BALANCE
EFPIA 2020 € million € millionAustria 2,380
Belgium 9,949
Bulgaria -478
Croatia -585
Cyprus 25
Czech Republic -2,349
Denmark 13,589
Estonia -470
Finland -1,279
France 5,091
Germany 28,386
Greece -344
Hungary 864
Iceland -151
Ireland 52,869
Italy 5,061
Latvia -225
Lithuania -418
Luxembourg -368
Malta 79
Netherlands 14,350
Norway -1,432
Poland -3,441
Portugal -1,661
Romania -2,908
Slovakia -1,631
Slovenia 1,803
Spain -3,229
Sweden 6,092
Switzerland 47,275
Turkey -3,129
United Kingdom -1,011
TOTAL 162,704
Note: All data based on SITC 54
Source: Eurostat (COMEXT database – May 2022) Norway: LMI; Russia: Clifar Import/Export, 2019; Switzerland: Swiss Federal Customs Administration; Turkey: Turkish Statistical Institute
Graph 25
Graph 24
EU -28 trade balance - High technology sectors ( € million) - 2014
The European Union’s top 5 pharmaceutical trading partners - 2014
EU exports
10,000
20,000
30,000
40,000
50,000
60,000
0
55,337
33,611
-60,000
-50,000
-40,000
-30,000
-20,000
-10,000
-45,320 -44,497
2,980
18,135
SITC 54 Pharmaceutical products
SITC 71 Power generating machinery and equipment
SITC 75 Office machines and computers
SITC 76 Telecommunication, sound, TV, video
SITC 77 Electrical machinery
SITC 87 Professional, scientific, controlling material
41.6%16.5%
Others
30.0%
USA
10.9%35.5
SWITZERLAND
5.6%JAPAN
5.4%
CHINA
6.5%RUSSIA
EU imports
37.8%
4.0%
SINGAPORE4.1%
INDIA2.1%

21
China
6.0%
8.3%
Switzerland
36.4%
11.8%
EU exports
EU exports
30.2%
32.2%
USA Others
13.9%
38.1%
Japan
4.9%
-
U.K.
7.0%
8.0%
Singapore
3.2%
-
EU imports
EU imports
-52,308
-29,780
23,768
SITC 54 Medicinal and pharmaceutical products
SITC 71 Power generating machinery and equipment
SITC 75 Office machines and automatic data processing machines
SITC 76 Telecommunications, sound-recording and reproducing apparatus and equipment
SITC 77 Electrical machinery, apparatus and appliances
SITC 87 Professional, scientific and controlling instruments and apparatus
-70,000
-60,000
-50,000
-40,000
-30,000
-20,000
-10,000
0
10,000
20,000
30,000
40,000
50,000
60,000
70,000
80,000
90,000
100,000
110,000
120,000
130,000
140,000
-65,587
17,319
135,633
Source: Eurostat, COMEXT database, May 2022
Source: Eurostat, COMEXT database, May 2022
EU-27 TRADE BALANCE - HIGH TECHNOLOGY SECTORS (€ MILLION) - 2021
THE EUROPEAN UNION’S TOP 5 PHARMACEUTICAL TRADING PARTNERS - 2021

EFPIA Key Data | 2022
22
TOTAL SPENDING (PUBLIC AND PRIVATE) ON HEALTHCARE AS A PERCENTAGE OF GDP AT MARKET PRICES
Country 1980 1990 2000 2010 2015 2020 Austria 7.0 7.7 9.2 10.2 10.4 11.5
Belgium 6.2 7.1 8.0 10.2 10.4 10.7
Czech Republic - 3.7 5.7 6.9 7.2 9.1
Denmark 8.4 8.0 8.1 10.3 10.2 10.6
Estonia - - 5.2 6.3 6.3 8.1
Finland 5.9 7.3 7.1 9.1 9.6 9.6
France 6.8 8.0 9.6 11.2 11.4 12.4
Germany 8.1 8.0 9.9 11.1 11.2 12.5
Greece - 6.1 7.2 9.6 8.1 7.8
Hungary - - 6.8 7.5 6.9 6.4
Iceland 5.9 7.4 8.9 8.4 8.1 9.8
Ireland 7.5 5.6 5.9 10.5 7.3 7.2
Italy - 7.0 7.6 8.9 8.9 9.7
Latvia - - 5.4 6.1 5.7 6.6
Lithuania - - 6.2 6.8 6.5 7.6
Luxembourg 4.6 5.1 5.9 7.0 5.3 5.4
Netherlands 6.5 7.0 7.7 10.2 10.3 11.2
Norway 5.4 7.1 7.7 8.9 10.1 11.3
Poland - 4.3 5.3 6.4 6.4 7.2
Portugal 4.8 5.5 8.6 10.0 9.3 10.1
Slovakia - - 5.3 7.7 6.8 7.7
Slovenia - - 7.8 8.6 8.5 9.7
Spain 5.0 6.1 6.8 9.1 9.1 9.1
Sweden 7.7 7.2 7.3 8.3 10.8 11.4
Switzerland 6.4 7.6 9.1 9.9 11.0 11.3
Turkey 2.4 2.4 4.6 5.1 4.1 4.3
United Kingdom 5.1 5.1 7.2 9.8 9.9 12.8
Europe 6.1 6.4 7.2 8.7 8.5 9.3
USA 8.2 11.2 12.5 16.3 16.5 16.8
Japan 6.2 5.8 7.2 9.2 10.9 11.0
Note: Europe: non-weighted average (27 countries) – EFPIA calculations
Source: OECD Health Statistics 2020, May 2022
23
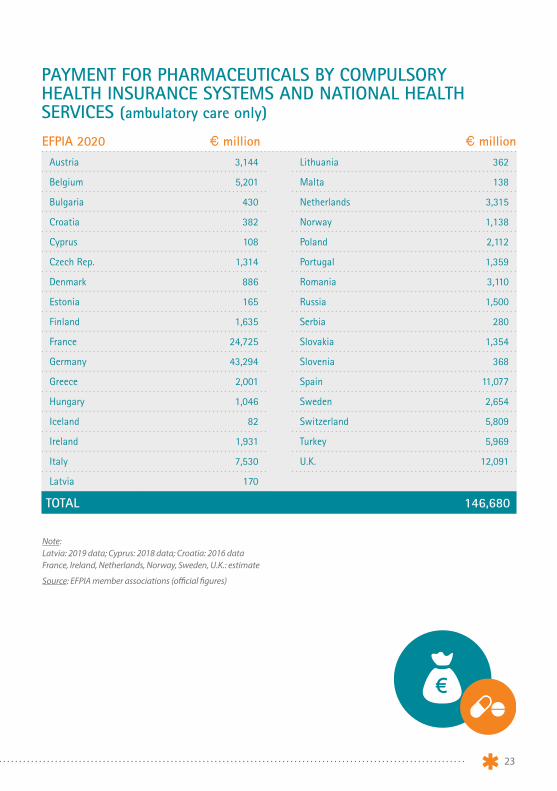
PAYMENT FOR PHARMACEUTICALS BY COMPULSORY HEALTH INSURANCE SYSTEMS AND NATIONAL HEALTH SERVICES (ambulatory care only)
EFPIA 2020 € million € millionAustria 3,144
Belgium 5,201
Bulgaria 430
Croatia 382
Cyprus 108
Czech Rep. 1,314
Denmark 886
Estonia 165
Finland 1,635
France 24,725
Germany 43,294
Greece 2,001
Hungary 1,046
Iceland 82
Ireland 1,931
Italy 7,530
Latvia 170
Lithuania 362
Malta 138
Netherlands 3,315
Norway 1,138
Poland 2,112
Portugal 1,359
Romania 3,110
Russia 1,500
Serbia 280
Slovakia 1,354
Slovenia 368
Spain 11,077
Sweden 2,654
Switzerland 5,809
Turkey 5,969
U.K. 12,091
TOTAL 146,680
Note: Latvia: 2019 data; Cyprus: 2018 data; Croatia: 2016 dataFrance, Ireland, Netherlands, Norway, Sweden, U.K.: estimate
Source: EFPIA member associations (official figures)

EFPIA Key Data | 2022
24
MAIN CAUSES OF CANCER MORTALITY ACROSS OECD, BY SEX, 2019
Source: Health at a Glance 2021, OECD Indicators, OECD, pages 89 & 93
31%
21%19%
14%
8%
7%
27%
8%36%
9%
20%
Cancer Injuries
Circulatory system diseases
Alchol and drugs effects Diabetes and other endocrine diseases
Respiratory system Others
MAIN CAUSES OF AVOIDABLE MORTALITY ACROSS OECD COUNTRIES, 2019
PREVENTABLE CAUSES OF MORTALITY1,917,107 premature deaths
TREATABLE CAUSES OF MORTALITY1,084,441 premature deaths
17.2%
14.6%
11.2%
7.9%
4.3%
3.7%
Lung Breast
Colorectial
Pancreas
StomachOvary Liver Cervix uteriLeukemia
Bladder Melanoma of skinProstate
4.8%
3.3%
2.0%1.7%
1.0%
24.1%
10.7%
6.7%5.8%
3.8%
3.5%
9.7%1.2%
5.8%
Source: OECD Health Statistics 2021.
WOMEN MEN
25
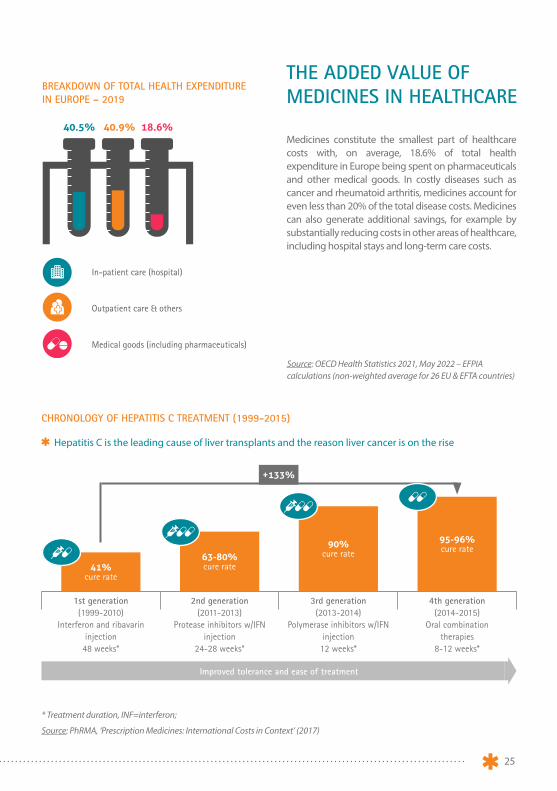
THE ADDED VALUE OF MEDICINES IN HEALTHCARE
Medicines constitute the smallest part of healthcare costs with, on average, 18.6% of total health expenditure in Europe being spent on pharmaceuticals and other medical goods. In costly diseases such as cancer and rheumatoid arthritis, medicines account for even less than 20% of the total disease costs. Medicines can also generate additional savings, for example by substantially reducing costs in other areas of healthcare, including hospital stays and long-term care costs.
Source: OECD Health Statistics 2021, May 2022 – EFPIA calculations (non-weighted average for 26 EU & EFTA countries)
* Treatment duration, INF=interferon;
Source: PhRMA, ‘Prescription Medicines: International Costs in Context’ (2017)
BREAKDOWN OF TOTAL HEALTH EXPENDITURE IN EUROPE – 2019
CHRONOLOGY OF HEPATITIS C TREATMENT (1999-2015)
Outpatient care & others
18.6%40.9%40.5%
In-patient care (hospital)
Medical goods (including pharmaceuticals)
Hepatitis C is the leading cause of liver transplants and the reason liver cancer is on the rise
1st generation(1999-2010)
Interferon and ribavarin injection
48 weeks*
2nd generation(2011-2013)
Protease inhibitors w/IFN injection
24-28 weeks*
3rd generation(2013-2014)
Polymerase inhibitors w/IFN injection
12 weeks*
4th generation(2014-2015)
Oral combination therapies
8-12 weeks*
+133%
41%cure rate
63-80%cure rate
90%cure rate
95-96%cure rate
Improved tolerance and ease of treatment

26
EFPIA Key Data | 2022
EFPIA MEMBER ASSOCIATIONS
ASSOCIATIONS WITH LIAISON STATUS
Austria Fachverband der Chemischen Industrie Österreichs (FCIO)
Belgium Association Générale de l’Industrie du Médicament (pharma.be)
Denmark Laegemiddelindustriforeningen
The Danish Association of the Pharmaceutical Industry (Lif )
Finland Lääketeollisuus ry
Pharma Industry Finland (PIF)
France Les Entreprises du Médicament (LEEM)
Germany Verband Forschender Arzneimittelhersteller (VfA)
Greece Hellenic Association of Pharmaceutical Companies (SFEE)
Ireland Irish Pharmaceutical Healthcare Association (IPHA)
Italy Associazione delle Imprese del Farmaco (Farmindustria)
Netherlands Vereniging Innovatieve Geneesmiddelen
Norway Legemiddelindustrien
Norwegian Association of Pharmaceutical Manufacturers (LMI)
Poland Employers Union of Innovative Pharmaceutical Companies (Infarma)
Portugal Associação Portuguesa da Indústria Farmacêutica (Apifarma)
Russia Association of International Pharmaceutical Manufacturers (AIPM)
Spain Asociación Nacional Empresarial de la Industria Farmacéutica (Farmaindustria)
Sweden Läkemedelsindustriföreningen
The Swedish Association of the Pharmaceutical Industry (LIF)
Switzerland Verband der forschenden pharmazeutischen Firmen der Schweiz (Interpharma)
Turkey Arastirmaci Ilac Firmalari Dernegi (AIFD)
United Kingdom The Association of the British Pharmaceutical Industry (ABPI)
Bosnia-Herzegovina: Association of Research-based Medicine Producers (UIPL)Bulgaria: Association of Research-based Pharmaceutical Manufacturers in Bulgaria (ARPharM)Croatia: Innovative Pharmaceutical Initiative (iF!)Cyprus: Cyprus Association of Pharmaceutical Companies (KEFEA)Czech Republic: Association of Innovative Pharmaceutical Industry (AIFP)Estonia: Association of Pharmaceutical Manufacturers in Estonia (APME)Hungary: Association of Innovative Pharmaceutical Manufacturers (AIPM)Iceland: Icelandic Association of the Pharmaceutical Industry (FRUMTÖK) Latvia: Association of International Research-based Pharmaceutical Manufacturers (SIFFA)Lithuania: The Innovative Pharmaceutical Industry Association (IFPA)Luxembourg: Innovative Medicines for Luxembourg (IML)Malta: Maltese Pharmaceutical Association (PRIMA)North Macedonia: Association of Foreign Innovative Pharmaceutical Manufacturers (HOBA)Romania: Association of International Medicines Manufacturers (ARPIM)Serbia: Innovative Drug Manufacturers’ Association (INOVIA)Slovakia: Slovak Association of Innovative Pharmaceutical Industry (AIFP)Slovenia: Forum of International Research and Development Pharmaceutical Industries (EIG)Ukraine: Association of Pharmaceutical Research and Development (APRaD)
27
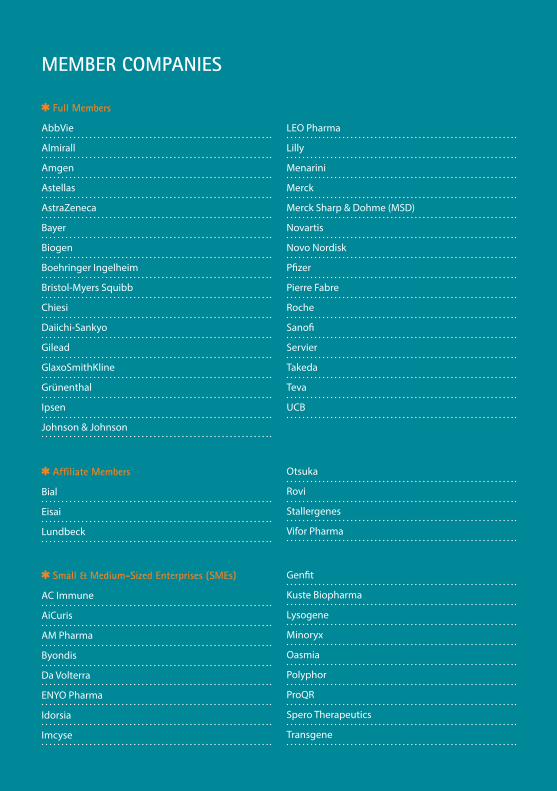
MEMBER COMPANIES
Full Members
AbbVie
Almirall
Amgen
Astellas
AstraZeneca
Bayer
Biogen
Boehringer Ingelheim
Bristol-Myers Squibb
Chiesi
Daiichi-Sankyo
Gilead
GlaxoSmithKline
Grünenthal
Ipsen
Johnson & Johnson
LEO Pharma
Lilly
Menarini
Merck
Merck Sharp & Dohme (MSD)
Novartis
Novo Nordisk
Pfizer
Pierre Fabre
Roche
Sanofi
Servier
Takeda
Teva
UCB
Affiliate Members
Bial
Eisai
Lundbeck
Otsuka
Rovi
Stallergenes
Vifor Pharma
Small & Medium-Sized Enterprises (SMEs)
AC Immune
AiCuris
AM Pharma
Byondis
Da Volterra
ENYO Pharma
Idorsia
Imcyse
Genfit
Kuste Biopharma
Lysogene
Minoryx
Oasmia
Polyphor
ProQR
Spero Therapeutics
Transgene
EFPIALeopold Plaza Building Rue du Trône 108
B–1050 Brussels BelgiumTel.: +32 (0)2 626 25 55
www.efpia.eu [email protected]
Further details about the Federation and its activities can be obtained from:
EFPIA (The European Federation of Pharmaceutical Industries and Associations) represents the research-based pharmaceutical industry operating in Europe.
Founded in 1978, its members comprise 37 national pharmaceutical industry associations, 38 leading pharmaceutical companies and 17 small and medium sized enterprises undertaking research,
development and manufacturing of medicinal products in Europe for human use.
EFPIA aims to create an environment that enables its members to innovate, discover, develop and deliver new therapies and vaccines for people across Europe, as well as contribute to the European economy.
EFPIA’s vision is for a healthier future for Europe. A future based on prevention, innovation, access to new treatments and better outcomes for patients.
Through its membership, EFPIA represents the common views of about 1,900 large, medium and small companies including the entire European research-based pharmaceutical sector whose interests also
include a significant part of the generics and biosimilars segments. Vaccines Europe (VE) is the specialised vaccine industry group within EFPIA. It represents major innovative research-based global vaccine
companies as well as small and medium sized enterprises operating in Europe.