facts and figures 2009
TRANSCRIPT
Facts and Figures 2009Key Figures in Education 2009
Facts and Figures 2009 is an outline of the Danish education system with a quantitative description of trends and developments in various fi elds of education.
� e education system is changing continuously keeping up with new generations and new requirements from the labour market. � is publication presents a series of key fi gures in tables and graphs showing the directions of the development. Primarily, the publication illustrates the development by Danish fi gures complemented by equivalent fi gures form selected countries.
� e Danish Ministry of Education
Facts and Figu
res 2009 - Key Figu
res in Edu
cation 2009 Facts and Figures
2009Key Figures in Education 2009
� e Danish Ministry of Education – Statistical Publication no. 2 – 2010

Key Figures in Education 2009
Facts and Figures 2009
The Danish Ministry of Education – Statistical Publication no. 2 – 2010

Facts and Figures 2009Key Figures in Education 2009
Author: UNI•C Statistics & AnalysisSerial editor and production: Danish Ministry of Education
Translation: Ability
Graphics: Rumfang ApSCover: Rumfang ApSPhotos: Jakob Dall, Poul Rasmussen, Lars Skaaning and Preben Søborg
1st edition, june 2010
ISBN (WWW) 978-87-603-2886-5Internet: www.uvm.dk/factsandfigures2009
Published by the Danish Ministry of Education, 2010
Facts and Figures 2009 cannot be ordered in a printed edition.
Please adress inquiries to the Danish Ministry of Education, phone no.: +45 33 92 52 23 or e-mail: [email protected]
or
UNI•C Statistics & Analysis, phone no.: +45 35 87 83 00 or e-mail: [email protected]
3
Table of contents
1 Preface 5
1 The education system 61.1 The mainline Danish education system 61.2 The adult education and continuing training system 171.3 Pupils, students and educational institutions in the main education
system 20
2 The educational level 232.1 The highest completed education in the work force 232.2 Extrapolation of the educational level of the population 232.3 Projected educational level tabulated by gender and ethnicity 272.4 Time spent from completing the 9th form until achieving vocational
qualifications 302.5 International comparison of the level of education 33
3 Finances 353.1 Average public expenditure on various educations 353.2 Public expenditure on adult education and continuing training 353.3 Expenditure on the Danish Education Support 383.4 Public expenditure on education as a percentage of total public
expenditure in Denmark and selected countries 393.5 Total public and private expenditures on educational institutions in
Denmark and selected countries 403.6 Total public and private expenditures per pupil/student in Denmark
and selected countries 423.7 Expenditure on financial support of students in higher education in
Denmark and selected countries 433.8 The teachers’ working hours 45

Facts and Figures 20094
4 Information technology in education 474.1 Infrastructure in basic school 474.2 Knowledge sharing systems in basic schools 474.3 Continuing information technology training in basic schools 484.4 EMU – Denmark’s education portal 494.5 Information technology in school in an international perspective 50
5 Basic school 525.1 Number of schools and pupils 525.2 Pupils receiving special needs education 575.3 Age at school start 595.4 The pupils’ choice of education after basic school 605.5 Number of teachers 625.6 Normal class size and pupil-teacher ratio 64
6 Youth education 696.1 Number of schools and students 696.2 Age at school start 706.3 Completion, dropout, and behaviour after dropout 716.4 The pupils’ choice of education after the youth education 786.5 Choice of subjects in upper secondary schools 806.6 Training contracts 826.7 Education for young people with special needs, young people in basic
vocational education and training, and young people in production schools 85
6.8 International mobility 88
7 Higher education 897.1 Number of institutions and students 897.2 Age at the start of study 907.3 Completion, dropout, and behaviour after dropout 907.4 Length of study and age at graduation 917.5 International mobility in higher educations 92
8 Adult education and continuing training 988.1 Number of institutions and number of participants 988.2 Age and educational background 1018.3 Continuing training activity in international perspective 102
5Preface
Preface
How many municipal primary and lower secondary schools are there in Denmark, and how many private basic schools? What is the number of pupils per class, and how many pupils are there per teacher? What percentage of pupils has an ethnic origin other that Danish? What is the proportion of a youth cohort that completes a vocationally oriented education and training programme, and what is the share that completes a higher educa-tion? These are some of the questions that are answered in this publication.
Facts and figures 2009 gives an overview of the structure of the Danish educational system and describes in numbers the development in most of
the various fields of education. The publication presents key figures and graphs that show the direction of the development in recent years and what may be expected in the years ahead. The statistics concern primarily the development in Denmark; however, figures from other selected countries are also provided.
The preparation for publication was completed in January 2010.
Most of the figures in the publication may be viewed on the website of the Danish Ministry of Education, www.uvm.dk. Additional and more detailed information about the individual fields of education may also be found there.

Facts and Figures 20096
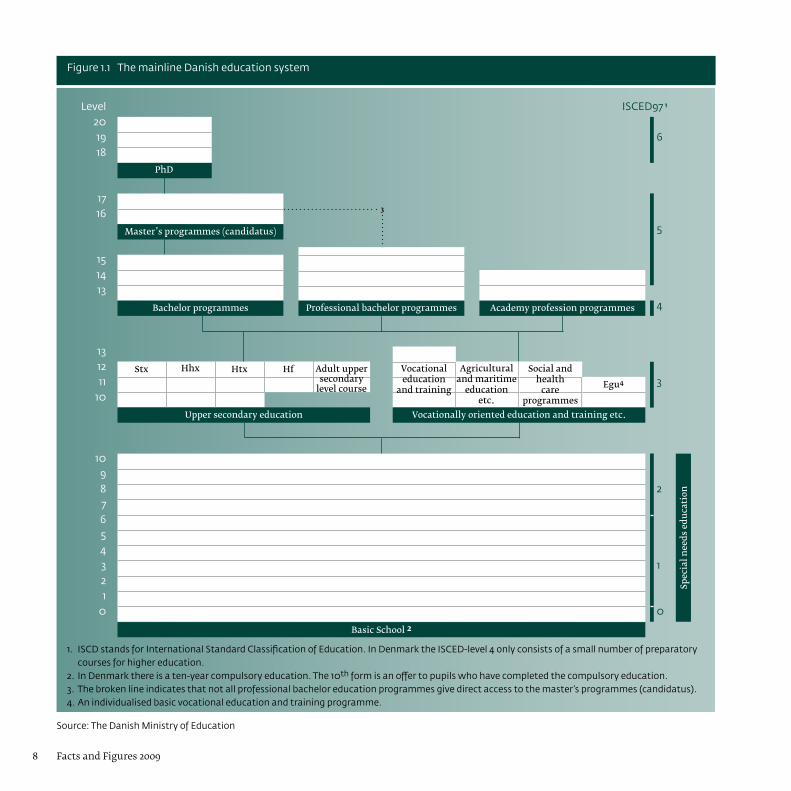
The Danish education system may be divided into groups according to qualification level and field.
Some education programmes give competence to further studies – this is called study competence. Other pro-grammes give labour market qualifica-tions – called vocational qualifications. There are education programmes that provide both forms of qualification. At the same time, there are educations that provide neither study nor voca-tional qualifications.
The education system is divided into two parallel systems: the mainline education and an adult education and continuing training. The educational level of both systems is directly com-parable.
Figure 1.1 and 1.2 show the structures of and the connections between the mainline education system and the adult education and continuing train-ing system.
In the following section, the educa-tion system is reviewed together with
the framework, the contents, and the aims that apply to its various areas.
1.1 The mainline Danish education system
The basic school (primary and lower secondary school) There is a ten-year compulsory educa-tion in Denmark, but no compulsory schooling. However, only very few children are home taught. The compul-sory education begins in August of the calendar year in which the child reaches six years of age.
Almost all children begin their school-ing in a one-year pre-school class that in most schools is an integral part of the first years of primary level. From 1 August 2009 the pre-school class is included in the compulsory education.
There are ten years of basic school. The basic school gives admission to the youth education; however, the pupils may choose to continue in a 10th form. A little less than half of the pupils in the 9th form of the basic school elect to continue in the 10th form; however,
this proportion has been diminishing in the recent years.
The basic school comprises various types of schools. The municipal basic school including special schools by far covers the teaching of the major-ity of the pupils. The municipal basic school is a free offer to parents. The private basic schools (private independ-ent schools and private elementary schools) and the continuation schools are alternatives to the municipal basic schools. Continuation schools are private boarding schools that typically offer teaching at the 8th through 10th form level. The private basic schools and the continuation schools are self-governing institutions financed by state subsidies and pupil contribu-tions.
In the year 2008, there were 704,000 pupils in basic school. Of these, 82 % attended a municipal basic school, and 14 % the private basic schools, while 4 % attended a continuation school.
According to the Danish legislation on municipal basic schools, the purpose of the municipal basic schools is to
1 The education system

7Tal der taler
Facts and Figures 20098
Source: The Danish Ministry of Education
Figure 1.1 The mainline Danish education system
Level201918
1716
151413
131211
10
10987654321
0
6
5
4
3
2
1
0
Master’s programmes (candidatus)
3
PhD
Stx Vocationaleducation
and training
Agriculturaland maritime
education etc.
Social andhealth
careprogrammes
Egu4
Hhx Htx Hf
Professional bachelor programmesBachelor programmes Academy profession programmes
Upper secondary education Vocationally oriented education and training etc.
Basic School 2
Adult uppersecondary
level course
1. ISCD stands for International Standard Classification of Education. In Denmark the ISCED-level 4 only consists of a small number of preparatory courses for higher education. 2. In Denmark there is a ten-year compulsory education. The 10th form is an offer to pupils who have completed the compulsory education. 3. The broken line indicates that not all professional bachelor education programmes give direct access to the master’s programmes (candidatus).4. An individualised basic vocational education and training programme.
Spec
ial n
eeds
edu
cati
on
ISCED97 1
9Th e education system
Figure 1.2 The two parallel Danish education systems
HIGHER EDUCATION
The mainline education system The adult and continuing education system
YOUTH EDUCATION ADULT EDUCATION
Academyprofessioneducation
VVU-programmes
Diplomaprogrammes
Master’s programmes (part-time)
Basic adult education (GVU)
Professional bachelor eduation etc.
Universitybacheloreducation
Master’s programmes (candicatus)
Source: The Danish Ministry of Education

Facts and Figures 200910
bring to the pupils, in cooperation with the parents, knowledge and skills that:
“... prepare them for further education and give them the desire to learn more, familiarize themselves with Danish culture and history, provide them with an understanding of other countries and cultures, contribute to their appreciation of the interaction between man and nature, and promote an all-round development of the individual pupil”.
Pupils in the municipal basic schools are normally taught in classes that remain together throughout the entire course of the basic school. The teaching is differentiated within the framework of the class so that the teaching is based on the requirements and qualifications of the individual pupil.
The private basic schools offer teach-ing to children in the age bracket of compulsory education, and it must measure up to what normally is re-quired in the municipal basic schools; however, the framework for planning the teaching is more open.
There are a few other forms of school that offer teaching at the basic school level. There are for example special schools for children, special needs day schools, community homes, and parts of the municipal youth school offers.
Some pupils have so great physical and mental difficulties that their education cannot be dealt with in the regular teaching. Therefore, they receive a special needs education. Until the 1st of January 2007, there were two forms of special needs education: the general special needs education, which was the responsibility of the municipali-ties, and the extensive special needs education, which was the responsibil-ity of the counties. Today, all special needs education is the responsibility of the municipalities, and it is no longer split up in general and extensive spe-cial needs education. In the year 2008, almost 50,000 pupils in the municipal basic school attended special needs education in special classes or in their ordinary class.
In the international ISCED97 classifica-tion, the pre-school class corresponds to level 0, and the basic school corre-
sponds to level 1 (1st through 6th form) and level 2 (7th through 10th form).
Youth education The youth education builds on the qualifications and the knowledge the students have acquired in basic school. All young people must be offered a youth education.
Youth education includes the upper secondary education and the vocation-ally oriented education and training programmes.
The youth education may prepare the students for further studies or for a profession or both. In either case, the emphasis is on developing the personal, vocational, and theoretical qualifications of the students.
Most youth education takes ap-proximately three years; however, the duration may be anywhere from one year and a half and up to more than five years.
Through a differentiated offer and planning of the education, the individual skills and wishes of the
11The education system
students may largely be taken into consideration. The purpose is to secure a high level of motivation so as many young people as possible complete the education.
Nearly 81 % are expected to complete a youth education within 25 years after completing the 9th form. In addi-tion, 4 % of a youth cohort is expected to complete a higher education that is not counted as a youth education. Thus in 2008, a good 84 % in total of a youth cohort is expected to complete at least a youth education. It is the goal of the government that at least 85 % of a youth cohort complete a youth educa-tion in the year 2010 and at least 95 % in 2015.
On the 1st August 2007, new legislation took effect to give young people with special needs who cannot complete an ordinary youth education a legal right to a three-year course of educa-tion. The purpose of this education is that youths with special needs acquire competences as much as possible to actively participate in adult life and to pursue further education and employ-ment. This way, young people with
special needs are given the same op-portunity as other young people so that all young people have the opportunity to complete a youth education.
Upper secondary educationThe upper secondary education programmes are preparatory to higher education and comprise the upper secondary school leaving examination (stx), including the adult upper secondary level course, the higher preparatory examination (hf), the higher com-mercial examination (hhx), and the higher technical examination (htx). These education programmes prepare young people who take an interest in knowledge, in-depth studies, perspec-tive, and abstraction for a higher education by allowing them to acquire a general education, knowledge, and competences and by allowing them to develop academic insight and study competence.
All students who have received the relevant instruction and have passed the prescribed tests in the basic school may continue to an upper secondary education, unless the dismissing school appraises that the student has
made the choice on an inadequate or unrealistic basis. In such cases, the student is entered for an entrance examination.
Stx, hhx, and htx are three-year educa-tion programmes with a common half-year basic course followed by two and half years in a programme chosen by the student. Within certain limits, the schools themselves plan which study programme should be offered to the students. A study programme consists normally of three subjects. In addition to the compulsory subjects and the study programme subjects, the students choose one or more elec-tive subjects.
Hf is offered as a two-year youth education programme as well as an adult programme composed of single subjects. Hf comprises mandatory subjects and optional subjects; this gives to a certain degree the oppor-tunity to put together an individual education programme. Hf is intended as an upper secondary education offer to somewhat older students. It is not possible to go from the basic school 9th form directly to hf.
“Through a differentiated offer and planning of the education, the individual skills and wishes of the students may largely be taken into consideration.
Facts and Figures 200912
Hf is frequently offered together with stx in upper secondary schools, while hhx and htx are offered in vocational colleges. For many years, vocational colleges have been self-governing institutions financed by the govern-ment. With effect from 2007, the upper secondary schools were transferred from the counties into self-governing institutions financed by the govern-ment. There are a small number of private upper secondary schools and adult upper secondary level courses where the students pay a part of the tuition costs.
The final examination completing an upper secondary education qualifies to enter higher education and thus gives a general study competence. However, most higher education programmes pose requirements concerning sub-jects, level and marks obtained.
Vocationally oriented education and trainingThe vocationally oriented education and train-ing programmes comprise the commercial and technical vocational education and training programmes including the basic social and health care training
programmes, and skilled education within the field of agriculture. In addition, the vocationally oriented education and training programmes comprise the basic vocational educa-tion and training (egu) within the fields of engine driver, chiropodist, and other education within navigation etc.
These education programmes are in-tended to give young people and adults strong professional, personal and general qualifications that formally and factually are in demand in the labour market. They qualify directly for employment in certain trades. All vocationally oriented education and training programmes give formal vo-cational qualifications. The education programmes also give the students study competence for higher educa-tion within the vocational academy programmes and certain professional bachelor programmes.
Normally, the only requirement for admission to a vocationally oriented education and training programme is that the applicant has completed the compulsory education in the basic
school. Some of the vocational colleges have a relatively high proportion of adult students, especially within the social and health education.
The vocationally oriented education and training programmes (EUD) account for the greater part of vocational youth education and consist of 109 pro-grammes in a wide range of the com-mercial, the technical, and the social and health care professional fields. The basic courses of the programmes are combined in 12 vocational basic access channels. Each access channel is structured so that the programmes have joint function and competence at the entry. The duration of an education programme is normally 3-4 years, but may vary between 1½ and 5½ years.
The Danish vocationally oriented education and training programmes are alternate programmes. This means that the students alternate between school and practice during the course of the education. The education programmes consist of a basic course and a main course. The basic course normally takes place in a school, but for the individual student, this may

13The education system
be replaced, partly or in full, by a basic practical training in an enterprise on the basis of a training contract (new apprenticeship). The main course alternates between practical training in an enterprise and education in a school.
There is free access to the basic EUD course, and there is continuous admis-sion. However, there is restricted admission to certain basic courses, in particular the fashion-oriented ones (such as “Body and style”) and to educations with limited employment opportunities. Approximately 30-50 % of the time is spent in school and 50-70 % in a practical training company or in school-based practical training organised by the vocational college if the student is not able to obtain a training contract (internship) with an enterprise.
It is the government’s goal that at least 95 % of a youth cohort complete a youth education programme in 2015. As pointed out above, the latest statistics show that this figure was 81 % in 2008 (84 % if including persons that do not obtain a youth education
but nevertheless complete a higher education). For this reason, the effort against drop-out in the vocationally oriented education programmes has been strengthened, for example by requiring that the schools prepare plans of action with goals and strate-gies for an increased rate of comple-tion. Increased emphasis is placed on guidance and mentor and teacher contact arrangements, and the schools offer basic course packages that take into consideration students with weak as well as with strong study qualifica-tions. Improved opportunities have been created for dividing the education into steps and levels and for individual courses of study. Moreover, the effort to gain more practice placements and the quality of school-based practical training have been strengthened.
Students under 25 years of age who have already completed the first step of an education may return after a minimum of half a year of relevant vocational experience to complete the education in a course of study called EUD+.
Adults over 25 years of age with vocational experience in the field in question have the opportunity to complete the course of study in a shorter time based on an appraisal of their actual competency and a subse-quent crediting of competencies. If the requirement of two years of relevant vocational experience is met, this may take place as a basic adult education (GVU).
The youth education programmes comprise level 3 of the ISCED97 clas-sification.
The basic vocational education and training (egu) is an individually planned offer of education to young people under 30 years of age who do not qualify directly for another youth education leading to formal qualifications.
The course of study is primarily based on practice and alternates between time in school and time in practice. The duration of this education is normally two years; however, in special cases it may be extended by an additional year of practice.
Facts and Figures 200914
In total, the time in school is from 20 to 40 weeks. The schooling elements in an individualised basic vocational education and training plan may be comprised from a series of educational fields including vocational education and training (EUD), adult vocational training (AMU), production schools, folk high schools, full-time studies at youth schools, adult education centres, etc.
The periods of practice take place in one or more enterprises or as workshop practice in a technical school, a pro-duction school or similar. A completed egu education provides vocational qualifications and the opportunity to continue in another qualifying educa-tion and training programme with credit transfer.
Production schoolsThe production schools offer educa-tion of young people under 25 years of age who have not completed a youth education programme, and who do not directly have the qualifications to enter a youth education programme or who have discontinued a youth education programme.
The purpose of this education is to strengthen the students’ personal development and to improve their opportunities in the education system and in the general labour market. The offer is planned with the specific aim that young people acquire qualifica-tions that enable them to complete a vocationally qualifying youth educa-tion.
The education programme is based on activities in diverse workshops and comprises practical work and perform-ance of tasks in combination with theoretical training in actual produc-tion and marketing. Furthermore, the schools offer teaching in general subjects so the students are prepared to start a general youth education. Up to one third of the course of study in a production school may be spent in other educational institutions. For example, these may include studies of general subjects in an adult education centre (VUC) or parts of a basic course of study in a vocational college.
The stay in a production school has no fixed length but may not last more than a year. Students who complete
a course of study of more than three months’ duration at a production school shall, as a principal rule, par-ticipate in a course of study of two to five weeks duration that gives credit, and that is directed towards qualifying education, for instance, a vocationally oriented education and training pro-gramme. Furthermore, the students may participate in practice for four weeks each semester.
Higher educationThe higher education programmes con-stitute the educational continuation of youth education and provide the students with final vocational qualifi-cations. They are categorized according to level and duration: the short-cycle higher education including, among other things, the vocational academy educa-tion, the medium-cycle higher education including the university bachelor programmes, the professional bach-elor programmes and other medium duration higher programmes, together with the long-cycle higher education includ-ing master’s programmes (candidatus) and PhD programmes.
15The education system
The latest calculations based on the educational behaviour in 2008 show that 47 % of a youth cohort will com-plete a higher education. It is the goal of the government that at least 50 % of a youth cohort complete a higher education in the year 2015.
As a rule, higher education is free in Denmark. However, the students nor-mally pay for books and other teaching materials. For most higher education, the schools themselves decide how many student seats are established. For some education programmes, however, the number of student seats is decided centrally; by way of example this is the case for the medical, veteri-nary, dentistry, and nursing schools.
To be admitted to a higher education, the applicant must meet the entry requirements demanded by the school in question. For example, in order to be admitted to a university bachelor programme, the applicant must meet the entry requirement of an upper secondary graduation diploma includ-ing certain upper secondary subjects at a specified level. Furthermore, some bachelor programmes require that
the upper secondary examination be passed with a certain minimum mark in average or in individual subjects.
A vocational academy education is a short-cycle higher education that as a rule takes two years, including a minimum of 3 months’ practice. These educa-tion programmes are often directed towards a specific trade or job func-tion, and they combine theory and practice. The requirement for admis-sion to a vocational academy education is an upper secondary education or a vocationally oriented education, possi- bly complemented by requirements of certain academic levels in mathemat-ics and English.
In the autumn of 2009, there are 25 vocational academy education pro-grammes. The vocational academy education programmes give access to relevant diploma programmes. Most of the vocational academy education pro-grammes are offered at the academies of professional higher education.
A professional bachelor education is a profession-oriented, qualifying medium-cycle higher education. The
programmes for professional bachelor education normally take three to four years including a minimum of half a year of practice. A professional bachelor education combines theory and practice and is most often directed towards a certain trade or job field.
The entry requirements for the professional bachelor programmes are in most cases an upper secondary education; however, certain vocational education and training programmes (EUD) complemented by upper second-ary courses also provide admission. Today, there are approximately 40 professional bachelor education programmes within health care, biotechnology, laboratory technology, media and communication, pedagogy, technology, information technology, social sciences, and economics.
A professional bachelor education provides admission to relevant master’s programmes (candidatus) and master’s programmes (part-time). Beginning 2009, professional bachelor programmes are offered as individual advanced level full-time study pro-grammes of at least 1½ years’ duration.

Facts and Figures 200916
research project and prepares a writ-ten thesis based on the PhD project, completes research courses correspond-ing to approximately 30 ECTS points, participates in active research environ-ments through residences in other, primarily foreign, research institu-tions, as well as acquires experience in teaching or another form of knowledge dissemination.
The entry requirement to a PhD pro-gramme is normally a master’s degree (candidatus), although it is possible to be admitted before the master’s programme (candidatus) has been completed. It must be ensured, how-ever, that the combined course of study has the same magnitude and is at the same level as if the PhD programme was started after the completion of the master’s degree (candidatus).
The higher education programmes comprise level 5 of the ISCED97 classification. The PhD education is considered level 6 in the ISCED97 clas-sification.
In most cases, a relevant professional academy education is prerequisite.
The greater part of the professional bachelor education takes place at university colleges – (UC).
Among other medium-cycle education programmes, there are for example: fine arts education, maritime/navigation education, sign language interpreter, and armed forces education. The dura-tion of these programmes varies.
At the same level as the professional bachelor education programme, there is the three-year bachelor education programme in the universities. The bach-elor education is a complete education giving vocational qualifications as well as access to a two-year master’s education programme (candidatus).
The current structure of the university education was established in 1993 when it was decided to divide the long-cycle university education pro-grammes leading to a master’s degree (candidatus) into two shorter courses of study: a bachelor course of study and a master’s (candidatus) course of
study. Formerly, there had been only the complete course of study leading to the master’s degree (candidatus) as the first academic degree. Today, all long-cycle higher education programmes in university consist of a three-year bachelor programme followed by a two-year master’s programme (candi-datus). Henceforth, the education may be extended further by a three-year PhD programme (the so-called 3+2+3 model).
As a rule, the entry requirement for the bachelor programmes in university is an upper secondary education plus possibly meeting specific requirements for course subjects and level. Admis-sion to the master’s programmes (candidatus) presupposes a relevant bachelor degree or another relevant Danish or foreign education at the same level.
As a superstructure to the master’s programmes (candidatus), there is a research education leading to a PhD degree. This education is normalized to three year of full-time studies. The pro-gramme includes, among others, that the student completes an independent

17The education system
Educational and vocational counsellingCounselling regarding choice of educa-tion and vocation are combined in a coherent system that is independent of the individual education programs, institutions, and sectors. Among other things, the counselling shall be conducive to a choice of education and career that is of the greatest possible benefit to the individual and to the society. Furthermore, the counselling shall in particular target young people with a special need for counselling and contribute to limit dropouts and change of study as much as possible.
The responsibility for youth education and vocational counselling is organ-ised in youth guidance centres at mu-nicipal level (UU). Today, there are 45 UUs countrywide – some of them being shared between several municipalities. The UUs guide pupils in the municipal primary and lower secondary schools in their choice of youth education and vocation. Additionally, the UUs shall reach out for young people under 25 years of age who have not completed or are currently undertaking a study.
Beyond this, young people may them-selves approach a UU for counselling.
The responsibility for counselling re-garding choice of higher education and career is organised in seven regional guidance centres called “Studievalg”. The centres shall guide all young people in a youth education in their schools and everybody else who want counselling regarding choice of higher education and vocation.
Furthermore, the Danish Ministry of Education has established an Internet guidance portal, ‘UddannelsesGuiden’, (www.ug.dk). The portal addresses a wide target group and contains for instance information about education programmes and jobs, about current and expected employment opportuni-ties, about education programmes offered in English, and links to educational institutions etc. Addition-ally, the website www.optagelse.dk facilitates electronic applications to youth education programmes and higher education programmes.
Besides the transitional guidance described above, guidance is given at
the individual educational institutions regarding completion of the education in question.
1.2 The adult education and continuing training system
Adult education and continuing training (VEU) may be divided into vocationally oriented, general, and liberal adult education.
Most of the vocationally oriented and general adult education and continu-ing training are formally qualifying to another study or to the labour market. Liberal adult education at folk high schools, in evening schools etc., and private courses are normally not qualifying.
The amount of the teaching within the various types of adult education and continuing training ranges from a few hours to a full-time course of study of several years’ duration. Depending on the field of study, the teaching is given as full-time, part-time, day, evening and/or distance teaching, and at the workplace.
Facts and Figures 200918
Adult education and continuing train-ing may be publicly and/or privately funded. In some of the publicly funded education programmes, partial user payment has been introduced as a principle. In some programmes, the State furthermore gives grants to fam-ily support.
The general adult education pro-grammes comprise:
• Preparatory adult education (FVU) which gives adults the opportunity to complement their basic skills in reading, spelling and written presentation (FVU reading) as well as number skills, arithmetic and basic mathematical concepts (FVU arithmetic). Both subjects are di-vided into steps, and it is possible to submit to a test after each step. FVU aims at further education.
• General adult education (avu) which is an offer to adults over 18 years of age to improve their knowledge in a series of general subjects, for example Danish, mathematics and social studies. Avu may be concluded with tests corresponding to the 9th
and 10th form in the basic school. The teaching is organised as single subject courses, and it is possible to take several subjects at a time.
• Higher preparatory single subject course (single subject hf) which is meant to give adult participants a general education, knowledge, and qualifications forming the basis for further education or increasing their opportunities in the labour market. Single-subject hf may be concluded with tests corresponding to the upper secondary levels. It is possible to take several subjects at a time and piece them together into a full higher preparatory (hf) examina-tion.
The general adult and continuing training programmes, which are com-pleted with a full qualification, cover level 2-3 in the ISCED97 classification.
The vocational adult education and continuing training programmes comprise:
• Adult vocational training (AMU), which make up a wide, coordinated offer of
vocationally oriented adult educa-tion and continuing training. There are approximately 3000 different adult vocational training pro-grammes and selected single subject courses in the vocational education programmes that target unskilled and skilled workers in public or private employment. It is possible to take several continuing vocational educations consecutively within the same subject field. A diploma from the adult vocational training programmes gives an independent competence to carry out unskilled and skilled job functions in Den-mark. Approximately 150 education programmes are completed with a test, and the participants receive a certificate. The certificate gives a formal competence to perform a job to which the authorities require an authorisation, for instance crane operator.
• Basic adult education (GVU), takes its starting point in the former experi-ences and qualifications of the indi-vidual participant. The participant undergoes a competence evaluation on the background of which an

19The education system
individual education plan is set up. The participant may receive credit for previous education and relevant pro-fessional experience and shall then complement these with relevant elements from the vocational educa-tion programme, the continuing vocational training programme, etc. This way, the participant will attain the same goal and the same profes-sional level and will take the same final test as students who complete a corresponding youth education.
• Higher adult education programmes that build on a youth education. The participants must have several years of professional experience within the subject fields in question. The programmes are offered as open education and correspond to one year of full-time studies. These education programmes are at the same level as the vocational academy pro-grammes.
• Diploma programmes that may be used as continuing and further education and training or advanced level edu-cation. The education programmes are based on a vocational academy
programme, a further education for adults programme or a professional bachelor programme. The partici-pants should have several years of relevant professional experience. The programmes are offered as open edu-cation and correspond to one year of full-time studies. The programmes are at the level of professional bachelor and university bachelor programmes.
• Master’s education programmes that may be used as continuing and further education or advanced level education. The study programmes may build on a university bachelor programme, a professional bachelor programme, a diploma programme or a master’s programme (candida-tus). The participants should have several years of relevant profes-sional experience. The master’s programmes are offered as open education and correspond to 1-1½ years of full-time studies. The educa-tion programmes are at the level of a long-cycle higher education.
• Open education programmes at the voca-tional and the higher education level
furthermore comprise a wide range of single subject and subject-specific courses.
The vocationally oriented adult and continuing training programmes, which lead to a full qualification, cover level 3-5 in the ISCED97 classification.
Other education programmes and of-fers for adults:
• Liberal adult education offers that are education programmes and courses offered by folk high schools, evening schools, adult education associa-tions, etc. The teaching is broad and of a general character.
• Special needs education for adults which are offers to persons with physical or mental handicaps. The offer, which includes training and special needs assistance, has as its purpose to rem-edy and limit the effect of a handi-cap and to give the participants the opportunity of a more active life.
• Assessments of prior learning give adults the opportunity to obtain an as-sessment and accreditation of all
Facts and Figures 200920
those of their abilities that are not documented regardless of where they have obtained them. The as-sessment takes place at the educa-tional institution and in relation to the education that the person wishes to start studying or to have cut short or to have accredited. The arrange-ment applies to all adult and further education programmes up to and including diploma level.
1.3 Pupils, students and educa-tional institutions in the main education system
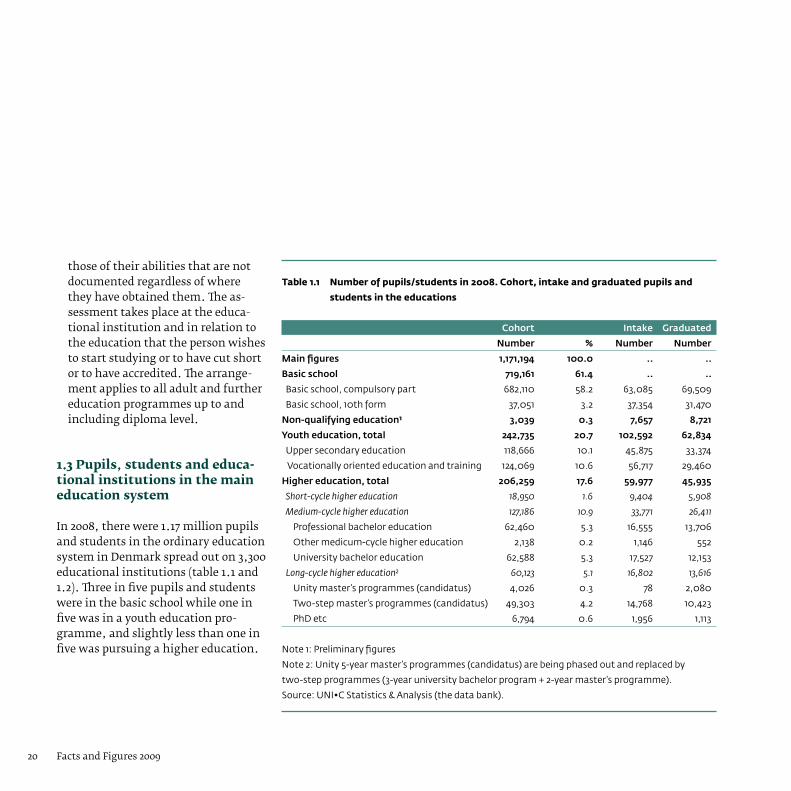
In 2008, there were 1.17 million pupils and students in the ordinary education system in Denmark spread out on 3,300 educational institutions (table 1.1 and 1.2). Three in five pupils and students were in the basic school while one in five was in a youth education pro-gramme, and slightly less than one in five was pursuing a higher education.
Table 1.1 Number of pupils/students in 2008. Cohort, intake and graduated pupils and
students in the educations
Cohort Intake Graduated
Number % Number Number
Mainfigures 1,171,194 100.0 .. ..
Basicschool 719,161 61.4 .. ..
Basic school, compulsory part 682,110 58.2 63,085 69,509
Basic school, 10th form 37,051 3.2 37,354 31,470
Non-qualifyingeducation1 3,039 0.3 7,657 8,721
Youtheducation,total 242,735 20.7 102,592 62,834
Upper secondary education 118,666 10.1 45,875 33,374
Vocationally oriented education and training 124,069 10.6 56,717 29,460
Highereducation,total 206,259 17.6 59,977 45,935
Short-cycle higher education 18,950 1.6 9,404 5,908
Medium-cycle higher education 127,186 10.9 33,771 26,411
Professional bachelor education 62,460 5.3 16,555 13,706
Other medicum-cycle higher education 2,138 0.2 1,146 552
University bachelor education 62,588 5.3 17,527 12,153
Long-cycle higher education2 60,123 5.1 16,802 13,616
Unity master’s programmes (candidatus) 4,026 0.3 78 2,080
Two-step master’s programmes (candidatus) 49,303 4.2 14,768 10,423
PhD etc 6,794 0.6 1,956 1,113
Note 1: Preliminary figures
Note 2: Unity 5-year master’s programmes (candidatus) are being phased out and replaced by
two-step programmes (3-year university bachelor program + 2-year master’s programme).
Source: UNI•C Statistics & Analysis (the data bank).

21The education system
2009
Educationalinstitutions,total 3,291
Basic schools1 2,306
Other basic school education2 336
Other institutions within basic schools3 94
Adult education institutions 194
Upper secondary education 149
Vocational colleges etc 109
Academies of professional higher education 104
University colleges, engineering colleges etc 12
Universities 8
Other institutions with higher education 73
Remark: The table shows legal entities – i.e. main institutions and independent institutions. Main
institutions are administrative units. Each main institution has one or more departments.
Note 1: Comprises municipal and private basic schools and continuation schools (cf. table 5.1).
Note 2: Comprises municipal youth schools and youth boarding schools and special schools for
children. Furthermore, there are special needs day schools and community homes.
Note 3: Comprises home economics and needlecraft schools as well as production schools.
Note 4: Includes North Jutland Academy of Professional Higher Education which was merged with
University College North Jutland on 1 January 2009.
Source: UNI•C Statistics & Analysis.
Table 1.2 Number of educational institutions

Tal der taler22
23The educational level
There are several ways of looking at the educational level of the population. Two ways are presented here:
1. By means of tabulations of the achieved level of education of the population.
2. By means of extrapolations of the present behaviour to future popula-tions.
These two methods are used for dif-ferent purposes. Tabulations of the achieved level of education may be used for comparison and status of the present situation. However, when viewing the present populations, often many changes have taken place since they started in the education system. Extrapolations are most suitable if one desires to learn about the significance of present behaviour for the future. Here, we get a picture of how the future will be if the behaviour that we know today continues.
In this chapter, the education level of the population is illustrated both by looking at the highest education held by persons in the work force and by comparing the education level of the
population in Denmark with that of other OECD countries. In addition, an extrapolation is made of the education level that the current youth cohorts are expected to have in 25 years assuming they educate themselves according to the study behaviour in 2008.
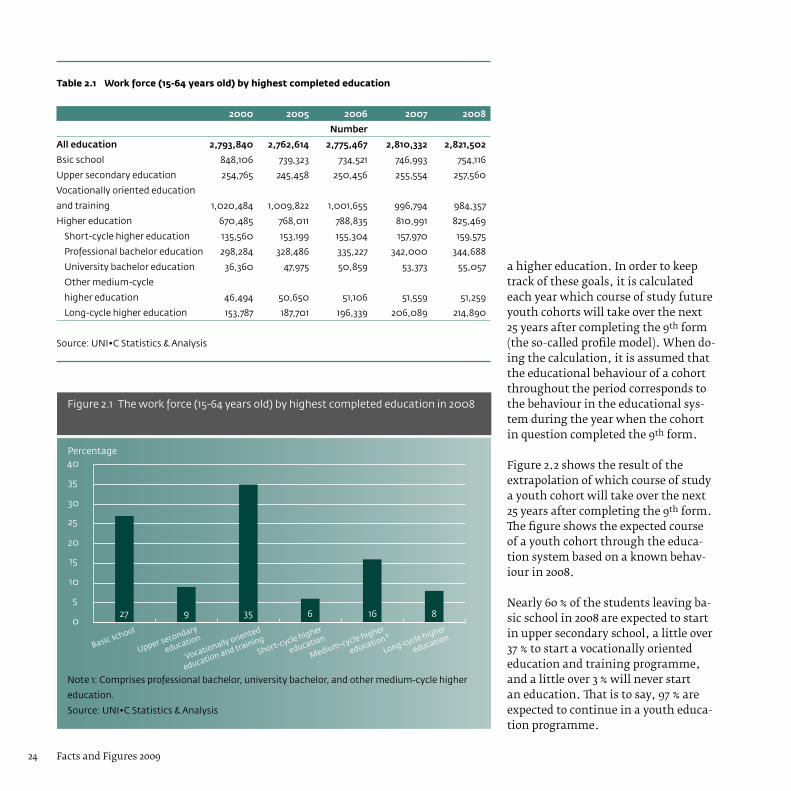
2.1 The highest completed education in the work force
The work force is comprised of persons in the 15-64 age group who are either working or jobless.
In 2008, the work force numbered 2.82 million persons, corresponding to 78 % of the total population in the 15-64 age group. During the period 2005-2008, there was a decrease of just under 59,000 in availability in the Danish labour market (table 2.1).
For one in four in the work force, corresponding to 754,000 individuals, basic school is the highest completed education. 35 %, corresponding to 984,000 individuals, have completed a vocationally oriented education and training, and a proportion of 29 %
of the work force, corresponding to 825,000 individuals, have a higher education (figure 2.1).
In general, the work force has gradu-ally achieved a higher education level. This change is primarily owed to gene-ration differences. The younger youth cohorts in the labour market have a higher education than the youth co-horts who are retiring in these years.
Since 2005, the proportion with basic school as the highest completed educa-tion has been steady at just under 27 %, and the proportion with an upper secondary education has been steady at a good 9 %. During the same period, the total share with a higher education has increased slightly, while the share with a vocationally oriented education has decreased.
2.2 Extrapolation of the educational level of the population
It is the goal of the government that in 2015, 95 % of a youth cohort achieve a youth education, and that 50 % achieve
2 The educational level
Facts and Figures 200924
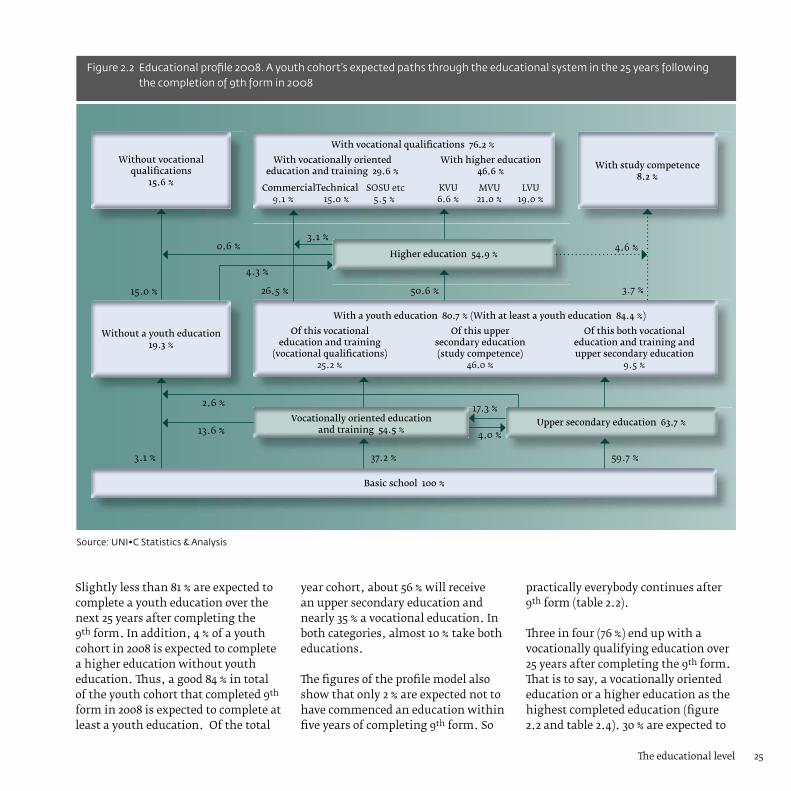
a higher education. In order to keep track of these goals, it is calculated each year which course of study future youth cohorts will take over the next 25 years after completing the 9th form (the so-called profile model). When do-ing the calculation, it is assumed that the educational behaviour of a cohort throughout the period corresponds to the behaviour in the educational sys-tem during the year when the cohort in question completed the 9th form.
Figure 2.2 shows the result of the extrapolation of which course of study a youth cohort will take over the next 25 years after completing the 9th form. The figure shows the expected course of a youth cohort through the educa-tion system based on a known behav-iour in 2008.
Nearly 60 % of the students leaving ba-sic school in 2008 are expected to start in upper secondary school, a little over 37 % to start a vocationally oriented education and training programme, and a little over 3 % will never start an education. That is to say, 97 % are expected to continue in a youth educa-tion programme.
Table 2.1 Work force (15-64 years old) by highest completed education
2000 2005 2006 2007 2008
Number
Alleducation 2,793,840 2,762,614 2,775,467 2,810,332 2,821,502
Bsic school 848,106 739,323 734,521 746,993 754,116
Upper secondary education 254,765 245,458 250,456 255,554 257,560
Vocationally oriented education
and training 1,020,484 1,009,822 1,001,655 996,794 984,357
Higher education 670,485 768,011 788,835 810,991 825,469
Short-cycle higher education 135,560 153,199 155,304 157,970 159,575
Professional bachelor education 298,284 328,486 335,227 342,000 344,688
University bachelor education 36,360 47,975 50,859 53,373 55,057
Other medium-cycle
higher education 46,494 50,650 51,106 51,559 51,259
Long-cycle higher education 153,787 187,701 196,339 206,089 214,890
Source: UNI•C Statistics & Analysis
0
5
10
15
20
25
30
35
40Percentage
Long-cycle higher
education
Medium-cycle higher
education 1
Short-cycle higher
education
Vocationally oriented
education and trainingUpper secondary
educationBasic school
2005 2006 2007 2008
27 9 35 6 16 8
Figure 2.1 The work force (15-64 years old) by highest completed education in 2008
Note 1: Comprises professional bachelor, university bachelor, and other medium-cycle higher
education.
Source: UNI•C Statistics & Analysis
25Th e educational level
Figure 2.2 Educational profi le 2008. A youth cohort’s expected paths through the educational system in the 25 years following the completion of 9th form in 2008
Without vocational qualifi cations
15.6 %
Without a youth education 19.3 %
With vocational qualifi cations 76.2 %
With vocationally oriented With higher education education and training 29.6 % 46.6 %
Commercial Technical SOSU etc KVU MVU LVU 9.1 % 15.0 % 5.5 % 6.6 % 21.0 % 19.0 %
With a youth education 80.7 % (With at least a youth education 84.4 %)
Of this vocational Of this upper Of this both vocational education and training secondary education education and training and (vocational qualifi cations) (study competence) upper secondary education 25.2 % 46.0 % 9.5 %
Vocationally oriented education and training 54.5 %
Higher education 54.9 %
Upper secondary education 63.7 %
With study competence 8.2 %
Basic school 100 %
Source: UNI•C Statistics & Analysis
4.6 %3.1 %
0.6 %
2.6 %
13.6 % 4.0 %
17.3 %
4.3 %
15.0 %
3.1 %
3.7 %50.6 %26.5 %
59.7 %37.2 %
Slightly less than 81 % are expected to complete a youth education over the next 25 years after completing the 9th form. In addition, 4 % of a youth cohort in 2008 is expected to complete a higher education without youth education. Th us, a good 84 % in total of the youth cohort that completed 9th form in 2008 is expected to complete at least a youth education. Of the total
year cohort, about 56 % will receive an upper secondary education and nearly 35 % a vocational education. In both categories, almost 10 % take both educations.
Th e fi gures of the profi le model also show that only 2 % are expected not to have commenced an education within fi ve years of completing 9th form. So
practically everybody continues after 9th form (table 2.2).
Th ree in four (76 %) end up with a vocationally qualifying education over 25 years after completing the 9th form. Th at is to say, a vocationally oriented education or a higher education as the highest completed education (fi gure 2.2 and table 2.4). 30 % are expected to
Facts and Figures 200926
Table 2.2 Proportion of a youth cohort that is expected to continue an education within
5 years of completing the 9th form
2005 2006 2007 2008
%
10th form 54.5 51.7 49.5 49.4
Vocationally oriented education and training 15.2 16.2 16.6 16.3
Upper secondary education 28.3 29.9 31.7 32.5
Not in education 2.0 2.3 2.2 1.9
Source: UNI•C Statistics & Analysis. Profile model 2008
Table 2.3 Proportion of a youth cohort that is expected to attain at least a youth
education during the 25 years following the completion of 9th form
2000 2005 2006 2007 2008
%
Youtheducation 83.3 81.9 81.5 80.6 80.7
Of this:
– upper secondary education 52.2 55.0 54.6 54.0 55.5
– vocationally oriented education
and training 42.9 38.5 37.8 36.8 34.7
– both upper secondary education
and vocationally oriented education
and training 11.8 11.5 11.0 10.2 9.5
Proportion with higher education
without youth education 4.0 4.4 4.3 4.1 3.7
Atleastayoutheducation 87.3 86.3 85.8 84.7 84.4
Source: UNI•C Statistics & Analysis. Profile model 2008
receive a vocationally oriented educa-tion. This proportion is split in 9 % in commercial, 15 % in technical, and 6 % in another vocationally oriented educa-tion (mainly social and health care). Almost 47 % end up with a higher education – of these 7 % with a short-cycle higher education (KVU), 21 % with a medium-cycle higher educa-tion (MVU), and 19 % with a long-cycle higher education (LVU).
The 25-year extrapolation of the youth cohorts in the period 2000-2008 shows that the proportion that will attain an upper secondary education has increased since 2000, whereas the proportion that will attain a vocation-ally oriented education has dropped markedly (table 2.3).
Regarding the qualifications 25 years after the completion of 9th form, the extrapolations show that the propor-tion of the youth cohorts that will complete an education giving profes-sional competence has dropped during the 2000-2008 period (table 2.4).
If instead of considering the quali-fications 25 years after 9th form, one
looks at qualifications 5 years after the completion of 9th form, the extrapo-lations show that the proportion of youth cohorts that is expected to attain a youth education has increased in the 2005-2008 period (table 2.5). Whereas 62 % of a youth cohort in 2005 was
expected to attain a youth education 5 years after completing 9th form, it was 64 % in 2008. This corresponds to an Increase of a good 3 %.
27The educational level
2.3 Projected educational level tabulated by gender and ethnicity
There is a difference in how boys and girls with Danish, respectively another ethnic origin, manage in the educa-tional system. Around 84 % of the girls of Danish origin will achieve a youth education, whereas this is only the case for 79 % of the boys (figure 2.3).
The proportion of pupils of ethnic ori-gin other than Danish who achieve a youth education is generally less than the proportion of pupils of Danish origin. Nearly 77 % of the girls of ethnic origin other than Danish achieve a youth education in contrast to 66 % of the boys (figure 2.3).
It is noteworthy that there are more pupils of an ethnic origin other than Danish who do not take a youth education but nonetheless qualify for, and subsequently complete, a higher education through professional quali-fications and higher preparatory single subject courses.
Table 2.4 Youth cohorts tabulated according to expected educational qualifications
25 years after completing 9th form
2000 2005 2006 2007 2008
%
Withvocationalqualifications 79.8 78.5 77.9 77.1 76.2
Vocationallyorientededucationandtraining 33.9 30.6 30.4 30.6 29.6
Commercial education 9.7 8.1 7.9 8.4 9.1
Technical education 18.2 16.0 16.2 16.4 15.0
Social and health education etc 6.0 6.6 6.3 5.8 5.5
Highereducation 45.9 47.9 47.4 46.5 46.6
Short-cycle higher education 9.1 7.1 7.1 6.6 6.6
Medium-cycle higher education 23.0 24.7 23.6 21.7 21.0
Long-cycle higher education 13.8 16.1 16.8 18.2 19.0
Withoutvocationalqualifications 20.2 21.5 22.1 22.9 23.8
Only study qualifications (upper
secondary education) 7.4 7.8 7.9 7.6 8.2
Directly from basic school 3.3 3.1 3.2 3.3 2.8
After discontinued education 9.4 10.6 11.0 12.0 12.8
Source: UNI•C Statistics & Analysis. Profile model 2008
Table 2.5 Proportion of a youth cohort that is expected to attain at least a youth
education during the 5 years following the completion of 9th form
2000 2005 2006 2007 2008
%
Ungdomsuddannelse 62,6 62,0 62,3 63,3 64,0
Youtheducation 62.6 62.0 62.3 63.3 64.0
Of this:
– upper secondary education 47.0 49.1 49.1 49.6 51.5
– vocationally oriented education and training 16.2 13.6 13.9 14.4 13.2
– both upper secondary education and vocation-
ally oriented education and training 0.7 0.7 0.7 0.7 0.6
Proportion with higher education
without youth education 0.4 0.5 0.6 0.4 0.4
Atleastayoutheducation 63.0 62.5 62.9 63.7 64.4
Source: UNI•C Statistics & Analysis. Profile model 2008

Facts and Figures 200928
It is projected that 25 years after completion of the 9th form, 81 % of the girls will have completed an educa-tion leading to a vocationally oriented education and training or a higher education. It is projected that nearly 72 % of the boys will have completed an education leading to a vocational quali-fication (figure 2.4).
It is projected that regardless of ethnic origin, a larger proportion of the girls will attain an education leading to a vocational qualification. Nearly 82 % of the girls of Danish origin and nearly 74 % of the girls with another ethnic origin are expected to attain an educa-tion leading to a vocational qualifica-tion in contrast to respectively 73 % and 58 % of the boys (figure 2.4).
If, instead of considering the qualifica-tions 25 years after completion of the 9th form, one looks at qualifications 5 years after the completion of the 9th form, the extrapolations show that the proportion of pupils of ethnic origin other than Danish that are expected to attain a youth education has increased markedly from 2005 to 2008 (table 2.6). In 2005, the share of pupils of ethnic
Figure 2.3 Proportion of a youth cohort that is projected to attain at least a youth education in the course of 25 years after completing 9th form, tabulated by gender and ethnicity.
Source: UNI•C Statistics & Analysis. Profile model 2008
0
10
20
3040
50
60
70
80
90
100
GirlsBoysGirlsBoysGirlsBoys
2005 2006 2007 2008
Percentage
Ethnic origin other than Danish
Danish originAll
33 26 34 26 23 23
3855
38
56 35 50
28
19
27
18
42
27
■ Vocationally oriented education and training ■ Higher education ■ Without vocational qualifications
Figure 2.4 Educational qualifications of the youth cohort in 2008, 25 years after completing 9th form, tabulated by gender and ethnicity
Source: UNI•C Statistics & Analysis. Profile model 2008
0
10
20
30
40
50
60
70
80
90Percentage
GirlsBoysGirlsBoysGirlsBoysEthnic origin other
than DanishDanish originAll
39 53 39 53 40 49
30
20
31
20
21
20
910 9 11
5
7
■ Upper secondary education ■ Vocationally oriented education and training ■ – of this both qualifications

29Tal der taler
Facts and Figures 200930
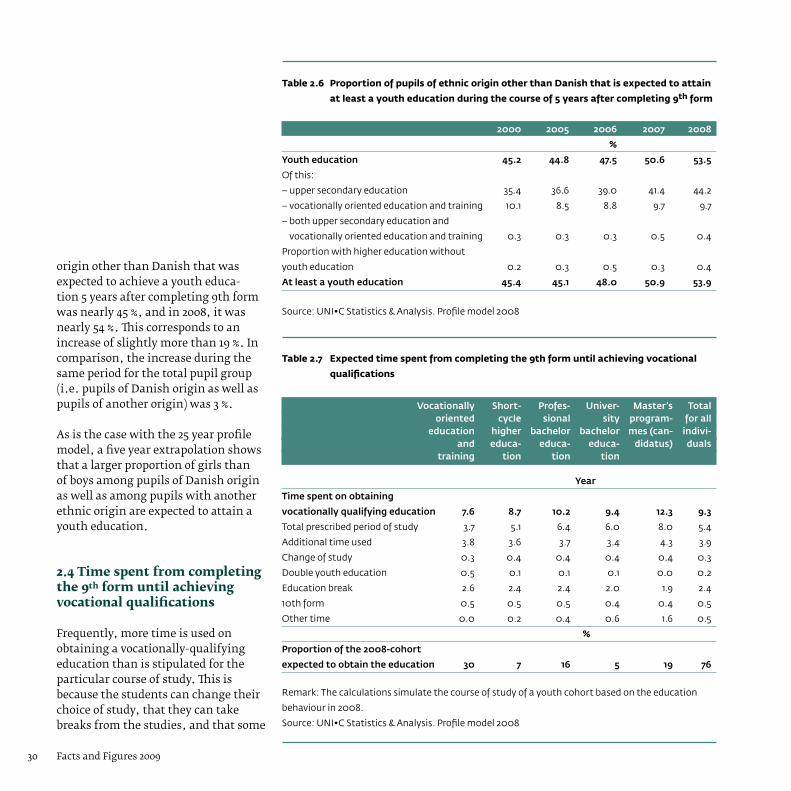
origin other than Danish that was expected to achieve a youth educa-tion 5 years after completing 9th form was nearly 45 %, and in 2008, it was nearly 54 %. This corresponds to an increase of slightly more than 19 %. In comparison, the increase during the same period for the total pupil group (i.e. pupils of Danish origin as well as pupils of another origin) was 3 %.
As is the case with the 25 year profile model, a five year extrapolation shows that a larger proportion of girls than of boys among pupils of Danish origin as well as among pupils with another ethnic origin are expected to attain a youth education.
2.4 Time spent from completing the 9th form until achieving vocational qualifications
Frequently, more time is used on obtaining a vocationally-qualifying education than is stipulated for the particular course of study. This is because the students can change their choice of study, that they can take breaks from the studies, and that some
Table 2.6 Proportion of pupils of ethnic origin other than Danish that is expected to attain
at least a youth education during the course of 5 years after completing 9th form
2000 2005 2006 2007 2008
%
Youtheducation 45.2 44.8 47.5 50.6 53.5
Of this:
– upper secondary education 35.4 36.6 39.0 41.4 44.2
– vocationally oriented education and training 10.1 8.5 8.8 9.7 9.7
– both upper secondary education and
vocationally oriented education and training 0.3 0.3 0.3 0.5 0.4
Proportion with higher education without
youth education 0.2 0.3 0.5 0.3 0.4
Atleastayoutheducation 45.4 45.1 48.0 50.9 53.9
Source: UNI•C Statistics & Analysis. Profile model 2008
Table 2.7 Expected time spent from completing the 9th form until achieving vocational
qualifications
Vocationally Short- Profes- Univer- Master’s Total oriented cycle sional sity program- forall education higher bachelor bachelor mes(can- indivi- and educa- educa- educa- didatus) duals training tion tion tion
Year
Timespentonobtaining
vocationallyqualifyingeducation 7.6 8.7 10.2 9.4 12.3 9.3
Total prescribed period of study 3.7 5.1 6.4 6.0 8.0 5.4
Additional time used 3.8 3.6 3.7 3.4 4.3 3.9
Change of study 0.3 0.4 0.4 0.4 0.4 0.3
Double youth education 0.5 0.1 0.1 0.1 0.0 0.2
Education break 2.6 2.4 2.4 2.0 1.9 2.4
10th form 0.5 0.5 0.5 0.4 0.4 0.5
Other time 0.0 0.2 0.4 0.6 1.6 0.5
%
Proportionofthe2008-cohort
expectedtoobtaintheeducation 30 7 16 5 19 76
Remark: The calculations simulate the course of study of a youth cohort based on the education
behaviour in 2008.
Source: UNI•C Statistics & Analysis. Profile model 2008

31The educational level
choose to take more than one youth education.
The profile model extrapolations in table 2.7 show the combined time the students are expected to use to attain a vocationally qualifying education. The total prescribed period of study corresponds to the straight course from 9th form graduation to the completion of a vocationally-qualifying education. The prescribed period of study for a primary and lower secondary school teacher is three years in upper second-ary school and four years in a teacher’s training college, a total of seven years1. This is not the only road to a primary and lower secondary school teacher’s education, but it is the fastest.
Furthermore, the table shows the additional time used by the students after completing the 9th form. The additional time comprises: 1) change of studies, referring to the time used on a study programme not completed,
2) double youth education, mean-ing the time used on another youth education after having completed one youth education, 3) an education break, referring to the time not used for education, for instance for work, military service, travelling etc, 4) 10th form since the 10th form is optional, and 5) other time, mainly covering an extended time to complete the study programme.
In average, a student uses 9.3 years after the 9th form to obtain an educa-tion. Of these, 5.4 years are used on the prescribed period of study and 3.9 years on additional time. The largest
part of the additional time is used on an education break of 2.4 years. In average, 10th form and other time each constitute 0.5 years, whereas change of studies and a double youth educa-tion in average constitute 0.3 years and 0.2 years respectively. The average time used on change of study and on 10th form are practically independent of which education is taken, while other types of time used vary depending on education programme.
The longest education break is found in vocationally oriented education and training programmes, short-cycle higher education, and professional
¹ In practice a little less than seven years because most education programmes start in August/September and end in Juni.
0
1
2
3
4
5Year
Total for alle personerKandidatuddannelserUniversitetsbachelorProfessionsbachelorKorte videregående uddannelserErhvervsfaglige uddannelser
Total for all
individualsMaster’s
programmes
(candidatus)University
bachelor
educationProfessional
bachelor
educationShort-cycle
higher
educationVocationally
oriented education
and training
■ Change of studies ■ Double youth education ■ Ecuational break ■ 10th form ■ Other time
Figure 2.5 Additional time spent by students to achieve vocational qualifications
Source: UNI•C Statistics & Analysis. Profile model 2008
Facts and Figures 200932
bachelor education, while the univer-sity students take the shortest breaks.In the vocationally oriented education and training programmes, an average of 3.7 years is used on prescribed period of study. An additional 3.8 years are used on completing the education. A double youth education is naturally most common in the vocational educa-tion and training programmes because many choose to take an upper second-ary education as well as a vocationally oriented education.
With 3.4 years, the university bach-elors have the least extra use of time. Here, the remnant time, which pri-marily covers a delay in the duration of study, is also the shortest. Note that only students who do not continue in a master’s programme (candidatus) are counted here. The majority by far continue in a master’s programme (candidatus), and they are therefore counted in that category.
With 4.3 years, the master’s students (candidatus) have the highest use of extra time. Their break in education is less than average; but especially the
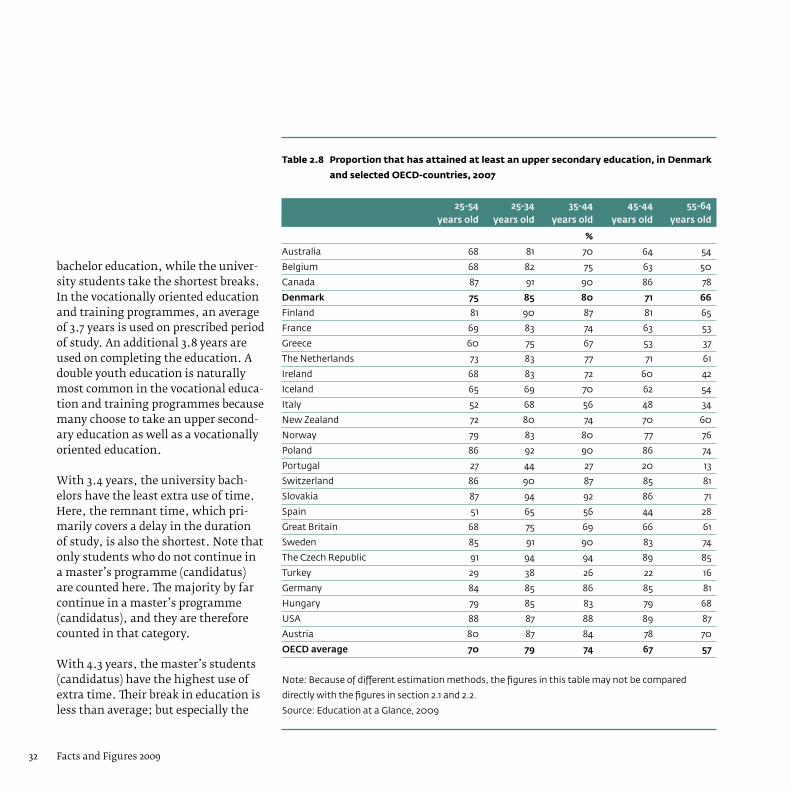
Table 2.8 Proportion that has attained at least an upper secondary education, in Denmark
and selected OECD-countries, 2007
25-54 25-34 35-44 45-44 55-64 yearsold yearsold yearsold yearsold yearsold
%
Australia 68 81 70 64 54
Belgium 68 82 75 63 50
Canada 87 91 90 86 78
Denmark 75 85 80 71 66
Finland 81 90 87 81 65
France 69 83 74 63 53
Greece 60 75 67 53 37
The Netherlands 73 83 77 71 61
Ireland 68 83 72 60 42
Iceland 65 69 70 62 54
Italy 52 68 56 48 34
New Zealand 72 80 74 70 60
Norway 79 83 80 77 76
Poland 86 92 90 86 74
Portugal 27 44 27 20 13
Switzerland 86 90 87 85 81
Slovakia 87 94 92 86 71
Spain 51 65 56 44 28
Great Britain 68 75 69 66 61
Sweden 85 91 90 83 74
The Czech Republic 91 94 94 89 85
Turkey 29 38 26 22 16
Germany 84 85 86 85 81
Hungary 79 85 83 79 68
USA 88 87 88 89 87
Austria 80 87 84 78 70
OECDaverage 70 79 74 67 57
Note: Because of different estimation methods, the figures in this table may not be compared
directly with the figures in section 2.1 and 2.2.
Source: Education at a Glance, 2009

33The educational level
other time of 1.6 years is much higher than in other education programmes.
2.5 International comparison of the level of education
OECD sums up the proportion of dif-ferent age groups that have at least a youth education. It holds good for all age groups that Denmark lies above the OECD average as regards the share of the population of working age (25-64 years) that has at least a youth educa-tion (table 2.8).
The table shows that a greater propor-tion of the youngest age group has as a minimum a youth education than that of the older age groups. This holds true for Denmark as well as for the other OECD countries. Generally, the differ-ence in level of education between the 25-34 years old and the 55-64 years old is slightly less in the countries where the most 25-34 years old have at least a youth education.
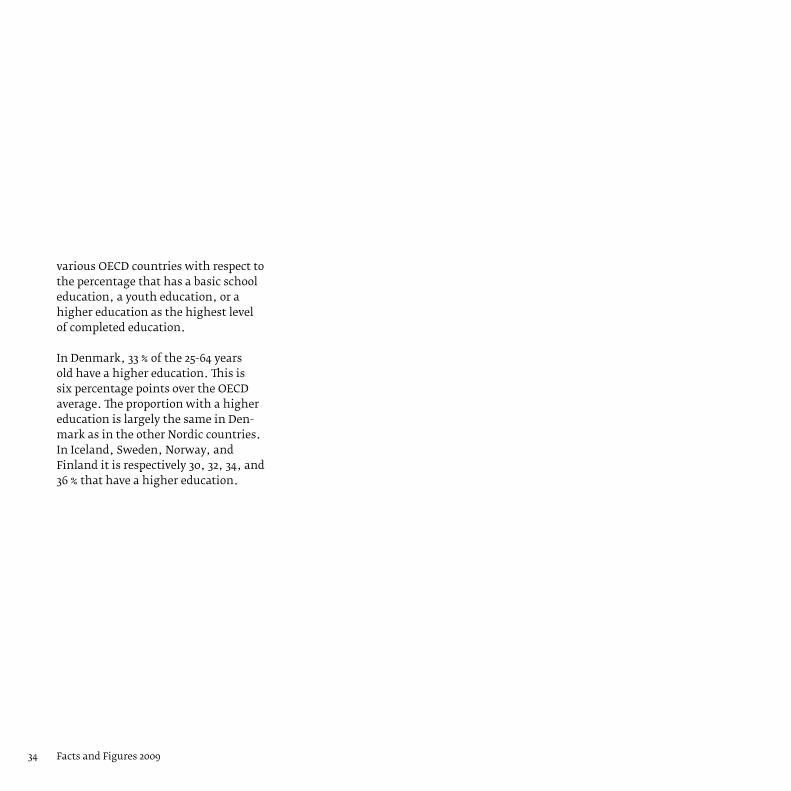
Table 2.9 shows the highest level of completed education in the population (25-64 years old). The table compares
Table 2.9 The distribution of the population with respect to highest level of completed
education, in Denmark and selected OECD countries, 2007
Basic Youth Higher school education education
%
Australia 32 33 34
Belgium 32 36 33
Canada 13 38 49
Denmark 25 43 33
Finland 20 44 36
France 31 42 27
Greece 40 37 22
The Netherlands 27 42 31
Ireland 32 36 32
Iceland 36 34 30
Italy 48 38 14
New Zealand 29 30 41
Norway 21 44 34
Poland 14 68 19
Portugal 72 14 14
Switzerland 12 55 32
Slovakia 13 73 14
Spain 49 22 29
Great Britain 32 37 32
Sweden 16 53 32
The Czech Republic 9 76 14
Turkey 71 18 11
Germany 16 60 24
Hungary 20 61 17
USA 12 48 40
Austria 19 62 17
OECDaverage 30 44 27
Note: Because of different estimation methods, the figures in this table may not be compared
directly with the figures in section 2.1 and 2.2.
Source: Education at a Glance, 2009
Facts and Figures 200934
various OECD countries with respect to the percentage that has a basic school education, a youth education, or a higher education as the highest level of completed education.
In Denmark, 33 % of the 25-64 years old have a higher education. This is six percentage points over the OECD average. The proportion with a higher education is largely the same in Den-mark as in the other Nordic countries. In Iceland, Sweden, Norway, and Finland it is respectively 30, 32, 34, and 36 % that have a higher education.
35Finances
3.1 Average public expenditure on various educations
Table 3.1 sums up the average grants to operating costs from the State and the municipalities per field of edu-cation. In the table, the education programmes are subdivided in five categories: basic school, boarding schools, youth educations, higher education, and adult education and continuing training.
The average operating grant covers all the expenses of the State and the mu-nicipalities to education programmes that are disbursed to the institutions excluding user payments/fees. As a rule, there are user payment/tuition fees in the private basic schools, the private boarding schools, private upper secondary schools, and in adult educa-tion and continuing training except at the vocational training school courses (TAMU).
The education programmes do not have the same grant principles. Some institutions receive grants if the pupils participate in the education, whereas other only receive the grant when the
pupils have passed in their subject. Some own their buildings while other rent their buildings and so on. Com-paring the educational fields across is therefore encumbered with meth-odology problems and subsequently a certain uncertainty.
The table gives an overview of public education expenses in the various educational fields corresponding to the education on one pupil during one year. As shown by the table, there is a wide variation because of the different lengths, contents, and organisation of the education programmes.
The education programmes where fellowship and residence is an integral part of the school form, for instance the private boarding schools, receive a higher average grant than the other education areas. This is so because these education programmes have additional expenses in connection with operating boarding facilities, and therefore, the unity grant cannot be compared directly with other educa-tional areas.
Finally, it should be emphasised that an operating grant average does not make it possible to compare across areas how much it costs to educate one pupil/student. For instance, the different lengths and organisation of the education programmes imply that while the unit grant in the upper sec-ondary education programmes largely correspond to the grant for the educa-tion of one pupil in one year, the unit grants in the vocationally oriented education programmes correspond to two to three years education per pupil because the pupils also have periods of practice during the course of their education. 3.2 Public expenditure on adult education and continuing training
Adult education and continuing train-ing (VEU) is divided in three different types of educational levels:
• The general VEU • The vocationally oriented VEU • The higher VEU
3 Finances

Facts and Figures 200936
Table 3.1 Average operating grant per educational area financed by the State or a municipality in 2008
Averagegrant Statedperunit
DKKmillionin2009-prices
Basicschools
Private basic schools 46,000 full time equivalent pupil
Municipal basic school1 63,400 pupil
Privateindependentschools
8th - 9th form continuation schools 110,000 full time equivalent student
10 th form continuation schools 103,000 full time equivalent student
Folk high schools 112,000 full time equivalent student
Home economics and needlework schools 134,000 full time equivalent student
Youtheducations
Production schools 95,000 full time equivalent student
Technical vocational education and training 111,000 full time equivalent student
Commercial vocational education and training 70,000 full time equivalent student
Public upper secondary schools2 83,000 full time equivalent student
Private upper secondary schools 78,000 full time equivalent student
Hhx 62,000 full time equivalent student
Htx 83,000 full time equivalent student
Highereducation
Vocational academy education 87,000 student full time equivalent
Professional bachelor educations 73,000 student full time equivalent
Long-cycle higher education (universities) 68,400 student full time equivalent
Adulteducationandcontinuingtraining
Vocational training schools (TAMU) 125,000 full time equivalent student
Continuing vocational training (AMU) 132,000 full time equivalent student
General adult education (VUC)2 102,000 full time equivalent student
Open education and part-time education at vocational education and training level 39,000 full time equivalent student
Open education at higher education level 24,000 full time equivalent student
Note 1: Incl. special needs education.
Note 2: Among other things, the average grant per full time equivalent student / student full time equivalent depends on whether the institutions own
their buildings or not and receive building taximeter grant. To enhance comparability, a hypothetical grant has been added for the buildings of the public
upper secondary schools and general adult education schools (VUC) corresponding to the grant they would have received if they themselves, like other
institutions under the Danish Ministry of Education, had had to defray all expenses in connection with the ownership of buildings.
Source: The Danish Ministry of Education, 2009

37Finances
The general VEU encompasses prepara-tory adult education (FVU), general adult education (avu), and the upper secondary educations (single subject courses within hf, hhx, htx, and stx). The vocationally oriented VEU is concerned with adult vocational train-ing (AMU) and the pedagogical basic education (vocational basic education, EUD, as single subject courses) etc.
Higher VEU comprises various single subject courses in short-, medium-, and long-cycle higher education programmes. Furthermore, there is a series of short- and medium-cycle higher education programmes under open education such as the accelerated primary and lower secondary teacher training programme with award of credit for prior learning, meritlære-ruddannelse. Besides, there are study
activities relating to diploma and master’s programmes.
In 2008, the public operating grants for all three VEU types amounted to almost DKK 3 billion at 2009 prices (table 3.2).
There are various options for compen-sation of loss of income during adult education and continuing training (ta-ble 3.3). Approximately DKK 1.7 billion has been disbursed as compensation for loss of salary in connection with adult education and continuing train-ing activities in 2008. This expense is on top of the operating grant to adult education and continuing training. The compensation for loss of salary is paid either as VEU allowance or as state educational support for adults (SVU).
The expense to VEU allowance, which in 2008 amounted to approximately DKK 1.3 billion (2009 prices), is aimed at persons who participate in adult education and continuing training at an educational level up to and includ-ing the vocational education and training (including AMU).
Table 3.2 Public operational expenditure grant per type of VEU
2005 2006 2007 2008
DKKmillionin2009-prices
Operationalexpendituregrant,total 2,904 -- 2,751 2,978
General educations 1,330 -- 1,303 1,274
Vocational education and training programmes 1,173 1,184 1,145 1,358
Higher education 401 338 330 387
Remark: The table does not include expenditure on popular enlightenment (folk high schools,
evening courses and day folk high schools), special needs education for adults or expenditure on
Danish courses for foreigners. The education in question only addresses persons who work.
Source: The public accounts and Finance Acts
Table 3.3 Restitution expenses
2005 2006 2007 2008
DKKmillionin2009-prices
Restitutionexpenses,total 1,744 1,633 1,506 1,651
VEU-allowance 1,274 1,168 1,111 1,289
SVU-general 125 107 70 72
SVU-advanced 345 359 325 290
Remark: The table does not include expenditure on popular enlightenment (folk high schools,
evening courses and day folk high schools), special needs education for adults or expenditure on
Danish courses for foreigners.
Source: The public accounts and Finance Acts
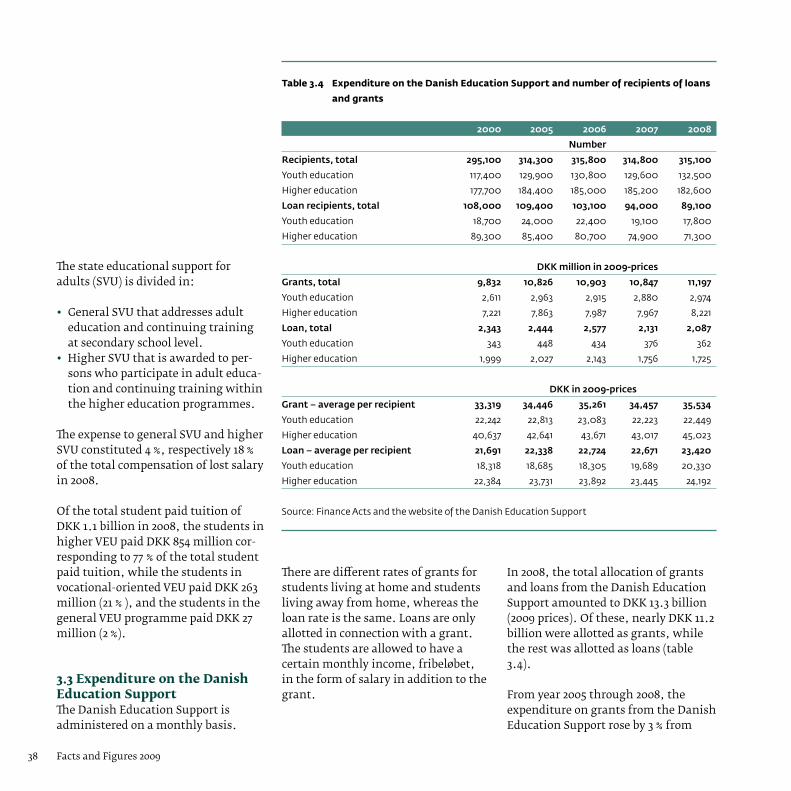
Facts and Figures 200938
The state educational support for adults (SVU) is divided in:
• General SVU that addresses adult education and continuing training at secondary school level.
• Higher SVU that is awarded to per-sons who participate in adult educa-tion and continuing training within the higher education programmes.
The expense to general SVU and higher SVU constituted 4 %, respectively 18 % of the total compensation of lost salary in 2008.
Of the total student paid tuition of DKK 1.1 billion in 2008, the students in higher VEU paid DKK 854 million cor-responding to 77 % of the total student paid tuition, while the students in vocational-oriented VEU paid DKK 263 million (21 % ), and the students in the general VEU programme paid DKK 27 million (2 %).
3.3 Expenditure on the Danish Education Support The Danish Education Support is administered on a monthly basis.
Table 3.4 Expenditure on the Danish Education Support and number of recipients of loans
and grants
2000 2005 2006 2007 2008
Number
Recipients,total 295,100 314,300 315,800 314,800 315,100
Youth education 117,400 129,900 130,800 129,600 132,500
Higher education 177,700 184,400 185,000 185,200 182,600
Loanrecipients,total 108,000 109,400 103,100 94,000 89,100
Youth education 18,700 24,000 22,400 19,100 17,800
Higher education 89,300 85,400 80,700 74,900 71,300
DKKmillionin2009-prices
Grants,total 9,832 10,826 10,903 10,847 11,197
Youth education 2,611 2,963 2,915 2,880 2,974
Higher education 7,221 7,863 7,987 7,967 8,221
Loan,total 2,343 2,444 2,577 2,131 2,087
Youth education 343 448 434 376 362
Higher education 1,999 2,027 2,143 1,756 1,725
DKKin2009-prices
Grant–averageperrecipient 33,319 34,446 35,261 34,457 35,534
Youth education 22,242 22,813 23,083 22,223 22,449
Higher education 40,637 42,641 43,671 43,017 45,023
Loan–averageperrecipient 21,691 22,338 22,724 22,671 23,420
Youth education 18,318 18,685 18,305 19,689 20,330
Higher education 22,384 23,731 23,892 23,445 24,192
Source: Finance Acts and the website of the Danish Education Support
There are different rates of grants for students living at home and students living away from home, whereas the loan rate is the same. Loans are only allotted in connection with a grant. The students are allowed to have a certain monthly income, fribeløbet, in the form of salary in addition to the grant.
In 2008, the total allocation of grants and loans from the Danish Education Support amounted to DKK 13.3 billion (2009 prices). Of these, nearly DKK 11.2 billion were allotted as grants, while the rest was allotted as loans (table 3.4).
From year 2005 through 2008, the expenditure on grants from the Danish Education Support rose by 3 % from

39Finances
DKK 10.8 billion to DKK 11.2 billion (2009 prices).
During the same period, the number of grant recipients was stable at 315,000, whereas the number of loan recipients fell from 109,000 to 89,000, corresponding to a decrease of nearly 19 %.
It emerges from the table that the total expense to the Danish Education Support at constant prices has been relatively stable at DKK 13 billion in recent years. Furthermore, it is noted that most is spent on higher education – both for loans and grants. The pro-portion spent on loans to students in youth education is relatively modest.
3.4 Public expenditure on educa-tion as a percentage of total public expenditure in Denmark and selected countries
In 2006, Denmark used 15.6 % of the total public expenditure on education (table 3.5). This puts Denmark slightly over the OECD average of 13.3 %, but be-
Table 3.5 Public expenditure on education as a percentage of total public expenditure in
Denmark and selected OECD-countries, 2006
Basicschooland Higher All youtheducation educations1 educations2
%
Australia 10.3 3.4 13.9
Belgium 8.2 2.7 12.4
Canada 7.7 4.1 11.8
Denmark 9.4 4.4 15.6
Finland 7.9 4.0 12.6
France 7.1 2.3 10.6
The Netherlands 7.8 3.3 12.0
Ireland 11.0 3.4 14.4
Iceland 12.4 3.3 18.1
Italy 6.9 1.6 9.5
Japan 7.0 1.7 9.5
New Zealand 12.7 5.1 18.9
Norway 9.8 5.1 16.2
Poland 8.6 2.2 12.0
Portugal 8.0 2.2 11.3
Switzerland 8.7 3.4 12.8
Slovakia 12.5 4.6 19.5
Spain 7.2 2.5 11.1
Great Britain 8.7 2.4 11.9
Sweden 8.1 3.4 12.6
The Czech Republic 6.5 2.3 10.1
Germany 6.3 2.5 9.7
Hungary 6.5 2.0 10.4
USA 10.0 3.9 14.8
Austria 7.2 3.0 11.0
OECD-average 9.0 3.1 13.3
Remark: The expenditures in these statistics comprise all public expenditure on education including
student grants etc.
Note 1: The expenses on higher educational institutions include teaching, services, and research.
Note 2: The sum of the education levels shown do not correspond in all cases to the number for “All
education” because not all expenditure is included in the two preceding columns.
Source: Education at a Glance, 2009

Facts and Figures 200940
low the share of Iceland, New Zealand, Norway, and Slovakia.
The expenditures in these statistics comprise all public expenditure on education including student grants etc. The elevated expenses to higher education in Denmark may in part be ascribed to the relatively high expenses to financial grants to the students.
3.5 Total public and private expenditures on educational institutions in Denmark and selected countries
Compared to other countries, Den-mark uses relatively many resources on education at all levels. In the year 2006, the total expenditure (public and private) on educational institutions in Denmark amounted to 7.3 % of the gross domestic product. In Denmark, the private expenditure on education is far less than the public expenditure on education. On the other hand, in USA, the difference between private and public expenditure is not as pronounced.
Table 3.6 Total public and private expenditure on educational institutions as a percentage
of GDP in Denmark and selected OECD-countries, 2006
Youth Higher All Pre-school1 Basicschool education educations2 educations3
%ofGDP
Australia 0.1 3.0 0.9 1.6 5.7
Belgium 0.6 1.5 2.6 1.3 6.1
Denmark 0.7 3.1 1.4 1.7 7.3
Finland 0.4 2.4 1.4 1.7 5.8
France 0.7 2.5 1.4 1.3 5.9
The Netherlands 0.4 2.6 1.2 1.5 5.6
Iceland 0.9 3.8 1.5 1.1 8.0
Italy 0.5 2.1 1.4 0.9 4.9
Japan 0.2 2.0 0.9 1.5 5.0
New Zealand 0.3 2.8 1.4 1.5 6.3
Norway4 0.3 2.5 1.2 1.2 5.4
Poland 0.6 2.6 1.1 1.3 5.7
Portugal 0.4 2.6 1.0 1.4 5.6
Switzerland 0.2 2.6 1.6 1.4 5.9
Slovakia 0.5 1.7 1.0 1.0 4.3
Great Britain5 0.3 2.8 1.5 1.3 5.9
Sweden 0.6 2.8 1.3 1.6 6.3
The Czech Republic 0.5 1.8 1.1 1.2 4.8
Germany 0.5 1.9 1.0 1.1 4.8
Hungary 0.8 2.2 1.1 1.1 5.6
USA 0.4 3.0 1.0 2.9 7.4
Austria 0.5 2.4 1.3 1.3 5.5
OECD-average 0.5 2.5 1.2 1.4 5.7
Note 1: Pre-school comprises pre-school class and kindergarten for 3-6 years old.
Note 2: Expenditure on higher educational institutions comprises teaching as well as services and
research.
Note 3: The sums for the education levels shown do not correspond to the number for “All education”
in all cases because not all expenditure is included in the preceding columns.
Note 4: Comprises only public expenditure.
Note 5: Column 2 refers to 1st-6th form, and column 3 refers to 7th-10th form and youth education.
Source: Education at a Glance, 2009

41Tal der taler
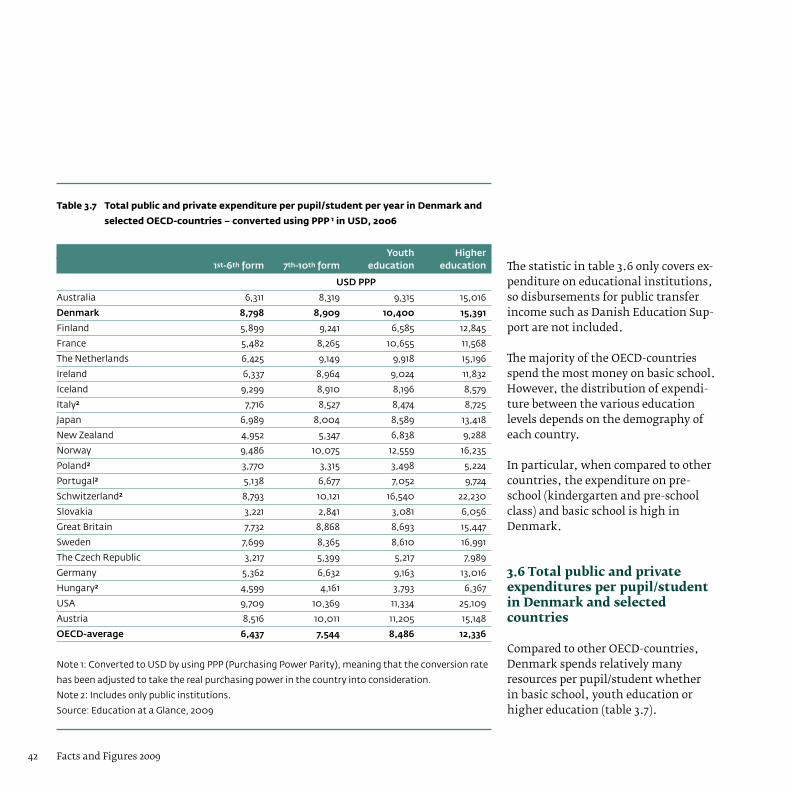
Facts and Figures 200942
The statistic in table 3.6 only covers ex-penditure on educational institutions, so disbursements for public transfer income such as Danish Education Sup-port are not included.
The majority of the OECD-countries spend the most money on basic school. However, the distribution of expendi-ture between the various education levels depends on the demography of each country.
In particular, when compared to other countries, the expenditure on pre-school (kindergarten and pre-school class) and basic school is high in Denmark.
3.6 Total public and private expenditures per pupil/student in Denmark and selected countries
Compared to other OECD-countries, Denmark spends relatively many resources per pupil/student whether in basic school, youth education or higher education (table 3.7).
Table 3.7 Total public and private expenditure per pupil/student per year in Denmark and
selected OECD-countries – converted using PPP 1 in USD, 2006
Youth Higher 1st-6thform 7th-10thform education education
USDPPP
Australia 6,311 8,319 9,315 15,016
Denmark 8,798 8,909 10,400 15,391
Finland 5,899 9,241 6,585 12,845
France 5,482 8,265 10,655 11,568
The Netherlands 6,425 9,149 9,918 15,196
Ireland 6,337 8,964 9,024 11,832
Iceland 9,299 8,910 8,196 8,579
Italy2 7,716 8,527 8,474 8,725
Japan 6,989 8,004 8,589 13,418
New Zealand 4,952 5,347 6,838 9,288
Norway 9,486 10,075 12,559 16,235
Poland2 3,770 3,315 3,498 5,224
Portugal2 5,138 6,677 7,052 9,724
Schwitzerland2 8,793 10,121 16,540 22,230
Slovakia 3,221 2,841 3,081 6,056
Great Britain 7,732 8,868 8,693 15,447
Sweden 7,699 8,365 8,610 16,991
The Czech Republic 3,217 5,399 5,217 7,989
Germany 5,362 6,632 9,163 13,016
Hungary2 4,599 4,161 3,793 6,367
USA 9,709 10,369 11,334 25,109
Austria 8,516 10,011 11,205 15,148
OECD-average 6,437 7,544 8,486 12,336
Note 1: Converted to USD by using PPP (Purchasing Power Parity), meaning that the conversion rate
has been adjusted to take the real purchasing power in the country into consideration.
Note 2: Includes only public institutions.
Source: Education at a Glance, 2009
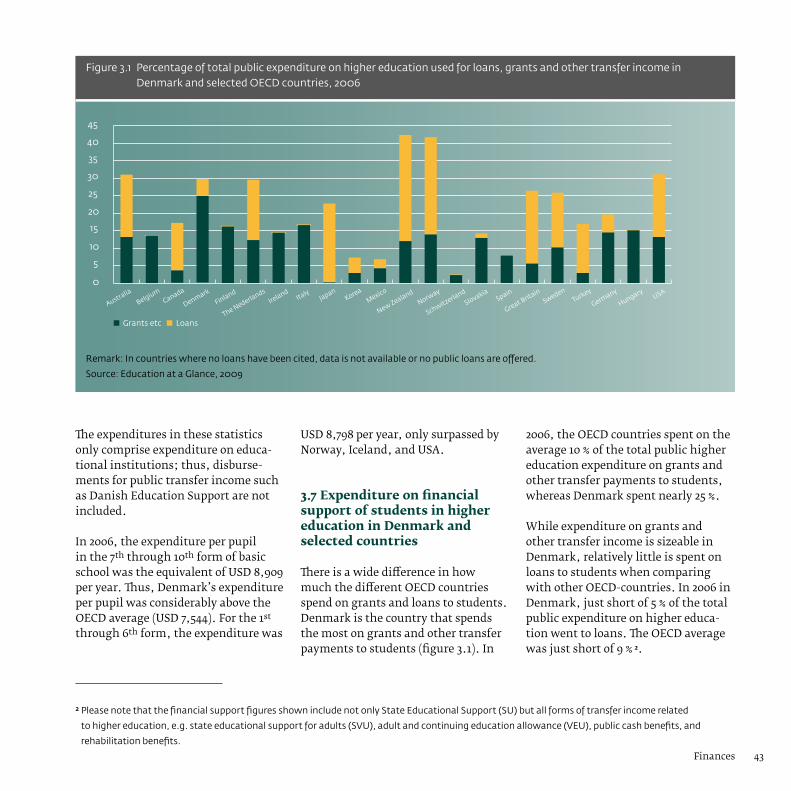
43Finances
The expenditures in these statistics only comprise expenditure on educa-tional institutions; thus, disburse-ments for public transfer income such as Danish Education Support are not included.
In 2006, the expenditure per pupil in the 7th through 10th form of basic school was the equivalent of USD 8,909 per year. Thus, Denmark’s expenditure per pupil was considerably above the OECD average (USD 7,544). For the 1st through 6th form, the expenditure was
USD 8,798 per year, only surpassed by Norway, Iceland, and USA.
3.7 Expenditure on financial support of students in higher education in Denmark and selected countries
There is a wide difference in how much the different OECD countries spend on grants and loans to students. Denmark is the country that spends the most on grants and other transfer payments to students (figure 3.1). In
2006, the OECD countries spent on the average 10 % of the total public higher education expenditure on grants and other transfer payments to students, whereas Denmark spent nearly 25 %.
While expenditure on grants and other transfer income is sizeable in Denmark, relatively little is spent on loans to students when comparing with other OECD-countries. In 2006 in Denmark, just short of 5 % of the total public expenditure on higher educa-tion went to loans. The OECD average was just short of 9 % 2.
2 Please note that the financial support figures shown include not only State Educational Support (SU) but all forms of transfer income related
to higher education, e.g. state educational support for adults (SVU), adult and continuing education allowance (VEU), public cash benefits, and
rehabilitation benefits.
0
5
10
15
20
25
30
35
40
45
USA
Hungary
GermanyTurkey
Sweden
Great BritainSpain
Slovakia
SchwitzerlandNorway
New ZealandMexico
KoreaJapan
ItalyIreland
The Nederlands
Finland
DenmarkCanada
Belgium
Australia
■ Grants etc ■ Loans
Figure 3.1 Percentage of total public expenditure on higher education used for loans, grants and other transfer income in Denmark and selected OECD countries, 2006
Remark: In countries where no loans have been cited, data is not available or no public loans are offered.
Source: Education at a Glance, 2009

Facts and Figures 200944
Table 3.8 Utilisation of the teachers’ working hours per purpose
Educational/ Corrections Vacation, admini- andevalua- holidays, Pre- strative tionofas- Examina- Other Reduction andpublic Education paration tasks Breaks signments tion tasks duetoage hollidays1
%ofthetotalworkinghours
Vocationalcolleges
EUD 27.9 23.8 - 5.7 2.6 2.2 23.8 0.8 13.2
Hhx 21.7 25.3 – 4.1 10.7 5.3 19.7 0.8 12.4
Htx 21.2 25.3 – 4.1 11.3 3.5 21.1 0.3 13.2
KVU 17.2 25.1 – 3.1 6.9 6.9 26.8 0.9 13.0
AMU 36.5 17.6 – 7.0 0.1 0.2 23.7 0.4 14.5
Generaluppersecondaryschools(stx)
18.9 25.0 1.8 4.1 9.7 5.7 19.5 1.4 13.9
MVU
National institute for social educators
and teacher training colleges 20.4 32.1 – – 0.4 5.7 27.1 0.6 14.1
Basic Health care college 16.3 27.0 – – 0.9 9.0 32.0 0.1 14.8
Engineer 18.1 37.4 – – 0.0 6.4 20.7 0.0 17.4
VUC
AVU 22.2 25.8 – 6.4 6.8 4.2 18.1 2.2 14.2
Hf 18.5 24.3 1.8 4.0 10.3 7.2 19.0 1.2 13.8
SOSU
21.5 23.4 – 4.8 2.4 2.9 30.3 0.0 14.6
Remark: The proportions of the teachers’ hours are based on a full-time equivalent of 1924 hours.
Note 1: The difference in time used on vacation, holiday, and public holidays is owed to a difference in the extent to which the 6th holiday week is spent
and in the extent of the total hours contributed.
Source: Utilisation of the teachers working hours, Rambøll Management/Danish Ministry of Education, 2008

45Finances
In Sweden and Norway, the students borrow an amount that constitutes respectively 17 % and 28 % of the total expenses on higher education. Generally, the students in other OECD countries borrow considerably more than the Danish students who on the other hand receive large grants and other transfer income.
3.8 The teachers’ working hours
Table 3.8 shows a mapping of the teachers’ working hours at the general upper secondary schools, institutions for vocationally oriented education, institutions for professional bachelor education, adult education centres (VUC), and basic health care colleges (SOSU).
The table shows how the teachers’ work tasks are distributed on specific work tasks such as teaching, prepa-ration, breaks, etc. It is noted that there is a significant difference in the proportion of the working hours spent on teaching at the different teaching institutions.
Table 3.9 is an account of the average number of hours that teachers in dif-ferent OECD countries spend on teach-ing on a yearly basis. The information on the teachers working hours is not complete from all of the countries. Despite this uncertainty, it emerges from table 3.9 that upper secondary
teachers in Denmark teach markedly less that their colleagues in the other OECD countries.
Table 3.9 The average number of hours spent by a teacher per year on teaching in Denmark
and in selected OECD countries in 2007
Generalupper 1st-6thform 7th-10thform secondaryschool
Numberoflessons
Denmark 1 648 648 364
Finland 677 692 550
France 914 632 618
Germany 806 758 714
Iceland 671 671 560
Ireland 946 735 735
Italy 735 601 601
Norway 741 654 523
OECD-average 798 709 653
Note 1: Regarding basic school in Denmark, the numbers refer to the classical concept of teaching.
Source: Education at a Glance, 2009

46 Tal der taler

47Information technology in education
Information technology in the educa-tion programmes is a question of avail-able hardware, infrastructure, deploy-ment and application of knowledge sharing systems, and of the teachers’ competence in integrating informa-tion technology in the teaching. This chapter provides a view into some of these aspects, primarily regarding the basic school.
4.1 Infrastructure in basic school
The number of pupils per teaching computer of a recent date in the municipal primary and lower second-ary schools has dropped in recent years from more than six to less than four pupils per computer (figure 4.1). During the same time, the number of teaching computers that were acquired less than four years ago has increased from 71,600 to 128,000, equivalent to an increase of nearly 79 % (figure 4.2).
4.2 Knowledge sharing systems in basic schools
The schools may choose different systems of knowledge sharing. The
systems may for instance be used for distribution of materials to teachers and pupils, for virtual group rooms, interactive tests, and for handing in papers.
4 Information technology in education
0
1
2
3
4
5
6
7
200820072006
2005 2006 2007 2008
2006 2007 2008
Figure 4.1 Number of pupils per teaching computer of a recent date1 in municipal primary and lower secondary schools
Remark: The numbers are summed up as per 1 January of the year.
Note 1: For this purpose, a teaching computer of a recent date is defined as one that is no more
than five years old.
Source: UNI•C Statistics & Analysis

Facts and Figures 200948
The basic schools have a choice of systems such as SkoleIntra, MinSkole, Skolenetværket, and Fronter. SkoleIn-tra is the product used by most of the basic schools. It is a comprehensive intranet solution that gives the oppor-tunity of information dissemination, knowledge sharing, and coordina-tion and integration of information technology in the teaching. Figure 4.3 shows the proportion of basic schools with a SkoleIntra subscription.
Since 2002, an increasing part of the basic schools have used SkoleIntra. In 2008, 83 % of the municipal and private basic schools subscribed to SkoleIntra as well as 50 % of other basic schools (figure 4.3).
4.3 Continuing information technology training in basic schools
The pedagogic IT driver’s license is a key element in the continuing infor-mation technology training of basic school teachers. The driver’s license is an offer to teachers and teacher students who do not yet have the basic
0
20,000
40,000
60,000
80,000
100,000
120,000
140,000
200820072006
2006 2007 2008
■ Younger than 4 years ■ 4-5 years old ■ Older than 5 years
Figure 4.2 Number of teaching computers in municipal primary and lower secondary schools per year of acquisition
Remark: The numbers are summed up as per 1 January of the year.
Source: UNI•C Statistics & Analysis
0
10
20
30
40
50
60
70
80
90
20092008200720062005200420032002
Percentage
■ Municipal and private basic schools ■ Other basic schools 1
Figure 4.3 Proportion of basic schools with a SkoleIntra subscription
Note 1: Other basic schools include continuation schools, municipal youth schools, special schools for children, special needs day schools, and community homes.Remark: The numbers are summed up as per 1 January of the year. Source: UNI•C Statistics & Analysis

49Information technology in education
skills in integrating information tech-nology and media as a natural element of teaching school subjects and mat-ters. It should be noted that teachers may acquire equivalent competence in other ways.
After August 2009, it is no longer possi-ble to split up the pedagogic IT driver’s license by school type because a joint pedagogic IT driver’s license tailored to the needs of the course participant is introduced. In the basic school field, the Danish Ministry of Education is the central supplier of the pedagogic IT driver’s license through UNI•C, but generally speaking, this offer is complemented by a number of private suppliers. Over time, there has been a marked increase in the proportion of basic school teachers who have taken a pedagogic IT driver’s license (see figure 4.4).
4.4 EMU – Denmark’s education portal
EMU is Denmark’s education portal which has as its main purpose to develop and improve the education by
0
10
20
30
40
50
60
200820072006200520042003200220012000
Percentage
Figure 4.4 Proportion of basic school teachers with a pedagogic IT driver’s license
Remark: The graph shows the proportion of basic school teachers who have acquired the
Danish Ministry of Education’s pedagogic IT driver’s license.
Source: UNI•C Statistics & Analysis
0
100,000
200,000
300,000
400,000
500,000
600,000
1st half of2009
1st half of2008
1st half of2007
1st half of2006
1st half of2005
1st half of2004
1st half of2003
Figure 4.5 Average number of unique users on the EMU top list
Remark: The EMU top list covers all the services that are on the web page
http://www.emu.dk/tjenester.html and all the fields of education on EMU.
Source: UNI•C Statistics & Analysi
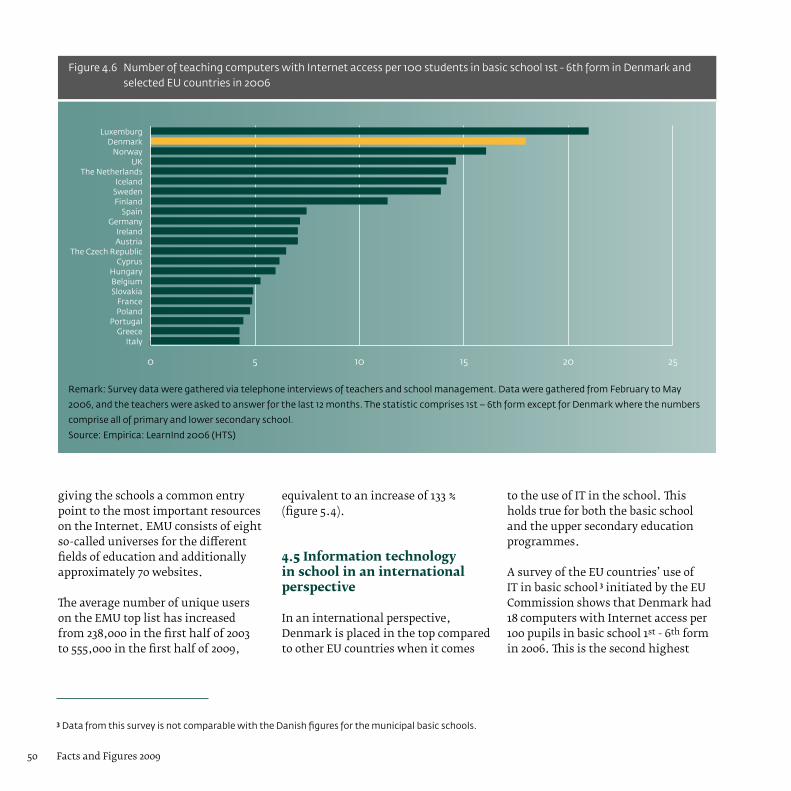
Facts and Figures 200950
giving the schools a common entry point to the most important resources on the Internet. EMU consists of eight so-called universes for the different fields of education and additionally approximately 70 websites.
The average number of unique users on the EMU top list has increased from 238,000 in the first half of 2003 to 555,000 in the first half of 2009,
equivalent to an increase of 133 % (figure 5.4).
4.5 Information technology in school in an international perspective
In an international perspective, Denmark is placed in the top compared to other EU countries when it comes
3 Data from this survey is not comparable with the Danish figures for the municipal basic schools.
0 5 10 15 20 25
ItalyGreece
PortugalPolandFrance
SlovakiaBelgium
HungaryCyprus
The Czech RepublicAustriaIreland
GermanySpain
FinlandSwedenIceland
The NetherlandsUK
NorwayDenmark
Luxemburg
Figure 4.6 Number of teaching computers with Internet access per 100 students in basic school 1st - 6th form in Denmark and selected EU countries in 2006
Remark: Survey data were gathered via telephone interviews of teachers and school management. Data were gathered from February to May
2006, and the teachers were asked to answer for the last 12 months. The statistic comprises 1st – 6th form except for Denmark where the numbers
comprise all of primary and lower secondary school.
Source: Empirica: LearnInd 2006 (HTS)
to the use of IT in the school. This holds true for both the basic school and the upper secondary education programmes.
A survey of the EU countries’ use of IT in basic school 3 initiated by the EU Commission shows that Denmark had 18 computers with Internet access per 100 pupils in basic school 1st - 6th form in 2006. This is the second highest

51Information technology in education
0 5 10 15 20 25 30 35 40 45
PortugalPoland
GermanySlovakia
GreeceItaly
IrelandThe Czech Republic
SpainBelgium
HungaryOECD-average
CyprusFrance
FinlandIceland
LuxemburgAustria
The NetherlandsUK
SwedenDenmark
Norway
Figure 4.7 Number of teaching computers with Internet access per 100 students in upper secondary schools in Denmark and selected EU countries in 2006
Remark: Survey data were gathered via telephone interviews of teachers and school management. Data were gathered from February to May
2006, and the teachers were asked to answer for the last 12 months.
Source: Empirica: LearnInd 2006 (HTS)
number in EU (figure 4.6). In upper level secondary schools, there were 37 computers with Internet access per 100 pupils in 2006 – a number surpassed only by Norway who had 40 computers with Internet access per 100 students (figure 4.7).
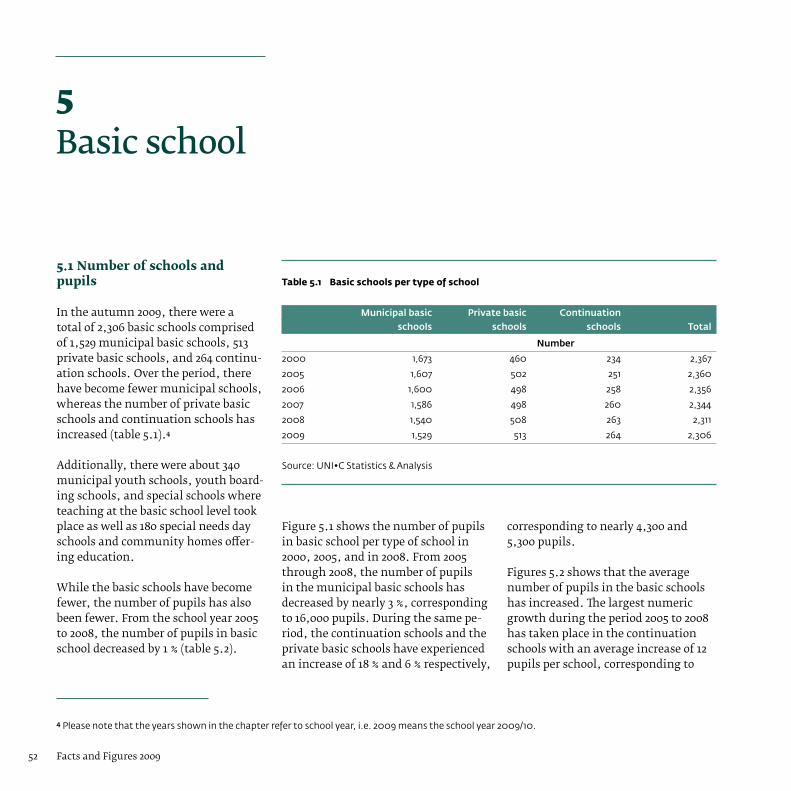
Facts and Figures 200952
5.1 Number of schools and pupils
In the autumn 2009, there were a total of 2,306 basic schools comprised of 1,529 municipal basic schools, 513 private basic schools, and 264 continu-ation schools. Over the period, there have become fewer municipal schools, whereas the number of private basic schools and continuation schools has increased (table 5.1).4
Additionally, there were about 340 municipal youth schools, youth board-ing schools, and special schools where teaching at the basic school level took place as well as 180 special needs day schools and community homes offer-ing education.
While the basic schools have become fewer, the number of pupils has also been fewer. From the school year 2005 to 2008, the number of pupils in basic school decreased by 1 % (table 5.2).
Figure 5.1 shows the number of pupils in basic school per type of school in 2000, 2005, and in 2008. From 2005 through 2008, the number of pupils in the municipal basic schools has decreased by nearly 3 %, corresponding to 16,000 pupils. During the same pe-riod, the continuation schools and the private basic schools have experienced an increase of 18 % and 6 % respectively,
corresponding to nearly 4,300 and 5,300 pupils.
Figures 5.2 shows that the average number of pupils in the basic schools has increased. The largest numeric growth during the period 2005 to 2008 has taken place in the continuation schools with an average increase of 12 pupils per school, corresponding to
5 Basic school
4 Please note that the years shown in the chapter refer to school year, i.e. 2009 means the school year 2009/10.
Table 5.1 Basic schools per type of school
Municipalbasic Privatebasic Continuation schools schools schools Total
Number
2000 1,673 460 234 2,367
2005 1,607 502 251 2,360
2006 1,600 498 258 2,356
2007 1,586 498 260 2,344
2008 1,540 508 263 2,311
2009 1,529 513 264 2,306
Source: UNI•C Statistics & Analysis
53Tal der taler

Facts and Figures 200954
an increase of 13 %. The private basic schools have experienced an average increase of 8 pupils per school (4 %), while the municipal basic schools have had an increase of 5 pupils per school (1 %). The anticipated development in number of pupils until 2019 is shown in the extrapolation in figure 5.3. It is seen that during the entire period the number of pupils will decrease steadily by an average of 4,500 pupils per year.
In 2008, a good 10 % of the pupils in basic school (excluding continua-tion schools) were of ethnic origin other than Danish. Before the school year 2007, the number of pupils was counted according to the definition of bilingual pupils5 in the Danish legisla-tion on municipal basic schools, but subsequently, the figures were tallied according to Statistics Denmark’s definition of ethnic origin including
5 Bilingual pupils are defined as children who have a matemal tongue other than Danish and who do not learn
Danish until they come in contact with the surrounding society, e.g. through school education.
Table 5.2 Number of pupils in basic school per form level
20001 2005 2006 2007 2008
Number
Basicschool,total 658,824 710,835 709,936 704,974 703,623
Pre-school class – 67,362 67,635 65,413 64,822
1st form – 67,031 67,153 66,700 65,988
2nd form – 68,123 66,663 66,216 66,759
3rd form – 67,861 68,022 66,033 66,404
4th form – 70,312 67,585 67,504 66,097
5th form – 69,563 70,023 67,005 67,762
6th form – 68,704 69,660 69,772 67,427
7th form – 68,186 68,427 69,169 69,518
8th form – 65,374 67,692 67,237 68,271
9th form – 64,180 64,157 67,248 67,669
10th form – 33,421 32,108 32,667 32,906
Remark: Includes figures for municipal and private basic schools and continuation schools.
Note 1: Figures per form level are not available for 2000.
Note 2: For the years 2005 and 2006, the number of pupils per class level do not add up to the basic
school total because the total includes pupils for which the class level was not given.
Source: UNI•C Statistics & Analysis
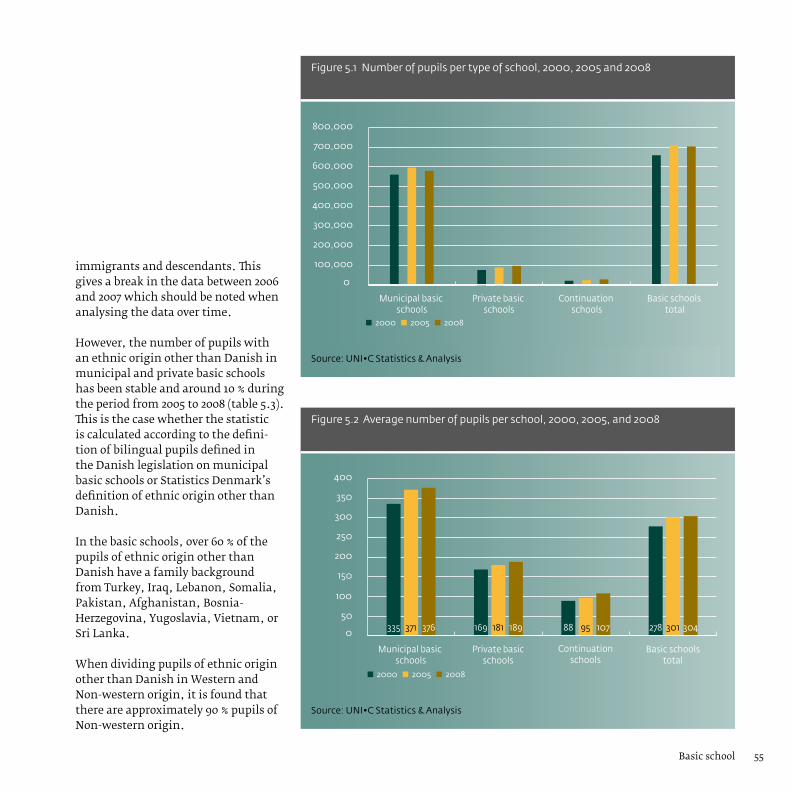
55Basic school
immigrants and descendants. This gives a break in the data between 2006 and 2007 which should be noted when analysing the data over time.
However, the number of pupils with an ethnic origin other than Danish in municipal and private basic schools has been stable and around 10 % during the period from 2005 to 2008 (table 5.3). This is the case whether the statistic is calculated according to the defini-tion of bilingual pupils defined in the Danish legislation on municipal basic schools or Statistics Denmark’s definition of ethnic origin other than Danish.
In the basic schools, over 60 % of the pupils of ethnic origin other than Danish have a family background from Turkey, Iraq, Lebanon, Somalia, Pakistan, Afghanistan, Bosnia-Herzegovina, Yugoslavia, Vietnam, or Sri Lanka.
When dividing pupils of ethnic origin other than Danish in Western and Non-western origin, it is found that there are approximately 90 % pupils of Non-western origin.
0
100,000
200,000
300,000
400,000
500,000
600,000
700,000
800,000
Basic schools total
Continuation schools
Private basic schools
Municipal basic schools
■ 2000 ■ 2005 ■ 2008
Figure 5.1 Number of pupils per type of school, 2000, 2005 and 2008
Source: UNI•C Statistics & Analysis
0
50
100
150
200
250
300
350
400
Basic schoolstotal
Continuationschools
Private basicschools
Municipal basic schools
335 376371 169 189181 88 10795 278 304301
■ 2000 ■ 2005 ■ 2008
Figure 5.2 Average number of pupils per school, 2000, 2005, and 2008
Source: UNI•C Statistics & Analysis

Facts and Figures 200956
Table 5.3 Distribution of pupils of ethnic origin other than Danish in municipal and private basic schools
2000 2005 2006 2007 2008
Number
NumberofpupilsofethnicoriginotherthanDanish,total 53,850 69,417 69,243 68,520 69,207
Municipal basic schools1 46,140 60,037 59,758 59,575 59,549
Private basic schools 7,710 9,380 9,485 8,945 9,658
%
ProportionofpupilsofethnicoriginotherthanDanish,total 8.4 10.1 10.1 10.1 10.2
Municipal basic schools1 8.2 10.1 10.0 10.2 10.3
Private basic schools 9.9 10.3 10.3 9.8 10.1
%
DistributionofpupilsofethnicoriginotherthanDanish2
Total – – – 100 100
Turkey – – – 16.4 15.5
Iraq – – – 8.9 8.9
Lebanon – – – 9.4 9.0
Somalia – – – 5.9 6.0
Pakistan – – – 4.6 4.4
Afghanistan – – – 4.5 4.2
Bosnia-Herzegovina – – – 4.2 4.0
Yugoslavia – – – 3.8 3.5
Vietnam – – – 3.5 3.4
Sri Lanka – – – 3.2 3.2
Other countries – – – 35.7 37.9
%
Total – – – 100 100
Non-western origin – – – 90.3 89.6
Western origin – – – 9.7 10.4
Remark: In 2000-2006, the number of bilingual pupils has been counted as defined in the Danish legislation on municipal basic schools. In 2007 and
2008, the number has been counted as defined by Statistics Denmark’s whereby ethnic origin other than Danish covers immigrants and descendants.
Note 1: Includes the figures for a few special schools and community homes until 2004.
Note 2: The list is sorted according to number of pupils of ethnic origin other than Danish.
Source: UNI•C Statistics & Analysis
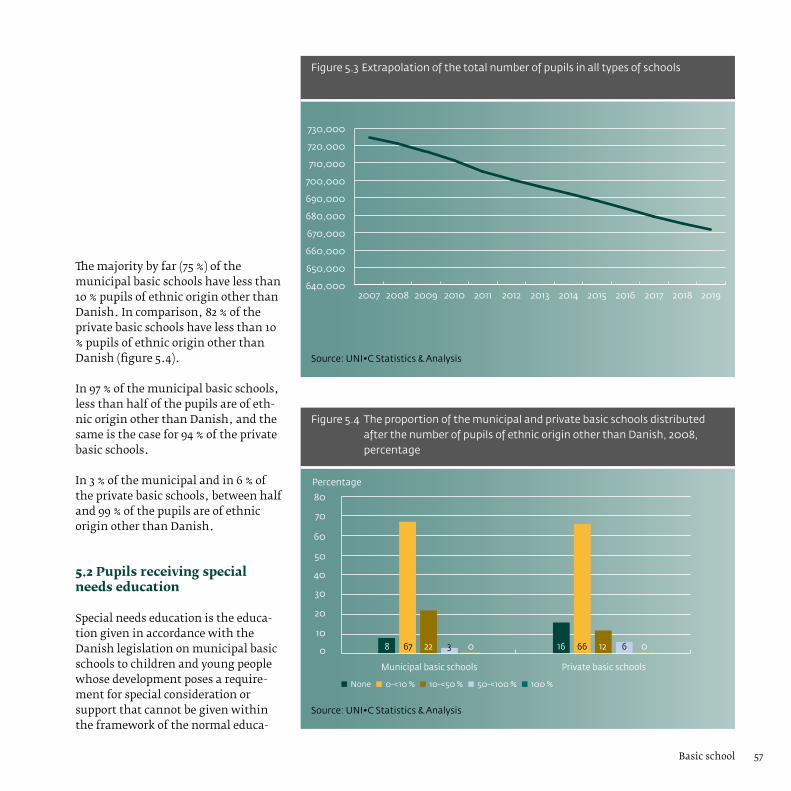
57Basic school
The majority by far (75 %) of the municipal basic schools have less than 10 % pupils of ethnic origin other than Danish. In comparison, 82 % of the private basic schools have less than 10 % pupils of ethnic origin other than Danish (figure 5.4).
In 97 % of the municipal basic schools, less than half of the pupils are of eth-nic origin other than Danish, and the same is the case for 94 % of the private basic schools.
In 3 % of the municipal and in 6 % of the private basic schools, between half and 99 % of the pupils are of ethnic origin other than Danish.
5.2 Pupils receiving special needs education
Special needs education is the educa-tion given in accordance with the Danish legislation on municipal basic schools to children and young people whose development poses a require-ment for special consideration or support that cannot be given within the framework of the normal educa-
640,000
650,000
660,000
670,000
680,000
690,000
700,000
710,000
720,000
730,000
2019201820172016201520142013201220112010200920082007
Figure 5.3 Extrapolation of the total number of pupils in all types of schools
Source: UNI•C Statistics & Analysis
0
10
20
30
40
50
60
70
80
Percentage
Private basic schoolsMunicipal basic schools
228 067 3 1216 0 66 6
■ None ■ 0-<10 % ■ 10-<50 % ■ 50-<100 % ■ 100 %
Figure 5.4 The proportion of the municipal and private basic schools distributed after the number of pupils of ethnic origin other than Danish, 2008, percentage
Source: UNI•C Statistics & Analysis

58 Tal der taler
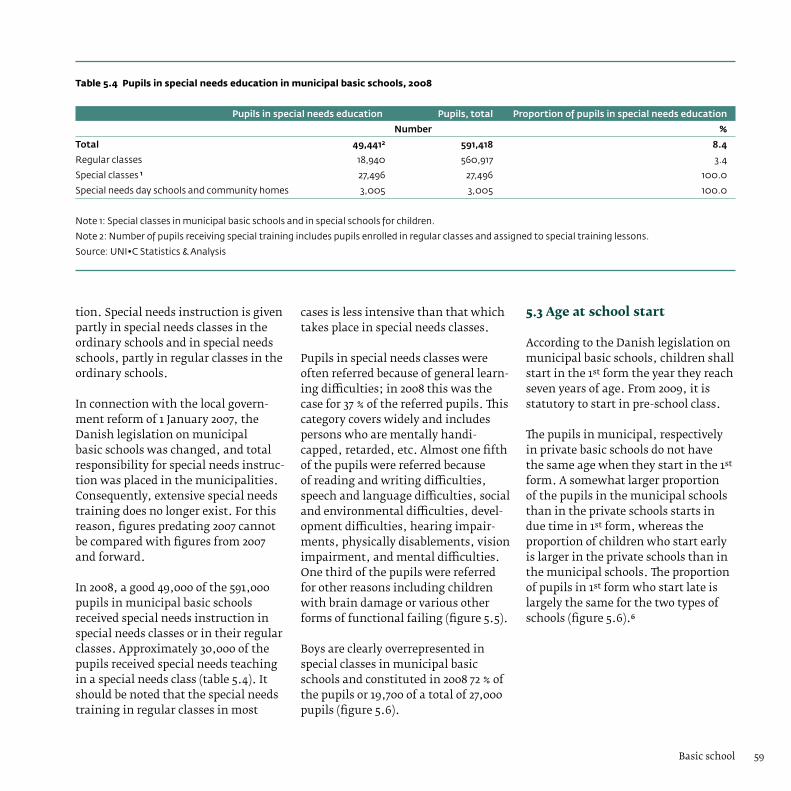
59Basic school
tion. Special needs instruction is given partly in special needs classes in the ordinary schools and in special needs schools, partly in regular classes in the ordinary schools.
In connection with the local govern-ment reform of 1 January 2007, the Danish legislation on municipal basic schools was changed, and total responsibility for special needs instruc-tion was placed in the municipalities. Consequently, extensive special needs training does no longer exist. For this reason, figures predating 2007 cannot be compared with figures from 2007 and forward.
In 2008, a good 49,000 of the 591,000 pupils in municipal basic schools received special needs instruction in special needs classes or in their regular classes. Approximately 30,000 of the pupils received special needs teaching in a special needs class (table 5.4). It should be noted that the special needs training in regular classes in most
cases is less intensive than that which takes place in special needs classes.
Pupils in special needs classes were often referred because of general learn-ing difficulties; in 2008 this was the case for 37 % of the referred pupils. This category covers widely and includes persons who are mentally handi-capped, retarded, etc. Almost one fifth of the pupils were referred because of reading and writing difficulties, speech and language difficulties, social and environmental difficulties, devel-opment difficulties, hearing impair-ments, physically disablements, vision impairment, and mental difficulties. One third of the pupils were referred for other reasons including children with brain damage or various other forms of functional failing (figure 5.5).
Boys are clearly overrepresented in special classes in municipal basic schools and constituted in 2008 72 % of the pupils or 19,700 of a total of 27,000 pupils (figure 5.6).
5.3 Age at school start
According to the Danish legislation on municipal basic schools, children shall start in the 1st form the year they reach seven years of age. From 2009, it is statutory to start in pre-school class.
The pupils in municipal, respectively in private basic schools do not have the same age when they start in the 1st form. A somewhat larger proportion of the pupils in the municipal schools than in the private schools starts in due time in 1st form, whereas the proportion of children who start early is larger in the private schools than in the municipal schools. The proportion of pupils in 1st form who start late is largely the same for the two types of schools (figure 5.6).6
Table 5.4 Pupils in special needs education in municipal basic schools, 2008
Pupilsinspecialneedseducation Pupils,total Proportionofpupilsinspecialneedseducation
Number %
Total 49,4412 591,418 8.4
Regular classes 18,940 560,917 3.4
Special classes1 27,496 27,496 100.0
Special needs day schools and community homes 3,005 3,005 100.0
Note 1: Special classes in municipal basic schools and in special schools for children.
Note 2: Number of pupils receiving special training includes pupils enrolled in regular classes and assigned to special training lessons.
Source: UNI•C Statistics & Analysis

Facts and Figures 200960
There is clearly a connection between the children’s gender and when they start in the 1st form. In 2008, a considerably larger proportion of the boys started later than the girls in the 1st form. Correspondingly, a smaller proportion of the boys than of the girls started in due time or early (figure 5.8). Over the time, there has been a general tendency to more children, boys as well as girls, starting in due time or early in the 1st form (figure 5.9).
5.4 The pupils’ choice of education after basic school
The majority by far of the pupils continue in a youth education within a period of 3 months after having
13
37
4
0.3 0.3
11
33
5
24
■ General learning disabilities ■ Development impairments■ Social and environment di�culties■ Reading and writing di�culties■ Speech and language di�culties■ Hearing impairments■ Vision impairments■ Physically disablements■ Mental di�culties■ Other■ Unknown
Figure 5.5 Reasons for referral to special needs education among pupils in special classes in municipal basic schools, 2008, percent
Source: UNI•C Statistics & Analysis
0
5,000
10,000
15,000
20,000
25,000
30,000
TotalGirlsBoys
19,708 7,788 27,496
2005 2006 2007 2008
Figure 5.6 Number of pupils in special needs education in municipal basic schools by gender, 2008
Source: UNI•C Statistics & Analysis
6 Start in due time is construed as the children
starting in 1st form the year they reach seven
years of age. Children who start in 1st form
before the year they reach sven years of age
are said to have started early, and children
who start after the year they reach seven
years of age are said to have started late.

61Basic school
completed basic school. In 2008 83 % of the pupils in 9th and 10th form started a youth education within 3 months after having completed basic school (table 5.5).
There is a distinct difference in boys’ and girls’ choice of education. In 2008 a considerable larger proportion of the girls than of the boys chose a general upper secondary education programme, whereas a clearly larger proportion of the boys than of the girls chose a vocational upper second-ary education. Also the vocationally oriented education and training were primarily chosen by the boys (figure 5.10).
Figure 5.11 shows the distribution by gender of pupils of ethnic origin other than Danish who continue in educa-tion after the 9th or 10th form. The tendency for this group is the same as well: The girls choose primarily a gen-eral upper secondary school, whereas the boys primarily choose a vocational upper secondary or a vocational educa-tion. However, a higher percentage by far of the pupils of ethnic origin other than Danish do not continue educa-
0
10
20
30
40
50
60
70
80
90
Private basic schoolsMunicipal basic schools
Percentage
802 18 786 17
■ Early ■ In due time ■ Late
Figure 5.7 School start in 1st form in municipal and private basic schools per type of school in 2008
Source: UNI•C Statistics & Analysis
0
10
20
30
40
50
60
70
80
90
GirlsBoys
Percentage
741 24 853 12
■ Early ■ In due time ■ Late
Figure 5.8 School start in 1st form in municipal and private basic schools by gender in 2008
Source: UNI•C Statistics & Analysis

Facts and Figures 200962
tion. While 17 % of the boys in the total group do not continue in education, this is the case for 22 % of the boys of ethnic origin other than Danish. For the girls, 17 % of the total group do not continue in education, whereas it is the case for 23 % of the girls of ethnic origin other than Danish.
5.5 Number of teachers
In the year 2008 there were 62,000 teachers in the basic schools. 50,000 of these were employed by municipal basic schools, 8,000 by private basic schools, and 4,000 were employed by continuation schools (table 5.6).
From the year 2005 through 2008, the number of teachers in municipal basic schools decreased, while the number in the private basic schools and in the continuation schools increased. Thus, in the basic schools as a whole, the number of teachers is largely unchanged.
When considering the age distribu-tion of the teachers in basic school (excluding continuation schools), it
50
55
60
65
70
75
80
85
90
95
20082007200620052004200320022001
Percentage
■ Boys ■ Girls
Figure 5.9 Proportion of pupils who start in due time or early in 1st form in municipal and private basic schools by gender
Remark: Only pupils in municipal schools are included in the figure for the 2002 school year.
Source: UNI•C Statistics & Analysis
Table 5.5 Behaviour 3 months after basic school
2005 2006 2007 2008
%
Total 100 100 100 100
Continue in an education programme 83.1 82.0 83.3 83.1
General upper secondary education 38.6 38.6 39.5 38.8
Vocational upper secondary education 16.1 15.6 15.9 17.0
Vocationally oriented education and training 26.1 25.7 25.9 24.8
Other education1 2.2 2.2 2.1 1.4
Donotcontinueeducation 16.9 18.0 16.7 16.9
Note 1: Other education comprises higher education and non-qualifying education.
Source: UNI•C Statistics & Analysis
63Basic school
0
10
20
30
40
50
60
GirlsBoys
Percentage
30 21 31 172 50 13 18 171
■ General upper secondary education ■ Vocational upper secondary education■ Vocationally oriented education and training ■ Other education1 ■ Do not continue education
Figure 5.10 Behaviour 3 months after basic school, by gender, 2008
Note 1: Other education comprises higher education and non-qualifying education.
Source: UNI•C Statistics & Analysis
is seen that in particular the group of 45 to 54 years old has diminished in recent years. Thus, in 2003, the group of 45 to 54 years old made up 32 % as compared to 23 % in 2008. During the same period, the group of teachers over 55 years old has increased by two percentage points, whereas teachers in the age group 35 to 44 years old has increased by nearly six percentage points. During the same period, the proportion of teachers 34 years of age or less has been stable at 25 % (figure 5.12).
In general, the teachers in the private basic schools with 43.1 years of age in average are slightly younger that those in the municipal basic schools who are 44.4 years old in average.
The gender distribution among teach-ers and school managers is skewed. Two out of three teachers are women. On the other hand, two out of three school managers are men (does not emerge from the figure). The gender skew is strongest among teachers in the youngest age group (figure 5.13).
0
10
20
30
40
50
GirlsBoys
Percentage
27 19 30 222 45 11 20 231
■ General upper secondary education ■ Vocational upper secondary education■ Vocationally oriented education and training ■ Other education1 ■ Do not continue education
Figure 5.11 Behaviour of pupils of ethnic origin other than Danish, 3 months after basic school, by gender, 2008
Note 1: Other education comprises higher education and non-qualifying education.
Source: UNI•C Statistics & Analysis

Facts and Figures 200964
15.0
17.5
20.0
22.5
25.0
27.5
30.0
32.5
35.0
200820072006200520042003
Percentage
■ 18-34 years old ■ 35-44 years old ■ 45-54 years old ■ 55 years old and above
Figure 5.12 Age distribution of teachers
Remark: Not including continuation schools.
Source: UNI•C Statistics & Analysis
5.6 Normal class size and pupil-teacher ratio
The pupil-teacher ratio describes the ratio between the number of pupils and the number of teachers, that is to say the average of number of pupils per teacher.
In 2008, the pupil-teacher ratio was 11.1 in the municipal basic schools, whereas it was 12.4 in the private basic schools. Thus, there are slightly more pupils per teacher in the private basic schools (figure 5.14). These numbers have not changed notably in recent years.
The normal class size expresses the average number of pupils in a class. Dedicated special classes are not counted in the normal class size calculation.
Combined for the municipal and the private basic schools, the standard number of pupils per class was 19.6 in 2008. However, the standard number of pupils per class covers for major vari-ations in class size, generally as well as between the two types of schools,
Table 5.6 Number of teachers in the basic schools
2005 2006 2007 2008
Number
Basicschool,total 62,089 62,671 61,552 61,992
Municipal basic schools 50,933 51,418 50,218 50,341
Private basic schools 7,548 7,537 7,653 7,828
Continuation schools 3,608 3,716 3,681 3,823
Remark: Includes both part-time and full-time teachers.
Source: UNI•C Statistics & Analysis and the association of continuation schools

65Tal der taler

Facts and Figures 200966
the municipal basic schools having an average of 20.2 pupils per class and the private basic schools having 16.7 (figure 5.15).
At first it seems odd that the munici-pal schools at the same time have a relatively high number of students per class (20.2) and a low student/teacher ratio (11.1). Conversely, the private basic schools have a relatively low number of students per class while they have a high pupil/teacher ratio (12.4).
The reason why the municipal schools have a lower pupil/teacher ratio is that the municipal schools spend relatively more teacher fulltime equivalents on challenged pupils (for instance special needs pupils) than the private basic schools. Since there are more special needs pupils, the average pupil draws on more teacher resources in the municipal schools than in the private schools. This way, the pupil/teacher ra-tio ends up lower in municipal schools than in private schools.
The higher resource requirements com-pound the reason for a higher number
0
2
4
6
8
10
12
14
20082005
11.1 12.3 11.1 12.4
■ Municipal basic schools ■ Private basic schools
Figure 5.14 Pupil-teacher ratio 2005 and 2008
Remark: The pupil-teacher ratio has been calculated based on the total time used by teachers minus the time used in special classroom teaching plus the teaching time of the school management. The time used is divided with a standard man-year (1,924 hours). All the pupils are included except pupils in special classes. Municipal special schools and community homes are not considered.Source: UNI•C Statistics & Analysis
Percentage
0
5
10
15
20
25
30
55 years old and above45-54 years old35-44 years old18-34 years old
7 8 7 9
18 19 1616
■ Men ■ Women
Figure 5.13 Age distribution of teachers by gender, 2008
Remark: Not including continuation schools
Source: UNI•C Statistics & Analysis
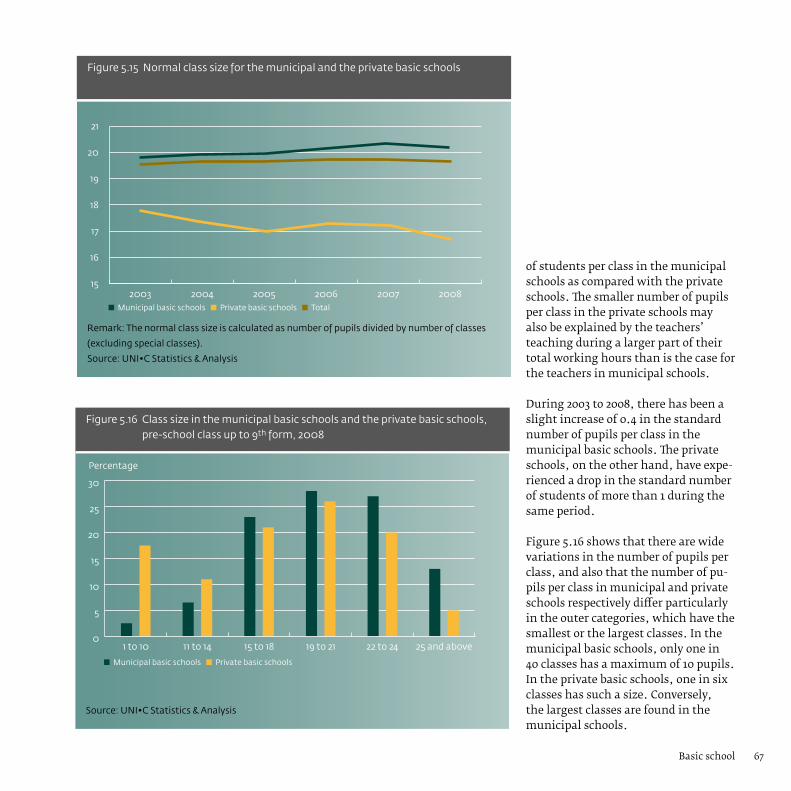
67Basic school
of students per class in the municipal schools as compared with the private schools. The smaller number of pupils per class in the private schools may also be explained by the teachers’ teaching during a larger part of their total working hours than is the case for the teachers in municipal schools.
During 2003 to 2008, there has been a slight increase of 0.4 in the standard number of pupils per class in the municipal basic schools. The private schools, on the other hand, have expe-rienced a drop in the standard number of students of more than 1 during the same period.
Figure 5.16 shows that there are wide variations in the number of pupils per class, and also that the number of pu-pils per class in municipal and private schools respectively differ particularly in the outer categories, which have the smallest or the largest classes. In the municipal basic schools, only one in 40 classes has a maximum of 10 pupils. In the private basic schools, one in six classes has such a size. Conversely, the largest classes are found in the municipal schools.
15
16
17
18
19
20
21
200820072006200520042003■ Municipal basic schools ■ Private basic schools ■ Total
Figure 5.15 Normal class size for the municipal and the private basic schools
Remark: The normal class size is calculated as number of pupils divided by number of classes
(excluding special classes).
Source: UNI•C Statistics & Analysis
0
5
10
15
20
25
30
25 and above22 to 2419 to 2115 to 1811 to 141 to 10
Percentage
■ Municipal basic schools ■ Private basic schools
Figure 5.16 Class size in the municipal basic schools and the private basic schools, pre-school class up to 9th form, 2008
Source: UNI•C Statistics & Analysis

Tal der taler68

69Youth education
6.1 Number of schools and students
The youth education programmes com-prise the higher education preparatory general upper secondary studies and the vocational education and training programmes that target the labour market, but which may also give admission to higher education.
In the autumn of 2009, there were a total of 149 general upper second-ary educational institutions and 109 vocational colleges (table 6.1).
In 2008, 241,000 students were enrolled in a youth education. Of these, just under half (49 %), were enrolled in an upper secondary education pro-gramme, and slightly more than half (51 %), were enrolled in a vocation-ally oriented education and training programme.
In 2008, there were a good 82,000 students in the general upper second-ary education programmes comprised of the upper secondary school leaving examination (stx) and the higher preparatory exams (hf). The majority
by far (87 %) of these took stx, while 13 % studied for hf.
The vocational upper secondary educa-tion programmes, consisting of the higher commercial examination (hhx) and the higher technical examination (htx), accounted for nearly 35,000 stu-dents in 2008. The greater part (70 %) took hhx, while every third studied for htx.
In the general upper secondary schools, there are markedly more women than men, whereas in the vocational secondary schools, and par-ticularly in the vocationally oriented education and training programmes, there is a predominance of men.
Since 2005, the proportion of students of ethnic origin other than Danish in the youth education programmes has increased by 14 %, and in 2008, these students accounted for nearly one in ten students in youth education. In total, there were 23,100 students of ethnic origin other than Danish, and of these, 10,400 were in upper second-ary schools where they constituted 9 % of the students and 12,700 were
in vocationally oriented education and training programmes where they made up 10 % of the students (table 6.3).
There is a more balanced gender distri-bution in the youth educations among students of an ethnic origin other than Danish than there is among ethnically Danish students. In 2008 in the upper secondary education programmes, women made up 53 % of the students of ethnic origin other than Danish, and in the vocationally oriented education and training programmes, they made up 52 %.
In upper secondary schools, women of ethnic origin other that Danish primarily choose the general up-per secondary education; the men choose the vocational upper second-ary education to a larger extent. In the vocationally oriented education and training programmes, the men choose a technical education; women choose especially social and health care training programmes (does not emerge from the table).
6 Youth education
Facts and Figures 200970
In 2008, most of the upper secondary students were enrolled in stx (61 %). Hhx followed with 21 % of the stu-dents. Htx and the two-year hf had each a share of 9 % of the students (figure 6.1).
In 2008, 123,000 students studied in a vocationally oriented education and training programme. In particular popular are the programmes within the commercial field, building and construction, and health, care and pedagogy (figure 6.2).
6.2 Age at school start
In average, the students in upper secondary schools (stx) and higher technical schools (htx) are respectively 16.6 and 16.8 years old when they start; in higher commercial schools, they are 17 years old. At the upper secondary school leaving examination, the students in stx have an average age of 19.5 years, in htx 19.7 years, and in hhx 20 years. The students are of the same age in stx, hhx, and htx, whereas there is a wider spread in the age of the students in the two-year
Table 6.2 Number of students in youth education by gender
2000 2005 2006 2007 2008
Number
Youtheducationstudents,total 217,114 226,248 233,092 236,293 240,993
Men 107,800 112,659 117,029 119,308 122,586
Women 109,314 113,589 116,063 116,985 118,407
Uppersecondaryeducation,total 93,081 104,442 108,230 111,430 116,931
Men 40,514 45,869 47,882 49,551 52,319
Women 52,567 58,573 60,348 61,879 64,612
Stx(incl.adultuppersecondarylevelcourse) 53,061 61,961 65,454 68,058 71,748
Men 20,448 24,033 25,457 26,362 27,769
Women 32,613 37,928 39,997 41,696 43,979
Hf 11,021 10,119 9,655 9,823 10,417
Men 3,707 3,678 3,524 3,536 3,817
Women 7,314 6,441 6,131 6,287 6,600
Hhx 21,754 23,924 24,304 24,051 24,234
Men 10,329 11,290 11,819 12,155 12,577
Women 11,425 12,634 12,485 11,896 11,657
Htx 7,245 8,438 8,817 9,498 10,532
Men 6,030 6,868 7,082 7,498 8,156
Women 1,215 1,570 1,735 2,000 2,376
Vocationallyorientededucationandtraining,
total 124,033 121,806 124,862 124,863 124,062
Men 67,286 66,790 69,147 69,757 70,267
Women 56,747 55,016 55,715 55,106 53,795
Source: UNI•C Statistics & Analysis
Table 6.1 Number of educational institutions with youth education programmes
2000 2005 2006 2007 2008 2009
Number
Upper secondary schools and higher
preparatory courses (hf) 124 125 126 126 127 128
Private upper secondary schools and hf-courses 16 17 17 17 17 17
Adult upper secondary level course 5 4 4 4 4 4
Vocational colleges etc 119 115 113 113 114 109
Source: UNI•C Statistics & Analysis
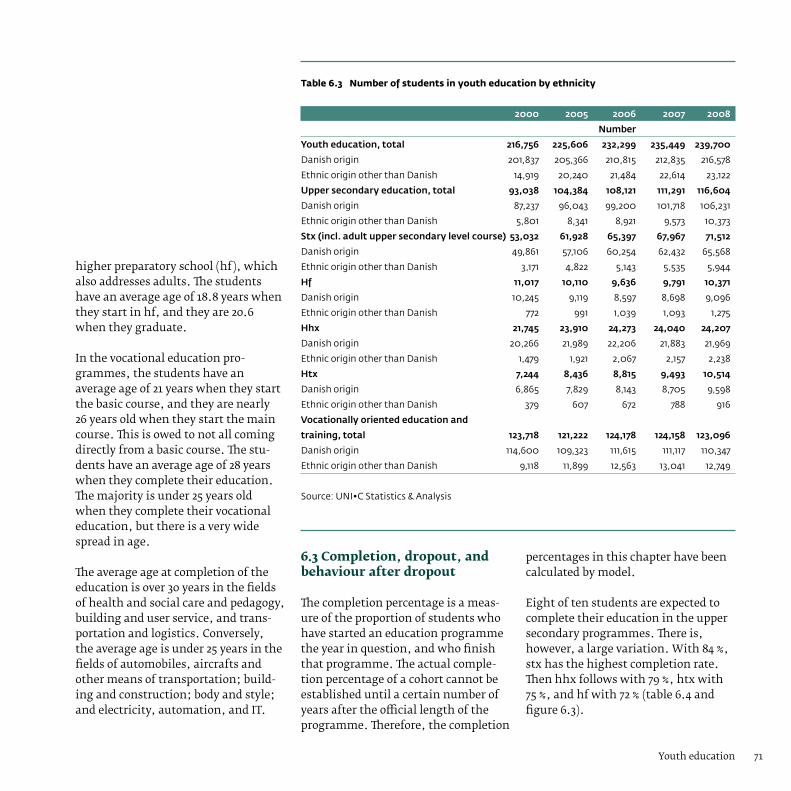
71Youth education
higher preparatory school (hf), which also addresses adults. The students have an average age of 18.8 years when they start in hf, and they are 20.6 when they graduate.
In the vocational education pro-grammes, the students have an average age of 21 years when they start the basic course, and they are nearly 26 years old when they start the main course. This is owed to not all coming directly from a basic course. The stu-dents have an average age of 28 years when they complete their education. The majority is under 25 years old when they complete their vocational education, but there is a very wide spread in age.
The average age at completion of the education is over 30 years in the fields of health and social care and pedagogy, building and user service, and trans-portation and logistics. Conversely, the average age is under 25 years in the fields of automobiles, aircrafts and other means of transportation; build-ing and construction; body and style; and electricity, automation, and IT.
Table 6.3 Number of students in youth education by ethnicity
2000 2005 2006 2007 2008
Number
Youtheducation,total 216,756 225,606 232,299 235,449 239,700
Danish origin 201,837 205,366 210,815 212,835 216,578
Ethnic origin other than Danish 14,919 20,240 21,484 22,614 23,122
Uppersecondaryeducation,total 93,038 104,384 108,121 111,291 116,604
Danish origin 87,237 96,043 99,200 101,718 106,231
Ethnic origin other than Danish 5,801 8,341 8,921 9,573 10,373
Stx(incl.adultuppersecondarylevelcourse) 53,032 61,928 65,397 67,967 71,512
Danish origin 49,861 57,106 60,254 62,432 65,568
Ethnic origin other than Danish 3,171 4,822 5,143 5,535 5,944
Hf 11,017 10,110 9,636 9,791 10,371
Danish origin 10,245 9,119 8,597 8,698 9,096
Ethnic origin other than Danish 772 991 1,039 1,093 1,275
Hhx 21,745 23,910 24,273 24,040 24,207
Danish origin 20,266 21,989 22,206 21,883 21,969
Ethnic origin other than Danish 1,479 1,921 2,067 2,157 2,238
Htx 7,244 8,436 8,815 9,493 10,514
Danish origin 6,865 7,829 8,143 8,705 9,598
Ethnic origin other than Danish 379 607 672 788 916
Vocationallyorientededucationand
training,total 123,718 121,222 124,178 124,158 123,096
Danish origin 114,600 109,323 111,615 111,117 110,347
Ethnic origin other than Danish 9,118 11,899 12,563 13,041 12,749
Source: UNI•C Statistics & Analysis
6.3 Completion, dropout, and behaviour after dropout
The completion percentage is a meas-ure of the proportion of students who have started an education programme the year in question, and who finish that programme. The actual comple-tion percentage of a cohort cannot be established until a certain number of years after the official length of the programme. Therefore, the completion
percentages in this chapter have been calculated by model.
Eight of ten students are expected to complete their education in the upper secondary programmes. There is, however, a large variation. With 84 %, stx has the highest completion rate. Then hhx follows with 79 %, htx with 75 %, and hf with 72 % (table 6.4 and figure 6.3).
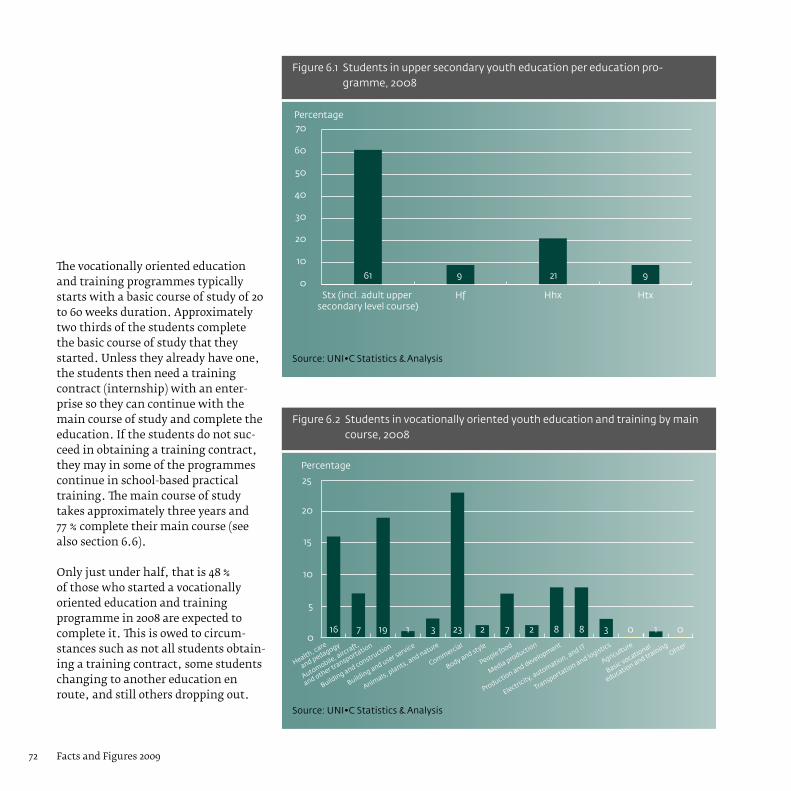
Facts and Figures 200972
The vocationally oriented education and training programmes typically starts with a basic course of study of 20 to 60 weeks duration. Approximately two thirds of the students complete the basic course of study that they started. Unless they already have one, the students then need a training contract (internship) with an enter-prise so they can continue with the main course of study and complete the education. If the students do not suc-ceed in obtaining a training contract, they may in some of the programmes continue in school-based practical training. The main course of study takes approximately three years and 77 % complete their main course (see also section 6.6).
Only just under half, that is 48 % of those who started a vocationally oriented education and training programme in 2008 are expected to complete it. This is owed to circum-stances such as not all students obtain-ing a training contract, some students changing to another education en route, and still others dropping out.
Figure 6.1 Students in upper secondary youth education per education pro-gramme, 2008
Source: UNI•C Statistics & Analysis
Figure 6.2 Students in vocationally oriented youth education and training by main course, 2008
Source: UNI•C Statistics & Analysis
2005 2006 2007 2008
Percentage
0
10
20
30
40
50
60
70
HtxHhxHfStx (incl. adult upper secondary level course)
61 9 21 9
0
5
10
15
20
25
ØvrigeEGULandbrugTransport og logistikStrøm, styring og itProduktion og udviklingMedieproduktionMad til menneskerKrop og stilMerkantilDyr, planter og naturBygnings- og brugerserviceBygge og anlægBil, fly, anden transportSundhed, omsorg, pædagogik
Percentage
16 7 19 1 3 23 2 7 2 8 8 3 0 1 0
Ohter
Basic vocational
education and training
Agriculture
Transportation and logistics
Electricity, automation, and IT
Production and development
Media production
People food
Body and style
Commercial
Animals, plants, and nature
Building and user service
Building and construction
Automobile, aircraft,
and other transportation
Health, care
and pedagogy
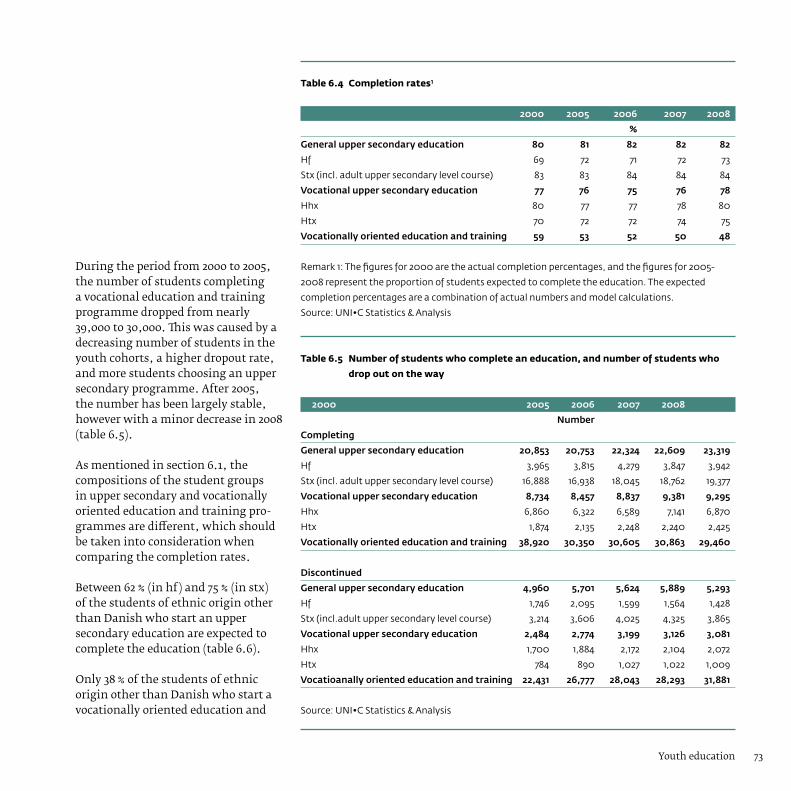
73Youth education
During the period from 2000 to 2005, the number of students completing a vocational education and training programme dropped from nearly 39,000 to 30,000. This was caused by a decreasing number of students in the youth cohorts, a higher dropout rate, and more students choosing an upper secondary programme. After 2005, the number has been largely stable, however with a minor decrease in 2008 (table 6.5).
As mentioned in section 6.1, the compositions of the student groups in upper secondary and vocationally oriented education and training pro-grammes are different, which should be taken into consideration when comparing the completion rates.
Between 62 % (in hf) and 75 % (in stx) of the students of ethnic origin other than Danish who start an upper secondary education are expected to complete the education (table 6.6).
Only 38 % of the students of ethnic origin other than Danish who start a vocationally oriented education and
Table 6.4 Completion rates1
2000 2005 2006 2007 2008
%
Generaluppersecondaryeducation 80 81 82 82 82
Hf 69 72 71 72 73
Stx (incl. adult upper secondary level course) 83 83 84 84 84
Vocationaluppersecondaryeducation 77 76 75 76 78
Hhx 80 77 77 78 80
Htx 70 72 72 74 75
Vocationallyorientededucationandtraining 59 53 52 50 48
Remark 1: The figures for 2000 are the actual completion percentages, and the figures for 2005-
2008 represent the proportion of students expected to complete the education. The expected
completion percentages are a combination of actual numbers and model calculations.
Source: UNI•C Statistics & Analysis
Table 6.5 Number of students who complete an education, and number of students who
drop out on the way
2000 2005 2006 2007 2008
Number
Completing
Generaluppersecondaryeducation 20,853 20,753 22,324 22,609 23,319
Hf 3,965 3,815 4,279 3,847 3,942
Stx (incl. adult upper secondary level course) 16,888 16,938 18,045 18,762 19,377
Vocationaluppersecondaryeducation 8,734 8,457 8,837 9,381 9,295
Hhx 6,860 6,322 6,589 7,141 6,870
Htx 1,874 2,135 2,248 2,240 2,425
Vocationallyorientededucationandtraining 38,920 30,350 30,605 30,863 29,460
Discontinued
Generaluppersecondaryeducation 4,960 5,701 5,624 5,889 5,293
Hf 1,746 2,095 1,599 1,564 1,428
Stx (incl.adult upper secondary level course) 3,214 3,606 4,025 4,325 3,865
Vocationaluppersecondaryeducation 2,484 2,774 3,199 3,126 3,081
Hhx 1,700 1,884 2,172 2,104 2,072
Htx 784 890 1,027 1,022 1,009
Vocatioanallyorientededucationandtraining 22,431 26,777 28,043 28,293 31,881
Source: UNI•C Statistics & Analysis

Facts and Figures 200974
training programme are expected to complete the education.
When comparing the completion rates for ethnic Danes with the completion rates for students of ethnic origin other than Danish in the upper secondary education programmes, the ethnic Danes in general, have a higher completion rate (figure 6.4). In hf 70 % of the men of ethnic Danish origin are expected to complete the upper second-ary education programmes in contrast to 58 % of the men among the students of ethnic origin other than Danish.
The same pattern is observed in the vocationally oriented education and training programmes as in upper secondary education (figure 6.5). In general, students of ethnic Danish ori-gin have a higher completion rate than students of ethnic origin other than Danish. Besides, women in general be-ing better at completing, the very large difference may also be a consequence of the women primarily choosing the significantly shorter social and health care education programmes.
Table 6.6 Completion rates1 for students of ethnic origin other than Danish
2000 2005 2006 2007 2008
%
Stx (incl. adult upper secondary level course) 70 71 75 74 75
Hf 48 66 64 64 62
Htx 67 69 68 69 70
Vocationally oriented education and training 68 66 67 67 68
– of this basic course 41 41 41 38 38
– of this main course 70 71 75 74 75
Note 1: The figures for 2000 are the actual completion percentages, and the figures for 2005-2008
represent the proportion of students expected to complete the education. The expected completion
percentages are a combination of actual numbers and model calculations.
Source: UNI•C Statistics & Analysis
Figure 6.3 Completion rates 1 in youth education programmes
Note 1: The proportions in 2000-2004 are the actual completion percentages, and the figures
for 2005-2008 represent the proportion of students expected to complete the education. The
expected completion percentages are a combination of actual numbers and model calculations.
Source: UNI•C Statistics & Analysis
0
10
20
30
40
50
60
70
80
90
200820072006200520042003200220012000
Percentage
■ Vocationally oriented education and training ■ Htx ■ Hhx ■ Hf ■ Stx (incl. adult upper secondary level course)
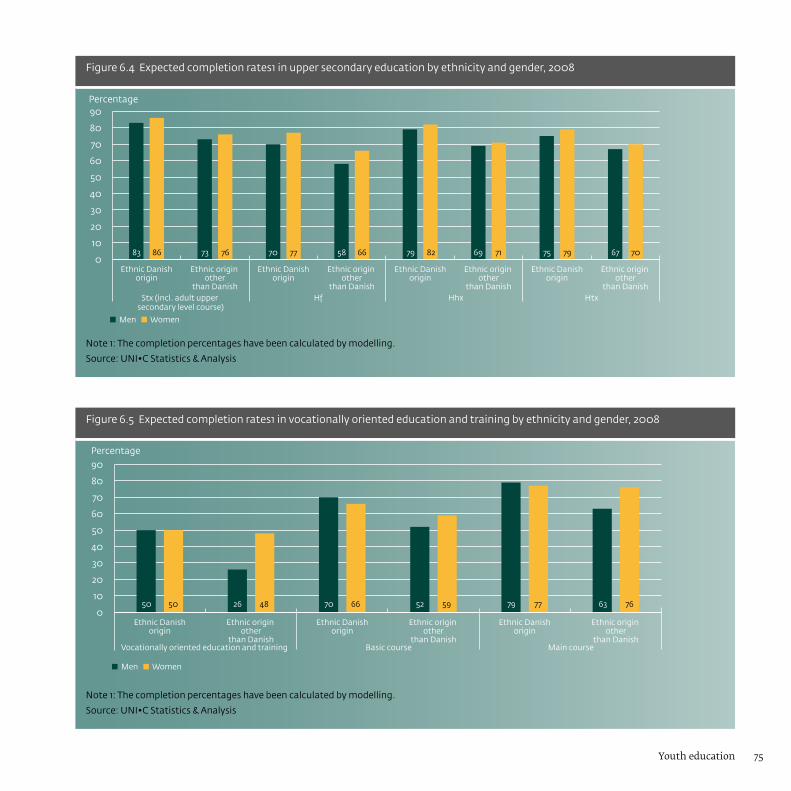
75Youth education
Figure 6.4 Expected completion rates1 in upper secondary education by ethnicity and gender, 2008
Note 1: The completion percentages have been calculated by modelling.
Source: UNI•C Statistics & Analysis
Figure 6.5 Expected completion rates1 in vocationally oriented education and training by ethnicity and gender, 2008
Note 1: The completion percentages have been calculated by modelling.
Source: UNI•C Statistics & Analysis
0
10
20
30
40
50
60
70
80
90
Ethnic origin other
than Danish
Ethnic Danishorigin
Ethnic origin other
than Danish
Ethnic Danishorigin
Ethnic origin other
than Danish
Ethnic Danishorigin
Ethnic origin other
than Danish
Ethnic Danishorigin
Stx (incl. adult upper secondary level course)
Hf Hhx Htx
Percentage
83 86 73 76 70 77 58 66 79 82 69 71 75 79 67 70
■ Men ■ Women
0
10
20
30
40
50
60
70
80
90
Ethnic origin other
than Danish
Ethnic Danishorigin
Ethnic origin other
than Danish
Ethnic Danishorigin
Ethnic origin other
than Danish
Ethnic Danishorigin
Vocationally oriented education and training Basic course Main course
Percentage
50 50 26 48 70 66 52 59 79 77 63 76
■ Men ■ Women

Facts and Figures 200976
The major part of the students drop-ping out of a three-year upper second-ary education start a new education within 27 months. The major part (60-61 %) of those dropping out of stx and hhx start another education. The same is the case as regards 72 % of those dropping out of htx. Of those dropping out of hf, only 42% are expected to start another education. In the vocational education and training programmes, the corresponding share is only 31 % (figure 6.6).
Since 2003, the tendency to continue the education has been decreasing slightly in stx, hf, and hhx. In htx, the tendency has been a decrease up until 2005 after which there has been an increase. In the vocationally oriented education and training programmes, the tendency has likewise been a decrease since 2003.
About 40 % of the students who drop out of a vocational upper secondary education start a vocationally oriented education and training programme within 27 months, while 30 % of the students who drop out of stx start another upper secondary education
0
10
20
30
40
50
60
70
80
90
20062005200420032002
Percentage
■ Vocationally oriented education and training ■ Htx ■ Hhx ■ Hf ■ Stx (incl. adult upper secondary level course)
Figure 6.6 Behaviour after discontinued youth education – proportion expected to start another education within 27 months
Source: UNI•C Statistics & Analysis
Figure 6.7 Behaviour after discontinued youth education 2006 – proportion who started another education within 27 months
Note 1: Non-qualifying education and training programmes includes primarily production schools.
Note 2: Students who have discontinued the education and who start a higher education may be
admitted by exemption or may have complemented with hf single subject courses.
Source: UNI•C Statistics & Analysis
0
10
20
30
40
50
60
70
Erhvervsfaglige uddannelser
HtxHhxHfStx (incl. adult upper
secondary level course)
Percentage
5 30 19 24406 7 7 584
413 16 391 395 26 282 106 8 697
■ Non-qualifying education1 ■ Upper secondary education ■ Vocationally oriented education and training ■ Higher education2 ■ Do not continue education

77Tal der taler
Facts and Figures 200978
program, primarily hf. 58 % of those dropping out of hf do not start a new education (figure 6.7).
6.4 The pupils’ choice of education after the youth education
An upper secondary education prepares for an academy preparatory educa-tion, whereas a vocationally oriented education and training is vocationally oriented. Thus, it is to be expected that the majority of the students who complete a higher secondary educa-tion continue their education within 27 months, corresponding to two years plus a summer holiday. More than 75 % of the graduates from stx, hhx and htx, and 61 % of those who complete hf, continue their education, whereas this is only the case for 14 % of those who complete a vocationally oriented education and training programme (table 6.7 and 6.8).Although upper secondary education primarily prepares for an academy pre-paratory education, and consequently is aimed at higher education, 32 % of the graduates from hhx continue in a
Table 6.7 Behaviour after completing upper secondary education – proportion that has
started a new education within 27 months
2002 2003 2004 2005 20061
%
Stx(incl.adultuppersecondarylevelcourse) 100.0 100.0 100.0 100.0 100.0
Continueinaneducationprogramme 74.7 75.6 77.0 77.7 78.1
Non-qualifying education 0.2 0.1 0.1 0.1 0.0
Upper secondary education 4.2 2.8 2.3 0.2 0.2
Vocationally oriented education and training 6.5 6.5 6.4 6.6 5.8
Short-cycle higher education 4.1 4.6 4.8 5.3 5.6
Professional bachelor and other medium-cycle higher
education 19.1 19.0 19.8 20.4 20.6
University bachelor and master’s programmes (candidatus) 40.6 42.6 43.6 45.2 45.8
Donotcontinueeducation2 25.3 24.4 23.0 22.3 21.9
Hf 100.0 100.0 100.0 100.0 100.0
Continueinaneducationprogramme 67.4 66.8 66.9 67.0 61.2
Non-qualifying education 0.4 0.1 0.4 0.3 0.1
Upper secondary education 7.0 3.3 2.6 0.7 0.5
Vocationally oriented education and training 13.9 15.0 15.2 14.4 13.7
Short-cycle higher education 5.1 6.3 5.5 6.1 7.0
Professional bachelor and other medium-cycle higher
education 29.1 29.0 30.0 31.2 27.7
University bachelor and master’s programmes (candidatus) 11.9 13.2 13.3 14.4 12.2
Donotcontinueeducation2 32.6 33.2 33.1 33.0 38.8
Note 1: Preliminary figures.
Note 2: The category ‘Do not continue education’ includes basic school.
Source: UNI•C Statistics & Analysis

79Youth education
vocationally oriented education and training programme. This is also the case for 12-13 % of the graduates from hf and htx (table 6.7).
In stx, primarily university bachelor programmes are popular. 45 % of the stx and 32 % of the htx graduates from 2006 started a university education. 27 % of the hf graduates in 2006 entered a professional bachelor education or a medium-cycle higher education programme.
A wide majority (86 %) of those who choose a vocationally oriented educa-tion and training programme leave the educational system and become available to the labour market. Nearly 14 % continue their education within 27 months. In total,7% start a new vocationally oriented education and training programme, and a good 4 % start a higher education (table 6.7).
Figure 6.8 shows the education which students who graduate from the upper secondary schools and the vocation-ally oriented education and training
Hhx 100.0 100.0 100.0 100.0 100.0
Continueinaneducationprogramme 73.3 73.7 74.7 76.2 74.5
Non-qualifying education 0.2 0.1 0.1 0.1 0.0
Upper secondary education 0.2 0.3 0.1 0.1 0.2
Vocationally oriented education and training 35.0 34.1 33.1 33.4 32.2
Short-cycle higher education 10.4 10.8 12.2 12.8 13.2
Professional bachelor and other medium-cycle higher
education 8.9 9.4 10.3 9.9 9.4
University bachelor and master’s programmes (candidatus) 18.7 18.9 18.9 19.8 19.5
Donotcontinueeducation2 26.7 26.3 25.3 23.8 25.5
Htx 100.0 100.0 100.0 100.0 100.0
Continue in an education programme 78.4 79.1 81.5 80.4 81.0
Non-qualifying education 0.5 1.2 1.2 1.1 0.9
Upper secondary education 3.6 2.1 2.6 0.1 0.3
Vocationally oriented education and training 13.3 14.2 14.8 13.9 12.7
Short-cycle higher education 11.7 10.9 9.7 9.6 10.6
Professional bachelor and other medium-cycle higher
education 23.9 24.5 25.0 24.3 23.6
University bachelor and master’s programmes (candidatus) 25.3 26.2 28.2 31.3 32.8
Donotcontinueeducation2 21.6 20.9 18.5 19.6 19.0
Tabel 6.7...
2002 2003 2004 2005 20061
%

Facts and Figures 200980
programmes have started within 27 months.
Table 6.9 shows how many are in the course of another education programme 15 months after having graduated from an upper secondary school. More that half of the graduates are under way again after 15 months, corresponding to one year plus a sum-mer holiday.
Young people in vocational upper secondary education are the fastest to start a new education. After 15 months, more than 60 % had started a new education in 2007.
As a matter of development over time, especially those who start in higher
Table 6.8 Behaviour after completing a vocational education and training programme –
proportion that has started a new education within 27 months
2002 2003 2004 2005 20061
%
Vocationaleducationandtrainingprogrammes 100.0 100.0 100.0 100.0 100.0
Continueinaneducationprogramme 11.3 11.5 12.5 12.5 13.9
Non-qualifying education 0.1 0.1 0.2 0.2 0.1
Upper secondary education 0.5 0.5 0.6 0.5 0.5
Vocationally oriented education and training 4.5 4.6 5.8 6.1 7.4
Short-cycle higher education 2.4 2.5 2.1 2.1 2.3
Professional bachelor and other medium-cycle higher education 3.7 3.7 3.7 3.6 3.6
University bachelor and master’s programmes (candidatus) 0.1 0.1 0.1 0.1 0.1
Donotcontinueeducation 88.7 88.5 87.5 87.5 86.1
Note 1: Preliminary figures.
Source: UNI•C Statistics & Analysis
education programmes get started faster. In 2007, 50 % of the stx students had started a higher education after 15 months as compared with barely 40 % in 2000.
6.5 Choice of subjects in upper secondary schools
During the latest years the upper secondary education has undergone a major reform that has influenced the structure and contents of the educa-tion programmes. The three upper sec-ondary education programmes: Upper secondary school leaving examination (stx), higher commercial examination (hhx), and higher technical examina-tion (htx) have been given a common
structure with an introductory basic course of study with a duration of half a year and a subsequent major study programme with a duration of two and a half years.
Each education programme has major subjects, mandatory subjects and elective subjects. In upper secondary schools, the subjects may be taken at A, B, or C level respectively, A being the highest level.
The first cohort in the new reform began their education in 2005, and completed it in 2008.
The reform has strengthened the number of students with natural sciences among the future graduates. Furthermore, the future graduates will have fewer foreign languages, but the ones they do have will be completed at a higher level.
In stx, the proportion of students with three foreign languages was 40% before the reform. In 2008, the first cohort after the reform, the proportion was 4% (figure 6.9).
81Youth education
The proportion of students in hhx who had at least three foreign languages before the reform was 21% in 2007. In 2008, after the reform, this proportion was 5%.
Since htx is a technical upper second-ary education, no students in this pro-gramme take three foreign languages - neither before nor after the reform.An important goal of the reform was to increase the proportion of gradu-ates who meet the requirements for admission to an education programme within natural sciences, technology, and health. This requires that the stu-dents have taken mathematics at level A, and physics and chemistry at least at level B. Only graduates from stx and
Table 6.9 Behaviour after completing upper secondary education leaving examination – proportion that has started further education
within 15 months
2002 2003 2004 2005 2006 20071
%
Stx(incl.adultuppersecondarylevelcourse),total 49.9 51.9 52.6 52.3 55.6 53.6
Of this vocationally oriented education and training 3.9 3.9 4.3 4.7 4.5 3.3
Of this higher education 39.9 41.1 43.5 47.4 50.8 50.0
Hf,total 51.0 49.6 49.9 49.0 48.4 46.2
Of this vocationally oriented education and training 9.6 9.8 10.8 11.2 10.3 9.4
Of this higher education 32.3 32.1 34.7 36.4 37.4 35.6
Hhx,total 60.2 60.1 60.6 62.9 62.6 61.4
Of this vocationally oriented education and training 29.1 28.8 27.8 28.8 28.6 25.4
Of this higher education 30.8 30.8 32.4 33.9 33.7 35.7
Htx,total 63.6 63.0 68.3 66.9 68.5 65.7
Of this vocationally oriented education and training 9.3 8.7 11.4 10.4 10.5 8.1
Of this higher education 48.9 48.2 51.3 54.9 56.3 56.4
Note 1: Preliminary figures.
Source: UNI•C Statistics & Analysis
010
20
30
40
50
60
70
80
90
100
Vocationally orientededucation and training
HtxHhxHfStx (incl. adult upper secondary
level course)
Percentage
6 72 22 14 47 39 32 42 26 13 67 19 7 6 86
■ Do not continue education ■ Higher education ■ Vocationally oriented education and training■ Upper secondary education ■ Non-qualifying education
Figure 6.8 Behaviour after completing youth education 2006 – proportion that has started a new education within 27 months
Note 1: The category ‘Do not continue education’ also includes those who continue in basic school.Source: UNI•C Statistics & Analysis

Facts and Figures 200982
htx will have the opportunity to meet these requirements.
In 2007, the proportion of graduates with mathematics A and physics and chemistry at least at level B was 13 % for stx, while the corresponding propor-tion after the reform in 2008 was 21 % (figure 6.10).
In the htx programme in 2007, just under half of the graduates had taken mathematics at level A and physics and chemistry at least at level B. After the reform in 2008, 77 % of the htx graduates had taken these subjects and levels.
6.6 Training contracts
The vocational education and training programmes (EUD) are alternating programmes where parts of the train-ing takes place in a school, while other parts take place in practice. Therefore, the students should apply for entering a training contract about a practice placement (internship) with an enterprise. Students who cannot find
0
5
10
15
20
25
30
35
40
45
HhxStx (incl. adult upper secondary level course)
Percentage
40 41 84 24 21 35
■ 2006 ■ 2007 ■ 2008 ■ 2009
Figure 6.9 Proportion of students in 2006-2008 and anticipated proportion of students in 2009 with at least three foreign languages in stx and hhx
Note: Foreign languages are here defined as English, French, German, Italian, Spanish, Russian, Greek, Chinese, and Japanese.Source: UNI•C Statistics & Analysis
0
10
20
30
40
50
60
70
80
90
HtxStx
Percentage
14 13 21 25 47 49 77 79
■ 2006 ■ 2007 ■ 2008 ■ 2009
Figure 6.10 Number of students in 2006-2008 and anticipated number of students in 2009 who take mathematics A and physics and chemistry at minimum level B in stx and htx
Source: UNI•C Statistics & Analysis
83Youth education
a practice placement themselves may take their practice in school.
The number of training contracts entered has varied greatly during the period 2005-2009 (table 6.10). From 2005 to 2007, the number of training contracts entered increased thus by 17 %, but dropped again by 9 % from 2007 to 2008, mainly in the second half of 2008. The drop has continued by an additional 15 % in the first half of 2009. The wide variation in number of training contracts entered has had an influence on the number of ongoing training contracts, practice placement applicants, and students in school-based practical training.
Contracts entered refer to the number of students who have contracted a practice placement during the latest 12 months. Ongoing contracts refer to the number of students who are in practical training with a contract at the end of the months. Students in school-based practical training means the number of students who are in school-based practical training at the end of December (in 2009 at the end of June). Total number of practice place-
0
10,000
20,000
30,000
40,000
50,000
60,000
70,000
June 2009
Dec. 2008
June 2008
Dec. 2007
June 2007
Dec. 2006
June 2006
Dec. 2005
June 2005
Dec. 2004
June 2004
Dec. 2003
June 2003
■ Students in school-based practical training ■ Practice placement applicants ■ Contracts entered the latest 12 months ■ Ongoing contracts
Figure 6.11 Practice placement applicants and training contracts at the end of June and December
Source: UNI•C Statistics & Analysis
Table 6.10 Practice placement applicants and training contracts
2003 2004 2005 2006 2007 2008 2009
Number
Ongoing contracts 55,038 54,200 57,070 62,362 66,360 66,002 62,587
Contracts entered 26,170 28,493 31,445 36,046 36,894 33,637 28,7351
Practice placement applicants 11,370 10,655 6,586 4,707 3,206 3,897 6,379
Students in school-based practical
training 7,562 6,936 4,315 2,540 1,622 1,583 2,391
Remark: In 2003-2008, the figures are as of end December, in 2009 as of end June.
Note 1: Number of contracts entered in the period 1 July 2008 - 30 June 2009.
Source: UNI•C Statistics & Analysis
Facts and Figures 200984
ment applicants includes students without an ongoing or planned con-tract who have qualified for the desired main course of study, and who have confirmed their application. Students in school-based practical training do not have a contract, and therefore they count as practice placement appli-cants.
From 2005 to 2007 the number of ongoing training contracts increased by 16 %, upon which it decreased by 1% till the end of 2008. The decrease in training contracts continued in the first half of 2009.
The number of practice placement applicants dropped from nearly 6,600 by the end of 2005 to 3,200 in 2007 after which the number increased again.
The drop from 2005 to 2007 may partly be ascribed to changed requirements of the application status of the students, although better opportunities for obtaining a training contract have also had a significant influence.
There was a significant drop in the number of students in school-based practical training from almost 4,300 at the end of 2005 to slightly less than 1,600 at the end of 2008. The decrease was owed to improved opportunities to obtain training contracts as well as the introduction of restricted admission to school-based practical training in eight of the education programmes. These eight programmes are: informa-tion technology and communication, office with special subject, technical designer, mechanic, electronics and
low power, electrician, carpentry, and cabinet making. The restriction of admission to school-based practi-cal training for some of the education programmes was due to the fact that the school-based practical training was used inappropriately. In other cases, a low employment rate for skilled per-sons in school-based practical training was a decisive factor.
From 2008 to 2009, the decrease in number of training contracts lead to a renewed increase in the number of students in school practice from nearly 1,600 to 2,400. The increased difficulty of finding training places has lead to an easement in the admission restric-tions of school practice for the big education programmes, office educa-tion with specialisation, woodwork building education, and mechanic education in 2009.
Figure 6.11 shows the development in number of practice placement appli-cants and training contracts as of June and December for the period 2003 to 2009.
0
10,000
20,000
30,000
40,000
50,000
60,000
70,000
2008200520082005Ongoing contracts Students in school-based practical training
■ Ethnic Danish origin ■ Ethnic origin other than Danish
Figure 6.12 Ongoing training contracts and students in school-based practical training at the end of June by ethnicity, 2005 and 2008
Source: UNI•C Statistics & Analysis

85Youth education
young people who cannot complete an ordinary youth education, have a legal right to a three-year course of education in a youth education pro-gramme. At the end of the compulsory education, young people with special needs shall be offered such a course of education.
Typically, the education takes place in municipal educational institu-tions, which receive approximately 70 % of the students, and the rest is distributed among private boarding schools, production schools, voca-tional colleges, day folk high schools, workshops, and other institutions.
In February 2009, nearly 2,000 young people had started in an education programme for young people with
Table 6.11 Referral causes for students in education programmes for young people with
special needs, February 2009
2009
%
General learning disabilities 65.1
Development impairments 19.1
Social and environmental difficulties 2.0
Physically disablements 1.8
Mental difficulties 0.9
Hearing impairments 0.2
Vision impairments 0.1
Reading and writing difficulties 0.1
A combination of reasons 9.0
Other 1.7
Total 100.0
Numberofstudents,total 1,965
Source: UNI•C Statistics & Analysis
Figure 6.12 shows ongoing contracts and students in school-based practi-cal training by ethnicity. In 2008, a significantly larger number of ethnic Danes as well as students of ethnic origin other than Danish had an ongoing contract as compared to 2005. Especially students of ethnic origin other than Danish have benefited from the higher number of contracts in the intervening period. The proportion of ethnic Danes with a contract has increased by 14 %, whereas the propor-tion of students of ethnic origin other than Danish has increased by 36 %.
In 2008, fewer students were undertak-ing school-based practical training compared to 2005. For the group of ethnic Danish origin, the number of students in school-based practical training has decreased by 65 %, while the decrease is 57 % for students of ethnic origin other than Danish.
Students of ethnic origin other than Danish constituted a larger propor-tion of both students with an ongoing training contract and students in school practice in 2008 than in 2005; this reflects, among other things, the
demographic development. Students of ethnic origin other than Danish had 7 % of the ongoing contracts in 2008 and 5 % in 2005. 26 % of all students in school practice were of an ethnic origin other than Danish in 2008 and 22 % in 2005.
6.7 Education for young people with special needs, young people in basic vocational education and training, and young people in production schools
Education for young people with special needsSince 1 August 2007, young mental re-tarded people and other young people with special needs, in other words,
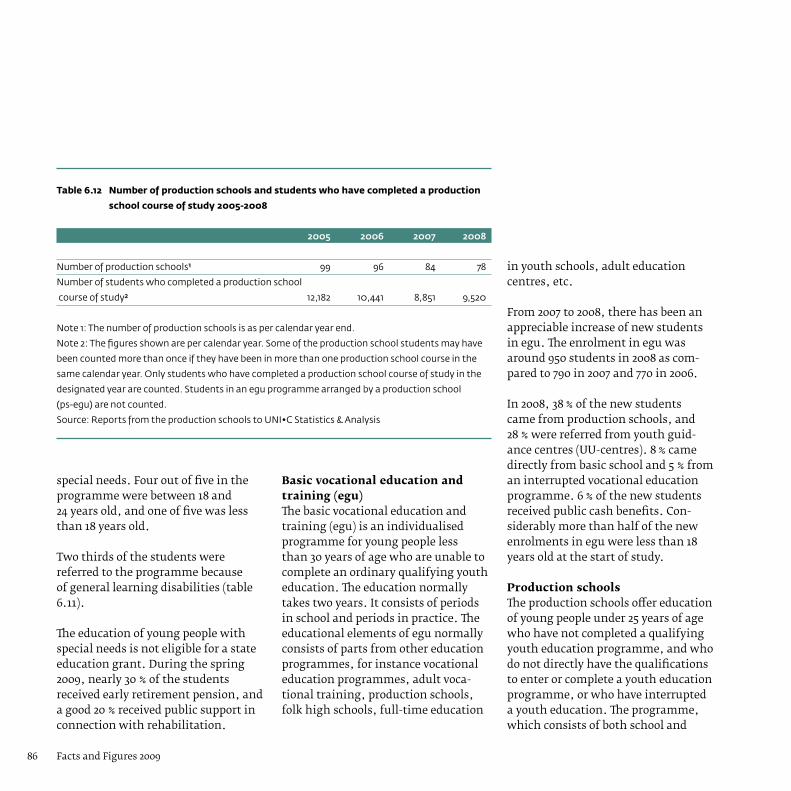
Facts and Figures 200986
special needs. Four out of five in the programme were between 18 and 24 years old, and one of five was less than 18 years old.
Two thirds of the students were referred to the programme because of general learning disabilities (table 6.11).
The education of young people with special needs is not eligible for a state education grant. During the spring 2009, nearly 30 % of the students received early retirement pension, and a good 20 % received public support in connection with rehabilitation.
Basic vocational education and training (egu)The basic vocational education and training (egu) is an individualised programme for young people less than 30 years of age who are unable to complete an ordinary qualifying youth education. The education normally takes two years. It consists of periods in school and periods in practice. The educational elements of egu normally consists of parts from other education programmes, for instance vocational education programmes, adult voca-tional training, production schools, folk high schools, full-time education
Table 6.12 Number of production schools and students who have completed a production
school course of study 2005-2008
2005 2006 2007 2008
Number of production schools1 99 96 84 78
Number of students who completed a production school
course of study2 12,182 10,441 8,851 9,520
Note 1: The number of production schools is as per calendar year end.
Note 2: The figures shown are per calendar year. Some of the production school students may have
been counted more than once if they have been in more than one production school course in the
same calendar year. Only students who have completed a production school course of study in the
designated year are counted. Students in an egu programme arranged by a production school
(ps-egu) are not counted.
Source: Reports from the production schools to UNI•C Statistics & Analysis
in youth schools, adult education centres, etc.
From 2007 to 2008, there has been an appreciable increase of new students in egu. The enrolment in egu was around 950 students in 2008 as com-pared to 790 in 2007 and 770 in 2006.
In 2008, 38 % of the new students came from production schools, and 28 % were referred from youth guid-ance centres (UU-centres). 8 % came directly from basic school and 5 % from an interrupted vocational education programme. 6 % of the new students received public cash benefits. Con-siderably more than half of the new enrolments in egu were less than 18 years old at the start of study.
Production schoolsThe production schools offer education of young people under 25 years of age who have not completed a qualifying youth education programme, and who do not directly have the qualifications to enter or complete a youth education programme, or who have interrupted a youth education. The programme, which consists of both school and

87Youth education
Table 6.13 Behaviour among students after completion of a production school course of
study 2008
2008
%
Regular education 31.1
Other education 4.9
Regular employment 20.2
Employment with activation subsidy 2.2
Liberal adult education etc. 1.6
Unemployment 17.7
Dropout/other 22.3
Total 100.0
Totalnumberofstudents 9,520
Remark: The figures shown are per calendar year.
Source: UNI•C Statistics & Analysis
Table 6.14 Students in vocationally oriented education and training programmes who
complete a practice placement abroad
2003 2004 2005 2006 2007
Number
Students in practice placement abroad 1,220 1,585 1,844 1,695 1,851
%
Proportion of all students in vocationally
oriented education and training programmes 1.0 1.1 1.4 1.3 1.5
Remark: The mobility figures have been gathered from the programmes PIU, Leonardo, Copernicus,
DK-USA, and Nordplus. Population figures for the students have been fetched from the dynamic
databases and the Databank of the Danish Ministry of Education and from UNI•C.
Source: UNI•C Statistics & Analysis
practice, builds upon activities in various workshops with a view to pro-duction and marketing. In addition, the schools offer teaching of general subjects. The programme is organised as full-time teaching. However, there are no examinations and no tests. The number of production schools has fallen steadily from 2005 to 2008. Also the number of students who have completed a production school course of study has dropped appreciably (27 %) from 2005 to 2007. From 2007 to 2008 however, there has been an increase of 8 % (table 6.12).
The majority (56 %) of the students who completed a production school course of study in 2008 have either continued in a qualifying education programme (36 %) or found ordinary employment in the labour market (20 %). An addi-tional 2 % are employed with an activa-tion subsidy, and 18 % are unemployed (table 6.13).

Facts and Figures 200988
6.8 International mobility
Supported by either the Danish practice scheme, Practice Abroad (PIU), EU’s Life Long Learning Programmes (Leonardo da Vinci, Comenius), the DK-USA programme, or the Nordic Nordplus programme, students in the vocationally oriented education and training programmes may complete a part of their education at schools or in practice abroad. Typically, the exchange programmes last from one to nine months and grant credit. That is to say that the time abroad is credited in the Danish vocational education and training programme.
The number of Danish students in the vocationally oriented education and training programmes who completed a practice placement abroad has in the later years been between 1,700 and 1,800 (table 6.14). The majority of the students come from education programmes within commerce and office, the hotel and restaurant trade, the service trade, and from social and health care education programmes.
The students in the vocationally oriented education and training programmes are especially attracted to Norway, Great Britain, Germany, and Sweden.
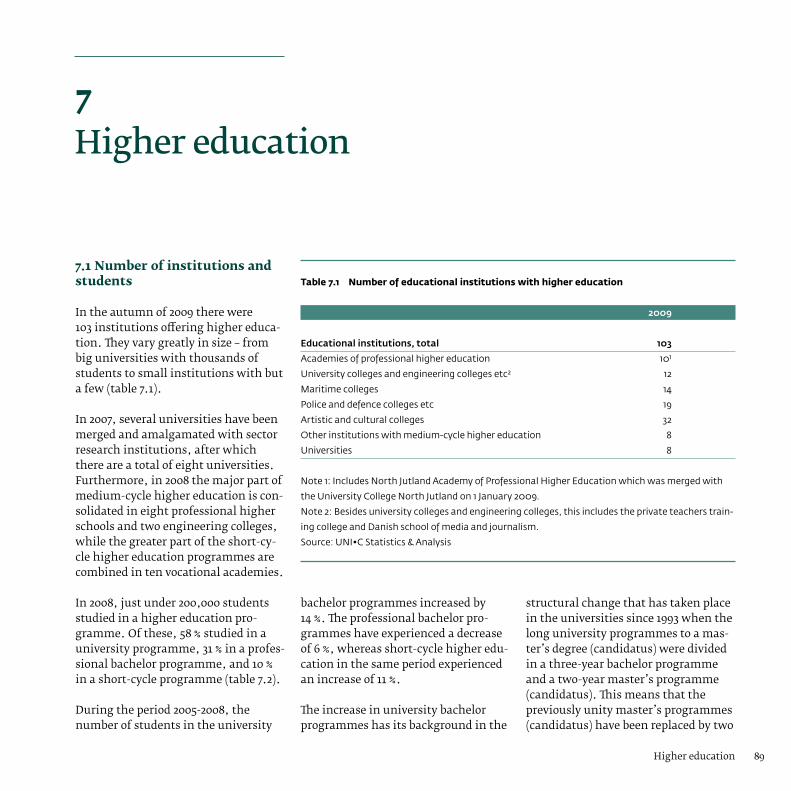
89Higher education
7.1 Number of institutions and students
In the autumn of 2009 there were 103 institutions offering higher educa-tion. They vary greatly in size – from big universities with thousands of students to small institutions with but a few (table 7.1).
In 2007, several universities have been merged and amalgamated with sector research institutions, after which there are a total of eight universities. Furthermore, in 2008 the major part of medium-cycle higher education is con-solidated in eight professional higher schools and two engineering colleges, while the greater part of the short-cy-cle higher education programmes are combined in ten vocational academies.
In 2008, just under 200,000 students studied in a higher education pro-gramme. Of these, 58 % studied in a university programme, 31 % in a profes-sional bachelor programme, and 10 % in a short-cycle programme (table 7.2).
During the period 2005-2008, the number of students in the university
bachelor programmes increased by 14 %. The professional bachelor pro-grammes have experienced a decrease of 6 %, whereas short-cycle higher edu-cation in the same period experienced an increase of 11 %.
The increase in university bachelor programmes has its background in the
structural change that has taken place in the universities since 1993 when the long university programmes to a mas-ter’s degree (candidatus) were divided in a three-year bachelor programme and a two-year master’s programme (candidatus). This means that the previously unity master’s programmes (candidatus) have been replaced by two
7 Higher education
Table 7.1 Number of educational institutions with higher education
2009
Educationalinstitutions,total 103
Academies of professional higher education 101
University colleges and engineering colleges etc2 12
Maritime colleges 14
Police and defence colleges etc 19
Artistic and cultural colleges 32
Other institutions with medium-cycle higher education 8
Universities 8
Note 1: Includes North Jutland Academy of Professional Higher Education which was merged with
the University College North Jutland on 1 January 2009.
Note 2: Besides university colleges and engineering colleges, this includes the private teachers train-
ing college and Danish school of media and journalism.
Source: UNI•C Statistics & Analysis
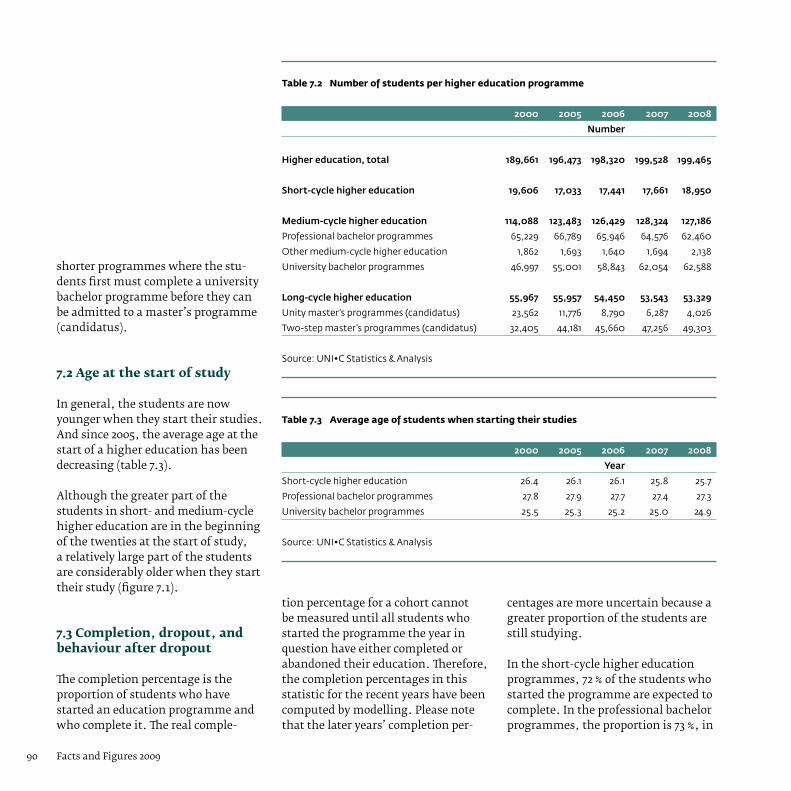
Facts and Figures 200990
shorter programmes where the stu-dents first must complete a university bachelor programme before they can be admitted to a master’s programme (candidatus).
7.2 Age at the start of study
In general, the students are now younger when they start their studies. And since 2005, the average age at the start of a higher education has been decreasing (table 7.3).
Although the greater part of the students in short- and medium-cycle higher education are in the beginning of the twenties at the start of study, a relatively large part of the students are considerably older when they start their study (figure 7.1).
7.3 Completion, dropout, and behaviour after dropout
The completion percentage is the proportion of students who have started an education programme and who complete it. The real comple-
Table 7.2 Number of students per higher education programme
2000 2005 2006 2007 2008
Number
Highereducation,total 189,661 196,473 198,320 199,528 199,465
Short-cyclehighereducation 19,606 17,033 17,441 17,661 18,950
Medium-cyclehighereducation 114,088 123,483 126,429 128,324 127,186
Professional bachelor programmes 65,229 66,789 65,946 64,576 62,460
Other medium-cycle higher education 1,862 1,693 1,640 1,694 2,138
University bachelor programmes 46,997 55,001 58,843 62,054 62,588
Long-cyclehighereducation 55,967 55,957 54,450 53,543 53,329
Unity master’s programmes (candidatus) 23,562 11,776 8,790 6,287 4,026
Two-step master’s programmes (candidatus) 32,405 44,181 45,660 47,256 49,303
Source: UNI•C Statistics & Analysis
Table 7.3 Average age of students when starting their studies
2000 2005 2006 2007 2008
Year
Short-cycle higher education 26.4 26.1 26.1 25.8 25.7
Professional bachelor programmes 27.8 27.9 27.7 27.4 27.3
University bachelor programmes 25.5 25.3 25.2 25.0 24.9
Source: UNI•C Statistics & Analysis
tion percentage for a cohort cannot be measured until all students who started the programme the year in question have either completed or abandoned their education. Therefore, the completion percentages in this statistic for the recent years have been computed by modelling. Please note that the later years’ completion per-
centages are more uncertain because a greater proportion of the students are still studying.
In the short-cycle higher education programmes, 72 % of the students who started the programme are expected to complete. In the professional bachelor programmes, the proportion is 73 %, in
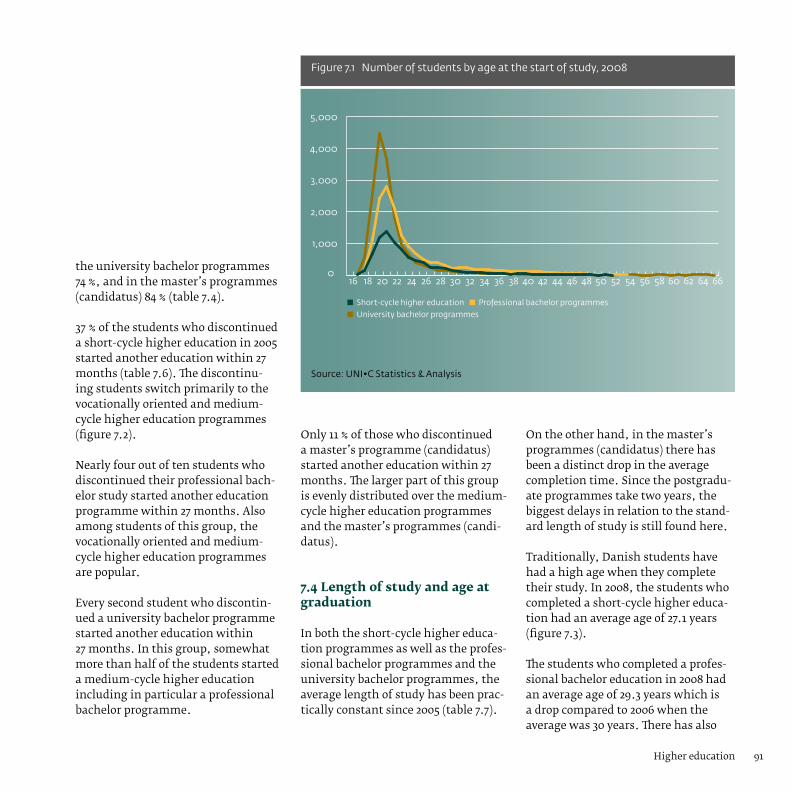
91Higher education
the university bachelor programmes 74 %, and in the master’s programmes (candidatus) 84 % (table 7.4).
37 % of the students who discontinued a short-cycle higher education in 2005 started another education within 27 months (table 7.6). The discontinu-ing students switch primarily to the vocationally oriented and medium-cycle higher education programmes (figure 7.2).
Nearly four out of ten students who discontinued their professional bach-elor study started another education programme within 27 months. Also among students of this group, the vocationally oriented and medium-cycle higher education programmes are popular.
Every second student who discontin-ued a university bachelor programme started another education within 27 months. In this group, somewhat more than half of the students started a medium-cycle higher education including in particular a professional bachelor programme.
Only 11 % of those who discontinued a master’s programme (candidatus) started another education within 27 months. The larger part of this group is evenly distributed over the medium-cycle higher education programmes and the master’s programmes (candi-datus).
7.4 Length of study and age at graduation
In both the short-cycle higher educa-tion programmes as well as the profes-sional bachelor programmes and the university bachelor programmes, the average length of study has been prac-tically constant since 2005 (table 7.7).
On the other hand, in the master’s programmes (candidatus) there has been a distinct drop in the average completion time. Since the postgradu-ate programmes take two years, the biggest delays in relation to the stand-ard length of study is still found here.
Traditionally, Danish students have had a high age when they complete their study. In 2008, the students who completed a short-cycle higher educa-tion had an average age of 27.1 years (figure 7.3).
The students who completed a profes-sional bachelor education in 2008 had an average age of 29.3 years which is a drop compared to 2006 when the average was 30 years. There has also
0
1,000
2,000
3,000
4,000
5,000
6664626058565452504846444240383634323028262422201816
■ Short-cycle higher education ■ Professional bachelor programmes■ University bachelor programmes
Figure 7.1 Number of students by age at the start of study, 2008
Source: UNI•C Statistics & Analysis
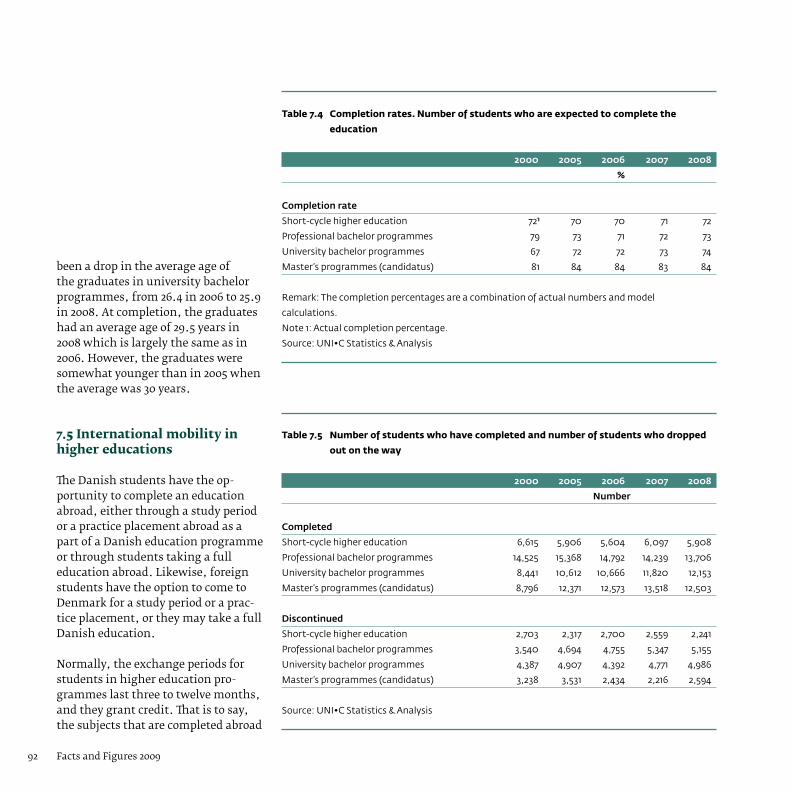
Facts and Figures 200992
been a drop in the average age of the graduates in university bachelor programmes, from 26.4 in 2006 to 25.9 in 2008. At completion, the graduates had an average age of 29.5 years in 2008 which is largely the same as in 2006. However, the graduates were somewhat younger than in 2005 when the average was 30 years.
7.5 International mobility in higher educations
The Danish students have the op-portunity to complete an education abroad, either through a study period or a practice placement abroad as a part of a Danish education programme or through students taking a full education abroad. Likewise, foreign students have the option to come to Denmark for a study period or a prac-tice placement, or they may take a full Danish education.
Normally, the exchange periods for students in higher education pro-grammes last three to twelve months, and they grant credit. That is to say, the subjects that are completed abroad
Table 7.4 Completion rates. Number of students who are expected to complete the
education
2000 2005 2006 2007 2008
%
Completionrate
Short-cycle higher education 721 70 70 71 72
Professional bachelor programmes 79 73 71 72 73
University bachelor programmes 67 72 72 73 74
Master’s programmes (candidatus) 81 84 84 83 84
Remark: The completion percentages are a combination of actual numbers and model
calculations.
Note 1: Actual completion percentage.
Source: UNI•C Statistics & Analysis
Table 7.5 Number of students who have completed and number of students who dropped
out on the way
2000 2005 2006 2007 2008
Number
Completed
Short-cycle higher education 6,615 5,906 5,604 6,097 5,908
Professional bachelor programmes 14,525 15,368 14,792 14,239 13,706
University bachelor programmes 8,441 10,612 10,666 11,820 12,153
Master’s programmes (candidatus) 8,796 12,371 12,573 13,518 12,503
Discontinued
Short-cycle higher education 2,703 2,317 2,700 2,559 2,241
Professional bachelor programmes 3,540 4,694 4,755 5,347 5,155
University bachelor programmes 4,387 4,907 4,392 4,771 4,986
Master’s programmes (candidatus) 3,238 3,531 2,434 2,216 2,594
Source: UNI•C Statistics & Analysis

93Higher education
grant credit in the Danish education so that the stay abroad does not prolong the study.
Several students in higher educa-tion go on an exchange programme supported by an international educa-tion programme such as Erasmus or Nordplus. Others go with support from their own educational institution, from private foundations, or financed by themselves. Beginning July 2008, it has become easier for the students themselves to arrange an exchange study in a foreign educational institu-tion. It is now possible to have all or parts of the tuition financed by the foreign grant scheme. I 20077, 5,100 Danish students joined an exchange programme abroad, whereas 7,200 foreign students completed an exchange programme in Denmark. In both cases, 70-80 % of the exchange students were university bachelor or master’s (candidates) students, and 15-20 % were professional
Table 7.6 Behaviour after discontinued education – proportion who have started another
education within 27 months, percentage
2002 2003 2004 2005
%
Short-cyclehighereducation 100.0 100.0 100.0 100.0
Continue in an education programme 37.9 37.2 37.4 36.9
Do not continue education 62.1 62.8 62.6 63.1
Professionalbachelorprogrammes 100.0 100.0 100.0 100.0
Continue in an education programme 40.5 41.7 39.7% 37.8
Do not continue education 59.5 58.3 60.3% 62.2
Universitybachelorprogrammes 100.0 100.0 100.0 100.0
Continue in an education programme 51.1 54.3 49.1 49.9
Do not continue education 48.9 45.7 50.9 50.1
Master’sprogrammes(candidatus) 100.0 100.0 100.0 100.0
Continue in an education programme 14.1 15.5 13.9 11.2
Do not continue education 85.9 84.5 86.1 88.8
Source: UNI•C Statistics & Analysis
Table 7.7 Average time to graduate in number of years
2000 2005 2006 2007 2008
Year
Short-cycle higher education 1.9 2.0 2.1 2.1 2.1
Professional bachelor programmes 3.6 3.7 3.6 3.7 3.7
University bachelor programmes 3.5 3.5 3.5 3.4 3.4
Master’s programmes (candidatus) 3.3 3.4 3.3 3.2 3.1
Source: UNI•C Statistics & Analysis
7 The years indicated mean academic year, i.e. 2007 means the academic year 2007/08.

Facts and Figures 200994
bachelor students, whereas only four percent were students in short-cycle higher education (table 7.8).
The number of Danish exchange stu-dents is again slightly increasing after a period of stagnation. From 2005 to 2007, the number increased almost 8% (figure 7.4). Among other things, the increase is owed to the opportunity to study abroad with a grant from Eras-mus, which was introduced in 2007.
It has generally been the universities that send out the most exchange stu-dents. The five countries that received the most Danish university students in 2007 were USA, which received 14 % of the total number of exchange stu-dents, Great Britain (10 %), Germany (9%), Australia (9 %), and Spain (7 %),
The number of international exchange students in Denmark has nearly dou-bled since 2000, and from 2005 to 2007, the number rose by 11 %.
In 2007, in the university domain, where the majority of the interna-tional exchange students are received, the most students came from Germany
0
10
20
3040
50
60
70
80
90
100
Master’s programmes(candidatus)
University bachelorprogrammes
Professional bachelorprogrammes
Short-cycle highereducation
Percentage
■ Do not continue education ■ Other 1 ■ Vocationally oriented education and training ■ Short-cycle higher education ■ Medium-cycle higher education ■ Long-cycle higher education
Figure 7.2 Behaviour after discontinued education in 2005 – proportion who has started another education within 27 months
Note 1: Other includes upper secondary education and non-qualifying education.
Source: UNI•C Statistics & Analysis
25
26
27
28
29
30
31
200820072006200520042003200220012000
■ Short-cycle higher education ■ Professional bachelor programmes■ University bachelor programmes ■ Master’s education (candidatus)
Figure 7.3 Average age at graduation
Source: UNI•C Statistics & Analysis
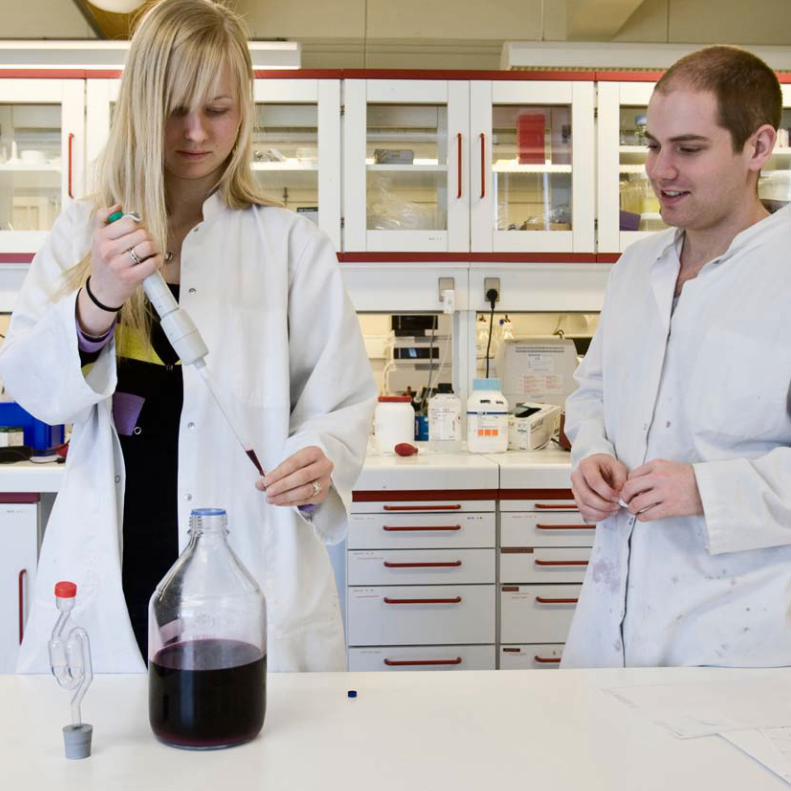
95Tal der taler
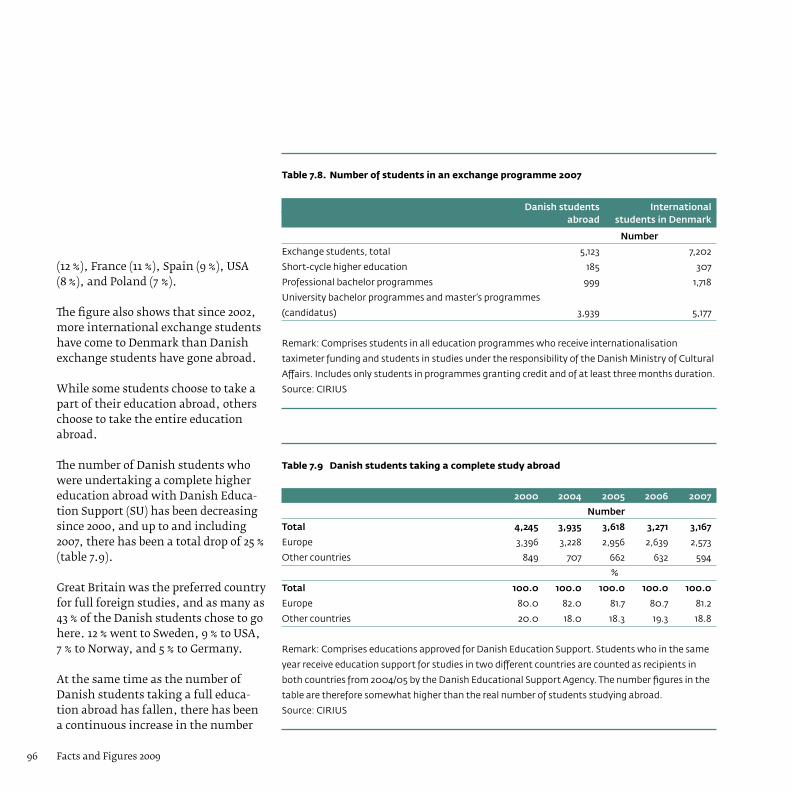
Facts and Figures 200996
(12 %), France (11 %), Spain (9 %), USA (8 %), and Poland (7 %).
The figure also shows that since 2002, more international exchange students have come to Denmark than Danish exchange students have gone abroad.
While some students choose to take a part of their education abroad, others choose to take the entire education abroad.
The number of Danish students who were undertaking a complete higher education abroad with Danish Educa-tion Support (SU) has been decreasing since 2000, and up to and including 2007, there has been a total drop of 25 % (table 7.9).
Great Britain was the preferred country for full foreign studies, and as many as 43 % of the Danish students chose to go here. 12 % went to Sweden, 9 % to USA, 7 % to Norway, and 5 % to Germany.
At the same time as the number of Danish students taking a full educa-tion abroad has fallen, there has been a continuous increase in the number
Table 7.8. Number of students in an exchange programme 2007
Danishstudents International abroad studentsinDenmark
Number
Exchange students, total 5,123 7,202
Short-cycle higher education 185 307
Professional bachelor programmes 999 1,718
University bachelor programmes and master’s programmes
(candidatus) 3,939 5,177
Remark: Comprises students in all education programmes who receive internationalisation
taximeter funding and students in studies under the responsibility of the Danish Ministry of Cultural
Affairs. Includes only students in programmes granting credit and of at least three months duration.
Source: CIRIUS
Table 7.9 Danish students taking a complete study abroad
2000 2004 2005 2006 2007
Number
Total 4,245 3,935 3,618 3,271 3,167
Europe 3,396 3,228 2,956 2,639 2,573
Other countries 849 707 662 632 594
%
Total 100.0 100.0 100.0 100.0 100.0
Europe 80.0 82.0 81.7 80.7 81.2
Other countries 20.0 18.0 18.3 19.3 18.8
Remark: Comprises educations approved for Danish Education Support. Students who in the same
year receive education support for studies in two different countries are counted as recipients in
both countries from 2004/05 by the Danish Educational Support Agency. The number figures in the
table are therefore somewhat higher than the real number of students studying abroad.
Source: CIRIUS

97Higher education
of international students taking a full education in Denmark. In 2007, there was, however, a minor decrease of about 2%. This is the first drop in a number of years. The drop should be viewed in relation to the introduction of tuition for students from countries outside of EU/EEA who were enrolled after 31 July 2006. Since 2007, full tuition stipends have been given to highly qualified international students from countries outside of EU/EEA in a number of higher education pro-grammes.
With the exception of students from the Nordic countries, the majority of the international students follow education programmes that are offered in English.
In 2007, around 2.5 international students came to Denmark for each Danish student who went abroad to complete a full education programme.
The most international students came from Norway (16 %), China (12 %), Swe-den (11 %), Iceland (9 %), and Germany (6 %).
0
1,000
2,000
3,000
4,000
5,000
6,000
7,000
8,000
20072006200520042003200220012000
■ International exhange students ■ Danish exchange students
Figure 7.4 Number of Danish students in exchange programmes abroad and number of international students in exchange programmes in Denmark
Remark: Comprises students in all education programmes who receive internationalisation
taximeter funding and students in studies under the responsibility of the Danish Ministry of
Cultural Affairs. Includes only students in programmes granting credit and of at least three
months duration. Short-cycle higher education has not been included before 2005.
Source: CIRIUS
0
1,000
2,000
3,000
4,000
5,000
6,000
PhD programmes
Long-cycle higher education
Medium-cycle higher education
Short-cycle higher education
1493 1207
4906
457
■ 2004 ■ 2005 ■ 2006 ■ 2007
Figure 7.5 Number of international students taking a complete course of study in Denmark
Source: CIRIUS – Special run from Statistics Denmark
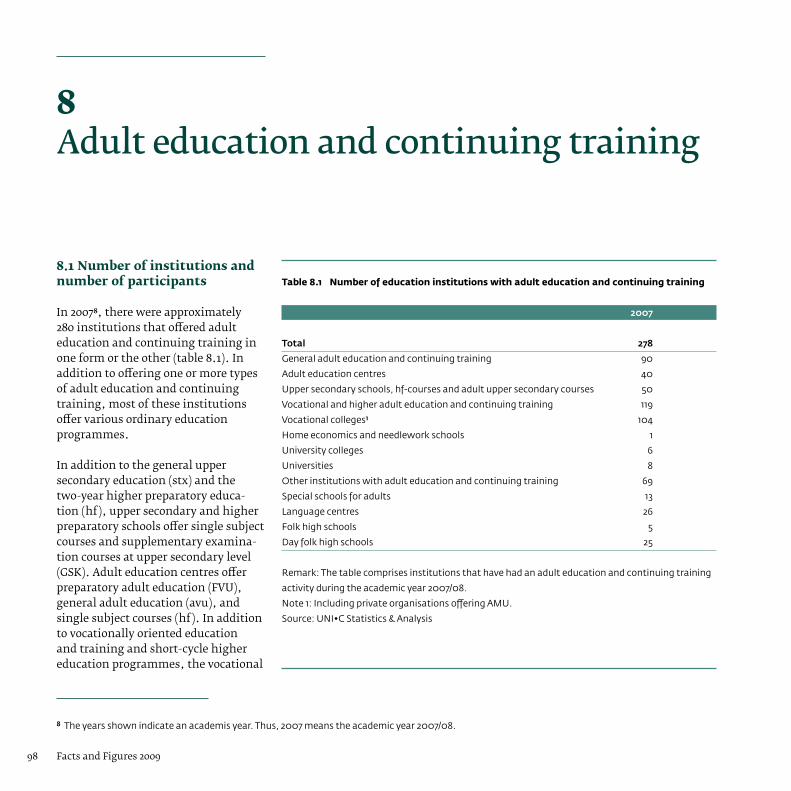
98 Facts and Figures 2009
8 Adult education and continuing training
8.1 Number of institutions and number of participants
In 20078, there were approximately 280 institutions that offered adult education and continuing training in one form or the other (table 8.1). In addition to offering one or more types of adult education and continuing training, most of these institutions offer various ordinary education programmes.
In addition to the general upper secondary education (stx) and the two-year higher preparatory educa-tion (hf), upper secondary and higher preparatory schools offer single subject courses and supplementary examina-tion courses at upper secondary level (GSK). Adult education centres offer preparatory adult education (FVU), general adult education (avu), and single subject courses (hf). In addition to vocationally oriented education and training and short-cycle higher education programmes, the vocational
8 The years shown indicate an academis year. Thus, 2007 means the academic year 2007/08.
Table 8.1 Number of education institutions with adult education and continuing training
2007
Total 278
General adult education and continuing training 90
Adult education centres 40
Upper secondary schools, hf-courses and adult upper secondary courses 50
Vocational and higher adult education and continuing training 119
Vocational colleges1 104
Home economics and needlework schools 1
University colleges 6
Universities 8
Other institutions with adult education and continuing training 69
Special schools for adults 13
Language centres 26
Folk high schools 5
Day folk high schools 25
Remark: The table comprises institutions that have had an adult education and continuing training
activity during the academic year 2007/08.
Note 1: Including private organisations offering AMU.
Source: UNI•C Statistics & Analysis

99Tal der taler
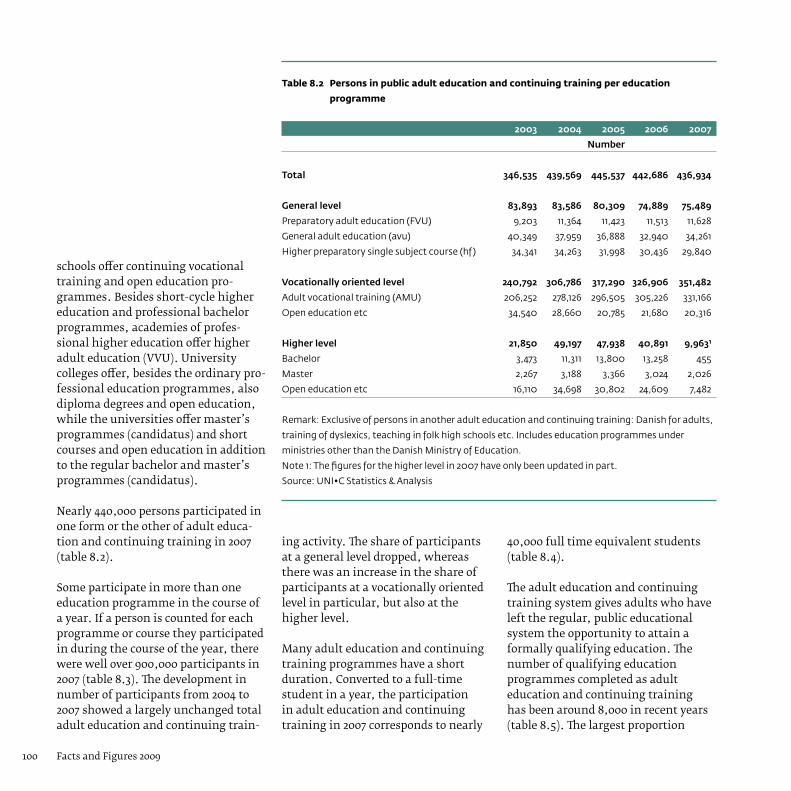
Facts and Figures 2009100
schools offer continuing vocational training and open education pro-grammes. Besides short-cycle higher education and professional bachelor programmes, academies of profes-sional higher education offer higher adult education (VVU). University colleges offer, besides the ordinary pro-fessional education programmes, also diploma degrees and open education, while the universities offer master’s programmes (candidatus) and short courses and open education in addition to the regular bachelor and master’s programmes (candidatus).
Nearly 440,000 persons participated in one form or the other of adult educa-tion and continuing training in 2007 (table 8.2).
Some participate in more than one education programme in the course of a year. If a person is counted for each programme or course they participated in during the course of the year, there were well over 900,000 participants in 2007 (table 8.3). The development in number of participants from 2004 to 2007 showed a largely unchanged total adult education and continuing train-
Table 8.2 Persons in public adult education and continuing training per education
programme
2003 2004 2005 2006 2007
Number
Total 346,535 439,569 445,537 442,686 436,934
Generallevel 83,893 83,586 80,309 74,889 75,489
Preparatory adult education (FVU) 9,203 11,364 11,423 11,513 11,628
General adult education (avu) 40,349 37,959 36,888 32,940 34,261
Higher preparatory single subject course (hf) 34,341 34,263 31,998 30,436 29,840
Vocationallyorientedlevel 240,792 306,786 317,290 326,906 351,482
Adult vocational training (AMU) 206,252 278,126 296,505 305,226 331,166
Open education etc 34,540 28,660 20,785 21,680 20,316
Higherlevel 21,850 49,197 47,938 40,891 9,9631
Bachelor 3,473 11,311 13,800 13,258 455
Master 2,267 3,188 3,366 3,024 2,026
Open education etc 16,110 34,698 30,802 24,609 7,482
Remark: Exclusive of persons in another adult education and continuing training: Danish for adults,
training of dyslexics, teaching in folk high schools etc. Includes education programmes under
ministries other than the Danish Ministry of Education.
Note 1: The figures for the higher level in 2007 have only been updated in part.
Source: UNI•C Statistics & Analysis
ing activity. The share of participants at a general level dropped, whereas there was an increase in the share of participants at a vocationally oriented level in particular, but also at the higher level.
Many adult education and continuing training programmes have a short duration. Converted to a full-time student in a year, the participation in adult education and continuing training in 2007 corresponds to nearly
40,000 full time equivalent students (table 8.4).
The adult education and continuing training system gives adults who have left the regular, public educational system the opportunity to attain a formally qualifying education. The number of qualifying education programmes completed as adult education and continuing training has been around 8,000 in recent years (table 8.5). The largest proportion

101Adult education and continuing training
completed of the qualifying education programmes has been at the higher level, especially at medium-cycle higher level. The vocationally oriented education and training programmes are primarily basic adult education programmes (GVU).
8.2 Age and educational background
The variation in age among the participants in adult education and continuing training is considerable. Shortly after leaving basic or upper secondary school, many young people choose to complement their educa-tion by a general adult education and continuing training as an avu subject, an hf single subject course, or a sup-plementary examination course at upper secondary level in order to meet the entrance requirement of a given higher education. Others enrol after many years in the labour market. This may be caused by a perceived require-ment for development of qualifications in line with changed and often higher requirements within their trade or
Table 8.3 Participants in public adult education and continuing training per education
programme
2003 2004 2005 2006 2007
Number
Total 720,550 986,853 959,793 914,505 915,246
Generallevel 193,780 202,690 203,060 182,958 189,010
Preparatory adult education (FVU) 20,376 22,292 25,239 26,087 23,959
General adult education (avu) 90,219 90,947 90,715 78,500 88,733
Higher preparatory single subject course (hf) 83,185 89,451 87,106 78,371 76,318
Vocationallyorientedlevel 480,477 678,366 662,656 659,445 710,390
Adult vocational training (AMU) 432,409 619,472 619,732 612,382 674,454
Open education etc 48,068 58,894 42,924 47,063 35,936
Higherlevel 46,293 105,797 94,077 72,102 15,8461
Bachelor 6,426 21,054 24,057 21,895 532
Master 4,345 6,961 7,041 7,204 3,177
Open education etc 35,522 77,782 62,979 43,003 12,137
Remark: Exclusive of participants in another adult education and continuing training: Danish for
adults, training of dyslexic, teaching in folk high schools etc. Includes education programmes under
ministries other than the Danish Ministry of Education.
Note 1: The figures for the higher level in 2007 have only been updated in part.
Source: UNI•C Statistics & Analysis
Table 8.4 Full time equivalent students in public adult education and continuing training
per education programme
2003 2004 2005 2006 2007
Number
Total 56,194 65,423 62,262 49,982 38,452
General level 33,521 31,238 29,174 23,764 20,511
Vocationally oriented level 11,052 12,136 11,679 10,664 11,279
Higher level 11,621 22,049 21,409 15,554 6,6621
Note 1: The figures for the higher level in 2007 have only been updated in part.
Source: UNI•C Statistics & Analysis

Facts and Figures 2009102
based on a personal wish to acquire new skills.
The participants in vocationally ori-ented adult education and continuing training are relatively the oldest, while the participants in general/academic preparatory education are the youngest (figure 8.1).
Four out of five of the total number of persons of around 450,000 who participated in adult education and continuing training in 2007 had either a general education (basic school, general upper secondary school) or a vocationally oriented education as their highest level education, and one in five had a higher education (table 8.6). Among the participants with a higher education, there were relatively more with a medium-cycle higher education.
8.3 Continuing training activity in international perspective
In 2008, nearly one in three of the population in the age bracket 25-64 years participated in an educational
Table 8.5 Number of formally qualifying examinations implemented as adult education
and continuing training
2002 2003 2004 2005 2006
Number
Total 4,912 8,005 5,997 7,924 7,984
Upper secondary 1,073 1,214 1,163 1,264 1,556
Vocational .. 181 155 288 261
Short-cycle higher 1,540 3,546 829 1,957 1,670
Medium-cycle higher 1,939 2,175 2,867 3,463 2,022
Long-cycle higher 360 889 983 952 890
Remark: Based on calendar year.
Source: UNI•C Statistics & Analysis
0
5,000
10,000
15,000
20,000
25,000
6664626058565452504846444240383634323028262422201816
Number of students
■ General ■ Vocational ■ Higher
Figure 8.1 Number of participants in adult education and continuing training by age, 2007
Source: UNI•C Statistics & Analysis
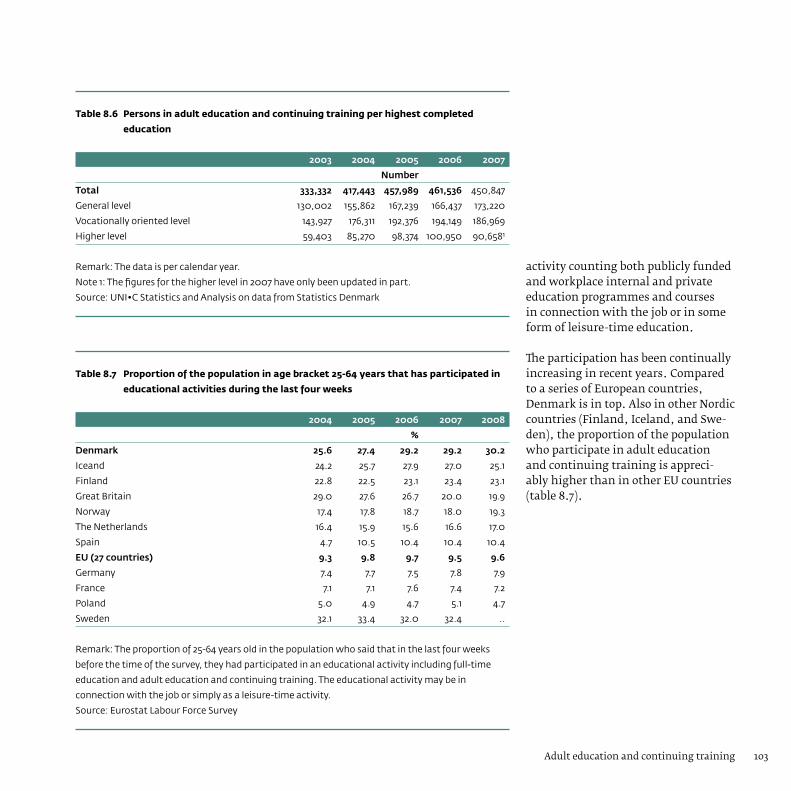
103Adult education and continuing training
activity counting both publicly funded and workplace internal and private education programmes and courses in connection with the job or in some form of leisure-time education.
The participation has been continually increasing in recent years. Compared to a series of European countries, Denmark is in top. Also in other Nordic countries (Finland, Iceland, and Swe-den), the proportion of the population who participate in adult education and continuing training is appreci-ably higher than in other EU countries (table 8.7).
Table 8.6 Persons in adult education and continuing training per highest completed
education
2003 2004 2005 2006 2007
Number
Total 333,332 417,443 457,989 461,536 450,847
General level 130,002 155,862 167,239 166,437 173,220
Vocationally oriented level 143,927 176,311 192,376 194,149 186,969
Higher level 59,403 85,270 98,374 100,950 90,6581
Remark: The data is per calendar year.
Note 1: The figures for the higher level in 2007 have only been updated in part.
Source: UNI•C Statistics and Analysis on data from Statistics Denmark
Table 8.7 Proportion of the population in age bracket 25-64 years that has participated in
educational activities during the last four weeks
2004 2005 2006 2007 2008
%
Denmark 25.6 27.4 29.2 29.2 30.2
Iceand 24.2 25.7 27.9 27.0 25.1
Finland 22.8 22.5 23.1 23.4 23.1
Great Britain 29.0 27.6 26.7 20.0 19.9
Norway 17.4 17.8 18.7 18.0 19.3
The Netherlands 16.4 15.9 15.6 16.6 17.0
Spain 4.7 10.5 10.4 10.4 10.4
EU(27countries) 9.3 9.8 9.7 9.5 9.6
Germany 7.4 7.7 7.5 7.8 7.9
France 7.1 7.1 7.6 7.4 7.2
Poland 5.0 4.9 4.7 5.1 4.7
Sweden 32.1 33.4 32.0 32.4 ..
Remark: The proportion of 25-64 years old in the population who said that in the last four weeks
before the time of the survey, they had participated in an educational activity including full-time
education and adult education and continuing training. The educational activity may be in
connection with the job or simply as a leisure-time activity.
Source: Eurostat Labour Force Survey

Facts and Figures 2009Key Figures in Education 2009
Facts and Figures 2009 is an outline of the Danish education system with a quantitative description of trends and developments in various fi elds of education.
� e education system is changing continuously keeping up with new generations and new requirements from the labour market. � is publication presents a series of key fi gures in tables and graphs showing the directions of the development. Primarily, the publication illustrates the development by Danish fi gures complemented by equivalent fi gures form selected countries.
� e Danish Ministry of Education
Facts and Figu
res 2009 - Key Figu
res in Edu
cation 2009 Facts and Figures
2009Key Figures in Education 2009
� e Danish Ministry of Education – Statistical Publication no. 2 – 2010