the performance of robust weighted least squares in the presence of outliers and heteroscedastic...
TRANSCRIPT
The Performance of Robust Weighted Least Squares in the Presence of Outliers and Heteroscedastic Errors
HABSHAH MIDI1, MD. SOHEL RANA2, AND A. H. M. RAHMATULLAH IMON3
1,2 Laboratory of Applied and Computational Statistics, Institute for Mathematical Research, University Putra Malaysia,
43400 Serdang, Selangor, MALAYSIA
3Department of Mathematical Sciences, Ball State University,
Muncie, IN 47306, U.S.A.
E-mail: [email protected], [email protected], [email protected]
Abstract: The Ordinary Least Squares (OLS) method is the most popular technique in statistics and is often use to estimate the parameters of a model because of tradition and ease of computation. The OLS provides an efficient and unbiased estimates of the parameters when the underlying assumptions, especially the assumption of contant error variances (homoscedasticity), are satisfied. Nonetheless, in real situation it is difficult to retain the error variance homogeneous for many practical reasons and thus there arises the problem of heteroscedasticity. We generally apply the Weighted Least Squares (WLS) procedure to estimate the regression parameters when heteroscedasticity occurs in the data. Nevertheless, there is evidence that the WLS estimators suffer a huge set back in the presence of a few atypical observations that we often call outliers. In this situation the analysis will become more complicated. In this paper we have proposed a robust procedure for the estimation of regression parameters in the situation where heteroscedasticity comes together with the existence of outliers. Here we have employed robust techniques twice, once in estimating the group variances and again in determining weights for the least squares. We call this method Robust Weighted Least Squares (RWLS). The performance of the newly proposed method is investigated extensively by real data sets and Monte Carlo Simulations. The results suggest that the RWLS method offers substantial improvements over the existing methods. Key-words: Heteroscedasticity, Outliers, Robust Estimation, Robust Weighted Least Squares, Monte Carlo Simulation 1. Introduction In linear regression analysis the ordinary least squares (OLS) technique is widely used to fit the model mainly because of tradition and ease of computation. Under certain assumptions the OLS estimators possess some very nice and desirable properties. Significance tests and confidence intervals involving regression coefficients are available in popular statistical packages that researchers use regularly. But the validity of the tests and the coverage probability of confidence intervals depend largely on the extent to which the model's assumptions are met.
Among the assumptions of the OLS regression model, homoscedasticity is a rather stringent one that is unlikely to hold in many applied settings. Researchers often encounter situations in which the variance of the dependent variable is related to the values of one or more explanatory variables, resulting in heteroscedasticity. In such a situation, a variance model based on the explanatory variables can produce weights for the weighted least squares estimator (see [5], [6], [11], [22]). Weighted least squares, which is a special case of the generalized least squares estimator, is optimal if the covariance structure of the errors is known (see [18]). But usually, the error covariance structure is not known in advance. In that case, researchers can use esti-
WSEAS TRANSACTIONS on MATHEMATICS Habshah Midi, Md. Sohel Rana, A. H. M. Rahmatullah Imon
ISSN: 1109-2769 351 Issue 7, Volume 8, July 2009
mated generalized least squares (see [4], [17], [20]) instead. In the presence of heteroscedasticity, the OLS estimators are still unbiased. However, the most damaging consequence of heteroscedasticity is that the OLS estimator of the parameter Covariance Matrix (OLSCM), whose diagonal elements are used to estimate the standard errors of the regression coefficients, becomes biased and inconsistent. As a consequence, the t tests for individual coefficients are either too liberal or too conservative depending on the form of heteroscedasticity. Therefore, a natural question comes to our mind is whether we can find an alternative variance estimator that remains consistent under heteroscedasticity. In this case, a Heteroscedasticity Consistent Covariance Matrix (HCCM) proposed by White (see [28]) is used to solve the consistency problem of the estimator. But there is evidence that a few atypical ob-servations (outliers) can make all the estimation procedures meaningless (see [2], [19], [21], [24]). In the presence of outliers we have some robust techniques for the detection of heteroscedasticity (see [13], [23]). Unfortunately we do not have much robust techniques available in the literature for the estimation of parameters in the presence of heteroscedasticity and outliers. Although heteroscedasticity does not cause any biasness problem to the OLS estimators, the OLS can easily be affected by the presence of outliers. The weighted least squares also suffer the same problem in the presence of outliers (see [19]) and can make a huge interpretive problem in the estimation technique. Generally speaking, none of the estimation techniques work well unless we eliminate/reduce the effect of outliers in a heteroscedastic regression model. This problem motivates us to develop a new and more accurate estimation technique, when heteroscedasticity and outliers occurs at the same time. Our proposed method can handle heteroscedastic problem as we have used different weights for different group variances. At the same time our method is outlier resistant because we have employed robust techniques in estimating the group variances and again in determining weights for the least squares. Real data sets and Monte Carlo simulations support our view that the newly proposed robust weighted least squares method outperforms the existing estimation techniques in the presence of heteroscedasticity and outliers.
2. Estimation of Heteroscedastic Regression Model Consider a linear regression model y X= β +ε (1)
where y is the 1n× vector of observed values for the response variables, X is the of predictors n p×including the intercept, β is a 1p× vector of regression parameters, and ε is the vector of 1n×errors. The errors are assumed to be normally distributed, with mean 0 and constant variance 2σ .
The OLS estimator of regression coefficients is 1ˆ ( )T TX X X yβ −= , and the
1 1ˆvar( ) ( ) ( )T T TX X X X X Xβ − −= Ω (2) where ( )TE εε = Ω , a positive definite matrix. Equation (2) simplifies to
2 1ˆvar( ) ( )T −X Xβ σ (3) =
if the errors are homoscedastic, that i ns 2IσΩ = .
If the errors are heteroscedastic, that is 2VσΩ = , equation (2) becomes
2 1 1ˆvar( ) ( ) ( )T T TX X X VX X Xβ σ − −= (4) The above problem can be solved by transforming the model to a new set of observations that satisfy the standard least squares assumptions. Then the OLS is applied on the transformed data. Since
is the covariance matrix of the errors, V must be nonsingular and positive definite, and
2Vσ
1 1 1ˆ ( )T TGLS X V X X V yβ − − −= (5)
is the generalized least squares (GLS) estimates of β . When the errors ε are uncorrelated but have unequal variances, the covariance matrix of ε is written as , i = 1, 2, …, n .Consequently, the GLS is the solution of the heteroscedastic model. If we define W
2 / ]iV di wσ = [1ag
1V −= , W becomes a diagonal matrix with diagonal elements or weights 1 2 . From equation (5), the weighted least squares estimator is
, ,...,w w
1( )T
nw
TˆWLS X WX X−
2 1( )TWLS WXβ σ
Wy
X −
β =
ˆ( )WLSV =
and
where 2
2 ˆi iwn pWLS
εσ =
−∑ .
If the heteroscedastic error structure of the regression model is known, it is easy to compute the weights of W matrix, and consequently the WLS would be a good solution of heteroscedastic regression model. Unfortunately, in practice, the structure of the heteroscedastic error is unknown.
WSEAS TRANSACTIONS on MATHEMATICS Habshah Midi, Md. Sohel Rana, A. H. M. Rahmatullah Imon
ISSN: 1109-2769 352 Issue 7, Volume 8, July 2009

3. Robust Weighted Least Squares (RWLS) Several attempts have been made in the literature to estimate the parameters of the regression model with unknown heteroscedastic error structure (see [7], [8], [9], [15], [16], [28]). Montgomery et al. (see [20]), proposed a WLS methods to solve this problem by developing weighting techniques that are later used for estimating the parameters of a heteroscedastic model. Instead of fitting regression with all the data, Montgomery et al. (see [20]) suggested finding several “near-neighbor” groups in the explanatory variable. We refer to this method as the Montgomery, Peck and Vining (MPV) method. The group means would now represent the explanatory variables (X). The groups in the response variable Y is formed in accordance with the groups formed in X. The sample variance of each groups of Y and the mean of each group of X are then computed. These group variances in Y are then regressed on the corresponding group mean of X. In the presence of heteroscedasticity we expect variations in errors among these groups. Hence the inverse of the fitted response can be used as weights for stabilizing variance heterogeneity. The values of X are first sorted to form near neighbor groups. The main limitation of the preceding mentioned estimators is that they are very sensitive to outliers. It is important to point out that it is very difficult to know the exact heteroscedastic pattern if outliers occur in the data. In this situation, it is really difficult to find a suitable weights for the weighted least squares procedures. The main shortcoming of the MPV method is that both the group mean and the group variance are computed from non-robust methods which are very sensitive to the presence of outliers. It is now evidence that the classical mean and standard deviation are easily affected by outliers (see [19,24]). Consequently, the resulting weight of the MPV would not be useful in stabilizing the error variances and hence the fitting of the model will not be that efficient. A more effective way to deal with this problem is to replace the non-robust mean and standard deviations with the robust measures such as the median and median absolute deviations (MAD). However, based on our study, it is not sufficient to remove the effect of outliers just by replacing the classical mean and classical standard deviation by median and MAD. In order to improve the precision of the MPV estimator, we propose to consider a robust weighting function for dampening the influence of outlying cases. The main attraction
of this method is that it still can retain the unbiasness properties in the presence of heteroscedasticty and outliers. The proposed Robust Weighted Least Squares (RWLS) method consists of the following steps: Step 1: Identify several “near-neighbors,” groups in the explanatory variables which correspond to the observations which are reasonably close to each other or have approximately repeated points in the explanatory variables (X). The number of “near-neighbors,” groups is denoted as g. Step 2: Next we calculate Med ( ( )jX ), j = 1, 2, …, g, the median for each group of the explanatory variables (X) and also compute MAD ( jY )=Median {| ( )j jYY Median− |} from the g groups of the response variables (Y) corresponding to the groups of (X). Step 3: Regress {MAD ( jY )} on Med (2
( )jX ) by the Least Trimmed of Squares (LTS) method (see [24]) and compute the regression coefficients from this fitting. Step 4: Obtain the LTS regression line of y on x’s by using the parameter estimates computed in Step 3. Calculate the fitted values of y based on the values of the variables X’s. Step 5: The inverse of these absolute fitted values denoted by will be the initial weight. The final weight can be acquired from any robust weight functions, but in this study, we will use the Huber (see [10]) weights function which is defined as
1iw
2
1 | | 1.31.345 | | 1.345
| |
i
ii
i
ew
ee
≤⎧⎪= ⎨ >⎪⎩
45
The constant 1.345 is called the tuning constant and the is the standardized residuals of the LTS obtained from step 3. We multiply the weight with the weight to get the final weight .
ie
1iw
2iw iwStep 6: Finally perform a WLS regression using final weights . The regression coefficients iwobtained from this WLS regression are the desired estimate of the heteroscedastic model. 4. Numerical Examples In this section we consider few examples to show the advantages of using RWLS estimator in the presence of heteroscedasticity and outliers. 4.1 Restaurant Food Sales Data Our first example is taken from Montgomery et al.
WSEAS TRANSACTIONS on MATHEMATICS Habshah Midi, Md. Sohel Rana, A. H. M. Rahmatullah Imon
ISSN: 1109-2769 353 Issue 7, Volume 8, July 2009
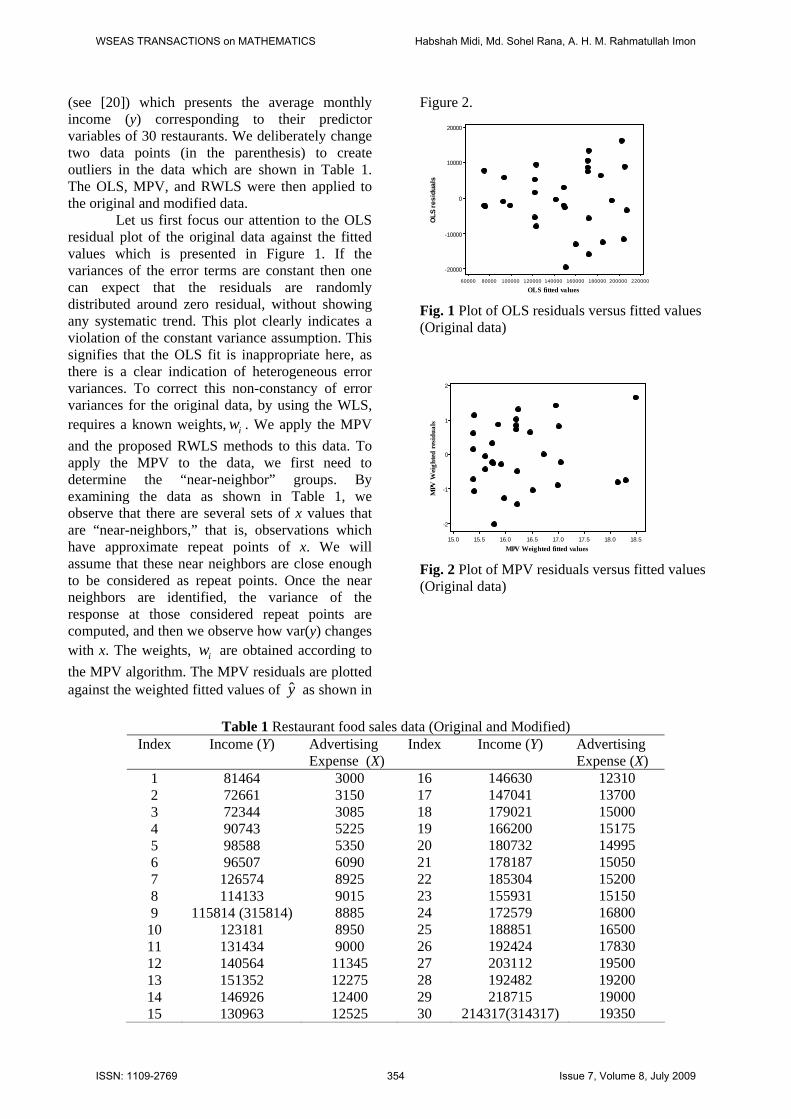
(see [20]) which presents the average monthly income (y) corresponding to their predictor variables of 30 restaurants. We deliberately change two data points (in the parenthesis) to create outliers in the data which are shown in Table 1. The OLS, MPV, and RWLS were then applied to the original and modified data.
Figure 2. 20000
10000
0
-10000
-20000
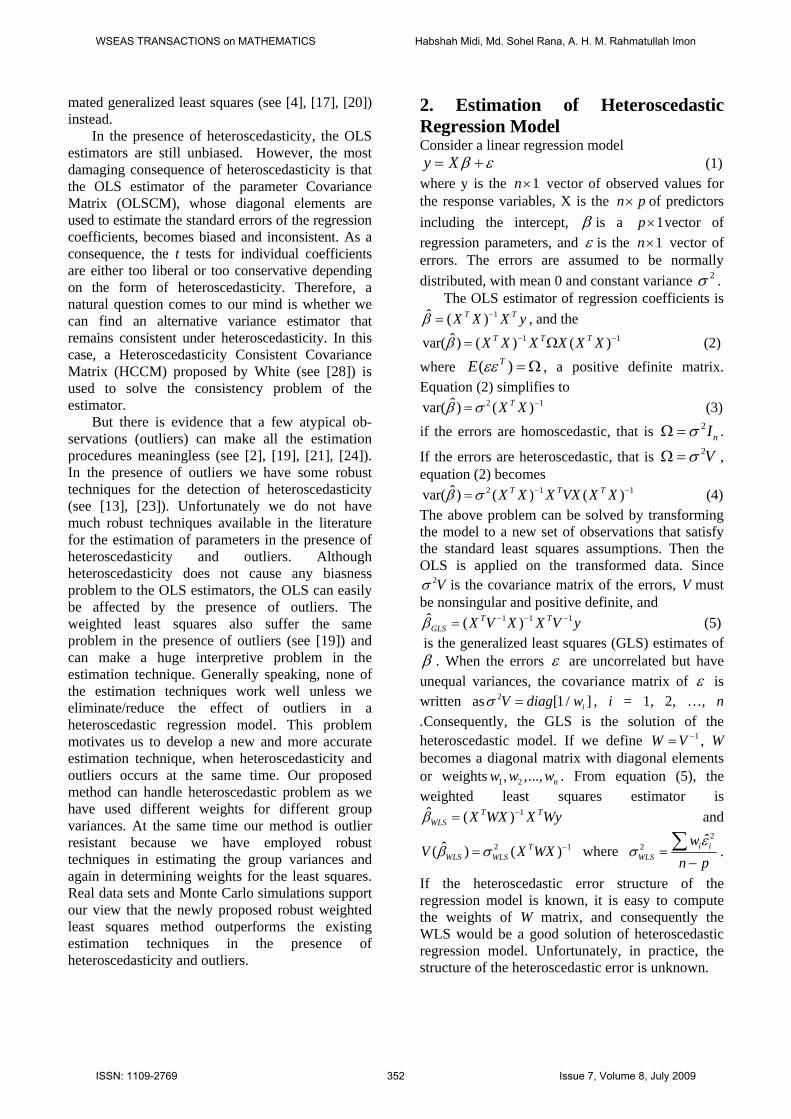
Let us first focus our attention to the OLS residual plot of the original data against the fitted values which is presented in Figure 1. If the variances of the error terms are constant then one can expect that the residuals are randomly distributed around zero residual, without showing any systematic trend. This plot clearly indicates a violation of the constant variance assumption. This signifies that the OLS fit is inappropriate here, as there is a clear indication of heterogeneous error variances. To correct this non-constancy of error variances for the original data, by using the WLS, requires a known weights, . We apply the MPV iwand the proposed RWLS methods to this data. To apply the MPV to the data, we first need to determine the “near-neighbor” groups. By examining the data as shown in Table 1, we observe that there are several sets of x values that are “near-neighbors,” that is, observations which have approximate repeat points of x. We will assume that these near neighbors are close enough to be considered as repeat points. Once the near neighbors are identified, the variance of the response at those considered repeat points are computed, and then we observe how var(y) changes with x. The weights, are obtained according to iwthe MPV algorithm. The MPV residuals are plotted against the weighted fitted values of as shown in y
2200002000001800001600001400001200001000008000060000
OLS fitted values
OLS
res
idua
ls
Fig. 1 Plot of OLS residuals versus fitted values (Original data)
2
1
0
-1
-2
18.518.017.517.016.516.015.515.0
MPV Weighted fitted values
MPV
Wei
ghte
d re
sidu
als
Fig. 2 Plot of MPV residuals versus fitted values (Original data)
Table 1 Restaurant food sales data (Original and Modified)
Index Income (Y) Advertising Expense (X)
Index Income (Y) Advertising Expense (X)
1 2 3 4 5 6 7 8 9
10 11 12 13 14 15
81464 72661 72344 90743 98588 96507
126574 114133
115814 (315814) 123181 131434 140564 151352 146926 130963
3000 3150 3085 5225 5350 6090 8925 9015 8885 8950 9000
11345 12275 12400 12525
16 17 18 19 20 21 22 23 24 25 26 27 28 29 30
146630 147041 179021 166200 180732 178187 185304 155931 172579 188851 192424 203112 192482 218715
214317(314317)
12310 13700 15000 15175 14995 15050 15200 15150 16800 16500 17830 19500 19200 19000 19350
WSEAS TRANSACTIONS on MATHEMATICS Habshah Midi, Md. Sohel Rana, A. H. M. Rahmatullah Imon
ISSN: 1109-2769 354 Issue 7, Volume 8, July 2009

18.017.517.016.516.0
2
1
0
-1
-2
RWLS Weighted Fitted Values
RW
LS w
eig
hte
d R
esi
du
als
Fig. 3 Plot of RWLS residuals versus fitted values (Original data)
65432
5
4
3
2
1
0
-1
MPV Weighted Fitted Values
MPV
Wei
ghte
d R
esid
uals
Fig. 4 Plot of MPV residuals versus fitted values (Modified data)
22.520.017.515.012.510.07.55.0
7
6
5
4
3
2
1
0
-1
-2
RWLS Weighted Fitted Values
RW
LS
Wei
ghte
d R
esid
uals
Fig. 5 Plot of RWLS residuals versus fitted values (Modified data)
65432
0.00
-0.25
-0.50
-0.75
MPV Weighted Fitted Values
MPV
Wei
ghte
d R
esid
uals
Fig. 6 Plot of MPV residuals versus fitted values (Modified data)
2120191817161514
1.5
1.0
0.5
0.0
-0.5
-1.0
-1.5
-2.0
RWLS Weighted fit
RW
LS
Wei
ghte
d R
esid
uals
Fig. 7 Plot of RWLS residuals versus fitted values (Modified data) This plot indicates much improvement when compared to Figure 1 of the OLS fit. Figure 3 displays the residuals of the RWLS estimates against the RWLS fitted values of . We observe yfrom this plot that this transformation also helps in producing constant error variances. It is now evident from Figures 2 and 3 that in the absence of outliers, the performance of the MPV and the RWLS are equally good. In order to see the effect of outliers in the presence of heteroscedasticity, we would like to consider the modified Restaurant Food Sales data. We deliberately put two outliers at the 9th and 30th positions in the original Restaurant Food Sales data to create outliers. We apply the LTS method to confirm that these two modified data are outliers. We applied the MPV and the RWLS methods to the modified data and display their residual plots in Figures 4 and 5. It is interesting to note here, regarding the plots observed in Figures 4 and 5. Unlike Figures 2 and 3, the plots of Figures 4 and 5 do not show a clear indication of whether heteroscedastic problem has been solved. These results are as expected, because the outliers can destroy the real picture of the heteroscedasticity. To get a clearer picture about the real situation, the fitted values and the residuals corresponding to the two outliers are omitted. The residual plots of the MPV and the RWLS are again re-plotted without these two observations. These two plots are shown in Figures 6 and 7. The plot of Figure 6 shows that the MPV method is affected by outliers. The fan shape of Figure 6 signifies that, the MPV cannot remedy the problem of heteroscedasticity in the presence of outliers. On the other hand, the RWLS plot of Figure 7 indicates that the RWLS can solve the heteroscedasticity even for data which have outliers. Table 2 presents the summary statistics, such as the standard errors and the t values of the estimated regression coefficient of the original and
WSEAS TRANSACTIONS on MATHEMATICS Habshah Midi, Md. Sohel Rana, A. H. M. Rahmatullah Imon
ISSN: 1109-2769 355 Issue 7, Volume 8, July 2009

Table 2 Summary statistics for the restaurant food sales data (Original and Modified) Methods Data Type Estimate SE t-value
OLS Original 8.0489 0.3257 24.713 Modified 8.1637 1.4786 5.5212
MPV Original 7.9288 0.2528 31.3541 Modified 8.1637 1.4786 5.5212
RWLS Original 7.933956 0.2557 31.0177 Modified 8.087738 0.4629 17.4685
modified data. The results of Table 2 reveal that in the absence of outliers, the RWLS estimates are reasonably close to the MPV estimates with respect to the estimated regression parameters, Standard errors, and t-values. The presence of outliers changes things dramatically. The OLS and the MPV estimates immediately affected by outliers. However, the RWLS seems to be only slightly affected by outliers. The summary statistics exemplified in Table 2 signify that the RWLS method does a superb job for both original and modified data. The RWLS possesses the lowest standard errors of the parameter estimates, and the largest t values compared to the OLS and the MPV. 4.2 Simulated High Leverage Data with Heterogeneous Variances Our next example is a data set (see Table 3) taken from Imon (see [12]) which is generated in similar way as it was done by Ryan (see [25]) to study the heterogeneity of variances. The essential difference, however, is that here the explanatory variable X contains high leverage points. Although this data set is artificial in nature, it gives us a better understanding about the results. Here we clearly know the structure of the data, but for the real data there is always uncertainty about the nature of the observations (see [3]). There is a good Table 3 Simulated High Leverage Data with Heterogeneous Variances Index Y X Index Y X 1 2 3 4 5 6 7 8 9 10
2.9003 5.8499 1.5382 6.2404 8.2405 1.7757 0.1720 12.6976 5.1139 10.8171
1.0 1.0 1.5 1.5 2.0 2.0 2.5 2.5 3.0 3.0
11 12 13 14 15 16 17 18 19 20
1.2638 14.3819 12.2122 4.1828 -0.4158 20.4436 -1.9150 21.2692 74.5689 70.2012
3.5 3.5 4.0 4.0 4.5 4.5 5.0 5.0 10.0 10.0
reason to believe that if the variances of errors depend on X, it is expected that unusual Y values would correspond to unusual X values. Hence it is more likely that high leverage points would also produce large errors and thus they may become outliers. Table 3 presents similar type of data. To generate this data we set ten values of X as 1, 1.5, 2, 2.5, 3, 3.5, 4, 4.5, 5 and 10. Each of the observations is replicated once to produce 20 observations. The Y values are generated based on the following function
1 2i i iY X ε= + + i=1, 2, …, 20. (6) where the true errors ( iε ) are generated using
3ii iXσ = to produce heteroscedastic errors. All three methods were then applied to this data. The OLS residuals plot in Figure 8 with funnel shape gives a clear indication of violation of the constant variance assumption and two outliers are also identified. Nonetheless, it is difficult to judge by looking at the MPV and the RWLS residual plots of Figures 9 and 10 whether the problem of heteroscedasticity has been solved or not. In order to see the effect of outliers on the MPV and the RWLS, the residual plots of both estimates are re-plotted with residuals corresponding to the two outliers are omitted (19th and 20th observations). These residual plots are illustrated in Figures 11-12. It can be observed from Figure 11 that the MPV method still shows the heteroscedastic pattern whereas in Figure 12, the proposed RWLS shows a substantial improvement. The results of Table 4 signify that the OLS and the MPV method cannot retain their unbiasedness properties in the presence of outliers. Nevertheless, there is no such type of biasness problem for the RWLS method. The RWLS estimates give the least bias and least standard errors when compared to the other estimates. From these results, it seems that all estimators except the RWLS are very sensitive to outliers and heteroscedastic errors. Just by
20
10
0
-10
-20
-306050403020100-10
OLS Fitted VAlues
OL
S R
esid
uals
Fig. 8 Plot of OLS residuals versus fitted values
WSEAS TRANSACTIONS on MATHEMATICS Habshah Midi, Md. Sohel Rana, A. H. M. Rahmatullah Imon
ISSN: 1109-2769 356 Issue 7, Volume 8, July 2009

1.21.00.80.60.40.20.0
1.0
0.5
0.0
-0.5
-1.0
MPV Weighted Fitted Values
MPV
Wei
ghte
d Fi
tted
Res
idua
ls
Fig. 9 Plot of MPV residuals versus fitted values
2.001.751.501.251.000.750.50
1.5
1.0
0.5
0.0
-0.5
-1.0
RWLS Weighted Fitted Values
RW
LS
Wei
ghte
d R
esid
uals
Fig. 10 Plot of RWLS residuals versus fitted values
1.21.00.80.60.40.20.0
1.0
0.5
0.0
-0.5
-1.0
MVP Weighted Fitted Values
MV
P W
eigh
ted
Res
idua
ls
Fig. 11 Plot of MPV residuals versus fitted values (without outliers)
2.001.751.501.251.00
1.0
0.5
0.0
-0.5
-1.0
-1.5
RWLS Weighted Fitted Values
RW
LS
Wei
ghte
d R
esid
uals
Fig. 12 Plot of RWLS residuals versus fitted values (without outliers)
observing the results of some data, we cannot make a general conclusion yet, but a reasonable interpretation up to this stage is that the RWLS is less affected by outliers and heteroscedasticity compared to the other estimators. Table 4 Summary statistics for Simulated High Leverage Data with Heterogeneous Variances
Methods Estimate Bias SE (Estimate) t-value
OLS 7.3660 5.366 0.9929 7.4188MPV 4.6399 2.6399 1.4543 3.1903
RWLS 2.0970 0.0970 0.9255 2.2657 5. Monte Carlo Simulation Results Here we report a Monte Carlo simulation study that is designed to assess the performance of the RWLS method. We reuse a model proposed by Lipsitz et al. (see [14]) based on a fixed design matrix. For the simulations, we used the model:
3 2i i iy x= ε+ + (12) To generate the X values, first we fixed the 50 sample size from uniform distribution with different groups. We take the first 10 random sample from Uniform (10, 1, 9), the second 10 from Uniform (10, 10, 19), the third 10 from Uniform (10, 20, 29), the fourth 10 from Uniform (10, 30, 39), and the fifth 10 from Uniform (10, 40, 49). Now we have fixed X sample with sample size 50. The error terms were generated such that they will induce heteroscedasticity. In this respect, iε is
generated according to this relation, i ixε ε ∗=
where ε ∗ were drawn from standard normal distribution with mean zero and variance one. For n = 100, we doubled the fix X sample size. We increase the sample size four times and six times to produce sample of size 200 and 300, respectively. Then we start to contaminate the data. We randomly replace few good data points with certain percentage of outliers. The outliers are created by computing the average and the standard deviation of the n residuals which are generated byε ∗ ~N(0,1). Then we take 12σ distance which is equivalent to 12sεε ∗
∗± and denoted this value as . The heteroscedastic error with outliers .contε ∗
are generated such that .In this ( .i cont i contx ε ∗)ε = .
situation, it is more likely that these points would produce big residuals indicating outliers in the data
WSEAS TRANSACTIONS on MATHEMATICS Habshah Midi, Md. Sohel Rana, A. H. M. Rahmatullah Imon
ISSN: 1109-2769 357 Issue 7, Volume 8, July 2009

Table 5 Simulated summary statistics for coefficient β (True value = 2) Percentage of Outliers Methods Sample Size Measures
0% 5% 10% 15% 20% OLS n = 50 Estimate 2.0030 2.9234 3.9757 6.3272 5.0667
SE 0.2811 1.3109 1.4177 1.7692 1.7629 t-value 7.2549 2.3353 2.8072 3.5790 2.8767 n = 100 Estimate 1.9944 2.9871 3.5369 5.4579 5.0770 SE 0.2002 0.7376 0.9353 1.2046 1.2367 t-value 10.0544 4.0525 3.7837 4.5328 4.1070 n = 200 Estimate 2.0013 2.7692 3.5381 5.4652 5.0556 SE 0.1418 0.4881 0.6600 0.8486 0.8691 t-value 14.1733 5.6751 5.3621 6.4414 5.8178 n = 300 Estimate 2.0000 2.8303 3.5226 5.4146 5.0119 SE 0.1157 0.4073 0.5365 0.6897 0.7070 t-value 17.3262 6.9506 6.56631 7.8507 7.0894
MPV n = 50 Estimate 2.0029 3.2624 3.7298 5.7155 5.1502 SE 0.2264 0.7931 1.1403 1.3603 1.3892 t-value 9.1832 4.1134 3.2708 4.2016 3.7073 n = 100 Estimate 1.9928 2.8593 3.5823 5.1935 5.1526 SE 0.1653 0.5917 0.7299 0.9295 0.9617 t-value 12.0556 4.8323 4.9079 5.5874 5.3578 n = 200 Estimate 1.9980 2.7875 3.5678 5.1862 4.9856 SE 0.1219 0.3807 0.5114 0.6593 0.6862 t-value 16.3904 7.3220 6.9765 7.8662 7.2655 n = 300 Estimate 1.9986 2.7754 3.4741 5.1134 5.0189 SE 0.0990 0.3235 0.4267 0.5478 0.5563 t-value 20.1878 8.5792 8.1417 9.3344 9.0219
RWLS n = 50 Estimate 2.0014 2.07734 2.0646 2.1856 2.1405 SE 0.1942 0.3459 0.4411 0.4963 0.5527 t-value 10.7714 6.4302 5.1521 4.7124 4.1756 n = 100 Estimate 1.9956 2.0234 2.0696 2.1981 2.1207 SE 0.1413 0.2562 0.2970 0.3689 0.4342 t-value 14.8697 8.8270 7.6176 6.4632 5.3757 n = 200 Estimate 1.9983 2.0314 2.0433 2.1793 2.1176 SE 0.1075 0.1753 0.2409 0.2883 0.3244 t-value 20.2500 12.6438 9.5899 8.2559 7.1909 n = 300 Estimate 1.9981 2.0000 2.0461 2.1655 2.0998 SE 0.0882 0.1689 0.2053 0.2535 0.2734 t-value 24.0742 13.5217 11.2123 9.5193 8.4921
set. We replace some iε with the contaminated
( .)i contε based on the percentage of contamination. In our study, we choose 5%, 10%, 15% and 20% level of contamination. The OLS, MPV, and RWLS are then applied to these data. In each simulation run, there were 10,000 replications. Table 5 presents the average measures of the regression coefficients and their corresponding standard errors and t-statistics for different percentage of outliers for different sample sizes. It can be observed that when there is no outliers the
OLS, MPV and the RWLS give close estimates to the true value of the parameters. These results suggest no biasness problem of the regression parameters. The results also suggest that these estimates get even closer to the true value as the sample s izes get larger . The presence of heteroscedasticity retains the unbiasedness property of the OLS estimates. However, our prime interest is to investigate the effect of both outliers and heteroscedasticity on the regression coefficients, standard errors and the t-values. Several interesting points emerge from Table 5. As can be expected,
WSEAS TRANSACTIONS on MATHEMATICS Habshah Midi, Md. Sohel Rana, A. H. M. Rahmatullah Imon
ISSN: 1109-2769 358 Issue 7, Volume 8, July 2009

Table 6. Simulated information criteria for different estimation techniques. Percentage of Outliers Methods Sample Size Measures
0% 5% 10% 15% 20% OLS n = 50 AMSEE 0.0994 0.9477 3.9883 18.7945 9.4849
MSE 56.7786 224.3825 286.3569 357.3529 356.0769 AIC 548.8587 687.1766 711.5668 733.7142 733.3572 BIC 554.5947 692.9127 717.3029 739.4502 739.0933 n = 100 AMSEE 0.0472 1.0188 2.4059 11.9964 9.5082 MSE 57.1968 210.6950 267.1664 344.0931 353.2785 AIC 1096.1420 1357.8380 1405.3320 1455.9390 1461.2080 BIC 1103.9570 1365.6530 1413.1470 1463.755 1469.0240 n = 200 AMSEE 0.0245 0.6145 2.3879 12.0271 9.3559 MSE 57.2942 197.1919 266.6284 342.8170 351.1175 AIC 2189.9520 2685.223 2805.8980 2906.4330 2916.0040 BIC 2199.8470 2695.1180 2815.7930 2916.3280 2925.8990 n = 300 AMSEE 0.0163 0.7047 2.3331 11.6727 9.0848 MSE 57.2844 201.5165 265.4738 341.2798 349.8193 AIC 3283.2780 4038.8670 4204.2560 4354.9670 4369.7960 BIC 3294.3890 4049.9780 4215.3670 4366.0790 4380.9080
MPV n = 50 AMSEE 0.0633 1.6563 3.0383 13.9038 10.0154 MSE 0.0310 1.5753 2.1691 2.0841 2.1418 AIC 524.1677 651.4896 681.4489 696.0028 706.367 BIC 529.9038 657.2257 687.1850 701.7389 712.1013 n = 100 AMSEE 0.0293 0.7635 2.5360 10.2201 9.9754 MSE 0.9323 1.5494 1.8234 1.8095 2.2657 AIC 1048.9140 1297.2970 1349.6120 1390.6180 1404.44 BIC 1056.7290 1305.1120 1357.4280 1398.4330 1412.2550 n = 200 AMSEE 0.0147 0.6354 2.4730 10.1633 8.9246 MSE 0.9410 1.4188 1.9333 1.8297 2.1854 AIC 2102.3720 2573.3920 2690.9210 2776.6550 2806.9340 BIC 2112.2670 2583.2870 2700.8160 2786.5500 2816.8290 n = 300 AMSEE 0.0103 0.6097 2.1812 9.7014 9.1216 MSE 0.9264 1.6574 1.9389 1.8977 2.1847 AIC 3152.9900 3866.2040 4043.3940 4168.6940 4204.1600 BIC 3164.1010 3877.3160 4054.5060 4179.7610 4215.2710
RWLS n = 50 AMSEE 0.0705 0.0917 0.1127 0.1331 0.8383 MSE 0.90701 0.8788 0.7967 0.7848 0.7786 AIC 511.8869 572.8702 599.4941 613.6786 630.1075 BIC 517.623 578.6063 605.2301 619.4147 635.8436 n = 100 AMSEE 0.0336 0.0369 0.0429 0.0831 0.0656 MSE 0.9530 0.8127 0.8686 0.7841 0.8576 AIC 1023.6320 1141.7130 1183.7650 1226.5710 1272.9090 BIC 1031.4470 1149.5280 1191.5810 1234.3860 1280.7420 n = 200 AMSEE 0.0175 0.0185 0.0215 0.0540 0.0364 MSE 0.9937 0.8861 0.8723189 0.7990 0.8749 AIC 2054.0150 2265.2550 2402.2160 2478.0900 2557.6870 BIC 2063.9100 2275.1500 2412.1100 2487.9850 2567.5820 n = 300 AMSEE 0.0122 0.0121 0.0157 0.0425 0.0236 MSE 0.9878 0.8482 0.8838 0.8125 0.8812 AIC 3089.5800 3466.4380 3623.6290 3744.3140 3845.2200 BIC 3100.6910 3477.5500 3634.7400 3755.4250 3856.3320
both the OLS and the MPV estimates retain unbiasedness only when there is no outliers in the data. But as the percentage of outliers increases, the OLS estimates move away from the true values
drastically, followed by the MPV estimates. The results also point out that the standard errors of the OLS and MPV estimates are larger than the RWLS and their t-values are relatively small. It is
WSEAS TRANSACTIONS on MATHEMATICS Habshah Midi, Md. Sohel Rana, A. H. M. Rahmatullah Imon
ISSN: 1109-2769 359 Issue 7, Volume 8, July 2009

important to note that the RWLS produces unbiased estimators, smaller standard errors and larger t values when compared to the OLS and MPV estimates irrespective of sample sizes and the percentage of outliers in the data. The best overall performance of the existing and proposed methods, in the presence of outliers and heteroscedasticity, can be accomplished by evaluating several indicators. We consider four indicators in our simulation study. The first indicator is the Average Mean Square Error of Estimation (AMSEE) which was introduced by Simpson (see [27]) and is defined as
ˆ ˆ[( ) ( )]( )
TR RAMSEE mean
mean MSEEβ β β β= − −
=
The second indicator is the Mean Square Error (MSE) of the model. The third indicator is the Akaike (see [1]) Information Criterion (AIC) defined as
ln( / ) 2AIC n SSE n p= + The fourth indicator is the Bayes Information Criterion (BIC), originally proposed by Schwartz (see [26]) and defined as
ln( / ) (ln )BIC n SSE n p n= + The model with smaller AMSEE, MSE, AIC and BIC are preferred. We compute these four types of measurements for the OLS, the MPV and the RWLS for the simulated design and the average results based on 10,000 replications are presented in Table 6. It is seen that AMSEE, MSE, AIC and BIC values of the RWLS method are consistently the smallest among the three estimators followed by the MPV and the OLS methods. The results appear to be uniform for different percentage of outliers and sample of size n= 50, 100, 200, 300. These results agree reasonably well with the preceding results that the RWLS emerges to be conspicuously more efficient than the OLS and the MPV. 6. Conclusion The main focus of this paper is to develop a reliable method for correcting the problem of heteroscedastic errors in the presence of outliers. The empirical study reveals that the OLS and the MPV estimates are easily affected by the outliers. Hence they are not reliable. On the other hand, the RWLS estimates emerge to be conspicuously more efficient and more reliable as it is less affected by the outliers. The results seem to suggest that the RWLS method offers a substantial improvement over the other existing methods for handling the
problems of outliers and heteroscedastic errors. References [1] H. Akaike, Information Theory and an Extension of Maximum Likelihood Principle, In B. N. Petrov and F. Caski (Eds.), Second International Symposium on Information Theory, Akademia Kiado, Budapest, 1973, pp. 267-281. [2] Z. Azami, M. Ibrahim, A. Ibrahim, A. Shahrum, Z.O. Mohd, Performances test statisticals for single outliers detection in bilinear (1,1,1,1) models, WSEAS Transactions on Mathematics, 5(12), 2006, pp. 1359- 1365. [3] V. Barnett, and T. Lewis, Outliers in Statistical data, 3rd ed., Willy, New York, 1994. [4] R. J. Carroll, and D. Ruppert, Transformation and Weighting in Regression, Chapman and Hall, New York, 1988. [5] S. Chatterjee, and A.S. Hadi, Regression Analysis by Examples, 4th ed., Wiley, NewYork, 2006. [6] R. D. Cook, and S. Weisberg, Diagnostics for heteroscedasticity in regression, Biometrika ,70, 1983, pp. 1-10. [7] R. Davidson, and J. G. MacKinnon, Estimation and Inference in Econometrics, Oxford University Press, New York, 1993. [8] D. V. Hinkley, Jackknifing in unbalanced situations, Technometrics, 19, 1977, pp.285- 292. [9] S. D. Horn, R. A. Horn, and D. B. Duncan, Estimating heteroscedastic variances in linearmodel, Journal of the American Statistical Association, 70, 1975, pp. 380-385. [10] P. J. Huber, Robust Statistics, Wiley, New York, 1981. [11] J. Ilmari, R. Jula, Heteroscedastic linear models for analyzing process data, WSEAS Transactions on Mathematics, 2(3), 2003, pp. 179-187. [12] A.H.M. R. Imon, Deletion residuals in the
detection of heterogeneity of variances in linear regression, Journal of Applied Statistics, 36, 2009. pp. 347-358.
[13] M. H. Kutner, C. J. Nachtsheim, and J. Neter, Applied Linear Regression Models, 4th ed., McGraw- Hill/ Irwin, New York, 2004
WSEAS TRANSACTIONS on MATHEMATICS Habshah Midi, Md. Sohel Rana, A. H. M. Rahmatullah Imon
ISSN: 1109-2769 360 Issue 7, Volume 8, July 2009
[14] S. R. Lipsitz, J. G. Ibrahim, and M. Parzen, A degrees-of-freedom approximation for a t- statistic with heterogeneous variance, Statistician, 48, 1999, 495-506. [15] J. S. Long, and L. H. Ervin, Using heteroscedasticity consistent standard errors in the linear regression model. American Statistician, 54, 2000, 217-224. [16] J. G. MacKinnon, and H. White, Some heteroskedasticity consistent covariance matrix estimators with improved finite sample properties, Journal of Econometrics, 29, 1985, pp. 53-57. [17] G. S. Maddala, Generalized least squares with an estimated covariance matrix, Econometrica, 39, 1971, pp. 23-33. [18] K. V. Mardia, J. T. Kent, and J. M. Bibby, Multivariate analysis, Academic Press, New York, 1979. [19] R.A. Maronna, R. D. Martin, and V.J. Yohai, Robust Statistics -Theory and Methods, Wiley, New York, 2006. [20] D. C. Montgomery, E. A. Peck, and G.G Vining, Introduction to Linear Regression Analysis,3rd ed, Wiley, New York. 2001. [21] I. Paolo, Application of multivariate robust statistical hypothesis testing to data from emiconductor environments, WSEAS Transactions on Mathematics, 6(3), 2007, pp. 506-512.
[22] L. Rahmatollah, Weighted mean matrix on weighted sequence spaces, WSEAS Transactions on Mathematics,3(4), 2004, pp.789- 793. [23] M.S. Rana, H. Midi, and A.H.M.R. Imon, A Robust Modification of the Goldfeld-Quandt Test for the Detection of Heteroscedasticity in the Presence of Outliers, Journal of mathematics and Statistics, 4(4), 2008, pp. 277-283. [24] P.J. Rousseeuw, and A. Leroy, Robust Regression and Outlier Detection, Wiley, New York, 1987. [25] T.P. Ryan, Modern Regression Methods, Wiley, New York, 1997. [26] G. Schwartz, Estimating the Dimensions of a Model, Annals of Statistics, 121, 1978, pp. 461- 464. [27] J. R. Simpson, New methods and comparative evaluations for robust and biased-robust regression estimate, PhD thesis, Arizona State University, 1995. [28] H. White, A heteroskedastic- consistent
covariance matrix estimator and a direct test of heteroskedasticity, Econometrica, 48, 1980, pp. 817-838.
WSEAS TRANSACTIONS on MATHEMATICS Habshah Midi, Md. Sohel Rana, A. H. M. Rahmatullah Imon
ISSN: 1109-2769 361 Issue 7, Volume 8, July 2009