the palaeoenvironmental and palaeohydrological evolution of padul peat bog (granada, spain) over one...
TRANSCRIPT

The palaeoenvironmental and palaeohydrological evolution of Padul Peat Bog (Granada, Spain) over one million years, from elemental, isotopic and molecular organic geochemical proxies J.E. Ortiz a *, T. Torres a , A. Delgado b , R. Julia c , M. Lucini d , F.J. Llamas a ,
E. Reyes b , V. Soler e , M. Valle f
a Laboratory of Biomolecular Stratigraphy, E.T.S.I. Minas de Madrid, CI Rios Rosas 21, Madrid28003, Spain Estacion Experimental "El Zaidin" (C.S.I.C.). CIProfessor Albareda 1, 18008 Granada, Spain
0 Instituto de Ciencias de la Tierra "Jaume Almera" (C.S.I.C.) CILluis Sole i Sabaris sin, 08028 Barcelona, Spain d IZASA, S.A. ClAragoneses 13, 28108 Alcobendas, Madrid Spain
° Instituto de Agrobiologia y Productos Naturales (C.S.I.C). Avda Astrofisico Fco Sanchez 3, 38206 La Laguna, Tenerife, Spain Facultad de Ciencias, Universidad de Salamanca, Pza de la Merced sin. 37008 Salamanca, Spain
Abstract
The elemental (concentration of organic carbon, atomic H/C and C/N ratios), isotopic (<513C values of organic matter) and molecular (predominant w-alkane chain length and carbon preference index (CPI)) organic components were measured for 600 samples taken from a 107-m long core from the Padul Basin (Andalusia, Spain). The record runs from the Lower Pleistocene (ca. 1 M a B.P.) to the mid-Holocene (ca. 4.5 ka B.P.) with, in general, little diagenesis (removal of components). Two markedly different hydrogeological scenarios were interpreted: (1) F rom ca. 1 M a to ca. 400 ka B.P. run-off recharge was significant and water depths were greater (lacustrine scenario). F rom ca. 400 to 4.5 ka B.P., the Padul Basin became a peat bog s.s. with the major water input coming from groundwater inflow. F rom ca. 400 to ca. 180 ka B.P. alternating episodes with either predominant grasses, trees or aquatic macrophytes which were linked to wet/dry phases, took place. An important deglaciation episode has been interpreted to occur between ca. 180 and 170 ka B.P. The global climatic changes occurring from ca. 170 to 25 ka B.P. were not recorded in the proxies, though they do show important variations linked to the Last Glacial Maximum and the beginning of the Holocene (ca. 25-10 ka B.P.): (2) Cold phases coexisting with dry periods produced the recession of forests and the development of grasses. After these periods, as both temperature and precipitation increased, forests expanded and the water level, linked to thaw, rose, especially at ca. 20 ka B.P. Few changes occurred during the Holocene, al though there were short alternations between wet and dry episodes. Overall, the techniques applied proved to be excellent palaeoenvironmental proxies for studvina the basin's oalaeoclimatoloaical and palaeohydrological evolution.

1. Introduction
Padul peat bog, located in Andalusia in the southern part of the Iberian Peninsula (Fig. 1), has one of the best available records of Pleistocene sediments, which are more than 100 m thick and can be used to study palaeo-environmental variations. Previous papers on its stratigraphy and palynology have been published: Menendez Amor and Florschiitz (1962, 1964), Florschiitz et al. (1971) and Pons and Reille (1988), who noted oscillations in the pollen curves related to palaeoclimatic changes. In 1997, in the framework of the E U project E Q U I P and Paleoclima (funded by the Spanish Agency for Radioactive Waste Management and the Spanish Nuclear Safety Council), a new 107-m deep borehole was drilled (Nestares and Torres, 1998) near the west edge, where the bog reaches its maximum depth (Fig. 1).
The aim of this study was to reconstruct the palaeo-environmental evolution of the southern part of the Iberian Peninsula through interpretation of the organic geochemistry of the sediments recorded in the new Padul peat bog borehole. Subaqueous sediments hold information from which histories of past climates and former environmental conditions can be reconstructed. Lake sediments receive organic matter from both autochthonous (phytoplankton, bacteria, aquatic macrophytes) and allochthonous sources (terrestrial plant debris, pollen). Thus, environmental changes affecting vegetation within and around the lake should be reflected in the biogeochemistry of the lake sediments. Likewise, lake morphology, catchment topography and climate affect the amounts of contributions from terrestrial and aquatic sources to the sediments. Thus, the composition of the organic matter of a lake includes a variety of proxies
Fig. 1. Geographical and geological setting and cross-section of Padul peat bog. Groundwater flow directions are represented with arrows.
such as elemental, isotopic and molecular indicators which can be used to reconstruct palaeoenvironments of lakes and their surrounding areas.
However, interpretation is not simple: in most cases, organic matter is a mixture of components from many sources and with variable degrees of preservation. Despite diagenesis, partial reworking and alteration of the original organic matter when sinking to the lake bot tom, sedimentary organic matter retains important palaeoen-vironmental information about its origin and about how it was delivered and deposited. In fact, according to Meyers (2003), the two most important types of informat ion provided by sedimentary organic matter are the origin of the organic matter and the proportional abundance of the various biota that produced it.
Although lake systems are diverse and the sources and evolution of organic matter are geographically and temporally variable, useful generalizations can be made about the various kinds of elemental, isotopic, and molecular organic geochemical proxies that provide evidence of the origins and depositional histories of sedimentary organic matter and hence palaeoenvironmental conditions.
The borehole was carefully sampled at 15 cm intervals to study the organic matter <513C values, C H N content and biomarkers, among other palaeoenvironmental proxies. Other samples were selected for dating through different techniques: radiocarbon, U/Th, amino acid racemization and palaeomagnetism.
2. Geographical and geological setting
Padul peat bog is located 20 km south of Granada city (Andalusia, southern Spain). It was formed in a highly subsident fault-bounded tectonic basin at the foot of the Sierra Nevada and consists of an endorrheic basin surrounded by mountains. It is placed 720 m above sea level and some parts are permanently covered by water. Its longitudinal axis is NW-SE orientated. It has a surface area of 4 k m 2 and a maximum depth of 100 m. It is located close to the Betic Range and is surrounded by the Albunuelas Range and Manar mountains, the latter belonging to the Sierra Nevada Range. The bedrock consists mainly of faulted Mesozoic dolostones that caused the basin to sink gradually.
Padul Basin is a discharge area for the groundwater flow of the surrounding aquifers. The flow directions change from sub-horizontal, in the Mesozoic aquifers adjacent to the basin, to essentially upwards discharge inside the peat-containing depression (Canada, 1984).
Present rainfall in the area is a minor factor in the water balance of the peat deposit and run-off input of water is estimated to contribute only about 8% of the total (Canada, 1984). Consequently, changes in the water table in the peat are controlled indirectly by infiltration
of water from the surrounding mountains , occasioned by accumulation of snow during colder phases and its subsequent melting.
Padul Basin receives a composite of vegetation debris from the Sierra Nevada where it is possible to recognize a series of vegetation belts (Florschiitz et al., 1971) comprising from bot tom to top: steppe, Quercus ilex (more humid), Quercus pubescens (xeromorphic), Acantholi-mon-Tragacanta (Eastern Mediterranean character) and Mediterranean mounta in steppe.
2.1. Borehole core description
The stratigraphy of the Padul borehole (latitude: 37°01'01"N; longitude: 3°36'07"W; elevation: 714.20) is shown in Fig. 2. where an interpretation in terms of water input into the basin is also included (Fig 2-A) based on the lithology. Throughout the core fossil flora remains are abundant : well-preserved tree wood and bark, talus and leaves. A mammal vertebra was also recovered and in some horizons mollusc shells were found: Pelecypoda (Pisidium sp.) and Gast ropoda (Radix sp, Planorbis sp and Succinea sp). Ostracod valves have been recovered from marly beds: Herpetocypris reptans (Baird), Candona angulata Miiller and Candona negleta Sars.
We refer to the sampled horizons of the borehole by their depth, in cm, from top to bot tom (e.g., sampled level SPD-0125 is at 125 cm).
3. Methodology
For the borehole dating, four different techniques were used: conventional radiocarbon, U/Th, amino acid racemization and palaeomagnetism. A total of 600 samples was also taken at, approximately, 15 cm intervals along the borehole to extract the lipid fraction, and to obtain the H/C and C/N ratios and <513C values of the organic matter.
3.1. 14C dating
Radiocarbon dating was undertaken on several peats (SPD-0198; SPD-0213; SPD-0300; SPD-0335; SPD-0345; SPD-0375; SPD-0407; SPD-0433; SPD-0533). For this purpose, ca. 100 g were analyzed in the Instituto de Quimica Fisica Rocasolano (C.S.I.C., Madrid) . Materials measured by the radiometric technique were analyzed by converting C 0 2 from the sample to benzene, measuring for 1 4 C content in a scintillation spectrometer and then calculating for radiocarbon age. The ages were calibrated using the program CALIB from the Washington University, method B, 2 sigma (95.4% confidence intervals) (Stuiver and Reimer, 1993).

Fig. 2. Stratigraphy and chronology of Padul peat bog borehole core. Datings are followed by the method used for their calculation: 1 4 C , U/Th, aard (amino acid racemization). Owing to drawing limitations, some 1 4 C results have not been represented (SPD-0213, 7220 ± 190 ka; SPD-0335, 9019 ± 241; SPD-0345, 9021 ± 245, SPD-0407, 11329 ± 213). Pons and Reille (1988) dated the top of the Padul record at 4450 ± 60 ka. Diagram A reflects the water-input of Padul Basin based on the lithology (1 , massive peat; 2, peaty lutite and lutitic peat; 3, lutites and marls; 4, sands and sandy lutites; 5, gravels); 1 represents low water level episodes and 5 high water level episodes. Diagram B shows low (white rectangles), intermediate (grey) and high (black rectangles) water level episodes according to the information provided by the palaeoenvironmental proxies. F r o m 107 to 60 m a lacustrine conditions prevailed while at the uppermost 60 m Padul Basin became a peat bog.

3.2. UlTh dating
For U/Th dating we selected and prepared pure peat from five horizons (SPD-0825; SPD-1860; SPD-2620; SPD-3180; SPD-5805) using the procedure developed by Vogel and Kronfeld (1980).
The procedure used for chemical separation is based on that developed by Bischoff and Fitzpatrick (1991). In this procedure, the sample is totally dissolved in strong mineral acids and a radioisotope with known activity is incorporated in order to determine the efficiency of the isotope separation. The U and Th isotopes were isolated by ion-exchange chromatography and then analyzed in an alpha spectrometer from Ortec with a silica barrier detector. For age calculation the programme U D A T E from Rosenbauer (1991) was used.
3.3. Amino acid racemization dating
For amino acid racemization dating purposes, we rejected the first centimetre of the borehole to avoid surface contamination. We were able to recover ostracod shells in some horizons of the core (SPD-3200; SPD-3600; SPD-4135), mainly comprising representatives of the Herpetocypris reptans (Baird) species. In one horizon (SPD-9710) close to the bot tom, Opercula remains of Bithynia sp. were recovered.
Samples were sieved under running water, dried at room temperature and studied under a binocular microscope to determine the faunal assemblages. Ostracods and Opercula were carefully sonicated and cleaned with water to remove the sediment. Afterwards, at least 10 mg of ostracods (ca 2000 single valves) and 15-20 mg of Opercula were picked.
The sample preparation protocol is described in Goodfriend (1991) and Goodfriend and Meyer (1991) and involves hydrolysis under N 2 atmosphere in HC1 (2.9 Lrl/mg of 12 N HC1 and 100 p,l of 6 N HC1) for 20 h at 100 °C, and derivatization in two steps: esterifica-tion with thionyl chloride in isopropanol and acylation with trifluoroacetic acid anhydride in dichloromethane.
Aliquots (1^1 were injected into a Hewlett-Packard 5890 gas chromatograph equipped with a Chirasil-L-Val fused silica column (0.39 m m x 0.25 |im x 25 m) from Chrompack and a N P D detector.
Mean D/L ratios and standard deviations for each horizon are shown in Tables 1 and 2. For the ostracod samples, aspartic acid, phenylalanine and glutamic acid D/L ratios were selected to calculate the numerical age because these were the only amino acids in Herpetocypris reptans samples for which equations could be established (cf. Ortiz et al. (2004)). Likewise, according to Torres et al. (2000), these amino acids are reliable for the age calculation of young samples. The age calculation algorithms employed are in Ortiz et al. (2004). In
Opercula samples, isoleucine, leucine and phenylalanine d/l ratios were used because they are the most reliable amino acids for age calculation of old samples (Torres et al., 2000). The age calculation algorithms used are described in Ortiz et al. (2002).
3.4. Palaeomagnetism
The samples were selected in the laboratory and orientated in situ with a Pomeroy D-2801 portable drill. After removing the weathered surface material, cylindrical cores were prepared and measured in the Palaeomagnetism Laboratory of the Institut de Physique du Globe de Paris (IPGP) using a vertical cryogenic 2G magnetometer. All the samples were submitted to thermal demagnetization to 600 °C at steps of 50 °C in a low thermal gradient P Y R O X oven.
3.5. CHN analysis
The samples (4-5 g) from the sediment core were homogenized with mor tar and pestle. Total organic carbon, hydrogen and nitrogen contents were measured with a LECO CHN-analyser (CHN-600) at 1050 °C. The inorganic carbon fraction was previously removed by adding HC1 so the proportional carbon abundance measured (C) is the organic carbon content (%TOC).
3.6. Organic matter S13C values
Carbon isotope ratios of bulk organic matter were measured at the "Estacion Experimental El Zaidin" A.D and E.R. After carbonate removal with 1:1 HC1, the <513C values of organic matter were measured in selected samples by means of an EA- IRMS elemental analyser connected to a Finnigan M A T 251 mass spectrometer. Results are expressed in S notat ion (%0), using the international Vienna Pee Dee Belemnite standard. The standard deviations are 0.1% o for <S13C in organic matter.
3.7. Lipid extraction and analysis (biomarker analysis)
About 5-10 g of sediment were first ground and bio-markers extracted following the LEB protocol, which consists of (Lucini et al., 2000): 24 h soxhlet extraction with dichloromethane and methanol 2:1 (suprasolv Merck) and concentration of the isolated bitumen using a rotor-vapour device. Three fractions were obtained through liquid chromatography in a silica-alumina glass column using solvents of different polarity: hexane,
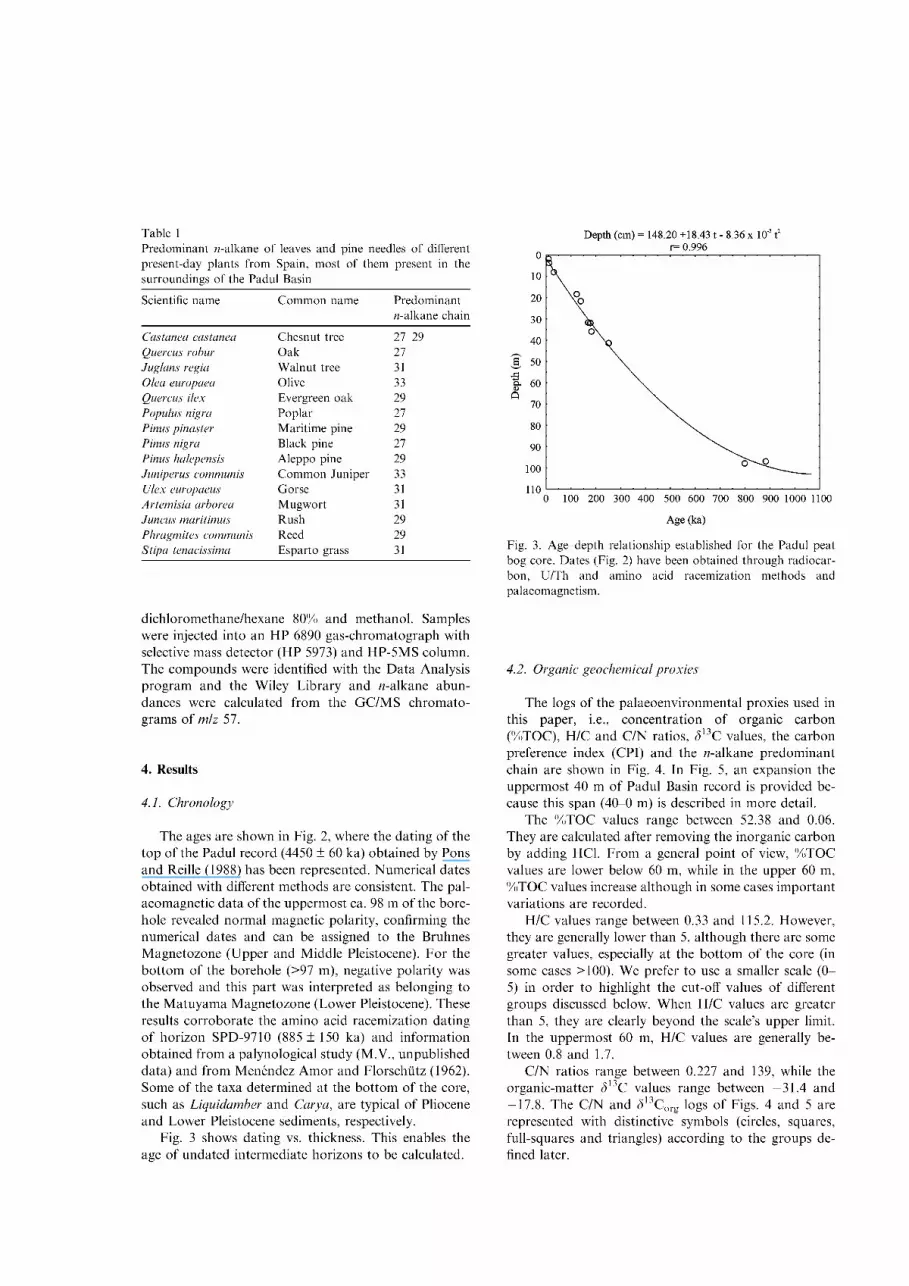
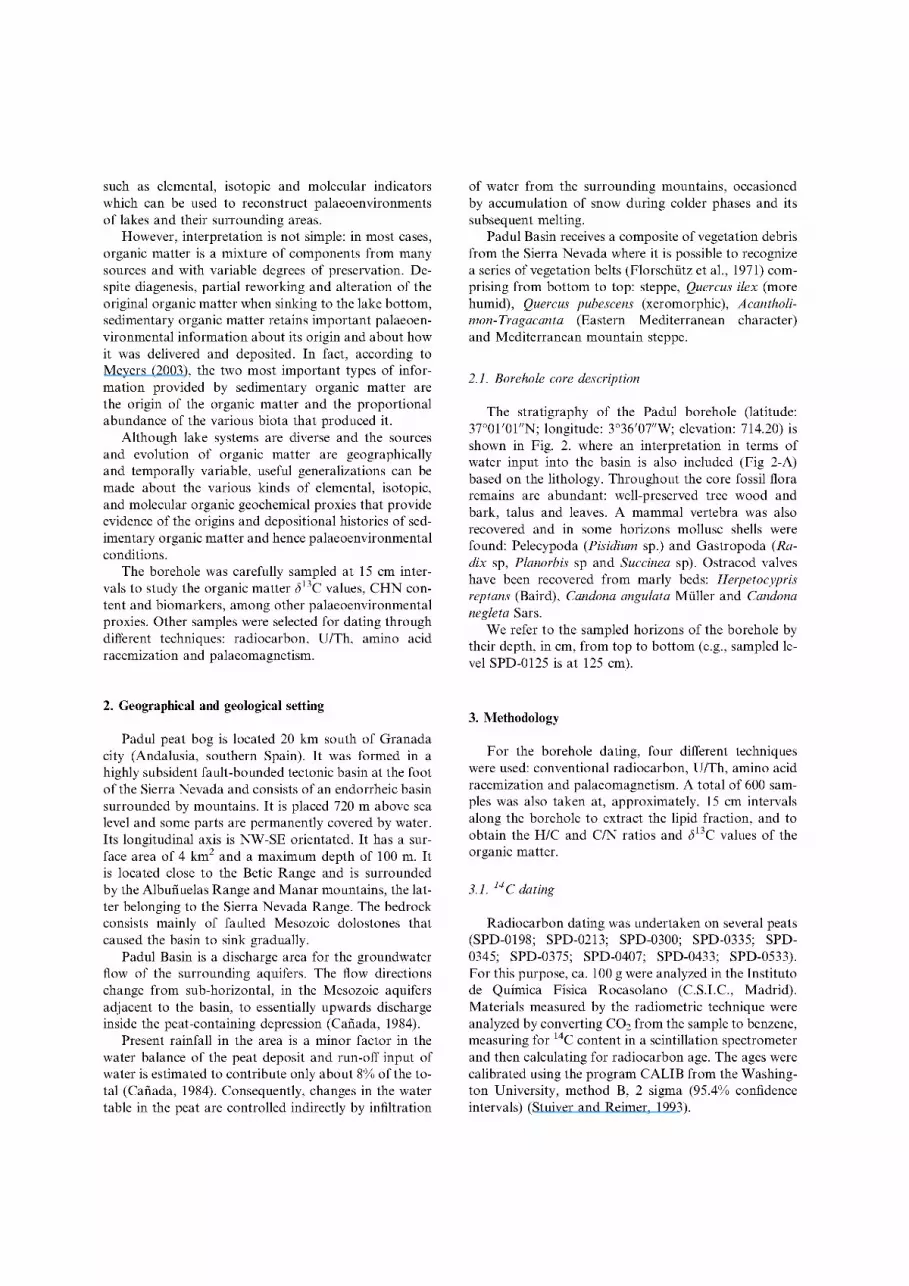
Table 1 Predominant ^-alkane of leaves and pine needles of different present-day plants from Spain, most of them present in the surroundings of the Padul Basin
Scientific name C o m m o n name Predominant ft-alkane chain
Castanea castanea Chesnut tree 27-29 Quercus robur Oak 27 Juglans regia Walnut tree 31 Olea europaea Olive 33 Quercus ilex Evergreen oak 29 Populus nigra Poplar 27 Pinus pinaster Marit ime pine 29 Pinus nigra Black pine 27 Pinus halepensis Aleppo pine 29 Juniper us communis C o m m o n Juniper 33 Ulex europaeus Gorse 31 Artemisia arborea Mugwor t 31 Juncus maritimus Rush 29 Phragmites communis Reed 29 Stipa tenacissima Espar to grass 31
dichloromethane/hexane 80% and methanol. Samples were injected into an H P 6890 gas-chromatograph with selective mass detector (HP 5973) and HP-5MS column. The compounds were identified with the Da ta Analysis program and the Wiley Library and n-alkane abundances were calculated from the GC/MS chromato-grams of mlz 57.
4. Results
4.1. Chronology
The ages are shown in Fig. 2, where the dating of the top of the Padul record (4450 ± 60 ka) obtained by Pons and Reille (1988) has been represented. Numerical dates obtained with different methods are consistent. The pal-aeomagnetic data of the uppermost ca. 98 m of the borehole revealed normal magnetic polarity, confirming the numerical dates and can be assigned to the Bruhnes Magnetozone (Upper and Middle Pleistocene). For the bo t tom of the borehole (>97 m), negative polarity was observed and this part was interpreted as belonging to the Matuyama Magnetozone (Lower Pleistocene). These results corroborate the amino acid racemization dating of horizon SPD-9710 (885 ± 150 ka) and information obtained from a palynological study (M.V., unpublished data) and from Menendez Amor and Florschlitz (1962). Some of the taxa determined at the bot tom of the core, such as Liquidamber and Carya, are typical of Pliocene and Lower Pleistocene sediments, respectively.
Fig. 3 shows dating vs. thickness. This enables the age of undated intermediate horizons to be calculated.
Depth (cm) = 148.20 +18.43 t - 8.36 x 10"312
r= 0.996
no 1 • • • • • • • • • • 1
0 100 200 300 400 500 600 700 800 900 1000 1100
Age (ka) Fig. 3. Age-dep th relationship established for the Padul peat bog core. Dates (Fig. 2) have been obtained through radiocarbon, U /Th and amino acid racemization methods and palaeomagnetism.
4.2. Organic geochemical proxies
The logs of the palaeoenvironmental proxies used in this paper, i.e., concentration of organic carbon (%TOC), H/C and C/N ratios, 313C values, the carbon preference index (CPI) and the n-alkane predominant chain are shown in Fig. 4. In Fig. 5, an expansion the uppermost 40 m of Padul Basin record is provided because this span (40-0 m) is described in more detail.
The % T O C values range between 52.38 and 0.06. They are calculated after removing the inorganic carbon by adding HC1. F rom a general point of view, %TOC values are lower below 60 m, while in the upper 60 m, %TOC values increase although in some cases important variations are recorded.
H/C values range between 0.33 and 115.2. However, they are generally lower than 5, although there are some greater values, especially at the bot tom of the core (in some cases >100). We prefer to use a smaller scale ( 0 -5) in order to highlight the cut-off values of different groups discussed below. When H/C values are greater than 5, they are clearly beyond the scale's upper limit. In the uppermost 60 m, H/C values are generally between 0.8 and 1.7.
C/N ratios range between 0.227 and 139, while the organic-matter d13C values range between —31.4 and - 1 7 . 8 . The C/N and 313Corg logs of Figs. 4 and 5 are represented with distinctive symbols (circles, squares, full-squares and triangles) according to the groups defined later.
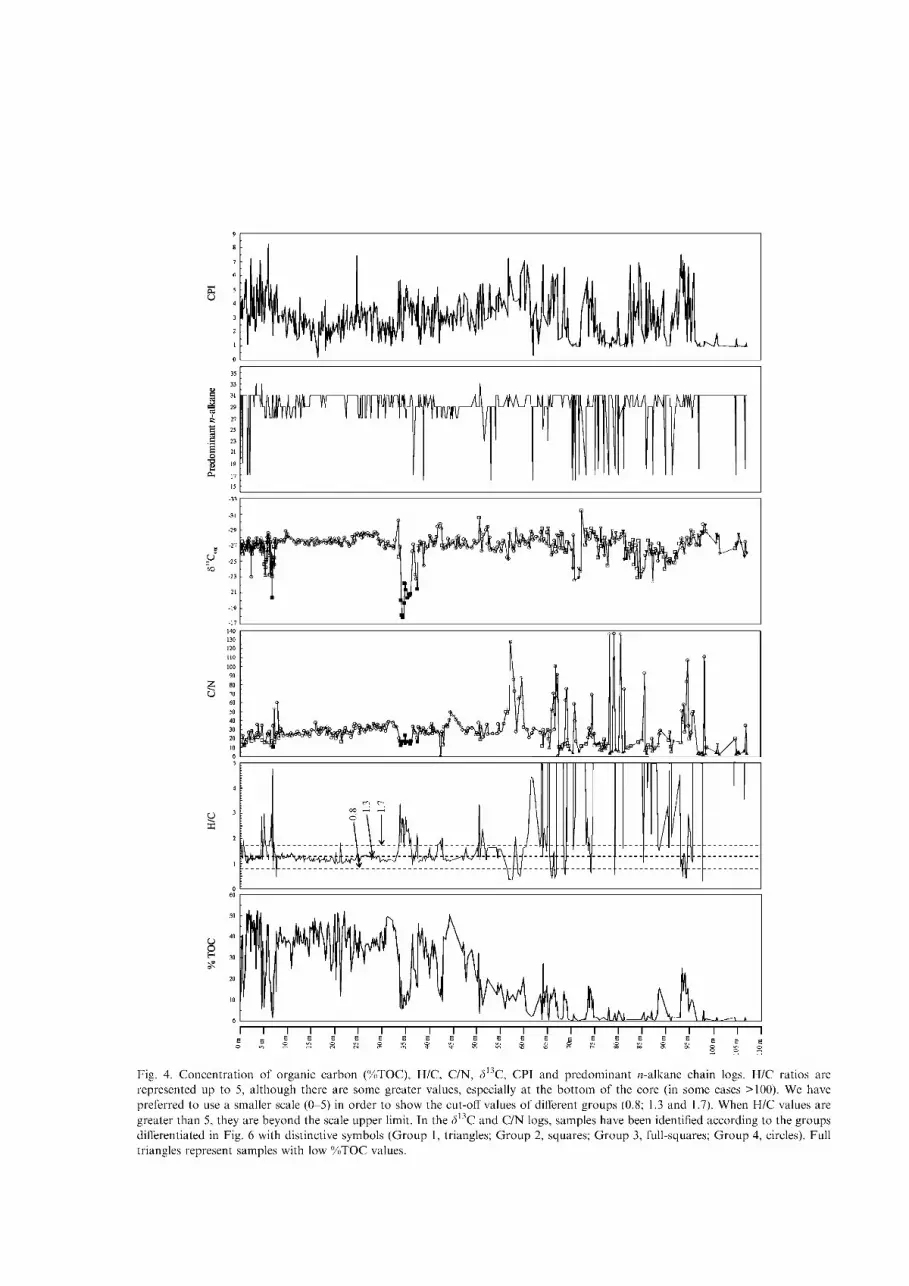
Fig. 4. Concentrat ion of organic carbon (%TOC), H/C, C/N, 3 C, CPI and predominant ft-alkane chain logs. H/C ratios are represented up to 5, a l though there are some greater values, especially at the bo t tom of the core (in some cases >100). We have preferred to use a smaller scale (0-5) in order to show the cut-off values of different groups (0.8; 1.3 and 1.7). When H/C values are greater than 5, they are beyond the scale upper limit. In the 3l3C and C/N logs, samples have been identified according to the groups differentiated in Fig. 6 with distinctive symbols (Group 1, triangles; G r o u p 2, squares; G r o u p 3, full-squares; G r o u p 4, circles). Full triangles represent samples with low % T O C values.

Fig. 5. Concentrat ion of organic carbon (%TOC), H/C, C/N, 3 C, CPI and predominant ft-alkane chain logs in the uppermost 40 m. See Fig. 4 for description.

The predominant w-alkane chain is also represented in Figs. 4 and 5. Most of the samples of the upper part of the core maximize at C 2 7 , C29 or C 3 1 , while the Cn n-alkane is predominant in samples from 107 to 60 m.
The carbon preference index (CPI) represents the predominance of odd-over-even w-alkanes over a certain range and is defined as: CPI - (5^C 23-3i(odd) + C25-3 3(odd))/(J]C24-32(even)). The values of this proxy vary between 8.27 and 0.23.
5. Discussion
5.1. Concentration of total organic carbon
The concentration of total organic carbon is a fundamental proxy for describing the abundance of organic matter in sediments. The %TOC represents the organic matter that escaped remineralization during sedimentation and is influenced by both the initial production of biomass and subsequent degree of degradation, so it integrates different origins of organic matter. Typical organic matter contains approximately 50% carbon, such that the concentration of organic matter in sediment is equivalent to about twice %TOC (Meyers, 2003).
Low concentrations of organic carbon, less than 0.5%, were found in sediments from several horizons of the bot tom of Padul borehole (106.8; 106.4-104.6; 101.20; 100.8; 100.4; 98.0; 97.6-96.4; 85.6; 80.9-80.7; 78.7-78.0; 71.4; 70.2-70.0 m), where detritic sediments are dominant (lutites, gravel, marls) with very scarce int-erbeds of peat. This provides evidence of greater depths than those normally supposed for a peat bog. High amounts of mica flakes and very coarse sand-sized meta-morphic rock fragments transported from the detrital deposits (Pliocene) of the surrounding areas were found, suggesting that run-off contribution to the Padul Basin water recharge was greater with different boundary conditions than today's.
A sudden increase in the concentration of organic carbon from 70 m marks a dramatic change in the sedimentary record, with a predominance of peaty lutites (between 70 and 50 m) and peat (from 50 to 0 m). There are, however, some minima in the %TOC valves, which correlate with horizons consisting of marls (36.0-33.4 m) or sands (7-4.5 m).
This correspondence between the concentration of organic carbon and lithology can be interpreted in terms of hydrogeological behaviour. During the first third of the record (107-70 m) there was a relatively deep water body (lacustrine conditions) in the Padul Basin, probably associated with a considerable run-off, whereas in the uppermost 70 m this changed into palustrine conditions (peat bog s.s. "...enclosed basins of deposition, such as former lake basins... where plant growth and succession results in a compact accumulation of plant
debris", Sirkin, 1978) with predominant groundwater recharge.
5.2. Organic matter HIC ratios
The atomic H/C ratio can be used to determine the origin of organic matter and changes in lake level (oxic-anoxic conditions). H/C values decline during exposure to air, mainly due to the selective removal of labile components during transport and after deposition by bacterial respiration and inorganic oxidation (Talbot and Livingstone, 1989) and the preservation of labile components is enhanced by rapid transport and burial in an anoxic environment (Talbot, 1988). Therefore, the range organic matter preservation as recorded by H/C ratios reflects its transport , burial history and redox conditions.
According to Hun t (1979), Pocock (1982) and Tis-sot and Welte (1984), sedimentary organic matter can be classified as algal/amorphous, herbaceous, woody or coaly. Algal and amorphous remains tend to be more hydrogen-rich than the other groups because of their relatively high content of saturated organic compounds and have H/C ratios higher than 1.7 (Talbot and Livingstone, 1989). Herbaceous remains are richer in aromatics and so have a lower hydrogen content; they have H/C values between 1.3 and 1.7 (Talbot and Livingstone, 1989), while woody material is dominated by polycyclic aromatic compounds that are even poorer in hydrogen, with H/C ratios between 0.8 and 1.3 (Talbot and Livingstone, 1989). At the other extreme, altered or oxidized plant material (coaly) has H/C values lower than 0.8. Thus, the atomic H/C ratio can be used to differentiate between the origin of the organic matter present in a sediment, al though the boundaries between the different groups are, however, in reality diffuse.
These groups can be also a guide to the organic matter preservation potential. Significant amounts of preserved algal or herbaceous remains normally indicate deposition in an oxygen-poor environment (Talbot and Livingstone, 1989), while extreme oxidation of the organic matter results in the presence of charcoal and degraded wood.
The atomic H/C ratio log is shown in Figs. 4 and 5. The cut-off values of different groups (0.8; 1.3 and 1.7) have been highlighted using a scale ranging from 0 to 5.
According to the H/C plot (Fig. 4), from 107 to 60 m there is a dominance of organic matter derived from phytoplankton (values higher than 1.7), with a few minima, reaching values characteristic of land plants (95.5-94.5; 93.9-93.7; 93.3-93.1; 90.5; 88.5-88.3; 85.2; 73.9; 73.5; 70.4; 66.2; 65.6; 65.3; 64.7; 63.9 m). However, H/ C values of some horizons from this part of the core may be artificially high owing to the low concentrations

of organic carbon and the organic matter of the sediment might be from sources other than phytoplankton.
The high values obtained from the bot tom of the core also indicate good preservation of organic matter (Talbot and Livingstone, 1989) within an oxygen-poor (lacustrine) environment. In some cases, the H/C ratio decreases below 0.8, which indicates oxidation or alteration of the organic matter and usually corresponds to gravel (66.8-65.7; 74.1; 97.8) or lutite (94.3-94.1; 93.5; 79.9; 79.1; 77.8; 68.7-68.3 m) horizons.
The behaviour of the Padul basin changed radically in the uppermost 60 m, in which the H/C ratio marks a predominance of inputs of organic matter from terrestrial plants (values between 0.8 and 1.7), suggesting the existence of low-water episodes (palustrine). There are, however, eight episodes of elevated H/C ratios that record a rise of the water level (58.1; 51.2; 50.5; 42.7; 36.0-33.6; 7.1; 6.7-6.1; 5.5^1.6 m). In four of them (36.0-33.6; 7.1; 6.7-6.1; 5.5^1.6) a lithological change (marls and calciarenites) was recorded.
The H/C ratio varies narrowly from 33.4 m to the top of the core. Most of the values are below 1.3, a value consistent with either woody (0.8<H/C<1.3) or herbaceous terrestrial plants (1.3<H/C<1.7).
There are more frequent oscillations from 60 to 36.0 m (ca. 400-180 ka B.P.): there is a predominance of H/C values characteristic of herbaceous plants (60.4-59.8; 55.1-52.2; 50.3^19.7; 47.7^17.5; 42.5; 41.5; 40.2-40.0; 37.2-37.0 and 36.6 m), alternating with values typical of woody plants. There are only four episodes (58.1; 51.2; 50.5; 42.7 m) of phytoplankton abundance. This might be related to precipitation oscillations. During wetter periods trees should develop, while in drier episodes grasses should be predominant. However, this will have to be analyzed in greater detail because in the surroundings of Padul Basin there are some species of Pinus and perennial Quercus typical of areas with low precipitation rates and warm or relatively high temperatures (Mediterranean climate).
There is good correspondence between the H/C values characteristic of woody plants and the predominance of C 2 7 and C 2 9 w-alkanes, typical of trees (Cranwell, 1973). However, there are other samples where these w-alkanes are predominant whereas other proxies indicate different provenance of organic matter. This is explicable in terms of other kinds of vegetation, such as emergent macrophytes, maximizing at C 2 7 to C 3 1 w-alkanes (Ficken et al., 2000).
5.3. Organic matter CIN ratios and carbon stable isotopic composition
The C/N ratio is an indicator of the protein content of organic matter (Miiller and Mathesius, 1999). Proteins account for the greatest par t of the organic matter of living organisms together with lipids and carbohy
drates, but the proportional abundance of proteins varies among organisms. Thus, this proxy provides information about the proport ions of algal and land plant contribution to organic matter (Prahl et al., 1980; Meyers, 1994; Kaushal and Bindford, 1999).
Benthic organisms and bacteria have C/N ratios around 4.2 and 4.1, while in planktonic organisms the ratio can vary between 4 and 7 (Bordovskiy, 1965). Fresh organic matter from lake algae, which are protein-rich and cellulose-poor, has C/N values ranging 4 and 10, whereas vascular land plants, which are protein-poor (1-10%) and cellulose-rich, usually have ratios of 20 and greater (Hedges et al., 1986; Meyers, 1994). C/N ratios between 30 and 40 are characteristic of cellulose-rich plants (Ertel and Hedges, 1985), whereas values of 12-17 suggest a mixture of algal and vascular plant.
These differences generally survive sinking and sedimentat ion in subaqueous environments; however, dia-genetic processes, such as autolysis, dissolution and microbial mineralization, e.g., oxic/anoxic cycles, microbial decay and bacterial processes (Aller, 1994) can modify the original ratios (Miiller and Mathesius, 1999). For this reason, the carbon isotope ratio of organic carbon is often used together with C/N values to answer questions concerning the sources and composition of organic matter.
The carbon isotopic compositions of organic matter reflect the dynamics of carbon assimilation during photosynthesis and the isotopic composition of the carbon source, which depends on environmental conditions (Hayes, 1993).
The carbon isotopic composition of organic matter (<513C) in lake sediments is frequently used to distinguish among the organic matter sources, especially between terrestrial and aquatic plants. It can further differentiate between different types of land plants ( C 3 and C 4 ) and be used to constrain algal productivity (Talbot and Johann-essen, 1992).
Phytoplankton algae preferentially utilize 1 2 C to produce organic matter and therefore remove 1 2 C from surface waters reservoirs (Dean and Stuiver, 1993). Consequently, the 1 3 C / 1 2 C ratio of the remaining inorganic carbon increases and produces an increase in <513C values in the newly produced organic matter. Thus, an increase in productivity yields an increase of 1 3 C in the organic matter. Freshwater phytoplankton typically have <513C values between - 2 0 % o and - 3 0 % o (Galimov, 1985).
Nevertheless, there are several additional factors that can control the <513C values, including the chemistry of the water, the exchange of C 0 2 with atmosphere, the dissolved inorganic matter reservoir and the carbon acquisition mechanisms (Mckenzie, 1985; Hakansson, 1985). In fact, phytoplankton can sometimes produce an enrichment in 1 3 C of biomass when photosynthesis occurs under C 0 2 limiting-conditions (Sharkey and

Berry, 1985; Hodell and Schelske, 1998). Laws et al. (1995), Bidigare et al. (1997) and Popp et al. (1997a,b,1998) observed that the fixation of organic carbon is mostly influenced by the growth rate (cell size) and cell geometry of phytoplankton together with the concentration of the aqueous C 0 2 . However, in some other cases the relation between carbon isotope fractionation during carbon fixation and growth rate was found to be non-linear (Laws et al., 1997), at least with low aqueous C 0 2 concentrations; this was attributed to either an active uptake of bicarbonate or an uptake of C 0 2 with external carbonic anhydrase mediated conversion of bicarbonate to C 0 2 supplementing the supply of C 0 2 when it becomes limiting (Laws et al., 1998). Thus, an active uptake of H C O ^ rather than C 0 2 can produce a 1 3 C-enrichment of biomass (Espie et al., 1991; Hollander and Mckenzie, 1991; Goericke et al., 1994; Ber-nasconi et al., 1997; Laws et al., 1998).
In addition, the lake receives organic matter from its surroundings. Terrestrial plants can be divided in two groups depending on their methods of C 0 2 concentration and photo synthetic fixation pathways and subsequently the fractionation against 1 3 C , namely C 3 and C 4 .
In terrestrial plants utilizing the C 3 (Calvin) pathway, the enzyme Rubisco, which is responsible for the fixation of C 0 2 during photosynthesis, produces a discrimination against 1 3 C (Farquhar et al., 1982). Taking into account the diffusion in and out of the cell and environmental factors, the resulting common range for 313C values of C 3 land plants (trees, shrubs and cold climate grasses) is — 23% Q to — 31% Q (cf. O'Leary, 1981, 1988; Meyers, 1990; Meyers et al., 1995; Meyers and
Lallier-Verges, 1999; Ficken et al., 2000), with a mean value of — 27%Q. On the other hand, land plants that use the C 4 (Hatch-Slack; grasses and sedges) photosyn-thetic pathway have d13C values between — 9%Q and -17%o (Tieszen et al., 1979; O'Leary, 1981, 1988; Meyers, 1990; Ficken et al., 2000), with a mean value o f - 1 3 % ,
Distinctive d13C values can be used together with the C/N values to identify the major sources of organic matter in lake sediments. Carbon isotope values are considered to be relatively conservative in comparison with C/ N ratios (Thornton and McManus , 1994).
The atomic C/N ratio and the carbon isotopic composition of organic matter (S13Corg) logs are shown in Figs. 4 and 5. Fig. 6 compares the atomic C/N ratios to the S13Corg values. Four groups can be distinguished according to the inferred major sources of organic matter: Group 1 (algae), Group 2 (mixed origin: algae/C 3
plants), Group 3 (algae/land plants) and Group 4 ( C 3
land plants). Samples from each group were identified with distinctive symbols in the C/N and S13Corg logs (Figs. 4 and 5).
Samples from Group 1 (algae), with low C/N ratios and S13Corg values, should reflect periods of increasing water input which caused the water level to rise and produced phytoplankton blooms. Most of these, except one at 42.1 m, are located in the lowermost 65 m of the core (Fig. 4). The hydrological model for this part of the record suggests that these high water level phases are probably linked to wet episodes and temperate or warm climate, causing an increase in run-off.
However, many samples with low concentrations of organic carbon (listed above and plotted as full triangles
Fig. 6. <5 1 3 C o r g vs. C/N plot. Fou r groups have been distinguished: G r o u p 1 (algae), G r o u p 2 (algae/C 3 plants), G r o u p 3 (algae/land plants), and G r o u p 4 ( C 3 land-plants). C/N ratios are represented up to 100. Samples (7) with C/N values higher than 100, have <5 1 3 C o r g
values between - 2 8 . 5 and -27 .10 , being included within G r o u p 4.

in Fig. 4) are included within this group and cannot be interpreted as being derived from lacustrine algae because their C/N ratios are probably artificially depressed (Meyers, 2003). This is due to the analytical methodology, where the carbonate carbon is removed from sediment, but the inorganic nitrogen is not. Generally, in most of the sediments the inorganic nitrogen concentrations are smaller than the organic nitrogen ones (Miiller and Mathesius, 1999), but in sediments with low organic carbon concentrations (lower than 0.3%), such as some located at the bot tom of Padul core, the proport ion of inorganic nitrogen can be a large fraction of residual nitrogen and C/N ratios may be biased.
Group 2 (mixed origin: algae/C 3 plants) has <5 1 3 C o r g
values which are typical of either phytoplankton or C 3
land plants, and C/N values between 10 and 20, which suggests a mixture of organic debris. This probably reflects water inputs to the Padul Basin (not as large as in Group 1), which caused noticeable algal production and a washing in of land plant and aquatic organic matter. According to the different hydrogeological scenarios of the upper and lower part of the Padul record, we conclude that , when samples of this group are located at the bot tom of the core (>65 m), they reflect increases in water body depth linked to higher runoff and, therefore, wet climatic phases (Fig. 4). On the other hand, when samples of this group are in the top 65 m (Fig. 4), they probably reflect warm-temperate periods that accelerated thaw in the surrounding mountains and higher runoff and groundwater recharge.
Group 3 (algae/land plants shown as full squares in Figs. 4-6) is more difficult to interpret. The samples included in this group are from 36.0-33.6 m, with one from 6.70 m (Figs. 4 and 5). The <5 1 3 C o r g values (—17%0 and — 21 %0) are between the common values for phytoplankton ( -20% o to - 3 0 % o , Galimov, 1985) and C 4 plants ( - 9 % 0 to - 1 6 % 0 ; Tieszen et al., 1979; O'Leary, 1981). The C/N values fall in the range 10-20 and might indicate a mixed origin of algae and organic residues belonging to C 4 plants, though some C 3 plants could also contribute.
This episode, according to our interpretation, is related to warm and dry conditions. It might have caused an important development of both phytoplankton within the peat bog and C 4 grasses and shrubs on the borders. In fact, most studies attribute the high <513C values for organic matter in African lake sediments to the spread of C 4 plants, notably savanna grasses and sedges, as a result of drier climate and/or lower pC02
(Hillaire-Marcel et al., 1989; Talbot and Johannessen, 1992; Street-Perrott, 1994; Ficken et al., 1998b; Huang et al., 1999), al though coinciding with cold phases (Last Glacial Age).
In our view, the land plants that follow the C 4 photo-synthetic pathway did not develop sufficiently to cause such a heavy increase in isotopic composition of the sed
iment. There is no evidence in other parts of the core for similar values. Likewise, in the palynological analysis no important pollen counts of C 4 plants were recorded in this span (cf. Florschtitz et al., 1971). However, this interpretation must be handled carefully owing to the question of how the proxies are delivered into lake sediments, i.e., pollen is carried by wind, whereas organic debris is carried by streams or just falls from the surface. Otherwise, some aquatic macrophytes could contribute to those values; in fact, the Vaq ratio (used to determine the relative inputs to lake sediments of aquatic macrophytes and terrestrial plants) of these samples is between 0.25 and 0.6 (unpublished data). This range suggests an important development of emergent and submerged/ floating aquatic macrophytes (Ficken et al., 2000).
Nevertheless, an uptake of dissolved H C O ^ (with <513C = 1%0) by algae, diatoms and aquatic macrophytes could have occurred sufficiently to drive up the <5 1 3 C o r g
to values in the range of C 4 plants or even a bit higher (Keely and Sandsquist, 1992; Goericke et al., 1994), because of the limited availability of dissolved C 0 2 , which can be reduced in periods of high productivity (Hollander and Mckenzie, 1991; Goericke et al., 1994; Bernasconi et al., 1997;), at high growth rates (Laws et al., 1998) or in waters where HCOj~ to C 0 2 ratios are kept high by alkaline p H (Espie et al., 1991; Hassan et al., 1997; Laws et al., 1998).
The samples of Group 3 show relative maxima in the atomic H/C values, confirming its provenance from an important algae development. In cases like this, the removal of C 0 2 by algae (high primary productivity) promotes calcite precipitation by decreasing the aqueous C 0 2 (Hodell and Schelske, 1998; Hodell et al., 1998), such as in the 36.0-33.6 m span which consists mainly of marls. Also, precipitation of C a C 0 3 is induced by warming of surface waters. In these cases, a wide range of <513C values (from - 1 0 % o to -47% 0 ) is found in freshwater phytoplankton, in which the aqueous chemistry, dissolved inorganic carbon reservoir and carbon acquisition mechanisms exert great control on the carbon isotope composition (Tyson, 1995). In brief, the possible decrease of C 0 2 could have caused uptake in dissolved bicarbonate (with higher values of <513C) by algae and macrophytes instead of the limiting C 0 2 , in the way proposed by Laws et al. (1998).
Based on this information, the high <5 1 3 C o r g values obtained between 36.0 and 33.6 m (ca. 180 to 170 ka B.P.) should be related to a climatic opt imum when ice from the surrounding mountains melted and reached the peat bog through groundwater flow, causing a rise in water level, an increase in dissolved H C O ^ (dissolution of dolostones) and the development of phytoplankton.
Finally, C/N and <5 1 3 C o r g values for Group 4 are characteristic of C 3 land plants (Filley et al., 2001; Meyers, 2003). However, they may also be characteristic

of aquatic macrophytes (Miiller and Mathesius, 1999). Therefore, samples of this group cannot be ascribed to a specific palaeoenvironmental event. C 3 terrestrial plants may be either grasses or trees characteristic of areas with different precipitation rates. Furthermore, C 3 trees include a huge variety of species with diverse ecological characteristics. For these reasons samples of Group 4 may either indicate episodes of greater or lesser water inflow but, in all cases, not as large as in samples of Groups 1, 2 or 3.
Figure 4 shows that at the bot tom of the core (>65 m) algae were a major organic matter source (predominance of samples belonging to Group 1). This suggests that the water was deeper than in the middle and upper part of the record, in which palustrine conditions probably predominated. However, samples belonging to Group 1 with low concentrations of organic carbon (full triangles) cannot be interpreted as being derived from phytoplankton. These results are consistent with those obtained from lithology, %TOC and H/C ratio, al though there is a lag at the top of this period of about 5 m (65-60). Likewise, some episodes with land-derived organic matter are also important in this part of the core, which correlates extremely well with the decrease in the H/C ratio (Fig. 4). More specific points can be made: the terrestrial plants that reached the Padul basin belonged to C 3 plants and there are some episodes with an important vegetation cover ( C / N » ) .
Between 60.0 and 36.0 m (ca. 400-180 ka B.P.), most of the samples are included in Group 4 with some phases of major phytoplankton and algae development (58.1; 51.2; 50.5 and 42.7) as interpreted from the H/C ratio (see discussion above). Most of the information comes from the interpretation of the atomic H/C ratio which, as discussed above, indicates the alternation of episodes with grasses/trees dominance.
There is also close correlation between the oscillations observed in the H/C plot and the C/N and <5 1 3 C o r g values in the rest of the core. The rise in water level recorded in samples of Group 3 (36.0-33.6 and 6.7 m) is also recorded in the H/C log (Figs. 4 and 5). Likewise, owing to the good correspondence between the litholog of Florschiitz et al. (1971) and ours (Nestares and Torres, 1998), it is possible to observe coincidences between palynology and our study. Around 38.0-34.0 m there is a major decrease in Artemisia and Chenopodiacea together with an increase in Quercus from the preceding span, suggesting optim u m conditions.
The global climatic changes occurring from ca. 170— 25 ka B.P. (from 33.6 to 7 m) did not strongly affect the palaeoenvironmental proxies; i.e., H/C and C/N ratios and <5 1 3 C o r g values vary little, except at 21.2 m where C/N and <5 1 3 C o r g values belong to Group 2, the H/C ratio increases and the concentration of organic carbon decreases. This is interpreted as a rise in the peat bog
water level. However, the pollen diagram (Florschiitz et al., 1971) indicates major changes around 20-25 m.
In the uppermost part of the core (approximately the last 7 m), many samples belong to Group 2 (algae-C 3
plants), indicating the mixture of organic matter sources alternating with Group 4 ones ( C 3 land-plants). The variations in the <5 1 3 C o r g values between 6.7 and 4.5 m, with a maximum difference of 5%0 (—23.3%0 to — 28.3% 0), are specially marked. These differences are undoubtedly related to important vegetation changes, but always within the range of plants following the C 3 photosynthetic pathway, linked to the Last Glacial Maximum and the beginning of the Holocene (Fig. 2).
Samples with lower <5 1 3 C o r g values (6.9-6.7; 5.9-5.6 and 4.6 m) are included in Group 4 and coincide with atomic H/C ratios common to grasses (1.3<H/C<1.7) and with predominant w-alkane chains of 31 carbon atoms which are typical of grasses (Cranwell, 1973). There is also high consistency between our interpretation and the pollen study of Valle et al. (in press): the pollen assemblages and organic geochemical proxies provide evidence for a clearly marked palaeoclimatic change from the span 7.25-6.65 m, reflecting glacial conditions (Heinrich H 2 event), to 6.65 m at which the climate improved. In our view these samples indicate cold phases coexisting with dry periods which produced the recession of temperate forests in this area and the development of grasses (Artemisia and Chenopodiacea; cf. Valle et al., in press). After these periods, both temperature and precipitation increased, causing the expansion of temperate forests and a rise in water level, with an important production of algae. These latter episodes are characterized by samples of Group 2 (algae and C 3
plants) and Group 3, which coincide with H/C ratios characteristic mainly of phytoplankton or trees (see discussion above), and C2i o r C 2 9 predominant w-alkanes, common to trees (Cranwell, 1973).
Some changes in the palaeoenvironmental proxies occurred during the Holocene, i.e., <5 1 3 C o r g values remain almost constant, al though we deduce alternation of wet and dry episodes characterized by samples of Group 2 and Group 4, respectively.
5.4. Biomarker molecule proxies (n-alkanes)
Hydrocarbons as a group are less susceptible to microbial degradation during diagenesis than most types of organic matter because they lack the functional groups that impart chemical reactivity (Prahl and Carpenter, 1984; Meyers et al., 1995), and moreover, they have low water solubility. Hydrocarbons constitute a small fraction of the total organic matter in both biota and sediments and diagenetic degradation of other compounds may exaggerate the source signatures of biomarker hydrocarbons (Tenzer et al., 1999).

The M-alkanes present in a sediment reflect mainly the contribution from algae, aquatic macrophytes and land plants. They survive unchanged during passage through the digestive systems of animals and the contributions of M-alkanes by animals or fungi to sediments are negligible (Ficken et al., 1998a).
There are three principal sources of biotic hydrocarbons in lake sediments that produce different M-alkane profiles: (1) algae and bacteria that live within a lake, (2) aquatic macrophytes that live in the lake, and (3) vascular plants that live around it.
The hydrocarbon compositions of phytoplankton are dominated by low molecular weight, where algae maximize at C 1 7 M-alkane and some cyanobacteria at C 1 9 (Gelpi et al., 1970; Blumer et al., 1971; Cranwell et al., 1987). Even-chain M-alkanes ranging from C M to C 2 2
have been ascribed to photosynthetic and non-photo-synthetic bacterial inputs (Han and Calvin, 1969; H a n et al., 1980; Grimalt and Albaiges, 1987).
The M-alkanes of submerged/floating macrophytes n-alkanes maximize at C 2 i , C 2 3 and C 2 5 (Cranwell, 1984, Ogura et al., 1990, Viso et al., 1993). The emergent macrophytes have M-alkane distributions similar to terrestrial plants, that is, maximizing at C 2 7 and C 2 9 (Cranwell, 1984).
Vascular plants on land or around edges of lakes contain large proport ions of higher molecular weight M-alkanes, C 2 7 , C 2 9 and C 3 i , in their epicuticular waxy coatings (Eglinton and Hamilton, 1963, 1967; Eglinton and Calvin, 1967; Cranwell et al., 1987, Rieley et al., 1991), and abundances of these wax hydrocarbons reflect the amount of organic matter transported to lakes from the surrounding land. More specific differentiations can be made: where grasses dominate, C 3 1 is the major M-alkane, while C 2 7 and C 2 9 are more abundant in sediments where trees predominate (Cranwell, 1973). We have recently analyzed leaves and pine needles of present day plants (Table 1), most of those present in the surroundings of the Padul Basin showing similar results; in two species, Junniperus communis (Juniper) and Olea europ-aea (olive) M-alkanes maximize at the C 3 3 M-alkane.
The carbon preference index (CPI) can be used as a proxy for the preservation potential of the organic matter when there is a clear predominance of superior plant waxes. CPI values are high in living plants and surface sediments but then decrease, tending to a final value of 1 with increasing maturity. In general, young (modern) vascular plants have CPI values around 7 but due to dia-genetic processes their CPI gradually decrease down to 1 (Hedges and Prahl, 1993). However, this index cannot be used as a preservation potential proxy in all cases because a CPI of 1 may also indicate immature organic matter with only a low contribution from higher plants.
The predominant M-alkane chain log is shown in Figs. 4 and 5, which is interpreted as an indicator of the origin of the organic debris input (algae, aquatic macrophytes
or land plants; Cranwell et al., 1987; Ficken et al., 2000) and of variation over time in the water-body depth.
Sometimes, especially in peats, despite the presence of plant species dominated by the shorter chain length M-alkanes, the latter are either minor components or are absent from chromatograms, which suggests that a selective diagenetic removal of lower molecular weight M-alkanes has occured (Lehtonen and Ketola, 1993; Ficken et al., 1998a). This is not the case in the Padul peat bog. Atomic H/C ratios, which are also used to determine the preservation of organic matter, are only below 0.8 in very few cases. Likewise, with respect to the CPI, most of the values are greater than 1.5, with some rare exceptions in the lower part of the core. Therefore, very little removal of components during t ransport and after deposition occurred.
The predominance of M-alkanes of low-molecular-weight at the bot tom of the core (>70 m) indicates that algae and bacteria are important organic matter sources (Gelpi et al., 1970; Blumer et al., 1971; Cranwell et al., 1987). This suggests, as do the other palaeoenvironmental proxies, that the water body would have had some depth. There is also an important number of samples indicating another origin for the organic matter (land plants or aquatic macrophytes) with predominant C 2 7
to C 3 i M-alkanes (Cranwell, 1973). In all cases, organic matter inputs were smaller than in the upper part of the core (cf. %TOC).
With the aid of the predominant M-alkane chain proxy, samples of doubtful origin, such as those with low concentrations of organic carbon, can be ascribed to a certain group. Thus, samples with predominantly lower molecular weight M-alkanes are derived from phytoplankton (104.6; 96.8; 85.6; 80.9; 71.4; 70.1), whereas in the remaining samples the organic matter likely came from other sources (macrophytes or land plants).
Between 70 and 65 m, the C 3 i M-alkane predominates, suggesting input from grasses, with three episodes in which the C 2 9 M-alkane is abundant . In our wiew this indicates the existence of dry conditions which produced the recession of trees and the expansion of grasses.
In the lower and middle parts of the core, the predominance of C 2 7 , C 2 9 and C 3 i M-alkanes might be related to palustrine conditions (Figs. 4 and 5) with important organic matter inputs from trees or grasses, al though this predominance may also indicate high water level phases, as emergent macrophytes usually also maximize at those M-alkanes (Ficken et al., 2000). There are some exceptions, such as between 36.0 and 33.6 m, where lower molecular weight M-alkanes, typical of phytoplankton, are predominant. This corroborates the information provided by the other proxies, as discussed above. There are also some samples in which C 3 3 M-alkane, characteristic of Juniperus or Olea (see Table 1; Ficken et al., 2000), is predominant.

6. Conclusions
The concentration of organic carbon, the atomic H/C and C/N ratios, the <513C and CPI values and the predominant w-alkane chain length, proved to be excellent palaeoenvironmental proxies for the study of the palaeo-climatological and palaeohydrological evolution of Padul Peat Bog. The atomic H/C ratios and CPI values indicate that little diagenesis during transport and after deposition occurred in the basin.
These proxies provide evidence of two markedly different hydrogeological scenarios in the Padul Basin. F rom the bot tom (ca. 1 M a B.P.) to 60 m (ca. 400 ka B.P.), an important run-off recharge made the water-body deeper than in the rest of the record. F rom 60 m to the uppermost part (ca. 400-4.5 ka B.P.), the Padul Basin became a peat bog s.s., with the main water input coming as groundwater inflow.
Atomic C/N ratios and <5 1 3 C o r g values distinguished four different palaeoenvironmental scenarios: Group 1 (algae), Group 2 (mixed origin: algae/C 3 plants), Group 3 (algae/land plants) and Group 4 ( C 3 land plants). Samples of each group were identified with distinctive symbols in the C/N and <5 1 3 C o r g logs (Figs. 4 and 5). According to our interpretation, samples of Groups 1 and 3 represent relative high water level episodes while samples of Group 4 reflect episodes with less water availability; samples of Group 2 reflect intermediate episodes.
Samples with low C/N ratios and intermediate-low <513C values (Group 1) as well as with high H/C ratios and abundant of lower molecular weight w-alkanes, were interpreted as deriving from phytoplankton. These values are predominant in the lower part of the core (ca. lMa-400 ka B.P.) and can be related to wet episodes which caused the water body level to rise.
F rom ca. 400 ka to ca. 180 ka B.P. (60-36.0 m), alternating episodes linked to wet/dry phases with a dominance of grasses or trees and aquatic macrophytes, respectively, were identified by the atomic H/C ratio.
Two important warm-wet episodes, interpreted from low C/N and high <5 1 3 C o r g values (Group 3), occurred at ca. 180 to 170 ka B.P. (36-33.6 m) and at ca. 20 ka B.P. (6.7 m). The former can be correlated with the marine isotopic stage (OIS) 7a; and the latter with the climatic optim u m identified by Florschiitz et al. (1971). The latter was also interpreted in the study of Valle et al. (in press).
The global climatic changes occurring from ca. 170 to 25 ka B.P. (33.6-7 m) were not recorded in the proxies. In this period, H/C and C/N ratios and <5 1 3 C o r g values varied little, al though significant variations occurred in the pollen log (Florschiitz et al., 1971).
However, important changes linked to the Last Glacial Maximum and the beginning of the Holocene were detected (7^1.5 m). Samples with lower <5 1 3 C o r g values coinciding with high atomic C/N ratios, atomic H/C ratios between 1.3 and 1.7 and with predominant w-alkane
chains of 31 carbon atoms represent cold-dry phases which caused the recession of temperate forests in this area and the extension of grasses. After these periods, both temperature and precipitation recovered, causing the expansion of temperate forests and a rise in water level, with a major production of lacustrine algae. These latter episodes are characterized by samples with intermediate C/N ratios and <5 1 3 C o r g values as well as by H/ C ratios characteristic of phytoplankton or trees, and C 2 7 or C29 predominant w-alkanes.
Few changes during the Holocene (uppermost 4.5 m) were recorded in the palaeoenvironmental proxies, though there were alternating wet and dry episodes.
The predominant w-alkane chain provides evidence of organic matter origin and, in general, is consistent with the interpretation made from the other proxies. Some uncertainties, however, still remain, especially in the ascription of C 2 7 to C 3 1 predominant w-alkanes to either grasses, trees or aquatic macrophytes. Therefore, this proxy has to be interpreted together with others or information from w-alkanes should be processed in another way. Thus, some authors (Meyers et al., 1980) preferred to use the ratio of the C29 to C 1 7 w-alkanes, the terrigenous/aquatic ratio (TARHC; Silliman et al., 1996, Bour-bonniere and Meyers, 1996; Tenzer et al., 1999) or the C i 5 _ 2 i / C 2 2 - 3 3 ratio (Xie et al., 2003) as a proxy for land-derived versus algal contributions of hydrocarbons. Compound specific carbon stable isotope analysis could also be useful.
Based on the information provided by the palaeoenvironmental proxies used in this paper, a scheme representing the low, intermediate and high water level episodes is presented in Fig. 2B. These episodes are well correlated with the water input interpretation made using the lithology (Fig. 2A). Only in few cases does a bad correlation occur, which probably reflects the greater sensitivity of lithology to water level variation than organic geochemical proxies.
Acknowledgements
We are especially indebted to Mr. Garr ido who allowed us to drill the core in his property and provided many facilities. Funding was obtained through the projects "Evidence from Quaternary Infills Palaeohydroge-ology" (European Union, F14W/CT96/0031), "Evolut ion Paleoclimatica de la Mitad Sur de la Peninsula Iberica" of E N R E S A (National Company for Radioactive Waste Management, 703238) and "Paleo-clima" of E N R E S A and CSN (Spanish Nuclear Safety Council) Thanks also to Frank Chambers and Richard Pancost for comments on this manuscript.
Guest Associate Editor—R.D. Pancost

References
Aller, R.C. , 1994. Bioturbat ion and remineralization of sedimentary organic matter: effects of redox oscillation. Chemical Geology 114, 331-345.
Bernasconi, S.M., Barbieri, A., Simona, M., 1997. Ca rbon and nitrogen isotope variations in sedimenting organic matter in Lake Lugano. Limnology and Oceanography 42, 1755-1765.
Bidigare, R.R. , Fluegge, A., Freeman, K.H. , Hanson , K.L. , Hayes, J .M., Hollander, D. , Jasper, J.P., King, L., Laws, J., Milder, J., Millero, F.J. , Pancost, R., Popp , B.N., Steinberg, P.A., Wakeham, S.G., 1997. Consistent fractionat ion of 13C in nature and in the laboratory: growth-rate effects in some haptophyte algae. Global Biogeochemical Cycles 11 (2), 279-292.
Bischoff, J.L., Fitzpatrick, J.A., 1991. U-series dating of impure carbonates: an isochron technique using total-sample dissolution. Geochimica et Cosmochimica Acta 55, 543-554.
Bordovskiy, O.K., 1965. Accumulat ion and transformation of organic substances in marine sediments. Mar ine Geology 3, 3-114.
Bourbonniere, R.A., Meyers, P.A., 1996. Sedimentary geolipid records of historical changes in the watersheds and productivities of Lakes Ontar io and Erie. Limnology and Oceanography 41 , 352-359.
Blumer, M. , Guillard, R.R.L. , Chase, T., 1971. Hydrocarbons of marine plankton. Mar ine Biology 8, 183-189.
Canada , P., 1984. Estudio hidrogeologico preliminar y de drenaje de las explotaciones a cielo abierto de lignito de Arenas del Rey y de turba de Padul. M. thesis, G r a n a d a University, p. 189.
Cranwell, P.A., 1973. Chain-length distribution of «-alkanes from lake sediments in relation to postglacial environmental change. Freshwater Biology 3, 259-265.
Cranwell, P.A., 1984. Lipid geochemistry of sediments from U p t o n Broad, a small productive lake. Organic Geochemistry 7, 25-37.
Cranwell, P.A., Eglinton, G., Robinson, N . , 1987. Lipids of aquatic organisms as potential constributors to lacustrine sediments-II. Organic Geochemistry 11, 513-527.
Dean, W.E. , Stuiver, M. , 1993. Stable carbon and oxigen isotope studies of the sediments of Elk Lake, Minnesota. In: Bradbury, J.P., Dean, W.E. (Eds.), Elk Lake, Minnesota: Evidence for Rap id Climate Change in the Nor th-Centra l United States, 276. Geological Society of America Special Paper, pp. 63-180.
Eglinton, G., Hamil ton, R.J., 1963. The distribution of n-alkanes. In: Swain, T. (Ed.), Chemical Plant Taxonomy. Academic Press, pp. 87-217.
Eglinton, G., Hamil ton, R.J., 1967. Leaf epicuticular waxes. Science 156, 1322-1335.
Eglinton and Calvin, M., 1967. Chemical fossils. Scientific American 216, 32^13.
Ertel, J.R., Hedges, J.I., 1985. Sources of sedimentary humic substances: vascular plant debris. Geochimica et Cosmochimica Acta 49, 2097-2107.
Espie, G.S., Miller, G.A., Kandasamy, R.A., Cavin, D.T. , 1991. Active H C O ^ t ranspor t in cyanobacteria. Canadian Journal of Botany 69, 936-944.
Farquhar , G .D. , O'Leary, M.H. , Berry, J.A., 1982. On the relationship between carbon isotope discrimination and the
intercellular carbon dioxide concentrat ion in leaves. Australian Journal of Plant Physiology 9, 121-137.
Ficken, K.J. , Barber, K.E. , Eglinton, G., 1998a. Lipid bio-marker , <S 1 3 C and plant macrofossil stratigraphy of a Scottish mon tane peat bog over the last two millennia. Organic Geochemistry 28, 217-237.
Ficken, K.J. , Street-Perrott, F.A. , Perrott , R.A., Swain, D.L. , Olago, D.O. , Eglinton, G., 1998b. Glacial/interglacial variations in carbon cycling revealed by molecular and isotope stratigraphy of Lake Nkunga , Mt . Kenya, East Africa. Organic Geochemistry 29, 1701-1719.
Ficken, K.J. , Li, B., Swain, D.L. , Eglinton, G., 2000. A n n-alkane proxy for the sedimentary input of submerged/ floating freshwater aquatic macrophytes. Organic Geochemistry 31 , 745-749.
Filley, T.R., Freeman, K.H. , Bianchi, T.S., Baskaran, M. , Colarusso, L.A., Hatcher , P.G., 2001. A n isotopic biogeochemical assessment of shifts in organic mat ter input to Holocene sediments from M u d Lake, Florida. Organic Geochemistry 32, 1153-1167.
Florschutz, F . , Menendez Amor , J., Wijmstra, T.A., 1971. Palinology of a thick Quaternary succession in southern Spain. Palaeogeography, Palaeoclimatology, Palaeoecology 10, 233-264.
Galimov, E.M., 1985. The biological fractionation of isotopes. Academic Press, Or lando.
Gelpi, E., Scheider, H., M a n n , J., Oro, J., 1970. Hydrocarbons of geochemical significance in microscopic algae. Phyto-chemistry 9, 603-612.
Goericke, J.P., Montoya , J.P., Fry, B., 1994. Physiology of isotopic fractionation in algae and cyanobacteria. In: Lajtha, K., Michener, R .H . (Eds.), Stable Isotopes in Ecology and Environmental Science. Blackwell, Oxford, pp. 187-221.
Goodfriend, G.A., 1991. Patterns of racemization and epime-rization of amino acids in land snail shells over the course of the Holocene. Geochimica et Cosmochimica Acta 55, 2 9 3 -302.
Goodfriend, G.A., Meyer, V., 1991. A Comparat ive study of the kinetics of amino acid racemization/epimerization in fossil and modern mollusc shells. Geochimica et Cosmochimica Acta 55, 3355-3367.
Grimalt , J.O., Albaiges, J., 1987. Sources and occurrence of C 1 2 - C 2 2 «-alkane distributions with even carbon-number preference in sedimentary environments. Geochimica et Cosmochimica Acta 51, 1379-1384.
Hakansson, S., 1985. A review of various factors influencing the stable carbon isotope ratio of organic lake sediments by the change from glacial to post-glacial environmental conditions. Quaternary Science Reviews 4, 135-146.
Han , J., Calvin, M. , 1969. Hydrocarbon distribution of algae and bacteria and microbiological activity in sediments. Proceedings of the Nat ional Academy of Science, U S A 64, 436^143.
Han , J., CmcCar thy, E.D. , Van Hoeven, W., Calvin, M. , Bradley, W.H. , 1980. Organic Geochemical studies II: a preliminary report on the distribution of aliphatic hydrocarbons in algae, in bacteria, and in recent lake sediment. Proceedings of the Nat ional Academy of Science, U S A 59, 29-37.

Hassan, K .M. , Swinehart, J.B., Spalding, R .F . , 1997. Evidence for Holocene environmental change from C/N ratios and <S 1 3 N and values in Swan Lake sediments, western Sand Hills, Nebraska . Journal of Paleolimnology 18, 121-130.
Hayes, J .M., 1993. Fac tors controlling 1 3 C contents of sedimentary organic compounds: principles and evidence. Mar ine Geology 113, 111-125.
Hedges, J.I., Prahl, F .G. , 1993. Early diagenesis: consequences for applications of molecular biomarkers. In: Engel, M.H. , Macko , S.A. (Eds.), Organic Geochemistry. Principles and Applications. Plenum Press, New York , pp. 237-253.
Hedges, J.I., Clark, W.A., Quay, P.D. , Richey, J.E., Devi, U., De Santos, U., 1986. Composit ions and fluxes of particulate organic material in the A m a z o n River. Limnology and Oceanography 31 , 717-738.
Hillaire-Marcel, C , Aucour , A.M. , Bonnefille, R., Riolet, A., Vicens, A., Williamson, D. , 1989. 1 3 C/palynological evidence of differential residence times of organic carbon prior to its sedimentation in East African rift lakes and peat bogs. Quaternary Science Reviews 8, 207-212.
Hodell , D.A., Schelske, C.L., 1998. Production, sedimentation, and isotopic composition of organic mat ter in Lake Ontar io . Limnology and Oceanography 43, 200-214.
Hodell , D.A., Schelske, C.L., Fahnenstiel , G.L., Robbins , L.L., 1998. Biologically induced calcite and its isotopic composition in Lake Ontar io. Limnology and Oceanography 43, 187-199.
Hollander, D.J., Mckenzie, J.A., 1991. C O z control on carbon-isotope fractioation during aqueous photosynthesis: a pa l eo - / ;C0 2 barometer. Geology 19, 929-932.
Huang , Y., Street-Perrott, F.A. , Perrott , R.A., Metzger, P., Eglinton, G., 1999. Glacial-interglacial environmental changes inferred from molecular and compound-specific <S 1 3 C analyses of sediments from Sacred Lake, Mt. Kenya. Geochimica et Cosmochimica Acta 63, 1383-1404.
Hunt , J .M., 1979. Petroleum Geochemistry and Geology. Freeman, San Francisco.
Kaushal , S., Bindford, M.W. , 1999. Relationship between C:N ratios of lake sediments, organic mat ter sources, and historical deforestation of Lake Pleasant, Massachusetts , USA. Journal of Paleolimnology 22, 439^142.
Keely, J.E., Sandsquist, D.R. , 1992. Carbon: freshwater plants. Plant and Cell Environment 15, 1021-1035.
Laws, E.A., Popp , B.N., Bidigare, R.R. , Kennicutt , M.C. , Macko , S.A., 1995. Dependence of phytoplankton carbon isotopic composition on growth rate and ( C 0 2 ) a q : Theoretical considerations and experimental results. Geochimica et Cosmochimica Acta 59 (6), 1131-1138.
Laws, E.A., Bidigare, R.R. , Popp , B.N., 1997. Effect of growth rate and C O z concentrat ion on carbon isotopic fractionation by the marine d ia tom Phaeodactylum tricornutum. Limnology and Oceanography 42 (7), 1552-1560.
Laws, E.A., Thompson , P.A., Popp , B.N., Bidigare, R.R. , 1998. Sources of inorganic carbon for marine microalgal photosynthesis: a reassessment of <S 1 3 C data from batch culture studies of Thalassiosira pseudonana and Emiliana huxleyi. Limnology and Oceanography 43 (1), 136-142.
Lehtonen, K., Ketola, M. , 1993. Solvent-extractable lipids of Sphagnum, Carex, Bryales, and Carex Bryales peats: content and compositional features vs. peat humification. Organic Geochemistry 15, 275-280.
Lucini, M. , Torres, T., Llamas, J .F. , Canoira , L., Ortiz, J.E., Garcia de la Morena , M.A., 2000. Geoquimica organica de las lutitas lacustres de las cuencas cenozoicas del Duero y Ebro . Geogaceta 28, 93-96.
Mckenzie, J.A., 1985. Ca rbon isotopes and productivity in the lacustrine and marine environments. In: Stumm, W. (Ed.), Chemical Processes in Lakes. Wiley, New York , pp. 99-118.
Menendez Amor , J., Florschiitz, F . , 1962. U n aspect de la vegetation en Espagne meridionale duran t la derniere glaciation et l 'Holocene. Geologie en Mijnbouw 41 , 1 3 1 -134.
Menendez Amor , J., Florschiitz, F . , 1964. Results of the preliminary palynological investigation of samples from a 50 m boring in southern Spain. Boletin de la Real Sociedad Espanola de Historia Natura l (Geologia) 62, 251-255.
Meyers, P.A., 1990. Impacts of regional Late quaternary climate changes on the deposition of sedimentary organic mat ter in Walker Lake Nevada. Palaeogeography, Palaeo-climatology, Palaeoecology 78, 229-240.
Meyers, P.A., 1994. Preservation of elemental and isotopic source identification of sedimentary organic matter . Chemical Geology 144, 289-302.
Meyers, P.A., 2003. Applications of organic geochemistry to paleolimnological reconstructions: a summary of examples from the Laurent ian Grea t Lakes. Organic Geochemistry 34, 261-289.
Meyers, P.A., Lallier-Verges, E., 1999. Lacustrine sedimentary organic matter records of Late Quaternary paleoclimates. Journal of Paleolimnology 21 , 345-372.
Meyers, P.A., Edwards , S.J., Eadie, B.J., 1980. Fa t ty acids and hydrocarbon content of settling sediments in Lake Michigan. Journal of Grea t Lakes Research 6, 331-337.
Meyers, P.A., Leenheer, M.J. , Bourbonniere, R.A., 1995. Diagenesis of vascular plant organic matter components during burial in lake sediments. Aquat ic Geochemistry 1, 35-42.
Miiller, A., Mathesius, U. , 1999. The palaeoenvironments of coastal lagoons in the southern Baltic Sea. The application of sedimentary C o r g / N ratios as source indicators of organic matter . Palaeogeography, Palaeoclimatology, Palaeoecology 145, 1-16.
Nestares, T., Torres, T., 1998. U n nuevo sondeo de investiga t ion paleoambiental del Pleistoceno y Holoceno en la turbera de Padul (Granada , Andalucia). Geogaceta 23, 9 9 -102.
Ogura, K., Machilara, T., Takada , H., 1990. Diagenesis of biomarkers in Biwa lake sediments over 1 million years. Organic Geochemistry 16, 805-813.
O'Leary, M.H. , 1981. Ca rbon isotopic fractionation in plants. Phytochemistry 20, 553-567.
O'Leary, M.H. , 1988. Ca rbon isotopes in photosynthesis. Fract ionat ion techniques may reveal new aspects of carbon dynamic in plants. Bioscience 38, 328-329.
Ortiz, J.E., Torres, T., Llamas, F.J. , 2002. Cross-calibration of the racemization rates of leucine and phenylalanine and epimerization rates of isoleucine between ostracodes and gastropods over the Pleistocene in southern Spain. Organic Geochemistry 33, 691-699.
Ortiz, J.E., Torres, T., Julia, R., Delgado, A., Llamas, F.J., Soler, V., Delgado, J., 2004. Numerical dating algorithms of amino acid racemization ratios from continental ostracodes.
Application to the Guadix-Baza Basin (southern Spain). Quaternary Science Reviews 23 (5-6), 717-730.
Pocock, S.A.J., 1982. Identification and recording of particulate sedimentary organic matter . H o w to asses matura t ion and paleotemperatures?. Social and Economic Paleontologist Mineral . Short Course 7, 13-131.
Pons, A., Reille, M., 1988. The Holocene and upper Pleistocene pollen record from Padul (Granada , Spain): a new study. Palaeogeography, Palaeoclimatology, Palaeoecology 66, 243-263.
Popp , B.N., Parekh, P., Tilbrook, B., Bidigare, R.R. , Laws, E.A., 1997a. Organic carbon <S 1 3 C variations in sedimentary rocks as chemostratigraphic and paleoenvironmental tools. Palaeogeography, Palaeoclimatology, Palaeoecology 132, 119-132.
Popp , B.N., Laws, E.A., Bidigare, R.R. , Dore , J.E., Hanson , S.G., Wakeham, S.G., 1997b. Effect of phytoplankton cell geometry on carbon isotopic fractionation. Geochimica et Cosmochimica Acta 62, 69-77.
Prahl, F .G. , Carpenter, R., 1984. Hydrocarbons in Washington coastal sediments. Estuarine and Coastal Shelf Science 18, 703-720.
Prahl, F .G. , Bennett, J.T., Carpenter , R., 1980. The early diagenesis of aliphatic hydrocarbons and organic matter in sedimentary particulates from D a b o b Bay, Washington. Geochimica et Cosmochimica Acta 44, 1967-1976.
Rieley, G., Collier, R.J., Jones, D .M. , Eglinton, G., 1991. The biogeochemistry of Ellesmere Lake, U .K. I: source correlation of leaf wax inputs to the sedimentary record. Organic Geochemistry 17, 901-912.
Rosenbauer , 1991. U D A T E 1 : a computer program for the calculation of uranium-series isotopic ages. Computers and Geosciences 17 (1), 45-75.
Sharkey, T.D. , Berry, J.A., 1985. Ca rbon isotope fractionation of algae as influenced by an inducible C 0 2 concentrating mechanism. In: Lucas, W.J. , Berry, J.A. (Eds.), Inorganic Carbon Up take by Aquat ic Pho to synthetic Organisms. American Society of Plant Physiology, pp. 389-401.
Silliman, J.E., Meyers, P.A., Bourbonniere, R.A., 1996. Record of postglacial organic mat ter delivery and burial in sediments of Lake Ontar io . Organic Geochemistry 24, 463-472.
Sirkin, L., 1978. Peat-bog deposits. In: Fairbridge, R.W., Burgeois, J. (Eds.), The Encyclopedia of Sedimentology, Encyclopedia of Ear th Science Series, vol. VI. Dowden, Hutchinson and Ross Inc, Stroudsburg, PA, pp. 541-543.
Street-Perrott, F.A. , 1994. Palaeoperspectives-changes in terrestrial ecosystems. Ambio 23, 37-43 (Special IGB P issue).
Stuiver, M. , Reimer, P.J., 1993. Extended 14C database and revised CALIB radiocarbon calibration program. Radiocarbon 35, 215-230.
Talbot, M.R. , 1988. The origins of lacustrine oil source rocks: evidence from the lakes of tropical Africa. In: Fleet, A.J.,
Kelts, M.R. , Talbot, M.R . (Eds.), Lacustrine Petroleum Source Rocks, 40. Geological Society of London , Special Publication, pp. 29^13.
Talbot, M.R. , Livingstone, D.A., 1989. Hydrogen index and carbon isotopes of lacustrine organic mat ter as lake level indicators. Palaeogeography, Palaeoclimatology, Palaeoecology 70, 121-137.
Talbot, M.R. , Johannessen, T., 1992. A high resolution palaeoclimatic record for the last 27,500 years in tropical West Africa from the carbon and nitrogen isotopic composition of lacustrine organic matter . Ear th and Planetary Science Letters 110, 23-37.
Tenzer, G.E. , Meyers, P.A., Robbins , J.A., Eadie, B.J., Morehead, N .R . , Lansing, M.B. , 1999. Sedimentary organic matter record of recent environmental changes in the St. Marys River ecosystem. Michigan-Ontario Border 30 (2/3), 133-146.
Thornton , S.F., M c M a n u s , J., 1994. Applicat ion of organic carbon and nitrogen stable isotope and C/N ratios as source indicators of organic matter provenance in estuarine systems: evidence from the Tay Estuary, Scotland. Estuarine Coastal Shelf Science 38, 219-233.
Tieszen, L.L., Senyimba, M.M. , Imbamba, S.K., Troughton, J.H., 1979. The distribution of C 3 and C 4 grasses and carbon isotope discrimination along an altitudinal and moisture gradient in Kenya. Oecologia 37, 337-350.
Tissot, B.P., Welte, D.H. , 1984. Petroleum Format ion and Occurrence. Springer, Berlin.
Torres, T., Llamas, J., Canoira , L., Coello, F.J. , Garcia-Alonso, P., Ortiz, J.E., 2000. Aminostrat igraphy of two Pleistocene marine sequences from the Medi terranean Coast of Spain: Cabo de Huer tas (Alicante) and Gar rucha (Almeria). In: Goodfriend, G.A., Collins, M.J. , Fogel, S.A., Macko , S.A., Wehmiller, J .F . (Eds.), Perspectives in Amino Acids and Protein Geochemistry. Oxford University Press, New York , pp. 263-278.
Tyson, R.V., 1995. Sedimentary Organic Matter : Organic Facies and Palynofacies. C h a p m a n and Hall, London .
Valle, M. , Rivas, M.R. , Lucini, M. , Ortiz, J.E., Torres, T., in press. In terpreta t ion paleoecologica y paleoclimatica del t ramo superior de la turbera de Padul (Granada , Espafia) a partir de datos palinologicos. Review of Paleobotany and Palynology.
Viso, A.C. , Pesando, D. , Bernard, P., Mar ty , J.C., 1993. Lipids components of the Mediterranean seagrass Posidonea Oceanica. Phytochemistry 34, 381-387.
Vogel, J.C., Kronfeld, J., 1980. A new method for dating peat. South African Journal of Science 76, 557-558.
Xie, S., Lai, X., Yi, Y., Gu , Y., Liu, Y., Wang, X., Liu, G., Liang, B., 2003. Molecular fossils in a Pleistocene river terrace in southern China related to paleoclimate variation. Organic Geochemistry 34, 789-797.