the oxygen isotopic composition of phytolith assemblages from tropical rainforest soil tops...
TRANSCRIPT

Clim. Past, 8, 307–324, 2012www.clim-past.net/8/307/2012/doi:10.5194/cp-8-307-2012© Author(s) 2012. CC Attribution 3.0 License.
Climateof the Past
The oxygen isotopic composition of phytolith assemblages fromtropical rainforest soil tops (Queensland, Australia):validation of a new paleoenvironmental tool
A. Alexandre1, J. Crespin1, F. Sylvestre1, C. Sonzogni1, and D. W. Hilbert 1,2
1CEREGE, UMR7330, Aix-Marseille Universite, CNRS, IRD, Europole de l’Arbois, BP80, 13545 Aix en Provence,Cedex 04, France2CSIRO Ecosystem Sciences, Tropical Forest Research Centre, P.O. Box 780, Atherton, QLD 4883, Australia
Correspondence to:A. Alexandre ([email protected])
Received: 21 April 2011 – Published in Clim. Past Discuss.: 27 May 2011Revised: 28 October 2011 – Accepted: 9 January 2012 – Published: 22 February 2012
Abstract. Phytoliths are micrometric particles of amorphoussilica that form inside or between the cells of higher planttissues throughout the life of a plant. With plant decay,phytoliths are either incorporated into soils or exported tosediments via regional watersheds. Phytolith morpholog-ical assemblages are increasingly used as proxy of grass-land diversity and tree cover density in inter-tropical areas.Here, we investigate whether, along altitudinal gradients innortheast Queensland (Australia), changes in theδ18O sig-nature of soil top phytolith assemblages reflect changes inmean annual temperature (MAT) and in the oxygen iso-topic composition of precipitation (δ18Oprecipitation), as pre-dicted by equilibrium temperature coefficients previouslypublished for silica. Oxygen isotopic analyses were per-formed on 16 phytolith samples, after controlled isotopicexchange (CIE), using the IR Laser-Heating FluorinationTechnique. Long-term mean annual precipitation (MAP)and MAT values at the sampled sites were calculated bythe ANUCLIM software. δ18Oprecipitation estimates werecalculated using the Bowen and Wilkinson (2002) model,slightly modified. An empirical temperature-dependantrelationship was obtained: 118Owood phytolith-precipitation(‰ vs. VSMOW) =−0.4 (±0.2)t (◦C) + 46 (±3) (R2 = 0.4,p < 0.05;n = 12). Despite the various unknowns introducedwhen estimatingδ18Oprecipitationvalues and the large uncer-tainties onδ18Owood phytolith values, the temperature coef-ficient (−0.4± 0.2 ‰◦C−1) is in the range of values pre-viously obtained for natural quartz, fresh and sedimentary
diatoms and harvested grass phytoliths (from−0.2 to−0.5 ‰◦C−1). The consistency supports the reliability ofδ18Owood phytolithsignatures for recording relative changes inmean annualδ18Osoil water values (which are assumed to beequivalent to the weighted annualδ18Oprecipitation values inrainforests environments) and MAT, provided these changeswere several ‰ and/or several◦C in magnitude.
1 Introduction
Phytoliths are micrometric particles (<60–100 µm of diame-ter) of amorphous silica that form within a matter of hours todays (Perry et al., 1987) inside or between the cells of higherplant tissues throughout the life of a plant. With plant de-cay, phytoliths are either incorporated into soils or exportedto sediments via regional watersheds. Phytolith morpholog-ical assemblages are increasingly used as proxy of grass-land diversity and tree cover density in inter-tropical areas(e.g. Alexandre et al., 1998; Boyd et al., 2005; Bremond etal., 2005a,b, 2008a,b Piperno, 2006; Lentfer and Torrence,2007; Neuman et al., 2009). In parallel, pioneering stud-ies of the oxygen isotope composition (δ18O) of phytolithshave demonstrated that in non-transpiring grass stem tissues,the equilibrium fractionation between water and phytolith istemperature-dependent (Shahack-Gross et al., 1996; Webband Longstaffe, 2000, 2002, 2003, 2006). The obtainedtemperature coefficient is−0.33 ‰◦C−1 (recalculated from
Published by Copernicus Publications on behalf of the European Geosciences Union.
308 A. Alexandre et al.: The oxygen isotopic composition of phytolith assemblages from tropical rainforest soil tops
Shahack-Gross et al., 1996), in the−0.2 to −0.5 ‰◦C−1
range of temperature coefficients previously measured forbiogenic silica (diatom frustules) and quartz (Clayton et al.,1972; Matsuhisa et al., 1979; Juillet-Leclerc and Labeyrie,1987; Shemesh et al., 1992; Sharp and Kirschner, 1994;Brandriss et al., 1998; Moshen et al., 2005; Dodd and Sharp,2010; Crespin et al., 2010). Those studies also evidenced thatin transpiring tissues,18O enrichment of sap water increaseswith the inverse of relative humidity, which limits the use oftheδ18O signature of phytoliths from grass leaves as a func-tion of temperature and the isotopic composition of soil wa-ter (δ18Osoil water) (Webb and Longstaffe, 2000, 2002, 2003,2006). These calibration studies, although extremely use-ful for our understanding of the temperature and soil-waterδ18O signals carried by phytoliths, have not lead to paleoen-vironmental reconstructions due to the fact that phytolithsfrom both transpiring and non-transpiring grass tissues arenot morphologically distinguishable.
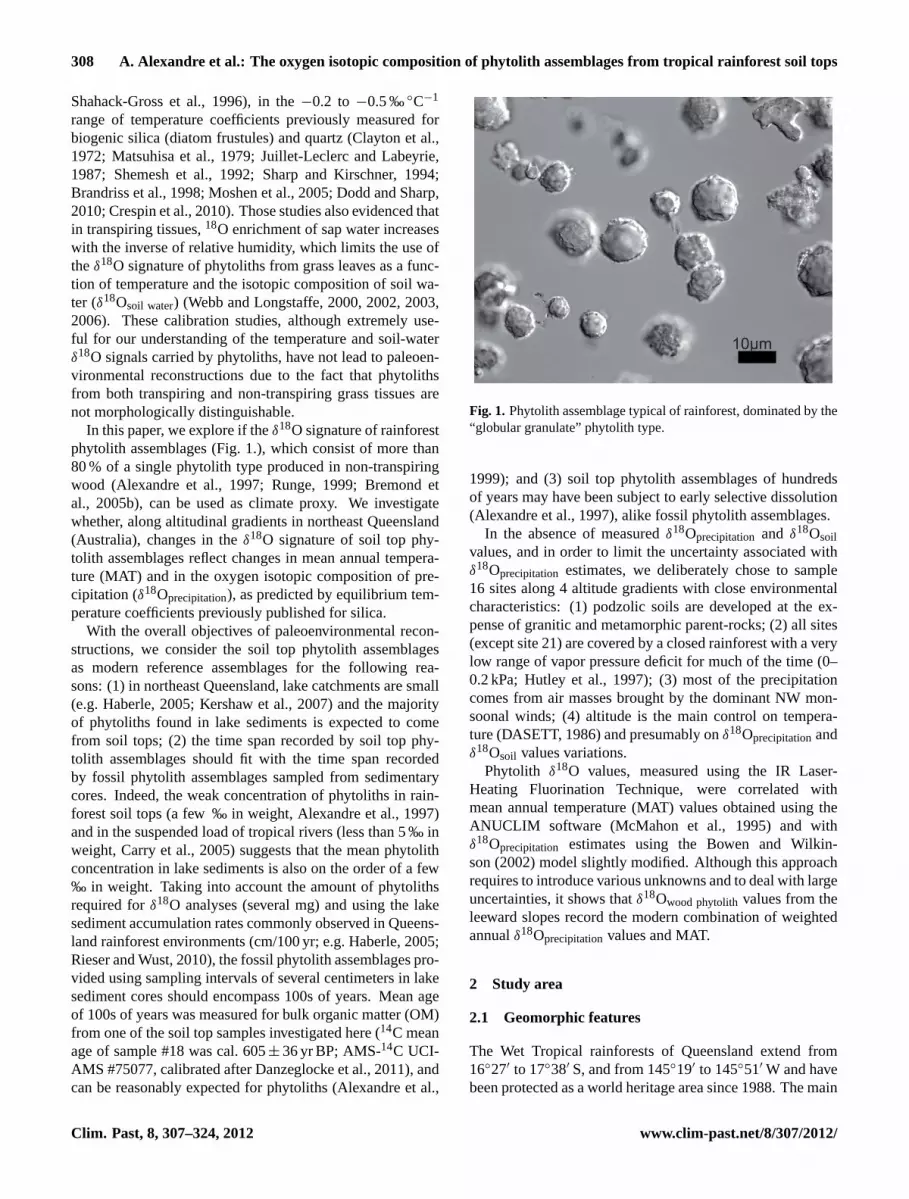
In this paper, we explore if theδ18O signature of rainforestphytolith assemblages (Fig. 1.), which consist of more than80 % of a single phytolith type produced in non-transpiringwood (Alexandre et al., 1997; Runge, 1999; Bremond etal., 2005b), can be used as climate proxy. We investigatewhether, along altitudinal gradients in northeast Queensland(Australia), changes in theδ18O signature of soil top phy-tolith assemblages reflect changes in mean annual tempera-ture (MAT) and in the oxygen isotopic composition of pre-cipitation (δ18Oprecipitation), as predicted by equilibrium tem-perature coefficients previously published for silica.
With the overall objectives of paleoenvironmental recon-structions, we consider the soil top phytolith assemblagesas modern reference assemblages for the following rea-sons: (1) in northeast Queensland, lake catchments are small(e.g. Haberle, 2005; Kershaw et al., 2007) and the majorityof phytoliths found in lake sediments is expected to comefrom soil tops; (2) the time span recorded by soil top phy-tolith assemblages should fit with the time span recordedby fossil phytolith assemblages sampled from sedimentarycores. Indeed, the weak concentration of phytoliths in rain-forest soil tops (a few ‰ in weight, Alexandre et al., 1997)and in the suspended load of tropical rivers (less than 5 ‰ inweight, Carry et al., 2005) suggests that the mean phytolithconcentration in lake sediments is also on the order of a few‰ in weight. Taking into account the amount of phytolithsrequired forδ18O analyses (several mg) and using the lakesediment accumulation rates commonly observed in Queens-land rainforest environments (cm/100 yr; e.g. Haberle, 2005;Rieser and Wust, 2010), the fossil phytolith assemblages pro-vided using sampling intervals of several centimeters in lakesediment cores should encompass 100s of years. Mean ageof 100s of years was measured for bulk organic matter (OM)from one of the soil top samples investigated here (14C meanage of sample #18 was cal. 605± 36 yr BP; AMS-14C UCI-AMS #75077, calibrated after Danzeglocke et al., 2011), andcan be reasonably expected for phytoliths (Alexandre et al.,
10µm
Figure 1
Fig. 1. Phytolith assemblage typical of rainforest, dominated by the“globular granulate” phytolith type.
1999); and (3) soil top phytolith assemblages of hundredsof years may have been subject to early selective dissolution(Alexandre et al., 1997), alike fossil phytolith assemblages.
In the absence of measuredδ18Oprecipitation and δ18Osoilvalues, and in order to limit the uncertainty associated withδ18Oprecipitation estimates, we deliberately chose to sample16 sites along 4 altitude gradients with close environmentalcharacteristics: (1) podzolic soils are developed at the ex-pense of granitic and metamorphic parent-rocks; (2) all sites(except site 21) are covered by a closed rainforest with a verylow range of vapor pressure deficit for much of the time (0–0.2 kPa; Hutley et al., 1997); (3) most of the precipitationcomes from air masses brought by the dominant NW mon-soonal winds; (4) altitude is the main control on tempera-ture (DASETT, 1986) and presumably onδ18Oprecipitationandδ18Osoil values variations.
Phytolith δ18O values, measured using the IR Laser-Heating Fluorination Technique, were correlated withmean annual temperature (MAT) values obtained using theANUCLIM software (McMahon et al., 1995) and withδ18Oprecipitation estimates using the Bowen and Wilkin-son (2002) model slightly modified. Although this approachrequires to introduce various unknowns and to deal with largeuncertainties, it shows thatδ18Owood phytolithvalues from theleeward slopes record the modern combination of weightedannualδ18Oprecipitationvalues and MAT.
2 Study area
2.1 Geomorphic features
The Wet Tropical rainforests of Queensland extend from16◦27′ to 17◦38′ S, and from 145◦19′ to 145◦51′ W and havebeen protected as a world heritage area since 1988. The main
Clim. Past, 8, 307–324, 2012 www.clim-past.net/8/307/2012/

A. Alexandre et al.: The oxygen isotopic composition of phytolith assemblages from tropical rainforest soil tops 309
Table 1. Location of the sampled sites and associated climate parameters provided by the ANUCLIM software (D. coast: distance fromthe coast; Alt: altitude; Max Alt: mean maximum altitude crossed by air masses; MAT: mean annual temperature; MAP: mean annualprecipitation; H: relative humidity). Rainforest types from Tracey (1982).δ18Oprecipitationvalues are estimated from Eqs. (7) and (8) slightlymodified after Bowen and Wilkinson (2002).
Sample Transect Latitude S Longitude E D. coast Alt Max Alt MAT Error∗ MAP Error∗ H Rainforest δ18Oprecipitation Uncertainty∗
# DD DD m (m a.s.l.) (m a.s.l.) (◦C) (◦C) (mm) (mm) (%) type (‰ vs. V-SMOW)
9 Bartle frere 17.28 145.62 70 770 1600 19.8 0.2 1832 275 82 1 −8.97 0.838 Bartle frere 17.38 145.79 40 1113 1600 17.9 0.2 4082 612 100 8/9 −7.86 1.036 Bartle frere 17.38 145.79 40 1222 1600 17.4 0.2 4603 690 100 8/9 −7.64 1.135 Bartle frere 17.38 145.80 40 1283 1600 17 0.2 4942 741 100 8/9 −7.52 1.2
21 Palmerston 17.57 145.83 30 190 190 22.7 0.2 3333 500 92 24 −3.67 0.024 Palmerston 17.61 145.77 30 405 405 21.7 0.2 3154 473 94 1/2 −4.48 0.119 Palmerston 17.59 145.62 40 810 810 19.6 0.2 2516 377 92 5a −5.30 0.218 Palmerston 17.53 145.58 40 950 950 19 0.2 2281 342 91 5a −5.58 0.317 Palmerston 17.52 145.57 40 1050 1050 18.2 0.2 2583 387 95 24 −5.78 0.3
16 Mt. Edith 17.13 145.63 70 670 1500 20.4 0.2 1569 235 72 1 −8.01 0.615 Mt. Edith 17.11 145.62 70 750 1500 20 0.2 1700 255 78 8/9 −8.17 0.614 Mt. Edith 17.11 145.62 70 840 1500 19.5 0.2 1941 291 82 8/9 −8.35 0.711 Mt. Edith 17.09 145.62 70 1150 1500 18 0.2 3083 462 96 8/9 −8.97 0.8
28 N. Cairns 16.47 145.33 30 70 70 24.1 0.2 2040 306 67 1/2 −3.68 0.029 N. Cairns 16.52 145.39 30 210 210 23.2 0.2 1758 264 65 16g −4.10 0.133 N. Cairns 16.81 145.49 30 600 600 22.1 0.2 1500 225 71 1b −4.88 0.2
∗ Calculations detailed in Sect. 4.5.
distribution of rainforests in northern Queensland straddlesthree geologic and geomorphic regions that are NW-SE orN-S oriented (Fig. 2a and b): the basaltic tablelands, withan average altitude of 760 m a.s.l. on the west; the alluvial,granitic, and metamorphic lower coastal belt (0–900 m a.s.l.)on the east that includes a coastal plain and a coastal range;and the intermediate granitic and metamorphic eastern high-lands with isolated peaks up to 1545 m a.s.l. (Mt. BelledenKer) and 1622 m a.s.l. (Mt. Bartle Frere). The eastern high-lands and the tablelands belong to the Great Dividing Range.Red or yellow loams, red podzolic soils, xanthozems, andkrasnozems were developed throughout the weathering ofmetamorphic rocks, granite, and basalts.
2.2 Climate features
The region is located at the southern limit of an area thatis influenced by the Australian Summer Monsoon (ASM).The climate pattern is controlled by the position of the In-tertropical Convergence zone (ITCZ) and the monsoon circu-lation. Over 80 % of mean annual precipitation falls duringthe November–March interval, supplied by NW monsoonalwinds during the earlier phase of the ASM, by S-E tradewinds during the later phase of the ASM (Godfred-Spenningand Reason, 2002) and by occasional cyclones. In the NW-SE oriented eastern highlands, there is a very pronouncedorographic influence with higher precipitation averages cen-tred around the highest peaks and their eastern slopes, wind-ward to the moist prevailing SE airstream. Mean annual pre-cipitation reaches 4000 mm yr−1 along the coast, increasingwith elevation to reach 11000 mm yr−1 at Mt. Bartle Frere,and falls dramatically inland (1200 mm yr−1 on the western
Tableland) (Fig. 2c). At higher ranges (from 1000 m a.s.l.),fog and orographic cloud layers shroud the summits of themountains and maintain moist conditions throughout theyear. Fog deposition accounts for approximately 40 % ofthe water reaching the forest floor (Hutley et al., 1997).The amount of water derived from the canopy interception,also called “cloud stripping” by these high-altitude “cloud-forests”, can account for 66 % of precipitation during the dryseason (McJannet et al., 2007a,b). Coastal humidity aver-ages 78 % in the summer but often reaches values higher than90 %. Mean annual temperature (MAT) exceeds 24◦C alongthe coast and falls to below 21◦C on the tableland, and tobelow 17◦C in the highest ranges (DASETT, 1987; Mossand Kershaw, 2000; Godfred-Spenning and Reason, 2002;Robertson et al., 2005).
2.3 Vegetation features
Rainforests of the wet tropics of Queensland are classi-fied into 27 structural categories that contain more than3000 plant species from 210 families (Tracey, 1982; Webband Tracey, 1994). Soils were sampled from areas that sup-port seven rainforest categories (Table 1), numbered and de-scribed by Tracey (1982) as follows: Type 16g (medium andlow woodlands) occurs in wet and moist zones on metamor-phic foothills. Canopies average 15–20 m. Eucalyptus andAcacia species are common. The ground layer is rich ingrasses (e.g.Imperata cylindrica). Type 1 (complex meso-phyll vine forests) occurs on the highly fertile basaltic andalluvial soils on the tropical humid lowlands. The canopylevel reaches 20–40 m. Most of the trees are evergreens.Woody lianes, vascular epiphytes, tree palms, and fleshy
www.clim-past.net/8/307/2012/ Clim. Past, 8, 307–324, 2012

310 A. Alexandre et al.: The oxygen isotopic composition of phytolith assemblages from tropical rainforest soil tops
Bartle Frere South Peak
Cairns
145°30’ E
145°30’ E
17°3
0’ S
17°0
0’ S
16°3
0’ S
146°00’ E
Malanda
Innisfail
Sth Johnston Riv.Nth Johnston Riv.
Russel Riv.
TABLELANDS
NorthernCairns Transect
G R E A T B A R R I E R R E E F
Mt EdithTransect
PalmerstonHighwayTransect
Bartle FrereTransect
146°00’ E
N
Lamb Range
BelendenKer Range
Baron Riv.
EASTERN H
IGH
LAN
DS
CO
AS
TAL
BE
LT
Walkamin
Tinaroo Lake
Mulgrave Riv.
Atherton
a
AUSTRALIA
Figure 2
Fig. 2. (a) Location of the rainforests area (in green) in the Wet Tropics of Queensland.(b) Altitude and(c) mean annual precipitation(MAP) maps generated by the ANUCLIM software (McMahon et al., 1995). Sampled transects and stations of Malanda and Walkamine forwhich measuredδ18Oprecipitationdata is available are positioned.
Clim. Past, 8, 307–324, 2012 www.clim-past.net/8/307/2012/

A. Alexandre et al.: The oxygen isotopic composition of phytolith assemblages from tropical rainforest soil tops 311
herbs with wide leaves (e.g. zingibers and aroids) are promi-nent. Type 2 (mesophyll vine forests) occurs on graniteand schist shallow soils of low to medium fertility, below400 m a.s.l. The canopy is 30 m high. The forest has a com-bination of structural features intermediate between thoseof complex mesophyll and simple notophyll types. Type 5(complex notophyll vine forests) occur on the tableland, onthe wet uplands and highlands, and on the basic volcanicsoils. The canopy is 20–45 m high. Robust woody lianesand epiphytes, aroids and zingibers are conspicuous lifeforms. Dense ground ferns, tree ferns, and palms are present(type 5a). Type 8 (simple notophyll vine forest) occurs be-tween 400 and 1000 m a.s.l. on granitic ranges. Canopy is23–33 m high. Tree palms are often locally common. Groundferns are abundant. Canopy is stunted and wind-sheared onexposed ridges, grading into type 9. Type 9 (simple micro-phyll vine-fern forest) occurs between 800 and 1300 m a.s.l.,on granite soils of the cloudy wet highlands. The canopyis 10–25 m high, and the trees are evergreens. Only two orthree layers are noticeable. Epiphytes are common. A denseground layer is characteristic and composed of ferns, palms,and herbs. Forests of this type are also called “cloud” or“wet montane” forests. Type 24 (cleared areas) is made ofcomplex mesophyll vine forest fragments, sugar-cane in thelowlands, and mixed farming in the uplands. Sampling wasperformed under the forest remnants.
3 Materials
Sixteen samples were collected from poorly drained pod-zolic soils developed at the expense of granitic and metamor-phic parent-rocks, along four altitudinal transects from 70 to1283 m a.s.l. (Table 1, Figs. 2 and 3). The sampling methodconsisted of collecting individual sub-samples of the upper2 cm of the soil humic horizon (litter excluded), at randomintervals, over an area of 5× 5 m. Sub-samples were mixedtogether.
Three transects where samples were collected are locatedin the eastern highlands, east Atherton, while the fourth tran-sect (Northern Cairns) is located on the coastal belt. The“Bartle Frere” transect is located on the North-Western slopeof Bartle Frere South Peak (1615 m a.s.l.), above RussellRiver oriented NW-SE when its upstream section crosses theupper rainforest area. All of the sampled points are leewardrelative to the dominant S-E trade winds. The “PalmerstonHighway” transect is located in the eastern section of theeastern highlands, above the Johnston River valley (NW-SE).The sites sampled are windward to the dominant S-E tradewinds. The “Mt. Edith” transect is located on the southernslope of Mount Edith (1149 m a.s.l.). The sampled sites arewindward, but the S-E trades first pass over the BellendenKer range (maximum altitude of 1545 m a.s.l., mean altitudeof 1100 m a.s.l.) before reaching the tablelands and flowingup to Mt. Edith. The “Northern Cairns” transect is located on
Bartle Frere Transect Bartle Frere South Peak
(1615 m)
35363738
N-W S-E
Palmerston Highway Transect N-W S-E
1718 19
24
21
Mt Edith (1149 m)11
Mt Edith Transect N S
14
1516
33
29
28
Northern CairnsTransect S-SE
9
N-NW
70 m210 m
600 m
840 m
750 m670 m
190 m
405 m
1050 m950 m 810 m
770 m
1283 m1222 m
1184 m1113 m
SE trade winds
Belleden Kerrange
SE trade winds
SEtrade winds
(1545 m)
Figure 3
SEtrade winds
Fig. 3. The four sampled transects: topography and location rela-tively to the dominant S-E trade winds. Numbers refer to the sam-pled sites (Table 1).
the coastal belt. The sampled points are windward (Fig. 3)relative to the dominant S-E trade winds.
Long term climate means at the sampling sites (Table 1)were obtained from regional, digital maps of bioclimaticvariables that were created using the ANUCLIM software(McMahon et al., 1995), which uses a Digital ElevationModel (DEM) and meteorological data from a large numberof stations over variable time periods (several decades) to es-timate the climate variables for each grid cell in the DEM(0.1 km2).
4 Methods
4.1 Phytolith chemical extraction
Phytoliths were extracted from 20 g of dry soil slightlycrushed and sieved at 2 mm, after which the following stepswere applied (Kelly, 1999; Crespin et al., 2008): (1) disso-lution of carbonates using HCl (1 N); (2) an iron oxide re-duction performed with trisodium citrate (C6H5Na3O7) at88.4 g l−1 and 1 g of sodium dithionite (Na2O4S2, H2O);
www.clim-past.net/8/307/2012/ Clim. Past, 8, 307–324, 2012

312 A. Alexandre et al.: The oxygen isotopic composition of phytolith assemblages from tropical rainforest soil tops
(3) the oxidation of organic matter performed using H2O2(30 %) until the reaction subsided; (4) a defloculation us-ing a sodium hexametaphosphate Na(PO3)6 (5 %) solutionbuffered at pH 7; (5) a sieving of the samples at 60 µm; (6) aclay removal by sedimentation and centrifugation; (7) a den-simetric separation of phytoliths carried out with a zinc bro-mide heavy liquid (ZnBr2) that had a density of 2.3; and(8) drying for at least 24 h. Steps 2 and 3 were carried outat 50◦C as previously recommended (Crespin et al., 2008).
4.2 Phytolith counting
The recovered fraction was mounted on microscope slidesin Canada Balsam, for counting at 600X magnification.More than 200 identifiable phytoliths with a diameter greaterthan 5 µm and with a taxonomic significance were countedper sample. Repeated counting gave an error of±3.5 %(SD). Phytoliths were classified following Twiss (1992),Mulholland (1989), Fredlund and Tieszen (1994), Kondo etal. (1994), Alexandre et al. (1997), Barboni et al. (1999),Runge (1999), and Bremond et al. (2008); and named us-ing the International Code for Phytolith Nomenclature 1.0(Madella et al., 2005). Phytolith types were categorized asfollows: (1) dicotyledon tree and shrub types mainly repre-sented by the Globular granulate type produced by the wood(Scurfield et al., 1974; Kondo et al., 1994); (2) a palm Globu-lar echinate type; (3) grass (poaceae) types comprising Acic-ular, Elongate echinate, bulliform cells, and short cells types;and (4) types without taxonomic significance (unclassified).Abundances of the classified phytolith categories were ex-pressed as a percentage of classified phytoliths, while theabundance of unclassified types was expressed as a percent-age of the sum of counted phytoliths (Table 2). Two to 60 µmsize particles of quartz, iron oxide and charcoal, as well aslarger thin remains of OM, were sometimes recovered andhence counted (Table 2). Samples with more than 15 % ofOM remains were re-oxidized.
4.3 δ18Osilica measurements
Phytoliths are hydrous silica particles that contain exchange-able oxygen mostly in hydroxyl groups (Labeyrie and Juillet,1982; Perry and Keeling-Tucker, 2000). In order to evalu-ate the amount of exchangeable oxygen, to fix the isotopiccomposition, and to calculate the isotopic composition ofnon-exchangeable oxygen (δ18Osilica) a controlled isotopicexchange procedure (CIE) was carried out. Two aliquotsof 1.6 mg of the same sample were exchanged with vaporfrom two waters of a known isotopic composition (Crespinet al., 2008). Oxygen extractions were then performedusing the IR Laser-Heating Fluorination Technique as de-scribed in Alexandre et al. (2006) and Crespin et al. (2008).Oxygen gas samples were directly sent to and analyzedby a dual-inlet mass spectrometer (ThermoQuest FinniganDelta Plus). The oxygen isotopic results are expressed inthe standardδ-notation relative to V-SMOW. The measured
δ18O values of each sample (δ18Omeasured 1, δ18Omeasured 2)were corrected on a daily basis using a quartz lab standard(δ18OBoulange 50−100 µm = 16.36± 0.09 ‰). Additionally, wechecked thatδ18Omeasured 1and δ18Omeasured 2values ob-tained for one to three aliquots of the phytolith lab standardMSG 40 were always in the standard deviation of the meanvalue measured during a long term calibration (Crespin etal., 2008). During the calibration period, replicate analy-ses of the international standard NBS 28 gave an averageof 9.6± 0.17 ‰ (1 SD,n = 13). Replicate analyses of thesoil top phytolith samples yielded to a reproducibility forδ18Omeasuredbetter than±0.5 ‰, except for one sample (#19)(Table 2).
The recent inter-laboratory comparison for oxygen iso-topic composition of hydrous biogenic silica has evidencedthat, when the CEREGE CIE is performed, a methodologicalbias occurs leading to abnormally high fractionation betweenthe vapour and the exchanged oxygen (118Ovapour-Oexchanged)(Chapligin et al., 2012). Tests were conducted to exam-ine any possibility of systematic error: before the start ofthe CIE, the working standards were heated at 350◦C inorder to remove possible labile organic remains that mayincrease the surface area of the materials; the amount ofsilica subjected to exchange was increased by 6; water-vapour exchange temperature (and associated fractionationfactor) was changed; time of vapour-silica exchange was in-creased while the volume of exchange was reduced by 1/3;the rate of silica dehydration was reduced. None of thesetests produced significant changes in theδ18Omeasuredval-ues. The difference between the two labelled waters wasreduced by 8 ‰, which did not change theδ18Osilica val-ues either. Additionally, for two working standards (MSG60,BFC), vapour-silica exchanges were carried out at three tem-peratures (140◦C, 200◦C (usual temperature) and 246◦C).Changes inδ18Omeasuredvalues were conform with thoseexpected from the temperature-dependency of the equilib-rium fractionation factorsαwater-vapour andαvapour-exchanged.The methodological bias assumed to occur during vapour-silica exchange remains unexplained but was reproducibleand could be quantified. For this purpose, pooled val-ues from Chapligin et al. (2012) were taken as true val-ues. CEREGE 1000 lnαvapour-Oexchanged values obtained for140 and 200◦ were compared with 1000 lnαvapour-Oexchanged
values previously obtained for diatoms exchanged at sim-ilar temperatures by Labeyrie and Juillet (1982). Differ-ence was invariant with temperature and did not show anyrelationship with the measured percentage of exchangeableoxygen (R2 = 0.08) but decreased with increasingδ18Osilicavalues (R2 = 0.4 and 0.9 after outlier removal). The rela-tionship was used in a first step to correct the values of1vapour-Oexchanged@CEREGE(1vapour-Oexchangedwas assumed sim-ilar to 1000 lnα) as follows:
Clim. Past, 8, 307–324, 2012 www.clim-past.net/8/307/2012/

A. Alexandre et al.: The oxygen isotopic composition of phytolith assemblages from tropical rainforest soil tops 313
Tabl
e2.
Phy
tolit
has
sem
blag
es,n
onph
ytol
ithre
mai
ns,a
ssoc
iate
dm
easu
red
and
calc
ulat
edis
otop
icva
lues
,1
18O
woo
dph
ytol
ith-p
reci
pita
tionva
lues
.
Sam
ple
#T
rans
ect
Phy
tolit
hty
pes
and
orig
inN
onph
ytol
ithre
mai
nsIs
otop
icm
easu
rem
ents
Isot
opic
calc
ulat
ions
dC
orre
ctio
ns1
18O
woo
dph
ytol
ith-p
reci
pita
tion
Unc
l.G
lobu
lar
Glo
bula
rP
oace
aeQ
uart
zO
Mb
Fe
Oxi
des
Cha
rcoa
lδ
18O
mea
sure
d1
δ18
Om
easu
red
2X
eδ
18O
silic
aδ
18O
e silic
aδ
18O
f woo
d.ph
ytol
ith.
gran
ulat
eec
hina
tety
pes
a
(Tre
ew
ood)
(Pal
m)
Ave
rage
SD
nA
vera
geS
Dn
Mea
nS
DM
ean
SD
Mea
nS
DM
ean
Unc
.g
Mea
nU
nc.g
(%su
m)
(%cl
assi
fied
phyt
olith
s)(%
coun
ted
part
icle
s)(‰
vs.V
SM
OW
)(%
)(‰
vs.V
SM
OW
)(‰
vs.V
SM
OW
)
9B
artle
Fre
re15
4851
11
01
031
.23
0.26
335
.94
0.11
311
.10.
735
.60.
131
.71.
231
.91.
540
.91.
638
Bar
tleF
rere
491
81
35
00
23.5
00.
082
33.2
30.
272
23.0
0.7
31.7
0.3
20.8
2.7
21.1
2.7
29.0
2.9
36B
artle
Fre
re19
990
10
00
031
.06
0.28
334
.62
0.13
28.
40.
734
.30.
131
.20.
931
.20.
938
.91.
435
Bar
tleF
rere
1396
22
03
00
30.2
30.
032
33.6
70.
454
2.1
1.1
33.3
0.4
30.2
0.8
30.2
0.8
37.7
1.5
21P
alm
erst
on39
7614
100
10
032
.43
0.27
337
.42
0.16
211
.80.
737
.30.
233
.31.
333
.31.
337
.01.
324
Pal
mer
ston
1080
191
00
01
33.5
31
36.6
90.
172
7.5
1.3
36.6
0.2
34.1
0.8
34.1
0.8
38.6
0.8
19P
alm
erst
on20
856
90
10
931
.58
0.68
236
.17
0.13
210
.81.
635
.90.
132
.11.
232
.11.
237
.41.
218
Pal
mer
ston
2493
52
00
01
32.7
41
36.1
50.
082
8.1
1.2
36.0
0.1
33.2
0.9
33.2
0.9
38.8
0.9
17P
alm
erst
on37
834
131
03
133
.79
0.44
337
.22
0.36
48.
11.
337
.10.
434
.50.
934
.81.
340
.51.
3
16M
t.E
dith
1663
343
20
00
30.7
30.
293
32.9
70.
012
5.3
0.7
32.7
0.0
30.7
0.5
31.1
1.0
39.1
1.2
15M
t.E
dith
1170
282
00
03
29.8
00.
362
33.9
50.
083
9.8
0.9
33.5
0.1
29.7
1.0
29.7
1.0
37.9
1.2
14M
t.E
dith
3177
185
10
00
30.5
00.
133
35.1
60.
052
11.0
0.3
34.8
0.5
30.7
1.2
30.9
1.4
39.3
1.6
11M
t.E
dith
1886
86
00
00
28.8
00.
122
33.8
50.
222
11.9
0.6
33.3
0.2
28.5
1.3
28.5
1.3
37.5
1.5
28N
.Cai
rns
1889
92
10
00
32.0
40.
393
34.7
90.
162
6.5
1.0
34.5
0.2
32.2
0.7
32.5
1.1
36.1
1.1
29N
.Cai
rns
2695
05
20
00
33.2
00.
503
35.2
50.
082
4.9
1.2
35.1
0.1
33.5
0.5
33.9
1.1
38.0
1.1
33N
.Cai
rns
1556
422
02
00
30.6
60.
242
34.8
90.
112
10.0
0.6
34.5
0.1
30.8
1.1
30.8
1.1
35.7
1.1
aIn
clud
eac
icul
ar,e
long
ate
echi
nate
,bul
lifor
mce
llsan
dsh
ortc
ells
type
s.b
Org
anic
mat
ter.c
Per
cent
age
ofex
chan
geab
leox
ygen
.d
Cal
cula
ted
afte
rC
resp
inet
al.(
2008
)us
ing
aM
onte
Car
losi
mul
atio
n.e
Cor
rect
edfo
rC
IEm
etho
dolo
gica
lbia
sus
ing
aM
onte
Car
losi
mul
atio
n(s
eede
tails
inte
xt).
fC
orre
cted
for
the
pres
ence
ofqu
artz
.
www.clim-past.net/8/307/2012/ Clim. Past, 8, 307–324, 2012

314 A. Alexandre et al.: The oxygen isotopic composition of phytolith assemblages from tropical rainforest soil tops
Corrected1vapour-Oexchanged@CEREGE
= 1vapour-Oexchanged, Labeyrie and Juillet(1982)
− 1.3 × δ18Osilica@CEREGE+ 78. (1)
In a second step, the corrected1vapour-Oexchangedvalues wereused to correct theδ18Osilica values. The consistency of thiscorrection was verified using an independent data set pre-viously obtained at CEREGE for fresh water diatoms fromAnnecy Lake (Crespin et al., 2010). The obtained relation-ship between1diatoms-lake waterand temperature of the lakeallowed defining a corrected relationship:
Corrected1diatoms-lake water(‰ vs. VSMOW)
= −0.28 (±0.06) t (◦C) + 35.3 (±0.9) (2)
with aR2 of 0.7 and a p-value of 0.002, instead of
1diatoms-lake water(‰ vs. VSMOW)
= −0.16 (±0.09) t (◦C) + 39.25 (±1.4). (3)
In a 1diatomslake water vs. t diagram, the obtained cor-rected fractionation line was shifted towards lower values of1diatoms-lake water, close to fractionation lines previously ob-tained for fresh water diatoms (e.g. Brandriss et al., 1998;Moschen et al., 2005; Dodd and Sharp, 2010).
Difference between correctedδ18Osilica and thepooled δ18Osilica values, however, still increased from−0.1 ‰ (MSG60) to +2.9 ‰ (G95), with the content in totalorganic carbon measured during the inter-laboratory com-parison (Chapligin et al., 2012). This relationship suggestedthat organic remains increase the CEREGE abnormally highfractionation between the vapour and the exchanged oxygen(118Ovapour-Oexchanged).
For each of the samples, mean and standard deviation(SD) of X (exchangeable oxygen),δ18Osilica, and correctedδ18Osilica were calculated usingR and a Monte Carlo simu-lation: X, δ18Osilica and correctedδ18Osilica were computed10 000 times, using 10 000 simulated values of the variablestaken into account in the equations (Crespin et al., 2008 andthis section). The simulated uncertainty (SD) on correctedδ18Osilica ranged from±0.5 to 1.2 ‰ for 15 over 16 samplesand reached±2.7 ‰ for one sample (#38; Table 2).
4.4 Corrections onδ18Osilica for obtainingδ18Owood phytolith
Since some rainforest phytolith assemblages contained asmall amount of 2–60 µm particles that were not wood phy-toliths, corrections were made to calculateδ18Owood phytolithvalues fromδ18Osilica values.
– Correction for the presence of quartz particles:Weight correction was made for the amount of 2–60 µmsize quartz particles given their abundance (less or equal
to 3 % of the counted particles in 7 samples) and therespective densities of quartz (2.6) and phytoliths (2.3).A value of 8 ‰ was attributed to quartz particles as it isin the lower range ofδ18O values measured worldwidefor detrital quartz of metamorphic origin (e.g. Garlickand Epstein, 1967; Savin and Epstein, 1970; Clayton etal., 1972; Eslinger et al., 1973; Blatt, 1986; Graham etal., 1996; Alexandre et al., 2006).
– Correction for the presence of grass phytoliths:Phytoliths from the grass under-storey may originatefrom transpiring grass leaves and may haveδ18O val-ues slightly enriched relative to wood phytoliths. Webband Longstaffe (2002) previously demonstrated for agrass species collected from across the North Ameri-can prairies that the18O enrichment of leaf phytolithsrelative to stem phytoliths increases with the inverse ofrelative humidity (h):
118Oleaf silica-stem silica = 12.5/h − 13. (4)
As underlined by Webb and Longstaffe (2002), this rela-tionship is very similar to that reported by Yapp (1979)for the evaporation of body fluids in land snails. It isapplied here, as a general equation, to phytoliths fromthe under-storey grasses. According to Eq. (4), for the0.6–1 range of relative humidity calculated by the ANU-CLIM software for the sampled sites (Table 1), leaf phy-tolith 18O enrichment should range from 5 to 0.5 ‰. Inthe absence of measured data on relative humidity in theunder-storey, values from Table 1 were used in Eq. (4) tocorrect the obtainedδ18Osilica values for the presence ofgrass phytoliths. This correction is expected to be maxi-mal. Indeed, in the lower canopy vapour pressure deficitis low (0–0.2 kPa; Hutley et al., 1997) and18O enrich-ment of leaf water should be weak, as measured in theAmazonian rainforest (Ometto et al., 2005). Moreover,grass phytolith types (Table 1) gather phytoliths fromboth leaves and stems; the latest being not subject totranspiration (Webb and Longstaffe, 2002).
– Correction for the presence of palm phytoliths:To our knowledge,δ18Owater signatures in forest palmstems and leaves have never been measured. If18O en-richment is similar for palm and grass phytoliths, Eq. (4)should also be used to correct the obtainedδ18Osilica val-ues for the presence of palm phytoliths.
– No correction for the presence of unclassified phytolithsand charcoal:Unclassified phytoliths were assumed to mainly origi-nate from tree wood and were not corrected for. The oc-currence of charcoal particles was not corrected eithersince charcoal is largely made of carbon and should notcontribute to the oxygen yield.
Clim. Past, 8, 307–324, 2012 www.clim-past.net/8/307/2012/

A. Alexandre et al.: The oxygen isotopic composition of phytolith assemblages from tropical rainforest soil tops 315
– No correction for the presence of organic matter (OM):Less or equal to 5 % of thin organic matter remains,most of them with surface ranging from 100 to 200 µm,were counted in 5 samples (Table 2). Given the low den-sity of organic remains (<1), their weight concentrationis expected to be lower than 0.2 % weight.
– Related uncertainties:Given a counting error of±3.5 % (SD), the uncertaintyon δ18Owood phytolith due to quartz weight correctionranged from±0.5 to 0.9 ‰ for the 7 samples wheresome quartz particles were counted. Uncertainties dueto grass phytolith corrections ranged from±0 to 0.2 ‰.Uncertainties due to palm correction were lower than0.5 ‰, except for samples #7 and #11 with high contentof palm phytolith types.
4.5 Estimation of MAP, MAT and δ18Oprecipitation values
Ideally, matching the time span recorded by the soil phytolithassemblages would require us to obtain, for each of the sam-pled sites, measurements for hundreds of years for MAP,MAT, δ18Osoil water and/orδ18Oprecipitation values, which isunrealistic. Therefore, estimates were made, as justifiedbelow.
Regarding atmospheric temperature, measurements backto 1910 revealed an increase of MAT of +0.1◦C/10 yr, mostlyduring the second half of the 19th century in Queensland(Suppiah et al., 2001). To our knowledge there is no othercontinuous record of temperature from any tropical Aus-tralian site. A dendroclimatological study showed evidenceof a slower increasing trend of +1.5◦C since the 16th centuryin New Zealand (Cook et al., 2000). From these records, theassumption was made that modern long term MAT valuesgenerated by the ANUCLIM software (Table 1) should onlyslightly overestimate (by less than 1–2◦C) the mean valuefor the last 100s of years; this in a similar way for all thesampled sites. Given the<0.5◦C standard errors in monthlymaximum and minimum temperature values generated bythe ANUCLIM software a standard error of around 0.2◦Cin MAT would be a conservative estimate (M. F. Hutchinson,personal communication; Hutchinson, 1991, 1995) (Table 1).
Regarding MAP, tree ring reconstruction from the Ather-ton tableland (Queensland) revealed no long trend in precip-itation since 1861 (Heinrich et al., 2008). Making due al-lowance for varying conditions, station density and standard-isation to 30 years, the predictive errors in MAP from theANUCLIM surfaces are around 10–15 % across the conti-nent (M. F. Hutchinson, personal communication; Hutchin-son, 1991, 1995) (Table 1).
In the absence of long termδ18Oprecipitationmeasurementsclose to the sampled sites, directδ18O measurements couldhave been performed from non-evaporative surface water(e.g. river, spring water) (Lachniet and Patterson, 2009).However, given the confined sampled area, surface waters
did not show sufficient variations in distance from the wa-ter source to record rapid changes inδ18Oprecipitation val-ues with elevation. Weighted annualδ18Oprecipitation es-timates were thus calculated using as a basis the Bowenand Wilkinson (2002) model established from the Inter-national Atomic Energy Agency-World Meteorological Or-ganization Global Network for Isotopes in Precipitation(GNIP) database (IAEA/WMO, 1998).δ18Oprecipitation val-ues are controlled by the latitude (LAT) and by the alti-tude (ALT). For stations located<200 m a.s.l. (Eq. 5) and>200 m a.s.l. (Eq. 6) the relationships are respectively ex-pressed as:
δ18Oprecipitation = −0.0051(|LAT |)2+ 0.1805(|LAT |) − 5.247 (5)
δ18Oprecipitation = −0.0051(|LAT |)2+ 0.1805(|LAT |)
− 0.002(ALT) − 5.247. (6)
Equations (5) and (6) were slightly modified to take regionalconditions into consideration. The magnitude of the alti-tude effect estimated as 0.002 ‰ m−1 a.s.l. by Bowen andWilkinson (2002) was also measured worldwide with anuncertainty lower than±0.0005 ‰ m−1 (Siegenthaler andOeshger, 1980; Chamberlain and Poage, 2000; Gonfiantiniet al., 2001; Lachniet and Patterson, 2002, 2009). How-ever, in humid tropics,δ18O values of precipitation from airmasses lifted over high mountains appear to be controlled bythe cumulative rainout upwind of collecting stations (Lach-niet and Patterson, 2009). At leeward stations, this rainoutprocess leads to measuredδ18Oprecipitationvalues lower thanthose predicted by the altitude effect alone (Rietti-Shati etal., 2000; Longinelli et al., 2006; Lachniet and Patterson,2009). This process is also called “shadow effect”. In or-der to take into account such a cumulative rainout, the cu-mulative change in altitude (1ALT) along a SE-NW transect(i.e. parallel with the trajectory of the dominant trade winds)was used to estimateδ18Oprecipitationvalues at both windwardand leeward sites (Fig. 3; Table 1). This procedure resultedin an inversed isotopic vertical gradient for the leeward slopeof Mt. Bartle Frere, neglecting the role of increasing temper-ature as elevation decreases. This may have led to an under-estimate forδ18Oprecipitationvalues, especially at leeward lowelevation sites. Additionally, in agreement with the few iso-topic studies investigating the water cycle in rainforest areas,an inland18O gradient of−0.08 ‰/100 km reflecting the in-fluence of recycled continental moisture (mainly from evapo-transpiration) (Salati et al., 1979; Gat and Matsui, 1991; Mar-tinelli et al., 1996; Njitchoua et al., 1999; Lachniet and Pat-terson, 2002) was added (Eqs. 7 and 8). However, given thesites proximity to the coast, the inland gradient has limitedimpact onδ18Oprecipitationvalues.
Finally, for the<200 m a.s.l. and>200 m a.s.l. sites, thecalculation ofδ18Oprecipitationvalues was as follows:
www.clim-past.net/8/307/2012/ Clim. Past, 8, 307–324, 2012

316 A. Alexandre et al.: The oxygen isotopic composition of phytolith assemblages from tropical rainforest soil tops
δ18Oprecipitation = −0.0051(|LAT |)2+ 0.1805(|LAT |)
− 5.247 − 0.08 (DIST), (7)
and
δ18Oprecipitation = −0.0051(|LAT |)2+ 0.1805(|LAT |)
− 0.002(|1ALT |) − 5.247 − 0.08 (DIST). (8)
Uncertainty associated with the latitude parameter in Eqs. (7)and (8) is not known but should be similar for all thesites, as they are located at similar or close latitude (Ta-ble 1). At the global scale, the average difference betweenδ18Oprecipitation values estimated from Eqs. (5) and (6) andthe measured values is 0.21 ‰ (σ = 2.49 ‰) (Bowen andWilkinson, 2002). Added to the altitude effect uncertainty(±0.0005 ‰ m−1), it leads to a maximum propagated uncer-tainty onδ18Oprecipitationestimates from Eqs. (7) and (8) rang-ing from 0.2 to 0.8 ‰ (Table 1).
Estimated weighted annualδ18Oprecipitation values werecompared with measured weighted seasonalδ18Oprecipitationvalues obtained by CSIRO Land and Water during tworainy seasons in 1998 and 1999, at two stations (Malanda:17◦21′ S; 145◦35′ E; 762 m a.s.l. and Walkamin: 17◦08′ S;145◦25′ E; 594 m a.s.l.) located in the Atherton tablelands(Fig. 2). Those were the only measured data available forthe area. Since most of the precipitation occurs during therainy season, weighted seasonal values were expected to beclose to weighted annual estimates. They were indeed veryclose – respectively−8.68 ‰ and−8.50 ‰ at Malanda and−7.77 ‰ and−7.85 ‰ at Walkamine – which strengthenedthe reliability of theδ18Oprecipitationestimations.
There is no available data on long termδ18Osoil water sig-nature from the Australian rainforests. However, as thoserainforests are characterized by low radiation levels due tofrequent occurrence of fog and low clouds and by a lowrange of the vapor pressure deficit for much of the time, soilevaporation and understorey evaporation are expected to below (Hutley et al., 1997). For comparison,δ18Osoil waterval-ues measured in the Amazonian rainforest were shown to beclose toδ18Oprecipitationvalues and to lie along the local iso-topic meteoric water line (Girard et al., 2000). On steepslopes developed at the expense of granitic and metamor-phic parent-rocks, shallow groundwaters may locally occurat the boundary between arenite and soils. However, if this isthe case at the sample sites, localδ18Ogroundwatersignaturesshould be close to the long termδ18Osoil water values. Fi-nally, given the conditions described above, the assumptionwas made that long term depth-weightedδ18Osoil watersigna-tures were close to weight annualδ18Oprecipitationvalues.
5 Results
5.1 Phytolith assemblages
The abundances of tree, palm, grass, and unclassified phy-tolith categories are presented in Table 2. Three to fourphytolith assemblages from the Bartle Frere transect (#35,#36, #38), collected under the cloud forest were dominatedby tree wood phytoliths (91 to 99 % of classified phytoliths),while abundances of palm and grass phytoliths ranged from0–8 % and 1–2 % of classified phytoliths, respectively. Tree,palm, and grass phytoliths accounted for 48 %, 51 %, and1 %, respectively, of classified phytoliths in the fourth assem-blage (#9) that came to the lowest site covered by a rainfor-est with high floristic richness. Ranges of the abundancesof tree, palm, and grass phytoliths in the five assemblagesfrom the Palmerston Highway transect were 76–93 %, 4–19 %, and 1–13 %, respectively, of classified phytoliths. Inthe four assemblages from the Mt. Edith transect, the abun-dance of tree, palm, and grass phytoliths were 63–86 %, 8–34 %, and 3–6 %, respectively, of classified phytoliths. Thefour phytolith assemblages from the Northern Cairns tran-sect showed various abundances of tree, palm, and grass phy-toliths: 56–95 %, 0–42 %, and 2–5 % of classified phytoliths,respectively. The phytolith index, D/P (the ratio of ligneousdicotyledons globular granulate, D, over short cell Poaceaephytoliths, P) was always higher than 12 in agreement withrainforests tree cover density (Bremond et al., 2005a,b).
Quartz, OM, Fe oxides and charcoal particles were presentin low proportions in few samples (Table 2).
5.2 δ18Osilica, δ18Owood phytolith and environment
Mean, reproducibility and uncertainties ofδ18Omeasured 1,δ18Omeasured 2, the percentage of exchangeable oxygen, cal-culatedδ18Osilica values corrected for the CIE methodologi-cal bias and for the presence of quartz are presented in Ta-ble 2. Corrections for the presence of grass and palm phy-toliths are presented in Table 3 for comparison.
δ18Owood phytolith values, corrected for the presence ofquartz only, range from 21.1 ‰ to 31.9 ‰ for the as-semblages from the Bartle Frere transect, from 32.1 ‰ to34.8 ‰ for assemblages from Palmerston Highway, from28.5 ‰ to 31.1 ‰ for assemblages from the Mt. Edith tran-sect, and from 30.8 ‰ to 33.9 ‰ for assemblages from theNorthern Cairns transect. The estimated weighted annual18Oprecipitationvalues ranged from−8.97 ‰ to−3.67 ‰, fora mean annual temperature range of 17–24.1◦C and a pre-cipitation range of 1500–4942 mm yr−1 (Table 1). Whenall points are taken into account, no direct correlationappear betweenδ18Owood phytolith values, weighted annual18Oprecipitation values, MAT, MAP or elevation. Whenδ18Owood phytolith values from the leeward transect of Bar-tle Frere are excluded (Fig. 4), a positive linear correlationwith the estimated weighted annualδ18Oprecipitation values
Clim. Past, 8, 307–324, 2012 www.clim-past.net/8/307/2012/
A. Alexandre et al.: The oxygen isotopic composition of phytolith assemblages from tropical rainforest soil tops 317
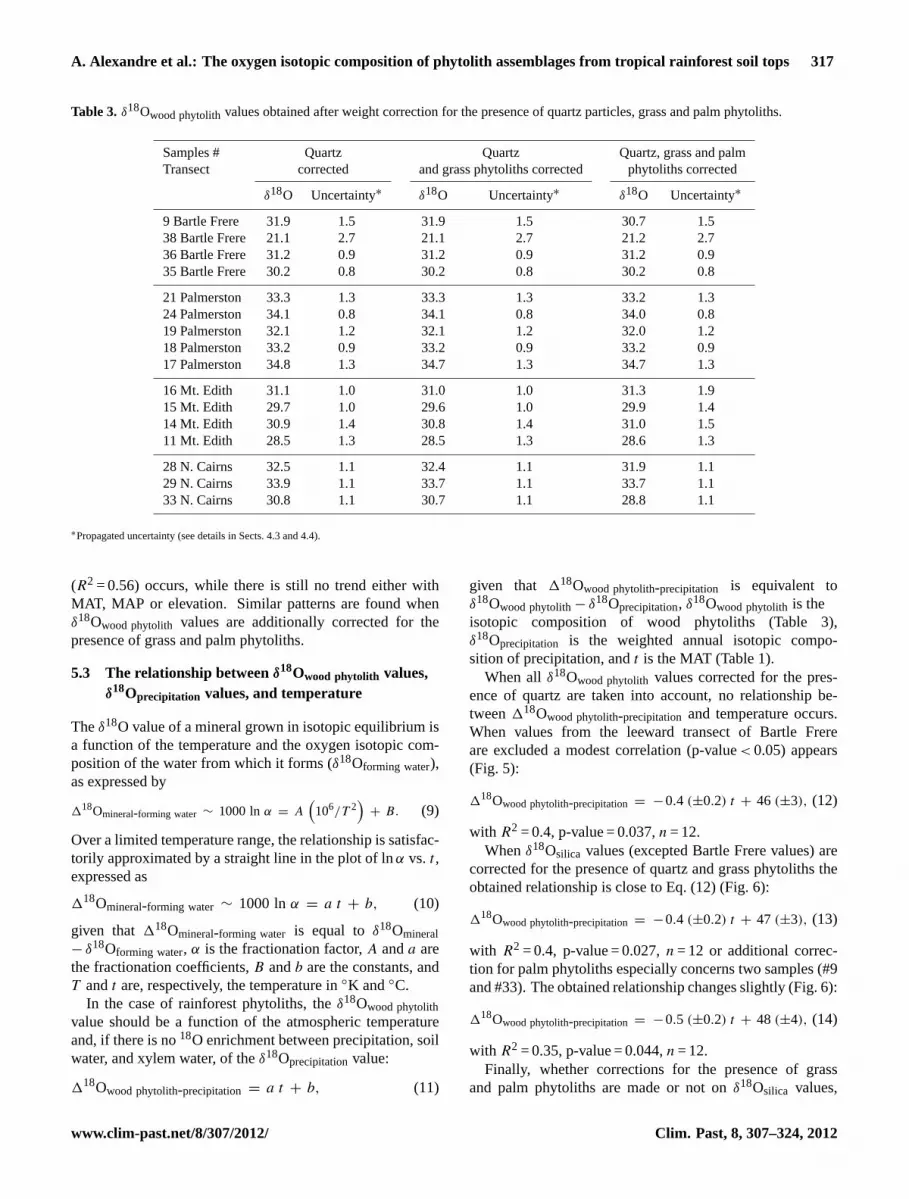
Table 3. δ18Owood phytolithvalues obtained after weight correction for the presence of quartz particles, grass and palm phytoliths.
Samples # Quartz Quartz Quartz, grass and palmTransect corrected and grass phytoliths corrected phytoliths corrected
δ18O Uncertainty∗ δ18O Uncertainty∗ δ18O Uncertainty∗
9 Bartle Frere 31.9 1.5 31.9 1.5 30.7 1.538 Bartle Frere 21.1 2.7 21.1 2.7 21.2 2.736 Bartle Frere 31.2 0.9 31.2 0.9 31.2 0.935 Bartle Frere 30.2 0.8 30.2 0.8 30.2 0.8
21 Palmerston 33.3 1.3 33.3 1.3 33.2 1.324 Palmerston 34.1 0.8 34.1 0.8 34.0 0.819 Palmerston 32.1 1.2 32.1 1.2 32.0 1.218 Palmerston 33.2 0.9 33.2 0.9 33.2 0.917 Palmerston 34.8 1.3 34.7 1.3 34.7 1.3
16 Mt. Edith 31.1 1.0 31.0 1.0 31.3 1.915 Mt. Edith 29.7 1.0 29.6 1.0 29.9 1.414 Mt. Edith 30.9 1.4 30.8 1.4 31.0 1.511 Mt. Edith 28.5 1.3 28.5 1.3 28.6 1.3
28 N. Cairns 32.5 1.1 32.4 1.1 31.9 1.129 N. Cairns 33.9 1.1 33.7 1.1 33.7 1.133 N. Cairns 30.8 1.1 30.7 1.1 28.8 1.1
∗Propagated uncertainty (see details in Sects. 4.3 and 4.4).
(R2 = 0.56) occurs, while there is still no trend either withMAT, MAP or elevation. Similar patterns are found whenδ18Owood phytolith values are additionally corrected for thepresence of grass and palm phytoliths.
5.3 The relationship betweenδ18Owood phytolith values,δ18Oprecipitation values, and temperature
Theδ18O value of a mineral grown in isotopic equilibrium isa function of the temperature and the oxygen isotopic com-position of the water from which it forms (δ18Oforming water),as expressed by
118Omineral-forming water ∼ 1000 lnα = A(106/T 2
)+ B. (9)
Over a limited temperature range, the relationship is satisfac-torily approximated by a straight line in the plot of lnα vs. t ,expressed as
118Omineral-forming water ∼ 1000 lnα = a t + b, (10)
given that 118Omineral-forming water is equal toδ18Omineral− δ18Oforming water, α is the fractionation factor,A anda arethe fractionation coefficients,B andb are the constants, andT andt are, respectively, the temperature in◦K and◦C.
In the case of rainforest phytoliths, theδ18Owood phytolithvalue should be a function of the atmospheric temperatureand, if there is no18O enrichment between precipitation, soilwater, and xylem water, of theδ18Oprecipitationvalue:
118Owood phytolith-precipitation = a t + b, (11)
given that 118Owood phytolith-precipitation is equivalent toδ18Owood phytolith− δ18Oprecipitation, δ18Owood phytolith is theisotopic composition of wood phytoliths (Table 3),δ18Oprecipitation is the weighted annual isotopic compo-sition of precipitation, andt is the MAT (Table 1).
When allδ18Owood phytolith values corrected for the pres-ence of quartz are taken into account, no relationship be-tween118Owood phytolith-precipitation and temperature occurs.When values from the leeward transect of Bartle Frereare excluded a modest correlation (p-value< 0.05) appears(Fig. 5):
118Owood phytolith-precipitation = −0.4 (±0.2) t + 46 (±3), (12)
with R2 = 0.4, p-value = 0.037,n = 12.Whenδ18Osilica values (excepted Bartle Frere values) are
corrected for the presence of quartz and grass phytoliths theobtained relationship is close to Eq. (12) (Fig. 6):
118Owood phytolith-precipitation = −0.4 (±0.2) t + 47 (±3), (13)
with R2 = 0.4, p-value = 0.027,n = 12 or additional correc-tion for palm phytoliths especially concerns two samples (#9and #33). The obtained relationship changes slightly (Fig. 6):
118Owood phytolith-precipitation = −0.5 (±0.2) t + 48 (±4), (14)
with R2 = 0.35, p-value = 0.044,n = 12.Finally, whether corrections for the presence of grass
and palm phytoliths are made or not onδ18Osilica values,
www.clim-past.net/8/307/2012/ Clim. Past, 8, 307–324, 2012

318 A. Alexandre et al.: The oxygen isotopic composition of phytolith assemblages from tropical rainforest soil tops
MAT (°C)
MAP (mm/y)
δ18O
woo
d ph
ytol
ith
(‰ v
s V-S
MO
W)
Altitude (m a.s.l.)
Figure 4 (revised)
δ18O
woo
d ph
ytol
ith
(‰ v
s V-S
MO
W)
(‰ vs V-SMOW)δ18Oprecipitation
15
20
25
30
35
40
0 200 400 600 800 1000 1200 1400
15
20
25
30
35
40
-10 -9 -8 -7 -6 -5 -4 -3
15
20
25
30
35
40
16 18 20 22 24
15
20
25
30
35
40
1000 2000 3000 4000 5000 6000
δ18O
woo
d ph
ytol
ith
(‰ v
s V-S
MO
W)
δ18O
woo
d ph
ytol
ith
(‰ v
s V-S
MO
W)
Fig. 4. δ18Owood phytolithvalues (corrected for the presence of quartz) vs. altitude, mean annual temperature (MAT), mean annual precip-
itation (MAP) and estimated amount weighted mean annualδ18Oprecipitationvalues. Error bars refer to uncertainties onδ18Oprecipitation,
δ18Owood phytolith, MAP and MAT (Sects. 4.3, 4.4 and 4.5). Diamonds: points from Bartle Frere; squares: other points. A linear positive
correlation appears betweenδ18Owood phytolithandδ18Oprecipitationvalues (R2 = 0.5) when points from Bartle Frere transect (squares) areexcluded.
∆18O
woo
d ph
ytol
ith -
prec
ipita
tion
(‰ v
s V-S
MO
W)
MAT (°C)
∆18Owood phytolith - precipitation = -0.4 (±0.2) t + 46 (±3)
(R2=0.4, p=0.037; n=12)
Figure 5 (revised)
33
35
37
39
41
18 20 22 24
Fig. 5. Empirical relationship between118Owood phytolith-precipitation
value and mean annual atmospheric temperature (MAT) obtainedfor the three windward transects. Grey lines: associated uncertain-ties (Tables 1 and 2) and limits of the 95 % confidence interval.
118Owood phytolith-precipitation values obtained for the wind-ward transects show negative linear relationships with MAT,expressed by close mean temperature coefficients rangingfrom −0.4 (±0.2) to −0.5 (±0.2) ‰◦C−1 and y-interceptranging from 46 to 48 (±4) ‰ (Fig. 6). These relationshipsare in the range of fractionation factor equations previously
∆18O
woo
d ph
ytol
ith -
prec
ipita
tion
(‰ v
s V-S
MO
W)
MAT (°C)
Figure 6 (revised)
33
35
37
39
41
18 20 22 24
#33
Quartz correction (eq.12)Quartz, grass phyt. correction (eq.13 )Quartz, grass, palm phyt. correction (eq.14 )
(eq.12 )(eq.13 )(eq.14 )
Fig. 6. Impact of non-wood phytolith corrections: relationships be-tween118Owood phytolith-precipitationvalue and mean annual atmo-spheric temperature (MAT) obtained for the three windward tran-sects and depending on non-wood phytolith corrections (Table 3).Cf. text for Eqs. (1)–(3).
measured for different silica-water couples (Clayton et al.,1972; Matsuhisa et al., 1979; Juillet-Leclerc and Labeyrie,1987; Sharp and Kirschner, 1994; Shemesh et al., 1992;Shahack-Gross et al., 1996; Brandriss et al., 1998; Moshenet al., 2005; Dodd and Sharp, 2010). For more clarityand because corrections for grass an palm phytoliths may
Clim. Past, 8, 307–324, 2012 www.clim-past.net/8/307/2012/

A. Alexandre et al.: The oxygen isotopic composition of phytolith assemblages from tropical rainforest soil tops 319
This study (eq. 12)Shahack-Gross et al., 1996
Juillet-Leclerc and Labeyrie, 1987
(2)
(3)
(6)
Clayton et al., 1972(9)
(4)(5)
(1)
Phytoliths
Diatoms
Quartz
Sharp and Kirshner, 1994(11)Matsuhisa et al., 1979(10)
t (°C)
δ18 O
silic
a - δ
18O
wat
er(‰
vs
V-S
MO
W)
Crespin et al., 2010corrected for methodological bias
(7)
(8)
Figure 7 (revised)
28
30
32
34
36
38
40
42
44
46
0 10 20 30
Shemesh et al., 1992Brandriss et al., 1998Moschen et al., 2005
Dodd and Sharp, 2010
(1) -0.4‰/°C
(11) -0.3‰/°C
(9) -0.27‰/°C
(3) -0.28‰/°C
(4) -0.49‰/°C
(8) -0.19‰/°C (7) -0.28‰/°C
(5) -0.19‰/°C
(6) -0.20‰/°C
(2) -0.33‰/°C
(10) -0.27‰/°C
Fig. 7. Comparison of the thermo-dependant relationships expressed as 1000 lnα ∼ [δ18Osilica− δ18Owater] (‰ vs. VSMOW) = a t (◦C) +b
obtained for phytolith-water, diatom-water and quartz-water couples.
be overestimated (cf. Sect. 4.4)δ18Owood phytolith values ob-tained after quartz correction are discussed below.
6 Discussion
6.1 The obtained temperature-dependant relationship:comparison with previous studies
Equation (12) can be further compared with the temperature-dependant relationships previously published for differentsilica-water couples (Fig. 7).
Regarding temperature coefficients, Fig. 7 indicates thatthe −0.4 (±0.2) ‰◦C−1 value obtained from Eq. (12)is close to the value obtained for harvested grass phy-toliths (−0.33 ‰◦C−1 recalculated from Shahack-Gross etal. (1996) and natural quartz (−0.30 ‰◦C−1, Sharp andKirschner, 1994). The coefficient is in the range obtained forfossil diatoms (from−0.28 to−0.49 ‰◦C−1, Juillet-Leclercand Labeyrie, 1987; Shemesh et al., 1992), slightly largerthan the value experimentally obtained for high tempera-ture quartz (−0.24 to−0.27 ‰◦C−1; Clayton et al., 1972;
Matsuhisa et al., 1979), an ‰◦C−1, Brandriss et al., 1998;Moshen et al., 2005; Dodd and Sharp, 2010; Crespin et al.,2010).
If we focus on the entire temperature-dependant relation-ships (fractionation lines), Fig. 7 recalls that there is no uni-form relationship for the different silica-water couples. Sev-eral factors were previously suggested to account for thesediscrepancies: diatom frustules that show higher dissolutionrate than that of phytoliths (Fraysse et al., 2009) may havebeen subject to early diagenesis which could have impactedtheir isotopic composition after deposition (Schmidt et al.,2001; Dodd and Sharp, 2010); approximations of temper-ature andδ18Owater value may have led to uncertainties on118Osedimentary diatom-water values (Moschen et al., 2005); re-crystallization during experimental high temperature quartz-water exchange may have led to kinetic effects and low-ered obtained118Oquartz-water values (Sharp and Kirschner,1994). The extent of these effects are still to be assessed. Atthe same time, Fig. 7 indicates that the line obtained fromEq. (12) is located in between the ones obtained for natu-ral quartz (Sharp and Kirschner, 1994) and sedimentary di-atoms (Juillet-Leclerc and Labeyrie, 1987; Shemesh et al.,
www.clim-past.net/8/307/2012/ Clim. Past, 8, 307–324, 2012
320 A. Alexandre et al.: The oxygen isotopic composition of phytolith assemblages from tropical rainforest soil tops
1992) and the ones obtained for grass phytoliths (Shahack-Gross et al., 1996), fresh water diatoms (Brandriss et al.,1998; Moschen et al., 2005; Dodd and Sharp, 2010; Crespinet al., 2010) and values extrapolated from the high temper-ature quartz-water fractionation (Clayton et al., 1972; Mat-shuhisa et al., 1979). For the considered temperature range,ourδ18Oprecipitationestimates (from Eq. 12) are lower by only0.2 to 0.9 ‰ than estimates using the fractionation relation-ship from Juillet-Leclerc and Labeyrie (1987). They arelower by 1.5 to 2.2 ‰ than estimates using the fractionationrelationship from Sharp and Kirschner (1994) and higher by2.5 to 3.2 ‰ than estimates using the fractionation relation-ship from Shahack-Gross et al. (1996). The relative shift toharvested grass phytoliths may result from the uncertaintiesassociated with both relationships. This shift can also be ex-plained if calculated118Owood phytolith-precipitationvalues arehigher than actual118Owood phytolith-forming watervalues, dueto evaporative18O enrichment of the soil water absorbedby roots. This may occur if a significant part of the watercomes from the first 10s of centimeters of soil during thedry and more evaporative season. However, a greening dur-ing the dry season, when it occurs, involves rainforest treeroots’ capacity for absorbing non-18O enriched deep soil wa-ter rather than shallow water (Huete et al., 2006). Addition-ally, although biased estimations ofδ18Oprecipitation and/ordiscrepancies betweenδ18Oprecipitationandδ18Osoil watermayhave occurred, they should be reproducible in order to ex-plain systematic shifts of several ‰, which is rather unlikely.An underestimation ofδ18Oprecipitationmay also be involved.Although agreement between estimatedδ18Oprecipitation andmeasuredδ18Oprecipitationvalues at Malanda and Walkaminesupport the accuracy of our estimations, obtaining long termδ18Oprecipitation and/orδ18Osoil water records (rather than di-rect measurements only instructive for short term hydrolog-ical conditions) for the studied area would help to furtherverify this accuracy. Finally, superficial dissolution of phy-toliths in litter and soil (Alexandre et al., 1999) may alsolead to slight18O enrichment as the lighter isotope, formingweaker bonds and having a higher diffusion velocity than theheavier isotope, goes preferentially to the liquid phase. Dis-solution figures are difficult to detect on the granulated sur-face of the globular granulate phytolith type which preventsverifying the later hypothesis.
6.2 δ18Owood phytolith values obtained from the leewardBartle Frere transect
Data obtained from Bartle Frere transect did not followthe above relationship (Eq. 12), due to particularly low118Owood phytolith-precipitationvalues (Table 2) drastically de-creasing with elevation in contrast to a low temperaturegradient (Table 1). Several points are discussed below toaccount for this discrepancy: (1) a low temperature gra-dient may emphasize variations ofδ18Owood phytolith val-ues in relation to local environmental changes (e.g. soil
evaporation, depth of water uptake, phytolith production),but would unlikely explain a shift as high as 8–9 ‰◦C−1
in δ18Owood phytolith and118Owood phytolith-precipitationvalues;(2) the four highest sites of the Bartle Frere transect are cov-ered by a cloud forest characterized by cloud striping (Mc-Jannete et al., 2007a,b). As previously noted, cloud strip-ing may increase the inland isotopic gradient, enhance thecumulative rainout of18O depletion in air masses and de-creaseδ18Oprecipitation values. However, cloud forest sitesof the windward Mt. Edith transect do not show unexpect-edly low 118Owood phytolith-precipitation values; (3) the BartleFrere transect diverges from the three other transects in thatit is located leeward relative to the S-E trade winds. Poten-tial δ18Oprecipitation underestimation at leeward sites wouldimply lower 118Owood phytolith-precipitation values and cannotaccount for the discrepancy. N-W monsoonal winds andcyclones with westerly tracks may contribute to precipita-tion on the N-W slope of Bartle Frere South Peak to agreater extent than on slopes oriented windward. The as-sociated high amount effect (Nott et al., 2007) would de-crease theδ18Oprecipitation value (and increase associated118Owood phytolith-precipitation values). However, such an ef-fect would likely impact the whole slope and cannot accountfor decreasing118Owood phytolith-precipitation values with de-creasing altitude; (4) the Bartle Frere slope may be subject tohigher rain shadow effect than the one taken into account inEq. (2), which may lead to overestimateδ18Oprecipitationval-ues all the more so altitude decreases. In the literature, theonly δ18Oprecipitationmeasured value obtained from a leewardtropical site was about 2 ‰ lighter than the one expected fora windward site of similar altitude (Gonfiantini et al., 2001).
Finally, without further data, potential combined impactsof canopy interception, storms and rain shadow effects onδ18Oprecipitationvalues are difficult to assess but are rather in-teresting tracks to investigate in a near future.
6.3 Implications for paleoenvironmentalreconstructions
In the absence of a uniform temperature-dependant rela-tionship for different silica-water couples, the use of oneor another fractionation equation for reconstructing pre-cise values forδ18Oforming water and temperature from fos-sil samples appears subject to caution. On the otherhand, the small range of empirical temperature coefficients(from 0.2 to 0.5 ‰◦C−1) supports their use for reconstruct-ing, from continuous fossil sequences, relative changes inδ18Oforming water and temperature. Consistence of the em-pirical temperature coefficient obtained in the present study(−0.4 (±0.2) ‰◦C−1) highlights the reliability of soil topphytolith assemblages from rainforests of northeast Queens-land to reflect changes in MAT andδ18Oprecipitation. If nosignificant fractionation occurs when phytoliths are exportedand buried, continuous fossil phytolith sequences from lakesin northeast Queensland can be used for reconstructing past
Clim. Past, 8, 307–324, 2012 www.clim-past.net/8/307/2012/

A. Alexandre et al.: The oxygen isotopic composition of phytolith assemblages from tropical rainforest soil tops 321
relative changes inδ18Osoil water and δ18Oprecipitation values(when both isotopic compositions are assumed to be close)and/or in MAT values. Given the large uncertainties ob-tained on118Owood phytolith-precipitation values, it is plausi-ble to expect reproducible uncertainties of several ‰ andseveral◦C on reconstructed changes inδ18Osoil water and/orδ18Oprecipitation values, and MAT values. Moreover, giventhe low amount of phytoliths recovered from soils and sedi-ments, we expect the time resolution from sedimendary phy-tolith records to be limited to hundreds of years. However,such large uncertainties and low time resolution are still suf-ficient for investigating significant terrestrial changes thatoccurred during the Quarternary glacial/interglacial transi-tions. If the range of temperature changes can be constrainedby other proxies, such as pollen transfer functions, recon-struction of relative changes inδ18Osoil water values usingδ18Owood phytolithvalues should become straightforward. Ad-ditionally, the association of morphological andδ18O analy-ses on similar tropical forest phytolith assemblages shouldallow one to assess whether past forest dynamics were orwere not synchronous with climate changes. At least acomparison of terrestrialδ18O records from tropical for-est phytolith assemblages with deep-sea reference curvesshould help to further investigate the relationship betweenglobal oceanic transgression/regression phases (e.g. revealedby δ18Obenthic foraminiferarecords) and local changes in thewater cycle (revealed byδ18Ophytolith records).
7 Conclusions
The obtained empirical temperature-dependant relationshipEq. (12) suggests that top phytolith assemblages from rain-forests of northeast Queensland reflect changes in MAT andδ18Oprecipitation, in the range predicted by equilibrium tem-perature coefficients previously published for quartz, diatomsand harvested grass phytoliths. This, despite the various un-knowns introduced when estimatingδ18Oprecipitation valuesand the large uncertainties onδ18Owood phytolith values. Theconsistency supports the reliability ofδ18Owood phytolith sig-natures for recording changes in mean annualδ18Osoil watervalues (which are assumed to be equivalent to the weightedannual δ18Oprecipitation values in rainforests environments)and MAT, provided these changes were several ‰ and/orseveral◦C in magnitude. Morphological phytolith analysisof Quaternary continuous sedimentary sequences from theWestern Australo-Pacific area should help to select rainfor-est phytolith assemblages suitable forδ18O analysis. Thecombination of both methods should provide simultaneousinsights regarding rainforest dynamics and climate change.
Acknowledgements.This work was conducted during the thesisof J. Crespin PhD (2004–2008) and was partially supported bythe Stable Isotope Lab at CEREGE and the French programECLIPSE. We thank the Sustainable Ecosystems group at theTropical Forest Research Center (CSIRO) of Atherton who helpedus to organize the field trip and who provided the ANUCLIM data.δ18Oprecipitationvalues measured for Malanda and Walkamine weremade available to us by P. G. Cooks and Andrew Herczeg (CSIROLand and Water). Errors on MAT an MAP values generated by theANUCLIM software were assessed thanks to Michael Hutchin-son (ANU). We also thank C. Pailles and C. Vallet-Coulomb(CEREGE) for respectively providing and analyzing the CIEwaters, and J. J. Motte (mapping, CEREGE). This work benefitedfrom the comments of two anonymous reviewers.
Edited by: D. Fleitmann
The publication of this article is financed by CNRS-INSU.
References
Alexandre, A., Meunier, J. D., Colin, F., and Koud, J. M.: Plant im-pact on the biogeochemical cycle of silicon and related weather-ing processes, Geochim. Cosmochim. Acta, 61, 677–682, 1997.
Alexandre, A., Meunier, J. D., Lezine, A. M., Vincens, A., andSchwartz, D.: Phytoliths: indicators of grassland dynamicsduring the Late Holocene in intertropical Africa, Palaeogeogr.Palaeocl., 136, 213–229, 1998.
Alexandre, A., Meunier, J. D., Mariotti, A., and Soubies, F.: LateHolocene paleoenvironmental record from a latosol at Salitre(Southern Central Brazil): phytolith and carbon isotope evi-dence, Quaternary Res., 51, 187–194, 1999.
Alexandre, A., Sonzogni, C., Basile, I., Sylvestre, F., Parron, C.,Meunier, J. D., and Colin, F.: Oxygen isotope analyses offine silica grains using laser-extraction technique: comparisonwith oxygen isotope data obtained from ion microprobe analy-ses and application to quartzite and silcrete cement investigation,Geochim. Cosmochim. Acta, 70, 2827–2835, 2006.
Barboni, D., Bremond, L., and Bonnefille, R.: Comparative study ofmodern phytolith assemblages from inter-tropical Africa, Palaeo-geogr. Palaeocl., 246, 454–470, 2007.
Blatt, H.: Oxygen isotopes and the origin of quartz, J. Sediment.Petrol., 57, 373–377, 1986.
Bowen, G. J. and Wilkinson, B.: Spatial distribution ofδ18O inmeteoric precipitation, Geology, 30, 315–318, 2002.
Boyd, W. E., Lentfer, C. J., and Parr, J.: Interactions between humanactivity, volcanic eruptions and vegetation during the Holocene atGarua and Numundo, West New Britain, PNG, Quaternary Res.,64, 384–398, 2005.
www.clim-past.net/8/307/2012/ Clim. Past, 8, 307–324, 2012

322 A. Alexandre et al.: The oxygen isotopic composition of phytolith assemblages from tropical rainforest soil tops
Brandriss, M. E., O’Neil, J. R., Edlund, M. B., and Stoermer, E. F.:Oxygen isotope fractionation between diatomaceous silica andwater, Geochim. Cosmochim. Acta, 62, 1119–1125, 1998.
Bremond, L., Alexandre, A., Peyron, O., and Guiot, J.: Grass waterstress estimated from phytoliths in West Africa, J. Biogeogr., 32,11–32, 2005a.
Bremond, L., Alexandre, A., Hely, C., and Guiot, J.: A phytolith in-dex as a proxy of tree cover density in tropical areas: calibrationwith Leaf Area Index along a forest-savanna transect in south-eastern Cameroon, Global Planet. Change, 45, 277–293, 2005b.
Bremond, L., Alexandre, A., Peyron, O., and Guiot, J.: Grasslandbiomes estimated from phytoliths in West Africa, J. Biogeogr.,35, 2039–2048, 2008a.
Bremond, L., Alexandre, A., Wooller, M. J., Hely, C., Williamson,D., Schafer, P. A., Majule, A., and Guiot, J.: Phytolith indicesas proxy of grass subfamilies dominance on tropical mountainsfrom three sites in East Africa: Mt Kenya (Kenya), Mt Rungweand Lake Masoko (Tanzania), Global Planet. Change, 61, 209–224, 2008b.
Canadell, J., Jackson, R. B., Ehleringer, J. R., Mooney, H. A., Sala,O. E., and Schulze, E.-D.: Maximum rooting depth of vegetationtypes at the global scale, Oecologia, 108, 583–595, 1996.
Cary, L., Alexandre, A., Meunier, J. D., Boeglin, J. L., and Braun, J.J.: Contribution of phytoliths to the suspended load of biogenicsilica in the Nyong basin rivers (Cameroon), Biogeochemistry,74, 101–114, 2005.
Chapligin, B., Leng, M., Webb, E., Alexandre, A., Dodd, J., Faure,K., Ijiri, A., L ucke, A., Shemesh, A., Abelmann, A., Herzschuh,U., Longstaffe, F., Meyer, H., Moschen, R., Okazaki, Y., Rees, N.H., Sharp, Z., Sloane, H. J., Sonzogni, C., Swann, G., Sylvestre,F., Tyler, J., and Yam, R.: Interlaboratory comparison of oxy-gen isotopes from biogenic silica, submitted to Geochim. Cos-mochim. Acta, 2012.
Clayton, R. N., O’Neil, J. R., and Mayeda, T. K.: Oxygen isotopeexchange between quartz and water, J. Geophys. Res., 77, 3057–3067, 1972.
Crespin, J., Alexandre, A., Sylvestre, F., Sonzogni, C., Pailles, C.,and Garreta, V.: IR-laser-extraction technique adapted to oxygenisotopes analysis of small biogenic silica samples, Anal. Chem.,80, 2372–2378, 2008.
Crespin, J., Sylvestre, F., Alexandre, A., Sonzogni, C., Pailles,C., Perga, M. E.: Re examination of the temperature-dependentrelationship betweenδ18Odiatoms and δ18Olake water for LakeAnnecy (France). Implications for palaeoclimatic applications,J. Paleolimnol., 44, 547–557,doi:10.1007/s10933-010-9436-2,2010.
Dansgaard, W.: Stable isotopes in precipitation, Tellus, 4, 436–468,1964.
Danzeglocke, U., Joris, O., and Weninger, B.: CalPal-2007online,http://www.calpal-online.de/, last access: 27 October 2011.
DASETT: Nomination of Wet Tropical Rainforests of North-eastAustralia by the Government of Australia for inclusion in theWorld Heritage List, Department of Arts, Sports, the Environ-ment, Tourism and Territories, 31 pp., 1986.
Dayem, K. E., Molnar, P., Battisti, D. S., and Roe, G. H.: Lessonslearned from oxygen isotopes in modern precipitation applied tointerpretation of speleothem records of paleoclimate from east-ern Asia, Earth Planet. Sc. Lett., 295, 219–230, 2010.
Dodd, J. P. and Sharp, Z. D.: A laser fluorination method for oxy-gen isotope analysis of biogenic silica and a new oxygen iso-tope calibration of modern diatoms in freshwater environments,Geochim. Cosmochim. Acta, 74, 1381–1390, 2010.
Eslinger, E., Mayer, L. M., Durst, T. L., Hower, J., and Savin, S. M.:An X-ray technique for distinguishing between detrital and sec-ondary quartz in the fine-grained fraction of sedimentary rocks,J. Sediment. Petrol., 43, 540–543, 1973.
Flanagan, L. B., Bain, J. F., and Ehleringer, J. R.: Stable oxygen andhydrogen isotope composition of leaf water in C3 and C4 plantspecies under field conditions, Oecologia, 88, 394–400, 1991.
Fraysse, F., Pokrovsky, O. S., Schott, J., and Meunier, J. D.: Surfacechemistry and reactivity of plant phytoliths in aqueous solutions,Chem. Geol., 258, 197–206, 2009.
Fredlund, G. and Tieszen, L. T.: Modern phytolith assemblagesfrom the North American Great Plains, J. Biogeogr., 21, 321–335, 1994.
Fricke, H. C. and O’Neil, J. R.: The correlation between18O/16Oratios of meteoric water and surface temperature: its use in in-vestigating terrestrial climate change over geologic time, EarthPlanet. Sc. Lett., 170, 181–196, 1999.
Garlick, G. D. and Epstein, S.: Oxygen isotope ratios in coexist-ing minerals of regionally metamorphosed rocks, Geochim. Cos-mochim. Acta, 31, 181–214, 1967.
Gat, J. R.: Atmospheric water balance-the isotopic perspective, Hy-drol. Process., 14, 1357–1369, 2000.
Gat, J. R. and Matsui, E.: Atmospheric water balance in the Ama-zon basin: an isotopic evapotranspiration model, J. Geophys.Res., 96, 13179–13188, 1991.
Gat, J. R., Mook, W. G., and Meijer, A. J.: Environmental Isotopesin the hydrological cycle, in: Principles and applications IHP-VTechnical Documents in Hydrology, 39, UNESCO-IAEA, 2001.
Genty, D., Blamart, D., Ouahdi, R., Gilmour, M., Baker, A., Jouzel,J., and Van-Exter, S.: Precise dating of Dansgaard-Oeschger cli-mate oscillations in western Europe from stalagmite data, Nature,421, 833–837, 2003.
Girard, J. P., Freyssinet, P., and Chazot, G.: Unraveling climaticchanges from intraprofile variation in oxygen and hydrogen iso-topic composition of goethite and kaolinite in laterites: an inte-grated study from Yaou, French Guiana, Geochim. Cosmochim.Acta, 64, 409–426, 2000.
Godfred-Spenning, C. R. and Reason, C. J. C.: Interannual variabil-ity of lower troposheric moisture transport during the australianmonsoon, Int. J. Climatol., 22, 509–532, 2002.
Gonfiantini, R., Roche, M. A., Olivry, J. C., Fontes, J. C., andZuppi, G. M.: The alitude effect on the isotopic composition oftropical rains, Chem. Geol., 181, 147–167, 2001.
Graham, C. M., Valley, J. W., and Winter, B. L.: Ion micro-probe analysis of18O/16O in authigenic and detrital quartz in theSt. Peter Sandstone, Michigan Basin and Wisconsin Arch, USA:contrasting diagenetic histories, Geochim. Cosmochim. Acta, 60,5101–5116, 1996.
Haberle, S. G.: A 23,000-yr pollen record from Lake Euramoo, WetTropics of NE Queensland, Australia, Quaternary Res., 64, 343–356, 2005.
Houlder, D., Hutchinson, M., Nix, H., and McMahon, J.: ANU-CLIM User’s Guide, Australian National University, Canberra,2000.
Clim. Past, 8, 307–324, 2012 www.clim-past.net/8/307/2012/
A. Alexandre et al.: The oxygen isotopic composition of phytolith assemblages from tropical rainforest soil tops 323
Hsieh, J. C. C., Chadwick, O. A., Kelly, E. F., and Savin, S. M.:Oxygen isotopic composition of soil water: quantifying evapora-tion and transpiration, Geoderma, 82, 269–293, 1998.
Huete, A. R., Didan, K., Shimabukuro, Y. E., Ratana, P., Saleska,S. R., Hutyra, L. R., Yang, W., Nemani, R. R., and Myneni, E.:Amazon rainforests green-up with sunlight in dry season, Geo-phys. Res. Lett., 33, L06405,doi:10.1029/2005GL025583, 2006.
Hutchinson, M. F.: The application of thin plate smoothing splinesto continent-wide data assimilation, in: Data Assimilation Sys-tems, edited by: Jasper, J. D., Bureau of Meteorology ResearchReport No. 27, Melbourne, 104–113, 1991.
Hutchinson, M. F.: Interpolating mean rainfall using thin platesmoothing splines, Int. J. Geogr. Inf. Syst., 9, 385–403, 1995.
Hutley, L. B., Doley, D., and Yates, D. J.: Water balance of anAustralian subtropical rainforest at altitude: the ecological andphysiological significance of intercepted cloud and fog, Aust. J.Bot., 45, 311–329, 1997.
Jenkinson, D. J. and Rayner, J. H.: The turnover of soil organic mat-ter in some of the Rothamsted classical experiments, Soil Sci.,123, 298–305, 1977.
Juillet-Leclerc, A. and Labeyrie, L.: Temperature dependence of theoxygen isotopic fractionation between diatom silica and water,Earth Planet. Sc. Lett., 84, 69–74, 1987.
Kelly, E. F.: Methods for extracting opal phytoliths from soils andplant material, Internal Report, Colorado State University, FortCollins, 1990.
Kershaw, A. P., Bretherton, S. C., and van der Kaars, S.: A completepollen record of the last 230 ka from Lynch’s Crater,north-easternAustralia, Palaeogeogr. Palaeocl., 251, 23–45, 2007.
Kondo, R., Childs, C., and Atkinson, I.: Opal phytoliths of NewZealand, Manaaki Whenua Press, 85 pp., 1994.
Labeyrie, L. and Juillet, A.: Oxygen isotopic exchangeability of di-atom valve silica; interpretation and consequences for paleocli-matic studies, Geochim. Cosmochim. Acta, 46, 967–975, 1982.
Lachniet, M. S. and Patterson, W. P.: Stable isotope values of CostaRican surface waters, J. Hydrol., 260, 135–150, 2002.
Lachniet, M. S. and Patterson, W. P.: Oxygen isotope values of pre-cipitation and surface waters in northern Central America (Be-lize and Guatemala) are dominated by temperature and amounteffects, Earth Planet. Sc. Lett., 284, 435–446, 2009.
Lecuyer, C., Reynard, B., and Martineau, F.: Stable isotope frac-tionation between mollusc shells and marine waters from Mar-tinique Island, Chem. Geol., 213, 293–305, 2004.
Leng, M. J. and Barker, P. A.: A review of the oxygen isotope com-position of lacustrine diatom silica for paleoclimate reconstruc-tion, Earth Sci. Rev., 75, 5–27, 2006.
Lentfer, C. and Torrence, R.: Holocene volcanic activity, vegeta-tion succession, and ancient human land use: unraveling the in-teractions on Garua Island, Papua New Guinea, Rev. Palaeobot.Palynol., 143, 83–105, 2007.
Liu, W., Li, X., Zhang, L., An, Z., and Xu, L.: Evaluation of oxygenisotopes in carbonate as an indicator of lake evolution in aridareas: The modern Qinghai Lake, Qinghai-Tibet Plateau, Chem.Geol., 268, 126–136, 2009.
Longinelli, A., Anglesio, E., Flora, O., Iacumin, P., and Selmo, E.:Isotopic composition of precipitation in Northern Italy: Reverseeffect of anomalous cliamtic events, J. Hydrol., 329, 471–476,2006.
Madella, M., Alexandre, A., and Ball, T.: ICPN WorkingGroup (2005) International Code for Phytolith Nomencla-ture 1.0, Ann. Bot.-London, 96, 253–260, 2005.
Martinelli, L. A., Victoria, R. L., Sternberg, L. S. L., Ribeiro, A.,and Moreira, M. Z.: Using stable isotopes to determine sourcesof evaporated water to the atmosphere in the Amazon Basin, J.Hydrol., 183, 191–204, 1996.
Matsuhisa, Y., Goldsmith, J. R., and Clayton, R. N.: Oxygen iso-topic fractionation in the system quartz-albite-anorthite-water,Geochim. Cosmochim. Acta, 43, 1131–1140, 1979.
McJannet, D., Wallace, J., and Reddell, P.: Precipitation intercep-tion in Australian tropical rainforests: I. Measurment of stem-flow, throughfall and cloud interception, Hydrol. Process., 21,1692–1702, 2007a.
McJannet, D., Wallace, J., and Reddell, P.: Precipitation intercep-tion in Australian tropical rainforests: I. Altitudinal gradient ofcloud interception, stemflow, throughfall and interception, Hy-drolo. Process., 21, 1703–1718, 2007b.
McMahon, J. P., Hutchinson, M. F., Nix, H. A., and Ord, K. D.:ANUCLIM user’s guide, version 1, Centre for Resource and En-vironmental Studies, Australian National University, Canberra,1995.
Moschen, R., Lucke, A., and Schleser, G. H.: Sensitivity of bio-genic silica oxygen isotopes to changes in surface water tem-perature and paleoclimatology, Geophys. Res. Lett., 32, L07708,doi:10.1029/2004GL022167, 2005.
Moss, P. T. and Kershaw, A. P.: The last glacial cycle from thehumid tropics of northeastern Australia: comparison of a terres-trial and a marine record, Palaeogeogr. Palaeocl., 155, 155–176,2000.
Mulholland, S. C.: Phytoliths shape frequencies in North Dakotagrasses: A comparison to general patterns, J. Archaeol. Sci., 16,489–511, 1989.
Neumann, K., Fahmy, A., Lespez, L., Ballouche, A., and Huy-secom, E.: The Early Holocene palaeoenvironment of Oun-jougou (Mali): phytoliths in a miltiproxy context, Palaeogeogr.Palaeocl., 276, 87–106, 2009.
Njitchoua, R., Sigha-Nkamdjou, L., Dever, L., Marlin, C., Sighom-nou, D., and Nia, P.: Variations of the stable isotopic compositionof rainfall events from the Cameroon rainforest, Central Africa,J. Hydrol., 223, 17–23, 1999.
Nott, J., Haig, J., Neil, H., and Gillieson, D.: Greater frequencyvariability of land falling tropical cyclones at centennial com-pared to seasonal and decadal scales, Earth Planet. Sc. Lett., 255,367–372, 2007.
Ometto, J. P. H., Flanagan, L. B., Martinelli, L. A., and Ehrleringer,J. R.: Oxygen isotope ratios of waters and respired CO2 in Ama-zonian forest and pasture ecosystems, Ecol. Appl., 15, 58–70,2005.
Parton, W. J., Schimel, D. S., Cole, C. V., and Ojima, D. S.: Analy-sis of factors controlling soil organic matter levels in Great Plainsgrasslands, Soil Sci. Soc. Am. J., 51, 1173–1179, 1987.
Perry, C. C. and Keeling-Tucker, T.: Biosilicification: the role oforganic matrix in structure control, J. Biol. Inorg. Chem., 5, 537–550, 2000.
Piperno, D. R.: Phytoliths: a comprehensive guide for archaeolo-gists and paleoecologists, Altamira Press, Lanham, p. 238, 2006.
www.clim-past.net/8/307/2012/ Clim. Past, 8, 307–324, 2012

324 A. Alexandre et al.: The oxygen isotopic composition of phytolith assemblages from tropical rainforest soil tops
Piperno, D. R. and Becker, P.: Vegetational history of a site inthe central Amazon Basin derived from phytolith and charcoalrecords from natural soils, Quaternary Res., 45, 202–209, 1996.
Poage, M. A. and Chamberlain, C. P.: Empirical relationships be-tween elevation and the stable isotope composition of precipita-tion and surface waters: considerations for studies of paleoeleva-tion change, Am. J. Sci., 301, 1–15, 2001.
Prior, C. A., Carter, J. A., and Rieser, U.: Are phytolith radiocar-bon dates reliable?, 10th International Conference on AcceleratorMass Spectrometry, Berkeley, USA, 2005.
Rieser, U. and Wust, R. A. J.: OSL chronology of Lynch’sCrater, the longest terrestrial record in NE-Australia, Quatern.Geochronol., 5, 233–236, 2010.
Rieser, U., Carter, J. A., and Prior, C. A.: Phytoliths: a chronome-ter for the late Quaternary, Poster presented at the INQUA 2007Conference, Cairns, Australia, July/August 2007.
Rietti-Shatti, M., Yam, R., Karlen, W., and Shemesh, A.: Sta-ble isotope composition of tropical high-altitude fresh-waters onMt Kenya, Equatorial East Africa, Chem. Geol., 166, 341–350,2000.
Robertson, A. W., Kirshner, S., Smyth, P., Charles, S. P., and Bates,B. C.: Subseasonal-to-Interdecadal variability of the Australianmonsoon over North Queensland, Q. J. Roy. Meteorol. Soc., 131,1–26, 2005.
Rozanski, K., Araguas-Araguas, L., and Gonfiantini, R.: Isotopicpatterns in modern global precipitations, in: Climate change incontinental climate records, edited by: Swart, P. K., Lohmann, K.C., Mc Kenzie, J., and Savin, S., American Geophysical Union,Geophys. Monogr., 78, 1–36, 1993.
Runge, F.:The opal phytolith inventory of soils in central Africa– quantities, shapes, classification, and spectra, Rev. Palaeobot.Palynol., 107, 23–53, 1999.
Salati, E., Dall’Ollio, A., Gat, J., and Matsui, E.: Recycling of waterin the Amazon basin: an isotope study, Water Resour. Res., 15,1250–1258, 1979.
Santos, G. M., Southon, J. R., Druffel-Rodriguez, K. C., Griffin, S.,and Mazon, M.: Magnesium perchlorate as an alternative watertrap in AMS graphite sample preparation: A report on samplepreparation at KCCAMS at the University of California, Irvine,Radiocarbon, 46, 165–173, 2004.
Santos, G. M., Alexandre, A., Coe, H. H. G., Reyerson, P. E.,Southon, J. R., and De Carvalho, C. N.: The Phytolith14Cpuzzle: a tale of background determinations and accuracy tests,Radicarbon, 52-1, 113–128, 2010.
Savin, S. M. and Epstein, S.: The oxygen isotopic compositions ofcoarse grained sedimentary rocks and minerals, Geochim. Cos-mochim. Acta, 34, 323–329, 1970.
Scurfield, G., Anderson, C. A., and Segnit, E. R.: Silica in woodystems, Aust. J. Bot., 22, 211–229, 1974.
Shahack-Gross, R., Shemesh, A., Yakir, D., and Weiner, S.: Oxy-gen isotopic composition of opaline phytoliths: potential for ter-restrial climatic reconstruction, Geochim. Cosmochim. Acta, 60,3949–3953, 1996.
Sharp, Z. D. and Kirschner, D. L.: Quartz-calcite oxygen isotopethermometry: A calibration based on natural isotopic variations,Geochim. Cosmochim. Acta, 58, 4491–4501, 1994.
Shemesh, A., Charles, C. D., and Fairbanks, R. G.: Oxygen isotopesin Biogenic Silica: Global Changes in Ocean Temperature andIsotopic Composition, Science, 256, 1434–1436, 1992.
Siegenthaler, U. and Oeschger, H.: Correlation of18O in precipita-tion with temperature and altitude, Nature, 285, 314–317, 1980.
Stromberg, C. A. E.: Decoupled taxonomic radiation and ecologi-cal expansion of open-habitat grasses in the Cenozoic of NorthAmerica, P. Natl. Acad. Sci., 102, 11980–11984, 2005.
Suppiah, R., Collins, D. A., and Della-Marta, P. M. Observedchanges in australian climate, supporting document for: Climatechange projections for australia, Technical report, CSIRO Atmo-spheric Research, Aspendale, Australia, 2001.
Tracey, J. G.: The vegetation of the humid tropical region of NorthQueensland, CSIRO, 128 pp., 1982.
Twiss, P. C.: Predicted world distribution of C3 and C4 grass phy-toliths, in: Phytolith Systematiccs, edited by: Rapp, G. and Mul-holand, S. C., Emerging Issues. Adv. Archeol. Mus. Sci. I, 113–128, 1992.
Von Grafenstein, U., Erlenkeuser, H., Brauer, A., Jouzel, J., andJohnsen, S. J.: A Mid-European decadal isotope-climate recordfrom 15,500 to 5000 years B.P., Science, 284, 1654–1657, 1999.
Wang, Y., Cheng, H., Edwards, R. L., He, Y., Kong, X., An, Z., Wu,J., Kelly, M. J., Dykoski, C. A., and Li, X.: The Holocene AsianMonsoon: Links to Solar Changes and North Atlantic Climate,Science 308, 854–857, 2005.
Webb, E. A. and Longstaffe, F. J.: The oxygen isotopic composi-tions of silica phytoliths and plant water in grasses: implicationsfor the study of paleoclimate, Geochim. Cosmochim. Acta, 64,767–780, 2000.
Webb, E. A. and Longstaffe, F. J.: Climatic influences on theoxygen isotopic composition of biogenic silica in prairie grass,Geochim. Cosmochim. Acta, 66, 1891–1904, 2002.
Webb, E. A. and Longstaffe, F. J.: The relationship betweenphytolith-and plant waterδ18O values in grasses, Geochim. Cos-mochim. Acta, 67, 1437–1449, 2003.
Webb, E. A. and Longstaffe, F. J.: Identifying theδ18O signature ofprecipitation in grass cellulose and phytoliths: Refining the pa-leoclimate model, Geochim. Cosmochim. Acta, 70, 2417–2426,2006.
Webb, J. A. and Golding, S. D.: Geochemical mass-balance andoxygen-isotope constraints on silcrete formation and its paleocli-matic implications in southern Australia, J. Sediment. Res., 68,981–993, 1998.
Webb, L. J. and Tracey, J. G.: The rainforests of northern Australia,in: Australian vegetation, edited by: Groves, R. H., CambridgeUniversity Press, 87–130, 1994.
Yanes, Y., Romanek, C. S., Delgado, A., Brant, H. A., Noakes, J.E., Alonso, M. R., and Ibanez, M.: Oxygen and carbon stableisotopes of modern land snail shells as environmental indicatorsfrom a low-latitude oceanic island, Geochim. Cosmochim. Acta,73, 4077–4099, 2009.
Clim. Past, 8, 307–324, 2012 www.clim-past.net/8/307/2012/