the ostrobothnian model of smart specialisation
TRANSCRIPT

The Ostrobothnian Model of Smart Specialisation
SEIJA VIRKKALA,ANTTI MÄENPÄÄ &ÅGE MARIUSSEN (Eds.)
PROCEEDINGS OF THE UNIVERSITY OF VAASAREPORTS 195


III
Julkaisija Julkaisupäivämäärä Vaasan yliopisto Marraskuu 2014 Tekijä(t) Julkaisun tyyppi Seija Virkkala Antti Mäenpää & Åge Mariussen (Toim.)
Toimitettu julkaisu Julkaisusarjan nimi, osan numero Vaasan yliopiston julkaisuja. Selvityksiä ja raportteja, 195
Yhteystiedot ISBN Vaasan yliopisto Filosofinen tiedekunta/ Aluetiede PL 700 65101 Vaasa
ISBN 978–952–476–576–3 (print) ISBN 978–952–476–577–0 (online) ISSN ISSN 1238–7118 (print) ISSN 2323–6833 (online) Sivumäärä Kieli 178 Englanti
Julkaisun nimike Älykkään erikoistumisen Pohjanmaan malli Tiivistelmä Älykäs erikoistuminen on EU:n uusi kasvustrategia, jota luonnehtii uusien alueellisten liiketoimintamahdollisuuksien yrittäjämäinen etsiminen, sektorirajat ylittävien toiminto-jen tunnistaminen ja kehittäminen sekä toimintojen priorisointi. Sen keskeinen piirre on ns. triple helix -toimijoiden eli korkeakoulujen, yritysten ja julkisten organisaatioiden välinen yhteistyö. Julkaisussa esitetään tutkimustuloksia näiden tahojen yhteistyösuhtei-den, eli relaatioiden rakenteesta ja toiminnasta Pohjanmaalla. Tutkimus perustuu 53 haas-tatteluun ja yhteistyön rakennetta mitataan mm. kumppaneiden sijainnin ja tärkeyden kautta. Yhteistyötä analysoidaan myös ns. gap/kuilu -indeksillä, joka on tiettyyn relaati-oon kohdistetun osa-alueen odotuksen ja kokemuksen välinen erotus. Tämän avulla saa-daan tietoa yhteistyöverkoston pullonkauloista sekä hyvistä ratkaisuista. Tulosten perusteella Pohjanmaan innovaatiojärjestelmä on yritysvetoinen ja toimijat ovat suhteellisen tyytyväisiä paikallisiin yhteistyökumppaneihinsa. Suhteet ovat tosin epä-symmetrisiä, sillä yritykset tekevät yhteistyötä eniten muiden yritysten kanssa ja julkisen hallinnon toimijat sekä korkeakoulut nojaavat niin ikään enemmän yhteistyöhön yritysten kuin omien sektoreidensa kanssa. Pohjanmaan verkostot ovat kuitenkin yhtenäisiä, sillä yhteistyön odotusten ja kokemusten väliset kuilut ovat suhteellisen pieniä. Erityisesti korkeakoulut ja energiateknologiayritykset ovat hyvin verkostoituneita. Melkein puolet haastatelluista kertoi teknologioiden kehittämisen kumppaneiden sijaitsevan Pohjanmaal-la ja alueella on vahva yrityksiä ja korkeakouluja yhdistävä teknologiatausta. Pohjanmaan älykkään erikoistumisen malli on kehittämisväline, jota voidaan käyttää älykkään erikoistumisen suunnittelussa EU:n eri alueilla. Malli koostuu kyselytutkimuk-sesta, gap -analyysistä, ryhmäkeskusteluista, kehittämistoimenpiteistä ja arvioinneista. Tavoitteena on tunnistaa yhteistyön kuiluja ja kehittämistoimenpiteitä ehdotetaan näiden kuilujen pienentämiseksi, uusien yhteyksien luomiseksi tai heikkojen yhteyksien vahvis-tamiseksi. Asiasanat älykäs erikoistuminen, triple helix, yhdistävyys, alueellinen innovaatiojärjestelmä, gap -analyysi


V
Publisher Date of publication University of Vaasa November 2014 Author(s) Type of publication Seija Virkkala, Antti Mäenpää & Åge Mariussen (Eds.)
Edited Publication Name and number of series Proceedings of the University of Vaasa. Reports, 195
Contact information ISBN University of Vaasa Faculty of Philosophy Regional Studies P.O. Box 700 65101 Vaasa Finland
ISBN 978–952–476–576–3 (print) ISBN 978–952–476–577–0 (online) ISSN ISSN 1238–7118 (print) ISSN 2323–6833 (online) Number of pages
Language
178 English Title of publication The Ostrobothnian Model of Smart Specialisation Abstract Smart specialisation is a new growth strategy within the EU that can be characterised by regional level entrepreneurial discovery, identification and development of cross-sectoral activities, selection and prioritisation of the activities under development, and experimentation. One important aspect is the connectivity of triple helix actors (compa-nies, universities and public organisations). This report describes findings derived from a survey about connectivity in the region of Ostrobothnia. The dynamics of the network were analysed with the help of gap indexes between expectation and experience con-cerning a group of relationships. These indexes provide information about the bottle-necks and good solutions among the relationships of the actors. A detailed questionnaire was prepared and tested, and 53 interviews were conducted in the autumn of 2013. The major finding was that the innovation system in Ostrobothnia is business oriented and relatively well connected. The relations are asymmetric: companies mostly have connections with other companies and both the public and university sectors rely more on the companies than on their own sectors. The networks in Ostrobothnia are locally embedded and cohesive, so gaps are relatively small. The analysis shows that universi-ties and energy technology companies in particular are well connected through their regional triple helix. Almost half of the partners in technological development come from the region, and there is a shared regional technology platform between the univer-sities and the companies. The Ostrobothnian model is a development tool that can be used in smart specialisation planning across the EU. The model consists of surveys, gap analysis, focus group meet-ings, policy measures and evaluation followed up by a repeat of the procedure. The gaps are identified, and policy measures are suggested to bridge the gaps, create new links and strengthen the weak ones. Keywords smart specialisation, triple helix, connectivity, regional innovation system, gap analysis


VII
PREFACE
This publication is the final report of a project on smart specialisation in Ostro-bothnia. The project was initiated by Jerker Johnson from the Regional Council of Ostrobothnia. He also produced the project plan and selected the project’s partici-pants. The project was implemented from December 2012 to April 2014. The other members of the project group were Niklas Ulfvens and Irina Nori (Regional Council of Ostrobothnia), Seija Virkkala, Åge Mariussen and Antti Mäenpää (University of Vaasa, Regional Studies), Josu Takala, Daryna Shylina and Sara Tilabi (University of Vaasa, Industrial Management), Christian Johansson and Peter Björk (Hanken School of Economics, Marketing), Kenneth Norrgård and Kimmo Paulaharju (Vaasa University of Applied Sciences, Information technolo-gy) and Åsa Hagberg-Andersson (Novia University of Applied Sciences).
The project on smart specialisation in Ostrobothnia is a continuation of the Re-gions of Knowledge project (RESGen), which was built up as a triple helix con-cept and as an AMCER (Advanced Monitoring and Coordination of EU R&D Policies at Regional Level) project within the ESPON programme. Ostrobothnia participated in this study with seven other regions. The AMCER project bench-marked the Ostrobothnian regional innovation system with other participating regions providing an outsider view for the region. The project on smart specialisa-tion in Ostrobothnia, based on the findings of these former research projects, aimed to have a regionally structured dialogue on innovation and related policies.
The ideas of the Ostrobothnian model and the related questionnaire have been developed in partnership with many educational institutes and researchers. Indus-trial management researchers led by Josu Takala developed Sustainable Competi-tive Advantage (SCA) methods including gap analysis inside companies. Marius-sen, Mäenpää and Virkkala applied gap analysis in the context of a regional triple helix, and planned the model used in the survey. They also planned the question-naire for the triple helix actors. The other project group members, in particular Jerker Johnson, offered valuable comments on the model and to the questionnaire. We also received useful comments about the questionnaire from Håkon Finne (Sintef, Norway) and Elias Carayannis (George Washington University, USA) at a seminar on 15.3.2013 and in the seminar ‘Measuring Quadruple Helix Connec-tivity: Towards a Strategy for Smart Regional Governance’ on 13.5.2013. The survey and the Ostrobothnian model for smart specialisation were presented by Jerker Johnson in a peer review seminar of the S3 Platform in Vaasa on 14.5.2013, and he received valuable feedback. Subsequently, the survey was pre-sented at many scientific conferences.

VIII
The final questionnaire was challenging for the respondents, and we warmly thank those who gave their valuable time to fill in the questionnaire. The difficult task of conducting interviews with the rather complicated questionnaire was car-ried out by Antti Mäenpää.
During the project, connectivity analysis was developed as a method of regional development policy. This method includes the survey, gap analysis, focus group meetings, policy measures and evaluation. This report presents a connectivity analysis, which we believe is the first step in the smart specialisation strategy of Ostrobothnia. In the concluding chapter, we present our follow-up suggestions for the smart specialisation programmes both in Finland and in Ostrobothnia.
Editors
Seija Virkkala, Antti Mäenpää and Åge Mariussen

IX
AUTHORS Seija Virkkala, Professor of Regional Studies at the University of Vaasa
Antti Mäenpää, Doctoral Student of Regional Studies at the University of Vaasa
Åge Mariussen, Senior Researcher at the Nordland Research Institute (in Nor-way), Leader of Bothnia-Atlantica Institute at the University of Vaasa
Jerker Johnson, International Coordinator at the Regional Council of Ostroboth-nia, Leader of the Ostrobothnian Smart Specialisation Project
Peter Björk, Professor of Marketing at the Hanken School of Economics
Christian Johansson, Statistics Lecturer at the Hanken School of Economics
Daryna Shylina, Doctoral Student of Industrial Management at the University of Vaasa
Sara Tilabi, Research Assistant of Industrial Management at the University of Vaasa
Josu Takala, Professor of Industrial Management at the University of Vaasa


XI
Contents
PREFACE ........................................................................................................... VII
AUTHORS ........................................................................................................... IX
1 INTRODUCTION ........................................................................................... 1 Antti Mäenpää & Seija Virkkala
2 THE ROLE OF SMART SPECIALISATION STRATEGIES IN REGIONAL STRATEGIES .......................................................................... 15 Jerker Johnson
3 INNOVATION, NETWORKS AND CONNECTIVITY AS A PRECONDITION FOR REGIONAL DEVELOPMENT - CONCEPTUAL FRAMEWORK OF THE STUDY ................................................................ 21 Seija Virkkala
4 METHODOLOGY AND RESEARCH DESIGN ......................................... 49 Antti Mäenpää
5 STATISTICAL ANALYSIS .......................................................................... 67 Peter Björk & Christian Johansson
6 APPLYING SUSTAINABLE COMPETITIVE ADVANTAGE (SCA) METHOD FOR REGIONAL INNOVATIONS ............................................ 89 Daryna Shylina, Sara Tilabi & Josu Takala
7 SUMMARY AND CONCLUSION ............................................................. 118 Seija Virkkala, Jerker Johnson & Åge Mariussen
8 TOWARDS A SMART SPECIALISATION STRATEGY IN OSTROBOTHNIA AND FINLAND .......................................................... 133 Åge Mariussen, Jerker Johnson & Seija Virkkala
APPENDICES .................................................................................................... 146


1 INTRODUCTION
Antti Mäenpää & Seija Virkkala, University of Vaasa: Regional Studies
1.1 Objectives of the Study
The aim of our publication is to describe the connectivity of triple helix actors in the region of Ostrobothnia and to introduce a method that can be used in smart specialisation planning in Ostrobothnia and other regions of the EU. This deve-lopment tool is called the Ostrobothnian model of smart specialisation.
The analytical starting point of our tool is the model of the connected–disconnected region (Goddard & Kempton 2011) based on a triple helix setting between companies, universities and public administration. The triple helix fra-mework and the model of the connected-disconnected region are seen in a con-text of regional innovation. The basic hypothesis is that the greater the extent to which different triple helix actors are connected to one another the more innova-tive the region becomes. Therefore it is crucial to analyse and measure the struc-tures and functions of different triple helix relations.
In this study, we map the connections between and within triple helix actors based on methods of social network analysis. The depths of triple helix relations are also studied with the help of the gap analysis approach developed by Ranta and Takala (2007). This method was originally used to measure the operations and risk levels inside companies and was adapted in this study to work for the regional level and between various types of actors.
This background led to the current Ostrobothnian model. Our model for smart specialisation consists of surveys, gap analysis, focus group meetings, policy measures and evaluation. We also use the knowledge taxonomies developed by Lundvall and Johnson (1994) in the framework of the method. We are still testing the connectivity model, but we expect that it can be used as a more general meth-od of regional development policy in other contexts and regions.
According to our main findings, Ostrobothnia is a relatively well connected re-gion but the relations are asymmetric: companies mostly have connections with other companies and both the public and university sectors rely more on the com-pany sector than on their own sectors. It therefore seems that Ostrobothnian inno-vation systems are business driven.

2 Proceedings of the University of Vaasa. Reports Smart specialisation strategies and regional innovation policies can be directed towards nurturing new industries, on the one hand, and towards increasing the innovation potential of the existing ones on the other hand. Regional authorities should seek a good balance between these two tasks. The new industries can be nurtured by searching for new combinations of existing technologies or activities. This process is described in the literature of evolutionary economic geography by the term ‘related variety’, and it is found at the core of the entrepreneurial discov-ery process. The study on smart specialisation in Ostrobothnia was concentrated more on the development of the existing industries and on the enhancement of their innovation potential by analysing the structure and function of the triple he-lix network. However, connectivity analysis can be seen in light of entrepreneuri-al discovery, particularly when the gaps, holes, missing and weak links are identi-fied, and when policy measures are suggested to bridge the gaps, fill the holes, create new links and strengthen the weak ones.
The rest of this chapter introduces the smart specialisation concept, with an em-phasis on the smart specialisation project in Ostrobothnia via six steps of the Guide on Research and Innovation Strategies for Smart Specialisation, also known as the RIS3 Guide (Foray et al. 2012). Chapter 2 discusses the role of smart specialisation strategies among other regional development tools in Finland. Chapter 3 introduces the conceptual framework of our study and the basic re-search questions. The methodology will be described in Chapter 4, which presents the questionnaire and explains the data collection method. Chapter 5 presents the statistical analysis of the empirical findings of our survey. Chapter 6 illustrates data based on Sustainable Competitive Advantage method, and provides another view of the results. Chapter 7 summarises and interprets the empirical findings, and discusses research challenges. It presents connectivity analysis as a regional development model that can be used to prepare and to evaluate development pro-grammes like smart specialisation strategies and transnational learning. In the final chapter, we describe the connections between national (INKA) and regional programmes and suggest further steps for regional smart specialisation strategies in Ostrobothnia and Finland.

Proceedings of the University of Vaasa. Reports 3
1.2 What is Smart Specialisation?
The European Union (EU) has struggled to stimulate the economy of Europe for nearly a decade now. As more production-based work is transferred to Asia, Eu-rope needs good ideas to enhance and sustain its growth. During one brainstorm-ing session in the 2008 Knowledge for Growth seminar in Barcelona, a group led by Dominique Foray came up with a solution for a new European development strategy: a smart specialisation strategy (Foray, David & Hall 2009; Midtkandal & Sörvik 2012; Mariussen 2013: 1). The answer to the challenges of globalisation and economic crisis facing Europe is to create new growth through innovation based on smart specialisation.
The EU is now building an innovation union with a regional innovation policy initiative that includes smart specialisation. Smart specialisation is a strategic ap-proach to economic development through targeted support for research and inno-vation. It is the basis for European Structural Fund interventions and is part of the region’s policy contribution to the Europe 2020 jobs and growth agenda (S3 Plat-form 2014). According to the S3 platform (2014) smart specialisation:
”…involves a process of developing a vision, identifying competitive advantage, setting strategic priorities and making use of smart policies to maximise the knowledge-based development potential of any region, strong or weak, high-tech or low-tech”.
The EU initiated several regional innovation policy programs, of which smart specialisation is the third (RIS3). Many concepts of smart specialisation are rec-ognisable from the earlier initiatives and reveal roots within innovation system theory and science-based R&D, but these concepts are now developed into a mul-ti-dimensional policy approach involving matters of regional development policy (McCann & Ortega-Argilés 2013). Smart specialisation differs from the earlier European level regional innovation strategies because it aims to be an integral part of regional development planning. It reflects the ambition of the European Commission to integrate research policy (Horizon 2020), innovation policy, and the regional development policies of the Structural Funds.
What does smart specialisation mean? Are some economic activities better than others? What kind of development is really the smartest? How do the Europeans determine what is best for all the different regions and countries within Europe? Well, they do not, and that is the whole idea.
Europe contains many different countries and regions, each with its own system for development and innovation, and with a distinct economic background. Thus,

4 Proceedings of the University of Vaasa. Reports the smart specialisation strategy needs to differ in different regions and cannot be formulated on a national level alone. There might be significant differences be-tween regions dedicated for international export or agriculture for instance. Dif-ferent regions have different challenges and also unique abilities to solve them (Midtkandal & Sörvik 2012.)
Thus, being smart is not copying other regions’ great ideas, particularly if the re-gions differ significantly from the home region. Essentially, the idea is to make a strategy for one’s own region based on its strengths. That is why it is crucial to have real experts from the region involved in the development of the strategy. Smart specialisation strategies can be based on existing strategies, as long as those are made for the region in question and can be empirically proved to be accurate (Foray et al. 2012: 8, 11, 18).
Evidence-based strategy is another important aspect of the smart specialisation concept. Essentially, one can separate smart specialisation into two parts: smart and specialisation. The smart part has a couple of components. First, the region has to have some knowledge-based on empirical studies and research that pro-vides an accurate strategic framework (Foray et al. 2012: 8; European Commis-sion 2013: 10). This helps regional politicians make better decisions and discuss strategy with other regional actors. Evidence-based strategy and broad discussions might also gather wider support in the implementation phase of the strategy.
Second, the concept of smart emphasises the role of research units such as univer-sities, or laboratories. In order to promote regional, and therefore, European de-velopment and cohesion, cooperation between regional actors and researchers is crucial. Universities are considered to be the key enablers of regional cooperation and are important partners for the other actors of the region (Foray et al. 2012: 40; Etzkowitz & Leydesdorff 2000: 109–110).
Third, the notion smart also means that economic activities will be more research based. For example, tourist regions and sectors can be developed with research on the experience economy, and the marketing and organising can be based on the application of information technology.
Proper research capabilities are important for the specialisation part of the smart specialisation strategy. Different regions can compete on the global market as much as possible based on the idea of specialisation. Every region within Europe should have its own distinct area of expertise. Related research concerning these areas is very important in the long run, because without research, the development of the regional specialisation might not reach its full potential (Foray et al. 2012: 8; European Commission 2013: 10).

Proceedings of the University of Vaasa. Reports 5
Specialisation or prioritisation is probably the hardest part of the strategy for ma-ny regions. There should not be too many objectives or areas for specialisation. If the development funds spread out to all possible objectives, then none of the ac-tors receive enough funds to fully develop. The regional actors should select only a limited number of high-priority economic activities and these should be based on empirical evidence, as the strategy aims to further enhance the existing know-ledge base and regional-based skills. Smart specialisation means concentrating knowledge resources and linking them to prioritised activities. This allows re-gions to take advantage of scale, scope and spillovers in the production and use of knowledge (Foray et al. 2012: 11, 14–15; Midtkandal & Sörvik 2012; Foray & Goenega 2013: 4).
Emphasis is placed on export-oriented activities that provide income for the re-gional economy. Entrepreneurial expertise is required for strategy formation be-cause entrepreneurs know about the markets, including their challenges and op-portunities. Additionally, entrepreneurial expertise can be found in universities and public organisations, particularly if there are not many companies in the regi-on (Foray et al 2012: 12, 92; Midtkandal & Sörvik 2012).
The entrepreneurial process of discovery is in itself an essential part of smart spe-cialisation. It means that regional actors and partnerships are searching for new business opportunities and evaluating them just as companies do. Regional actors should study the markets they target with their main export items and assess the labour and infrastructure conditions. Then, the regional developers should en-courage cooperation among the different partners: companies, universities and public actors. Regional entrepreneurship is a way of creating new growth and of providing a new way of marketing (branding) the regional economy via speciali-sation.
An important component of smart specialisation is also cross-sector coordination. Such coordination links innovation and science policymaking with Structural Fund strategies of place-based regional and national development. This has been done before, through specific programmes such as the Region of Knowledge pro-gramme. Now, it is becoming mainstream. This is being accomplished in a way that borrows heavily from the regional planning methods of the Structural Funds, where bottom-up processes and place-based development are high on the agenda. Part of this process of cross-sector discovery includes peer reviews of mutual learning. The smart specialisation platform, funded by the EU in 2011 and based in Seville, organises conferences and seminars for the regions in which partici-pants can present their smart specialisation strategies and receive feedback from experts from around Europe.

6 Proceedings of the University of Vaasa. Reports In summary, smart specialisation represents a place-based approach to economic development. The essential characteristic of the strategy includes linking research and innovation with economic development in new ways. Examples include the entrepreneurial process of discovery and the setting of priorities by policymakers in close cooperation with local actors (Foray et al. 2012: 15).
Smart specialisation builds on earlier theories of regional innovation and innova-tion policies while reflecting new theoretical notions. The importance of interac-tion between companies and other actors (universities, public organisations) is emphasised in regional innovation system theories (Cooke, Boekholt & Tödtling 2002; Cooke, Heidenreich & Braczyk 2004), and they were the basis of earlier regional innovation policies of the EU like the Regional Technology Plan (RTP), the Regional Innovation and Technology Transfer Strategy (RITS) and the Re-gional Innovation Strategy (RIS), across the 1990s and 2000s. Innovation as such has become a core element in regional development policies (Morgan & Nauwe-laers 1999).
Previous EU policies to support regional innovation strategies took into account and developed place-based strategies to focus on the unique assets and strengths of the region. When identifying investments in innovation, regions need to diver-sify starting from their existing strengths and skill base, with the application of generic technologies to regionally specific industries and considering the con-nectedness within and between regions (Charles, Gross & Bachtler 2013).
Smart specialisation can be seen as the synthesis of different frameworks, and therefore some concepts might acquire new meaning. For example, the concept of ‘related variety’ developed in the field of evolutionary economic geography, meaning that regional economies can grow when they diversify into sectors simi-lar to the existing regional knowledge base (Frenken, Van Oort & Verburg 2007: 687). In the smart specialisation context, related variety is then the identification and development of relevant cross-sectoral activities. The novel insight is that smart specialisation policy should concentrate on activities instead of sectors or firms. Foray (2011) calls this level of intervention ‘granularity’. For example, a region should develop eco-tourism and not tourism as a sector or specific tourism firms. Alternatively, a region could support nanotechnology applications in the modernisation of the pulp and paper industry and not the industry or specific firms as such.
The second novel insight is the process of entrepreneurial discovery. According to the business theory advanced by Kirzner (Shane 2003) entrepreneurs are continu-ally searching for, identifying and evaluating new business opportunities and this process is called entrepreneurial discovery. According to Foray and Rinoldi

Proceedings of the University of Vaasa. Reports 7
(2013), entrepreneurial discovery at the regional level is what regional policy makers and developers should do, focusing on the activities instead of sectors. Again, this reflects the granularity principle of Foray. The policy makers can search for the entrepreneurial knowledge and discoveries to realise a regional vi-sion. They should be able to differentiate between simple innovation and dis-coveries that have the potential to generate new areas of specialisation and that might constitute the cornerstone of smart specialisation (Foray & Rinoldi 2013).
The third new notion found within smart specialisation is experimentalism. There is no guarantee of success in any particular action; indeed, some actions will lead to failure. Smart specialisation relies on the theories of experimental learning based on Sabel (1992) and on Sabel and Zeitlin (2010), and it develops the idea of self-discovery elaborated by Hausman and Rodrik (2003). According to the ar-gument, innovation policy needs to allow for experiments in order to discover what works and what does not work in a particular context. Failures must also be noted in order to identify success. The idea of discovery and experimentation points to the role of indicators and evaluations (McCann & Ortega-Argilés 2013).
The concept of inclusiveness, new to regional innovation policy, suggests oppor-tunities for all sectors in the regions, even if all sectors or activities cannot be supported. As described earlier, the prioritisation of activities with potential for regional growth is essential for smart specialisation. However, prioritisation will change over time, and eventually new priorities will be identified.
Geographically, the area of cooperation, networking and development is growing as the level of specialisation is narrowing. Most regions rely on global value chains, including flows of knowledge and trade, through access to transnational communities of shared knowledge.
1.3 Six Steps to a Successful Smart Specialisation Strategy and the Smart Specialisation Project in Ostrobothnia
One way to further understand the smart specialisation strategy is to look for in-formation on how to create a successful strategy. These six steps for a smart strat-egy are from the RIS3 guide, which has been created to act as a handbook for smart specialisation (Foray et al. 2012: 27). The different steps are:

8 Proceedings of the University of Vaasa. Reports 1. Analysis of the regional context and potential for innovation. 2. Governance: Ensuring participation and ownership. 3. Elaboration of an overall vision for the future of the region. 4. Identification of priorities. 5. Definition of coherent policy mix, roadmaps and action plan. 6. Integration of monitoring and evaluation mechanisms.
Following these steps should enable regions to create their own strategies for smart growth. However, these steps only provide the framework for a successful strategy. Thus, the order of steps may vary, and at some point a region might need to return to the beginning and conduct further analysis before adapting the final version of the strategy (Foray et al. 2012: 17; Mariussen 2013: 3). We will illumi-nate the smart specialisation project in Ostrobothnia via these steps.
Step 1 begins with an analysis of the regional economy and its capability for in-novation. This is a rather crucial step as the analysis provides the basis for the entire strategy. There are numerous examples of how to analyse regional proper-ties. One might research the economic background, history, demography and oth-er factors. There are many proper methods, and which are used depends on how sound they are and how relevant to the specific region (Foray et al. 2012: 29–30).
The point of departure for a discussion on smart specialisation in Ostrobothnia is that the region lies at the centre of Finland’s energy technology industries, as its largest cluster in the Nordic countries lies within the hinterland of the regional capital, Vaasa. However, Ostrobothnia is also known for two other strong export-related clusters: boat building and fur farming. There were several studies con-ducted on these industries that helped to prove their importance for other regional actors. So, the basis for the specialisation was already clear for the Regional Council of Ostrobothnia and other stakeholders. Furthermore, the basic character-istics of the innovation system in Ostrobothnia were based on findings of other research projects like AMCER, a project of the ESPON programme concentrating on the comparison of eight regions in Europe (AMCER Report 2012); however, the analysis did not stop there.
At the end of 2012, the Regional Council of Ostrobothnia wanted to develop a tool for smart specialisation (as explained in Chapter 4). The Regional Council used the experience of the region’s experts in order to measure the connectivity of the triple helix actors in the region through spesific questionnaires. The intervie-wer also asked about cooperation with the main industries, which confirmed that three industries (energy technology, boat building and fur farming) were impor-tant for different helix actors. The emphasis was on the cooperation of the region-al actors rather than on single industries, although these were also noted.

Proceedings of the University of Vaasa. Reports 9
Step 2 addresses the governance of the strategy and ensures the participation of regional actors. It is important to invite all the regional actors to the process of creating the strategy, as they have the practical knowledge of the region. Accord-ing to the instructions formerly presented in the guide book, companies and uni-versities should be highly appreciated partners in this mutual planning (Foray et al. 2012: 21). In Ostrobothnia the smart specialisation project of developing and testing the gap analysis method was organised as can be seen in the Figure 1.1.
Figure 1.1. The governance of the Ostrobothnian smart specialisation project
Several university project groups and officials from the Ostrobothnian Regional Council were involved in the project work. All members of the working groups and management teams held positions in the steering group. However, this was not a group with the authority to make strategy decisions. There were no company representatives within the project group, but companies were involved as the find-ings from the survey were introduced and discussed in three focus groups where different industries spoke for themselves.
Step 3 concentrates on the creation of a shared vision for the region’s future. The idea is to create such an attractive vision that all the regional actors would want to be part of it. A good vision should map a route to new economic opportunities

10 Proceedings of the University of Vaasa. Reports and address societal challenges; therefore, this vision should represent broad in-terests (Foray et al. 2012: 22, 45–47). The overall vision of the smart specialisa-tion project in Ostrobothnia was constructed on the idea of a ‘Connected Region’, which can also be the long term goal of the Regional Council and one tenet of a smart specialisation strategy.
Step 4 addresses the identification of priorities. The idea is to choose specific and achievable objectives for the use of development funds. These can be different types of projects, or they can promote one type of technology, particularly one of the key enabling technologies. The idea is to set clear examples of smart speciali-sation and outline its benefits; therefore, the priorities should be chosen accord-ingly (Foray et al. 2012: 52; Saublens 2014).
According to the approach in the study, the priorities are defined through gap analysis. Gaps are differences between expectations and experiences of triple he-lix actors concerning cooperation with other actors in the selected three sectors in Ostrobothnia. These priorities most likely involve the promotion of cooperation through mutual projects or can be used for creating forums that promote coopera-tion among certain industries or sectors. The smart specialisation strategy in Os-trobothnia might include other priorities based on, for example, new activities and new combinations of technologies.
Step 5 concentrates on the definition of coherent policies and all the other plan-ning involving the implementation of the project. After the priorities are clarified, this is usually the next step to set the strategy process into motion. The basic idea of this step is to set timetables, and provide funds for projects and create plans for their implementation. One example could be a project that studies the possibility of introducing one of the key enabling technologies to a regionally important in-dustry (Foray et al. 2012: 23).
The smart specialisation project in Ostrobothnia encourages suggestions for poli-cy measures after identifying the largest development challenges in the cooperati-on between triple helix actors. For example, suggestions for concrete plans will be discussed in the focus groups with stakeholders. In Chapter 8 we will suggest development programmes for Ostrobothnia based on the findings of gap analysis.
Step 6 is about monitoring and evaluating the process. Monitoring refers to the actions done to ensure that the strategy is properly prepared and concentrates on the former five steps and their implementation during the process. Evaluation should be made after a strategy has been implemented and there are some results to evaluate. The basic idea is that the strategy is properly pursued, with clear indi-cations of its achievements (Foray et al. 2012: 24, 59; Saublens 2014).

Proceedings of the University of Vaasa. Reports 11
The smart specialisation project in Ostrobothnia, in terms of its evaluation and monitoring stage, uses the gap index as an output indicator for a smart specialisa-tion strategy aimed at improving the connectivity of the region. The policy meas-ure with an objective for better connectivity in the region is a success if the gap index of the specific relationship is reduced after the policy intervention. The idea is to repeat the measurement so as to identify bottlenecks in the triple helix net-work.
The project provides insight into the smart specialisation strategy in Ostrobothnia, particularly through the measurement of connectivity and through the project’s modelling of regional development policy. The model helps to identify the devel-opment challenges and responds by bridging the gaps through policy interven-tions discussed with relevant stakeholders. The gap index can also be an indicator when evaluating the success of a specific policy intervention. This input is only one source of the smart specialisation strategy (Table 1.1). The smart specialisa-tion strategy as a policy programme is still in development, and there remains open questions such as those surrounding entrepreneurial discovery. In Chapter 8, the smart specialisation strategy in Ostrobothnia will be presented in relation to the INKA programme.
Table 1.1. The input of the smart specialisation research project to the smart spe-cialisation strategy in Ostrobothnia
Steps in the smart specialisation strategy
Smart specialisation in Ostrobothnia -project; possible input to smart specialisation strategy
Analysis Connectivity of triple helix actors: structure and func-tioning of the actor network, technology partners
Governance Project governance Stakeholders engagement in focus group meetings
Elaboration of an overall vision ‘Connected region’ Development of selected sectors
Identification of priorities Gaps between expectations and experiences of triple helix actors in the three selected sectors
Definition of policy mix Measures to bridge the observed gaps Monitoring and evaluation Repetition of the survey: Have the gaps been bridged?

12 Proceedings of the University of Vaasa. Reports References
AMCER report (2012). Advanced Monitoring and Coordination of EU R&D Policies at Regional Level. [Web Publication] [Accessed 1.9.2014]. Available at: http://www.espon.eu/ export/sites/default/Documents/Projects/TargetedAnalyses/ AMCER/DFR/AMC ER _Draft_Final_Report _v1.pdf.
Charles, D, Gross, F. & Bachtler, J. (2013). Smart Specialisation as an Evolution in Regional Innovation Policy. [Seminar presentation at Regional Studies Associ-ation network: Understanding Regional Innovation Policy Dynamics: Workshop on Regional Innovation Policy Dynamics: Actors, Agencies and Learning. 23-24 September 2013] Manchester: University of Manchester.
Cooke, P., Boekholt, P. & Tödtling, F. (2002). The Governance of Innovation in Europe: Regional Perspectives on Global Competitiveness. London: Pinter.
Cooke, P., Heidenreich, M. & Braczyk, H.-J. (Eds.) (2004). Regional Innovation Systems: the Role of Governance in a Globalized World. 2th ed. London: Routledge.
Etzkowitz, H. & Leydesdorff, L. (2000). The Dynamics of Innovation: From National Systems and "Mode 2" To a Triple Helix of University Industry Gov-ernment Relations. Research Policy 29, 109–123.
European Commission (2013). Regions Spearhead Eco-Innovation and Smart, Sustainable Growth. Panorama Inforegio 47: 8–11.
Foray, D. (2011). Smart Specialisation: From Academic Idea to Political Instru-ment, The Surprising Destiny of a Concept and the Difficulties Involved in its Im-plementation. [Prepared for European Integration process in the new regional and global settings. Warsaw, October 19th and 20th, 2011].
Foray, D., David, P. & Hall, B. (2009). Smart Specialisation – The Concept. Knowledge Economists Policy Brief 9.
Foray, D., Goddard, J., Beldarrain, X., Landabaso, M., McCann, P., Morgan, P., Nauwelaers, C. & Ortega-Argilés, R. (2012). Guide to Research and Innovation Strategies for Smart Specialisation (RIS3). Europe: European Commission.
Foray, D. & Goenaga, X. (2013). The Goals of Smart Specialisation. S3 Policy Brief Series 1. Europe: European Commission.

Proceedings of the University of Vaasa. Reports 13
Foray, D. & Rinoldi, A. (2013). Smart Specialisation Programmes and Imple-mentation. S3 Policy Brief Series 2. Europe: European Commission.
Frenken, K., Van Oort, F. & Verburg, T. (2007). Related Variety, Unrelated Vari-ety and Regional Economic Growth. Regional Studies 41: 685–697.
Goddard, J. & Kempton, L. (2011). Connecting Universities to Regional Growth: A Practical Guide. Europe: European Union.
Hausman, R. & Rodrik, D. (2003). Economic Development as Self-Discovery. Journal of Development Economics 72: 2, 603–633.
Kempton, L., Goddard, J., Edwards, J., Hegyi, F. & Elena-Pérez, S. (2013). Uni-versities and Smart Specialisation. S3 Policy Brief Series 3. Europe: European Commission.
Lundvall, B.-Å. A. & Johnson, B. (1994). The Learning Economy. Industry & Innovation. 1: 2, 23–42.
Mariussen, Å (2013). Smart Specialisation: Reinventing Regional Systems of Innovation. Botnia Atlantica -Institute Newsletter 1, 1–3.
McCann, P. & Ortéga-Argiles, R. (2013). Modern Regional Innovation Policy. Cambridge Journal of Regions, Economy and Society 6, 187–216.
Midtkandal, I. & Sörvik, J. (2012). What is Smart Specialisation? [Web page] [2.12.2013]. Available at: http://www.nordregio.se/en/Metameny/ Nordregio-News/2012/Smart Specialisation/Context/.
Morgan, K. & Nauwelars, C. (1999). Regional Innovation Strategies: The Chal-lenge for Less-Favoured Regions. Regions, Cities and Public Policy Series. Lon-don: Regional Studies Association.
Ranta, J.-M. & Takala, J. (2007). A Holistic Method for Finding out Critical Fea-tures of Industry Maintenance Services. International Journal Services and Standards 3: 3, 312–325.
Sabel, C. (1992). Learning by Monitoring: The Institutions of Economic Devel-opment. Working Paper 102. New York: Colombia University School of Law.
Sabel, C. & Zeitlin, J. (2010). Learning from Difference: The New Architechture of Experimentalsit Governance in the EU. In Sabel, C. & Zeitlin, J. (Eds.) Exper-imentalist Governance in the European Union: Towards a New Architecture. Ox-ford: Oxford University Press. 1–28.

14 Proceedings of the University of Vaasa. Reports Saublens, C. (2014). Research and Innovation Strategies for Smart Specialisa-tion (RIS3): The Steps. [Web Page] [Accessed 7.1.2014] Available at: http://www.know-hub.eu/knowledge-base/encyclopaedia/research-and-innovation-strategies-for-smart-specialisation-ris3-the-steps.html.
Shane, S. (2003). A General theory of Entrepreneurship: The Individual-Opportunity Nexus. New Horizons in Entrepreneurship Series. Northampton: Ed-ward Elgar Publishing.
S3 Platform (2014). What is Smart Specialisation? [Web Page] [Accessed 1.9.2014] Available at: http://s3platform.jrc.ec.europa.eu/home.

Proceedings of the University of Vaasa. Reports 15
2 THE ROLE OF SMART SPECIALISATION STRATEGIES IN REGIONAL STRATEGIES
Jerker Johnson, Regional Council of Ostrobothnia
The purpose of this chapter is to analyse the shortcomings of the current regional planning system and to describe the added value of preparing Regional Innovati-on Smart Specialisation Strategies (RIS3). This chapter will provide the rationale for the smart specialisation project in Ostrobothnia and explain the reasons behind the solutions adopted in the Ostrobothnian model for RIS3.
2.1 The Planning Instruments
The point of departure in programme based regional development is that regional development is not an issue for any single institution but requires wide cooperati-on in the use of regional development resources. The Law on Regional Develop-ment and the Administration of the Structural Funds (2014/7) stipulates that the responsibility for regional development lies with the municipalities and with the state. Regional Councils, as joint municipal organisations, were established to administer this dual responsibility. They are governed by their own political body with a basis in municipal elections and represent the regional development autho-rity and have an obligation to provide planning documents expressing regional ‘political will’. The documents are also expected to incorporate state initiatives and plan their implementation regionally. In this way the Regional Councils are assigned a role of mediating between state and regional desires in order to pro-mote a smooth functioning regional development system.
The Regional Strategy document defines the most important development efforts in the region and is a combination of the desired long-term development goals, necessary strategic choices, development strategies and the most important pro-jects in terms of regional development. To implement the Regional Strategy the Councils prepare an Implementation Plan every two years. This includes the most important projects and other measures executing the Regional Strategy and other development programmes, together with details of the required financing.
The Spatial Plan is a general plan outlining the use of land in the region or parts of the region. The plan sets out the principles of land use and community structu-re and designates areas requiring regional development. The purpose of the plan is to settle national, regional and sub-regional land use issues. It is used as a gui-

16 Proceedings of the University of Vaasa. Reports deline when drawing up and amending local master plans and detailed local plans, and when other measures are taken to organise land use.
However, these documents, written in general terms, are legally non-binding and usually used as a basis for negotiations with the state government. The Regional Strategy finds its concrete form in the Implementation Plan that is essentially a tool for influencing the state budget. The Spatial Plan is approved by the Ministry of Environment after consultations with the Regional Councils. After being ap-proved it will provide the framework conditions for detailed local plans.
2.2 Challenges in Forming Tools for Regional Innovation Policy
The ambitious task of combining all development measures in one document may sound attractive but is an illusion in practice. Below, we will argue the case and explain why the political process of setting up the documents will not necessarily provide a list of development measures in terms of importance, when considering innovation. Previously, there was an emphasis on innovation, but this has become more pronounced with the introduction of smart specialisation as a central tool in regional policy aimed at fostering innovation and competitiveness.
The Regional Strategy is being taken at face value as representing the political will of the region. When expressing that will, the political parties function as gatekeepers, and with existing institutions they define the agenda. This is an im-portant democratic process but does not necessarily foster competitiveness, as it is claimed to do. Competitiveness that requires innovation is connected to continuo-us structural change with both ‘sunrise’ and ‘sunset’ industries. The sunset indust-ries are most likely to lobby the political process and, pointing to visible effects, can provide strong political arguments; in contrast, sunrise development is aca-demically more difficult to discover and do not have political advocates as the visible positive effects are only gradually emerging.
In addition to industry, public administration has a strong involvement in the pro-cess. Structural changes also modify the service needs and duties of administrati-ve actors. Experience has shown that there are strong inter-ministerial rivalries when different ministries are not de facto prepared to open the content of their regional programmes for consideration and when they are not prepared to discuss their budgetary resources. Additionally, when facing budget shortages there is an increasing desire from a national level to coordinate EU policies with national ones or subordinate them.

Proceedings of the University of Vaasa. Reports 17
The discussion between the municipalities and the state is problematic because the actors have different competencies and will focus their interest and gain expe-rience in different fields. Development planning, linked to programme planning and the regional implementation of the European Structural Funds, differs from municipal planning, with its strong emphasis on spatial planning. This renders the Regional Councils quite weak, as they do not possess the resources of state actors or the strong support of municipalities, except when municipal politicians also hold high state-level political positions.
This weak position can also be observed in the planning documents. The AMCER study labels the Ostrobothnian regional innovation system governance ‘dirigiste’, implying that the primary source of initiative lies outside the region and that the financing is centrally determined with decentralised units in the region. The plan-ning is supposed to prepare for the local implementation of these central initiati-ves. Analysing the contents of the Plans of Implementation in 2005 revealed how similar the programmes were for the five regions comprising the West-Finland Alliance (Johnson & Mäkinen 2005). The role of the universities in development was a prominent feature of the agenda in all regions, but was even more pronoun-ced in those regions lacking their own regional universities. The obvious conclu-sion was that the plan was seen as a way to secure funding by communicating political support for investments rather than as a sound analysis of the regional innovation system. The logic behind this action is that the development objectives would materialise via the implementation of the actors’ proposals. Therefore, the role of planning is not strategic but simply to trigger funding. Nevertheless, single applicants cannot be given complete responsibility for regional development, par-ticularly in situations when the objectives are vague.
A place-based approach would be a valuable learning journey to make better and more informed decisions. For instance, the findings of the smart specialisation project in Ostrobothnia confirm one result of the AMCER project that was al-ready known in Ostrobothnia: The RIS in Ostrobothnia is business-driven, and not university-driven, something that requires a different approach.
Linking plans of implementation to budgetary practices hinders the development of the strategic process. Regions are encouraged to make choices in planning. Those choices are expressed in the verbal parts of the plan, but since this process includes a prisoners’ dilemma, the regions will argue their case in relation to eve-ry budgetary item. This was observed in the 2005 study where each region solici-ted more funding on each budgetary item and thereby disqualified themselves from being serious discussion partners. However, this is an obvious outcome as there are no quotas or mechanisms through which regions might swap financing

18 Proceedings of the University of Vaasa. Reports according to strategic ambitions. The conclusion is that the planning process forms a political platform for regional political action rather than for a strategic process.
2.3 Novelties Provided by the Smart Specialisation Process
The European Commission (EC) has tied the administration of Structural Funds to regional planning. With the introduction of smart specialisation and the ex-ante conditionality for ERDF (European Regional Development Funds) financing, the EC has also introduced innovation as a target for regional planning. In the Ostro-bothnian approach, this is manifested in the consideration of the most urgent gaps in the RIS and by finding appropriate measures to bridge these gaps. This differs from the traditional perspective adopted in regional planning which seeks to coordinate and mediate political desires. Coordination is important to guarantee the smooth functioning of regional administration but does not necessarily promo-te innovation.
The Ostrobothnian smart specialisation model is a place-based solution. It was created on the basis of the concrete development problems identified in the Ost-robothnian RIS by the AMCER project. It is based on a model where long-time leading exporters are assumed to be at the forefront of innovation. It is a com-monly accepted fact that firms working in an international environment also tend to be more innovative. In this case it was also confirmed by counting the number of registered patents by the European Patent Office (EPO). In order words, it can be claimed that the model is an evidence-based model.
Previously, the export industries had been in focus when considering regional development measures but were not addressed in a systematic way. The final re-port of the AMCER project called for triple helix coordination. This has been applied and the triple helix discussion is now formalised around innovation part-ners and key enabling technologies. A method to measure the triple helix connec-tivity was introduced; and connectivity is in the model assumed to be connected with innovation. This transfers planning from a political process towards a stake-holder process focusing on bridging gaps in the innovation system. The vision of the model is one of a connected region which is defined as one where the helix innovation partners within and between the helixes have both high ‘experience’ and high ‘expectations’. Studying and bridging gaps forms the basis for policy, and where the regional level is not an appropriate level, the results form the basis for a multi-level dialogue on regional innovation.

Proceedings of the University of Vaasa. Reports 19
The study on the regional plans of implementation was conducted in 2005, but there is no reason to believe that the meta-logic of preparing the plans has chan-ged, even though the environment or context has changed. There is a stronger quest for innovative measures in planning just as the financial outlook is beco-ming dire. Available resources have diminished and this is likely to continue. This puts the focus on entrepreneurial discovery on spotting new opportunities. The concept should be understood as not only applying to firms but also as including new ways of working for all the helix categories. Repeating the structuralised dialogue by analysing gaps in the innovation network, combined with focus group seminars, is assumed to foster new ways of working. This will be combined with a similar analysis in partner regions where the regions can learn from one another by comparing and contrasting scoring and reasons behind the results. In addition to the dialogue among the stakeholders, the process was fitted with an interactive web-application. It is hoped that this will further benchmark the innovation dis-cussion outside the partnerships and provide feedback for consideration.
2.4 Conclusions Regarding Novelties versus Challenges
The challenges presented above were due to the different perspectives held by various actors in regional development and the meta-logic behind the financing. The essence in the novelty provided by the smart specialisation process lies in visionary leadership. The model, with subsequent analysis, provides a vision of innovation as a process of innovation by related variety. It also provides a frame-work for gradual learning among the actors.
It is believed that this model will gradually influence the actors involved, depen-ding on whether the project gains regional momentum and political support. The economy remains volatile, and the planning work is undergoing major administra-tive changes. In this context, actors are likely to consider new ways of working.
The method promotes horisontal coordination through an annual triple helix dia-logue. The actions based on dialogue are dynamic and have a basis in identified gaps. The method will provide the means to constantly address the challenges involved in the implementation of the RIS. This problem-based approach differs from the administrative approach previously applied.
The Councils have been participating in a dialogue with the Ministry for Econo-my and Employment to prepare the ERDF programme and the national innova-tion strategy for smart specialisation. Although it has been known since autumn

20 Proceedings of the University of Vaasa. Reports 2011 that RIS3 will be an ex-ante condition, little national attention was paid to the issue. Instead, lengthy discussions and arm twisting over the governance mo-del took place, and the content of the innovation strategy was left to the eleventh hour. This project reverses that perspective, making learning and cooperation the centre of attention.
References
Johnson, J. & Mäkinen, M. (2005). Maakuntaohjelman toteuttamissuunnitelma: vuorovaikutuksen vai reviirikamppailun väline [Implementation Plan: a Tool for Regional Cooperation, or Competition]. Hallinnon tutkimus 2, 158–167.

Proceedings of the University of Vaasa. Reports 21
3 INNOVATION, NETWORKS AND CONNECTIVITY AS A PRECONDITION FOR REGIONAL DEVELOPMENT - CONCEPTUAL FRAMEWORK OF THE STUDY
Seija Virkkala, University of Vaasa: Regional Studies
This chapter introduces the conceptual framework of a smart specialisation study in Ostrobothnia. The key concepts are innovation, networks and connectivity. The chapter concentrates on regional innovation studies, the triple helix thesis and network analysis. While regional innovation studies emphasise business innova-tion, the triple helix framework points to the important and changing role of uni-versities. The triple helix framework is used to shed light on the connectedness between actors. These two approaches are seen as complementary approaches to the problem of innovation.
First, we aim to describe the connectivity of regional triple helix actors in Ostro-bothnia, and second, we introduce a regional policy method which can be used for smart specialisation in Ostrobothnia and possibly in other regions in the European Union (EU). This chapter aims to provide the theoretical building blocks for con-nectivity analysis and for a regional development policy model. The theoretical background of gap analysis developed by industrial management researchers is introduced in Chapter 6.
The final part of the chapter will sum up the conceptual framework and formulate research questions.
3.1 Systemic Innovation Concepts, Regional Innovation Systems, and Knowledge Typologies
Due to the challenges of globalisation, regional economies and firms have to con-tinuously renew and reinvent themselves in order to remain competitive. Innova-tion has been seen both in theory and in practice as the driving force of national and regional economies, and the response to the challenge of regional renewal has been innovation and regional innovation policies. Almost every region has inno-vation potential but this capacity differs between regions due to the different his-tories and institutional and economic structures established in the past. According to Cooke, Heidenreich & Braczyk (2004), this variety of innovation potential should be recognised. Different industries innovate differently, and there are also different innovation modes.

22 Proceedings of the University of Vaasa. Reports Innovation can be defined as a new creation with economic significance. It can be seen as a process that results in new processes, products, markets or ways of or-ganisation, according to Schumpeter. According to a broad definition, innovations are new solutions and continuous renewal of firms, regions, and nations. Tradi-tionally, innovation has been conceptualised as a linear process from basic re-search via technology or applied research to commercialisation in the firms. However, today the world is more complex and innovation is conceptualised as a systemic and interactive process (Lundvall 1998). According to the innovation system literature, innovation processes are seen as interactions between and with-in firms, and between firms and other organisations such as educational and re-search institutes and government agencies. Innovation processes and innovation networks are the basis of economic development in the regions. The more com-plex the innovations are, the more firms need different types of technologies and competences, as well as knowledge produced outside the firms by research insti-tutes and knowledge-intensive business services (KIBS) for example (Varis & Littunen 2012). Complex innovation suggests an even greater need for coopera-tion between firms and universities as has been conceptualised in the triple helix model.
In the theories of regional innovation or geography of innovation, the regional level is seen as the most appropriate spatial level for studying innovation process-es, the critical actors involved and the factors contributing to this innovation. The emphasis on the regional level in innovation studies originated with Alfred Mar-shall’s industrial district concept, and later expanded to include many theories and concepts such as clusters, new industrial spaces, technology districts, local pro-duction systems, innovative milieus, learning regions, regional innovations net-works, and regional innovation systems. In the late nineteenth century, Marshall attributed the spatial clustering of industries to specialised labour markets, local access to specialised suppliers and large markets, and to the presence of local knowledge spillovers. These concepts share an emphasis on the region as the loci of production and innovation activities (Moulaert & Sekia 2003). In this article, we discuss two of these theories: the regional innovation system (RIS) and the triple helix framework, which can be seen as complementary approaches to the renewal of regions. While RIS points to innovations in firms, the triple helix framework emphasises the new role of universities. To be effective, innovations should draw upon the capabilities of the region.

Proceedings of the University of Vaasa. Reports 23
3.1.1 Regional innovation systems
The notion of the RIS has been popular both in academic literature and in policy practice. The term has been used and interpreted in many ways. A regional inno-vation system (RIS) can be defined as interacting knowledge creation and exploi-tation subsystems linked to global, national and regional systems (Cooke et al. 2004). In this definition, the knowledge generation subsystem consists of public and private research laboratories, universities, higher educational institutes (HEIs) and technology transfer agencies. The exploitation subsystem is understood as the regional production system consisting of firms. The RIS approach emphasises the role of innovation networks as well as of intermediary organisations transferring the knowledge between knowledge institutions and firms. Firms in regional clus-ters or a RIS can acquire knowledge for innovation from knowledge institutions in their regions, from national institutions or from institutions in other countries. The regional firms can be embedded in national systems, and simultaneously par-ticipate in global value chains and product networks (Virkkala 2013). An RIS may take many different forms, affecting the way innovation processes and colla-borative relationships are organised (Asheim & Isaksen 2002; Cooke et al. 2004). RIS normally contains and supports several clusters representing different sectors, and as an open system, RIS can generate knowledge dynamics across different sectors.
The region of Ostrobothnia was one of eight European regions that participated in a project of ESPON programme comparing different RISs and their performance. The AMCER project used a typology of regional innovation system developed by Cooke et al. (2004). In the project, RIS was defined by a governance dimension and by a business innovation dimension (AMCER Report 2012). Governance comprises public policy, institutions, and knowledge infrastructure as integrated parts of the regional innovation processes. Three types of RIS can be identified: grassroots, network, and ‘dirigiste’. Grassroots is the regional level where the innovation system is generated and organised. Financial support and research competences are diffused regionally, with little supranational coordination. Re-gional development agencies and regional institutional actors play a dominant role (Cooke & Morgan 1998). A network RIS is likely to occur when the institu-tional support encompasses local, regional, federal, and supranational levels, and funding is guided by agreements among banks, government agencies and firms. The research competences are likely to mix pure and applied research, and explo-ration and exploitation activities are geared to the needs of large and small firms. The level of coordination is quite high, due to the existence of many stakeholders as well as associations and forums. The degree of specialisation is more flexible than dedicated, because the system hosts various firm scales and types (Cooke

24 Proceedings of the University of Vaasa. Reports 1998). A dirigiste RIS is animated mainly from outside and above the region it-self. Innovation often flows from central government policies. Funding is central-ly determined, with decentralised units located in the region. Research competen-ces are predominantly basic and often linked to the needs of larger, state-owned firms in or beyond the region. Since the system is state run, the coordination level is potentially quite high and the degree of specialisation is also likely to be high (Cooke 1998).
The business innovation dimension (Cooke et al. 2004) is linked to the industrial base characterised in terms of productive culture and systemic innovation. Of special interest is the role of lead firms, the emphasis given to private or in-house research over public research and the nature of the innovation milieu in which firms operate. There are three different forms of RIS resulting from this dimensi-on: the ‘localist’, the interactive, and the globalist. In the localist form, RIS is dominated by smaller firms, and there will be a reasonably high degree of asso-ciation among entrepreneurs, as well as between entrepreneurs and local policy-makers. A localist framework will probably have few major public innovation or R&D resources, and some smaller private ones (Cooke et al. 2004). An interacti-ve RIS is one where there is balance between large and small firms. Larger firms with regional headquarters, with the regional government, are keen to promote the innovation base of the economy. There is a mix of public and private research institutes. The association in local and regional industry networks, forums, and clubs is about average. In the globalised RIS, the innovation system is dominated by global corporations, often supported by clustered supply chains of dependent small- and medium-sized enterprises (SMEs). The research reach is more private than public, although a public innovation structure aimed at helping SMEs may have developed. Cooperation is based on the needs of large enterprises, and con-ducted to a significant extent on their terms. Ostrobothnia was characterised as a dirigiste and globalised RIS.
3.1.2 Knowledge typology and modes of innovation
Knowledge exists in many forms and emerges in complex systems of research, business, and public spheres as well as inside organisations. Codified knowledge consists of information that can be written in an explicit form. Tacit knowledge is acquired through experience, demonstration, and practice, requiring personal phy-sical interactions. According to Nonaka and Takeuchi (1995) knowledge is crea-ted within and between organisations in the interaction with the tacit and codified knowledge through a ‘knowledge spiral’.

Proceedings of the University of Vaasa. Reports 25
According to Lundvall and Johnson (1994), knowledge is a various mix of codi-fied and tacit elements and is defined in aspects of ‘know-how’, ‘know what’, ‘know-why’ and ‘know-who’ as follows:
– Know-how defines how things are going in practice, the fingertips how to per-
form skills.
– Know what is knowledge about facts (like facts on regions, inhabitants, indus-trial structure) and it describes what is going on.
– Know-why is knowledge that explains why things are done in certain ways (or theories of the reasons of development), the principles and laws of nature, in the human mind, and of society.
– Know-who identifies the actors and partners, and also who is authorised to make decisions. It is knowledge regarding who knows what (Lundvall and Johnson 1994).
These dimensions of knowledge will be used in the smart specialisation survey to define the depth of the relationship concerning respondent’s knowledge of his/her partner. The deeper the relationship, the more dimensions the respondent knows about his/her partner’s activities relevant to innovation. This knowledge ta-xonomy will also be used as a theoretical framework of the regional development model based on connectivity analysis.
Jensen et al. (2007) introduces two modes of innovation: science, technology and innovation (STI) and doing, using and interacting (DUI). The STI mode of lear-ning and innovation is based on the production and use of codified scientific and technical knowledge, whereas the DUI mode is an experience-based mode of learning that relies on informal processes. The STI mode prioritises the producti-on of ‘know-why’ while the DUI mode typically prioritises ‘know-how’ and ‘know-who’ (Jensen et al. 2007). ‘Know-how’ and ‘know-who’ are typically ta-cit, while innovations mainly focus on incremental changes in existing products and processes. In the DUI mode, crucial knowledge in innovation processes is formed through a combination of the employees’ education and work life expe-rience. The knowledge base is developed through in-house problem-solving by individuals and teams of workers, and this emerges, for example, when firms co-operate with customers who are facing new problems, and when suppliers engage in innovation activity (Jensen et al. 2007; Isaksen & Karlsen 2010; Virkkala 2013). The DUI mode is based on synthetic and symbolic knowledge (Mar-ket/user-driven) emphasising competence building and organisational innova-tions, but analytical knowledge is more important in the STI mode of innovation.

26 Proceedings of the University of Vaasa. Reports 3.2 Triple Helix and Connected-Disconnected Regions
The triple helix model, based on close interaction between universities, com-panies and public institutions, was launched by Etzkowitz and Leydesdorff (2000; Leydesdorff & Etzkowitz 1998). In this article, the triple helix model is used as a heuristic for empirical study of connectivity, which is seen as a precondition for regional innovation processes. A ‘helix’ refers to the spiral ways in which various bodies are intertwined, as for example a double-winding staircase (Qvortrup 2006).
The operating codes of the helices are different. The scientific system com-municates and functions in accordance with the code of true/false, and it uses a great deal of energy on testing its own results, academic discussion and falsifica-tion attempts for example. The research system observes itself by the develop-ment and use of methods and theories, since these are the way to generate new knowledge. New knowledge is inherently important, whether it is useful or not (Qvortrup 2006 based on system theory of Niklas Luhmann 1995).
The economic system communicates and acts in accordance with the code of pro-fit/loss. The system is result-oriented and competition is seen as an incentive to raise productivity and to reduce costs, and the business plans are important (Qvortrup 2006). Companies make their special contributions, which are useful products and services and financial profits. However, the companies also observe the outside world via this optic: they attempt to impose targeted behaviour on both the scientific system and the public sector, encouraging both parties to focus on use-value.
The public sector communicates and acts in accordance with the code of right/wrong: services are supplied rightly or wrongly in relation to politically de-fined needs, meaning they are politically correct or incorrect. The public sector observes itself and its own degree of success via a politicised optic. The public sector supplies special products like welfare services. It regulates private com-panies’ behaviour on the basis of collective welfare criteria (Qvortrup 2006). The public sector also regulates and plans the institutions supporting innovation in the regions (See Table 3.1).

Proceedings of the University of Vaasa. Reports 27
Table 3.1. Three helices and their tasks according to the system approach (based on Qvortrup 2006 and Etzkowitz and Leydesdorff 2000)
Character Science Business Public sector The operation code True/false Profit/losses Right/wrong Way to operate Theories, meth-
ods, Verification, falsification
Results, business plans
Governance of other sectors
Self-evaluation Peer reviews Profitability Implementation of decisions and political plans according to crite-ria: democracy etc.
‘Products’ Articles, reports, books
Products and services
Welfare services, guidance of regional development
Time horisons Long Short Short/long
In industrial society, universities and business entities were more independent under the guidance of the state. Today in the knowledge society, these sectors or helices are more engaged in interaction, with overlapping domains. When the helices are overlapping, each of the helices takes the roles of others. Former boundaries between private and public research and applied research are crum-bling. Research that had been previously conducted in universities has now been redefined, and new forms of cooperation and institutions for research work have been developed. Universities emphasise entrepreneurial tasks, such as creating companies, while industrial enterprises take on the academic dimensions of sha-ring knowledge and training employees. The third mission of economic develop-ment has emerged to supplement the earlier missions of university teaching and research (Etzkowitz & Leydesdorff 2000). According to the triple helix thesis, the potential for innovation and economic development lies in a more prominent role for the university and in the hybridisation of elements from universities, industry and government. The non-linear interactions between the helices can generate new combinations of knowledge and resources that can advance innovation at the regional level (Ranga & Etzkowitz 2013).
The institutional spheres of universities, industry and government interlink in different ways, and the triple helix model exhibits variants in different regimes (Etzkowitz & Leydesdorff 2000). In a statist regime, government plays a leading role driving academia and industry but also in limiting their capacity to initiate and develop innovative transformations (Russia, China and Latin America). In a laissez faire regime characterised by limited state intervention (USA, Western Europe) industry is the driving force, with the other two spheres as ancillary sup-

28 Proceedings of the University of Vaasa. Reports port structures and limited roles in innovation: universities acting mainly as pro-viders of skilled human capital, and government mainly as a regulator of social and economic mechanisms. The institutional spheres have strong borders, and highly circumscribed internal relations. In the transition to a knowledge society, a balanced regime is emerging, whereby universities and other knowledge institu-tions play a greater role, acting in partnership with industry and government and even taking the lead in joint initiatives (Etzkowitz 2008). This variant denotes a knowledge infrastructure that takes the roles of the other and that produces hybrid organisations. The objective is to realise an innovative environment consisting of university spin-off firms, tri-lateral initiatives for knowledge based economic de-velopment and strategic alliances among firms, government laboratories and aca-demic research groups (Etzkowitz & Leydesdorff 2000; Tuunainen 2002). Ac-cording to the triple helix balanced model, the best environments for innovation are created at the intersection of the spheres (see Figure 3.1). This is where creati-ve synergies emerge and spark the process of innovation, and create new venues for interaction and new formats (Etzkowitz & Leydesdorff 2000). In the intersec-tion of these helices are found hybrid organisations, which in our case study are local development organisations acting as bridge builders between firms, univer-sities and public sector, developing the regional economy and supporting local firms with knowledge of extra-regional networks.
Figure 3.1. Triple helix, balanced model (Etzkowitz & Leydesdorff 2000: 111)

Proceedings of the University of Vaasa. Reports 29
The notion of a quadruple helix refers to other actors besides universities, firms and public sector actors. These are users of innovations and this fourth helix can be seen as representing civil society, as well as an organisational counterpart of an open and user-centred innovation policy (Foray et al. 2012: 37). According to Carayannis and Campbell (2012: 17), the fourth helix represents media, culture and civil society. User reflections are important in producing many products and services that aim to improve living conditions. In the triple helix model applied in the Ostrobothnian survey (see Figure 3.2), media and culture sector are included but not as a separate helix; instead they are part of either the public or business sectors. The interest groups important in the Nordic corporative societies, such as trade unions, employers’ unions, and farmers’ unions can be counted in the public sector. In addition, hybrid organisations such as development organisations were counted as part of the public sectors whereas media was part of business sector. Caryannis and Cambell (2012) include the fifth sector representing the environ-ment, but in our framework, the fifth sector (which is quintuple helix) was rep-resented by the environmental authorities in the public sector. Therefore, the fra-mework used in the survey contained elements of five helices, but empirically had three helices (Mäenpää 2014: 35–43).
Figure 3.2. The triple helix model applied in the Ostrobothnian smart specialisa-tion survey (Mäenpää 2014: 42)

30 Proceedings of the University of Vaasa. Reports The concepts based on notions of a triple helix and a quadruple helix, which are used in regional innovation policies, and especially in smart specialisation, are connected and disconnected regions. A connected region is a norm or vision ac-cording to which the actors of different helices are working in the same direction and linked to economic development and innovation. The three helices work in harmony with one another, thereby mutually reinforcing each other (European Commission 2011; Goddard, Kempton & Vallance 2013). In a connected region, the universities, industry and government coevolve and interact through an over-lay of recursive networks and organisations (Dolfsma & Leydesdorff 2009).
“The public sector speaks with one voice in their understanding of the issues fa-cing the region and how to overcome them, and has the mechanisms and political will to build consensus. The private sector has a coherent and representative voi-ce and the willingness to work beyond the parameters of the self-interest of their business/sector. There are synergies between the intellectual asset of the region’s universities and the needs of business in developing innovation capacity. The uni-versities in the region see themselves as being for the region and not just of the region and are willing partners in the process.” (Foray et al. 2012: 46).
In a disconnected region, there are no boundary spanners, the partnerships are ineffective or non-existent, and there is a lack of understanding about the changes. Entrepreneurs are locked out of regional planning. The more connected a region the more innovative it is. The regions are located along this axis of connected-disconnected, and in the study on smart specialisation in Ostrobothnia we try to discover to what degree the triple helix networks in Ostrobothnia are connected. The idea of a connected region can be seen as a vision or target that the region should achieve.
However, we have some reservations concerning the relation between connected-ness and innovation. Firstly, the regions are open and they are embedded in diffe-rent spatial scales. This is also mentioned in the RIS3 guide (Foray et al. 2012) that points out local embeddedness and relatedness. We later address extra-regional networks with the help of the concept of proximity. Secondly, there might be problems if helices force their own principles on the others. Thirdly, another problem is the basic hypothesis on the causality between the connectivity and regional innovativeness.
Concerning the second reservation, Qvortrup (2006) points out that the bounda-ries between universities, industry and state are not to be erased but that the mu-tual contact among them is instead to be intensified, with their relationships made more flexible and intertwined. The individual parts are at the same time both se-

Proceedings of the University of Vaasa. Reports 31
parate from one another and yet closely interlinked (Qvortrup 2006). A precondi-tion of a connected region is that it respects the relative autonomy of each of the functional systems mentioned. If one makes the research system too business minded, then one prevents it from generating new knowledge. If one places too many restrictions on companies, then one reduces their production of goods and services. If one makes public institutions effective, then they might find it diffi-cult to meet their duty to provide public welfare. Structural couplings should be established between these functional systems, so that one system produces servi-ces that the other cannot supply. The public sector produces the general condi-tions for both companies and research institutions: infrastructure and public regu-lation, for example (Qvortrup 2006).
According to the RIS guide (Foray et al. 2012), the connected region should be considered within the framework of the influence of national policies, and a rela-ted consideration is the extent national higher education, science and technology policy have territorial dimensions. However, other policies may be spatially blind and work against building links between universities and the region (European Commission 2011: 46–47). For example, the Finnish universities are presently funded by the state through their results in education (number of bachelor’s, mas-ter’s and doctoral degrees) and in research (journal publications, etc.) and not through their third tasks such as their social service mission. These are the chal-lenges of multi-level governance.
3.3 Network Analysis: Networks by Helices, Proximity Concepts and Gaps
Networks play a central role in the creation and diffusion of new knowledge (Camagni 1991). Networking reflects the growing interactivity in innovation pro-cesses. The more networks there are between the actors located in different heli-ces, the more the helices are interacting and the more connected a region is.
In the network analysis, the starting point is a relation between the actors. The interest is both in the relations and positions of individual members in the social network as well as in the networks as a whole. When analysing these relations, concerns can include the quantity of relations (dense vs. sparse), the content of the relations and their meaning. A relation can have a direction (Johansson, Matti-la & Uusikylä 1995), for example, when knowledge is transferred from one mem-ber to the other member. The networks consist of nodes and ties. In our study, the nodes are the organisations located in different helices and the ties are the rela-tionships between the organisations. A relation in network is the basic analytical

32 Proceedings of the University of Vaasa. Reports unit in our empirical study. Our key interest is in meso-level relations, specifically the relations among and within helices.
Networks can be local and regional as well as transnational, and they can be mul-ti-layered and multi-scalar. Networks contribute to knowledge creation and in-formation diffusion through two mechanisms, one through networks creating buzz or flows of information within the cluster, through spatially proximate rela-tionships among employees, firms and state agencies (Bathelt, Malmberg & Mas-kell 2004). Thus, the geographical proximity of actors favours an innovation pro-cess in which tacit knowledge is important, and in which knowledge and best practices are shared locally. The results are unique local competences, skills and tacit knowledge. Knowledge embedded in the local environment can diffuse spontaneously through ‘local buzz’. Local buzz is transferred through personal contact and present in meetings (Storper & Venables 2004; Virkkala 2013).
Second, networks establish pipelines between local and non-local firms to ex-change information and knowledge. An innovative region should be locally em-bedded, but at the same oriented towards a wider market. The knowledge from extra-regional networks might be valuable and complementary to local knowled-ge. In order to absorb useful knowledge from outside the region, local actors should have absorptive and development capacity, and there should be local or regional innovation networks. The benefits of local and extra-local ties are comp-lementary, and with the help of extra-local networks, the local networks might develop the capacity of a regional environment and actors to avoid the lock-in situations especially in the cases of sectors or clusters with diminished global markets. Many authors suggest a mixture of local and non-local linkages to be best for firms, and combinations of a local ‘buzz’ and global pipelines to be best for the long-term evolution of clusters (Bathelt et al. 2004; Aoyoma, Murphy & Hanson 2011).
We are interested in both regional and extra-regional networks, and we are stu-dying the degree to which innovation networks, based on triple helix relations, are embedded locally, nationally or globally. The content of the relations varies ac-cording to the partners involved (for details on innovation and support see Chap-ter 4).
We will distinguish between two properties of networks. They have a structure, which may be centralised or distributed, and relations in networks may be charac-terised by high and low levels of connectivity, which we measure as gaps (see Table 3.2).

Proceedings of the University of Vaasa. Reports 33
Table 3.2. Network structure and connectivity
Connectivity High Low
Structure Centralised
‘Gangs’ with leaders Several strong ties combined with holes
Hierarchical, segmented (silos) some strong ties, many gaps or holes
Decentralised/ diverse
The strength of weak ties Fragmented (no or insignificant networks)
A centralised network structure with a low level of connectivity, measurable as observable gaps or holes (relations with no or low expectations), may be seen as a network corresponding to a hierarchical organisation with top-down coordination. Here, actors at the lower levels relate to others at the same level through the cent-re. For reasons of efficiency, the centre in this type of organisation prevents coor-dination at the same level. The criticism of this model is that it easily results in silos, with actors working on the same topic without knowing of one another.
Unlike this situation, a centralised network with high connectivity may be seen as a ‘gang,’ where everybody is related to everybody else, but at the same time with clear leaders in specific positions. A gang is internally integrated, but it may have weak relations to its environment. These weak relations may be seen as either gaps or holes (see Table 3.2). Typically, a gang leader might be the actor com-municating out of the gang. Gangs may be seen as productive and competitive, but at the same time, one might expect that they are lock-ins, networks which are unable to search for and discover new directions.
A network with a diverse (decentralised) structure and a high level of connectivity (both weak and strong ties) is seen as an ‘ecology,’ where the ‘strengths of weak ties’ permit several combinations and re-combinations (entrepreneurial discove-ries).
Building a regional network is a way of mobilising resources, especially in situ-ations where resources are widely dispersed among public and private actors. There are different types of networks, but we are especially interested in networks among universities, businesses and public organisations. We assume that innova-tion networks are business driven, that research networks are university driven and that regional development networks are driven by public organisations. Ho-wever, the actors of other helices can participate in all of three types of networks.

34 Proceedings of the University of Vaasa. Reports Our interest in regional development networks, defined as loose policy networks, lies in their innovation support, that is, the ways these types of networks are sup-porting innovation in the region. Policy networks are a specific form of governan-ce characterised by public-private interaction in public policy. The policy network consists of public, semi-public and private actors such as local governments, poli-tical and societal groups, pressure and interest groups, societal institutions and private business organisations, all of which are dependent on each other’s resour-ces and competences. Regional development networks contribute to the producti-on of public purpose within their particular policy field; that is, through visions, values, plans, policies and regulations aimed at the general public (Virkkala 2013).
Table 3.3 shows different networks based on the initiator and the helix. All net-works also have actors from other helices. For example, if a public actor leads regional development networks then it has universities and firms as representati-ves. Different types of networks aim at different types of knowledge: innovation networks aim for knowledge that can be used for products and process innovation within organisations, and regional development networks aim for knowledge nee-ded for the design and implementation of institutions at the private and public level. In their protocols, institutions include formal and informal rules and habits established to reduce uncertainty in society and in their region (North 1990). Ac-tors in regional networks have a common discourse and common context of knowledge creation within which they as a group communicate through discour-se. Networks are emerging, transforming and changing over time. They have also long-term and short-term prospects (Virkkala 2013.)
Table 3.3. Different types of networks by helices
Characteristics of network
Regional development networks
Innovation networks Research networks
Main helix actor (initiating actor by helix)
Public organisation Business driven University driven
Type of knowledge Knowledge needed for the design and implementation of institutions for promoting innovation and for the inno-vation frameworks
Knowledge to be used in products and process Codified knowledge Tacit knowledge
Knowledge needed for under-standing and explaining phenomena
Codes Regional development aims, welfare
Profit Truth
Type of network Loose policy network Network based on STI or DUI innovation modes Development activity
Research teams Basic research Applied research

Proceedings of the University of Vaasa. Reports 35
Based on the triple helix framework, which highlights the interconnections bet-ween the three helices, our aim is to discover the extent to which Ostrobothnia is a connected region and what the most important issues are in order to improve the functioning of the innovation network. The connectivity can be studied through network analysis:
– by identifying the partners of the actors in each helix as well as their locations
in the triple helix structure and in different geographical scale, – by evaluating the importance of these partners by helices and by geographical
scales, and – by mapping how well connected the three helices are both internally and ex-
ternally.
What is needed for the presence of relations between different actors is conceptu-alised by the different dimensions of proximity, including geographical, or-ganisational, social, cognitive and institutional proximity (Boschma 2005). Pro-ximity is required in some dimensions, but not necessary all of them, to connect actors and to enable interactive learning and innovation.
Geographical proximity refers to the distance between two units in kilometres. It is relative in cost and time and may represent a constraint for economic actors intending to interact (Torre & Rallet 2005). Geographical proximity is beneficial for innovation because effective learning requires face-to-face interaction. Such interaction is easier to organise when agents are co-located. Geographical proxi-mity may be helpful in overcoming cultural and other barriers between different types of organisations in helices with different cultures.
Organisational proximity refers to proximity along with common rules and rou-tines of behaviour, for example the units in different locations of the same or-ganisational arrangement. Organisational proximity is beneficial for establishing innovation networks because it reduces uncertainty and opportunism. Social pro-ximity is based on personal linkages formed through joint education, social back-grounds or social events. Relations based on similar backgrounds are important carriers of knowledge exchange. Social proximity may play an important role in knowledge spillovers.
Cognitive proximity refers to the distance between the cognitive base (knowledge base) of actors, and some level of cognitive proximity is necessary for the emer-gence of interactive learning processes. People or firms sharing the same know-ledge base and expertise learn more from one another than if the cognitive distan-ce is great. Institutional proximity covers joint formal and informal rules, which

36 Proceedings of the University of Vaasa. Reports reduces uncertainty (Boschma 2005, 2009). Institutions are enabling mechanisms that provide stable conditions for interactive learning. In the triple helix context, as with the university-industry-government configuration, different helices can be seen as institutions and we find more institutional proximity among organisations inside one helix. University, industry and government actors operate in different institutional regimes that have different codes of operation.
The different dimensions of proximity can explain the formation of networks. The dimensions can be correlated and there is interplay between them. One can expect proximity dimensions in innovation networks to be substitutes rather than comp-lements. To establish a successful relation, one needs proximity in at least one dimension to manage the uncertainty. Ponds, van Oort and Frenken (2009, ac-cording to Boschma 2009) found that geographical proximity is especially im-portant in the establishment of university-industry-government (U-I-G) relation-ships (where institutional proximity is low) and less important in U-I-G collabora-tion, where actors operate under the same institutions (where institutional proxim-ity is high) (see Table 3.4).
Table 3.4. Different dimensions of proximity in the relations of a triple helix framework
Dimension of proximity Degree of proximity High Low
Geographical Relation between actors in the region
Relation between actors in the region and abroad
Institutional (helices)
Relations between firms Relations between universities Relations between public organisations
Relations between actors in different helices
Cognitive (knowledge base)
Similar knowledge base of actors, actors in the same cluster
Different knowledge bases of the actors
Social Relationships based on friendship and reciprocity
Formal relationships
Organisational (type of network)
Relationship between one type of network, between units of a global firm or the same public sector (like environment)
Different type of networks
A high degree of proximity is a prerequisite for forging connections among agents. However, when assessing the economic effects of networks, proximity between agents in networks does not necessarily increase their innovative perfor-mance, and may even harm it. According to Boschma and Frenken (2009), the

Proceedings of the University of Vaasa. Reports 37
level of proximity between agents affects whether their connection will lead into a higher level of innovative performance or not. The success of a network relation may be related to optimal levels of geographical proximity, social proximity, ins-titutional proximity, organisational proximity and cognitive proximity as well as to a balance between local and non-local links. Thinking in terms of the triple helix framework and institutional proximity, an optimal level requires operating simultaneously in different institutional regimes, such as local development agen-cies or KIBs cooperating with industry, government and academia.
The proximity concept can be used analytically in the triple helix context; the presence of a relation can be seen as a close proximity between partners indepen-dent of the dimensions of proximity. An actor has expectations of the relationship if his or her respective partner is close enough in at least one proximity dimensi-on. The relationship can be strong or weak depending on the level of expectation and experience of the actor concerning the relationship. Furthermore, the strength of the relationship can be measured between the gap of expectation and experien-ce on the relationship. This gap analysis originated from industrial management (seen in Chapter 6 in the report) but applied at regional level to describe and ana-lyse the functioning of networks between and within helices.
3.4 Regional Development Policy Model Based on the Connectivity of Networks and Gap Analysis
The strength of relationships can also be used in regional development when iden-tifying the bottlenecks and barriers of the networks. When both expectations and experiences of the relationship are high, the relation can be seen as strong, indica-ting a good solution in terms of regional development policy. This solution can then be highlighted as good practice by regional development actors, and other actors could learn something from the strong relationship. When both expecta-tions and experiences are low, the relation is weak. However, when expectations are high and experiences are low there is a development challenge that should raise concerns for regional development planners. With the help of gap analysis, we can identify the relationships that should be developed in order to improve the functioning of the networks. Action should be taken through policy interventions. There can also be holes in the networks when the actors have no relation at all but the presence of a relation could be favourable for the regional innovation and de-velopment. This case is a challenge for local development organisations and boundary spanners whose task is to link different actors and create connectivity and cohesion in a fragmented system (see Table 3.5).

38 Proceedings of the University of Vaasa. Reports Table 3.5. Proximity concept of the triple helix relation: towards a model of
connectivity in regional development policy
Relationship Proximity High Intermediary Low No proximity
Expectation/ Experience
High expectation and high experience
High expectation Low experience
Low expectation Low experience
Absence of relation
Gap Small gap Large gap Small gap Absence Role in regional development policy
Best practice in a connected region
Development chal-lenge
Weak relationship Structural hole in the network?
Structural hole in the network?
Gap analysis can be used as a method to deliver a tailor-made policy focusing on the specific bottlenecks of the regional economies. The relations should be more detailed than just between companies, companies and universities or companies and public organisations. For example, the relation between companies and public organisations might differ in employment issues, environmental regulation, spa-tial planning, technological development or business development. This also re-quires different ways of examining and covering the gaps.
Identifying the good practices and the bottlenecks of the network is just a first step in the regional development policy. The second step is to find out how to overcome the barriers of the relationship, which includes evaluating and ana-lysing the reason for large gaps. This can be made with relevant stakeholders in focus group meetings in which the gaps will be introduced for stakeholder discus-sion. The idea with a focus group meeting is to create a common understanding, and to find the way to create proximity with possible policy interventions. The knowledge taxonomy (Lundvall 1998) will be used as an analytical framework of the regional development model based on gap analysis. We can analytically dif-ferentiate phases of relation building based on the knowledge taxonomy (Table 3.6). In the first phase, actors build a relationship with their partners based on the information they possess on the importance of the relationship (the ‘know-who’ at the lower-left section of Figure 3.3). The actor has expectations of this rela-tionship. In the second phase, there is interaction in the relationship, during and after which the actor has experience, which can be characterised as tacit know-ledge (the ‘know-how’ at the upper-left section of Figure 3.3). In the third phase, a researcher is asking about the tacit knowledge on the relationship; here, the ex-pectations and experiences will be codified, and their distance will represent the gap index describing the strength of the specific relationship (the ‘know what’ in the upper-right section of Figure 3.3). The next phase is a focus group meeting with the relevant stakeholders, regional development agencies and researchers. In the meeting, the participants look for the explanation of the gap; sometimes cau-

Proceedings of the University of Vaasa. Reports 39
sal and sometimes more theoretical explanations are needed. In the meeting, the potential policy interventions available to fill the gap will be discussed (the ‘know-why’ in the lower-right section of Figure 3.3). Policy interventions can be either part of larger programme, just one project or investment or a change in re-gulation. The aim of the meeting is to reach a consensus on the reasons for the respective gap, as well as on the possible policy interventions through structured discussions with different partners, including the authority responsible for region-al development. In one focus group meeting there can be a structured discussion on many gaps concerning different relations such as employment issues, envi-ronment issues or spatial planning.
Table 3.6. Knowledge types and the regional development model based on gap analysis
Knowledge type
Triple helix context of the study
Stage of the relation and the model
Participants
Know-who Forming the relationship based on the knowledge who is important for the actor
Presence of relation based on expectation
Triple helix actors
Know-how Actor’s tacit knowledge of the relationship
Interaction in the relation – forming of experience
Triple helix actors
Know what
Strength of the relationship The gap index: experience – expectation
Respondents to the survey, Researchers and regional development agency
Know-why Explaining the gap Measures to fill the gap
Focus group meeting Relevant stakeholders, regional development agency and researchers
Figure 3.3. Knowledge types, gaps and policy interventions
Know-how Tacit knowledge of the relationship (Step 2)
Know what Gap index: high expectations low experiences (Step 3)
Know-who Forming the relationship based on the knowledge of who is important for the actor (Step 1)
Know-why Explanation of the gap in focus group meeting Suggestions for intervention to fill the gap by policy actors
(Step 4)

40 Proceedings of the University of Vaasa. Reports After the discussions in the focus group, public actors, and possibly the other stakeholders, should make decisions and prepare a policy intervention (see the step four at the lower-right section of Figure 3.4). The implementation of the pol-icy improving the functioning of the network and filling the gaps need to be inter-nalised by the actors (see step five of Figure 3.4) will influence their behaviour, with the respective relationship decreasing the gap between expectation and expe-rience (see step six of Figure 3.4). After some time, perhaps one or two years, the survey should be repeated, and if a lower gap is found, the policy intervention has succeeded, and we will find a shift from frustration (high gap) to good practice relations (low gap). If the gap is still high, procedural steps one to four should be repeated. This is also a knowledge spiral inspired by organisational learning theo-ry of Nonaka and Takeuchi (1995) and by Virkkala and Mariussen (2013).
Figure 3.4. Knowledge spiral based on the gap analysis, focus group meetings and policy interventions
Know-how Forming new practices and new relations based on the interventions (Step 6)
Know what Gap is small From frustration to good practice relation
(Step 7) Know-who Internalisation of the policy intervention by stakeholders (change of the relation) (Step 5)
Know-why Explanation of the gap in the focus group meeting Decision on intervention to fill the gap
(Step 4)
This method could be one part of an experimental policy in which self-discovery is important (Foray, David & Hall 2009). Self-discovery or entrepreneurial disco-very will occur through gap analysis, focus group meetings and policy interven-tions. The approach is based on abduction: something is lacking in the system that can be characterised as a hole or a gap, which demands the best possible explana-tion. Abduction is also the glue of the regional development policy model based on gap analysis since the regional policy makers are searching with the relevant stakeholders for the best possible policy intervention to fill the revealed gap.
The survey and the regional development policy model have been tested during the smart specialisation project of Ostrobothnia. The strength of relationships measured between gaps of expectation and experience of the respondent towards

Proceedings of the University of Vaasa. Reports 41
his/her partner, the gap analysis and the focus group meetings aiming to fill the gaps, can all be used more widely as a regional development method, especially in smart specialisation. The model can be used as monitoring and evaluation of the policy outcomes, another crucial step in smart specialisation.
3.5 Distributed Knowledge Networks, Technology Expectations and Related Variety
Knowledge needed for innovation is increasingly complex. There is a variety of knowledge sources and inputs used by companies and organisations. Companies need different types of knowledge from different regional, national and interna-tional knowledge networks in order to innovate. There is a current shift from a firm’s internal knowledge base to more open and globally distributed knowledge networks. The relevant knowledge base for many firms is not necessarily internal to their own sector or region, but is instead distributed across a range of technolo-gies, actors and industries in global commodity chains (Asheim, Boschma & Cooke 2011).
In order to use globally dispersed knowledge, a region needs its own RIS capable of absorbing knowledge from extra-regional networks. The knowledge must be understood and interpreted. Knowledge flows and electronic databases need to be applied in the cognitive framework of the receiver in order to derive some value from this knowledge. Both absorptive and development capacities are important to the effective use of knowledge.
One important dimension of knowledge cooperation is technology. In order to acquire technology the actors need some cognitive proximity to the technology provider. We are interested in where the most important technology partners of companies in Ostrobothnia are located, in which helix and in which region. The cognitive proximity can be seen in relation to the geographical proximity (Ostro-bothnia, the rest of Finland, and world) and to the institutional one (helices). Be-sides the relative importance of local, national and global sources of technology, we are interested in what kinds of technology are important for firms in Ostro-bothnia now and in the future.
Networks are mechanisms of knowledge transfer between actors within and bet-ween helices, but they are also mechanisms between sectors. Cross-sectoral net-works can induce regions to move into new growth paths while building on their existing assets. The variety of knowledge may be a key driver of economic growth. The long-term development of regions depends on their ability to diversi-

42 Proceedings of the University of Vaasa. Reports fy into new applications and new sectors through entrepreneurship and innovati-on, while building on their current knowledge base and competence. Therefore, it is essential for regions to transform and renew their economic base (Martin and Sunley 2006).
Regions may have many options to restructure their economies in the long run. One option is to diversify regional economies into new fields while building on regional assets. The long-term development of regions may depend on their abili-ty to develop new sectors or new market niches with their roots in the current regional knowledge base. According to Boschma (2009) spin-offs, labour mobili-ty and networks play a key role in this process of regional diversification.
Learning and knowledge transfer are facilitated when there is technological relat-edness between sectors, so cognitive distance is neither too big for learning to occur nor too small that novelty is hampered (Boschma 2009). Sectors need to be related or complementary in cognitive terms. Regions need related variety in or-der to enable effective knowledge transfer between different (but related) sectors, and to trigger the recombining of pieces of knowledge in entirely new ways.
The term platform policies refers to bringing together different but related activi-ties. Policymaking requires localised action embedded in a region and attuned to the specific needs of regions. The regional history largely determines the availabi-lity of options and probable outcomes of policy actions (Boschma 2009, Asheim et al 2011).
According to the RIS3 guide: “The key to successful differentiation is to exploit related variety, which suggests that a regional economy can build its competitive advantage by diversifying its unique, localised know-how into new combinations and innovations which are close or adjacent to it. These new combinations must be feasible or accessible given the existing assets, so as to exploit the experience accumulated by regional actors.” (Foray et al. 2012: 18.)
In Ostrobothnia, we will find technologies used by the main clusters: energy technologies, boat building and fur farming. These cross sectional technologies are related to different research areas provided by research institutes within and outside the region (Figure 3.5). Regional technology platforms are networks of R&D institutions that are able to support several clusters. Well-developed re-gional technology platforms are likely to enable innovation of new products, in-dustries and clusters through related varieties and entrepreneurial discoveries.

Proceedings of the University of Vaasa. Reports 43
Figure 3.5. Ostrobothnian cross-sectoral technological platforms (Johnson 2012, based on the work of Johnson and Ulfvens 2012)
3.6 Research Questions
In an innovative region, the three helices work in harmony with one another and thereby mutually reinforce one another. The preconditions for the innovation are that the triple helix actors are networking. Our first research question is related to notions of connectivity and proximity in a triple helix framework. Our aim is to discover how triple helix actors, which include companies, universities and public organisations, relate within networks. This effort includes understanding their geographical reach, that is, the importance of regional, national and international contacts.
The regional actors should be connected within and between helices, but there should be also interaction among all the actors, and this level and content of inter-action can be mapped with the help of elements from gap analysis. In the second question, we ask how the triple helix network is functioning, and what the bott-lenecks and the effective solutions are in this network. For this purpose, we have developed and tested gap analysis and other methods including knowledge ta-xonomy.

44 Proceedings of the University of Vaasa. Reports The third question is related to the connectivity between actors developing tech-nologies. The knowledge for new technologies is distributed across different sec-tors and regions, and to gain this knowledge a region needs absorptive capacity and a developed RIS. We are interested in where the most important technology partners in Ostrobothnia are located, especially in which helix and in which re-gion. The three first research questions are related to connectivity, and a method was developed and empirical data gathered to answer them.
Besides the above mentioned analytical research question, we also fulfilled a normative research task: to introduce a regional development model for smart specialisation in Ostrobothnia. The model was based on the survey, and tested through the project. The operationalisation of the conceptual framework and the research questions and topics are reflected in the structure of the survey, which will be described in the next chapter (see Table 3.7).
Table 3.7. Research frame
Topic in triple helix framework
Conceptual framework
Research question Method and data
Structure of the network, presence of relations
Network connectivity, proximity, network typology
1. How does the triple helix look in Ostrobothnia? (network structure) A. To what degree are the net-works of triple helix actors region-ally connected or disconnected? B. To what degree are the networks regionally, nationally, and globally embedded?
Mapping the number of respondents’ part-ners by helices and by regions. Evaluation of the importance of part-ners by helixes and by regions
Functioning of the network, interaction in relations
Strength of the network ties
2. How does the triple helix net-work function in Ostrobothnia? A. What are the biggest bottle-necks? B. What are the good solutions?
Gap analysis: evalua-tion of the relation in terms of expectations and experience
Technology partners
Absorptive capacity, RIS, Distributed knowledge, Technology platform
3. What kinds of technologies are triple helix actors using now and in future, where are they acquired?
Mapping the technol-ogies as well as the important technology partners by helices and regions now and in future
Regional development policy model
Knowledge taxonomy and knowledge spiral
4. What are the elements of regional development model based on the connectivity analysis?
Developing and test-ing the regional de-velopment model for a smart specialisation model

Proceedings of the University of Vaasa. Reports 45
References
AMCER report (2012). Advanced Monitoring and Coordination of EU R&D Pol-icies at Regional Level. [Web Publication] [Accessed 1.9.2014]. Available at: http://www.espon.eu/ export/sites/default/Documents/Projects/TargetedAnalyses/ AMCER/DFR/AMC ER _Draft_Final_Report _v1.pdf.
Aoyama, Y. & Murphy, J. & Hanson, S. (2011). Key Concepts in Economic Ge-ography. Los Angeles: Sage
Asheim, B.T. & Isaksen, A. (2002). Regional Innovation Systems: The Integra-tion of Local ”Sticky” and Global ”Ubiquitous” Knowledge. Journal of Technol-ogy Transfer 27:1, 77–86.
Asheim, B.T., Boschma, R. & Cooke, P. (2011). Constructing Regional Ad-vantage: Platform Policies Based on Related Variety and Differentiated Knowledge Bases. Regional Studies 45: 7, 893–904.
Bathelt, H., Malmberg, A. & Maskell, P. (2004). Clusters and Knowledge: Local Buzz, Global Pipelines and the Process of Knowledge Creation. Progress in Hu-man Geography 28, 31–56.
Boschma, R. (2005). Proximity and Innovation: a Critical Assessment. Regional Studies 39:1, 61–74.
Boschma, R. (2009). Evolutionary Economic Geography and its Implication for Regional Innovation Policy. Papers in Evolutionary Economic Geography 0912 Utrecht: Utrecht University.
Boschma, R. & K. Frenken (2009). The Spatial Evolution of Innovation Net-works: A Proximity Perspective. Papers in Evolutionary Economic Geography 0905. Utrecht: Utrecht University.
Camagni, R. (Ed.) (1991). Innovation Networks: Spatial Perspectives. London: Belhaven.
Carayannis, E. & Campbell, D. (2012). Mode 3 Knowledge Production in Quad-ruple Helix Innovation Systems: 21st-Century Democracy, Innovation, and En-trepreneurship for Development. SpringerBriefs in Business 7. New York: Springer.

46 Proceedings of the University of Vaasa. Reports Cooke, P. (1998). Introduction: Origin of the concept. In Cooke, P., Heidenreich, M. & Braczyk, H.-J. (Eds.) (1998) Regional Innovation Systems. London: UCL Press. 2–25.
Cooke, P. & Morgan, K. (1998). The Associational Economy: firms, regions, and innovation. Oxford: Oxford University Press.
Cooke, P., Heidenreich, M. & Braczyk, H.-J. (Eds.) (2004). Regional Innovation Systems: the Role of Governance in a Globalized World. Routledge: London. 2nd edition.
Dolfsma, W. & Leydesdorff, L. (2009) Lock-In and Break-Out from Technologi-cal Trajectories: Modeling and Policy Implications. Technological Forecasting and Social Change 76:7, 932–941.
Etzkowitz, H. (2008). The Triple Helix: University-Industry-Government Inno-vation in Action. London: Routledge.
Etzkowitz, H. & Leydesdorff, L. (2000). The Dynamics of Innovation: From National Systems and "Mode 2" To a Triple Helix of University Industry Gov-ernment Relations. Research Policy 29, 109–123.
European Commission (2011). Connecting Universities to Regional Growth. Eu-rope: European Commission.
Foray, D., David, P., & Hall, B. (2009). Smart Specialisation – The Concept. Knowledge Economists Policy Brief 9. Europe: European Commission.
Foray, D., Goddard, J., Beldarrain, X., Landabaso, M., McCann, P., Morgan, P., Nauwelaers, C. & Ortega-Argilés, R. (2012). Guide to Research and Innovation Strategies for Smart Specialisation (RIS3). Europe: European Commission.
Goddard, J., Kempton, L. & Vallance, P. (2013). Universities and Smart Speciali-sation: Challenges, Tensions, and Opportunities for the Innovation Strategies of European Regions. Ekonomiaz 83.
Isaksen, A. & Karlsen, J. (2010). Different Modes of Innovation and the Chal-lenge of Connecting Universities and Industry: Case Studies of Two Regional Industries in Norway. European Planning Studies 18: 12, 1993–2008.
Jensen, M. B., Johnson, B., Lorenz, E. & Lundvall, B.-Å. (2007). Forms of Knowledge and Modes of Innovation. Research Policy 36, 680–93.

Proceedings of the University of Vaasa. Reports 47
Johnson, J. (2012). Projektplan för Smart Specialisering Strategier (S3) i Öster-botten. Unpublished Ostrobothnian S3 project plan.
Johansson, J.E., Mattila, M. & Uusikylä, P. (1995). Johdatus verkostoanalyysiin [An Introduction to Network -analysis]. National Consumer Research Center Re-ports and Guidebooks 3. Helsinki: National Consumer Research Center.
Leydesdorff, L. & Etzkowitz. H. (1998). The Triple Helix as a Model for Innova-tion Studies. Science & Public Policy 25: 3, 195–203.
Luhmann, N. (1995). Social Systems. Stanford: Stanford University Press.
Lundvall, B.-Å. (1998). Why Study National Systems and National Styles of In-novation? Technology Analysis and Strategic Management 10: 4, 403–422.
Lundvall, B.-Å. & Johnson, B. (1994). The Learning Economy. Industry & Inno-vation 1:2, 23–42.
Martin, R. & Sunley, P. (2006). Path Dependence and Regional Economic Evolu-tion. Journal of Economic Geography 6: 4, 395–437.
Moulaert, F. & Sekia, F. (2003). Territorial Innovation Models: A Critical Sur-vey. Regional Studies 37: 3, 289–302.
Mäenpää, A. (2014). Älykkään erikoistumisen mittaaminen. Esimerkkinä Pohjanmaan triple helix –tutkimus [Measuring Smart Specialisation: The triple helix Study in Ostrobothnia]. University of Vaasa. Master’s thesis in Regional Studies.
Nonaka, I. & Takeuchi, H. (1995). The Knowledge-Creating Company: How Japanese Companies Create the Dynamics of Innovation. Oxford: Oxford Uni-versity Press.
North, D. (1990). Institutions, Institutional Change and Economic Performance. Cambridge: Cambridge University Press.
Ponds, R., van Oort, F.G. & Frenken, K. (2009). Internationalization and Region-al Embedding of Scientific Research in the Netherlands. In: Varga A. (Ed.): Uni-versities, knowledge transfer and regional development. Cheltenham: Edward Elgar Publishing. 109–137.
Qvortrup, L. (2006). The New Knowledge Regions. From Simple to Complex Innovation Theory. In Cooke P. & Piccaluga, A. (Eds.) Regional development in the Knowledge Economy. New York: Routledge. 246–271.

48 Proceedings of the University of Vaasa. Reports Ranga, M. & Etzkowitz, H. (2013). Triple Helix Systems: an Analytical Frame-work for Innovation Policy and Practice in the Knowledge Society. Industry & Higher Education 27: 3, 237–262.
Storper, M. & Venables, A. (2004). Buzz: Face-To-Face Contact and the Urban Economy. Journal of Economic Geography 4: 4, 351–370.
Torre, A. & Rallet, A. (2005). Proximity and Localization. Regional Studies 39, 47–59.
Tuunainen, J. (2002). Reconsidering the Mode 2 and the Triple Helix: A Critical Comment Based on a Case Study. Science Studies 15: 2, 36–58.
Varis, M. & Littunen, H. (2012). SMEs and Their Peripheral Innovation Envi-ronment: Reflections from a Finnish Case. European Planning Studies 20: 4, 547–582.
Virkkala, S. (2013). Geographical Perspectives: Regional Development and Transnational Learning. In Mariussen, Å. & Virkkala, S. (Eds.) Learning Trans-national Learning. Routledge Studies in Human Geography. London: Routledge. 51–101.
Virkkala, S. & Mariussen, Å. (2013). Theory of Organisational Knowledge Crea-tion as a Framework for Transnational Learning in Regional Development. In Mariussen, Å. & Virkkala, S. (Eds.) Learning Transnational Learning. Routledge Studies in Human Geography. London: Routledge. 102–137.

Proceedings of the University of Vaasa. Reports 49
4 METHODOLOGY AND RESEARCH DESIGN
Antti Mäenpää, University of Vaasa: Regional Studies
4.1 Background Information on the Ostrobothnian Region
The Ostrobothnian region consists of 15 municipalities (see Figure 4.1 below). It is the only NUTS 3 region in Finland that has a larger population of Swedish speakers (51 %) than Finnish speakers (45 %). Other notable exceptional aspects are the energy technology cluster, which is the most extensive in the Nordic countries. Many leading companies on the field (for example ABB, Wärtsilä, The Switch and Vacon) are situated in the region. Ostrobothnia also has quite a low unemployment rate compared to other parts of Finland and has lately been promo-ted as a prosperous region. (AMCER Report 2012.)
Figure 4.1. The Ostrobothnian region and its municipalities (Regional Council of Ostrobothnia 2014)

50 Proceedings of the University of Vaasa. Reports Geographically, Ostrobothnia consists of 7,749 square kilometres of land and has a population of 178 000 people. The regional capital is the city of Vaasa and it is also the main innovation centre where over 59 000 people live. The latest availa-ble information from 2008 indicates that among the Ostrobothnian workforce, 6.3 % earned their living from agriculture, 32 % from industry and 60.8 % from the service sector (AMCER report 2012). There is a disparity between the regional capital Vaasa with its more urban culture and history, and its rural hinterland. However, the export clusters chosen in the study reflect the spatial industrial structure of the region. The energy technology is particularly represented in the regional capital, boat building in the small industrial town of Jakobstad, and fur farming in the surrounding rural areas.
Economically the big multinational companies dominate. Because of this, Ostro-bothnia is quite strong exporter as over 60 % of the regionally produced industrial products are sold abroad. In the case of renewable energy products, the amount exported is over 70 %. However, Ostrobothnian GDP is lower than the average in Finland, although it is higher than the European average (AMCER report 2012). This reflects the facts, that alongside the big companies are also many small ones, and for example, fur farms and boat builders are small businesses compared to the global energy field actors.
Research and development is strongly situated inside the big companies within the renewable energy field but there are also many other research entities in the region (AMCER report 2012). Besides the companies’ own research units and departments, various types of universities are the biggest R&D players. There are four universities in the region: the University of Vaasa, Hanken School of Economics, Åbo Akademi University and the University of Helsinki (Law facul-ty). There are also two universities of applied sciences: VAMK Vaasa University of Applied Sciences and NOVIA University of Applied Sciences. In addition, there is also an industrial design department called MUOVA, which is a joint de-partment of Aalto University and the University of Vaasa. Within these seven universities there are over 12 000 students and therefore statistically nearly every fifth person on the regional capital Vaasa is a university student. One could there-fore say that Vaasa is a university city. (Havu 2013.)
In total, the funds devoted for research in Ostrobothnia are above the average in Finland. During 2009, the Ostrobothnian region spent 1619 euros per person on research when the average in Finland was 1271 euros at that time. Of all the re-search personnel in Finland, over 2.5 % lives in the Ostrobothnian region and it is clear that the region is quite strongly focused on research compared to the average level in Finland. (AMCER report 2012.)

Proceedings of the University of Vaasa. Reports 51
Besides the universities, there are also other regional developers. The Regional Council of Ostrobothnia and many sub-regional development organisations work to support the specific needs of the region. VASEK has specialised on the deve-lopment of the Vaasa region, while Merinova is developing the energy industries on the area. Concordia, Dynamo and Kristiinankaupungin Kehitys Oy are sub-regional development organisations that have specialised in other municipalities and their development needs.
4.2 Creation and Presentation of the Survey
With the basic information on the region established, we can now delve deeper into the actual survey and its logic. When the survey was created, there were se-veral discussions about the topic of possible objectives for Ostrobothnian smart specialisation. In the end, the existing research on regional innovations and triple helix structures convinced us that knowledge transfer was critical for innovation. Cross-helix innovations in particular have been presented as extremely important for new development. According to this theoretical background one can say that connectivity between triple helix actors is a precondition of regional innovation.
The first draft of the instrument for measuring connectivity was an academic work generated in meetings where most participants represented the university helix. However, the meetings were arranged by the Regional Council of Ostro-bothnia representing the public sector and it also brought in the companies’ views by representing the energy, boat, fur and maritime sectors. The maritime sector was later dropped from further analysis because there was not enough key actors who answered the call to participate in the study.
We decided to measure the cooperation between the triple helix actors via nine relations. First, we had three types of organisations: universities, public or-ganisations and companies. Then we also wanted to measure the cooperation on three geographical levels: local, national and international. This created the nine connections that we focused on (see Figure 4.2.).

52 Proceedings of the University of Vaasa. Reports
Figure 4.2. The relations in the survey by helices and by regions
Figure 4.2 demonstrates how challenging the measuring of relationships was in the survey. There are connections between three types of organisations and besi-des those there are also three geographical levels. When we measured the depth of cooperation, we therefore sometimes had to ask exactly the same questions nine times (See appendix 1). However, we think that this approach delivered a broad view of cooperation in Ostrobothnia.
The questionnaire has four parts reflecting the topics and the research questions of the total study. These parts are:
1. Background information 2. Mapping the location and importance of the partners of respondents 3. Measuring the depth of cooperation 4. Technologies and the location of technology partners now and in the future
The questionnaire used mainly closed questions. The background information consists of facts describing the respondent, part two of the facts to be evaluated (connections), part three of the respondent’s subjective opinions on the quality and depth of the particular relationship, and part four of both facts and subjective opinions or evaluations on the sources of future technologies.
Background information included very basic questions that were the same for all respondents, regardless of the type of organisation. We asked about the respon-dent’s name, position in the organisation, and the number of employees in the organisation. There was also a question about cooperation with specific industrial fields specifically inserted to measure the importance of the four possible smart

Proceedings of the University of Vaasa. Reports 53
specialisation objects: fur farming, boat building, the renewable energy products and maritime technologies. This last specialisation did not attract a single answer that indicated its importance, and therefore only the first three were taken forward to the analysis phase.
We chose respondents who were either experts in their field (especially in the three special industrial fields and their technologies) or were working as leaders. This was due to the fact that we needed answers both regarding the cooperation of the whole organisation (or one of its functional areas, if it was huge) but also on the technologies of the future. Consequently, the role of the respondents varied slightly but we tried to choose both sorts of experts.
We also had to take some shortcuts concerning specific regional actors. Deve-lopment organisations were important informants in our research, but we decided to merge them with the public organisations. There are still some questions within the questionnaire specifically asking about a respondent’s connections to deve-lopment organisations and thus we can still study their role within the region.
We also tried to include civil society actors in our research and selected trade uni-on representatives to act as those respondents. We used the same public or-ganisations’ questionnaire to collect data from these civil society representatives too. We felt including trade unions and development organisations with the public sector were justified because all are non-commercial actors. The move meant we could devise three types of questionnaires that supported our analyses and espe-cially the presentation of results within the triple helix context.
Mapping the location and importance of the partners was addressed in the next part of the questionnaire. The first question measures the scope of cooperation and also includes the geographical reach. Understandably, this was the hardest question for the respondents to answer (see the question in Table 4.1.).
Table 4.1. Question concerning the breadth of cooperation by helices and by regions
How many partners do you have? Companies
Public organisations
Universities Development
organisations
In Ostrobothnia and Central Ostrobothnia
In other parts of Finland
In the rest of the world

54 Proceedings of the University of Vaasa. Reports Of course, we did not ask for very specific numbers, as it is quite natural that people would not be able to recount all their contacts at that moment they are as-ked (Table 4.1). The first question however reveals many things even if the num-bers are not fully accurate. First, it shows whether there is any cooperation at all with other helix actors. It also shows to some extent where there are most connec-tions. This helps us to get a picture of the overall number of connections of the respondent’s organisation and also reveals the distribution of cooperation geo-graphically and via the type of triple helix partner.
Asking about cooperation or partners proved challenging because of the definition of the terms. Support for defining the term “cooperation” was sought from Easton and Araujo (1992) who stated that cooperation occurs when two actors have a mutual interest in joint activities. Some of these activities might also be linked to strategic issues (Gradl, Krämer & Amadigi 2010). Finally, a “partner” was de-fined by us as an important organisation, which facilitates and/or supports value creation for both parties.
Cooperation could be based on both formal and informal contracts and be of regu-lar or more sporadic character. We also created some further guidelines on inter-action: there must be some sort of dialogue between partners, and this would ex-clude trade, for example, unless there were negotiations of some sort within the process (like planning a service or such, not necessarily price negotiations). One could argue that our definition of partners and partnerships could be more precise, but we wanted to collect all the possible cooperation data that we could with our questionnaire.
We also needed to know the degree and importance of the national and interna-tional cooperation of the respondents because this may explain some of the results (see Tables 4.1 and 4.2). For example if the cooperation between companies is mostly international and there are many connections, this may explain why there are not such good regional connections between the companies et cetera.
We also added the Region of Central Ostrobothnia alongside the Region of Ost-robothnia that we are actually interested in (see Tables 4.1 and 4.2) because the boat building industry is concentrated at the border of both regions and also be-cause some public organisations operate in both regions. It is easier for the res-pondents to answer questions when the regions are treated as one entity, but we still only asked questions of Ostrobothnian experts and not from Central Ostro-bothnian ones.
The rest of the questions concerning cooperation varied, as we decided to create different questionnaires for different types of organisations. This helped us to

Proceedings of the University of Vaasa. Reports 55
concentrate on the different aspects that were integral to the very nature of or-ganisations. For example, we asked universities about their cooperation in teaching and research areas, whereas we had questions about strategic part-nerships for the public organisations. The companies were also asked about their innovation cooperation and such like. All these differences can be seen from the original questionnaires that can be viewed in the appendix 1. One example of the-se questions is provided here as well (Table 4.2):
Table 4.2. Question concerning the importance of cooperation by helices and by regions
How important are these
strategic partners for your organisation?
Companies
Public organisations
Universities Development organisations
In Ostrobothnia and Central Ostrobothnia
In other parts of Finland
In the rest of the world
The principles for the question are the same as before, but we are now measuring importance and therefore the scale has changed from an open field to a scale of 1–10, where 1 indicates strategic partners are of low importance to the respondent’s organisation and 10 indicates they are of high importance. Zero is used if there are no answers or no importance otherwise in the partnership.
Besides the importance of the strategic partners, we also asked companies the same question about supporting partners, innovation partners and so on (see Table 4.3). When this data is combined with the former data about the scope of part-nerships, we can ascertain the overall cooperation with the amounts of contacts and measures of importance. Actors representing the university sector were asked about the cooperation with research partners, partners in education and partners in development activity indicating the social service mission of universities. Public organisations were asked about strategic and supporting partners (see Table 4.3).

56 Proceedings of the University of Vaasa. Reports Table 4.3. Types of partnerships according to the type of the respondent’s organi-
sation
Public organisations Universities Companies
Supporting partnership Research partnership Supporting partnership
Strategic partnership Education partnership Strategic partnership
- Social service mission/development Innovation partnership
The final question in this section addressed the roles of different actors within knowledge production. The aim was to measure the actual role of different or-ganisations within Ostrobothnia (see Table 4.4). The conceptual background to this question lies in the notion of a regional innovation system.
Table 4.4. Question about the role that partners have within knowledge produc-tion
Organisation
Role in knowledge production
They give us knowledge
We generate knowledge together
We give them knowledge
Commercial actors (companies, etc.) Public sector actors (development organisa-tions, other public organisations, etc.)
Non-commercial actors (universities etc.)
Households
Volunteer organisations (Red Cross etc.)
Privilege organisations (trades unions, etc.)
The respondent’s organisation could have different role in the sharing of know-ledge. This question measures which partners are the really important knowledge givers or takers. Respondents were also offered the option to answer that know-ledge is created mutually, and this proved a very popular choice. Originally, we divided all organisations into three categories (public organisation, university and company) but we have since divided them into smaller groups to ascertain how important the civil society organisations are in terms of knowledge production. This categorisation is also used when measuring European GDP.

Proceedings of the University of Vaasa. Reports 57
The depth of cooperation was measured in the third part of the questionnaire and this was the part our project group really pondered over. Finally, we settled on multiple questions measuring the quality or the depth of the cooperation. These differ from the former measurements of the importance of the partnership, becau-se we were asking about experiences and expectations and thus measuring the overall feeling of contentment in the chosen field of cooperation. One example of these questions is provided below (Table 4.5).
Table 4.5. Example question about the experiences, expectations and the direc-tion of development in the past and in the future
Scale: 10 = high,
1= low
Direction of development in the future
(mark with a cross)
Direction of development in the past
(mark with a cross)
Question Expec-tations
Experi-ences
Grows Remains the same
Lowers Grows Remains the same
Lowers
Cooperation in research
As Table 4.5 shows, we asked the respondent’s opinion about cooperation through expectations and experience. The respondents first considered the expec-tations that they hold for the chosen field for cooperation. We guided the respon-dents to think about their expectations of the ideal situation for cooperation. Then the respondents ranked their experiences of cooperation in the same field. While there is room for improvement because there are many questions, we can quite precisely locate the possible development challenges. We used same ten-point scale as in the second section of the questionnaire: where 10 is the best possible form of cooperation and 1 is the lowest ranked form. Once again, zero was used to indicate that there was no answer. Calculating discrepancy scores between ex-pectation and experience gave us a result equating to the strength of the coopera-tion network.
We also asked about the direction of development under the same question. The respondent could choose only one direction for the future and another one for the past. These corresponding questions gave us more information about the state of cooperation within the chosen fields. For example, cooperation in research could be problematic and the difference between expectation and experience might be three points. If the direction of development had been worse in the past and was

58 Proceedings of the University of Vaasa. Reports expected to improve in the future, it suggested the organisations could focus on other areas of cooperation first, as in the research area the situation was impro-ving by itself.
As mentioned previously, this section featured several questions on each relation-ship and these varied according to the type of organisation the respondent came from (see appendix 1 for full questionnary). For example, we had questions that measured how well the respondent knew a certain partner from each relationship (i.e. one partner from the university sector in Ostrobothnia, and/or one public or-ganisation partner based outside Finland etc.) and these helped us to measure pos-sible differences in the information sharing among the best partners of each pos-sible connection. For example, if cooperation was not good in some specific fields and the respondent did not know even the best connection to the relevant helix actor well, then one explanation might be a lack of proper connections.
We asked the same question-sets three times within a single helix according to the chosen geographical division: first for the region, then for the other parts of Fin-land and lastly for the international connections. The only exception was public organisations, as we did not ask about their connections to companies outside the region at all. This was because in Finland, several of the public actors are regional entities and they have no jurisdiction to act in other areas. For example, the Re-gional Council of Ostrobothnia is focused on developing its own area as there are other Regional Councils covering other parts of Finland.
As mentioned, there were three regional question-sets within a single helix part-nership (and only one between public actors and companies), but we asked about cooperation with all the triple helix actors and this meant that it was possible that the respondent answered nine question-sets in this part of the questionnaire (this happened only to university helix respondents). This was very tough for the re-spondents and remains a major problem within this part of the questionnaire. All the questions can be viewed in the appendix 1.
The last section of the questionnaire addressed the technologies of the future. We measured these using three different questions that were the same for all respon-dents. We could not have totally open questions, as the survey would be repeated in the future. The first question about technologies can be seen below (Table 4.6).
This section also used a ten-point scale where 1 indicated low importance and 10 high importance of various technological fields, products and applications. As before zero was used when the respondent did not have any answers to contribute.

Proceedings of the University of Vaasa. Reports 59
We asked about the importance of technologies for the respondent now and in the future and we also asked for development ideas at this point, as it is perfectly pos-sible that some innovations require something other than technologies (like servi-ces etc.) and that is why the section included some open questions. There was also room for the respondent to explain the importance of the technologies as it is im-portant to acknowledge that regional developers cannot be experts on all possible technological or service innovations. The optimal situation was when respondents helped the researchers by explaining the options.
The chosen technologies are based on the EU’s key enabling technologies, which EU has declared innovative additions to the current technological field. We also included renewable energy and smart grids as we were aware of their importance and they were quite frequently nominated by the respondents. The open fields gave the respondent the opportunity to tell us about any new technological or ser-vice innovations and such like.
Table 4.6. Question about the importance of various technologies for Ostroboth-nia
Importance of technologies Scale: 10 = high, 1= low Open questions
Technologies Now After 20 years Why? How it could be developed?
Nanotechnology
Micro- and nano-electronics including semiconductors Photonic Advanced materials Biotechnology Advanced production meth-ods Smart grids (Intelligent elec-trical networks) Renewable energy Other, what?
Our next question simply asked what types of organisations and locations are im-portant to innovation. The only difference from the former questions that were centred on the importance of partnerships was the inclusion of the respondent’s own organisation. We also asked the respondents to indicate importance by mar-

60 Proceedings of the University of Vaasa. Reports king options with a cross rather than to grade options on a numerical scale. There-fore, this was a rough way to measure the technological importance of various locations and their actors. The actual question can be seen below (Table 4.7).
Table 4.7. The location of various partners in technological innovation activities
The location of technological innovators
Within own organisation
In the companies
In the public organisations
Universities and research entities
Development organisations
In Ostrobothnia and Central Ostrobothnia
In other parts of Finland
In rest of the world
This question applies the same principles as the previous questions measuring the importance of various types of partnerships. It is intended to be answered quickly and quite often it was, as companies and universities were often included. Even though the question is quite basic, it still helps us to gain a better picture of the innovation partners of the organisations.
Table 4.8. Question about the future technology partners and their importance after 20 years
Where could Ostroboth-nian organisations find technological develop-ment partners 20 years hence?
Within own organisation
In the companies
In the public organisations
Universities and research entities
Development organisations
In Ostrobothnia and Cen-tral Ostrobothnia
In other parts of Finland In the rest of the world
With our last question within the questionnaire (see Table 4.8) we wanted to measure how important various technological partners might be to the respond-ent’s organisation 20 years hence. We again used a ten-point numerical measure-ment scale and repeated the format where ten represented high importance and

Proceedings of the University of Vaasa. Reports 61
one low importance, again with zero used to record there being no answer to the questions.
The final question of the questionnaire was designed to provide a little more in-formation about the future development of technological cooperation within the Ostrobothnian region. Quite a number of the respondents answered that the Ost-robothnian region would be important and this offered very good background information to support the Regional Council when it starts to implement the smart specialisation strategy. The region has faith in itself, which we find encouraging.
4.3 Choosing the Respondents and Implementing the Interviews
It was very important to choose the correct respondents to answer our question-naire. Earlier we had decided that we particularly needed two types of experts. First, we needed leaders because we wanted data about organisational cooperati-on. Secondly, we needed technical experts, as we were gathering information on future technologies. We also needed people from the three different helices.
We started by searching for local experts via the internet and also many experts were known to our working group. We particularly wanted to have people wor-king in fields focused on export. We were also keen to have respondents from the chosen “smart” industrial fields, so some energy industry, boat building and fur farming specialists were gathered especially for the list. We also included deve-lopment organisations and trade union representatives on the list of public or-ganisation specialists. The actual selection of respondents was made using strati-fied sampling according to these guidelines.
After the selection we sent the respondents an invitation letter and e-mail explai-ning our study and asked if they would meet our interviewer. We had to use an interviewer because our answering sheets were so large. It was also important that the respondents would be able to ask for clarification if they did not understand the questions. A good number of those we initially approached agreed to be inter-viewed, and we decided that 15 people from each helix would be sufficient at that point when the questionnaire was being tested. In total, we interviewed 53 people of whom 21 represented firms, 15 universities and 17 public administration. The interviews were conducted in August–October 2013, mostly by the author of this article (Mäenpää 2014).

62 Proceedings of the University of Vaasa. Reports The interviews went well. The interviewer visited the respondent’s work place and explained that the questionnaire was to be used for the Regional Council’s development work and academic research. Then the interviewer presented the relevant questionnaire (see Appendix 1) and asked if the respondent wanted to fill in the information themselves or if they preferred the interviewer to mark their answers for them. There were always two answer sheets available, so that the respondent could see the questions even if he or she decided to let the interviewer fill in the answers. After the respondents had answered all the questions they could, the interviewer asked if the respondent would be willing to participate in special focus group meetings.
These focus group meetings would provide an opportunity to present our initial results to the respondents and also to involve some other experts. We were keen for the respondents to assess the results and we hoped the meetings would also offer opportunities to obtain explanations of, or background information on, the responses received. Many respondents agreed to attend the focus group meetings, their schedules permitting.
4.4 Focus Group Meetings
Three focus group meetings were held. The first was on the energy industry and was held in Vaasa on 17 January 2014. The other two focused on boat building and fur farming and these were held in Jakobstad on 7 March 2014. These mee-tings involved presenting our results as planned and the assembled experts specu-lating on what our findings might indicate.
The energy industry experts were a little surprised that our results indicated that regional partners were considered highly important. Local cooperation was gene-rally deemed to be important in the future. The energy sector representatives, ho-wever did not feel that the local universities supported the sector enough, citing too few students and projects. The reason for the failing was suggested to be that the most appropriate type of education was not directly available in Vaasa, as its providers are scattered throughout Finland. Company representatives were disap-pointed that the nearby regional universities were unable to meet their needs; ho-wever, there is little potential for change because higher education is controlled at central government level in Finland.
There were also large differences in the expectations and experiences of com-panies and their regional subcontractors (i.e. other companies). This was explai-ned by companies having high expectations of the quality of the production from

Proceedings of the University of Vaasa. Reports 63
subcontractors that have taken over the production of components. Accordingly, quality is very important and there would be no subcontractors in the first place if they did not manage to make their components more efficiently than the customer firms.
Companies were also not happy about the apparent overall fragmentation of Fin-nish government. The company representatives criticised building projects where, for example, one Finnish official decided on environmental issues and another on cultural issues. They thought Finnish bureaucracy too burdensome. They also mentioned that there are other countries that apply their legislation less strictly, and this attracts many international projects because things advance quickly.
Our results also indicated that cooperation at regional development level is not perfect. The companies explained that even though the energy industry is the main industry in Ostrobothnia, there are still many difficulties. One of the biggest problems is the fact that not all municipalities support the energy industry and thus its projects do not gain the support of the whole region.
When we compared the triple helix relations one could see that companies most preferred cooperating with other companies in the region. Universities were the next most important partners, and cooperation with the public sector was ranked as the least preferable option. Among the public entities, development or-ganisations were deemed the most important partners.
The boat building industry was not content with the levels of cooperation with universities. They explained that Finnish universities do not have the resources to develop the newest technologies. Therefore, companies have to either conduct research or development themselves or buy the research from outside the country. The boat building industry was however content about the level of cooperation with public organisations and especially with development organisations. The only problem was the infrastructure of the Jakobstad harbour, which caused issues for boat transportation. The boat building industry representatives were most con-tent about the cooperation with other companies, and that with public or-ganisations was ranked second. Universities were the least important partners.
The fur farming industry was very pleased to see that our regional indicators mapped the industry correctly. Most of the Finnish fur farming industry is located on the Ostrobothnia region. However, local universities were not as important as national ones. The experts explained that fur farms require genetic research, which can be found only in the biggest cities in Finland. Because of that, the fur farming industry considers other companies to be the most important partners.

64 Proceedings of the University of Vaasa. Reports The next most important partners are the public organisations and universities are the least important also to this field.
The questionnaire has now been presented and the logic behind the questions should be clearer. We have also explained the implementation of the interviews, the choosing of respondents, and how the focus group seminars worked, which we hope will help clarify the results gathered. In chapter 5, we present these ana-lyses in detail.
4.5 Validity and Reliability of the Survey
Validity means that the survey measures the phenomena that it planned to meas-ure (e.g., the connectivity of triple helix actors in Ostrobothnia) so that we can properly answer the research questions. Reliability refers to the consistency or stability of the measurements. To meet these requirements, we took care in prepa-ring the questionnaire and survey, and tried to take account of all relevant dimen-sions of the cooperation. The questionnaire was presented and tested in many project seminars, in research seminars on March 15 and May 13, and also in a stakeholder seminar on June 20, 2013. The survey plan had undergone a peer-review procedure at the S3 platform workshop in May in Vaasa 2013. The model has also been applied by University of Nordland, Norway.
Asking respondents about cooperation on innovation is a challenge for many rea-sons. One is that the respondents have diverse backgrounds and can have different interpretations of concepts, such as, innovations, cooperation and development. We do think that this is a problem in all research concerning partners, or coopera-tion in general as people have their own perspective on these terms. However, we tried to overcome this with written definitions of the concepts, and by making an interviewer available to explain the notions throughout. With regard to validity, there is also the risk of getting “the right day” as results may vary each day. Ulti-mately, cooperation is based upon interaction and people tend to remember the latest connections as being the strongest. This once again is integral to very nature of cooperation research and is thus unavoidable.
Another risk lays in the complexity of business structures and how innovation processes unfold into different types of networks, and actor constellations. We asked the same questions of people who have no subordinates and people who have over 300 subordinates. In all of these cases, we assumed that the respondent knew all the connections of his or her subordinates, or the whole organisation, which, in the case of the larger networks, was almost certainly not the case. Ho-
Proceedings of the University of Vaasa. Reports 65
wever, the leaders should know the main structure of the cooperative arrange-ments, and are thus still valuable sources of information about the scale and im-portance of cooperation.
In any research, the accuracy of the results will be improved if the respondents are provided with clear definitions and are helped to answer the questions fully. It is also important to obtain enough answers, as they further improve the reliability of the whole research. Consequently, it was decided the presence of an interview-er was critical in the data collection phase.
It was decided the research could benefit from a quantitative research approach, founded on a structured questionnaire. However, the data were gathered through interviews that also provided qualitative data. Consequently, the study utilises both qualitative and quantitative approaches, making it a mixed-method form of research.
During the research project, a standardised instrument based on gap indexes was developed for tracking the development of connectivity and monitoring the smart specialisation strategy in Ostrobothnia. The aim is in future to acquire data that are more longitudinal on the connectivity of triple helix actors in Ostrobothnia.

66 Proceedings of the University of Vaasa. Reports References
AMCER report (2012). Advanced Monitoring and Coordination of EU R&D Pol-icies at Regional Level. [Web Publication] [Accessed 1.9.2014]. Available at: http://www.espon.eu/ export/sites/default/Documents/Projects/TargetedAnalyses/ AMCER/DFR/AMC ER _Draft_Final_Report _v1.pdf.
Easton, G. & Araujo, L. (1992). Non-Economic Exchange in Industrial Networks. In Axelsson, B. & Easton, G. (Eds.) Industrial Networks: A New View on Reality. London: Routledge. 62–88.
Gradl, C., Krämer, A., Amadigi, F. (2010). Partner Selection for Inclusive Busi-ness Models: The Case of Casa Melhor. Greener Management International 56, 25–42.
Havu, E. (2013). Education. [Web Page] [Accessed 28.1.2014] Available at: http://www.vaasa. fi/Other_languages/ In_English/Education.
Mäenpää, A. (2014). Älykkään erikoistumisen mittaaminen. Esimerkkinä Pohjanmaan triple helix –tutkimus [Measuring Smart Specialisation: The triple helix Study in Ostrobothnia]. University of Vaasa. Master’s thesis in Regional Studies.
Regional Council of Ostrobothnia (2014). Toimialue ja jäsenkunnat [Area of Op-eration and Member Municipalities]. [Web Page] [Accessed 28.1.2014]. Availa-ble at: http://www.obotnia.fi/fi/d-Toiminta-ja-teht%C3%A4v%C3%A4t-Toimialue-ja-j % C3%A4 sen kunnat.aspx?docID=261&TocID=4.

Proceedings of the University of Vaasa. Reports 67
5 STATISTICAL ANALYSIS
Peter Björk and Christian Johansson, Hanken School of Economis
Cooperation for new service development and innovation is critical for business and regional development. Within the triple helix framework it is claimed that it is the number of important cooperation that is decisive for development. This chapter presents findings from a small scale quantitative study. Central actors representing companies, universities as well as, public organisations in Ostro-bothnia were approached.
5.1 Companies as Triple Helix Actors
This section consists of two parts. All companies are first analysed as one sample (n = 16). Then companies representing the energy cluster is analysed (n = 6). The other two clusters scrutinised for smart specialisation, boat and fur, are not sepa-rately analysed, due to small sample sises.
5.1.1 All companies
This part reports on the triple helix structure out of a company perspective (Table 5.1).
Table 5.1. Company connectivity (all companies)
All companies
Type of partner Region
Ostrobothnia Finland International Company 108 (25) 26 (20) 14 (4) Public organisation 7 (2) 3 (1) 0 (0) University 2 (2) 2 (1) 1 (0) Development organisation 2 (2) 1 (0) 5 (0)
Number of partners, mean (median)

68 Proceedings of the University of Vaasa. Reports Looking at the number of company partners, the companies in Ostrobothnia seems to be well connected; they have many partners locally and nationally, as well as, internationally. The dominance of local partners is somewhat surprising because of how the region presents itself, as being international and export orien-ted. This is certainly true, but at the same time the numbers prove how strength for international activities are founded on regional network structures. It is also obvious from Table 5.2 that the companies have prioritised cooperation with other companies. The number of partners in the public and university sector, and with development organisations is much lower.
A similar structure emerges when focus is put on the importance of the different partners and activities like support, strategy and innovation (Table 5.2).
Table 5.2. Partner importance from a company perspective (all companies)
Company partners are on average more important than partners from other sectors and local partners seems to be more important than partners from other regions. There are only a couple of exceptions to this rule. For the university sector, and also to some extent for the public sector, we see that partners in other parts of Finland are as important (or even more important) as local partners. The explana-tion for this seems to be straight forward; companies perceive that all the necessa-ry resources are not to be found locally. One example is the energy sector where a lot of cooperation with the university sector is done with universities in other parts of Finland.
All in all, we interpret the results as a clear endorsement for the Ostrobothnia re-gion. Many of our companies do business globally, but they still choose to coope-rate within the region and find the cooperation valuable and competitive.
All companies and partner importance
Type of partner Region
Ostrobothnia Finland International Company 9.3 / 8.6 / 7.4 8.8 / 8.3 / 6.1 8.1 / 6.9 / 6.2 Public organisation 7.7 / 7.2 / 4.8 6.7 / 7.8 /4.9 3.3 / 3.7 / 2.8 University 6.5 / 5.7 / 5.2 6.9 / 5.7 / 5.5 5.8 / 4.1 / 4.4 Development organisation 6.8 / 5.9 / 5.9 6.2 / 4.9 / 4.8 4.8 / 3.2 / 4.0
Mean value, scale 1 = not at all important, 10 = very important support/strategy/innovation

Proceedings of the University of Vaasa. Reports 69
The next step is to evaluate the strength and depth of the cooperation. The ques-tionnaire gives us the opportunity to analyse several different aspects of the coo-peration and in this way it is easier to isolate and identify the areas for improve-ments. Table 5.3 shows measures for how companies have experienced and ex-pect cooperation to develop with a set of different type of actors and activities in different regions, and in what direction the cooperation is moving (trends).
Table 5.3. Evaluation of cooperation expectations, experiences and trends:
companies – other companies
All companies – other companies Aspect of cooperation Region n Expectations Experiences Gap Trend History
Subcontractors Ostrobothnia 16 8.7 7.8 -0.9 2.3 2.4 Finland 16 8.2 6.9 -1.3 2.4 2.4 International 9 8.1 7.6 -0.5 2.3 2.2
Customers Ostrobothnia 15 8.8 8.1 -0.7 2.4 2.4 Finland 14 8.0 7.3 -0.7 2.6 2.4 International 9 8.3 7.6 -0.7 2.6 2.4
In-house cooperation
Ostrobothnia 13 8.8 7.9 -0.9 2.3 2.2 Finland 9 8.6 7.6 -1.0 2.3 2.4 International 5 8.0 6.8 -1.2 2.4 2.4
Technology development
Ostrobothnia 12 8.2 6.9 -1.3 2.6 2.3 Finland 13 6.8 6.1 -0.7 2.2 2.3 International 9 8.3 7.7 -0.6 2.4 2.4
Production system development
Ostrobothnia 15 7.1 5.9 -1.2 2.5 2.3 Finland 12 6.8 6.0 -0.8 2.2 2.0 International 9 8.0 7.3 -0.7 2.6 2.2
Process development
Ostrobothnia 15 6.7 5.6 -1.1 2.5 2.2 Finland 10 6.5 5.9 -0.6 2.3 2.1 International 8 6.9 6.5 -0.4 2.4 2.3
Organisational development
Ostrobothnia 14 5.7 5.4 -0.3 2.4 2.2 Finland 10 4.6 4.2 -0.4 2.1 2.0 International 8 5.4 5.5 0.1 2.3 2.1
Marketing Ostrobothnia 12 6.3 6.1 -0.2 2.3 2.3 Finland 10 6.6 6.1 -0.5 2.2 2.0 International 8 6.9 6.3 -0.6 2.6 2.5
Expectations / Experiences, scale 1 = low, 10 = high Gap = Experience – Expectation Trend (future)/ History, scale 1 = decrease, 2 = as before, 3 = increase
Starting with the company-company relations we can see that there are no alar-ming gaps between the expectations and experiences of how the cooperation works. The mean value for the expectation is almost always bigger than the cor-

70 Proceedings of the University of Vaasa. Reports responding value for experience but this is a common outcome, everyone tend to expect (hope for) more than actually can be delivered. Generally speaking, small negative gaps are no cause for concern. The biggest gaps can be found in subcont-ractor – other parts of Finland and technology – Ostrobothnia but they are only of moderate sise, -1.3 in both cases. On the bright side, both areas show an expected positive trend for the future. The highest expectations can be found concerning subcontractors, customers and in-house cooperation within Ostrobothnia.
Companies have cooperation with universities. Three different types of activities were analysed in this study: education, research and development. The figures presented in Table 5.4 indicate that the companies have had best experiences when it comes to cooperation on education in Ostrobothnia, a relationship that is expected to become even more important in the future.
Table 5.4. Evaluation of cooperation expectations, experiences and trends: companies – universities
All companies - Universities Aspect of cooperation Region n Expectations Experiences Gap Trend History Education Ostrobothnia 13 8.2 7.3 -0.9 2.5 2.2
Finland 14 6.8 5.4 -1.4 2.5 2.2 International 14 6.6 5.7 -0.9 2.1 2.0
Research Ostrobothnia 6 6.7 6.3 -0.4 2.5 2.3 Finland 8 8.3 6.9 -1.4 2.4 2.4 International 8 6.9 6.5 -0.4 2.3 2.4
Development Ostrobothnia 6 4.7 4.0 -0.7 2.2 1.8 Finland 6 7.2 6.3 -0.9 2.3 2.2 International 5 6.0 5.2 -0.8 2.6 2.2
When it comes to cooperation on research the region of Ostrobothnia is not quite enough. It is obvious that the companies take input from universities outside the region as well. Next we can see the results for public organisations (Table 5.5).

Proceedings of the University of Vaasa. Reports 71
Table 5.5. Evaluation of cooperation expectations, experiences and trends: companies – public organisations in Ostrobothnia and other parts of Finland
All companies – public organisations, cooperation in Ostrobothnia and other parts of Finland
Aspect of cooperation Region n Expectations Experiences Gap Trend History Infrastructure and logistics
Ostrobothnia 11 8.6 7.3 -1.3 2.1 2.5 Finland 8 6.6 6.1 -0.5 2.3 2.3
Regional development
Ostrobothnia 14 8.8 6.7 -2.1 2.2 2.4 Finland 9 7.2 6.6 -0.6 2.2 2.1
Technology development
Ostrobothnia 13 6.8 5.7 -1.1 2.3 2.2 Finland 9 6.7 5.7 -1.0 2.3 2.1
Business development
Ostrobothnia 10 7.5 5.7 -1.8 2.0 2.1 Finland 8 6.5 5.5 -1.0 2.4 2.3
Land use planning Ostrobothnia 13 6.9 4.9 -2.0 2.0 2.0 Finland 9 5.8 4.6 -1.2 2.4 2.2
Environmental issues Ostrobothnia 12 6.8 5.5 -1.3 2.3 2.1 Finland 10 5.7 5.2 -0.5 2.2 2.0
Employment affairs
Ostrobothnia 12 6.6 6.1 -0.5 2.1 2.2 Finland 9 6.3 5.8 -0.5 2.0 2.0
Cooperation between companies and public organisations is most often linked to issues of infrastructure, logistics and regional development (Table 5.5). There is, in particular, a high pressure on regional development in Ostrobothnia.
It can be concluded, by comparing findings in Table 5.5 with those in Table 5.6 that companies are in much closer connection to regional and national policy makers than those active on an international arena.
Table 5.6. Evaluation of cooperation expectations, experiences and trends: companies – public organisations internationally
All companies - public organisations, international cooperation
Aspect of cooperation n Expectations Experiences Gap Trend History
Technology and business life 5 5.2 4.2 -1.0 2.0 2.0
Environmental issues 4 6.0 6.0 0.0 1.8 2.0
Logistics 4 4.8 3.8 -1.0 2.0 2.0
Education 4 4.3 2.5 -1.8 1.8 2.3
Regional development 4 3.8 3.0 -0.8 2.0 2.0

72 Proceedings of the University of Vaasa. Reports 5.1.2 Energy sector companies
This part reports findings based on how companies representing the energy sector perceive cooperation with other companies, universities and public organisations.
Table 5.7. Company connectivity (energy sector companies)
Energy sector companies
Type of partner Region
Ostrobothnia Finland International Company 23 (21) 26 (20) 20 (4) Public organisation 2 (2) 2 (0) 0 (0) University 3 (3) 3 (1) 1 (0) Development organisation 2 (2) 1 (0) 0 (0)
Number of partners, mean (median)
As can be seen in Table 5.7, this sector has more international partners, both rela-tively and in absolute terms. Furthermore, these companies cooperate substantial-ly with other firms.
This cooperation with other companies is important (Table 5.8). Especially other companies in the region of Ostrobothnia add to support, strategy and innovations. When it comes to the University sector and innovations there are indications of weak input.
Table 5.8. Partner importance from a company perspective (energy sector com-panies)
Energy sector companies and partner importance
Type of partner Region
Ostrobothnia Finland International Company 9.1 / 8.7 / 9.0 8.7 / 8.4 / 7.1 8.0 / 7.7 / 6.8 Public organisation 7.3 / 7.5 / 4.8 6.6 / 7.4 / 4.8 3.5 /2.0 / 1.0 University 7.4 / 5.9 / 5.1 7.5 / 5.6 / 5.5 6.8 / 2.7 / 3.0 Development organisation 7.2 / 5.7 / 5.8 5.5 / 5.8 / 5.2 2.0 / 1.5 / 1.0
Mean value, scale 1 = not at all important, 10 = very important support/strategy/innovation

Proceedings of the University of Vaasa. Reports 73
The importance of regional companies for development is further validated in Table 5.9. Knowledge developed in cooperation with subcontractors, customers and in-house stands out as particularly important.
Table 5.9. Evaluation in the energy sector of cooperation expectations, experi-ences and trends: companies – other companies
Energy sector cooperation with other companies in Ostrobothnia and the rest of Finland* Aspect of cooperation Region n Expectations Experiences Gap Trend History Subcontractors
Ostrobothnia 6 9.3 7.8 -1.5 2.2 2.2 Finland 6 8.7 7.5 -1.2 2.2 2.5
Customers Ostrobothnia 4 9.3 8.5 -0.8 3.0 2.5 Finland 5 8.6 8.2 -0.4 2.6 2.4
In-house cooperation
Ostrobothnia 4 9.0 8.0 -1.0 2.8 2.3 Finland 4 8.8 7.8 -1.0 2.5 2.8
Technology development
Ostrobothnia 5 9.0 7.6 -1.4 2.6 2.4 Finland 5 8.0 7.2 -0.8 2.4 2.4
Production system development
Ostrobothnia 6 7.3 6.8 -0.5 2.8 2.3 Finland 4 8.0 7.5 -0.5 2.3 1.8
Process development
Ostrobothnia 6 6.3 6.0 -0.3 2.7 2.2 Finland 4 6.8 6.3 -0.5 2.5 2.3
Organisational development
Ostrobothnia 6 5.8 6.0 0.2 2.5 2.2 Finland 4 5.3 5.3 0.0 2.0 2.0
Marketing Ostrobothnia 6 7.2 7.3 0.1 2.5 2.5 Finland 5 7.0 6.8 -0.2 2.4 2.2
Expectations / Experiences, scale 1 = low, 10 = high Gap = Experience – Expectation Trend (future)/ History, scale 1 = decrease, 2 = as before, 3 = increase *International company – company evaluation are not reported due to low rate of response
The results for the energy sector are similar to the results for all the companies. In most cases we have negative but small gaps. The biggest gaps are for subcontrac-tors and technology in Ostrobothnia. The gaps were discussed during the focus group seminar and explanations were also provided. The region has several com-panies that are very successful globally and they have extremely high expecta-tions on their subcontractors. These companies must be competitive when it co-mes to quality, supply chain, cost level and so on. This provides a though climate for smaller, local subcontractors. They do not have enough resources to keep up with the latest developments in their sector and they are not always willing to take risks with new innovations. One possible solution could be to tie the subcontrac-tors closer to the bigger companies.

74 Proceedings of the University of Vaasa. Reports To be noticed in Table 5.10 is the high expectations the energy sector has on re-search partners in Finland. The education level in Ostrobothnia is on an acceptab-le level. To this one has to notice the high expectation challenging the university sector.
Table 5.10. Evaluation in the energy sector of cooperation expectations, experi-ences and trends: companies –universities
Energy sector cooperation with universities in Ostrobothnia and the rest of Finland* Aspect of cooperation Region n Expectations Experiences Gap Trend History Education Ostrobothnia 6 8.5 7.0 -1.5 2.7 2.3
Finland** - - - - - - Research Ostrobothnia 6 8.5 6.0 -2.5 2.8 2.5
Finland 4 9.0 7.5 -1.5 2.5 2.5 Development Ostrobothnia 5 7.2 6.6 -0.6 2.4 1.8
Finland 4 6.8 6.8 0.0 2.5 2.5 **not reported due to low rate of response *International company –University evaluation are not reported due to low rate of response.
Companies of the energy sector do not differ from other types of companies in terms of companies and public sector cooperation. Regional development has first priority, to be followed by issues of infrastructure and logistics. However one has to notice the low level of experiences, which is not a good grade for the public sector. (see Table 5.11)
Regional planning and use of land in Ostrobothnia are also problematic areas from the point of view of the energy sector. Use of land has the biggest gap but expectations are on the other hand not all that high, the expectations on regional planning are exceptionally high in combination with a substantial gap when com-paring against experiences. We also find one more aspect of cooperation in Ost-robothnia with a gap of at least two that is cooperation within infrastructure and logistics.

Proceedings of the University of Vaasa. Reports 75
Table 5.11. Evaluation in the energy sector of cooperation expectations, experi-ences and trends: companies – public organisations
Energy sector companies cooperation with public organisations in Ostrobothnia and the rest of Finland*
Aspect of cooperation
Region n Expectations Experiences Gap Trend History
Infrastructure and logistics
Ostrobothnia 4 8.5 6.5 -2.0 2.5 2.5 Finland 4 6.5 5.5 -1.0 2.3 2.5
Regional development
Ostrobothnia 5 9.0 6.6 -2.4 2.4 2.4 Finland 4 7.0 6.3 -0.7 2.3 2.3
Technology development
Ostrobothnia 6 7.3 6.5 -0.8 2.7 2.3 Finland 4 6.5 5.3 -1.2 2.3 2.0
Business development
Ostrobothnia** - - - - - - Finland** - - - - - -
Land use planning
Ostrobothnia 4 6.5 3.5 -3.0 1.8 1.5 Finland** - - - - - -
Environmental issues
Ostrobothnia** - - - - - - Finland 4 5.0 4.8 -0.2 2.3 2.0
Employment affairs
Ostrobothnia 5 5.8 5.8 0.0 2.2 2.4 Finland 4 5.5 5.8 0.3 2.3 2.0
**not reported due to low rate of response *International company – public sector evaluation are not reported due to low rate of response
The focus group seminar offered some insight and explanations for the question-naire results. One possibility is that we see a wind power effect. During the recent years we have experienced a great deal of interest in the region from several wind power plant actors. From their point of view it is problematic that it can take seve-ral years to obtain permit to build wind power plants. With the rapid development in the sector, technologies may change dramatically during such a long time pe-riod. Another, more general explanation is the tendency for companies and public sector to move in different directions. While companies strive to become more and more dynamic they feel that they are held back by the public sector with inc-reasing numbers of laws and regulations. A smoother cooperation with the diffe-rent agents in the public sector is a main priority. It was also mentioned during the discussions that Ostrobothnia is a big region with good resources, but they are too fragmented. When the resources are divided between many different actors, and decisions are made at different points in time there tend to be something for eve-ryone but not enough for anyone. In order to improve the situation we need to become better at working towards common goals.

76 Proceedings of the University of Vaasa. Reports 5.2 Universities as Triple Helix Actors
The University sector was represented by 12 respondents, and as Table 5.13 shows cooperation is primarily on a regional and national level when it comes to partners with companies. Internationally, joint projects are most often with other universities.
Table 5.13. University connectivity
Universities
Type of partner Region
Ostrobothnia Finland International
Company 70 (25) 43 (10) 4 (0) Public organisation 13 (10) 8 (2) 2 (0) University 4 (5) 11 (5) 16 (10) Development organisation 4 (4) 2 (0) 2 (0) Number of partners, mean (median)
Respondents representing the university sector find cooperation with companies as most important. One can also notice that these respondents do find contribution of regional actors more important than contributions of national and international actors (see Table 5.14).
Table 5.14. Partner importance from a university perspective
Universities and partner importance
Type of partner Region
Ostrobothnia Finland International Company 9.1 / 8.7 / 8.6 7.8 / 7.2 / 7.0 5.7 / 5.2 / 4.8 Public organisation 8.0 / 7.5 / 8.9 6.6 / 6.7 /7.5 6.2 / 5.9 / 5.8 University 8.0 / 7.9 / 8.3 8.3 / 7.0 / 6.8 8.1 / 7.2 / 6.2 Development organisation 8.1 / 8.0 / 8.3 7.1 / 6.4 / 7.0 6.4 / 3.8 / 3.8
Mean value, scale 1 = not at all important, 10 = very important research/education/social service development

Proceedings of the University of Vaasa. Reports 77
The figures presented in Table 5.15 portray a structure, which indicate that the university sector on all three dimensions supports the regional company helix. To be noticed is the fairly low experience level.
Table 5.15. Evaluation of cooperation expectations, experiences and trends: universities – companies
Universities - companies Aspect of cooperation
Region n Expectations Experiences Gap Trend Histo-ry
Education Ostrobothnia 12 8.1 6.9 -1.2 2.4 2.4 Finland 12 7.6 6.2 -1.4 2.3 2.3 International 7 8.0 7.3 -0.7 3.0 2.9
Research Ostrobothnia 13 9.1 7.8 -1.3 2.7 2.5 Finland 12 8.5 7.2 -1.3 2.3 2.3 International 7 7.9 6.9 -1.0 2.9 2.7
Development Ostrobothnia 13 9.1 7.9 -1.2 2.5 2.5 Finland 12 7.8 6.7 -1.1 2.3 2.3 International 6 7.7 7.2 -0.5 3.0 2.8
Expectation / Experiences, scale 1 = low, 10 = high Gap = Experience – Expectation Trend (future)/ History, scale 1 = decrease, 2 = as before, 3 = increase
The figures in Table 5.16 signals to the university sector that improvements are to be expected, and that international universities outperform the regional ones. Big gaps are almost exclusively found among the local universities. On the other hand we observe a slightly more positive development in Ostrobothnia, both regarding past history and future trend, compared to other regions.

78 Proceedings of the University of Vaasa. Reports Table 5.16. Evaluation of cooperation expectations, experiences and trends:
universities – other universities
Universities - universities Aspect of cooperation
Region n Expectations Experiences Gap Trend History
Education Ostrobothnia 14 7.6 6.0 -1.6 2.6 2.4 Finland 13 7.6 6.4 -1.2 2.5 2.3 International 12 7.6 6.6 -1.0 2.5 2.3
Applied research
Ostrobothnia 15 7.7 6.1 -1.6 2.6 2.7 Finland 13 7.6 6.7 -0.9 2.5 2.4 International 11 7.8 6.6 -1.2 2.6 2.6
Basic research Ostrobothnia 10 5.7 4.2 -1.5 2.6 2.6 Finland 9 6.9 5.2 -1.7 2.2 2.2 International 7 6.0 4.7 -1.3 2.4 2.1
Information system research
Ostrobothnia 5 4.4 3.2 -1.2 2.2 2.2 Finland 6 4.3 4.3 0.0 2.0 2.0 International 6 3.5 3.7 0.2 2.2 2.2
Regional research
Ostrobothnia 13 7.3 5.4 -1.9 2.7 2.6 Finland 9 6.2 5.2 -1.0 2.7 2.2 International 6 6.0 5.2 -0.8 2.5 2.5
Technology research
Ostrobothnia 10 7.6 6.3 -1.3 2.5 2.5 Finland 9 6.6 5.8 -0.8 2.6 2.3 International 8 5.9 5.4 -0.5 2.4 2.4
Production system research
Ostrobothnia 10 6.7 5.5 -1.2 2.6 2.4 Finland 8 5.5 4.1 -1.4 2.4 2.1 International 8 5.5 4.6 -0.9 2.5 2.5
Process research Ostrobothnia 10 7.4 6.0 -1.4 2.6 2.5 Finland 9 6.6 2.1 -1.5 2.4 2.1 International 7 5.4 4.1 -1.3 2.4 2.4
Organisational research
Ostrobothnia 9 6.8 5.2 -1.6 2.4 2.3 Finland 9 6.8 5.1 -1.7 2.4 2.1 International 9 6.0 4.8 -1.2 2.6 2.3
Leadership research
Ostrobothnia 10 7.0 5.2 -1.8 2.6 2.4 Finland 10 7.1 5.4 -1.7 2.5 2.2 International 10 6.4 5.3 -1.1 2.5 2.3
Marketing research
Ostrobothnia 9 7.8 6.7 -1.1 2.4 2.6 Finland 8 5.9 4.6 -1.3 2.3 2.1 International 8 6.6 5.1 -1.5 2.4 2.3
Cooperation between universities and public organisations was analysed on eight dimensions. Best cooperation experiences were found on dimensions, such as, regional development and research. In general it seems that the most problematic area is cooperation with the public sector in other parts of Finland. (see Table 5.17).

Proceedings of the University of Vaasa. Reports 79
Table 5.17. Evaluation of cooperation expectations, experiences and trends: universities – public organisations
Universities – public organisations Aspect of cooperation
Region n Expectations Experiences Gap Trend History
Education Ostrobothnia 13 7.6 6.5 -1.1 2.6 2.4 Finland 11 6.6 5.2 -1.4 2.6 2.2 International 7 7.0 6.3 -0.7 2.7 2.4
Research Ostrobothnia 15 8.3 7.3 -1.0 2.4 2.4 Finland 11 7.8 6.2 -1.6 2.6 2.4 International 8 7.4 6.0 -1.4 2.8 2.9
Employment matters
Ostrobothnia 12 6.8 5.7 -1.1 2.3 2.2 Finland 9 6.8 5.7 -1.1 2.3 2.2 International 5 4.8 4.0 -0.8 2.4 2.4
Environmental issues
Ostrobothnia 10 7.4 6.5 -0.9 2.6 2.4 Finland 8 6.6 5.5 -1.1 2.4 2.1 International 5 5.6 4.6 -1.0 2.6 2.6
Information system development
Ostrobothnia 6 5.0 3.5 -1.5 2.3 2.3 Finland 4 4.5 3.3 -1.2 2.5 2.3 International 5 5.2 4.0 -1.2 2.6 2.6
Regional development
Ostrobothnia 12 8.3 7.1 -1.2 2.7 2.4 Finland 10 7.0 5.6 -1.4 2.4 2.2 International 6 7.3 6.3 -1.0 2.5 2.5
Organisational development
Ostrobothnia 11 7.4 6.2 -1.2 2.5 2.3 Finland 8 6.3 5.0 -1.3 2.4 2.0 International 5 4.2 3.4 -0.8 2.4 2.4
Marketing development
Ostrobothnia 11 6.0 5.4 -0.6 2.5 2.3 Finland 8 6.0 5.0 -1.0 2.5 2.0 International 5 5.0 4.4 -0.6 2.6 2.4
5.3 Public Organisations as Triple Helix Actors
In this section we will examine the depth and regional focus of public sector coo-peration. From Table 5.18 we can clearly see that most public sector cooperation is done together with local companies. This is not surprising since the role of the public sector at large is to serve and monitor the firms in Ostrobothnia in many different areas. In the same way it is natural to find close connections within Ost-robothnia with other public sector actors, the university sector and development organisations. There are also a significant number of public sector partners in other parts of Finland; these are a result of government contacts, for example cooperation with different ministries and municipalities. Table 5.19 reinforces the above interpretation, the most important partners are found locally. Public sector partners in other parts of Finland are also important whereas international partners are considered less important.

80 Proceedings of the University of Vaasa. Reports Table 5.18. Public organisation connectivity
Public organisations
Type of partner Region
Ostrobothnia Finland International Company 197 (50) 26 (4) 7 (0) Public organisation 25 (20) 27 (10) 5 (2) University 5 (5) 3 (2) 1 (0) Development organisation 4 (5) 6 (2) 1 (0)
Number of partners, mean (median)
Table 5.19. Partner importance from a public organisation perspective
Examining the depth of the cooperation in Ostrobothnia we see (Table 5.20) that the highest expectations can be found for industry development, this is natural considering the role of the public sector. This is also the area where we find the highest experiences indicating that the cooperation within this area is on a fairly good level. Regional development on the other hand is slightly more problematic, also here the expectations are rather high but experiences do not quite match up. This is the sector where we observe the biggest gap. However, trend and history variables have mean levels above two, showing that things have improved in the past and are expected to improve in the future.
Public organisations and partner importance
Type of partner Region
Ostrobothnia Finland International Company 8.7 / 7.6 7.6 / 6.8 6.6 / 5.1 Public organisation 8.6 / 8.3 8.2 / 7.0 5.9 / 5.7 University 8.1 / 7.1 7.9 / 6.5 6.4 / 4.4 Development organisation 8.0 / 8.5 7.0 / 7.1 5.8 / 5.5
Mean value, scale 1 = not at all important, 10 = very important support/strategy

Proceedings of the University of Vaasa. Reports 81
Table 5.20. Evaluation of cooperation expectations, experiences and trends: public organisations – companies in Ostrobothnia
Public organisations - companies Aspect of cooperation
n Expectations Experiences Gap Trend History
Infrastructure and logistics 11 8.0 6.8 -1.2 2.4 2.3
Regional development 13 8.9 7.5 -1.4 2.5 2.5
Technology development 14 8.8 7.6 -1.2 2.6 2.4
Business life development 14 9.1 8.0 -1.1 2.3 2.4
Land use plan-ning 10 6.8 6.0 -0.8 2.6 2.3
Environmental issues 11 7.5 6.5 -1.0 2.6 2.6
Employment affairs 12 7.8 6.8 -1.0 2.3 2.3
Expectations / Experiences, scale 1 = low, 10 = high Gap = Experience – Expectation Trend (future)/ History, scale 1 = decrease, 2 = as before, 3 = increase
Moving on to public sector – university sector cooperation in Table 5.21 it seems that education cooperation nationally is the most problematic area with the big-gest gap. The expectations are not all that high but experiences even lower. Other problematic areas are research and regional development, both within Ostroboth-nia. Notice also that these areas attracted high response rates, which emphasises their importance.
In the final part we examine the public sector – public sector cooperation present-ed in Tables 5.22 and 5.23. On the regional level the biggest gap concern infrast-ructure, in other parts of Finland infrastructure and environment are the most problematic areas. Regional development is worth mentioning as a positive example, very high expectations combined with decent experience levels. Loo-king at international cooperation we find that most of the dimensions are proble-matic with big gaps, this is an area with definite room for improvements. On the positive side, all areas exhibit strong positive trends so there is hope for better performances in the future.

82 Proceedings of the University of Vaasa. Reports Table 5.21. Evaluation of cooperation expectations, experiences and trends:
public organisations –universities
Public organisations - universities Aspect of cooperation
Region n Expectations Experiences Gap Trend History
Education Ostrobothnia 13 8.2 6.6 -1.6 2.5 2.2 Finland 9 7.9 5.9 -2.0 2.3 2.3 International 5 7.4 5.2 -1.2 2.6 2.4
Research Ostrobothnia 12 8.5 6.8 -1.7 2.7 2.3 Finland 10 7.7 6.6 -1.1 2.4 2.5 International 5 7.6 6.2 -1.4 2.8 2.4
Employment matters
Ostrobothnia 9 7.6 6.4 -1.2 2.3 2.2 Finland 8 7.3 6.0 -1.3 2.4 2.4 International 5 5.0 4.0 -1.0 2.2 2.0
Environmental issues
Ostrobothnia 11 6.8 5.5 -1.3 2.6 2.5 Finland 8 5.9 4.6 -1.3 2.3 2.0 International 6 5.7 4.2 -1.5 2.5 2.0
Information system development
Ostrobothnia 6 5.8 4.3 -1.5 2.2 2.2 Finland 6 5.0 4.0 -1.0 2.3 2.2 International 4 5.0 4.5 -0.5 2.0 1.8
Regional development
Ostrobothnia 14 9.1 7.4 -1.7 2.5 2.4 Finland 9 7.7 6.6 -1.1 2.1 2.0 International 6 7.8 6.3 -1.5 2.5 2.3
Organisational development
Ostrobothnia 5 5.2 4.6 -0.6 2.4 2.2 Finland 6 5.8 5.0 -0.8 2.3 2.2 International 4 5.8 5.5 -0.3 2.3 2.3
Marketing development
Ostrobothnia 5 5.6 4.2 -1.4 2.6 2.0 Finland 5 6.2 5.4 -0.8 2.4 2.2 International 4 6.5 5.8 -0.7 2.5 2.3
Table 5.22. Evaluation of cooperation expectations, experiences and trends: public organisations – other public organisations in Ostrobothnia and other parts of Finland
Public organisations – other public organisations, Ostrobothnia and other parts of Finland
Aspect of cooperation
Region n Expectations Experiences Gap Trend History
Infrastructure Ostrobothnia 12 8.7 7.0 -1.7 2.5 2.5 Finland 9 8.3 6.6 -1.7 2.6 2.4
Regional development
Ostrobothnia 15 9.1 8.0 -1.1 2.5 2.4 Finland 13 8.2 6.6 -1.6 2.4 2.1
Environmental issues
Ostrobothnia 12 7.5 6.3 -1.2 2.6 2.5 Finland 9 8.2 6.0 -2.2 2.3 2.1
Employment affairs
Ostrobothnia 14 7.4 6.6 -0.8 2.4 2.3 Finland 10 6.4 5.5 -0.9 2.3 2.0

Proceedings of the University of Vaasa. Reports 83
Table 5.23. Evaluation of cooperation expectations, experiences and trends: public organisations – other public organisations internationally
Public organisations – other public organisations, internationally Aspect of cooperation n Expectations Experiences Gap Trend History Technology and busi-ness life development 10 8.5 7.3 -1.2 2.6 2.4
Environmental issues 8 8.1 6.6 -1.5 2.6 2.3 Logistics 8 8.2 6.0 -2.2 2.9 2.6 Education 7 7.6 4.9 -2.7 2.7 2.3 Regional development 8 7.9 5.9 -2.0 2.6 2.4
5.4 Technologies for Innovations
The last section of the questionnaire included questions about technology for in-novation, with a reference to their importance today and in 20 years (Table 5.24). As can be seen from the Table, the respondents have a firm belief in renewable energy as a sector for regional innovations, and a competitive advantage founded on advanced production methods. Another important sector for innovations is smart grids.
Table 5.24. Perceived importance of technology for innovations
Importance
Technology
n Today In 20 years
Nanotechnology 31 4,4 7,2 Micro- and nanoelectronics including semiconductors 30 6,0 8,0
Photonic 25 3,9 5,3 Advanced materials 38 6,3 8,0 Biotechnology 34 5,3 7,2 Advanced production methods 39 7,4 8,8 Smart grids (intelligent electrical networks) 44 7,0 8,9
Renewable energy 28 7,1 9,5
It was concluded earlier that regional cooperation is important and strong. There-for it is of interest to further analyse where the most important cooperation part-

84 Proceedings of the University of Vaasa. Reports ners are located today and in the future. As can be found in Table (5.25), the res-pondents have a strong belief in the region on all dimensions.
Table 5.25. For technology development where are the most important partners located
The location of technological inno-vators
Within own organisation
In the companies
In the public organisations
Universities and research entities
Development organisations
In Ostrobothnia and Central Ostrobothnia 28 43 13 34 22
In other parts of Fin-land 6 37 6 30 10
In the rest of the world 7 28 6 26 10
Looking into the future and inspiration to technology development, the respon-dents have a strong belief in the knowledge generation processes of the com-panies (the company helix). Interesting to notice is also the importance of univer-sities, especially those located abroad, for new technology development (Table 5.26).
Table 5.26. Evaluation of own organisation and helixes for new technology de-velopment (scale 1 to 10)
Where will Ostrobothnian or-ganisations find technological development partners 20 years hence?
Within own organisation
In the companies
In the public organisations
Universities and research entities
Development organisations
In Ostrobothnia and Central Ostrobothnia 7,5 8,8 3,9 8,0 5,7
In other parts of Fin-land 6,6 8,3 4,4 8,5 5,6
In the rest of the world 6,3 8,5 3,6 8,9 6,1

Proceedings of the University of Vaasa. Reports 85
5.5 Summary
The findings presented in this chapter, with a focus on all actors analysed, portray a triple helix structure (Figure 5.1) which out of a:
Company helix perspective shows: – a strong regional intra-business helix, in terms of number and quality of com-
pany interactions. To this, it can be added that companies in Ostrobothnia have extended networks, which also include national and international com-panies.
– negative cooperation experiences (with all actors, from all helixes) measured as Gaps of experiences to expectations, and
– a trend, which emphasise the importance of cooperation networks.
University helix perspective shows: – well-developed network to regional and national companies and public actors.
– good connections to regional universities, as well as, national and internation-al ones, and
– although the experiences of the connections does not meet up to the expecta-tions, actors representing the University helix advocate the importance of the triple helix structure.
Public helix perspective shows: – many connections to companies and other actors in the public helix as well as
to regional universities.
– actors representing the public sector are most critical to existing cooperation networks in terms of experiences to expectations, and
– in particular, the experiences of public and university cooperation in terms of education and research is fairly low.
Counting the number of connections between different types of actors and based on this measure estimate a share of connectivity between the different types of helix the following structure emerges. (Figure 5.1).

86 Proceedings of the University of Vaasa. Reports
Figure 5.1. Triple helix structure in Ostrobothnia
Companies in Ostrobothnia cooperate most with other companies (86 % of the links between partners are company to company interactions). 11 percent of the companies’ contacts are with the public sector and 3 percent with universities. The cooperation structure is completely different in the Public and University Helix. Here, the intra-helix cooperation is on much lower level, and the contacts with the companies dominate.
With a focus on Ostrobothnia and perceived partner importance for innovation, strategy and research it can be concluded that companies lean on cooperation with other companies, the universities find cooperation with companies as most impor-tant, and actors in the public sector take influence from all helixes in strategic issues.
Based on the identified gaps between expectations and experiences of cooperation between different helixes in Ostrobothnia (Figure 5.2) it can be argued that:

Proceedings of the University of Vaasa. Reports 87
Figure 5.2. Perceived partner importance in the triple helix of Ostrobothnia (in-novation for the company helix/ strategy for the public helix / re-search for the University helix)
In Company – University helix:
Universities have better experiences, but are more dissatisfied with the cooperati-on than companies.
In Company – Public helix:
Large gaps can be identified analysing companies perception on public actors in terms of regional development and land use plans in Ostrobothnia. One can also notice that actors of the public helix evaluate their cooperation with the com-panies as better than the company actors perceive on all dimensions but “Infrast-ructure logistics”. A particular large discrepancy is on the “Industry develop-ment” dimension. The Public sector actors consider the cooperation as 8 in com-parison to the companies which grade it as 5.7.
In University – Public helix:
The experienced cooperation is on a fairly low level on all dimensions from both perspectives. One can notice that actors of the public helix are particularly disap-pointed with the regional academic research.

88 Proceedings of the University of Vaasa. Reports The empirical findings presented in this chapter have many dimensions for inter-pretation. The summary presented in this section has had a focus on the triple helix structure of Ostrobothnia and dimensions linked innovations such as re-search and industry development. For further in-depth studies focus can be put on national and international cooperations, as well as, on all sub-dimensions reported in the Tables.
Respondents were also asked about technologies for innovations. Generally, they have a strong belief in all eight technologies asked for. However, they point out renewable and smart grid technologies as the two most important development areas. Furthermore, it can be concluded that partners for technology development are identified in cooperation with other companies and universities, mainly re-gional. Finally, the findings give reason to believe that knowledge for technology innovations, in the future, will be absorbed from universities abroad.

Proceedings of the University of Vaasa. Reports 89
6 APPLYING SUSTAINABLE COMPETITIVE ADVANTAGE (SCA) METHOD FOR REGIONAL INNOVATIONS
Daryna Shylina, Sara Tilabi and Josu Takala, University of Vaasa: Industrial Management
The growing role of technology cannot be underestimated nowadays as it brings vast number of opportunities for business development, growth and strengthen the companies’ competitive advantages (Takala 2012). The advanced technology is the source of profit and competitiveness to enterprises, and at the same time, it also supports enterprises to adapt to market changes. Along with the unceasing renovation of technology, enterprises must continually adapt to the technical re-quirements of market.
This article concentrates on smart specialisation and especially on estimation of connectivity between companies, public sector and academic area with the help of Sustainable Competitive Advantage (SCA) method. First, background informati-on and theory is covered in details and then analyses based on technology ran-kings and RAL model are performed separately. At the final stage, SCA analysis is used to see how companies, academic area and other companies are connected. The idea is that the higher connectivity leads to more successful and sustainable developments.
6.1 Theoretical Background and Methodology
Sense and Respond Model
Sense and respond strategy is used to assist in forming a picture of what might happen in the future. Using sense and respond method enables firms not only to collect data regarding expectations and experiences but also to understand how firms see themselves compared to competitors. Besides, firms are able to see the development of a certain attribute at a given time frame (Strauss and Neuhauss 1997; Bradley and Nolan 1998; Ranta and Takala 2007). The following Table 6.1 shows model of questionnaire for Sense and Respond method (Ranta & Takala, 2007):

90 Proceedings of the University of Vaasa. Reports Table 6.1. Format of the questionnaire (adapted from Ranta and Takala 2007)
Performance attribute
Scale: 1=low, 10=high Compared with competitors
Direction of development
Expectation (1-10)
Experience (1-10)
worse same better worse same better
Performance 1 Performance 2
Critical Factor Index and Balanced Critical Factor Index
“The Critical Factor Index (CFI) method is a measurement tool to indicate which attribute of a business process is critical and which is not, based on the experience and expectations of the company’s employees, customers or business partners” (Ranta & Takala 2007).
In fact, the CFI method is a supporting tool for the strategic decision-making. This tool helps mangers to make decision fast and react more suitable. In the cur-rent business environment fast adaptation and development can be considered as one of the most important company strengths (Takala & Uusitalo 2012).
Balanced Critical Factor Index (BCFI), that is modified CFI, detects the most critical factors affecting the overall company’s performance much more properly and reliably. BCFI method provides the company with the crucial strategic data for the approach development and correction. The easiest way for the required data collection is the qualitative questionnaire. The key issue is that the more in-terviews take place in the data collection phase, the results are more reliable.
The Scaled Critical Factor Index (SCFI) model is developed by Takala and Liu (2011) which adds trend research into the study (Liu 2010).
After the data collection, the formulas from 1 to 10 (Table 6.2) are used to calcu-late CFI, BCFI SCFI and New Scaled Critical Factor Index (Nadler & Takala 2008; Takala & Uusitalo 2012):

Proceedings of the University of Vaasa. Reports 91
Table 6.2. CFIs calculation formula
Name Model
CFI CFI= (1)
BCFI BCFI=
(2)
SCFI
SCFI=
(3) (3)
NSCFI indext Developmen index Gap index Imprtance
]1)(nexpectatio[n1 ]1)(experience[
n1
NSCFI 1
2
1
2
⋅⋅
−⋅⋅−⋅=
∑∑nn
ii
(4)
Parameters:
– Importance index: presents the level of importance of one criterion among
others. This index reflects the actual expectations of the company regarding one criterion.
Importance index = (5)
– Gap Index: which is used to understand the gap between experience and ex-
pectations of a specific criteria
Gap index= (6)
– Development index: This presents the information about the actual direction
of the company’s development.

92 Proceedings of the University of Vaasa. Reports
Developments index= (7)
– Performance index: presents the value of an attribute’s performance based on
the real experience of the respondents
Performance index= (8)
– Standard deviation of experience: represents if respondents have similar an-
swer regarding to one attribute for what they have experienced.
SD experience index = (9)
– Standard deviation of expectations: reflect if respondents have similar answer
regarding to one attribute for expectation in a specific future.
SD expectation index = (10)
When the calculations are ready, the results of CFI, BCFI and SCFI calculation can be presented in the following bar chart (Figure 6.1). The different questions and their identification numbers can be found as an appendix 2.
Figure 6.1. Example of the final bar chart to represents CFI, BCFI or SCFI re-sults

Proceedings of the University of Vaasa. Reports 93
Method of judgments for critical attributes
Once the bar chart is ready, three colors are used to define the level which one attribute are located: red for under resources attributes, green for normal attribute (not critical) and yellow for over recourses attributes. Both red and yellow bars (over and under resources attributes) are critical.
For defining the better resource allocation, firstly, the whole resource is counted to be 100 % and it is divided to the total number of attributes to define the aver-age resource level. Then an attribute is counted to be balanced and takes the green color if CFI (BCFI/SCFI) value is between the range of 1/3 and 2/3 of average resource level. For the rest, if any attribute has lower value than 1/3 of average resource level then it is counted to be under resourced and takes the red color. If one attribute has higher value than 2/3 of average resource level is counted to be over resourced and takes the yellow color (Liu et al. 2011).
RAL model
The way to integrate Miles & Snow Topology (Miles and Snow 1978) into Sense and Response methodology is to use RAL Model (Figure 6.2). RAL is abbre-viated from Responsiveness, Agility and Leanness. A firm can optimize the RAL model components (Responsiveness, Agility, Leanness) by prioritizing between cost, quality, time and flexibility (Takala 2012).
– Responsiveness: is firm’s ability to respond and to react to the customers de-
mand within the constraints of cost and time (Holweg 2005). – Agility: is ability to adjust in competitive and turbulent environments. Yauch
(2011) writes agility results to on time delivery with the optimal cost and qual-ity.
– Leanness: which means to minimise waste which helps company to improve quality and reduce cost and delivery time (Senaratne 2008).

94 Proceedings of the University of Vaasa. Reports
Figure 6.2. RAL model (Ranta & Takala 2007)
Methodology: case studies
In order to test the model, 21 case studies from three industry sectors in Ostro-bothnia were investigated. Cases are studied with the empirical material received by the questionnaire presented in Chapter 4. The numbers of interviews regarding to each group are as follows: 1. Energy sector: 9 companies 2. Boat industry: 3 companies 3. Fur industry: 3 companies 4. Other industry: 6 companies
The SCA factors are calculated for each company, and risk levels for companies’ strategy are evaluated. Also in order to evaluate the effect of Technology and knowledge on CFIs, three companies from energy sector are asked to answer the Technology/Knowledge questionnaire. All the various questions measured and their identification number can be found as an appendix 2.
6.2 Energy Sector
The following Table shows the overall situation of connectivity among compa-nies, academic sector and public part in energy sector (see Table 6.3).
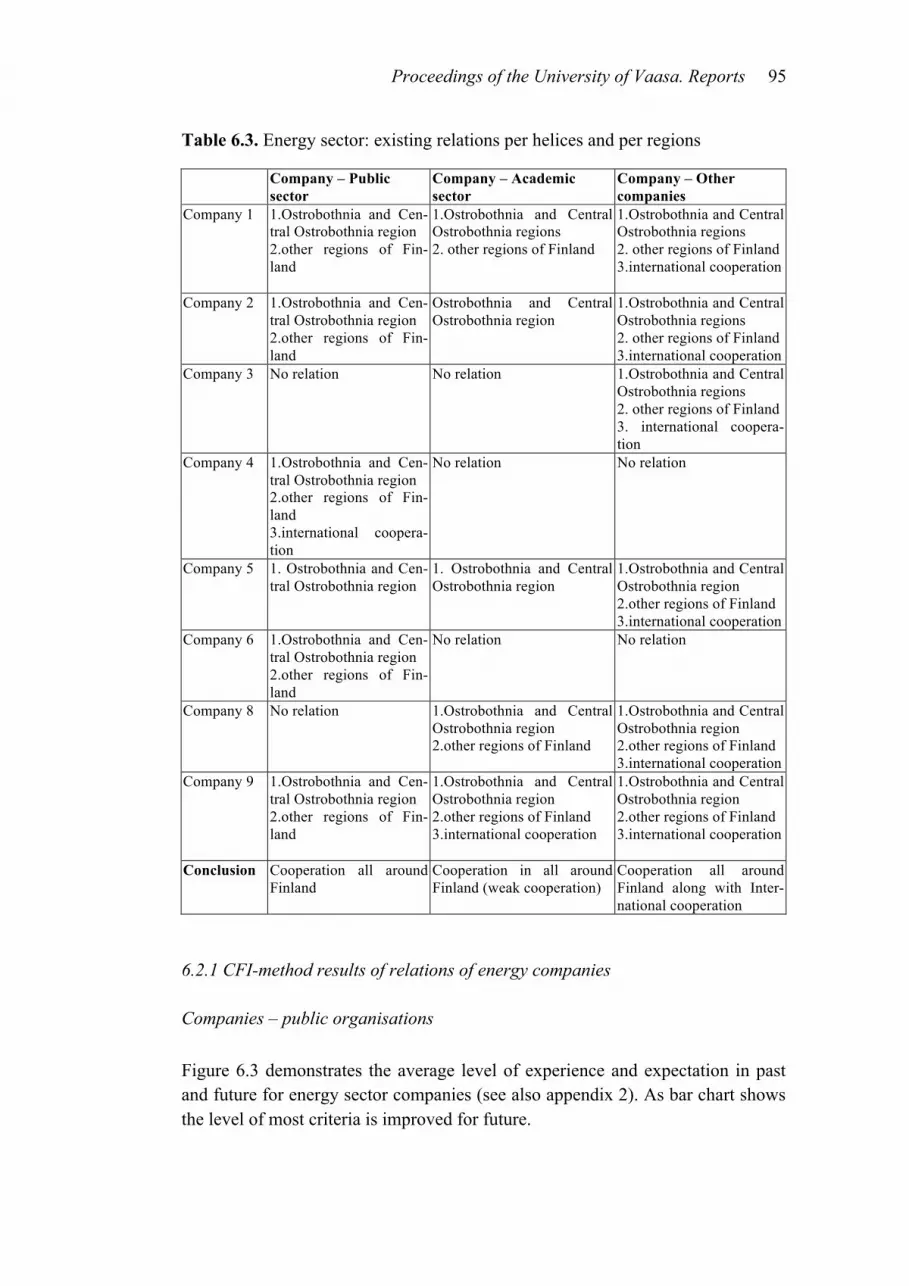
Proceedings of the University of Vaasa. Reports 95
Table 6.3. Energy sector: existing relations per helices and per regions
Company – Public sector
Company – Academic sector
Company – Other companies
Company 1
1.Ostrobothnia and Cen-tral Ostrobothnia region 2.other regions of Fin-land
1.Ostrobothnia and Central Ostrobothnia regions 2. other regions of Finland
1.Ostrobothnia and Central Ostrobothnia regions 2. other regions of Finland 3.international cooperation
Company 2
1.Ostrobothnia and Cen-tral Ostrobothnia region 2.other regions of Fin-land
Ostrobothnia and Central Ostrobothnia region
1.Ostrobothnia and Central Ostrobothnia regions 2. other regions of Finland 3.international cooperation
Company 3
No relation No relation 1.Ostrobothnia and Central Ostrobothnia regions 2. other regions of Finland 3. international coopera-tion
Company 4
1.Ostrobothnia and Cen-tral Ostrobothnia region 2.other regions of Fin-land 3.international coopera-tion
No relation No relation
Company 5
1. Ostrobothnia and Cen-tral Ostrobothnia region
1. Ostrobothnia and Central Ostrobothnia region
1.Ostrobothnia and Central Ostrobothnia region 2.other regions of Finland 3.international cooperation
Company 6
1.Ostrobothnia and Cen-tral Ostrobothnia region 2.other regions of Fin-land
No relation No relation
Company 8
No relation 1.Ostrobothnia and Central Ostrobothnia region 2.other regions of Finland
1.Ostrobothnia and Central Ostrobothnia region 2.other regions of Finland 3.international cooperation
Company 9
1.Ostrobothnia and Cen-tral Ostrobothnia region 2.other regions of Fin-land
1.Ostrobothnia and Central Ostrobothnia region 2.other regions of Finland 3.international cooperation
1.Ostrobothnia and Central Ostrobothnia region 2.other regions of Finland 3.international cooperation
Conclusion Cooperation all around Finland
Cooperation in all around Finland (weak cooperation)
Cooperation all around Finland along with Inter-national cooperation
6.2.1 CFI-method results of relations of energy companies
Companies – public organisations
Figure 6.3 demonstrates the average level of experience and expectation in past and future for energy sector companies (see also appendix 2). As bar chart shows the level of most criteria is improved for future.

96 Proceedings of the University of Vaasa. Reports
Figure 6.3. Energy industry: Average of expectations vs. average of experiences (company-public organisation)
The following bar chart (Figure 6.4.) shows NSCFI results of the relation between company and public organisation in energy sector for future.
Figure 6.4. Energy industry: NSCFI (future), company-public organisation
As the bar charts shows, most of attributes are in balanced level in future but all 5 attributes of international cooperation are under resource area which means that energy sector companies in Ostrobothnia region are disconnected from interna-tional public organisations. These attributes are: cooperation on technological and business life development; cooperation on environmental issues; cooperation on logistics; cooperation on regional development; and cooperation on education.
Companies – universities
Figure 6.5 compares the average level of resources for different criteria in past and future. As the bar chart shows, the level of most criteria improves in future

Proceedings of the University of Vaasa. Reports 97
which means that the companies in energy sector plan to have better connection with universities.
Figure 6.5. Energy industry: Average of expectations vs. average of experiences (companies- universities)
Bar chart (Figure 6.6) demonstrates of NSCFI analysis between companies and universities in energy sector for future:
Figure 6.6. Energy industry: NSCFI (future), companies-universities
As the above bar chart shows most of the attributes are in balanced level. But companies in energy sector have problem with international cooperation. It means that their relations with their university partners should be taken in to considerati-on. These critical attributes are: we contact our most important partner; we know our most important partner’s R&D and education methods; we know our most
0,001,002,003,004,005,006,00
1.1.
1.2.
1.3.
2.1.
2.2.
2.3.
2.4.
2.5.
3.1.
3.2.
3.3.
4.1.
4.2.
4.3.
4.4.
4.5.
5.1.
5.2.
5.3.
6.1.
6.2.
6.3.
6.4.
6.5.
Average of expectation Average of experiences

98 Proceedings of the University of Vaasa. Reports important partner’s work; our most important partner improves our innovation; we know our most important partner’s research and education staff.
Companies – other companies
Figure 6.7. presents the average level of different criteria for past and future. Here also the level of most attributes improves in future which means companies plan to have more and better connection with other companies.
Figure 6.7. Energy industry: Average of expectations vs. average of experiences (companies- other companies)
Bar chart in Figure 6.8 demonstrates the relation between respondents in energy sector and other companies in Ostrobothnia. As the Figure shows, almost all crite-ria are located in balanced level which means that energy sector companies do not have serious problems in terms of different attributes of the cooperation with oth-er companies. Only in the Ostrobothnia region there are some unclear attributes, which means that different respondents have different opinions about it. These areas are: cooperation with subcontractors; cooperation with customers; coopera-tion in developing production functions; cooperation on production system deve-lopment and cooperation in marketing. The problematic areas in other parts of Finland are on cooperation with subcontractors and cooperation on organisational development.

Proceedings of the University of Vaasa. Reports 99
Figure 6.8. Energy industry: NSCFI (future), companies-other companies
3.2.1 SCA -risk level results
SCA -risk level for energy sector companies for past and future are demonstrated in following Tables:
Table 6.4. Energy industry: SCA -risk level, past
BCFI SCFI NSCFI Companies – Public organisations 0.98 0.99 0.97 Companies – Universities 0.89 0.87 0.89 Company – Other companies 0.94 0.95 0.95
Table 6.5. Energy industry: SCA -risk level, future
BCFI SCFI NSCFI Companies – Public organisations 0.95 1 0.96 Companies – Universities 0.89 0.88 0.89 Companies – Other companies 0.94 0.96 0.95
Comparison between Table 6.4 and Table 6.5 shows that SCA -risk level for en-ergy sector companies remains almost unchanged in future. It means that internal resources allocation for energy sector companies supports equally companies’ strategies in different sector (public sector, academia, and other companies) in past and future.

100 Proceedings of the University of Vaasa. Reports 6.2.3. The effect of technology and knowledge on CFIs calculation
Besides the smart specialisation questionnaire extra information was asked from energy companies. Questions on technology and knowledge (T/K) co-operation were answered by three companies from energy industry. The following three bar charts (Figures 6.9, 6.10 and 6.11) show how T/K calculations affect on CFIs results:
Figure 6.9. Demonstration of T/K on NSCFI – companies and public organisa-tions
Figure 6.10. Demonstration of T/K on NSCFI – company and universities

Proceedings of the University of Vaasa. Reports 101
Figure 6.11. Demonstration of T/K on NSCFI – companies and other companies
As three bar charts reveal, adding T/K factor on NSCFI effects on the results but not to a fixed direction; for some attributes the revel of resources increases and for some of them decreases.
6.2 Fur Industry
Three fur industry companies were interviewed. The results show that fur industry companies and public organisations have cooperation all around Finland, and there is also strong cooperation between companies and universities in Ostroboth-nia and at international level. The cooperation among companies is strong all around Finland and also in international level.
6.3.1 CFI-method results of relations of fur companies
Companies – public organisations
The following bar chart (Figure 6.12.) reveals the difference between average of expectations and average of experiences. The comparison of experiences and ex-pectations in cooperation between companies and public organisations reveals, where the resources should or should not be put in the future period.

102 Proceedings of the University of Vaasa. Reports
Figure 6.12. Fur industry companies – Public organisations: Average of expec-tations vs. average of experiences
According to this bar chart (Figure 6.12.), level of most of the attributes increases in future, which means that a company expects to have significant improvement in cooperation with public sectors in other regions of Finland and in the interna-tional level. However, the fur industry companies expect a stable development in cooperation with public organisations in Ostrobothnia region in such criteria as cooperation on infrastructure and logistics; cooperation on business development; cooperation on employment affairs; our most important partner contacts us; our most important partner knows our operations; and our most important partner knows our staff.
In order to define problematic and stable areas NSCFI method is used. The results in future period time can be seen in the following chart (Figure 6.13.).
Figure 6.13. Fur industry companies – Public organisations: NSCFI (future)

Proceedings of the University of Vaasa. Reports 103
The situation in future will be worsened in cooperation with public organisations in other regions of Finland. More scattered areas will be appeared as an addition to the past situation: cooperation on infrastructure and logistics; cooperation on business development; cooperation on technology development. At the same ti-me, at the international level more critical attributes will be appeared as well addi-tional to past period: cooperation on infrastructure and logistics; co-operation on education; cooperation on regional development; our most important partner knows our work. Nonetheless, in Ostrobothnia region cooperation on business development attribute will be stabilised.
Companies – universities
The following bar chart provides information about differences between experi-ences and expectations in cooperation between fur industry companies and uni-versities. Based on this bar chart, it can be noticed that companies expect to see improvements in future in cooperation in Ostrobothnia and international level. However, in other regions of Finland most companies want to have stable devel-opment. (Figure 6.14.)
Figure 6.14. Fur industry companies – Universities: Average of expectations vs. average of experiences
Next bar chart (Figure 6.15.) shows the situation in relationship between com-panies and universities in future. According to this graph, the cooperation will be stable and will be significantly improved. There are no critical problems in other regions in Finland. On the other hand there is only one serious problem in the

104 Proceedings of the University of Vaasa. Reports international cooperation: educational cooperation and one scattered attribute in the same region: our most important partner improves our innovation.
Figure 6.15. Fur industry companies – Universities: NSCFI (future)
Companies – other companies
Figure 6.16. compares the average of experience with average of expectations in companies’ collaboration with other companies. It can be seen from a graph that companies would like to enhance their cooperation with other companies in futu-re, especially in Ostrobothnia, and at international level. In other regions of Fin-land the improvements are not crucial and sometimes it can be even stable.
Figure 6.16. Fur industry companies – Other companies: Average of expecta-tions vs. average of experiences

Proceedings of the University of Vaasa. Reports 105
Following chart (Figure 6.17.) represents the general situation of the cooperation of fur industry companies. The results are positive and it means that fur industry companies do not have vital problems in cooperation with other companies. Only cooperation between departments of the own company in Ostrobothnia region is defined as problematic, on which attention and resources should be put on. In addition to that there are three scattered attributes in other regions of Finland and in the international level. They are: cooperation with customers in Ostrobothnia region; our most important partner in other parts of Finland helps us with our dif-ficult problems; and we share our key know-how with our most important interna-tional partner during mutual innovation.
Figure 6.17. Fur industry companies – Other companies: NSCFI (future)
3.2.1. SCA -risk level results
SCA -risk level for fur sector companies for past and future are demonstrated in following Tables (6.6 and 6.7):
Table 6.6. SCA -risk level, past
BCFI SCFI NSCFI Companies – Public organisations 0.93 0.93 0.94 Companies – Universities 0.93 0.92 0.91 Companies – Other companies 0.99 0.99 0.98

106 Proceedings of the University of Vaasa. Reports Table 6.7. SCA -risk level, future
BCFI SCFI NSCFI Companies – Public organisations 0.99 0.96 0.96 Companies – Universities 0.90 0.90 0.90 Companies – Other companies 0.99 0.98 0.98
Comparison between the two Tables shows that SCA -risk level for fur sector companies will increase in future. It means that resources allocation for fur in-dustry companies will be used in a proper way and critical areas will be changed into stable areas. However, risk levels in cooperation between fur companies and universities will decrease and resources are not allocated for developing this col-laboration.
6.3 Boat Industry
Three boat industry companies were interviewed. According to the results there is cooperation between companies and public organisations all around Finland and at international level. Companies and universities have strong cooperation in Ost-robothnia. There is cooperation among companies all around Finland and also in international level.
6.3.1 CFI-method results
Companies – public organisations
Comparison of average of experiences and average of expectations is reveled in the chart below (Figure 6.18), which helps to define the areas of expected devel-opment in boat industry. It reveals that in Ostrobothnia relationships between boat industry companies and public organisations could be significantly improved whi-le there are no crucial changes in other regions of Finland or internationally.

Proceedings of the University of Vaasa. Reports 107
Figure 6.18. Boat industry companies – Public organisations: Average of expec-tations vs. average of experiences
Bar chart (Figure 6.19.) below demonstrates the cooperation situation between companies and public organisations in future. Based on this graph, it can be noti-ced that situation in the future is almost stable. However, there are areas in every region which should be put more attention on. They are: cooperation on infrast-ructure and logistics and our most important partner improves our innovation pro-cess in Ostrobothnia; cooperation in business development and cooperation in employment affairs in other parts of Finland, and finally cooperation on regional development and cooperation on education development internationally. At the same time cooperation in other parts of Finland has the biggest amount of scatte-red attributes: cooperation on regional development; our most important partner knows our work; and our most important partner knows our staff.
Figure 6.19. Boat industry companies – Public organisations: NSCFI (future)

108 Proceedings of the University of Vaasa. Reports Companies – universities
Following graph (Figure 6.20.) reveals the comparison between expectations and experiences among companies and universities in boat industry. Consequently, the results show that boat industry companies expect to have considerable deve-lopment and big changes in future in all regions of Finland and also international-ly.
Figure 6.20. Boat industry companies – Universities: Average of expectations vs. average of experiences
Based on NSCFI-method, future situation of relationship between boat industry companies and universities is defined. Below graph (Figure 6.21) revels some areas needed to be considered above all. They are: we know our most important partner's R&D and education methods; our most important partner improves our innovation processes; we know our most important partner’s research and educa-tional staff in other parts of Finland and international cooperation on education; our key partner improves our innovational activities; we know our most important international partner’s research and educational staff. Additionally, there are un-defined and unclear areas in Ostrobothnia: cooperation on education and coopera-tion on research.

Proceedings of the University of Vaasa. Reports 109
Figure 6.21. Companies – universities: NSCFI (future)
Boat industry companies – other companies
The following bar chart (Figure 6.22.) shows the average of expectations and ave-rage of experiences between interviewed boat industry companies and other com-panies. We find significant gaps in this kind of collaboration in Ostrobothnia, while gaps in other regions of Finland and internationally are minor.
Figure 6.22. Boat industry companies – Other companies: Average of expecta-tions vs. average of experiences

110 Proceedings of the University of Vaasa. Reports In order to define the problematic areas in future in relations between boat indust-ry companies and other companies, NSCFI-method was used with the help of “traffic light” method (Figure 6.23.). Overall, the situation is stable, even though critical and scattered areas are observed all around Finland and internationally. Critical areas are: cooperation on production system development and coopera-tion on process development in Ostrobothnia; cooperation within own corporation (between departments); cooperation on organisational development and coopera-tion on marketing in other parts of Finland; cooperation within own corporation (between departments) and cooperation on organisational development interna-tionally. In addition to that scattered areas are cooperation in developing techno-logies in Ostrobothnia region; cooperation on process development and our most important partner knows our company's standards and concepts in other parts of Finland; cooperation on technology development, cooperation on marketing and we share our key knowledge with our most important partner during mutual inno-vation process at the international level.
Figure 6.23. Boat industry companies – Other companies: NSCFI (future)
SCA -risk level results
SCA -risk level for boat sector companies for past and future are demonstrated in the following Tables (6.8. and 6.9):

Proceedings of the University of Vaasa. Reports 111
Table 6.8. SCA -risk level, past
BCFI SCFI NSCFI Companies – Public organisations 0.93 0.93 0.93 Companies – Universities 0.90 0.90 0.92 Companies – Other companies 0.97 0.99 0.97
Table 6.9. SCA -risk level, future
BCFI SCFI NSCFI Companies – Public organisations 0.93 0.93 0.92 Companies – Universities 0.90 0.89 0.91 Companies – Other companies 0.98 1.00 0.98
Comparison between the two Tables shows that SCA -risk level for boat sector companies will remain relatively in the same level in future. It means that resour-ces allocation for boat sector companies support equally companies’ strategies in different cooperation in past and future. It is important to mention that the lowest risk levels are in company-public and academic sectors in both periods, past and future.
6.3 Theoretical and Functional Implications
User Handbook Guidelines applying SCA method
Smart specilisation survey and methodology (see Chapter 4) can be seen as a re-gional development policy (see Chapter 7) as well as a SCA model based more on industrial management procedure. For SCA model, it is important to repeat the survey as well as define and observe the trend of changes. Following graphic re-sents phases of applying SCA method (Figure 6.24).

112 Proceedings of the University of Vaasa. Reports
Figure 6.24. SCA stages
1. Phase: survey
This phase includes topics: mapping of location and importance of partner per helix and per region, measuring the strength of the partnership: the most im-portant relations in the triple helix network (Sustainable Competitive Advantage analysis) and identifying and evaluating current and future technologies (see Chapter 4).
2. Phase: calculations
After receiving all the answers critical attributes and areas are defined and evalu-ated. In addition to that average of expectations and average of experiences are calculated in order to see the areas where resources should be put in future and what expectations companies have concerning the type of collaboration in diffe-rent regions. Relationship strategy can be calculated and along with risk levels of every collaboration. The method of calculations is mentioned above in methodo-logy part of the Chapter.

Proceedings of the University of Vaasa. Reports 113
3. Phase: analysis and interpretations
Based on calculations, results should be interpreted. With the help of “traffic light” method problematic and stable areas are defined. The full picture of expec-tations can be seen in graphs. Moreover, existence of collaboration and its strengths can be determined and illustrated. With the help of RAL model rela-tionship strategy can be defined and consequently risk levels of this collaboration are estimated. During this phase the first report is prepared.
4. Phase: workshop (weak market test)
During this phase interviews will be conducted which is named Weak Market Test (WMT). The interviews are needed in order to ask for a feedback from the respondents about the validity of results and how much these results present a real company situation. In order to have feedback from all respondents workshop shall be organised, where at the beginning general results and findings are presented and interpreted, after which discussion is opened for feedback.
5. Phase: final conclusions and report
After conducting a workshop with respondents, final conclusions can be made and a final report can be written. This report will be used in further projects in order to compare previous results and actual findings as well as to see the trend of changes.
Combining macro- and micro level studies
An important implication of this study is to create a system for defining the exis-tence and strength of cooperation as well as evaluation of problematic areas of cooperation between companies and public sector, academic sector and other companies in different industries. This system is implemented by using S&R and SCA methods which are proposed above. In addition to that relationship strategy is defined by RAL model in order to specify the direction of the collaboration.
The survey could eventual be used from the whole industry perspective and sepa-rately from each company’s perspective. This macro evaluation of each industry helps to see whole picture of collaboration between companies and public or-ganinations, universities and other companies in each industry in one region. Eve-

114 Proceedings of the University of Vaasa. Reports ry industry will be evaluated separately in order to see the general performance from partnership point of view, how efficient resources are located and used, what a main relationship strategy is put to use and what the risk level is. Thus com-panies, public organisations and universities can make decisions about future col-laboration between themselves whether they plan strengthen the existing part-nerships, or connect to more partners or cancel old partnerships.
Possible benefits of such model proposed in this study include:
– Having improvements in collaboration and creating new partnerships; – Creating a space for investing resources efficiently; – Improving industrial situation of the region; – Competitive increase inside and outside the region.
Validity and reliability
Validation method was organized within one industrial peak (energy, fur or boat industry) but among different companies which perform in one mutual industrial market. Number of respondents from energy peak (9 respondents equal to 9 com-panies) was satisfactory and acceptable in order to conclude secure statements. However, number of respondents from boat and fur industries (3 respondents equal to 3 companies to each industrial peak) was not sufficient for making con-clusions and generalizing for the whole industry peak.
Equally important as the precise documentation are proper instructions so that the respondents can answer questionnaires and uncertainty can be avoided. The most effective method of data collection is conducting interviews, where explanations and answers are provided immediately. Concerning the filling the questionnaire, it is important to mention that reliable answers do not depend on the amount of res-pondents.
Limitations and future research
In order to have success in implementing of the analytical models mentioned in this work it is essential to eliminate and/or conquer the limitation of these models. Such as:
During calculations, it was noticed that with the help of S&R method three index-es were used in order to define problematic and stable situation in the coopera-

Proceedings of the University of Vaasa. Reports 115
tion. They are BCFI, SCFI and NSCFI. These three indexes should be further tested and developed in order to have the one who can be more accurate than oth-ers. The main idea is that depending on number of respondents this or that index should be used for receiving more reliable and realistic findings.
Calculation of risk levels requires having additional information from the re-spondents, concerning quality, cost, time and flexibility matters. Accordingly, couple of more questions should be added to the main questionnaire.
Nevertheless, there are certain numbers of ideas offered further for future re-search. It is more reliable to have more companies from one industrial peak with more than one respondent from each company. It will make more precise conclu-sions about each industrial peak.
As it was already mentioned in limitations, S&R and SCA methods should be more developed and tested in more cases as it will help to define the accurate and the most efficient tool for detection of, for instance, problematic areas in the col-laboration, relationship strategy and risk levels. Consequently, resource allocation can be divided and distributed more precisely within the companies and other institutions based on the proper decision making. Additionally, more partnerships will be created and existed one will be improved.
116 Proceedings of the University of Vaasa. Reports References
Bradley, S.P. & Nolan, R. L. (1998). Sense and Respond: Capturing Value in the Network Era. Boston: Harvard Business School Press.
Holweg M. (2005). The Three Dimensions of Responsiveness. International Journal of Operations & Production Management 25: 7, 603–622.
Liu, Y. (2010). Implementing Sustainable Competitive Advantage for Proactive Operations in Global Turbulent Business Environments. Acta Wasaensia 227. Industrial Management 19. Vaasa: University of Vaasa.
Liu, Y., Wu, Q., Zhao, S. & Takala, J. (2011). Operations Strategy Optimisation Based on Developed Sense and Respond Methodology. In Kaminishi, K., Duysters, G. & de Hoyos, A. (Eds.). Proceedings of the 8th International Confer-ence on Innovation & Management. Wuhan: Wuhan University of Technology Press. 1010–1015.
Miles, R., & Snow, C. (1978). Organizational Strategy, Structure, and Process. Academy of Management Review 3: 3, 546–563.
Nadler D. & J. Takala (2008). The Development of the Critical Factor Index Method. Proceedings of the 7th International Conference on Innovation & Man-agement. Hong Kong: Hong Kong Polytechnic University. 1333–1338.
Ranta, J.-M. & Takala, J. (2007). A Holistic Method for Finding Out Critical Fea-tures of Industry Maintenance Services. International Journal Services and Standards 3: 3, 312–325.
Senaratne S. (2008). Lean Construction as a Strategic Option: Testing its Suitabil-ity and Acceptability in Sri Lanka. Lean Construction Journal, 34-48.
Strauss, B. & Neuhauss, P. (1997). The Qualitative Satisfaction Model. Interna-tional Journal of Service Industry Management 8, 236–249.
Takala, J. (2012). Impacts for New Knowledge Creations, Limitations, Further Studies and Managerial Implications. In Takala J. & Uusitalo T. (Eds.) Resilient and Proactive Utilization of Opportunities and Uncertainties in Service Business, Proceedings of the University of Vaasa. Reports 177. 64–68.
Takala, J. & Uusitalo, T. (Eds.) (2012). Resilient and Proactive Utilization of Op-portunities and Uncertainties in Service Business. Proceedings of the University of Vaasa. Reports 177.

Proceedings of the University of Vaasa. Reports 117
Takala J. & Liu Y. (2011). Operational Competitiveness Development and Its Risk Evaluation. Journal on Innovation and Sustainability 2: 3, 2–9.
Yauch C. (2011). Measuring Agility as a Performance Outcome. Journal of Man-ufacturing Technology 22: 3, 381–404.

118 Proceedings of the University of Vaasa. Reports 7 SUMMARY AND CONCLUSION Seija Virkkala, University of Vaasa: Regional Studies, Jerker Johnson, Regional Council of Ostrobothnia & Åge Mariussen, Nordland Research Institute and University of Vaasa
7.1 Summary of Findings
Innovation networks have been called the key determinants of economic deve-lopment. The starting point of the smart specialisation study in Ostrobothnia was networks in the context of a triple helix framework, and our aim was to discover the extent of the connectivity among triple helix actors in Ostrobothnia. The first research question addressed the regional network structure: What does the re-gional triple helix look like in Ostrobothnia? The second research question ad-dressed network dynamics, which were analysed with the help of gap indexes that provide information about the bottlenecks and good solutions among the rela-tionships between the triple helix actors. The third research question addressed technology, specifically the nature, location and partners of present and future technologies. Finally, we also identified elements of a smart specialisation model that could be replicated. In order to answer the research questions a detailed ques-tionnaire was carefully prepared and tested, and 53 interviews were conducted in the autumn of 2013.
The first research question, on the regional triple helix structure in Ostrobothnia, consisted of two parts: To what degree are networks of triple helix actors re-gionally connected or disconnected? Secondly, to what degree are triple helix actors embedded in regional, national and international networks?
From the perspective of the triple helix framework, the connections between ac-tors are either intra-helix or cross-helix. When helices are isolated the networks are directed inside the networks’ own helix. This is the case of the disconnected triple helix. The more the helices overlap and interact with one another, the more connected the region and the triple helix is. Taking account of the total number of partners (657) included in the interviews (53), we can see that only 38 % (247) of the relations are directed towards the respondents’ own helices, and 62 % are di-rected towards the other helices in Ostrobothnia, in the rest of Finland and abroad. This can be interpreted as signifying high connectivity between the helices.
The findings indicate that both universities and public organisations in Ostroboth-nia are extremely outward looking and they have many relations with company

Proceedings of the University of Vaasa. Reports 119
partners. In particular, the high connectivity is reflected by the respondents of the public organisations and university actors, but the majority (87 %) of the partners of companies are other companies. This can be explained by a cluster formation among the firms. For example, the energy technology industry concentrates on core activities, and the outsourcing process leads to services and components being bought from outside the companies. A local supplier network has emerged around the key firms. Additionally, there has been and will be spin-off processes from existing firms supporting the networks (Virkkala et al. 2008). For com-panies, the partners for innovation seem not to be as important as the partners for support and strategy. This might indicate that innovation is still more of a core activity than an outsourced support activity.
Chapter 3 introduced different dimensions of proximity, and our data makes it possible to examine both the geographical and institutional proximity of triple helix actors. Geographical proximity is beneficial for innovation since learning requires face-to-face interaction. Institutional proximity refers to the same regime and operational codes, which means that inside the helices (companies, academia, and the public sector) the regimes are similar but still differ between the helices. High institutional proximity indicates the amount of the partners located in the respondent’s own helix. Low institutional proximity means cooperation across helix borders, with cross-helix cooperation interpreted as connectivity.
Most of the partners of all companies (70 %) are based in Ostrobothnia, which indicates a high level of geographical proximity. In addition, the institutional proximity for the companies is extremely high (86.5 %), suggesting that the com-panies largely cooperate with other companies (which are also more important partners) as opposed to public organisations and universities. The university sec-tor has an average geographical proximity (51 %) and a low institutional proximi-ty (17 %). However, in this case the low institutional proximity means that uni-versities are not living in the closed academic world; instead, they are open to the other parts of society and cooperate particularly with firms in Ostrobothnia, which the respondents also find important. Public organisations indicate a high geo-graphical proximity and a low institutional proximity, meaning that their net-works are mostly in the region of Ostrobothnia and mainly consist of companies. (Table 7.1)

120 Proceedings of the University of Vaasa. Reports
Table 7.1. Geographical and institutional proximity based on the number of re-spondents’ partners in each helix
Helix of respondents
Geographical proximity: Ostrobothnia vs. other regions
Institutional proximity: own helix vs. other helices
Companies High (70 %; 119/171) High (86.5 %; 148/171) Universities Average (51 %; 91/179) Low (17 %; 31/179) Public sector High (75 %; 231/307) Low (22 %; 68/307)
All Average (67 %; 441/657) Average (38 %; 247/657) Low proximity: less than 25 % of the number of partners in the helix or in the region. Average proximity: 26–69 % of the number the partners in the helix or in the region. High proximity: More than 70 % of the number of the partners in the helix or in the region.
The second part of the first research question addressed the degree to which the triple helix networks in Ostrobothnia are regionally, nationally and globally em-bedded. The networks of the companies seem to be regional, national and global. In particular, the energy sector companies were embedded in all these levels. Universities were embedded as much in national and international networks as in regional ones, but public organisations were mostly regionally embedded. In addi-tion, these findings could be evaluated from the point of view of spatial network topologies. Considering all the actors, we could conclude, according to the no-tions of Bathelt, Malmberg and Maskell (2004), that there is a strong local buzz in the triple helix network in Ostrobothnia but also along global pipelines; however, we can also agree with Glückler (2007), who advances a typology of spatial net-works instead of a dualistic model of local versus global links. These models can be combined differently by bridging and brokering networks at the local and glo-bal levels.
The second question related to the dynamics of the network. One view of the functioning of networks is to measure the gaps between expectations and expe-riences concerning an actor’s relationships. This method was used by an industrial management team of University of Vaasa to measure the sustainable competitive advantage (SCA) of firms, but applied in our study to measure the strength of regional relationships. Actors have expectations and experiences in terms of rela-tionships, and when both are high, relationships can be seen as strong, and from the perspective of regional development policy as presenting a good solution. When both are low, relations are weak. However, when the expectation is high and the experience is low there is a development challenge that merits attention from regional development planners. According to our findings, the gaps in the

Proceedings of the University of Vaasa. Reports 121
triple helix network in Ostrobothnia are generally small, indicating a cohesive network. However, the gaps vary among triple helix actors.
A gap is large when the difference between expectation (on a scale of 1–10) and experience (on a scale of 1–10) is more than two. The companies we surveyed seem on average to be happy with their cooperative arrangements with other companies and also with universities. Their gaps towards public sector policies are large within four areas: regional development (-2), land use planning (-2.1), business development (-1.8), and infrastructure and logistics (-1.3). The energy sector companies had somewhat larger gaps than other companies. There is a sig-nificant gap (-2.5) between the expectations and experiences of the energy indust-ry on research at the universities in Ostrobothnia.
University actors seem to be happiest of all the helix groups, since they had no relations with large gaps. Public organisations were happy with their partners in Ostrobothnia but frustrated with their relationships in Finland concerning educa-tion in the academic sector, as well as with environmental issues. Additionally, public organisations were unhappy with the international public organisations concerning logistical, educational and regional development (see Table 7.2).
Table 7.2. Largest gaps per helix and per region
Respondent’s
helix Partners helix
Companies Universities Public organisations Companies Happy (No large
gaps) Ostrobothnia: research Ostrobothnia: regional
development, land use planning, business development, infra-structure and logistics
Universities Happy (No large gaps)
Happy (No large gaps)
Happy (No large gaps)
Public organisations
Happy (No large gaps)
Finland: education Finland: education International: infra-structure and logistics, education, regional development
If both expectations and experiences score at least eight out of ten and the gap is smaller than one, we find only one good practice: the relations between com-panies and their customers in Ostrobothnia. If we take into account the expecta-

122 Proceedings of the University of Vaasa. Reports tions and experiences scoring more than seven and the gaps smaller than one, we find more cases of good solutions (see Table 7.3). The good solutions are con-centrated inside the company helix, indicating a well-functioning company net-work in Ostrobothnia with links to other parts of Finland and also to international actors.
Table 7.3. Good solutions per helix and per region, when expectations and expe-riences are more than seven and the gap is smaller than one
Respondent’s helix Partner’s helix
Company Universities Public organisations
Company Ostrobothnia: subcontractors, customers, in-house coopera-tion Finland: customers, in-house cooperation, International: subcontractors, customers, technology devel-opment, production system development
Ostrobothnia: education
No good solutions
Universities International: education, development
No good solutions Ostrobothnia: research
Public organisations
No good solutions No good solutions No good solutions
The third research question was related to the technology used presently and in the future and the location of the most important technology partners per helix and per region. In terms of technology development, the geographical and cogni-tive proximities overlap. According to the evaluation of all respondents, Ostro-bothnia is the most important technology provider: The geographical proximity for the technology providers is 46 % (140/306). The institutional proximity for the company sector is on average 49 % (149/306), for universities it is 29 % (90/306) and for public organisations (including development organisations) it is 22 % (67/306).
The respondents assessed companies and universities to be the most important sources for future technologies. Regionally the most important technology provi-ders reside within the company helix in Ostrobothnia as well as with universities abroad. This reflects the fact that today the key companies have extensive inter-ests in regional research and development (R&D). Indeed, the majority of R&D expenditure in Ostrobothnia occurs in the companies (see Figure 7.1). However,

Proceedings of the University of Vaasa. Reports 123
the connectivity to the global technology providers is also important. This seems to confirm that the regional innovation system of Ostrobothnia is connected to extra-regional knowledge producers, and has its own research to translate knowledge from these networks for specific use.
Figure 7.1 might also explain to some degree the functioning of the triple helix network in Ostrobothnia. Part of the research is conducted by companies, which means they have assumed some functions of universities, and the helix functions in this respect overlap. However, the research by companies is often in the field of applied research. The knowledge base in the industry in Ostrobothnia is synthetic (practical): Knowledge is created in the industrial processes of testing, experi-mentation, simulation and practical work. Knowledge is embodied in technical solutions or engineering in energy technology. The knowledge base of boat buil-ding is craft related and combines different technological fields. Boat building as well as the fur industry is characteristic of what is termed the doing, using and interacting (DUI) mode of innovation. The triple helices for these two sectors differ from the energy technology sector.
Figure 7.1. Research and development expenditures in Vaasa region (Nylén 2014)

124 Proceedings of the University of Vaasa. Reports Based on the interviews, we did not find clear research networks led by universi-ties, or regional development networks led by public organisations. The business oriented innovation networks seem to be a dominant type of network, and all ty-pes of actors seem to rely on companies. The other type of networks might still exist but the findings do not establish they are as strong as the innovation net-works led by the firms.
From a RIS point of view, a region needs a critical mass of different types of or-ganisations, and they should be connected and interacting, so as to form a system. In Ostrobothnia, there are many different organisations, and they seem to be con-nected. Regional connectivity might mean local processes of search and scan to exploit localised networks. However, based on the gap index we cannot evaluate the possible lock-ins of the regional innovation system.
Smart specialisation and emerging technologies
So far the analysis indicates that research at the universities is well connected to innovation in the industry, but that it falls short of expectations. This begs the question of how well positioned the university is today, seen in relation to the needs for different research disciplines now and in the future (see Table 7.4).
Table 7.4. Perceived importance of technology for innovations, strengths and weaknesses of the university helix
Amount of respondents
Importance Position of university helix
n Now In 20 years Nanotechnology 31 4.4 7.2 absent Micro- and nano- electronics 30 6.0 8.0 weak Photonics 25 3.9 5.3 absent Advanced materials 38 6.3 8.0 absent Biotechnology 34 5.3 7.2 weak Advanced production methods 39 7.4 8.8 strong Smart grids 44 7.0 8.9 moderate Renewable energy 28 7.1 9.5 moderate
Disciplinary priorities of Finnish universities are based on the idea of national networks, where different universities have unique national roles, without consid-eration of the regional triple helix. In addition to universities, Finland has well-developed polytechnic institutions, universities of applied sciences which are spe-

Proceedings of the University of Vaasa. Reports 125
cialised according to the regional labor market. This means that polytechnic insti-tutions in Ostrobothnia are well connected to the needs of regional industries, including energy technology. However, the University of Vaasa is specialised in business studies. Research on smart grids and energy technology at the university level in Ostrobothnia, including the University of Vaasa accordingly, are to a lar-ge extent privately funded. Through this private funding, the university is able to be regionally relevant on these areas. Business studies are relevant to advanced production methods. These disciplines are also regarded as most important today from the point of view of the industry. They are at the core of the specialisation of the companies. This confirms what we have said before on close university – in-dustry connections, both helices have the same core specialisation.
The observed gap when it comes to research relevant to the energy sector (-2.5) could accordingly be seen as a request for “more of the same”, in other words increased public sector financing of energy technology research (see chapter 8).
However, if we look at “emergent technologies” or the perception of our infor-mants on the technologies 20 years from now, the picture is somewhat different. Not surprisingly, core components of the current specialisation remain the same, renewable energy, smart grids and advanced production methods. What has changed, however, is the significance of certain technologies which are outside the core of the Ostrobothnian triple helix specialisation today. They can be sum-marized in two main areas of research:
1. Advanced materials, nano technology, relations between micro- and nanoe-
lectronics and semi-conductors. 2. Biotechnology.
However, smart grids can be seen also as part of microelectronics and renewable energy as part of biotechnology (see Chapter 4). This discussion will be continued in Chapter 8 (see below).
Research challenges
The information gathered during the project makes many interpretations possible, even if 53 interviews represent a low number for statistical analysis. However, it is obvious that more empirical data are needed, especially on boat and fur clusters in order to identify the cluster specific innovation characteristics, as well as to test a more causal hypothesis on innovation networks and performance. Comparison of the sectors would provide new information. To examine the development of

126 Proceedings of the University of Vaasa. Reports the triple helix relations, and also to monitor and evaluate the success of the poli-cy interventions, longitudinal data will be gathered that are based on the gap ana-lysis and structured dialogues with stakeholders.
One addition to the empirical data could involve measuring the positions of diffe-rent actors in the networks and by adopting the metrics of social network analysis. This would imply asking respondents to name their partners. Some actors might have more central positions than others. Social network analysis and actor net-work analysis could also be used to examine the emergence of different types of networks such as business-led innovation networks, university-led research net-works and public-led regional development networks. These networks have diffe-rent operation codes and different ways of emerging. Inside different networks, knowledge exhibits different functions and it might be transferred and translated in various ways between actors. Network analysis might also imply different functions for weak and strong ties.
Another research challenge would be to combine network analysis with the per-formance indicators of regional development. This is intended to test the link between connectivity and regional development. In our case, the region of Ostro-bothnia has relatively high performance indicators in the Finnish context: low unemployment, a growth of the regional economy, and population growth, among other indicators. However, we know only a little about the causality between the connectivity of triple helix actors and the regional development indicators. The regional performance indicators might relate more to the export based growth of the region and to the development trajectory, as well as to the global demand for products in key sectors such as renewable-energy technology, boats, and furs to the Russian and Asian markets.
As concepts smart specialisation and entrepreneurial discovery present research challenges for regional studies. In Ostrobothnia, more research is needed on deve-lopment of the sectors to identify the activities of smart specialisation inside and across the selected clusters.

Proceedings of the University of Vaasa. Reports 127
7.2 The Ostrobothnian Model of Smart Specialisation– How to Use Connectivity Analysis in Regional Development Policy
Point of departure
One of the aims of the smart specialisation project was to identify the most urgent requirements in the innovations system and to build a model of regional develop-ment policy that could be used in Ostrobothnia and in similar regions. Finnish regions have relatively well constructed innovation endowments. Finland has pur-sued a decentralised university model as part of its regional development strategy and the regions in Finland generally compare well on innovation parameters. Ne-vertheless, in a rapidly changing world this does not necessarily mean that the innovation system is working optimally. On the contrary, emerging gaps in the system have to be identified and bridged to ensure continued favourable deve-lopment.
Every region has some kind of innovation potential, and there are also triple helix actors. The innovation problem is often a systemic failure, involving too little or no interaction between stakeholders. There might be enough stakeholders but no knowledge transfer among them. The transfer of knowledge is assumed to take place in university campuses, science parks and the like, and in many cases, the focus when promoting interactions has been in creating social arenas. This is pos-sible in larger centres but less viable in the peripheral regions.
The smart specialisation model of Ostrobothnia aims to promote interaction among triple helix actors organising a structured dialogue on innovation. Triple helix coordination is rather difficult as the stakeholders live in different worlds with different operation codes and functions. This requires a discussion of a mo-del or a visionary leadership. In Ostrobothnia, the concept of connectedness has been adopted as a goal of the development measures. Thus, the challenge is first to create a shared and place-based vision; second, to create a sustainable learning organisation bridging partner, and third to build strong communication channels with the partnerships and the outside world.
The connectedness will serve to deepen the knowledge of the innovative process and to make more targeted interventions in the form of development projects. It will also serve to identify research agendas on relevant topics for innovation poli-cies and to identify key legislation needs and missing relevant innovation parame-

128 Proceedings of the University of Vaasa. Reports ters to be communicated in a multi-framework dialogue. The justification for a triple helix model is that the partners make sometimes ill-informed decisions that will affect the innovative process in the region. Thus, a connectedness and a dee-per learning of the triple helix will serve the innovative process. There is a con-sensus in the Ostrobothnia region on selected clusters but not on the measures that should be undertaken to promote industries.
Steps in the process
The Ostrobothnian model consists of surveys and analysis, focus group meetings, and measures to reduce gaps, followed up by repeating the procedure. The model is based on a vision of a ‘connected region’ along a triple helix as a precondition for innovation, and a need of structured discussion on innovation and the bott-lenecks of innovations. The idea is to identify the development gaps and to con-centrate development efforts and resources in the region in the direction of smart specialisation.
1) Survey and gap analysis
Gap analysis is an animation of the analysis behind the smart specialisation stra-tegy. This analysis is expected to identify core positions in the regional economy, such as strategically important clusters, important sectors and research resources and institutions, builders in the triple helix, connecting science, politics and economy and visionary entrepreneurs. We assume that the smart specialisation strategy relates to changing relations or connectivity among these positions, such as closer contact between R&D and business and new industrial strategies. We also assume that gap analysis can be related to these changes in a relevant man-ner.
The analysis is used to select core positions. In each of these core positions, the measurement of gaps starts with a selection of a stratified sample of informants. The method assumes that there is an analysis explaining the complexities of the sector or cluster in sufficient detail (the “granularity principle”, see Chapter 1) in order to identify relevant positions. If a cluster or sector is expected to demonstra-te large internal complexity, it should be broken up analytically into several iden-tifiable positions, with one sample for each. For instance, the set of samples for the private sector could include (a) one sample with strategic leaders in the core clusters facing international competition, (b) one sample with leaders in important

Proceedings of the University of Vaasa. Reports 129
positions in the regional supply networks and (c) one sample with entrepreneurs working with new discoveries, for instance, with suppliers who are starting to export. Granulation could be carried further and it might be moving in different directions, say, if export strategies are different or if the supplier networks are heterogeneous.
In the R&D sector, the stratified samples are expected to include (a) institutional leaders, (b) leading researchers in strategically important disciplines identified by the analysis and (c) bridge builders and researchers working with regional indust-ries. Again, the number of samples will depend upon the size and complexity of the sector, which is expected to be clarified in the analysis behind the smart spe-cialisation strategy.
In the public sector leaders and informants with relevant industry contacts from the sectors identified in the smart specialisation strategy, or from sectors conside-red important by the industrial leaders, should be included.
2) Focus group meetings
There should be continuous discussion on the bottlenecks of innovation in focus group meetings with the industries and other stakeholders. The bottlenecks of innovation are the largest gaps between expectations and experiences found in the gap analysis, and it is important to discuss the possible policy interventions to bridge the gaps and solve the problems of bottlenecks. In addition, these good solutions could be discussed in the focus group meetings. However, the dialogue cannot just be open, it must be openly communicated. The stakeholders should be engaged with precise questions on partners and technologies to find a gap in the innovation structure and then to verify the results in an open process.
3) Policy measures (interventions)
Policy measures to bridge the gaps can be projects or programmes, or proposals for stakeholders to make networking between specific actors. In the case of the first round in Ostrobothnia, a Logic Framework Analysis (LFA) was applied by the Regional Council of Ostrobothnia. The gaps were observed and analysed by origin and consequences, enabling the creation of an intervention logic both for short- and long-term interventions, representing activities and investments aimed at gap bridging. The results of this analysis have now been tied to the call for pro-

130 Proceedings of the University of Vaasa. Reports posals of the Regional Council of Ostrobothnia that will occur twice a year and that will systematically address issues in the analysis.
4) Repetition of the study: following up
The policy process should be continuous and the study and measure of the suc-cess of the interventions should be repeated. Have there been improvements in overcoming the bottlenecks of the innovation system? In Ostrobothnia the first phase of gap analysis and focus group meetings were implemented in 2013 and 2014. Building on the experience of the first smart specialisation project, the data from the gap analysis will be stored continuously electronically on the web. The process can be seen in Figure 7.2:
Figure 7.2 The smart specialisation process in Ostrobothnia
The approach based on gap analysis can be used as an indicator of the success of smart specialisation strategy and other interventions. It can be seen as evidence-based analysis and in terms of policy efforts based on the gaps perceived by the stakeholders. The method based on gap analysis can be used in preparing, imple-menting, comparing and evaluating smart specialisation strategies.

Proceedings of the University of Vaasa. Reports 131
A similar methodological approach has also been applied in the Region of Nor-dland, Norway (Mariussen et al. 2013a, 2013b). We have used the gap analysis explaining why some gaps are smaller in Ostrobothnia than in Nordland. The ap-plication of the model enables learning between the regions because the gap ana-lyses adopted similar analytical methods and both used focus group seminars to compare and analyse the differences in the results. Applying the methodology in different contexts will also help to test and develop the model.
Use of the smart specialisation model in transnational learning
The experience from the first round in Ostrobothnia has shown that this activity has been a learning process, first through the reflection of what are the most im-portant innovation partners, and secondly through reflecting on the perceived gap between the experiences and expectations, and moreover on what should be done. Using the model in transnational learning would require that different regions perceive the gap in a similar way and regions with a larger gap should learn from regions with a smaller gap. The gap index can be combined with the concept of transnational learning as developed by Nonaka (see Mariussen, Midtkandal & Rakhmatullin 2014; Mariussen & Virkkala 2013).
Running the process within the regions will lead to a reflection among stakehol-ders on innovation partnership and will also prompt closer triple helix connectivi-ty or a horizontal coordination within the regions. In Finland, this is expected to highlight a more problem-oriented approach to innovation policy and also to complement the current debate centred on innovation parameters. On a general level, the problems are known but the process will deepen understanding, and permit more targeted actions.
Between the regions, the process will serve to identify areas of strength, thereby forming a matrix for what a region can learn from another and vice versa. For instance, the first round did show that Ostrobothnian enterprises were more con-tent with the local educational system than the corresponding enterprises in Nor-dland. This then raises the question of what is done differently in Ostrobothnia and whether this experience can be transferred. The difference between regions lies in their different historical contexts, which contribute to different solutions pursued. However, it is not only the organisation of the work but also the culture of the work that makes up the tacit knowledge of the partners involved. Through learning seminars, this knowledge can be codified, transferred and internalised between regions. Thus, the Ostrobothnian model can be useful for many deve-lopment needs, today and in the future.

132 Proceedings of the University of Vaasa. Reports References
Bathelt, H., Malmberg, A. & Maskell, P. (2004). Clusters and knowledge: Local buzz, global pipelines and the process of knowledge creation. Progress in Human Geography 28, 31-56.
Glücker, J. (2007) Economic geography and the evolution of networks. Journal of Economic Geography 7(5): 619-634.
Mariussen, Å. & Virkkala, S. (Eds.) (2013). Learning Transnational Learning. Routledge Studies in Human Geography.
Mariussen, Å., Gjertsen, A. Løvland,J. Lindeløv, B. (2013a). Smart 4H, Forslag til Smart spesialisering for Nordland. Nordland Research Institute, Publikation 4/2013.
Mariussen, Å, Gjertsen, A. Løvland,J. Lindeløv, B. (2013b). Summary Report: Smart Specialisation Strategy for Nordland – background, summary and pro-posals. Working note…/2913 Nordlandsforskning.
Mariussen, Å., Midtkandal, I. & Rakhmatullin, R. (2014). A Policymakers Guide to Transnational Learning in Smart Specialisation. European commission. S3 Po-licy Brief Series No 5/2014.
Nylén, J. (2014) T&K-panostukset 20 suurimmassa seutukunnassa 2005–2012. Unpublished powerpoints.
Virkkala, S., Mariussen, Å. & Sjölund, M. (2008). The Region of Western Fin-land. The Micro Case Vaasa Area. Case study report of the DGRegio project The impact of globalization and increased trade liberalization on European regions.

Proceedings of the University of Vaasa. Reports 133
8 TOWARDS A SMART SPECIALISATION STRATEGY IN OSTROBOTHNIA AND FINLAND
Åge Mariussen, Nordland Research Institute and University of Vaasa, Jerker Johnson, Regional Council of Ostrobothnia & Seija Virkkala, University of Vaasa: Regional Studies
The networks in Ostrobothnia are locally embedded and cohesive, such that the gaps are relatively small. The analysis shows that in particular universities and energy technology companies are well connected through their regional triple helix. At the same time, they are also well connected inside their helices, both nationally, and globally.
Research undertaken in the project also indicates that the system of innovation in fur farming and boat building are different, with weaker R&D support and differ-ent systems of innovation.
The innovation system in the energy sector in Ostrobothnia is business driven. Companies provide most of the money for research, and they are connected most-ly to other companies. Universities are connected to companies, and they are well connected nationally and internationally within their helices. The privately finan-ced technological research at the University of Vaasa and its specialisation in bu-siness studies seems to fit with the preferences of the companies. Similarly, the most important partners in technological development are:
1. The regional company helix (14 %) 2. The regional university helix (11 %) 3. The regional business helix (10 %) 4. Universities in other parts of Finland (9.8 %) 5. Own local organisation and companies abroad (9.1 %)
In total, 46 % of the partners of innovation come from the region. In addition, new technology development in the region is coming not just from the own or-ganisation (7.5 on a scale from 1 to 10) but also from other firms in the region (8.8) and universities in the region (8.0).
This is a strong indication that there is a shared regional technology platform between the universities and the companies with advanced production, renewable energy technology and smart grids at the core. There is a gap between company

134 Proceedings of the University of Vaasa. Reports expectations and university performance, but the evidence presented here seems to indicate that what is asked for is more of the same, i. a. more technological research at the universities in the region, complementing the private contributions.
This opens three related comments.
1. First, one would have thought that this request from the companies should
lead to a more pro-active relation between the public sector as a financer of re-search and the university sector. However, this does not take into account the aforementioned state level policies in Finland, where the triple helix is not taken into consideration when it comes to prioritisation of money to university level research.
2. The core position of the companies in the regional system of innovation gives the region an admirable advantage. In this respect, we might add, a typical characteristic of Finnish systems of innovation is that they rely on companies in the lead. However, we have to ask what the downside is. What is the risk, if any, with a system of innovation driven by companies?
3. Another somewhat surprising finding in this well-connected triple helix is the public sector, which, surprisingly, has low scores on industrial and regional policy and planning in relation to the energy industry.
These questions correspond well to the finding from the AMCER project which defined the innovation system in Ostrobothnia as state “dirigiste”. They open up for some reflections on the Finnish national framework and smart specialisation in Finland.
8.1 The Finnish Smart Specialisation Strategy: Lost in Translation
“Finland is at risk of becoming a victim of its economic success. In the last dec-ades Finnish firms in the forest products and telecommunications industries have become world leaders. Together they account for 40 percent of the country’s ex-ports and 8 percent of its GDP. They have achieved this by relentlessly refining the core technologies in their respective domains, and introducing them into suc-cessful products with the help of supply chains and marketing organizations whose discipline, flexibility, and efficiency are widely admired by their competi-tors. The development of the technologies central to this success has been sup-ported by an ensemble of public research facilities which are equally widely ad-

Proceedings of the University of Vaasa. Reports 135
mired. But the kinds of discipline that made possible this success, and the public policies that furthered them, are unlikely to secure it in the future”. (Sabel & Saxenian 2008: 13.)
The novelty of smart specialisation is crystallised in a new understanding of cer-tain concepts, such as entrepreneurial discoveries. As any distinguished professor of innovation can verify, these theories were known already, before the publicati-on of the RIS3 guide (by Foray et al. 2012). This guide is a guide in policyma-king, not a doctoral dissertation. What is new in terms of theory is that the publi-cation of the guide as an official document gives certain theories, such as the theory of entrepreneurial discoveries, a higher legitimacy and a new context, be-cause they are seen as particularly relevant in regional and innovation policyma-king.
Smart specialisation defines a new framework for making innovation policies. It promotes cross-sector coordination, which links innovation and science policy-making with Structural Fund strategies of place-based regional and national deve-lopment. As we will show below, this is done in a way which borrows heavily from the regional planning methods of the Structural Funds, where bottom-up processes and place-based development are high on the agenda. This means that innovation policy instruments, like cluster programs, will have to be integrated in a form of planning which is borrowed from regional planning. In the autumn of 2013, the Commission decided that compliance with these rules of smart specia-lisation is a condition for receiving support from the Structural Funds. The guard-ian of these rules is DG Regional and Urban Policy. They have a nuclear option. A failure to apply the new rules could block national allocation of Structural Funds.
This is now on the agenda in Finland, as the Commission has presented major reservations to the national innovation program INKA (Finnish acronym, innova-tive cities) as a point of departure for a Finnish Structural Fund strategy because it does not comply with the smart specialisation requirements of planning. INKA is an innovation policy tool for cluster development. As an innovation policy in-strument, it does not comply with the guidelines for smart specialisation (The Ministry of Employment and the Economy 2014.)
The debate which led to smart specialisation has a parallel in Finland, which is trying to come to terms with the failure of its own ICT success story of the 1990s, most recently with the new Nokia strategy following the sale of its mobile phone division to Microsoft, and the following rapid downsizing carried out by Mic-rosoft of the mobile phone divisions inside Finland. Seen in a broader context, Finland also has similar problems with another core cluster, the paper and pulp

136 Proceedings of the University of Vaasa. Reports cluster, where the corporate actors are moving out production to Asia and Latin America.
The debate leading to the initiation of INKA is about overcoming the shortfalls of the National Systems of Innovation paradigm. In this paradigm, Finland was a pioneer and example of good practice. This followed a strategic decision in 1980s to go from a raw material based economy to a knowledge based economy. The state started to encourage private firms to invest in science and research across several sectors. Appropriate institutions were built. The decision in 1990 to apply NIS in Finland contributed to the Nokia success story. A core element was a tight top-down national level coordination of investments in science policy, in part-nership with large corporate actors. The policy coordination mechanism was na-tional, the Science and Technology Policy Council. Implementation was left to the large universities in the large cities, and to the large corporations. It contribut-ed to the development of a tightly knit and highly centralised city system of inno-vation, based on Nokia and state investments in science in the main universities in the major cities. Initially, the ICT value chain in the 1990s which created these regional clusters was mainly national.
However, this was going to change. This national framework for planning was caught off-guard in the early years of the 21th Century, as Nokia started to ride the waves of the global market through outsourcing of electronic manufacturing. That was only the beginning, as the entire mobile phone sector went through a brutal global concentration and monopolisation following the 2008 crisis, and the triumph of Apple. This brought the internal technological lock-in problems of Nokia on the table. The cooperation with Microsoft was a heroic attempt to solve the acute problem of lock-in inside the innovation system core of Nokia, by opening up to a wider ecosystem of innovation, provided by Microsoft. But Nokia as a corporation proved to be too closely locked into its own core business, mobi-le phones, created by its own success story of the 1990s. The brutal but obvious solution was to sell out this core to Microsoft and move in a new direction, net-works.
The regional component of this national policy was the Centre of Expertise prog-ram. The CoE (Finnish acronym OSKE) program was closely coordinated by the state, in cooperation with the leading universities and regional development or-ganisations. One of the core ambitions was to repeat the ICT success story in ot-her high tech sectors, such as bio-technology, based on commercialisation of uni-versity research. The program was closed, and later continued again in a new form as INKA, a program for city development. (The Ministry of Employment and the Economy 2014.)

Proceedings of the University of Vaasa. Reports 137
There are several similarities between the internal debate in Finland and the Knowledge for Growth group which discussed the shortcomings of the National Systems of Innovation policy and wrote the smart specialisation guide (Foray et al. 2012). First, national systems of innovation were likely to duplicate everyt-hing, and create micro level copies of global value chains, such as bio-tech. This insight is now taken on board in INKA, which is focusing on critical mass. But whereas the smart specialisation solution was European networking and co-specialisation, INKA is focused on advantages of scale and city networks inside Finland. Following the on-going discussion on how the ex-ante criteria of smart specialisation and how Finland should comply with the place-based criteria the Regional Development Schemes elaborated by the Regional Councils have been put forward. This solution would comply with the place-based criteria but not necessary with quest for entrepreneurial discovery. The role of the Regional De-velopment Schemes is a large political process which is led by the Regional Councils and approved by a politically elected board. The result is taken to rep-resent the “political will” of the region and by also encompassing state initiatives like INKA it is designed to mitigate between state and regional wills. While this is essential for an efficient working of innovation system it is not a process that will foment new innovative discoveries.
Another initial failure of the NIS paradigm was to attempt to integrate entire va-lue chains, instead of discovering where in the value chain its competitiveness is hidden (such as choosing between phones or networks, which requires different systems of innovation), specialise on these functions, as well as related or suppor-ting sectors, and co-specialise with others on other parts of the value chain. One might say that this is precisely what Nokia is now doing, when it is refocusing on networks rather than phones.
The major approach of smart specialisation seen as a process of planning enabling entrepreneurial discoveries is that it opens up the search for the strengths of the regional or national economy in terms of global market competitiveness, and ac-cordingly the decisions of how systems of innovation should be constructed and reconstructed and emergent opportunities discovered. The point of departure for this analysis is place-based. As such, it is imposing a layer of analysis, monitoring and evaluation on micro-level oriented cluster programs, or other innovation poli-cy programs. Based on the spatial perspective provided by the analysis of these strategies, the monitoring of innovation system programs may be seen in a wider perspective, and related to place-based development. Because this is done as a planning process, it is codified, accessible and open to a wider audience of institu-tions and decision makers than most innovation policy instruments.

138 Proceedings of the University of Vaasa. Reports In the Table 8.1 the approach for smart specialisation in Ostrobothnia is contrast-ed to INKA:
Table 8.1. Comparison of INKA and smart specialisation strategy in Ostrobothnia
INKA (Innovative cities) programme
OSTROBOTHNIA, Smart special-isation strategy
Analysis Desire for a critical mass and agglomeration economics. National polycentric develop-ment model. Top-down spatial hierarchy.
Place-based development building on outward orientation. Globalised clus-ter assumed to be innovation leaders and innovation taking place in net-works. Horisontal connectedness will further foster innovation. Bottom-up network model.
Governance Regional proposals for national selection.
Annual triple helix stakeholder dia-logue based on innovation system gap analysis. Dialogue will produce stakeholder view on priorities in funding. Process governed by the Regional Council and integrated in the Regional Development Scheme.
Overall Vision
To achieve global competive-ness in selected fields. To integrate Finnish stakehold-ers in global networks.
A connected region with a strong place-based innovation politics. A process of entrepreneurial discov-ery on-going thru addressing gaps in the innovations networks. Peer-review learning with European partners.
Priorities Based on evaluation of pro-posals.
Most urgent gaps in the RIS identi-fied thru dialogue.
Policy Mix National and regional funding, steered by the legislation gov-erning the Finnish National Technology Centre (Tekes).
Regional funding, multi-level dia-logue when the regional level is not the competent authority.
Monitoring and Evaluation
External evaluations, evalua-tions indicators.
Repetition of the process and stake-holder perceived improvements.
The method for governance in Ostrobothnia is chosen to facilitate a process of learning through gap analysis. Within this institutional context, however, funding to support investments in innovation is largely missing. This is due to the Finnish national system of innovation that is being set up.

Proceedings of the University of Vaasa. Reports 139
8.2 The Finnish National System of Innovation
Sabel and Saxenian (2008) emphasised in their analysis on the Finnish system of innovation the need to move from a centralised system of research and innovation dominated by the large actors in forestry and telecommunications to a strategy characterised by search, and learning through trial and error.
“Ideally Finland’s justly vaunted national system of innovation should play an important role in addressing the shift from optimization to transverse exploration. But so far it has not. National systems of innovation, Finland’s included, were often designed with the idea of closing the gap between a country’s capabilities in particular areas and the respective world technological frontier. Such systems become less useful as the”boundary” begins to wander. In the worst case the na-tional system of innovation can actually impede progress by focusing attention, and fixing resources, on the problems that would have been central to an indus-try’s domain if unanticipated connections to other bodies of knowledge had not rendered them irrelevant. There is some risk of this perverse outcome in Finland. For example, the country’s university based research in the forest products area, though indisputably the best in the world, is largely dedicated to investigating the leading edge of current production technologies, even as the technology’s mani-fold limits as the basis for an industry in an advanced county become clear. An analogue in ICT is a research focus on radio-related cell-phone technologies or on optimization of current network software to the neglect of the technological foundations of the applications that will give distinctive value to cell-phone plat-forms.” (Sabel & Saxenian 2008: 18.)
The 2008 report anticipated the challenges which came later, with the restructu-ring of Nokia. Today, the Finnish economy has challenges in adapting to the glo-bal market. Core clusters like forest industry and ICT are in deep trouble, the ba-lance of trade is negative, and the fiscal situation is rapidly deteriorating. The response is central level cuts and austerity measures. The overall challenge is to recreate growth. In order to recreate growth, Finland needs well-coordinated smart specialisation strategies both at the national and regional levels enabling diversification through entrepreneurial discoveries.
The strength of the Finnish economy is good connections between different actors i.e. relatively high triple helix connectivity as well as very high levels of invest-ment in private and public RDI. This is also the case in Ostrobothnia according to our findings.
Until now Finland also enjoys the strengths of a Nordic model enabling a welfare state which is able to mobilise human resources to work in an economy character-ised by high level of skills, knowledge and productivity.

140 Proceedings of the University of Vaasa. Reports The weakness of the economy is too centralised network structure based on a rela-tively narrowly defined export base. Reliance on a few strong sectors has created the unfolding economic crisis with a negative balance of trade. The threat is social and spatial polarisation and undermining of the Nordic model of the welfare state.
The opportunity is as creative destruction at the core (ICT, forestry) opening up for diversification of the export base and broader and more decentralised spatial, cross sector, and interdisciplinary networks of innovation enabling entrepre-neurial discoveries. This is an opportunity also for Ostrobothnia having export oriented clusters outside the core: a relatively strong energy technology cluster as well as boat building and fur industry.
The main objective for smart specialisation for Finland should be to use the strength of connectivity, the knowledge base and the strong RDI performance into more diversified and decentralised structures and systems of innovation, resulting in a broader export base.
8.3 Next Steps
According to our opinion, a smart specialisation strategy for Finland should be based on a strategy which is able to overcome the weaknesses of this system, as described by Sabel and Saxenian (2008). What is needed is a more decentralised system, capable of learning through its mistakes, and capable of supporting at-tempts to go in different directions, in order to diversify the export base of the country and recreate economic growth. This is taken on board by the Ostroboth-nian approach to smart specialisation. Decentralisation doesn´t imply isolation quite the contrary, the approach builds on the economic outward orientation of the region where leading competitive enterprises are well connected internally and globally. The drivers of innovation in the Ostrobothnian context has been bu-siness networking and customer proximity combined with applied and scientific research.
There is a need to both communicate and deepen the process in the region and with European partners and provide continuity in the process. The situation facing the regions is that many central initiatives introduce regional processes and when they do not deliver on intentions they also weaken the regional ability to imple-ment strategic processes. The reasons for this can be seen in the challenges fa-cing the Finnish regional policy as outlined in chapter 2. Nevertheless initiatives that do not deliver on intentions weaken the stakeholder motivation to participate

Proceedings of the University of Vaasa. Reports 141
and thus weaken the innovative process. This is also a challenge to the smart spe-cialisation process in Ostrobothnia.
The European Commission has by introducing the concept of smart specialisation and by making it an ERDF ex ante condition also tied the policy on innovation to the Structural Funds. This and moreover that it is linked to the framework of fin-ding synergies between European funding justifies that the process is tied to the regional planning process and to governing legislation. This will ensure the con-tinuity that is vital for the stakeholder involvement and learning.
In the governance of the Ostrobothnian model of smart specialisation we may separate between soft governance and hard governance. The soft governance con-sists of a communication of results of the dialogue thru the web and to different stakeholders while the hard governance is the formal treatment of the process in the MYR. Finnish acronym MYR means Regional Cooperation Group that has an established function given by the Finnish law (Finlex 2014). The Regional Coor-dination Groups have been amended to include representatives of the triple helix to coordinate the use of funds. This is however not possible if the group does not have a common vision built on a common perception of the problems faced.
We may divide the coordination into three parts that are linked: 1) A problem oriented leadership; 2) Informal coordination and 3) Formal coordination. The problem oriented leadership would be by a gradual acceptance of the gap analysis as a base for the developing of the region and obtaining the vision of being a con-nected region. This would imply more horisontal coordination of the stakeholders and promote the regional coordination and synergies in the financing of different funds. The informal coordination consists of contacts and discussions between different stakeholders. The informal coordination is difficult due to the on-going centralisation trends. This makes the problem oriented leadership received thru the gap analysis and the formal coordination even more important.
The tools for the formal coordination is already existent as the changes in the Law on Regional Development and the administration of the Structural Funds have strengthened the role of the Regional Cooperation Groups (Finlex 2014). In Os-trobothnia, the MYR will make their judgments based on the Western Finland ERDF programme and on the results of the smart specialisation process. The le-gislation gives us the tools for the latter as it stipulates the role of the MYR and secretariat, but whatever formally is written into legislation is void if the actors do not accept the roles and works accordingly.

142 Proceedings of the University of Vaasa. Reports
Figure 8.1. Governance of the smart specialisation process in Ostrobothnia
The smart specialisation strategy materialises through a gap analysis followed by focus group seminars in each of the selected sectors with high export perfor-mance. With respect to the energy sector the chosen priorities are that equals the INKA programme. The difference however lies in the cross-sectional horisontal approach of the smart specialisation process complementing the INKA pro-gramme and providing both an approach on the process of entrepreneurial discov-ery and a bottom-up approach. The main contrast presented by the Ostrobothnian approach compared to INKA lies within the “governance” and the “priorities” as presented in the previous Table 8.1.
The governance of the Ostrobothnian model of smart specialisation is based on larger participation of regional stakeholders and integration into the regional planning (see Figure 8.1). This is contrary to the INKA programme where the decisions are taken centrally by a decision group. The groups contain regional representation but the advantage of the group would be that they have a better overview of on-going national projects and their work. This may avoid duplicati-on of efforts and thus promote coordination. The view behind this also holds a more technological perspective to innovation while the European approach rep-resents a wider perspective on innovation.

Proceedings of the University of Vaasa. Reports 143
In the INKA program the priorities are based on the evaluation of projects. This requires that you firstly have a project application and secondly that it complies with the criteria.
The priority in the Ostrobothnian smart specialisation strategy is to identify chal-lenges through gaps in the RIS that is assumed to foster innovations. These gaps are matched to project priorities in the financing and with a combination of hard and soft coordination available funds are directed towards bridging the needs of the innovation. Gap analysis will be intermittently repeated for a deeper under-standing of the needs and the results will also be communicated.
We believe that this would regionally correspond to final conclusion on the Finn-ish innovation policy as noted by Sabel and Saxenian (2008): “In today’s uncer-tain world even the best institutions cannot avoid mistakes. They can however respond to them quickly. Building such institutions is the challenge for Finnish innovations policy”.
8.4 Suggestion for Components in a Smart Specialisation Strategy in Ostrobothnia
The above analysis has indicated weaknesses in the triple helix which may be explained with reference to the role of the public sector in three closely related areas.
Table 8.2. Problems to focus smart specialisation strategy in Ostrobothnia
Problem Possible negative impact Indicator Too small public investments in R&D
Short-termism, lock-in into cor-porate strategies
Gap on research (-2.5)
Too little diversification/ related varieties
Technological lock-in Monitoring of current specialisation v.s. future technological trends
Regional planning Investment decisions Gap on land use plan-ning, infrastructure and regional development

144 Proceedings of the University of Vaasa. Reports Based on the Table 8.2, a smart specialisation strategy relevant to Ostrobothnia should aim to rebalance the triple helix through an improved role of the public sector in three areas:
1. Specialisation. Ostrobothnia has a strong and well-connected system of inno-
vation in energy technology. In terms of scientific direction, research at the regional universities seems to be well positioned, but never the less it falls short of expectations from the companies, because it is under-funded from the public sector in the core area, energy technology. A core indicator which may guide work on this indicator is the gap on research (-2.5). The question for an explorative program, then, is how this gap should be closed.
2. Smart specialisation through entrepreneurial discoveries. One of the dangers of a company driven regional system of innovation is that it becomes too linked to corporate strategies, too short-sighted and not sufficiently oriented towards emerging related and potentially disruptive technologies of the future. This is why a well-functioning regional system of innovation with industries financing research has to be supplemented with public sector investments which open up for wider exploration, in other words, entrepreneurial discover-ies of new paths. Our survey has revealed potential future relations to new technologies such as biotechnology – energy production and nano-technology – electro-technology which are outside the scope of the regional system of in-novation today, but may have a disruptive significance on the core of this sys-tem in the future, or open up new paths. The potential challenges and opportu-nities, and how to relate to them, should be discussed with relevant stakehold-ers.
3. Regional planning. It is a challenge to close the gap on spatial and regional planning. This seems to indicate stronger regional level institutional capabili-ties and resources.

Proceedings of the University of Vaasa. Reports 145
References
Finlex (2014). Laki alueiden kehittämisestä ja rakennerahastotoiminnan hal-linnoinnista 2014/7 [Act of Regional Development and the Administration of the Structural Funds]. [Web Page] [Accessed 14.10.2014]. Available at: http://www.finlex.fi/fi/laki/alkup/2014/20140007.
Foray, D., Goddard, J., Beldarrain, X., Landabaso, M., McCann, P., Morgan, P., Nauwelaers, C. & Ortega-Argilés, R. (2012). Guide to Research and Innovation Strategies for Smart Specialisation (RIS3). Europe: European Commission.
Sabel, C. & Saxenian, A. (2008). A Fugitive Success. Finland’s Economic Fu-ture. SITRA Reports 80. Helsinki: Edita Prima.
The Ministry of Employment and the Economy (2014). The Innovative Cities programme INKA. [Web Page] [Accessed 14.10.2014]. Available at: http://www.tem.fi/en/innovations/strategic_centres_and_clusters/innovative_cit ies _programme_(inka).

146 Proceedings of the University of Vaasa. Reports APPENDICES Appendix 1. Questionnaire for Public Organisations, Universities and Companies
S3- Questionnaire
Background information 1. Name of organisation: 2. Name of respondent: 3. Respondent’s position: 4. Do you work with these branches? (Please choose only the most important)
_ Maritime industry _ Boat building industry _ Fur farming industry _ Energy technology industry _ Other, which? __________________
5. Organisation’s main task: 6. Number of employees: 7. Do you have a specific R&D department? Yes/No
(question for public organisations and companies only) Part 1. Mapping the location and importance of the partners
Partner Partner can be any organisation or its representative that is important to your organisation’s opera-tions. Partnership provides additional benefit for both sides and it can be based on official con-tracts, or even on long mutual understanding. This cooperation might be regular in nature, or it might happen occasionally. Supporting partners benefit your organisation for example through projects, whereas your or-ganisation makes longer-term goals and plans with strategic partners. Usually strategic partners are easier to recognise. Research partners are partners that undertake research cooperation with your organisation. Education partners are partners that cooperate with your organisation on educational matters. Social service mission partners are partners that are important to your organisation on matters other than education or research. This usually means development partners and such like. Innovation partners are partners that help your organisation to develop new ideas for innovations (these can be new products, processes, technologies, organisational forms etc.) In the questionnaire, we separate the various partners into four groups and these are:
Companies, like service producers, subcontractors and clients, etc. Public Organisations like municipalities, ministries, civil societies and international in-
stitutions etc. Universities like universities, universities of applied sciences and other research and
teaching organisations.

Proceedings of the University of Vaasa. Reports 147
Development Organisations like VASEK, Concordia, Dynamo, Merinova and Kristi-inankaupungin elinkeinokeskus oy, as well as KOSEK.
How many partners does your organisation have and where are they situated?
How many partners do you have? Companies
Public
organisations
Universities Development organisations
In Ostrobothnia and Cen-tral Ostrobothnia
In other parts of Finland
In the rest of the world
NOTE: Companies may belong to the same corporation, but record them separately. How important are Supporting/Strategic/Research/Education/Social Service Mis-sion/Innovation Partnerships for your organisation in different regions? Responses should be provided on a scale of 1 to 10, where 10 means very important and 1 indicates the partnership is of little importance. Example question:
How important is a supporting partnership for your organisation?
Companies
Public
organisations
Universities Development organisations
In Ostrobothnia and Central Ostrobothnia
In other parts of Finland
In the rest of the world
Questions asked per helix:
Public organisations Universities Companies
Supporting partnership Research partnership Supporting partnership
Strategic partnership Education partnership Strategic partnership
- Social service mission Innovation partnership

148 Proceedings of the University of Vaasa. Reports Which roles do these various actors have in terms of knowledge production in your organisation?
Role in knowledge production
Organisation
They provide us knowledge
We produce knowledge together
We provide knowledge to them
Commercial actors (for example companies)
Public sector actors (for exam-ple development organisations, other public organisations)
Non-commercial actors (for example universities)
Households Volunteer organisations (for example Red Cross etc.)
Privilege organisations (labour unions, etc.)
Role in knowledge production = mark with a cross the role(s) that your partners usually have in knowledge production Part 2. Measuring the depth of cooperation 2.1. Public organisations - Companies
2.2. Public organisations - Universities
2.3. Public organisations - Public organisations
2.4. Universities - Companies
2.5. Universities - Public organisations
2.6. Universities - Universities
2.7. Companies - Public organisations
2.8. Companies - Universities
2.9. Companies - Companies
NOTE: These questions are on different papers.

Proceedings of the University of Vaasa. Reports 149
Example question:
Scale: 10 = high, 1= low
Direction of development in the future (mark with a cross)
Direction of development in the past (mark with a cross)
Question Expecta-tions
Experi-ences
Grows Remains the same
Lowers Grows Remains the same
Lowers
Cooperation in research
Expectations = What is the level of expectations for an attribute on a scale of 1 to 10 Experiences = What is the level of experiences for an attribute on a scale of 1 to 10 Direction of development (future) = Direction of development compared to the situation expected 1 year after completing this questionnaire Direction of development (past) = Direction of development compared to the situation 1 year before completing this questionnaire Definitions and questions asked per helix: Public Organisations Cooperation here refers to activities in which both sides are genuinely interacting with one anoth-er. For example we do not consider purchasing a product, or granting assistance to be cooperation if there is not some sort of dialogue between the actors (for example planning, mutual project, etc.) In the public sector cooperation might take place for example on administration (permissions, advice etc.) or on economic activities (assistance, employment, supporting entrepreneurship etc.).
2.1. Public Organisations - Companies Cooperation In Ostrobothnia and Central Ostrobothnia (partner may vary according to ques-tion) 2.1.1.Cooperation on infrastructure and logistics 2.1.2.Cooperation on regional development 2.1.3.Cooperation on technology development 2.1.4.Cooperation on business life development 2.1.5.Cooperation on land use planning 2.1.6.Cooperation on environmental issues
2.1.7.Cooperation on employment affairs
(Choose the same partner for these questions)
2.1.8.Our most important partner contacts us 2.1.9.Our most important partner knows our work 2.1.10.Our most important partner helps us with our difficult problems 2.1.11.Our most important partner knows our staff

150 Proceedings of the University of Vaasa. Reports
2.2. Public Organisations - Universities Cooperation In Ostrobothnia and Central Ostrobothnia (partner may vary according to question) 2.2.1.Cooperation on education 2.2.2.Cooperation on research 2.2.3.Cooperation on employment matters 2.2.4.Cooperation on environmental issues 2.2.5.Cooperation on information system development 2.2.6.Cooperation on regional development 2.2.7.Cooperation on organisational development 2.2.8.Cooperation on marketing development
(Choose same partner for these questions)
2.2.9.We know our most important partner’s research and development methods 2.2.10.We know our most important partner’s work 2.2.11.Our most important partner helps us with our difficult problems 2.2.12.We know our most important partner’s research and educational staff working in our field Cooperation in other parts of Finland (partner may vary according to question)
2.2.13.Cooperation on education 2.2.14.Cooperation on research 2.2.15.Cooperation on employment matters 2.2.16.Cooperation on environmental issues 2.2.17.Cooperation on information system development 2.2.18.Cooperation on regional development 2.2.19.Cooperation on organisational development 2.2.20.Cooperation on marketing development
(Choose same partner for these questions)
2.2.21.We know our most important partner’s research and development methods 2.2.22.We know our most important partner’s work 2.2.23.Our most important partner helps us on our difficult problems 2.2.24.We know our most important partner’s research and educational staff working in our field
Cooperation in the rest of the world (partner may vary according to question) 2.2.25.Cooperation on education 2.2.26.Cooperation on research 2.2.27.Cooperation on employment matters 2.2.28.Cooperation on environmental issues 2.2.29.Cooperation on information system development 2.2.30.Cooperation on regional development 2.2.31.Cooperation on organisational development 2.2.32.Cooperation on marketing development

Proceedings of the University of Vaasa. Reports 151
(Choose the same partner for these questions)
2.2.33.We know our most important partner’s research and development methods 2.2.34.We know our most important partner’s work 2.2.35.Our most important partner helps us with our difficult problems 2.2.36.We know our most important partner’s research and educational staff working in our field
2.3. Public Organisations - Public Organisations Cooperation in Ostrobothnia and Central Ostrobothnia (partner may vary according to ques-tion) 2.3.1.Cooperation on infrastructure 2.3.2.Cooperation on regional development 2.3.3.Cooperation on environmental issues 2.3.4.Cooperation on employment affairs
(Choose the same partner for these questions)
2.3.5.Our most important partner knows our work 2.3.6.Our most important partner helps us with our difficult problems 2.3.7.We know our most important partner’s staff 2.3.8.Our most important partner knows the regulations and concepts relevant to our field
Cooperation in other parts of Finland (partner may vary according to question)
2.3.9.Cooperation on infrastructure 2.3.10.Cooperation on regional development 2.3.11.Cooperation on environmental issues 2.3.11.Cooperation on employment
(Choose same partner for these questions)
2.3.12.Our most important partner knows our work 2.3.13.Our most important partner helps us with our difficult problems 2.3.14.We know our most important partner’s staff 2.3.15.Our most important partner knows the regulations and concepts relevant to our field
Cooperation in the rest of the world (partner may vary according to question) 2.3.16.Cooperation on technological and business life development 2.3.18.Cooperation on logistics 2.3.19.Cooperation on education 2.3.20.Cooperation on regional development (Choose the same partner for these questions) 2.3.21.Our most important partner knows our work 2.3.22.Our most important partner helps us with our difficult problems 2.3.23.We know our most important partner’s staff 2.3.24.Our most important partner knows the regulations and concepts relevant to our field

152 Proceedings of the University of Vaasa. Reports Universities Cooperation here refers to activities in which both sides are genuinely interacting with one anoth-er. For example we do not consider purchasing a product, or applying for assistance to be coopera-tion if there is not some sort of dialogue between the actors (for example, a mutual research pro-ject, product development, education work, development work etc.).
2.4. Universities - Companies Cooperation In Ostrobothnia and Central Ostrobothnia (partner may vary according to ques-tion) 2.4.1.Cooperation on education
2.4.2.Cooperation on research
2.4.3.Cooperation on development
(Choose the same partner for these questions)
2.4.4.We contact our most important partner concerning research 2.4.5.We know our most important partner’s research and development methods
2.4.6.We know our most important partner’s work
2.4.7.Our most important partner improves our educational and research abilities
2.4.8.We know our most important partner’s staff
Cooperation in other parts of Finland (partner may vary according to question)
2.4.9.Cooperation on education
2.4.10.Cooperation on research
2.4.11.Cooperation on development
(Choose the same partner for these questions)
2.4.12.We contact our most important partner concerning research 2.4.13.We know our most important partner’s research and development methods
2.4.14.We know our most important partner’s work
2.4.15.Our most important partner improves our educational and research abilities
2.4.16.We know our most important partner’s staff
Cooperation in the rest of the world (partner may vary according to question) 2.4.17.Cooperation on education
2.4.18.Cooperation on research
2.4.19.Cooperation on development
(Choose the same partner for these questions)
2.4.20.We contact our most important partner concerning research 2.4.21.We know our most important partner’s research and development methods
2.4.22.We know our most important partner’s work
2.4.23.Our most important partner improves our educational and research abilities 2.4.24.We know our most important partner’s staff

Proceedings of the University of Vaasa. Reports 153
2.5. Universities - Public organisations Cooperation In Ostrobothnia and Central Ostrobothnia (partner may vary accord-ing to question) 2.5.1.Cooperation on education
2.5.2.Cooperation on research
2.5.3.Cooperation on employment matters 2.5.4.Cooperation on environmental issues
2.5.5.Cooperation on information system development
2.5.6.Cooperation on regional development 2.5.7.Cooperation on organisational development
2.5.8.Cooperation on marketing development
(Choose the same partner for these questions)
2.5.9.We know our most important partner’s research and development needs
2.5.10.We know our most important partner’s work 2.5.11.Our most important partner improves our educational and research abilities
2.5.12.We know our most important partner’s staff
Cooperation in other parts of Finland (partner may vary according to question)
2.5.13.Cooperation on education
2.5.14.Cooperation on research 2.5.15.Cooperation on employment matters
2.5.16.Cooperation on environmental issues
2.5.17.Cooperation on information system development
2.5.18.Cooperation on regional development 2.5.19.Cooperation on organisational development
2.5.20.Cooperation on marketing development
(Choose the same partner for these questions)
2.5.21.We know our most important partner’s research and development needs
2.5.22.We know our most important partner’s work 2.5.23.Our most important partner improves our educational and research abilities
2.5.24.We know our most important partner’s staff
Cooperation in the rest of the world (partner may vary according to question) 2.5.25.Cooperation on education
2.5.26.Cooperation on research 2.5.27.Cooperation on employment matters
2.5.28.Cooperation on environmental issues
2.5.29.Cooperation on information system development 2.5.30.Cooperation on regional development
2.5.31.Cooperation on organisational development 2.5.32.Cooperation on marketing development

154 Proceedings of the University of Vaasa. Reports
(Choose the same partner for these questions)
2.5.33.We know our most important partner’s research and development needs
2.5.34.We know our most important partner’s work 2.5.35.Our most important partner improves our educational and research abilities
2.5.36.We know our most important partner’s staff
2.6. Universities - Universities Cooperation in Ostrobothnia and Central Ostrobothnia (partner may vary according to ques-tion) 2.6.1.Cooperation on education 2.6.2.Cooperation on applied research
2.6.3.Cooperation on basic research
2.6.4.Cooperation on information system research 2.6.5.Cooperation on regional research
2.6.6.Cooperation on technology research
2.6.7.Cooperation on production system research
2.6.8.Cooperation on process research 2.6.9.Cooperation on organisational research
2.6.10.Cooperation on leadership research
2.6.11.Cooperation on marketing research
(Choose the same partner for these questions)
2.6.12.We know our most important partner’s R&D methods 2.6.13.We know our most important partner’s work
2.6.14.Our most important partner improves our educational and research abilities
2.6.15.We know our most important partner’s research and educational staff
Cooperation in other parts of Finland (partner may vary according to question)
2.6.16.Cooperation on education 2.6.17.Cooperation on applied research
2.6.18.Cooperation on basic research
2.6.19.Cooperation on information system research 2.6.20.Cooperation on regional research
2.6.21.Cooperation on technology research
2.6.22.Cooperation on production system research
2.6.23.Cooperation on process research 2.6.24.Cooperation on organisational research
2.6.25.Cooperation on leadership research
2.6.26.Cooperation on marketing research
(Choose the same partner for these questions)
2.6.27.We know our most important partner’s R&D methods 2.6.28.We know our most important partner’s work

Proceedings of the University of Vaasa. Reports 155
2.6.29.Our most important partner improves our educational and research abilities
2.6.30.We know our most important partner’s research and educational staff
Cooperation in the rest of the world (partner may vary according to question) 2.6.31.Cooperation on education 2.6.32.Cooperation on applied research
2.6.33.Cooperation on basic research
2.6.34.Cooperation on information system research 2.6.35.Cooperation on regional research
2.6.36.Cooperation on technology research
2.6.37.Cooperation on production system research
2.6.38.Cooperation on process research 2.6.39.Cooperation on organisational research
2.6.40.Cooperation on leadership research
2.6.41.Cooperation on marketing research
(Choose the same partner for these questions)
2.6.42.We know our most important partner’s R&D methods 2.6.43.We know our most important partner’s work
2.6.44.Our most important partner improves our educational and research abilities
2.6.45.We know our most important partner’s research and educational staff Companies Cooperation here refers to activities in which both sides are genuinely interacting with one anoth-er. For example we do not consider purchasing a product, or granting assistance to be cooperation if there is not some sort of dialogue between the actors (for example planning, a mutual project, etc.) Companies can cooperate on for example product development, environmental consulting, research, subcontractors etc.
2.7. Companies - Public organisations Cooperation in Ostrobothnia and Central Ostrobothnia (partner may vary according to ques-tion) 2.7.1.Cooperation on infrastructure and logistics
2.7.2.Cooperation on regional development 2.7.3.Cooperation on technology development
2.7.4.Cooperation on business development
2.7.5.Cooperation on land use planning
2.7.6.Cooperation on environmental issues
2.7.7.Cooperation on employment affairs
(Choose the same partner for these questions)
2.7.8.Our most important partner contacts us
2.7.9.Our most important partner knows our work

156 Proceedings of the University of Vaasa. Reports
2.7.10.Our most important partner improves our innovation process
2.7.11.Our most important partner knows our staff
Cooperation in other parts of Finland (partner may vary according to question)
2.7.12.Cooperation on infrastructure and logistics
2.7.13.Cooperation on regional development 2.7.14.Cooperation on technology development
2.7.4.Cooperation on business development
2.7.16.Cooperation on land use planning
2.7.17.Cooperation on environmental issues
2.7.18.Cooperation on employment affairs
(Choose the same partner for these questions)
2.7.19.Our most important partner contacts us
2.7.20.Our most important partner knows our work 2.7.21.Our most important partner improves our innovation process
2.7.22.Our most important partner knows our staff
Cooperation in the rest of the world (partner may vary according to question) 2.7.23.Cooperation on technological and business life development
2.7.24.Cooperation on environmental issues 2.7.25.Cooperation on logistics
2.7.26.Cooperation on education
2.7.27.Cooperation on regional development
(Choose the same partner for these questions)
2.7.28.Our most important partner knows our work 2.7.29.Our most important partner helps us on our difficult problems
2.7.30.We know our most important partner’s staff
2.7.31.Our most important partner knows regulations and concepts of our field
2.8. Companies - Universities Cooperation in Ostrobothnia and Central Ostrobothnia (partner may vary according to question) 2.8.1.Cooperation on education
2.8.2.Cooperation on research
2.8.3.Cooperation on development
(Choose the same partner for these questions)
2.8.4.We contact our most important partner 2.8.5.We know our most important partner’s R&D and education methods
2.8.6.We know our most important partner’s work
2.8.7.Our most important partner improves our innovation process
2.8.8.We know our most important partner’s research and educational staff

Proceedings of the University of Vaasa. Reports 157
Cooperation in other parts of Finland (partner may vary according to question)
2.8.9.Cooperation on education
2.8.10.Cooperation on research
2.8.11.Cooperation on development
(Choose the same partner for these questions)
2.8.12.We contact our most important partner
2.8.13.We know our most important partner’s R&D and education methods
2.8.14.We know our most important partner’s work
2.8.15.Our most important partner improves our innovation process
2.8.16.We know our most important partner’s research and educational staff
Cooperation in the rest of the world (partner may vary according to question) 2.8.17.Cooperation on education
2.8.18.Cooperation on research
2.8.19.Cooperation on development
(Choose the same partner for these questions)
2.8.20.We contact our most important partner
2.8.21.We know our most important partner’s R&D and education methods
2.8.22.We know our most important partner’s work
2.8.23.Our most important partner improves our innovation 2.8.24.We know our most important partner’s research and educational staff
2.9. Companies - Companies Cooperation in Ostrobothnia and Central Ostrobothnia (partner may vary according to question) 2.9.1.Cooperation with subcontractors 2.9.2.Cooperation with customers
2.9.3.Cooperation within own corporation (between departments)
2.9.4.Cooperation on technology development
2.9.5.Cooperation on production system development 2.9.6.Cooperation on process development
2.9.7.Cooperation on organisational development
2.9.8.Cooperation on marketing
(Choose the same partner for these questions) 2.9.9.We share our key knowledge with our most important partner during mutual innova-tion process 2.9.10.Our most important partner knows our products/services
2.9.11.Our most important partner knows our standards/concepts
2.9.12.Our most important partner helps us with our difficult problems
2.9.13.Our most important partner knows our key staff
Cooperation in other parts of Finland (partner may vary according to question)

158 Proceedings of the University of Vaasa. Reports
2.9.14.Cooperation with subcontractors
2.9.15.Cooperation with customers
2.9.16.Cooperation within own corporation (between departments)
2.9.17.Cooperation on technology development
2.9.18.Cooperation on production system development
2.9.19.Cooperation on process development
2.9.20.Cooperation on organisational development
2.9.21Cooperation on marketing
(Choose the same partner for these questions) 2.9.22.We share our key knowledge with our most important partner during the mutual in-novation process 2.9.23.Our most important partner knows our products/services 2.9.24.Our most important partner knows our standards/concepts
2.9.25.Our most important partner helps us with our difficult problems
2.9.26.Our most important partner knows our key staff
Cooperation in the rest of the world (partner may vary according to question) 2.9.27.Cooperation with subcontractors 2.9.28.Cooperation with customers
2.9.29.Cooperation within own corporation (between departments)
2.9.30.Cooperation on technology development 2.9.31.Cooperation on production system development
2.9.32.Cooperation on process development
2.9.33.Cooperation on organisational development
2.9.34.Cooperation on marketing
(Choose the same partner for these questions) 2.9.35.We share our key knowledge with our most important partner during the mutual in-novation process 2.9.36.Our most important partner knows our products/services
2.9.37.Our most important partner knows our standards/concepts
2.9.38.Our most important partner helps us on our difficult problems 2.9.39.Our most important partner knows our key staff

Proceedings of the University of Vaasa. Reports 159
Part 3. Technologies and the location of technology partners now and in the future 3.1. How important do you think that following technologies are to develop-ing future innovations for the Ostrobothnian and Central Ostrobothnian regions? Importance Technologies Now After 20
years Why? How it could be developed?
scale 1-10 scale 1-10
Nanotechnology Micro- and nano-electronics including semiconductors Photonic Advanced materials Biotechnology Advanced production methods Smart grids (Intelligent electrical net-works) Renewable energy Other, what? Other, what? Other, what? Other, what?
3.2. Where are Ostrobothnia’s and Central Ostrobothnia’s partners for in-novation situated? (Mark with crosses)
The location of technological inno-vators
Within own organi-sation
In the compa-nies
In the public organisations
Universities and research entities
Development organisations
In Ostrobothnia and Central Ostroboth-nia
In other parts of Finland
In the rest of the world

160 Proceedings of the University of Vaasa. Reports 3.3. Where will Ostrobothnian organisations find technological development partners 20 years hence? (scale 1-10) Where will Ostroboth-nian organisations find technological devel-opment partners 20 years hence?
Within own organisation
In the companies
In the public organisa-tions
Universities and research entities
Develop-ment organisa-tions
In Ostrobothnia and Central Ostrobothnia
In other parts of Fin-land
In the rest of the world
Thank you for your input:

Proceedings of the University of Vaasa. Reports 161
Appendix 2
Questionnaire for cooperation Companies – Public organisations
Attributes Cooperation in Ostrobothnia and Central Ostrobothnia 1.1 Cooperation on infrastructure and logistics 1.2 Cooperation on regional development 1.3 Cooperation on technology development 1.4 Cooperation on business development 1.5 Cooperation on land use planning 1.6 Cooperation on environmental issues 1.7 Cooperation on employment affairs Our most important public partner in Ostrobothnia 2.1 Our most important partner contacts us 2.2 Our most important partner knows our work 2.3 Our most important partner improves our innovation process 2.4 Our most partner knows our staff Cooperation in other parts of Finland 3.1 Cooperation on infrastructure and logistics 3.2 Cooperation on regional development 3.3 Cooperation on technology development 3.4 Cooperation on business development 3.5 Cooperation on land use planning 3.6 Cooperation on environmental issues 3.7 Cooperation on employment affairs Our most important public partner in other parts of Finland 4.1 Our most important partner contacts us 4.2 Our most important partner knows our work 4.3 Our most important partner improves our innovation process 4.4 Our most important partner knows our staff International cooperation 5.1 Cooperation on technological and business life development
5.2 Cooperation on environmental issues 5.3 Cooperation on logistics 5.4 Cooperation on education
5.5 Cooperation on regional development Our most important international public partner
6.1 Our most important partner knows our work 6.2 Our most important partner helps us on our difficult problems
6.3 We know our most important partner’s staff
6.4 Our most important partner knows regulations and concepts of our field

162 Proceedings of the University of Vaasa. Reports Questionnaire for cooperation Companies – Universities
Attributes Cooperation in Ostrobothnia and Central Ostrobothnia
1.1 Cooperation on education 1.2 Cooperation on research 1.3 Cooperation on development Our most important university partner in Ostrobothnia 2.1 We contact our most important partner 2.2 We know our most important partner's R&D and education methods
2.3 We know our most important partner's work 2.4 Our most important partner improves our innovation process 2.5 We know our most important partner’s research and educational staff
Cooperation in other parts of Finland 3.1 Cooperation on education 3.2 Cooperation on research 3.3 Cooperation on development Our most important university partner in rest of Finland
4.1 We take contact to our most important partner 4.2 We know our most important partner's R&D and education methods
4.3 We know our most important partner's work 4.4 Our most important partner improves our innovation process 4.5 We know our most important partner’s research and education staff
International cooperation 5.1 Cooperation on education 5.2 Cooperation on research 5.3 Cooperation on development Our most important international university partner
6.1 We contact our most important partner 6.2 We know our most important partner's R&D and education methods
6.3 We know our most important partner's work 6.4 Our most important partner improves our innovation process 6.5 We know our most important partner’s research and education staff

Proceedings of the University of Vaasa. Reports 163
Questionnaire for cooperation Companies – Other companies
Attributes Cooperation in Ostrobothnia and Central Ostrobothnia 1.1 Cooperation with subcontractors 1.2 Cooperation with customers 1.3 Cooperation within own corporation (between departments) 1.4 Cooperation on technology development 1.5 Cooperation on production system development 1.6 Cooperation on process development 1.7 Cooperation on organisational development 1.8 Cooperation on marketing Our most important company partner in Ostrobothnia
2.1 We share our key knowledge with our most important partner during mutual innovation process
2.2 Our most important partner knows our products/services 2.3 Our most important partner knows our standards/concepts 2.4 Our most important partner helps us with our difficult problems 2.5 Our most important partner knows our key staff Cooperation in other parts of Finland 3.1 Cooperation with subcontractors 3.2 Cooperation with customers 3.3 Cooperation within own corporation (between departments) 3.4 Cooperation on technology development 3.5 Cooperation on production system development 3.6 Cooperation on process development 3.7 Cooperation on organisational development 3.8 Cooperation on marketing Our most important company partner in other parts of Finland 4.1 We share our key knowledge with our most important partner during mutual
innovation process
4.2 Our most important partner knows our products/services 4.3 Our most important partner knows our standards/concepts 4.4 Our most important partner helps us with our difficult problems 4.5 Our most important partner knows our key staff International cooperation 5.1 Cooperation with subcontractors 5.2 Cooperation with customers 5.3 Cooperation within own corporation (between departments) 5.4 Cooperation on technology development 5.5 Cooperation on production system development 5.6 Cooperation on process development

164 Proceedings of the University of Vaasa. Reports
5.7 Cooperation on organisational development 5.8 Cooperation on marketing Our most important international company partner
6.1 We share our key knowledge with our most important partner during mutual innovation process
6.2 Our most important partner knows our products/services 6.3 Our most important partner knows our standards/concepts 6.4 Our most important partner helps us with our difficult problems 6.5 Our most important partner knows our key staff

