the artistic dividend: urban artistic specialisation and economic development implications
TRANSCRIPT
The Artistic Dividend:
Urban Artistic Specialization and Economic Development Implications
Ann Markusen Project on Regional and Industrial Economics
Humphrey Institute of Public Affairs University of Minnesota
301 S. 19th Avenue, Room 231 Minneapolis, MN 55455
[email protected] 612-625-8092 W
612-625-6351 Fax
Greg Schrock Center for Urban Economic Development
University of Illinois Chicago 322 S. Green Street, Suite 108
Chicago, IL 60607-3555 [email protected]
Forthcoming in final form in Urban Studies, Volume 43, No. 10: 1661-1686.
We are grateful to the Hubert H. Humphrey Institute of Public Affairs at the University of Minnesota for the research assistance and the resources to conduct and disseminate the research. The data analysis was supported in part by the National Science Foundation, Program in Geography and Regional Science, Grant No. 0136988. Thanks to Michael Leary, David King, Martina Cameron Anne Discher and Bill Dermody for research assistance and feedback and to Mel Gray, Neil Cuthbert, Bill Beyers and Bruce Seaman on how art worlds and arts economies operate. Thanks also to Trent Alexander of the Minnesota Population Center, University of Minnesota, for technical assistance with IPUMS data.
Abstract
Over the past two decades, urban and regional policymakers have increasingly looked to the arts and culture as an economic panacea, especially for the older urban core. The arts’ regional economic contribution is generally measured by totaling the revenue of larger arts organizations, associated expenditures by patrons, and multiplier effects. This approach underestimates the contributions of creative artists to a regional economy, because of high rates of self-employment and direct export activity, because artists’ work enhances the design, production and marketing of products and services in other sectors, and because artists induce innovation on the part of suppliers. Artists create import-substituting entertainment options for regional consumers and spend large shares of their own incomes on local arts output. We take a labor-centered view of the arts economy, hypothesizing that many artists choose a locale in which to work, often without regard to particular employers but in response to a nurturing artistic and patron community, amenities, and affordable cost of living. Because evidence on such economic impacts and location calculus is impossible to document directly, we use the distribution of artists across the largest U.S. metropolitan areas as a proxy, using data from the PUMS for 1980, 1990 and 2000. We find artists sort themselves out among American cities in irregular fashion, not closely related to either size or growth rates. We further explore variations in the definition of artist, the relationship between artistic occupation and industry, and differentials in artists’ self-employment rates and earnings across cities. We conclude that artists comprise a relatively footloose occupation that can serve as a target of regional and local economic development policy, and we outline the components of such a policy.

I. Conceptualizing an Artistic Dividend
For decades, arts advocates and cultural economists have tried to make the case
that public and philanthropic investments in the arts create a positive economic return for
the host community beyond the aesthetic enjoyment of the immediate audience or the
incomes generated for workers in the artistic enterprise. Hundreds of arts impact studies
have been done, detailing the probable expenditure of arts patrons, including tourists
drawn to a region expressly for this purpose, on tickets, restaurant meals, hotels, and
other local purchases. Despite the methodological problems that confront such efforts
(Seaman, 1987; Beyers and GMA, 1999), these studies document a not insignificant
economic return to non-artistic businesses and the regional economy as a whole.1
These studies approach the arts as a predominantly a local-serving industry,
especially for museums and the performing arts where, with exceptions like New York
and London, the majority of tickets are purchased by local residents. Visitors may also
attend, but they do not base their travel destinations on the opportunity to see local theatre
or dance. Few performing artists, then — musicians, dancer, actors and performance
artists — are believed to export their art out of the region. Other artists — painters,
sculptors, photographers, authors — may more easily export their work as well as sell it
locally, since it is embodied in a product that stores artistic value for consumption
elsewhere. But for the most part, artists in these occupations are seen as initially creating
for a local market. Thus resident artists and artistic establishments are not generally
considered a part of the economic base of the region, especially because economic base
analysis has relied on industries rather than occupations in identifying base components.2
1
Such an approach seriously understates the full economic contribution of an
artistic community to a regional economy. Restricting itself to arts organizations and the
impact of events associated with them, it fails to trace the many ways in which a region’s
artistic talent contributes to regional productivity and output. It cannot capture, for
instance, the work that artists do to enhance the design features of a region’s
manufacturing products or marketing efforts. It does not tally up the success of
photographers, painters, authors, poets and graphic designers in exporting their work out
of the region over the internet, arts fairs, or via other direct sales routes. Nor does it
account for the revenues and income to groups or individual artists who tour with
theatrical, musical or dance performances. It does not take into account the incomes
earned and human capital created by the many artists who teach others in their craft. It
does not trace the incomes generated for support workers who build sets, edit
manuscripts, print books and music, act as brokers or agents and engage in paid
promotional efforts outside of arts establishments, links that Howard Becker enabled us
to see so powerfully in his book, Art Worlds (1982). Finally, arts impact analysis does
not evaluate the extent to regional consumption of the arts may be import-substituting, as
consumers prefer to spend on performances and artwork rather than spending at shopping
malls full of imports. Furthermore, since artists themselves heavily patronize other
artists’ work, and so much of this work is labor intensive, the multiplier effect of local
arts consumption may be higher than expected. All of these are components of the artistic
dividend for a regional economy — the additional economic impact that would not occur
without the presence of artists. In this analysis, we focus on artists and urban economic
development, defining artists to include performing artists (actors, directors, dancers,
2

choreographers), musicians, writers and visual artists (painters, photographers,
filmmakers, ceramicists, textile artists, sculptors, printmakers).3
Artistic activity produces dividends for a regional economy in two ways — as
current income streams and as returns to the region as a whole on past investments.
Every year, thousands of individuals in a regional economy labor to produce artistic
performances, canvasses and photographs, books and magazine articles, tapes and films
and videos that are attended by paying customers or sold via bookstores, galleries, art
fairs and art crawls, the internet, private patronage or contractual arrangements (including
with government, business and wealthy individuals). To the extent that their work is
marketed at all, artists creating such works of art earn greater or lesser amounts of
income. They also place orders for materials, equipment and labor, much of which
further generates incomes in the region. Furthermore, the work of regional artists can
enhance the quality and salability of products and services of other businesses in the
region who are customers of or suppliers to artists.
Artists are thus not simply earning income from local activities. They are
contributors to the region’s economic base — goods and services exported out of the
region that enable the producers to earn incomes that are in turn spent in support of local-
serving businesses as well as on imports of yet other goods and services. Every region
must have a relatively unique economic base to thrive in a world increasingly integrated
through trade with other regional economies. Artists contribute to this economic base
when their work and performances are paid for by consumers and businesses elsewhere.
They also contribute to it when their work helps regional businesses win or expand
markets elsewhere.
3
We can also think of the artistic dividend as a kind of public good, a return to past
decades of investments by funders, patrons, businesses, arts organizations, the public
sector and artists themselves in the human capital and physical infrastructure that
constitute “art worlds” in the regional economy (Becker, 1982). A vibrant arts
community encompassing everything from pioneering and internationally renowned
regional theatre companies and museums to the thick and diverse layers of artistic talent
in the regional economy will serve as a major drawing factor for the location of new
businesses, the recruitment of new employees from elsewhere and further gravitation of
artists to the region (Florida, 2002b). It also helps reinforce the loyalty of current
residents and businesses to the region, providing the “lovability” that is so essential to the
future of a high wage region in a fast integrating world (Markusen, 1996).
The artistic dividend compares favorably with economists’ analysis of a
professional sports dividend (Noll and Zimbalist, 1997; Seaman, 2003). There are
similarities. Like arts events, major league teams draw audiences both locally and from
out-state, and people who come to these events spend money at local bars, restaurants and
on purchases they make in the environs. Much of this spending — especially that of
regional residents — would have been likely spent on other recreational and restaurant
purchases in the region, which is also true of theatre and concert-goers. The same
business and civic leaders who work to bring professional sports to a region are often
important patrons of the arts.
But the location and work behavior of sports players and artists are strikingly
different. Professional athletes generally do not live year round in the region where their
team is headquartered and thus spend the bulk of their incomes outside of the region
4

(Zimbalist, 2002). A few Broadway plays and Hollywood acts excepted, most artists
who perform in a metropolitan region live there as well. Few professional athletes or
other members of their entourage apply their talents to other business activities in the
region or engage in teaching, whereas many artists do. Because they are not pursuing
work in other venues, athletes are unlikely to be indirectly contributing to the
employment of others beyond what is already measured with economic impact
techniques. Studies of the overall economic impact of a new stadium show an extremely
small, perhaps negative effect on overall economic activity and employment and no
reasonable return on investment (Noll and Zimbalist, 1997; Coates and Humphreys,
2002), and metros with professional sports teams do no better in the long run than those
that do not (Baade, 1994; Chatfield, 2003).
Our occupational approach, described in the following sections, allows us to make
the case that artists’ contributions reach more broadly and deeply into the regional
economy. We do not address here the impact of artists and arts establishments on sub-
regional communities. Studies have found that both have helped to stabilize and
revitalize urban neighborhoods (Metropolitan Regional Arts Council, 1985; Stern and
Seifert, 1998; Stern, 2003; Strom, 2001; Center for an Urban Future, 2002; Walker,
2002). Conscious public, foundation and private decisions to support traditional arts
centers such as museums, orchestra halls and theatres as well as the staff and companies
that work in them have contributed to such effects. The development of inner city loft
spaces has also had a powerful impact (Zukin, 1982: Penne and Shanahan, 1987.) When
arts venues are decentralized across cities and suburbs, it amplifies the panoply of distinct
neighborhoods that draw people across traditional boundaries for entertainment and
5

recreation and adds to the amenities of the region as a whole, much as Jane Jacobs
espoused in her pathbreaking work on New York City (Jacobs, 1961).
II. Theorizing the Distribution of Artists among Cities
Why might artists thrive in large, mature cities or newer, faster-growing ones?
First, sheer size may matter. Residents who love big cities may display a higher penchant
for arts consumption, and producers may enjoy increasing returns to scale, especially in
art forms such as the opera. Previous work uncovered some evidence of this, but
surprisingly, the effect is greater for popular arts than high culture; only at very high
thresholds does the demand for elite arts activities show sensitivity to size of place (Blau,
1989: 57-9). Second, the demand for artistic activity from residents may be higher in the
traditional elite cities like New York, Philadelphia, Boston, Chicago, San Francisco and
Los Angeles where people with high, unearned (i.e. capital) income cluster and patronize
the arts through philanthropy, attendance and collecting. Third, certain large city centric
industries, such as advertising and media, may form a significant source of demand and
income for artists. Scott’s (2004) new book on Hollywood shows intricately how this
operates in Los Angeles. Fourth, artists and art spaces attract tourists (Judd, 1999;
Holcomb, 1999), generating urban income flows that feed back into artists’ livelihoods.
Fifth, synergies among different types of artistic activity may create agglomerative
tendencies that enhance the draw of large, traditional city centers; prior work has found
some synergy between theatre and dance activities, and between opera and chamber
music ensembles, though less than anticipated (Blau, 1989: 67-76). Such synergies can
be informal as well as organizational; two excellent sociological studies of art worlds
6

show how extraordinarily networked artists are with other artists and with workers in
other sectors (Becker, 1982; Rodgers, 1989). Sixth, artists many be drawn to the
amenities offered by a plethora of cultural institutions in, and the diversity and
innovativeness of, the largest cities (Florida, 2002a, 2002b; Glaeser, Kolko and Saiz,
2000; Clark, 2003). Finally, the impact of these factors may be magnified by the
behavior of artists themselves, who are more likely to patronize other artistic endeavors
than any other group.
Are there factors that might mitigate the draw of these cities and channel artists to
second tier and smaller cities and even rural locations? Yes, several. First, higher costs of
living may drive artists, who tend to earn low incomes and be self-employed, away from
the largest cities (Markusen and King, 2003). Second, some artists, particularly those in
the non-performing fields, may prefer certain amenities such as less congested,
recreational and private spaces for doing their art. Many artists are by temperament
“loners” and value the solitude available in non-urban settings; others prefer the
neighborhood feel of cities in the mid-sized range. Prior research has found that
performing artists are more apt to live closer to metropolitan cores than are visual artists
and writers, with musicians in the middle rage, though members of all artistic subgroups
are more centripetally oriented than residents as a whole (Markusen, 2004). Finally, the
emergence of the Internet has greatly expanded the possibilities for sales of artwork,
including music, graphic and visual arts and writing, from remote locations, freeing
artists from the need to be “where the action is.”
In this paper, we use artistic concentrations across American cities as proxies for
the size and presence of an artistic dividend. We do not test for the contribution of the
7
many causal forces we have just reviewed in generating these patterns – that is a project
for future research. We do refer t them in interpreting certain shifts and outcomes.
III. Operationalizing the Artistic Dividend Occupationally
Because the data do not exist, it is impossible to accurately document the value of
artists’ direct exports from the region, the value of their work on contract to non-arts
businesses, or their role in inducing innovation on the part of suppliers. In survey and
interview work we have done, artists are sometimes able to estimate their artistic income,
though not to distinguish easily the export from non-export components, but they have
difficulty put a value on the other two functions beyond articulating instances. We
employ, therefore, an occupational approach to document the presence and array of artists
in a metropolitan economy and compare these with those of other similarly-sized regions.
Our inference is that artistic over-representation in an economy is an indicator of the
presence and rough size of an artistic dividend.
Our use of occupations rather than industries to probe the creative economy is a
part of a research shifts towards a labor/human capital emphasis in regional development.
While industries aggregate up establishments (often embedded in multi-site and multi-
industry firms) on the basis of what they produce and treat them as location
decisionmaking units, advocates of an occupational approach stress the virtues of
aggregating up workers (including managers) on the basis of what they do, a way of
conceptualizing regional economies by their production process rather than their output
and acknowledging the role that occupational groups play in the formation of skill and
decisions to locate (Thompson and Thompson, 1985; Feser, 2003 ; Markusen, 2004;
8
Markusen and Schrock, 2004; Markusen and Barbour, 2003). Consider, for instance, the
cultural industries approach pioneered by a number of sociologists and economic
geographers in recent years (Pratt, 1997; Scott, 1997; Power, 2002; Hesmondhalgh, 2002;
Pratt, 2004). Although these researchers define cultural industries differently, the
unifying idea is to group together industries that supply cultural products, in turn defined
as those with high symbolic content, conveying social meaning, and/or providing psychic
gratification and personal ornamentation. Such a definition produces a strikingly different
picture of the creative economy. While Hemondhalgh’s conceptual treatment is highly
original, and the geographers provide powerful insights into various of the industries
amalgamated, several caveats can be raised. First, these accounts lack a coherent concept
of “cultural” to drive the actual designation of industries. Second, resulting industry lists
contain huge industries, such as advertising, printing and publishing, which have many
other product characteristics and serve as integral elements in other production chains and
systems. Finally, as we show below for advertising, the numbers of workers (and thus
the share of activity) that can reasonably be considered creative is very small in many of
the industries included.
Our definition of artists includes actors, directors, performance artists, dancers,
musicians, composers, authors, writers, painters, sculptors, and photographers. We are
primarily interested in those who self-identify as artists and have figured out a way to
engage in their art work as their major occupation, whether through employment, grants-
sponsored work, commercial contracts or sales of their own original work. We
acknowledge the presence, talents and hard work of part-time and unpaid artists in
creating aesthetic value and in contributing to the cache of a region. As arts fans, we
9
believe in art for art’s sake and in the tremendous educative, cultural and entertainment
value of artistic endeavor. The value of arts in our communities cannot be conflated with
its economic dimensions. Our work is designed to articulate the economic development
reasons why artistic practice should be nurtured by a city or region and to suggest ways
of doing so.
We use the Census of Population 5% Public Use Micro-Data sample to gauge the
presence of working artists, because it asks those surveyed their occupation, based on the
activity on which they spend the largest share of their working hours. While this data set
captures many more artists than do studies based on employers’ reporting of employment
by occupation, it stills results in significant under-counting of income-earning artists
because the Census directs part-time artists whose major activity belongs to another
occupation to report only the latter (Wassall and Alper, 1985). One estimate available for
the degree of such undercounting is available from the Bureau of Labor Statistics and is
explored below. We used the twenty-nine largest U.S. metropolitan areas (as of 2000) as
our study population. Using the Census data involved challenges in working across
metropolitan areas whose boundaries change over time and across changing occupational
definitions, especially the 1997 major overhaul of occupational codes. A detailed
description of the data base, occupational coding, metropolitan units and statistical
reliability are available in the Appendix to Markusen, Schrock and Cameron (2004).
We use this data to answer the following questions. To what extent do the largest
U.S. metro areas differentially specialize in artists and sub-groups of artists? How have
these patterns changed over time? To what extent are changing concentrations the result
of net migration of artists? Are concentrations closely associated with either growth rate
10

or sheer size of metro economies? Do arts-related occupations with lower rates of self-
employment and higher average incomes, such as architect and designer, exhibit patterns
of concentration similar to artists? How might artistic concentrations correspond to
differential industrial specializations? What do we know about self-employment among
artists and does this vary across metro areas? The answers we give are exploratory in
nature and suggest many lines of future research.
IV. Patterns of Artistic Advantage at the 21st Century’s Beginning
During the 1990s, American artists gravitated in large numbers towards three pre-
eminent centers of creative activity: Los Angeles, New York and San Francisco.4 These
gains were accompanied by notable artistic specializations in eight “second tier” metros:
Washington DC, Seattle, Boston, Minneapolis/St. Paul, Orange County, Miami, Portland
and San Diego. All hosted artistic agglomerations at rates between 10% and 36% above
the national average by 2000. In contrast, a number of large metros remained 10% or
more below the national average, including St. Louis, Houston, Pittsburgh, Riverside-San
Bernardino, San Jose and Tampa. Net migration of artists contributes to these
differentials. Artistic prowess does not appear to be closely associated with metro size or
rate of growth.
These rankings of “artistic dividend” reflect the degree to which the character of a
metro’s workforce is distinctively artistic. This does not mean that places with relatively
low artistic concentrations, measured in terms of location quotients (LQ), do not have
significant arts enclaves and high absolute numbers of artists. In cities like Chicago, the
magnitude of these arts activities is muted by the overall size and diversity of the regional
11
economy. In work elsewhere, we caution that one must look at both employment
specialization and absolute numbers of workers in occupations and industries to fully
understand regional economic comparisons. Chicago, for instance, is the most high tech
of American metros in terms of the numbers of workers in high tech industries, but San
Jose, Boise and other metros have higher rates of high tech specialization, because they
lack broader array of manufacturing and service activities of the former (Chapple,
Markusen, Schrock, Yamamoto and Yu, 2004a, 2004b).
A. Artistic Edge in the Big Three: Los Angeles, New York and San Francisco
Artistic advantage, as gauged by location quotients, is highly skewed in the
United States. Distinguishing themselves from the nation’s other large metros, Los
Angeles, New York and San Francisco attract and/or home-grow artists that comprise
disproportionately large shares of their workforces. In 2000, each of these metros posted
artistic specializations close to or in excess of twice the national norm (Table 1). Indeed,
they are the only three whose concentrations consistently exceed the norm for the large
metro group as a whole. Moreover, they wield their strengths across the board, ranking
in the top three in all of the sub-occupations – performing and visual artists, writers and
musicians.
A number of factors have contributed to the prominence of the “big three:” a
growth in arts funding, possibly tied to wealth appreciation especially at the highest end
of the income distribution; the rise and cultivation of tourist activity by these cities; and
more self-conscious pursuit of cultural capital by the core cities’ leadership and economic
development organizations. The three super artistic centers are particularly outstanding
12
in the performing arts, where their lead is quite dramatic. The relationship between the
performing arts and large, diversified media empires in these cities, including television,
motion pictures, and publishing enhances their draw. In the 1990s, American media
products were extraordinarily successful in international trade, not just in English
language forms. As we show below, these factors enabled these three metros to reverse a
trend towards artistic decentralization from previous decades.
Though these three super-arts cities led the nation at the beginning of the 21st
century, they are not the only ones to manifest an artistic dividend. A group of mid-sized
metros also exhibit artistic specialization (Table 1). Seven of them enjoyed a lead of 10%
or more over the national average by 2000: Washington, DC, Seattle, Boston, Orange
County, the Twin Cities, San Diego, and Miami. Lagging the national average, and at
less than 75% of the all metro average, are the metros of Dallas, Philadelphia, Phoenix,
Denver, San Jose, Cleveland, Pittsburgh, Detroit and Houston, among others. In these
metros, other occupations play the lead roles in their economies, and the arts appear to be
more “local-serving.” Of course, this is an overall generalization – some performers will
live in Pittsburgh and travel to gigs elsewhere; other artists will paint or write there and
export their work. But the aggregate size of these artistic pools are small relative to the
rest of the metro workforce and thus are not likely to be acting as magnets in the
competition to attract and keep artistic talent as they are in the dividend cities.
B. Re-concentration in the Los Angeles, San Francisco, New York in the 1990s
Reversing a trend towards decentralization between 1980 and 1990, Los Angeles,
New York and San Francisco increased their artistic lead over other American metros in
13
the 1990s. Using a modestly expanded definition of artistic occupations, necessitated by
coding changes between 1990 and 2000,5 we show that artistic concentrations in the top
three cities declined in the 1980s but grew disproportionately in the last decade of the
century (Table 2).6 This attractive power, attributable to the success of media and
entertainment industries and tourism in these three cities, appears to have been at the
expense of the rest of the country, including other mid-sized metros who had gained on
the big three in the 1980s: Boston, Minneapolis/St. Paul, Portland, Chicago.
In a shake-up of the ranks of the big three, Los Angeles outpaced New York to
post the highest concentration of artists vis-à-vis the nation in 2000. Washington, DC
and Seattle maintained their fourth and fifth positions, but the artistic advantage in each
declined quite a bit, creating a growing gap between the top three and the rest. Among
gaining mid-sized metros, Orange County moved up ranks from twelfth to seventh,
perhaps sharing in neighbor Los Angeles’ draw, and the Twin Cities moved up from
tenth to eighth, surpassing Miami, San Diego and Atlanta.
It is important to keep in mind that artistic specialization is a function of not just
the number of artists but of their presence relative to other groups in the labor force. If
other occupations disappear from a region, the denominator of the location quotient will
decline and the region will appear more artistically-oriented. This may be operating in
the case of Los Angeles and Orange County, two metros hit hard by the defense industry
implosion in the 1990s. As aerospace jobs evaporated, the region came to rely more
heavily on artistic prowess for its livelihood. Similarly, the relative decline in artistic
specialization in Washington, DC, Miami, San Diego and Atlanta may be associated with
faster growth in other occupations. Heavy population in-migration and job creation in
14
other sectors, including construction and elderly care, may be diminishing the
significance of artists as a propulsive force in these economies.
Shifts in metropolitan growth rates for artists for the two decades reflect an
overall curtailment of growth in artistic occupations in the 1990s (Table 3.) Artists
dramatically outpaced national job growth in the 1980s, but the occcupation’s growth
reflected more closely the national experience in the following decade.7 There are two
possible explanations for this. First, generous public funding, especially from the
National Endowment for the Arts, and generous philanthropic support for artists shrank
dramatically following political controversy over the NEA and the stock market crash of
the late 1980s. Many artists may have had to turn to other occupations as a primary
source of support. Second, the information technology boom of the 1990s may have
absorbed a large number of artistically-inclined workers. This shift from philanthropic
and public funding to the private sector may have favored the metropolitan areas where
private sector media, advertising, entertainment, and other arts-requiring private sector
firms congregate. Washington, Boston, Chicago, San Diego and Seattle posted very
modest artistic employment growth rates in the 1990s compared with rates greater than
50% in the 1980s.
Despite these caveats, our review of the evidence suggests that artists, especially
visual artists and writers, remain relatively footloose – able to practice their craft in any
number of places and responsive to different offerings in each. Our work confirms two
somewhat contradictory tendencies. First, the concentration of top fine art venues and
associated media and entertainment industries in the artistic super cities continues to
generate and draw artists to these poles. In the 1990s, this pace quickened. Second, other
15
artists are drawn to a selective set of mid-sized metros at the expense of other metros and
of small towns and rural areas as a whole. The rise of these second tier artistic cities
seems secure, even if artistic concentrations between the Big Three and the second tier
group fluctuate somewhat decade by decade.
C. The Role of Migration in Changing Artistic Specializations
Artists choose among cities as locations to live and work, and their net migration
rates contribute to the changing pattern of specialization. The Census PUMS data set
shows where artists sampled lived in 1995 and 2000. From these, we computed the net
migration rates for artists for each of the 29 metros. Los Angeles had by far the highest
net in-migration rate of artists, feeding its large jump in artistic specialization over this
period (Table 4). Thus Los Angeles’ artistic distinctiveness, as gauged by location
quotients, is not chiefly a function of the implosion of other occupations – it has been fed
by an unusually large stream of artists in-migrants hoping to make their fortunes in that
city and by fewer artists leaving. The New York metro attracted higher numbers of new
artists from migration in this period, but lost many more to outmigration than did Los
Angeles. In other words, churning in the artistic workforce was greater in New York and
may be attributable to that city’s higher concentrations of actors and dancers and to its
higher cost of living. Other second tier cities enjoyed a marked positive rate of net
migration by artists – Phoenix, Portland, Orange County, Dallas, Riverside, San Diego
and Atlanta. In many cases, these were counterparts to relatively rapid growth rates in
overall population.
16

Overall, net migration varies dramatically for metros among the set, from a high
of 2.16 for Los Angeles to a low of 0.37 for Houston in this period. Such rate
differentials confirm a great deal of ferment and self-sorting among artists in terms of
where they choose to live and work. They help to explain the resurgence of the three arts
super cities in the 1990s. As National Endowments for the Arts individual grants
imploded in the 1990s (Kreidler, 1996) and regional corporate contributions plunged
following the late 1980s stock market crash, private sector media and entertainment-
related jobs and contract work became relatively more important to artists than grants and
commissions, forcing them to move on balance toward the major corporate centers of
such activity.
D. Artists’ Clusters: Not Simply a Function of Size or Growth
Are the largest metros’ artistic talent pools proportionately or exponentially
related to sheer size? Does rate of growth have anything to do with it – do artistic
endeavors lag behind in faster growing cities, where new construction and finance and
manufacturing dominate the near term agenda? As others have found for past decades,
the answer to both of these questions is no.
Take the nation’s largest metros by size. Los Angeles and New York do rank
first and second by size, but artistically blessed San Francisco ranks sixth in size of the 29
metro set. On the other hand, Chicago and Philadelphia, the nation’s third and fifth
largest metros, remain just above or below the national norm, while at least ten smaller
metros posted more impressive artistic specializations. The absence of a clear
17

relationship between size and artistic specialization is evident in Figure 1, which arrays
the top 29 metros from largest at the top to smallest at the bottom.
Nor does recent growth experience track closely to artistic excellence. Fast-
growing, “newcomer” cities like Atlanta, San Diego, and Portland experienced an erosion
in artistic shares of their workforce in the 1990s, as did older, slow growth metros like
Boston and Cleveland. Other faster-growing metros such as Dallas, Phoenix and Denver
failed to reach the national average.
E. Diversity in Specialization: How Genres of Artists Sort Themselves Out by Place
Lumping all types of artists together provides a nice metric for simple
comparison, but it does not do justice to the complexity of artistic advantage. No metro’s
lead is preeminent across all groups of artists. The rich panoply of artists’ residential
specialization depicted in Table 1 shows that particular types of artists congregate in
particular locales. Even among the top three metros, variations in artistic specialties are
striking. Los Angeles’ artistic workforce is more heavily oriented towards performing
artists and musicians than the other two. New York posts the highest share of authors.
Perhaps characterizing these cities’ artistic strengths with labels like “Hollywood” and
“Greenwich Village” is not a bad first approximation.
A look at the “second tier” artistic cities – those eight that exceed the national
norm by 10% in the aggregate but fall behind the super three – shows how variegated
artistic strong suits can be (Figure 2). Writers are Boston’s strongest suit, as they are for
the Twin Cities and Washington DC. Visual artists are more prominent among the ranks
of artists in Orange County and San Diego – a striking West Coast alignment - and less
18
so in Washington DC, Boston and Miami. Seattle excels both among writers and visual
artists with more modest shares of performing artists. Miami shows a surprising strength
in performing arts. Orange County and Miami show a deficit of writers, and San Diego
lags among performing artists. Thus second tier artistic metros appear to develop niches
around certain arts sectors, with relatively few excelling across the board. Among these
seven second tier arts cities, only Washington DC, Seattle, Boston and Minneapolis-St
Paul outpaced the U.S. average in each of the four artistic subgroups.
V. Metro Concentrations of Related Artistic Occupations: Designers and Architects
Urban pools of creative artists often coexist alongside other occupations with
considerable artistic content. Some researchers include architects and designers in the
definition of artists. We did not do so because we wanted to focus closely on those
whom people traditionally think of as artists. Both architects and designers as
occupational groups are more likely to have full time, professional jobs than are the
artists we have focused on so far, and thus to have higher average incomes. Here we look
at these two related occupations and compare their regional distributional patterns with
those of artists. We find that New York, Los Angeles and San Francisco host the most
dense concentrations of designers but not architects, and that Detroit makes a surprise
showing among designers, because of its pre-eminence in industrial design.
A. Designers
In 2000, more than 350,000 people in the largest 29 U.S. metros designated their
principal occupation as “designer.” This diverse occupation consists of several
19
suboccupations, including commercial and industrial designers (10% of U.S. total),
fashion designers (3%), floral designers (21%), graphic designers (39%), interior
designers (9%), merchandise displayers (15%), and set and exhibit designers (2%). Pay
varies dramatically across these subgroups, with fashion ($27.04/hour) and commercial
and industrial designers ($24.55/hour) among the highest paid, graphic designers in the
middle ($18.25) and floral designers ($9.29) the lowest (Bureau of Labor Statistics,
Occupational Employment Statistics, 2002).
Among U.S. metros, New York, Los Angeles and San Francisco/Oakland host the
largest shares of designers (Table 5). New York exceeds the national workforce share by
over 80%. These rankings mirror the strong artistic showing of these metros, though
they sort in New York’s rather than Los Angeles’ favor.
But the gap between these three and other large cities is not that marked as it is
for artists. Detroit is also included in the high-performance group, ranking fourth, with a
concentration of designers 64% above the national norm. This reveals the diversity
among designers in terms of industries that use their skills. Designers are in high demand
in Detroit’s automobile industry and in the auto-promotional advertising activities housed
nearby. Detroit supports more than nine times the national average of commercial and
industrial designers – one out of every six to seven jobs in the nation in this category is
located in Detroit. Designers are also prominent in the labor force in Seattle, Boston,
Portland, San Jose, Orange County and Minneapolis-St. Paul, where they outpace larger
metros such as Chicago, Washington DC, Philadelphia, Atlanta and Houston.
Although we often think about architects and designers as a cluster of their own –
with interior designers working hand-in-hand with architects, our analysis shows this to
20
be a misconception. Designers are a much larger and more diverse group than popular
notions capture. Many industrial and consumer product and service firms require
specialized groups of designers to fashion them into attractive and useful items that will
sell well on the market, from automobiles to software and health care services to the
advertising that promotes them.
Different metros may be heavily specialized in one subgroup of designers and not
in others, while some will be relatively diversified. The two largest designer subgroups
(commercial/industrial and graphic designers) illustrate this (Table 5). Four metros
(Detroit, Seattle, San Jose, and Portland) possess concentrations of commercial and
industrial designers twice the national average. Detroit and San Jose are notable in
posting below average concentrations of graphic designers. This skewed pattern is tied to
very high concentrations of manufacturing activities in each, autos in the former, and
aerospace, computers and electronics in the latter. A second group of metros host
impressive pools of graphic designers but fall below the national average for commercial
and industrial designers: San Francisco, New York, Denver, Orange County, Baltimore,
and Washington DC. In addition to Seattle and Portland, four other metros show
prominence (40% above the U.S. average) in one of these design occupations and at least
a better than average showing in the other – Boston, Kansas City, Minneapolis/St. Paul,
and Phoenix.
Designers comprise an occupation with relatively rapid growth over the past few
decades. An understanding of their emerging and distinctive geography requires
knowledge of the interface between designers and the industries they tend to work in, a
point we explore next in the next section.
21
B. Architects
Architects design buildings and work with engineers, city planners, lawyers and
other professionals to make them become reality. They are diverse, in that many work
for large firms – some focus on commercial buildings, others on large residential
complexes and yet others on public monumental buildings like theaters and museums –
with an elaborate internal division of labor. Other architects hang out a shingle and work
out of home offices, designing houses for those who can afford them or redesigning
kitchens, porches and housing rehabs for middle class owners or apartment complexes.
Landscape architects plan and design new commercial and residential projects and
maintain gardens around existing homes and offices. While many architects serve
primarily regional markets, there are a growing number of firms with national and global
reach, and these are not all concentrated in the largest U.S. cities. Renowned architect
Cesar Pelli, for instance, works from New Haven, CT, and Minneapolis/St. Paul
architects Vincent James and Jennifer Yoos compete for and win projects across the
country.
Architects, perhaps because their creative work requires the cooperation of many
other parties to come to fruition, are more concentrated in metropolitan areas as a whole
than other artists (Table 5). They reveal, in other words, a tendency to cluster in what
regional scientists call “central places” and serve, from these, a regional hinterland. We
find some support for this tendency, which presumes that the larger a city is, the larger its
share of such an occupation. However, we also find considerable specialization that
cannot be predicted from sheer metro size. In general, the metro distribution of architects
22
is not far different from that of artists, although metro rankings do differ in some
respects.
The economies of the San Francisco/Oakland, Seattle, and Boston metros support
more architects as a share of their workforce than does New York. The Bay Area’s
strong showing may be related to intensive earthquake-related redesign and rehabbing in
the last decade. It may also, as with Seattle and Boston, be a talisman of a stronger local
market for architecture-intensive design, with many architects working on rehab and
upgrading projects. Strikingly missing from the list of the top clusters of architects is Los
Angeles, barely above the national norm and well below that of the metro group as a
whole. Not surprisingly, rapidly growing metros like Atlanta and Dallas outpace many
slow-growing metros, where we would not expect much new construction. Yet fast-
growing Tampa and Riverside/San Bernardino fall well below average.
VI. Artists by Industry: the Case of Advertising
Economic developers often think first in terms of industry and only then in terms
of occupation. Elsewhere, we make the case treating occupations as a co-equal force in
regional development (Markusen 2004). Location decisions on the part of skilled
workers may be as important as those of firms, because firms’ success may rely on pools
of talent and the ability to retain and attract more talented workers (Florida, 2002b). In a
broader sense, a region’s success around certain industries may be predicated on its
strength in key occupations driving those industries.
We can use the intersection between one industry, advertising, and artists
(including designers), as an opportunity to explore this interrelationship. Nationally,
23
about 10% of employees in the advertising industry, as reported by employers, belong to
arts occupations (Table 6). Large numbers of graphic designers, art directors, writers and
multi-media artists (a subgroup of visual artists) work in this industry. Painters,
commercial and industrial designers and actors are also employed in this sector, but make
up miniscule proportions of its workforce.
Do metro specializations in advertising industry employment dovetail with
prominent pools of designers, writers and other artistic groups? The answer is yes, with
some caveats. New York, San Francisco and Chicago dominate the list of metros with
high concentrations of jobs in advertising (Table 7). For their size, San Jose,
Minneapolis-St. Paul, and Detroit have developed vibrant specializations in advertising.
This may help explain the relatively strong showing of designers in each, whose
concentrations are higher than those of other artistic occupations. Although the two are
related, it is not possible to determine whether industry or occupation drives the presence
of the other in any one region. One can speculate that Detroit’s preeminence in auto
manufacturing bred an auto-centric advertising sector that in turn attracted designers. In
the Twin Cities, the presence of large, consumer-oriented companies like General Mills
and Pillsbury may have interacted with the independent emergence of an artistic
community to breed a successful advertising industry. This brief exploration of the
interconnection between industry and occupation suggests that an adequate understanding
of a metro’s artistic dividend should be based on a joint exploration of occupational and
industrial structure in the region.
VII. Metro Patterns of Artists’ Self-Employment
24
Artists demonstrate a strong commitment to self-employment, sometimes by
choice, often from desperation. Writers and fine artists, in particular, are more apt to be
self-employed than earning a salary, while performing artists and architects are more apt
to be on a payroll. For many artists, such self-employment adds to their income as an
avocation or second. Do metros differentially offer regularized employment for artists?
Yes. Using the case of writers, a group with very high rates of self-employment, we find
dramatic differentials in writers’ self-employment across metro areas. Our findings on
self-employment suggest that analysts and policymakers should use Census rather than
establishment-based data in evaluating the presence of artists in their region. Even with
the Census, self-employed artists remain undercounted because many of them moonlight,
i.e. do their art work as a second job (Alper and Wassell, 1999). We are able to estimate
the size of this effect at the national level but not for individual metros.
Nationally, artists are highly likely to be self-employed, ranging from 68% for
writers and authors to 24% for performing artists (Table 8). By comparison, only 8% of
workers overall were self-employed as of 2002. These data are drawn from careful work
by the Bureau of Labor Statistics that take into account both establishment and self-
reported employment sources. Using national estimates from the Current Population
Survey, they add to the Census totals an estimate of individuals who are self-employed as
artists as a second occupation. This raises the rate of self-employment among writers, for
instance, from 57% to 68%. Many self-employed artists who earn artistic income do so
as their second “job.” Musicians are most prominent in this regard – almost one in three
self-employed musicians engage in their musical activity as an avocation.
25
That more than two out of every three writers are not tied to an employer
underscores the relatively footloose character of this occupation – writers may be drawn
to New York, the heart of the international publishing industry, where lots of craft know-
how is in the air but where rents are astronomical and networks highly competitive. Or
they may gravitate to a second tier city like Minneapolis/St. Paul, Portland or Seattle with
a vibrant writing community and superior amenities. Yet others may prefer an affordable
small town in a stunning natural environment, where the Internet is one’s access to an
artistic community. Among performing artists, musicians are the most likely to be self-
employed, at 39%, while actors and choreographers are the least likely at 17%.
Designers (32%) and architects (22%) are less apt to be self-employed than artists as a
whole, yet the share is not negligible and far exceeds the national norm of 8%.
Artists within each of these occupations may vary markedly from each other.
Some writers have full-time jobs with magazines, newspapers or educational institutions,
while others work purely from commissions or sales of finished work. Some musicians
are unionized employees of orchestras or members of successful combos with a corporate
identity, while many others play local clubs, entertain at weddings and make occasional
recordings, much of it “off the books.”
Using writers as a case study, we probe the degree to which writers, reporting in
the Census as their primary occupation, are self-employed across our metro set. We find
dramatically different rates, from 57% of Los Angeles’ writers self-employed to only
22% in Kansas City (Table 9). Other high self-employment metros include Houston,
Portland, Riverside-San Bernardino, San Francisco and New York. Low self-
employment shares are found among writers in Baltimore, Cleveland, Washington, DC,
26
Minneapolis/St. Paul and Dallas. This may be due to the character of writing-intensive
activities in these regions. Payroll employment for writers may be high due to the huge
presence of Hallmark cards in Kansas City and legal, lobbying and political work in
Washington, DC. In other locales (Los Angeles, San Francisco and New York), short-
term media-related work (and lots of it) may attract self-employed writers. An additional
force is the high costs of living in some cities, driving self-employed artists to lower-cost,
amenity-rich environments. Interestingly, there is no clear Sunbelt/Frostbelt distinction
here, although there does seem to be a Western bias among metros that attract self-
employed writers.
The presence of self-employed artists in a region means that analysts and
policymakers should not rely solely on arts organization impact studies or establishment
data on artists’ employment in understanding the size of their artistic dividend. All the
metros studied show dramatically higher numbers of writers in their workforces when the
Census figures are used to chart their presence rather than employer-based OES data
(Table 9). The smallest differential is found in Baltimore, which reports 68% more
writers, and Portland possesses the largest gap, where the Census finds seven times as
many writers. If we used employer-based employment statistics to rank metros as
writers’ enclaves, Washington DC, New York and Minneapolis-St. Paul would top the
list in that order. But using Census figures, New York, San Francisco and Los Angeles
dominate, with Washington ranked fourth and the Twin Cities as eighth. Self-
employment is clearly driving these discrepancies, as evidenced by a strong statistical
correlation (0.72) between the metropolitan rate of self-employment among authors and
the ratio of Census to OES employment.
27
VIII. Artists’ Income Differentials by Region
Migration research has generally emphasized earnings as the single most
important factor in driving workers’ locational choice. Do metros with high
concentrations of artists pay their artists better than regions with low concentrations? The
Census permits us to study income differentials among those self-identifying as artists,
though it is not clear the extent to which such income is attributable to artistic work
(since artists may be working a second job or have non-wage income). In 2000,
differences in median artists’ incomes across metropolitan areas were fairly significant,
ranging from $42,000 in Newark to $20,000 in Riverside-San Bernardino (Table 10).
These earnings differentials are correlated with concentrations of artists among
the employed, suggesting that a premium does exist for artists working in creative
centers. They are also correlated with cost of living differentials (proxied by median
home price divided by median household income)—real income differentials are thus
somewhat lower than nominal levels. Some of the unexplained differential between
metros could be attributable to different mixes of artistic subgroups—performing artists
($35,000) and writers $($33,000) have higher personal incomes than visual artists
($25,000) and musicians ($20,000). New York, Los Angeles and San Francisco all host
larger concentrations of the former two subgroups, while San Diego, with low median
artistic incomes, hosts much higher concentrations of visual artists and musicians that the
former two. We found no correlation between median income and shares of artists
working for for-profit employers across the metro set, even though Galligan and Alper
(1988) found that artists working for commercial employers made more money (but
28
suffered higher unemployment rates) than artists working in the non-profit sector. We
also observed no correlation between the extent of self-employment among artists and
their median incomes.
These findings are exploratory. To adequate test for factors attracting artists to
metro area, a model would have to include variables representing industry structure,
amenities, and artist training and service organizations, as well as cost of living, type of
employer, and the presence of artistic concentrations. Artists may be as drawn to
amenities, and be willing to trade them off for lower earnings or higher costs of living, as
to higher earnings. They may also be drawn to regions with grand apprenticeship and
learning opportunities, trading off current income against future returns.
IX. Conclusion
Artists make important contributions to regional economies beyond those
associated with arts organizations and events, and these contributions are unevenly spread
among cities. Los Angeles, New York and San Francisco increased their lead over other
regions in the 1990s, reversing a modest trend of several decades towards
decentralization. Our perusal of 2000 shows that a number of “second tier” cities have
emerged and maintained distinction as artist-rich centers: Washington, DC, Seattle,
Boston, Orange County, Minneapolis/St. Paul, San Diego and Miami. Portland, Atlanta,
Baltimore, Chicago and Newark are also above the national norm. Other large metros
fall below the national norm, though there is some shifting over time in these ranks as
well.
29
The Big Three excel in all subgroups of artists, while the mid-sized cities with
artistic strength tend to specialize in one or two – some attract writers, others performing
artists or visual artists. The range of occupational discrepancy between these twenty-nine
regions ranges from an indexed share of 5.44 for Los Angeles in performing artists to
0.52 for St. Louis, also for performing artists. This means than Los Angeles hosts more
than five times the national workforce artists’ share norm, while St. Louis falls almost
50% below it.
We found no clear relationship between artistic strength and either overall
regional employment size or recent growth rates. Some large regions, like Chicago and
Philadelphia, do not share the other mega-regions’ artistic prowess, while many mid-
sized metros, such as Seattle, outpace the national norm.
The distribution of architects is even more concentrated in large cities nationally
than creative artists and generally mirrors their location patterns. Among designers,
however, a diverse group that encompasses industrial and commercial designers and
graphic artists, we find that metros like Detroit, Seattle, Portland and San Jose do not trail
far behind the Big Three. Detroit and San Jose host prominent concentrations of
industrial designers, while Seattle tops the list among graphic designers.
Our model of artistic specialization does not assume that firms and arts
organizations come first and artists follow. We believe that decisions of artists to live in
certain regions may be a stimulant to new firm formation and may attract other arts-using
firms to the region as well; our qualitative work on the Twin Cities confirms this
(Markusen and King, 2003). Decisions by both employers and artists interact to build
artistic enclaves. We explore this by looking at the interrelationship between one
30
industry, advertising, and artists to see whether there appears to be a synergy. We do find
this, and speculate that in some places, such as Minneapolis-St. Paul, the presence of an
artistic pool may be important in generating, attracting and enhancing the productivity of
advertising firms, while in Detroit, the presence of the auto industry appears to be more
important in the strong advertising sector in that economy.
Self-employment is an important feature of artistic activity in the United States
and in most regions we studied. Writers and visual artists are more likely to be self-
employed than employed by others, and musicians are quite likely to earn money from
their music as a second (and self-employed) activity. Examining writers and authors, we
find that some metros – Los Angeles, Houston, Portland – have much higher shares of
self-employed authors than do others; only about one in three authors is self-employed in
Kansas City, Baltimore, Cleveland and Washington, DC. It is therefore perilous to use
employer-based data sources to estimate the numbers of artists who are engaged in their
artwork as their major source of income.
Will these trends persist into the future? Several forces appear to be at work. The
catapulting of American media into international markets in the 1990s, as people
everywhere accepted English as a major form of communication and as the Internet
created almost unlimited opportunities for dissemination, favored the super artistic cities,
who were able to counter a prior tendency towards dispersion. Our 2000 Census data
does not capture the dot.com and telecommunications bust of the last few years that could
have eroded the new media edge of these cities and their ability to retain artists.
Continued large cost-of-living and congestion differentials between these cities and artist-
rich mid-sized American cities suggest decentralization may again assert itself. To the
31
extent that the Internet renders proximity less important, this will feed the dispersal trend.
Yet the complex assembling of media and entertainment products in the super arts cities,
reinforced by robust tourism to these cities, should enable them to hold their lead
indefinitely.
What can city leaders do to improve their artistic dividend? Our work is designed
to distinguish artists from other members of the so-called creative class, a distinction we
explore elsewhere (Markusen, 2005). For an artist-centric strategy, we counsel “different
strokes for different folks.” In the Big Three, the significance and uniqueness of their
artistic pools should be acknowledged and cultivated. Studying what draws artists to
their cities, whether it be particular employers, the rich cultural milieu or the region’s
natural amenities, should help to craft policies aimed at distinctive artists’ occupational
organizations, training institutions and networks. Each may benefit, too, from a deeper
understanding of how they compare with the other two and with the more outstanding
mid-sized cities. For the artist-rich second tier cities, surveying their artistic pools and
identifying their niche would be similarly helpful in constructing a strategy that promotes
artists’ organizations and education and nurtures the amenities that attract and keep artists
in the region. As we have shown with qualitative work in our previous study, a lower
cost of living, less congestion, recreational opportunities, alternative health care, and a
diverse artistic culture are among the features that draw artists away from the super arts
cities.
What about large cities that currently show a relative deficit of artists? Smaller
towns that cannot expect to mount even a single arts center? Because artists are
relatively footloose – many choose to live in a particular place to practice their art and
32

travel or use the Internet and mail to “export” their work out of the region, building an
artistic component to the local economy is a reasonable project for many cities and small
towns. Artists make less money than most other skilled workers, and an affordable
community is important to them. Affordable loft space in historic buildings in an older
city’s bar, comedy club and gallery-rich neighborhoods can anchor them there, while a
beautiful natural environment beckons to others. Every city and town has some modicum
of artistic talent among its residents. Artists can be engaged in thinking through a
strategy to market the place to other artists and to figure out how modest amounts of
public money and energy can be spent to attract and retain artists and art-loving tourists.
Localities can also help artists to market their work through the Internet and art fairs.
Public support for space, equipment, and networking opportunities for artists may pay off
handsomely (Jackson et al, 2003).
Cities of all sizes can amplify their artistic dividends by working on three fronts.
First, diversifying away from strictly “bricks and mortar” subsidies to arts facilities, cities
can nurture artistic occupations in several ways. One is through support for artists’
clubhouses – places where artists come together to share their craft and to learn ways of
making a living from their art. Publicly-supported artists’ live-and-work spaces have
become important anchors for many urban neighborhoods, often revitalizing historic
buildings and reversing a process of decline. Public education for the arts and support for
arts events helps to raise the visibility of art in a community and generate sales and gigs
for individual artists. Cities can also help artists hone their entrepreneurial skills and
build businesses (Markusen and King, 2003).
33
Second, cities can pioneer ways of tightening the connections between an existing
corporate community and resident artists. Traditionally, this relationship has been
conceived of as philanthropic in nature and has indeed played an important role in artistic
development. But artists can also be viewed as talent available to help companies design
a better product (designers), write better manuals for workers and consumers (writers),
solve management problems through simulation techniques (actors), and prepare better
marketing materials (painters, photographers, writers). Few organized channels exist to
match one up with the other, and such a “market” might contribute to both firm
productivity and profits and artists’ livelihoods.
Third, state and local governments should improve their decision criteria for
allocating public dollars to the arts. Currently, large new performing arts facilities tend to
receive disproportionate shares of the public dollar, because they are supported by well-
organized and energetic elites who lobby effectively. Smaller, more diverse cultural
organizations, artists’ live-work space and artists’ clubhouses receive paltry amounts of
money in contrast, though they are breeding grounds and experimental stages for future
artists and make important contributions to their neighborhoods and the overall diverse
character of a city. A broader appreciation for the size and dimensions of artistic
dividend will lead to a more diversified approach to arts funding. Better institutional
relationships between artists, arts organizations and economic development agencies will
facilitate such gains (Walker, Jackson and Rosenstein, 2003).
34
1 Among the best of these studies are the two done by Beyers and GMA (1999) on Seattle. Based on an extensive survey of arts organizations and arts patrons, they provide a detailed accounting of arts-related economic impacts for King County. They also compare their methodology and findings with those of a number of recent studies of other major metropolitan areas in the country. 2 The only study we have found that attempts to get at some of these larger impacts is an exploratory piece on the New England economy, The Creative Economy Initiative (2000). It uses an industry lens to define a “creative cluster” consisting of the applied arts (including graphic, industrial and web design, and advertising), plus the performing, visual, and literary arts,media, heritage (museums) and advocacy and support groups, including funders; it totals up the workers that business establishments in these sectors employ as the measure of the cluster’s size. The excellent Alliance for the Arts/Port Authority of New York and New Jersey study (1993), which attempts to show how its region’s arts complex forms a portion of its economic base, similarly uses industries rather than occupations. Studies of an emerging “culture industry” have an even broader focus; for an excellent overview of European studies on the cultural sector, see MKW Wirtschaftsforschung GmbH (2001). 3 Most economic studies of artists use a similar definition, which parallels government occupational codes. Some arts advocacy organizations also include arts administrators and art teachers, and a minority of studies include designers and architects. For conceptual and operational definitions of artist, see Wassall and Alper, 1985; Mitchell and Karttunen, 1992; Karttunen, 1998; and Filicko and Lafferty, 2002. 4 Metropolitan definitions used in this analysis were Metropolitan Statistical Areas (MSA) or Primary Metropolitan Statistical Areas (PMSA) as of 2000, with the exceptions of New York and San Francisco. 5 See Markusen, Schrock and Cameron (2004), the appendix, for discussion of changes to occupational coding between 1990 and 2000, and comparability of data between those years. 6 The dispersing impulse was evident before 1980 for some artistic occupations. Between 1970 and 1980, visual artists decentralized from centers like New York and Los Angeles while performing artists continued to cluster there. Big city shares of visual artists fell from 43 to 34% while their shares of performing artists rose from 35 to 40% (Heilbrun, 1987: 308). 7 See Alper et al, 1996, for an examination of changing employment and earnings by artistic subgroups over the Census years 1970, 1980 and 1990, and Ellis and Beresford,
35

1994, for a study of socioeconomic trends in artistic occupations over the same two decades. The latter find that the ranks of artists increased much faster in the 1980s than in the previous decade, although the largest contributor to that growth is accounted for by designers, a group not included in our definition.
36
References
ALLIANCE FOR THE ARTS AND THE PORT AUTHORITY OF NEW YORK AND NEW JERSEY. (1993) The Arts As An Industry: Their Economic Importance to the New York-New Jersey Metropolitan Region. New York: Port Authority of New York and New Jersey, October.
ALPER, N. and WASSELL, G. (1999) More Than Once in a Blue Moon: Multiple Jobholdings by American Artists. National Endowment for the Arts, Report #40. Santa Ana, CA: Seven Locks Press.
BECKER, H. (1982) Art Worlds. Berkeley and Los Angeles: University of California Press.
BEYERS, W. B. and GMA RESEARCH CORPORATION. (1999) An Economic Impact Study of Arts and Cultural Organizations in King County: 1997. Bellevue, WA: GMA Research Corporation.
BLAU, J. (1989) The Shape of Culture. Cambridge: Cambridge University Press.
CHAPPLE, K., MARKUSEN, A., SCHROCK, G., YAMAMOTO, D. and YU, P. (2004a) Gauging Metropolitan “High Tech” and “I-Tech” Activity. Economic Development Quarterly, 18, 1, pp. 10-29.
CHAPPLE, K., MARKUSEN, A., SCHROCK, G., YAMAMOTO, D. and YU, P. High Tech Rankings, Specialization and Relationship to Growth: A Rejoinder. (2004b) Economic Development Quarterly, 18, 1, pp. 44-49.
CHATFIELD, N. (2003) Feasibility Study of the Recently Proposed Minnesota Vikings/Gophers Stadium. Master’s Degree Professional Paper, Humphrey Institute of Public Affairs, University of Minnesota, June.
CLARK, T. N. (2003) Urban Amenities: Lakes, Opera and Juice Bars – Do they Drive Development? The City as an Entertainment Machine. Research in Urban Policy, 9, pp. 130-140.
COATES, D. and HUMPHREYS, B. (2002) The Effect of Professional Sports on Earnings and Employment in the Services and Retail Sectors in U.S. Cities. Regional Science and Urban Economics, 33, pp. 175–98.
ELLIS, D. and BERESFORD, J. (1994) Trend in Artistic Occupations: 1970-1990. Washington, DC: Washington, DC: National Endowment for the Arts, Research Division Report #29.
ELLIS, M.; BARFF, R. and RENARD, B. (1993) Migration Regions and Interstate Labor Flows by Occupation in the United States. Growth and Change, 24 (Spring), pp. 166–90.
A-1
FESER, E. (2003) “What regions do rather than make: A proposed set of knowledge-based occupation clusters.” Urban Studies, 40, 10: pp. 1937-58.
FILICKO, T. and Lafferty, S. (2002) “Defining the arts and cultural universe: Lessons from the profiles project.” Journal of Arts Management, Law, and Society. 2, 3, pp. 15-205.
FLORIDA, R. (2002a) Bohemia and economic geography. Journal of Economic Geography, 2, pp. 55-71.
FLORIDA, R. (2002b) The Rise of the Creative Class. New York, Basic Books.
GALLIGAN, A. and ALPER, N. (1998) “Characteristics of performing artists: a baseline profile of sectoral crossovers.” Journal of Arts Management, Law & Society. 28, 3. pp/ 155-78.
GLAESER, E., KOLKO, J. and SAIZ, A. (2000) Consumer City. Cambridge, MA: National Bureau of Economic Research, Working Paper No. 7790, July.
HEILBRUN, J. and GRAY, C. M. (1993) The Economics of Art and Culture. New York: Cambridge University Press.
HEILBRUN, J. (1987) Growth and geographic distribution of the arts in the U.S., in D. Shaw, W. Hendon and C. R. Waits (Eds.) Artists and Cultural Consumers. Akron, Ohio: Association for Cultural Economics, pp. 24–35.
HESMONDHALGH, D. (2002) The Cultural Industries. London: Sage.
HOLCOMB, B. (1999) Marketing cities for tourism. In d. Judd and S. Fainstein (Eds.) The Tourist City. New Haven: Yale University Press, pp. 54-70.
JACKSON, M-R., KABWASA-GREEN, F., SWENSON, D., HERRANZ, JR, J., FERRYMAN, K., ATLAS, C., WALLNER, E. and ROSENSTEIN, C. (2003) Investing in Creativity. Washington, DC: The Urban Institute. www.usartistsreport.org
JACOBS, J. (1961) The Death and Life of Great American Cities. New York: Vintage
JUDD, D. (1999) Constructing the tourist bubble, in D. Judd and S. Fainstein (Eds.) The Tourist City. New Haven, CT: Yale University Press, pp. 35-53.
KARTTUNEN, S. (1998) "How to Identify Artists? Defining the population for `status-of-the-artist studies." Poetics 26: 1-19.
KREIDLER, J. (1996) Leverage Lost: The Nonprofit Arts in the Post-Ford Era. In Motion Magazine from http://www.inmotionmagazine.com/lost.html
MARKUSEN, A., SCHROCK G. and CAMERON, M. (2004) The Artistic Dividend Revisited. Minneapolis, MN: Project on Regional and Industrial Economics, the Humphrey Institute, University of Minnesota, March.
A-2

MARKUSEN, A. and KING, D. (2003) The Artistic Dividend: The Hidden Contributions of the Arts to the Regional Economy. Minneapolis, MN: Project on Regional and Industrial Economics, the Humphrey Institute, University of Minnesota, July.
MARKUSEN, A. and BARBOUR, E. (2003) California’s Occupational Advantage. Working Paper No. 2003.12, San Francisco: Public Policy Institute of California, May.
MARKUSEN, A. and SCHROCK, G. (2004) Regional Job Growth Through an Occupational Lens. Working Paper #256. Minneapolis, MN: Project on Regional and Industrial Economics, the Humphrey Institute, University of Minnesota, November.
MARKUSEN, A. (1996) Toronto's economic future: a rumination on comparisons with seven U.S. Cities, in J. Kjellberg Bell and S. Webber (Eds.) Urban Regions in a Global Context. Toronto: Centre for Urban and Community Studies, University of Toronto, pp. 47–68.
MARKUSEN, A. (2004) Targeting occupations in regional and community economic development. Journal of the American Planning Association, 70, 3, pp. 253-268.
MARKUSEN, A. (2005). “Urban development and the politics of a creative class: evidence from the study of artists.” Environment and Planning A, forthcoming.
MITCHELL, R. and KARTTUNEN, S. (1992) “Why and how to define an artist.” In R, TOWSE and KHAKEE, A., (eds) Cultural Economics. Berlin: Springer: 175-186.
MKW WIRTSCHAFTSFORSCHUNG GMBH. (2001) Employment in the Cultural Sector: Literature and Research — an Overview. Final Report for the European Commission, DG Employment and Social Affairs. Munich: MKW Wirtsschaftsforschung GmbH.
NOLL, R. and ZIMBALIST, A. (1997) The economic impact of sports teams and facilities, in R. Noll and A. Zimbalist (Eds.) Sports, Jobs, and Taxes: The Economic Impact of Sports Teams and Stadiums. Washington, DC: Brookings Institution Press: 55-91.
POWER, D. (2002) “’Cultural industries’ in Sweden: An assessment of their place in the Swedish economy.” Economic Geography 78, 2, pp. 103-27.
PRATT, A. (1997) “The Cultural Industries Production System: A Case Study of Employment Change in Britain, 1984-91.” Environmental and Planning A, 29, pp. 1953-1974.
PRATT, A. (2004) Mapping the cultural industries: regionalization; the example of South East England. In D. Power and A. Scott (Eds) Cultural Industries and the Production of Culture. New York: Routledge.
RODGERS, P. (1989) The Work of Art. London: Calouste Gulbenkian Foundation and Policy Studies Institute.
RUGGLES, S., MATTHEW, S., et al. (2003) Integrated Public Use Microdata Series: Version 3.0 Minneapolis: Historical Census Projects, University of Minnesota. http://www.ipums.org
A-3
SCOTT, A. (2005) On Hollywood: The Place, The Industry. Princeton: Princeton University Press.
SCOTT, A. (1997) The cultural economy of cities. International Journal of Urban and Regional Research, Vol. 2: 323-39.
SEAMAN, B. (1987) Arts impact studies: a fashionable excess, in A. J. Radich (Ed.) Economic Impact of the Arts: A Sourcebook. Washington, DC: National Conference of State Legislatures, pp. 43–76.
SEAMAN, B. 2003. Cultural and sport economics: conceptual twins?" Journal of Cultural Economics, 27, 2, pp. 81-126.
STERN, M. and SEIFERT, S. (1998) Community Revitalization and the Arts in Philadelphia. Philadelphia: University of Pennsylvania, Social Impact of the Arts Project.
STERN, M. (2003) Culture and the Changing Urban Landscape: Philadelphia 1997-2002. Paper presented at the Regional Science Association International meetings, Philadelphia, November 22.
STROM, E. (2001) Strengthening Communities through Culture. Washington, DC: Center for Arts and Culture.
THOMPSON, W. and THOMPSON, P. (1985) “From Industries to Occupations: Rethinking Local Economic Development.” Economic Development Commentary, 9: 12-18.
WALKER, C. (2002) Arts & Culture: Community Connections. Washington, DC: The Urban Institute.
WALKER, C, JACKSON, M-R. and ROSENSTEIN, C. (2003) Culture and Commerce. Washington, DC: The Urban Institute, March.
WASSALL, G. and ALPER, N. (1985) Occupational Characteristics of Artists: A Statistical Analysis. Journal of Cultural Economics, 9, 1, pp. 13–34.
ZIMBALIST, A. (2002) A Note on the Local Economic Impact of Sports Expenditures. Journal of Sports Economics, 3, 4, pp. 361–66.
A-4
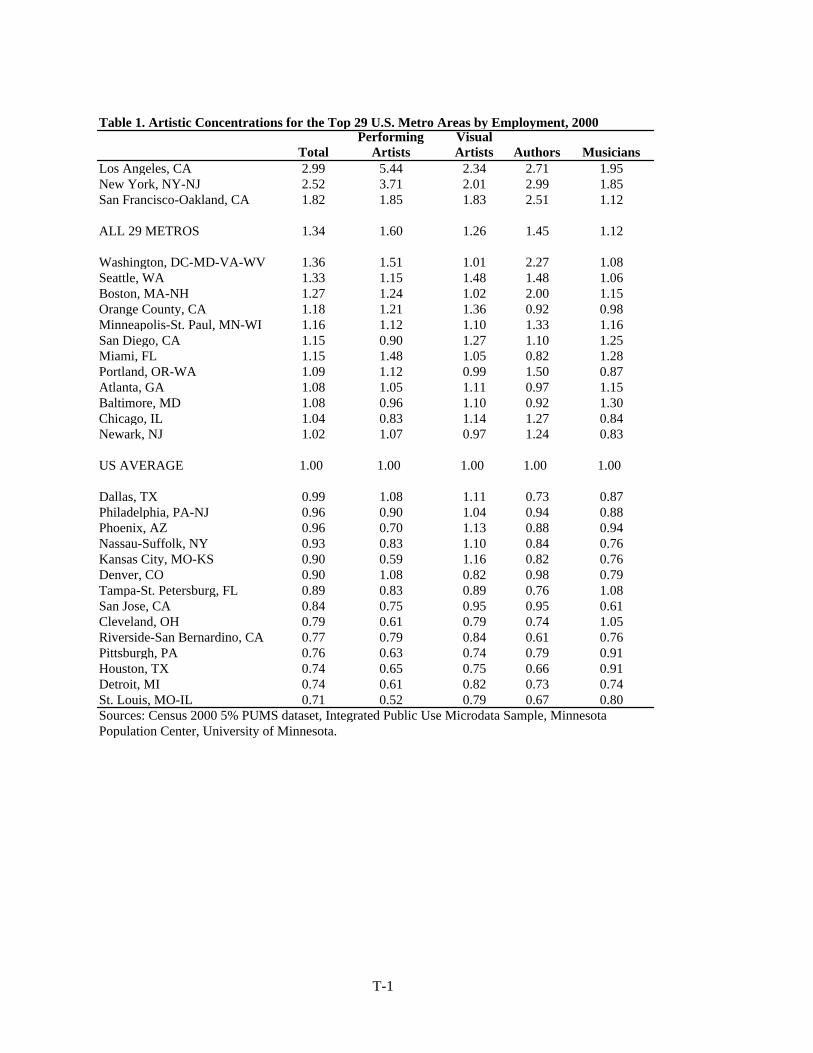
Table 1. Artistic Concentrations for the Top 29 U.S. Metro Areas by Employment, 2000
TotalPerforming
ArtistsVisual Artists Authors Musicians
Los Angeles, CA 2.99 5.44 2.34 2.71 1.95New York, NY-NJ 2.52 3.71 2.01 2.99 1.85San Francisco-Oakland, CA 1.82 1.85 1.83 2.51 1.12
ALL 29 METROS 1.34 1.60 1.26 1.45 1.12
Washington, DC-MD-VA-WV 1.36 1.51 1.01 2.27 1.08Seattle, WA 1.33 1.15 1.48 1.48 1.06Boston, MA-NH 1.27 1.24 1.02 2.00 1.15Orange County, CA 1.18 1.21 1.36 0.92 0.98Minneapolis-St. Paul, MN-WI 1.16 1.12 1.10 1.33 1.16San Diego, CA 1.15 0.90 1.27 1.10 1.25Miami, FL 1.15 1.48 1.05 0.82 1.28Portland, OR-WA 1.09 1.12 0.99 1.50 0.87Atlanta, GA 1.08 1.05 1.11 0.97 1.15Baltimore, MD 1.08 0.96 1.10 0.92 1.30Chicago, IL 1.04 0.83 1.14 1.27 0.84Newark, NJ 1.02 1.07 0.97 1.24 0.83
US AVERAGE 1.00 1.00 1.00 1.00 1.00
Dallas, TX 0.99 1.08 1.11 0.73 0.87Philadelphia, PA-NJ 0.96 0.90 1.04 0.94 0.88Phoenix, AZ 0.96 0.70 1.13 0.88 0.94Nassau-Suffolk, NY 0.93 0.83 1.10 0.84 0.76Kansas City, MO-KS 0.90 0.59 1.16 0.82 0.76Denver, CO 0.90 1.08 0.82 0.98 0.79Tampa-St. Petersburg, FL 0.89 0.83 0.89 0.76 1.08San Jose, CA 0.84 0.75 0.95 0.95 0.61Cleveland, OH 0.79 0.61 0.79 0.74 1.05Riverside-San Bernardino, CA 0.77 0.79 0.84 0.61 0.76Pittsburgh, PA 0.76 0.63 0.74 0.79 0.91Houston, TX 0.74 0.65 0.75 0.66 0.91Detroit, MI 0.74 0.61 0.82 0.73 0.74St. Louis, MO-IL 0.71 0.52 0.79 0.67 0.80Sources: Census 2000 5% PUMS dataset, Integrated Public Use Microdata Sample, Minnesota Population Center, University of Minnesota.
T-1

Table 2. Artistic Specializations, Selected Metros, 1980, 1990, 20001980 LQ 1990 LQ 2000 LQ
Los Angeles, CA 2.39 2.31 2.99New York, NY-NJ 2.60 2.42 2.52San Francisco-Oakland, CA 1.79 1.60 1.82Washington, DC-MD-VA-WV 1.76 1.63 1.36Seattle, WA 1.59 1.40 1.33Boston, MA-NH 1.51 1.49 1.27Orange County, CA 1.15 1.26 1.18Minneapolis-St. Paul, MN-WI 1.20 1.27 1.16San Diego, CA 1.24 1.15 1.15Miami, FL 1.35 1.09 1.15Portland, OR-WA 1.18 1.24 1.09Atlanta, GA 1.31 1.08 1.08Chicago, IL 1.03 1.09 1.04Cleveland, OH 0.82 0.83 0.79
Refer to Appendix for disclaimers regarding the comparability of occupational codes between Census years.
Artists are defined as the 2000 Census codes: Authors (285); Musicians and Composers (275); Actors (270); Producers & Directors (271); Dancers & Choreographers (274); Photographers (291), TV, Video, and Motion Picture Camera Operators (292, partial); and Artists & Related Workers (260).
Artists are defined as the 1980/1990 Census codes: Authors (183); Musicians and Composers (186); Painters, Sculptors, Craft-Artists, and Artist Printmakers (188); Artists, Performers & Related Workers (194); Actors & Directors (187); Dancers (193); and Photographers (189).
Sources: Census 1980, 1990, 2000 5% PUMS dataset, Integrated Public Use Microdata Series, Minnesota Population Center, University of Minnesota.
T-2
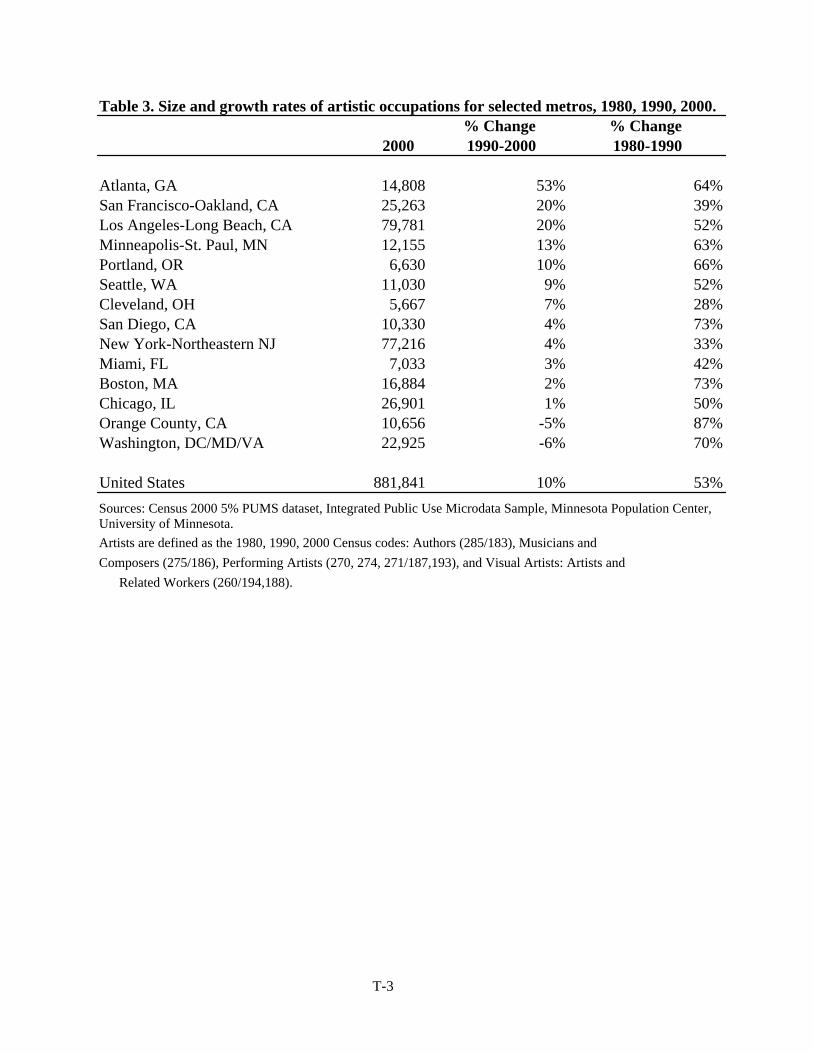
Table 3. Size and growth rates of artistic occupations for selected metros, 1980, 1990, 2000.% Change % Change
2000 1990-2000 1980-1990
Atlanta, GA 14,808 53% 64%San Francisco-Oakland, CA 25,263 20% 39%Los Angeles-Long Beach, CA 79,781 20% 52%Minneapolis-St. Paul, MN 12,155 13% 63%Portland, OR 6,630 10% 66%Seattle, WA 11,030 9% 52%Cleveland, OH 5,667 7% 28%San Diego, CA 10,330 4% 73%New York-Northeastern NJ 77,216 4% 33%Miami, FL 7,033 3% 42%Boston, MA 16,884 2% 73%Chicago, IL 26,901 1% 50%Orange County, CA 10,656 -5% 87%Washington, DC/MD/VA 22,925 -6% 70%
United States 881,841 10% 53%
Artists are defined as the 1980, 1990, 2000 Census codes: Authors (285/183), Musicians and Composers (275/186), Performing Artists (270, 274, 271/187,193), and Visual Artists: Artists and Related Workers (260/194,188).
Sources: Census 2000 5% PUMS dataset, Integrated Public Use Microdata Sample, Minnesota Population Center, University of Minnesota.
T-3

T4. Migration of artists by metropolitan area, 1995-2000In/out
migration ratio
New artists as % of
total
Moved into metro
Moved out of metro
Artists 2000
Los Angeles, CA 2.16 22% 19,250 8,918 88325Phoenix, AZ 1.56 23% 2,105 1,346 9247Portland-Vancouver, OR 1.48 24% 1,634 1,105 6876Orange County, CA 1.47 26% 2,814 1,914 10881New York/Bergen, NY-NJ 1.44 21% 20,591 14,348 96,196Dallas, TX 1.42 27% 3,064 2,162 11517San Francisco-Oakland, CA 1.37 28% 7,258 5,285 26071Riverside-San Bernadino, CA 1.34 22% 1,519 1,135 6992Tampa-St. Petersburg, FL 1.28 21% 1,406 1,100 6674San Diego, CA 1.25 24% 2,680 2,144 10961Atlanta, GA 1.22 26% 3,971 3,255 15,282Kansas City, MO-KS 1.21 23% 1,236 1,021 5412Washington, DC-MD-VA 1.14 24% 5,436 4,749 23016Seattle, WA 1.11 22% 2,482 2,244 11428Newark, NJ 1.05 26% 1,708 1,626 6643Boston, MA 0.98 24% 3,770 3,847 15552Minneapolis-St Paul, MN-WI 0.97 16% 1,994 2,047 12,275Baltimore, MD 0.95 21% 1,784 1,869 8608Pittsburgh, PA 0.93 16% 872 939 5550Detroit, MI 0.89 12% 1,282 1,438 10450Chicago, IL 0.83 16% 4,379 5,288 27612Philadelphia, PA/NJ 0.82 15% 2,248 2,753 15498San Jose, CA 0.81 28% 1,379 1,699 4904St. Louis, MO-IL 0.63 15% 912 1,448 6275Cleveland, OH 0.53 12% 669 1,255 5,805Nassau Co, NY 0.51 12% 1,034 2,034 8304Houston, TX 0.37 21% 2,008 5,388 9725Source: Calculated by Ann Markusen and Martina Cameron, Project on Regional and Industrial Economics, University of Minnesota, Calculated from Census 1980, 1990, 2000 5% PUMS dataset, Integrated Public Use Microdata Sample, Minnesota Population Center, University of Minnesota. Note: Outmigration data not availabl for Denver and Miami metro areas for 2000.
T-4

Commercial Industrial Graphic
Metropolitan Area Designers Designers Designers ArchitectsNew York, NY-NJ 1.83 0.67 1.62 1.80San Francisco-Oakland, CA 1.75 0.68 1.72 2.83Los Angeles, CA 1.72 0.43 1.26 1.18Detroit, MI 1.64 9.34 0.85 0.83Seattle, WA 1.63 2.22 2.11 2.53Boston, MA-NH 1.60 1.94 1.45 2.49Portland, OR-WA 1.57 2.00 1.16 1.84San Jose, CA 1.52 2.21 0.93 1.05Orange County, CA 1.43 0.66 1.46 1.43Minneapolis-St. Paul, MN-WI 1.36 1.06 1.42 1.54San Diego, CA 1.27 0.44 1.20 1.21Dallas, TX 1.24 1.13 1.15 1.49Chicago, IL 1.17 0.81 1.01 1.49Denver, CO 1.16 0.67 1.48 1.80Houston, TX 1.12 1.31 1.03 1.13Atlanta, GA 1.09 0.75 1.01 1.56Kansas City, MO-KS 1.09 1.43 1.58 1.49Nassau-Suffolk, NY 1.09 0.67 0.84 1.20Newark, NJ 1.08 1.11 1.15 1.18Washington, DC-MD-VA-WV 1.07 0.55 1.42 1.82Philadelphia, PA-NJ 1.07 1.08 1.31 1.19Baltimore, MD 1.05 0.62 1.44 1.16Phoenix, AZ 0.98 1.41 1.19 1.10Cleveland, OH 0.98 1.00 0.98 1.13St. Louis, MO-IL 0.98 1.20 1.29 1.14Pittsburgh, PA 0.91 0.56 0.58 1.05Riverside-San Bernardino, CA 0.70 0.19 0.57 0.46Sources: Census 2000 5% PUMS dataset, Integrated Public Use Microdata Sample, Minnesota Population Center, University of Minnesota.Architects are defined in the 2000 Census as SOC 130, designers as SOC 263.
Table 5. Concentrations of Designers, Architects by Metropolitan Area, 2000
T-5
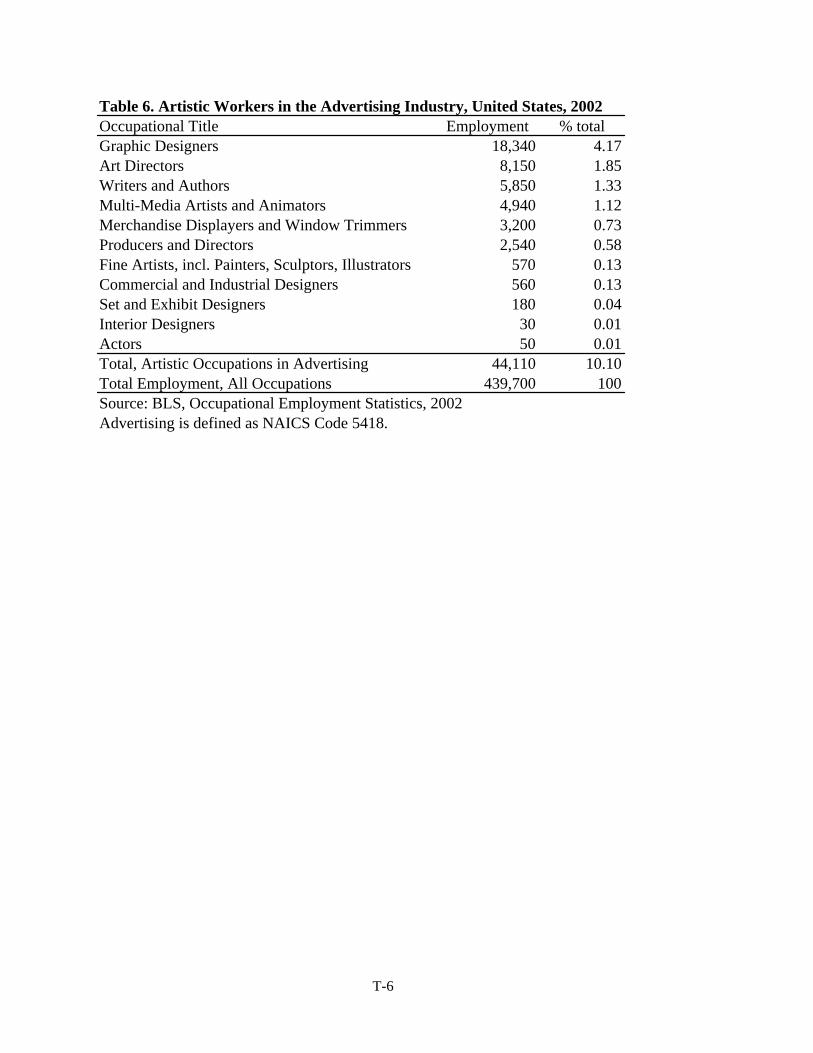
Table 6. Artistic Workers in the Advertising Industry, United States, 2002Occupational Title Employment % totalGraphic Designers 18,340 4.17Art Directors 8,150 1.85Writers and Authors 5,850 1.33Multi-Media Artists and Animators 4,940 1.12Merchandise Displayers and Window Trimmers 3,200 0.73Producers and Directors 2,540 0.58Fine Artists, incl. Painters, Sculptors, Illustrators 570 0.13Commercial and Industrial Designers 560 0.13Set and Exhibit Designers 180 0.04Interior Designers 30 0.01Actors 50 0.01Total, Artistic Occupations in Advertising 44,110 10.10Total Employment, All Occupations 439,700 100Source: BLS, Occupational Employment Statistics, 2002Advertising is defined as NAICS Code 5418.
T-6
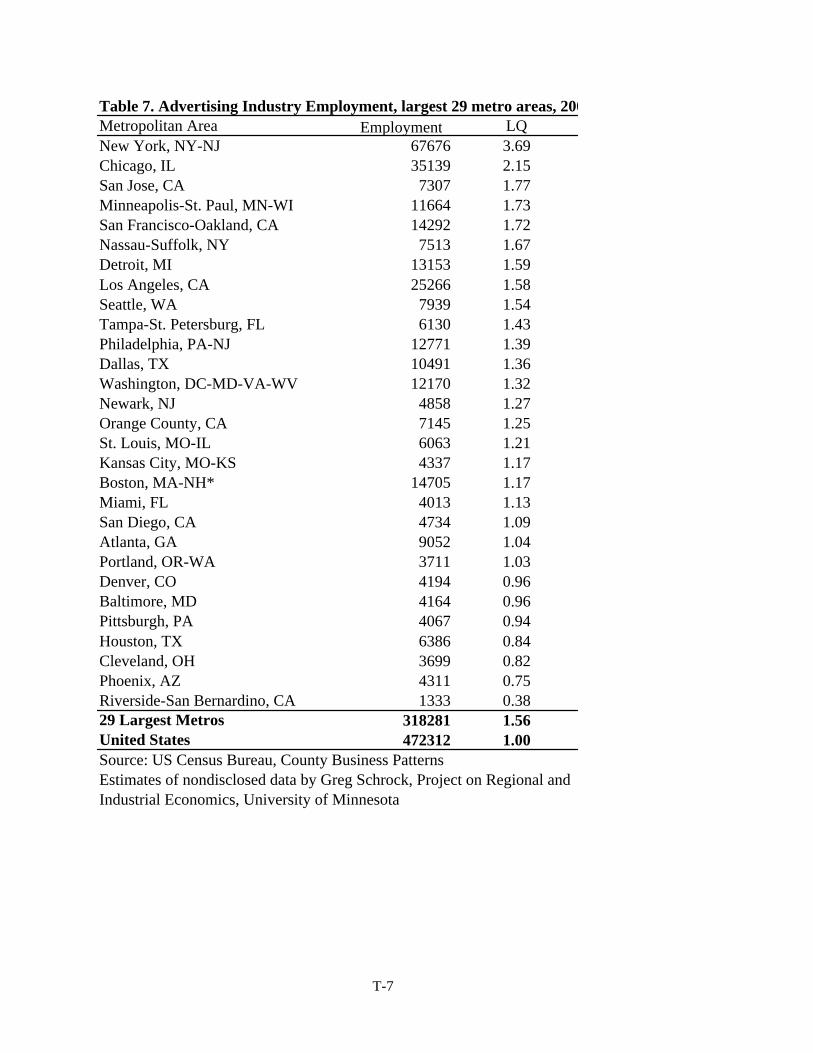
Table 7. Advertising Industry Employment, largest 29 metro areas, 200Metropolitan Area Employment LQNew York, NY-NJ 67676 3.69Chicago, IL 35139 2.15San Jose, CA 7307 1.77Minneapolis-St. Paul, MN-WI 11664 1.73San Francisco-Oakland, CA 14292 1.72Nassau-Suffolk, NY 7513 1.67Detroit, MI 13153 1.59Los Angeles, CA 25266 1.58Seattle, WA 7939 1.54Tampa-St. Petersburg, FL 6130 1.43Philadelphia, PA-NJ 12771 1.39Dallas, TX 10491 1.36Washington, DC-MD-VA-WV 12170 1.32Newark, NJ 4858 1.27Orange County, CA 7145 1.25St. Louis, MO-IL 6063 1.21
4337 1.1714705 1.17
4013 1.134734 1.099052 1.043711 1.034194 0.964164 0.964067 0.946386 0.843699 0.824311 0.751333 0.38
318281 1.56472312 1.00
Kansas City, MO-KSBoston, MA-NH*Miami, FLSan Diego, CAAtlanta, GAPortland, OR-WADenver, COBaltimore, MDPittsburgh, PAHouston, TXCleveland, OHPhoenix, AZRiverside-San Bernardino, CA29 Largest MetrosUnited StatesSource: US Census Bureau, County Business PatternsEstimates of nondisclosed data by Greg Schrock, Project on Regional and
Industrial Economics, University of Minnesota
T-7

Table 8. Self employment trends, artistic occupations, 2002Occupational Title Total Employment Self-
em ed% Self-
em
ploy ployedPrimary
jobSecondary
jobVisual artists 307,254 155,159 50% 129,109 26,050 Artists and related workers 148,682 80,022 54% 70,731 9,291 Arts directors 50,664 27,139 54% 23,988 3,151 Fine artists: painters, sculptors, illustra 23,192 12,866 55% 11,372 1,494 Multi-media artists & animators 74,826 40,017 53% 35,371 4,646 Photographers 130,442 68,432 52% 54,024 14,408 Camera operators, TV/Video/Motion pi 28,130 6,705 24% 4,354 2,351
Performing artists 176,463 42,724 24% 38,174 4,550 Actors 63,033 10,992 17% 9,754 1,238 Producers and directors 76,125 24,995 33% 21,683 3,312 Dancers & choreographers 37,305 6,737 18% 6,737 0 Dancers 19,992 3,854 19% 3,854 0 Choreographers 17,313 2,883 17% 2,883 0
Musicians, singers and related 215,425 83,121 39% 56,770 26,351 Music directors & composers 54,271 21,354 39% 14,584 6,770 Musicians & singers 161,154 61,767 38% 42,186 19,581
Writers & authors 138,980 94,377 68% 80,509 13,868
Total, arts occupations 838,122 375,381 45% 304,562 70,819
Designers 531,921 168,806 32% 132,827 35,979 Commercial & industrial designers 51,823 16,088 31% 12,659 3,429 Fashion designers 14,844 4,353 29% 3,425 928 Floral designers 103,993 33,832 33% 26,621 7,211 Graphic designers 211,871 67,422 32% 53,052 14,370 Interior designers 60,050 19,325 32% 15,206 4,119 Merchandise displayers, window trimm 77,221 23,881 31% 18,791 5,090 Set and exhibit designers 12,119 3,905 32% 3,073 832
Architects 136,378 29,678 22% 23,809 5,869 Architects, ex. landscape and naval 113,243 24,253 21% 19,457 4,796 Landscape architects 23,135 5,425 23% 4,352 1,073
Total, all artistic occupations 1,506,421 573,865 38% 461,198 112,667
Total, all occupations 144,013,600 11,451,600 8% 9,926,000 1,525,600Source: Bureau of Labor Statistics, National Industry-Occupation Employment Matrixhttp://www.bls.gov/emp/empoils.htm
T-8
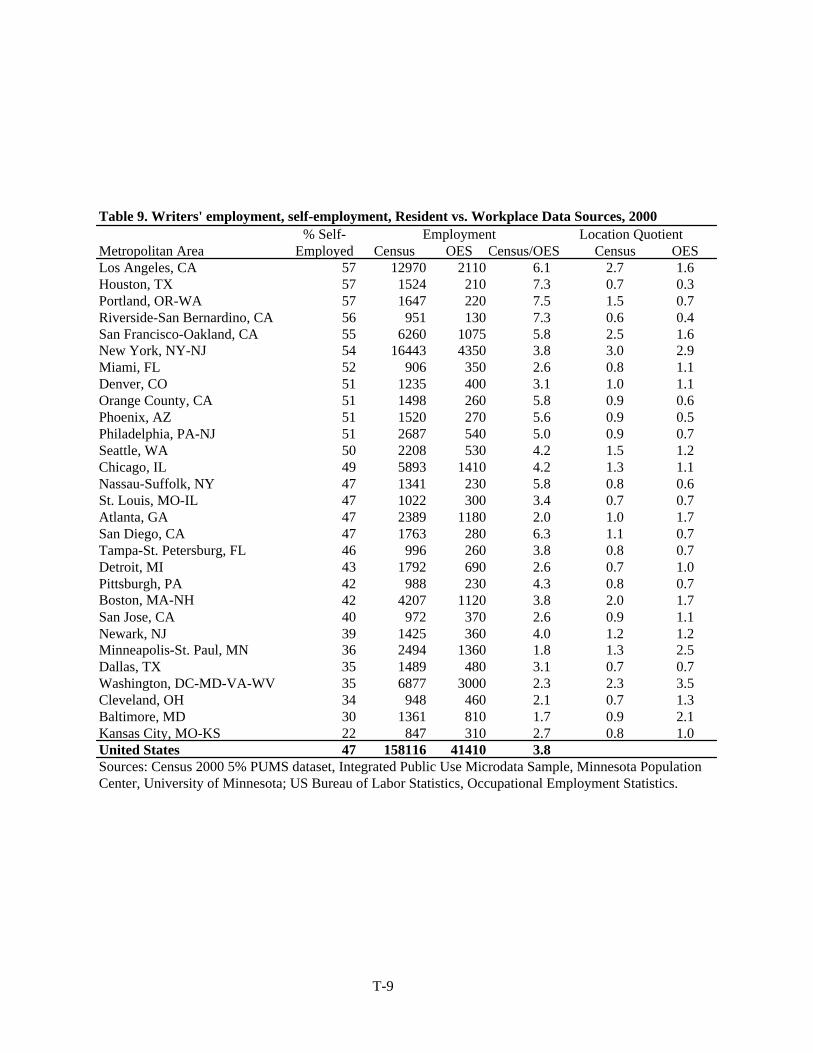
Table 9. Writers' employment, self-employment, Resident vs. Workplace Data Sources, 2000% Self- Employment Location Quotient
Metropolitan Area Employed Census OES
Census/OES Census OESLos Angeles, CA 57 12970 2110 6.1 2.7 1.6Houston, TX 57 1524 210 7.3 0.7 0.3Portland, OR-WA 57 1647 220 7.5 1.5 0.7Riverside-San Bernardino, CA 56 951 130 7.3 0.6 0.4San Francisco-Oakland, CA 55 6260 1075 5.8 2.5 1.6New York, NY-NJ 54 16443 4350 3.8 3.0 2.9Miami, FL 52 906 350 2.6 0.8 1.1Denver, CO 51 1235 400 3.1 1.0 1.1Orange County, CA 51 1498 260 5.8 0.9 0.6Phoenix, AZ 51 1520 270 5.6 0.9 0.5Philadelphia, PA-NJ 51 2687 540 5.0 0.9 0.7Seattle, WA 50 2208 530 4.2 1.5 1.2Chicago, IL 49 5893 1410 4.2 1.3 1.1Nassau-Suffolk, NY 47 1341 230 5.8 0.8 0.6St. Louis, MO-IL 47 1022 300 3.4 0.7 0.7Atlanta, GA 47 2389 1180 2.0 1.0 1.7San Diego, CA 47 1763 280 6.3 1.1 0.7Tampa-St. Petersburg, FL 46 996 260 3.8 0.8 0.7Detroit, MI 43 1792 690 2.6 0.7 1.0Pittsburgh, PA 42 988 230 4.3 0.8 0.7Boston, MA-NH 42 4207 1120 3.8 2.0 1.7San Jose, CA 40 972 370 2.6 0.9 1.1Newark, NJ 39 1425 360 4.0 1.2 1.2Minneapolis-St. Paul, MN 36 2494 1360 1.8 1.3 2.5Dallas, TX 35 1489 480 3.1 0.7 0.7Washington, DC-MD-VA-WV 35 6877 3000 2.3 2.3 3.5Cleveland, OH 34 948 460 2.1 0.7 1.3Baltimore, MD 30 1361 810 1.7 0.9 2.1Kansas City, MO-KS 22 847 310 2.7 0.8 1.0United States 47 158116 41410 3.8 Sources: Census 2000 5% PUMS dataset, Integrated Public Use Microdata Sample, Minnesota Population Center, University of Minnesota; US Bureau of Labor Statistics, Occupational Employment Statistics.
T-9
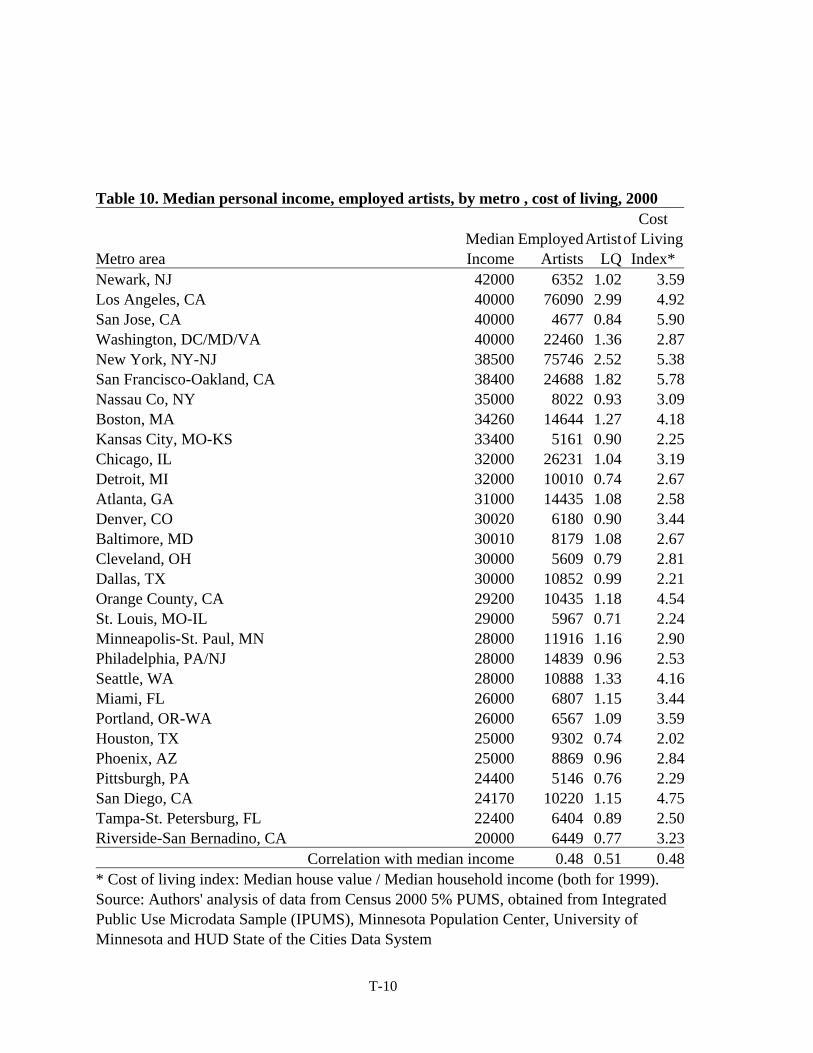
T-10
artists, by metro , cost of living, 2000 Cost
Table 10. Median personal income, employed Median EmployedArtistof LivingMetro area Income Artists LQ Index* Newark, NJ 42000 6352 1.02 3.59Los Angeles, CA 40000 76090 2.99 4.92San Jose, CA 40000 4677 0.84 5.90Washington, DC/MD/VA 40000 22460 1.36 2.87New York, NY-NJ San Francisco-Oakland, CA Nassau Co, NY Boston, MA Kansas City, MO-KS Chicago, IL Detroit, MI Atlanta, GA Denver, CO Baltimore, MD Cleveland, OH Dallas, TX Orange County, CA St. Louis, MO-IL Minneapolis-St. Paul, MN Philadelphia, PA/NJ Seattle, WA Miami, FL Portland, OR-WA Houston, TX Phoenix, AZ Pittsburgh, PA San Diego, CA Tampa-St. Petersburg, F
an Bernadino, CA 20000 6449 0.77 3.23Correlation with median income 0.48 0.51 0.48
38500 75746 2.52 5.3838400 24688 1.82 5.7835000 8022 0.93 3.0934260 14644 1.27 4.1833400 5161 0.90 2.2532000 26231 1.04 3.1932000 10010 0.74 2.6731000 14435 1.08 2.5830020 6180 0.90 3.4430010 8179 1.08 2.6730000 5609 0.79 2.8130000 10852 0.99 2.2129200 10435 1.18 4.5429000 5967 0.71 2.2428000 11916 1.16 2.9028000 14839 0.96 2.5328000 10888 1.33 4.1626000 6807 1.15 3.4426000 6567 1.09 3.5925000 9302 0.74 2.0225000 8869 0.96 2.8424400 5146 0.76 2.2924170 10220 1.15 4.75
L 22400 6404 0.89 2.50Riverside-S * Cost of living index: Median house value / Median household income (both for 1999). Source: Authors' analysis of data from Census 2000 5% PUMS, obtained from Integrated
ample (IPUMS), Minnesota Population Center, University of te of the Cities Data System
Public Use Microdata SMinnesota and HUD Sta
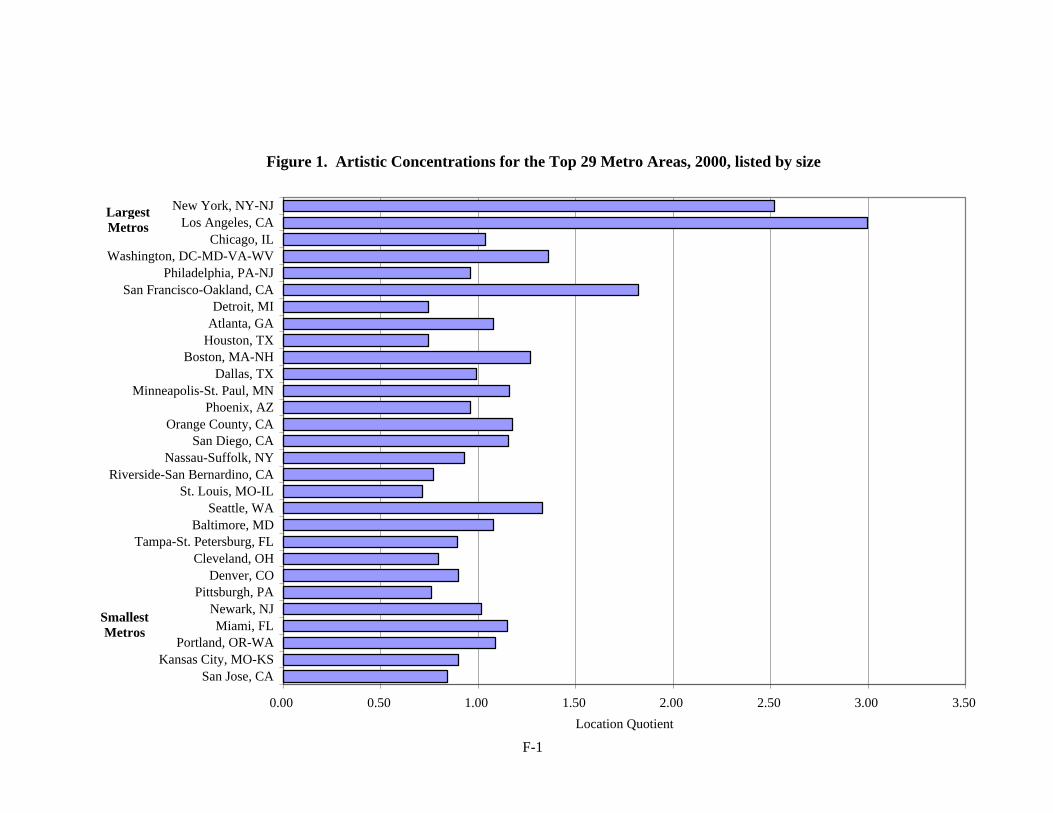
F
Y-NJ
igure 1. Artistic Concentrations for the Top 29 Metro Areas, 2000, listed size
0.00 0.50 1.00 1.50 2.00 2.50 3.00 3.50
Kansas City, MO-KSPortland, OR-WA
Tampa-St. Petersburg, FL
rside-San Bernardino, CANassau-Suffolk, NY
San Diego, CAOrange County, CA
Phoenix, AZMinneapolis-St. Paul, MN
Dallas, TXBoston, MA-NH
Houston, TXAtlanta, GADetroit, MI
San Francisco-Oakland, CAPhiladelphia, PA-NJ
Washington, DC-MD-VA-WVChicago, IL
Los Angeles, CA York, N
Location Quotient
Lar
by
San Jose, CA
Miami, FLarkNew , NJ
Pittsburgh, PAver,nd,
Denvela
COOHCle
Baltimore, MDtle, MO
S Lo
eatuis,
WA-ILSt.
Rive
NewgesttrosMe
SmallMetros
est
F-1

F-2
Figure 2. Artistic Sub-Specializations, Selected Metros, 2000
0.00
0.50
1.00
1.50
2.00
2.50
Washington, DC-MD-VA-WV
Boston, MA-NH Seattle, WA Minneapolis-St.Paul, MN-WI
San Diego, CA Orange County,CA
Loca
tion
Quo
tient
Miami, FL
Authors Performing Artists Visual Artists