the ohio lottery commission
TRANSCRIPT
The Ohio Lottery CommissionAn Enterprise Fund of the State of Ohio
Comprehensive Annual Financial Report for the Fiscal Year Ended June 30, 2019

Comprehensive Annual Financial Report FY 2019 1
The Ohio Lottery CommissionAn Enterprise Fund of the State of Ohio
Comprehensive Annual Financial ReportFor the Fiscal Year Ended June 30, 2019
Prepared by the Ohio Lottery Office of Finance
Mike DeWine, GovernorPat McDonald, Executive Director
Sean A. Whalen, Commission ChairpersonGregory A. Bowers, Finance Director

2 The Ohio Lottery
Comprehensive Annual Financial Report FY 2019 3
TABLE OF CONTENTS
INTRODUCTORY SECTION
Letter of TransmittalProfile of the Ohio Lottery ..............................................................................................................................................6Economic Outlook ..........................................................................................................................................................6Lottery Products .............................................................................................................................................................7Major Initiatives ...............................................................................................................................................................9Accounting Systems and Policies ............................................................................................................................... 10Budgetary Control ....................................................................................................................................................... 10Internal Control Environment...................................................................................................................................... 10Financial Information ................................................................................................................................................... 11GFOA Certificate of Achievement ............................................................................................................................... 11Independent Audit ....................................................................................................................................................... 11Acknowledgments ....................................................................................................................................................... 11
FINANCIAL SECTION
Independent AuditIndependent Auditor’s Report..................................................................................................................................... 18
Management’s Discussion and AnalysisFinancial Highlights ..................................................................................................................................................... 21Overview of the Financial Statements ........................................................................................................................ 21Lottery Operating Fund ............................................................................................................................................... 21Annuity Prize Fund ....................................................................................................................................................... 21Financial Analysis ......................................................................................................................................................... 22Operating Analysis ....................................................................................................................................................... 25Capital Assets and Debt Administration .................................................................................................................... 27Contacting the Ohio Lottery’s Financial Management .............................................................................................. 27
Financial StatementsStatement of Net Position - Major Funds ................................................................................................................... 28Statement of Revenues, Expenses, and Changes in Fund Net Position - Major Funds ........................................... 30Statement of Cash Flows - Major Funds .................................................................................................................... 31
Notes to the Basic Financial StatementsSummary of Significant Accounting Policies ............................................................................................................. 32Cash Deposits and Investments ................................................................................................................................. 36Capital Assets .............................................................................................................................................................. 38Prize Awards Payable ................................................................................................................................................... 39Other Liabilities ............................................................................................................................................................ 39Noncurrent Liabilities .................................................................................................................................................. 40Pension-Ohio Public Employees Retirement System (Opers)/Net Pension Liability/Asset ................................... 40Other Post Employment Benefits ............................................................................................................................... 44Net OPEB Liability ........................................................................................................................................................ 44Interfund Transactions and Balances ......................................................................................................................... 48Litigation ....................................................................................................................................................................... 48
Required Supplementary InformationSchedule of the Proportionate Share of the Net Pension Liability ............................................................................ 49Schedule of Ohio Lottery Contributions ..................................................................................................................... 49Schedule of Proportionate Share of the Net OPEB Liability ..................................................................................... 50Schedule of Ohio Lottery Contributions ..................................................................................................................... 50
STATISTICAL SECTIONIntroduction .................................................................................................................................................................. 54Ohio Lottery Statistics ................................................................................................................................................. 55Transfers to Education ................................................................................................................................................. 60Video Lottery Terminal (VLT) Statistics ...................................................................................................................... 61Demographic and Economic Information .................................................................................................................. 62

4 The Ohio Lottery
• INTRODUCTORY SECTION •
WINNERS ARE EVERYWHEREIt’s that simple. People play. People win. Schools bene� t. Celebrating our 45th anniversary in Fiscal Year 2019, the Ohio Lottery enjoyed a record-breaking year, generating $3.4 billion in traditional lottery sales. More than $2.1 billion of that went back to our players as prizes. No matter the size of the prize, you can’t deny the joy on these players’ faces when they realize they’re winners.

Comprehensive Annual Financial Report FY 2019 5
6 The Ohio Lottery
OCTOBER 01, 2019
TO THE GOVERNOR OF THE STATE OF OHIOThe Ohio Lottery Commissioners, andThe Citizens of Ohio:We are pleased to submit to you this Comprehensive Annual Financial Report (CAFR) of the Ohio Lottery Commission (the Ohio Lottery) for the fiscal year ended June 30, 2019. The Office of Finance of the Ohio Lottery has prepared this report in accordance with Generally Accepted Accounting Principles (GAAP). Lottery management assumes the responsibility for the accuracy and completeness of this report. To the best of our knowledge, the information presented is accurate in all material respects and is reported in a manner designed to present fairly the financial position, the results of operations, and the cash flows of the Lottery. All disclosures necessary to gain an understanding of the Ohio Lottery financial activities have been included. The Independent Auditor’s Report is included on pages 18-20 of this report. The Ohio Lottery, an agency of the State of Ohio (the State), was launched in 1974 and is operated as a business enterprise within the framework of the State’s laws and regulations. The Ohio Lottery’s mission is to offer entertaining games that maximize profits for K-12 public education.
The Ohio Lottery is an enterprise of the State and is included in the State’s CAFR. The Ohio Lottery’s activity is reported as an enterprise fund type and includes all activity for which the Ohio Lottery is financially accountable. No data related to any other State agency or fund is included.
PROFILE OF THE OHIO LOTTERYThe Ohio Lottery Commission was approved in May 1973 through a constitutional amendment approved by voters by a 2-to-1 margin. The first ticket went on sale in August 1974. Throughout the 1980’s the Lottery launched a number of draw games which still exist today, such as Pick 3 and Pick 4. The 1990’s were a strong decade for scratch-off games, with $2, $5 and $10 price points launched during the decade. The first $20 instant ticket was launched in 2003, and the Lottery later added a $30 price point in 2014. Encouraged by the ongoing success of its in-state lotto games, the Ohio Lottery formally joined the Mega Millions consortium in fiscal year 2002 and entered into an agreement to sell Powerball beginning in fiscal year 2010. In the last decade, the Lottery has begun an aggressive strategy of modernizing its game portfolio to better match player demand, launching EZPlay in 2008 and Keno in fiscal year 2009, in addition to recent new fast play draw options. Today, the Ohio Lottery Commission offers customers a wide variety of draw-based and scratch off games, with new convenient payment options, at nearly 10,000 licensed retailer locations across the state.
In 1983, the Ohio Legislature earmarked Lottery profits to education, which was made permanent via a constitutional amendment in 1987. Altogether, the Lottery has provided $25.6 billion to public education. Video Lottery gaming was introduced in Ohio when the Governor signed Executive Order 2011-22K, which authorized the Ohio Lottery to amend and adopt rules necessary to implement a video lottery program at Ohio’s seven (7) horse racing facilities. The Lottery’s role is to regulate the program with the goal of generating revenue for the State of Ohio while maintaining integrity and transparency. Last year, Video Lottery (VLT) revenue contributed roughly 30 percent of all Lottery profits.
As of June 30, 2019, 44 states, plus the District of Columbia, the U.S. Virgin Islands and Puerto Rico operate lotteries using computer-based draw games and instant “scratch off” games. The Ohio Lottery routinely ranks in the top ten of all US lotteries in terms of its sales and profits.
ECONOMIC OUTLOOKAccording to the Bureau of Economic Analysis (BEA), personal income in the United States increased 0.8 percent in the first quarter of federal fiscal year 2019. The report indicates that personal income grew in 49 states and the District of Columbia. BEA targeted a number of factors behind the increase in personal income, which include increases in earnings, and transfer receipts. Of the industries tracked by the BEA, the largest percentage of earnings increases were in health care and social assistance; professional, scientific, and technical services; and state and local government. All told, twenty of the twenty-four industries tracked saw earnings growth.
The US unemployment rate for June 2019 was 3.7 percent, which is 0.3 percent less than the previous year. In comparison to June 2018, the three main industries where employment growth increased were professional and business services, healthcare, and transportation and warehousing.
Ohio began the first quarter of fiscal year 2019 with a 0.9 percent increase in personal income over the previous quarter. Ohio ranked 30th among states for change of income between the quarters. Throughout fiscal year 2019, the unemployment figures in Ohio have decreased, from 4.5 percent in June of 2018 to 4.0 percent as of June 2019. Ohio’s unemployment rate currently sits at 0.3 percent higher than the national rate.
Many factors in the national and state economies have a direct impact on revenue generation at the Ohio Lottery. As smaller retail outlets close, national big box retailers and bulk consumer product warehouse clubs open in their place. The Ohio Lottery’s revenues may be negatively impacted by this national and statewide trend because these retailers do not consider lottery products to be part of their business model, though the Lottery continues to make inroads into these markets.
THE OHIO LOTTERY COMMISSION 615 WEST SUPERIOR AVENUE CLEVELAND, OHIO 44113-1879 1-800-686-4208
Comprehensive Annual Financial Report FY 2019 7
Fiscal year 2019 was the fourth consecutive year of profits exceeding $1 billion dollars. Recent revenue increases are primarily the result of the $1.6 billion jackpot for Mega Millions in October 2018, ongoing success of KENO, and the continuing strong performances from seven VLT facilities. Additionally, as consumers scale back on discretionary spending, Ohio Lottery games offer an affordable entertainment alternative.
LOTTERY PRODUCTSThe Ohio Lottery provides the opportunity for the public to participate in different games with two styles of play, draw-based games and scratch off games. Descriptions of the games and their portion of sales are as follows:
DRAW - BASED GAMES allow the customer to pick the numbers for their wager or utilize automatic computer-generated plays. Players receive a ticket with the numbers selected and must wait for a drawing to determine if they have matched the numbers and won.
Pick 3 was Ohio’s first draw based game. Players select a three-digit number from 000 to 999 and can play the numbers straight (numbers in exact order), boxed (numbers in any order) or as backup bets (players can win either or both ways). A wheel wager can also be placed. This wager is, in essence, equivalent to a straight bet being made for each number combination. Pick 3 sales for fiscal year 2019 were $354.0 million, or 10.5 percent of total Ohio Lottery sales.
Pick 4 is played similarly to Pick 3. Players select a four-digit number from 0000 to 9999 and may play it straight, boxed or in back-up bets. Sales for fiscal year 2019 were $216.9 million, or 6.5 percent of total Ohio Lottery sales.
Pick 5 began in August 2012 and is played similarly to Pick 3 and Pick 4. Players select a five-digit number from 00000 to 99999 and may play it straight, boxed or in back-up bets. Sales for fiscal year 2019 were $44.5 million, or 1.3 percent of total Ohio Lottery sales. Pick 3, Pick 4 and Pick 5 are drawn middays and evenings Sunday through Saturday.¬
Rolling Cash 5 is a lotto game in which players select five numbers from a pool of 1 to 39, with overall odds of winning any prize of 1 in 9. The top prize starts at $100,000 and increases if not won. Sales for fiscal year 2019 were $52.0 million, or 1.6 percent of total Ohio Lottery sales. Drawings are held Sunday through Saturday evenings.
Classic Lotto is an in-state lotto game in which players select six numbers from a pool of 1 to 49. To win the jackpot, all six numbers must be matched. The jackpot starts at $1.0 million and increases if not won. Drawings are held on Monday, Wednesday, and Saturday evenings. Classic Lotto sales for fiscal year 2019 were $27.5 million, or 0.8 percent of total Ohio Lottery sales.
Kicker is an add-on game, with a top prize of $100,000, which may only be purchased along with Classic Lotto. KICKER was reinstated in April 2012. Sales for fiscal year 2019 were $3.9 million, or 0.1 percent of total Ohio Lottery sales.
EZPlay is a hybrid instant/draw game. EZPLAY combines the instant win experience with an online game component. The player purchases an online ticket that consists of two sections, a draw section followed by a play section. Players then match the two sections to determine if they are a winner. Game themes and ticket selling prices modify easily to keep the product line fresh. In fiscal year 2013, a progressive jackpot component was added to the game portfolio, which now comprises roughly 83 percent of EZPLAY sales. Sales for fiscal year 2019 were $100.3 million, or 3.0 percent of total Ohio Lottery sales.
8 The Ohio Lottery
EZPlay TAP is a series of EZPLAY® Games that include graphical touch-screen style play and is played exclusively on Multi-Purpose Next Generation (MPNG) machines. This was an exclusive, legal gaming option offered by the Ohio Lottery for Veteran and Fraternal Organizations. In October 2014, 670 units were deployed at various fraternal and veteran organizations throughout the State. Several different games are loaded into each machine with play prices starting at twenty-five cents. These games are normally structured to generate an 85-90 percent payout. Sales for fiscal year 2019 were $40.8 million, or 1.2 percent of total Ohio Lottery sales.
EZPlay Touch & Win are a style of EZPLAY games that are based on the traditional KENO game. It was originally introduced as QuicKeno in June 2016, and rebranded and renamed in January 2018 to generate more attention. Touch & Win games, which start at $0.25, are highly interactive, visually entertaining, and played on a Touch & Win terminal. Sales for fiscal year 2019 were $30.4 million, which came to 0.9 percent of total Ohio Lottery sales.
KENO is a draw game in which players choose from one to 10 numbers (also called spots) for a top prize of $100,000 by matching 10 of 20 numbers drawn. The drawings are held every day starting at 6:04 a.m. and occur every four minutes, ending at 2:28 a.m. The Ohio Lottery introduced Booster in February 2010.
Players may select the Booster option for a chance to increase their winnings at the cost of $1 for each dollar wagered on KENO. The Booster number drawn can be 1, 2, 3, 4, 5, or 10 and can increase winnings 2, 3, 4, 5, or 10 times. Combined KENO/Booster sales for fiscal year 2019 were $453.9 million, or 13.5 percent of total Ohio Lottery sales.
The Lucky One is a monitor game that complements Keno, with drawings held every four minutes. Wagers range between $1 and $50. Players choose one number between 1 and 36 and have up to three different ways to play. Sales for fiscal year 2019 were $16.9 million, or 0.5 percent of total Ohio Lottery sales.
Mega Millions is a multi-state lotto game. To become more competitive, Mega Millions adjusted their pools and jackpot amount on October 28, 2017. For each $2 wager, players select five numbers from a pool of 1 to 70 and select one Mega ball number from a second pool of 1 to 25. To win the jackpot, all six numbers must match. The jackpot starts at $40.0 million and increases a minimum of $5.0 million if not won.
Megaplier was added to Mega Millions in January 2011. Players may select the Megaplier option for a chance to increase their winnings at the cost of $1 for each dollar wagered on Mega Millions. The Megaplier number drawn can be 2, 3, 4 or 5, and can increase winnings by that Megaplier number drawn. Megaplier multiplies the winnings by the number drawn for prizes up to $5,000. If a player selects the Megaplier option and then matches all five numbers but not the Mega ball, the prize is automatically $1.0 million. Drawings are held on Tuesday and Friday evenings. Mega Millions/Megaplier sales for fiscal year 2019 were $192.7 million, or 5.7 percent of total Ohio Lottery sales.
POWERBALL is a multi-state, lotto game launched in Ohio in April 2010. For each $2 wager, players select five numbers from a pool of 1 to 69 and select one Powerball number from a second pool of 1 to 26. To win the jackpot, all six numbers must match. The jackpot starts at $40.0 million and increases if not won. Drawings are held on Wednesday and Saturday evenings.
Players may select the Power Play feature that allows a winner to increase the original prize amount for an additional $1 wager. Powerball players winning any prize other than the jackpot will win a larger cash prize. Combined Powerball/Power Play sales for fiscal year 2019 were $143.3 million or 4.3 percent of total Ohio Lottery sales.
Comprehensive Annual Financial Report FY 2019 9
Lucky For Life is a small-scale multi-state game that was introduced in Ohio in November 2015. Wagers cost $2 and drawings are held on Mondays and Thursdays. The Top Prize is $1,000 a day for life and the Second Prize is $25,000 a year for life. The top prize and second prize payouts are divided equally among multiple winners. Sales for fiscal year 2019 were $20.4 million, or 0.6 percent of total Ohio Lottery sales.
SCRATCH OFFS are played by scratching the latex covering off a play area to reveal pre-printed combinations. There are different ways to win in a “scratch off” game, such as matching three like dollar amounts, symbols, or letters. If the correct combinations appear, the player becomes an “instant winner” and may immediately submit a claim to cash the ticket. Scratch off games have been the Ohio Lottery’s dominant product since fiscal year 1997. For fiscal year 2019, scratch off game sales were $1.66 billion or 49.5 percent of total traditional ticket sales. The Ohio Lottery has successfully sold scratch off games at the $1, $2, $3, $5, $10, $20 and $30
price points. The Ohio Lottery continues to feature several “spotlight” scratch off games, which are games sold at $10 and $20 price points with attractive, higher prize payouts. To keep things interesting, the Ohio Lottery introduced several varieties of scratch off games this year including the first ever Pop N Pak game that gave players 55 chances to win and a chance to win up to $500,000. This is one of the $10 games that helped the Lottery achieve double digit growth in the $10 price point category. The Lottery also released the Decade of Dollars family of games at $1, $2, $5, and $10 price points. Sales for these games was part of the reason the scratch off realized record breaking sales for the fiscal year and the success of these games will help the Lottery to produce and sell future family of games.
VIDEO LOTTERY was introduced to the State of Ohio in 2012 when Governor Kasich signed Executive Order 2011-22K, which authorized the Lottery to amend and adopt rules necessary to implement a video lottery program at Ohio’s seven (7) horse racing facilities. On June 1, 2012, Scioto Downs in Columbus began video gaming with 1,787 video lottery terminals; as of June 30, 2019, there were 11,663 terminals at seven different racetracks in Ohio. A Video Lottery Terminal (VLT) is a stand-alone device containing a random-number generator. Each VLT connects to a centralized computer system that allows the Lottery to monitor game play and collect revenue activity. The Central Monitoring System (CMS) keeps track of money deposited in a terminal, usage, wins and payouts, machine maintenance and cash removal. Game themes are approved by the Ohio Lottery Commissioners, and independently tested and certified, before placed into operation. The minimum percentage payout in Ohio is 85.0 percent. The VLT total revenue for fiscal year 2019 was $1,058.6 million, with the Ohio Lottery receiving $354.6 million as commissions earned.
MAJOR INITIATIVESDuring fiscal year 2019, the Ohio Lottery transferred $1,153.9 million to the LPEF. This was an increase of $66.2 million compared to fiscal year 2018, and the highest profit transfer recorded in the Ohio Lottery’s 45-year history. Fiscal year 2018 included only eleven (11) transfers from VLT profits due to a change in an OBM Accounting rule. Through fiscal year 2019, the Ohio Lottery has provided over $25.6 billion in profits to the State of Ohio.
Additionally, the Ohio Lottery made several noteworthy achievements during fiscal year 2019:
• In fiscal year 2019, net revenue generated from VLTs were $1,058.6 million, the first year that net revenue surpassed the $1.0 billion mark. This was $71.3 million more than the prior fiscal year. Of this amount, the video lottery operators received $700.5 million as commissions earned, while the Lottery’s share of revenue equaled $354.6 million. Funds dedicated towards Problem Gambling programs were $3.5 million.
• October 2018 was a very exciting month for Ohio Lottery customers. A Mega Millions jackpot soared to $1.537 billion for the October 23rd draw. While the jackpot was not won in Ohio, an Ohio Lottery retailer in Kettering, Ohio sold a $1 million winning ticket. Ohio lottery customers held more than 530,000 winning Mega Millions tickets for the draw, sharing $12.6 million in prizes. Retailers earned an estimated $5.1 million in commissions during the jackpot sequence which began on July 27th and continued with the October 23rd jackpot. In addition, the Powerball jackpot reached $687 million in October 2018.
• On August 1st, the Ohio Lottery celebrated Keno’s 10th Anniversary with special promotions for both players and retailers, which ran the entire month. A decade ago, KENO got its big start here in Ohio. Bars and taverns across the state were excited to launch this social game in their establishments, and ten years later KENO is going strong and available at most Ohio Lottery retailers!
• As part of our strategy to reach new consumers and adapt our business model to the changing landscape of how consumers purchase goods and services, the Lottery introduced a cashless solution on all vending units. The Lottery retrofitted all self-service equipment with credit/debit card readers to allow customers to purchase games without cash. The card readers accept Visa, Mastercard, Discover and eWallet transactions. Customers are limited to spending $100 per day per card. Fiscal year 2019 represented the first full year for the program and it generated nearly $98 million in sales.
• In the Fall of fiscal year 2019, the Ohio Lottery ceased its partnership with banks to process winning claims between $600 and $5,000. The Lottery implemented an alternative cashing program at our nine regional offices by issuing pre-paid debit cards. In addition to finding new venues for cashing winning tickets, the Ohio Lottery will continue to partner with its seven racinos throughout the state. Not only do racino’s give players alternative locations to cash their lottery prizes, but they are conveniently open 24 hours a day – 7 days a week. Looking forward to fiscal year 2020, the Lottery expects to capitalize on its efforts to digitize its offerings by also allowing players to cash winning tickets via the Lottery’s mobile application.
10 The Ohio Lottery
• In September 2018, the Ohio Lottery introduced state-of-the-art Photon point-of-sale terminals. These new terminals offer better display screens, two ticket scanners, ticket-tracking ability, and the ability to accept both cash and debit/credit transactions. The Photon highlights include a “Quick Pick” button available on the main online game screen or from within the individual game screen, the ability to access any of the numbers games (Pick 3, Pick 4, or Pick 5) from within any of the numbers games screens, a shopping cart that lists all wagers requested and provides a running total of requested wagers and cost. Furthermore, the shopping cart helps to ensure tickets are correct before the transaction is complete. Finally, Photons offer a more robust instant ticket reporting solution.
• The Ohio Lottery’s mission is to offer entertaining games that maximize profits for K-12 public education, with the vision to create a fun and innovative gaming experience. In fiscal year 2020, the Ohio Lottery will be pursuing the introduction of an iLottery program, where consumers can purchase lottery games on-line. An iLottery RFP was issued in Fiscal Year 2020, and the Lottery expects the program to be launched by fiscal year 2021.
• The Lottery encourages players to enjoy Ohio Lottery games responsibly. The Lottery has demonstrated its historical commitment to responsible gambling by providing mandatory training for all Lottery employees, retailers and Video Lottery Terminal employees. On its own and in conjunction with its Ohio for Responsible Gambling (ORG) partners - the Ohio Casino Control Commission, the Ohio State Racing Commission and the Ohio Department of Addiction Services - the Lottery produces media campaigns that promote methods of practicing responsible gambling and highlight prevention of problem gambling. Based on the findings by the Ohio Problem Gambling Prevalence Studies, a small percentage of Ohioans are at risk for developing life altering gambling problems. In fiscal year 2019, Ohio for Responsible Gambling continued with their successful campaign “Get Set Before You Bet”, which target select groups, such as seniors, athletes, teenagers, and Spanish-speaking adults. In fiscal year 2019, the Ohio Lottery contributed $3.2 million from VLT sales for Problem Gambling in Ohio.
• Additionally, the Lottery funds regional outpatient treatment programs, training for problem gambling counselors and a statewide annual conference which presents cutting edge research and treatment tools to the problem gambling community to better address the issues impacting our citizens.
• The Ohio Lottery, in partnership with the Ohio Casino Control Commission, launched Ohio’s first statewide Voluntary Exclusion Program (VEP) in March 2019. The program allows individuals to voluntarily bar themselves from every gambling establishment in Ohio regulated by either the Ohio Lottery or the Ohio Casino Control Commission. An individual may choose to ban themselves for one year, five years, or for life.
• Along with offering fair and equitable games, the Ohio Lottery continues its commitment to the community to enhance and expand its various sponsorship programs, such as Partners in Education, MBE/EDGE Programs, and Community Outreach. Moreover, to appeal to a more diverse player and retailer base, the Ohio Lottery plans to implement various social media opportunities. Players and retailers can access the Ohio Lottery via Twitter, Facebook, Instagram, YouTube, WordPress, and both the Ohio Lottery website and app. Going forward, into fiscal year 2020, the Ohio Lottery will continue to develop new ways to enhance its current product offerings and maximize operational efficiency and effectiveness. The Lottery benchmarks Ohio’s sales results against peer lottery states and review best practices to improve Ohio’s current lottery products.
ACCOUNTING SYSTEMS AND POLICIESThe Ohio Lottery operates under two enterprise funds, each using the full accrual basis of accounting. Under this basis, revenues are recognized when earned and expenses are recognized when incurred. The two Ohio Lottery funds are the Lottery Operating Fund and the Annuity Prize Fund.
The Ohio Lottery’s operations are accounted for on a flow of economic resources measurement focus. With this measurement focus, all assets and deferred outflows of resources, liabilities and deferred inflows of resources associated with the operations of the Ohio Lottery are included in the statements of net position. Operating statements present increases (e.g. revenues) and decreases (e.g. expenses) in total net position. A narrative overview and analysis of the Ohio Lottery’s financial activities for the fiscal year ended June 30, 2019 is in the Management’s Discussion and Analysis in the financial section of this document.
BUDGETARY CONTROLBudgetary control for all state agencies is maintained through legislative appropriations and the executive branch allotment. The budget includes all costs to operate the Ohio Lottery with the exception of certain prizes paid to winners and all commissions paid to retailers. Various prize tiers and commissions are funded through the sale of lottery tickets and are not included as part of the biennial budget submitted for approval. An encumbrance system is utilized, whereby purchase orders reserve portions of applicable appropriations. The Ohio Lottery and the State of Ohio Office of Budget and Management monitor the appropriations and the amounts expended within the Ohio Lottery’s funds. The adopted budget is divided among the operating offices at the Ohio Lottery, which have responsibility for delivery of service. These offices control the funds within their program. The Office of Finance monitors all accounts via the Ohio Administrative Knowledge System and its accounting reporting system, Solomon. Additionally, the Ohio Lottery prepares periodic revisions to project revenue and expenditure trends and implements any changes necessary to keep both within appropriation and within internal management targets set by the Director.
INTERNAL CONTROL ENVIRONMENTManagement of the Ohio Lottery is responsible for establishing and maintaining internal controls designed to ensure that assets are protected from loss, theft, or misuse, and to ensure that the accounting system allows for compilation of accurate and timely financial information. Financial information is reported at monthly public meetings of the Ohio Lottery Commission. Because the cost of a control should not exceed their benefits to be derived, the objective is to provide reasonable, rather than absolute assurance, that the financial statements are free of any material misstatements.
Comprehensive Annual Financial Report FY 2019 11
To enhance controls over accounting procedures, the Ohio Lottery has segregated the following functions: personnel and payroll; purchasing; accounts payable; general ledger; and accounts receivable processing. Additionally, a Contract Compliance Officer monitors the execution of all large vendor contracts. Data input and processing is separate from system programming. An Information Security Manager monitors and audits automated systems. An Electronic Data Processing Audit Plan is executed annually to further improve internal controls. An internal audit team reviews all areas of operations and reports to the Director. The Office of Internal Audit prepares an annual internal audit plan and formally submits the plan to the Office of Budget and Management for approval. Results of these internal audits are submitted to the Auditor of State for review and consideration in its financial audit.
Since the Ohio Lottery manages a valuable ticket inventory and controls the disbursement of prizes, the following steps are taken to ensure that operations remain honest and secure:
• Maintain secure Ohio Lottery facilities with limited access.• Perform background checks on retailers, key employees at Racino’s, contractors and Ohio Lottery employees.• Print lottery tickets with special paper, inks, dyes and security codes.• Establish and execute detailed procedures for all game drawings.• Contract with the Auditor of State as an independent witness to further ensure the integrity of our drawings and the television
game show.• Provide a variety of access and other controls in our computer systems.
FINANCIAL INFORMATIONThe Ohio Lottery operates as an enterprise activity, selling lottery tickets to the general public and funding all related support activities from funds internally generated. No general government functions or fiduciary operations are managed by the Ohio Lottery or included in this report.
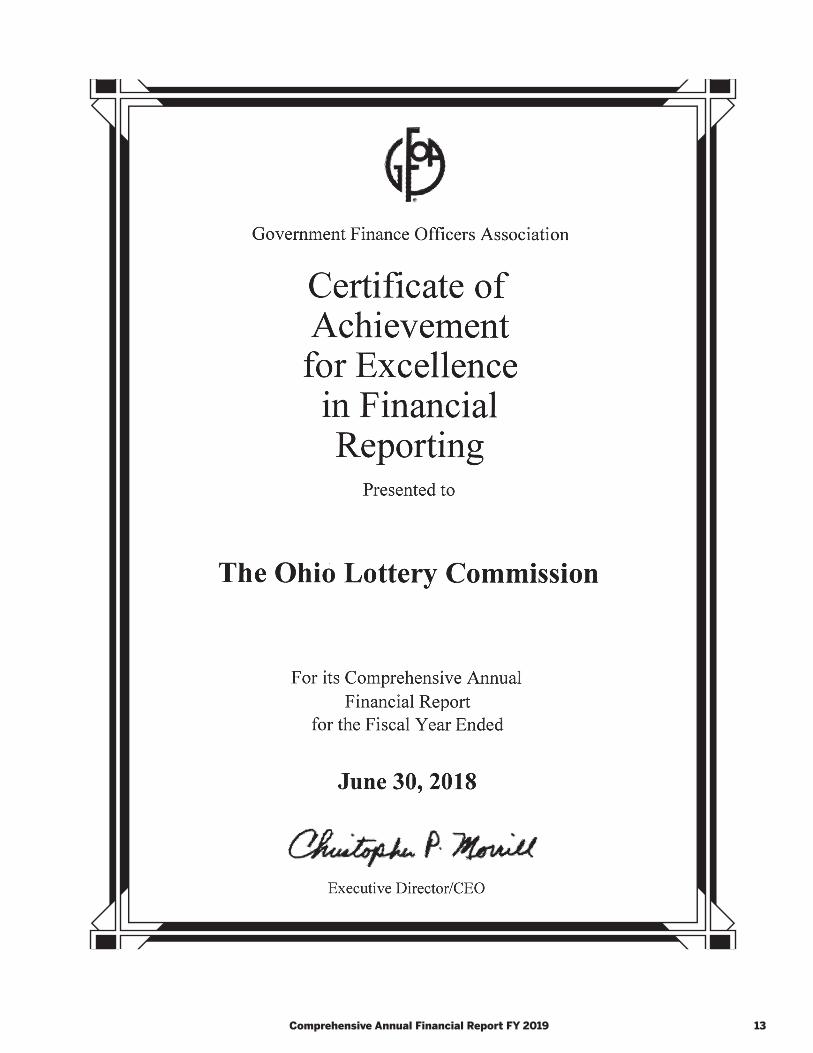
GFOA CERTIFICATE OF ACHIEVEMENTThe Government Finance Officers Association (GFOA) awarded a Certificate of Achievement for Excellence in Financial Reporting to the Ohio Lottery for its CAFR for the fiscal year ended June 30, 2018. This was the twenty-second consecutive year that the Ohio Lottery has received this prestigious award. To qualify for the Certificate of Achievement Award, the Ohio Lottery published an easily readable and efficiently organized CAFR. This report satisfied both generally accepted accounting principles and applicable legal requirements.
A Certificate of Achievement is valid for a period of one year only. We believe our current CAFR continues to meet the Certificate of Achievement Program’s requirements and we are submitting it to the GFOA to determine its eligibility for another certificate.
INDEPENDENT AUDITOhio law requires an annual audit of the Ohio Lottery by an independent auditor. The Auditor of State for the State of Ohio currently conducts the annual financial audit of the Ohio Lottery. The Ohio Lottery’s financial statements audit for fiscal year 2019 has been completed in conformity with generally accepted governmental auditing standards. The auditor’s unmodified audit opinion of the Ohio Lottery’s financial statements is included in the financial section of this report.
ACKNOWLEDGMENTSPreparation of this report was made possible by the efficient and dedicated efforts of our employees. A special note of thanks is given to the General Accounting Bureau comprised of Mary Tedeschi-Vittardi, Marisol Halligan and Anna Callas and to the entire finance staff. Thanks to Michael M. Bycko, Visual Communications Manager, for the layout and graphics support of this publication.
Publishing this Comprehensive Annual Financial Report reflects our commitment to meet the highest standards of accountability. The Ohio Lottery intends to continually improve financial management and clearly communicate its financial story. It is important for the public to know that the Ohio Lottery’s financial condition is properly reported, including payments made to education. Credit is due to Commission Chair Sean Whalen and the members of the Ohio Lottery Commission for their commitment to operating the Ohio Lottery in a responsible and progressive manner.
Respectfully Submitted,
Gregory A. BowersFinance Director
OLC
Pat McDonaldExecutive Director
12 The Ohio Lottery
Comprehensive Annual Financial Report FY 2019 13
14 The Ohio Lottery
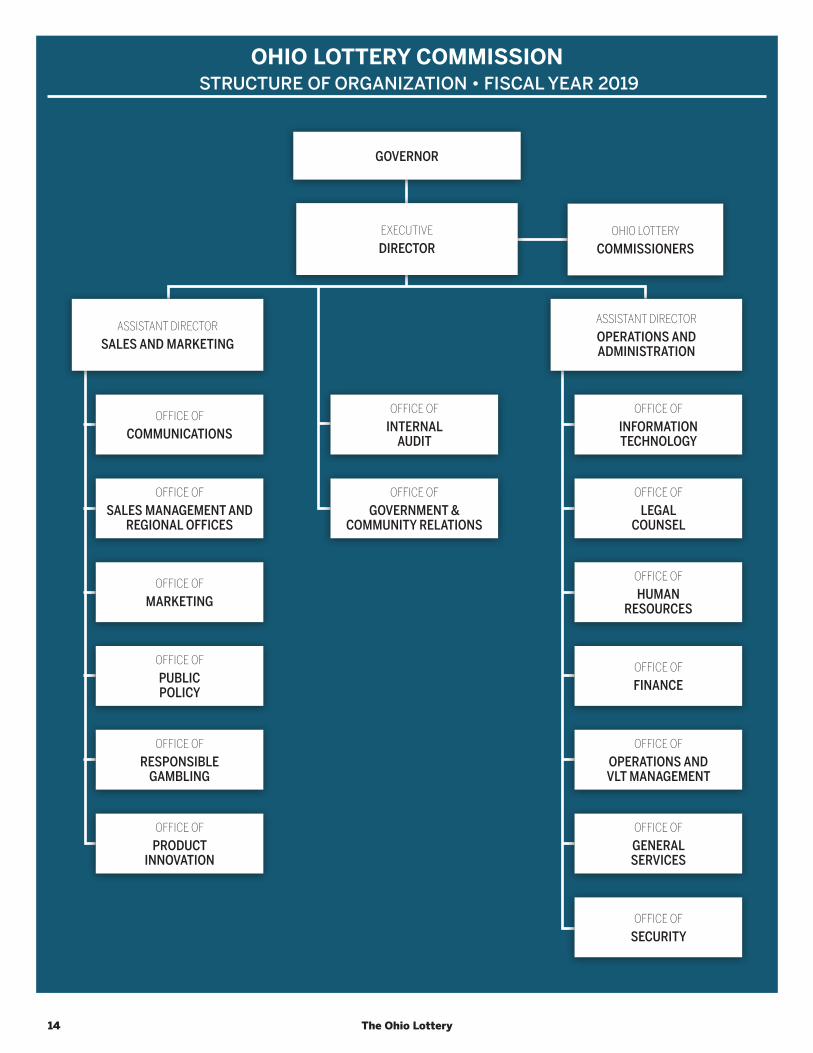
OHIO LOTTERY COMMISSIONSTRUCTURE OF ORGANIZATION • FISCAL YEAR 2019
GOVERNOR
EXECUTIVE
DIRECTOR
ASSISTANT DIRECTOR
SALES AND MARKETING
OFFICE OF
COMMUNICATIONS
OFFICE OF
INFORMATIONTECHNOLOGY
OFFICE OF
SALES MANAGEMENT ANDREGIONAL OFFICES
OFFICE OF
GOVERNMENT &COMMUNITY RELATIONS
OFFICE OF
MARKETING
OFFICE OF
LEGALCOUNSEL
OFFICE OF
INTERNALAUDIT
OFFICE OF
HUMANRESOURCES
OFFICE OF
PUBLICPOLICY
OFFICE OF
OPERATIONS ANDVLT MANAGEMENT
OFFICE OF
GENERALSERVICES
OFFICE OF
FINANCE
OFFICE OF
SECURITY
OFFICE OF
RESPONSIBLEGAMBLING
OFFICE OF
PRODUCTINNOVATION
ASSISTANT DIRECTOR
OPERATIONS ANDADMINISTRATION
OHIO LOTTERY
COMMISSIONERS
Comprehensive Annual Financial Report FY 2019 15
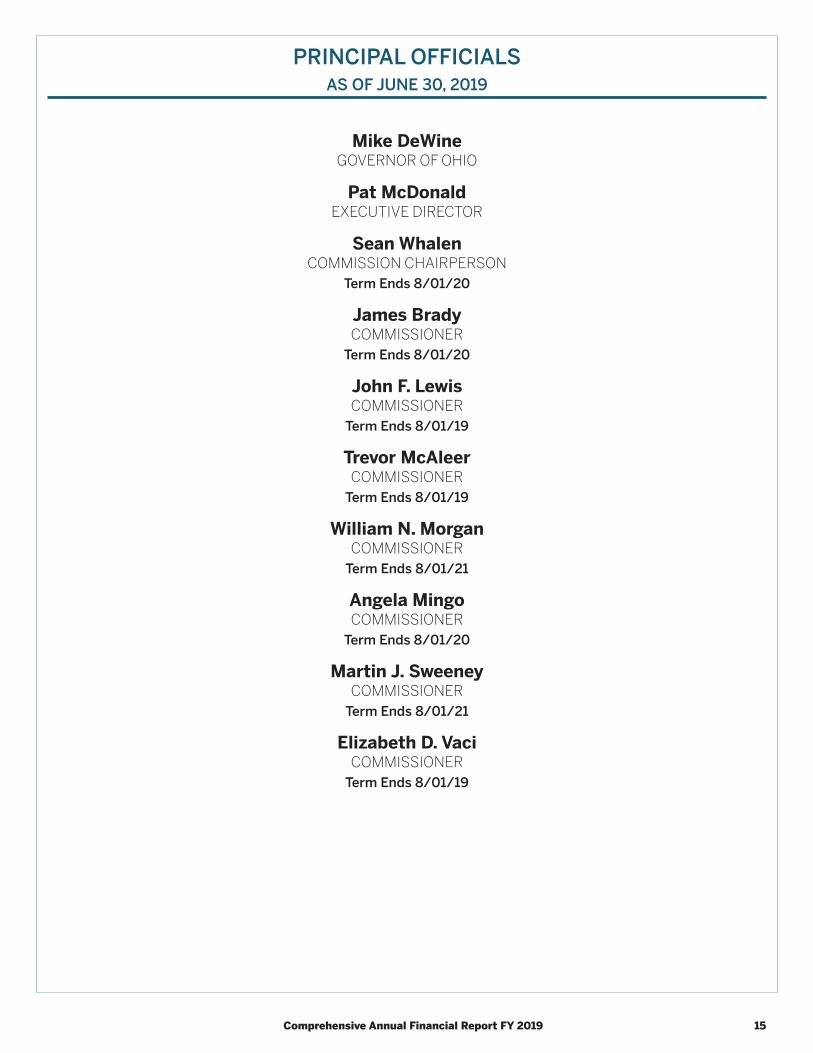
PRINCIPAL OFFICIALSAS OF JUNE 30, 2019
Mike DeWineGOVERNOR OF OHIO
Pat McDonaldEXECUTIVE DIRECTOR
Sean WhalenCOMMISSION CHAIRPERSON
Term Ends 8/01/20
James BradyCOMMISSIONER
Term Ends 8/01/20
John F. LewisCOMMISSIONER
Term Ends 8/01/19
Trevor McAleerCOMMISSIONER
Term Ends 8/01/19
William N. MorganCOMMISSIONER
Term Ends 8/01/21
Angela MingoCOMMISSIONER
Term Ends 8/01/20
Martin J. SweeneyCOMMISSIONER
Term Ends 8/01/21
Elizabeth D. VaciCOMMISSIONER
Term Ends 8/01/19

16 The Ohio Lottery
• FINANCIAL SECTION •PHILANTHROPYThe Ohio Lottery has a proud tradition of supporting those in need through its philanthropy. Throughout the year, employees dig deep and contribute thousands of dollars to numerous charities and thousands of pounds of food to bene� t our fellow Ohioans. E� orts include the State of Ohio’s Combined Charitable Campaign, Cash Explosion’s Facing Hunger campaign and the Kids in Need Stu� the Bus campaign.
The Ohio Lottery is a proud contributor to Cleveland’s Stu� the Bus campaign that helps local schools with much-needed supplies. Our regional o� ces across Ohio also contribute supplies to their local municipalities.
Since 2011, Cash Explosion’s Facing Hunger campaign has asked fans of the show to donate non-perishable food when they come to a taping of the show. The campaign runs from November to May each year and those donations are given to a food bank in Ohio. Since inception, the Facing Hunger campaign has donated nearly 25 tons of food to multiple food banks across Ohio.
In May 2019, dozens of tornadoes roared through the Dayton area that injured hundreds of Ohioans and left a path of destruction in local communities. The devastation left many without homes, electricity or access to food and water. Director Pat McDonald, along with Ohio Lottery and Cash Explosion representatives, delivered 7,500 pounds of food to The Foodbank, Inc. in Dayton for disaster relief e� orts in the Miami Valley.

Comprehensive Annual Financial Report FY 2019 17
INDUSTRY LEADERSThe Ohio Lottery was honored to host several industry conferences last year in Cleveland. The year kicked o� with the National Council of Legislators from Gaming States (NCLGS) summer conference which included several hundred industry leaders and state legislators from across the country. Additionally, the National Council on Problem Gambling (NCPG) held its 32nd annual conference here, drawing record attendance.
Finally, Ohio was selected as the host for the North American Association of State and Provincial Lotteries (NASPL) 2018 tradeshow and awards ceremony. As host, the Lottery planned the entire week of workshops, educational sessions and concluded the week with awards banquet for lotteries and industry leaders from across the globe. From year-long planning sessions to providing volunteers during the events, Ohio Lottery sta� was an integral part of each conference’s successes.
18
Efficient Effective Transparent
Lausche Building, 12th Floor 615 Superior Avenue, NW
Cleveland, Ohio 44113-1801 (216) 787-3665 or (800) 626-2297
INDEPENDENT AUDITOR’S REPORT
Ohio Lottery Commission Cuyahoga County 615 Superior Avenue, N.W. Cleveland, Ohio 44113 To the Commissioners:
Report on the Financial Statements We have audited the accompanying financial statements of each major fund of the Ohio Lottery Commission, Cuyahoga County, Ohio (the Commission), as of and for the year ended June 30, 2019, and the related notes to the financial statements, which collectively comprise the Commission’s basic financial statements as listed in the table of contents. Management’s Responsibility for the Financial Statements
Management is responsible for preparing and fairly presenting these financial statements in accordance with accounting principles generally accepted in the United States of America; this includes designing, implementing, and maintaining internal control relevant to preparing and fairly presenting financial statements that are free from material misstatement, whether due to fraud or error. Auditor's Responsibility Our responsibility is to opine on these financial statements based on our audit. We audited in accordance with auditing standards generally accepted in the United States of America and the financial audit standards in the Comptroller General of the United States’ Government Auditing Standards. Those standards require us to plan and perform the audit to reasonably assure the financial statements are free from material misstatement. An audit requires obtaining evidence about financial statement amounts and disclosures. The procedures selected depend on our judgment, including assessing the risks of material financial statement misstatement, whether due to fraud or error. In assessing those risks, we consider internal control relevant to the Commission’s preparation and fair presentation of the financial statements in order to design audit procedures that are appropriate in the circumstances, but not to the extent needed to opine on the effectiveness of the Commission's internal control. Accordingly, we express no such opinion. An audit also includes evaluating the appropriateness of management’s accounting policies and the reasonableness of their significant accounting estimates, as well as our evaluation of the overall financial statement presentation. We believe the audit evidence we obtained is sufficient and appropriate to support our audit opinions.
19
Ohio Lottery Commission Cuyahoga County Independent Auditor’s Report Page 2
Opinion In our opinion, the financial statements referred to above present fairly, in all material respects, the respective financial position of each major fund of the Ohio Lottery Commission, Cuyahoga County, Ohio, as of June 30, 2019, and the respective changes in financial position and, where applicable, cash flows thereof for the year then ended in accordance with the accounting principles generally accepted in the United States of America.
Other Matters
Report on Summarized Comparative Data We have previously audited the Ohio Lottery’s 2018 financial statements, and we expressed an unmodified opinion on those audited financial statements in our report dated October 1, 2018. In our opinion, the summarized comparative data presented herein as of and for the year ended June 30, 2018 is consistent, in all material respects, with the audited financial statements from which it has been derived. Required Supplementary Information
Accounting principles generally accepted in the United States of America require this presentation to include management’s discussion and analysis and schedules of net pension and other post-employment benefit liabilities and pension and other post-employment benefit contributions listed in the table of contents, to supplement the basic financial statements. Although this information is not part of the basic financial statements, the Governmental Accounting Standards Board considers it essential for placing the basic financial statements in an appropriate operational, economic, or historical context. We applied certain limited procedures to the required supplementary information in accordance with auditing standards generally accepted in the United States of America, consisting of inquiries of management about the methods of preparing the information and comparing the information for consistency with management’s responses to our inquiries, to the basic financial statements, and other knowledge we obtained during our audit of the basic financial statements. We do not opine or provide any assurance on the information because the limited procedures do not provide us with sufficient evidence to opine or provide any other assurance. Supplementary and Other Information Our audit was conducted to opine on the Commission’s basic financial statements taken as a whole. The introductory section and the statistical section information present additional analysis and are not a required part of the basic financial statements. We did not subject the introductory section and statistical section information to the auditing procedures applied in the audit of the basic financial statements and, accordingly, we express no opinion or any other assurance on them.
20 The Ohio Lottery
Ohio Lottery Commission Cuyahoga County Independent Auditor’s Report Page 3
Other Reporting Required by Government Auditing Standards In accordance with Government Auditing Standards, we will also issue our report dated October 1, 2019, on our consideration of the Commission’s internal control over financial reporting and our tests of its compliance with certain provisions of laws, regulations, contracts and grant agreements and other matters. That report describes the scope of our internal control testing over financial reporting and compliance, and the results of that testing, and does not opine on internal control over financial reporting or on compliance. That report is an integral part of an audit performed in accordance with Government Auditing Standards in considering the Commission’s internal control over financial reporting and compliance. Keith Faber Auditor of State Columbus, Ohio October 1, 2019
Comprehensive Annual Financial Report FY 2019 21
MANAGEMENT’S DISCUSSION AND ANALYSIS
As management of the Ohio Lottery Commission (the Ohio Lottery), we offer readers of the Ohio Lottery’s financial statements this narrative overview and analysis of our financial activities for the fiscal year ended June 30, 2019. We encourage readers to consider the information presented here in conjunction with additional information that we have furnished in our letter of transmittal, which can be found on pages 6-11 of this report, and the financial statements which begin on page 28.
FINANCIAL HIGHLIGHTS • Total traditional lottery sales increased $200.7 million, or 6.4 percent from fiscal year 2018, resulting in overall sales of $3.4 billion.• Draw-based game sales increased $138.2 million, or 8.9 percent from last year. Higher jackpots combined with increased overall
sales in most game categories helped spur growth over the prior year. Monitor games including Keno and The Lucky One, grew 8.8% due to increased number of retail outlets. The largest jackpot for fiscal year 2019 was a $1.537 billion Mega Millions jackpot, the highest in Mega Millions recorded history. Powerball also had a jackpot of $768.4 million, the second largest in history.
• Scratch-off ticket sales increased $62.4 million, or 3.9 percent from fiscal year 2018. This can be attributed to strategic changes to the holiday game portfolio, first ever launch of an innovative Pop-N-Pak game -“$10 Super Break the Bank”, the release of a new family of games at different price points “Decade of Dollars”, and a revised $30 game – “Fastest Road to a Million”. In addition, the Retailer Incentive Program, where retailers can earn additional commissions based on certain sales increases, also helped spur growth. Finally, the Lottery began to see the benefits of the expansion of self-service terminals.
• Total prize expense for fiscal year 2019 represented 63.7 percent of total ticket sales compared to 63.2 percent in fiscal year 2018. Though the percentage of prize expense increased slightly, actual prize expense increased $141.2 million in fiscal year 2019 as a result of increased sales volume.
• Operating expenses increased by $13.7 million compared to fiscal year 2018 due to an increase in salaries/benefits, and general increases in gaming related costs due to an increase in sales activity.
• Gross gaming revenue from VLT’s totaled $1,058.6 million, an increase of $71.3 million over fiscal year 2018. The Ohio Lottery’s net VLT revenue increased from $330.7 million to $354.6 million or 7.2 percent in fiscal year 2019.
• The Ohio Lottery transferred $1.15 billion to the Lottery Profits Education Fund (LPEF) in 2019, $66.2 million more than the 2018 transfer amount. The Ohio Lottery’s total net position increased $61.2 million, or 32.9 percent, due to additional GASB adjustments and an increase in operating income.
OVERVIEW OF THE FINANCIAL STATEMENTSThis annual report consists of a series of financial statements and notes to these statements. The basic financial statements by fund include the statement of net position, statement of revenues, expenses and changes in fund net position, statement of cash flows, as well as the notes to the basic financial statements, which disclose detailed information within the financial statements.
The Ohio Lottery’s activities are accounted for within the enterprise fund type and are reported using a full accrual basis of accounting, which is comparable to the methods used by private sector entities. The Ohio Lottery manages the following major funds:
LOTTERY OPERATING FUNDRevenues for this fund are provided primarily from traditional ticket sales and net revenue collected from the VLT facilities. Expenses of this fund represent primarily prize expenses (including cash transfers to the Annuity Prize Fund), operating expenses, and transfers to the LPEF. For purposes of this financial report, all financial activity is presented within the Lottery Operating Fund. Please see notes to the basic financial statements for more detailed activity reported within this fund.
ANNUITY PRIZE FUNDRevenues for this fund are provided through cash transfers from the Lottery Operating Fund for the purpose of providing investment principal for funding long-term prize obligations. Expenses of the Annuity Prize Fund primarily represent annuity prize payments.
The statement of net position presents information on all of the Ohio Lottery’s assets, deferred outflow of resources, liabilities and deferred inflows of resources. The difference between the two is reported as total net position. Over time, increases or decreases in net position may serve as a useful indicator of whether the financial position of the Ohio Lottery is improving or deteriorating. The statement of revenues, expenses and changes in fund net position reports the revenue and expense activity of the Ohio Lottery. This statement is used to measure the success of the Ohio Lottery’s operations over the given period related to sales, expenses, and funding of Ohio education. The statement of cash flows provides information about the Ohio Lottery’s cash receipts and cash payments during the reporting period from operating, non-capital and capital financing, and investing activities.
22 The Ohio Lottery
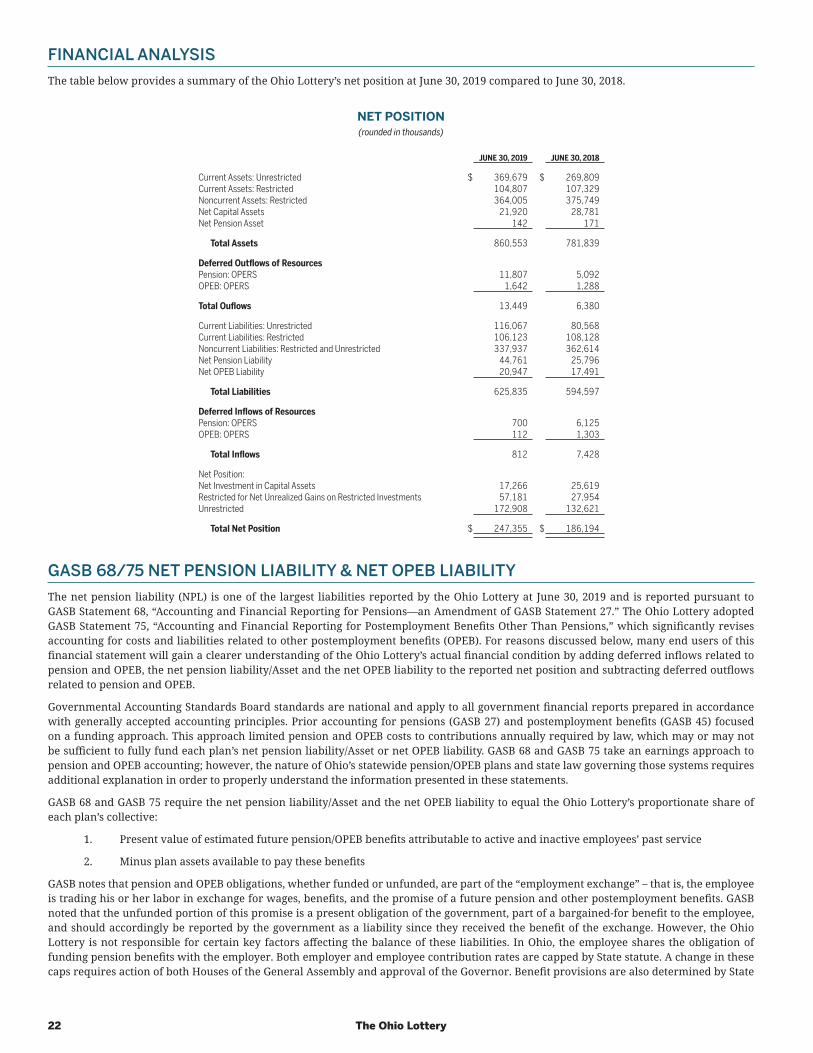
FINANCIAL ANALYSISThe table below provides a summary of the Ohio Lottery’s net position at June 30, 2019 compared to June 30, 2018.
NET POSITION(rounded in thousands)
JUNE 30, 2019 JUNE 30, 2018
Current Assets: Unrestricted $ 369,679 $ 269,809Current Assets: Restricted 104,807 107,329Noncurrent Assets: Restricted 364,005 375,749Net Capital Assets 21,920 28,781Net Pension Asset 142 171
Total Assets 860,553 781,839
Deferred Outflows of ResourcesPension: OPERS 11,807 5,092OPEB: OPERS 1,642 1,288
Total Ouflows 13,449 6,380
Current Liabilities: Unrestricted 116,067 80,568Current Liabilities: Restricted 106,123 108,128Noncurrent Liabilities: Restricted and Unrestricted 337,937 362,614Net Pension Liability 44,761 25,796Net OPEB Liability 20,947 17,491
Total Liabilities 625,835 594,597
Deferred Inflows of ResourcesPension: OPERS 700 6,125OPEB: OPERS 112 1,303
Total Inflows 812 7,428
Net Position:Net Investment in Capital Assets 17,266 25,619Restricted for Net Unrealized Gains on Restricted Investments 57,181 27,954Unrestricted 172,908 132,621
Total Net Position $ 247,355 $ 186,194
GASB 68/75 NET PENSION LIABILITY & NET OPEB LIABILITYThe net pension liability (NPL) is one of the largest liabilities reported by the Ohio Lottery at June 30, 2019 and is reported pursuant to GASB Statement 68, “Accounting and Financial Reporting for Pensions—an Amendment of GASB Statement 27.” The Ohio Lottery adopted GASB Statement 75, “Accounting and Financial Reporting for Postemployment Benefits Other Than Pensions,” which significantly revises accounting for costs and liabilities related to other postemployment benefits (OPEB). For reasons discussed below, many end users of this financial statement will gain a clearer understanding of the Ohio Lottery’s actual financial condition by adding deferred inflows related to pension and OPEB, the net pension liability/Asset and the net OPEB liability to the reported net position and subtracting deferred outflows related to pension and OPEB.
Governmental Accounting Standards Board standards are national and apply to all government financial reports prepared in accordance with generally accepted accounting principles. Prior accounting for pensions (GASB 27) and postemployment benefits (GASB 45) focused on a funding approach. This approach limited pension and OPEB costs to contributions annually required by law, which may or may not be sufficient to fully fund each plan’s net pension liability/Asset or net OPEB liability. GASB 68 and GASB 75 take an earnings approach to pension and OPEB accounting; however, the nature of Ohio’s statewide pension/OPEB plans and state law governing those systems requires additional explanation in order to properly understand the information presented in these statements.
GASB 68 and GASB 75 require the net pension liability/Asset and the net OPEB liability to equal the Ohio Lottery’s proportionate share of each plan’s collective:
1. Present value of estimated future pension/OPEB benefits attributable to active and inactive employees’ past service
2. Minus plan assets available to pay these benefits
GASB notes that pension and OPEB obligations, whether funded or unfunded, are part of the “employment exchange” – that is, the employee is trading his or her labor in exchange for wages, benefits, and the promise of a future pension and other postemployment benefits. GASB noted that the unfunded portion of this promise is a present obligation of the government, part of a bargained-for benefit to the employee, and should accordingly be reported by the government as a liability since they received the benefit of the exchange. However, the Ohio Lottery is not responsible for certain key factors affecting the balance of these liabilities. In Ohio, the employee shares the obligation of funding pension benefits with the employer. Both employer and employee contribution rates are capped by State statute. A change in these caps requires action of both Houses of the General Assembly and approval of the Governor. Benefit provisions are also determined by State
Comprehensive Annual Financial Report FY 2019 23
statute. The Ohio revised Code permits but does not require the retirement systems to provide healthcare to eligible benefit recipients. The retirement systems may allocate a portion of the employer contributions to provide for these OPEB benefits.
The employee enters the employment exchange with the knowledge that the employer’s promise is limited not by contract but by law. The employer enters the exchange also knowing that there is a specific, legal limit to its contribution to the retirement system. In Ohio, there is no legal means to enforce the unfunded liability of the pension/OPEB plan as against the public employer. State law operates to mitigate/lessen the moral obligation of the public employer to the employee, because all parties enter the employment exchange with notice as to the law. The retirement system is responsible for the administration of the pension and OPEB plans.
Most long-term liabilities have set repayment schedules or, in the case of compensated absences (i.e. sick and vacation leave), are satisfied through paid time-off or termination payments. There is no repayment schedule for the net pension liability or the net OPEB liability. As explained above, changes in benefits, contribution rates, and return on investments affect the balance of these liabilities but are outside the control of the local government. In the event that contributions, investment returns, and other changes are insufficient to keep up with required payments, State statute does not assign/identify the responsible party for the unfunded portion. Due to the unique nature of how the net pension liability and the net OPEB liability are satisfied, these liabilities are separately identified within the long-term liability section of the statement of net position.
In accordance with GASB 68 and GASB 75, the Ohio Lottery’s statements prepared on an accrual basis of accounting include an annual pension expense and an annual OPEB expense for their proportionate share of each plan’s change in net pension liability and net OPEB liability, respectively, not accounted for as deferred inflows/outflows.
CURRENT ASSETS – UNRESTRICTEDThe Ohio Lottery’s Current Assets – Unrestricted increased nearly $100.0 million compared to fiscal year 2018. Current Assets Unrestricted consists primarily of Cash & Cash Equivalents (including Video Lottery), Cash Equity with the Treasurer of State, Net Receivables from Agents, and other Assets such as Prepaid Assets.
Cash Equity with Treasurer of State increased $91.6 million, while Cash and Cash Equivalents decreased $22.9 million. The increase in Cash Equity with Treasurer of State was offset by a decrease in balances held in Cash and Cash Equivalents primarily due to the timing differences of the transfer of funds from the Gross Revenue Fund to the State Lottery Fund.
Cash and Cash Equivalent – Video Lottery decreased by $6.9 million due to the timing of the transfers. In fiscal year 2018, the final transfer to the Treasurer of State was made before the end of the fiscal year, compared to the final transfer made after the end of fiscal year 2019.
Net Receivables from Agents increased by $3.4 million, which is comprised of amounts due from lottery retailers from the sale of traditional lottery tickets, VLT revenue due from the VLT operators and unrecorded scratch off ticket sales. On a weekly basis, amounts due from retailers are collected electronically from the retailer’s bank accounts for the invoices due from the prior week sales. On June 30, 2019, eight days of sales activity was waiting to be collected compared to seven days on June 30, 2018. Other Assets increased by $0.8 million over last fiscal year.
CURRENT ASSETS - RESTRICTEDThe Lottery’s Current Assets – Restricted decreased from $107.3 million in Fiscal Year 2018 to $104.8 million in Fiscal Year 2019, or $2.5 million.Current Assets – Restricted represent investments dedicated for the payment of annuity prize awards, Obligations under Securities Lending program per GASB 28 requirements, and Interest Receivable. Dedicated Investments decreased $6.4 million, which is a direct function of the number of winners choosing the annuity option during the year. This is a normal occurrence due to less offerings that have the annuity prize. This category also decreased due to a decrease in the Securities Lending program.
NONCURRENT ASSETS – RESTRICTEDNoncurrent Assets – Restricted, which is comprised of investments dedicated for the payment of the Lottery’s long-term annuity prizes, decreased from $375.7 million in fiscal year 2018 to $364.0 million in fiscal year 2019, or $11.7 million. This decrease is primarily the result of fewer grand prize winners selecting the annuity option over time as opposed to the cash option.
CURRENT LIABILITIES - UNRESTRICTEDCurrent Liabilities - Unrestricted increased by $35.5 million, primarily due to the accounting for GASB 28 and the Securities Lending Program. The amount reported as obligations under security lending increased from $30.1 million in 2018 to $64.1 million in 2019, or $33.9 million. In addition, Capital Leases Payable: Current increased $0.2 million.
CURRENT LIABILITIES - RESTRICTEDCurrent Liabilities – Restricted decreased $2.0 million. This can be attributed to a change in an accounting procedure which caused Due to other State Agencies to remain unaffected from 2018. Also, obligations under securities lending increased $3.9 million as the value and size of the investment portfolio has increased over time.
NONCURRENT LIABILITIESNoncurrent Liabilities decreased $2.3 million. This decrease is primarily attributed to the Prize Awards Payable from restricted assets which decreased by $25.9 million. The primary reason for this decrease is the majority of jackpot winners preferred the cash option over the
24 The Ohio Lottery
annuity prize option. There was also an increase of $19.0 million in GASB 68 Net Pension Liability. GASB 75 (OPEB Liability) increased of $3.5 million.
The overall effect on liabilities is an increase of $31.2 million attributed to the combination of increases and decreases of the various accounts discussed above.
NET POSITIONAccording to enabling Ohio Statute, the Lottery can retain working capital for its further operations, and as a result, Net Position increased by $61.1 million, or 32.8% in fiscal year 2019 compared to fiscal year 2018. In addition, the increases are primarily attributed to the increase in fair value of investments held by the Lottery to pay annuity prizes. Accounting principles dictate that the Lottery record the gain or loss related to the change in market value of investments. Since the full maturity value of the investments is needed to pay the annuity prize, the Lottery does not expect to realize any permanent gain on these investments.
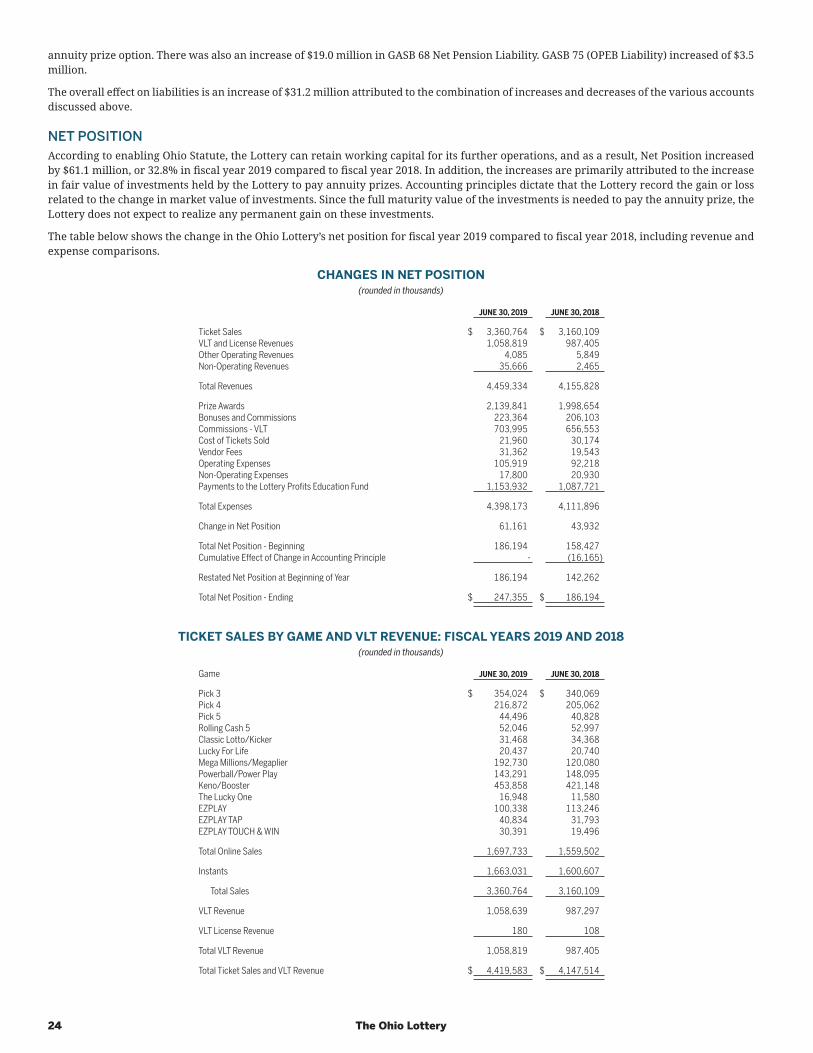
The table below shows the change in the Ohio Lottery’s net position for fiscal year 2019 compared to fiscal year 2018, including revenue and expense comparisons.
CHANGES IN NET POSITION(rounded in thousands)
JUNE 30, 2019 JUNE 30, 2018
Ticket Sales $ 3,360,764 $ 3,160,109VLT and License Revenues 1,058,819 987,405Other Operating Revenues 4,085 5,849Non-Operating Revenues 35,666 2,465
Total Revenues 4,459,334 4,155,828
Prize Awards 2,139,841 1,998,654Bonuses and Commissions 223,364 206,103Commissions - VLT 703,995 656,553Cost of Tickets Sold 21,960 30,174Vendor Fees 31,362 19,543Operating Expenses 105,919 92,218Non-Operating Expenses 17,800 20,930Payments to the Lottery Profits Education Fund 1,153,932 1,087,721
Total Expenses 4,398,173 4,111,896
Change in Net Position 61,161 43,932
Total Net Position - Beginning 186,194 158,427Cumulative Effect of Change in Accounting Principle - (16,165)
Restated Net Position at Beginning of Year 186,194 142,262
Total Net Position - Ending $ 247,355 $ 186,194
TICKET SALES BY GAME AND VLT REVENUE: FISCAL YEARS 2019 AND 2018(rounded in thousands)
Game JUNE 30, 2019 JUNE 30, 2018
Pick 3 $ 354,024 $ 340,069Pick 4 216,872 205,062Pick 5 44,496 40,828Rolling Cash 5 52,046 52,997Classic Lotto/Kicker 31,468 34,368Lucky For Life 20,437 20,740Mega Millions/Megaplier 192,730 120,080Powerball/Power Play 143,291 148,095Keno/Booster 453,858 421,148The Lucky One 16,948 11,580EZPLAY 100,338 113,246EZPLAY TAP 40,834 31,793EZPLAY TOUCH & WIN 30,391 19,496
Total Online Sales 1,697,733 1,559,502
Instants 1,663,031 1,600,607
Total Sales 3,360,764 3,160,109
VLT Revenue 1,058,639 987,297
VLT License Revenue 180 108
Total VLT Revenue 1,058,819 987,405
Total Ticket Sales and VLT Revenue $ 4,419,583 $ 4,147,514
Comprehensive Annual Financial Report FY 2019 25
OPERATING ANALYSISSales from traditional lottery games in fiscal year 2019 were $3,360.8 million. This represents a $200.7 million or 6.3 percent increase over sales from fiscal year 2018. The following section summarizes traditional lottery sales in fiscal year 2019 by game category.
DAILY DRAWSales for Daily Draw-based games, which consist of Pick 3, Pick 4, and Pick 5, totaled $615.4 million in fiscal year 2019. This was $29.4 million, or 5.0 percent higher than sales posted in fiscal year 2018. Sales for both Pick 3 and Pick 4 increased $14.0 million and $11.8 million, respectively, while Pick 5 finished the year up by $3.7 million. The increase in sales for both Pick 3 & Pick 4 can be attributed to an increase in prizes won, as players may have reinvested those winnings back into the game.
LOTTO GAMESSales for Lotto games, which consist of Rolling Cash 5, Classic Lotto and KICKER, totaled $83.5 million for fiscal year 2019. This is $3.9 million, or 4.4 percent less than sales posted in fiscal year 2018. Fiscal year 2019 sales for Rolling Cash were $950,000 less than sales posted in fiscal year 2018. Classic Lotto was down $2.8 million. This decrease can be attributed to lower than average jackpots throughout FY 2019. Sales for KICKER, an add-on game of Classic Lotto, were $70,000 less than sales posted in fiscal year 2018.
MULTI-STATE JACKPOT GAMESSales for Multi-state jackpot games, which consist of Mega Millions, Megaplier, Powerball, Power Play, and Lucky for Life, totaled $356.5 million for fiscal year 2019. This is $67.5 million, or 23.4 percent more than sales posted in fiscal year 2018.
Sales for Mega Millions in fiscal year 2019 were $68.2 million more than sales posted the prior year, while Megaplier, the Mega Millions add-on game, increased by $4.3 million. This increase can be attributed to a record-setting jackpot offered during the year. Powerball sales in fiscal year 2019 were $5.3 million less than sales generated the prior year, while Power Play, the Powerball add-on game, increased by $397,000. Sales for Lucky for Life, a multi-state game offering life prizes, decreased slightly by $303,000.
KENO AND THE LUCKY ONE (MONITOR GAMES)Sales for Monitor games totaled $470.8 million for the 2019 fiscal year. This is $38.1 million, or 8.8 percent more than sales posted in fiscal year 2018. Sales for KENO in fiscal year 2019 were $22.9 million more than sales posted in fiscal year 2018, while Booster added $9.8 million to the positive variance in this category. Sales for Booster in fiscal year 2019 were 26.1 percent of KENO sales. Sales for KENO/Booster grew steadily as the Lottery continued its expansion in this distribution channel, as well as offering more promotions during the year. The Lucky One generated $16.9 million in sales.
EZPLAYSales for EZPLAY games, which include, EZPLAY, EZPLAY TAP, and EZPLAY TOUCH & WIN, totaled $171.6 million for the 2019 fiscal year. This is $7.0 million, or 4.3 percent more than sales posted in fiscal year 2018. Fiscal year 2019 sales for EZPLAY were $12.9 million less than sales recorded in fiscal year 2018. Fiscal year 2019 sales for EZPLAY TAP were $9.0 million more than sales posted in fiscal year 2018. Sales decreases for EZPLAY were mitigated by Touch & Win and other interactive touch-screen style games. Decreases in some EZPLAY categories were the result of timing of new game releases, specifically new progressive EZPLAY game launches. EZPLAY TOUCH & WIN games are only played on Multi-Play Touch & Win (MPQK) terminals and available at select Ohio Lottery licensed retailers. This product line was launched in June of fiscal year 2016 and generated $30.4 million in sales in the EZPLAY category.
SCRATCH-OFF TICKETSSales for Scratch-off ticket games totaled $1.7 billion, which is $62.4 million, or 3.9 percent more than sales posted in fiscal year 2018. Scratch-off ticket sales were bolstered by several strategic initiatives during the year, such as changes to the holiday game lineup, the first ever launch of an innovative Pop-N-Pak game -“$10 Super Break the Bank”, the release of a new family of games at different price points “Decade of Dollars”, and a revised $30 game – “Fastest Road to a Million”. In addition, the Retailer Incentive Program, where retailers can earn additional commissions based on certain sales increases, also helped spur growth. Finally, the Lottery began to see the benefits of the expansion of self-service terminals.
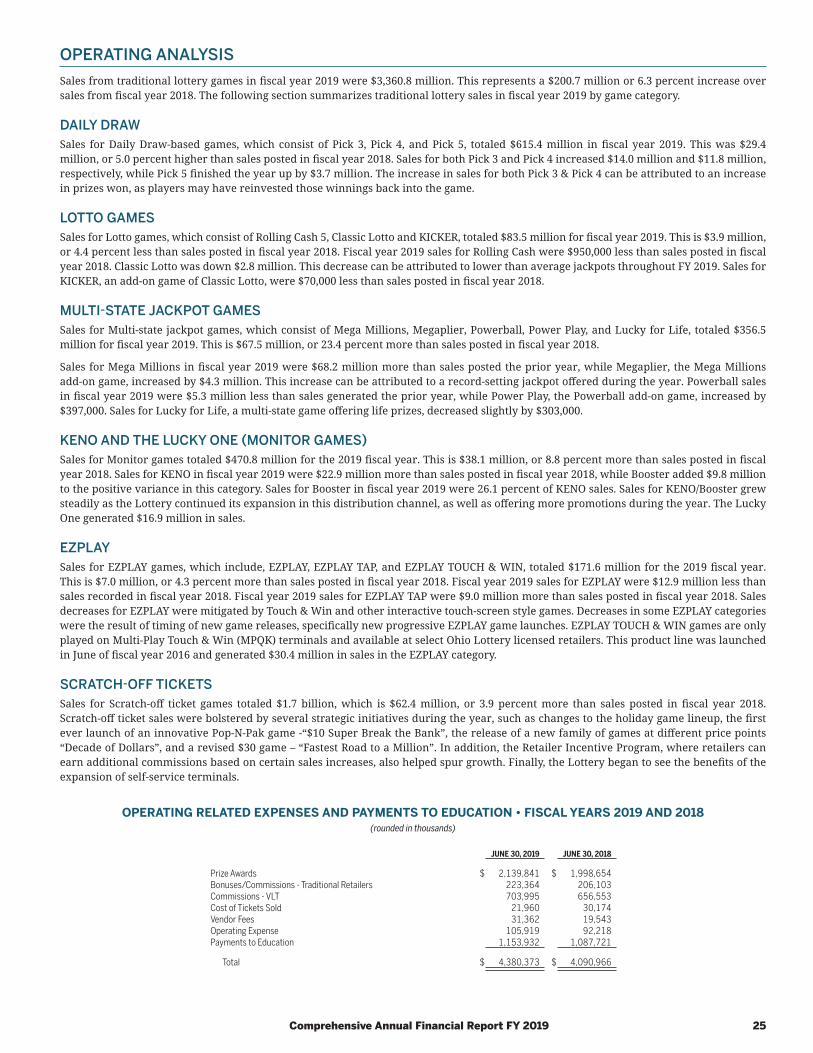
OPERATING RELATED EXPENSES AND PAYMENTS TO EDUCATION • FISCAL YEARS 2019 AND 2018(rounded in thousands)
JUNE 30, 2019 JUNE 30, 2018
Prize Awards $ 2,139,841 $ 1,998,654Bonuses/Commissions - Traditional Retailers 223,364 206,103Commissions - VLT 703,995 656,553Cost of Tickets Sold 21,960 30,174Vendor Fees 31,362 19,543Operating Expense 105,919 92,218Payments to Education 1,153,932 1,087,721
Total $ 4,380,373 $ 4,090,966
26 The Ohio Lottery
PRIZE AWARDSPrize expense for fiscal year 2019, which totaled $2,139.8 million, was $141.2 million, or 7.1 percent higher than fiscal year 2018. Prize expense has a direct correlation to sales. Therefore, since sales volume increased, the prizes awarded also increase. Additionally, the combinations of several large multistate jackpots, combined with growth in higher price point scratch-off tickets and steady increases in Keno sales, led to larger prizes awarded during the fiscal year. Finally, prizes for Pick 3 and Pick 4 were higher than the games designed payout matrix, which is a function of the “luck of the draw”.
BONUSES/COMMISSIONSBonuses/Commissions increased due to higher sales volume and the implementation of a quarterly bonus incentive for the retailers. This program provides an increase in commissions for retailers when they meet certain sales goals and other mandatory requirements and optional qualifying criteria. Additional bonuses earned by retailers from this incentive program amounted to $14.2 million for the year, which consisted of five quarterly payments. The fourth quarter of fiscal year 2018, the first year of the retailer incentive program, was paid in quarter one of fiscal year 2019. No accruals were made in 2018. Commissions- VLT increased $47.4 million due to the increase in VLT sales for fiscal year 2019.
COST OF TICKETS SOLDExpenses in this category include costs associated with the printing of scratch-off tickets as well as other paper stock necessary to sell draw-based games via the point of sale terminal at retail. Although costs in this category generally increase with sales volume, fiscal 2019 experienced a decrease due to a slight drop in thermal paper prices as well as a change in categorizing expenses in fiscal year 2019 compared to fiscal year 2018.
VENDOR FEESThis includes payments made to vendors that provide gaming-related services such as the gaming system and the warehousing and distribution of instant “scratch-off” tickets. The gaming system comprises of services such as the software, hardware, communication, technical support, set-up and delivery of terminals, and the general maintenance of the Lottery’s online gaming system. This also includes payments made for the purpose of purchasing gaming equipment such as the self-service terminals at retail. Costs associated with vendor fees increased due to an increase in sales volume, as well as additional self-service equipment purchased during fiscal year 2019.
OPERATING EXPENSETotal Operating Expenses, which for purposes of this Management Discussion & Analysis, consists of personal services (including salaries and benefits), maintenance & equipment, advertising, travel, utilities, rent, depreciation and other expenses. Costs associated with personal services such as salaries and benefits increased over the prior fiscal year in addition to general inflationary increases in other categories such as rent and maintenance contracts. Other expenses increased due to pension expenses and OPEB expense (GASB 75). Total Operating Expenses increased $13.7 million and for fiscal year 2019 represented 3.2 percent of total traditional lottery sales.
PAYMENTS TO EDUCATIONPayments to education increased $66.2 million because of an increase in traditional lottery sales and VLT revenue. Profits from traditional lottery products increased due to a combination of draw-based game sales and scratch-off sales. The majority of profits derived from draw-based games can be attributed to the success from Multi-State game jackpots. Profits derived from VLT operations were up $50.8 million over fiscal year 2018. However, $28.5 million in additional profits from VLT activity resulted from an extra month of profit (June 2018) that posted in 2019 and counted towards fiscal year 2019 profits due to an accounting change issued by the Office of Budget & Management.
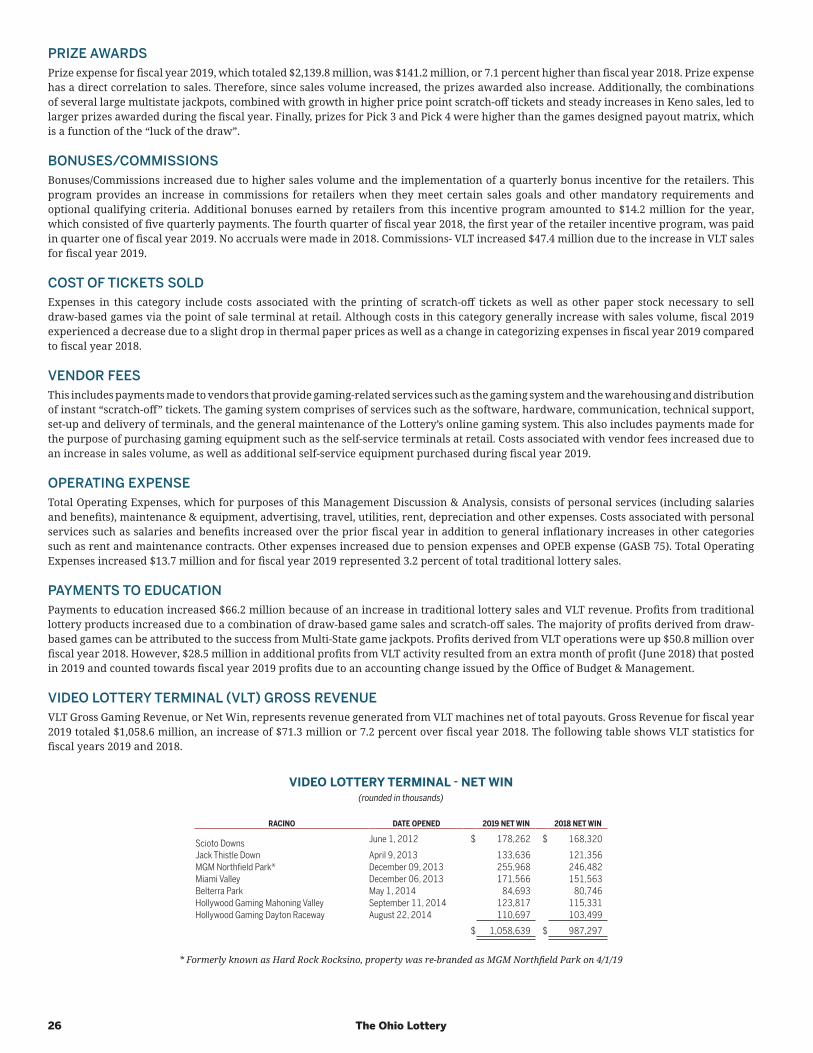
VIDEO LOTTERY TERMINAL (VLT) GROSS REVENUEVLT Gross Gaming Revenue, or Net Win, represents revenue generated from VLT machines net of total payouts. Gross Revenue for fiscal year 2019 totaled $1,058.6 million, an increase of $71.3 million or 7.2 percent over fiscal year 2018. The following table shows VLT statistics for fiscal years 2019 and 2018.
VIDEO LOTTERY TERMINAL - NET WIN(rounded in thousands)
RACINO DATE OPENED 2019 NET WIN 2018 NET WIN
Scioto Downs June 1, 2012 $ 178,262 $ 168,320
Jack Thistle Down April 9, 2013 133,636 121,356MGM Northfield Park* December 09, 2013 255,968 246,482Miami Valley December 06, 2013 171,566 151,563Belterra Park May 1, 2014 84,693 80,746Hollywood Gaming Mahoning Valley September 11, 2014 123,817 115,331Hollywood Gaming Dayton Raceway August 22, 2014 110,697 103,499
$ 1,058,639 $ 987,297
* Formerly known as Hard Rock Rocksino, property was re-branded as MGM Northfield Park on 4/1/19
Comprehensive Annual Financial Report FY 2019 27
CAPITAL ASSETS AND DEBT ADMINISTRATION
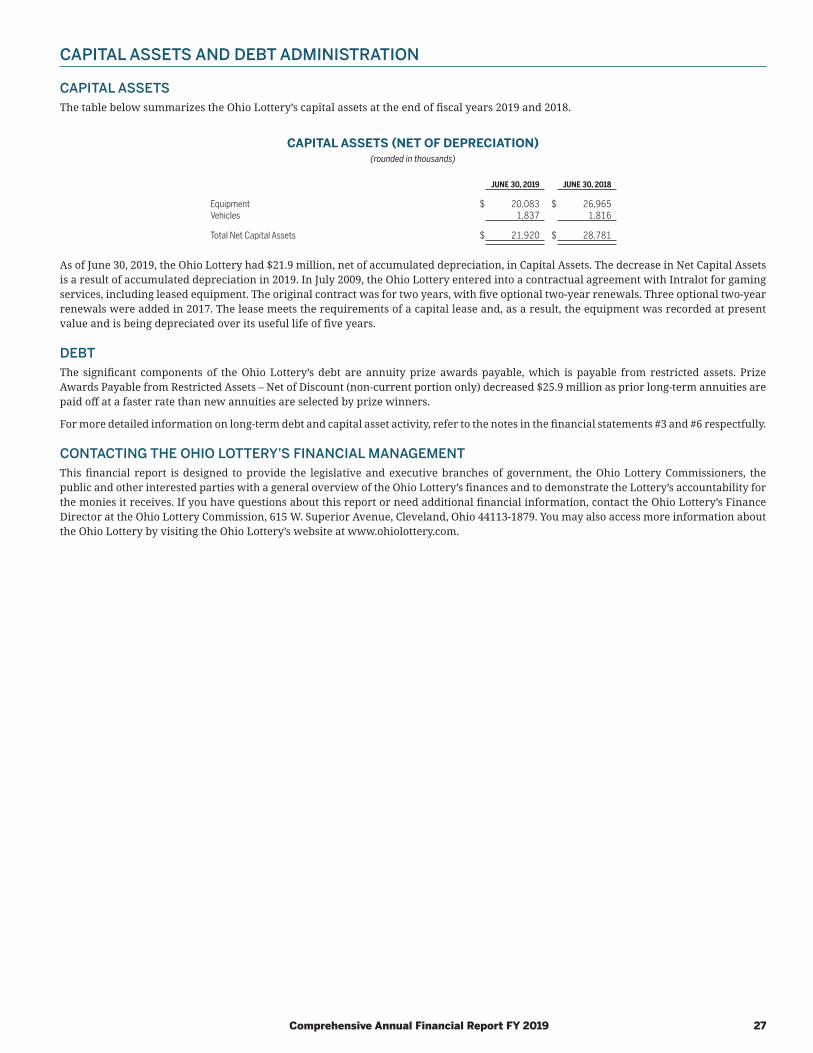
CAPITAL ASSETSThe table below summarizes the Ohio Lottery’s capital assets at the end of fiscal years 2019 and 2018.
CAPITAL ASSETS (NET OF DEPRECIATION)(rounded in thousands)
JUNE 30, 2019 JUNE 30, 2018
Equipment $ 20,083 $ 26,965Vehicles 1,837 1,816
Total Net Capital Assets $ 21,920 $ 28,781
As of June 30, 2019, the Ohio Lottery had $21.9 million, net of accumulated depreciation, in Capital Assets. The decrease in Net Capital Assets is a result of accumulated depreciation in 2019. In July 2009, the Ohio Lottery entered into a contractual agreement with Intralot for gaming services, including leased equipment. The original contract was for two years, with five optional two-year renewals. Three optional two-year renewals were added in 2017. The lease meets the requirements of a capital lease and, as a result, the equipment was recorded at present value and is being depreciated over its useful life of five years.
DEBTThe significant components of the Ohio Lottery’s debt are annuity prize awards payable, which is payable from restricted assets. Prize Awards Payable from Restricted Assets – Net of Discount (non-current portion only) decreased $25.9 million as prior long-term annuities are paid off at a faster rate than new annuities are selected by prize winners.
For more detailed information on long-term debt and capital asset activity, refer to the notes in the financial statements #3 and #6 respectfully.
CONTACTING THE OHIO LOTTERY’S FINANCIAL MANAGEMENTThis financial report is designed to provide the legislative and executive branches of government, the Ohio Lottery Commissioners, the public and other interested parties with a general overview of the Ohio Lottery’s finances and to demonstrate the Lottery’s accountability for the monies it receives. If you have questions about this report or need additional financial information, contact the Ohio Lottery’s Finance Director at the Ohio Lottery Commission, 615 W. Superior Avenue, Cleveland, Ohio 44113-1879. You may also access more information about the Ohio Lottery by visiting the Ohio Lottery’s website at www.ohiolottery.com.
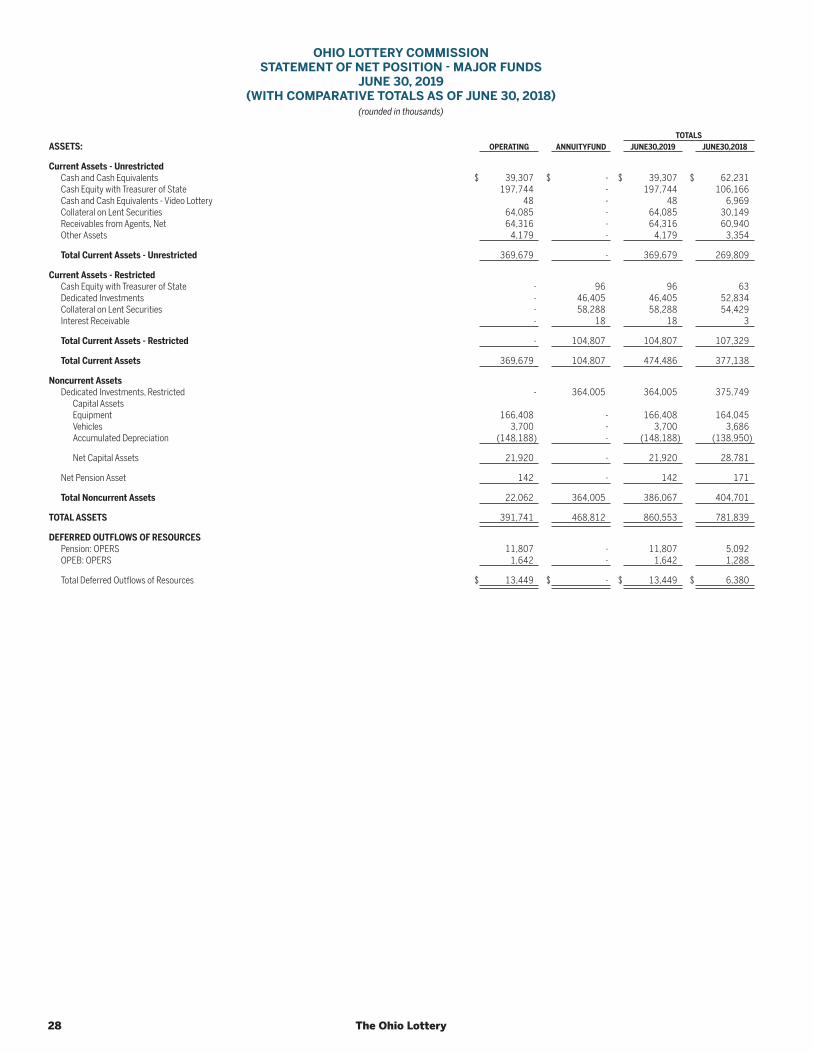
28 The Ohio Lottery
OHIO LOTTERY COMMISSIONSTATEMENT OF NET POSITION - MAJOR FUNDS
JUNE 30, 2019(WITH COMPARATIVE TOTALS AS OF JUNE 30, 2018)
(rounded in thousands)
TOTALSASSETS: OPERATING ANNUITYFUND JUNE30,2019 JUNE30,2018
Current Assets - UnrestrictedCash and Cash Equivalents $ 39,307 $ - $ 39,307 $ 62,231Cash Equity with Treasurer of State 197,744 - 197,744 106,166Cash and Cash Equivalents - Video Lottery 48 - 48 6,969Collateral on Lent Securities 64,085 - 64,085 30,149Receivables from Agents, Net 64,316 - 64,316 60,940Other Assets 4,179 - 4,179 3,354
Total Current Assets - Unrestricted 369,679 - 369,679 269,809
Current Assets - RestrictedCash Equity with Treasurer of State - 96 96 63Dedicated Investments - 46,405 46,405 52,834Collateral on Lent Securities - 58,288 58,288 54,429Interest Receivable - 18 18 3
Total Current Assets - Restricted - 104,807 104,807 107,329
Total Current Assets 369,679 104,807 474,486 377,138
Noncurrent AssetsDedicated Investments, Restricted - 364,005 364,005 375,749
Capital AssetsEquipment 166,408 - 166,408 164,045Vehicles 3,700 - 3,700 3,686Accumulated Depreciation (148,188) - (148,188) (138,950)
Net Capital Assets 21,920 - 21,920 28,781
Net Pension Asset 142 - 142 171
Total Noncurrent Assets 22,062 364,005 386,067 404,701
TOTAL ASSETS 391,741 468,812 860,553 781,839
DEFERRED OUTFLOWS OF RESOURCESPension: OPERS 11,807 - 11,807 5,092OPEB: OPERS 1,642 - 1,642 1,288
Total Deferred Outflows of Resources $ 13,449 $ - $ 13,449 $ 6,380
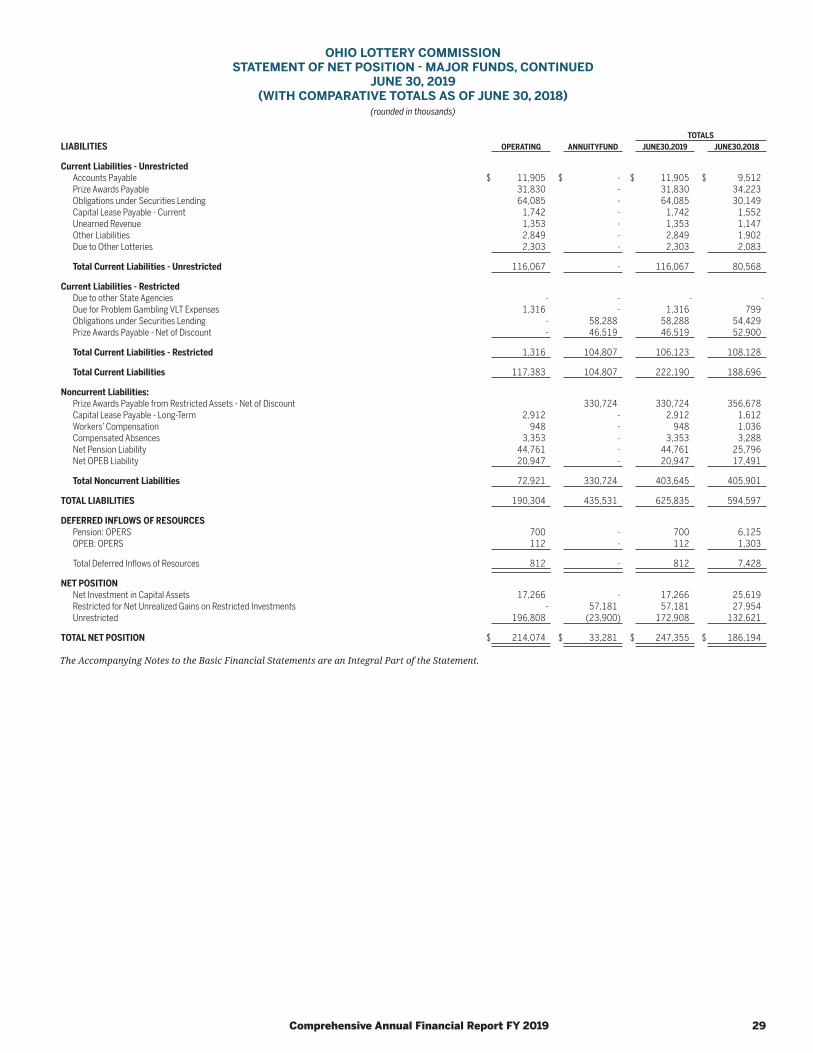
Comprehensive Annual Financial Report FY 2019 29
OHIO LOTTERY COMMISSIONSTATEMENT OF NET POSITION - MAJOR FUNDS, CONTINUED
JUNE 30, 2019(WITH COMPARATIVE TOTALS AS OF JUNE 30, 2018)
(rounded in thousands)
TOTALSLIABILITIES OPERATING ANNUITYFUND JUNE30,2019 JUNE30,2018
Current Liabilities - UnrestrictedAccounts Payable $ 11,905 $ - $ 11,905 $ 9,512Prize Awards Payable 31,830 - 31,830 34,223Obligations under Securities Lending 64,085 - 64,085 30,149Capital Lease Payable - Current 1,742 - 1,742 1,552Unearned Revenue 1,353 - 1,353 1,147Other Liabilities 2,849 - 2,849 1,902Due to Other Lotteries 2,303 - 2,303 2,083
Total Current Liabilities - Unrestricted 116,067 - 116,067 80,568
Current Liabilities - RestrictedDue to other State Agencies - - - -Due for Problem Gambling VLT Expenses 1,316 - 1,316 799Obligations under Securities Lending - 58,288 58,288 54,429Prize Awards Payable - Net of Discount - 46,519 46,519 52,900
Total Current Liabilities - Restricted 1,316 104,807 106,123 108,128
Total Current Liabilities 117,383 104,807 222,190 188,696
Noncurrent Liabilities:Prize Awards Payable from Restricted Assets - Net of Discount 330,724 330,724 356,678Capital Lease Payable - Long-Term 2,912 - 2,912 1,612Workers’ Compensation 948 - 948 1,036Compensated Absences 3,353 - 3,353 3,288Net Pension Liability 44,761 - 44,761 25,796Net OPEB Liability 20,947 - 20,947 17,491
Total Noncurrent Liabilities 72,921 330,724 403,645 405,901
TOTAL LIABILITIES 190,304 435,531 625,835 594,597
DEFERRED INFLOWS OF RESOURCESPension: OPERS 700 - 700 6,125OPEB: OPERS 112 - 112 1,303
Total Deferred Inflows of Resources 812 - 812 7,428
NET POSITIONNet Investment in Capital Assets 17,266 - 17,266 25,619Restricted for Net Unrealized Gains on Restricted Investments - 57,181 57,181 27,954Unrestricted 196,808 (23,900) 172,908 132,621
TOTAL NET POSITION $ 214,074 $ 33,281 $ 247,355 $ 186,194
The Accompanying Notes to the Basic Financial Statements are an Integral Part of the Statement.
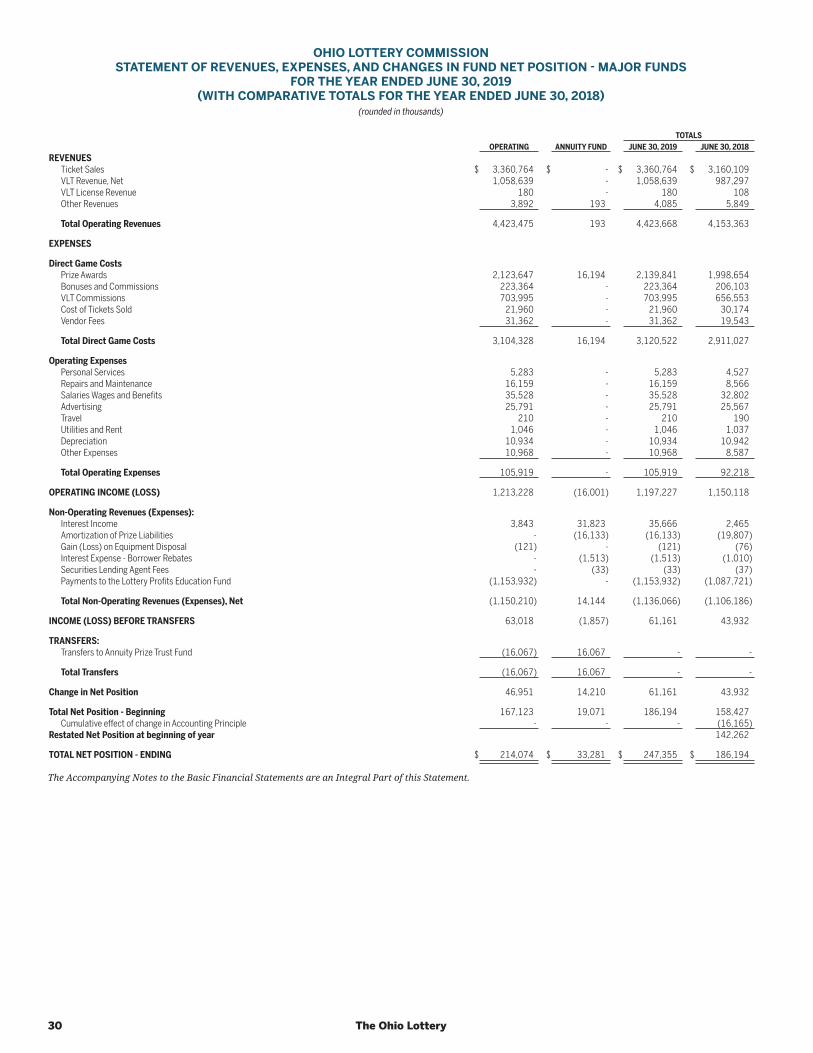
30 The Ohio Lottery
OHIO LOTTERY COMMISSIONSTATEMENT OF REVENUES, EXPENSES, AND CHANGES IN FUND NET POSITION - MAJOR FUNDS
FOR THE YEAR ENDED JUNE 30, 2019(WITH COMPARATIVE TOTALS FOR THE YEAR ENDED JUNE 30, 2018)
(rounded in thousands)
TOTALSOPERATING ANNUITY FUND JUNE 30, 2019 JUNE 30, 2018
REVENUESTicket Sales $ 3,360,764 $ - $ 3,360,764 $ 3,160,109VLT Revenue, Net 1,058,639 - 1,058,639 987,297VLT License Revenue 180 - 180 108Other Revenues 3,892 193 4,085 5,849
Total Operating Revenues 4,423,475 193 4,423,668 4,153,363
EXPENSES
Direct Game CostsPrize Awards 2,123,647 16,194 2,139,841 1,998,654Bonuses and Commissions 223,364 - 223,364 206,103VLT Commissions 703,995 - 703,995 656,553Cost of Tickets Sold 21,960 - 21,960 30,174Vendor Fees 31,362 - 31,362 19,543
Total Direct Game Costs 3,104,328 16,194 3,120,522 2,911,027
Operating ExpensesPersonal Services 5,283 - 5,283 4,527Repairs and Maintenance 16,159 - 16,159 8,566Salaries Wages and Benefits 35,528 - 35,528 32,802Advertising 25,791 - 25,791 25,567Travel 210 - 210 190Utilities and Rent 1,046 - 1,046 1,037Depreciation 10,934 - 10,934 10,942Other Expenses 10,968 - 10,968 8,587
Total Operating Expenses 105,919 - 105,919 92,218
OPERATING INCOME (LOSS) 1,213,228 (16,001) 1,197,227 1,150,118
Non-Operating Revenues (Expenses):Interest Income 3,843 31,823 35,666 2,465Amortization of Prize Liabilities - (16,133) (16,133) (19,807)Gain (Loss) on Equipment Disposal (121) - (121) (76)Interest Expense - Borrower Rebates - (1,513) (1,513) (1,010)Securities Lending Agent Fees - (33) (33) (37)Payments to the Lottery Profits Education Fund (1,153,932) - (1,153,932) (1,087,721)
Total Non-Operating Revenues (Expenses), Net (1,150,210) 14,144 (1,136,066) (1,106,186)
INCOME (LOSS) BEFORE TRANSFERS 63,018 (1,857) 61,161 43,932
TRANSFERS:Transfers to Annuity Prize Trust Fund (16,067) 16,067 - -
Total Transfers (16,067) 16,067 - -
Change in Net Position 46,951 14,210 61,161 43,932
Total Net Position - Beginning 167,123 19,071 186,194 158,427Cumulative effect of change in Accounting Principle - - - (16,165)
Restated Net Position at beginning of year 142,262
TOTAL NET POSITION - ENDING $ 214,074 $ 33,281 $ 247,355 $ 186,194
The Accompanying Notes to the Basic Financial Statements are an Integral Part of this Statement.
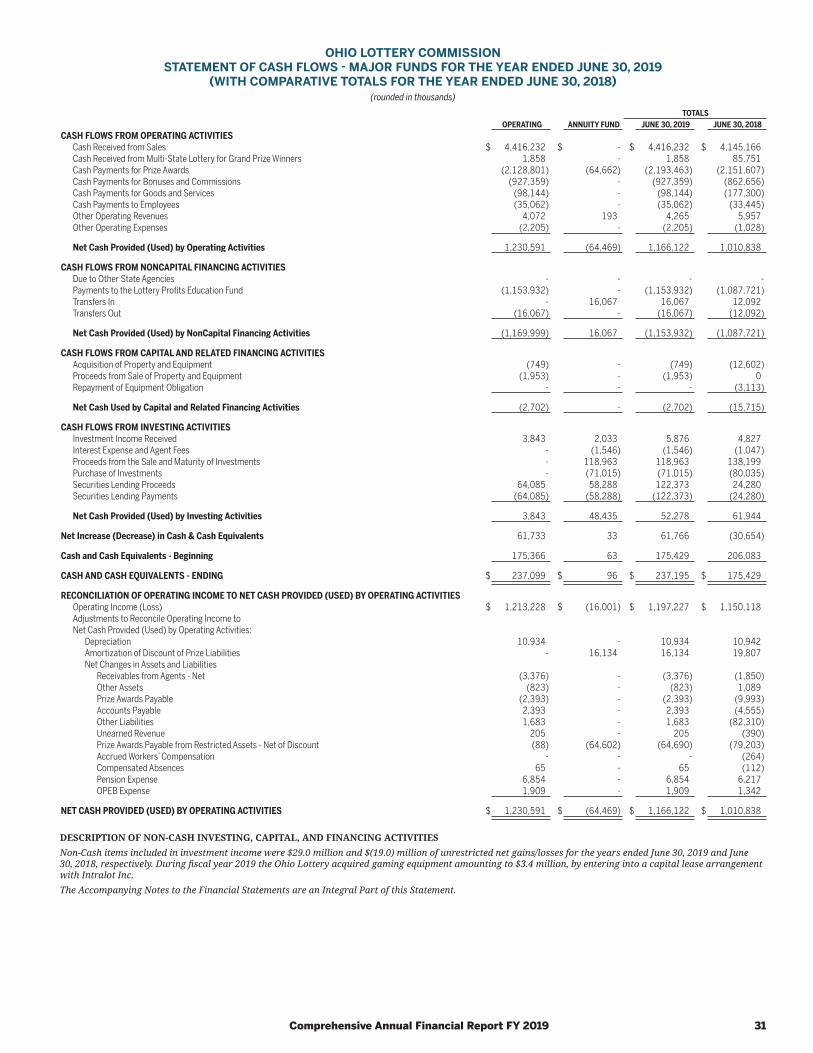
Comprehensive Annual Financial Report FY 2019 31
OHIO LOTTERY COMMISSIONSTATEMENT OF CASH FLOWS - MAJOR FUNDS FOR THE YEAR ENDED JUNE 30, 2019
(WITH COMPARATIVE TOTALS FOR THE YEAR ENDED JUNE 30, 2018)(rounded in thousands)
TOTALS OPERATING ANNUITY FUND JUNE 30, 2019 JUNE 30, 2018
CASH FLOWS FROM OPERATING ACTIVITIES Cash Received from Sales $ 4,416,232 $ - $ 4,416,232 $ 4,145,166Cash Received from Multi-State Lottery for Grand Prize Winners 1,858 - 1,858 85,751Cash Payments for Prize Awards (2,128,801) (64,662) (2,193,463) (2,151,607)Cash Payments for Bonuses and Commissions (927,359) - (927,359) (862,656)Cash Payments for Goods and Services (98,144) - (98,144) (177,300)Cash Payments to Employees (35,062) - (35,062) (33,445)Other Operating Revenues 4,072 193 4,265 5,957Other Operating Expenses (2,205) - (2,205) (1,028)
Net Cash Provided (Used) by Operating Activities 1,230,591 (64,469) 1,166,122 1,010,838
CASH FLOWS FROM NONCAPITAL FINANCING ACTIVITIES Due to Other State Agencies - - - -Payments to the Lottery Profits Education Fund (1,153,932) - (1,153,932) (1,087,721)Transfers In - 16,067 16,067 12,092Transfers Out (16,067) - (16,067) (12,092)
Net Cash Provided (Used) by NonCapital Financing Activities (1,169,999) 16,067 (1,153,932) (1,087,721)
CASH FLOWS FROM CAPITAL AND RELATED FINANCING ACTIVITIES Acquisition of Property and Equipment (749) - (749) (12,602)Proceeds from Sale of Property and Equipment (1,953) - (1,953) 0Repayment of Equipment Obligation - - - (3,113)
Net Cash Used by Capital and Related Financing Activities (2,702) - (2,702) (15,715)
CASH FLOWS FROM INVESTING ACTIVITIES Investment Income Received 3,843 2,033 5,876 4,827Interest Expense and Agent Fees - (1,546) (1,546) (1,047)Proceeds from the Sale and Maturity of Investments - 118,963 118,963 138,199Purchase of Investments - (71,015) (71,015) (80,035)Securities Lending Proceeds 64,085 58,288 122,373 24,280Securities Lending Payments (64,085) (58,288) (122,373) (24,280)
Net Cash Provided (Used) by Investing Activities 3,843 48,435 52,278 61,944
Net Increase (Decrease) in Cash & Cash Equivalents 61,733 33 61,766 (30,654)
Cash and Cash Equivalents - Beginning 175,366 63 175,429 206,083
CASH AND CASH EQUIVALENTS - ENDING $ 237,099 $ 96 $ 237,195 $ 175,429
RECONCILIATION OF OPERATING INCOME TO NET CASH PROVIDED (USED) BY OPERATING ACTIVITIES Operating Income (Loss) $ 1,213,228 $ (16,001) $ 1,197,227 $ 1,150,118Adjustments to Reconcile Operating Income to Net Cash Provided (Used) by Operating Activities:
Depreciation 10,934 - 10,934 10,942Amortization of Discount of Prize Liabilities - 16,134 16,134 19,807Net Changes in Assets and Liabilities
Receivables from Agents - Net (3,376) - (3,376) (1,850)Other Assets (823) - (823) 1,089Prize Awards Payable (2,393) - (2,393) (9,993)Accounts Payable 2,393 - 2,393 (4,555)Other Liabilities 1,683 - 1,683 (82,310)Unearned Revenue 205 - 205 (390)Prize Awards Payable from Restricted Assets - Net of Discount (88) (64,602) (64,690) (79,203)Accrued Workers’ Compensation - - - (264)Compensated Absences 65 - 65 (112)Pension Expense 6,854 - 6,854 6,217OPEB Expense 1,909 - 1,909 1,342
NET CASH PROVIDED (USED) BY OPERATING ACTIVITIES $ 1,230,591 $ (64,469) $ 1,166,122 $ 1,010,838
DESCRIPTION OF NON-CASH INVESTING, CAPITAL, AND FINANCING ACTIVITIES Non-Cash items included in investment income were $29.0 million and $(19.0) million of unrestricted net gains/losses for the years ended June 30, 2019 and June 30, 2018, respectively. During fiscal year 2019 the Ohio Lottery acquired gaming equipment amounting to $3.4 million, by entering into a capital lease arrangement with Intralot Inc.The Accompanying Notes to the Financial Statements are an Integral Part of this Statement.
32 The Ohio Lottery
NOTES TO THE BASIC FINANCIAL STATEMENTSFOR THE YEAR ENDED JUNE 30, 2019
1. SUMMARY OF SIGNIFICANT ACCOUNTING POLICIES
REPORTING ENTITYThe Ohio Lottery Commission (the Ohio Lottery) began selling tickets in August 1974, under Section 3770 of the Ohio Revised Code (ORC). The Ohio Lottery has a nine-member board of commissioners appointed by the Governor with the advice and consent of the Senate. It is classified as an enterprise fund of the State of Ohio (the State) and is presented as such in the State’s financial statements.
The Ohio Lottery is required by law to transfer all of its net profits from the sale of lottery tickets to the Lottery Profits Education Fund (LPEF) of the State. The amounts transferred are determined and certified by the Director of the Ohio Lottery and are to be used to help support primary, secondary, vocational, and special education within the State.
In fiscal year 2010 a cross-sale agreement was reached authorizing the Ohio Lottery to sell both Mega Millions and Powerball games. The net proceeds from the sale of Mega Millions and Powerball in Ohio that remain after associated operating expenses, prize disbursements, retailer bonuses and commissions, reimbursements, and any other expenses necessary to comply with the agreements among the member jurisdictions are required to be transferred to the LPEF of the State.
Video Lottery was introduced in the State of Ohio in 2012 when Governor Kasich signed Executive Order 2011-22K, which authorized the Lottery to amend and adopt rules necessary to implement a video lottery program at Ohio’s seven (7) horse racing facilities. On June 1, 2012, Scioto Downs in Columbus began video gaming with 1,787 video lottery terminals, since then six additional VLT facilities opened. The Ohio Lottery is responsible for regulating the licensing of video lottery sales agents (VLSA), key gaming employees, VLT manufacturers, collection and disbursement of VLT revenue, as well as compliance. The Ohio Lottery receives the proceeds from the video lottery terminal income less a commission paid to the VLSA.
BASIS OF ACCOUNTINGThe Ohio Lottery operates under a series of enterprise funds, each using a full accrual basis of accounting. Under this basis, revenues are recognized when earned and expenses are recognized when incurred. The two Ohio Lottery funds are the Lottery Operating Fund, and the Annuity Prize Fund.
Ohio Lottery operations are accounted for on a flow of economic resources measurement focus. With this measurement focus, all assets and liabilities associated with the operations of the Ohio Lottery are included in the statement of net position. Operating statements present increases (e.g. revenues) and decreases (e.g. expenses) in total net position. The Ohio Lottery distinguishes operating revenues and expenses from non-operating items within the operating statements. Operating revenues and expenses generally result from providing services, producing and delivering goods in connection with selling Ohio Lottery tickets. All revenues and expenses not meeting this definition are reported as non-operating revenues and expenses.
LOTTERY OPERATING FUNDRevenues for this fund are provided primarily from the sale of lottery tickets. Starting in June 2012, revenues from VLTs are also included in this fund. Receivables from ticket sales are collected weekly, with net proceeds equal to an individual retailer’s gross sales less cash prizes paid and commissions earned. The balance from the Lottery Operating Fund is reduced mainly by the following types of transactions: (1) operating expenses and all non-deferred prize payments; (2) cash transfers to the Annuity Prize Trust Fund; (3) transfers to the LPEF of the State; and (4) transfers to other State agencies to support centralized services.
ANNUITY PRIZE FUNDRevenues for the Annuity Prize Fund are provided through cash transfers from the Lottery Operating Fund for the purpose of supplying investment principal for funding long-term prize obligations of the Ohio Lottery, and the investment income related to those cash transfers. Expenses of the Annuity Prize Fund primarily represent payments for annuity prizes.
CASH AND CASH EQUIVALENTSCash equivalents include highly liquid investments with a maturity of 90 days or less from the date of purchase. The Ohio Lottery also considers Cash Equity with Treasurer of State (TOS) to be a cash equivalent. Cash flows related to the payment of prize awards are accounted for as an operating activity.
INVESTMENTSThe Ohio Lottery’s investments are stated at fair value (based on quoted market prices) in the accompanying comparative statement of net position, and the change in the fair value of the investments is recorded as investment income along with the interest earned on the investments.
The Ohio Lottery has invested funds in the State Treasury Asset Reserve of Ohio (STAR Ohio). STAR Ohio is an investment pool managed
Comprehensive Annual Financial Report FY 2019 33
by the TOS, which allows governments within the State to pool their funds for investment purposes. STAR Ohio is not registered with the Securities Exchange Commission (SEC) as an investment company, but has adopted Governmental Accounting Standards Board (GASB), Statement No. 79, “Accounting and Financial Reporting for Certain External Investment Pools and Pool Participants,” which establishes accounting and financial reporting standards for qualifying external investment pools that elect to measure for financial reporting purposes all of their investments at amortized cost.
ALLOWANCE FOR DOUBTFUL ACCOUNTSThe allowance for doubtful accounts at June 30, 2019 and 2018 of $597,000 and $541,000, respectively, is based on an analysis of historical collection experience for accounts receivable, which considers the age of the receivable and current economic conditions.
RESTRICTED ASSETS AND RESTRICTED NET POSITIONRestricted assets represent amounts restricted for the payment of annuity prize awards and payments to other Governmental Agencies. Upon the awarding of an annuity prize, amounts equal to the present value of future prize payments are deposited with the TOS. The Ohio Lottery is either credited with equity in the State of Ohio Common Cash and Investments Account equal to the amounts deposited, or specific State investments are identified and dedicated to the repayment of annuity prizes. Amounts necessary to fund annuity prizes awarded shortly before the end of the fiscal year that will be used to acquire additional equity in State of Ohio general investments in the succeeding year, if any, are recorded as amounts “due from unrestricted assets” in the accompanying statement of net position. In fiscal year 2006, the Ohio Lottery adopted a new method of providing investment capital for future annuity prize payments by purchasing individual securities to fund a specific prize obligation. The restricted net position of the Annuity Fund represents amounts that have been externally imposed by Ohio Lottery winners and are restricted to be used for future prize payments when winners select the annuity option.
CAPITAL ASSETSCapital assets are defined as assets with an initial, individual cost of more than $1,000, or otherwise classified as sensitive items as described in the Department of Administrative Services’ (DAS) Property Inventory Guidelines and Procedures and are stated on the basis of historical cost. Accumulated depreciation is determined by depreciating the cost of the assets over their estimated useful lives on a straight line basis.
The estimated useful life for ticket issuing equipment is five years. The estimated useful life for all other equipment ranges from three to fifteen years.
When assets are retired or otherwise disposed of, the cost and related accumulated depreciation or amortization are removed from the accounts and any resulting gain (loss) is reflected in non-operating revenues (expenses) in the year of disposal.
PRIZE AWARDSPrize awards that are payable in installments over future years are recorded at their present values based upon interest rates provided to the Ohio Lottery by the TOS. The interest rates represent the expected long term rate of return on the assets restricted for the payment of annuity prize awards. Once established for a particular annuity prize award, the interest rate does not fluctuate with changes in the expected long term rate of return. The difference between the present value and gross amount of the obligations is amortized over the terms of the obligations using the interest method, and the amortization is recognized as a non-operating expense.
UNEARNED REVENUEAdvanced wagers may be placed for all online games. Sales relating to future draws are recorded as unearned revenue when received. Sales revenue is recognized during the month in which the related drawings occur.
COMPENSATED ABSENCESOhio Lottery employees earn vacation leave, sick leave and personal leave at various rates within limits specified under collective bargaining agreements or under law. Generally, employees accrue vacation leave at a rate of 3.1 hours every two weeks for the first four years of employment, up to a maximum rate of 9.2 hours every two weeks after 24 years of employment. Vacation credit may be accumulated to a maximum of three times the annual rate of accrual. At termination or upon other separation from the Ohio Lottery, employees are paid at their hourly rate for 100 percent of unused vacation leave and personal leave. Bargaining unit employees are also eligible to receive 100 percent of unused compensatory time.
Sick leave for all full time employees is accumulated at a rate of 3.1 hours every two weeks. Union employees who have a minimum of five years or exempt employees who have a minimum of one year of service shall convert to cash any sick leave accrued at the employee’s regular rate of pay earned at time of separation within three years of separation at the rate of 55 percent for retirement separation and 50 percent for all other separations.
DEFERRED COMPENSATION PLANOhio Lottery employees are eligible to participate in the deferred compensation plan sponsored by the state of Ohio. The state-sponsored plan was created in accordance with IRC Section 457. The plan is available to all Ohio Lottery employees and permits them to defer a portion of their salary until future years. Deferred compensation assets are not available to employees until termination, retirement, death, or unforeseeable emergency.
34 The Ohio Lottery
VIDEO LOTTERY OPERATIONSThe Ohio Lottery commenced Video Lottery Operations in June 2012 at Scioto Downs in Columbus. In April 2013, Thistledown Racino in Cleveland opened. In March 2016, new owners took over and the name changed to JACK Thistledown. In December 2013, Hard Rock Rocksino in Northfield and Miami Valley Gaming in Lebanon opened. In April 2019, new owners took over Hard Rock Rocksino. The property was re-branded as MGM Northfield Park. Later in May 2014, Belterra Park in Cincinnati opened. Hollywood Gaming Dayton opened in August 2014, and Hollywood Mahoning Valley Race Course opened in September 2014. As of June 30 2019, the Video Lottery Sales Agents (VLSA) had 11,663 VLTs in operation. A Video Lottery Terminal (VLT) is a stand-alone device containing a random-number generator. Each VLT is connected to a centralized computer system that allows the Lottery to monitor game play and revenue activity. The Central Monitoring System (CMS) keeps track of money deposited in a terminal, usage, wins and payouts, machine maintenance and cash removal. Each game theme is approved by Ohio Lottery Commissioners and independently tested and certified before being placed into operation.
The Ohio Lottery recognizes VLT revenue as “gross gaming revenue”. Gross gaming revenue represents gross wagers, net of related prizes. The minimum percentage payout in Ohio is 85 percent. Licensed operators receive 66.5 percent of gross terminal revenue to operate their facility, as commissions earned. Payments to the VLSA are recorded in VLT Commissions. For fiscal year ended June 30, 2019, VLT revenue was $1,058.6 million with $700.5 million paid to VLSA as VLT commission, $354.6 million representing the Lottery’s share and 3.5 million was collected for Problem Gambling Services, as defined in the Ohio revised Code..
NON-OPERATING EXPENSE: PAYMENTS TO THE LOTTERY PROFITS EDUCATION FUNDPayments to the Lottery Profits Education Fund totaled $1,153.9 million. Of this amount, $810.1 million represented profits generated from traditional lottery games, while $343.8 million represented profits generated from the VLT program. Due to a change in how the office of Budget & Management recognizes transfers, VLT Revenue earned in June was transferred and posted to the LPEF in July and will be accounted for in the next fiscal year.
BONUSES AND COMMISSIONSRetailers receive a commission of 5.5 percent based on their total sales. Cashing bonuses are paid on a weekly basis and equal 1.0 percent of all redeemed tickets. An additional 0.5 percent is awarded to retailers if their cash-to-sales ratio is 49.5 percent or greater. A $5 claiming bonus is awarded to retailers for validating a winning ticket worth $600 to $5,000. In addition, various selling bonuses are in place for online games ranging from $500 to $100,000. A retailer is eligible for an instant ticket bonus when selling the top prize of the game with top prize of $100,000 or more. The bonus is 1.0 percent of the prize, with a maximum of $10,000. The Game Show selling bonus is 1.0 percent of the championship contestant’s total winnings (excluding bonus prize winnings).
In July 2017, the Lottery launched a tiered commission structure to incentivize retailers to increase sales volume in select categories, along with other mandatory qualifying criteria selected by management. Qualified, eligible retailers will receive 0.5 percent commission bonus for achieving a 2.5 percent increase in sales over the same quarter last year, and a 1.0 percent commission bonus for a 5.0 percent increase in sales over the same quarter last year.
A VLSA receives a commission of 66.5 percent of the net win, which is defined as net revenues remaining after payout of prizes to players. The VLT terminal income is calculated as follows: credit(s) played, less credits won, less promotional credits.
FUND EQUITY CLASSIFICATIONSFund equity is classified as net position and displayed in three components:
• Net Investment in Capital Assets – consists of capital assets net of accumulated depreciation.• Restricted – for Net Unrealized Gains on Restricted Investments.• Unrestricted – represents all other net position that are not classified as invested in capital assets or restricted.
RISK MANAGEMENTThe Ohio Lottery is exposed to various risks of loss related to torts; theft of, damage to and destruction of assets; errors and omissions; injuries to employees; and natural disasters. The Ohio Lottery generally retains the risk of loss; however, the Ohio Lottery is protected for purposes of sales collections by third-party surety bonds or deposits. Upon inception, retailers with an on site consumption D5 liquor license are required to have a deposit of $500.00. All other retailers are required to carry a minimum bond of $15,000. On a yearly basis, the retailers’ required coverage is based on an evaluation of their average annual sales. The minimum bond coverage is $15,000 or one twenty-sixth of their annual sales. If an existing business is being purchased the bond coverage is $15,000 or one twenty- sixth of their annual sales. The amount of loss arising from these risks was not significant for the years ended June 30, 2019, 2018, and 2017. No significant payments were made or liabilities recorded during the years ended June 30, 2019, 2018, and 2017 due to self-insured risks.
The Office of Risk Management implemented the Blanket Bond coverage program, under which all state employees, including elected and appointed officials (other than the Treasurer of State as an individual), are covered. This policy is paid annually and remains in effect until terminated. The premium is split between all participating state agencies and is charged based upon number of employees. It provides a limit of $250,000 per occurrence, subject to a $5,000 deductible for employee theft. This policy covers all employees of all the participating agencies, including each commissioner. The Ohio Lottery pays a premium to the State for workers’ compensation benefits.
The Ohio Lottery pays a premium assessed by DAS to cover motor vehicle liability related to bodily injury and property damage for a maximum of $2.0 million per occurrence. The Ohio Lottery retains the risk for any liability exceeding this limit.
Comprehensive Annual Financial Report FY 2019 35
The state contracts with Medical Mutual of Ohio, Anthem and Aetna to serve as the third-party administrators for the Ohio Med PPO, a fully self-insured health benefit plan. This plan allows all employees and any eligible dependents to have access to both network and non-network providers. Medical Mutual, Anthem and Aetna each serve specific regions of Ohio based upon the home ZIP codes, which determines which administrator the employee will be assigned to. The Ohio Lottery and its participants are charged a share of the costs for claims settlement based on the number of employees opting for plan participation and the type of coverage selected by participants. Employees contributed $49.40 for single, $135.27 for family Minus Spouse and $141.04 for Family Plus Spouse per pay period, while the Ohio Lottery contributed $278.88 for single and $765.47 for family coverage per pay period for each eligible employee. Premiums are accounted for in the State of Ohio’s Benefits Trust Fund. In the event that liabilities exceed premiums paid, assessed premiums would be increased in the succeeding year. The Ohio Lottery’s total contributions to the Health Plans for the last ten fiscal years were $5,102,000, $4,796,000, $4,280,000, $3,746,000, $3,577,000, $3,198,000, $2,682,000, $1,267,000, $1,371,000 and $1,284,000 .
BUDGETARY ACCOUNTING AND CONTROLThe Ohio Lottery is required to submit, through the Governor, a biennial budget to the Ohio General Assembly (General Assembly). Biennially, the General Assembly approves the appropriations, which are provided in annual amounts.
The Ohio Lottery’s official budget, as adopted by the Legislature, is based upon accounting for certain transactions on the basis of cash receipts and disbursements. Encumbrance accounting, under which purchase orders, contracts, and other commitments for expenditures are recorded as expenditures when the purchase commitment is made, is employed for budgetary purposes. Unliquidated encumbrances are generally canceled four months after the end of the fiscal year. Unencumbered appropriations lapse at the end of the biennium for which they were appropriated. The major differences between the budget basis and the GAAP basis of accounting are:
• Prizes and commissions which are not vouchered are not budgeted.• Revenues are recorded when received in cash (budget) as opposed to when earned (GAAP).• Expenses (including annuity prizes) are recorded when paid in cash or encumbered (budget) as opposed to when the liability is
incurred (GAAP).• The budget basis excludes depreciation and amortization, as well as gains and losses on the disposition of equipment.
The Ohio Lottery maintains budgetary control by not permitting total expenditures to exceed appropriations without approval of the General Assembly, except for vouchered prize awards for which appropriation amendments may be approved by Ohio OBM and unvouchered prize expenses, which are not budgeted. Certain budget amendments were adopted during the year ended June 30, 2019.
NEW ACCOUNTING PRONOUNCEMENTSThe Government Accounting Standards Board (GASB) has issued GASB Statement No. 83, “Certain Asset Retirement Obligations,” GASB Statement No. 88, “Certain Disclosures Related to Debt, including Direct Borrowings and Direct Placements,” to be implemented for the fiscal year ending June 30, 2019. GASB 83, 88, have no impact to the Ohio Lottery.
ESTIMATESThe preparation of the financial statements in conformity with GAAP requires management to make estimates and assumptions that affect the amounts reported in the financial statements and accompanying notes. Actual results may differ from those estimates.
SUMMARIZED COMPARATIVE DATAThe basic financial statements include certain prior year summarized comparative information in total but not at the level of detail required for a presentation in conformity with GAAP. Accordingly, such information should be read in conjunction with the Ohio Lottery’s financial statements for the year ended June 30, 2018, from which the summarized information was derived.
SECURITIES LENDINGIn accordance with GASB Statement No. 28, “Accounting and Financial Reporting for Securities Lending Transactions” (GASB 28), the Ohio Lottery reports cash received as collateral on securities lending transactions and any investments made with that cash as assets in the accompanying comparative statement of net position. Liabilities to return the collateral to the borrower are also recognized. Securities received as collateral in connection with securities lending activities are not recorded as the assets and liabilities of the Ohio Lottery, because the Ohio Lottery does not have the ability to pledge or sell the securities without borrower default. The costs of securities lending transactions are reported as expenses in the accompanying comparative statements of revenues, expenses and changes in fund net position.
PENSIONS/OTHER POSTEMPLOYMENT BENEFITS (OPEB)For purposes of measuring the net pension/OPEB liability, information about the fiduciary net position of the pension/OPEB plans and additions to/deductions from their fiduciary net position have been determined on the same basis as they are reported by the pension/OPEB plan. For this purpose, benefit payments (including refunds of employee contributions) are recognized when due and payable in accordance with the benefit terms. The pension/OPEB plans report investments at fair value.
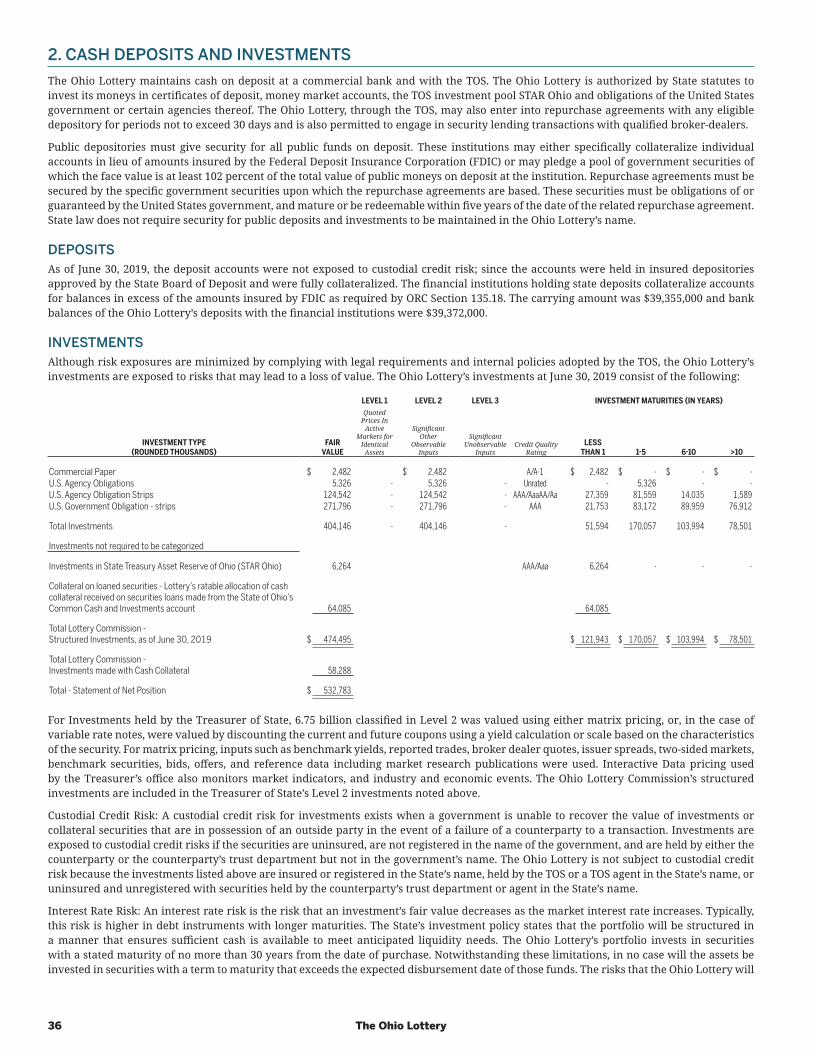
36 The Ohio Lottery
2. CASH DEPOSITS AND INVESTMENTSThe Ohio Lottery maintains cash on deposit at a commercial bank and with the TOS. The Ohio Lottery is authorized by State statutes to invest its moneys in certificates of deposit, money market accounts, the TOS investment pool STAR Ohio and obligations of the United States government or certain agencies thereof. The Ohio Lottery, through the TOS, may also enter into repurchase agreements with any eligible depository for periods not to exceed 30 days and is also permitted to engage in security lending transactions with qualified broker-dealers.
Public depositories must give security for all public funds on deposit. These institutions may either specifically collateralize individual accounts in lieu of amounts insured by the Federal Deposit Insurance Corporation (FDIC) or may pledge a pool of government securities of which the face value is at least 102 percent of the total value of public moneys on deposit at the institution. Repurchase agreements must be secured by the specific government securities upon which the repurchase agreements are based. These securities must be obligations of or guaranteed by the United States government, and mature or be redeemable within five years of the date of the related repurchase agreement. State law does not require security for public deposits and investments to be maintained in the Ohio Lottery’s name.
DEPOSITSAs of June 30, 2019, the deposit accounts were not exposed to custodial credit risk; since the accounts were held in insured depositories approved by the State Board of Deposit and were fully collateralized. The financial institutions holding state deposits collateralize accounts for balances in excess of the amounts insured by FDIC as required by ORC Section 135.18. The carrying amount was $39,355,000 and bank balances of the Ohio Lottery’s deposits with the financial institutions were $39,372,000.
INVESTMENTSAlthough risk exposures are minimized by complying with legal requirements and internal policies adopted by the TOS, the Ohio Lottery’s investments are exposed to risks that may lead to a loss of value. The Ohio Lottery’s investments at June 30, 2019 consist of the following:
LEVEL 1 LEVEL 2 LEVEL 3 INVESTMENT MATURITIES (IN YEARS)
INVESTMENT TYPE(ROUNDED THOUSANDS)
FAIR VALUE
Quoted Prices In
Active Markets for
Identical Assets
Significant Other
Observable Inputs
Significant Unobservable
InputsCredit Quality
RatingLESS
THAN 1 1-5 6-10 >10
Commercial Paper $ 2,482 $ 2,482 A/A-1 $ 2,482 $ - $ - $ -U.S. Agency Obligations 5,326 - 5,326 - Unrated - 5,326 - -U.S. Agency Obligation Strips 124,542 - 124,542 - AAA/AaaAA/Aa 27,359 81,559 14,035 1,589U.S. Government Obligation - strips 271,796 - 271,796 - AAA 21,753 83,172 89,959 76,912
Total Investments 404,146 - 404,146 - 51,594 170,057 103,994 78,501
Investments not required to be categorized
Investments in State Treasury Asset Reserve of Ohio (STAR Ohio) 6,264 AAA/Aaa 6,264 - - -
Collateral on loaned securities - Lottery’s ratable allocation of cash collateral received on securities loans made from the State of Ohio’s Common Cash and Investments account 64,085 64,085
Total Lottery Commission - Structured Investments, as of June 30, 2019 $ 474,495 $ 121,943 $ 170,057 $ 103,994 $ 78,501
Total Lottery Commission - Investments made with Cash Collateral 58,288
Total - Statement of Net Position $ 532,783
For Investments held by the Treasurer of State, 6.75 billion classified in Level 2 was valued using either matrix pricing, or, in the case of variable rate notes, were valued by discounting the current and future coupons using a yield calculation or scale based on the characteristics of the security. For matrix pricing, inputs such as benchmark yields, reported trades, broker dealer quotes, issuer spreads, two-sided markets, benchmark securities, bids, offers, and reference data including market research publications were used. Interactive Data pricing used by the Treasurer’s office also monitors market indicators, and industry and economic events. The Ohio Lottery Commission’s structured investments are included in the Treasurer of State’s Level 2 investments noted above.
Custodial Credit Risk: A custodial credit risk for investments exists when a government is unable to recover the value of investments or collateral securities that are in possession of an outside party in the event of a failure of a counterparty to a transaction. Investments are exposed to custodial credit risks if the securities are uninsured, are not registered in the name of the government, and are held by either the counterparty or the counterparty’s trust department but not in the government’s name. The Ohio Lottery is not subject to custodial credit risk because the investments listed above are insured or registered in the State’s name, held by the TOS or a TOS agent in the State’s name, or uninsured and unregistered with securities held by the counterparty’s trust department or agent in the State’s name.
Interest Rate Risk: An interest rate risk is the risk that an investment’s fair value decreases as the market interest rate increases. Typically, this risk is higher in debt instruments with longer maturities. The State’s investment policy states that the portfolio will be structured in a manner that ensures sufficient cash is available to meet anticipated liquidity needs. The Ohio Lottery’s portfolio invests in securities with a stated maturity of no more than 30 years from the date of purchase. Notwithstanding these limitations, in no case will the assets be invested in securities with a term to maturity that exceeds the expected disbursement date of those funds. The risks that the Ohio Lottery will
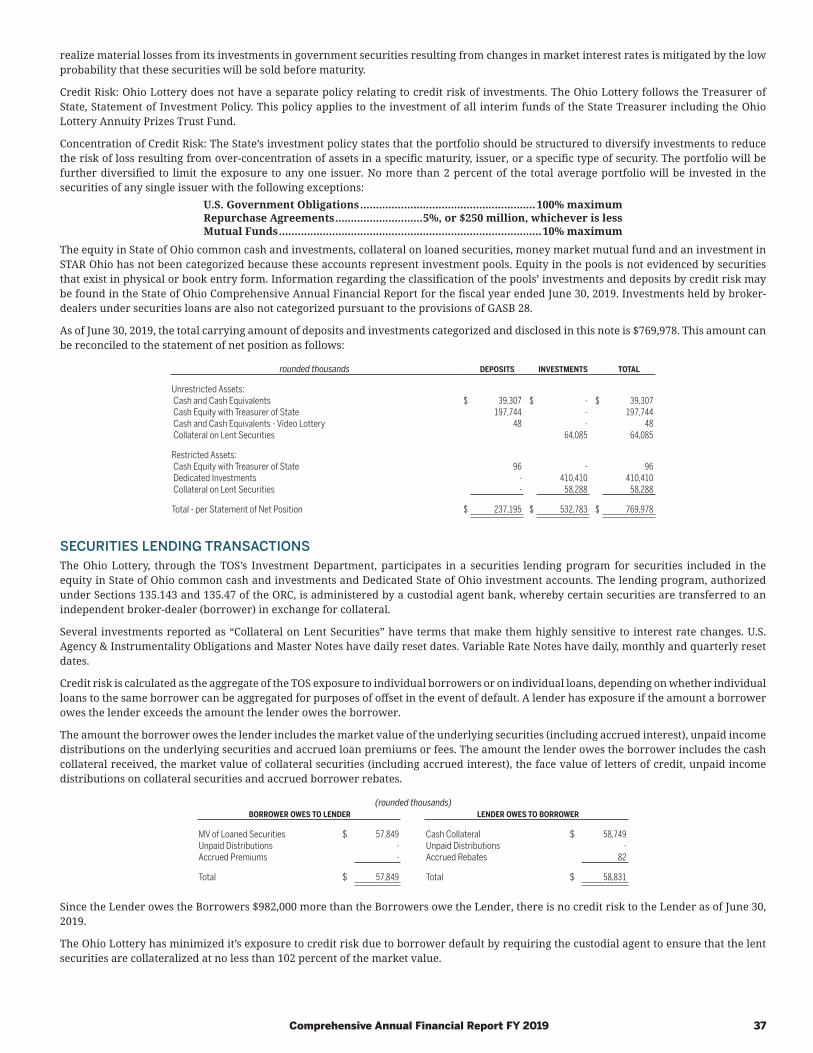
Comprehensive Annual Financial Report FY 2019 37
realize material losses from its investments in government securities resulting from changes in market interest rates is mitigated by the low probability that these securities will be sold before maturity.
Credit Risk: Ohio Lottery does not have a separate policy relating to credit risk of investments. The Ohio Lottery follows the Treasurer of State, Statement of Investment Policy. This policy applies to the investment of all interim funds of the State Treasurer including the Ohio Lottery Annuity Prizes Trust Fund.
Concentration of Credit Risk: The State’s investment policy states that the portfolio should be structured to diversify investments to reduce the risk of loss resulting from over-concentration of assets in a specific maturity, issuer, or a specific type of security. The portfolio will be further diversified to limit the exposure to any one issuer. No more than 2 percent of the total average portfolio will be invested in the securities of any single issuer with the following exceptions:
U.S. Government Obligations ........................................................100% maximumRepurchase Agreements ............................5%, or $250 million, whichever is lessMutual Funds ....................................................................................10% maximum
The equity in State of Ohio common cash and investments, collateral on loaned securities, money market mutual fund and an investment in STAR Ohio has not been categorized because these accounts represent investment pools. Equity in the pools is not evidenced by securities that exist in physical or book entry form. Information regarding the classification of the pools’ investments and deposits by credit risk may be found in the State of Ohio Comprehensive Annual Financial Report for the fiscal year ended June 30, 2019. Investments held by broker-dealers under securities loans are also not categorized pursuant to the provisions of GASB 28.
As of June 30, 2019, the total carrying amount of deposits and investments categorized and disclosed in this note is $769,978. This amount can be reconciled to the statement of net position as follows:
rounded thousands DEPOSITS INVESTMENTS TOTAL
Unrestricted Assets: Cash and Cash Equivalents $ 39,307 $ - $ 39,307 Cash Equity with Treasurer of State 197,744 - 197,744 Cash and Cash Equivalents - Video Lottery 48 - 48 Collateral on Lent Securities 64,085 64,085
Restricted Assets: Cash Equity with Treasurer of State 96 - 96 Dedicated Investments - 410,410 410,410 Collateral on Lent Securities - 58,288 58,288
Total - per Statement of Net Position $ 237,195 $ 532,783 $ 769,978
SECURITIES LENDING TRANSACTIONSThe Ohio Lottery, through the TOS’s Investment Department, participates in a securities lending program for securities included in the equity in State of Ohio common cash and investments and Dedicated State of Ohio investment accounts. The lending program, authorized under Sections 135.143 and 135.47 of the ORC, is administered by a custodial agent bank, whereby certain securities are transferred to an independent broker-dealer (borrower) in exchange for collateral.
Several investments reported as “Collateral on Lent Securities” have terms that make them highly sensitive to interest rate changes. U.S. Agency & Instrumentality Obligations and Master Notes have daily reset dates. Variable Rate Notes have daily, monthly and quarterly reset dates.
Credit risk is calculated as the aggregate of the TOS exposure to individual borrowers or on individual loans, depending on whether individual loans to the same borrower can be aggregated for purposes of offset in the event of default. A lender has exposure if the amount a borrower owes the lender exceeds the amount the lender owes the borrower.
The amount the borrower owes the lender includes the market value of the underlying securities (including accrued interest), unpaid income distributions on the underlying securities and accrued loan premiums or fees. The amount the lender owes the borrower includes the cash collateral received, the market value of collateral securities (including accrued interest), the face value of letters of credit, unpaid income distributions on collateral securities and accrued borrower rebates.
(rounded thousands)BORROWER OWES TO LENDER LENDER OWES TO BORROWER
MV of Loaned Securities $ 57,849 Cash Collateral $ 58,749Unpaid Distributions - Unpaid Distributions -Accrued Premiums - Accrued Rebates 82
Total $ 57,849 Total $ 58,831
Since the Lender owes the Borrowers $982,000 more than the Borrowers owe the Lender, there is no credit risk to the Lender as of June 30, 2019.
The Ohio Lottery has minimized it’s exposure to credit risk due to borrower default by requiring the custodial agent to ensure that the lent securities are collateralized at no less than 102 percent of the market value.
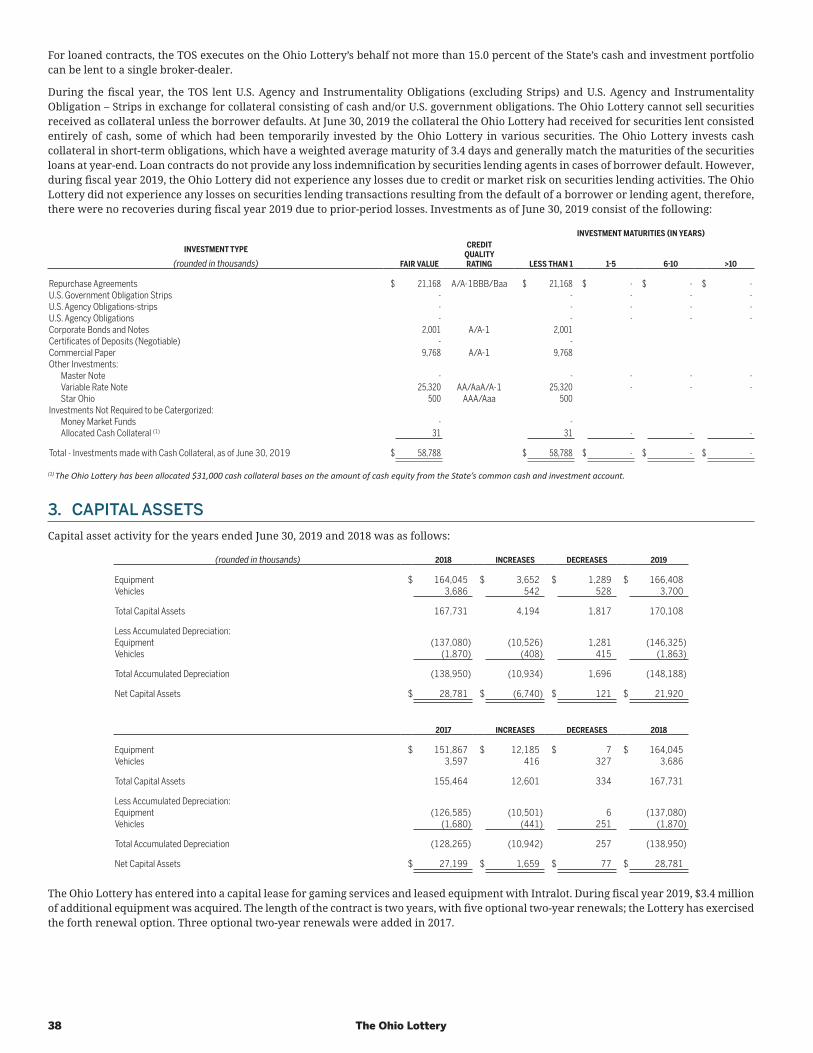
38 The Ohio Lottery
For loaned contracts, the TOS executes on the Ohio Lottery’s behalf not more than 15.0 percent of the State’s cash and investment portfolio can be lent to a single broker-dealer.
During the fiscal year, the TOS lent U.S. Agency and Instrumentality Obligations (excluding Strips) and U.S. Agency and Instrumentality Obligation – Strips in exchange for collateral consisting of cash and/or U.S. government obligations. The Ohio Lottery cannot sell securities received as collateral unless the borrower defaults. At June 30, 2019 the collateral the Ohio Lottery had received for securities lent consisted entirely of cash, some of which had been temporarily invested by the Ohio Lottery in various securities. The Ohio Lottery invests cash collateral in short-term obligations, which have a weighted average maturity of 3.4 days and generally match the maturities of the securities loans at year-end. Loan contracts do not provide any loss indemnification by securities lending agents in cases of borrower default. However, during fiscal year 2019, the Ohio Lottery did not experience any losses due to credit or market risk on securities lending activities. The Ohio Lottery did not experience any losses on securities lending transactions resulting from the default of a borrower or lending agent, therefore, there were no recoveries during fiscal year 2019 due to prior-period losses. Investments as of June 30, 2019 consist of the following:
INVESTMENT MATURITIES (IN YEARS)
INVESTMENT TYPE
(rounded in thousands) FAIR VALUE
CREDITQUALITYRATING LESS THAN 1 1-5 6-10 >10
Repurchase Agreements $ 21,168 A/A-1BBB/Baa $ 21,168 $ - $ - $ -U.S. Government Obligation Strips - - - - -U.S. Agency Obligations-strips - - - - -U.S. Agency Obligations - - - - -Corporate Bonds and Notes 2,001 A/A-1 2,001Certificates of Deposits (Negotiable) - -Commercial Paper 9,768 A/A-1 9,768Other Investments:
Master Note - - - - -Variable Rate Note 25,320 AA/AaA/A-1 25,320 - - -Star Ohio 500 AAA/Aaa 500
Investments Not Required to be Catergorized:Money Market Funds - -Allocated Cash Collateral (1) 31 31 - - -
Total - Investments made with Cash Collateral, as of June 30, 2019 $ 58,788 $ 58,788 $ - $ - $ -
(1) The Ohio Lottery has been allocated $31,000 cash collateral bases on the amount of cash equity from the State’s common cash and investment account.
3. CAPITAL ASSETSCapital asset activity for the years ended June 30, 2019 and 2018 was as follows:
(rounded in thousands) 2018 INCREASES DECREASES 2019
Equipment $ 164,045 $ 3,652 $ 1,289 $ 166,408Vehicles 3,686 542 528 3,700
Total Capital Assets 167,731 4,194 1,817 170,108
Less Accumulated Depreciation:Equipment (137,080) (10,526) 1,281 (146,325)Vehicles (1,870) (408) 415 (1,863)
Total Accumulated Depreciation (138,950) (10,934) 1,696 (148,188)
Net Capital Assets $ 28,781 $ (6,740) $ 121 $ 21,920
2017 INCREASES DECREASES 2018
Equipment $ 151,867 $ 12,185 $ 7 $ 164,045Vehicles 3,597 416 327 3,686
Total Capital Assets 155,464 12,601 334 167,731
Less Accumulated Depreciation:Equipment (126,585) (10,501) 6 (137,080)Vehicles (1,680) (441) 251 (1,870)
Total Accumulated Depreciation (128,265) (10,942) 257 (138,950)
Net Capital Assets $ 27,199 $ 1,659 $ 77 $ 28,781
The Ohio Lottery has entered into a capital lease for gaming services and leased equipment with Intralot. During fiscal year 2019, $3.4 million of additional equipment was acquired. The length of the contract is two years, with five optional two-year renewals; the Lottery has exercised the forth renewal option. Three optional two-year renewals were added in 2017.
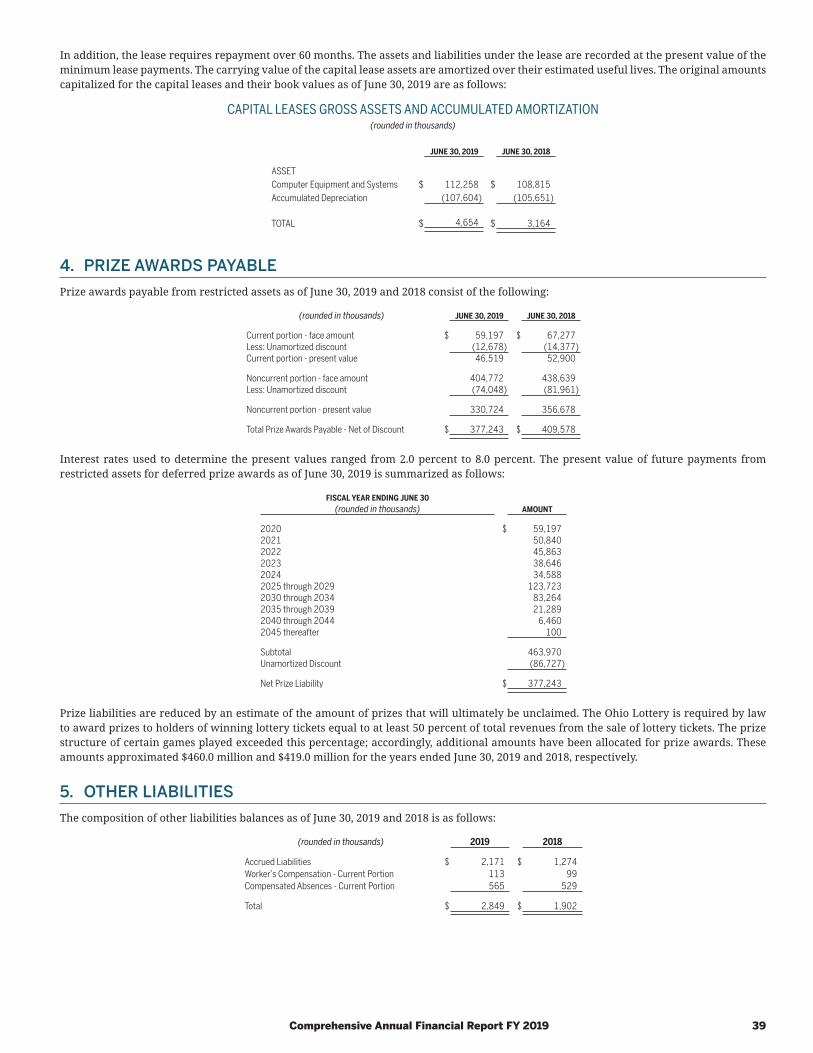
Comprehensive Annual Financial Report FY 2019 39
In addition, the lease requires repayment over 60 months. The assets and liabilities under the lease are recorded at the present value of the minimum lease payments. The carrying value of the capital lease assets are amortized over their estimated useful lives. The original amounts capitalized for the capital leases and their book values as of June 30, 2019 are as follows:
CAPITAL LEASES GROSS ASSETS AND ACCUMULATED AMORTIZATION(rounded in thousands)
JUNE 30, 2019 JUNE 30, 2018
ASSETComputer Equipment and Systems $ 112,258 $ 108,815 Accumulated Depreciation (107,604) (105,651)
TOTAL $ 4,654 $ 3,164
4. PRIZE AWARDS PAYABLEPrize awards payable from restricted assets as of June 30, 2019 and 2018 consist of the following:
(rounded in thousands) JUNE 30, 2019 JUNE 30, 2018
Current portion - face amount $ 59,197 $ 67,277Less: Unamortized discount (12,678) (14,377)Current portion - present value 46,519 52,900
Noncurrent portion - face amount 404,772 438,639Less: Unamortized discount (74,048) (81,961)
Noncurrent portion - present value 330,724 356,678
Total Prize Awards Payable - Net of Discount $ 377,243 $ 409,578
Interest rates used to determine the present values ranged from 2.0 percent to 8.0 percent. The present value of future payments from restricted assets for deferred prize awards as of June 30, 2019 is summarized as follows:
FISCAL YEAR ENDING JUNE 30(rounded in thousands) AMOUNT
2020 $ 59,1972021 50,8402022 45,8632023 38,6462024 34,5882025 through 2029 123,7232030 through 2034 83,2642035 through 2039 21,2892040 through 2044 6,4602045 thereafter 100
Subtotal 463,970Unamortized Discount (86,727)
Net Prize Liability $ 377,243
Prize liabilities are reduced by an estimate of the amount of prizes that will ultimately be unclaimed. The Ohio Lottery is required by law to award prizes to holders of winning lottery tickets equal to at least 50 percent of total revenues from the sale of lottery tickets. The prize structure of certain games played exceeded this percentage; accordingly, additional amounts have been allocated for prize awards. These amounts approximated $460.0 million and $419.0 million for the years ended June 30, 2019 and 2018, respectively.
5. OTHER LIABILITIESThe composition of other liabilities balances as of June 30, 2019 and 2018 is as follows:
(rounded in thousands) 2019 2018
Accrued Liabilities $ 2,171 $ 1,274Worker’s Compensation - Current Portion 113 99Compensated Absences - Current Portion 565 529
Total $ 2,849 $ 1,902
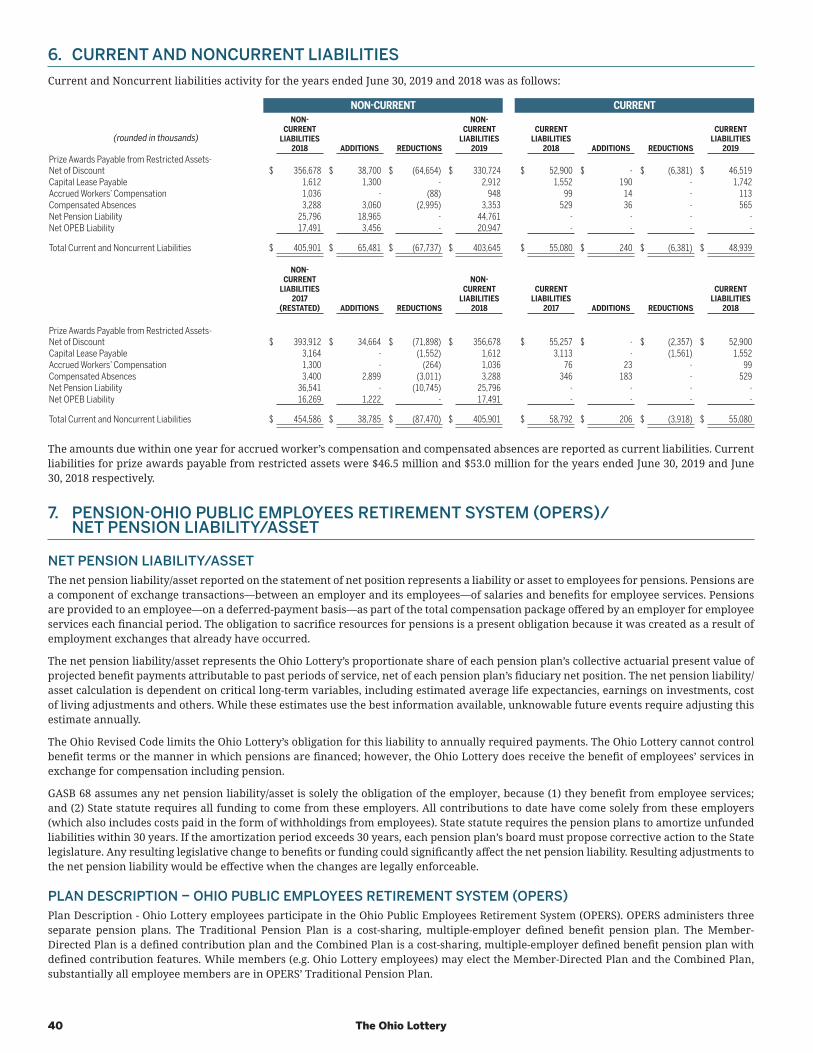
40 The Ohio Lottery
6. CURRENT AND NONCURRENT LIABILITIESCurrent and Noncurrent liabilities activity for the years ended June 30, 2019 and 2018 was as follows:
NON-CURRENT CURRENT
(rounded in thousands)
NON-CURRENT
LIABILITIES 2018 ADDITIONS REDUCTIONS
NON-CURRENT
LIABILITIES 2019
CURRENT LIABILITIES
2018 ADDITIONS REDUCTIONS
CURRENT LIABILITIES
2019Prize Awards Payable from Restricted Assets- Net of Discount $ 356,678 $ 38,700 $ (64,654) $ 330,724 $ 52,900 $ - $ (6,381) $ 46,519Capital Lease Payable 1,612 1,300 - 2,912 1,552 190 - 1,742Accrued Workers’ Compensation 1,036 - (88) 948 99 14 - 113Compensated Absences 3,288 3,060 (2,995) 3,353 529 36 - 565Net Pension Liability 25,796 18,965 - 44,761 - - - -Net OPEB Liability 17,491 3,456 - 20,947 - - - -
Total Current and Noncurrent Liabilities $ 405,901 $ 65,481 $ (67,737) $ 403,645 $ 55,080 $ 240 $ (6,381) $ 48,939
NON-CURRENT
LIABILITIES 2017
(RESTATED) ADDITIONS REDUCTIONS
NON-CURRENT
LIABILITIES 2018
CURRENT LIABILITIES
2017 ADDITIONS REDUCTIONS
CURRENT LIABILITIES
2018
Prize Awards Payable from Restricted Assets- Net of Discount $ 393,912 $ 34,664 $ (71,898) $ 356,678 $ 55,257 $ - $ (2,357) $ 52,900Capital Lease Payable 3,164 - (1,552) 1,612 3,113 - (1,561) 1,552Accrued Workers’ Compensation 1,300 - (264) 1,036 76 23 - 99Compensated Absences 3,400 2,899 (3,011) 3,288 346 183 - 529Net Pension Liability 36,541 - (10,745) 25,796 - - - -Net OPEB Liability 16,269 1,222 - 17,491 - - - -
Total Current and Noncurrent Liabilities $ 454,586 $ 38,785 $ (87,470) $ 405,901 $ 58,792 $ 206 $ (3,918) $ 55,080
The amounts due within one year for accrued worker’s compensation and compensated absences are reported as current liabilities. Current liabilities for prize awards payable from restricted assets were $46.5 million and $53.0 million for the years ended June 30, 2019 and June 30, 2018 respectively.
7. PENSION-OHIO PUBLIC EMPLOYEES RETIREMENT SYSTEM (OPERS)/ NET PENSION LIABILITY/ASSET
NET PENSION LIABILITY/ASSETThe net pension liability/asset reported on the statement of net position represents a liability or asset to employees for pensions. Pensions are a component of exchange transactions––between an employer and its employees—of salaries and benefits for employee services. Pensions are provided to an employee—on a deferred-payment basis—as part of the total compensation package offered by an employer for employee services each financial period. The obligation to sacrifice resources for pensions is a present obligation because it was created as a result of employment exchanges that already have occurred.
The net pension liability/asset represents the Ohio Lottery’s proportionate share of each pension plan’s collective actuarial present value of projected benefit payments attributable to past periods of service, net of each pension plan’s fiduciary net position. The net pension liability/asset calculation is dependent on critical long-term variables, including estimated average life expectancies, earnings on investments, cost of living adjustments and others. While these estimates use the best information available, unknowable future events require adjusting this estimate annually.
The Ohio Revised Code limits the Ohio Lottery’s obligation for this liability to annually required payments. The Ohio Lottery cannot control benefit terms or the manner in which pensions are financed; however, the Ohio Lottery does receive the benefit of employees’ services in exchange for compensation including pension.
GASB 68 assumes any net pension liability/asset is solely the obligation of the employer, because (1) they benefit from employee services; and (2) State statute requires all funding to come from these employers. All contributions to date have come solely from these employers (which also includes costs paid in the form of withholdings from employees). State statute requires the pension plans to amortize unfunded liabilities within 30 years. If the amortization period exceeds 30 years, each pension plan’s board must propose corrective action to the State legislature. Any resulting legislative change to benefits or funding could significantly affect the net pension liability. Resulting adjustments to the net pension liability would be effective when the changes are legally enforceable.
PLAN DESCRIPTION – OHIO PUBLIC EMPLOYEES RETIREMENT SYSTEM (OPERS)Plan Description - Ohio Lottery employees participate in the Ohio Public Employees Retirement System (OPERS). OPERS administers three separate pension plans. The Traditional Pension Plan is a cost-sharing, multiple-employer defined benefit pension plan. The Member-Directed Plan is a defined contribution plan and the Combined Plan is a cost-sharing, multiple-employer defined benefit pension plan with defined contribution features. While members (e.g. Ohio Lottery employees) may elect the Member-Directed Plan and the Combined Plan, substantially all employee members are in OPERS’ Traditional Pension Plan.
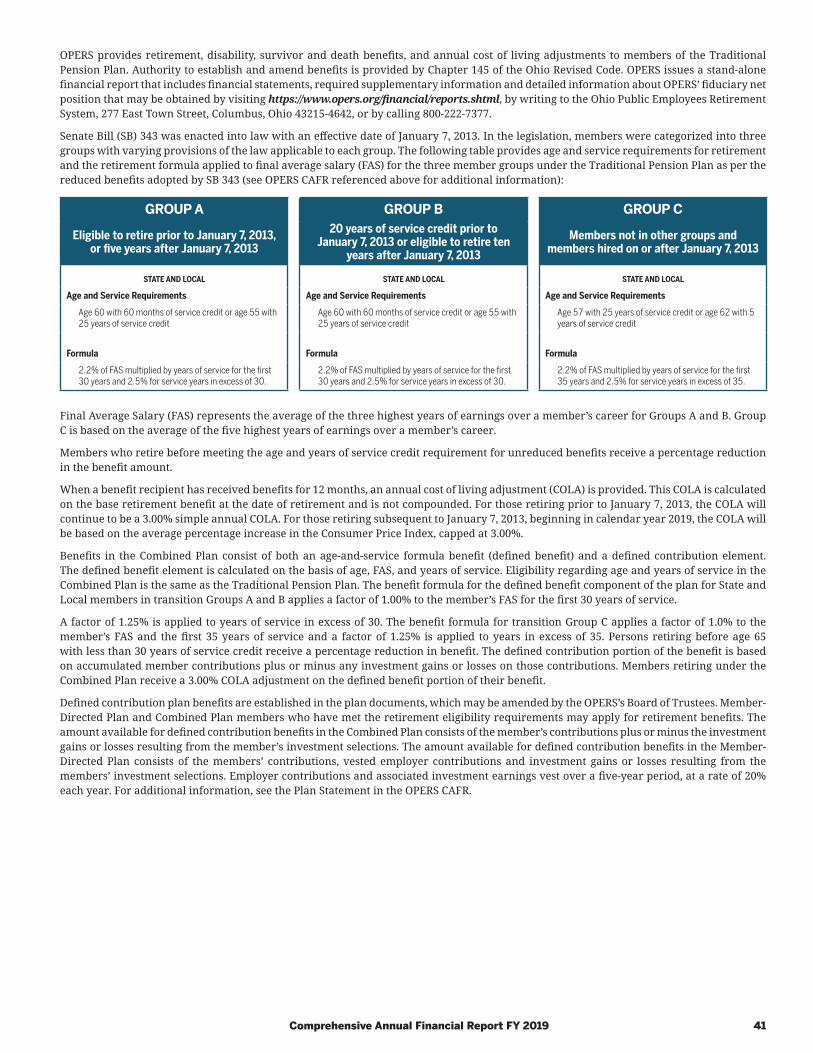
Comprehensive Annual Financial Report FY 2019 41
OPERS provides retirement, disability, survivor and death benefits, and annual cost of living adjustments to members of the Traditional Pension Plan. Authority to establish and amend benefits is provided by Chapter 145 of the Ohio Revised Code. OPERS issues a stand-alone financial report that includes financial statements, required supplementary information and detailed information about OPERS’ fiduciary net position that may be obtained by visiting https://www.opers.org/financial/reports.shtml, by writing to the Ohio Public Employees Retirement System, 277 East Town Street, Columbus, Ohio 43215-4642, or by calling 800-222-7377.
Senate Bill (SB) 343 was enacted into law with an effective date of January 7, 2013. In the legislation, members were categorized into three groups with varying provisions of the law applicable to each group. The following table provides age and service requirements for retirement and the retirement formula applied to final average salary (FAS) for the three member groups under the Traditional Pension Plan as per the reduced benefits adopted by SB 343 (see OPERS CAFR referenced above for additional information):
GROUP A GROUP B GROUP C
Eligible to retire prior to January 7, 2013, or five years after January 7, 2013
20 years of service credit prior to January 7, 2013 or eligible to retire ten
years after January 7, 2013Members not in other groups and
members hired on or after January 7, 2013
STATE AND LOCAL STATE AND LOCAL STATE AND LOCAL
Age and Service Requirements Age and Service Requirements Age and Service Requirements
Age 60 with 60 months of service credit or age 55 with 25 years of service credit
Age 60 with 60 months of service credit or age 55 with 25 years of service credit
Age 57 with 25 years of service credit or age 62 with 5 years of service credit
Formula Formula Formula
2.2% of FAS multiplied by years of service for the first 30 years and 2.5% for service years in excess of 30.
2.2% of FAS multiplied by years of service for the first 30 years and 2.5% for service years in excess of 30.
2.2% of FAS multiplied by years of service for the first 35 years and 2.5% for service years in excess of 35.
Final Average Salary (FAS) represents the average of the three highest years of earnings over a member’s career for Groups A and B. Group C is based on the average of the five highest years of earnings over a member’s career.
Members who retire before meeting the age and years of service credit requirement for unreduced benefits receive a percentage reduction in the benefit amount.
When a benefit recipient has received benefits for 12 months, an annual cost of living adjustment (COLA) is provided. This COLA is calculated on the base retirement benefit at the date of retirement and is not compounded. For those retiring prior to January 7, 2013, the COLA will continue to be a 3.00% simple annual COLA. For those retiring subsequent to January 7, 2013, beginning in calendar year 2019, the COLA will be based on the average percentage increase in the Consumer Price Index, capped at 3.00%.
Benefits in the Combined Plan consist of both an age-and-service formula benefit (defined benefit) and a defined contribution element. The defined benefit element is calculated on the basis of age, FAS, and years of service. Eligibility regarding age and years of service in the Combined Plan is the same as the Traditional Pension Plan. The benefit formula for the defined benefit component of the plan for State and Local members in transition Groups A and B applies a factor of 1.00% to the member’s FAS for the first 30 years of service.
A factor of 1.25% is applied to years of service in excess of 30. The benefit formula for transition Group C applies a factor of 1.0% to the member’s FAS and the first 35 years of service and a factor of 1.25% is applied to years in excess of 35. Persons retiring before age 65 with less than 30 years of service credit receive a percentage reduction in benefit. The defined contribution portion of the benefit is based on accumulated member contributions plus or minus any investment gains or losses on those contributions. Members retiring under the Combined Plan receive a 3.00% COLA adjustment on the defined benefit portion of their benefit.
Defined contribution plan benefits are established in the plan documents, which may be amended by the OPERS’s Board of Trustees. Member-Directed Plan and Combined Plan members who have met the retirement eligibility requirements may apply for retirement benefits. The amount available for defined contribution benefits in the Combined Plan consists of the member’s contributions plus or minus the investment gains or losses resulting from the member’s investment selections. The amount available for defined contribution benefits in the Member-Directed Plan consists of the members’ contributions, vested employer contributions and investment gains or losses resulting from the members’ investment selections. Employer contributions and associated investment earnings vest over a five-year period, at a rate of 20% each year. For additional information, see the Plan Statement in the OPERS CAFR.
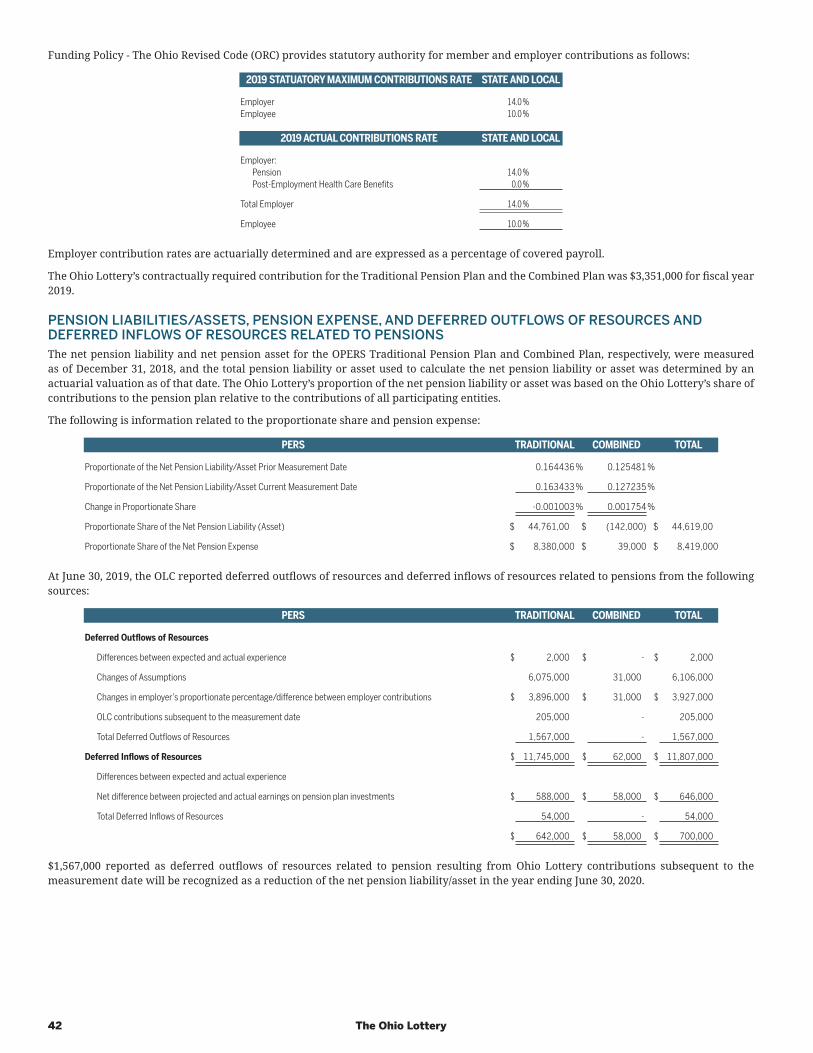
42 The Ohio Lottery
Funding Policy - The Ohio Revised Code (ORC) provides statutory authority for member and employer contributions as follows:
2019 STATUATORY MAXIMUM CONTRIBUTIONS RATE STATE AND LOCAL
Employer 14.0 %Employee 10.0 %
2019 ACTUAL CONTRIBUTIONS RATE STATE AND LOCAL
Employer:Pension 14.0 %Post-Employment Health Care Benefits 0.0 %
Total Employer 14.0 %
Employee 10.0 %
Employer contribution rates are actuarially determined and are expressed as a percentage of covered payroll.
The Ohio Lottery’s contractually required contribution for the Traditional Pension Plan and the Combined Plan was $3,351,000 for fiscal year 2019.
PENSION LIABILITIES/ASSETS, PENSION EXPENSE, AND DEFERRED OUTFLOWS OF RESOURCES AND DEFERRED INFLOWS OF RESOURCES RELATED TO PENSIONSThe net pension liability and net pension asset for the OPERS Traditional Pension Plan and Combined Plan, respectively, were measured as of December 31, 2018, and the total pension liability or asset used to calculate the net pension liability or asset was determined by an actuarial valuation as of that date. The Ohio Lottery’s proportion of the net pension liability or asset was based on the Ohio Lottery’s share of contributions to the pension plan relative to the contributions of all participating entities.
The following is information related to the proportionate share and pension expense:
PERS TRADITIONAL COMBINED TOTAL
Proportionate of the Net Pension Liability/Asset Prior Measurement Date 0.164436 % 0.125481 %
Proportionate of the Net Pension Liability/Asset Current Measurement Date 0.163433 % 0.127235 %
Change in Proportionate Share -0.001003 % 0.001754 %
Proportionate Share of the Net Pension Liability (Asset) $ 44,761,000 $ (142,000) $ 44,619,000
Proportionate Share of the Net Pension Expense $ 8,380,000 $ 39,000 $ 8,419,000
At June 30, 2019, the OLC reported deferred outflows of resources and deferred inflows of resources related to pensions from the following sources:
PERS TRADITIONAL COMBINED TOTAL
Deferred Outflows of Resources
Differences between expected and actual experience $ 2,000 $ - $ 2,000
Changes of Assumptions 6,075,000 31,000 6,106,000
Changes in employer’s proportionate percentage/difference between employer contributions $ 3,896,000 $ 31,000 $ 3,927,000
OLC contributions subsequent to the measurement date 205,000 - 205,000
Total Deferred Outflows of Resources 1,567,000 - 1,567,000
Deferred Inflows of Resources $ 11,745,000 $ 62,000 $ 11,807,000
Differences between expected and actual experience
Net difference between projected and actual earnings on pension plan investments $ 588,000 $ 58,000 $ 646,000
Total Deferred Inflows of Resources 54,000 - 54,000
$ 642,000 $ 58,000 $ 700,000
$1,567,000 reported as deferred outflows of resources related to pension resulting from Ohio Lottery contributions subsequent to the measurement date will be recognized as a reduction of the net pension liability/asset in the year ending June 30, 2020.
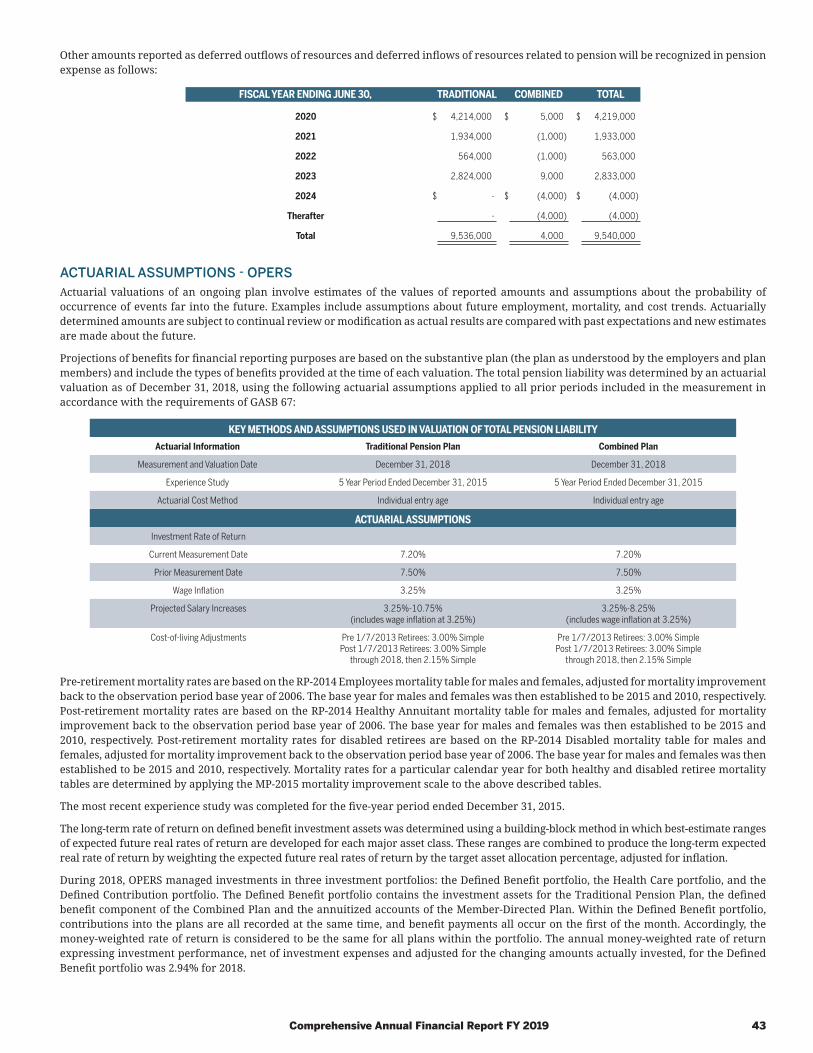
Comprehensive Annual Financial Report FY 2019 43
Other amounts reported as deferred outflows of resources and deferred inflows of resources related to pension will be recognized in pension expense as follows:
FISCAL YEAR ENDING JUNE 30, TRADITIONAL COMBINED TOTAL
2020 $ 4,214,000 $ 5,000 $ 4,219,000
2021 1,934,000 (1,000) 1,933,000
2022 564,000 (1,000) 563,000
2023 2,824,000 9,000 2,833,000
2024 $ - $ (4,000) $ (4,000)
Therafter - (4,000) (4,000)
Total 9,536,000 4,000 9,540,000
ACTUARIAL ASSUMPTIONS - OPERSActuarial valuations of an ongoing plan involve estimates of the values of reported amounts and assumptions about the probability of occurrence of events far into the future. Examples include assumptions about future employment, mortality, and cost trends. Actuarially determined amounts are subject to continual review or modification as actual results are compared with past expectations and new estimates are made about the future.
Projections of benefits for financial reporting purposes are based on the substantive plan (the plan as understood by the employers and plan members) and include the types of benefits provided at the time of each valuation. The total pension liability was determined by an actuarial valuation as of December 31, 2018, using the following actuarial assumptions applied to all prior periods included in the measurement in accordance with the requirements of GASB 67:
KEY METHODS AND ASSUMPTIONS USED IN VALUATION OF TOTAL PENSION LIABILITYActuarial Information Traditional Pension Plan Combined Plan
Measurement and Valuation Date December 31, 2018 December 31, 2018
Experience Study 5 Year Period Ended December 31, 2015 5 Year Period Ended December 31, 2015
Actuarial Cost Method Individual entry age Individual entry age
ACTUARIAL ASSUMPTIONS Investment Rate of Return
Current Measurement Date 7.20% 7.20%
Prior Measurement Date 7.50% 7.50%
Wage Inflation 3.25% 3.25%
Projected Salary Increases 3.25%-10.75% (includes wage inflation at 3.25%)
3.25%-8.25% (includes wage inflation at 3.25%)
Cost-of-living Adjustments Pre 1/7/2013 Retirees: 3.00% Simple Post 1/7/2013 Retirees: 3.00% Simple
through 2018, then 2.15% Simple
Pre 1/7/2013 Retirees: 3.00% Simple Post 1/7/2013 Retirees: 3.00% Simple
through 2018, then 2.15% Simple
Pre-retirement mortality rates are based on the RP-2014 Employees mortality table for males and females, adjusted for mortality improvement back to the observation period base year of 2006. The base year for males and females was then established to be 2015 and 2010, respectively. Post-retirement mortality rates are based on the RP-2014 Healthy Annuitant mortality table for males and females, adjusted for mortality improvement back to the observation period base year of 2006. The base year for males and females was then established to be 2015 and 2010, respectively. Post-retirement mortality rates for disabled retirees are based on the RP-2014 Disabled mortality table for males and females, adjusted for mortality improvement back to the observation period base year of 2006. The base year for males and females was then established to be 2015 and 2010, respectively. Mortality rates for a particular calendar year for both healthy and disabled retiree mortality tables are determined by applying the MP-2015 mortality improvement scale to the above described tables.
The most recent experience study was completed for the five-year period ended December 31, 2015.
The long-term rate of return on defined benefit investment assets was determined using a building-block method in which best-estimate ranges of expected future real rates of return are developed for each major asset class. These ranges are combined to produce the long-term expected real rate of return by weighting the expected future real rates of return by the target asset allocation percentage, adjusted for inflation.
During 2018, OPERS managed investments in three investment portfolios: the Defined Benefit portfolio, the Health Care portfolio, and the Defined Contribution portfolio. The Defined Benefit portfolio contains the investment assets for the Traditional Pension Plan, the defined benefit component of the Combined Plan and the annuitized accounts of the Member-Directed Plan. Within the Defined Benefit portfolio, contributions into the plans are all recorded at the same time, and benefit payments all occur on the first of the month. Accordingly, the money-weighted rate of return is considered to be the same for all plans within the portfolio. The annual money-weighted rate of return expressing investment performance, net of investment expenses and adjusted for the changing amounts actually invested, for the Defined Benefit portfolio was 2.94% for 2018.
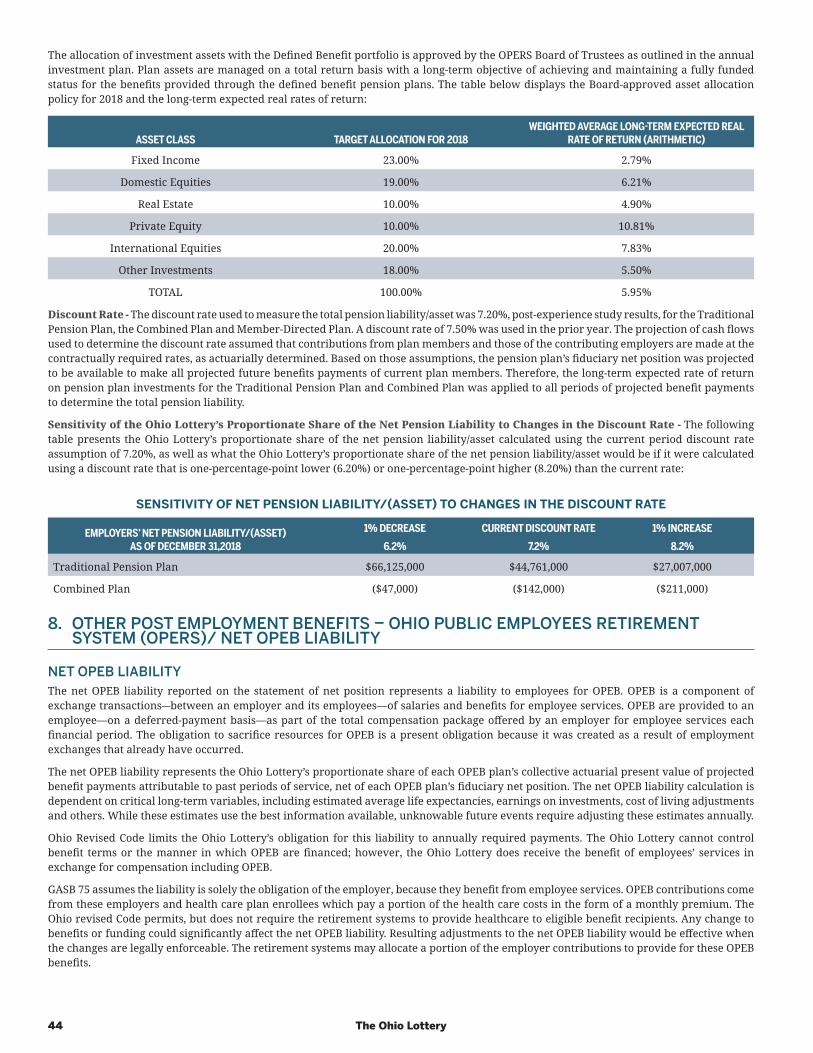
44 The Ohio Lottery
The allocation of investment assets with the Defined Benefit portfolio is approved by the OPERS Board of Trustees as outlined in the annual investment plan. Plan assets are managed on a total return basis with a long-term objective of achieving and maintaining a fully funded status for the benefits provided through the defined benefit pension plans. The table below displays the Board-approved asset allocation policy for 2018 and the long-term expected real rates of return:
ASSET CLASS TARGET ALLOCATION FOR 2018WEIGHTED AVERAGE LONG-TERM EXPECTED REAL
RATE OF RETURN (ARITHMETIC)
Fixed Income 23.00% 2.79%
Domestic Equities 19.00% 6.21%
Real Estate 10.00% 4.90%
Private Equity 10.00% 10.81%
International Equities 20.00% 7.83%
Other Investments 18.00% 5.50%
TOTAL 100.00% 5.95%
Discount Rate - The discount rate used to measure the total pension liability/asset was 7.20%, post-experience study results, for the Traditional Pension Plan, the Combined Plan and Member-Directed Plan. A discount rate of 7.50% was used in the prior year. The projection of cash flows used to determine the discount rate assumed that contributions from plan members and those of the contributing employers are made at the contractually required rates, as actuarially determined. Based on those assumptions, the pension plan’s fiduciary net position was projected to be available to make all projected future benefits payments of current plan members. Therefore, the long-term expected rate of return on pension plan investments for the Traditional Pension Plan and Combined Plan was applied to all periods of projected benefit payments to determine the total pension liability.
Sensitivity of the Ohio Lottery’s Proportionate Share of the Net Pension Liability to Changes in the Discount Rate - The following table presents the Ohio Lottery’s proportionate share of the net pension liability/asset calculated using the current period discount rate assumption of 7.20%, as well as what the Ohio Lottery’s proportionate share of the net pension liability/asset would be if it were calculated using a discount rate that is one-percentage-point lower (6.20%) or one-percentage-point higher (8.20%) than the current rate:
SENSITIVITY OF NET PENSION LIABILITY/(ASSET) TO CHANGES IN THE DISCOUNT RATE
EMPLOYERS’ NET PENSION LIABILITY/(ASSET)AS OF DECEMBER 31,2018
1% DECREASE CURRENT DISCOUNT RATE 1% INCREASE6.2% 7.2% 8.2%
Traditional Pension Plan $66,125,000 $44,761,000 $27,007,000
Combined Plan ($47,000) ($142,000) ($211,000)
8. OTHER POST EMPLOYMENT BENEFITS – OHIO PUBLIC EMPLOYEES RETIREMENT SYSTEM (OPERS)/ NET OPEB LIABILITY
NET OPEB LIABILITYThe net OPEB liability reported on the statement of net position represents a liability to employees for OPEB. OPEB is a component of exchange transactions-–between an employer and its employees—of salaries and benefits for employee services. OPEB are provided to an employee—on a deferred-payment basis—as part of the total compensation package offered by an employer for employee services each financial period. The obligation to sacrifice resources for OPEB is a present obligation because it was created as a result of employment exchanges that already have occurred.
The net OPEB liability represents the Ohio Lottery’s proportionate share of each OPEB plan’s collective actuarial present value of projected benefit payments attributable to past periods of service, net of each OPEB plan’s fiduciary net position. The net OPEB liability calculation is dependent on critical long-term variables, including estimated average life expectancies, earnings on investments, cost of living adjustments and others. While these estimates use the best information available, unknowable future events require adjusting these estimates annually.
Ohio Revised Code limits the Ohio Lottery’s obligation for this liability to annually required payments. The Ohio Lottery cannot control benefit terms or the manner in which OPEB are financed; however, the Ohio Lottery does receive the benefit of employees’ services in exchange for compensation including OPEB.
GASB 75 assumes the liability is solely the obligation of the employer, because they benefit from employee services. OPEB contributions come from these employers and health care plan enrollees which pay a portion of the health care costs in the form of a monthly premium. The Ohio revised Code permits, but does not require the retirement systems to provide healthcare to eligible benefit recipients. Any change to benefits or funding could significantly affect the net OPEB liability. Resulting adjustments to the net OPEB liability would be effective when the changes are legally enforceable. The retirement systems may allocate a portion of the employer contributions to provide for these OPEB benefits.
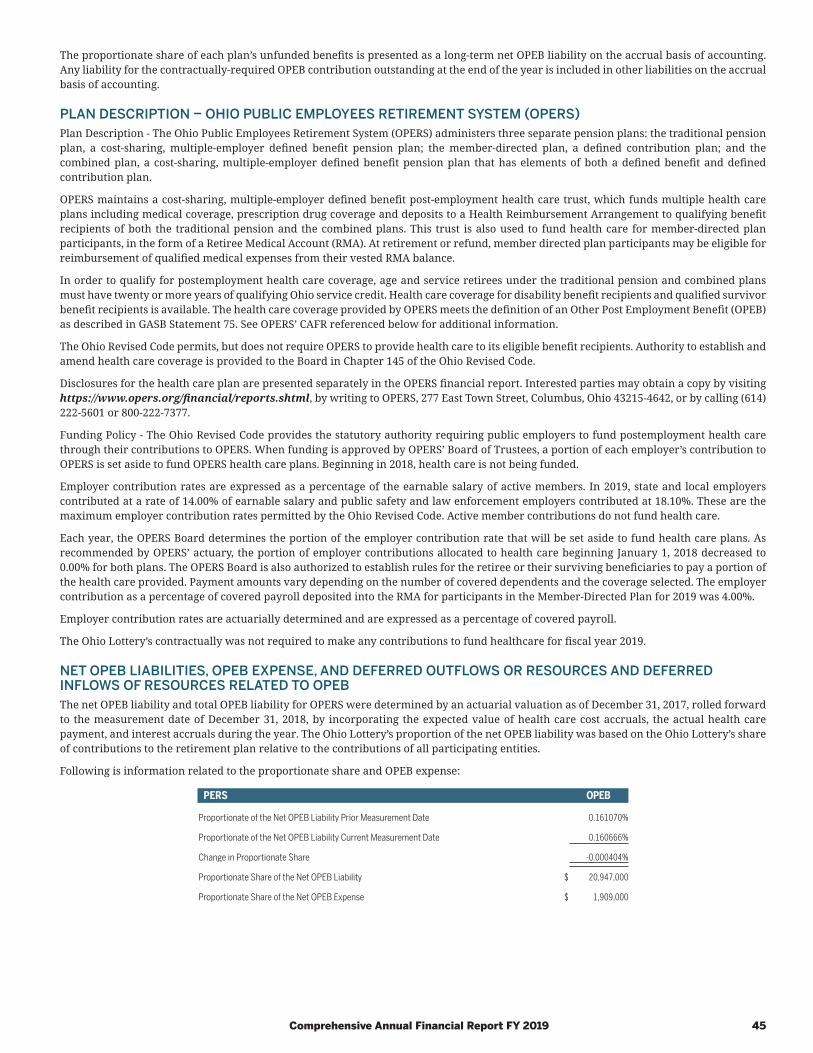
Comprehensive Annual Financial Report FY 2019 45
The proportionate share of each plan’s unfunded benefits is presented as a long-term net OPEB liability on the accrual basis of accounting. Any liability for the contractually-required OPEB contribution outstanding at the end of the year is included in other liabilities on the accrual basis of accounting.
PLAN DESCRIPTION – OHIO PUBLIC EMPLOYEES RETIREMENT SYSTEM (OPERS)Plan Description - The Ohio Public Employees Retirement System (OPERS) administers three separate pension plans: the traditional pension plan, a cost-sharing, multiple-employer defined benefit pension plan; the member-directed plan, a defined contribution plan; and the combined plan, a cost-sharing, multiple-employer defined benefit pension plan that has elements of both a defined benefit and defined contribution plan.
OPERS maintains a cost-sharing, multiple-employer defined benefit post-employment health care trust, which funds multiple health care plans including medical coverage, prescription drug coverage and deposits to a Health Reimbursement Arrangement to qualifying benefit recipients of both the traditional pension and the combined plans. This trust is also used to fund health care for member-directed plan participants, in the form of a Retiree Medical Account (RMA). At retirement or refund, member directed plan participants may be eligible for reimbursement of qualified medical expenses from their vested RMA balance.
In order to qualify for postemployment health care coverage, age and service retirees under the traditional pension and combined plans must have twenty or more years of qualifying Ohio service credit. Health care coverage for disability benefit recipients and qualified survivor benefit recipients is available. The health care coverage provided by OPERS meets the definition of an Other Post Employment Benefit (OPEB) as described in GASB Statement 75. See OPERS’ CAFR referenced below for additional information.
The Ohio Revised Code permits, but does not require OPERS to provide health care to its eligible benefit recipients. Authority to establish and amend health care coverage is provided to the Board in Chapter 145 of the Ohio Revised Code.
Disclosures for the health care plan are presented separately in the OPERS financial report. Interested parties may obtain a copy by visiting https://www.opers.org/financial/reports.shtml, by writing to OPERS, 277 East Town Street, Columbus, Ohio 43215-4642, or by calling (614) 222-5601 or 800-222-7377.
Funding Policy - The Ohio Revised Code provides the statutory authority requiring public employers to fund postemployment health care through their contributions to OPERS. When funding is approved by OPERS’ Board of Trustees, a portion of each employer’s contribution to OPERS is set aside to fund OPERS health care plans. Beginning in 2018, health care is not being funded.
Employer contribution rates are expressed as a percentage of the earnable salary of active members. In 2019, state and local employers contributed at a rate of 14.00% of earnable salary and public safety and law enforcement employers contributed at 18.10%. These are the maximum employer contribution rates permitted by the Ohio Revised Code. Active member contributions do not fund health care.
Each year, the OPERS Board determines the portion of the employer contribution rate that will be set aside to fund health care plans. As recommended by OPERS’ actuary, the portion of employer contributions allocated to health care beginning January 1, 2018 decreased to 0.00% for both plans. The OPERS Board is also authorized to establish rules for the retiree or their surviving beneficiaries to pay a portion of the health care provided. Payment amounts vary depending on the number of covered dependents and the coverage selected. The employer contribution as a percentage of covered payroll deposited into the RMA for participants in the Member-Directed Plan for 2019 was 4.00%.
Employer contribution rates are actuarially determined and are expressed as a percentage of covered payroll.
The Ohio Lottery’s contractually was not required to make any contributions to fund healthcare for fiscal year 2019.
NET OPEB LIABILITIES, OPEB EXPENSE, AND DEFERRED OUTFLOWS OR RESOURCES AND DEFERRED INFLOWS OF RESOURCES RELATED TO OPEBThe net OPEB liability and total OPEB liability for OPERS were determined by an actuarial valuation as of December 31, 2017, rolled forward to the measurement date of December 31, 2018, by incorporating the expected value of health care cost accruals, the actual health care payment, and interest accruals during the year. The Ohio Lottery’s proportion of the net OPEB liability was based on the Ohio Lottery’s share of contributions to the retirement plan relative to the contributions of all participating entities.
Following is information related to the proportionate share and OPEB expense:
PERS OPEB
Proportionate of the Net OPEB Liability Prior Measurement Date 0.161070%
Proportionate of the Net OPEB Liability Current Measurement Date 0.160666%
Change in Proportionate Share -0.000404%
Proportionate Share of the Net OPEB Liability $ 20,947,000
Proportionate Share of the Net OPEB Expense $ 1,909,000
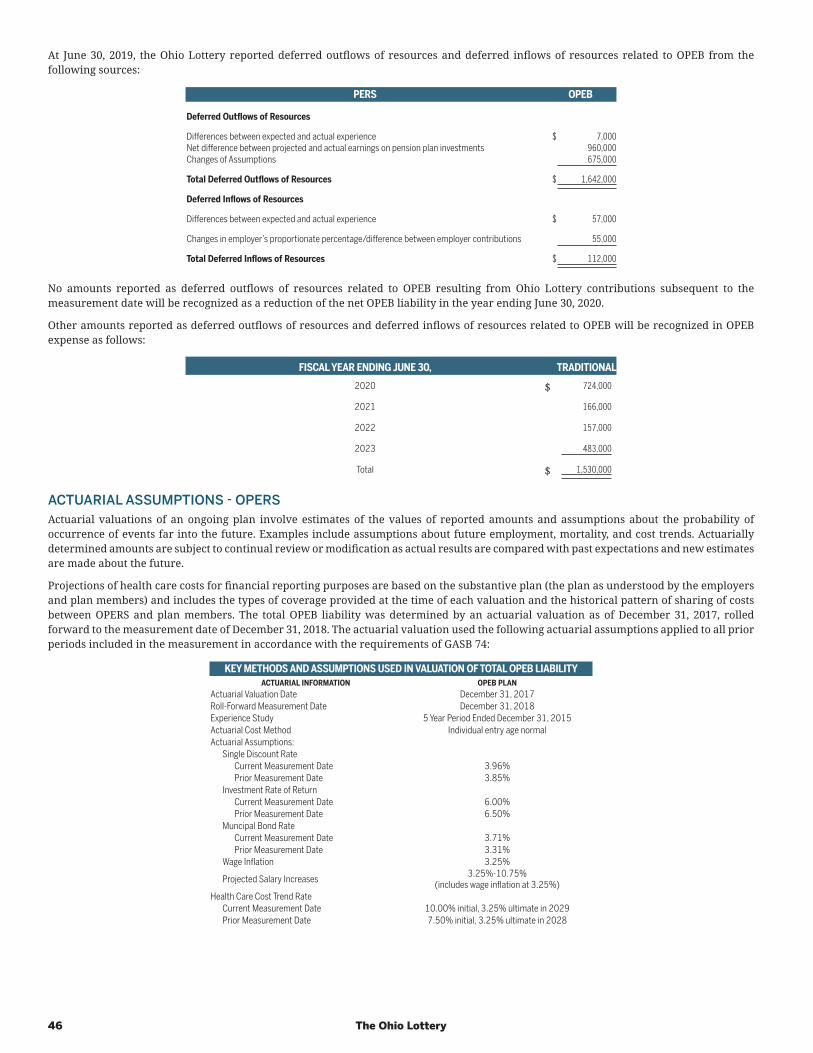
46 The Ohio Lottery
At June 30, 2019, the Ohio Lottery reported deferred outflows of resources and deferred inflows of resources related to OPEB from the following sources:
PERS OPEB
Deferred Outflows of Resources
Differences between expected and actual experience $ 7,000Net difference between projected and actual earnings on pension plan investments 960,000Changes of Assumptions 675,000
Total Deferred Outflows of Resources $ 1,642,000
Deferred Inflows of Resources
Differences between expected and actual experience $ 57,000
Changes in employer’s proportionate percentage/difference between employer contributions 55,000
Total Deferred Inflows of Resources $ 112,000
No amounts reported as deferred outflows of resources related to OPEB resulting from Ohio Lottery contributions subsequent to the measurement date will be recognized as a reduction of the net OPEB liability in the year ending June 30, 2020.
Other amounts reported as deferred outflows of resources and deferred inflows of resources related to OPEB will be recognized in OPEB expense as follows:
FISCAL YEAR ENDING JUNE 30, TRADITIONAL2020 $ 724,000
2021 166,000
2022 157,000
2023 483,000
Total $ 1,530,000
ACTUARIAL ASSUMPTIONS - OPERSActuarial valuations of an ongoing plan involve estimates of the values of reported amounts and assumptions about the probability of occurrence of events far into the future. Examples include assumptions about future employment, mortality, and cost trends. Actuarially determined amounts are subject to continual review or modification as actual results are compared with past expectations and new estimates are made about the future.
Projections of health care costs for financial reporting purposes are based on the substantive plan (the plan as understood by the employers and plan members) and includes the types of coverage provided at the time of each valuation and the historical pattern of sharing of costs between OPERS and plan members. The total OPEB liability was determined by an actuarial valuation as of December 31, 2017, rolled forward to the measurement date of December 31, 2018. The actuarial valuation used the following actuarial assumptions applied to all prior periods included in the measurement in accordance with the requirements of GASB 74:
KEY METHODS AND ASSUMPTIONS USED IN VALUATION OF TOTAL OPEB LIABILITYACTUARIAL INFORMATION OPEB PLAN
Actuarial Valuation Date December 31, 2017Roll-Forward Measurement Date December 31, 2018Experience Study 5 Year Period Ended December 31, 2015Actuarial Cost Method Individual entry age normalActuarial Assumptions:
Single Discount Rate Current Measurement Date 3.96%Prior Measurement Date 3.85%
Investment Rate of ReturnCurrent Measurement Date 6.00%Prior Measurement Date 6.50%
Muncipal Bond RateCurrent Measurement Date 3.71%Prior Measurement Date 3.31%
Wage Inflation 3.25%
Projected Salary Increases 3.25%-10.75% (includes wage inflation at 3.25%)
Health Care Cost Trend RateCurrent Measurement Date 10.00% initial, 3.25% ultimate in 2029Prior Measurement Date 7.50% initial, 3.25% ultimate in 2028
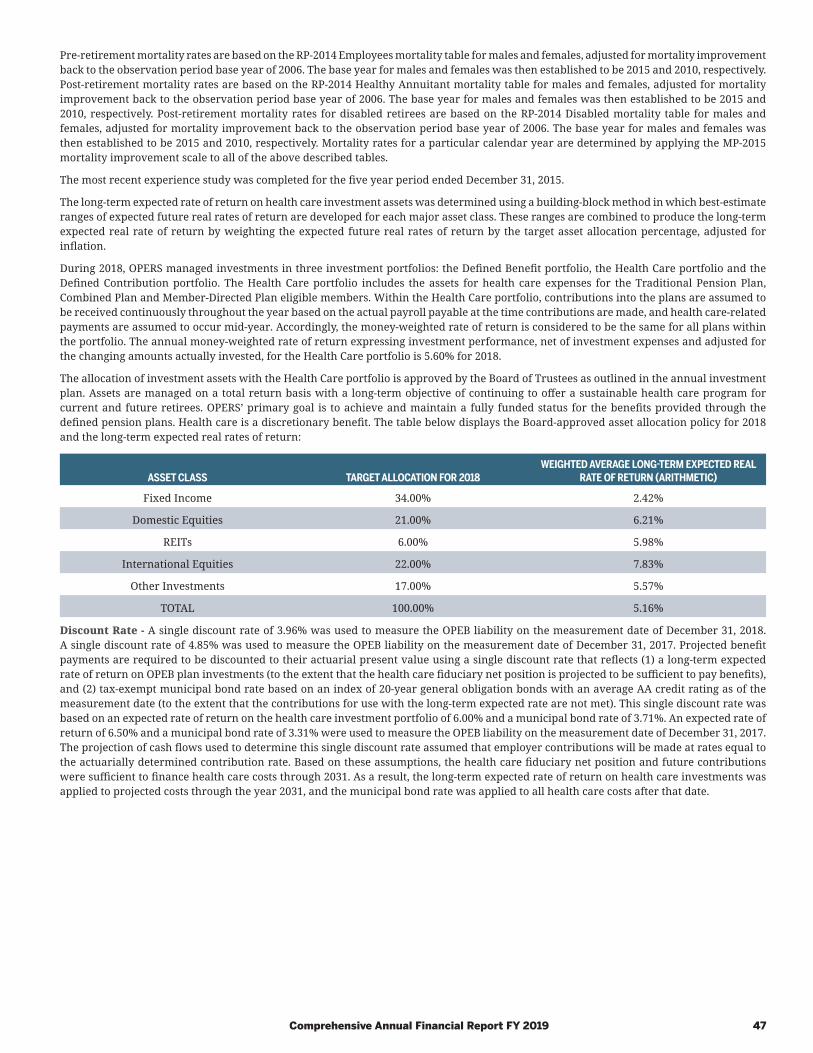
Comprehensive Annual Financial Report FY 2019 47
Pre-retirement mortality rates are based on the RP-2014 Employees mortality table for males and females, adjusted for mortality improvement back to the observation period base year of 2006. The base year for males and females was then established to be 2015 and 2010, respectively. Post-retirement mortality rates are based on the RP-2014 Healthy Annuitant mortality table for males and females, adjusted for mortality improvement back to the observation period base year of 2006. The base year for males and females was then established to be 2015 and 2010, respectively. Post-retirement mortality rates for disabled retirees are based on the RP-2014 Disabled mortality table for males and females, adjusted for mortality improvement back to the observation period base year of 2006. The base year for males and females was then established to be 2015 and 2010, respectively. Mortality rates for a particular calendar year are determined by applying the MP-2015 mortality improvement scale to all of the above described tables.
The most recent experience study was completed for the five year period ended December 31, 2015.
The long-term expected rate of return on health care investment assets was determined using a building-block method in which best-estimate ranges of expected future real rates of return are developed for each major asset class. These ranges are combined to produce the long-term expected real rate of return by weighting the expected future real rates of return by the target asset allocation percentage, adjusted for inflation.
During 2018, OPERS managed investments in three investment portfolios: the Defined Benefit portfolio, the Health Care portfolio and the Defined Contribution portfolio. The Health Care portfolio includes the assets for health care expenses for the Traditional Pension Plan, Combined Plan and Member-Directed Plan eligible members. Within the Health Care portfolio, contributions into the plans are assumed to be received continuously throughout the year based on the actual payroll payable at the time contributions are made, and health care-related payments are assumed to occur mid-year. Accordingly, the money-weighted rate of return is considered to be the same for all plans within the portfolio. The annual money-weighted rate of return expressing investment performance, net of investment expenses and adjusted for the changing amounts actually invested, for the Health Care portfolio is 5.60% for 2018.
The allocation of investment assets with the Health Care portfolio is approved by the Board of Trustees as outlined in the annual investment plan. Assets are managed on a total return basis with a long-term objective of continuing to offer a sustainable health care program for current and future retirees. OPERS’ primary goal is to achieve and maintain a fully funded status for the benefits provided through the defined pension plans. Health care is a discretionary benefit. The table below displays the Board-approved asset allocation policy for 2018 and the long-term expected real rates of return:
ASSET CLASS TARGET ALLOCATION FOR 2018WEIGHTED AVERAGE LONG-TERM EXPECTED REAL
RATE OF RETURN (ARITHMETIC)
Fixed Income 34.00% 2.42%
Domestic Equities 21.00% 6.21%
REITs 6.00% 5.98%
International Equities 22.00% 7.83%
Other Investments 17.00% 5.57%
TOTAL 100.00% 5.16%
Discount Rate - A single discount rate of 3.96% was used to measure the OPEB liability on the measurement date of December 31, 2018. A single discount rate of 4.85% was used to measure the OPEB liability on the measurement date of December 31, 2017. Projected benefit payments are required to be discounted to their actuarial present value using a single discount rate that reflects (1) a long-term expected rate of return on OPEB plan investments (to the extent that the health care fiduciary net position is projected to be sufficient to pay benefits), and (2) tax-exempt municipal bond rate based on an index of 20-year general obligation bonds with an average AA credit rating as of the measurement date (to the extent that the contributions for use with the long-term expected rate are not met). This single discount rate was based on an expected rate of return on the health care investment portfolio of 6.00% and a municipal bond rate of 3.71%. An expected rate of return of 6.50% and a municipal bond rate of 3.31% were used to measure the OPEB liability on the measurement date of December 31, 2017. The projection of cash flows used to determine this single discount rate assumed that employer contributions will be made at rates equal to the actuarially determined contribution rate. Based on these assumptions, the health care fiduciary net position and future contributions were sufficient to finance health care costs through 2031. As a result, the long-term expected rate of return on health care investments was applied to projected costs through the year 2031, and the municipal bond rate was applied to all health care costs after that date.
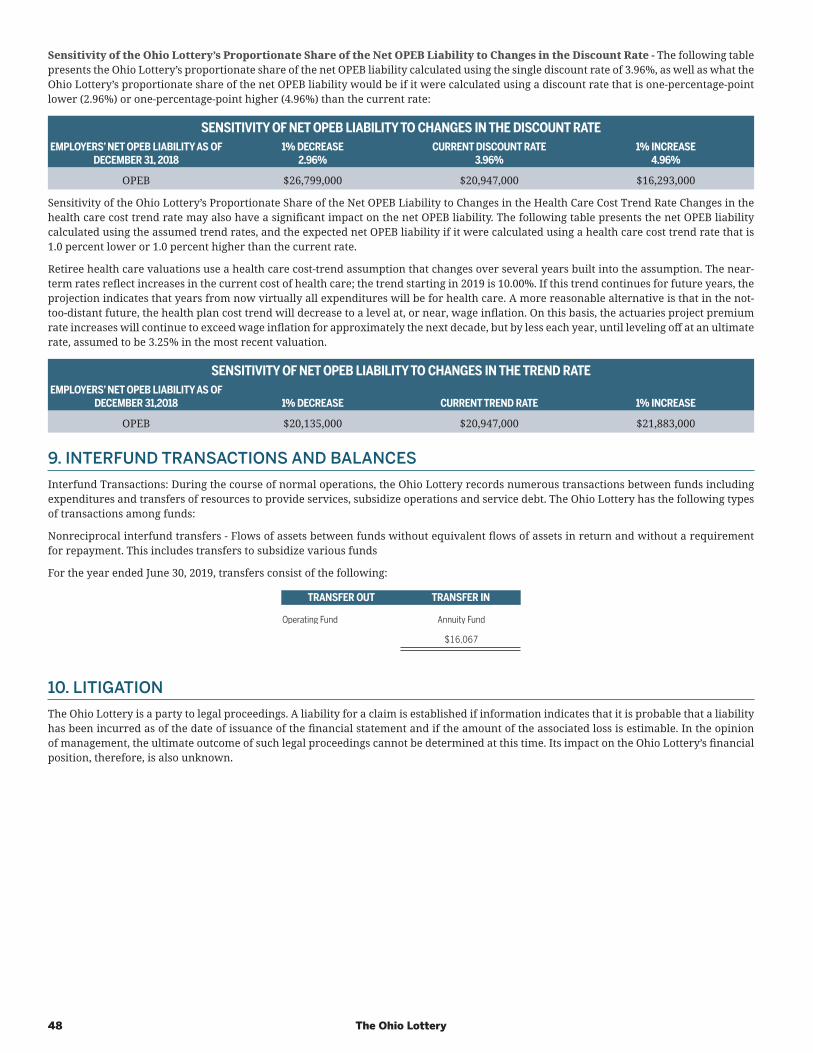
48 The Ohio Lottery
Sensitivity of the Ohio Lottery’s Proportionate Share of the Net OPEB Liability to Changes in the Discount Rate - The following table presents the Ohio Lottery’s proportionate share of the net OPEB liability calculated using the single discount rate of 3.96%, as well as what the Ohio Lottery’s proportionate share of the net OPEB liability would be if it were calculated using a discount rate that is one-percentage-point lower (2.96%) or one-percentage-point higher (4.96%) than the current rate:
SENSITIVITY OF NET OPEB LIABILITY TO CHANGES IN THE DISCOUNT RATEEMPLOYERS’ NET OPEB LIABILITY AS OF
DECEMBER 31, 20181% DECREASE
2.96%CURRENT DISCOUNT RATE
3.96%1% INCREASE
4.96%
OPEB $26,799,000 $20,947,000 $16,293,000
Sensitivity of the Ohio Lottery’s Proportionate Share of the Net OPEB Liability to Changes in the Health Care Cost Trend Rate Changes in the health care cost trend rate may also have a significant impact on the net OPEB liability. The following table presents the net OPEB liability calculated using the assumed trend rates, and the expected net OPEB liability if it were calculated using a health care cost trend rate that is 1.0 percent lower or 1.0 percent higher than the current rate.
Retiree health care valuations use a health care cost-trend assumption that changes over several years built into the assumption. The near-term rates reflect increases in the current cost of health care; the trend starting in 2019 is 10.00%. If this trend continues for future years, the projection indicates that years from now virtually all expenditures will be for health care. A more reasonable alternative is that in the not-too-distant future, the health plan cost trend will decrease to a level at, or near, wage inflation. On this basis, the actuaries project premium rate increases will continue to exceed wage inflation for approximately the next decade, but by less each year, until leveling off at an ultimate rate, assumed to be 3.25% in the most recent valuation.
SENSITIVITY OF NET OPEB LIABILITY TO CHANGES IN THE TREND RATEEMPLOYERS’ NET OPEB LIABILITY AS OF
DECEMBER 31,2018 1% DECREASE CURRENT TREND RATE 1% INCREASE
OPEB $20,135,000 $20,947,000 $21,883,000
9. INTERFUND TRANSACTIONS AND BALANCESInterfund Transactions: During the course of normal operations, the Ohio Lottery records numerous transactions between funds including expenditures and transfers of resources to provide services, subsidize operations and service debt. The Ohio Lottery has the following types of transactions among funds:
Nonreciprocal interfund transfers - Flows of assets between funds without equivalent flows of assets in return and without a requirement for repayment. This includes transfers to subsidize various funds
For the year ended June 30, 2019, transfers consist of the following:
TRANSFER OUT TRANSFER IN
Operating Fund Annuity Fund
$16,067
10. LITIGATIONThe Ohio Lottery is a party to legal proceedings. A liability for a claim is established if information indicates that it is probable that a liability has been incurred as of the date of issuance of the financial statement and if the amount of the associated loss is estimable. In the opinion of management, the ultimate outcome of such legal proceedings cannot be determined at this time. Its impact on the Ohio Lottery’s financial position, therefore, is also unknown.
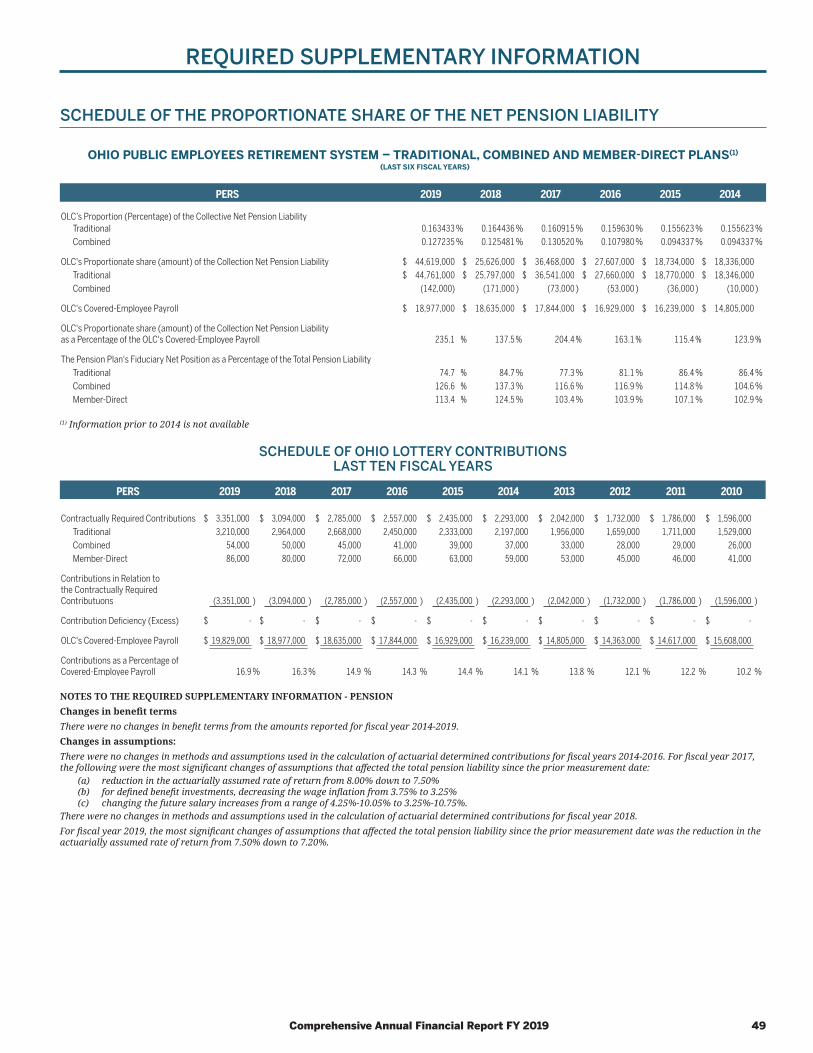
Comprehensive Annual Financial Report FY 2019 49
REQUIRED SUPPLEMENTARY INFORMATION
SCHEDULE OF THE PROPORTIONATE SHARE OF THE NET PENSION LIABILITY
OHIO PUBLIC EMPLOYEES RETIREMENT SYSTEM – TRADITIONAL, COMBINED AND MEMBER-DIRECT PLANS(1)
(LAST SIX FISCAL YEARS)
PERS 2019 2018 2017 2016 2015 2014
OLC’s Proportion (Percentage) of the Collective Net Pension LiabilityTraditional 0.163433 % 0.164436 % 0.160915 % 0.159630 % 0.155623 % 0.155623 %Combined 0.127235 % 0.125481 % 0.130520 % 0.107980 % 0.094337 % 0.094337 %
OLC's Proportionate share (amount) of the Collection Net Pension Liability $ 44,619,000 $ 25,626,000 $ 36,468,000 $ 27,607,000 $ 18,734,000 $ 18,336,000Traditional $ 44,761,000 $ 25,797,000 $ 36,541,000 $ 27,660,000 $ 18,770,000 $ 18,346,000Combined (142,000) (171,000 ) (73,000 ) (53,000 ) (36,000 ) (10,000 )
OLC's Covered-Employee Payroll $ 18,977,000 $ 18,635,000 $ 17,844,000 $ 16,929,000 $ 16,239,000 $ 14,805,000
OLC's Proportionate share (amount) of the Collection Net Pension Liability as a Percentage of the OLC's Covered-Employee Payroll 235.1 % 137.5 % 204.4 % 163.1 % 115.4 % 123.9 %
The Pension Plan's Fiduciary Net Position as a Percentage of the Total Pension LiabilityTraditional 74.7 % 84.7 % 77.3 % 81.1 % 86.4 % 86.4 %Combined 126.6 % 137.3 % 116.6 % 116.9 % 114.8 % 104.6 %Member-Direct 113.4 % 124.5 % 103.4 % 103.9 % 107.1 % 102.9 %
(1) Information prior to 2014 is not available
SCHEDULE OF OHIO LOTTERY CONTRIBUTIONS LAST TEN FISCAL YEARS
PERS 2019 2018 2017 2016 2015 2014 2013 2012 2011 2010
Contractually Required Contributions $ 3,351,000 $ 3,094,000 $ 2,785,000 $ 2,557,000 $ 2,435,000 $ 2,293,000 $ 2,042,000 $ 1,732,000 $ 1,786,000 $ 1,596,000Traditional 3,210,000 2,964,000 2,668,000 2,450,000 2,333,000 2,197,000 1,956,000 1,659,000 1,711,000 1,529,000Combined 54,000 50,000 45,000 41,000 39,000 37,000 33,000 28,000 29,000 26,000Member-Direct 86,000 80,000 72,000 66,000 63,000 59,000 53,000 45,000 46,000 41,000
Contributions in Relation to the Contractually Required Contributuons (3,351,000 ) (3,094,000 ) (2,785,000 ) (2,557,000 ) (2,435,000 ) (2,293,000 ) (2,042,000 ) (1,732,000 ) (1,786,000 ) (1,596,000 )
Contribution Deficiency (Excess) $ - $ - $ - $ - $ - $ - $ - $ - $ - $ -
OLC's Covered-Employee Payroll $ 19,829,000 $ 18,977,000 $ 18,635,000 $ 17,844,000 $ 16,929,000 $ 16,239,000 $ 14,805,000 $ 14,363,000 $ 14,617,000 $ 15,608,000
Contributions as a Percentage of Covered-Employee Payroll 16.9 % 16.3 % 14.9 % 14.3 % 14.4 % 14.1 % 13.8 % 12.1 % 12.2 % 10.2 %
NOTES TO THE REQUIRED SUPPLEMENTARY INFORMATION - PENSIONChanges in benefit termsThere were no changes in benefit terms from the amounts reported for fiscal year 2014-2019.Changes in assumptions:There were no changes in methods and assumptions used in the calculation of actuarial determined contributions for fiscal years 2014-2016. For fiscal year 2017, the following were the most significant changes of assumptions that affected the total pension liability since the prior measurement date:
(a) reduction in the actuarially assumed rate of return from 8.00% down to 7.50%(b) for defined benefit investments, decreasing the wage inflation from 3.75% to 3.25%(c) changing the future salary increases from a range of 4.25%-10.05% to 3.25%-10.75%.
There were no changes in methods and assumptions used in the calculation of actuarial determined contributions for fiscal year 2018.For fiscal year 2019, the most significant changes of assumptions that affected the total pension liability since the prior measurement date was the reduction in the actuarially assumed rate of return from 7.50% down to 7.20%.
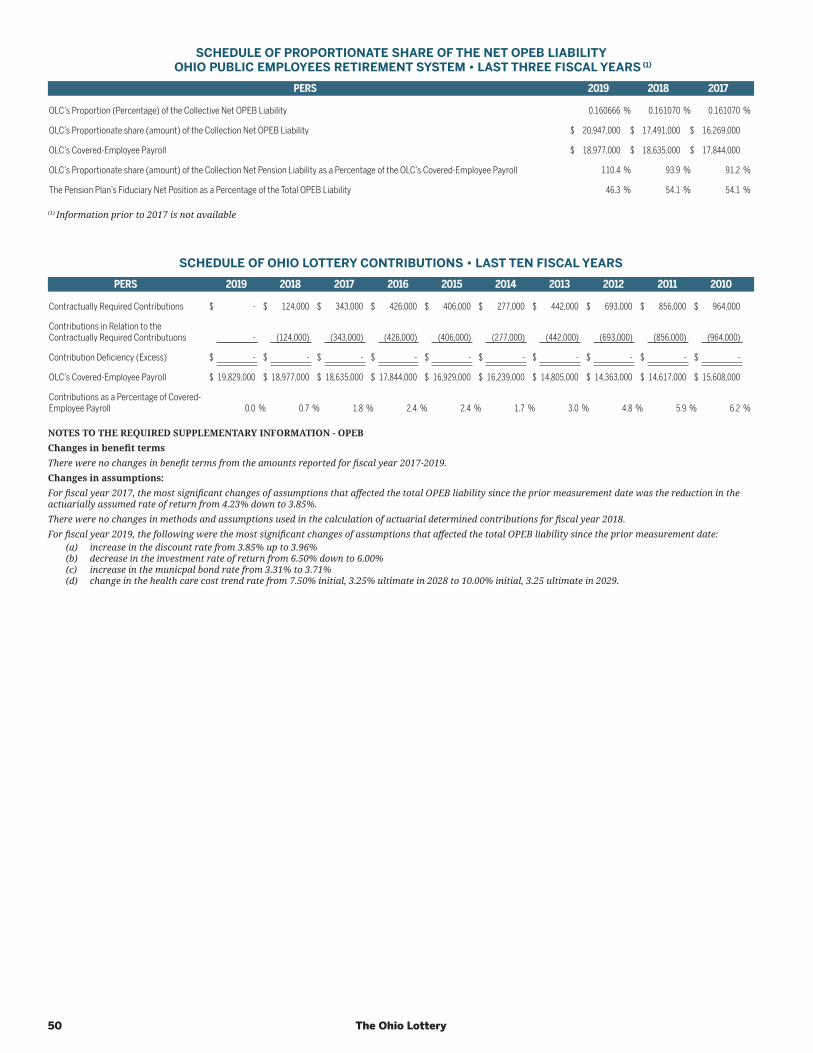
50 The Ohio Lottery
SCHEDULE OF PROPORTIONATE SHARE OF THE NET OPEB LIABILITY OHIO PUBLIC EMPLOYEES RETIREMENT SYSTEM • LAST THREE FISCAL YEARS (1)
PERS 2019 2018 2017
OLC’s Proportion (Percentage) of the Collective Net OPEB Liability 0.160666 % 0.161070 % 0.161070 %
OLC’s Proportionate share (amount) of the Collection Net OPEB Liability $ 20,947,000 $ 17,491,000 $ 16,269,000
OLC’s Covered-Employee Payroll $ 18,977,000 $ 18,635,000 $ 17,844,000
OLC’s Proportionate share (amount) of the Collection Net Pension Liability as a Percentage of the OLC’s Covered-Employee Payroll 110.4 % 93.9 % 91.2 %
The Pension Plan’s Fiduciary Net Position as a Percentage of the Total OPEB Liability 46.3 % 54.1 % 54.1 %
(1) Information prior to 2017 is not available
SCHEDULE OF OHIO LOTTERY CONTRIBUTIONS • LAST TEN FISCAL YEARS
PERS 2019 2018 2017 2016 2015 2014 2013 2012 2011 2010
Contractually Required Contributions $ - $ 124,000 $ 343,000 $ 426,000 $ 406,000 $ 277,000 $ 442,000 $ 693,000 $ 856,000 $ 964,000
Contributions in Relation to the Contractually Required Contributuons - (124,000) (343,000) (426,000) (406,000) (277,000) (442,000) (693,000) (856,000) (964,000)
Contribution Deficiency (Excess) $ - $ - $ - $ - $ - $ - $ - $ - $ - $ -
OLC’s Covered-Employee Payroll $ 19,829,000 $ 18,977,000 $ 18,635,000 $ 17,844,000 $ 16,929,000 $ 16,239,000 $ 14,805,000 $ 14,363,000 $ 14,617,000 $ 15,608,000
Contributions as a Percentage of Covered-Employee Payroll 0.0 % 0.7 % 1.8 % 2.4 % 2.4 % 1.7 % 3.0 % 4.8 % 5.9 % 6.2 %
NOTES TO THE REQUIRED SUPPLEMENTARY INFORMATION - OPEBChanges in benefit termsThere were no changes in benefit terms from the amounts reported for fiscal year 2017-2019.Changes in assumptions:For fiscal year 2017, the most significant changes of assumptions that affected the total OPEB liability since the prior measurement date was the reduction in the actuarially assumed rate of return from 4.23% down to 3.85%.There were no changes in methods and assumptions used in the calculation of actuarial determined contributions for fiscal year 2018.For fiscal year 2019, the following were the most significant changes of assumptions that affected the total OPEB liability since the prior measurement date:
(a) increase in the discount rate from 3.85% up to 3.96%(b) decrease in the investment rate of return from 6.50% down to 6.00%(c) increase in the municpal bond rate from 3.31% to 3.71%(d) change in the health care cost trend rate from 7.50% initial, 3.25% ultimate in 2028 to 10.00% initial, 3.25 ultimate in 2029.
Comprehensive Annual Financial Report FY 2019 51

52 The Ohio Lottery
• STATISTICAL SECTION •
OUR RETAIL PARTNERSThere are more than 9,800 Ohio Lottery retailers across Ohio and many of them are independently or family owned. In Fiscal Year 2019, our retailers earned more than $223.3 million in commissions and selling bonuses. Retailers may also enroll in the Lottery’s wildly successful Retailer Incentive Program - a set of best practices that help retailers sell our tickets. Retailers who meet or exceed these benchmarks receive quarterly bonuses in addition to their commissions.
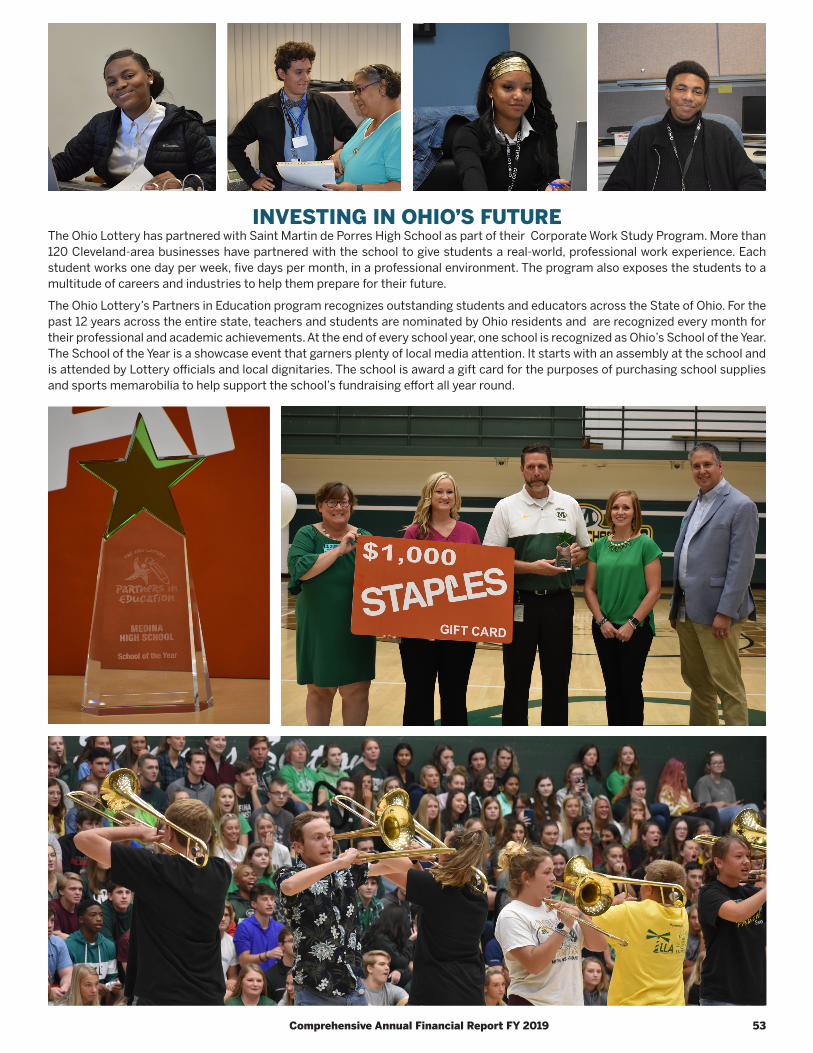
Comprehensive Annual Financial Report FY 2019 53
INVESTING IN OHIO’S FUTUREThe Ohio Lottery has partnered with Saint Martin de Porres High School as part of their Corporate Work Study Program. More than 120 Cleveland-area businesses have partnered with the school to give students a real-world, professional work experience. Each student works one day per week, � ve days per month, in a professional environment. The program also exposes the students to a multitude of careers and industries to help them prepare for their future.
The Ohio Lottery’s Partners in Education program recognizes outstanding students and educators across the State of Ohio. For the past 12 years across the entire state, teachers and students are nominated by Ohio residents and are recognized every month for their professional and academic achievements. At the end of every school year, one school is recognized as Ohio’s School of the Year. The School of the Year is a showcase event that garners plenty of local media attention. It starts with an assembly at the school and is attended by Lottery o� cials and local dignitaries. The school is award a gift card for the purposes of purchasing school supplies and sports memarobilia to help support the school’s fundraising e� ort all year round.
54 The Ohio Lottery
OHIO LOTTERY COMMISSION STATISTICAL SECTION
This section of the Ohio Lottery’s comprehensive annual financial report presents detailed information as a supplement to the information presented in the financial statements and note disclosures to assist readers in assessing the Lottery’s overall financial health.
FINANCIAL TRENDS
These schedules contain trend information to help readers understand how the Lottery’s financial performance and position has changed over time. The information presented includes changes in net position, sales, and transfer data specific to the Lottery as well as the lottery industry as a whole.
REVENUE CAPACITY
These schedules contain information to help readers assess the Lottery’s most significant revenue source. Sales information, included in the financial trends section, provides data about the various games available to the public. The Lottery’s statewide retailer network determines the market exposure for the Lottery’s games.
DEMOGRAPHIC AND ECONOMIC INFORMATION
These schedules offer demographic and economic indicators to help readers understand the environment within which the Lottery operates.
OPERATING INFORMATION
These schedules contain information about the Lottery’s organization and efficiency.Sources: Unless otherwise noted, the information in these schedules is derived from the comprehensive annual financial reports or the audited financial statements for the relevant year.
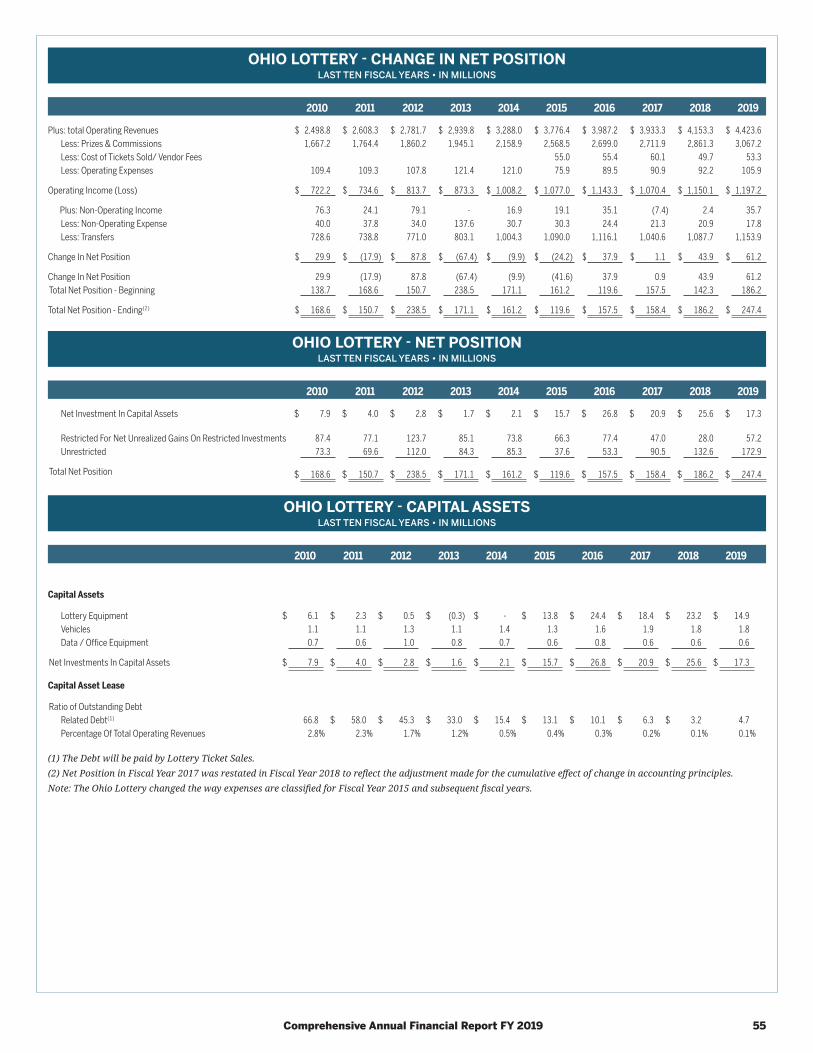
Comprehensive Annual Financial Report FY 2019 55
OHIO LOTTERY - CHANGE IN NET POSITIONLAST TEN FISCAL YEARS • IN MILLIONS
2010 2011 2012 2013 2014 2015 2016 2017 2018 2019
Plus: total Operating Revenues $ 2,498.8 $ 2,608.3 $ 2,781.7 $ 2,939.8 $ 3,288.0 $ 3,776.4 $ 3,987.2 $ 3,933.3 $ 4,153.3 $ 4,423.6Less: Prizes & Commissions 1,667.2 1,764.4 1,860.2 1,945.1 2,158.9 2,568.5 2,699.0 2,711.9 2,861.3 3,067.2Less: Cost of Tickets Sold/ Vendor Fees 55.0 55.4 60.1 49.7 53.3Less: Operating Expenses 109.4 109.3 107.8 121.4 121.0 75.9 89.5 90.9 92.2 105.9
Operating Income (Loss) $ 722.2 $ 734.6 $ 813.7 $ 873.3 $ 1,008.2 $ 1,077.0 $ 1,143.3 $ 1,070.4 $ 1,150.1 $ 1,197.2
Plus: Non-Operating Income 76.3 24.1 79.1 - 16.9 19.1 35.1 (7.4) 2.4 35.7Less: Non-Operating Expense 40.0 37.8 34.0 137.6 30.7 30.3 24.4 21.3 20.9 17.8Less: Transfers 728.6 738.8 771.0 803.1 1,004.3 1,090.0 1,116.1 1,040.6 1,087.7 1,153.9
Change In Net Position $ 29.9 $ (17.9) $ 87.8 $ (67.4) $ (9.9) $ (24.2) $ 37.9 $ 1.1 $ 43.9 $ 61.2
Change In Net Position 29.9 (17.9) 87.8 (67.4) (9.9) (41.6) 37.9 0.9 43.9 61.2Total Net Position - Beginning 138.7 168.6 150.7 238.5 171.1 161.2 119.6 157.5 142.3 186.2
Total Net Position - Ending(2) $ 168.6 $ 150.7 $ 238.5 $ 171.1 $ 161.2 $ 119.6 $ 157.5 $ 158.4 $ 186.2 $ 247.4
OHIO LOTTERY - NET POSITIONLAST TEN FISCAL YEARS • IN MILLIONS
2010 2011 2012 2013 2014 2015 2016 2017 2018 2019
Net Investment In Capital Assets $ 7.9 $ 4.0 $ 2.8 $ 1.7 $ 2.1 $ 15.7 $ 26.8 $ 20.9 $ 25.6 $ 17.3
Restricted For Net Unrealized Gains On Restricted Investments 87.4 77.1 123.7 85.1 73.8 66.3 77.4 47.0 28.0 57.2Unrestricted 73.3 69.6 112.0 84.3 85.3 37.6 53.3 90.5 132.6 172.9
Total Net Position $ 168.6 $ 150.7 $ 238.5 $ 171.1 $ 161.2 $ 119.6 $ 157.5 $ 158.4 $ 186.2 $ 247.4
OHIO LOTTERY - CAPITAL ASSETSLAST TEN FISCAL YEARS • IN MILLIONS
2010 2011 2012 2013 2014 2015 2016 2017 2018 2019
Capital Assets
Lottery Equipment $ 6.1 $ 2.3 $ 0.5 $ (0.3) $ - $ 13.8 $ 24.4 $ 18.4 $ 23.2 $ 14.9Vehicles 1.1 1.1 1.3 1.1 1.4 1.3 1.6 1.9 1.8 1.8Data / Office Equipment 0.7 0.6 1.0 0.8 0.7 0.6 0.8 0.6 0.6 0.6
Net Investments In Capital Assets $ 7.9 $ 4.0 $ 2.8 $ 1.6 $ 2.1 $ 15.7 $ 26.8 $ 20.9 $ 25.6 $ 17.3
Capital Asset Lease
Ratio of Outstanding DebtRelated Debt(1) 66.8 $ 58.0 $ 45.3 $ 33.0 $ 15.4 $ 13.1 $ 10.1 $ 6.3 $ 3.2 4.7 Percentage Of Total Operating Revenues 2.8% 2.3% 1.7% 1.2% 0.5% 0.4% 0.3% 0.2% 0.1% 0.1%
(1) The Debt will be paid by Lottery Ticket Sales.(2) Net Position in Fiscal Year 2017 was restated in Fiscal Year 2018 to reflect the adjustment made for the cumulative effect of change in accounting principles.Note: The Ohio Lottery changed the way expenses are classified for Fiscal Year 2015 and subsequent fiscal years.
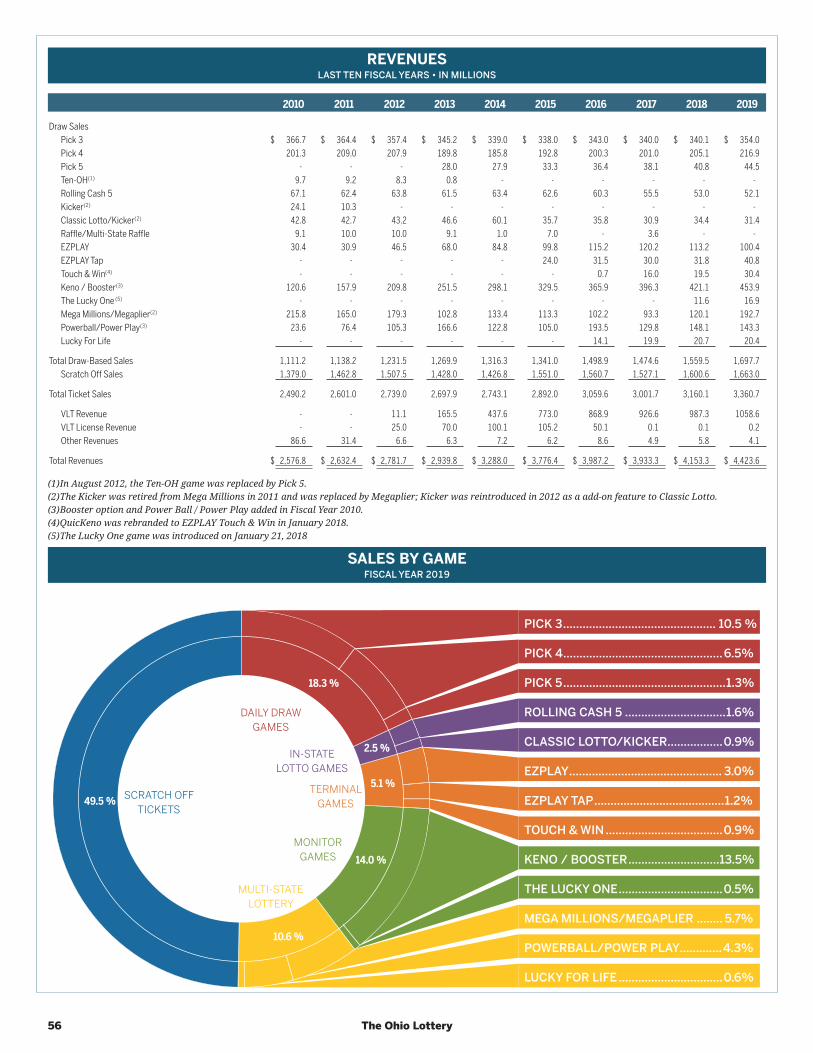
56 The Ohio Lottery
REVENUESLAST TEN FISCAL YEARS • IN MILLIONS
2010 2011 2012 2013 2014 2015 2016 2017 2018 2019
Draw SalesPick 3 $ 366.7 $ 364.4 $ 357.4 $ 345.2 $ 339.0 $ 338.0 $ 343.0 $ 340.0 $ 340.1 $ 354.0Pick 4 201.3 209.0 207.9 189.8 185.8 192.8 200.3 201.0 205.1 216.9Pick 5 - - - 28.0 27.9 33.3 36.4 38.1 40.8 44.5Ten-OH(1) 9.7 9.2 8.3 0.8 - - - - - -Rolling Cash 5 67.1 62.4 63.8 61.5 63.4 62.6 60.3 55.5 53.0 52.1Kicker(2) 24.1 10.3 - - - - - - - -Classic Lotto/Kicker(2) 42.8 42.7 43.2 46.6 60.1 35.7 35.8 30.9 34.4 31.4Raffle/Multi-State Raffle 9.1 10.0 10.0 9.1 1.0 7.0 - 3.6 - -EZPLAY 30.4 30.9 46.5 68.0 84.8 99.8 115.2 120.2 113.2 100.4EZPLAY Tap - - - - - 24.0 31.5 30.0 31.8 40.8Touch & Win(4) - - - - - - 0.7 16.0 19.5 30.4Keno / Booster(3) 120.6 157.9 209.8 251.5 298.1 329.5 365.9 396.3 421.1 453.9The Lucky One (5) - - - - - - - - 11.6 16.9Mega Millions/Megaplier(2) 215.8 165.0 179.3 102.8 133.4 113.3 102.2 93.3 120.1 192.7Powerball/Power Play(3) 23.6 76.4 105.3 166.6 122.8 105.0 193.5 129.8 148.1 143.3Lucky For Life - - - - - - 14.1 19.9 20.7 20.4
Total Draw-Based Sales 1,111.2 1,138.2 1,231.5 1,269.9 1,316.3 1,341.0 1,498.9 1,474.6 1,559.5 1,697.7Scratch Off Sales 1,379.0 1,462.8 1,507.5 1,428.0 1,426.8 1,551.0 1,560.7 1,527.1 1,600.6 1,663.0
Total Ticket Sales 2,490.2 2,601.0 2,739.0 2,697.9 2,743.1 2,892.0 3,059.6 3,001.7 3,160.1 3,360.7
VLT Revenue - - 11.1 165.5 437.6 773.0 868.9 926.6 987.3 1058.6VLT License Revenue - - 25.0 70.0 100.1 105.2 50.1 0.1 0.1 0.2Other Revenues 86.6 31.4 6.6 6.3 7.2 6.2 8.6 4.9 5.8 4.1
Total Revenues $ 2,576.8 $ 2,632.4 $ 2,781.7 $ 2,939.8 $ 3,288.0 $ 3,776.4 $ 3,987.2 $ 3,933.3 $ 4,153.3 $ 4,423.6
(1) In August 2012, the Ten-OH game was replaced by Pick 5.(2) The Kicker was retired from Mega Millions in 2011 and was replaced by Megaplier; Kicker was reintroduced in 2012 as a add-on feature to Classic Lotto.(3) Booster option and Power Ball / Power Play added in Fiscal Year 2010.(4) QuicKeno was rebranded to EZPLAY Touch & Win in January 2018.(5) The Lucky One game was introduced on January 21, 2018
SALES BY GAMEFISCAL YEAR 2019
PICK 3............................................... 10.5 %
PICK 4.................................................6.5%
PICK 5..................................................1.3%
ROLLING CASH 5 ...............................1.6%
CLASSIC LOTTO/KICKER.................0.9%
EZPLAY............................................... 3.0%
EZPLAY TAP........................................1.2%
TOUCH & WIN ....................................0.9%
KENO / BOOSTER............................13.5%
THE LUCKY ONE................................0.5%
MEGA MILLIONS/MEGAPLIER ........ 5.7%
POWERBALL/POWER PLAY.............4.3%
LUCKY FOR LIFE ................................0.6%
MULTI-STATELOTTERY
SCRATCH OFFTICKETS
18.3 %
49.5 %
2.5 %
14.0 %
5.1 %
10.6 %
DAILY DRAWGAMES
IN-STATELOTTO GAMES
TERMINALGAMES
MONITORGAMES
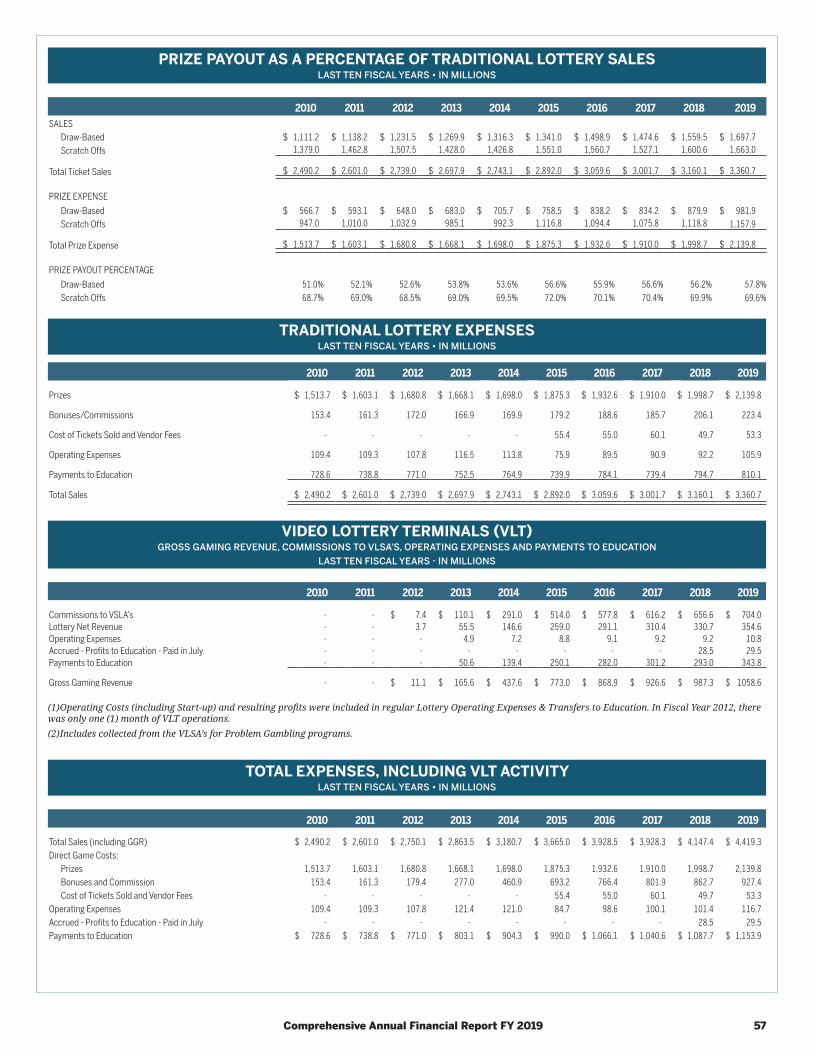
Comprehensive Annual Financial Report FY 2019 57
PRIZE PAYOUT AS A PERCENTAGE OF TRADITIONAL LOTTERY SALESLAST TEN FISCAL YEARS • IN MILLIONS
2010 2011 2012 2013 2014 2015 2016 2017 2018 2019SALES
Draw-Based $ 1,111.2 $ 1,138.2 $ 1,231.5 $ 1,269.9 $ 1,316.3 $ 1,341.0 $ 1,498.9 $ 1,474.6 $ 1,559.5 $ 1,697.7Scratch Offs 1,379.0 1,462.8 1,507.5 1,428.0 1,426.8 1,551.0 1,560.7 1,527.1 1,600.6 1,663.0
Total Ticket Sales $ 2,490.2 $ 2,601.0 $ 2,739.0 $ 2,697.9 $ 2,743.1 $ 2,892.0 $ 3,059.6 $ 3,001.7 $ 3,160.1 $ 3,360.7
PRIZE EXPENSE Draw-Based $ 566.7 $ 593.1 $ 648.0 $ 683.0 $ 705.7 $ 758.5 $ 838.2 $ 834.2 $ 879.9 $ 981.9Scratch Offs 947.0 1,010.0 1,032.9 985.1 992.3 1,116.8 1,094.4 1,075.8 1,118.8 1,157.9
Total Prize Expense $ 1,513.7 $ 1,603.1 $ 1,680.8 $ 1,668.1 $ 1,698.0 $ 1,875.3 $ 1,932.6 $ 1,910.0 $ 1,998.7 $ 2,139.8
PRIZE PAYOUT PERCENTAGEDraw-Based 51.0% 52.1% 52.6% 53.8% 53.6% 56.6% 55.9% 56.6% 56.2% 57.8%Scratch Offs 68.7% 69.0% 68.5% 69.0% 69.5% 72.0% 70.1% 70.4% 69.9% 69.6%
TRADITIONAL LOTTERY EXPENSESLAST TEN FISCAL YEARS • IN MILLIONS
2010 2011 2012 2013 2014 2015 2016 2017 2018 2019
Prizes $ 1,513.7 $ 1,603.1 $ 1,680.8 $ 1,668.1 $ 1,698.0 $ 1,875.3 $ 1,932.6 $ 1,910.0 $ 1,998.7 $ 2,139.8
Bonuses/Commissions 153.4 161.3 172.0 166.9 169.9 179.2 188.6 185.7 206.1 223.4
Cost of Tickets Sold and Vendor Fees - - - - - 55.4 55.0 60.1 49.7 53.3
Operating Expenses 109.4 109.3 107.8 116.5 113.8 75.9 89.5 90.9 92.2 105.9
Payments to Education 728.6 738.8 771.0 752.5 764.9 739.9 784.1 739.4 794.7 810.1
Total Sales $ 2,490.2 $ 2,601.0 $ 2,739.0 $ 2,697.9 $ 2,743.1 $ 2,892.0 $ 3,059.6 $ 3,001.7 $ 3,160.1 $ 3,360.7
VIDEO LOTTERY TERMINALS (VLT)GROSS GAMING REVENUE, COMMISSIONS TO VLSA’S, OPERATING EXPENSES AND PAYMENTS TO EDUCATION
LAST TEN FISCAL YEARS - IN MILLIONS
2010 2011 2012 2013 2014 2015 2016 2017 2018 2019
Commissions to VSLA’s - - $ 7.4 $ 110.1 $ 291.0 $ 514.0 $ 577.8 $ 616.2 $ 656.6 $ 704.0Lottery Net Revenue - - 3.7 55.5 146.6 259.0 291.1 310.4 330.7 354.6Operating Expenses - - - 4.9 7.2 8.8 9.1 9.2 9.2 10.8Accrued - Profits to Education - Paid in July - - - - - - - - 28.5 29.5Payments to Education - - - 50.6 139.4 250.1 282.0 301.2 293.0 343.8
Gross Gaming Revenue - - $ 11.1 $ 165.6 $ 437.6 $ 773.0 $ 868.9 $ 926.6 $ 987.3 $ 1058.6
(1) Operating Costs (including Start-up) and resulting profits were included in regular Lottery Operating Expenses & Transfers to Education. In Fiscal Year 2012, there was only one (1) month of VLT operations.(2) Includes collected from the VLSA’s for Problem Gambling programs.
TOTAL EXPENSES, INCLUDING VLT ACTIVITYLAST TEN FISCAL YEARS • IN MILLIONS
2010 2011 2012 2013 2014 2015 2016 2017 2018 2019
Total Sales (including GGR) $ 2,490.2 $ 2,601.0 $ 2,750.1 $ 2,863.5 $ 3,180.7 $ 3,665.0 $ 3,928.5 $ 3,928.3 $ 4,147.4 $ 4,419.3Direct Game Costs:
Prizes 1,513.7 1,603.1 1,680.8 1,668.1 1,698.0 1,875.3 1,932.6 1,910.0 1,998.7 2,139.8Bonuses and Commission 153.4 161.3 179.4 277.0 460.9 693.2 766.4 801.9 862.7 927.4Cost of Tickets Sold and Vendor Fees - - - - - 55.4 55.0 60.1 49.7 53.3
Operating Expenses 109.4 109.3 107.8 121.4 121.0 84.7 98.6 100.1 101.4 116.7Accrued - Profits to Education - Paid in July - - - - - - - - 28.5 29.5Payments to Education $ 728.6 $ 738.8 $ 771.0 $ 803.1 $ 904.3 $ 990.0 $ 1,066.1 $ 1,040.6 $ 1,087.7 $ 1,153.9
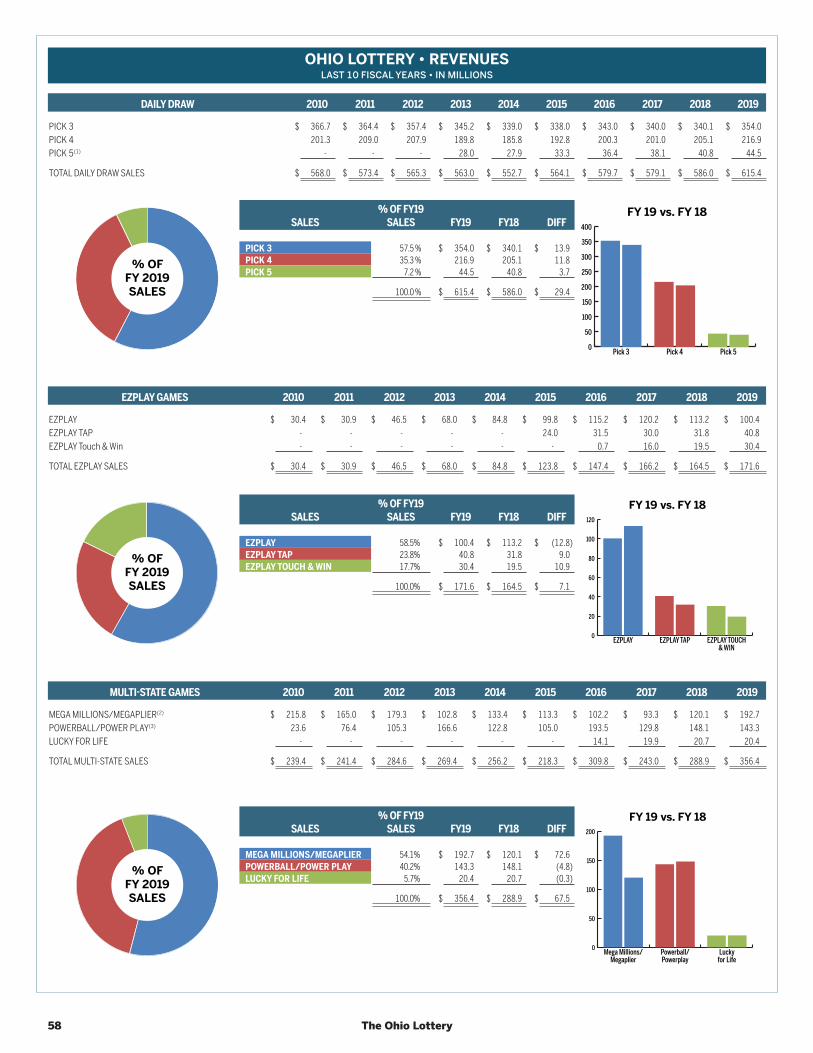
58 The Ohio Lottery
OHIO LOTTERY • REVENUESLAST 10 FISCAL YEARS • IN MILLIONS
DAILY DRAW 2010 2011 2012 2013 2014 2015 2016 2017 2018 2019
PICK 3 $ 366.7 $ 364.4 $ 357.4 $ 345.2 $ 339.0 $ 338.0 $ 343.0 $ 340.0 $ 340.1 $ 354.0PICK 4 201.3 209.0 207.9 189.8 185.8 192.8 200.3 201.0 205.1 216.9PICK 5(1) - - - 28.0 27.9 33.3 36.4 38.1 40.8 44.5
TOTAL DAILY DRAW SALES $ 568.0 $ 573.4 $ 565.3 $ 563.0 $ 552.7 $ 564.1 $ 579.7 $ 579.1 $ 586.0 $ 615.4
% OFFY 2019SALES
SALES% OF FY19
SALES FY19 FY18 DIFF
0
50
100
150
200
250
300
350
400
Pick 5Pick 4Pick 3
FY 19 vs. FY 18
PICK 3 57.5 % $ 354.0 $ 340.1 $ 13.9 PICK 4 35.3 % 216.9 205.1 11.8 PICK 5 7.2 % 44.5 40.8 3.7
100.0 % $ 615.4 $ 586.0 $ 29.4
EZPLAY GAMES 2010 2011 2012 2013 2014 2015 2016 2017 2018 2019
EZPLAY $ 30.4 $ 30.9 $ 46.5 $ 68.0 $ 84.8 $ 99.8 $ 115.2 $ 120.2 $ 113.2 $ 100.4EZPLAY TAP - - - - - 24.0 31.5 30.0 31.8 40.8EZPLAY Touch & Win - - - - - - 0.7 16.0 19.5 30.4
TOTAL EZPLAY SALES $ 30.4 $ 30.9 $ 46.5 $ 68.0 $ 84.8 $ 123.8 $ 147.4 $ 166.2 $ 164.5 $ 171.6
% OFFY 2019SALES
SALES% OF FY19
SALES FY19 FY18 DIFF
0
20
40
60
80
100
120
EZPLAY TOUCH& WIN
EZPLAY TAPEZPLAY
FY 19 vs. FY 18
EZPLAY 58.5% $ 100.4 $ 113.2 $ (12.8)EZPLAY TAP 23.8% 40.8 31.8 9.0 EZPLAY TOUCH & WIN 17.7% 30.4 19.5 10.9
100.0% $ 171.6 $ 164.5 $ 7.1
MULTI-STATE GAMES 2010 2011 2012 2013 2014 2015 2016 2017 2018 2019
MEGA MILLIONS/MEGAPLIER(2) $ 215.8 $ 165.0 $ 179.3 $ 102.8 $ 133.4 $ 113.3 $ 102.2 $ 93.3 $ 120.1 $ 192.7POWERBALL/POWER PLAY(3) 23.6 76.4 105.3 166.6 122.8 105.0 193.5 129.8 148.1 143.3LUCKY FOR LIFE - - - - - - 14.1 19.9 20.7 20.4
TOTAL MULTI-STATE SALES $ 239.4 $ 241.4 $ 284.6 $ 269.4 $ 256.2 $ 218.3 $ 309.8 $ 243.0 $ 288.9 $ 356.4
% OFFY 2019SALES
SALES% OF FY19
SALES FY19 FY18 DIFF
0
50
100
150
200
Luckyfor Life
Powerball/Powerplay
Mega Millions/Megaplier
FY 19 vs. FY 18
MEGA MILLIONS/MEGAPLIER 54.1% $ 192.7 $ 120.1 $ 72.6 POWERBALL/POWER PLAY 40.2% 143.3 148.1 (4.8)LUCKY FOR LIFE 5.7% 20.4 20.7 (0.3)
100.0% $ 356.4 $ 288.9 $ 67.5
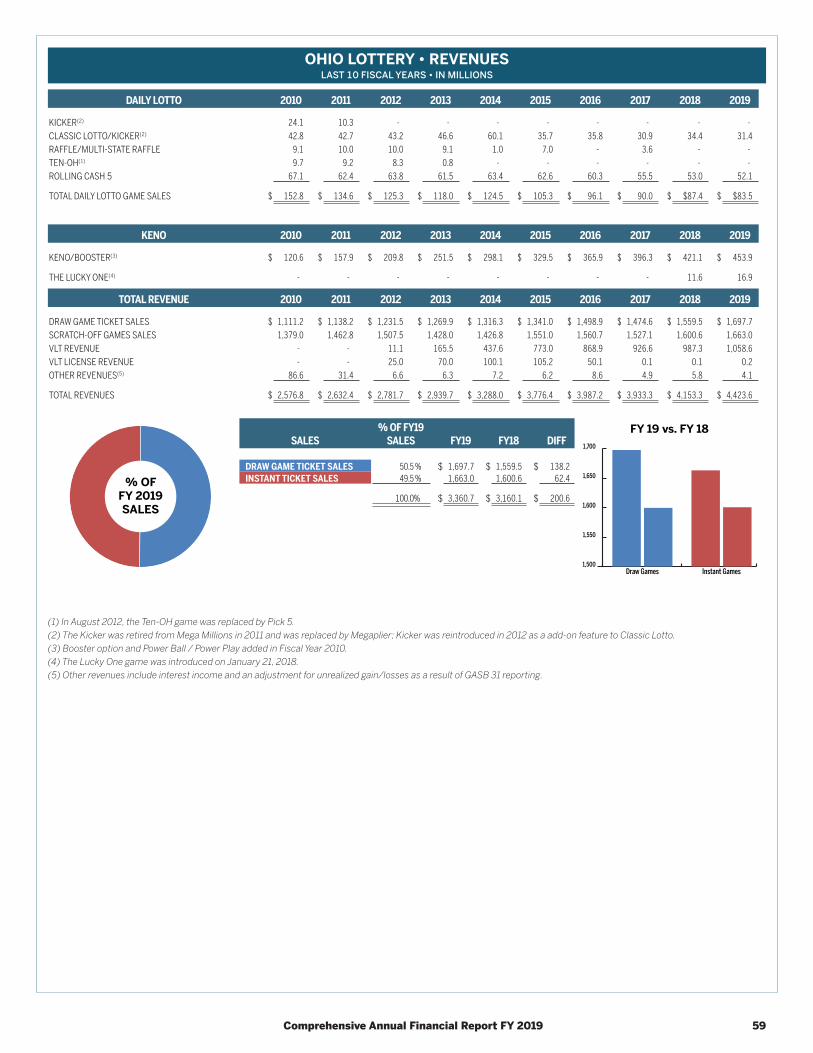
Comprehensive Annual Financial Report FY 2019 59
OHIO LOTTERY • REVENUESLAST 10 FISCAL YEARS • IN MILLIONS
DAILY LOTTO 2010 2011 2012 2013 2014 2015 2016 2017 2018 2019
KICKER(2) 24.1 10.3 - - - - - - - - CLASSIC LOTTO/KICKER(2) 42.8 42.7 43.2 46.6 60.1 35.7 35.8 30.9 34.4 31.4RAFFLE/MULTI-STATE RAFFLE 9.1 10.0 10.0 9.1 1.0 7.0 - 3.6 - - TEN-OH(1) 9.7 9.2 8.3 0.8 - - - - - - ROLLING CASH 5 67.1 62.4 63.8 61.5 63.4 62.6 60.3 55.5 53.0 52.1
TOTAL DAILY LOTTO GAME SALES $ 152.8 $ 134.6 $ 125.3 $ 118.0 $ 124.5 $ 105.3 $ 96.1 $ 90.0 $ $87.4 $ $83.5
KENO 2010 2011 2012 2013 2014 2015 2016 2017 2018 2019
KENO/BOOSTER(3) $ 120.6 $ 157.9 $ 209.8 $ 251.5 $ 298.1 $ 329.5 $ 365.9 $ 396.3 $ 421.1 $ 453.9
THE LUCKY ONE(4) - - - - - - - - 11.6 16.9
TOTAL REVENUE 2010 2011 2012 2013 2014 2015 2016 2017 2018 2019
DRAW GAME TICKET SALES $ 1,111.2 $ 1,138.2 $ 1,231.5 $ 1,269.9 $ 1,316.3 $ 1,341.0 $ 1,498.9 $ 1,474.6 $ 1,559.5 $ 1,697.7SCRATCH-OFF GAMES SALES 1,379.0 1,462.8 1,507.5 1,428.0 1,426.8 1,551.0 1,560.7 1,527.1 1,600.6 1,663.0VLT REVENUE - - 11.1 165.5 437.6 773.0 868.9 926.6 987.3 1,058.6VLT LICENSE REVENUE - - 25.0 70.0 100.1 105.2 50.1 0.1 0.1 0.2OTHER REVENUES(5) 86.6 31.4 6.6 6.3 7.2 6.2 8.6 4.9 5.8 4.1
TOTAL REVENUES $ 2,576.8 $ 2,632.4 $ 2,781.7 $ 2,939.7 $ 3,288.0 $ 3,776.4 $ 3,987.2 $ 3,933.3 $ 4,153.3 $ 4,423.6
% OFFY 2019SALES
SALES% OF FY19
SALES FY19 FY18 DIFF
1,500
1,550
1,600
1,650
1,700
Instant GamesDraw Games
FY 19 vs. FY 18
DRAW GAME TICKET SALES 50.5 % $ 1,697.7 $ 1,559.5 $ 138.2INSTANT TICKET SALES 49.5 % 1,663.0 1,600.6 62.4
100.0% $ 3,360.7 $ 3,160.1 $ 200.6
(1) In August 2012, the Ten-OH game was replaced by Pick 5.(2) The Kicker was retired from Mega Millions in 2011 and was replaced by Megaplier; Kicker was reintroduced in 2012 as a add-on feature to Classic Lotto.(3) Booster option and Power Ball / Power Play added in Fiscal Year 2010.(4) The Lucky One game was introduced on January 21, 2018.(5) Other revenues include interest income and an adjustment for unrealized gain/losses as a result of GASB 31 reporting.
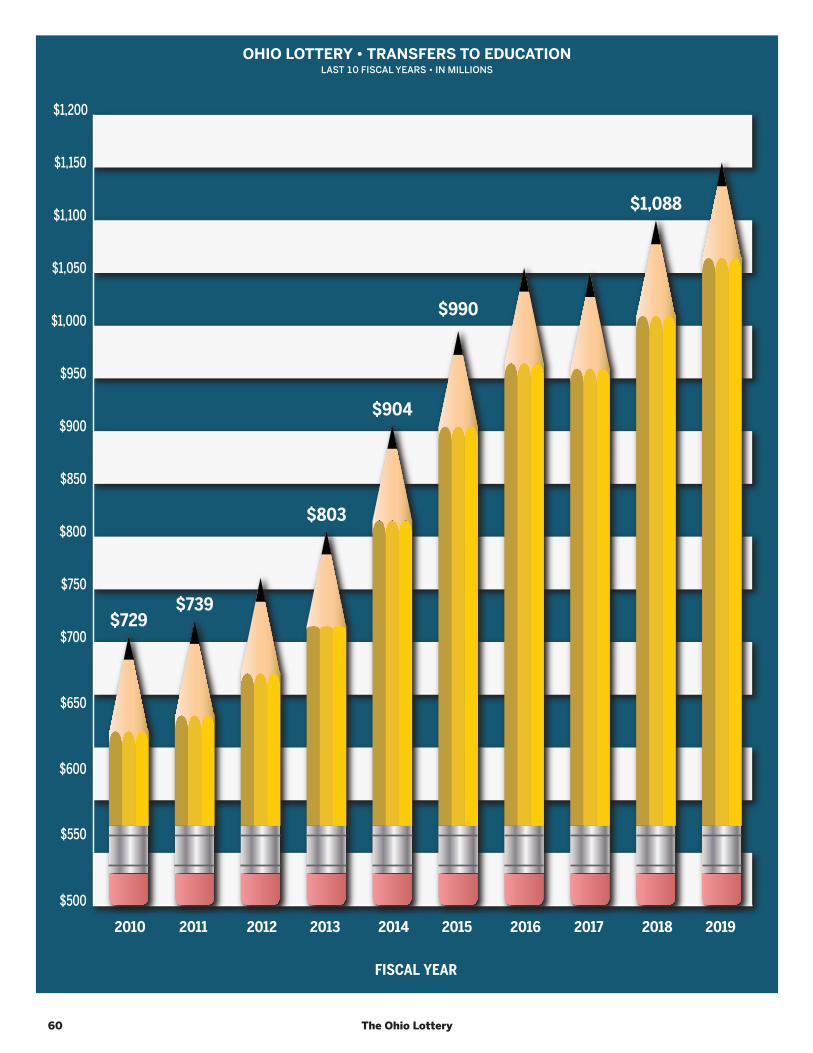
60 The Ohio Lottery
OHIO LOTTERY • TRANSFERS TO EDUCATIONLAST 10 FISCAL YEARS • IN MILLIONS
$500
$550
$600
$650
$700
$750
$800
$850
$900
$950
$1,000
$1,050
$1,100
FISCAL YEAR
$1,150
$1,200
2018 20192010 2011 2012 2013 2014 2015 2016 2017
$1,041
$1,088
$1,154
$729$739
$771
$803
$904
$990
$1,066
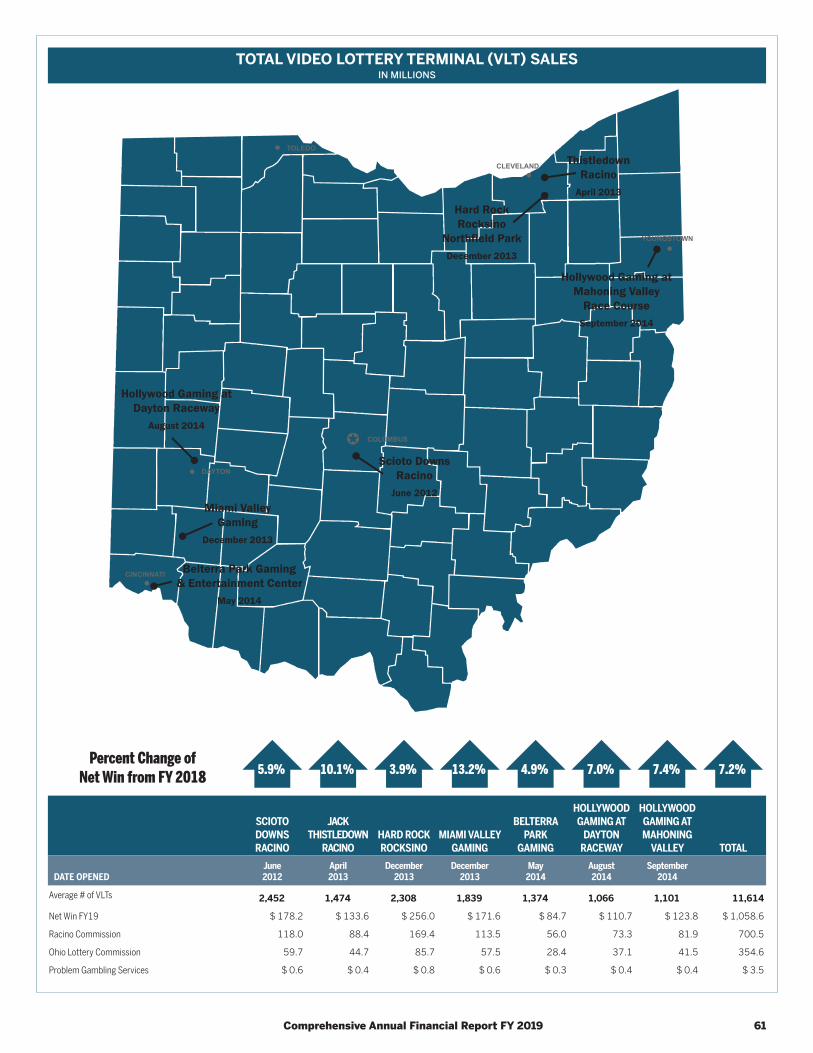
Comprehensive Annual Financial Report FY 2019 61
TOTAL VIDEO LOTTERY TERMINAL (VLT) SALESIN MILLIONS
Belterra Park Gaming& Entertainment Center
May 2014
Hollywood Gaming atDayton Raceway
August 2014
Miami ValleyGaming
December 2013
ThistledownRacino
April 2013
Hard RockRocksino
Northfield ParkDecember 2013
Scioto DownsRacino
June 2012
Hollywood Gaming atMahoning Valley
Race CourseSeptember 2014
COLUMBUS
CLEVELAND
YOUNGSTOWN
TOLEDO
DAYTON
CINCINNATI
Percent Change of Net Win from FY 2018 5.9% 10.1% 3.9% 13.2% 4.9% 7.0% 7.4% 7.2%
SCIOTO DOWNSRACINO
JACKTHISTLEDOWN
RACINOHARD ROCKROCKSINO
MIAMI VALLEYGAMING
BELTERRAPARK
GAMING
HOLLYWOOD GAMING AT
DAYTONRACEWAY
HOLLYWOOD GAMING ATMAHONING
VALLEY TOTAL
DATE OPENEDJune 2012
April 2013
December 2013
December 2013
May 2014
August 2014
September 2014
Average # of VLTs 2,452 1,474 2,308 1,839 1,374 1,066 1,101 11,614
Net Win FY19 $ 178.2 $ 133.6 $ 256.0 $ 171.6 $ 84.7 $ 110.7 $ 123.8 $ 1,058.6
Racino Commission 118.0 88.4 169.4 113.5 56.0 73.3 81.9 700.5
Ohio Lottery Commission 59.7 44.7 85.7 57.5 28.4 37.1 41.5 354.6
Problem Gambling Services $ 0.6 $ 0.4 $ 0.8 $ 0.6 $ 0.3 $ 0.4 $ 0.4 $ 3.5
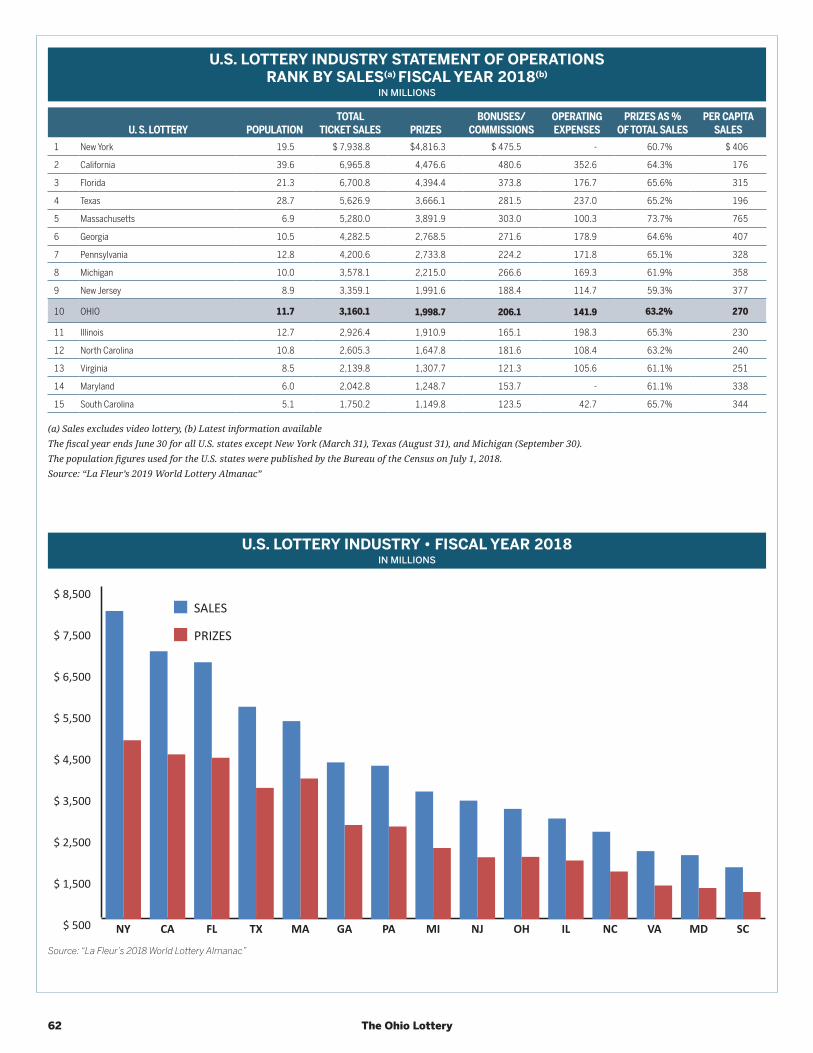
62 The Ohio Lottery
U.S. LOTTERY INDUSTRY STATEMENT OF OPERATIONSRANK BY SALES(a) FISCAL YEAR 2018(b)
IN MILLIONS
U. S. LOTTERY POPULATIONTOTAL
TICKET SALES PRIZESBONUSES/
COMMISSIONSOPERATING EXPENSES
PRIZES AS % OF TOTAL SALES
PER CAPITA SALES
1 New York 19.5 $ 7,938.8 $4,816.3 $ 475.5 - 60.7% $ 406
2 California 39.6 6,965.8 4,476.6 480.6 352.6 64.3% 176
3 Florida 21.3 6,700.8 4,394.4 373.8 176.7 65.6% 315
4 Texas 28.7 5,626.9 3,666.1 281.5 237.0 65.2% 196
5 Massachusetts 6.9 5,280.0 3,891.9 303.0 100.3 73.7% 765
6 Georgia 10.5 4,282.5 2,768.5 271.6 178.9 64.6% 407
7 Pennsylvania 12.8 4,200.6 2,733.8 224.2 171.8 65.1% 328
8 Michigan 10.0 3,578.1 2,215.0 266.6 169.3 61.9% 358
9 New Jersey 8.9 3,359.1 1,991.6 188.4 114.7 59.3% 377
10 OHIO 11.7 3,160.1 1,998.7 206.1 141.9 63.2% 270
11 Illinois 12.7 2,926.4 1,910.9 165.1 198.3 65.3% 230
12 North Carolina 10.8 2,605.3 1,647.8 181.6 108.4 63.2% 240
13 Virginia 8.5 2,139.8 1,307.7 121.3 105.6 61.1% 251
14 Maryland 6.0 2,042.8 1,248.7 153.7 - 61.1% 338
15 South Carolina 5.1 1,750.2 1,149.8 123.5 42.7 65.7% 344
(a) Sales excludes video lottery, (b) Latest information availableThe fiscal year ends June 30 for all U.S. states except New York (March 31), Texas (August 31), and Michigan (September 30).The population figures used for the U.S. states were published by the Bureau of the Census on July 1, 2018.Source: “La Fleur’s 2019 World Lottery Almanac”
U.S. LOTTERY INDUSTRY • FISCAL YEAR 2018IN MILLIONS
$ 500
$ 1,500
$ 2,500
$ 3,500
$ 4,500
$ 5,500
$ 6,500
$ 7,500
$ 8,500
SC MD VA NC IL OH NJ MI PA GA MA TX FL CA NY
PRIZES
SALES
Source: “La Fleur’s 2018 World Lottery Almanac”
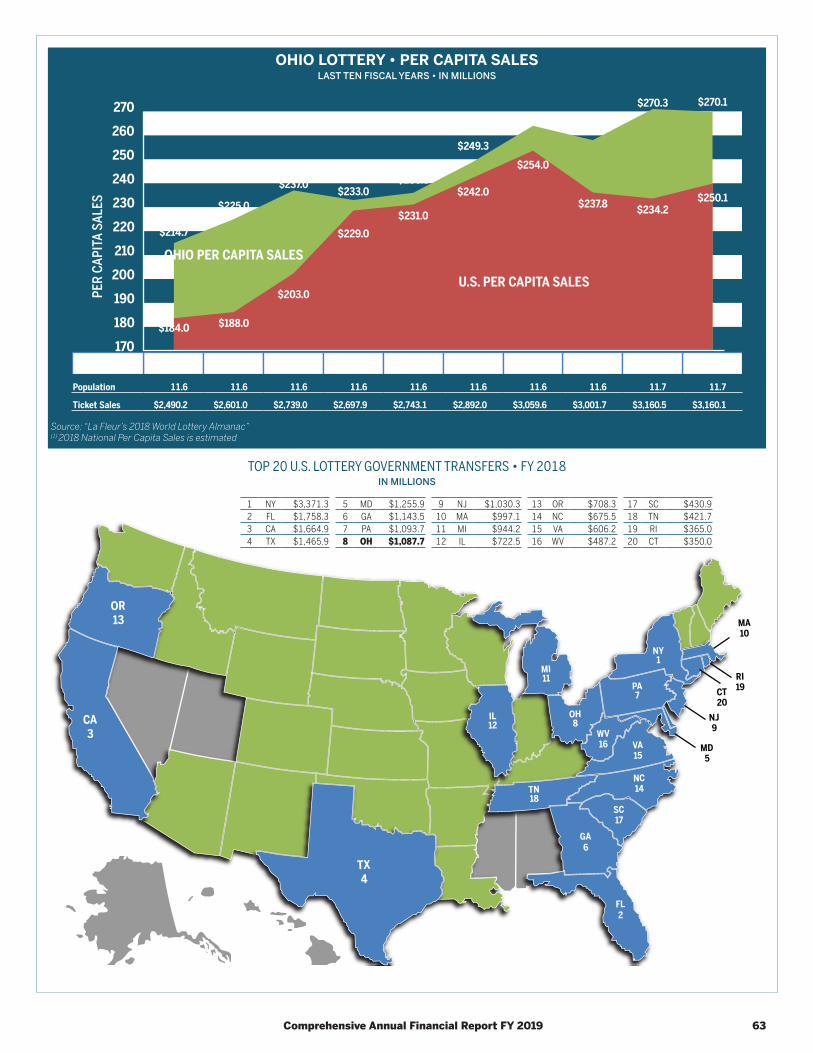
Comprehensive Annual Financial Report FY 2019 63
TOP 20 U.S. LOTTERY GOVERNMENT TRANSFERS • FY 2018IN MILLIONS
CA3
FL2
GA6
NC14
SC17
VA15
WV16 MD
5
RI19
NJ9
CT20
MA10
NY1
PA7
OH8
IL12
TN18
MI11
TX4
OR13
OHIO LOTTERY • PER CAPITA SALESLAST TEN FISCAL YEARS • IN MILLIONS
170
180
190
200
210
220
230
240
250
260
270PE
R CA
PITA
SAL
ES
2017 20182016201520142013201220112010 2019FISCAL YEAR
$254.0
$237.8
$184.0
$229.0
$203.0
$242.0
$231.0
$188.0
$234.2$250.1
U.S. PER CAPITA SALES
$236.5
$225.0
$258.8
$270.3$263.8
$214.7
$270.1
$249.3
$233.0$237.0
OHIO PER CAPITA SALES
Population 11.6 11.6 11.6 11.6 11.6 11.6 11.6 11.6 11.7 11.7
Ticket Sales $2,490.2 $2,601.0 $2,739.0 $2,697.9 $2,743.1 $2,892.0 $3,059.6 $3,001.7 $3,160.5 $3,160.1
Source: “La Fleur’s 2018 World Lottery Almanac”(1) 2018 National Per Capita Sales is estimated
1 NY $3,371.32 FL $1,758.33 CA $1,664.94 TX $1,465.9
5 MD $1,255.96 GA $1,143.57 PA $1,093.78 OH $1,087.7
9 NJ $1,030.310 MA $997.111 MI $944.212 IL $722.5
13 OR $708.314 NC $675.515 VA $606.216 WV $487.2
17 SC $430.918 TN $421.719 RI $365.020 CT $350.0
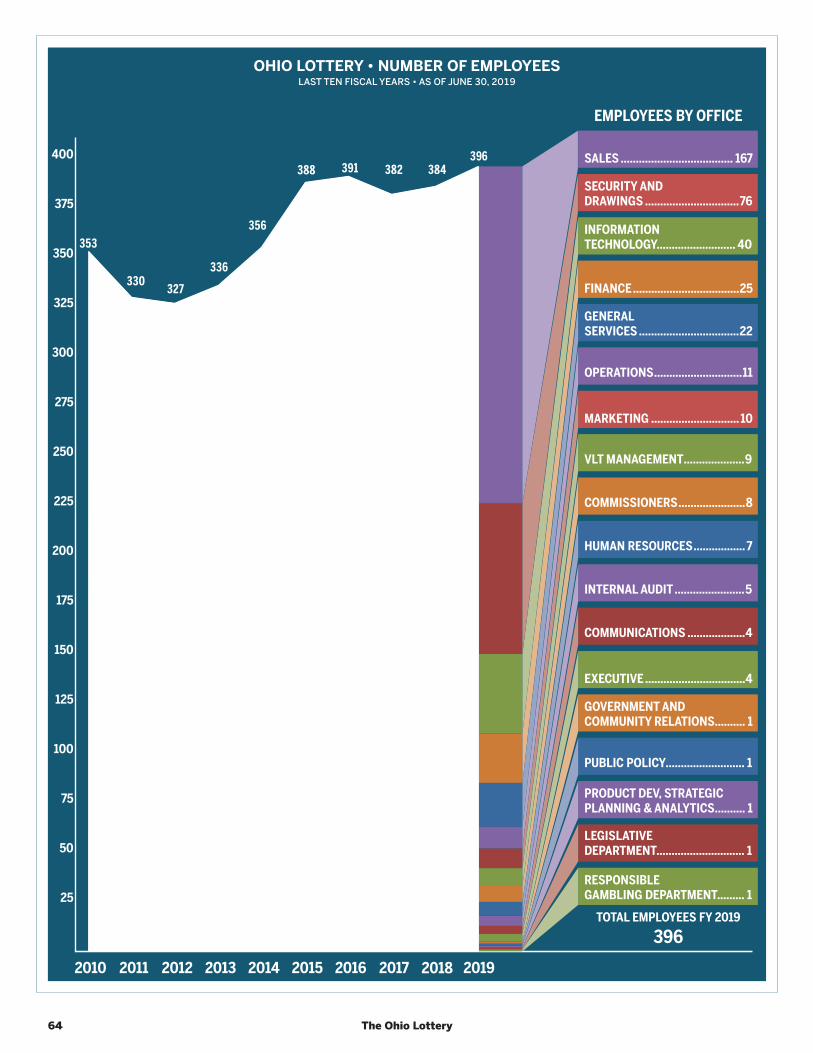
64 The Ohio Lottery
OHIO LOTTERY • NUMBER OF EMPLOYEESLAST TEN FISCAL YEARS • AS OF JUNE 30, 2019
50
25
100
75
125
150
175
200
225
250
275
300
325
350
375
400
201820172016201520142013201220112010 2019
GENERALSERVICES .................................22
OPERATIONS.............................11
MARKETING ............................. 10
VLT MANAGEMENT....................9
COMMISSIONERS......................8
HUMAN RESOURCES................. 7
INTERNAL AUDIT .......................5
COMMUNICATIONS ...................4
EXECUTIVE .................................4
GOVERNMENT ANDCOMMUNITY RELATIONS.......... 1
PUBLIC POLICY.......................... 1
PRODUCT DEV, STRATEGICPLANNING & ANALYTICS.......... 1
LEGISLATIVEDEPARTMENT............................. 1
RESPONSIBLEGAMBLING DEPARTMENT......... 1
INFORMATIONTECHNOLOGY.......................... 40
SECURITY ANDDRAWINGS ...............................76
SALES ..................................... 167
FINANCE...................................25
TOTAL EMPLOYEES FY 2019396
EMPLOYEES BY OFFICE
330327
336
356
388 391 382 384396
353
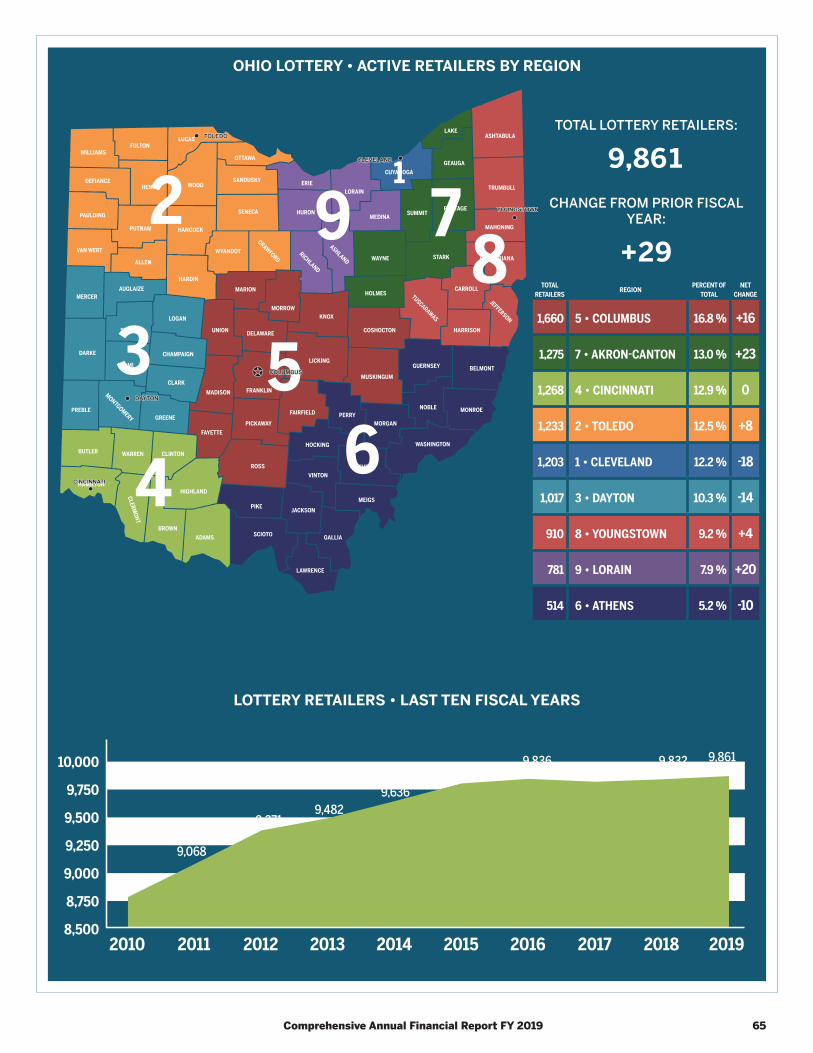
Comprehensive Annual Financial Report FY 2019 65
OHIO LOTTERY • ACTIVE RETAILERS BY REGION
201820172016201520142013201220112010 2019
9,861
8,770
9,068
9,3719,482
9,6369,795
9,836 9,810 9,832
8,500
9,000
9,500
9,750
10,000
8,750
9,250
1
9
3
2
4
5
78
6
MERCER
DARKE
PREBLE
MONTGOMERY
MIAMI
SHELBY
AUGLAIZE
LOGAN
CHAMPAIGN
CLARK
GREENE
WILLIAMS
DEFIANCE
PAULDING
VAN WERT
ALLEN
PUTNAM
HENRY
FULTONLUCAS
WOOD
HANCOCK
HARDIN
OTTAWA
SANDUSKY
SENECA
WYANDOT
CRAWFORD
CUYAHOGA
HURON
ERIELORAIN
RICHLAND
MEDINA
ASHLAND
LAKE
GEAUGA
SUMMITPORTAGE
WAYNE STARK
HOLMES
ASHTABULA
TRUMBULL
MAHONING
COLUMBIANA
CARROLLTUSCARAWAS
JEFFERSON
HARRISON
ROSS
FAYETTE
MADISON
MARION
UNION DELAWARE
MORROWKNOX
LICKING
FRANKLIN
PICKAWAY
COSHOCTON
MUSKINGUM
FAIRFIELD
SCIOTO
PIKE
GUERNSEY BELMONT
MONROE
WASHINGTON
NOBLE
MORGANPERRY
HOCKING
ATHENS
MEIGS
VINTON
JACKSON
GALLIA
LAWRENCE
BUTLER
HAMILTON
WARREN CLINTON
HIGHLAND
BROWNADAMS
CLERMONT
LOTTERY RETAILERS • LAST TEN FISCAL YEARS
TOTAL LOTTERY RETAILERS:
9,861CHANGE FROM PRIOR FISCAL
YEAR:
+29TOTAL
RETAILERS REGION PERCENT OFTOTAL
NETCHANGE
1,660 5 • COLUMBUS 16.8 % +16
1,275 7 • AKRON-CANTON 13.0 % +23
1,268 4 • CINCINNATI 12.9 % 0
1,233 2 • TOLEDO 12.5 % +8
1,203 1 • CLEVELAND 12.2 % -18
1,017 3 • DAYTON 10.3 % -14
910 8 • YOUNGSTOWN 9.2 % +4
781 9 • LORAIN 7.9 % +20
514 6 • ATHENS 5.2 % -10
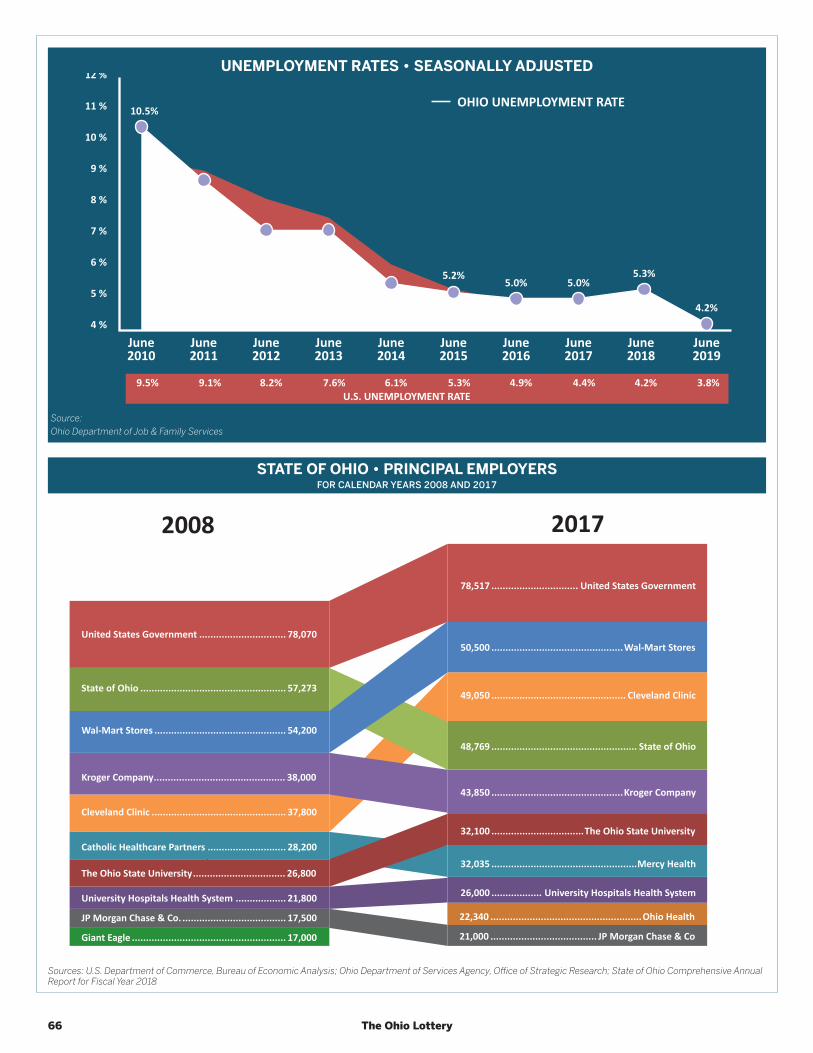
66 The Ohio Lottery
UNEMPLOYMENT RATES • SEASONALLY ADJUSTED
4 %
5 %
6 %
7 %
8 %
9 %
10 %
11 %
12 %
June2016
June2015
June2014
June2013
June2012
June2011
June2010
June2019
June2018
June2017
U.S. UNEMPLOYMENT RATE
OHIO UNEMPLOYMENT RATE
5.0%5.5%
7.2%
10.5%
4.2%
5.3%5.0%
5.2%
7.2%
8.8%
9.5% 9.1% 8.2% 7.6% 6.1% 5.3% 4.9% 4.4% 4.2% 3.8%
Source:Ohio Department of Job & Family Services
STATE OF OHIO • PRINCIPAL EMPLOYERSFOR CALENDAR YEARS 2008 AND 2017
22,340 ......................................................Ohio Health
21,000 ...................................... JP Morgan Chase & Co
32,035 ....................................................Mercy Health
26,000 .................. University Hospitals Health System
32,100 .................................The Ohio State University
43,850 ...............................................Kroger Company
49,050 ................................................ Cleveland Clinic
48,769 .................................................... State of Ohio
50,500 ...............................................Wal-Mart Stores
78,517 ............................... United States Government
Catholic Healthcare Partners ............................ 28,200
The Ohio State University................................. 26,800
University Hospitals Health System .................. 21,800
Giant Eagle ....................................................... 17,000
JP Morgan Chase & Co. ..................................... 17,500
Kroger Company............................................... 38,000
Cleveland Clinic ................................................ 37,800
Wal-Mart Stores ............................................... 54,200
State of Ohio .................................................... 57,273
United States Government ............................... 78,070
20172008
Sources: U.S. Department of Commerce, Bureau of Economic Analysis; Ohio Department of Services Agency, Office of Strategic Research; State of Ohio Comprehensive Annual Report for Fiscal Year 2018

The Ohio Lottery Commission • An Equal Opportunity Employer and Service Provider 615 West Superior Avenue • Cleveland, Ohio 44113-1875
1.800.686.4208 • www.ohiolottery.com