the obesity paradox and weight loss
TRANSCRIPT
fA
CLINICAL RESEARCH STUDY
The Obesity Paradox and Weight LossJonathan Myers, PhD,a,b Kusum Lata, MD,a Shilpy Chowdhury, MD, MPH,a Paul McAuley, PhD,c Nikhil Jain, BS,a
Victor Froelicher, MDa,b
aDivision of Cardiology, Veterans Affairs Palo Alto Health Care System, Palo Alto, Calif; bStanford University, Stanford, Calif;
cWinston-Salem State University, Winston-Salem, NC.f0ecCwcP
E-mail address
0002-9343/$ -see fdoi:10.1016/j.amjm
ABSTRACT
BACKGROUND: An “obesity paradox,” in which overweight and obese individuals with establishedcardiovascular disease have a better prognosis than normal weight subjects, has been reported in a numberof clinical cohorts, but little is known about the effects of weight loss on the obesity paradox and itsassociation with health outcomes.METHODS: Weight was determined in 3834 men at the time of a clinically referred exercise test and againduring a clinical evaluation a mean of 7 years later. The associations among weight changes, baselinefitness, and other risk markers with cardiovascular and all-cause mortality were determined by Coxproportional hazards analysis.RESULTS: During the follow-up period, 314 subjects died (72 of cardiovascular causes). In a multivariateanalysis (including baseline weight, weight change, exercise capacity, and cardiovascular disease), weightgain was associated with lower mortality and weight loss was associated with higher mortality (4% higherper pound lost per year, P � .001) compared with stable weight. For all-cause mortality, the relative risksor the no change, weight gain, and weight loss groups were 1.0 (referent), 0.64 (95% confidence interval,.50-0.83), and 1.49 (95% confidence interval, 1.17-1.89), respectively (P � .001). Those who died andxhibited weight loss had a significantly higher prevalence of deaths due to cancer and cardiovascularauses.ONCLUSION: Weight loss was related to higher mortality and weight gain was related to lower mortalityhen compared with stable weight. The obesity paradox in our sample is explained in part by a
ombination of non-volitional weight loss related to occult disease and a protective effect of weight gain.ublished by Elsevier Inc. • The American Journal of Medicine (2011) xx, xxx
KEYWORDS: Exercise testing; Heart disease; Mortality; Obesity
dcvhmdtcsosdhe
The prevalence of obesity has increased dramatically overthe last 2 decades and has reached global epidemic propor-tions in both adults and children in the United States.1,2 It isassociated with numerous comorbidities, including hyper-tension, type 2 diabetes, dyslipidemia, and cardiovasculardisease.1-3 Obesity is considered 1 of the 5 major riskactors for cardiovascular disease by the American Heartssociation and has been shown to be associated with the
Funding: None.Conflict of Interest: None of the authors have any conflicts of interest
associated with the work presented in this manuscript.Authorship: All authors had access to the data and played a role in
writing this manuscript.Requests for reprints should be addressed to Jonathan Myers, PhD, VA
Palo Alto Health Care System, Cardiology 111C, 3801 Miranda Ave, PaloAlto, CA 94304.
ront matter Published by Elsevier Inc.ed.2011.04.018
evelopment of heart failure, coronary heart disease, suddenardiac death, atrial fibrillation, and reduced overall survi-al.1-3 Despite the associations between obesity and theseealth conditions, a number of recent studies have docu-ented a puzzling phenomenon, termed the “obesity para-
ox,” in which overweight and obese individuals with es-ablished cardiovascular disease have a better prognosisompared with normal weight subjects.2,4,5 Other recenttudies have explored the role of fitness in the context of thebesity paradox and health outcomes. It has been demon-trated that irrespective of the presence of an obesity para-ox or related risk markers, individuals who are relatively fitave significantly better survival and fewer cardiovascularvents than unfit individuals.6-8
Although weight reduction is associated with a lesseningof hypertension, diabetes, and other cardiometabolic risk
markers,2,9 there is controversy regarding whether weight
mwpdtbmmhtw
etvlecmccyoaw
radttm[g
2 The American Journal of Medicine, Vol xx, No x, Month 2011
loss decreases or increases mortality risk.10-12 Several re-cent observational studies have reported higher mortalityrisk with increased weight loss.13-15 No doubt this issue is
ade more complex by the many comorbidities associatedith obesity and non-volitional weight loss. Variations inreexisting conditions, subclinicalisease, smoking, differences inhe type of fat loss or fat distri-ution (eg, visceral fat vs leanass), and the definition andeasure used to classify obesity
ave been suggested to explainhe inconsistent findings oneight loss and mortality.2,16
We recently reported the exis-tence of an obesity paradox inour population of veterans whowere referred for exercise testingfor clinical reasons.6,7,17 We ob-served that exercise capacitystrongly affects the obesity para-dox; in fact, when stratified by fit-ness level, the paradoxic associa-tion between obesity and mortalitywas not found in the group regis-tering high fitness.7,8 Stated differ-ntly, survival was influenced more by exercise capacityhan body mass index. Given this finding and the contro-ersial results of previous studies on the effects of weightoss on survival, it would be informative to document theffects of serial changes in both fitness and weight. In theurrent study, we assessed cardiovascular and all-causeortality in a subgroup of patients in the Veterans Exer-
ise Testing Study (VETS) who had weights recorded on 2linic visits before and after a treadmill test, a mean of 7ears apart. Our objectives were to determine the influencef fitness and changes in weight on cardiovascular andll-cause mortality and the extent to which changes ineight could explain the obesity paradox.
MATERIALS AND METHODSThe VETS cohort is an ongoing, prospective evaluation ofveteran subjects referred for exercise testing for clinicalreasons, designed to address exercise test, clinical, and life-style factors and their association with health outcomes.From the VETS cohort, a list of approximately 10,000 maleveterans who had undergone a maximal treadmill test forclinical reasons at the Veterans’ Administration (VA) PaloAlto Health Care System between 1992 and 2008 for clin-ical indications was formed. This list was used to query theVA computerized database to identify patients with weightsentered from clinic visits before and after an exercise test.The records were scanned to exclude patients with weightintervals less than 3 months apart, and those who died werereviewed to obtain a final weight that did not reflect a
CLINICAL SIGNIF
● Paradoxically, wto higher mortawas related tocompared withyears. Approxideaths in the wattributable towith muscle wa
● The obesity parplained in partnon-volitional wcult disease andweight gain.
sudden decrease associated with the terminal event. Seven
subjects were excluded because of gastric bypass surgeryduring the follow-up period. The final sample included 3834subjects.
Weight change was classified as those whose weightremained stable, those whose weight increased, and those
who lost weight between the ini-tial and the subsequent clinic visit.Delta weight was calculated anddivided by the time betweenweights to provide a change peryear. Similar calculations wereperformed to express weight changeas a percentage of baseline weight.An alteration in weight (increase ordecrease) � 1.0 lb was considered achange. The analyses were re-peated using a � 2.0-lb weightchange to determine whether ahigher threshold had an appre-ciable effect on the results. His-torical information that was re-corded at the time of the exercisetest included previous myocar-dial infarction by history or Qwave, cardiac procedures, heart fail-ure, hypertension, hypercholesterol-
emia (�220 mg/dL), claudication, chronic obstructive pulmo-nary disease, cancer, renal disease, diabetes, stroke,smoking status (current, past), and use of cardiacmedications.
Exercise TestingPatients underwent symptom-limited treadmill testing usingan individualized ramp treadmill protocol.18 Standard crite-ia for termination were used, including moderately severengina, �2.0 mm abnormal ST depression, a sustainedecrease in systolic blood pressure, or serious rhythm dis-urbances. The Borg 6-20 perceived exertion scale was usedo quantify degree of effort.19 Blood pressure was taken
anually, and exercise capacity (in metabolic equivalentsMETs]) was estimated from peak treadmill speed andrade.20
No test was classified as indeterminate, medications werenot withheld, and age-predicted maximal target heart rateswere not used as end points. The exercise tests were per-formed, analyzed, and reported using a standard protocolincorporating a computerized database with all definitionsand measurements prospectively defined.21
OutcomesThe main outcome variable was all-cause mortality; cardio-vascular deaths and other specific causes of death also wererecorded. The California Health Department Service andSocial Security Death Indices were used to ascertain thevital status of each patient as of December 31, 2008. Ac-
CE
loss was relatedand weight gainr mortality whene weight over 7y 60% of theloss group were
itions associated
seems to be ex-combination of
loss related to oc-otective effect of
ICAN
eightlitylowestabl
mateleightcondsting.
adoxby a
eighta pr
curacy of deaths was reviewed by 2 clinicians blinded to
l
t1W
t
tagtypbfc(gwrpgs
0(htwear4
tS
BODDDDD
3Myers et al Obesity Paradox and Weight Loss
exercise test results and confirmed using the Veterans Af-fairs computerized medical records.
Statistical AnalysisNCSS software (Kayesville, Utah) was used for all statisti-cal analyses. Unpaired t tests were used for comparisons ofcontinuous variables, and chi-square tests were used tocompare dichotomous variables between groups. Survivalanalysis was performed using Cox proportional hazardsanalysis to determine which clinical and exercise test vari-ables were independently associated with all-cause and car-diovascular death. Survival analyses were adjusted for age,exercise capacity, and cardiovascular disease. Hazard ratioswere calculated along with their 95% confidence intervals.The proportional hazards assumption was evaluated andconfirmed using the scaled Schoenfeld residual. Kaplan–Meier survival curves were constructed between subjectsexhibiting weight gain and weight loss, and compared usinga log-rank test. A delta weight score was created so thatunits of weight change per year in pounds would be anal-ogous to METs in a scale of 16, ranging from �8 to �8bs/year, allowing comparable change in percentage risk.
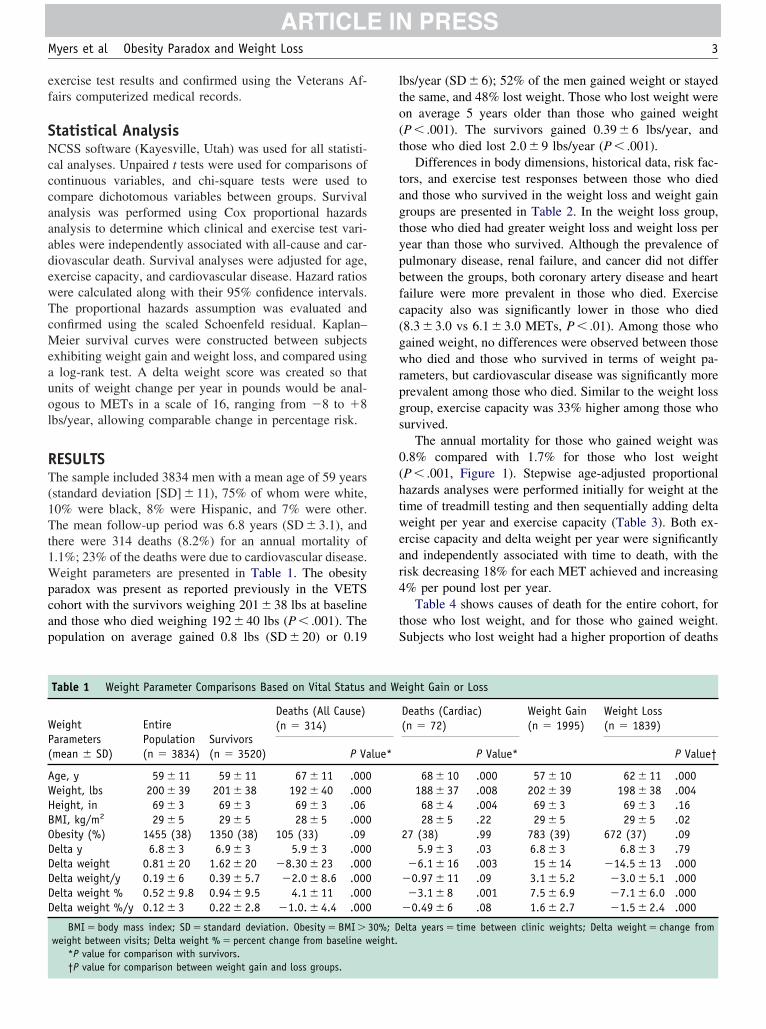
RESULTSThe sample included 3834 men with a mean age of 59 years(standard deviation [SD] � 11), 75% of whom were white,10% were black, 8% were Hispanic, and 7% were other.The mean follow-up period was 6.8 years (SD � 3.1), andhere were 314 deaths (8.2%) for an annual mortality of.1%; 23% of the deaths were due to cardiovascular disease.eight parameters are presented in Table 1. The obesity
paradox was present as reported previously in the VETScohort with the survivors weighing 201 � 38 lbs at baselineand those who died weighing 192 � 40 lbs (P � .001). Thepopulation on average gained 0.8 lbs (SD � 20) or 0.19
Table 1 Weight Parameter Comparisons Based on Vital Status
WeightParameters(mean � SD)
EntirePopulation(n � 3834)
Survivors(n � 3520)
Deaths (All Cause)(n � 314)
P Va
Age, y 59 � 11 59 � 11 67 � 11 .000Weight, lbs 200 � 39 201 � 38 192 � 40 .000Height, in 69 � 3 69 � 3 69 � 3 .06MI, kg/m2 29 � 5 29 � 5 28 � 5 .000besity (%) 1455 (38) 1350 (38) 105 (33) .09elta y 6.8 � 3 6.9 � 3 5.9 � 3 .000elta weight 0.81 � 20 1.62 � 20 �8.30 � 23 .000elta weight/y 0.19 � 6 0.39 � 5.7 �2.0 � 8.6 .000elta weight % 0.52 � 9.8 0.94 � 9.5 4.1 � 11 .000elta weight %/y 0.12 � 3 0.22 � 2.8 �1.0. � 4.4 .000
BMI � body mass index; SD � standard deviation. Obesity � BMI �weight between visits; Delta weight % � percent change from baseline w
*P value for comparison with survivors.
†P value for comparison between weight gain and loss groups.lbs/year (SD � 6); 52% of the men gained weight or stayedthe same, and 48% lost weight. Those who lost weight wereon average 5 years older than those who gained weight(P � .001). The survivors gained 0.39 � 6 lbs/year, andhose who died lost 2.0 � 9 lbs/year (P � .001).
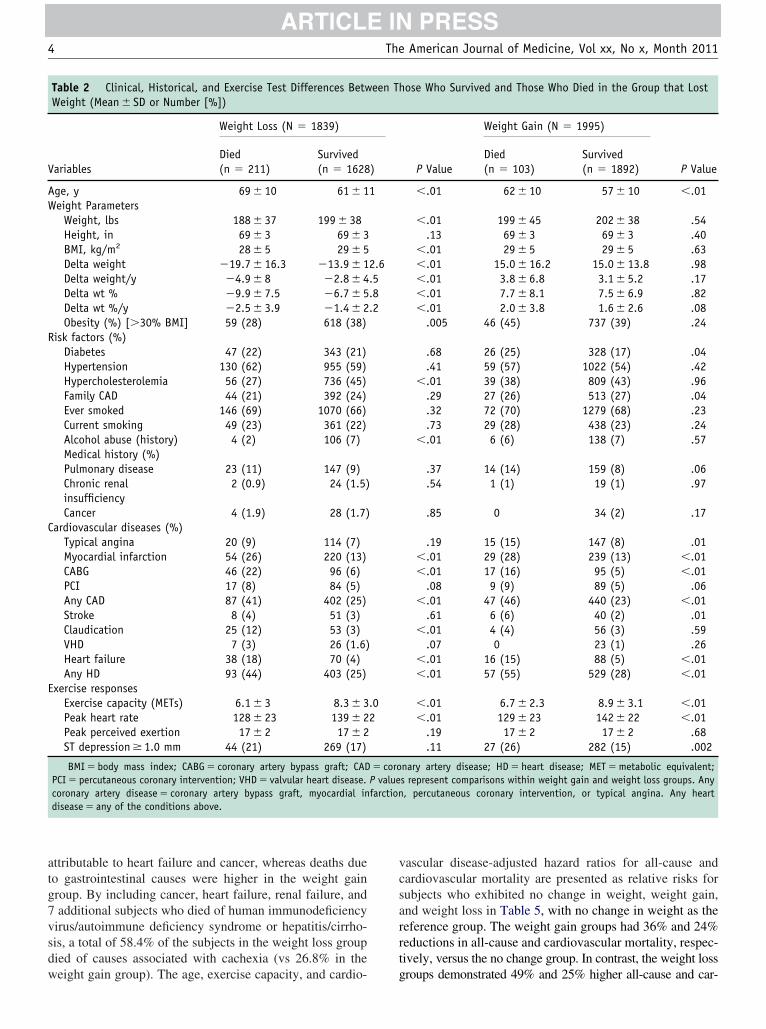
Differences in body dimensions, historical data, risk fac-ors, and exercise test responses between those who diednd those who survived in the weight loss and weight gainroups are presented in Table 2. In the weight loss group,hose who died had greater weight loss and weight loss perear than those who survived. Although the prevalence ofulmonary disease, renal failure, and cancer did not differetween the groups, both coronary artery disease and heartailure were more prevalent in those who died. Exerciseapacity also was significantly lower in those who died8.3 � 3.0 vs 6.1 � 3.0 METs, P � .01). Among those whoained weight, no differences were observed between thoseho died and those who survived in terms of weight pa-
ameters, but cardiovascular disease was significantly morerevalent among those who died. Similar to the weight lossroup, exercise capacity was 33% higher among those whourvived.
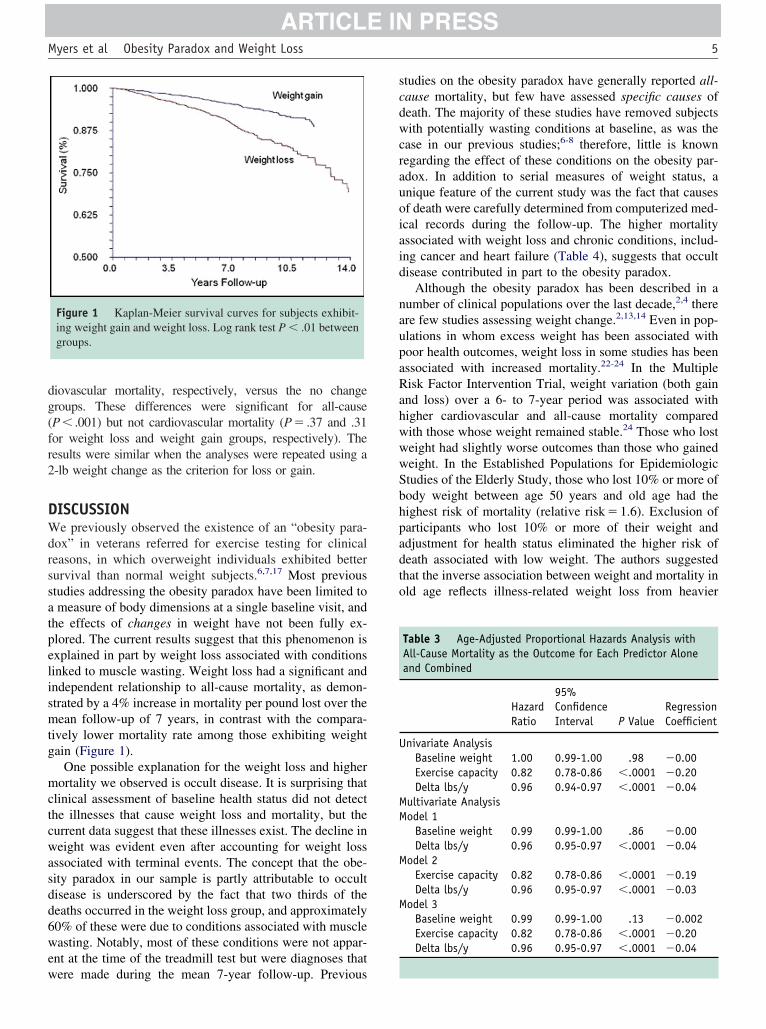
The annual mortality for those who gained weight was.8% compared with 1.7% for those who lost weightP � .001, Figure 1). Stepwise age-adjusted proportionalazards analyses were performed initially for weight at theime of treadmill testing and then sequentially adding deltaeight per year and exercise capacity (Table 3). Both ex-
rcise capacity and delta weight per year were significantlynd independently associated with time to death, with theisk decreasing 18% for each MET achieved and increasing% per pound lost per year.
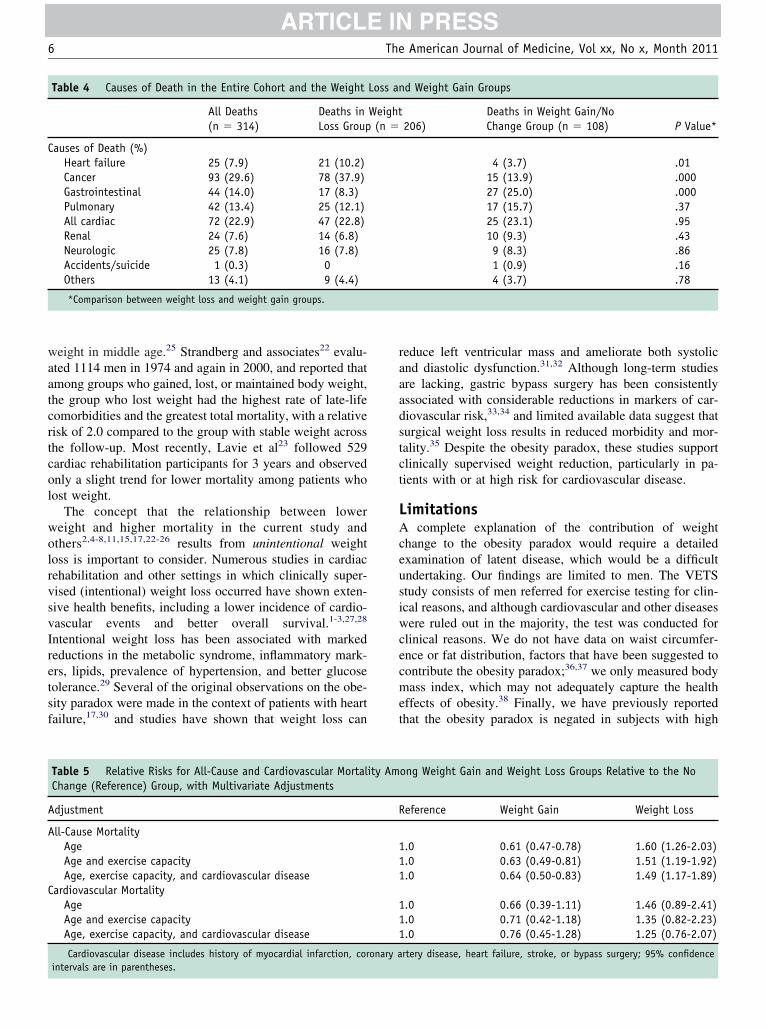
Table 4 shows causes of death for the entire cohort, forhose who lost weight, and for those who gained weight.ubjects who lost weight had a higher proportion of deaths
ight Gain or Loss
Deaths (Cardiac)(n � 72)
Weight Gain(n � 1995)
Weight Loss(n � 1839)
P Value* P Value†
68 � 10 .000 57 � 10 62 � 11 .000188 � 37 .008 202 � 39 198 � 38 .00468 � 4 .004 69 � 3 69 � 3 .1628 � 5 .22 29 � 5 29 � 5 .02
27 (38) .99 783 (39) 672 (37) .095.9 � 3 .03 6.8 � 3 6.8 � 3 .79
�6.1 � 16 .003 15 � 14 �14.5 � 13 .000�0.97 � 11 .09 3.1 � 5.2 �3.0 � 5.1 .000�3.1 � 8 .001 7.5 � 6.9 �7.1 � 6.0 .000
�0.49 � 6 .08 1.6 � 2.7 �1.5 � 2.4 .000
elta years � time between clinic weights; Delta weight � change from
and We
lue*
30%; Deight.
R
C
E
4 The American Journal of Medicine, Vol xx, No x, Month 2011
attributable to heart failure and cancer, whereas deaths dueto gastrointestinal causes were higher in the weight gaingroup. By including cancer, heart failure, renal failure, and7 additional subjects who died of human immunodeficiencyvirus/autoimmune deficiency syndrome or hepatitis/cirrho-sis, a total of 58.4% of the subjects in the weight loss groupdied of causes associated with cachexia (vs 26.8% in the
Table 2 Clinical, Historical, and Exercise Test Differences BetwWeight (Mean � SD or Number [%])
Variables
Weight Loss (N � 1839)
Died(n � 211)
Survived(n � 1628
Age, y 69 � 10 61 � 1Weight Parameters
Weight, lbs 188 � 37 199 � 38Height, in 69 � 3 69 � 3BMI, kg/m2 28 � 5 29 � 5Delta weight �19.7 � 16.3 �13.9 � 1Delta weight/y �4.9 � 8 �2.8 � 4Delta wt % �9.9 � 7.5 �6.7 � 5Delta wt %/y �2.5 � 3.9 �1.4 � 2Obesity (%) [�30% BMI] 59 (28) 618 (38)
isk factors (%)Diabetes 47 (22) 343 (21)Hypertension 130 (62) 955 (59)Hypercholesterolemia 56 (27) 736 (45)Family CAD 44 (21) 392 (24)Ever smoked 146 (69) 1070 (66)Current smoking 49 (23) 361 (22)Alcohol abuse (history) 4 (2) 106 (7)Medical history (%)Pulmonary disease 23 (11) 147 (9)Chronic renalinsufficiency
2 (0.9) 24 (1.5)
Cancer 4 (1.9) 28 (1.7)ardiovascular diseases (%)
Typical angina 20 (9) 114 (7)Myocardial infarction 54 (26) 220 (13)CABG 46 (22) 96 (6)PCI 17 (8) 84 (5)Any CAD 87 (41) 402 (25)Stroke 8 (4) 51 (3)Claudication 25 (12) 53 (3)VHD 7 (3) 26 (1.6)Heart failure 38 (18) 70 (4)Any HD 93 (44) 403 (25)
xercise responsesExercise capacity (METs) 6.1 � 3 8.3 � 3Peak heart rate 128 � 23 139 � 2Peak perceived exertion 17 � 2 17 � 2ST depression � 1.0 mm 44 (21) 269 (17)
BMI � body mass index; CABG � coronary artery bypass graft; CADPCI � percutaneous coronary intervention; VHD � valvular heart disease.coronary artery disease � coronary artery bypass graft, myocardial indisease � any of the conditions above.
weight gain group). The age, exercise capacity, and cardio-
vascular disease-adjusted hazard ratios for all-cause andcardiovascular mortality are presented as relative risks forsubjects who exhibited no change in weight, weight gain,and weight loss in Table 5, with no change in weight as thereference group. The weight gain groups had 36% and 24%reductions in all-cause and cardiovascular mortality, respec-tively, versus the no change group. In contrast, the weight loss
ose Who Survived and Those Who Died in the Group that Lost
P Value
Weight Gain (N � 1995)
P ValueDied(n � 103)
Survived(n � 1892)
�.01 62 � 10 57 � 10 �.01
�.01 199 � 45 202 � 38 .54.13 69 � 3 69 � 3 .40
�.01 29 � 5 29 � 5 .63�.01 15.0 � 16.2 15.0 � 13.8 .98�.01 3.8 � 6.8 3.1 � 5.2 .17�.01 7.7 � 8.1 7.5 � 6.9 .82�.01 2.0 � 3.8 1.6 � 2.6 .08
.005 46 (45) 737 (39) .24
.68 26 (25) 328 (17) .04
.41 59 (57) 1022 (54) .42�.01 39 (38) 809 (43) .96
.29 27 (26) 513 (27) .04
.32 72 (70) 1279 (68) .23
.73 29 (28) 438 (23) .24�.01 6 (6) 138 (7) .57
.37 14 (14) 159 (8) .06
.54 1 (1) 19 (1) .97
.85 0 34 (2) .17
.19 15 (15) 147 (8) .01�.01 29 (28) 239 (13) �.01�.01 17 (16) 95 (5) �.01
.08 9 (9) 89 (5) .06�.01 47 (46) 440 (23) �.01
.61 6 (6) 40 (2) .01�.01 4 (4) 56 (3) .59
.07 0 23 (1) .26�.01 16 (15) 88 (5) �.01�.01 57 (55) 529 (28) �.01
�.01 6.7 � 2.3 8.9 � 3.1 �.01�.01 129 � 23 142 � 22 �.01
.19 17 � 2 17 � 2 .68
.11 27 (26) 282 (15) .002
nary artery disease; HD � heart disease; MET � metabolic equivalent;s represent comparisons within weight gain and weight loss groups. Any, percutaneous coronary intervention, or typical angina. Any heart
een Th
)
1
2.6.5.8.2
.02
� coroP valuefarction
groups demonstrated 49% and 25% higher all-cause and car-
fr2
mctcwasdd6wew
sc
rauoiaid
n
upa
5Myers et al Obesity Paradox and Weight Loss
diovascular mortality, respectively, versus the no changegroups. These differences were significant for all-cause(P� .001) but not cardiovascular mortality (P� .37 and .31or weight loss and weight gain groups, respectively). Theesults were similar when the analyses were repeated using a-lb weight change as the criterion for loss or gain.
DISCUSSIONWe previously observed the existence of an “obesity para-dox” in veterans referred for exercise testing for clinicalreasons, in which overweight individuals exhibited bettersurvival than normal weight subjects.6,7,17 Most previousstudies addressing the obesity paradox have been limited toa measure of body dimensions at a single baseline visit, andthe effects of changes in weight have not been fully ex-plored. The current results suggest that this phenomenon isexplained in part by weight loss associated with conditionslinked to muscle wasting. Weight loss had a significant andindependent relationship to all-cause mortality, as demon-strated by a 4% increase in mortality per pound lost over themean follow-up of 7 years, in contrast with the compara-tively lower mortality rate among those exhibiting weightgain (Figure 1).
One possible explanation for the weight loss and higherortality we observed is occult disease. It is surprising that
linical assessment of baseline health status did not detecthe illnesses that cause weight loss and mortality, but theurrent data suggest that these illnesses exist. The decline ineight was evident even after accounting for weight loss
ssociated with terminal events. The concept that the obe-ity paradox in our sample is partly attributable to occultisease is underscored by the fact that two thirds of theeaths occurred in the weight loss group, and approximately0% of these were due to conditions associated with muscleasting. Notably, most of these conditions were not appar-
nt at the time of the treadmill test but were diagnoses that
Figure 1 Kaplan-Meier survival curves for subjects exhibit-ing weight gain and weight loss. Log rank test P � .01 betweengroups.
ere made during the mean 7-year follow-up. Previous
tudies on the obesity paradox have generally reported all-ause mortality, but few have assessed specific causes of
death. The majority of these studies have removed subjectswith potentially wasting conditions at baseline, as was thecase in our previous studies;6-8 therefore, little is knownegarding the effect of these conditions on the obesity par-dox. In addition to serial measures of weight status, anique feature of the current study was the fact that causesf death were carefully determined from computerized med-cal records during the follow-up. The higher mortalityssociated with weight loss and chronic conditions, includ-ng cancer and heart failure (Table 4), suggests that occultisease contributed in part to the obesity paradox.
Although the obesity paradox has been described in aumber of clinical populations over the last decade,2,4 there
are few studies assessing weight change.2,13,14 Even in pop-lations in whom excess weight has been associated withoor health outcomes, weight loss in some studies has beenssociated with increased mortality.22-24 In the Multiple
Risk Factor Intervention Trial, weight variation (both gainand loss) over a 6- to 7-year period was associated withhigher cardiovascular and all-cause mortality comparedwith those whose weight remained stable.24 Those who lostweight had slightly worse outcomes than those who gainedweight. In the Established Populations for EpidemiologicStudies of the Elderly Study, those who lost 10% or more ofbody weight between age 50 years and old age had thehighest risk of mortality (relative risk � 1.6). Exclusion ofparticipants who lost 10% or more of their weight andadjustment for health status eliminated the higher risk ofdeath associated with low weight. The authors suggestedthat the inverse association between weight and mortality inold age reflects illness-related weight loss from heavier
Table 3 Age-Adjusted Proportional Hazards Analysis withAll-Cause Mortality as the Outcome for Each Predictor Aloneand Combined
HazardRatio
95%ConfidenceInterval P Value
RegressionCoefficient
Univariate AnalysisBaseline weight 1.00 0.99-1.00 .98 �0.00Exercise capacity 0.82 0.78-0.86 �.0001 �0.20Delta lbs/y 0.96 0.94-0.97 �.0001 �0.04
Multivariate AnalysisModel 1
Baseline weight 0.99 0.99-1.00 .86 �0.00Delta lbs/y 0.96 0.95-0.97 �.0001 �0.04
Model 2Exercise capacity 0.82 0.78-0.86 �.0001 �0.19Delta lbs/y 0.96 0.95-0.97 �.0001 �0.03
Model 3Baseline weight 0.99 0.99-1.00 .13 �0.002Exercise capacity 0.82 0.78-0.86 �.0001 �0.20Delta lbs/y 0.96 0.95-0.97 �.0001 �0.04
aatcrtcol
wo
sf
aadst
6 The American Journal of Medicine, Vol xx, No x, Month 2011
weight in middle age.25 Strandberg and associates22 evalu-ted 1114 men in 1974 and again in 2000, and reported thatmong groups who gained, lost, or maintained body weight,he group who lost weight had the highest rate of late-lifeomorbidities and the greatest total mortality, with a relativeisk of 2.0 compared to the group with stable weight acrosshe follow-up. Most recently, Lavie et al23 followed 529ardiac rehabilitation participants for 3 years and observednly a slight trend for lower mortality among patients whoost weight.
The concept that the relationship between lowereight and higher mortality in the current study andthers2,4-8,11,15,17,22-26 results from unintentional weight
loss is important to consider. Numerous studies in cardiacrehabilitation and other settings in which clinically super-vised (intentional) weight loss occurred have shown exten-sive health benefits, including a lower incidence of cardio-vascular events and better overall survival.1-3,27,28
Intentional weight loss has been associated with markedreductions in the metabolic syndrome, inflammatory mark-ers, lipids, prevalence of hypertension, and better glucosetolerance.29 Several of the original observations on the obe-ity paradox were made in the context of patients with heartailure,17,30 and studies have shown that weight loss can
Table 4 Causes of Death in the Entire Cohort and the Weight
All Deaths(n � 314)
Deaths inLoss Group
Causes of Death (%)Heart failure 25 (7.9) 21 (10.2)Cancer 93 (29.6) 78 (37.9)Gastrointestinal 44 (14.0) 17 (8.3)Pulmonary 42 (13.4) 25 (12.1)All cardiac 72 (22.9) 47 (22.8)Renal 24 (7.6) 14 (6.8)Neurologic 25 (7.8) 16 (7.8)Accidents/suicide 1 (0.3) 0Others 13 (4.1) 9 (4.4)
*Comparison between weight loss and weight gain groups.
Table 5 Relative Risks for All-Cause and Cardiovascular MortalChange (Reference) Group, with Multivariate Adjustments
Adjustment
All-Cause MortalityAgeAge and exercise capacityAge, exercise capacity, and cardiovascular disease
Cardiovascular MortalityAgeAge and exercise capacityAge, exercise capacity, and cardiovascular disease
Cardiovascular disease includes history of myocardial infarction, cor
intervals are in parentheses.reduce left ventricular mass and ameliorate both systolicand diastolic dysfunction.31,32 Although long-term studiesre lacking, gastric bypass surgery has been consistentlyssociated with considerable reductions in markers of car-iovascular risk,33,34 and limited available data suggest thaturgical weight loss results in reduced morbidity and mor-ality.35 Despite the obesity paradox, these studies support
clinically supervised weight reduction, particularly in pa-tients with or at high risk for cardiovascular disease.
LimitationsA complete explanation of the contribution of weightchange to the obesity paradox would require a detailedexamination of latent disease, which would be a difficultundertaking. Our findings are limited to men. The VETSstudy consists of men referred for exercise testing for clin-ical reasons, and although cardiovascular and other diseaseswere ruled out in the majority, the test was conducted forclinical reasons. We do not have data on waist circumfer-ence or fat distribution, factors that have been suggested tocontribute the obesity paradox;36,37 we only measured bodymass index, which may not adequately capture the healtheffects of obesity.38 Finally, we have previously reportedthat the obesity paradox is negated in subjects with high
d Weight Gain Groups
206)Deaths in Weight Gain/NoChange Group (n � 108) P Value*
4 (3.7) .0115 (13.9) .00027 (25.0) .00017 (15.7) .3725 (23.1) .9510 (9.3) .439 (8.3) .861 (0.9) .164 (3.7) .78
ong Weight Gain and Weight Loss Groups Relative to the No
eference Weight Gain Weight Loss
.0 0.61 (0.47-0.78) 1.60 (1.26-2.03)
.0 0.63 (0.49-0.81) 1.51 (1.19-1.92)
.0 0.64 (0.50-0.83) 1.49 (1.17-1.89)
.0 0.66 (0.39-1.11) 1.46 (0.89-2.41)
.0 0.71 (0.42-1.18) 1.35 (0.82-2.23)
.0 0.76 (0.45-1.28) 1.25 (0.76-2.07)
rtery disease, heart failure, stroke, or bypass surgery; 95% confidence
Loss an
Weight(n �
ity Am
R
111
111
onary a
oi
1
1
1
1
1
1
1
1
1
1
2
2
2
2
2
2
2
2
2
2
3
3
3
3
3
3
3
3
3
7Myers et al Obesity Paradox and Weight Loss
fitness,6,7 and we do not have serial measures of fitness inur subjects. Therefore, the extent to which fitness levelnteracted with weight change and mortality is unknown.
CONCLUSIONSWeight loss over a mean 7-year period was related to higherall-cause mortality in veterans who were referred for exer-cise testing for clinical reasons. The obesity paradox in oursample seems to be explained in part by non-volitional weightloss related to latent disease that contributes to early mortality.The obesity paradox is a complex phenomenon that requiresadditional study, and future studies should consider weightchange when evaluating the longitudinal association amonghealth, overweight/obesity, and outcomes.
References1. Poirier P, Giles TD, Bray GA, et al. Obesity and cardiovascular
disease: pathophysiology, evaluation, and effect of weight loss. Arte-rioscler Thromb Vasc Biol. 2006;26:968-976.
2. Lavie CJ, Milani RV, Ventura HO. Obesity and cardiovascular dis-ease: risk factor, paradox, and impact of weight loss. J Am CollCardiol. 2009;53:1925-1932.
3. Klein S, Burke LE, Bray GA, et al. American Heart AssociationCouncil on Nutrition, Physical Activity, and Metabolism. Clinicalimplications of obesity with specific focus on cardiovascular disease:a statement for professionals from the American Heart AssociationCouncil on Nutrition, Physical Activity, and Metabolism. Circulation.2004;110:2952-2967.
4. Arena R, Lavie CJ. The obesity paradox and outcome in heart failure:is excess bodyweight truly protective? Future Cardiol. 2010;6:1-6.
5. Oreopoulos A, Padwal R, Kalantar-Zadeh K, Fonarow GC, NorrisCM, McAlister FA. Body mass index and mortality in heart failure: ameta-analysis. Am Heart J. 2008;156:13-22.
6. McAuley P, Myers J, Abella J, Froelicher V. Body mass, fitness andsurvival in veteran patients: another obesity paradox? Am J Med.2007;120:518-524.
7. McAuley PA, Kokkinos PF, Oliveira RB, Emerson BT, Myers JN.Obesity paradox and cardiorespiratory fitness in 12,417 male veteransaged 40 to 70 years. Mayo Clinic Proc. 2010;85:115-121.
8. McAuley P, Pittsley J, Myers J, Abella J, Froelicher VF. Fitness andfatness as mortality predictors in healthy older men: the VeteransExercise Testing Study. J Gerontol A Biol Sci Med Sci. 2009;64:695-699.
9. Klein S, Allison DB, Heymsfield SB, et al. Waist Circumference andCardiometabolic Risk: a Consensus Statement from Shaping Ameri-ca’s Health: Association for Weight Management and Obesity Preven-tion; NAASO, the Obesity Society; the American Society for Nutri-tion; and the American Diabetes Association. Obesity. 2007;15:1061-1067.
0. Lee IM, Paffenbarger Jr RS. Is weight loss hazardous? Nutr Rev.1996;54:S116-S124.
1. Sorensen TIA. Weight loss causes increased mortality: pros. Obes Rev.2003;4:3-7.
2. Yang D, Fontaine KR, Wang C, Allison DB. Weight loss causesincreased mortality: cons. Obes Rev. 2003;4:9-16.
3. Myrskyla M, Chang VW. Weight change, initial BMI, and mortalityamong middle- and older-aged adults. Epidemiology. 2009;20:840-848.
4. Østergaard JN, Grønbaek M, Schnohr P, Sørensen TI, Heitmann BL.Combined effects of weight loss and physical activity on all-causemortality of overweight men and women. Int J Obes. 2010;34:760-
769.5. Ingram DD, Mussolino ME. Weight loss from maximum body weightand mortality: the Third National Health and Nutrition ExaminationSurvey Linked Mortality File. Int J Obes. 2010;34:1044-1050.
6. Ross R, Janiszewski PM. Is weight loss the optimal target for obesity-related cardiovascular disease risk reduction? Can J Cardiol. 2008;24(Suppl D):25D-31D.
7. Lissin LW, Gauri AJ, Froelicher VF, Ghayoumi A, Myers J, Giacom-mini J. The prognostic value of body mass index and standard exercisetesting in male veterans with congestive heart failure. J Card Fail.2002;8:206-215.
8. Myers J, Buchanan N, Smith D, et al. Individualized ramp treadmill:observations on a new protocol. Chest. 1992;101:236S-241S.
9. Borg GAV. Borg’s Perceived Exertion and Pain Scales. Champaign,IL: Human Kinetics; 1998.
0. American College of Sports Medicine. Guidelines for Exercise Testingand Prescription. 8th ed. Baltimore: Lippincott, Williams, & Wilkins;2010.
1. Shue P, Froelicher VF. EXTRA: an expert system for exercise testreporting. J Non-Invasive Testing. 1998;II-4:21-27.
2. Strandberg TE, Strandberg AY, Salomaa VV, et al. Explaining theobesity paradox: cardiovascular risk, weight change, and mortalityduring long-term follow-up in men. Eur Heart J. 2009;30:1720-1727.
3. Lavie CJ, Milani RV, Artham SM, Patel DA, Ventura HO. The obesityparadox, weight loss, and coronary disease. Am J Med. 2009;122:1106-1114.
4. Blair SN, Shaten J, Brownell K, Collins G, Lissner L. Body weightchange, all-cause mortality, and cause-specific mortality in the Multi-ple Risk Factor Intervention Trial. Ann Intern Med. 1993;119:749-757.
5. Losonczy KG, Harris TB, Cornoni-Huntley J, et al. Does weight lossfrom middle age to old age explain the inverse weight mortalityrelation in old age? Am J Epidemiol. 1995;141:312-321.
6. Morse SA, Gulati R, Reisin E. The obesity paradox and cardiovasculardisease. Curr Hypertens Rep. 2010;12:120-126.
7. Savage PD, Brochu M, Poehlman ET, Ades PA. Reduction in obesityand coronary risk factors after high calorie exercise training in over-weight coronary patients. Am Heart J. 2003;146:317-323.
8. Ades PA, Savage PD, Harvey-Berino J. The treatment of obesity incardiac rehabilitation. J Cardiopulm Rehabil Prev. 2010;30:289-298.
9. Horton ES. Effects of lifestyle changes to reduce the risks of diabetesand associated cardiovascular risks: results from large scale efficacytrials. Obesity. 2009;17(Suppl 3):S43-S48.
0. Horwich TB, Fonarow GC, Hamilton MA, MacLellan WR, Woo MA,Tillisch JH. The relationship between obesity and mortality in patientswith heart failure. J Am Coll Cardiol. 2001;38:789-795.
1. Dayl SU, Kasikcioglu H, Uslu N, et al. Influence of weight loss onmyocardial performance index. Heart Vessels. 2006;21:84-88.
2. Alpert MA, Fraley MA, Birchem JA, Senkottaiyan N. Management ofobesity cardiomyopathy. Exp Rev Cardiovasc Ther. 2005;3:225-230.
3. Batsis JA, Sarr MG, Collazo-Clavell ML, et al. Cardiovascular riskafter bariatric surgery for obesity. Am J Cardiol. 2008;102:930-937.
4. Leichman JG, Wilson EB, Scarborough T, et al. Dramatic reversal ofderangements in muscle metabolism and left ventricular function afterbariatric surgery. Am J Med. 2008;121:966-973.
5. Picot J, Jones J, Colquitt JL, et al. The clinical effectiveness andcost-effectiveness of bariatric (weight loss) surgery for obesity: asys-tematic review and economic evaluation. Health Technol Assess. 2009;13:1-190, 215-357.
6. Beddhu S, Pappas LM, Ramkumar N, Samore M. Effects of body sizeand body composition on survival in hemodialysis patients. J Am SocNephrol. 2003;14:2366-2372.
7. Tanko LB, Christiansen C. Can the obesity paradox be explained bythe protective effects of peripheral adiposity? Arch Intern Med. 2005;165:1796-1797.
8. Janssen I, Katzmarzyk PT, Ross R. Waist circumference and not bodymass index explains the obesity paradox. Am J Clin Nutr. 2004;79:
379-384.