the mediating role of relationship marketing - pakistan
TRANSCRIPT
The Impact of Perceived Service Fairness on
Customer Citizenship Behaviors:
The Mediating Role of Relationship Marketing
By
Waseem Khan
091-12-14757
PhD Dissertation
In
Management Sciences
IQRA National University Peshawar Fall, 2020
The Impact of Perceived Service Fairness on
Customer Citizenship Behaviors:
The Mediating Role of Relationship Marketing
A Dissertation submitted to
The Department of Business Administration
IQRA National University Peshawar
In partial fulfillment
of the requirement for the degree of
PhD (Management Sciences)
By
Waseem Khan
091-12-14757
Fall, 2020
The Impact of Perceived Service Fairness on Customer Citizenship Behaviors: The Mediating Role of Relationship Marketing
A Dissertation submitted to the Business Administration Department as partial
fulfillment of the requirement for the award of Degree of Ph.D Management
Sciences.
Name Registration Number
Waseem Khan 091-12-14757
Supervisor
Prof. Dr. Farzand Ali Jan Department of Business Administration IQRA National University Peshawar December, 2019

Scanned with CamScanner

Author’s Declaration
I, Waseem Khan, bearing enrollment No. 091-12-14757, hereby state that my PhD
thesis titled “The Impact of Perceived Service Fairness on Customer Citizenship
Behaviors: The Mediating Role of Relationship Marketing” is my own work and has
not been submitted previously by me for taking any degree from this university i.e.
IQRA National University Peshawar or anywhere else in the country/world.
At any time if my statement is found to be incorrect even after I graduate the University
has the right to withdraw my PhD degree.
Date: December 25, 2019
Waseem Khan 091-12-14757
Plagiarism Undertaking
I solemnly declare that the research work presented in this thesis title “The Impact of
Perceived Service Fairness on Customer Citizenship Behaviors: The Mediating Role
of Relationship Marketing” is solely my research work with no significant
contribution from any other person. Small contribution/help wherever taken has been
duly acknowledged and that complete thesis has been written by me.
I understand the zero-tolerance policy of HEC and IQRA University Peshawar towards
plagiarism. Therefore, I as an author of the above titled thesis declare that no portion of
my thesis has been plagiarized and any material used as reference is properly
referred/cited.
I undertake if I am found guilty of any formal plagiarism in the above titled thesis even
after award of PhD Degree, the University reserves the right to withdraw/revoke my
PhD degree and that HEC and the university has the right to publish my name on the
HEC/ university website on which names of students are placed who submitted
plagiarized thesis.
Date: December 25, 2019
Waseem Khan 091-12-14757
Certificate
It is certified that Waseem Khan (091-12-14757) has carried out all the work related to this thesis under my supervision at the Department of Business Administration, IQRA University Peshawar, and the work fulfills the requirement for award of PhD degree.
Date: December 25, 2019
Supervisor:
_____________________________
Prof. Dr. Farzand Ali Jan Department of Business Administration
IQRA National University Peshawar
Head of Department:
_____________________________ Prof. Dr. Abid Usman Dean Department of Business Administration
Declarations
I declare the following:
That the material contained in this dissertation is the end result of my own work and that due acknowledgement has been given in the bibliography and references to all sources by the printed, electronic or personal.
That unless the dissertation has been confirmed as confident, I agree to an entire electronic copy or sections of this dissertation to being placed in library, if deemed appropriate, to allow future students the opportunity to see examples of past no longer than five years and that students would be able to print of copies or download. The authorship would remain anonymous.
I agree to my dissertation being submitted to a plagiarism detection service, where it will be stored in a database and compared against work submitted from this or any other school or from any other institution using the service.
I have read the Iqra National University Policy statement on ethics in research and consultancy.
INU ethics in research and consultancy; guidelines and procedures for students undertaking undergraduate/postgraduate research methods modules and dissertations and the policy for informed consent in research and consultancy and I declare that ethical issues have been considered, evaluated and appropriately addressed in this research.
_______________________ Waseem Khan 091-12-14757
PhD Scholar IQRA National University Peshawar
Date: December 25, 2019
Thumb Impression: __________

Copyrights Notice This research dissertation under the title “The Impact of Perceived Service Fairness on Customer Citizenship Behaviors: The Mediating Role of Relationship Marketing” is the intellectual property of Waseem Khan.
No part of this document may be reproduced, stored in any retrieval system or used otherwise without the prior permission of the author. I hereby allow IQRA National University, Peshawar to make copies of this dissertation for academic purposes only.
Any individual/organization may make copies of this document for non-commercial purposes with prior permission of the author.
_______________________
Waseem Khan
i
ACKNOWLEDGEMENTS
Undertaking doctoral studies was one of the most testing and yet valuable experience of
my life and it proved to be far more exciting and challenging than what I had expected.
Nonetheless, I could not have completed this study without the support and
encouragement of many individuals whom I extend my deep appreciation for their
invaluable contributions. Foremost, I gratefully acknowledge the contribution of
Professor Dr. Farzand Ali Jan who provided me intellectual support, constant
encouragement and constructive criticism. His faith in my abilities instilled tremendous
motivations for me to strive for excellence. I truly appreciate his guidance, steadfast
support, and dedication. I'm forever grateful for his generous sharing of his most
valuable resources and time, to help me move forward as I moved through this research.
The next person whom I wish to extend much appreciation is Professor Dr. Anwar
Chishti, from whom I have learned a great deal of knowledge about the application of
quantitative data analysis techniques. I am also thankful to him for his enthusiasm in
teaching us, especially in providing us with valuable research materials during doctoral
coursework. I thank you sir because I have learned a lot and got to know more about
how to conduct research.
I am also very grateful for the assistance provided by all the internal review committee
members of the Business Administration Department for their insightful and
constructive feedback during formative stages of my dissertation. Their experiences,
knowledge, and skills have helped me to complete this work in a much better way than
earlier versions. In particular, I am thankful for the help extended by Professor Dr.
Abid Usman, and Dr. Adil Adnan. Their constructive comments since the early stage of
this dissertation are valuable for me to improve the quality of the dissertation. I also
appreciate their willingness and availability for helping me when I was in need of their
assistance.
I would also like to express my thanks to Dr. Kashif Amin for his valuable inputs and
comments to my doctoral dissertation from its formative stage. I am indebted to for his
help, patience, and persistent support during my studies at Iqra National University. His
comprehensive and critical comments on my dissertation were indispensable to make it
meaningful.

ii
I would also like to thank Dr. Amir Nadeem, Dean Department of management
Sciences from City University Peshawar who have reviewed my dissertation, for his
meticulous examination of my dissertation and providing valuable comments and
suggestions to further improve it. I also want to thank my Uncle and my family
members who served as a main resource for helping me establish contact with banks
and referred my survey for data collection. I also extend my appreciation to Kashif
Amin, Kamran Nawaz, Kashif Shah and Ms. Nida Aman for their assistance and
collaboration for my data collection. I am thankful for the Assistance provided by the
branch managers and banking staff of the all branches in the data collection processes.
Most importantly, I am indebted for every individual consumer who responded to my
questionnaire survey, needless to say, I am so thankful for their time and kindness. I am
indebted for all the reviewers who reviewed the initial draft of the questionnaire,
validated its contents and provided their valuable comments and suggestions.
I want to express my thanks to Higher Education Commission for awarding me
Indigenous Scholarship grant and enabling me to meet my expenses and pay my full
tuition-fees during my doctoral studies. My sincere gratitude goes to Iqra National
University for all their support and facilitation during my doctoral study. I would also
like to express my gratitude to all the honorable faculty members in the Department of
Business Administration for their valuable help and instructions during my study at Iqra
National University. My thanks go to all the administrative staff of the University for
their timely provision of administrative assistance which facilitated my degree
completion process.
Last but not the least, I greatly appreciate the support of my colleagues and friends in
my coursework at Business Administration department, Iqra National University, who
had been with me for two years. I enjoyed a very valuable and unforgettable time with
them and I wish them best of luck in their future endeavors.
Thank you very much!

iii
DEDICATION
This dissertation is dedicated to my beloved family members, who have meant and
continue to mean so much to me, specially my father who have always loved me and
gave me great power for enduring difficulties.
I take this opportunity to thank my wife who has helped me to restore passion in my
professional life. Lastly, I would like to adore my lovely children Muhammad Ali,
Maryam and Mahrosh for their grace.
iv
LIST OF ABBREVIATIONS
AB Augmenting Behavior
CB Co-developing Behavior
CC Customer Commitment
CCB Customer Citizenship Behavior
CEB Customer Engagement Behavior
CFA Confirmatory Factor Analysis
CS Customer Satisfaction
DF Distributive Fairness
FR Foreign Bank
IB Influencing behavior
IB Islamic Bank
IF Informational Fairness
IPF Interpersonal Fairness
MB Mobilizing behavior
MC Microcredit Bank
MGA Multigroup Analysis
MICOM Measurement invariance of composites
PB Public Bank
PCT Psychological Contract theory
PF Procedural Fairness
PLS Partial Least Squires
PLS-SEM Partial Least Squired based Structure Equation Modeling
PVT Private Bank
RM Relationship Marketing
RQ Relationship Quality
RV Relationship Value
SBP State Bank of Pakistan

v
SD Logic Service dominant logic
SEM Structural Equation Modeling
SET Social Exchange theory
SF Service Fairness
SP Specialized Bank
TR Trust
WOM Word of Mouth
vi
ABSTRACT
Since late 1980’s the banking sector in Pakistan has undergone major structural
changes due to financial liberalization and deregulations. This transformation has led to
greater competition among financial institutions, favoring in the efficiency and
competitiveness of banking sector. As a result, a greater variety and choices of products
and services for customers are available while some banking institutions are offering
sophisticated delivery systems and more value-added services than rivals. Likewise,
banks have also come under enormous pressure to tackle the growing demands and
expectations of their consumers as well as due to the shift in customer-centric
regulatory paradigm towards protection of financial consumers, posing major challenge
for bank to retain existing customers. These considerations converge to imply the need
for more specific customer-focused strategies to build and maintain enduring bank-
client relationships. Presently, the business environment surrounding banking
institution is highly competitive where new clients are hard to attract at mature stage in
their life cycles, hence banks must strive for establishing new revenue streams,,
particularly in a situation where competition between financial establishments has
intensified, banking institutions need to make various efforts to achieve differentiated
competitiveness through forging sustainable relationships with customers.
In terms of producers of financial services, considering the highly competitive nature of
banking industry and increasingly interactive customer roles, fairness in service
delivery is essential in developing and maintaining bank-client relationships. Earlier
studies show that a consumer's perception of whether a service provider has fulfilled
the obligation to deliver the desired outcome and benefits associated with the service
promised to consumers serve as a is a fundamental basis for sustaining and enhancing
long-term customer-firm relationships. Service fairness is a multidimensional construct
composed of distributive fairness, procedural fairness, informational and interactional
fairness, which refers to a consumer’s perception regarding the degree of justice in a
service provider’s behavior during service delivery process. Service fairness is an
implicit agreement between customers with their service providers to have their needs
served well and to be treated fairly according the service outcomes promised.
Successful customer relationship management can be attributed to a customer’s positive
evaluations of a service provider’s efforts in provision of service fairness excellence
vii
during an exchange relationship. Although banking services is recognized to encounter
numerous service failure episodes there has been scant investigations in commercial
banking sector of Pakistan that addressed the connection among service fairness,
relationship marketing and customer engagement. Past studies in the domain
relationship marketing strongly support that mutually profitable buyer-seller
relationships are key to secure competitive advantage emphasizing the importance of
quality and value of relationships. However, there is a lack of an integrative perspective
about understanding buyer-seller relationship building process through the lens of
service fairness. This research contributes to building a comprehensive understanding
on how customer evaluations regarding different facets of service fairness affect bank-
consumer relationship building process and lead customers to perform various
citizenship behaviors, by examining empirically this relationship at multi-group level.
This research study was conducted in Pakistan, using a positivist philosophical lens,
data was gathered quantitively with the help of questionnaire distributed using stratified
random sampling technique. The validity of survey instrument and structural paths
relationships were confirmed using pilot study procedure. The results of pilot survey
were very useful in validating the proposed model and measurement scales used in the
study however few of the items were dropped from subsequent analysis to improve the
reliability and validity of the instrument. Data was gathered from 1740 consumers of
banking services located within scheduled bank branches in a single cross-section
however only 1430 valid responses were subjected to further analysis. The model was
assessed using partial least square based Structured Equation Modeling (PLS-SEM),
using Smart PLS 3.2.7 statistical software following the PLS-SEM guidelines proposed
by (Jörg Henseler, Hubona, & Ray, 2017) in the field of social sciences research. As a
result, the model demonstrated greater predictive response to a consumer’s assessment
of service fairness.
The results of this research confirmed that banking consumers commonly evaluate
fairness in exchange relationships when dealing with service providers. The findings
support the model’s structure and indicated that all four dimensions of service fairness
determine relationship value and quality, which in turn lead customers to perform
citizenship behaviors. The results show that service fairness evaluations also had direct
influence on customer citizenship behavior, however this relationship is better
viii
explained by a firm’s relationship marketing efforts. This implies that although fair
treatment is essential in reinforcing long-term relationships and for customers to engage
in citizenship behaviors but it is also a significant condition that may encourage
consumers to perform positive extra role behavioral outcomes. Therefore, banks should
provide assurance that their services can achieve a sustainable level of favorableness
that meets what the service provider has promised to its customers.
This study brought to light that the knowledge pertaining to the critical role of service
fairness strategies in building valuable, enduring relationships with customers.
Moreover, this research contributes in the relationship marketing literature on how
service fairness excellence encourage customer to engage in citizenship behaviors in
favor of the firm through developing successful long-term mutually beneficial
relationship. Therefore, besides service excellence banks need focus on providing
excellence in service fairness to create strong relationships with their clients as endured
relationship can lead to customer citizenship behaviors.
Keywords: Service fairness, Relationship Marketing, Customer citizenship behaviors,
Multi-group analysis, Banking Sector, Pakistan
ix
TABLE OF CONTENTS
ACKNOWLEDGEMENTS .............................................................................................. i
DEDICATION ................................................................................................................iii
LIST OF ABBREVIATIONS ......................................................................................... iv ABSTRACT .................................................................................................................... vi
TABLE OF CONTENTS ................................................................................................ ix
LIST OF TABLES ........................................................................................................ xvi
LIST OF FIGURES .....................................................................................................xviii Chapter 1 .......................................................................................................................... 1
INTRODUCTION ............................................................................................................ 1
1.1 Introduction ........................................................................................................... 1
1.2 Background of the study ....................................................................................... 1 1.3 Problem Statement ................................................................................................ 6
1.4 Research Questions ............................................................................................... 7
1.5 Research Objectives .............................................................................................. 8
1.6 Significance of the Study ...................................................................................... 8 1.7 Scope of the study ............................................................................................... 11
1.8 Research gaps identified ...................................................................................... 12
1.9 Structure of the thesis .......................................................................................... 14
Chapter 2 ........................................................................................................................ 16
LITERATURE REVIEW ............................................................................................... 16 2.1 Chapter overview ................................................................................................ 16
2.2 Equity theory ....................................................................................................... 16
2.3 Psychological contract theory ............................................................................. 20
2.4 Social exchange theory ........................................................................................ 26 2.5 Service dominant logic ........................................................................................ 30
2.6 Service fairness ................................................................................................... 32
2.6.1 Distributive fairness ..................................................................................... 34
2.6.2 Procedural fairness ....................................................................................... 36 2.6.3 Interpersonal fairness ................................................................................... 37
2.6.4 Informational fairness .................................................................................. 38
2.7 Relationship marketing ....................................................................................... 40
2.7.1 Relationship value ........................................................................................ 41
x
2.7.2 Relationship quality ..................................................................................... 45
2.7.1.1 Customer satisfaction .................................................................................. 47
2.7.1.2 Customer trust ............................................................................................. 49 2.7.1.3 Customer commitment ................................................................................ 49
2.8 Customer citizenship behavior ............................................................................ 50
Chapter 3 ........................................................................................................................ 54
RESEARCH METHODOLOGY ................................................................................... 54 3.1 Chapter overview ................................................................................................ 54
3.2 Theoretical framework and research hypotheses ................................................ 54
3.2.1 Service fairness and relationship quality ..................................................... 57
3.2.2 The relationship between service fairness and relationship value ............... 58 3.2.3 Relationship value and relationship quality ................................................. 59
3.2.4 Service fairness and customer engagement behavior .................................. 60
3.2.5 Relationship quality and customer engagement behavior............................ 60
3.2.6 Relationship value and customer engagement behavior .............................. 61 3.2.7 Service fairness, relationship quality, customer engagement behavior ....... 62
3.2.8 Service fairness, relationship value, customer engagement behavior .......... 63
3.3 Research paradigm .............................................................................................. 63
3.3.1 Ontology ...................................................................................................... 64 3.3.2 Epistemology ............................................................................................... 64
3.3.3 Methodology ................................................................................................ 65
3.3.4 Positivist paradigm of inquiry ...................................................................... 65
3.3.5 Realism ........................................................................................................ 66
3.3.6 Axiology ...................................................................................................... 66 3.4 Research design ................................................................................................... 67
3.4.1 Research approach ....................................................................................... 67
3.4.2 Research strategy ......................................................................................... 68
3.4.3 Research choice............................................................................................ 69 3.4.4 Time horizon ................................................................................................ 69
3.4.5 Research context .......................................................................................... 69
3.5 Data collection preparations ................................................................................ 70
3.5.1 Instrumentation ............................................................................................ 70 3.5.2 Questionnaire translation into Urdu and pre-testing .................................... 75
3.5.3 Theoretical framework validation ................................................................ 76
3.5.3.1 Questionnaire pre-testing ............................................................................ 76
xi
3.5.3.2 Questionnaire pilot testing .......................................................................... 76
3.5.4 Main study ................................................................................................... 78
3.5.4.1 Research Population .................................................................................... 78 3.5.4.2 Sampling Frame .......................................................................................... 78
3.5.4.3 Sample Size ................................................................................................. 78
3.5.4.4 Sampling strategy ........................................................................................ 79
3.5.4.5 Data collection procedure ........................................................................... 81 3.6 Data analysis preparation .................................................................................... 82
3.6.1 Introduction .................................................................................................. 82
3.6.2 Structural equation modelling (SEM) .......................................................... 82
3.6.3 Covariance-based and variance-based structural equation modelling SEM 85 3.6.4 Rationale for using PLS-SEM ..................................................................... 86
3.7 Assessing the results measurement model .......................................................... 88
3.7.1 Internal consistency reliability ..................................................................... 88
3.7.1.1 Composite reliability ................................................................................... 88 3.7.1.2 Indicator reliability ...................................................................................... 89
3.7.1.3 Cronbach’s Alpha (α) .................................................................................. 89
3.7.2 Model validity .............................................................................................. 89
3.7.3 Convergent validity ...................................................................................... 90 3.7.3.1 Average variance extracted (AVE) ............................................................. 90
3.7.3.2 Item outer loadings (λ) ................................................................................ 90
3.7.4 Discriminant validity ................................................................................... 91
3.7.4.1 Fornell-Larcker criterion ............................................................................. 91
3.7.4.2 Item cross loadings ..................................................................................... 91 3.7.4.3 Heterotrait-Monotrait Ratio (HTMT) ......................................................... 91
3.7.5 Assessing the results structural model ......................................................... 93
3.7.5.1 Assessing the structural model for (multi) collinearity ............................... 94
3.7.5.2 Cross-validation of parameter estimate stability ......................................... 94 3.7.5.3 Assessing the model predictive power – coefficient of determination (R2) 95
3.7.5.4 Assessing the f2 effect size .......................................................................... 95
3.7.5.5 Assessing predictive relevance (Q2) ........................................................... 96
3.7.5.6 Assessing the q2 effect size ......................................................................... 97 3.7.5.7 Significance and relevance assessments of structural model paths ............ 97
3.7.5.8 Mediation .................................................................................................... 98
3.7.5.9 Assessing model goodness of fit ................................................................. 99

xii
3.7.5.10 Measurement invariance of composite models - MICOM...................... 100
3.7.5.11 Multi-group analysis – (MGA) ............................................................... 102
3.8 Data management .............................................................................................. 105 3.8.1 Data screening ............................................................................................ 105
3.8.2 Missing values ........................................................................................... 105
3.8.3 Outlier analysis .......................................................................................... 105
3.8.4 Data coding ................................................................................................ 106 3.8.5 Assessment of normality ............................................................................ 107
3.8.6 Assessment of multi collinearity ................................................................ 110
3.8.7 Assessment of Common method variance ................................................. 111
3.8.8 Assessment of heteroscedasticity ............................................................... 112 3.8.8 Design summary ........................................................................................ 113
Chapter 4 ...................................................................................................................... 116
RESULTS AND DISCUSSION .................................................................................. 116
4.1 Chapter overview .............................................................................................. 116 4.2 Demographic profile of participants ................................................................. 116
4.2.1 Descriptive statistics .................................................................................. 119
4.3 Data analysis ..................................................................................................... 123
4.4 Measurement model assessment ....................................................................... 123 4.4.1 Internal consistency reliability ................................................................... 123
4.4.2 Convergent validity .................................................................................... 124
4.4.3 Discriminant validity ................................................................................. 126
4.4.3.1 Item cross loadings ................................................................................... 126
4.4.3.2 Fornell-Larcker criterion ........................................................................... 128 4.4.3.3 Heterotrait-monotrait ratio (HTMT) ......................................................... 129
4.5 Structural Model Evaluation ............................................................................. 132
4.5.1 Multicollinearity Statistics ......................................................................... 132
4.5.2 Overall Model Predictive Power (R2) ........................................................ 134 4.5.3 Effect size f 2 .............................................................................................. 135
4.5.4 Predictive accuracy– Q2 ............................................................................. 136
4.5.5 Predictive relevance effects size q2 ................................................................. 137
4.5.6 Assessing model goodness of fit ................................................................ 138 4.5.7 Cross-validation of parameter estimate stability ........................................ 139
4.5.8 Significance and relevance of structural path relationships ....................... 139
4.5.9 Direct effects .............................................................................................. 140
xiii
4.5.10 Total Indirect Effects (mediation effects) .................................................. 141
4.5.11 Specific indirect effects .............................................................................. 142
4.5.12 Total effects ............................................................................................... 143 4.5.13 Variance accounted for (VAF) by mediating variables ............................. 145
4.6 Hypotheses Validation summary ...................................................................... 147
4.6.1 Service fairness and relationship quality ................................................... 147
4.6.2 Service fairness and relationship value ...................................................... 148 4.6.3 Relationship value and relationship quality ............................................... 148
4.6.4 Service fairness and customer citizenship behavior .................................. 148
4.6.5 Relationship quality and customer citizenship behavior............................ 148
4.6.6 Relationship value and customer citizenship behavior .............................. 148 4.6.7 Service fairness, relationship quality and customer citizenship behavior . 149
4.6.8 Service fairness, relationship value and customer citizenship behavior .... 149
4.6.9 Relationship value, relationship quality and customer citizenship behavior ... .................................................................................................................... 149
4.6.10 Relationship between service fairness, relationship value, relationship quality and customer citizenship behaviors .............................................. 150
4.7.1 Introduction ................................................................................................ 156 4.7.2 Data analysis .............................................................................................. 156
4.7.3 Model predictive relevance and goodness of fit ........................................ 158
4.7.4 Structural paths across consumer groups ................................................... 161
4.7.5 Total Indirect paths .................................................................................... 162 4.7.6 Specific Indirect paths ................................................................................ 163
4.8 Invariance testing- MICOM .............................................................................. 164
4.8.1 Configural invariance (step 1) ................................................................... 164
4.8.2 Compositional invariance (step 2) ............................................................. 164 4.8.3 Composites equivalence of mean and variances (step 3) ........................... 165
4.9 Multigroup analysis- MGA ............................................................................... 165
4.9.1 Foreign vs Islamic bank consumers ........................................................... 166
4.9.2 Foreign vs micro credit bank consumers ................................................... 167
4.9.3 Foreign vs public sector bank consumers .................................................. 167 4.9.4 Foreign vs private sector bank consumers ................................................. 168
4.9.5 Foreign vs specialized bank consumers ..................................................... 169
4.9.6 Islamic vs microcredit bank consumers ..................................................... 170
4.9.7 Islamic vs public sector bank consumers ................................................... 171
xiv
4.9.8 Islamic vs private sector bank consumers .................................................. 171
4.9.9 Islamic vs specialized bank consumers ...................................................... 172
4.9.10 Microcredit vs public sector bank consumers ............................................ 173 4.9.11 Microcredit vs private sector bank consumers ........................................... 173
4.9.12 Microcredit vs Specialized bank consumers .............................................. 174
4.9.13 Pubic vs Private sector bank consumers .................................................... 174
4.9.14 Public vs Specialized bank consumers ...................................................... 174 4.9.15 Private sector vs Specialized bank consumers ........................................... 175
4.10 Summary of key findings .............................................................................. 183
4.10.1 The impact of service fairness on relationship value ................................. 183
4.10.2 The role of relationship value in relationship quality ................................ 183 4.10.3 The role of service fairness in relationship marketing ............................... 184
4.10.4 The role of relationship marketing in customer citizenship behaviors ...... 185
4.10.5 The impact of service fairness on customer citizenship behavior ............. 186
4.10.6 The relative importance of each dimension of service fairness in relationship building .................................................................................. 186
4.10.7 The importance of service fairness for relationship building and driving customer citizenship behaviors .................................................................. 187
Chapter 5 ...................................................................................................................... 188
CONCLUSION AND RECOMMENDATIONS ......................................................... 188
5.1 Chapter overview .............................................................................................. 188
5.2 Conclusion ........................................................................................................ 189 5.3 Theoretical implications .................................................................................... 194
5.4 Managerial implications .................................................................................... 197
5.4.1 Introduction ............................................................................................... 197
5.4.2 Distributive fairness ................................................................................... 198 5.4.3 Interpersonal fairness ................................................................................. 199
5.4.4 Information Fairness .................................................................................. 199
5.4.5 Procedural Fairness .................................................................................... 200
5.4.6 Training of contact personnel .................................................................... 201
5.4.7 Recruitment and selection appropriate individuals .................................... 201 5.4.8 Positioning the bank and its services based on fairness ............................. 202
5.4.9 Implications for practitioners ..................................................................... 202
5.4.10 Implications for policy with regard to consumer protection ...................... 203
5.4.11 Monitor and track perceptions about fairness ............................................ 204
xv
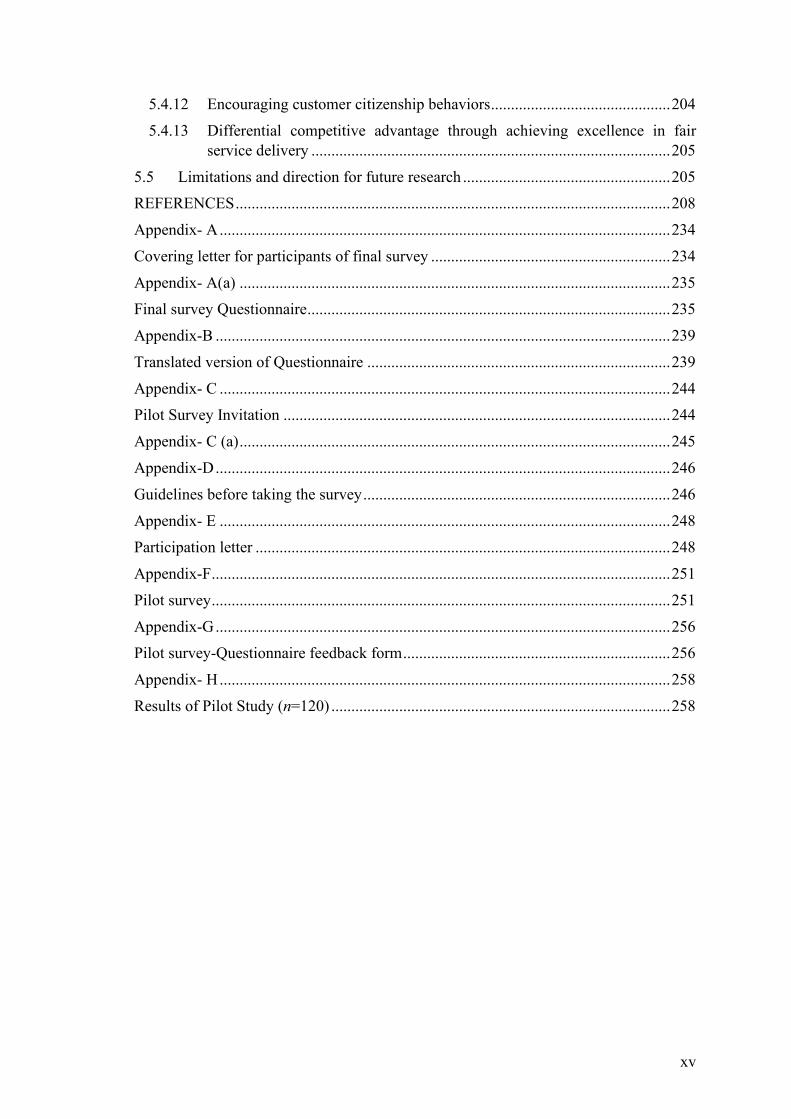
5.4.12 Encouraging customer citizenship behaviors ............................................. 204
5.4.13 Differential competitive advantage through achieving excellence in fair service delivery .......................................................................................... 205
5.5 Limitations and direction for future research .................................................... 205 REFERENCES ............................................................................................................. 208
Appendix- A ................................................................................................................. 234
Covering letter for participants of final survey ............................................................ 234
Appendix- A(a) ............................................................................................................ 235 Final survey Questionnaire ........................................................................................... 235
Appendix-B .................................................................................................................. 239
Translated version of Questionnaire ............................................................................ 239
Appendix- C ................................................................................................................. 244 Pilot Survey Invitation ................................................................................................. 244
Appendix- C (a) ............................................................................................................ 245
Appendix-D .................................................................................................................. 246
Guidelines before taking the survey ............................................................................. 246
Appendix- E ................................................................................................................. 248 Participation letter ........................................................................................................ 248
Appendix-F ................................................................................................................... 251
Pilot survey ................................................................................................................... 251
Appendix-G .................................................................................................................. 256 Pilot survey-Questionnaire feedback form ................................................................... 256
Appendix- H ................................................................................................................. 258
Results of Pilot Study (n=120) ..................................................................................... 258
xvi
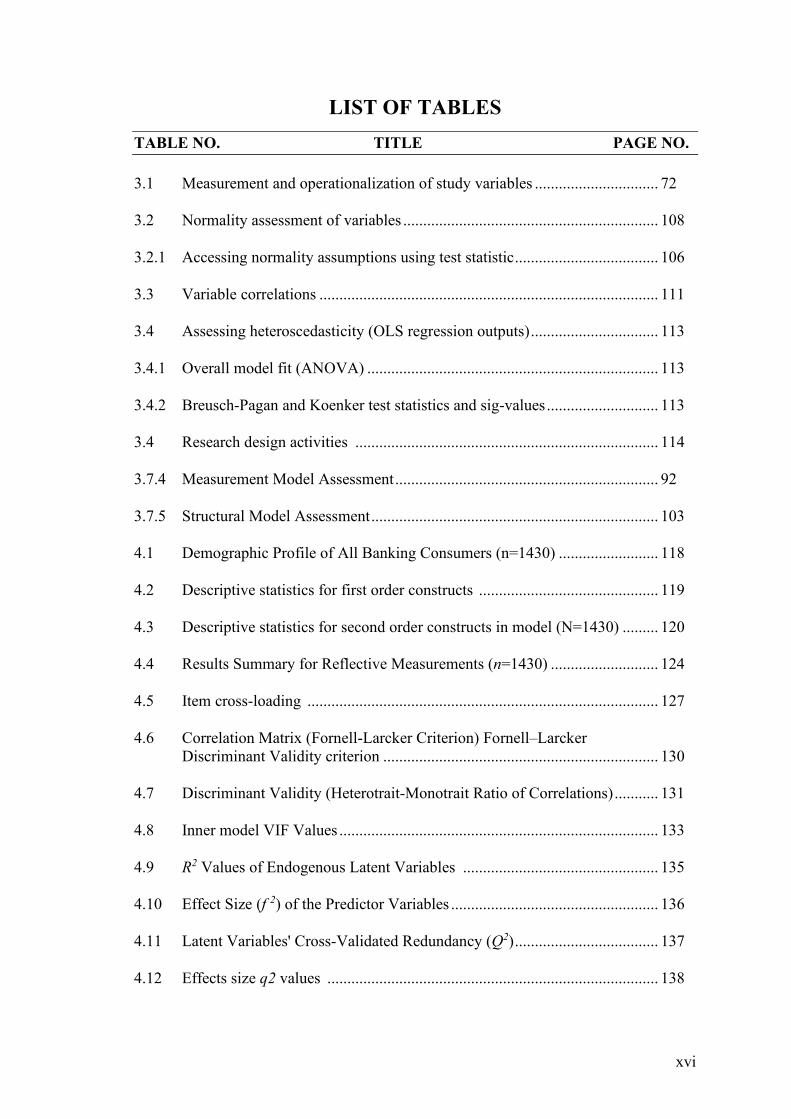
LIST OF TABLES TABLE NO. TITLE PAGE NO.
3.1 Measurement and operationalization of study variables ............................... 72
3.2 Normality assessment of variables ................................................................ 108
3.2.1 Accessing normality assumptions using test statistic .................................... 106
3.3 Variable correlations ..................................................................................... 111
3.4 Assessing heteroscedasticity (OLS regression outputs) ................................ 113
3.4.1 Overall model fit (ANOVA) ......................................................................... 113
3.4.2 Breusch-Pagan and Koenker test statistics and sig-values ............................ 113
3.4 Research design activities ............................................................................ 114
3.7.4 Measurement Model Assessment .................................................................. 92
3.7.5 Structural Model Assessment ........................................................................ 103
4.1 Demographic Profile of All Banking Consumers (n=1430) ......................... 118
4.2 Descriptive statistics for first order constructs ............................................. 119
4.3 Descriptive statistics for second order constructs in model (N=1430) ......... 120
4.4 Results Summary for Reflective Measurements (n=1430) ........................... 124
4.5 Item cross-loading ........................................................................................ 127
4.6 Correlation Matrix (Fornell-Larcker Criterion) Fornell–Larcker Discriminant Validity criterion ..................................................................... 130
4.7 Discriminant Validity (Heterotrait-Monotrait Ratio of Correlations) ........... 131
4.8 Inner model VIF Values ................................................................................ 133
4.9 R2 Values of Endogenous Latent Variables ................................................. 135
4.10 Effect Size (f 2) of the Predictor Variables .................................................... 136
4.11 Latent Variables' Cross-Validated Redundancy (Q2) .................................... 137
4.12 Effects size q2 values ................................................................................... 138
xvii
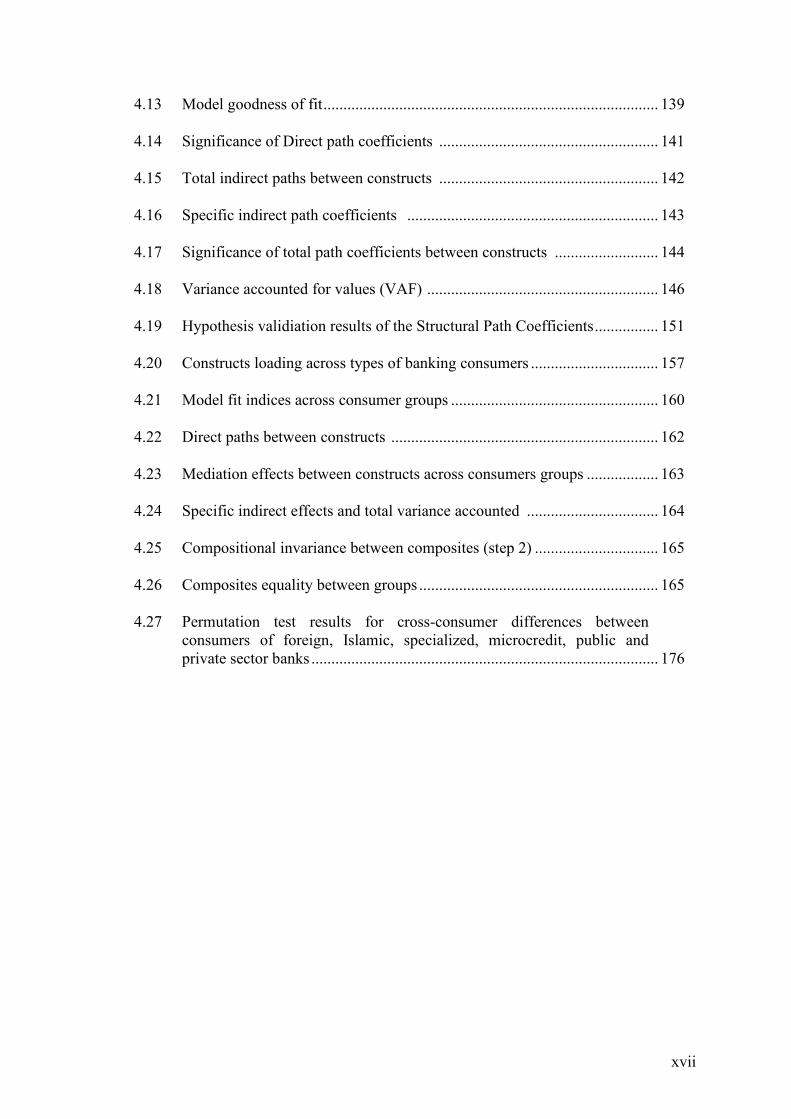
4.13 Model goodness of fit .................................................................................... 139
4.14 Significance of Direct path coefficients ....................................................... 141
4.15 Total indirect paths between constructs ....................................................... 142
4.16 Specific indirect path coefficients ............................................................... 143
4.17 Significance of total path coefficients between constructs .......................... 144
4.18 Variance accounted for values (VAF) .......................................................... 146
4.19 Hypothesis validiation results of the Structural Path Coefficients ................ 151
4.20 Constructs loading across types of banking consumers ................................ 157
4.21 Model fit indices across consumer groups .................................................... 160
4.22 Direct paths between constructs ................................................................... 162
4.23 Mediation effects between constructs across consumers groups .................. 163
4.24 Specific indirect effects and total variance accounted ................................. 164
4.25 Compositional invariance between composites (step 2) ............................... 165
4.26 Composites equality between groups ............................................................ 165
4.27 Permutation test results for cross-consumer differences between consumers of foreign, Islamic, specialized, microcredit, public and private sector banks ....................................................................................... 176
xviii
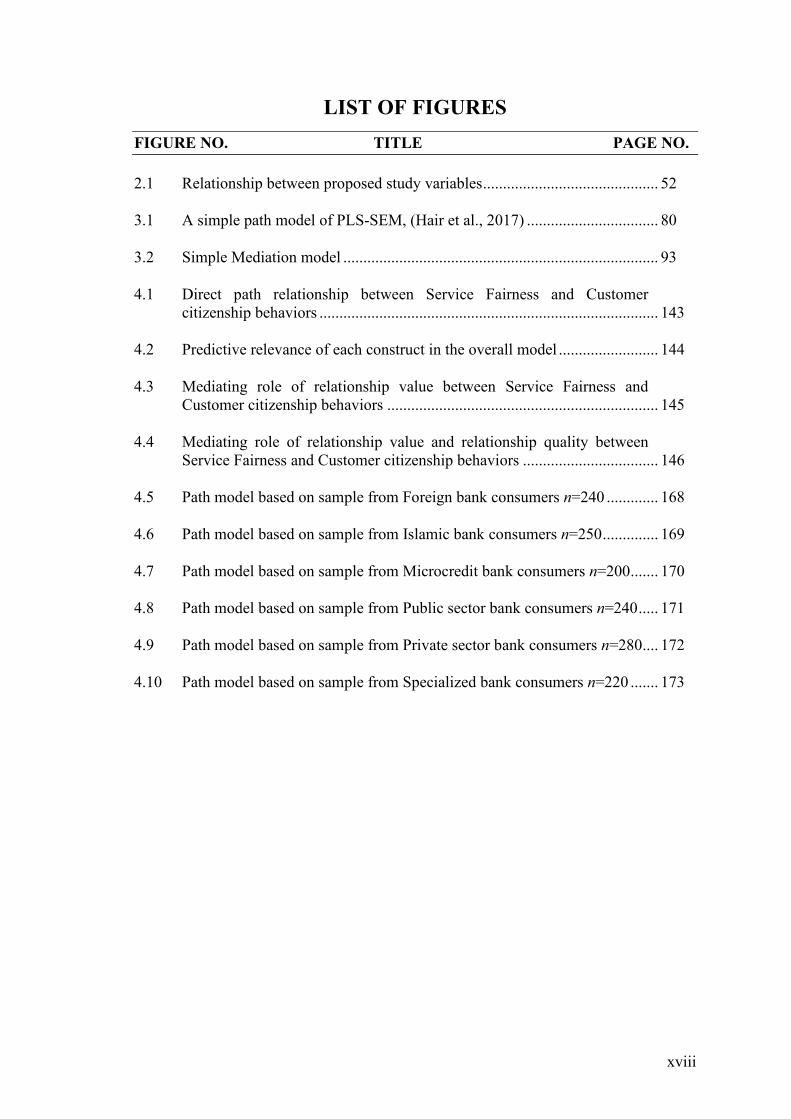
LIST OF FIGURES FIGURE NO. TITLE PAGE NO.
2.1 Relationship between proposed study variables ............................................ 52
3.1 A simple path model of PLS-SEM, (Hair et al., 2017) ................................. 80
3.2 Simple Mediation model ............................................................................... 93
4.1 Direct path relationship between Service Fairness and Customer citizenship behaviors ..................................................................................... 143
4.2 Predictive relevance of each construct in the overall model ......................... 144
4.3 Mediating role of relationship value between Service Fairness and Customer citizenship behaviors .................................................................... 145
4.4 Mediating role of relationship value and relationship quality between Service Fairness and Customer citizenship behaviors .................................. 146
4.5 Path model based on sample from Foreign bank consumers n=240 ............. 168
4.6 Path model based on sample from Islamic bank consumers n=250 .............. 169
4.7 Path model based on sample from Microcredit bank consumers n=200 ....... 170
4.8 Path model based on sample from Public sector bank consumers n=240 ..... 171
4.9 Path model based on sample from Private sector bank consumers n=280.... 172
4.10 Path model based on sample from Specialized bank consumers n=220 ....... 173
1
Chapter 1
INTRODUCTION
1.1 Introduction
In the introduction chapter of the study, the broad context within which the research is
undertaken is outlined. The chapter begins with a brief introduction to the business
environment surrounding banking sector highlighting the critical role of service fairness
as a fundamental basis for maintaining and developing bank-customer relationships and
its strategic importance to banking institutions in section 1.2. This is followed by
presenting problem statement of the research which underline the importance of service
fairness issues in service delivery in section 1.3. This leads to a detailed outlining of the
research questions of the study in section 1.4. In section 1.5, the research objectives are
presented. Section 1.6 deliberated about the significance of the study. The scope of the
study and delimitations are defined in section 1.7. Subsequently, the gaps identified in
current studies of service fairness, relationship marketing and customer citizenship
behaviors are introduced in section 1.8. This is followed by section 1.9 which outline
how the structure of the dissertation is organized.
1.2 Background of the study
The world’s economy is experiencing rapid transformation, particularly the market
landscape surrounding businesses has become more rigorous, as the number of
technological innovation and diffusion of modern technologies has accelerated, the
market penetration rate of products is getting higher, while the life cycle of products is
getting shorter, further intensifying the competition between companies for survival in
the marketplace (Soedarmono, Machrouh, & Tarazi, 2013). This phenomenon is no
exception to the entire financial industry, business climate around financial industry has
seen rapid transformation over past decade. The revolution in financial industry has
been steadily promoted in the name of liberalization, securitization, and
internationalization. Naturally, the financial industry has witnessed numerous
transformations both domestically and outside of Pakistan. Most prominent among
these is the rapid progress of financial liberalization due to the deregulation of barriers
between financial institutions. In advanced economies, financial diversification has
been implemented through restructuring financial industry through the process of
2
economic reforms and deregulation, centering around banks, securities, and insurance
sectors (Shabbir Ahmad & Burki, 2016).
Since late 1980s, the financial sector in Pakistan has underwent major structural
changes due to financial liberalization and deregulations. This transformation has led to
greater competition that has favored the efficiency and competitiveness of banking
sector (Zameer, Tara, Kausar, & Mohsin, 2015). Several of the reforms in the course of
the past decade have opened the way for new competitors to enter into the local
financial sector (Ali & Raza, 2017). These new competitors earned their competitive
advantages mostly by preserving lean structures, selective placement of branches, niche
marketing, service management and assisted service delivery through the use of latest
technology (Anjum, Xiuchun, Abbas, & Shuguang, 2017). Discernable divergence in
operating styles among various financial institutions are obvious in the domain of
customer orientation, asset liability management, multiple segment specialization,
administrative structures, market orientation, and management of customer
relationships. As a result, a greater variety and choices of products and services for
customers are available and the banking industry is offering sophisticated delivery
systems and more value-added services than rivals (Anjum et al., 2017; Paul, Mittal, &
Srivastav, 2016). In similar vein, banks have also come under enormous pressure to
deal with the growing demands and expectations of their clients as well as due to the
shift in customer-centric regulatory paradigm towards protection of financial
consumers, posing major challenge for bank to retain existing customers, as a
consequence of the fierce competition prevalent among banks, new clients are hard to
acquire at mature stage in their life-cycles (Zameer et al., 2015), banks need to put
additional effort into establishing new revenue streams (Saleh, Quazi, Keating, & Gaur,
2017). These considerations converge to imply the need for more specific customer-
strategies that build and maintain sustainable bank-client relationships (Dinulescu,
Visinescu, & Prybutok, 2019).
Earlier studies in the domain relationship marketing strongly support that mutually
profitable buyer-seller relationships are key to secure competitive advantage
emphasizing the importance of quality and value of relationships (Dinulescu et al.,
2019; Itani, Kassar, & Loureiro, 2019; Yoong, Lian, & Subramaniam, 2017).
Consumers who maintain successful relationships with their service providers generally

3
spend extra amount, support their firm vigorously, promote positive messages about the
firm and talk about the firm to others and relatives (LuJun Su, Hsu, & Swanson, 2017),
and gradually support the profitability of firms (Itani et al., 2019). Particularly in a
situation where competition between service companies has intensified, companies are
making various efforts to achieve differentiated competitiveness through strengthening
stable mutually rewarding relationships with customers (Dinulescu et al., 2019; Finch,
O’Reilly, & Abeza, 2018; Ye, Li, Wang, & Law, 2014).
Earlier research considers fairness perception as fundamental basis for establishing,
sustaining and enhancing long-term customer-firm relationships (Guo, Gruen, & Tang,
2017; Nikbin, Marimuthu, & Hyun, 2016; Romero, 2017). According to justice theory
(Adams, 1965) customer expect justice in an exchange relationship and gauge their
relationship based the extent to which expected benefits and results are provided as
promised (Rousseau, 1989). In addition, Carr (2007) asserted that customer compare
service results against the norms of fairness in comparison to other consumers based
on distribution of service resources, fair procedures, interpersonal treatment, and
transparency of information from their service providers. A number of past studies have
discussed the significance of service fairness in buyer seller exchange relationships
(Balaji, Roy, & Quazi, 2017; Nikbin et al., 2016; LuJun Su & Hsu, 2013; Lujun Su,
Huang, & Chen, 2015). However, all these studies lack perspective about the full
spectrum of buyer-seller relationship building process through the lens of service
fairness.
Service fairness refers to a consumer’s evaluations regarding the level of justice in a
service provider’s behavior during service delivery process (Seiders & Berry, 1998).
Fairness can affect a variety of aspects, ranging from satisfaction (Jung & Seock, 2017)
and dissatisfaction with service providers (Um & Kim, 2018), complaints (Balaji et al.,
2017), termination of relationship with service providers (Yi & Gong, 2008), and even
voluntary actions by customers for service providers (Choi & Lotz, 2018; Roy, Balaji,
Soutar, Lassar, & Roy, 2018; Roy, Shekhar, Lassar, & Chen, 2018). Service fairness is
a multidimensional construct comprising distributive fairness, procedural fairness,
informational and interactional fairness (Nikbin et al., 2016; Roy, Balaji, et al., 2018).
Earlier research on service fairness has shown that customers determine their trust and
4
commitment to remain in a relationship with a firm fundamentally on how fairly they
are treated (Carr, 2007; Hwang, Baloglu, & Tanford, 2019; Nikbin et al., 2016).
Schneider & Bowen, 1999, argued that consumers engage in a psychological contract
with a firm to have their needs served well and to be treated with justice. Successful
customer relationship management can be attributed to a customer’s positive evaluation
of a service provider fair behavior (Giovanis, Athanasopoulou, & Tsoukatos, 2015;
Saleem, Yaseen, & Wasaya, 2018). Since the intangibility inherent in services
amplifies consumers’ sensitivity towards fairness because it is often inconvenient for
consumers to estimate a service outcome before, and at times after a service transaction
is made (Choi & Lotz, 2018; Roy, Balaji, et al., 2018; Zhu & Chen, 2012). During
service consumption consumers are always present inside the service factory, which
provides a greater opportunity for customers to recognize fairness in relation to service
delivery therefore, from a service provider perspective, fair service delivery is crucial
for customer relationship management (Roy, Shekhar, et al., 2018; Zhu & Chen, 2012).
In terms of producers of financial services, fairness in service delivery is essential in
maintaining and developing bank-customer relationships, considering the highly
competitive nature of banking industry and increasingly interactive customer roles.
Although commercial banking is considered to encounter numerous service failures
(Kaura, Durga Prasad, & Sharma, 2015; Petzer, De Meyer-Heydenrych, & Svensson,
2017; Lujun Su, Swanson, & Chen, 2016), there has been scant investigations in
commercial banking sector of Pakistan that addressed the connection among service
fairness, relationship marketing and resulting customer engagement behaviors (Kamran
& Uusitalo, 2019). In addition to assuring on delivering fairness excellence needed for
sustainable relationships, banking establishments need to direct their relationship
marketing efforts to encourage customer discretionary behaviors.
Past research on value co-creation (Vargo & Lusch, 2008) suggest that firms need to
focus on the increasingly interactive experiential nature of buyer-seller relationships
that stimulate valuable customer resources in favor of the focal firm. Therefore, rather
than focusing only on the transactional side of their relationships with customers, banks
need to understand the increasingly active role of customer as co-creators of value
rather than passive users of service hitherto a inconsiderable area in the banking sector
(Yi & Gong, 2013). Customers may contribute a variety of personal resources that co-
5
create value namely; providing helpful suggestions to the service provider and other
customers, spreading positive word of mouth, recommending the service provider and
services to others, report service-related problems and their solutions and may take the
role as advocates of the firm (Braun, Batt, Bruhn, & Hadwich, 2016; Finch et al., 2018).
The trend of engaging consumers in co-creation activities has also been favored by the
new information technologies and the diverse array of digital channels, such as social
media platforms and smartphone applications (Roy, Shekhar, et al., 2018). Given that
distinctive contributions may come from each type of value co-creation behavior there
is little scholarly investigations as to why consumers engage in helpful activities to
support a certain service providing firm or a brand and begs further research (Balaji,
2014). Therefore, identifying potential drivers underlying such behavior should help
both academics and practitioners gain insights into how to stimulate value co-creation
(Balaji, 2014; Jaakkola & Alexander, 2014; Romero, 2017). Even though the
importance of relationship value and relationship quality on various consumer
outcomes have been well documented (Giovanis et al., 2015; Itani et al., 2019; Roy,
Balaji, et al., 2018), however the direct effect of relationship quality and relationship
value on consumer’s relational outcome such as customer citizenship behaviors, and
engagement behaviors has not been extensively studied (Choi & Lotz, 2018; Saleem et
al., 2018; LuJun Su et al., 2017).
Therefore, the purpose of this study was to investigate the critical role of service
fairness in developing and sustaining strong relationships with customers that further
induces their helpful discretionary behaviors. More specifically, this study sought to
investigate whether consumer– bank relationships act as mediating mechanism through
which service fairness fosters customer voluntary behaviors within the banking sector
in Pakistan. Thus, combining perspectives from equity theory (Adams, 1965), social
exchange theory (Blau, 1964) relationship marketing and service dominant logic
(Vargo & Lusch, 2008), this study tested a theoretical model that investigated the
impact of service fairness conducive for developing and maintaining enduring
relationships with customers and its consequences reflected in customer citizenship
behaviors in banking context.
6
1.3 Problem Statement
Since 2008, the State Bank of Pakistan has implemented prudential regulations on
commercial banks operating within Pakistan through the establishment of consumer
protection department, which advocate guidelines for banking conduct stipulating the
minimum service standards a client can expect from a banking institution (State Bank
of Pakistan, 2017) wherein the relation between the bank and its customers is guided by
four key obligatory principles, requiring banks to be trustworthy, transparent,
accountable, and fair with their clients during service encounters (“Guidelines of
Business Conduct for State Bank of Pakistan Karachi,” 2016).
The Banking Mohtasib Pakistan continuously receives an influx of complaints every
year, however, compared to the last few years, there has been an unprecedented
upsurge of about 44% in the total number of complaints over the last year. According
the annual report (Banking Muhtasib Pakistan, 2017) among all the complaints
registered, the number of grievances received for “Service inefficacies/Delays” among
were most frequent. Given the frequent incidences of consumer complaints during the
execution of financial service, banking sector is ranked as number third among all
service sectors (Nadiri, 2016). Against this backdrop the explicit and systematic
execution of service fairness strategies as planned process generally remains non-
existent in the banking sector of Pakistan. In addition, with increasing legislation for
consumer rights and surge in consumer protection societies it is vital for banking sector
to guaranty a consistent delivery of favorable consumption experience to consumers to
foster enduring consumer relationships. Since financial services involve high credence
attributes therefore provision of fair service by the banks is very important to sustain
long-term relationships with the customers (Roy, Devlin, & Sekhon, 2015). Although
service fairness excellence holds a strategic significance in the long-term survival of
service firms, despite its importance, a greater number of recent studies in the domain
of service marketing highlight that service fairness issues remains largely unexplored
and warrants further research (Bezerra & Gomes, 2019; Hwang et al., 2019; Kim et al.,
2018; Roy, Balaji, et al., 2018; Roy, Shekhar, et al., 2018; Wang et al., 2018).
Moreover, past research has also indicated that consumers react to service fairness
more strongly than service quality reveling that proving service quality to consumers is
necessary condition, however it not enough to establish sustainable relationships with
7
customers (Carr, 2007; Giovanis et al., 2015). Considering the fact that banking
institutions provide virtually identical products and services with little to no variation in
service quality, the real differentiation however may come from a consumer assessment
of the degree of overall fair treatment they receive from their relationship over time
(Roy, Shekhar, et al., 2018). Furthermore, taking into account the competitive nature of
banking sector in Pakistan, despite service excellence banks also need focus on
providing fairness excellence to enhance strong relationships with their clients to
achieve sustainable competitive advantage (Kamran & Uusitalo, 2019). In this regard,
understanding the consequences of a consumer’s service evaluations in terms of
fairness are of significant relevance to banking establishments which are explored in
this research.
It is apparent that albeit Pakistan is an emerging market, commercial banking is well
seasoned, advanced and competitive. Commercial banks are dedicated and also
required to deliver clients with services that surpass or conform to customer
expectations and also to act favorably and reasonably towards its customers in a
consistent and ethical manner however service fairness issues and whether it lead
strong relationship building is yet to be investigated from a developing country like
Pakistan as there is no solid empirical studies that investigated the important role of
service fairness in relationship building process particularly from within the banking
sector. Nonetheless studies also lack perspective regarding the important role of service
favorableness in a firm relationship building efforts that can be targeted to achieve
customer citizenship behaviors (Balaji, 2014; Roy, Balaji, et al., 2018).
1.4 Research Questions
In accordance with the research problem and background, this study intends to respond
to the following research questions posed:
1. How does customer perception of service fairness affect perceived
relationship value?
2. How does customer perception of service fairness affect perceived
relationship quality?
3. Is there a direct relationship between perception of service fairness and
customer citizenship behaviors?
8
4. Does relationship quality mediate between perceived service fairness
and customer citizenship behaviors?
5. Does relationship value mediate between perceived service fairness and
customer citizenship behaviors?
6. Does relationship quality mediate the effect between relationship value
and customer citizenship behaviors?
7. What is the relationship between customer perception of relationship
value and relationship quality?
8. Do perceptions of relationship quality and value directly influence
customer citizenship behaviors?
1.5 Research Objectives
This study aims to extended the existing knowledge on service fairness, relationship
marketing and customer engagement by setting the following objectives:
1. To investigate the role of service fairness and the relative importance its
sub-dimensions (distributive, procedural, interactional and informational
fairness) in building and sustaining long-term exchange relationships.
2. To investigate customer behavioral outcomes from the perspective of
service fairness and relationship marketing.
3. To explore the mediating role of relationship value between perceived
service fairness and customer citizenship behaviors.
4. To explore the mediating effect of relationship quality between
perceived service fairness and customer citizenship behaviors.
5. To explore the interlinkages amongst perceived service fairness,
relationship marketing, and customer behaviors across different
consumer groups in banking sector.
1.6 Significance of the Study
Building on the theories of fairness this study provides useful insights to managers,
practitioners and policy makers to consider the important role of fairness excellence in
all-inclusive service delivery situations. This research offer bank management a deeper
perspective on how consumers judge service delivery from the standpoint of fairness,
highlighting the importance of customer sensitivity towards fair treatment enabling
9
them to formulate more effective and efficient strategies for assuring fairness that will
lead to improved service delivery and superior exchange relationship management.
Customer perception of service fairness has strong practical significance from
relationship marketing perspective because customer judge their relationship with their
service providers based on how fairly they are treated by the service firm. Therefore, it
is utmost importance for banks to provide and maintain service fairness during service
consumption and post consumption stages. This study will serve as a practical guideline
to commercial banks mangers in Pakistan on managing the important role of service
justice in driving customer emotional and behaviors responses from the perspective of
relationship marketing.
The State Bank of Pakistan can better formulate polices with reference to fairness in
terms of information, procedures, outcomes and general conduct of banking
professionals for the sake of consumer protection. These guidelines may serve to
improve service failures rates and may help banks to forge enduring relationship with
their valued customers. This study will serve as practical guidelines for banking sector
in Pakistan to contemplate customer-bank relationship through the lens of service
fairness and deal with customer behavioral responses focusing on building relationship
marketing strategies.
This study offers useful insights in helping banking industry to consider the active role
of customers as co-constructors of value for the bank, therefore such helpful customer
engagements can be used as competitive advantage. These roles of customers are
important because customers participate in a variety of viral marketing activities with
exception of transaction in favor of the focal firm by spreading positive word of mouth,
providing product/service referrals or recommendations to others, suggesting
innovative ideas for new products/services and increase the overall contextual value of
product/service for others and the service firm (Itani et al., 2019; Roy, Shekhar, et al.,
2018).
Because of the interactivity inherent in social media platforms besides enabling buyers
are sellers to share and exchange information it also empowers buyers to share and
exchange service-related information with each other as well. Taking advantage of
social networks, firms can foster relationships with existing as well as potential
10
customers and create communities that work together interactively to recognize
problems and discover its resolution. These interactions transform the conventional
roles of both buyers and sellers involved in an exchange relationship (Roy, Balaji, et al.,
2018; So, King, Sparks, & Wang, 2016). In fact, consumers continually create value by
producing positive content, promote service related information, become avid advocate
of the firm and its services and guide perchance intension of others consumers during
online interactions (Carlson, Rahman, Taylor, & Voola, 2019). Considering the
significance of consumer interactions that co-create value and customer engagement
has critical role in a firm's superior competitive advantage and sales growth (van Doorn
et al., 2010; Yi & Gong, 2013).
Firms which provide the environment for discretionary behaviors, can use customers to
achieve their goals and profitably (Verleye, Gemmel, & Rangarajan, 2014).
Consequently, the effective management of customer interactions can be used as a
strategic advantage by banking sector with in Pakistan. This study highlights the
importance of bank-customer relationship based on fairness which is helpful to
reinvigorate pubic trust in banking institutions. Fair banking behaviors is helpful to
attract and retain customers and reduce service failure costs and thus can provide better
banking environment for citizens of the society.
Recent reforms in the banking sector have already effectuated a vibrant landscape
eliciting in the emergence of customer-specific strategies to foster enduring bank-
customer relationships (Shabbir Ahmad & Burki, 2016; Ali & Raza, 2017; Saleem,
Zahra, Ahmad, & Ismail, 2016). Therefore, in order for banks to attract and maintain
their customers from competition, they must turn to meet the economic and emotional
needs of their valued customers by investing in the increasingly interactive and
experiential nature of consumer relationships (Vivek, Beatty, & Morgan, 2012). There
are no researches available on customer perception of service fairness in the area of
service marketing from Pakistan.
From a methodological perspective this study validated multi-item measures adopted
from previous studies by testing an integrated model in a developing country
perspective within banking sector. This study validates that service fairness,
relationship quality and citizenship behaviors are second-order constructs bearing
higher reliability and validity scores and thus have a significant relevance in collective
11
cultures within a south Asian business context. Therefore, researchers can utilize these
validated measures in relation to other relevant theorical constructs in their future
studies.
Building on fairness theories in service sector, researcher can uncover new models after
reviewing this work. Service fairness is potentially a new frontier in building customer
trust, commitment and building valuable relationships in the area of service marketing.
This study in turn should provide valuable insights to marketing practitioners who may
devise better strategies in helping service supplying firms to contemplate service
fairness advocating fairness polices in helping them reduce service failure costs and
customer turnover. Thus, this study brings new insights for banking sector and
proposed that positive evolution of fair treatment during ongoing service transactions
help develop and strengthen relationship between banks and its customers, which
consequently guide customer discretionary behaviors. Therefore, it is suggested that
customer perception about a bank’s favorable image will strengthen its reputation and
market standing which will ultimately serve as a potential source of differential
competitive advantage.
1.7 Scope of the study
The scope of this study was limited to examine the predictive relevance of service
fairness evaluations in developing sustainable relationships with customers and driving
citizenship behaviors from the perspectives of users of banking services in Pakistan.
This quantitative study involved the use of pen and paper-based survey instrument to
collect data on the relationship between service fairness attributes (distributive,
procedural, informational and interpersonal fairness), relationship value, relationship
quality (satisfaction, commitment, trust) and customer engagement behaviors
(augmenting, co-developing, influencing, mobilizing behavior). Since this research is
exploratory nature, the analysis used a PLS-SEM path-modeling approach rather than a
covariance-based SEM approach. To ensure that the respondents had adequate
recollection of their overall service experience with their banking service provider, the
target population for the study was consumers who had used banking services within at
least one year. In view of the fact that the target population of the study was large, the
target population was delimited to five (05) provincial capital cities of Pakistan
(Peshawar, Lahore, Karachi, Quetta and Islamabad). This geographic clustering was
12
done because all the six different subgroups of banking consumers are in higher
concentration in capital cities as opposed to small cities and therefore have largest
number of branches and account holders. The sampling frame consisted of all users of
banking services which were first grouped (stratified) based on the type of banking
consumers (i.e. public, private, specialized, foreign, micro-finance and Islamic banking)
afterwards responses were collected from cases using random sampling through on-site
face-face contacts. Purposive sampling was selected because precise sampling frame
was missing due to bank policy of not disclosing consumer information as all such
requests made for data to the banks were refuted. Nonetheless, the scope of survey
could have been extended to ten most populous cities (i.e. increasing the sub-
geographic area from 05 to 10) representing approx. 20% of total population of
Pakistan, however due to cost and time limitations and since majority of bank branches
including all six stratums could be located within capital cities only, which therefore
represent an adequate number of banking consumers.
1.8 Research gaps identified
This study endeavors to investigate the aforementioned relationships and contribute to
current knowledge in the following ways: Prior research on service fairness has
predominantly focused on customer responses towards a firm’s post recovery efforts
after service failures (J. L. M. Lee, Siu, & Zhang, 2018; Muhammad, Yaqub, & Halim,
2018; Waqas, Ali, & Khan, 2014; Xu, Liu, & Gursoy, 2018), however service fairness
is assessments are more relevant to service encounters in general irrespective of service
failures and recovery (Nikbin et al., 2016; Roy, Balaji, et al., 2018; Roy, Shekhar, et al.,
2018). Therefore, there a lack sufficient understanding on how service fairness
contributes towards building buyer-seller relationship beyond service failures (Choi &
Lotz, 2018). Service fairness has not been exclusively applied to a firm’s customer
relationship marketing efforts (Balaji, 2014; Choi & Lotz, 2018; Finch et al., 2018;
Itani et al., 2019),
Although past researches have shown that service fairness is important for building
relationship quality (Nikbin et al., 2016; LuJun Su et al., 2017) and relationship value
(Dedeoglu, Bilgihan, Ye, Buonincontri, & Okumus, 2018; Fazal E. Hasan, Mortimer,
Lings, & Neale, 2017; Zhu & Chen, 2012), these attempts are fragmented. Therefore,
drawing upon psychological contract theory (Rousseau, 1989) and relationship
13
marketing (Verhoef, 2003) the role of fairness in shaping customer-firm relationships
will be addressed using a more holistic perspective. Although the importance of
fostering service fairness and positive customer responses has been well documented
(Nikbin et al., 2016; LuJun Su et al., 2017), theoretical and empirical understanding of
how perceptions of service fairness influences downstream variables such discretionary
value co-creating behaviors, remain incomplete (Itani et al., 2019).
Specifically, customers may provide a variety of resources by maximizing firm value
through resource integration by displaying helpful behaviors beyond purchase behavior
alone (Jaakkola & Alexander, 2014; van Doorn et al., 2010). Theoretical and empirical
understanding about when customers exhibit these extra-role behaviors is still limited
(Romero, 2017; Roy, Balaji, et al., 2018; Roy, Shekhar, et al., 2018). therefore,
building on equity theory (Adams, 1965) and social exchange (Blau, 1964) theories as
theoretical lenses, this study proposes that service fairness positively influences
customer engagement behaviors CEBs, through building mutually beneficial customer-
firm relationship.
Although various studies have examined various relational constructs piecemeal basis
to explain the linkage between service fairness and customer citizenship behavior (Choi
& Lotz, 2018; Roy, Balaji, et al., 2018; Zoghbi-Manrique-de-Lara, Suárez-Acosta, &
Guerra-Báez, 2017) however, research warrants this important gap of using service
fairness with relationship marketing as a broader construct comprising relationship
quality and relationship value (Zhu & Chen, 2012).
Moreover, researches within banking sector have stressed on improving customer
experiences by enhancing service quality (Ali & Raza, 2017; Anjum et al., 2017; Saleh
et al., 2017) and value (Zameer et al., 2015) while saying little about whether fairness
perception can contribute to customer-organizational relationship marketing (Balaji,
2014), which will be addressed in this study. Specifically, the author postulate that two
important relational constructs—relationship value, and relationship quality— are
critical bridges between service fairness and CEBs linkages.
Furthermore, different social and cultural backgrounds also affect the management
practices towards valuing fairness and customer-firm relationships (Kaura et al., 2015;
Roy, Balaji, et al., 2018). The commercial banks in developing countries may be
14
significantly different from commercial banks in developed countries. Therefore, this
study can have useful implications both for theoretical development and verification
from a developing country context (Roy et al., 2015). So far research on customer
evaluation of fairness in fostering relationship has not been generalized and applied to
various service delivery situations from Pakistan (Kamran & Uusitalo, 2019). Thus, this
study contemplates to fill this void by presenting and adapting the model of fairness,
relationship marketing, and customer extra-role behaviors in a South Asian context.
A novel contribution to consider in this research is that is uses customer engagement
behaviors reflective second order behavioral construct from relationship marketing
perspective (Jaakkola & Alexander, 2014; Roy, Balaji, et al., 2018). Particularly, the
current study explored the role of service fairness in building relationship quality &
value and its subsequent role in driving customer engagement. Building one extensive
review of literature, this study seeks to elucidate the psychological mechanism of
whether service fairness can trigger customer value co-creating behaviors through
building long-term customer-bank relationships. More specifically, using social
exchange perspective this research will test the role of service fairness in building
customer-firm relationships and its subsequent impact on customer behavioral and
emotional responses in exchange for fulfillment of their need for fair treatment.
1.9 Structure of the thesis
This research is divided into five chapters, specific details are as follows:
Chapter 1: The Introduction chapter begins by highlighting the current market
challenges banking institutions face and points out the limitations in the existing
literature. The chapter introduces the background and briefly explain the problem
statement of the study, in light of the stated problem the study delineate on research
questions and overall objectives of the research, explain the purpose of the research,
sets up the overall framework of the current research and explain the scope and
significance of the research.
Chapter 2: The Literature review chapter provides a detailed account on basic theories
that guided the theoretical framework the study. It started with explaining equity theory,
15
psychological contract theory, relationship marketing and service dominant logic that
served as basic theory building blocks of this research.
Chapter 3: Based on theoretical literature review this chapter puts forward the research
hypotheses according to the relationship of variables and proposed a research model
based on the past literature. Extending on literature review presented in the second
chapter, the identified theoretical concepts that were operationalized and used for
measurement using survey design. The specific contents include; the nature of research,
the operational definition and measurement of each variable; data analysis procedures;
data collection procedures; questionnaire design, sampling procedures and data
management.
Chapter 4: To verify the research model and research hypotheses, the Results and
discussion begins with the testing the reliability and validity of the measurement model,
subsequently the structural model analysis was performed to verify the direct and
indirect structural path relationships of the hypothesized model, group specific
differences were assessed using multi group analysis.
Chapter 5: The conclusion and recommendation chapter present the summary of
research results and key research findings, research implications for theory and practice,
limitations of the study, and the future research directions.
16
Chapter 2
LITERATURE REVIEW
2.1 Chapter overview
Service fairness is critical to building and sustaining exchange relationships with
customers that can be utilized as important strategic lever by service providers to
differentiate its self from competitors. This research draws on equity theory (Adams,
1965), social exchange theory (Blau, 1964), psychological contract (Rousseau, 1989),
service dominant logic (Vargo & Lusch, 2008) and prior related researches and tested
the current study model in banking sector of Pakistan. The primary aim of this research
is to investigate the role of service fairness in fostering customer relational outcomes
through developing long-term relationships. The opening sections (2.2 to 2.5) outline
basic theories that explain the psychological mechanism through which consumers are
motivated to react positively when they experience favorable service experiences.
Service fairness which is rooted in equity theory has been outlined in section 2.6 and its
four sub-dimensions are detailed in sub- sections (1-4), Section 2.7 detailed relationship
marketing and relationship value and relationship quality as its subtypes in sub-sections
2.7.1 and 2.7.2 respectively. Section 2.8 provides a detailed account on customer
citizenship behavior that emanate as a result of a firm relationship marketing efforts.
After reviewing relevant literature, theoretical and empirical gaps and filtered and
discussed in section 2.9. Afterwards, research model, theoretical framework and
hypotheses are discussed in section 2.10.
2.2 Equity theory
Rooted in social psychology, Equity theory was developed by Adam in 1965 based on
prior studies on relative deprivation, cognitive dissonance and reward allocation. Equity
theory focuses on the motivational and cognitive processes of weighing sacrifices or
investments (justice inputs) against rewards (justice outputs), and comparing the result
with others experiencing similar situations (Greenberg, 1990). According to (Adams,
1965) an individual’s behavior is motivated to maintain fairness in relation to others
based on perception whether the individual is treated fairly as compared to referent
others". Two key components of Adam's (1965) theory of equity refer to inputs and
outcomes. Inputs are those characteristics that a customer brings into the equity
17
equation such as hassle, expectations, time, money, and efforts (Adams, 1965). Inequity
results when a customer believes an input to be relevant, but the exchange partner does
not recognize it as such and this discrepancy influences the customers outcomes
(Adams, 1965). Outcomes are the rewards that the customer receives in exchange for
his inputs such as delivery of time bound, transparent, correct, and promising services.
Outcomes however, can also be perceived as negative, mis-representation, dis-honesty,
poor conduct of support staff, or hidden fees or surcharges. Through socialization,
people learn what outcomes are appropriate for which inputs (Adams, 1965). Inequity
is defined as the experience in which a person perceives that his ratio of inputs to
outcomes and the ratio of inputs to outcomes of a referent other (e-g., other consumers)
are unequal (Adams & Freedman, 1976). Equity, however, will be perceived when the
inputs/outcomes ratios of the person and his referent other are equal or when the
referent other has greater inputs and greater outcomes or lesser inputs and lesser
outcomes (Adams, 1965). Other researchers have proposed that individuals may not
need another person to be their referent other, they may instead use past experience as
their basis of comparison (Cropanzano & Randall, 1993). Regardless of what the
person uses as a comparison, the process remains the same (Greenberg, 1988). When
individuals perceive inequity in an exchange relationship, they experience feelings of
tension which wilt, in turn, spur them to try to do something to reduce or eliminate the
perception of inequity (Adams, 1965)
There are a number of ways in which a person can reduce feelings of inequity. Not all
of the possible choices are feasible in all situations, however, some are preferred over
others and some are used only as a last resort. These equity-restoring techniques
include the individual trying to change his perceptions in terms of input and outcomes,
minimizing the increase of any inputs that are costly in terms of effort, changing the
referent other, and withdrawal in the form of quitting (Adams, 1965). Researchers have
since argued that Adams' work did not fully explain how perceptions of justice are
formed in all situations. Leventhal (1976) proposed that fairness perceptions were not
simply the comparison of two ratios -- he argued that people use different rules when
deciding whether or not an outcome was fair. Some of these rules are seniority,
reciprocity, equality, and need (Leventhal, 1976). Deutsch, 1975 cited in (Alexander,
Sinclair, & Tetrick, 1995) proposed that the rule that the individual chooses when
18
determining perceptions of equity is influenced by the situation he is in and the goals
and values he applies to that situation.
Equity theory is applicable to all situations in which exchanges occur specifically in the
domain of services marketing (Choi & Lotz, 2018; Roy, Balaji, et al., 2018; LuJun Su
et al., 2017) it is used as a viable framework to not only to understand and interpret
consumer responses towards various service failure and restoration situations (Balaji et
al., 2017), but also to all-inclusive service delivery situations (Nikbin et al., 2016). For
example, while acquiring a service, consumers invest time, energy and money and
attach expectations in terms of delivery of the service from a service provider they
experience equity or inequity when the economic consequences of resources invested
are balanced or unequal against the economic consequences of resources received in
exchange from a service provider (Hutchinson, Lai, & Wang, 2009). Equity theory
undertakes that customers prefer to minimize disparities between their investments and
rewards (Choi & Lotz, 2018). When consumers experience unfair situations, emotions
such as anger, disappointment, and resentment emanate that encourage consumers to
take action to eliminate injustice in form of relationship discontinuation, switching
loyalty and negative word of mouth (Yi & Gong, 2008). Accordingly, experiences
fairness in service delivery situations lead to positive emotions that motivate consumers
to increase their confidence in the service firm and affirm exchange relationships
(Cheng, Chen, Yen, & Teng, 2017). Service providers that fail to provide assurance
regarding fair service delivery often cannot attract potential customer confidence
required to form better serviceable relationships with customers (Nikbin et al., 2016).
Firms that reward customers proportional to what they have invested attract their deep
commitment and satisfaction need to establish long term relationships (Giovanis et al.,
2015).
Equity theory has a strong research foundation over the years through empirical
investigations. However, the theory has attracted a handful of critique from researchers
(Hellriegel, Slocum, & Woodman,1998). Equity theory has received wide spread
recognition for its approach to fairness and fair treatment by organizations, also for
comprehensibility of its purpose (Greenberg, 2010; Lively et al., 2010; Paleari et al.,
2011), other researchers have criticized the theory in terms of its practicality and
modality e.g. (Szilagyi & Wallace, 1990; Steers et al. 1996). For instance, equity theory
19
does not account for individual differentiations and differences in cultures and how
these diversities might regulate the decisions of an individual in defining and
determining about fairness, equitable distribution. In some situations, however in-
equity might not always result in anger or feelings of regret as the issues of justice and
fairness encompasses subjective and personal judgments of an individual or other
circumstance of an inequitable event. The likelihood that an individual’s perceptions
regarding reality might be different than others experiencing similar situations is
always likely. Similarly, equity theory is based on one important proposition whereby
an individual experiences equity or inequity by comparing his inputs and outcomes to
referent other’s inputs and outcomes experiencing similar situations. However, there is
has been one major disagreement among researcher throughout the equity theory
literature i.e. In-consistent results regarding experiencing injustice as a result of over-
payment.
Although studies have continuously provided support for under-payment situation
wherein individuals respond to under-payment by lowering their inputs (performance)
in order to achieve equilibrium with equity (Hofmans, 2012; Carrell & Dittrich, 1978).
However, there are mixed views among researchers over the outcomes of over-payment
conditions (Vecchio, 1984; Sweeney, 1990). Additionally, many studies debate over the
proposition that over-payment might cause positive inequity. When first brought the
light, judgements of injustice from over-payment was presumed because of regrets on
the part of an individual due to either receiving the same amount of rewards from lesser
amount of inputs or having received more outcomes from the same ’amount of inputs
(Adams, 1963). Particularly, the model does not accurately reflect what reactions are
expected to be observed (decreasing inputs, increasing outcomes, or quitting the job).
In addition, Adams (1965) argues that when individuals experiences underpayment,
they might tend to balance their state of inequality either by altering their inputs and put
lesser effort into their work or might chose to put additional efforts into their work by
cognitively augmenting the amount of existing inputs. Against this backdrop, equity
theory is unable to provide an explicit answer about when does either of the two
opposing behaviors would likely to take place. Another drawback of equity theory is
consideration towards individual and difficulties in comparing one organization with
another (Pinder, 1998). For example: are comparisons with others always within one‘s
own organization, and do they change during a person‘s work career? There are a lot
20
of ambiguities around referent others, such as how they were selected and how many
were selected (Pritchard, 1969; Pinder, 1998; Donovan, 2001). Referent others often
times cannot be accurately categorized, as people might utilize many references for
various outcomes.
Additionally, people usually possess a disproportionate outlook of their personal
performances and have a tendency to over-estimate the amount what other individual
receive as a result of their performance. Therefore, people usually maintain inbuilt
predispositions towards looking at circumstances as in equitable (Dessler, 1991).
Equity theory is generally more focused towards short term comparison and fail to
judge whether inequality perceptions would change over longer periods of time and
begs further questions such as what reactions emerge over time if inequality prevails?
Inequality will lower or will it rise over time? Another criticism of equity theory is that
it disregards an individual’s responses to the experiences of inequality. Is it uncommon
that two persons will respond in different ways to the same degree of inequity to some
extent if they believe distinct events resulted in inequity? Thus, the theory offers
limited predictive utility because of its ineffectiveness to make particular judgments
regarding equity restoring behaviors (Paleari et al., 2011).
Finally, the central tenant of the equity theory is to induce motivation which consider
payment as central to motivate individuals, however wages is considered only one
constituent that may motivate an individual as there are various other determinants that
may induce an individual’s behavior to a greater extent other than mere payments
(Miner,1980). The most important comment in equity theory is that it lacks accuracy as
to what determines inputs and what determinants serves as outputs and under what
circumstances used by individuals to evaluate equity. Because each person interprets
inputs and outcomes differently, listing every input and outcome is out bounds for
researchers (Hofmans, 2012).
2.3 Psychological contract theory
The concept of Psychological work contract was first introduced in the field of
organizational psychology by Argyris in the 1960s which referred to psychological
contract as an implicit understanding on production volume between the team members
and the production manager. Levinson (1962) however, defined psychological contracts
21
as a series of mutual expectations that are consciously and unconsciously owned by
employment partners which nonetheless govern their relationship to each other.
Levinson, unlike Argyris, emphasized on mutual obligations between contracting
parties from a reciprocal perspective. In order to build employee-friendly relationships
early research began to introduce the concept of mutual expectations into psychological
contracts, emphasizing that they meet each other's expectations (Levinson & Solley,
1962; Schein, 1965). Since then, (Kotter, 1973) introduced his conceptualization that
psychological contract is an implicit contract between the employee and the
organization on what to give and to receive. Baker (1985) also referred to these
contracts as the sum of all mutual expectations in the form of written, non-written,
verbal, and non-verbal that exist between employers and employees including implicit
and explicit factors. Since 1990 psychological contract theory is being actively applied
to understand customer attitudes and behaviors. Recent theory on psychological
contract has been greatly expanded by the work of (Rousseau, 1989).
According to (Rousseau, 1989, p. 123), the psychological contract refers to “an
individual’s beliefs regarding the terms and conditions of the reciprocal exchange
agreement between that focal person and another party. Key issues here include the
belief that a promise has been made and a consideration offered in exchange for it,
binding the parties to some set of reciprocal obligations”. Psychological contracts are
determined by an individual’s subjective assessment regarding the obligation’s and
performances to which they are entitled in a mutually beneficial exchange agreement
implicitly promised between the organization and the employee (Rousseau, 1989). At
the outset (Rousseau, 1989) stressed on the on the importance of one-way interactions
instead of focusing on two-way exchange. More specifically, she believed that
psychological contract was an employee’s perceptions about the mutual employment
obligations between himself and his employer (Rousseau & Tijoriwala, 1998, p. 679).
Thus, the concept of psychological contract came into existence as a result of an
employee’s belief that the employer has promised a certain reward or return in the
future for his considerations provided in exchange of that reward (Rousseau, 1989).
According to psychological contract theory the promise can either be implicit or
explicit in nature. All those written or verbal agreements formulated between the firm
and employees where generally referred to as explicit promises. However, Implicit
promises could greatly induce psychological contracts whenever employees became
22
aware of such promises (Conway & Briner, 2005). (Robinson & Rousseau, 1994)
argued that psychological contract consists of beliefs which are fundamentally different
from general expectations. They said that “Expectations refer simply to what the
employee expects to receive from employer (Wanous, 1977). On the other hand, the
psychological contract entails a belief in what the employer is obligated to provide,
based on perceived promises of reciprocal exchange”. Therefore, promise is a special
case of expectations (Rousseau & McLean Parks, 1993), and expectations could be
considered as psychological contract only when they are accompanied by a belief that a
promise has been made. If a perceived obligation is not accompanied by the belief that
promises has been made, such as individuals’ moral values or inferences only based on
previous job experiences, should not be considered as psychological contract (Robinson
& Morrison, 1995; Robinson & Wolfe Morrison, 2000). Promise is based on much
more specific incidents conveying a commitment to do what, by when, and why
(Conway & Briner, 2005). Emphasizing promissory aspects makes the construct of
psychological contract more contractual, demanding more specified qualifications to be
considered as psychological contract (Conway & Briner, 2005).
Based on the promissory aspect, psychological contract is defined as beliefs which are
based on promissory incidents, regarding of exchange terms between individuals and
the organization. From the perspective of promissory approach, psychological contracts
contain both explicit and implicit promises. While formal contracts or agreements
contain explicit promises, implicit promises are shaped by a more subjective
interpretation of the organizational environments (Robinson & Rousseau, 1994). It
includes interpretation of past incidents or history, observation, vicarious learning,
inference, and so on. Regarding implicit promises, some researchers argue that
psychological contracts are mainly held by implicit promises, emphasizing that
psychological contracts are made up of expectations that are not written in formal
agreements but still have powerful influence on employee behaviors (Schein, 1965;
(Guest, 1998; Meckler, Drake, & Levinson, 2003)
Moreover, Rousseau argues that all contracts are fundamentally psychological,
suggesting that even explicit promises contain implicit interpretations (Rousseau, 1995).
Rousseau’s (1995) believed that organizations act as abstract entities do not hold
psychological contracts that provide the context for the creation of a psychological
23
contract, organizations cannot have a psychological contract with its members”
(Rousseau, 1989). Her conceptualization focuses on individualized one-way perception
of the contract rather than two way interactions expressing psychological contract as
existing ‘in the eye of the beholder’ (Rousseau, 1989). Considering psychological
contract as an individual’s subjective perceptions, it is featured as being easy to change.
Legal contract is formal and written down, thus both parties agree to terms and
conditions developing clear ‘zone of acceptance’ between them. This suggests that
those terms and conditions is difficult to change without re-negotiation between parties.
However, psychological contract is ‘agreements in the eye of the beholder’ (Rousseau,
1995). It is constructed through individualized subjective perceptions and feelings
(Rousseau, 1995), thus it is much easier to change within person. Contractual
restrictions which have been applied to legal contract would not work in psychological
contract. It is almost impossible to prevent it from being changed by either party
(Cullinane & Dundon, 2006).
Thus, what they emphasize in psychological contract is mutuality. Mutuality means the
degree to which two parties agree on each party’s future obligations and commitments.
High mutuality could exist when two parties interpret their obligations and
commitments in a same way. Individuals tend to create psychological contracts in order
to reduce insecurities and anticipate future exchanges (Rousseau, 1995). Also, making
agreements about future exchanges between employee and employer is to have them
develop specific descriptions of actions. Thus, mutuality is an important factor to make
the agreement clearer and more powerful impact for both the employee and the
employer (Hui, Lee, & Rousseau, 2004). In contrast to the general consensus on
psychological contract definition, its dimensions have not been agreed upon among
researchers (Freese & Schalk, 1996).
The most dominant typologies in psychological contracts is transactional and relational
contracts. The transactional-relational distinction is originated in the work of (Macneil,
1980) which represent a legal construct. Later, it has been adopted by Rousseau and
others (Millward & Hopkins, 1998; Raja, Johns, & Ntalianis, 2004; Robinson &
Rousseau, 1994; Rousseau, 1995). Transactional psychological contracts are engaged
with characteristics of short-term and consisting of relatively explicit promises based
on formal agreement by both parties. Thus, resource exchanges between two parties are
24
more tangible having a monetary value and highly specified. Pay for number of hour
work is typical example of transactional psychological contracts. On the other hand,
relational psychological contract is long-term and open-ended promises. It consists of
more implicit promises, and negotiation processes are unlikely to involve actual
agreement by both parties. Thus, it is loosely specified, and resources exchanged are
intangible. Job security in exchange for employee loyalty would be a good example of
relational psychological contracts (Conway & Briner, 2005). With suggestions of this
typology, Rousseau and her colleagues have argued that transactional and relational
contracts are located at the extreme opposite ends of a single continuum (Rousseau,
1990; Rousseau & McLean Parks, 1993).
Thus, they considered that the same employee cannot have both of two types of
contracts. However, empirical researches of those two types of contracts suggested that
transactional and relational contracts should be considered as relatively independent
dimensions (Coyle-Shapiro & Kessler, 2000). While relational and transactional
contracts appear to have opposite characteristics like mentioned above, actually they
work very independently and irrespective of one another (Conway & Briner, 2005).
Considering transactional and relational contracts could lie on the different continuums
independently, a third type of psychological contract referred to as a balanced contract
has been suggested. It contains both transactional and relational elements with
characteristics of open-ended relational features combined with the transactional
features of specified performance-based reward contingencies (Hui et al., 2004). The
concept of psychological contract was extended to the domain of service marketing in
mid 1990s.
Lusch & Brown, 1996 described how channel relationships are formed based on mutual
obligation in service exchanges. However, the term psychological contract was first
introduced by (Blancero & Ellram, 1997) in the domain of buyer-supplier relationships
wherein they proposed that the construct psychological contract can be extended to
understand the relationship between a buyer and supplier. In addition, the authors added
that such interdependent relationship is based on reciprocity where the supplier provide
services according to the needs and expectations of their customers in exchange for
their continued commitment and long-term loyalty. When the service provider delivers
the outcome and benefits it had promised this leads consumer to positive evaluation
25
regarding fulfillment of their obligations. Thus, perception of service fairness is build
on the concept of psychological contract between the consumer and the firm (Schneider
& Bowen, 1999). In addition, (Llewellyn, 2001) asserted that psychological contract
represents an implicit agreement between exchange partners that is guided by shared
judgments and expectation based on conditions and contents of the psychological
contract. Hai-Cheng (2006) emphasized on psychological contracts from the viewpoint
of the customer, they argued that the psychological contract is a prevalent concept in
relationship marketing which captures their judgments and beliefs about the reciprocal
obligations in the relationship with their service providers. (Antonaki & Trivellas, 2014)
proposed their psychological contract model in banking sector that stipulated the
relationship between consumers and the service provider which stated that “the
perceptional expectations and trust between buyer and the seller and their perceptions
about the obligations in the relationship”. (Antonaki & Trivellas, 2014) contend that
psychological contracts represent a reciprocal obligation between the buyer and the
seller.
Ma, Deng, Hao, & Wu, 2012 argues that a psychological contract represents reciprocal
obligations that is based on the perceptions and expectations between service provider
and consumer. They added that such contracts underline a series of mutual obligations
and liabilities held by both the parties. In the area of relationship marketing
psychological contacts represents the natural relational process between consumer and
the service provider that reflect implicit and explicit expectations in the exchange
process where the level relationship between service provider and consumers is
determined by the psychological contract which helps consumers evaluate the quality
of service delivery and determine their future purchase related decisions and service
utilization (Guo et al., 2017). The authors further described the two facets
psychological contracts; contractual and psychological.
The psychological point of view is grounded in social cognitive theory which represent
how social information is organized in the mind of an individual, on the other hand, the
contractual point of view represents exchange of material resources. In service settings,
reciprocal exchanges refer to stated or unstated expectations of consumers that lead to
the formation of psychological contracts that help in minimizing service-related risks
during delivery of services. Furthermore, psychological contracts provide helpful
26
insights to consumers to evaluate the exchange of resources that govern the exchange
process in their mind. The terms and condition regarding the exchange of resources
between the service provider and consumers is therefore also are inherent in
psychological contract (Guo et al., 2017). Primarily, reciprocation of economic and
social resources are the main facets of a psychological contract that guide the social
exchange process between the service provider and consumers (Guo et al., 2017; Guo,
Xiao, & Tang, 2009). As claimed by (Bagozzi, 1995) the main driver of all marketing
relationship is reciprocation. Reciprocal relationship has three main facets; “immediacy
of returns” to reach the fulfillment of the expected obligations between the two parties,
a partner is ought to reciprocate the rewards provided by the other partner in nearest
time. “equivalence of return” refers to the extent to which the amount resources
exchanged are equal between the two parties. “the nature of interest” refers to a keen
interest in the welfare between the two parties (Bagozzi, 1995).
Based on the discussion above it can be concluded that in context of service marketing
psychological contracts encompass social and economic exchanges based on mutual
interests. Psychological contract captures a customer judgment regarding fulfillment of
their expectation in reciprocal exchanges considering explicit (terms and conditions)
and implicit promises that consumer interpret during the exchange of tangible and
intangible resources. Nonetheless, consumers feel violation or breach of their
psychological contract when they perceive that have not received what that expected
from a reciprocal agreement (Robinson & Wolfe Morrison, 2000). This study extended
the psychological contract theory by arguing that consumers form long term
relationships and exhibit helpful behaviors when their service providers reciprocate
implicit and explicit expectations held by consumers in exchange relationships.
2.4 Social exchange theory
SET has a social psychological and sociological perspective that explains social change
and stability as a process of negotiated exchanges between people in society. It
indicates that all human relationships are formed by the use of a subjective cost-benefit
analysis and the comparison of alternatives. For example, when a person perceives the
costs of a relationship as outweighing the perceived benefits then the theory predicts
that the person will choose to leave the relationship. Social exchange theory is derived
from social psychology based on the work of (Thibaut & Kelley 1959), Inside the
27
relationship marketing literature the concept of social exchange has received both
managerial and academic interest and since then it has been applied successfully to
legal settings and work organizations. According to the theory of social exchange a
social relationship is sustained through a stream of reciprocative exchanges of tangible
or intangible resources between individuals. Therefore, according to this theory
relationships are regulated by progressive interactions continuously determined by a
stream of deliberate assessments regarding the benefits and costs of maintaining these
relationships. The basic principle underlaying this theory is that in an ongoing
relationship, partners considerably evaluate the exchanges that take place, such
evaluations determine their decision to remain or withdraw from the relationship and
supply useful information that can be helpful in evaluating potential alternatives. Given
the dynamic and disproportional nature of social relationships, deciding whether to
remain in a relationship demands continual revisiting (Chadwick Jones, 1976). The
associated costs and benefits within a relationship can significantly vary during the
initial and transitional stages of the relationship. Accordingly, individual behavior in a
social exchange is motivated to maximize benefits and minimize costs so as to achieve
the profitable most results in a given social relationship. A social relationship is subject
to change when the costs (i.e. price, emotional distress) for continuing with a
relationship outweighs the benefits (i.e. rewards, prestige) or these benefits are no
longer sufficient against the sacrifices made.
Bagozzi, 1974 introduced the issue of fairness/equity to marketing through marketing
exchange theory. (Bagozzi, 1975) examined fairness in the context of dyadic reciprocal
relationships and argued that maintaining equality is central to the maintenance of
ongoing exchange between buyers and service providers. Service transactions between
service providers and consumers are primarily built on the concept of social exchange
(Matos, Fernandes, Leis, & Trez, 2011; Patterson et al., 2006), and customers’
perceived fairness relates to fair exchanges with the organization during service
transactions. Consumers generally, expect gains equivalent to their investments. Social
exchange perspective maintains that customers compare their time, costs and efforts
against the rewards they have obtained from their service providers (e.g., service
quality, brand image, etc.)
28
From a relationship marketing perspective, (Blau, 1964) recognized exchange as a
social characteristic that defines the service encounter (that is, the social interactions)
between service providers and consumers. SET thus postulates that a consumer’s
attitudes towards the relationship, and subsequent level of support and commitment,
will be influenced by his or her evaluation of resulting outcomes that the service
provider deliver to its consumers. Homans (1974) stated that this theory is like an
economic analysis of interaction that focuses on the exchange and mutual exchange of
rewards and costs between the service provider and consumers. He also pointed out that
the underlying assumption of this exchange is to lower the costs and maximize the
rewards of consumption experience. This is based on their assumption that consumers
evaluate service delivery in terms of social exchange, that is, evaluation in terms of
expected benefits or costs obtained for the services rendered. An exchange is likely
when consumers acquire benefits without incurring unacceptable costs (Carmeli, Gilat,
& Weisberg, 2006; O’Reilly & Chatman, 1986). According to (Schneider & Bowen,
1999) consumer reciprocate favorably by displaying positive emotions when they
perceive that the service provider has fulfilled its obligations with regards to its
promised benefits and how these befits were delivered during service delivery
situations.
Using social exchange theory (Maxham, Netemeyer, James G. Maxham, & Netemeyer,
2002) contend that consumers compare the results of an exchange outcome with their
inputs and seek to equate them with other consumers, when the equity score is
propositional to referent others, they report positive treatment from their service
provider. According to social exchange theory, consumers consider the trade-off
between the benefits and costs before deciding to perform a particular social behavior
(Homans, 1974). When the personal sacrifice is balanced with the social benefits
consumers and motivated to engage in helpful activities that favors the firm (Osterhus,
1997; Tyler, Orwin, & Schurer, 1982). Similarly, (Bateman & Organ, 1983) argue that
SET framework explain how individuals reciprocate those who benefit them. They
contend that consumers will seek to reciprocate the efforts of the organocation and
employee such as fair treatment and improved interactions in the form of positive
attitudinal states. Moreover, consumers who perceive benefits from their service
provider to be greater than costs may in exchange be willing to participate in activities
that help the firm to improve profitability (Getz, 1994; Lucero & Allen, 1994).
29
Conversely, high perceived costs may stimulate negative attitudes on the part of the
service supplying firm, for example, charging high prices, premiums compared to other
service providers (Carmeli et al., 2006). Drawing on SET framework (Yi & Gong, 2008)
shed light on the mechanism of how customer perception of justice influences their
affectivity (positive and negative affect) which in turn encourage customers to perform
citizenship behavior and dysfunctional behaviors. The results show that consumer
reciprocate service fairness (a positive personal outcome from service providers) by
exhibiting citizenship behaviors. (Omar, Alam, Aziz, & Nazri, 2011) applied SET to
explain consumer-e-retailer relationships underlining that program perceived equity
drive important relationship outcomes among those who experience that their rewards
outweigh the costs. They also found that creating considerable value as part of the
benefits in loyalty programs is rewarded by consumers in the shape of improved
confidence and satisfaction in the program. (Chou, Lin, & Huang, 2016) revealed in
their study that a customer’s perception of fair balance between inputs and outcome
foster their value co-creation behavior and instill a sense belongingness in virtual
community. A strong sense attachment in a community is based on reciprocity between
members contributing of favorable outcomes or processes that are valuable and goal
oriented.
Choi & Lotz, 2018 explained how the exchange of strategic resources such as justice
and support predict reciprocal attitudes and behaviors in consumers that assist the
organization using social exchange framework. They added that customers
experiencing a high level of perceived justice (fair procedures, consistent interpersonal
treatment) and organizational support are more likely obligated to reward their service
provider in the form of affective commitment and perform citizenship behaviors. SET
has been viewed as one of the representative major concepts available for
understanding why consumers express positive or negative attitudes and behaviors
(Carmeli et al., 2006; Van Dyne, Graham, & Dienesch, 1994). In this regard, (Yoong et
al., 2017) applied SET framework to understand consumers’ evaluation on their
benefits versus costs represented by relationship value and relationship quality on their
level of loyalty with the service providers arguing that delivery value for money service
packages, innovative products and service, better social interactions build stronger
exchange relationships based on quality with consumers which are helpful to achieve
their loyalty.
30
Additionally, (Dang & Arndt, 2017) found that prior to perform citizenship behaviors
customers consider the trade-off between their personal cost in exchange for benefits
received using SET framework. Specifically, that pointed out that a consumer
perception regarding self-sacrifice versus lesser benefits undermine their intent to
perform citizenship behaviors. In light of these researches, this study assumes that
when banking customers perceive their relationship with service provider is rewarding,
it will result in favorable attitudes and behaviors. Conversely, when consumers
perceive that the costs/sacrifices are greater than the benefits it will adversely affects a
customer's and will eventual lead to termination of relationship with service provider.
2.5 Service dominant logic
The service dominant logic emphasizes on the significance of exchange process or
relationship among exchange partners, which states that value is created as
consequence of mutual cooperation among all parties in an exchange arrangement
(Vargo & Lusch, 2004). Most of the literature set the service-dominant logic (S-D logic)
as the theoretical cornerstone of value co-creation behavior. Moreover, value co-
creation is increasingly recognized as a key component of the S-D logic, and the
development of value co-creation is facilitated by the S-D logic. Researchers also
elucidate the concept of value co-creation primarily base on the foundation of the S-D
logic (Grönroos & Ravald, 2011).
Thus, it is also necessary to explore the theoretical background of S-D logic for a better
understanding of value co-creation. The S-D logic is an alternative to the traditional
goods-centered view for understanding economic exchange and value creation (Vargo
& Lusch, 2004; Vargo, Maglio, & Akaka, 2008). The S-D logic defines service as the
core outcome of an exchange and affirm that all the value generated is co-creational
where the service producer and consumer both co-create value every time (Vargo &
Lusch, 2008). Before S-D logic, marketers embraced goods-dominant (G-D) logic that
focuses on value-in exchange and views the customer just as the “passive audience” or
“passive recipient of value” rather than the “active player” (Braun et al., 2016; Payne,
Storbacka, & Frow, 2008; Vargo & Lusch, 2008; Vivek et al., 2012).
According to (Lusch & Vargo, 2006), S-D logic (1) considers the service a common
denominator of exchange, (2) embraces a process (i.e., service) orientation, rather than
31
an output (i.e., goods or services) orientation, and (3) makes customers endogenous to
the value creation by proposing that value is always created with customers, rather than
unilaterally created and distributed by firms. I other words, the nature of service is a
process rather than an output, which fundamentally changes the marketing thinking.
The process nature of service under S-D logic implies that customers can also use their
resources to benefit the service provider, whereas the output nature of services or goods
under G-D logic suggests that the customer cannot do anything beneficial for the firm
because they are only the receiver of outputs offered by firms. As such, value co-
creation has gained the attention of both academics and practitioners and triggered an
increasing concern for understanding the process of value creation between the firm
and the consumer collaboratively. According to the S-D logic, service is the application
of competencies (knowledge and skills) or service for the benefit of others based on
economic and social exchange.
The S-D logic claims that the value is determined by the customer on the basis of value
in use. That is, the value is perceived only when services or products are used. Through
the process of that customer consumes a good or service, the value is created (Vargo &
Lusch, 2004, 2008). The core concept of S-D logic is that the customer is
fundamentally a value creator, while the firm is instead a value facilitator (Grönroos &
Voima, 2013). According to the sixth foundational premise states that the customer is
always the creator of value. That is to say, the value is continually created by the
customers during the usage of goods and services by the extracting resource. Moreover,
value for the customer is something which is perceived and evaluated by customers at
the time of their consumption (Ballantyne & Varey, 2006). The key premises of SDL
support the view of value co-creation. S-D logic that highlights the service-orientation
theoretically further stresses the importance of customer participation (Lusch & Vargo,
2006; Vargo & Lusch, 2008).
Following S-D logic, value co-creation is the main premise of customer participation,
while customer participation is characterized by concrete behaviors that enable the
fulfillment of value co-creation (Chan et al., 2010). Customer participation studied in
the S-D logic literature primarily refers to customers taking activities during the service
process, through which the firm can create value with customers rather than for
customers (Braun et al., 2016; Roy, Balaji, et al., 2018; Vargo & Lusch, 2004).
32
Customer can take various activities within the value co-creation; thus, customer
participation should be investigated consistently with the research background and
purpose. For example, (Filieri, 2013) examined customer participation in the context of
new product development and use the breadth and depth dimensions of activities (e.g.,
idea generation, product design, product testing, etc.) involved in the new product
development process to measure it. (Chathoth, Altinay, Harrington, Okumus, & Chan,
2013) refered to customer participation as a behavioral construct measuring the degree
of customers’ involvement in the process of creating and delivering services, such as
providing and sharing information, making suggestions while using financial services.
2.6 Service fairness
Grounded in social justice theories perceived fairness refers to a person’s perception
regarding whether they have received appropriate treatment from others in a variety of
situations. Similarly, fairness is regarded as a basic framework against which an
individual gauges the nature and level of relationship with other individuals, society
and social institutions (Clemmer & Schneider, 1996). Perceived fairness is considered
as a central tenant of equity theory (Adams, 1965), balance and correctness are two
underlaying principles that form judgments regarding equity (Sheppard, Lewicki and
Minton 1992). Balance refers to the mental process through which am individual
compare his fairness inputs and outcomes against other individuals experiencing
parallel circumstances. If individuals perceive that their inputs outweigh the outputs
received compared to referent others, those persons will likely perceive an unbalance of
equity. Correctness denotes an individual’s belief that whether a decision or an
outcome was right or wrong (Sheppard et al. 1992), and the moral judgment regarding
the extent to which that decision or outcome was accurate. In other words, Service
fairness refers to a customer’s perception of the degree of justice in a service firm's
behavior. Customer judgment regarding fair treatment are formed based on his
evaluation of whether an outcome and/or the process to reach an outcome is reasonable,
acceptable, or just (Bolton, Ockenfels, Bolton, & Ockenfels, 2004; Lujun Su et al.,
2016; Xia et al., 2004).
Although fairness theory has been extensively applied to general social interactions and
organizational behavior (Greenberg, 1990), much of the research on service fairness in
service marketing has been relatively recent. Recent studies on service fairness, focuses
33
on how fairness affects customer retention (Nikbin et al., 2016) and customer
relationship building (Giovanis et al., 2015) in the process of restoring service failure in
customer care aspects (Balaji et al., 2017), as well as a number of other outcomes,
including, but not limited to customer loyalty (LuJun Su et al., 2017) and citizenship
behaviors (Chou et al., 2016). In a competitive business environment, fairness has been
recognized as a fundamental organizational value and a differentiation strategy (Collie,
Bradley, & Sparks, 2002; Konovsky, 2000; Yeoman & Mueller Santos, 2016) and
advocated as a desired virtue of organizations in the process of impression management
efforts (Greenberg, 1990b; Folger, 1998). In addition, (Bowen, Gilliland, & Folger,
1999) argue that fairness perceived by customers during service delivery is assessment
of "whether the service provider has fulfilled its obligations of providing the service
outcomes and benefits promised to customers".
A customer experiences fairness when his inputs are equally or adequately balanced
with the outputs obtained through the exchange process, and on the contrary, when the
ratio of output to input does not balance, they experience unfairness. Although fairness
perceptions most often materialize in a negative circumstance, a company that performs
beyond the customer’s fairness expectations can trigger a positive perception. However,
as performances in the service industry are difficult to evaluate and differ according
consumers perceived service standards, perception of service fairness becomes critical
in terms of future revenues or cost. The amount of fairness that the consumers perceive
during service contact points (i.e. the context where the service is delivered, is very
important to prevent the departure of the customer due to service failure and to further
extend and maintain enduring relationship between a firm and consumers (Carr, 2007).
Usually, customers do not recognize service failures until they compare their service
experiences with others (Seiders & Berry, 1998). Particularly in case of services, it is
difficult for customers to evaluate services prior to purchase, and even some services
cannot be evaluated after immediate purchase (Nikbin et al., 2016). Fairness is of
significant importance for service firms that produces intangible and difficult to assess
products or services, and therefore rely on consumer’s credence. In service factory
customers are physically monitor in the production and delivery of services and tend to
always collect useful information to determine if they are being treated fairly not only
in terms of the amount and allocation of the core service outcomes and policies,
34
procedures adopted to achieve these outcomes even how they were treated
interpersonally during frequent interactions with service provider (Bowen et al., 1999).
Being aware of fairness can also lead to further consolidation of the exchange
relationship with the service provider as consumers has added information about social
exchanges (Ambrose & Schminke, 2003). These constructs are based on perceptions of
justice or fairness (Greenberg, 1990) and have been confirmed by (Bies & Shapiro,
1987, 1987, Goodwin & Ross, 1992, 1989; Goodwin, Smith, & Verhage, 1991).
Drawing on the above literature, the current study evaluated four factor model of
fairness which has been be confirmed by different by researchers as a consumer’s
evaluative assessment of fairness during service delivery (Giovanis et al., 2015; Roy,
Balaji, et al., 2018; Zhu & Chen, 2012). It is proposed that distributive, procedural,
informational and interactional fairness contribute uniquely for building valuable and
superior relationships and encourage customer to engage on behalf of a service firm.
Interactional, distributive, informational and procedural justice essentially measure a
customer’s concern regarding fair treatment during successive service encounters
associated with the contact employees, outcomes, information and process involved,
respectively. The following section describe the facets of service fairness in detail.
2.6.1 Distributive fairness
Distributive fairness refers to the outcome of a decision or an exchange (Homans,
1961). (Lind & Tyler, 1988) considered customer's perception of distribution fairness
as to whether the service benefits provided by the service provider exceeds the cost
paid by the customer or whether amount of benefits received (outcome) is favorable
compared to cost, time and effort (inputs) paid by the customer. Distributive fairness is
grounded in equity theory (Adams, 1965) and social exchange theories. (Adams, 1965)
asserts that reward allocation within a group should be equitable and proportional to the
contributions of group members. Distributive fairness also requires that members
during exchange relationship receive fair treatment through unbiased distribution of
service resources [e.g. consumer efforts and the costs incurred (inputs) to receive the
expected benefits (outputs)] (Homans, 1961; Messick & Cook, 1983).
The concept of distributive fairness implies that customers want favorable outcomes
compared with their inputs from the service supplying firms for instance distributive
fairness can represent evaluations of product or service quality along with other
35
tangible details, consumers may compare the quality of the service with other buyers
who purchased similar service. Early studies on distributive fairness have developed
rules for allocation of rewards within social and workplace settings, (Deutsch, 1975)
based his distribution justice theory one three core principles (equity, equality, need).
Equity refers to distribution of reward or opportunity proportional to an individual’s
efforts or contribution (e.g. Consumers perceive fairness when the proportion of
outcomes in the service process is the same for each individual effort), equality refers
to equal distribution of opportunity regardless of an individual’s efforts or contribution
(e.g. Consumers perceives fairness when they get the same results as other consumers),
and need refers to distribution of outcome based on what an individual’s need e.g.
customer perceive fairness when there are special need are fulfilled. (Seiders & Berry,
1998) proposed that these principles also apply to service marketing research each play
a distinctive role in forming judgments regarding distribution of service benefits. A
customer perception regarding distributive fairness depends on the degree to which
his/her expectations will be met through fair distribution of outcome. For example:
Major customers demand special services only for themselves (equity), and regular
customers want to receive the same services as other customers (equality). In addition,
certain customers may want the exceptional services they need.
According to (Bowen et al., 1999) Distributive fairness encompasses four principles:
which are closely related to customer’s perception fairness. the first rule relates to cost;
a customer may feel a service to be too expensive or being more expensive than the
benefits they have received. The second rule relates to the amount of service, the
customer comment about his/her feeling to have benefited even more fairly when
received better services than expected, or received services at a cheaper price than he or
she expected thus exceeding consumer’s expectations rather than satisfying them. Third,
correctness is the commitment to accurately deliver core services as promised. Whether
the service delivered is consistent right from the beginning. Lastly, excellence refers to
the quality of service which refers to whether the benefits delivered to customer were of
exceptional quality?
A customer perceived Service quality functions as his/her expectation and their
perception of what they have actually received match or exceeds their expectations
regarding dimensions such as responsiveness, assurance, tangibles, and empathy. The
36
distributive justice equity model has been tested extensively in organizational behavior
and service marketing research (Greenberg, 1990), whereby an exchange is considered
fair when customers receives equal benefits as compared to their contributions. In the
current research, distributive fairness is referred to as “a customer’s subjective
evolution regarding the tangible details of the services offered.”
2.6.2 Procedural fairness
According to (Greenberg, 1990) procedural fairness is referred to as the means used to
obtain a result. Alternatively, procedural justice refers to the evaluations of the process
undertaken to derive an outcome, or more precisely Procedural Fairness refers to
perceived fairness regarding policies, procedures and standards used by decision
makers to arrive at an outcome through decision-making processes (Alexander &
Ruderman, 1987; Lind & Tyler, 1988; Thibaut and Walker, 1975). In other word an
outcome would be evaluated as fair if a person had the opportunity to express his/her
views or have input into the decision (Bies & Shapiro, 1988). In particular, they
proposed that for a process to be evaluated as fair, consistency, a lack of bias, accuracy
of information, correctability, representation, and ethicality have to be present
(Leventhal, Karuza & Fry 1980). In similar vein, (Lind & Tyler, 1988) reported that
individuals were more concerned with the fairness of decision-making procedures,
while other researchers (Greenberg, 1987; Sheppard, Lewicki, & Minton, 1992)
believed that procedural fairness was more important than the equity of the outcome of
the process. Taken together these findings demonstrate that customers' reactions
concern not only what is delivered, but on how it is delivered.
According to (Tax, Brown, & Chandrashekaran, 1998), there are five factors that
determine process fairness. first, process control refers to the freedom to allow
customer feedback in the decision-making process, second, Decision control refers to
the extent of discretion a person has to accept or reject a decision about an outcome.
Third, accessibility means ease of participation in a process, fourth, Timing and Speed
refers to the amount of time it takes to complete a process. fifth, flexibility refer to the
adoptability of the process to reflect personal circumstances of the customer. (Bowen et
al., 1999) regarded efficiency, response to un-usual requests, waiting time and
helpfulness as critical determinants of procedural fairness by the customer. (Tyler &
Blader, 2003) argues that a fairly straightforward process is an important means for
37
customers to achieve desirable outcomes, they also claim Procedural fairness carry
important symbolic value for assessments of one’s self-worth, relationships, and status
in relation to their service provider. In other words, when customers feel their opinions
are properly heard and reflected during the service provision process they form
identity-relevant judgments with their service provider. (De Cremer & Blader, 2006)
found that human desires related to procedural justice can be found in the desire for
belonging, those who want to feel a strong sense of belonging turned out to pay more
attention to procedural justice than to indifferent ones. In other words, procedural
fairness refers to the customer's perception of the smooth application of procedures,
policies, and standards used by the service organization in providing service outcomes,
including efficiency and flexibility of process (Lind & Tyler, 1988; Smith, Bolton, &
Wagner, 1999). Also, procedural justice determines whether the process of acquiring
core services is fair (Lind & Tyler, 1988). According to (Cronin & Taylor, 1994), the
degree of customer perception of procedural fairness is assessed by the relationship
between service provider and customer contact, In particular, communication activities,
service provider efforts, neutrality, trust, respect and legitimacy are important
determinants of procedural justice, It also has been found to affect the perception of
procedural justice (Maxwell, Lee, Anselstetter, Comer, & Maxwell, 2009). It stands to
reason that consumer evaluations about procedural fairness would improve alongside
the level of improvements within the procedures related service delivery. In other
words, when consumers form a positive/negative judgments about procedure related
elements during service delivery it is likely that they will experience balance/unbalance
situation between their inputs against the outcomes received and as a result will take
corrective/supportive measures to restore procedural fairness. In this study, procedural
justice was defined as evaluation of perceived policies, procedures, and standards until
the final result was obtained in the process of receiving financial services.
2.6.3 Interpersonal fairness
Interpersonal fairness is defined as the extent to which consumers feel they have been
treated fairly in regards to the personal interaction (i.e., the ways in which an individual
receives treatment from the employee of a firm) they encounter throughout the service
delivery process (Bies & Shapiro, 1987, 1988; Blodgett, Hill, & Tax, 1997). In other
words, Interactional fairness refers to the quality of interpersonal treatment customers
38
receives during the service delivery process by the service provider. (Bies & Moag,
1986; Bies & Shapiro, 1987, 1988) first introduced the concept on interactional justice
into the organizational domain identifying justification, truthfulness, respect and
proprietary as its main determinants. In addition, Interactive fairness is the assessment
of the extent to which customers are treated fairly in human relationships (Bies &
Shapiro, 1987; Mattila, 2004). Prior research on interactional justice indicate that it is
the most important aspect in the evaluation of service delivery and subsequent
evaluation of the service provider. Given that the service outcomes are satisfactory and
the service delivery procedures are adequate, still the improper behavior of the service
provider can cause negative customer emotions. According to (Greenberg, 1993) past
research demonstrates that when people were interviewed about what constitutes unfair
treatment, their responses focused on interpersonal rather than structural factors. The
literature operationalizes interactional justice in a variety of ways. According to (Bies
& Shapiro, 1987), interactional justice refers to the level of truthfulness, courtesy,
reverence, and disrespect in the inter-personal treatment tendered by a service firm.
Several other interpretations include being honest, friendly, sensitive (Clemmer 1993),
devoted (Ulrich & Barney, 1984), treating others with assurance and empathy
(Parasuraman, Zeithaml, & Berry, 1985).
Moreover (Bies & Shapiro, 1987) argued that interactional and procedural fairness are
interrelated. However, interactional fairness refers to the interpersonal side of
organizational practices, specifically the communication by management with
employees and the quality of personal interaction. It is generally understood to have
two subcomponents: interpersonal and informational (e.g. (Bies & Shapiro, 1987;
Brockner & Wiesenfeld, 1996). Informational fairness refers to the degree to which
information provided to the consumers was adequate and readily available, whereas
interpersonal fairness focuses on the dignity and respect with which one is treated.
2.6.4 Informational fairness
Informational fairness refers to the extent to which consumers of a service firm are
conveyed information and explanations regarding the procedures used to produce an
outcomes (Greenberg, 1993). Thus, it reflects to the favorability of information
supplied during the enactment of procedures and outcomes pertaining to the
correctability of the information, specificity, timeliness and genuineness with which the
39
information was delivered (Colquitt, 2001). Consequently, informational fairness may
be sought by giving information about procedures showing regard for consumer’s
concerns. Information fairness is perceived in many forms, for example, it relates to the
quality of communication and the extent to which adequate reasoning and explanation
is communicated to consumers as to why a particular loan application was rejected,
involving consumers in such communication and taking their opinion regarding the
decision and discussing alternative solutions. during enactment of services, provision of
comprehensive information by the service providers is crucial because such decisions
demand detailed account and justification on the part of consumers (Colquitt, 2001). In
addition, (Greenberg, 1993) affirm that providing a detailed account regarding decision
help individuals to acknowledge the reasons why such decision was made which can be
used as a mean to revert the reaction and minimize their resistance (Lance Frazier,
Johnson, Gavin, Gooty, & Bradley Snow, 2010). Judgements of fairness regarding
explanations seems to emerge when the information provided are comprehensive,
represent genuine concern and based on sound reasoning Bies (2001). Contrasting
interactional and information fairness, interactional fairness focus on how an outcome
is distributed among consumers while information fairness focus of providing
knowledge to consumer about the procedures undertaken to produce an outcome or
decision.
Perception of informational fairness can be improved remarkably when the information
communicated in honest and adequate, sufficient reason is provided against a claim and
explanations are provided that can eliminate contextual anxiety (Bies & Shapiro, 1987,
1988). Therefore, interactional fairness in this study refers to “the genuine respect and
interest shown to the customer by the service provider such that the customer feels
treated fairly in the consumption interaction.” A higher level of informational fairness
emanates when consumer have extensive information available to them which lead to
improved level of judgement regarding transparency in the procedures undertaken to
produce service outcomes and decisions (Cropanzano, Ambrose, & Bies, 2015). From
the stand point of providing fair information the fair image of the service provider can
be safeguarded by uncovering specific details about important outcomes or decisions to
consumers that may seem to reduce the negative affect, emotions and attitudes
(Steensma & Milligen, 2005). Providing adequate informational support is considered
effective in minimizing risks associated with purchase and post purchase situations.
40
Providing adequate information disclosure to consumers in critical and relevant for
banking sector to attain sustainable relationships with customers, particularly where
other banks have failed (K.-S. Kim, 2018; Taneja, Srivastava, & Ravichandran, 2015).
2.7 Relationship marketing
The basic premise of relationship marketing is that by participating in the relationship,
exchange parties can benefit from exchange by decreasing uncertainty or risk and
increasing efficiency (Balaji, 2014; Clark, Adjei, & Yancey, 2009; Schneider & Bowen,
1999). Early studies on relationship marketing started from explaining the relationship
marketing efforts among firms, especially the relationship between the buyers and
supplier (J. C. Anderson & Narus, 2006; Dwyer, Schurr, & Oh, 1987; Fontenot &
Wilson, 1997; Webster, 1992) and expanded to include customers, service providers
and salespeople (Dwyer et al., 1987; Webster, 1992; Zhu & Chen, 2012). A growing
body of research describe that a firm’s relationship marketing efforts has positive
effects on customer management effectiveness. Building successful relationships
between a service firm and its consumers contributes to desirable marketing outcomes
such as customer engagement, retention and loyalty. Recently, relationship marketing
has attracted the attention both in the industry and academia (Fournier, Dobscha, &
Mick, 1998; Sheth & Parvatiyar, 1995). (Grönroos, 1994) regarded relational marketing
as a paradigm shift in marketing discipline, and (Bagozzi, 1995) emphasizes on the
academic importance of relationship marketing, claiming that "relationship marketing
is at the core of marketing theory and practice".
According (Parasuraman, Berry, & Zeithaml, 1991) the essence of relationship
marketing is to attract, develop and maintain customer relationships." (Shani &
Chalasani, 1992, p. 41) argues that relationship marketing is an integrated effort to
identify, maintain and build up a network with individual consumers and continuously
to strengthen the network for the mutual benefit of both sides, through interactive,
individualized and value-added contacts over a long period of time. (Morgan & Hunt,
1994) defines relationship marketing as "any marketing activity that creates, develops,
and maintains successful exchange relationships," and have shown that trust and
commitment, an important component of relationship marketing. Relationship
marketing differs from traditional marketing in many ways; In traditional marketing, a
customer is merely a target for selling a company’s own products. On the other hand, in
41
relationship marketing, customers are seen as partners of company where long-term
relationships is maintained with them in order to make profitable relationship. If
traditional marketing relies on one-way delivery of messages from the company to the
customer through mass media, relationship marketing emphasizes interactive
communication through various means.
Traditional marketing efforts were directed towards getting only prospective consumers
however, relationship marketing encompasses not only getting new consumers, but also
retaining and recovering consumers. The goal of relationship marketing is to re-define
the traditional marketing approaches of consumer management by providing greater
attention to customer value creation (Braun et al., 2016), thus delivering value and
superior customer service are the main focal points of relationship marketing.
Relationship marketing involve continuous streams of numerous interactions extended
over time and account for both social and economic bonds (Fontenot & Wilson, 1997).
Shifting attention from market share to customer share is considered as a cost-efficient
means of increasing overall profitability (Griffin 2002).
The focus of relationship marketing is to endure lasting bonds with customers that
create mutual value, rather than focusing on gaining share of market relationship
marketing activities strive for gaining consumer share by aiming to generate repurchase
and encourage cross selling of the same product (Gummerus, von Koskull, &
Kowalkowski, 2017). Relationship marketing also focus to deal customer individually,
(Little & Marandi, 2003) argue that business profits come from customer not from
products therefore a customer share can only be assured when a firm shift is focus to
individual customers. Three of the most widely used constructs are discussed below:
2.7.1 Relationship value
Relationship value refers to a customer judgement regarding the cumulative utility of
all the tangible and intangible benefits received in relationship with a service provider
(Hogan, 2001a). Past research on relationship value has primarily focused on
examining buyer-supplier relationships considering the role of value for maintaining
long-term relationships (Leonidou, 2004). The main objective behind delivering
superior value in the existing competitive environment is by focusing on services
transactions (Ulaga & Eggert, 2006). In other words, the creation of relationship value
42
is the fundamental objective in exchange relationship between parties and should be
considered as the basis for defining a marketing strategy (Gil-Saura, Frasquet-Deltoro,
& Cervera-Taulet, 2009; Lindgreen, Palmer, Vanhamme, & Wouters, 2006).
Relationship value is a measure of how well consumers' needs and expectations are met
by the service provider, and it enables the efficient leveraging of resources in an
exchange relationship (Ruiz-Molina, Gil-Saura, & Moliner-Velázquez, 2015; Ulaga &
Chacour, 2001). Relationship value directly affects consumer behavioral outcomes and
leads to economic performance by creating loyalty and a sustainable competitive
advantage (Klanac, 2013). Perceived value is the consumer's overall assessment of the
utility of a product based on perceptions of what is received and what is given. Though
what is received varies across consumers (i.e., some may want volume, others high
quality, still others convenience) and what is given varies (i.e., some are concerned
only with money expended, others with time and effort), value represents a trade-off of
the salient give and get components.” (Zeithaml, 1988, p. 14). Therefore, it is important
to understand and enhance a customer experience regarding value in an exchange
relationship. A value is consumers’ perception of what they gain in return for their
sacrifice (Zeithaml, 1988), which can be examined in two ways. Desired value is what
consumers intend to achieve through purchasing a product or service, and perceived
value refers to the benefits that consumers believe they gain after purchasing the goods
or services (Woodruff, 1997).
A consumer value proposition is formed when firms understand consumer desires and
the current market offer such that they can develop a product or service that meets the
needs of the market and consumers (J. C. Anderson, Narus, & van Rossum, 2006).
Through this process, consumer value is generated and perceived consumer value is
formed. Consumer value research has thus far been primarily conducted for products
and brands from the behavioral perspectives of consumers (Arnold & Reynolds, 2003;
Rintamäki, Kanto, Kuusela, & Spence, 2006). (Rintamäki et al., 2006) highlighted this
aspect and suggested three types of consumer values and their subsets according to a
hierarchical structure of consumer value. First, utilitarian value refers to a functional
product-oriented consumer decision-making process that exists under the assumption
that consumers are rational. Utilitarian value occurs when task-related needs are met,
and monetary gain and convenience are its subdimensions. Monetary gains are obtained
through bargains or prices set to be cheaper than other stores.
43
Convenience can be defined as the ratio of input to output, and relevant inputs are time
and effort, which may be provided through time-saving and ease of shopping. Hedonic
value can be represented by three Fs: ‘fantasies, feelings, fun’ (Holbrook & Hirschman,
1982). Consumers feel hedonic value when they recognize that consumption is their
will and not related to a planned purchase. Hedonic value is abstract and subjective, and
entertainment and exploration are its sub-dimensions. store environments, events,
contests, and general service climate provide the experiential elements of the buying
experience and provide consumers with hedonic value. Exploration conveys hedonic
value when consumers feel excitement when searching for a service or information.
Finally, social value considers purchase as a social behavior that expresses symbolic
meaning, morals, relationships, and consumer identities. Buying behavior provides a
symbolic benefit that allows consumers to express their personal values through this
consumption experience. Status enhancement is a benefit attained by utilizing symbolic
characteristics, such as a position or a membership, in communication. Self-esteem
enhancement is a benefit that is obtained when symbolic features gained through a firm,
store, service, or other consumers are associated with consumers themselves and when
consumers define themselves through this benefit.
According to (Hellier, Geursen, Carr, & Rickard, 2003) relationship value is
determined by a customer perception of equity and service quality which further
influences their brand preference and repurchase intentions in insurance sector. They
found that service failure management leads to reduced failure costs (investments,
efforts, time) that maximize purchase utility which leads to consumer brand preference.
In addition, they highlighted the need for managing the elements needed to deliver
superior value related to purchase process. In B2B service industry settings (Hansen,
Samuelsen, & Silseth, 2008) explored the antecedents and consequences of consumer
perceived value they found that fair distribution of resources in terms of balanced cost
and benefit assessment leads to higher perception of economic value in the relationship.
(Chang & Hsiao, 2008) found that consumer perceived value was affected by service
justice (proper explanations, communication etc.) through perceived risk reduction
during the exchange process.
A firm’s ability to handle service failures with detachment, lead to a decreased levels
risk that were considered expected costs by the consumers during service consumption.
44
Moreover, widespread availability of information also significantly influenced
perception value by minimizing their discontent. Similarly, building on value-
disconfirmation paradigm (Hutchinson et al., 2009) found that fairness was
significantly related to a customer perception of value and satisfaction that lead to
word-of-mouth and revisit intentions. Their findings revealed that positive perceptions
about equity is a significantly predict value or utility that further lead to customer
behavioral intensions. Similar results were noted by (Omar et al., 2011) stating that
maintaining a constant utility level is important for building sustainable relationships
with customers and encourage their loyalty towards the firm. They provided empirical
evidence that when service users get equitable and fair treatment, they tend to
reciprocate by demonstrating higher levels of value that is important from enhanced
customer-firm relationships and therefore, considered equitable provision of rewards,
discounts, service utilities ensuring a win-win situation between the users and service
providers. In relationship marketing domain (Ulaga & Eggert, 2006) explored the
important role of relationship value in purchasing relationships they concluded that
offering superior value to customers is crucial for relationship maintainability that
directly influences the quality of the relationship including increasing trust, satisfaction
and commitment but not sufficient for relationship expansion unless it translated into
higher relationship quality.
Similarly (Ruiz-Molina et al., 2015) argue that relationship affective valuation in the
early stages of relationship are conclusive for the development of long-term
relationship quality. They found that emotional and social values are considered
important in building a relationship based on trust satisfaction and commitment which
lead to purchase intention. Moreover, following value-behavior framework (Jin, Line,
& Goh, 2013) found that customer experiential value perceptions are essential in
maintaining positive relationships with customer that further improves their attitude and
behavioral loyalty with the firm, they highlighted the importance of providing
economic efficiencies and argued that enhanced levels of value in terms of cost, time
and money and overall dining experience seem to improve dinner’s trust and
satisfaction which foster long term loyalty. (Balaji, 2014) explored the role of
relationship value and quality in driving customer citizenship behavior in bank settings.
they found that relationship value does not directly translate into citizenship behaviors
however achieving long term relationship quality with consumer is determined by a
45
firm’s ability to deliver superior value to its customers and therefore relationship value
precedes relationship quality.
The study highlighted the significance of relationship value in terms of economic value,
core service offering, and support services in maintaining and enhancing relationships
with customer from the perspective of business-consumer relationship marketing. A
study by (Lai, 2014) found that service quality significantly predicted value and
relationship quality with a service provider that ultimately lead to loyalty. They indicate
that when firm provide consistent level of quality to its customer it lead to improved
judgements regarding the value of service which lead to increased confidence and
commitment in the service provider that ultimately lead to loyalty. (Jalilvand,
Salimipour, Elyasi, & Mohammadi, 2017) found that relationship quality mediated the
relationship between value and positive word of mouth they asserted that perceptions of
relationship value in an important determinant of relationship quality that is important
for achieving differential competitive advantage. Their results indicate that firms that
offer superior value to its customers lead to positive attributed and favorable perception
about the service provider.
2.7.2 Relationship quality
Perceived relationship quality is defined as an overall assessment regarding the strength
of a relationship, conceptualized as a composite or multidimensional construct that
capture different but related facets of a relationship (Palmatier, Dant, Grewal, & Evans,
2006). The concept originated from (Crosby, Evans, & Cowles, 1990), and early
scholarly work by (Dwyer et al., 1987) who is devoted considerable efforts in
examining various aspects about relationship quality. The emergence perceives
relationship quality concept as a crucial in the area of relationship marketing, since it
provides insights into distinguishing successful relationships from unsuccessful ones. It
also underlines the kinds of problems that exist in relationship and; it is a useful
measure to evaluate the effectiveness of relationship marketing activities. Recent
literature revealed that relationship quality is a key predictor of firm performance such
as loyalty (Giovanis et al., 2015), citizenship behavior (Chou et al., 2016), repurchase
intention (Nikbin et al., 2016), positive word of mouth (Romero, 2017).
46
Firms that do not focus on customer relationships often fail to identify customers
accurately. In the past, firms focused on attracting new customers rather than
considering it worthwhile to maintain customers. However, as firms focuses on
attracting new customers, it tends to rely only on measures that are difficult to maintain
in the long run. Therefore, interest in relationship marketing has increased as it became
clear that retaining existing customers will result in relatively lower marketing costs
than attracting new ones (Barry & Terry, 2008). In recent years, as the importance of
relational marketing has started to emerge, interest in exchange relationships has
increased substantially, and the concepts of such as relationship value, relationship
quality, relationship strength has been introduced to effectively explain this
phenomenon (Shi, Bu, Ping, Tingchi Liu, & Wang, 2016; Ulaga & Eggert, 2006). As
service firms face uncertainty in complex service environments, relationships quality
contributes to continued ties with the service providers and meet customer expectations
(Papista & Dimitriadis, 2019). From a social point of view, a long-term relationship is
the accumulation of satisfied transactions and the expectations about future transactions,
based on commitment and trust developed through the creation of social and economic
bonds, and loyalty to relationships (Balaji, 2014).
During the 1980s, competition was based on producing quality goods and services.
Today, however, firm are finding that goods and service quality are a minimal factor in
their competition, the importance of relationship marketing is emphasized by
identifying that the quality of the relationship with customers is the main reason of
success. (Dwyer et al., 1987) have operationalized relationship quality as a relational
construct in their preliminary work on relationship marketing, Relationship marketing
research has since been developed rapidly based on the work of (Crosby et al., 1990),
and (Morgan & Hunt, 1994). A number of studies in service marketing context argue
that the quality of the relationship between the customer and the service provider
requires trust and commitment (Crosby et al., 1990; Grönroos, 1994; Parasuraman et al.,
1991). In a study by (Palmatier et al., 2006) argues that trust and commitment are the
most frequently mentioned relationship quality constructs.
In a relationship marketing context, a firm's relationship efforts can make customers
feel confident or committed to the relationship. (De Wulf, Odekerken-Schröder, &
Iacobucci, 2001) and (Kumar, Scheer, & Steenkamp, 1995) have shown trust,
47
commitment, and satisfaction, as second order constructs of relationship quality of a
firm’s relationship marketing efforts. To act as a conduit for long-term profits and
future interactions relationship quality is an indicator of relationship marketing (Crosby
et al., 1990). Relationship quality means that consumers are confident in the future
performance of the service provider because they trust the integrity of its sale people
and are constantly satisfied with their level of past performance. Relationship quality is
a composite measure of relationship strength and provides the most insight into
exchange performance (Crosby et al., 1990; De Wulf et al., 2001). An outstanding
service relationship between consumers and their service providers hold-together both
the partners to one another in a such a manner that they are capable of reaping the
rewards which are far greater than only the exchange of products and currency
(Macneil, 1980).
A number of studies in service marketing argue that the quality of the relationship
between the customer and the service provider requires trust and commitment
(Grönroos, 1994; Nikbin et al., 2016). In this regard, (Kashyap & Sivadas, 2012) and
(Giovanis et al., 2015) have shown trust, commitment, and satisfaction, as second order
constructs of relationship quality of a firm’s relationship marketing efforts. Although
there are different conceptualizations regarding the dimensions of relationship quality,
satisfaction, trust and commitment are regarded as essential constitutional elements
(Jalilvand et al., 2017; Ng, David, & Dagger, 2011; Wu, Huang, Tsai, & Lin, 2017).
2.7.1.1 Customer satisfaction
Customer satisfaction has been commonly considered a significant determinant of
enduring consumer behaviors (Han & Ryu, 2009; Roy, Eshghi, & Sarkar, 2013; Ryu &
Han, 2010; Saleem, Zahra, & Yaseen, 2017; Ulaga & Eggert, 2006). Researchers in the
area of consumer behavior and marketing have continuously focused their attention on
the importance of customer satisfaction and acknowledge that higher degree of
consumer satisfaction ultimately lead to enhanced repeat purchase and customer
maintenance rates (Hutchinson et al., 2009), boosting positive word-of-mouth
behaviors (Ng et al., 2011), and improved the monetory rewards to the service
providers that serve them (Fornell, 1992; Han & Ryu, 2009; Ryu & Han, 2010).
Customer satisfaction is viewed as "an individual’s emotional reaction to his or her
evaluation of the total set of experiences realized from patronizing that retailer”
48
(Westbrook & Oliver, 1981) and “an overall evaluation based on the total purchase and
consumption experience with a good or service over time" (Anderson, Fornell, &
Lehmann, 1994). (Storbacka, Strandvik, & Grönroos, 1994) state that customer
satisfaction is “the customers’ cognitive and affective evaluation based on their
personal experience across all service episodes within the relationship”. (Crosby et al.,
1990) similarly point out that satisfaction is an abstract measure that provides an
assessment of the quality of all interactions with the service provider in the past, thus
forming expectations on the quality of future interactions. The essential belief of
relationship marketing is the creation and maintenance of customers who are pleased to
choose the company and feel valued (Parasuraman et al., 1991). (Oliver, 1980; Oliver,
Rust, & Varki, 1997) also demonstrated that satisfaction judgment is an evaluation
process of both positive and negative affective responses, and cognitive
disconfirmation. He insisted that satisfaction should be theoretically distinguished from
emotional response. His expectancy-disconfirmation theory is one of the most widely
used approaches to explain customer satisfaction and dissatisfaction and has been
empirically tested in many hospitality and services studies. According to this theory,
consumers hold pre-purchase expectations during purchase of goods and services in
anticipation for the desired performance results. Once the service or product has been
bought and consumed, the service results are compared against the expectations.
confirmation is achieved in case if the result matches expectations. when consumers
perceive discrepancies between the outcomes and their expectations disconfirmation
prevails. Negative disconfirmations emerge when service results are lower than
expectation and thus the performance of product or service will be far inferior than
what was anticipated. Positive disconfirmations are materialized when the service
results are higher than expectations and this the performance of the product or service
will be far superior that what was supposed to be (Oliver et al., 1997; Pizam & Milman,
1993). Overall, there are divergent views among scholars in the area of consumer
behavior and marketing regarding conceptualisation of consumer satisfaction, however
both agree that customer satisfaction/dis-satisfaction emerge from as a consumer’s post
purchase assessments or evaluating process resulting from their perceptions regarding
discrepancies between expectations prior to purchase decision and their real
consumption encounters (Back & Parks, 2003; Deng, Lu, Wei, & Zhang, 2010; Hill &
Brierley, 2017; Oliver, 1980).
49
2.7.1.2 Customer trust
Trust is regarded as an essential component for successful relationships (Dwyer et al.,
1987; Fontenot & Wilson, 1997; Moorman, Deshpandé, & Zaltman, 1993) describe
trust as the perception of “confidence in the exchange partner's reliability and integrity.”
This definition emphasizes the importance of confidence and reliability in the concept
of trust. (D. T. Wilson, 1995) point out that “trust is a fundamental relationship building
block and as such is included in most relationship models”. (E. Anderson & Weitz,
1989) also define trust as “one party’s belief that its needs will be fulfilled in the future
by actions undertaken by the other party.” In a business to business relationship context,
(Doney & Cannon, 1997) describe trust as the perceived credibility and the
benevolence of an entity of trust. The first dimension of trust is the objective credibility
of the exchange partner, and the partner's words or documents are trustworthy (J. C.
Anderson & Narus, 2006; Ganesan, 1994). The second dimension of trust, benevolence,
stands for the degree to which a partner is truly interested in the welfare of other
partners and pursues joint interests (Kumar et al., 1995). It has also been found that
trust affects buyer attitudes and behaviors to suppliers (Schurr & Ozanne, 1985) and
provides a common basis for trading partners to solve mutual problems (Sullivan &
Peterson, 1982). Trusts also have a positive impact on the stability of buyer-supplier
relationships (E. Anderson & Weitz, 1989).
2.7.1.3 Customer commitment
In the relationship marketing literature, the concept of relationship commitment has
been often viewed and refers to customers’ general intentions to maintain the business
relationship (Ulaga & Eggert, 2006). (Martin & Bennett, 1996) argued that the strength
of customers' commitment to a firm depends on their perceptions of the firm's efforts.
The commitment is recognized as an essential ingredient for successful long-term
relationships (Dwyer et al., 1987; Morgan & Hunt, 1994). Commitment is frequently
described as a strong desire to continue an existing relationship (Harrison-Walker, 2001;
Jones, Fox, Taylor, & Fabrigar, 2010; Moorman et al., 1993; Morgan & Hunt, 1994),
some marketing scholars defined it as the forsaking of options alternatives provide
(Gundlach, Achrol, & Mentzer, 1995), a type of attitude strength (Ahluwalia et al.,
2000), and a resistance to change (Fullerton, 2005). (Dwyer et al., 1987), and (Morgan
& Hunt, 1994) defined commitment to the relationship as "an exchange partner
50
believing that an ongoing relationship with another is so important as to warrant
maximum efforts at maintaining it that is the committed party believes their
relationship is worth working on to ensure that is endures indefinitely." (Mayer &
Schoorman, 1992) and (Allen & Meyer, 1996) suggested the three-dimensional model
of organizational commitment, and this model overlaps considerably with other
multidimensional conceptualizations.
Because there were some important differences in the measures derived from the
multidimensional models, some researchers had used affective commitment
continuance commitment and normative commitment. They pointed out three ways
that individuals can be bounded to an organization. affective commitment is a desire to
belong to the organization. Continuance commitments based on a belief that leaving the
organization will be costly. Normative commitment is a sense of obligation to the
organization. These have been summarized as: wanting (effective commitment),
needing (continuance commitment), and being obliged (normative commitment) to stay
with your organization. They continuously have tried to develop the commitment skills
to my all these components. Normative commitment can be defined as an obligation to
stay with your organization, without specific reference to social pressure about loyalty
(Allen & Meyer, 1996; Meyer, Allen, & Smith, 1993; Meyer, Stanley, Herscovitch, &
Topolnytsky, 2002).
2.8 Customer citizenship behavior
Employees are a firms’ internal human resources whose task performances and OCBs
greatly contribute to promoting organizational performances. Customers can be also
considered as important human resources because they often physically present in firms’
business activities (Groth, 2005). Firms recognize customers as “partial employees”;
thus, the effective management of customers’ in-role and extra-role behaviors could be
a strategic advantage for firms (Groth, 2005; Lengnick-Hall, 1996; Schneider & Bowen,
1999). A number of prior studies have examined customers’ in-role behavior and/or
extra-role behavior as well as their relevant antecedents and consequences. (Bettencourt,
1997) first presented the concept of customer voluntary performance in they argued that
customers contribute to service quality through their roles as promoters of the firm, co-
producers of the firm’s service and consultants to the organization.
51
As indicators of consumer attraction and loyalty to the firm they can promote the
interests of the firm through favorable word of mouth and recommendations. Thus,
helpful, discretionary behaviors of customers like favorable word-of-mouth,
cooperation in the service encounter and communicating suggestions may be expected
to be influenced by customer perceptions of the extent to which they maintain a social
exchange relationship with a firm (Bagozzi, 1995). Later, (Groth, 2005) extended the
OCB theory to the customer domain to examine customer behaviors as well as their
antecedents in the service delivery. Through applying the OCB framework to examine
customer behaviors in service context, he proposed a new construct, namely, CCB,
updating the conceptual definitions of these customer helpful roles a stating that a
voluntary individual customer does not seek direct or indirect compensation for his
citizenship behavior is capable of effectively promoting the function of the service
organization and help maximize the overall value of firm products and service through
recommendations, helping other customers, and providing feedback. Consequently,
CCBs, as customer extra-role behaviors, was divided into three dimensions, each with
four items: giving recommendation (e.g., “recommend the firm and its services to
peers.”), providing feedback to the service provider (e.g., “provide helpful feedback for
improved customer service.”), and helping other customers (e.g., “help others with
service usage.”). Meanwhile, he defined customer in-role behavior as customer
responsible behavior, namely, customer coproduction, of which the measure consisted
of five items (e.g., “I performed all the tasks that are required.”). Further, he proposed
that customer socialization had a greater effect on customer coproduction than that on
CCB, while customer satisfaction had a greater impact on CCB than that on customer
coproduction. Today's customers actively participate with their service provider in
service delivery rather than passive buyers, providing suggestions and feedback for
improvement through a variety of media, and thereby aid the organization’s growth
efforts (Groth, Mertens, & Murphy, 2004).
In other words, customer makes voluntary efforts to improve profitability and raise
service quality just like employees within the organization. Working more proactively
and help other customers through community building and ultimately participate in the
development of service enterprises (Groth, 2005; Tat Keh & Wei Teo, 2001). Therefore,
it is evident that the customer citizenship behavior leads to the profits and improve firm
performance, a customer is regarded as a partial employee of the service organization
52
(Namasivayam, 2003). The service customer can be considered as a part-time employee
of the company and participates in the co-production during the production and
delivery of the service (Xue & Harker, 2002). In order to achieve its service
management goal, a service firm considers a customer to be a member of the
organization or a part of its workforce, even if it does not recognize itself as a member
of the service organization (Lovelock & Young, 1979; Mills & Morris, 1986). Because
customers have a significant impact on the quality of service provided through
interaction with the service organization (Lengnick‐Hall, Claycomb, & Inks, 2000).
The voluntary role of the customer in the process of service delivery can reduce the
additional costs for the service providers and improve the quality of service, which
ultimately result in competitive advantage of the service firm (Groth, 2005). In addition,
service customers may exhibit adaptive engagement in the interest of the service
organization and may be spontaneously motivated to perform voluntary extra-role
behaviors that go beyond expectations of customers. This can include conveying
positive messages about the service organization, working with service organization
employees, and sharing positive experiences with other customers (Tat Keh & Wei Teo,
2001). (Anaza, 2014; Balaji, 2014; Bartikowski & Walsh, 2011; Bove, Pervan, Beatty,
& Shiu, 2009) take the relationship marketing perspective to emphasize the impacts of
satisfaction, commitment, perceived fairness, service quality on CCB that was
considered as a complete construct or one including many sub-dimensions. In the
service domain, CCBs are outcomes of a firm’s CRM and have positive effects on
enhancing the firm’s business performances. Customer participate in service creation
and can be a source of producer learning. At the same time, customer can contribute
valuable resources, information and inputs and can assume the role of co-producers,
can participate in the appraisal of service quality and fulfil the function of
recommending a service to others (Pansari & Kumar, 2017).
Customer engagement behaviors are resulted from various motivational resources
provided by service firms that consumers reciprocate in the form of behavior
manifestations towards a firm irrespective of purchase, such as providing positive
word of mouth, product referral and recommendations, helping other customers,
writing reviews or blogs, advocating on behalf of the firm to other stakeholders etc (van
Doorn et al., 2010). Customer engagement is very important for a from profitability
from a relationship marketing perspective (Romero, 2017). (Verleye et al., 2014)
53
highlighted the important role of service quality and organizational support influencing
customer's affective states that lead to customer engagement behaviors conceptualized
as compliance, cooperation, feedback, helping other customers, positive word of mouth.
More recently (Braun et al., 2016) have identified 3 types of customer engagement
behaviors, engaging with other customers through interactions, engaging in on the line
activities in helping the focal firm and engaging in value co-creation activities on
behalf of the focal firm. They asserted that firms should provide guided benefits
(incentives, discounts, recognition etc. to their consumers to encourage customer
engagement behaviors. For example, customers provide variety of resources in the
shape of interacting with other stakeholders to provide positive word of mouth, provide
suggestions for product improvement to the firm. Moreover, (Alessandri, Consiglio,
Luthans, & Borgogni, 2018) asserted that customer engagement is an emerging concept
in B2B relationship marketing domain that can be encouraged through active
communication with customers and strategically promoting the firm services aimed at
maximizing customer value. In this regard, within the multi-stakeholder service system,
(Jaakkola & Alexander, 2014) have identified four types of customer engagement
behaviors that consumers seek to benefit a firm that co-create value, based on their
findings customer contribute various resources to help the focal firm such as
augmenting a firm service offering, affect other consumer’s perceptions and
preferences and helping the focal firm by providing suggestions and spreading
recommendations to others. the authors developed the most compressive and analytical
framework to measure CEB by aggregating customer extra role behaviors into four
broad categories: augmenting, co-developing, influencing and helping behaviors.
54
Chapter 3
RESEARCH METHODOLOGY
3.1 Chapter overview
This chapter begins by presenting conceptual framework and hypotheses of the
research and then proceeded by describing the philosophical underpinnings and overall
plan designed to address the research problem and stated objectives of the study. The
first section addresses the hypothesized relationship between theoretical concepts and
draw the proposed model of the study. Primarily eight hypotheses where drawn from
extant literature based on extensive literature review. Following theoretical framework,
the chapter starts with a brief description about the philosophical assumptions related to
social sciences and describe its relevance in light of the objectives of the current
research outlined in section 3.3. Subsequent sections presents an overview and the
justification about the overall plan of the research and outline activities planned under
research design as per following sub-sections: Section 3.4.1 described the overall
approach used address the questions in this study, Section 3.4.2 outlined details about
data collection strategy, Section 3.4.2 to 3.4.5 describe the justification regarding the
choice, selection of data collection, details about the context in which data was
collected. Section 3.5 provide the finer details about techniques and procedures used to
collect data, Section 3.6 elaborate on techniques and procedures used for data analysis
namely the Partial Least Square Structural Equation Modelling (PLS-SEM). Finally,
the last section 3.7 describes the data screening and its management.
3.2 Theoretical framework and research hypotheses
The theoretical framework for this research was drawn based on equity theory (Adams,
1965), social exchange theory (P. Blau, 1968) and service dominant logic (Vargo &
Lusch, 2008) that links customer’s fairness perceptions to customer-firm relationship
development and citizenship behaviors. The foundation of the study’s conceptual
framework is based on the aforementioned theoretical underpinnings which led to the
comprehension, operationalization of and justifications behind service fairness
perceptions and the causal relationships between service fairness evaluations,
relationship marketing and customer citizenship behaviors of these broader theoretical
55
concepts. The results of many research studies built on these existing theories indicate
that service fairness strategies are important research considerations for a firm’s
relationship marketing efforts that benefits the firm by improving the value and quality
of customer-firm relationships and engendering customer citizenship behaviors.
Service fairness theory integrate features from Adams’ (1963) equity theory and
Greenberg’s (1990) theory of organizational justice and social exchange theory (P.
Blau, 1968). For the current study service fairness theory serves as a means for
understanding the relationships between customer judgments of service fairness on
their attitudes and behaviors. This theoretical base has also been used in many service
marketing literatures in the domain of tourism & hospitality (Shulga & Tanford, 2018),
health care (Liang et al., 2017), franchising (Kim, Shin, & Koo, 2018) and financial
establishments (Kaura, Durga Prasad, & Sharma, 2015). This includes (Roy, Shekhar,
Lassar, & Chen, 2018) who indicated service fairness perception served as a key driver
of determining customer willingness to engage with their service providers.
Equity theory explains consumers’ attitudinal outcomes regarding perceptions of
service fairness, argues that a higher degree of service fairness judgements is an
indicator of how much the service provider cares about the welfare of their customer.
When consumers evaluate that their expectations are fairly rewarded, they feel a strong
sense of connection which leads them to develop favorable attitudes regarding the
service provider and the service delivery as a whole. Moreover, favorable perception
about the service provider further engenders the customers’ needs for social affiliation
(Baumeister & Leary, 1995). Moreover, consumers tend to continue and develop their
relationship with service providers in expectation for fair play to get equitable benefits
in return for subjective costs incurred and to minimize their efforts in repeated service
encounters, and do so by furthering their relationship to maintain this status (e.g.,
Blader & Tyler, 2009). Researches on the conceptualization of service fairness have
predominantly focused on four important dimensions of service fairness: distributive
fairness, procedural fairness, interpersonal fairness and information fairness. (Colquitt,
2001, Greenberg, 1990). Distributive fairness refers to the equitable and equal
allocation of service outcomes to all customers throughout the service delivery process;
procedural fairness refers to the of formal procedures involved behind the production
and allocation of service outcomes; Interpersonal fairness refers to the interpersonal
56
treatment a customer receives from service provider during service interactions and,
informational fairness is the transparency and adequacy of information supplied during
service encounters. Customer perceptions about service fairness is proposed to predict
stronger relationships in terms of economic and non-economic bonds that consumer
wants to maintain because according to the control model of service fairness (Thibaut
& Walker, 1975), consumers who perceive that they have a greater control over their
service outcomes and have greater opportunities to express their views regarding
overall service delivery will feel strong bonding with their service provider.
Customer citizenship behaviors as an outcome of service fairness can be understood
through the theoretical lens of social exchange theory (Blau, 1968). According to social
exchange theory, consumers who experience higher degrees fairness believe that the
service provider cares about their welfare, as a result consumer tend to provide valuable
resources as a parallel exchange for fair treatment by showing their support to service
providers (Blau, 1964). Likewise, the relationships between higher degree of service
fairness and relationship value and relationship quality may also be explained based on
social exchange theory (Colquitt et al., 2001), social exchange framework has been
used to explain the positive effects service fairness perceptions, fair treatment by the
service provider results in socio-emotional gains which obligate consumers to build
quality relationships (Dyne et., 1994; Blau, 1964). Therefore, it is expected that using
social exchange framework customers would respond to higher degrees of fairness with
higher degrees of value, trust and commitment. Similarly, in a favorable social
exchange relationship customer can be expected to perform discretionary actions that
are valuable to service providers because to consumers commitment towards their
maintain their relationship ((Xanthopoulou, Bakker, Demerouti, & Schaufeli, 2009).
The study research model hypothesized that value and quality of a relationship are
critical links through which service fairness relate to customer engagement behaviors.
In other words, the more customers rate their service provider as fair in terms of
distribution, procedures, interactions and information in successive transactions during
service delivery the more they want to stay in relationship and feel obliged to favor
service providers by contributing voluntary behaviors. Applying equity theory (Adams,
1965), social exchange theory (P. M. Blau, 1964) and service dominant logic (Vargo &
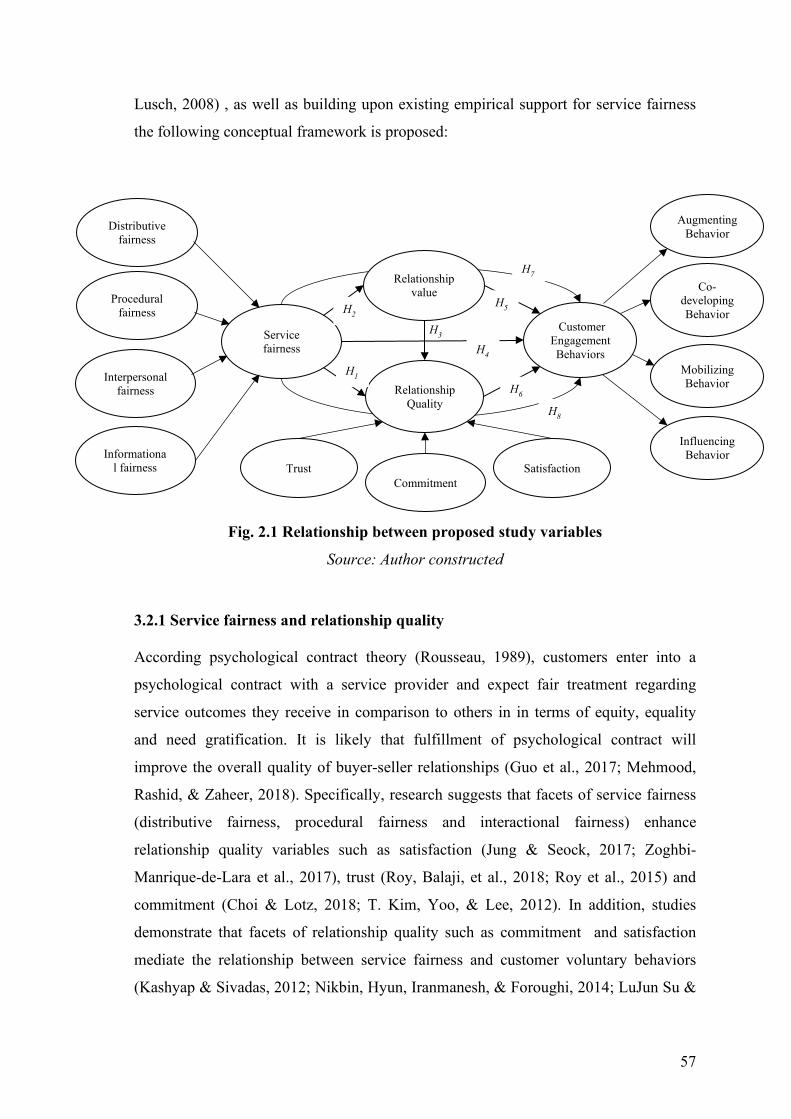
57
Lusch, 2008) , as well as building upon existing empirical support for service fairness
the following conceptual framework is proposed:
Fig. 2.1 Relationship between proposed study variables
Source: Author constructed
3.2.1 Service fairness and relationship quality
According psychological contract theory (Rousseau, 1989), customers enter into a
psychological contract with a service provider and expect fair treatment regarding
service outcomes they receive in comparison to others in in terms of equity, equality
and need gratification. It is likely that fulfillment of psychological contract will
improve the overall quality of buyer-seller relationships (Guo et al., 2017; Mehmood,
Rashid, & Zaheer, 2018). Specifically, research suggests that facets of service fairness
(distributive fairness, procedural fairness and interactional fairness) enhance
relationship quality variables such as satisfaction (Jung & Seock, 2017; Zoghbi-
Manrique-de-Lara et al., 2017), trust (Roy, Balaji, et al., 2018; Roy et al., 2015) and
commitment (Choi & Lotz, 2018; T. Kim, Yoo, & Lee, 2012). In addition, studies
demonstrate that facets of relationship quality such as commitment and satisfaction
mediate the relationship between service fairness and customer voluntary behaviors
(Kashyap & Sivadas, 2012; Nikbin, Hyun, Iranmanesh, & Foroughi, 2014; LuJun Su &
H3 Service fairness
Relationship Quality
Relationship value
Customer Engagement Behaviors
Interpersonal fairness
Procedural fairness
Distributive fairness
Trust Commitment
Satisfaction
Mobilizing Behavior
Co-developing Behavior
Augmenting Behavior
Influencing Behavior Informationa
l fairness
H7
H1
H2
H4
H5
H6 H8
58
Hsu, 2013; LuJun Su et al., 2017). More recently, service fairness was found to
enhance perceptions of trust, which ultimately drive customer engagement behavior
(Roy, Balaji, et al., 2018).
Other studies suggest that service fairness influence in and extra-role behaviors
indirectly e.g. (Choi & Lotz, 2018; Chou et al., 2016). While some researches have
examined the direct impact of service fairness on extra role behaviors e.g. (Cheng et al.,
2017; Roy, Shekhar, et al., 2018; Lujun Su et al., 2016; Zoghbi-Manrique-de-Lara et al.,
2017), these researches have mostly have overlooked a more immediate influence of
service fairness on relationship quality conceptualized as a higher order construct. This
study provides a closer perspective by investigating the overarching role of service
fairness in building relationship quality.
Building on principles of reciprocity, it is proposed that when consumers are fairly
treated by a service provider they will be obliged to react favorably towards the service
firm and will naturally consider their relationship worthwhile (Guo et al., 2017). In this
research, the quality relationships are referred to as the overall standard of relationship
between a service provider and its consumers (Hennig-Thurau, Gwinner, & Gremler,
2002). Relationship quality is a conceived as a unidimensional construct composed of
trust, satisfaction and commitment. In fact, past studies from service industries have
recommended that perceptions of fair service significantly enhance relationship quality
(Nikbin et al., 2016; LuJun Su et al., 2017). Therefore, it is proposed that service
fairness serve to improve perceptions of relationship quality.
Hypothesis 1: Service fairness is significantly related to relationship quality
3.2.2 The relationship between service fairness and relationship value
The notion of value is regarded a cornerstone element underlying buyer seller
relationships among practitioners and academicians (Guo et al., 2017; Saleem et al.,
2018). Customer positively evaluate the value of their relationship with a particular
service provider in expectation of fair returns of their efforts. The relationship between
service fairness and relationship value can be explained by social exchange theory
(Blau, 1964). In an exchange relationship parties involved expect to gain value in the
exchange by investing resources. Customers perceive higher value during exchange
relationship when benefits outweigh the sacrifices in comparison to others to obtain the
service from a service firm. Consumers do form fairness or unfairness judgments in that
59
they are likely to read the situation in terms of the potential to maximize personal
benefits or rewards and minimize their investments or losses (Peter & Olson, 1993).
Thus, during reciprocal exchange agreements, when firms consistently deliver value
through meeting customer expectations of fairness in terms of outcomes, procedures,
interpersonal treatment and information aimed at minimizing failure costs (time, effort,
money) and maximizing the utility of transactions for customers thus assisting
customers to stay in the relationship (Fazal E. Hasan et al., 2018; Hutchinson et al.,
2009; Omar et al., 2011). Relatively few studies have investigated the relationship
between service fairness and the customer’s perceived value (Ruiz-Molina et al., 2015).
Researchers (Hutchinson et al., 2009; Omar et al., 2011; Zhu & Chen, 2012) indicate
that service fairness is an important driver of perceived customer value. While (Chang
& Hsiao, 2008) suggested that perceived value can be enhanced by either increasing to
service fairness or by reducing risks associated with the purchase and use of the service.
Consistent with the evidence presented by previous researchers, it is possible to expect
that perceived service fairness would affect relationship value, thus it was suggested
that:
Hypothesis 2: Service fairness is significantly related with relationship value
3.2.3 Relationship value and relationship quality
Despite the lack of studies dealing relationship value from relationship marketing
perspective, only few studies provide insights into the relationship between relationship
value relationship quality. Research suggest that exchange relationship characterized by
superior value facilitates the process of building enduring intimate relationships that
engender trust and commitment between the consumer and the, creating emotional
bonds in relationship exchanges (Lai, 2014). For example, marketing researchers
maintain that customer positive evaluation of consumption value enhance satisfaction
and trust levels in the exchange relationship between partners (Jalilvand et al., 2017;
Yoong et al., 2017). In proposing a conceptual model of buyer-seller relationship,
(Balaji, 2014) articulates that relationship value acts as a direct antecedent of
relationship quality underling that consumers are more likely to build strong
relationship with a firm when they feel that they have received superior value during
exchange relationship relative to completion. In addition, (Jalilvand et al., 2017; Jin et
al., 2013; Moliner, Sánchez, Rodríguez, & Callarisa, 2007) argue that consumers judge
60
several facets of value during a relationship, and such value prepositions result in
increased levels of satisfaction, confidence, and commitment between exchange parties.
More recently, scholars found that value perceptions were found to improve elements
of relationship quality e.g. satisfaction, commitment and trust, which ultimately drive
relational outcomes indirectly (Balaji, 2014; Jalilvand et al., 2017). Moreover, (Moliner
et al., 2007) argue that perception of value can occur at pre or post purchase phases
during the course of the relationship, while relationship quality assessments,
particularly commitment and satisfaction, manifest after service consumption. It is
therefore proposed that relationship value contributes in improvement of relationship
quality perceptions.
Hypothesis 3; Relationship value significantly relates with relationship-quality
3.2.4 Service fairness and customer engagement behavior
Service fairness perceptions has been shown as central construct determining relational
responses from consumers (Giovanis et al., 2015; Jung & Seock, 2017; Roy, Balaji, et
al., 2018; Roy, Shekhar, et al., 2018). Similarly, extant studies have evaluated the direct
impact of service fairness perceptions on relational outcomes such as cooperative
behaviors, WOM and citizenship behaviors (Chao & Cheng, 2017; Lujun Su et al.,
2016; Zoghbi-Manrique-de-Lara et al., 2017). More recently, (Chao & Cheng, 2017;
Roy, Shekhar, et al., 2018) contend that the extent to which customers perceive they are
being treated fairly influences the extent to which they reciprocate with cooperative
behaviors. In social exchange relationships when customer evaluate fair treatment
received from a service provider in comparison to others they tend to give back and
care about the welfare of service provider by displaying positive behaviors in exchange.
Therefore, a strong perception of service fairness increases the level customer
engagement behaviors,
Hypothesis 4: Service fairness is significantly related to customer engagement behaviors
3.2.5 Relationship quality and customer engagement behavior
Extant researches have examined the influence that excellence buyer-seller
relationships has on customer extra-role behavioral e.g. (Balaji, 2014; Romero, 2017;
Wu et al., 2017). Research suggests that relationship quality enhance customer
engagement behaviors in favor of firm (Itani et al., 2019). Moreover, with stronger
61
sense of attachment with the firm, consumers have a strong predisposition to
reciprocate through engaging in more responsible behaviors towards the firm and the
welfare of other consumers (Chou et al., 2016; Finch et al., 2018). Several researches
have concluded that facets of relationship quality, such as trust, satisfaction, and
commitment are related to customer engagement behaviors such as word of mouth
recommendations, helping customers and the firm, and giving feedback (Chao &
Cheng, 2017; Jalilvand et al., 2017; Jung & Seock, 2017; Roy, Balaji, et al., 2018;
LuJun Su & Hsu, 2013; LuJun Su et al., 2017; Wei, Hua, Fu, & Guchait, 2017; Zoghbi-
Manrique-de-Lara et al., 2017). Since relationship quality is a multidimensional
concept which comprise of satisfaction, trust, and commitment.
Thus, how relationship quality influences customer engagement behaviors warrants
significant research considerations (Jaakkola & Alexander, 2014; Pansari & Kumar,
2017). Similarly, in a B2B relationship context (Youssef, Johnston, AbdelHamid,
Dakrory, & Seddick, 2018) show that relationship quality construct e.g. (satisfaction,
commitment, trust & involvement) has a relevant impact on customer engagement
represented by cognitive, attitudinal and behavioral dimensions. In addition,
consumers who believe that their relationship with the service provider is meaningful
are predicted to be more ardent advocates of their service providers and tend to spread
more positive WOM (Al-alak, 2014; Ng et al., 2011; LuJun Su et al., 2017). In fact,
past studies within hospitality industry has demonstrated that relationship quality with
service providers significantly influences customer involvement and positive word of
mouth (Fazal E. Hasan et al., 2017). Thus, it was proposed that:
Hypothesis 5: Relationship quality is significantly related to customer engagement behavior
3.2.6 Relationship value and customer engagement behavior
Many firms focus on building the economic side of relationships with customers to
enhance positive customer responses. According social exchange theory, evaluating the
utility of exchange relationship may influence the extent to which customers contribute
valuable resources towards the firm (Itani et al., 2019). In other words, customers
believe their sacrifice will gain appropriate returns compared to competitors, which
increases willingness to engage in voluntary, discretionary and helpful behaviors with
exception to purchase (Cheng, Luo, Yen, & Yang, 2016; Dang & Arndt, 2017; van
Doorn et al., 2010). As stated earlier, CEB is regarded as a key relational determinant
62
of consumer behavior (Jaakkola & Alexander, 2014; Pansari & Kumar, 2017; Roy,
Balaji, et al., 2018), it is very important that firms recognize that value and quality
aspects of a relationship are decisive in fostering customer engagement among
consumers. A stronger sense of value results in obligation and reciprocation among
consumers that emanate in the form of engaging in a more productive citizenship
behaviors that help the service firm (Balaji, 2014; Kashyap & Sivadas, 2012; Roy,
Balaji, et al., 2018). For example (Carlson, Rahman, Voola, & De Vries, 2018)
observed that stronger perceptions about value in a relationship lead tofavorable CEB
intentions in social media platforms. Prior studies (Cheng et al., 2016; Dang & Arndt,
2017; van Tonder & Petzer, 2018) provide empirical support and reveal that
relationship value is positively related to customer voluntary behaviors. Therefore,
study examine the direct link relationship value have on customer’s likelihood of
engagement behaviors in favor of the firm.
Hypothesis 6: Relationship value is significantly related to customer engagement behavior
3.2.7 Service fairness, relationship quality, customer engagement behavior
There is sufficient empirical evidence to support that relationship quality and its
dimensions in part mediate the relationship customer perception of service fairness and
relationship outcome variables e.g. citizenship behaviors and WOM. For example
(LuJun Su et al., 2017) provided empirical support how trust and satisfaction mediate
the linkage between service fairness and WOM intentions in hospitality and tourism
industry. Authors (Nikbin et al., 2016) provide evidence for mediating role of
relationship quality between service fairness and other behaviorally relevant outcomes
i.e. switching intention and customer performance. Researches (Jung & Seock, 2017;
Zoghbi-Manrique-de-Lara et al., 2017) report mediation through customer satisfaction,
affective commitment e.g. (Choi & Lotz, 2018) and trust e.g. (Roy, Balaji, et al., 2018)
between service fairness and customer extra role behaviors. Therefore, it is suggested
that customers reciprocate favorable engagement when they sense they are being
treated fairly and that formation of strong buyer-seller relationships will further
enhance link between service fairness and citizenship behaviors.
Hypothesis 7: Relationship quality mediate the link between service fairness and customer engagement behaviors
63
3.2.8 Service fairness, relationship value, customer engagement behavior
Customer derive superior value in a relationship when they form strong rational beliefs
about fair treatment received from a service provider relative to competitor. In other
words, customer’s extra role behaviors are reciprocated to help the firm based on
overall utility obtained from fair treatment during exchange relationships. Moreover,
customers actively strive to maximize their expected benefits and minimize their inputs
in expectation of fair returns (Fazal e Hasan, Lings, Neale, & Mortimer, 2014),
therefore to safeguard these goals they reinvest by making favorable contributions to
the firm and stay in the relationship in exchange for fair treatment (van Doorn et al.,
2010).
Prior research suggest that fairness or equity perceptions are related to value
perceptions and emotional and behavioral outcomes. For example (Zhu & Chen, 2012)
found that fairness had a more pronounced effect on perceived value when controlling
for the effect of trust in addition they found that customer perceived value mediate
between service fairness and satisfaction. Researchers (Hutchinson et al., 2009; Omar
et al., 2011) also provide empirical support for positive effects that service fairness had
on relationship value. More specifically, authors (Hutchinson et al., 2009) provide
empirical support on how perceived value mediate the link between justice perception
and customer recommendation behavior. Moreover, in recent a study (Dedeoglu et al.,
2018) argue that service-scape indirectly influences customer behavioral intentions
through evaluating emotional and novelty values, highlighting the importance of
communication and interactional aspects of service delivery on customer value and
subsequent behavioral outcomes e.g. (WOM and re-visit intention). Therefore, when
customers evaluate fairness in their service outcomes, they highly value their
relationship with a service provider and an engage in voluntary behaviors.
Hypothesis 8: Relationship value mediate the link between service fairness and customer engagement behaviors
3.3 Research paradigm
A research enquiry is guided by a set of beliefs, these set of beliefs or world view are
also referred to as research paradigms (Saunders & Lewis, 2018). A paradigm is a basic
belief system based on ontological, epistemological and methodological assumptions in
64
other words it is essentially as way of looking the world (Denzin & Lincoln, 2011;
Guba & Lincoln, 1994). These assumptions form the basis of choice about overall
research design (Creswell, 2003; Crotty, 1998).
3.3.1 Ontology
Ontology refers to beliefs about the nature of reality. In philosophical terms in refers to
the study of our existence and the fundamental nature of reality or being. Questions
related to ontology include (what exists? What is reality? What is true?) or the
assumption that what constitute valid knowledge? (Grunert, Khalifa, & Gmelin, 2004).
Ontology can further be classified into two perspectives; objectivism- which emphasize
on the object (organizations, its management, processes, policies and procedures) and
can operates independently from a social context (requiring no contextual reference)
while subjectivism- emphasize on the interdependence between organizations
(management, procedures, etc.) and the environment (social, political. Legal etc.)
within which it operates (Grunert et al., 2004). In agreement with objectivist ontology,
this study explored the relationship between a customer’s evaluations about service
fairness (distributive, procedural, informational and interpersonal fairness) received
from banking entities on their level of relationship with and citizenship behavior in
favor of these banking entities which can be exclusively examined without any context.
Service fairness, relationship marketing and citizenship behaviors are theoretical
concepts that exits within the service marketing literature that represents a consumer’s
objective reflections of reality. From an ontological perspective there are three
dominant perceptions of reality. (i.e. the belief that there is one reality, secondly that
there are multiple realities, thirdly that reality is constantly negotiated, debated or
interpreted) (Creswell, 2003; J. Wilson, 2010).
3.3.2 Epistemology
Epistemology and methodology are driven by ontological beliefs. Epistemology
examines the relationship between knowledge (what can be known) and the researcher
during discovery, in other words, how a researcher examine reality? Hence it involves
how the researcher arrived at knowing something what he knew? Hence the ontological
stance will determine the degree of objectivity in the relationship between what can be
known and the researcher would be? (J. Wilson, 2010). From an epistemological
65
perspective there are three dominant perceptions of how reality can be examined. (i.e.
firstly, that knowledge can be measured using reliable designs and tools, secondly that
knowledge need be interpreted to discover the underlying meaning, thirdly that
knowledge should be examined whatever tools are best suited to solve the problem). In
accordance with the objectives of the study, the researcher attempted to discover the
relationship among of service fairness, relationship marketing and citizenship behaviors
through operationalizing the aforementioned theoretical concepts quantitatively, and
objectively validating their measurement and discovering their interrelationships using
statistical techniques.
3.3.3 Methodology
Methodology refers to the discovery of knowledge in a systematic manner, unlike
epistemology methodology is more piratical and specific. A researchers ontological and
epistemological beliefs direct the use of appropriate methodology (N. Lee & Lings,
2008). Because methods such as surveys or interviews vary on their levels of
objectivity, as consequence a holistic view on how one understands knowledge can be
formed by combining ontology and epistemology also known as research paradigm
(Crotty, 1998, p. 28). Positivism, interpretivism and pragmatism are three common
views that underpin ontology and epistemology in social science research (Crotty,
1998; Denzin & Lincoln, 2005; Easterby-Smith, Thorpe, Jackson, & Jaspersen, 2018).
Combining perspectives from aforementioned theories, this study aimed to explore
empirically the impact of service fairness on customer engagement behaviors through
relationship marketing using quantitative and cross-sectional survey strategy. This
study administered questionnaire utilizing existing measures using stratified random
sampling technique.
3.3.4 Positivist paradigm of inquiry
Positivist paradigm of research assumes that there is one uniform, objective reality that
can be objectively assessed. This paradigm of inquiry investigates the facts and truth
regarding reality (Bryman, 2012). Because reality prevails which can be discovered
therefore within positivist paradigm the nature epistemology is objective (Creswell,
2003). The objectivity here means that in order to avert any influence on the outcomes
the researcher retains a distance from what is being discovered. Studies building on
positivism utilizes existing theories that provide the grounds for prediction and
66
explanation of phenomena. This paradigm incorporates manipulative or experimental
methodological designs where hypotheses testing and application of quantitative
methods are preferred (Brandimarte, 2011). Any influences that my hinder the results
of investigation are controlled through taking corrective measures.
In accordance with positivist paradigm, this study explored the relationship between
service fairness, relationship quality, relationship value and customer citizenship
behavior considered as constant realities that exist and are essentially common across
banking organizations which can be measured through objective means by deducting
hypothesis, operationalization of concepts to variables and rigorous testing through
statistical analysis (PLS-SEM). The issue of service fairness has also been explored
through positivists perspective by different researchers in the field of marketing with
the help of objective measures (Choi & Lotz, 2017; Giovanis et al., 2015; Roy, Balaji,
et al., 2018; Zoghbi-Manrique-de-Lara et al., 2017). According to (Brandimarte, 2011;
Guba & Lincoln, 1994) positivist paradigm is preferred when formal propositions can
easily be drawn from existing theories, quantifiable measures of variables are available
for hypothesis testing and inferences about underlying relationships can be drawn based
on adequate sample from a target population.
3.3.5 Realism
Realism and relativism are two strongly contrasting views of reality. Realism is the
ontological perspective within the quantitative or positivist paradigm of research (Feigl,
1943). Realists believe that reality is objective, its existence is guided by laws of
nature, reality is free from any frame of reference and therefore reality is independent
of any human behaviors, beliefs or theories it exists even of it is not discovered.
Realists believe in deterministic and reductionist approaches towards reality (Bryman,
2012). In lined with the methodology proposed earlier, the current study assumed a
realist perspective and believe that the aforementioned theoretical concepts and be
measured objectively with the help of quantitate measurements. Similarly, to determine
the inter-relationship among these constructs, no frame of reference is required.
3.3.6 Axiology
Axiology refers to what a researcher values throughout the research process (Grunert et
al., 2004). Service fairness is the basic foundation of marketing exchanges however this
67
has not been researched exclusively until recently. Therefore, the primary aim of this
study was to examine the essential role of service fairness in relationship building. In
order to address the stated research objective, the prevalence of this phenomena was
investigated through objective means without the intervention of the researcher.
3.4 Research design
The choice of research design generally defines the structure within and specifics with
which a study or studies will be carried out (Malhotra, 2010). A research design is
general plan which outlines how the researcher will go about answering these questions
(Saunders & Lewis, 2018). To make sure the study design fits the research questions
and accord positivist research paradigm, a theoretical framework was developed based
on extensive literature review from existing theories and relevant theoretical concepts
were subjected to measurement based on pre-valid scales adapted from relevant
researches. This study is exploratory nature where the purpose is to explore the
relationship between study variables, more specifically the purpose of this research was
prediction and theory development.
As part of its methodological approach, this research draws on a cross-sectional and
quantitative survey design. Before conducting empirical investigation, this research
employed validation and pre-testing procedures to ensure the validity and reliability of
estimates used. To predict the conceptual framework and hypotheses self-administered
questionnaire were used to collect self-reported responses from survey respondents
using stratified random sampling technique. After testing theoretical framework and
exploring the relationship between study variables the results were compared with
existing literature and conclusion and recommendation were drawn for banking sector.
3.4.1 Research approach
The choice of research paradigm has implications for the approach, design and strategy
of the research. The approach to conducting research is enshrined largely in two
streams of reasoning – inductive and deductive (Trochim, Donnelly, & Arora, 2016).
The extent to which the researcher is evident about the theory at the beginning of
his/her research raises an important question concerning the design of his/her research
project (Grunert et al., 2004). That is whether the research should use the deductive
68
approach, in which one can develop a theory and hypothesis (or hypotheses) and design
a research strategy to test the hypothesis, or the inductive approach, in which you
would collect data and develop a theory as a result of your data analysis (ibid.). These
streams have more simply been described as reasoning from the general to the specific,
i.e., from theory to practice (deduction); and from the specific to the general, i.e., from
practice to theory (induction) (Collis & Hussey, 2014). This research deducted
hypotheses based on a conceptual framework that was based on equity theory (Adams,
1965) social exchange theory (Blau, 1964), 1964) and service dominant logic (Vargo &
Lusch, 2008). The newly constructed (hypotheses) relationship were explored to further
understand the relationship between model constructs based on existing theories, which
therefore was a deductive approach. It is the dominant research approach in the social
sciences, where laws present the basis of explanation, allow the anticipation of
phenomena, predict their occurrence and therefore permit them to be controlled (Collis
& Hussey, 2014).
3.4.2 Research strategy
The survey strategy is usually associated with the deductive approach (Saunders &
Lewis, 2018). Survey is a popular and common strategy in business and management
research and is most frequently used to answer who, what, where, how much and how
many questions. It, therefore, tends to be used for exploratory and descriptive research.
The Surveys are popular as they allow the collection of a large amount of data from a
sizeable population in a highly economical way. They further argued that the survey
strategy permits the collection of quantitative data that can be analyzed using statistical
tools. In addition, the data collected using a survey strategy can be used to suggest
possible reasons for particular relationships between variables and to produce models
of these relationships. Using a survey strategy should give the researcher more control
over the research process and, when sampling is used, it is possible to generate findings
that are representative of the whole population at a lower cost than collecting the data
for the entire population. In this study, the survey strategy was employed that included
an initial pilot study in order to address the stated research questions. This research
utilized a pre-validated questionnaire as the survey instrument for gathering the data
(Collis & Hussey, 2014).
69
3.4.3 Research choice
Quantitative, qualitative and mixed methods are three research approaches for
conducting research in the field of social sciences (Bryman & Bell, 2015; Osborne,
2007). In compliance with the positivist paradigm and the objectives of the study, this
research uses a quantitative inquiry approach to address the objectives of the study.
Quantitative research relies on specific research questions, hypothesis and
operationalization of theoretical concepts requiring collection of numeric data from a
sizeable population using instruments having narrow questions to obtain measurable
and observable data on variables. After data collection specific variable hypothesis and
theoretical framework are analyzed using statistical procedures with the help of specific
statistical tools to interpret the results and draw conclusions.
3.4.4 Time horizon
This study was cross-sectional (i.e. data from each respondent was collected only one-
time using survey strategy) According to (Saunders & Lewis, 2018) cross-sectional
studies often employ the survey strategy.
3.4.5 Research context
Proper site selection is extremely important for successful theory evaluation. A variety
of important consideration such as relevance of unit of analysis, accessibility of data
and qualification of the organization should be considered to confirm the fitness of the
context (Nezu & Nezu, 2008). Before designing a study issues such as availability of
resources and adequate number of participants require significant attention (Easterby-
Smith et al., 2018). The banking sector in Pakistan is well-regulated, structured,
maintains a wide branch networks and has a larger customer base and is therefore
having a significant geographic presence across the country.
Given the fact that banking industry is under constant pressure for being accountable
and transparent to its customers yet banks account for the highest number of complaints
followed by hospitality and health sector (Nguyen & Klaus, 2013) similarly many
researches support the assertation that service fairness is more important than service
quality (Carr, 2007). In addition, banking sector in Pakistan is competitive, with
domestic and foreign plyers are competing each other to attract and maintain consumers
70
(Zameer et al., 2015) all these compelling reasons makes banking sector an ideal testing
ground for exploration and new theory development. The unit of analysis was therefore
banking consumers having an active bank account which were easily located in
different types of banks (Private, Public, Islamic, Foreign, Microcredit and
Specialized).
3.5 Data collection preparations
3.5.1 Instrumentation
In order to test the proposed theoretical relationship between service fairness, service
value, service quality and customer relationship existing measures were used to
estimate each construct. The survey instrument was developed based on well-validated
multi-item measures from previous studies. Each measure adapted for the current study
had more than 03 indicators per construct this was deliberated based on guidelines
provided by (Jörg Henseler, 2014) that recommend a median of 3.5 indicators for a
construct in a reflective model is suited for exploratory studies. Moreover, adhering to
the guidelines for mean approximation in hierarchical structural equation models,
service fairness was approximated as second-order construct comprising first order
constructs (distributive fairness, procedural fairness, interactional fairness and
information fairness), Relationship quality was approximated as second-order construct
comprising first order constructs (customer trust, customer satisfaction, and customer
commitment) and customer citizenship behavior approximated as (augmenting, co-
developing, influencing, mobilizing behaviors as its first order constructs). furthermore,
to suit the context of the study, slight wording modification were made to the measures.
Before estimating structural model, these measures were subjected to confirmatory
factor analysis in pilot testing stage (section 00). The items comprising each construct
were measured on 7-point Likert scales (strongly disagree=1; to strongly agree=7).
Seven-point Likert scales are generally preferred over five-point Likert scales because
it encompasses better psychometric properties (Leung, 2011). Since 7-point Likert
scales allow more variation in responses it produces more reliable and valid scores
during repeated measures (Lewis, 1993; Preston & Colman, 2000). The multi-item
measures adopted here from previous studies also considered using 7-point Likert items
because of its accurate validity and reliability scores. Seven-point Likert scales are
considered robust and more sensitive due to its ability to capture the true subjective

71
evaluations of survey respondents more accurately than five-point Likert scales
(Finstad, 2010). Table 3.1 provides details about operationalization of these
instruments e.g. conceptual, operational definitions, number of items with coding for
each construct and the authors from with the measures are sourced.
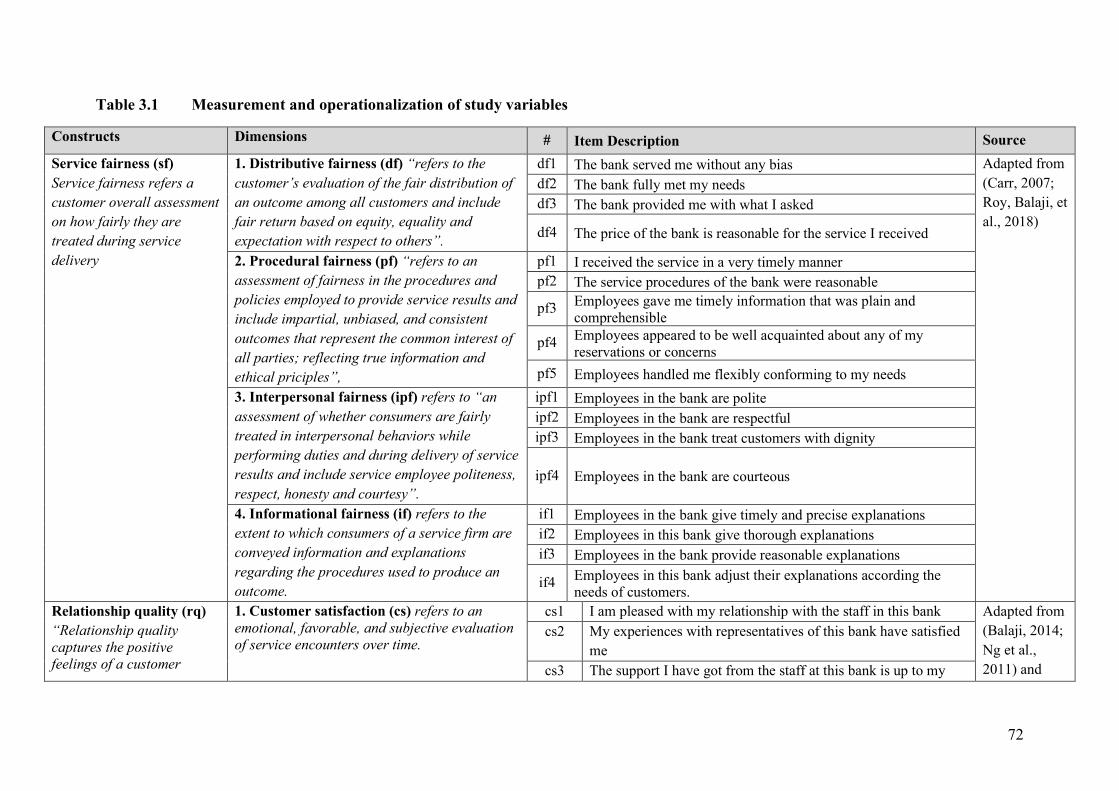
72
Table 3.1 Measurement and operationalization of study variables
Constructs Dimensions # Item Description Source Service fairness (sf) Service fairness refers a customer overall assessment on how fairly they are treated during service delivery
1. Distributive fairness (df) “refers to the customer’s evaluation of the fair distribution of an outcome among all customers and include fair return based on equity, equality and expectation with respect to others”.
df1 The bank served me without any bias Adapted from (Carr, 2007; Roy, Balaji, et al., 2018)
df2 The bank fully met my needs df3 The bank provided me with what I asked
df4 The price of the bank is reasonable for the service I received
2. Procedural fairness (pf) “refers to an assessment of fairness in the procedures and policies employed to provide service results and include impartial, unbiased, and consistent outcomes that represent the common interest of all parties; reflecting true information and ethical priciples”,
pf1 I received the service in a very timely manner pf2 The service procedures of the bank were reasonable
pf3 Employees gave me timely information that was plain and comprehensible
pf4 Employees appeared to be well acquainted about any of my reservations or concerns
pf5 Employees handled me flexibly conforming to my needs 3. Interpersonal fairness (ipf) refers to “an assessment of whether consumers are fairly treated in interpersonal behaviors while performing duties and during delivery of service results and include service employee politeness, respect, honesty and courtesy”.
ipf1 Employees in the bank are polite ipf2 Employees in the bank are respectful ipf3 Employees in the bank treat customers with dignity
ipf4 Employees in the bank are courteous
4. Informational fairness (if) refers to the extent to which consumers of a service firm are conveyed information and explanations regarding the procedures used to produce an outcome.
if1 Employees in the bank give timely and precise explanations if2 Employees in this bank give thorough explanations if3 Employees in the bank provide reasonable explanations
if4 Employees in this bank adjust their explanations according the needs of customers.
Relationship quality (rq) “Relationship quality captures the positive feelings of a customer
1. Customer satisfaction (cs) refers to an emotional, favorable, and subjective evaluation of service encounters over time.
cs1 I am pleased with my relationship with the staff in this bank Adapted from (Balaji, 2014; Ng et al., 2011) and
cs2 My experiences with representatives of this bank have satisfied me
cs3 The support I have got from the staff at this bank is up to my
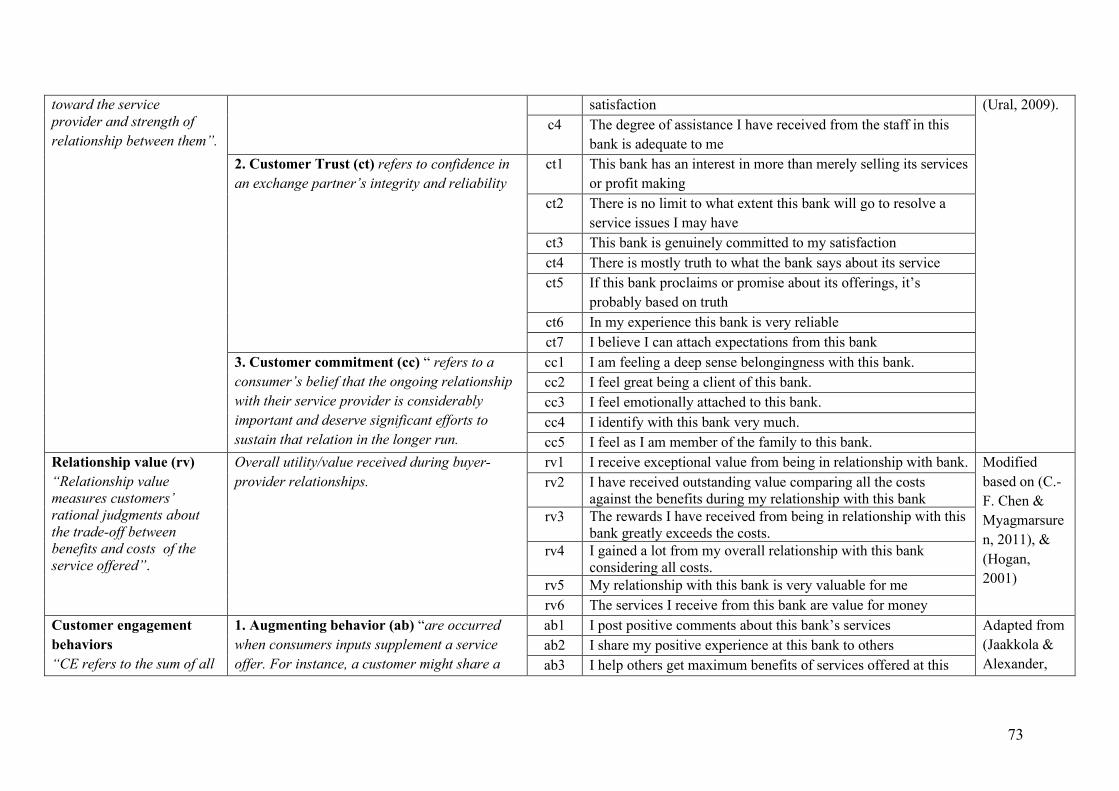
73
toward the service provider and strength of relationship between them”.
satisfaction (Ural, 2009).
c4 The degree of assistance I have received from the staff in this bank is adequate to me
2. Customer Trust (ct) refers to confidence in an exchange partner’s integrity and reliability
ct1 This bank has an interest in more than merely selling its services or profit making
ct2 There is no limit to what extent this bank will go to resolve a service issues I may have
ct3 This bank is genuinely committed to my satisfaction ct4 There is mostly truth to what the bank says about its service ct5 If this bank proclaims or promise about its offerings, it’s
probably based on truth ct6 In my experience this bank is very reliable ct7 I believe I can attach expectations from this bank
3. Customer commitment (cc) “ refers to a consumer’s belief that the ongoing relationship with their service provider is considerably important and deserve significant efforts to sustain that relation in the longer run.
cc1 I am feeling a deep sense belongingness with this bank. cc2 I feel great being a client of this bank. cc3 I feel emotionally attached to this bank. cc4 I identify with this bank very much. cc5 I feel as I am member of the family to this bank.
Relationship value (rv) “Relationship value measures customers’ rational judgments about the trade-off between benefits and costs of the service offered”.
Overall utility/value received during buyer-provider relationships.
rv1 I receive exceptional value from being in relationship with bank. Modified based on (C.-F. Chen & Myagmarsuren, 2011), & (Hogan, 2001)
rv2 I have received outstanding value comparing all the costs against the benefits during my relationship with this bank
rv3 The rewards I have received from being in relationship with this bank greatly exceeds the costs.
rv4 I gained a lot from my overall relationship with this bank considering all costs.
rv5 My relationship with this bank is very valuable for me rv6 The services I receive from this bank are value for money
Customer engagement behaviors “CE refers to the sum of all
1. Augmenting behavior (ab) “are occurred when consumers inputs supplement a service offer. For instance, a customer might share a
ab1 I post positive comments about this bank’s services Adapted from (Jaakkola & Alexander,
ab2 I share my positive experience at this bank to others ab3 I help others get maximum benefits of services offered at this
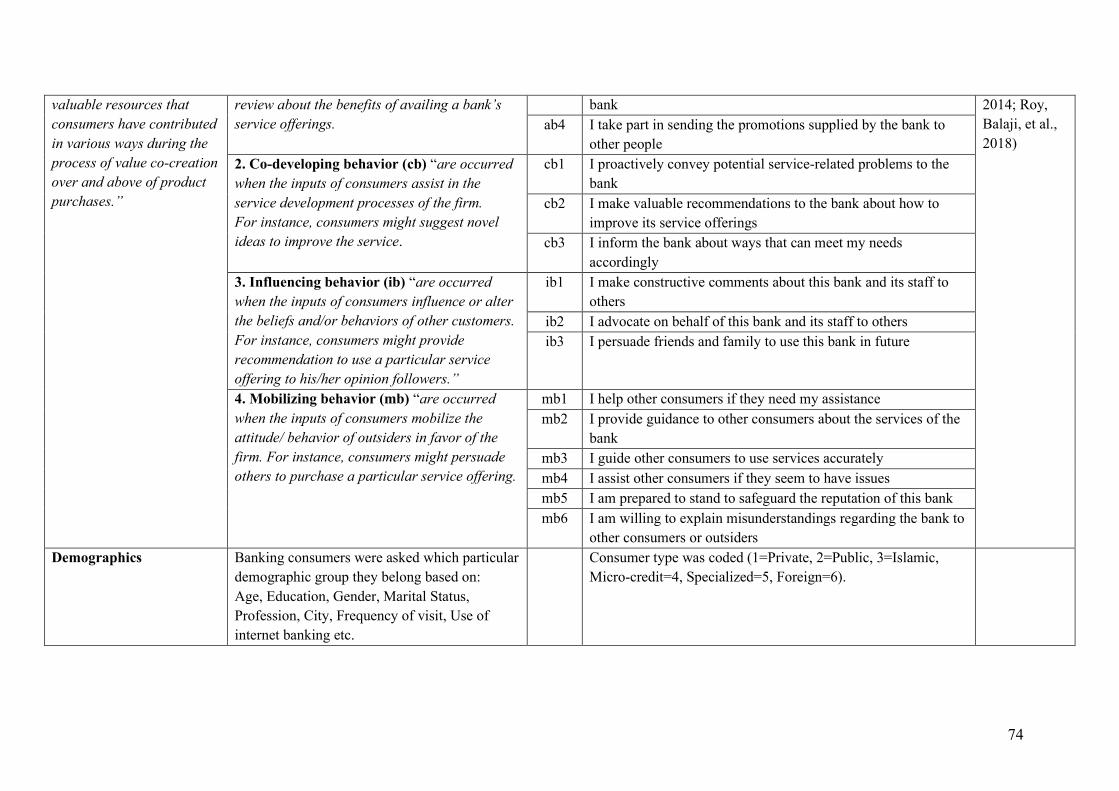
74
valuable resources that consumers have contributed in various ways during the process of value co-creation over and above of product purchases.”
review about the benefits of availing a bank’s service offerings.
bank 2014; Roy, Balaji, et al., 2018)
ab4 I take part in sending the promotions supplied by the bank to other people
2. Co-developing behavior (cb) “are occurred when the inputs of consumers assist in the service development processes of the firm. For instance, consumers might suggest novel ideas to improve the service.
cb1 I proactively convey potential service-related problems to the bank
cb2 I make valuable recommendations to the bank about how to improve its service offerings
cb3 I inform the bank about ways that can meet my needs accordingly
3. Influencing behavior (ib) “are occurred when the inputs of consumers influence or alter the beliefs and/or behaviors of other customers. For instance, consumers might provide recommendation to use a particular service offering to his/her opinion followers.”
ib1 I make constructive comments about this bank and its staff to others
ib2 I advocate on behalf of this bank and its staff to others ib3 I persuade friends and family to use this bank in future
4. Mobilizing behavior (mb) “are occurred when the inputs of consumers mobilize the attitude/ behavior of outsiders in favor of the firm. For instance, consumers might persuade others to purchase a particular service offering.
mb1 I help other consumers if they need my assistance mb2 I provide guidance to other consumers about the services of the
bank mb3 I guide other consumers to use services accurately mb4 I assist other consumers if they seem to have issues mb5 I am prepared to stand to safeguard the reputation of this bank mb6 I am willing to explain misunderstandings regarding the bank to
other consumers or outsiders Demographics Banking consumers were asked which particular
demographic group they belong based on: Age, Education, Gender, Marital Status, Profession, City, Frequency of visit, Use of internet banking etc.
Consumer type was coded (1=Private, 2=Public, 3=Islamic, Micro-credit=4, Specialized=5, Foreign=6).
75
3.5.2 Questionnaire translation into Urdu and pre-testing
Having selected the scales for to be used in the survey instrument development
(Appendix-A), taking into account the limited resources available for this study the
instrument was subsequently translated into Urdu, then back-translated and adjusted for
equivalence in line with the recommendations of (Brislin, 1970, 1986). The literature
(Dörnyei, Taguchi, & Taguchi, 2009; Forsyth, Kudela, Levin, Lawrence, & Willis,
2006) describes two approaches, which is adoption and adaptation to translate a survey
questionnaire. The adoption method is where the instrument to collect data is directly
translated from the original language to the targeted one regardless to the linguistic-
cultural nuances, which can impact the intended meaning of the question (Carrasco,
2003). In contrast to the adoption, the adaptation takes into account the cultural
differences to make the translated instrument suitable and appropriate (Hoffmeyer-
Zlotnik & Warner, 2014). Adaptation admits and answers for any differences that exist
crosswise languages.
Based on above guidelines the questionnaire was back-translated from English to Urdu
and then from Urdu by two relevant language experts, the retranslated version was then
compared with the original version., the instrument was subjected to further review by
two bilinguals fluent in English and Urdu languages for pre-testing the survey
instrument for biases. However, no substantial issues were detected with either
translation. Prior to commencing full data collection, the survey instrument was
subjected to two separate rounds of testing. The first round was focused chiefly on
evaluation of the instrument’s functionality, the second primarily on assessing the
instrument for comprehension/ease of understanding, completion time required, and for
cross-validation of adjustments made to the functionality following the first pre-test.
A convenience sample of n=6 (four university professors and two executives who were
grounded in the banking field) was selected to participate in the functionality test. Here,
each volunteer was requested to complete the survey with a focus on the functionality
of the instrument. Feedback provided by each participant in brief one-to-one sessions
reported few functionality issues relating to the consent, flow and grammar issues of
question. The instrument was adjusted and each issue was subsequently resolved. The
instrument was then tested for overall comprehension. Having selected a second
convenience sample (n=8, the translated instrument was handed over to 2 native Urdu
76
speaking assistant professors holding doctorate degrees, two lecturers and 4 banking
customers who participated voluntarily), each was briefed to complete the survey,
vetting it specifically for ease of comprehension, flow, duration and functionality.
Feedback indicated minor semantic issues with terminology and comprehension. On
average questionnaire took approximately 15 minutes to complete. 03 questions were
rephrased to improve comprehension, while the terminology issues were corrected,
with no further functionality issues identified, the translated survey instrument was
appropriate to effectively represent the source questionnaire (Appendix-B).
3.5.3 Theoretical framework validation
The research instrument used for empirical data collection was perfected on the basis of
a preliminary study comprising of two stages. The first stage involved a small number
of participants to pre-test the questionnaires in order to ensure that the questionnaire
had been appropriately designed for the intended participants. The second stage
involved a preliminary investigation to make sure that the scales used in the
questionnaire are reliable and support the validity of proposed theoretical model (Ruel,
Wagner, & Gillespie, 2016), and if the questionnaires worked as per its original intent
(Babin, Carr, Griffin, & Zikmund, 2012).
3.5.3.1 Questionnaire pre-testing
In order to ensure content validity, the initial survey instrument was reviewed by the
researcher, two (02) subject experts and four (04) relevant doctoral students to
comment on the representation and suitability. After reviewing contents of survey
instrument, edits and suggestions were incorporated into the pilot study. Although the
seven scales have already been peer-reviewed and branded as valid and reliable for
their specific purpose, a pilot study was necessary to further verify the reliability and
validity of the survey instrument as a whole—with all seven scales combined into one
instrument.
3.5.3.2 Questionnaire pilot testing
The objectives of the pilot study were to validate the survey instrument and to establish
model predictability. After pre-testing the research questionnaire confirming content
validity the questionnaire was pilot tested for face validity among cohorts and
77
colleagues. Face validity refers to “the subjective agreement among professionals that a
scale logically reflects the concept being measured” (Babin et al., 2012, p. 307), and is
normally established before the theory is tested using a confirmatory factor analysis
(CFA) (Joseph F. Hair, Black, Babin, & Anderson, 2019, p. 688). Based upon their
feedback formatting and layout improvements were incorporated. After checking for
face validity, the questionnaire was further tested on actual consumers of banking
services using convenience sampling technique to make sure they have no problems in
understanding or answering the questions and whether the instruction can clearly be
followed. These participants were excluded from the subsequent main study.
Each participant in the pilot survey received an invitation (Appendix-C) with
instructions (Appendix-D), a participation letter (Appendix-E), and the pilot survey
(Appendix-F). In addition to the survey, pilot participants were asked to provide
additional feedback on completion time, ambiguity, and difficulty (Appendix-G). The
additional section (Appendix-G) included open-ended questions for respondents to
comment on various aspects of the survey as a means to improve the questionnaire’s
overall quality. The Pilot survey was initiated on March, 2018 and ended on April,
2018. As a result of pilot survey one hundred & twenty (n=120) valid respondents were
collected using on site paper based self-administration of the questionnaire written in
both languages (English and Urdu), first the data collected was analyzed for functional
issues and respondent feedback was reviewed and integrated. and then it was subjected
to validity and reliability analysis as per guidelines outlined in section (3.5).
The responses collected (n=120) were examined in SmartPLS.3.2.6 which produced
good factor and model structure values conforming the PLS- SEM design (C. M.
Ringle, Sarstedt, & Straub, 2012). However, few items had poor reliability which
subsequently were dropped from the model (Appendix-H). Based on the pilot test
results (Appendix-H) the survey items were revised as necessary. Ambiguous, difficult,
or redundant questions were modified or discarded. The results of the pilot survey
helped establish internal consistency, reliability, face and content validity of the survey
instrument (Saunders & Lewis, 2018).
78
3.5.4 Main study
After addressing the issues reported in the preliminary survey the final questionnaire
was subjected to actual data collection. In this section, details about target population,
sample size, sampling strategy and data collection procedure was briefly outlined as
follows:
3.5.4.1 Research Population
According to (Saunders & Lewis, 2018), identification of a research population helps in
constructing a sampling frame which guides the determination of appropriate sample
for empirical data collection. A research population portrays the total number of
individuals from which a sample is to be derived (Bryman and Bell, 2007).
Furthermore, a population considers defining the exact number of subjects or objects
for sample selection (Collis & Hussey, 2014). The target population of study are all
bank consumers who have maintained an account with their bank for at least one year.
According to statistics and data warehouse department of the State Bank of Pakistan the
number of accounts of deposit holders in 2017 were N= 49,006,112 (4.9 billion) and in
2016 were N=46,491,242 (State Bank of Pakistan, 2017).
3.5.4.2 Sampling Frame
Once the research population has been identified, sampling frame needs be determined.
A sampling frame denotes the entire list total number of cases in a target population
(Saunders & Lewis, 2018). The sampling frame in many instances are retrieved from
valid databases therefore it is very crucial to accurately demarcate a sampling frame.
The sampling frame consist of all bank branches and their consumers (account holders)
across Pakistan. The unit of analysis was therefore individual consumers having an
active bank account. Further the banking consumers are grouped (stratified) based on
the type of banking consumers- i.e. consumers of public, private, specialized, foreign,
micro-finance and Islamic banking.
3.5.4.3 Sample Size
In accordance with the objectives of this study a pooled sample of n=1430 valid
responses from banking consumers were collected (n=240 from public, n=280 from
private, n=220 from specialized, n=240 from foreign, n=200 from micro-finance and
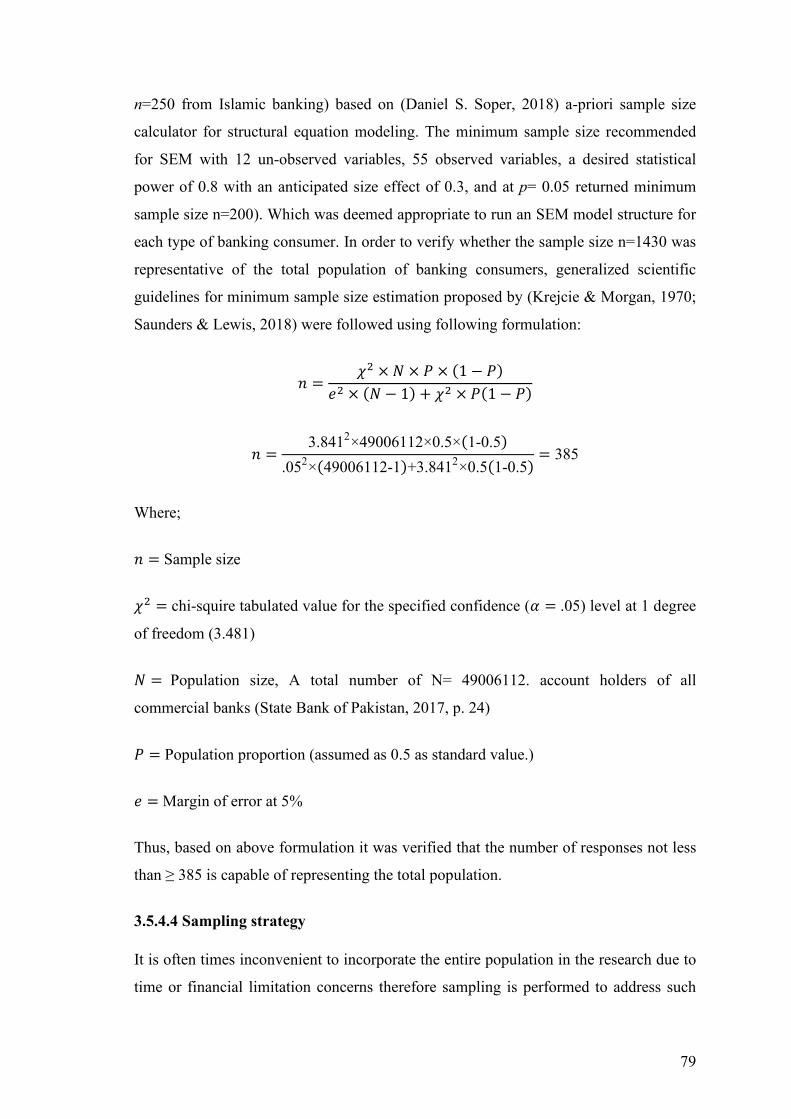
79
n=250 from Islamic banking) based on (Daniel S. Soper, 2018) a-priori sample size
calculator for structural equation modeling. The minimum sample size recommended
for SEM with 12 un-observed variables, 55 observed variables, a desired statistical
power of 0.8 with an anticipated size effect of 0.3, and at p= 0.05 returned minimum
sample size n=200). Which was deemed appropriate to run an SEM model structure for
each type of banking consumer. In order to verify whether the sample size n=1430 was
representative of the total population of banking consumers, generalized scientific
guidelines for minimum sample size estimation proposed by (Krejcie & Morgan, 1970;
Saunders & Lewis, 2018) were followed using following formulation:
𝑛𝑛 =𝜒𝜒2 × 𝑁𝑁 × 𝑃𝑃 × (1 − 𝑃𝑃)
𝑒𝑒2 × (𝑁𝑁 − 1) + 𝜒𝜒2 × 𝑃𝑃(1 − 𝑃𝑃)
𝑛𝑛 =3.8412×49006112×0.5×(1-0.5)
.052×(49006112-1)+3.8412×0.5(1-0.5)= 385
Where;
𝑛𝑛 = Sample size
𝜒𝜒2 = chi-squire tabulated value for the specified confidence (𝛼𝛼 = .05) level at 1 degree
of freedom (3.481)
𝑁𝑁 = Population size, A total number of N= 49006112. account holders of all
commercial banks (State Bank of Pakistan, 2017, p. 24)
𝑃𝑃 = Population proportion (assumed as 0.5 as standard value.)
𝑒𝑒 = Margin of error at 5%
Thus, based on above formulation it was verified that the number of responses not less
than ≥ 385 is capable of representing the total population.
3.5.4.4 Sampling strategy
It is often times inconvenient to incorporate the entire population in the research due to
time or financial limitation concerns therefore sampling is performed to address such
80
issues (Saunders & Lewis, 2018). A sample denotes a portion of the population that is
subjected to data collection and analysis (Bryman & Bell, 2015). Probability or
representative sampling and non-probability or judgmental sampling are two streams of
sampling techniques. Probability sampling includes drawing a random sample from the
target population in manner in which each unit has an equal chance of selection, this
sampling technique is intended to lower the sampling error to a minimum. Probability
sampling techniques are divided into simple random, systematic random, stratified
random, cluster and multistage sampling techniques. On the other hand, systematic or
non-probability sampling includes systematically drawing sample from the population
in a manner in which each unit does not have an equal chance of selection.
Convenience sampling, Quota sampling, purposive sampling, snowball sampling,
theoretical sampling are different techniques used for sample selection (Bryman & Bell,
2015; Saunders & Lewis, 2018).
In line with research design the current study adopted stratified purposive sampling
technique to gather data from the sampling frame. The sampling frame consisted of all
banking consumers which were first grouped (stratified) based on the type of banking
consumers (i.e. public, private, specialized, foreign, micro-finance and Islamic
banking) afterwards responses were collected from cases using random sampling
through on-site face-face contacts. Parallel with the objectives and subject to time and
resource constraints data collection was limited to consumers of banks branches
operating in five (05) provincial capital cities of Pakistan.
This geographic clustering was done because all the six different subgroups of banking
consumers are in higher concentration in capital cities as opposed to small cities and
therefore have largest number of branches and account holders. Purposive sampling
was selected because precise sampling frame was missing due to bank policy of not
disclosing consumer information as all such requests made for data to the banks were
refuted. This issue was compensated through; (1) increasing the sample size to n=1430,
(2) geographic clustering into 05 capital cities and (3) utilizing survey strategy. Since
the sample selection in this research was built on convenience sampling -A non-random
sampling technique that does not require precise sampling frame however in random
sampling, the exact sampling frame is a matter of concern (Saunders & Lewis, 2018).
Nonetheless, the scope of survey could have been extended to ten most populous cities
81
(i.e. increasing the sub-geographic area from 05 to 10) representing approx. 20% of
total population of Pakistan, however due to cost and time limitations and since
majority of bank branches including all six stratums are concentrated in capital cities
only, which therefore represent an adequate number of banking consumers.
3.5.4.5 Data collection procedure
Data was collected using on-site self-administered questionnaires during banking break
hours both inside and outside of the branch. Before administering the questionnaire,
access was negotiated with the branch managers stating the intent of the survey
sometimes the content of the questionnaire was briefly outlined to them. In fewer cases
personal contacts were utilized to gain access. Mostly data was collected personally and
sometimes with the help of collaborators of the researcher. After securing access,
respondents were handed over paper-based questionnaires along with introductory note
sheet explaining the purpose and intent of the study. Each responded type was accessed
using convenience sampling from six types of bank branches (public, private,
specialized, foreign, micro-finance, Islamic banking) within capital cities.
In order to address common method variance (CMV), the aim and intent of the study
was explained to respondents of the study verbally, afterwards they were handed over
an informed consent page in either language (English, Urdu) along with the survey
instrument wherein it was stated that their qualification for questions asked will not be
judged and there are no right or wrong answers to the questions. They were assured
about their anonymity and were asked to provide responses with honesty.
Questionnaires left incomplete and those handed over too quickly without interest were
discarded. Questionnaires were completed on behalf of respondents who were not
familiar with filling out surveys or who were not comfortable reading with either
language but were willing to participate.
The data collection process was completed over a course of six-weeks from July to
September 2018. A total 1740 respondents were contacted face-to-face from which 266
were either incomplete or unsuitable and therefore were discarded. The response rate
accounted was 84% because of face-to-face contact where respondent had minimal
chances declining for participating in the survey. As a result of data collection, the
82
remaining filled questionnaires were decoded in SPSS and were further subjected to
data cleaning.
3.6 Data analysis preparation
3.6.1 Introduction
Data analysis was performed using SMART PLS 3.2.7 (Joseph F. Hair, Hult, Ringle, &
Sarstedt, 2017), both group-specific and pooled sample data was evaluated using the
software’s inbuild PLS-SEM algorithm. PLS-SEM is preferred where the objective is
theory extension and prediction rather than theory testing and confirmation. PLS-SEM
is most suited in situations where sample sizes are small and theoretical models are
complex. Sharing similarities with CFA and regression, PLS-SEM provide accurate
prediction estimates across different models. Confirmatory factor analysis (CFA) and
structural paths analysis as illustrated in the model (Fig 2.) were analyzed using default
PLS-SEM algorithm settings. Path significance with both direct and indirect effects
were examined using PLS-SEM bootstrapping procedures (Hayes & Preacher, 2014).
Moreover, multigroup comparison analysis (MGA) using permutation procedure to
assess differences among group specific estimates (Joseph F. Hair et al., 2019).
Descriptive statistics were analyzed using SPSS 25 analytical software.
3.6.2 Structural equation modelling (SEM)
Structural equation modelling (SEM) is a second-generation multivariate analysis
technique used in the analysis of relationships between variables (Joseph F. Hair et al.,
2019, 2017). PLS-SEM can be defined as a causal modelling method aimed at
maximizing the explained variance of the dependent latent constructs (F. Hair Jr,
Sarstedt, Hopkins, & G. Kuppelwieser, 2014; Joseph F. Hair et al., 2017; C. Ringle,
Sarstedt, Mitchell, & Gudergan, 2018). SEM allows researchers to respond to a set of
the interrelated research question in a single, systematic, and comprehensive analysis
by modelling the relationship between multiple independent and dependent constructs
simultaneously. Marketing and other business disciplines have predominantly applied
PLS-SEM approach (C. Ringle et al., 2018). SEM started to appear in the marketing
literature in the early 1980s and its application has become the most prevalent
technique in recent years (Joseph F. Hair et al., 2017). SEM is used to empirically
examine the relationships between theoretical constructs in one analysis This technique
83
provides an effective way to determine the predictive relevance and sequence of
relationships among all constructs proposed under a theoretical model (Joseph F. Hair
et al., 2019). Every structural equation model consists of a measurement (outer) and a
structural (inner) model (Avkiran & Ringle, 2018) ; the former specifies (a) the
indicators for each construct used, and (2) assesses the reliability of each construct for
estimating the causal relationships” (Esposito Vinzi, 2010). The latter representing the
unobservable (cannot be measured directly) or latent variables because they are
theoretical concepts (Leeflang & Wittink, 2000). This allows for hypothesized and non-
observable relationships to be assessed and estimated (C. Ringle et al., 2018) based on
survey-sourced data. The inner model (structural model) consists of two types of
variables; exogenous and endogenous. A latent variable is qualified exogenous when
there is no other latent variable affecting it in the model. It is qualified as endogenous if
there is another (others) latent variable affecting it (it has at least one arrow that comes
from another LV) (Garson, 2016). PLS-SEM involves creating a path model between
Exogenous and Endogenous constructs and its indicators where it connects based on
theory and logic (Joseph F. Hair et al., 2017). Creating the path model is important to
distinguish the location of the constructs as well as the relationships between them
(figure 5.1).
In the case of this study, the model had four exogenous latent variables (Distributive,
Procedural, Interpersonal and Informational fairness). As no other variables predict the
other latent variables, they are exogenous latent variables. The outer models
(measurement model) need to be specified after the inner model is designed. This can
be done by making several decisions such as whether to use a multi-item or single item
scale (C. Ringle et al., 2018; Sarstedt, Diamantopoulos, & Salzberger, 2016) Two types
of indicators measure the Latent Variables (LV) in the outer models. The outer model
can be composed of Reflective or Formative LV or Mode A or Mode B respectively
(Cheah, Sarstedt, Ringle, Ramayah, & Ting, 2018; Hair et al., 2019). Reflectively
measured constructs differ from those that are formatively measured in that the
construct is said to cause the measurement items, or indicators, which in turn are
manifestations of the construct itself (Edwards and Bagozzi, 2000; Diamantopoulos and
Winklhofer, 2001).
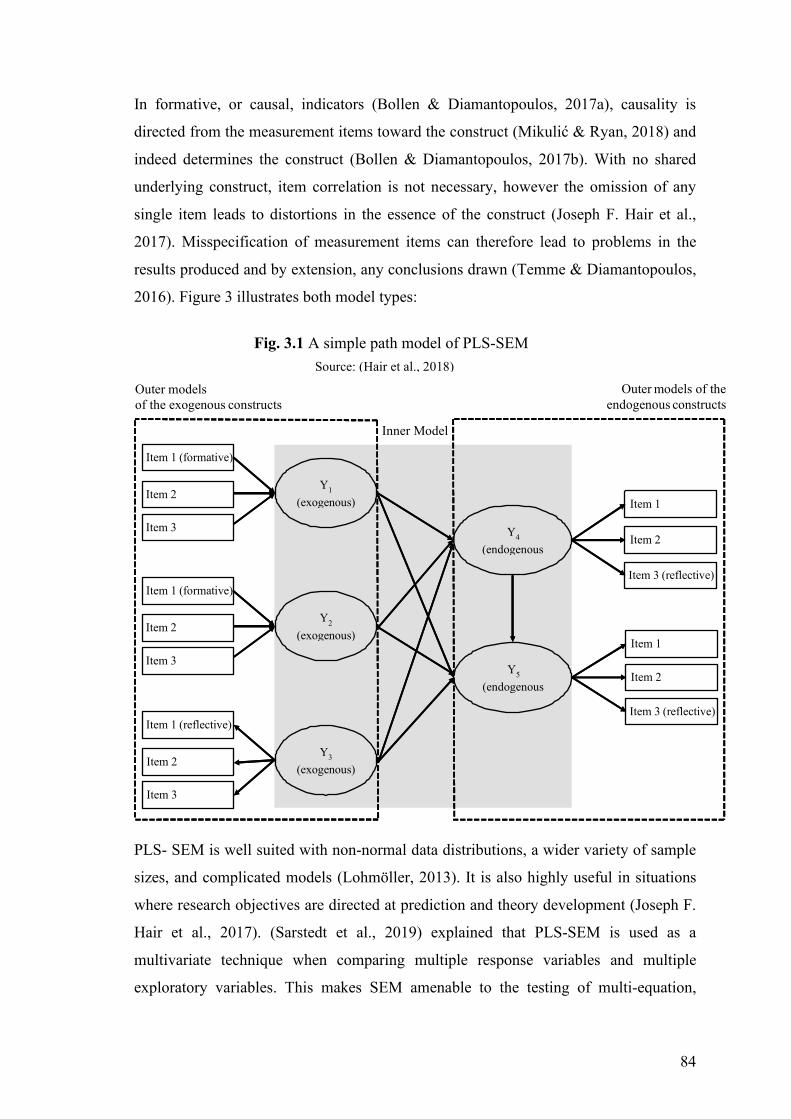
84
Source: (Hair et al., 2018)
In formative, or causal, indicators (Bollen & Diamantopoulos, 2017a), causality is
directed from the measurement items toward the construct (Mikulić & Ryan, 2018) and
indeed determines the construct (Bollen & Diamantopoulos, 2017b). With no shared
underlying construct, item correlation is not necessary, however the omission of any
single item leads to distortions in the essence of the construct (Joseph F. Hair et al.,
2017). Misspecification of measurement items can therefore lead to problems in the
results produced and by extension, any conclusions drawn (Temme & Diamantopoulos,
2016). Figure 3 illustrates both model types:
Fig. 3.1 A simple path model of PLS-SEM
PLS- SEM is well suited with non-normal data distributions, a wider variety of sample
sizes, and complicated models (Lohmöller, 2013). It is also highly useful in situations
where research objectives are directed at prediction and theory development (Joseph F.
Hair et al., 2017). (Sarstedt et al., 2019) explained that PLS-SEM is used as a
multivariate technique when comparing multiple response variables and multiple
exploratory variables. This makes SEM amenable to the testing of multi-equation,
Y1 (exogenous)
Y2 (exogenous)
Y3 (exogenous)
Y4 (endogenous
Y5 (endogenous
Outer models of the exogenous constructs
Inner Model
Outer models of the endogenous constructs
Item 1 (formative)
Item 2
Item 3
Item 1 (formative)
Item 2
Item 3
Item 1 (reflective)
Item 2
Item 3
Item 1
Item 2
Item 3 (reflective)
Item 1
Item 2
Item 3 (reflective)
85
multi-dependent relationship theories (Joseph F. Hair et al., 2019; Rigdon, Sarstedt, &
Ringle, 2017) also in situations where the processes for theory- testing are less
advanced (Jörg Henseler, Hubona, & Ray, 2017). Indeed, where mediator variables –
i.e. variables that essentially explain the presence of a relationship between an
independent and dependent variable (Baron & Kenny, 1986; Joseph F. Hair et al.,
2017) – are involved, the reliability-addressing capability of structural modelling
methods as noted by (Shmueli, Ray, Velasquez Estrada, & Chatla, 2016) and advocated
by (Baron & Kenny, 1986) are recommendable. Finally, while SEM is regarded as
confirmatory in nature it is apt to accommodating some exploratory attributes (Byrne,
2016).
3.6.3 Covariance-based and variance-based structural equation modelling SEM
SEM evaluation can be classified into to two types techniques, covariance based (CB)
and variance based partial least squares (PLS), each of which differ on a conceptual
level. The variance-based approach of PLS-SEM focus on predictive modeling and
theory development rather than theory testing or confirmation (Joe F Hair, Risher,
Sarstedt, & Ringle, 2018). PLS-SEM’s objective is to maximize prediction in the
dependent variables, rather than explain the co-variances of all of the indicators used in
a model (Hair Jr., Matthews, Matthews, & Sarstedt, 2017). PLS is best suited for
exploratory researches when alternative approach is needed to examine structural
models where the primary modeling objective is prediction not theory confirmation
(Joe F Hair et al., 2018; Joseph F. Hair et al., 2019). According to (Jörg Henseler et al.,
2017; Kline, 2016), PLS is similar to regression, but as a components-based structural
equation modeling technique, it can simultaneously model the structural and
measurement paths of complex model having multiple constructs and items. The PLS
algorithm supports weighted measurement of each indicator in how much it contributes
to the composite score of the latent variable (Jörg Henseler et al., 2017).
PLS-SEM approach is of importance for this study because the goal of present study is
invariably the extension (or further development) of theory as opposed to its testing and
confirmation- i.e. explore relationship between service fairness, firm's customer
relationship management efforts in predicting customer citizenship behaviors. In such
PLS-SEM is significantly more accommodating than CB-SEM since it estimates the
relationships in path models that minimize the residual variances of the endogenous
86
constructs while amplify endogenous variables’ path coefficients, i.e., PLS-SEM
generates loadings between reflective constructs and their indicators, standardize
regression coefficients between constructs, and coefficients of multiple determination
(R2) for dependent variables (S. Davcik, 2014). This furthermore satisfies the predictive
element of PLS that supports theory-building rather than testing and confirming
theories as in the case of CB-SEM (Hair et al., 2017). The covariance based SEM
variant is generally recommended for the testing, confirmation or comparison of
theories. It is also suited to situations where covariation in error terms is required for
instance and where non-recursive models are being tested. As suggested in numerous
studies, researchers have been drawn to the PLS-SEM approach because of its versatile
applicability suiting a wider range of situations, such as minimal demands on
measurement scales, sample size, and residual distribution (Joe F. Hair, Sarstedt,
Ringle, & Mena, 2012) The Partial Least Squares (PLS) method was used to test the
study hypotheses. Similar studies that demonstrated the impact of service fairness on
different attitudinal and behavioral outcomes have mostly utilized PLS-SEM approach
for testing their conceptual models. The current research also employed the Partial
Least Squares path modeling approach of structural equation modeling as its
methodological approach to assess the theoretical framework that examined the direct
and indirect linkage between service fairness and citizenship behaviors within banking
setting. The theoretical model of this research is built on equity, social exchange theory,
relationship marketing and value co-creation.
3.6.4 Rationale for using PLS-SEM
For a number of reasons, PLS-SEM was considered appropriate for addressing the
study’s objectives and research questions within the context of proposed theoretical
model. The purpose of this research was to investigate the linkages among service
fairness, relationship value, relationship quality and customer citizenship behavior i.e.
combining these constructs in a new light to develop theory (Joseph F. Hair et al., 2017;
Reinartz, Haenlein, & Henseler, 2009). To address this particular objective PLS-SEM
is highly suitable for its theory building capacities, prediction of target constructs and
the exploration and identification of relationships (Reinartz et al., 2009) such as those
in the present study (Giovanis et al., 2015; Roy, Balaji, et al., 2018). As illustrated in
the theoretical model (Fig. 2), Service fairness and Relationship value and quality are
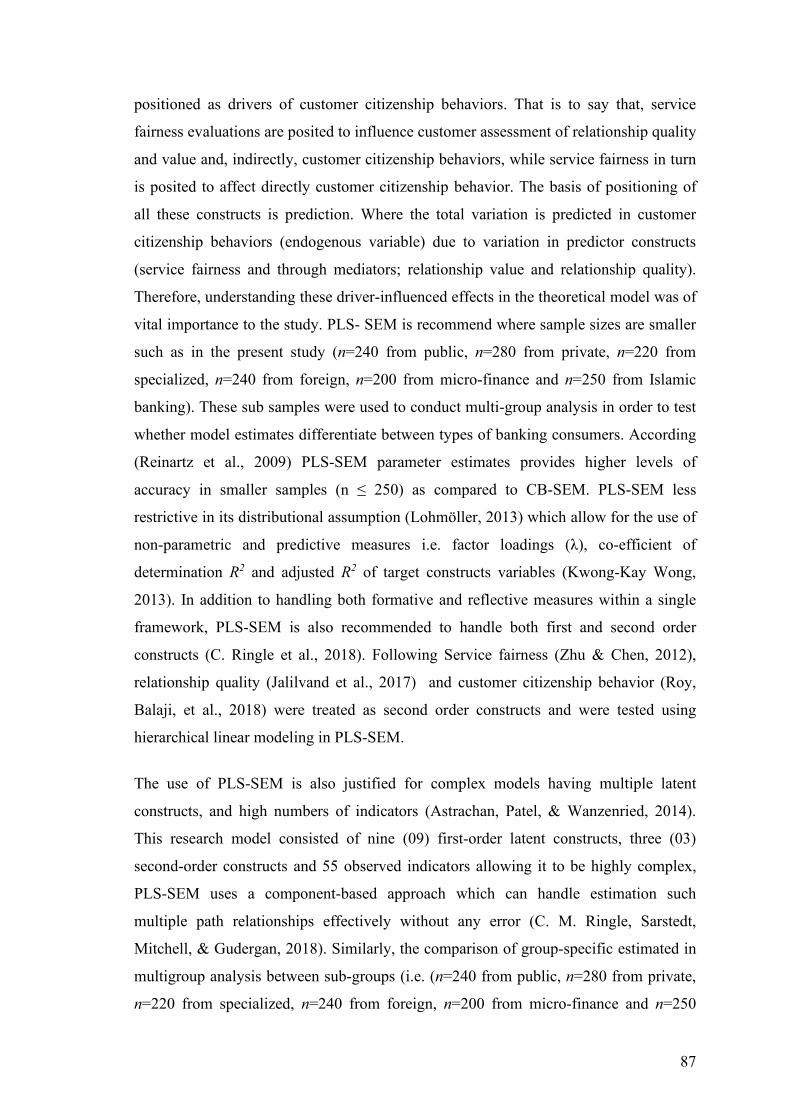
87
positioned as drivers of customer citizenship behaviors. That is to say that, service
fairness evaluations are posited to influence customer assessment of relationship quality
and value and, indirectly, customer citizenship behaviors, while service fairness in turn
is posited to affect directly customer citizenship behavior. The basis of positioning of
all these constructs is prediction. Where the total variation is predicted in customer
citizenship behaviors (endogenous variable) due to variation in predictor constructs
(service fairness and through mediators; relationship value and relationship quality).
Therefore, understanding these driver-influenced effects in the theoretical model was of
vital importance to the study. PLS- SEM is recommend where sample sizes are smaller
such as in the present study (n=240 from public, n=280 from private, n=220 from
specialized, n=240 from foreign, n=200 from micro-finance and n=250 from Islamic
banking). These sub samples were used to conduct multi-group analysis in order to test
whether model estimates differentiate between types of banking consumers. According
(Reinartz et al., 2009) PLS-SEM parameter estimates provides higher levels of
accuracy in smaller samples (n ≤ 250) as compared to CB-SEM. PLS-SEM less
restrictive in its distributional assumption (Lohmöller, 2013) which allow for the use of
non-parametric and predictive measures i.e. factor loadings (λ), co-efficient of
determination R2 and adjusted R2 of target constructs variables (Kwong-Kay Wong,
2013). In addition to handling both formative and reflective measures within a single
framework, PLS-SEM is also recommended to handle both first and second order
constructs (C. Ringle et al., 2018). Following Service fairness (Zhu & Chen, 2012),
relationship quality (Jalilvand et al., 2017) and customer citizenship behavior (Roy,
Balaji, et al., 2018) were treated as second order constructs and were tested using
hierarchical linear modeling in PLS-SEM.
The use of PLS-SEM is also justified for complex models having multiple latent
constructs, and high numbers of indicators (Astrachan, Patel, & Wanzenried, 2014).
This research model consisted of nine (09) first-order latent constructs, three (03)
second-order constructs and 55 observed indicators allowing it to be highly complex,
PLS-SEM uses a component-based approach which can handle estimation such
multiple path relationships effectively without any error (C. M. Ringle, Sarstedt,
Mitchell, & Gudergan, 2018). Similarly, the comparison of group-specific estimated in
multigroup analysis between sub-groups (i.e. (n=240 from public, n=280 from private,
n=220 from specialized, n=240 from foreign, n=200 from micro-finance and n=250
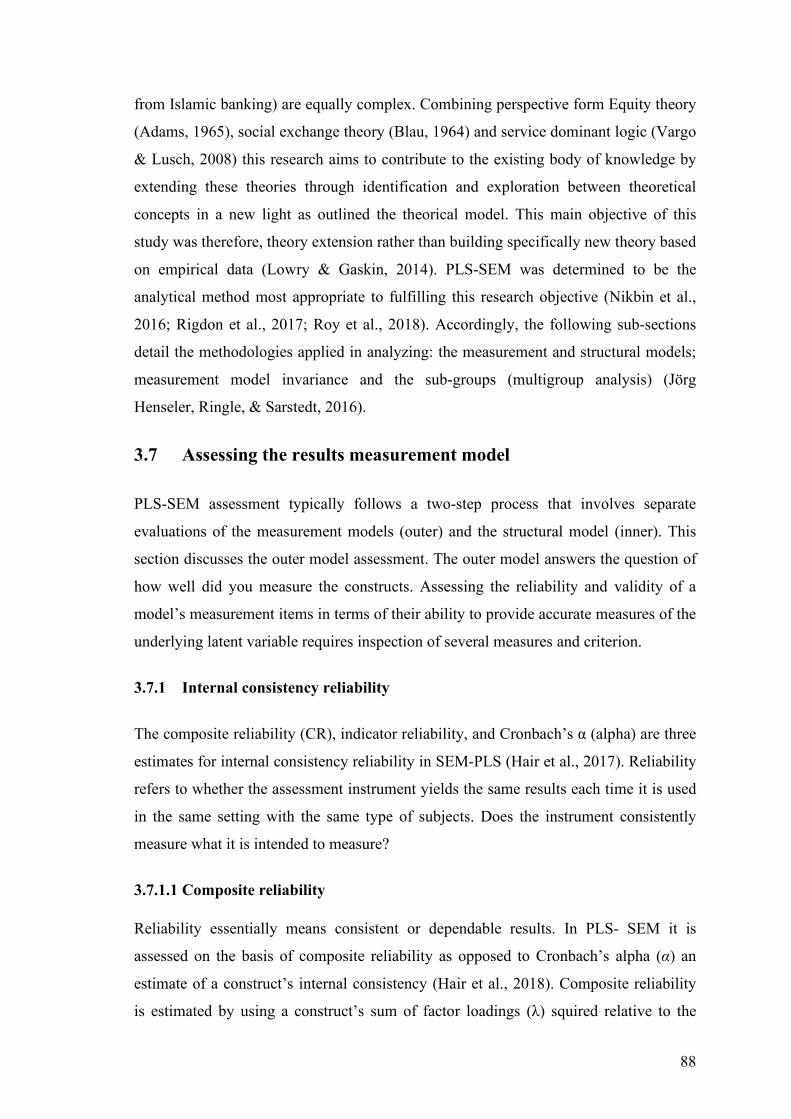
88
from Islamic banking) are equally complex. Combining perspective form Equity theory
(Adams, 1965), social exchange theory (Blau, 1964) and service dominant logic (Vargo
& Lusch, 2008) this research aims to contribute to the existing body of knowledge by
extending these theories through identification and exploration between theoretical
concepts in a new light as outlined the theorical model. This main objective of this
study was therefore, theory extension rather than building specifically new theory based
on empirical data (Lowry & Gaskin, 2014). PLS-SEM was determined to be the
analytical method most appropriate to fulfilling this research objective (Nikbin et al.,
2016; Rigdon et al., 2017; Roy et al., 2018). Accordingly, the following sub-sections
detail the methodologies applied in analyzing: the measurement and structural models;
measurement model invariance and the sub-groups (multigroup analysis) (Jörg
Henseler, Ringle, & Sarstedt, 2016).
3.7 Assessing the results measurement model
PLS-SEM assessment typically follows a two-step process that involves separate
evaluations of the measurement models (outer) and the structural model (inner). This
section discusses the outer model assessment. The outer model answers the question of
how well did you measure the constructs. Assessing the reliability and validity of a
model’s measurement items in terms of their ability to provide accurate measures of the
underlying latent variable requires inspection of several measures and criterion.
3.7.1 Internal consistency reliability
The composite reliability (CR), indicator reliability, and Cronbach’s α (alpha) are three
estimates for internal consistency reliability in SEM-PLS (Hair et al., 2017). Reliability
refers to whether the assessment instrument yields the same results each time it is used
in the same setting with the same type of subjects. Does the instrument consistently
measure what it is intended to measure?
3.7.1.1 Composite reliability
Reliability essentially means consistent or dependable results. In PLS- SEM it is
assessed on the basis of composite reliability as opposed to Cronbach’s alpha (α) an
estimate of a construct’s internal consistency (Hair et al., 2018). Composite reliability
is estimated by using a construct’s sum of factor loadings (λ) squired relative to the
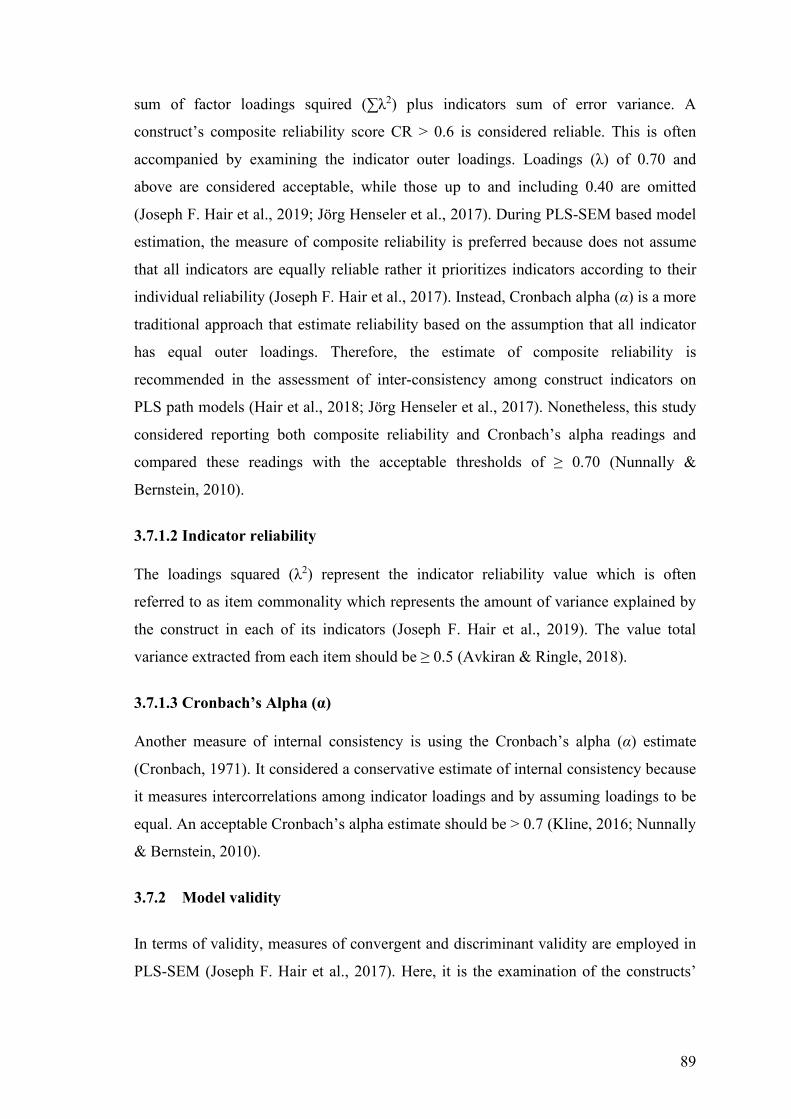
89
sum of factor loadings squired (∑λ2) plus indicators sum of error variance. A
construct’s composite reliability score CR > 0.6 is considered reliable. This is often
accompanied by examining the indicator outer loadings. Loadings (λ) of 0.70 and
above are considered acceptable, while those up to and including 0.40 are omitted
(Joseph F. Hair et al., 2019; Jörg Henseler et al., 2017). During PLS-SEM based model
estimation, the measure of composite reliability is preferred because does not assume
that all indicators are equally reliable rather it prioritizes indicators according to their
individual reliability (Joseph F. Hair et al., 2017). Instead, Cronbach alpha (α) is a more
traditional approach that estimate reliability based on the assumption that all indicator
has equal outer loadings. Therefore, the estimate of composite reliability is
recommended in the assessment of inter-consistency among construct indicators on
PLS path models (Hair et al., 2018; Jörg Henseler et al., 2017). Nonetheless, this study
considered reporting both composite reliability and Cronbach’s alpha readings and
compared these readings with the acceptable thresholds of ≥ 0.70 (Nunnally &
Bernstein, 2010).
3.7.1.2 Indicator reliability
The loadings squared (λ2) represent the indicator reliability value which is often
referred to as item commonality which represents the amount of variance explained by
the construct in each of its indicators (Joseph F. Hair et al., 2019). The value total
variance extracted from each item should be ≥ 0.5 (Avkiran & Ringle, 2018).
3.7.1.3 Cronbach’s Alpha (α)
Another measure of internal consistency is using the Cronbach’s alpha (α) estimate
(Cronbach, 1971). It considered a conservative estimate of internal consistency because
it measures intercorrelations among indicator loadings and by assuming loadings to be
equal. An acceptable Cronbach’s alpha estimate should be > 0.7 (Kline, 2016; Nunnally
& Bernstein, 2010).
3.7.2 Model validity
In terms of validity, measures of convergent and discriminant validity are employed in
PLS-SEM (Joseph F. Hair et al., 2017). Here, it is the examination of the constructs’
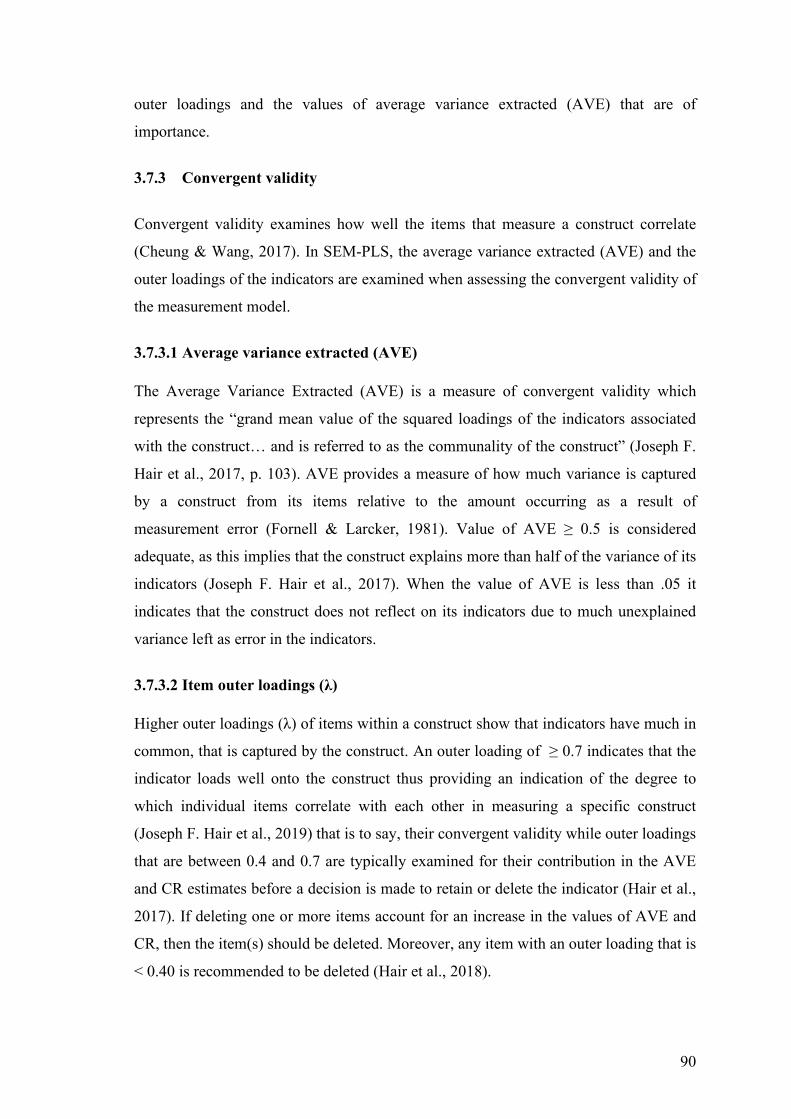
90
outer loadings and the values of average variance extracted (AVE) that are of
importance.
3.7.3 Convergent validity
Convergent validity examines how well the items that measure a construct correlate
(Cheung & Wang, 2017). In SEM-PLS, the average variance extracted (AVE) and the
outer loadings of the indicators are examined when assessing the convergent validity of
the measurement model.
3.7.3.1 Average variance extracted (AVE)
The Average Variance Extracted (AVE) is a measure of convergent validity which
represents the “grand mean value of the squared loadings of the indicators associated
with the construct… and is referred to as the communality of the construct” (Joseph F.
Hair et al., 2017, p. 103). AVE provides a measure of how much variance is captured
by a construct from its items relative to the amount occurring as a result of
measurement error (Fornell & Larcker, 1981). Value of AVE ≥ 0.5 is considered
adequate, as this implies that the construct explains more than half of the variance of its
indicators (Joseph F. Hair et al., 2017). When the value of AVE is less than .05 it
indicates that the construct does not reflect on its indicators due to much unexplained
variance left as error in the indicators.
3.7.3.2 Item outer loadings (λ)
Higher outer loadings (λ) of items within a construct show that indicators have much in
common, that is captured by the construct. An outer loading of ≥ 0.7 indicates that the
indicator loads well onto the construct thus providing an indication of the degree to
which individual items correlate with each other in measuring a specific construct
(Joseph F. Hair et al., 2019) that is to say, their convergent validity while outer loadings
that are between 0.4 and 0.7 are typically examined for their contribution in the AVE
and CR estimates before a decision is made to retain or delete the indicator (Hair et al.,
2017). If deleting one or more items account for an increase in the values of AVE and
CR, then the item(s) should be deleted. Moreover, any item with an outer loading that is
< 0.40 is recommended to be deleted (Hair et al., 2018).
91
3.7.4 Discriminant validity
The extent to which the items are indicative of a given construct and that the constructs
themselves uniquely differ from each other (Hair, et al., 2017) – evaluation of the
items’ cross loadings, the use of the Fornell-Larcker criterion (Fornell & Larcker, 1981)
criterion and incorporation of the more recently developed heterotrait- monotrait ratio
(HTMT) can be applied to assess discriminant validity.
3.7.4.1 Fornell-Larcker criterion
The Fornell-Larcker criterion which states that the square root of a construct’s AVE
should be higher than the highest correlations found with other constructs in the
measurement model (Fornell & Larcker, 1981). According to (Fornell & Larcker,
1981), the square root of AVE should be greater than the correlations among the
constructs; that is, the amount of variance shared between a latent variable and its block
of indicators should be greater than the shared variance between the latent variables.
3.7.4.2 Item cross loadings
While cross-loadings rely on indicators loading higher on their corresponding
constructs than on any other constructs, each indicator cross loading should load
highest on the construct it is intended to measure to satisfy the condition for
discriminant validity (Kline, 2016; Schreiber, Nora, Stage, Barlow, & King, 2006).
3.7.4.3 Heterotrait-Monotrait Ratio (HTMT)
In order to assess the discriminant validity, a comparison of the heterotrait-
heteromethod correlation and the monotrait-heteromethod correlations (HTMT) is able
to identify a lack of discriminant validity effectively instead of Fornell-Larcker
criterion and cross loadings (Jörg Henseler et al., 2017). An HTMT statistic between
two constructs is the ratio between the average of all pairwise correlation between
indicators of the two constructs and the average of all pairwise correlations within the
two constructs. The use of the heterotrait-monotrait (HTMT) is recommended in
assessing discriminant validity because cross loading assessment and the Fornell-
Larcker criterion more suitable with high sample sizes and heterogeneous loading
patterns and hence are incapable of detecting a lack of discriminant validity due to
unacceptably low sensitivity (Jörg Henseler et al., 2017) and (Joseph F. Hair et al.,
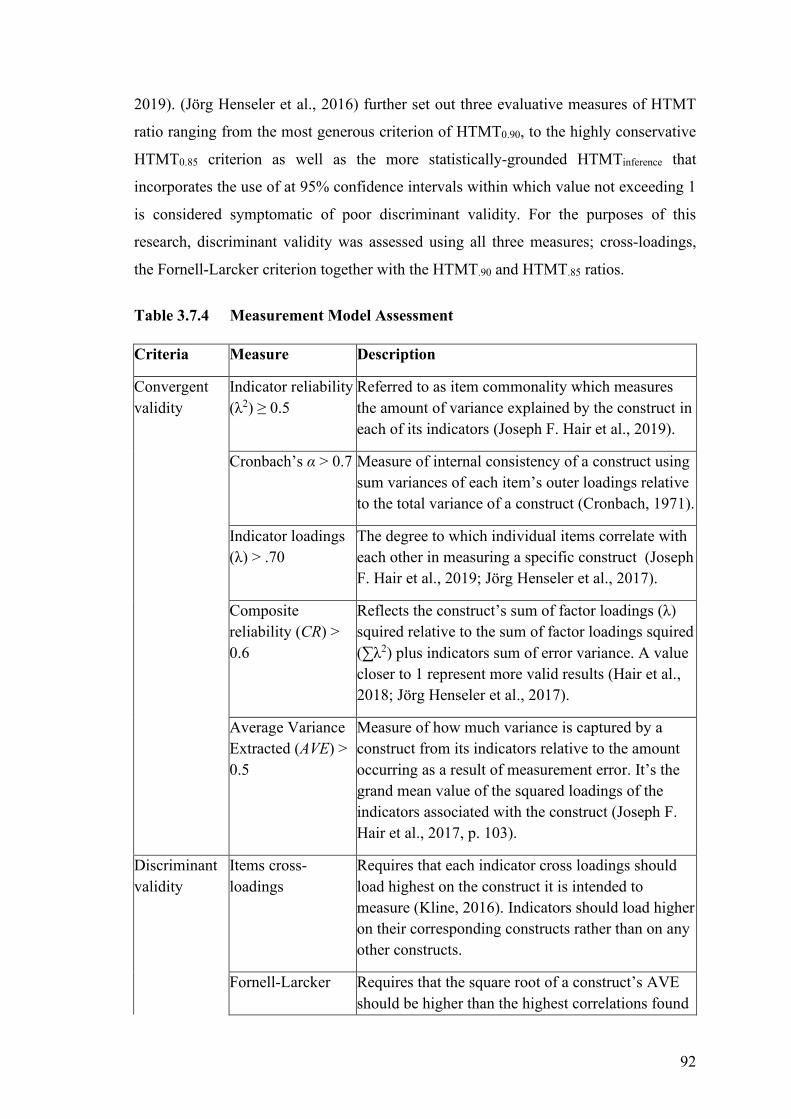
92
2019). (Jörg Henseler et al., 2016) further set out three evaluative measures of HTMT
ratio ranging from the most generous criterion of HTMT0.90, to the highly conservative
HTMT0.85 criterion as well as the more statistically-grounded HTMTinference that
incorporates the use of at 95% confidence intervals within which value not exceeding 1
is considered symptomatic of poor discriminant validity. For the purposes of this
research, discriminant validity was assessed using all three measures; cross-loadings,
the Fornell-Larcker criterion together with the HTMT.90 and HTMT.85 ratios.
Table 3.7.4 Measurement Model Assessment
Criteria Measure Description
Convergent validity
Indicator reliability (λ2) ≥ 0.5
Referred to as item commonality which measures the amount of variance explained by the construct in each of its indicators (Joseph F. Hair et al., 2019).
Cronbach’s α > 0.7 Measure of internal consistency of a construct using sum variances of each item’s outer loadings relative to the total variance of a construct (Cronbach, 1971).
Indicator loadings (λ) > .70
The degree to which individual items correlate with each other in measuring a specific construct (Joseph F. Hair et al., 2019; Jörg Henseler et al., 2017).
Composite reliability (CR) > 0.6
Reflects the construct’s sum of factor loadings (λ) squired relative to the sum of factor loadings squired (∑λ2) plus indicators sum of error variance. A value closer to 1 represent more valid results (Hair et al., 2018; Jörg Henseler et al., 2017).
Average Variance Extracted (AVE) > 0.5
Measure of how much variance is captured by a construct from its indicators relative to the amount occurring as a result of measurement error. It’s the grand mean value of the squared loadings of the indicators associated with the construct (Joseph F. Hair et al., 2017, p. 103).
Discriminant validity
Items cross-loadings
Requires that each indicator cross loadings should load highest on the construct it is intended to measure (Kline, 2016). Indicators should load higher on their corresponding constructs rather than on any other constructs.
Fornell-Larcker Requires that the square root of a construct’s AVE should be higher than the highest correlations found
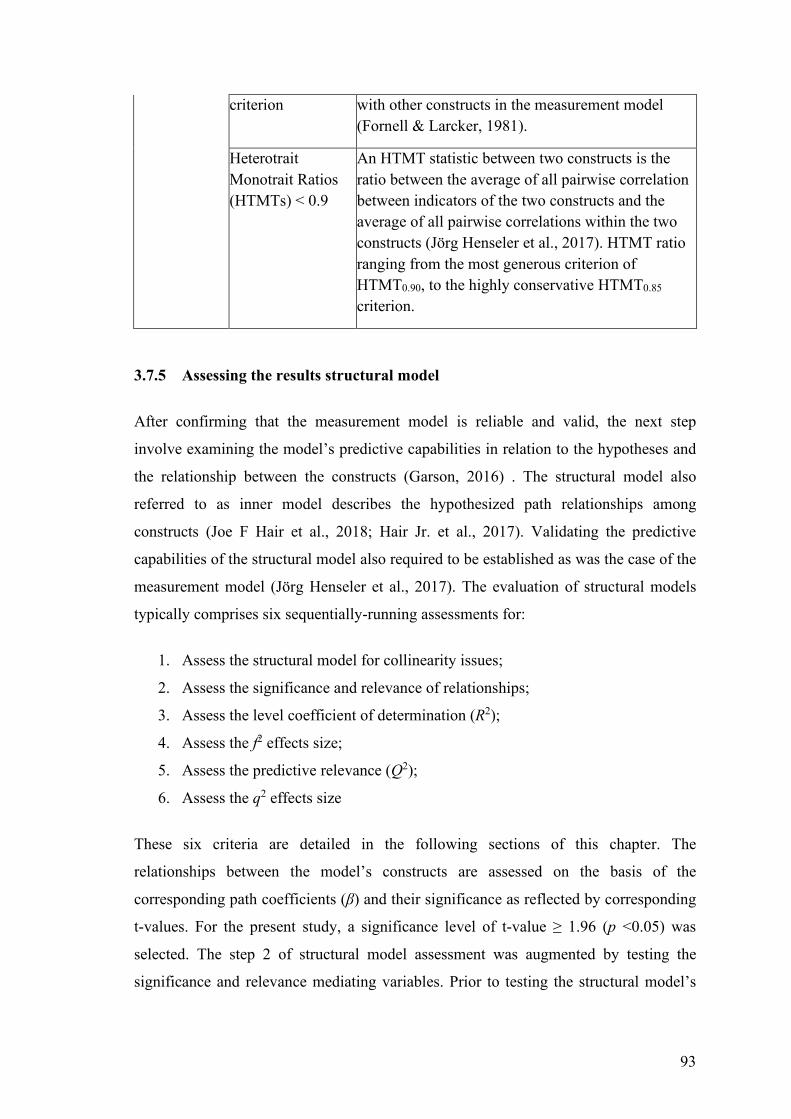
93
criterion with other constructs in the measurement model (Fornell & Larcker, 1981).
Heterotrait Monotrait Ratios (HTMTs) < 0.9
An HTMT statistic between two constructs is the ratio between the average of all pairwise correlation between indicators of the two constructs and the average of all pairwise correlations within the two constructs (Jörg Henseler et al., 2017). HTMT ratio ranging from the most generous criterion of HTMT0.90, to the highly conservative HTMT0.85 criterion.
3.7.5 Assessing the results structural model
After confirming that the measurement model is reliable and valid, the next step
involve examining the model’s predictive capabilities in relation to the hypotheses and
the relationship between the constructs (Garson, 2016) . The structural model also
referred to as inner model describes the hypothesized path relationships among
constructs (Joe F Hair et al., 2018; Hair Jr. et al., 2017). Validating the predictive
capabilities of the structural model also required to be established as was the case of the
measurement model (Jörg Henseler et al., 2017). The evaluation of structural models
typically comprises six sequentially-running assessments for:
1. Assess the structural model for collinearity issues;
2. Assess the significance and relevance of relationships;
3. Assess the level coefficient of determination (R2);
4. Assess the f2 effects size;
5. Assess the predictive relevance (Q2);
6. Assess the q2 effects size
These six criteria are detailed in the following sections of this chapter. The
relationships between the model’s constructs are assessed on the basis of the
corresponding path coefficients (β) and their significance as reflected by corresponding
t-values. For the present study, a significance level of t-value ≥ 1.96 (p <0.05) was
selected. The step 2 of structural model assessment was augmented by testing the
significance and relevance mediating variables. Prior to testing the structural model’s
94
significance and relevance, common method variance (CMV) and cross validation of
parameter estimates were performed.
3.7.5.1 Assessing the structural model for (multi) collinearity
The firsts step is evaluating the structural model for collinearity which refers to high
levels of correlation amongst variables. High collinearity may impact the structural
model as error rates may increase, resulting in an inaccurate estimation of the loadings
and subsequent path coefficient estimations (Joe F Hair et al., 2018). Multicollinearity
problem can be detected generally by employing two assessment methods. The initial
method requires assessment of the correlation matrix among predictor variables.
Multicollinearity issue persist when the common correlation coefficient between two
pairs of predictor variables exceeds > 0.9. afterwards the next method requires
examining the estimated VIF (variance inflation factor) values of predictor variables.
Models exhibiting VIF values of ≤ 3.3 and tolerance >0.20 are viewed as free of
common method bias (Hair et al., 2014). VIF values exceeding ≤ 3.3 threshold reflects
that predictor is having a stronger linear association between one or more predictor(s)
as a result of measurement error. VIF values may further be used, as in this study, to
test for common method bias; that is variance occurring as a result of the measurement
methods used as opposed to the variance in variables represented by the latent variables
(Podsakoff, Mackenzie, Lee, & Podsakoff, 2003).
To assess collinearity, both the tolerance level and the VIF values of the research model
were evaluated (Joe F Hair et al., 2018). After collinearity assessments the significance
of structural paths was tested using bootstrap procedure in Smart PLS. Bootstrapping
results may also be indicative of the relevance of specific relationships and the degree
to which the exogenous and endogenous variables are linked (Joe F Hair et al., 2018).
In this study, a subsample size of 5,000 was selected as default in all bootstrapping
procedures. Furthermore, in accordance with most empirical studies, to establish
significance of path coefficients the empirical t-value ≥ 1.96 with (p-value < 0.05) was
taken as an indication of significance at the 95% level of confidence.
3.7.5.2 Cross-validation of parameter estimate stability
To establish the validity and stability of the overall model, the model’s cross-validity
was confirmed through drawing a random sample from the dataset and then separately
95
running both samples to allow comparison between resultant estimations (Cepeda
Carrión, Henseler, Ringle, & Roldán, 2016; Yi & Nassen, 2015). The initial model is
estimated from about 70 percent of the observations in the left-out sample while the
extracted sample comprising 30 per cent of observations is then used for cross-
validation with the initial estimates. In addition, the model estimates of the extracted
sample are then compared with the common threshold values associated with
measurement and structural model (Diamantopoulos & Siguaw, 2009).
3.7.5.3 Assessing the model predictive power – coefficient of determination (R2)
The coefficient of determination (R2) is one of the primary criteria for model evaluation
that predict the amount of variance in the endogenous variable that is explained by
variance in the exogenous variable (s). Coefficient of determination (R2) is used to
assess the predictive power of constructs, in other words, how well one variable
predicts the outcome variable (Joseph F. Hair et al., 2019). The magnitude of R2 values
is used as a standard of models’ predictive accuracy (Field, 2009). The R2 values range
from 0 to 1 with higher levels indicating higher levels of predictive accuracy. R2 is an
overall effect size measure for the structural model. (Jörg Henseler & Chin, 2010). The
conclusion with regard to what degree of the coefficient’s magnitude is high is subject
driven. For example, marketing discipline regard R2=0.75 as high, while behavioral
sciences interpret R2=0.20 as high (Joseph F. Hair et al., 2019). As with multiple
regression, the adjusted coefficient of determination (R2adj) can be used as the criterion
to avoid bias toward complex models. This criterion is modified according to the
number of exogenous constructs relative to the sample size. The value is formally
defined as R2adj=1−(1−R2) × (n-1)/(n- k -1), where n is the sample size and k is the
number of exogenous latent variables used to predict the endogenous latent variable
under consideration. The R2adj value reduces the R2 value by the number of explaining
constructs and the sample size and thus systematically compensates for adding
nonsignificant exogenous constructs merely to increase the explained variance R2.
3.7.5.4 Assessing the f2 effect size
The effect size measures the change in R2 value of the overall model if a specific
exogenous variable is excluded, and is used to assess whether the omitted variable has a
substantive impact on the endogenous constructs. The effect size is computed as the
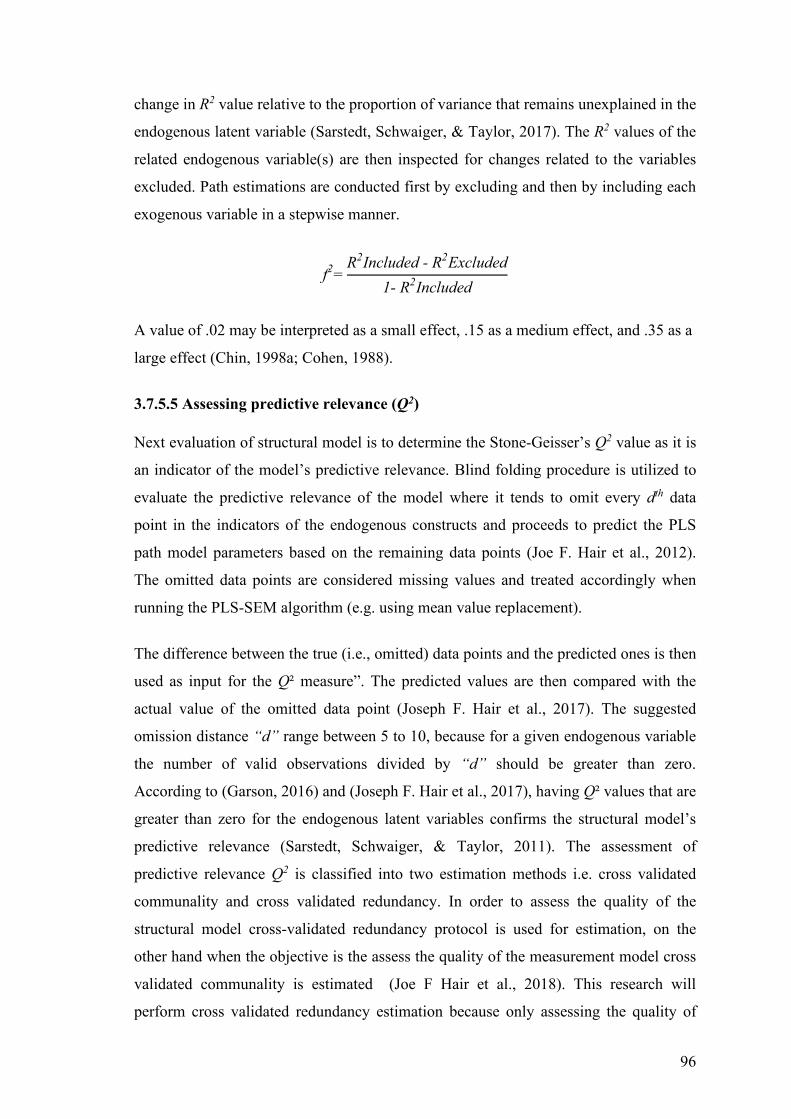
96
change in R2 value relative to the proportion of variance that remains unexplained in the
endogenous latent variable (Sarstedt, Schwaiger, & Taylor, 2017). The R2 values of the
related endogenous variable(s) are then inspected for changes related to the variables
excluded. Path estimations are conducted first by excluding and then by including each
exogenous variable in a stepwise manner.
f2=R2Included - R2Excluded
1- R2Included
A value of .02 may be interpreted as a small effect, .15 as a medium effect, and .35 as a
large effect (Chin, 1998a; Cohen, 1988).
3.7.5.5 Assessing predictive relevance (Q2)
Next evaluation of structural model is to determine the Stone-Geisser’s Q2 value as it is
an indicator of the model’s predictive relevance. Blind folding procedure is utilized to
evaluate the predictive relevance of the model where it tends to omit every dth data
point in the indicators of the endogenous constructs and proceeds to predict the PLS
path model parameters based on the remaining data points (Joe F. Hair et al., 2012).
The omitted data points are considered missing values and treated accordingly when
running the PLS-SEM algorithm (e.g. using mean value replacement).
The difference between the true (i.e., omitted) data points and the predicted ones is then
used as input for the Q² measure”. The predicted values are then compared with the
actual value of the omitted data point (Joseph F. Hair et al., 2017). The suggested
omission distance “d” range between 5 to 10, because for a given endogenous variable
the number of valid observations divided by “d” should be greater than zero.
According to (Garson, 2016) and (Joseph F. Hair et al., 2017), having Q² values that are
greater than zero for the endogenous latent variables confirms the structural model’s
predictive relevance (Sarstedt, Schwaiger, & Taylor, 2011). The assessment of
predictive relevance Q2 is classified into two estimation methods i.e. cross validated
communality and cross validated redundancy. In order to assess the quality of the
structural model cross-validated redundancy protocol is used for estimation, on the
other hand when the objective is the assess the quality of the measurement model cross
validated communality is estimated (Joe F Hair et al., 2018). This research will
perform cross validated redundancy estimation because only assessing the quality of
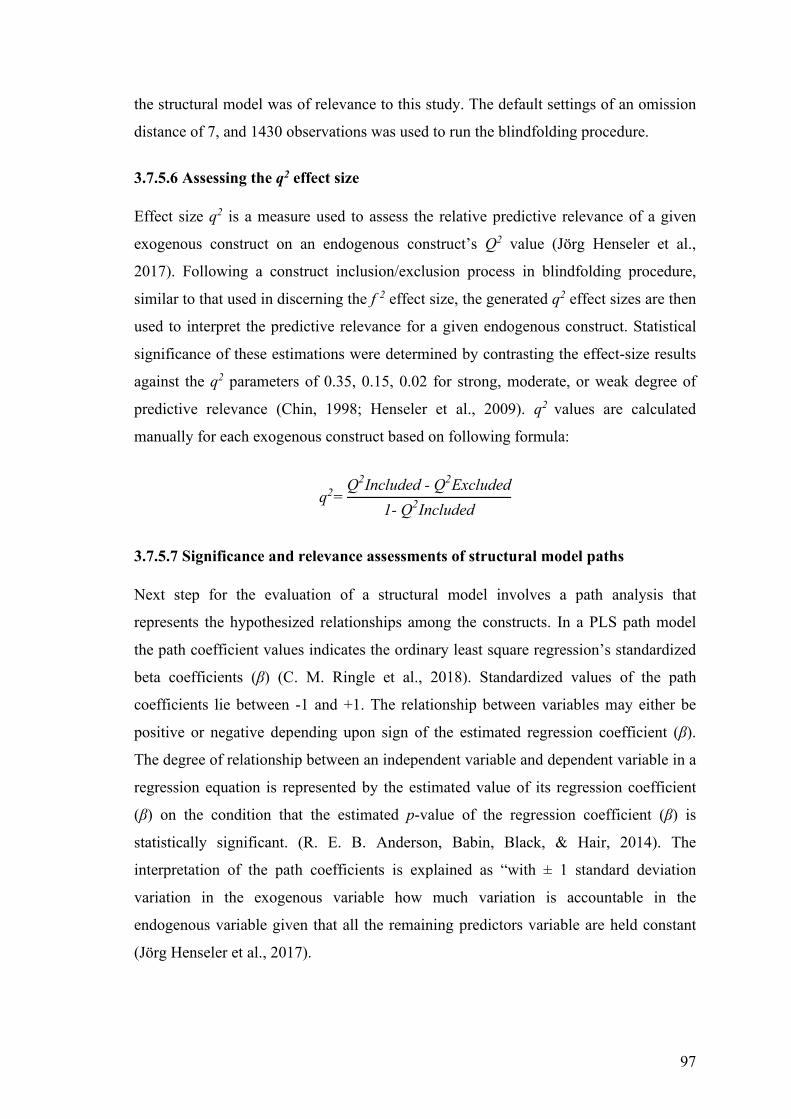
97
the structural model was of relevance to this study. The default settings of an omission
distance of 7, and 1430 observations was used to run the blindfolding procedure.
3.7.5.6 Assessing the q2 effect size
Effect size q2 is a measure used to assess the relative predictive relevance of a given
exogenous construct on an endogenous construct’s Q2 value (Jörg Henseler et al.,
2017). Following a construct inclusion/exclusion process in blindfolding procedure,
similar to that used in discerning the f 2 effect size, the generated q2 effect sizes are then
used to interpret the predictive relevance for a given endogenous construct. Statistical
significance of these estimations were determined by contrasting the effect-size results
against the q2 parameters of 0.35, 0.15, 0.02 for strong, moderate, or weak degree of
predictive relevance (Chin, 1998; Henseler et al., 2009). q2 values are calculated
manually for each exogenous construct based on following formula:
q2=Q2Included - Q2Excluded
1- Q2Included
3.7.5.7 Significance and relevance assessments of structural model paths
Next step for the evaluation of a structural model involves a path analysis that
represents the hypothesized relationships among the constructs. In a PLS path model
the path coefficient values indicates the ordinary least square regression’s standardized
beta coefficients (β) (C. M. Ringle et al., 2018). Standardized values of the path
coefficients lie between -1 and +1. The relationship between variables may either be
positive or negative depending upon sign of the estimated regression coefficient (β).
The degree of relationship between an independent variable and dependent variable in a
regression equation is represented by the estimated value of its regression coefficient
(β) on the condition that the estimated p-value of the regression coefficient (β) is
statistically significant. (R. E. B. Anderson, Babin, Black, & Hair, 2014). The
interpretation of the path coefficients is explained as “with ± 1 standard deviation
variation in the exogenous variable how much variation is accountable in the
endogenous variable given that all the remaining predictors variable are held constant
(Jörg Henseler et al., 2017).
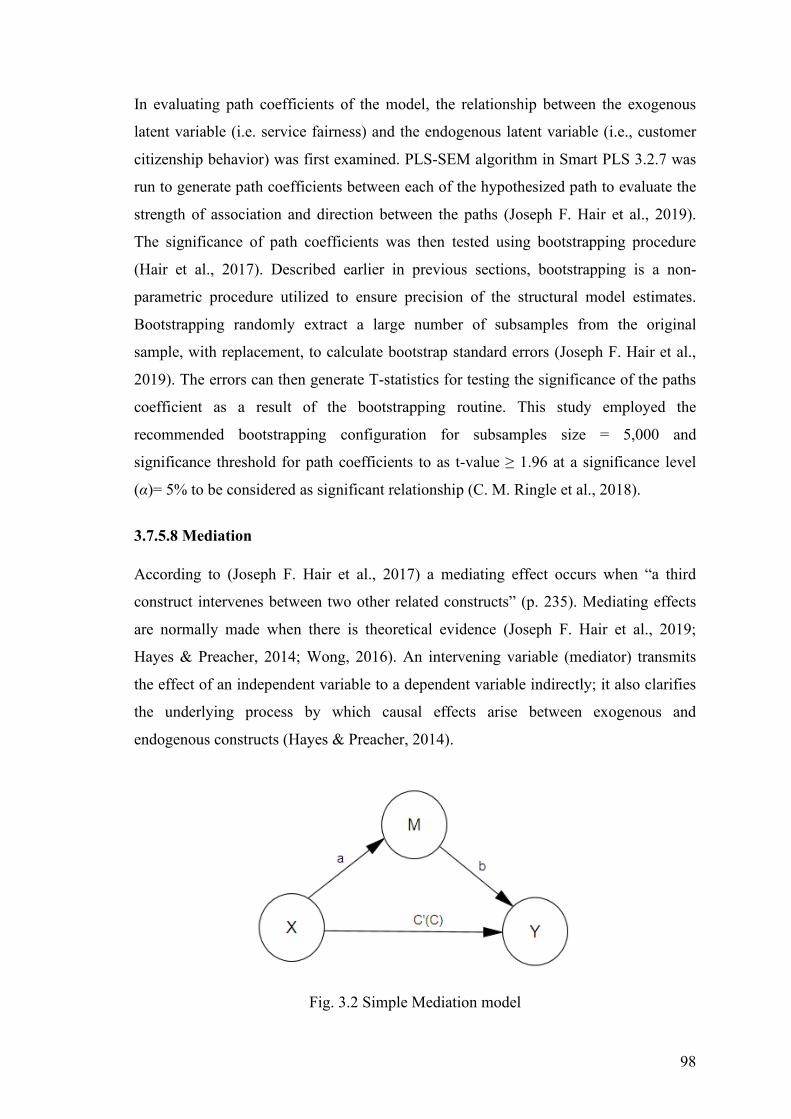
98
In evaluating path coefficients of the model, the relationship between the exogenous
latent variable (i.e. service fairness) and the endogenous latent variable (i.e., customer
citizenship behavior) was first examined. PLS-SEM algorithm in Smart PLS 3.2.7 was
run to generate path coefficients between each of the hypothesized path to evaluate the
strength of association and direction between the paths (Joseph F. Hair et al., 2019).
The significance of path coefficients was then tested using bootstrapping procedure
(Hair et al., 2017). Described earlier in previous sections, bootstrapping is a non-
parametric procedure utilized to ensure precision of the structural model estimates.
Bootstrapping randomly extract a large number of subsamples from the original
sample, with replacement, to calculate bootstrap standard errors (Joseph F. Hair et al.,
2019). The errors can then generate T-statistics for testing the significance of the paths
coefficient as a result of the bootstrapping routine. This study employed the
recommended bootstrapping configuration for subsamples size = 5,000 and
significance threshold for path coefficients to as t-value ≥ 1.96 at a significance level
(α)= 5% to be considered as significant relationship (C. M. Ringle et al., 2018).
3.7.5.8 Mediation
According to (Joseph F. Hair et al., 2017) a mediating effect occurs when “a third
construct intervenes between two other related constructs” (p. 235). Mediating effects
are normally made when there is theoretical evidence (Joseph F. Hair et al., 2019;
Hayes & Preacher, 2014; Wong, 2016). An intervening variable (mediator) transmits
the effect of an independent variable to a dependent variable indirectly; it also clarifies
the underlying process by which causal effects arise between exogenous and
endogenous constructs (Hayes & Preacher, 2014).
Fig. 3.2 Simple Mediation model
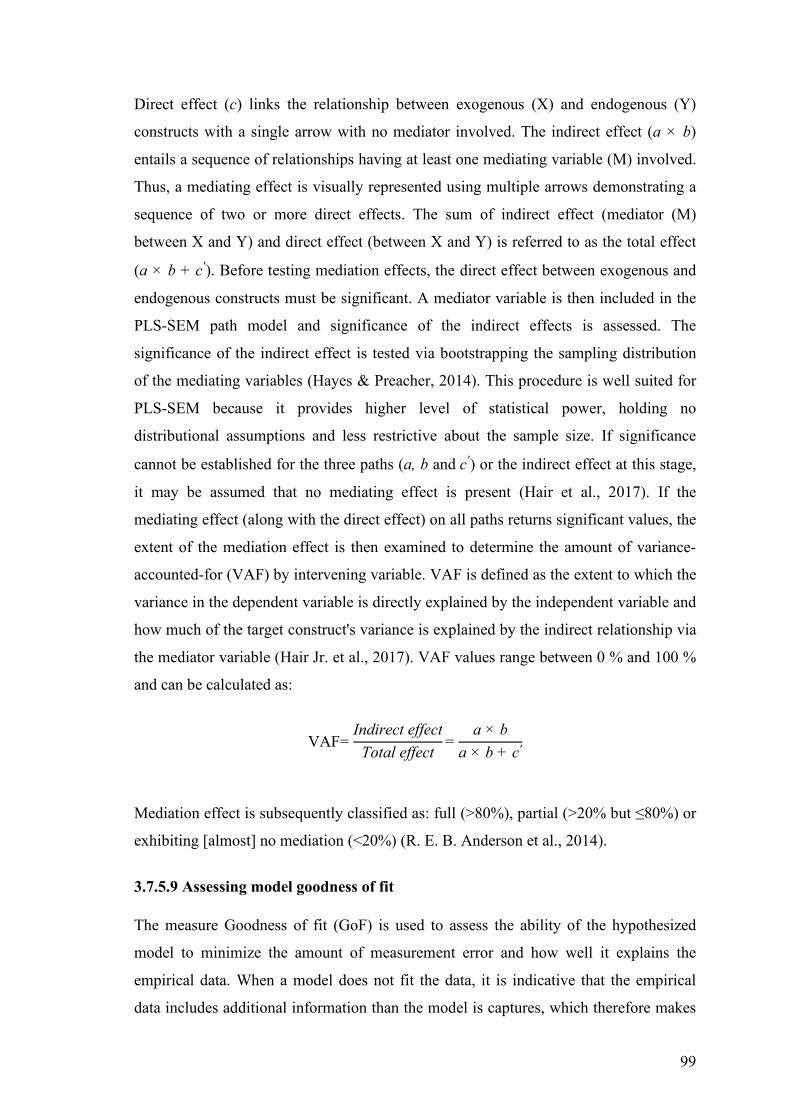
99
Direct effect (c) links the relationship between exogenous (X) and endogenous (Y)
constructs with a single arrow with no mediator involved. The indirect effect (a × b)
entails a sequence of relationships having at least one mediating variable (M) involved.
Thus, a mediating effect is visually represented using multiple arrows demonstrating a
sequence of two or more direct effects. The sum of indirect effect (mediator (M)
between X and Y) and direct effect (between X and Y) is referred to as the total effect
(a × b + c'). Before testing mediation effects, the direct effect between exogenous and
endogenous constructs must be significant. A mediator variable is then included in the
PLS-SEM path model and significance of the indirect effects is assessed. The
significance of the indirect effect is tested via bootstrapping the sampling distribution
of the mediating variables (Hayes & Preacher, 2014). This procedure is well suited for
PLS-SEM because it provides higher level of statistical power, holding no
distributional assumptions and less restrictive about the sample size. If significance
cannot be established for the three paths (a, b and c') or the indirect effect at this stage,
it may be assumed that no mediating effect is present (Hair et al., 2017). If the
mediating effect (along with the direct effect) on all paths returns significant values, the
extent of the mediation effect is then examined to determine the amount of variance-
accounted-for (VAF) by intervening variable. VAF is defined as the extent to which the
variance in the dependent variable is directly explained by the independent variable and
how much of the target construct's variance is explained by the indirect relationship via
the mediator variable (Hair Jr. et al., 2017). VAF values range between 0 % and 100 %
and can be calculated as:
VAF=Indirect effect
Total effect=
a × ba × b + c'
Mediation effect is subsequently classified as: full (>80%), partial (>20% but ≤80%) or
exhibiting [almost] no mediation (<20%) (R. E. B. Anderson et al., 2014).
3.7.5.9 Assessing model goodness of fit
The measure Goodness of fit (GoF) is used to assess the ability of the hypothesized
model to minimize the amount of measurement error and how well it explains the
empirical data. When a model does not fit the data, it is indicative that the empirical
data includes additional information than the model is captures, which therefore makes
100
the model estimates meaningless and results remain inconclusive (Jörg Henseler &
Sarstedt, 2013). Because of fundamental conceptual differences between theory
confirmation and prediction approaches inherent in SEM the PLS based SEM analysis
lack adequate global measures of goodness of fit.
Unlike covariance-based SEM the Partial least squares-based SEM maximizes the
degree of variance explained in a given endogenous construct utilizing a predictive
modeling approach therefore, however PLS-SEM does not accommodate well with
evaluating discrepancies between the model’s actual covariance matrix and estimated
covariance matrices (Sarstedt et al., 2019). In PLS path analysis, bootstrapping
procedure is used to assess a model fitness. This technique is based on establishing the
likeliness of obtaining differences between the model’s observed and implied
correlation matrices. The statistical significance of values representing the discrepancy
between the model’s observed and implied correlation matrices is examined based on
drawing bootstrap samples. The ‘Standardized Root Mean Square Residuals’ (SRMR)
is an approximate model fit criterion which is used to ascertain the significance of
values resulting from the discrepancy between the model’s observed and implied
correlation metrices [adding the squared differences and then taking square root].
There are divergent views amongst scholars, regarding the acceptable threshold level of
SRMR. According to (Byrne, 2016) the estimated value SRMR should be less than .055
to achieve an adequate model fit, moreover an estimated value of zero represents a
perfectly fitting model (Jörg Henseler et al., 2017). According to (Hu & Bentler, 1999)
and (Joseph F. Hair et al., 2017) within the PLS-SEM models the value of an adequate
model fit should reflect a threshold value of .08.
3.7.5.10 Measurement invariance of composite models - MICOM
Multi-group analysis was performed to assess is there any significant variations among
group-specific estimates in the structural and measurement models. Assessing
measurement invariance for multigroup data is an essential pre-condition before
running multigroup analyses (MGA) to make sure that the difference between groups is
what the researcher intends to measure and is free from unrelated content and/or
meanings associated with latent variables. In other words, variances in the structural
relationships between latent variables could be a result of different meanings the
101
groups’ respondents ascribe to the phenomena under investigation rather than the true
differences in the structural relationships among target groups and therefore can be a
potential source of measurement error” (Hair et al., 2017).
Therefore, to ensure that outcomes and results are valid, measurement invariance need
to be established before running multigroup analysis. Invariance assessment (also
known as equivalence) in PLS-SEM requires that the latent constructs comprising the
model be treated as composites as opposed to common factors assuming that the latent
scores are created exactly the same way across the groups before being able to compare
whether the factor structure is actually equivalent across groups (Hair et al., 2017). The
measurement invariance of composite models (MICOM) procedure was developed by
(Henseler, Ringle, and Sarstedt, 2016), which involves three levels:
3.7.5.10.1 Configural invariance
The first level involves examining whether the same factor structure (identical
indicators, identical treatment of missing values and outliers, and estimation of model
composites using the same algorithm) exists in all target groups.
3.7.5.10.2 Compositional invariance
This level require creation of identical composite scores across target groups to be
examined statistically for compositional invariance using permutation tests. The
permutation test provides correlation values calculated from composite weight scores
across groups (Henseler et al. 2018). If the original correlation values are smaller than
the p=5% quantile significance level, then measurement invariance is not established
conversely if the values for original correlation are greater than p ≥ 5% quantile suggest
that the measurement between two groups is invariant.
3.7.5.10.3. Composites equality
This step requires examining invariance for mean and variances of latent constructs
across groups using the associated permutation p-values. For full invariance the original
mean difference and variance values should fall between the lower (2.5%) and upper
(97.5%) boundaries achieving the 95% confidence interval and for partial invariance,
the value of either mean or variance should fall between the 2.5% and 97.5% interval.
In case the values of original mean difference for both mean and variance does not fall
102
between the 95% confidence level then there is no invariance. Moreover, the associated
p=value for mean and variance at p ≥ .05 suggest the composite structure of the two
groups are invariant.
3.7.5.11 Multi-group analysis – (MGA)
Multi-group analysis (MGA) was used to assess whether there are significant
differences between group-specific estimates (i.e. path coefficients, outer-loadings and
variance accounted for VAF) among pre-defined data groups (F. Hair Jr et al., 2014).
On a conceptual level, multi-group analysis is conceivably as an exceptional case of
modelling moderation analysis that is used analyze group differences between multiple
path relationships among constructs, (Henseler and Chin, 2010; Henseler and Fassott,
2010). PLS-SEM multigroup analysis (PLS-MGA) is widely used to identify
differences among pre-defined groups within the dataset (e.g., Hair et al. 2014a; Horn
and McArdle 1992; Keil et al. 2000). The significance of multigroup differences can be
accessed using several approaches for instance, the PLS-MGA procedure, parametric,
Welch-Satterthwaite and permutation approaches (Joseph F. Hair et al., 2019). The
parametric procedure is considered a more liberal approach which is limited by its
distribution assumptions and subject to Type 1 errors (Hair et al. 2017; Sarstedt et al.
2017). Similarly, Welch-Satterthwaite test is also a parametric test, but does not assume
equal variances when comparing the means of two groups. In contrast, the permutation
test is nonparametric, more conservative than parametric test and can handle type I
errors very well. Permutation test is highly recommended for PLS-MGA which is run
before stage 3 during the measurement invariance procedure (Hair et al. 2017).
The permutation-based procedure which is highlighted in previous subsections, is a
non-parametric approach that is consistent with PLS-SEM as opposed CB-SEM. A
permutation p-values ≤ to 0.10 denotes a significant difference between group-specific
estimates between two target groups this value is estimated based on permutation mean
difference. Moreover, PLS-MGA procedure is a one tailed test which returns
probability estimates for parameters differences based bootstrapping routine (Hair et al.
2019). A p-value below > 0.05 or above < 0.95, denote statistically significant results
(Sarstedt, Henseler, & Ringle 2017). To test the significant difference between group
specific estimates this study utilized permutation a non- parametric procedure using
Smart PLS. In order to perform multi-group analysis six groups were defined in Smart
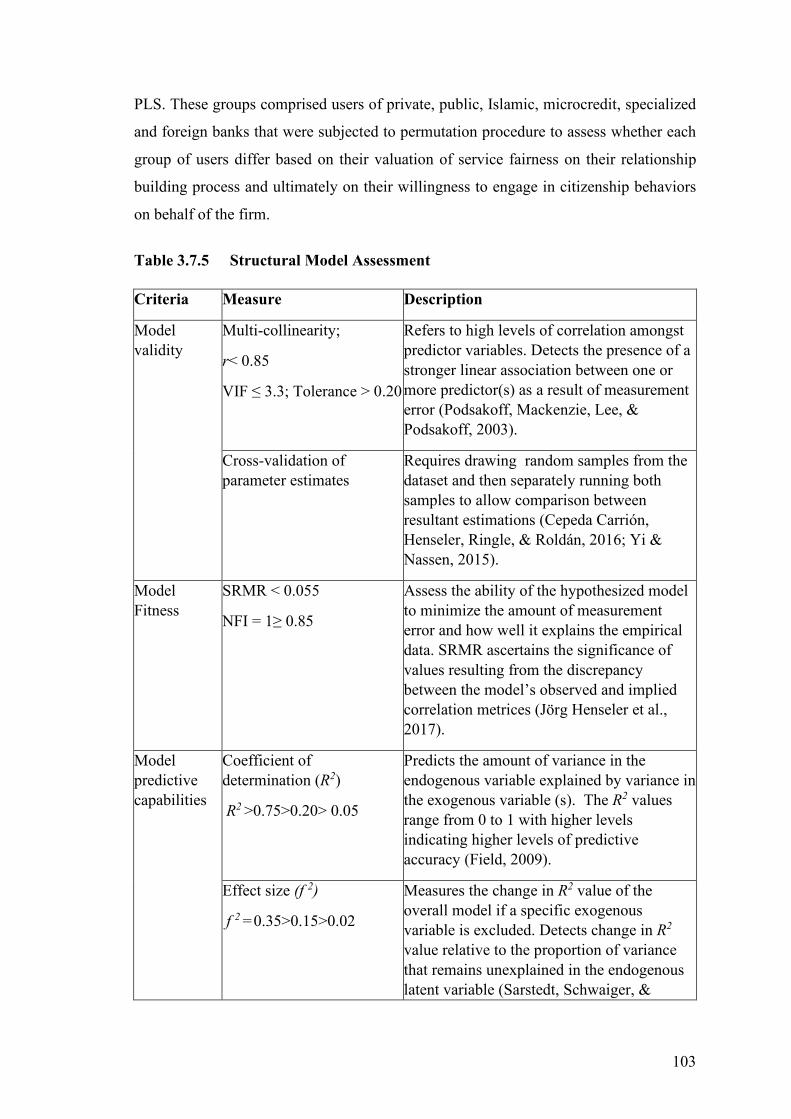
103
PLS. These groups comprised users of private, public, Islamic, microcredit, specialized
and foreign banks that were subjected to permutation procedure to assess whether each
group of users differ based on their valuation of service fairness on their relationship
building process and ultimately on their willingness to engage in citizenship behaviors
on behalf of the firm.
Table 3.7.5 Structural Model Assessment
Criteria Measure Description
Model validity
Multi-collinearity;
r< 0.85
VIF ≤ 3.3; Tolerance > 0.20
Refers to high levels of correlation amongst predictor variables. Detects the presence of a stronger linear association between one or more predictor(s) as a result of measurement error (Podsakoff, Mackenzie, Lee, & Podsakoff, 2003).
Cross-validation of parameter estimates
Requires drawing random samples from the dataset and then separately running both samples to allow comparison between resultant estimations (Cepeda Carrión, Henseler, Ringle, & Roldán, 2016; Yi & Nassen, 2015).
Model Fitness
SRMR < 0.055
NFI = 1≥ 0.85
Assess the ability of the hypothesized model to minimize the amount of measurement error and how well it explains the empirical data. SRMR ascertains the significance of values resulting from the discrepancy between the model’s observed and implied correlation metrices (Jörg Henseler et al., 2017).
Model predictive capabilities
Coefficient of determination (R2)
R2 >0.75>0.20> 0.05
Predicts the amount of variance in the endogenous variable explained by variance in the exogenous variable (s). The R2 values range from 0 to 1 with higher levels indicating higher levels of predictive accuracy (Field, 2009).
Effect size (f 2)
f 2 =0.35>0.15>0.02
Measures the change in R2 value of the overall model if a specific exogenous variable is excluded. Detects change in R2 value relative to the proportion of variance that remains unexplained in the endogenous latent variable (Sarstedt, Schwaiger, &
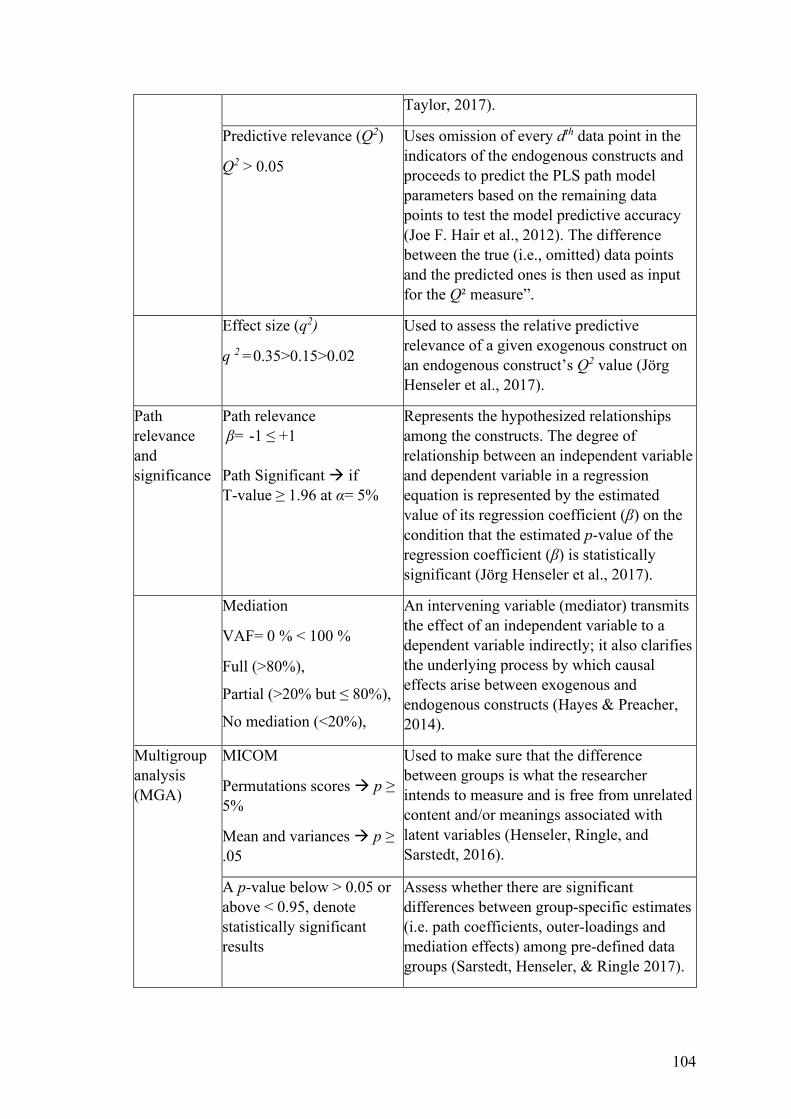
104
Taylor, 2017).
Predictive relevance (Q2)
Q2 > 0.05
Uses omission of every dth data point in the indicators of the endogenous constructs and proceeds to predict the PLS path model parameters based on the remaining data points to test the model predictive accuracy (Joe F. Hair et al., 2012). The difference between the true (i.e., omitted) data points and the predicted ones is then used as input for the Q² measure”.
Effect size (q2)
q 2 =0.35>0.15>0.02
Used to assess the relative predictive relevance of a given exogenous construct on an endogenous construct’s Q2 value (Jörg Henseler et al., 2017).
Path relevance and significance
Path relevance β= -1 ≤ +1 Path Significant if T-value ≥ 1.96 at α= 5%
Represents the hypothesized relationships among the constructs. The degree of relationship between an independent variable and dependent variable in a regression equation is represented by the estimated value of its regression coefficient (β) on the condition that the estimated p-value of the regression coefficient (β) is statistically significant (Jörg Henseler et al., 2017).
Mediation
VAF= 0 % < 100 %
Full (>80%),
Partial (>20% but ≤ 80%),
No mediation (<20%),
An intervening variable (mediator) transmits the effect of an independent variable to a dependent variable indirectly; it also clarifies the underlying process by which causal effects arise between exogenous and endogenous constructs (Hayes & Preacher, 2014).
Multigroup analysis (MGA)
MICOM
Permutations scores p ≥ 5%
Mean and variances p ≥ .05
Used to make sure that the difference between groups is what the researcher intends to measure and is free from unrelated content and/or meanings associated with latent variables (Henseler, Ringle, and Sarstedt, 2016).
A p-value below > 0.05 or above < 0.95, denote statistically significant results
Assess whether there are significant differences between group-specific estimates (i.e. path coefficients, outer-loadings and mediation effects) among pre-defined data groups (Sarstedt, Henseler, & Ringle 2017).
105
3.8 Data management
Before proceeding with data analysis data was examined for missing values, data
coding, suspicious response patterns, common method variance, outlier’s detection, and
data distribution and multicollinearity issues (Hair et al., 2019). The findings and
adjustments are presented in this section.
3.8.1 Data screening
A visual inspection of the filled questionnaires revealed 22 straight lining, 13
inconsistent response patterns, and 05 otherwise invalid observations which resulted in
subsequent exclusion of these cases. Thus, a total of n=1430 were identified as valid
and recorded in SPSS data editor and further examined for missing values. The data
entered was randomly cross-examined with the questionnaire to check that cases.
3.8.2 Missing values
This research addressed the issue of missing values in the following ways: First, the
questionnaire was pilot tested for content and face validity before final data collection,
second, respondents were required to complete all the questions in their entirety before
the survey could be submitted, third, verbal explanations were also provided when
needed while attempting survey. All these steps mitigated the possibility of any missing
values (Kline, 2016). Missing values were identified and coded as “0” during the data
entry process. Following guidelines for treating missing values (Joseph F. Hair et al.,
2019), for any individual case missing values should not exceed 15%. Similarly, for
any particular indicator, missing values should not exceed 5%. After examining the
dataset, the highest percentage of missing values for induvial cases did not exceed 2%
while percentage of missing values per indicator was also less than 5% which satisfied
the recommended criteria. Subsequently, all the missing values were treated using
“mean replacement” technique in Smart PLS.3.6.7 which replaces missing values with
the mean of their associated item values. (Hair et al., 2017; Ringle, Wende, & Becker,
2018).
3.8.3 Outlier analysis
Outliers are uncommon extreme values in among range of values of an observation.
(Mooi & Sarstedt, 2011). Outliers are a threat to valid results and therefore needs to be
106
excluded from the dataset to prevent distortion during analysis (Hair et al., 2017).
Garson, 2016 recommended examining the “residuals” in Smart PLS 3.2.7 to identify
outliers in a dataset. residuals are the difference between observed and expected values
of a variable, Smart PLS provide standardized residual values where smaller values of
residuals are indicative of good model fit. For any observation the residuals values
greater than 1.96 (standardized Z-score values at 95% confidence interval) are
considered outliers (Garson, 2016). The dataset of the current study did not contain any
extreme outliers as all the residual values were below 1.96.
3.8.4 Data coding
Data was coded as per follows:
Gender was coded as 1=male, 2=female
Marital status was coded as 1=single, 2=married
Age group was coded as 1=20 or less, 2=21 to 25, 3=26 to 30, 4=31-40, 5=41-50,
6=51-60, 7=Above 65
Education background was coded as 1= Metric or below, 2=Intermediate, 3=Bachelor
degree, 4=Masters or equivalent degree, 5=Above
Occupation was coded as 1= Student, 2=Working professional, 3= Business, 4=
Housewife, 5=Unemployed, 6=Other
City was coded as 1=Peshawar, 2=Lahore, 3=Karachi, 4=Islamabad, 5= Quetta
Frequency of visit was coded as 1=Everyday, 2=Several times a week, 3=Once every
week, 4= Once in 2 weeks, 5=Once a week, 6=Once in 2 months, 7=Once in 3 to 6
months, 8=Once in more than 6 months
Use of internet banking was coded as 0=no, 1=yes
Consumer type was coded as 1=public, 2=private, 3=specialized, 4=foreign, 5=micro-
finance and 6=Islamic banking
Each item in the questionnaire was coded 1=strongly disagree, 2=Disagree,
3=Somewhat Disagree, 4=Neutral, 5=Somewhat Agree, 6=Agree to 7=strongly Agree
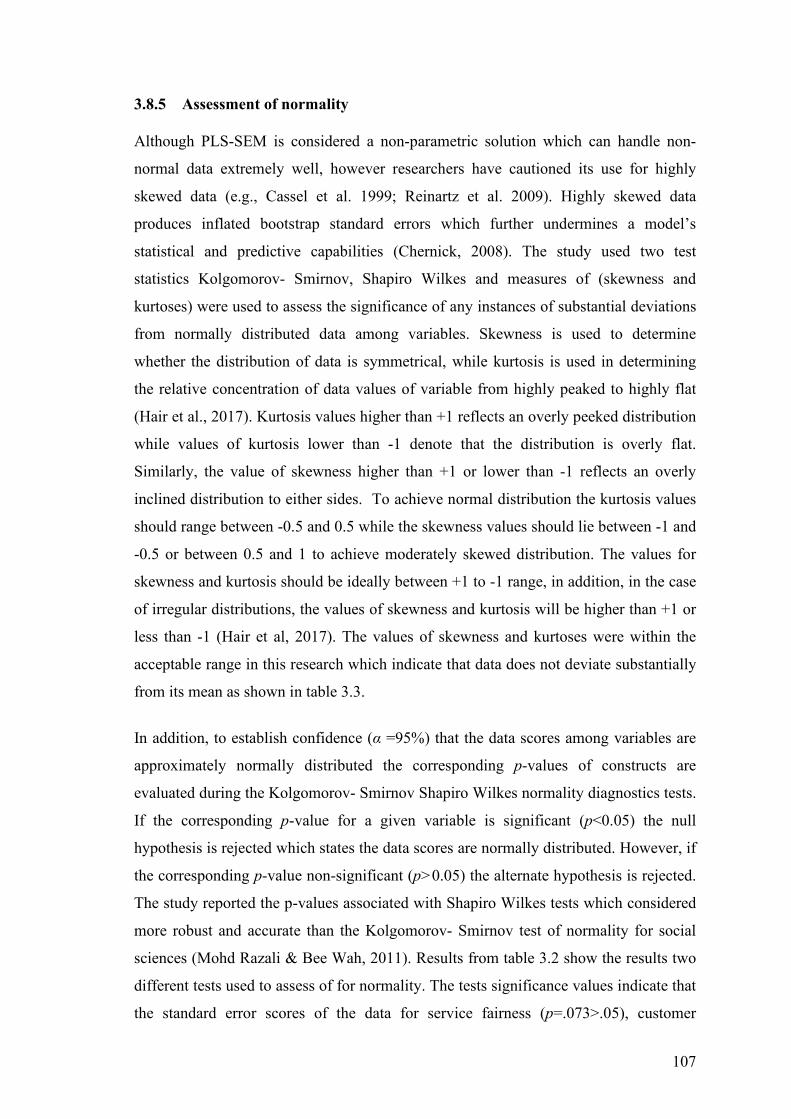
107
3.8.5 Assessment of normality
Although PLS-SEM is considered a non-parametric solution which can handle non-
normal data extremely well, however researchers have cautioned its use for highly
skewed data (e.g., Cassel et al. 1999; Reinartz et al. 2009). Highly skewed data
produces inflated bootstrap standard errors which further undermines a model’s
statistical and predictive capabilities (Chernick, 2008). The study used two test
statistics Kolgomorov- Smirnov, Shapiro Wilkes and measures of (skewness and
kurtoses) were used to assess the significance of any instances of substantial deviations
from normally distributed data among variables. Skewness is used to determine
whether the distribution of data is symmetrical, while kurtosis is used in determining
the relative concentration of data values of variable from highly peaked to highly flat
(Hair et al., 2017). Kurtosis values higher than +1 reflects an overly peeked distribution
while values of kurtosis lower than -1 denote that the distribution is overly flat.
Similarly, the value of skewness higher than +1 or lower than -1 reflects an overly
inclined distribution to either sides. To achieve normal distribution the kurtosis values
should range between -0.5 and 0.5 while the skewness values should lie between -1 and
-0.5 or between 0.5 and 1 to achieve moderately skewed distribution. The values for
skewness and kurtosis should be ideally between +1 to -1 range, in addition, in the case
of irregular distributions, the values of skewness and kurtosis will be higher than +1 or
less than -1 (Hair et al, 2017). The values of skewness and kurtoses were within the
acceptable range in this research which indicate that data does not deviate substantially
from its mean as shown in table 3.3.
In addition, to establish confidence (α =95%) that the data scores among variables are
approximately normally distributed the corresponding p-values of constructs are
evaluated during the Kolgomorov- Smirnov Shapiro Wilkes normality diagnostics tests.
If the corresponding p-value for a given variable is significant (p<0.05) the null
hypothesis is rejected which states the data scores are normally distributed. However, if
the corresponding p-value non-significant (p>0.05) the alternate hypothesis is rejected.
The study reported the p-values associated with Shapiro Wilkes tests which considered
more robust and accurate than the Kolgomorov- Smirnov test of normality for social
sciences (Mohd Razali & Bee Wah, 2011). Results from table 3.2 show the results two
different tests used to assess of for normality. The tests significance values indicate that
the standard error scores of the data for service fairness (p=.073>.05), customer
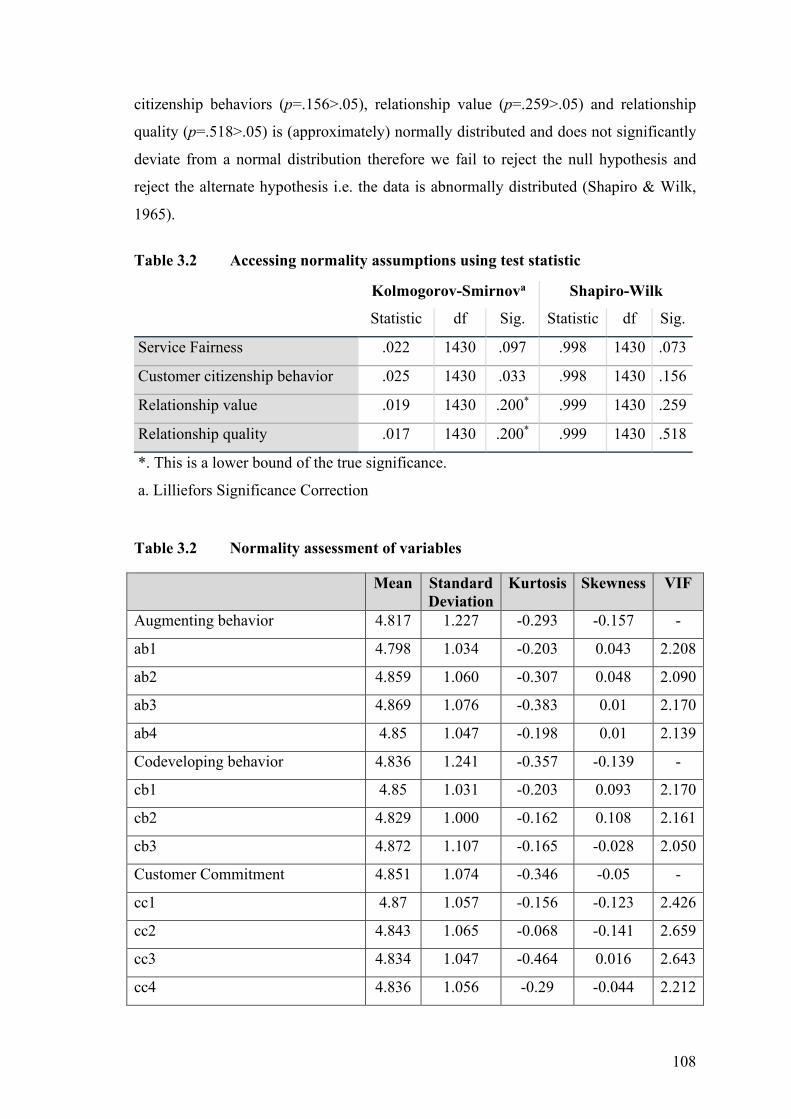
108
citizenship behaviors (p=.156>.05), relationship value (p=.259>.05) and relationship
quality (p=.518>.05) is (approximately) normally distributed and does not significantly
deviate from a normal distribution therefore we fail to reject the null hypothesis and
reject the alternate hypothesis i.e. the data is abnormally distributed (Shapiro & Wilk,
1965).
Table 3.2 Accessing normality assumptions using test statistic
Kolmogorov-Smirnova Shapiro-Wilk
Statistic df Sig. Statistic df Sig.
Service Fairness .022 1430 .097 .998 1430 .073
Customer citizenship behavior .025 1430 .033 .998 1430 .156
Relationship value .019 1430 .200* .999 1430 .259
Relationship quality .017 1430 .200* .999 1430 .518
*. This is a lower bound of the true significance.
a. Lilliefors Significance Correction
Table 3.2 Normality assessment of variables
Mean Standard Deviation
Kurtosis Skewness VIF
Augmenting behavior 4.817 1.227 -0.293 -0.157 -
ab1 4.798 1.034 -0.203 0.043 2.208
ab2 4.859 1.060 -0.307 0.048 2.090
ab3 4.869 1.076 -0.383 0.01 2.170
ab4 4.85 1.047 -0.198 0.01 2.139
Codeveloping behavior 4.836 1.241 -0.357 -0.139 -
cb1 4.85 1.031 -0.203 0.093 2.170
cb2 4.829 1.000 -0.162 0.108 2.161
cb3 4.872 1.107 -0.165 -0.028 2.050
Customer Commitment 4.851 1.074 -0.346 -0.05 -
cc1 4.87 1.057 -0.156 -0.123 2.426
cc2 4.843 1.065 -0.068 -0.141 2.659
cc3 4.834 1.047 -0.464 0.016 2.643
cc4 4.836 1.056 -0.29 -0.044 2.212
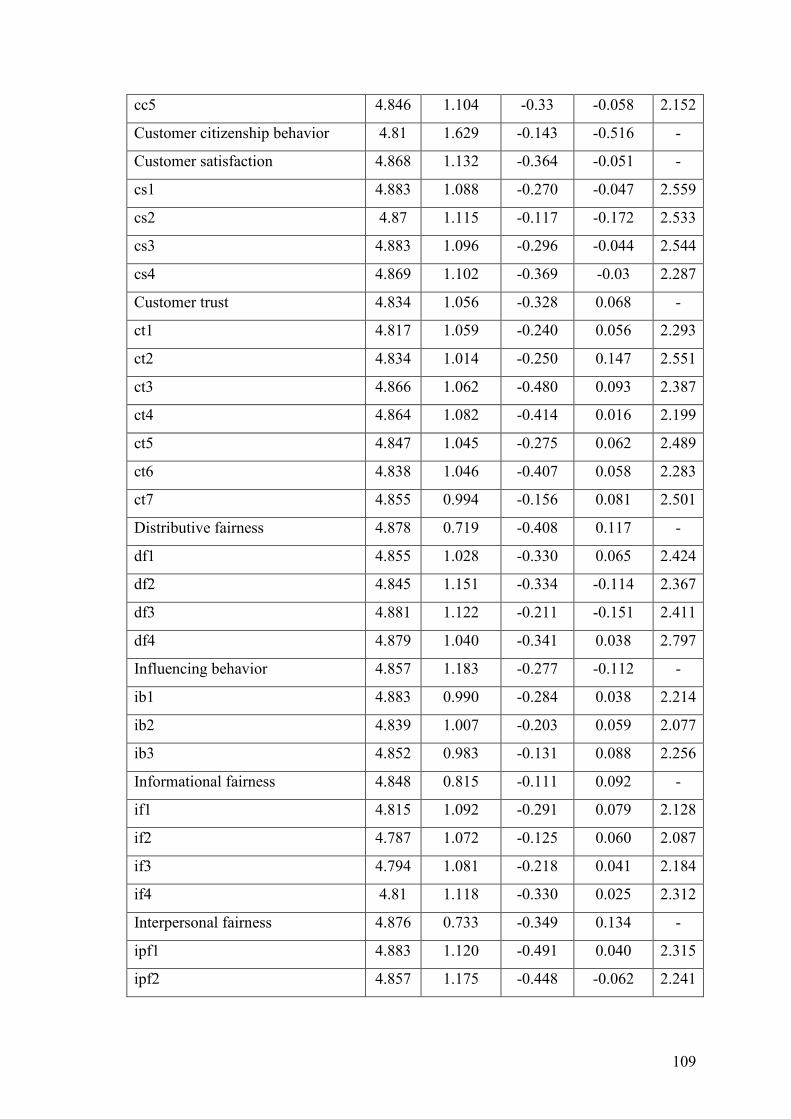
109
cc5 4.846 1.104 -0.33 -0.058 2.152
Customer citizenship behavior 4.81 1.629 -0.143 -0.516 -
Customer satisfaction 4.868 1.132 -0.364 -0.051 -
cs1 4.883 1.088 -0.270 -0.047 2.559
cs2 4.87 1.115 -0.117 -0.172 2.533
cs3 4.883 1.096 -0.296 -0.044 2.544
cs4 4.869 1.102 -0.369 -0.03 2.287
Customer trust 4.834 1.056 -0.328 0.068 -
ct1 4.817 1.059 -0.240 0.056 2.293
ct2 4.834 1.014 -0.250 0.147 2.551
ct3 4.866 1.062 -0.480 0.093 2.387
ct4 4.864 1.082 -0.414 0.016 2.199
ct5 4.847 1.045 -0.275 0.062 2.489
ct6 4.838 1.046 -0.407 0.058 2.283
ct7 4.855 0.994 -0.156 0.081 2.501
Distributive fairness 4.878 0.719 -0.408 0.117 -
df1 4.855 1.028 -0.330 0.065 2.424
df2 4.845 1.151 -0.334 -0.114 2.367
df3 4.881 1.122 -0.211 -0.151 2.411
df4 4.879 1.040 -0.341 0.038 2.797
Influencing behavior 4.857 1.183 -0.277 -0.112 -
ib1 4.883 0.990 -0.284 0.038 2.214
ib2 4.839 1.007 -0.203 0.059 2.077
ib3 4.852 0.983 -0.131 0.088 2.256
Informational fairness 4.848 0.815 -0.111 0.092 -
if1 4.815 1.092 -0.291 0.079 2.128
if2 4.787 1.072 -0.125 0.060 2.087
if3 4.794 1.081 -0.218 0.041 2.184
if4 4.81 1.118 -0.330 0.025 2.312
Interpersonal fairness 4.876 0.733 -0.349 0.134 -
ipf1 4.883 1.120 -0.491 0.040 2.315
ipf2 4.857 1.175 -0.448 -0.062 2.241
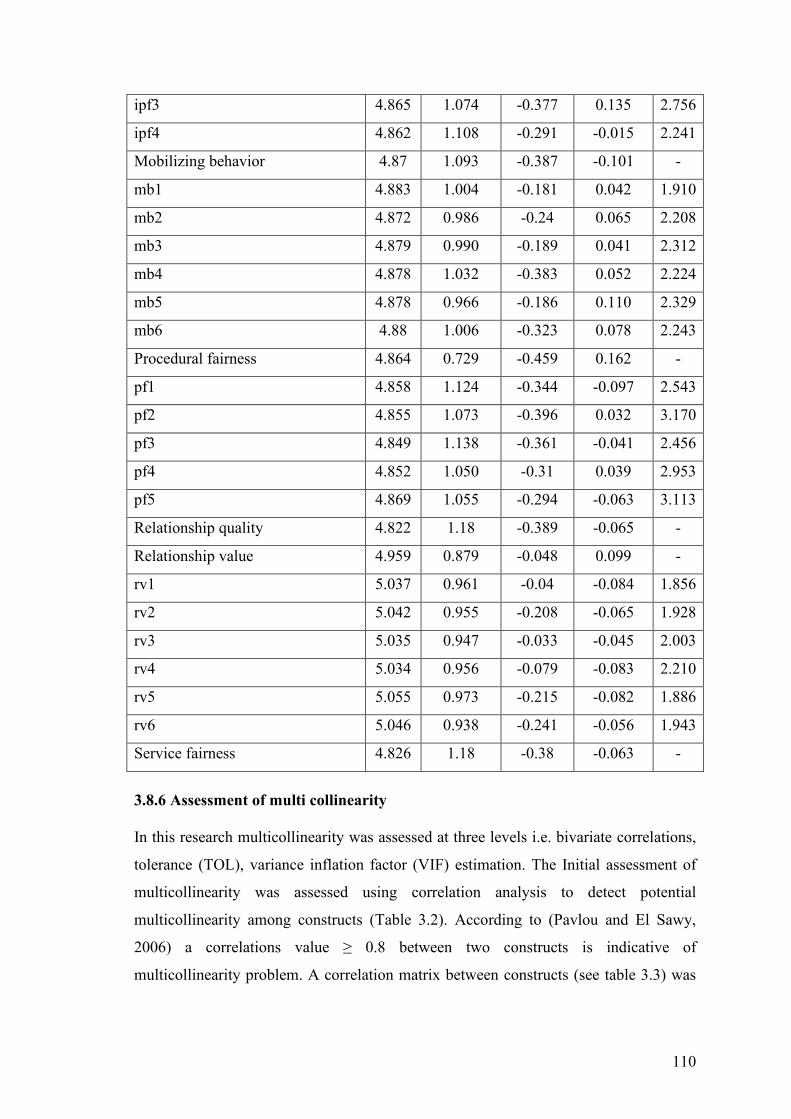
110
ipf3 4.865 1.074 -0.377 0.135 2.756
ipf4 4.862 1.108 -0.291 -0.015 2.241
Mobilizing behavior 4.87 1.093 -0.387 -0.101 -
mb1 4.883 1.004 -0.181 0.042 1.910
mb2 4.872 0.986 -0.24 0.065 2.208
mb3 4.879 0.990 -0.189 0.041 2.312
mb4 4.878 1.032 -0.383 0.052 2.224
mb5 4.878 0.966 -0.186 0.110 2.329
mb6 4.88 1.006 -0.323 0.078 2.243
Procedural fairness 4.864 0.729 -0.459 0.162 -
pf1 4.858 1.124 -0.344 -0.097 2.543
pf2 4.855 1.073 -0.396 0.032 3.170
pf3 4.849 1.138 -0.361 -0.041 2.456
pf4 4.852 1.050 -0.31 0.039 2.953
pf5 4.869 1.055 -0.294 -0.063 3.113
Relationship quality 4.822 1.18 -0.389 -0.065 -
Relationship value 4.959 0.879 -0.048 0.099 -
rv1 5.037 0.961 -0.04 -0.084 1.856
rv2 5.042 0.955 -0.208 -0.065 1.928
rv3 5.035 0.947 -0.033 -0.045 2.003
rv4 5.034 0.956 -0.079 -0.083 2.210
rv5 5.055 0.973 -0.215 -0.082 1.886
rv6 5.046 0.938 -0.241 -0.056 1.943
Service fairness 4.826 1.18 -0.38 -0.063 -
3.8.6 Assessment of multi collinearity
In this research multicollinearity was assessed at three levels i.e. bivariate correlations,
tolerance (TOL), variance inflation factor (VIF) estimation. The Initial assessment of
multicollinearity was assessed using correlation analysis to detect potential
multicollinearity among constructs (Table 3.2). According to (Pavlou and El Sawy,
2006) a correlations value ≥ 0.8 between two constructs is indicative of
multicollinearity problem. A correlation matrix between constructs (see table 3.3) was
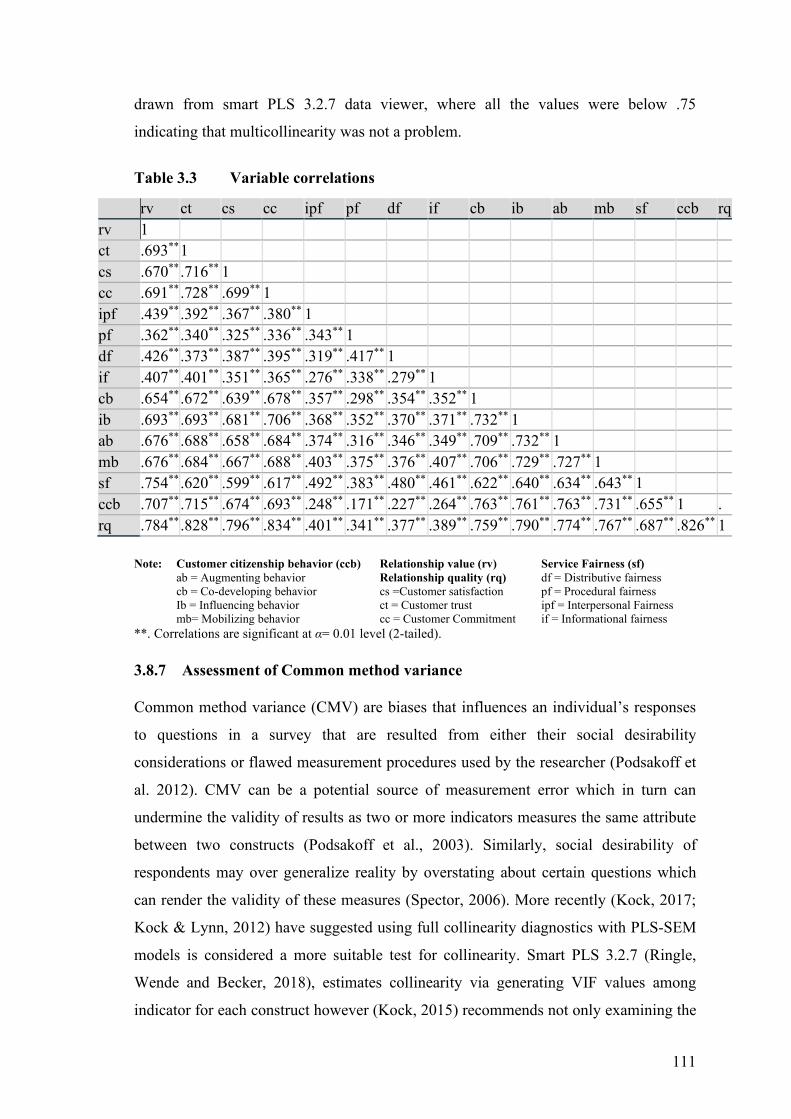
111
drawn from smart PLS 3.2.7 data viewer, where all the values were below .75
indicating that multicollinearity was not a problem.
Table 3.3 Variable correlations
rv ct cs cc ipf pf df if cb ib ab mb sf ccb rq rv 1 ct .693** 1 cs .670** .716** 1 cc .691** .728** .699** 1 ipf .439** .392** .367** .380** 1 pf .362** .340** .325** .336** .343** 1 df .426** .373** .387** .395** .319** .417** 1 if .407** .401** .351** .365** .276** .338** .279** 1 cb .654** .672** .639** .678** .357** .298** .354** .352** 1 ib .693** .693** .681** .706** .368** .352** .370** .371** .732** 1 ab .676** .688** .658** .684** .374** .316** .346** .349** .709** .732** 1 mb .676** .684** .667** .688** .403** .375** .376** .407** .706** .729** .727** 1 sf .754** .620** .599** .617** .492** .383** .480** .461** .622** .640** .634** .643** 1 ccb .707** .715** .674** .693** .248** .171** .227** .264** .763** .761** .763** .731** .655** 1 . rq .784** .828** .796** .834** .401** .341** .377** .389** .759** .790** .774** .767** .687** .826** 1
Note: Customer citizenship behavior (ccb)
ab = Augmenting behavior cb = Co-developing behavior Ib = Influencing behavior mb= Mobilizing behavior
Relationship value (rv) Relationship quality (rq)
Service Fairness (sf) df = Distributive fairness pf = Procedural fairness ipf = Interpersonal Fairness if = Informational fairness
cs =Customer satisfaction ct = Customer trust cc = Customer Commitment
**. Correlations are significant at α= 0.01 level (2-tailed).
3.8.7 Assessment of Common method variance
Common method variance (CMV) are biases that influences an individual’s responses
to questions in a survey that are resulted from either their social desirability
considerations or flawed measurement procedures used by the researcher (Podsakoff et
al. 2012). CMV can be a potential source of measurement error which in turn can
undermine the validity of results as two or more indicators measures the same attribute
between two constructs (Podsakoff et al., 2003). Similarly, social desirability of
respondents may over generalize reality by overstating about certain questions which
can render the validity of these measures (Spector, 2006). More recently (Kock, 2017;
Kock & Lynn, 2012) have suggested using full collinearity diagnostics with PLS-SEM
models is considered a more suitable test for collinearity. Smart PLS 3.2.7 (Ringle,
Wende and Becker, 2018), estimates collinearity via generating VIF values among
indicator for each construct however (Kock, 2015) recommends not only examining the
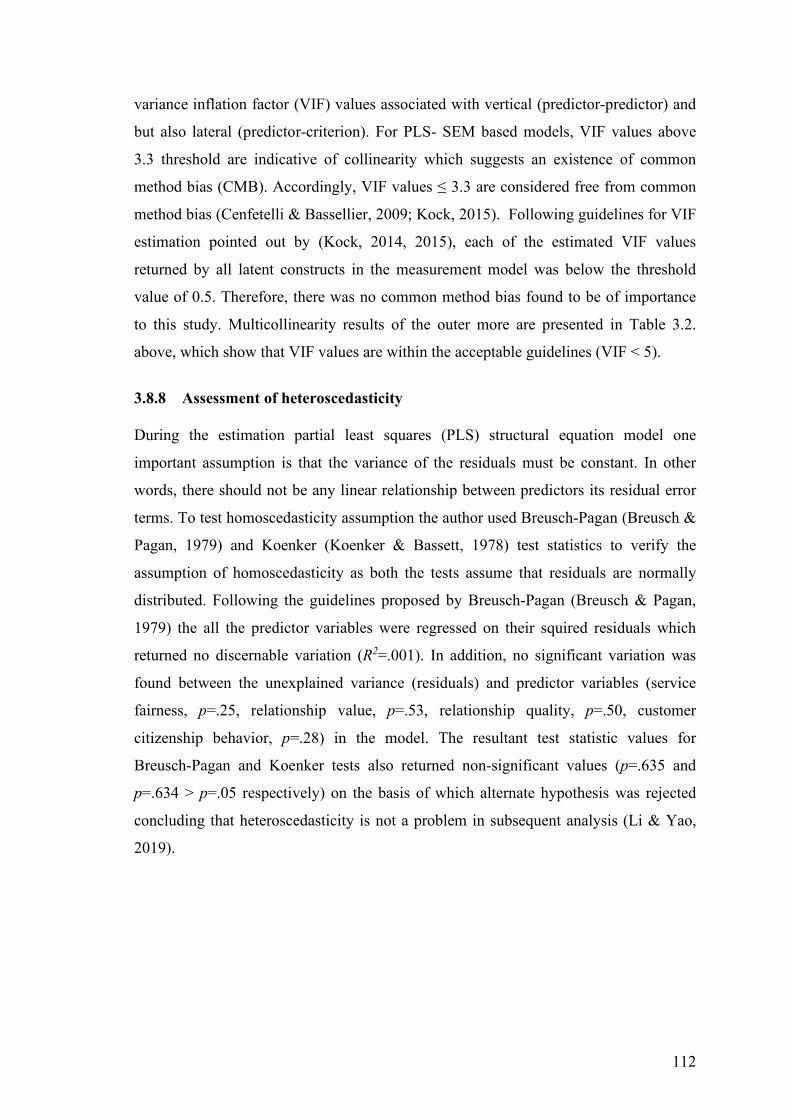
112
variance inflation factor (VIF) values associated with vertical (predictor-predictor) and
but also lateral (predictor-criterion). For PLS- SEM based models, VIF values above
3.3 threshold are indicative of collinearity which suggests an existence of common
method bias (CMB). Accordingly, VIF values ≤ 3.3 are considered free from common
method bias (Cenfetelli & Bassellier, 2009; Kock, 2015). Following guidelines for VIF
estimation pointed out by (Kock, 2014, 2015), each of the estimated VIF values
returned by all latent constructs in the measurement model was below the threshold
value of 0.5. Therefore, there was no common method bias found to be of importance
to this study. Multicollinearity results of the outer more are presented in Table 3.2.
above, which show that VIF values are within the acceptable guidelines (VIF < 5).
3.8.8 Assessment of heteroscedasticity
During the estimation partial least squares (PLS) structural equation model one
important assumption is that the variance of the residuals must be constant. In other
words, there should not be any linear relationship between predictors its residual error
terms. To test homoscedasticity assumption the author used Breusch-Pagan (Breusch &
Pagan, 1979) and Koenker (Koenker & Bassett, 1978) test statistics to verify the
assumption of homoscedasticity as both the tests assume that residuals are normally
distributed. Following the guidelines proposed by Breusch-Pagan (Breusch & Pagan,
1979) the all the predictor variables were regressed on their squired residuals which
returned no discernable variation (R2=.001). In addition, no significant variation was
found between the unexplained variance (residuals) and predictor variables (service
fairness, p=.25, relationship value, p=.53, relationship quality, p=.50, customer
citizenship behavior, p=.28) in the model. The resultant test statistic values for
Breusch-Pagan and Koenker tests also returned non-significant values (p=.635 and
p=.634 > p=.05 respectively) on the basis of which alternate hypothesis was rejected
concluding that heteroscedasticity is not a problem in subsequent analysis (Li & Yao,
2019).
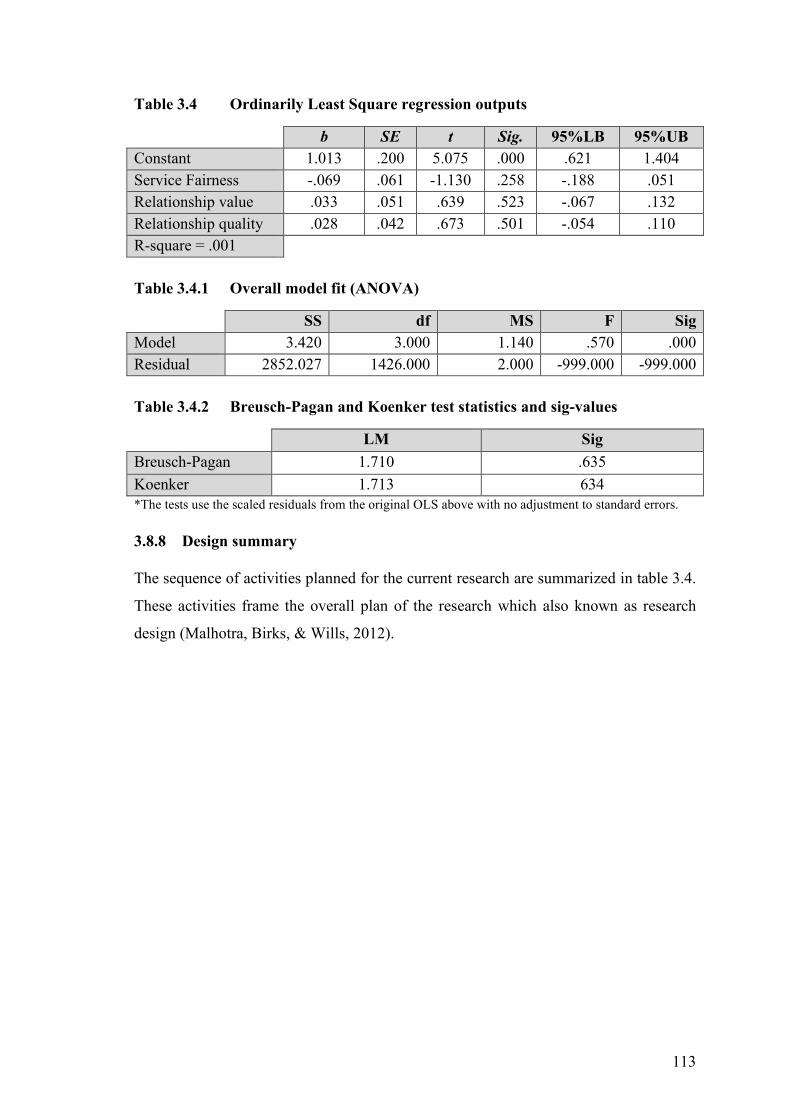
113
Table 3.4 Ordinarily Least Square regression outputs
b SE t Sig. 95%LB 95%UB Constant 1.013 .200 5.075 .000 .621 1.404 Service Fairness -.069 .061 -1.130 .258 -.188 .051 Relationship value .033 .051 .639 .523 -.067 .132 Relationship quality .028 .042 .673 .501 -.054 .110 R-square = .001 Table 3.4.1 Overall model fit (ANOVA)
SS df MS F Sig Model 3.420 3.000 1.140 .570 .000 Residual 2852.027 1426.000 2.000 -999.000 -999.000 Table 3.4.2 Breusch-Pagan and Koenker test statistics and sig-values
LM Sig Breusch-Pagan 1.710 .635 Koenker 1.713 634 *The tests use the scaled residuals from the original OLS above with no adjustment to standard errors.
3.8.8 Design summary
The sequence of activities planned for the current research are summarized in table 3.4.
These activities frame the overall plan of the research which also known as research
design (Malhotra, Birks, & Wills, 2012).
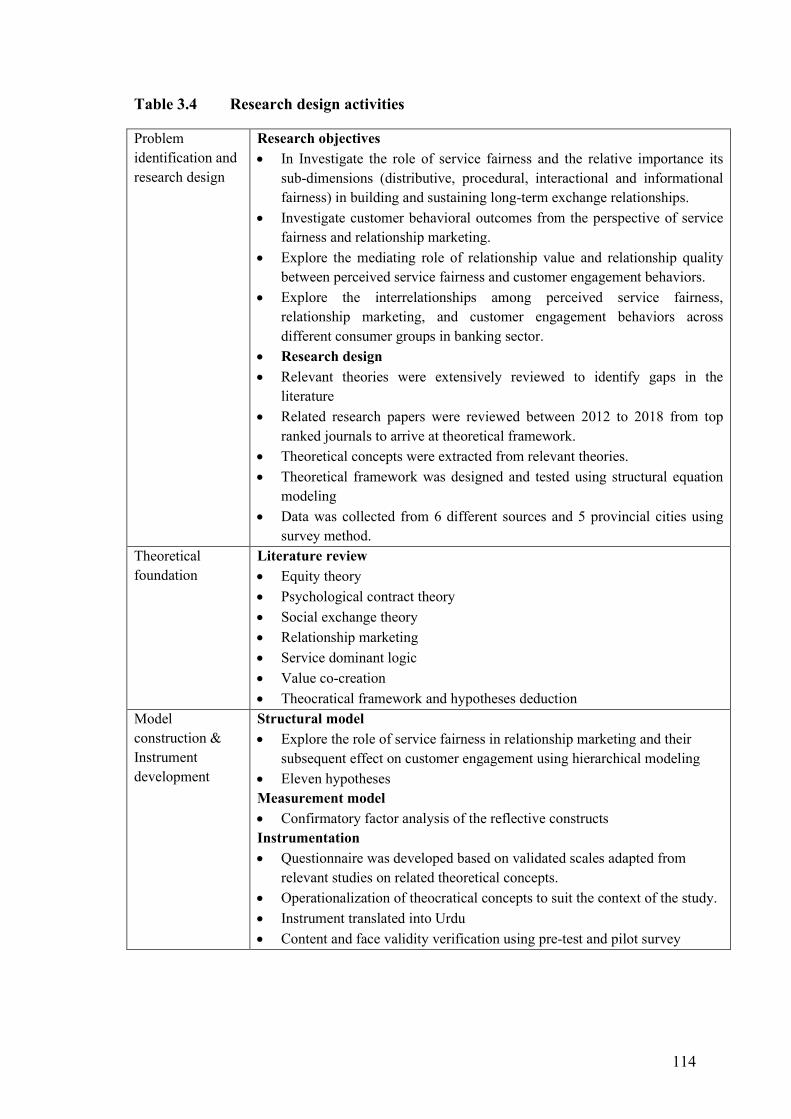
114
Table 3.4 Research design activities
Problem identification and research design
Research objectives • In Investigate the role of service fairness and the relative importance its
sub-dimensions (distributive, procedural, interactional and informational fairness) in building and sustaining long-term exchange relationships.
• Investigate customer behavioral outcomes from the perspective of service fairness and relationship marketing.
• Explore the mediating role of relationship value and relationship quality between perceived service fairness and customer engagement behaviors.
• Explore the interrelationships among perceived service fairness, relationship marketing, and customer engagement behaviors across different consumer groups in banking sector.
• Research design • Relevant theories were extensively reviewed to identify gaps in the
literature • Related research papers were reviewed between 2012 to 2018 from top
ranked journals to arrive at theoretical framework. • Theoretical concepts were extracted from relevant theories. • Theoretical framework was designed and tested using structural equation
modeling • Data was collected from 6 different sources and 5 provincial cities using
survey method. Theoretical foundation
Literature review • Equity theory • Psychological contract theory • Social exchange theory • Relationship marketing • Service dominant logic • Value co-creation • Theocratical framework and hypotheses deduction
Model construction & Instrument development
Structural model • Explore the role of service fairness in relationship marketing and their
subsequent effect on customer engagement using hierarchical modeling • Eleven hypotheses Measurement model • Confirmatory factor analysis of the reflective constructs Instrumentation • Questionnaire was developed based on validated scales adapted from
relevant studies on related theoretical concepts. • Operationalization of theocratical concepts to suit the context of the study. • Instrument translated into Urdu • Content and face validity verification using pre-test and pilot survey
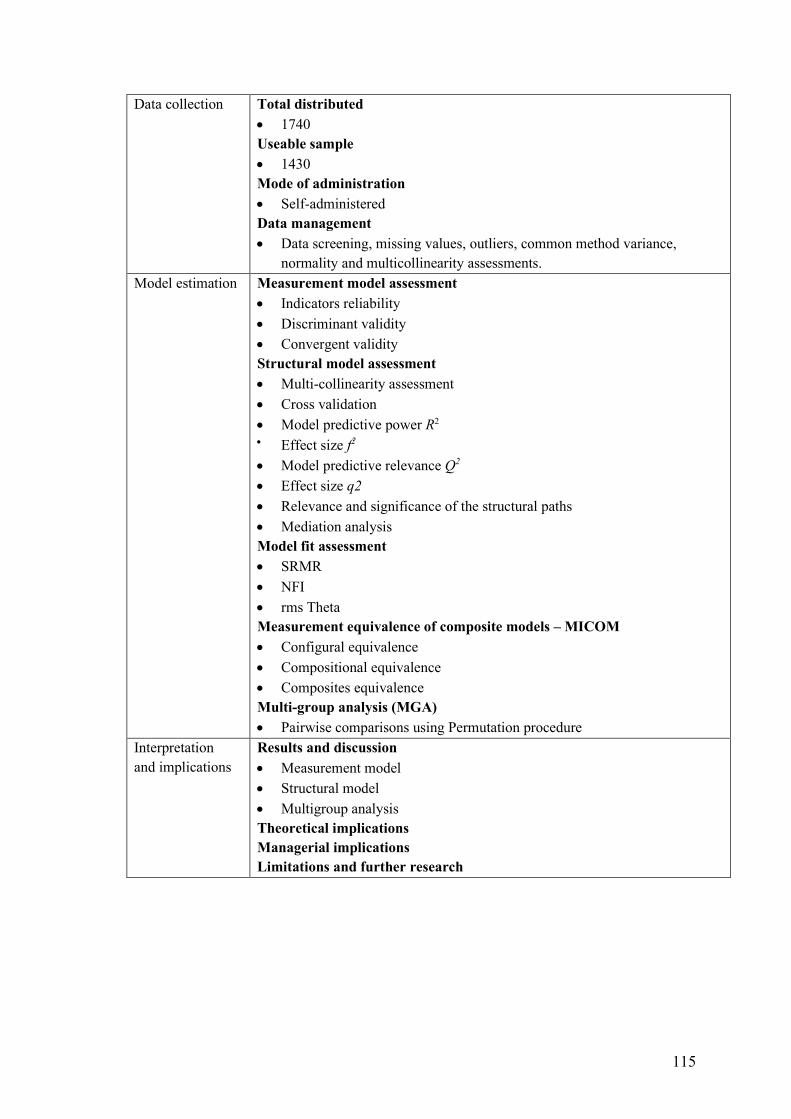
115
Data collection Total distributed • 1740 Useable sample • 1430 Mode of administration • Self-administered Data management • Data screening, missing values, outliers, common method variance,
normality and multicollinearity assessments. Model estimation Measurement model assessment
• Indicators reliability • Discriminant validity • Convergent validity Structural model assessment • Multi-collinearity assessment • Cross validation • Model predictive power R2 • Effect size f2
• Model predictive relevance Q2 • Effect size q2 • Relevance and significance of the structural paths • Mediation analysis Model fit assessment • SRMR • NFI • rms Theta Measurement equivalence of composite models – MICOM • Configural equivalence • Compositional equivalence • Composites equivalence Multi-group analysis (MGA) • Pairwise comparisons using Permutation procedure
Interpretation and implications
Results and discussion • Measurement model • Structural model • Multigroup analysis Theoretical implications Managerial implications Limitations and further research
116
Chapter 4
RESULTS AND DISCUSSION
4.1 Chapter overview
This chapter presents the results and provide a detailed discussion based on the study
findings. This chapter is divided into seven sections. The opening Section 4.1 describes
the demographic profile of the respondent. Section 4.2 provide descriptive statistics on
the responses received on each questionnaire items. Section 4.3 outline the sequence of
data analysis. Section 4.4 provide detailed discussion on the results of measurement
model that included confirming factor analysis (indicator reliability, convergent and
discriminant validity). Section 4.5 provide detailed discussion on the results of
structural model including the significance and relevance of path model, mediation and
overall model predictive power and relevance. Section 4.6 presents discussion about the
hypotheses results in relation to the objectives of the research. The results of multi-
group comparisons are reported and discussed in Section 4.7 in detail. Section 4.8
provide detailed account of measurement invariance (MICOM) between all 6 groups.
Section 4.9 addresses the multigroup analysis- MGA and provide comprehensive
discussion regarding significance differences among group specific estimates (e.g.
direct and indirect path differences, R2) between all the groups. The last section
provided a detailed discussion about the key findings of the study in the light objectives
of the study.
4.2 Demographic profile of participants
Demographic profile of participants was analyzed using SPSS v.25. A total of (n=1340)
banking consumers participated in the survey. The total sample (n=1340) was
comprised of sub samples i.e. n=240 from public, n=280 from private, n=220 from
specialized, n=240 from foreign, n=200 from micro-finance and n=250 from Islamic
banking consumers. Out of the total sample majority of respondents were male
(n=1384, 97%) while female participation remained significantly low (n=46, 3%).
Majority of participants were married (n=916, 64%) which almost doubled the size of
single participants (n=514, 36 %) in the total sample. The number of respondents under
the age 20 and above 65 were as low as (n=14, 1%), (n=30, 2%) respectively,
participation between the age 41 to 50 and 51 to 65 remained medium (n=156, 10.9%),
117
(n=143, 10%) while higher participation was accounted for age categories between 26
to 30 (n=415, 29%), between age 31 to 40 (n=386, 27%) and between the age 21 to 25
(n=286, 20%) respectively. Majority of the banking consumers had bachelor (n=691,
48%) or master degree (n=340, 23%), similar participation for intermediate (n=173,
12%) and metric or less educational qualification (n=156, 11%) was observed.
Consumers having higher qualifications than masters were only (n=70, 4%). Majority
of the banking consumers in the sample were either professionals (n=573, 40%), or
business owners (n=499, 35%). A significant number of respondents in the sample
were unemployed (n=163, 11%). A total of (n=129, 9%) were students, while (n=44,
3%) chose not to answer about their profession. All the respondents have at least
received banking service once during a year while majority (>70%) were active
recipients of banking services. Among these (n=353, 25%) have visited a branch once a
in a week, (n=240, 17%) have visited the branch once in two weeks, similarly about
(n=233, 16%) in a month and (n=187, 13%) have visited the branch every day. About
28% of the total consumers (n=48, 3%) have visited the branch at least once in two
months, about (n=85, 6%) consumers between 3 to 6 months and (n=60, 4%) in more
than 6 months. Those consumers who used Internet banking services (n=227, 16%)
were about 5 times less than non-users (n=1203, 84%) in the study sample. The number
of respondents recruited were from Karachi (n=561, 39%), Lahore (n=441, 31%),
Peshawar (n=213, 15%), Islamabad, (n=141, 10%) and from Quetta (n=74, 5%). These
demographic characteristics are summarized in table 4.1.

118
Table 4.1 Demographic Profile of All Banking Consumers (n=1430)
Sr# Demographic Variable Frequency Percentage
1 Gender Male 1384 96.8 Female 46 3.2
2 Marital status
Single 514 35.9 Married 916 64.1
3 Age Under 20 14 1.0 21-25 286 20.0 26-30 415 29.0 31-40 386 27.0 41-50 156 10.9 51-65 143 10.0 Above 65 30 2.1
4 Education Metric or below 156 10.9 Intermediate 173 12.1 Bachelor 691 48.3 Master 340 23.8 Above 70 4.9
5 Occupation Student 129 9.0 Working professional 573 40.1 Business 499 34.9 Housewife 22 1.5 unemployed 163 11.4 Others 44 3.1
6 City Peshawar 213 14.9 Lahore 441 30.8 Karachi 561 39.2 Islamabad 141 9.9 Quetta 74 5.2
7 Usage frequency
Everyday 187 13.1 Several times a week 224 15.7 Once a week 353 24.7 Once in two weeks 240 16.8 Once a month 233 16.3 Once in two months 48 3.4 Once in 3 to 6 months 85 5.9 Once in more than 6 months 60 4.2
8 Internet banking use
No 1203 84.1 Yes 227 15.9
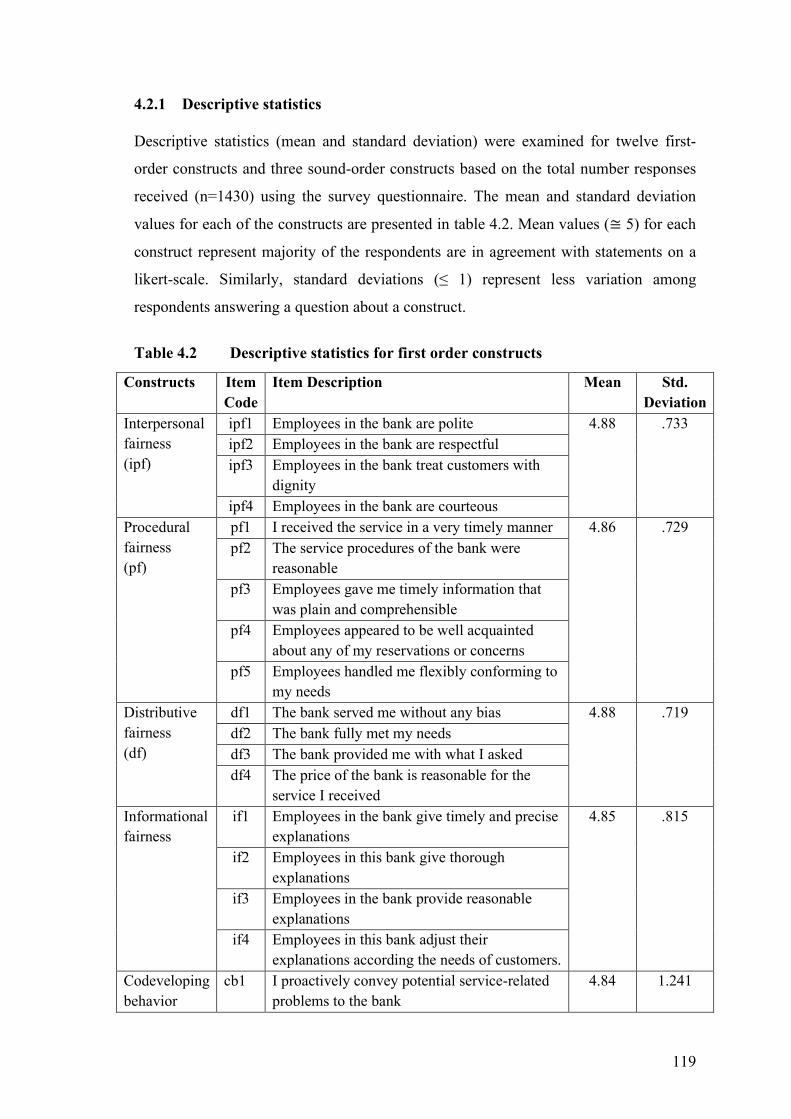
119
4.2.1 Descriptive statistics
Descriptive statistics (mean and standard deviation) were examined for twelve first-
order constructs and three sound-order constructs based on the total number responses
received (n=1430) using the survey questionnaire. The mean and standard deviation
values for each of the constructs are presented in table 4.2. Mean values (≅ 5) for each
construct represent majority of the respondents are in agreement with statements on a
likert-scale. Similarly, standard deviations (≤ 1) represent less variation among
respondents answering a question about a construct.
Table 4.2 Descriptive statistics for first order constructs
Constructs Item Code
Item Description Mean Std. Deviation
Interpersonal fairness (ipf)
ipf1 Employees in the bank are polite 4.88 .733 ipf2 Employees in the bank are respectful ipf3 Employees in the bank treat customers with
dignity ipf4 Employees in the bank are courteous
Procedural fairness (pf)
pf1 I received the service in a very timely manner 4.86 .729 pf2 The service procedures of the bank were
reasonable pf3 Employees gave me timely information that
was plain and comprehensible pf4 Employees appeared to be well acquainted
about any of my reservations or concerns pf5 Employees handled me flexibly conforming to
my needs Distributive fairness (df)
df1 The bank served me without any bias 4.88 .719 df2 The bank fully met my needs df3 The bank provided me with what I asked df4 The price of the bank is reasonable for the
service I received Informational fairness
if1 Employees in the bank give timely and precise explanations
4.85 .815
if2 Employees in this bank give thorough explanations
if3 Employees in the bank provide reasonable explanations
if4 Employees in this bank adjust their explanations according the needs of customers.
Codeveloping behavior
cb1 I proactively convey potential service-related problems to the bank
4.84 1.241
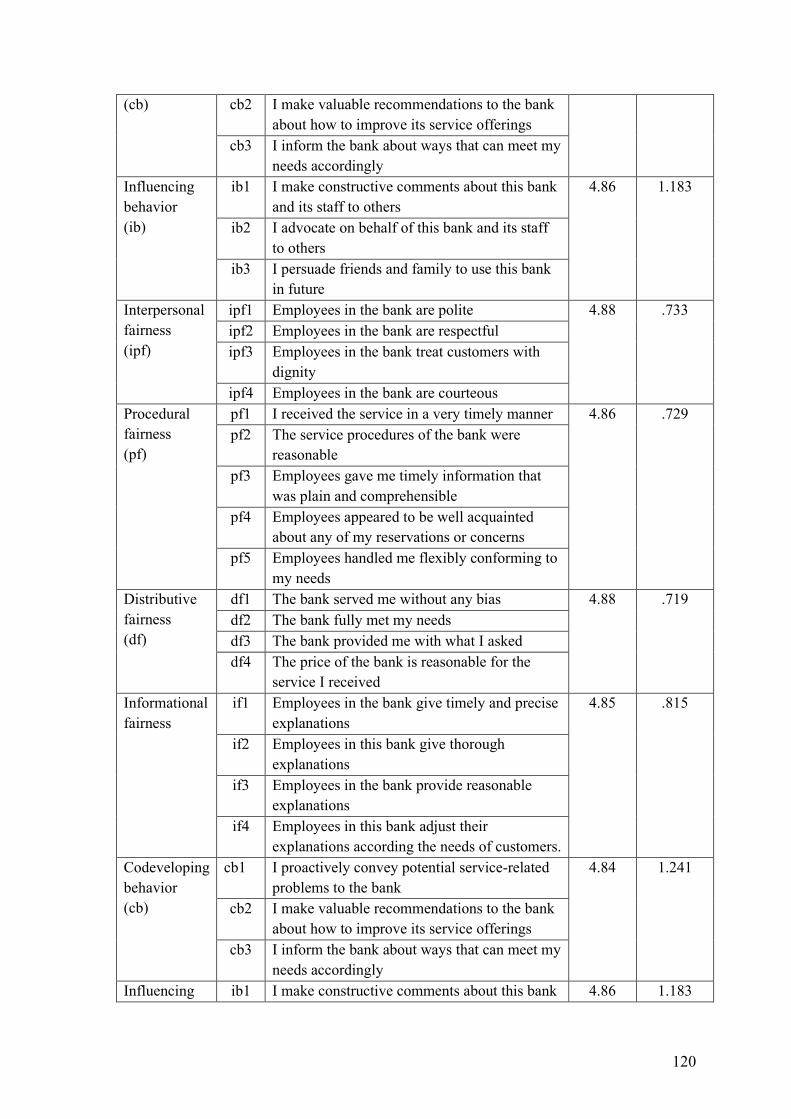
120
(cb) cb2 I make valuable recommendations to the bank about how to improve its service offerings
cb3 I inform the bank about ways that can meet my needs accordingly
Influencing behavior (ib)
ib1 I make constructive comments about this bank and its staff to others
4.86 1.183
ib2 I advocate on behalf of this bank and its staff to others
ib3 I persuade friends and family to use this bank in future
Interpersonal fairness (ipf)
ipf1 Employees in the bank are polite 4.88 .733 ipf2 Employees in the bank are respectful ipf3 Employees in the bank treat customers with
dignity ipf4 Employees in the bank are courteous
Procedural fairness (pf)
pf1 I received the service in a very timely manner 4.86 .729 pf2 The service procedures of the bank were
reasonable pf3 Employees gave me timely information that
was plain and comprehensible pf4 Employees appeared to be well acquainted
about any of my reservations or concerns pf5 Employees handled me flexibly conforming to
my needs Distributive fairness (df)
df1 The bank served me without any bias 4.88 .719 df2 The bank fully met my needs df3 The bank provided me with what I asked df4 The price of the bank is reasonable for the
service I received Informational fairness
if1 Employees in the bank give timely and precise explanations
4.85 .815
if2 Employees in this bank give thorough explanations
if3 Employees in the bank provide reasonable explanations
if4 Employees in this bank adjust their explanations according the needs of customers.
Codeveloping behavior (cb)
cb1 I proactively convey potential service-related problems to the bank
4.84 1.241
cb2 I make valuable recommendations to the bank about how to improve its service offerings
cb3 I inform the bank about ways that can meet my needs accordingly
Influencing ib1 I make constructive comments about this bank 4.86 1.183
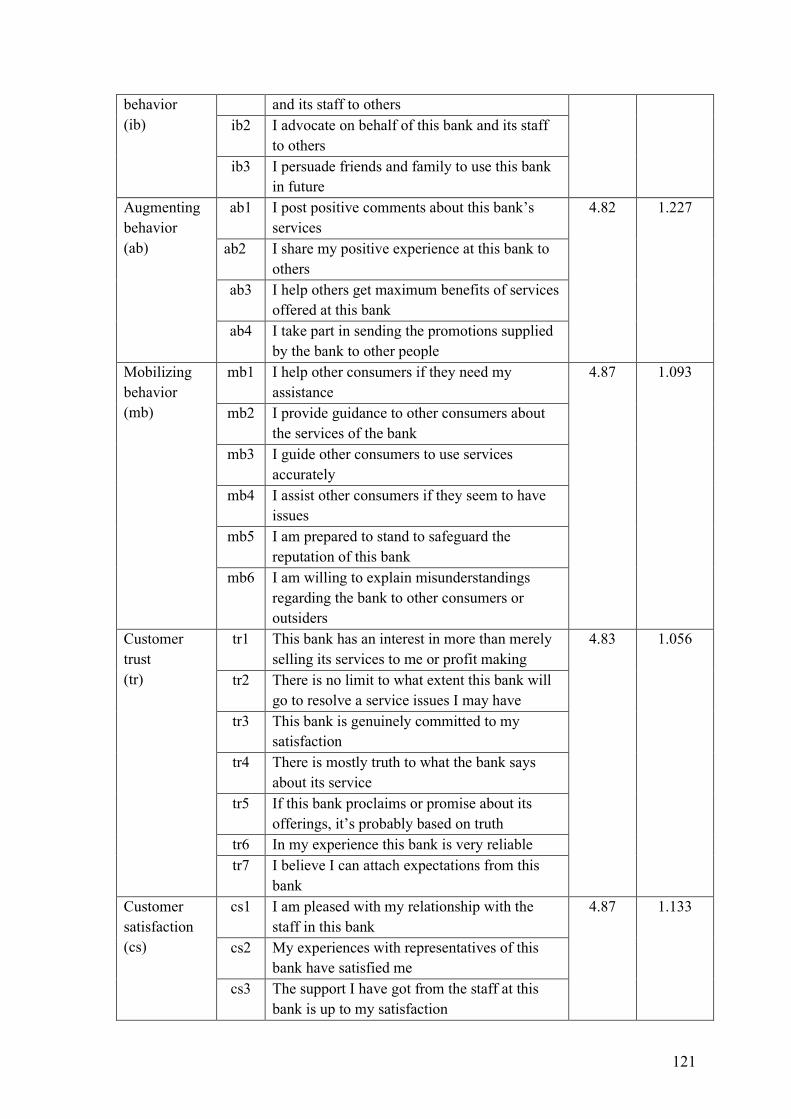
121
behavior (ib)
and its staff to others ib2 I advocate on behalf of this bank and its staff
to others ib3 I persuade friends and family to use this bank
in future Augmenting behavior (ab)
ab1 I post positive comments about this bank’s services
4.82 1.227
ab2 I share my positive experience at this bank to others
ab3 I help others get maximum benefits of services offered at this bank
ab4 I take part in sending the promotions supplied by the bank to other people
Mobilizing behavior (mb)
mb1 I help other consumers if they need my assistance
4.87 1.093
mb2 I provide guidance to other consumers about the services of the bank
mb3 I guide other consumers to use services accurately
mb4 I assist other consumers if they seem to have issues
mb5 I am prepared to stand to safeguard the reputation of this bank
mb6 I am willing to explain misunderstandings regarding the bank to other consumers or outsiders
Customer trust (tr)
tr1 This bank has an interest in more than merely selling its services to me or profit making
4.83 1.056
tr2 There is no limit to what extent this bank will go to resolve a service issues I may have
tr3 This bank is genuinely committed to my satisfaction
tr4 There is mostly truth to what the bank says about its service
tr5 If this bank proclaims or promise about its offerings, it’s probably based on truth
tr6 In my experience this bank is very reliable tr7 I believe I can attach expectations from this
bank Customer satisfaction (cs)
cs1 I am pleased with my relationship with the staff in this bank
4.87 1.133
cs2 My experiences with representatives of this bank have satisfied me
cs3 The support I have got from the staff at this bank is up to my satisfaction
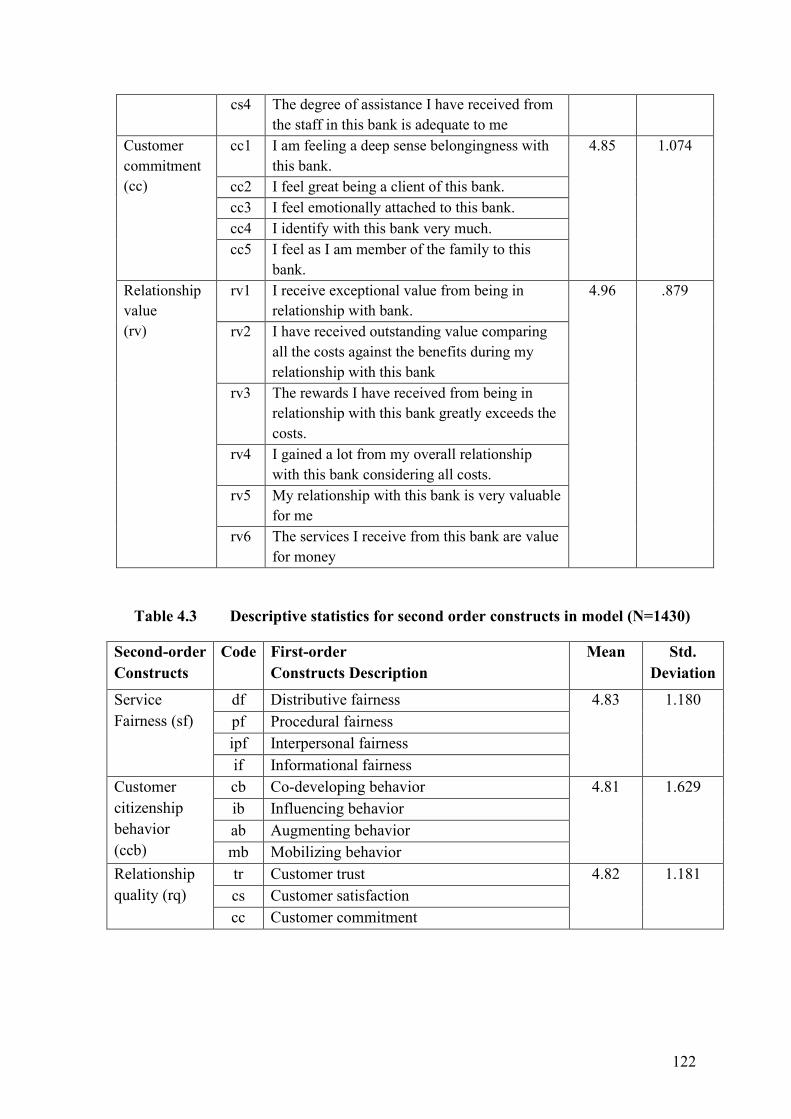
122
cs4 The degree of assistance I have received from the staff in this bank is adequate to me
Customer commitment (cc)
cc1 I am feeling a deep sense belongingness with this bank.
4.85 1.074
cc2 I feel great being a client of this bank. cc3 I feel emotionally attached to this bank. cc4 I identify with this bank very much. cc5 I feel as I am member of the family to this
bank. Relationship value (rv)
rv1 I receive exceptional value from being in relationship with bank.
4.96 .879
rv2 I have received outstanding value comparing all the costs against the benefits during my relationship with this bank
rv3 The rewards I have received from being in relationship with this bank greatly exceeds the costs.
rv4 I gained a lot from my overall relationship with this bank considering all costs.
rv5 My relationship with this bank is very valuable for me
rv6 The services I receive from this bank are value for money
Table 4.3 Descriptive statistics for second order constructs in model (N=1430)
Second-order Constructs
Code First-order Constructs Description
Mean Std. Deviation
Service Fairness (sf)
df Distributive fairness 4.83 1.180 pf Procedural fairness ipf Interpersonal fairness if Informational fairness
Customer citizenship behavior (ccb)
cb Co-developing behavior 4.81 1.629 ib Influencing behavior ab Augmenting behavior mb Mobilizing behavior
Relationship quality (rq)
tr Customer trust 4.82 1.181 cs Customer satisfaction cc Customer commitment
123
4.3 Data analysis
Analysis of partial least squared SEM modeling uses a two staged procedure which
require separate evaluation of measurement model (outer model) followed by
evaluation of structural model (inner model). The measurement model which specifies
the estimated relationship between the observed (indicator) variables within each
construct is tested for reliability and validity. When the indicators adequately confirm
their respective constructs the path relationship between constructs can therefore be
tested to predict or confirm the hypothesized relationship between latent constructs in
the structural model. The following sections report the analysis of measurement model
and structural model.
4.4 Measurement model assessment
A measurement model confirms the relationships between indicators and their
constructs through estimation of reliability and validity measures. After measurement
model specification these empirical measures were estimated using default algorithm
settings in SMART PLS 3.2.7 (the recommended settings include: a limit of maximum
of 300 iterations per run, path weighting schema, factor weighting schema, equal
indicator weights and a stop criterion of 1 x 10^7 (or 0.0000001) (Henseler, Hubona,
& Ray, 2017). The results of the measurement model were assessed on three levels;
first, internal consistency reliability was estimated based on composite reliability (CR),
indicator reliability (loading squared), and Cronbach’s α (alpha) values. Second,
convergent validity was estimated based on the average variance extracted (AVE) and
the outer loadings of the indicators. Third, discriminant validity was assessed using
items cross loading, Fornell-Larcker criterion and Heterotrait-Monotrait Ratio (HTMT).
4.4.1 Internal consistency reliability
The quality of measurement model was first evaluated by the internal consistency
reliability of measures. Table 4.4 presents the composite reliability (CR), indicator
reliability (loading squared), and Cronbach’s alpha (α) values. The results indicate that
the measurement model exhibit satisfactory levels internal consistency reliability as the
composite reliability (CR) of each construct is between the recommended threshold
rage i.e. below the upper limit 0.95 and exceeding the lower limit 0.70 and (Hair et al.,
2017). The value of Cronbach’s (α) for each of the construct was greater than > 0.8
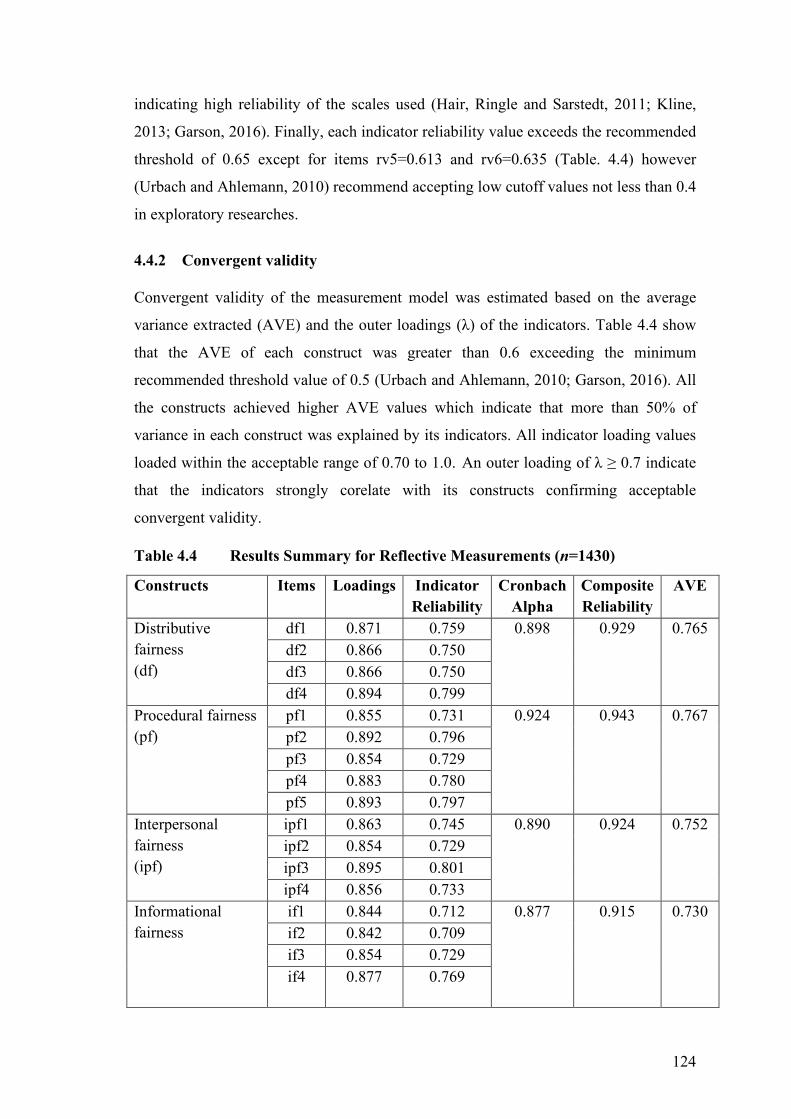
124
indicating high reliability of the scales used (Hair, Ringle and Sarstedt, 2011; Kline,
2013; Garson, 2016). Finally, each indicator reliability value exceeds the recommended
threshold of 0.65 except for items rv5=0.613 and rv6=0.635 (Table. 4.4) however
(Urbach and Ahlemann, 2010) recommend accepting low cutoff values not less than 0.4
in exploratory researches.
4.4.2 Convergent validity
Convergent validity of the measurement model was estimated based on the average
variance extracted (AVE) and the outer loadings (λ) of the indicators. Table 4.4 show
that the AVE of each construct was greater than 0.6 exceeding the minimum
recommended threshold value of 0.5 (Urbach and Ahlemann, 2010; Garson, 2016). All
the constructs achieved higher AVE values which indicate that more than 50% of
variance in each construct was explained by its indicators. All indicator loading values
loaded within the acceptable range of 0.70 to 1.0. An outer loading of λ ≥ 0.7 indicate
that the indicators strongly corelate with its constructs confirming acceptable
convergent validity.
Table 4.4 Results Summary for Reflective Measurements (n=1430)
Constructs Items Loadings Indicator Reliability
Cronbach Alpha
Composite Reliability
AVE
Distributive fairness (df)
df1 0.871 0.759 0.898 0.929 0.765 df2 0.866 0.750 df3 0.866 0.750 df4 0.894 0.799
Procedural fairness (pf)
pf1 0.855 0.731 0.924 0.943 0.767 pf2 0.892 0.796 pf3 0.854 0.729 pf4 0.883 0.780 pf5 0.893 0.797
Interpersonal fairness (ipf)
ipf1 0.863 0.745 0.890 0.924 0.752 ipf2 0.854 0.729 ipf3 0.895 0.801 ipf4 0.856 0.733
Informational fairness
if1 0.844 0.712 0.877 0.915 0.730
if2 0.842 0.709 if3 0.854 0.729 if4 0.877 0.769
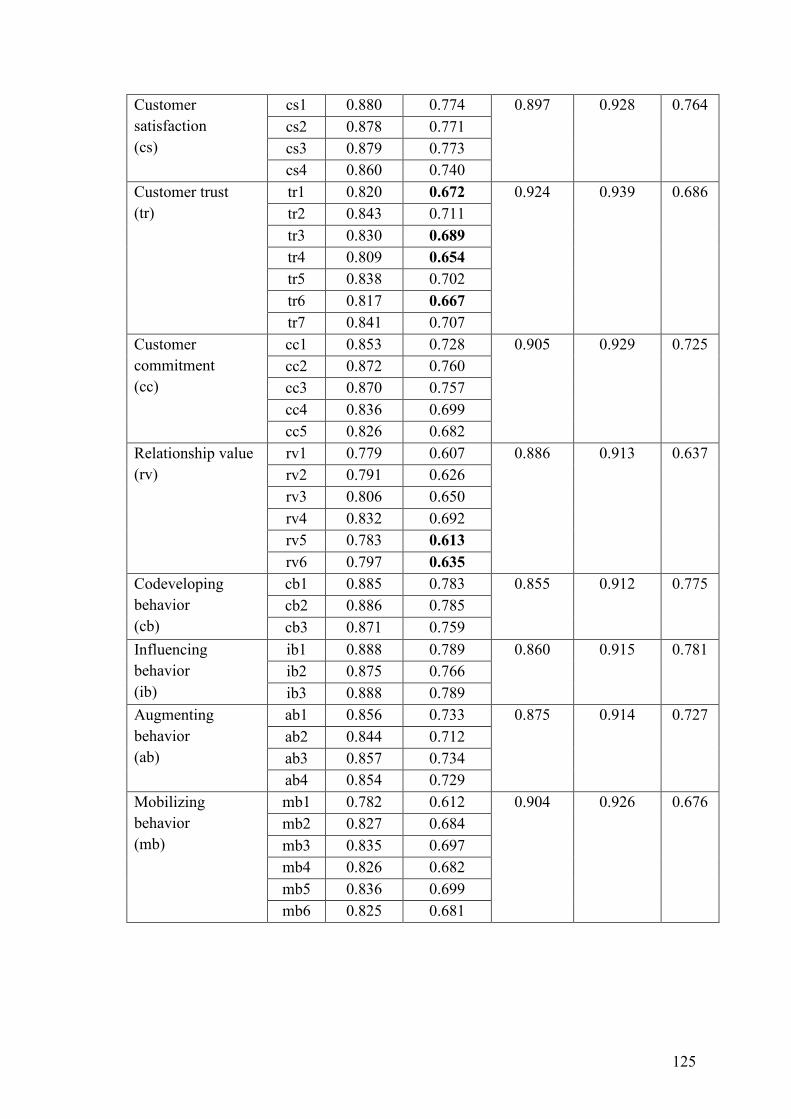
125
Customer satisfaction (cs)
cs1 0.880 0.774 0.897 0.928 0.764 cs2 0.878 0.771 cs3 0.879 0.773 cs4 0.860 0.740
Customer trust (tr)
tr1 0.820 0.672 0.924 0.939 0.686 tr2 0.843 0.711 tr3 0.830 0.689 tr4 0.809 0.654 tr5 0.838 0.702 tr6 0.817 0.667 tr7 0.841 0.707
Customer commitment (cc)
cc1 0.853 0.728 0.905 0.929 0.725 cc2 0.872 0.760 cc3 0.870 0.757 cc4 0.836 0.699 cc5 0.826 0.682
Relationship value (rv)
rv1 0.779 0.607 0.886 0.913 0.637 rv2 0.791 0.626 rv3 0.806 0.650 rv4 0.832 0.692 rv5 0.783 0.613 rv6 0.797 0.635
Codeveloping behavior (cb)
cb1 0.885 0.783 0.855 0.912 0.775 cb2 0.886 0.785 cb3 0.871 0.759
Influencing behavior (ib)
ib1 0.888 0.789 0.860 0.915 0.781 ib2 0.875 0.766 ib3 0.888 0.789
Augmenting behavior (ab)
ab1 0.856 0.733 0.875 0.914 0.727 ab2 0.844 0.712 ab3 0.857 0.734 ab4 0.854 0.729
Mobilizing behavior (mb)
mb1 0.782 0.612 0.904 0.926 0.676 mb2 0.827 0.684 mb3 0.835 0.697 mb4 0.826 0.682 mb5 0.836 0.699 mb6 0.825 0.681

126
4.4.3 Discriminant validity
Discriminant validity was assessed using items cross loading, Fornell-Larcker criterion
and Heterotrait-Monotrait Ratio (HTMT). Results are reported in sub-sections given
below:
4.4.3.1 Item cross loadings
Examination of the item cross loadings, indicated that: all indicators load highest only
on their respective constructs in terms of the cross-loadings. For instance, table 4.5
shows that items ab1, ab2, ab3, ab4 strongly load on its construct ab and so on and
therefore is shaded for illustration.
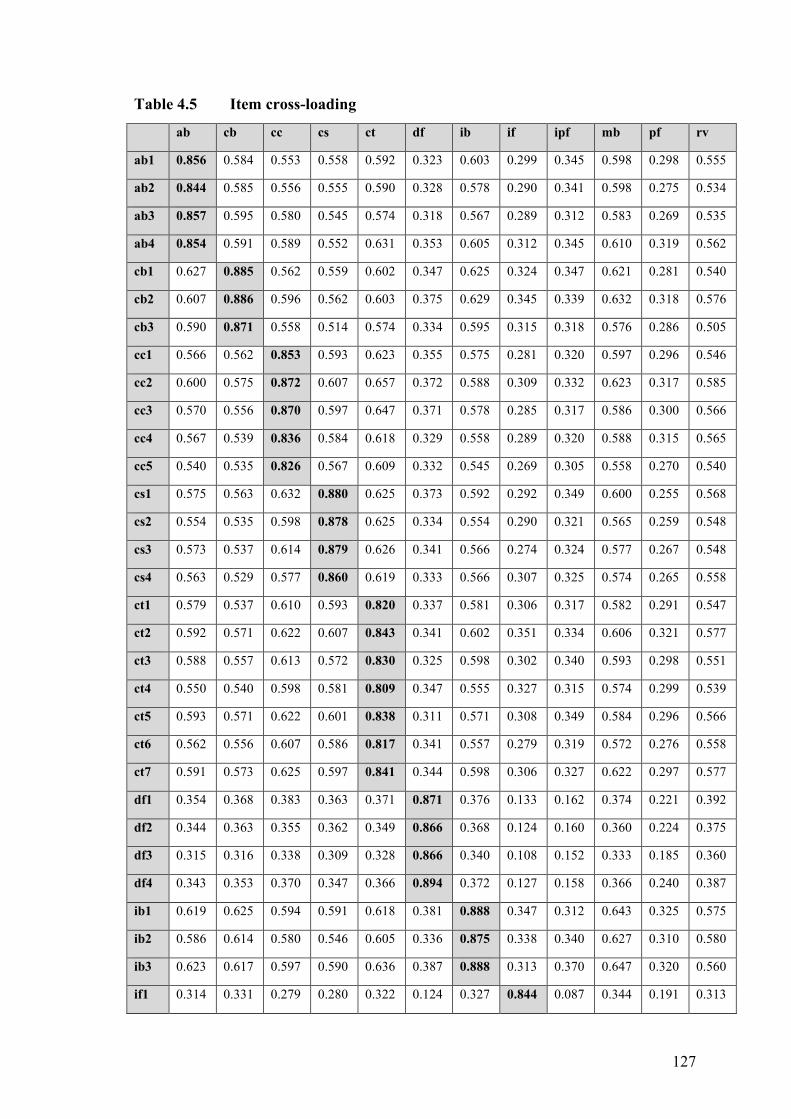
127
Table 4.5 Item cross-loading
ab cb cc cs ct df ib if ipf mb pf rv
ab1 0.856 0.584 0.553 0.558 0.592 0.323 0.603 0.299 0.345 0.598 0.298 0.555
ab2 0.844 0.585 0.556 0.555 0.590 0.328 0.578 0.290 0.341 0.598 0.275 0.534
ab3 0.857 0.595 0.580 0.545 0.574 0.318 0.567 0.289 0.312 0.583 0.269 0.535
ab4 0.854 0.591 0.589 0.552 0.631 0.353 0.605 0.312 0.345 0.610 0.319 0.562
cb1 0.627 0.885 0.562 0.559 0.602 0.347 0.625 0.324 0.347 0.621 0.281 0.540
cb2 0.607 0.886 0.596 0.562 0.603 0.375 0.629 0.345 0.339 0.632 0.318 0.576
cb3 0.590 0.871 0.558 0.514 0.574 0.334 0.595 0.315 0.318 0.576 0.286 0.505
cc1 0.566 0.562 0.853 0.593 0.623 0.355 0.575 0.281 0.320 0.597 0.296 0.546
cc2 0.600 0.575 0.872 0.607 0.657 0.372 0.588 0.309 0.332 0.623 0.317 0.585
cc3 0.570 0.556 0.870 0.597 0.647 0.371 0.578 0.285 0.317 0.586 0.300 0.566
cc4 0.567 0.539 0.836 0.584 0.618 0.329 0.558 0.289 0.320 0.588 0.315 0.565
cc5 0.540 0.535 0.826 0.567 0.609 0.332 0.545 0.269 0.305 0.558 0.270 0.540
cs1 0.575 0.563 0.632 0.880 0.625 0.373 0.592 0.292 0.349 0.600 0.255 0.568
cs2 0.554 0.535 0.598 0.878 0.625 0.334 0.554 0.290 0.321 0.565 0.259 0.548
cs3 0.573 0.537 0.614 0.879 0.626 0.341 0.566 0.274 0.324 0.577 0.267 0.548
cs4 0.563 0.529 0.577 0.860 0.619 0.333 0.566 0.307 0.325 0.574 0.265 0.558
ct1 0.579 0.537 0.610 0.593 0.820 0.337 0.581 0.306 0.317 0.582 0.291 0.547
ct2 0.592 0.571 0.622 0.607 0.843 0.341 0.602 0.351 0.334 0.606 0.321 0.577
ct3 0.588 0.557 0.613 0.572 0.830 0.325 0.598 0.302 0.340 0.593 0.298 0.551
ct4 0.550 0.540 0.598 0.581 0.809 0.347 0.555 0.327 0.315 0.574 0.299 0.539
ct5 0.593 0.571 0.622 0.601 0.838 0.311 0.571 0.308 0.349 0.584 0.296 0.566
ct6 0.562 0.556 0.607 0.586 0.817 0.341 0.557 0.279 0.319 0.572 0.276 0.558
ct7 0.591 0.573 0.625 0.597 0.841 0.344 0.598 0.306 0.327 0.622 0.297 0.577
df1 0.354 0.368 0.383 0.363 0.371 0.871 0.376 0.133 0.162 0.374 0.221 0.392
df2 0.344 0.363 0.355 0.362 0.349 0.866 0.368 0.124 0.160 0.360 0.224 0.375
df3 0.315 0.316 0.338 0.309 0.328 0.866 0.340 0.108 0.152 0.333 0.185 0.360
df4 0.343 0.353 0.370 0.347 0.366 0.894 0.372 0.127 0.158 0.366 0.240 0.387
ib1 0.619 0.625 0.594 0.591 0.618 0.381 0.888 0.347 0.312 0.643 0.325 0.575
ib2 0.586 0.614 0.580 0.546 0.605 0.336 0.875 0.338 0.340 0.627 0.310 0.580
ib3 0.623 0.617 0.597 0.590 0.636 0.387 0.888 0.313 0.370 0.647 0.320 0.560
if1 0.314 0.331 0.279 0.280 0.322 0.124 0.327 0.844 0.087 0.344 0.191 0.313
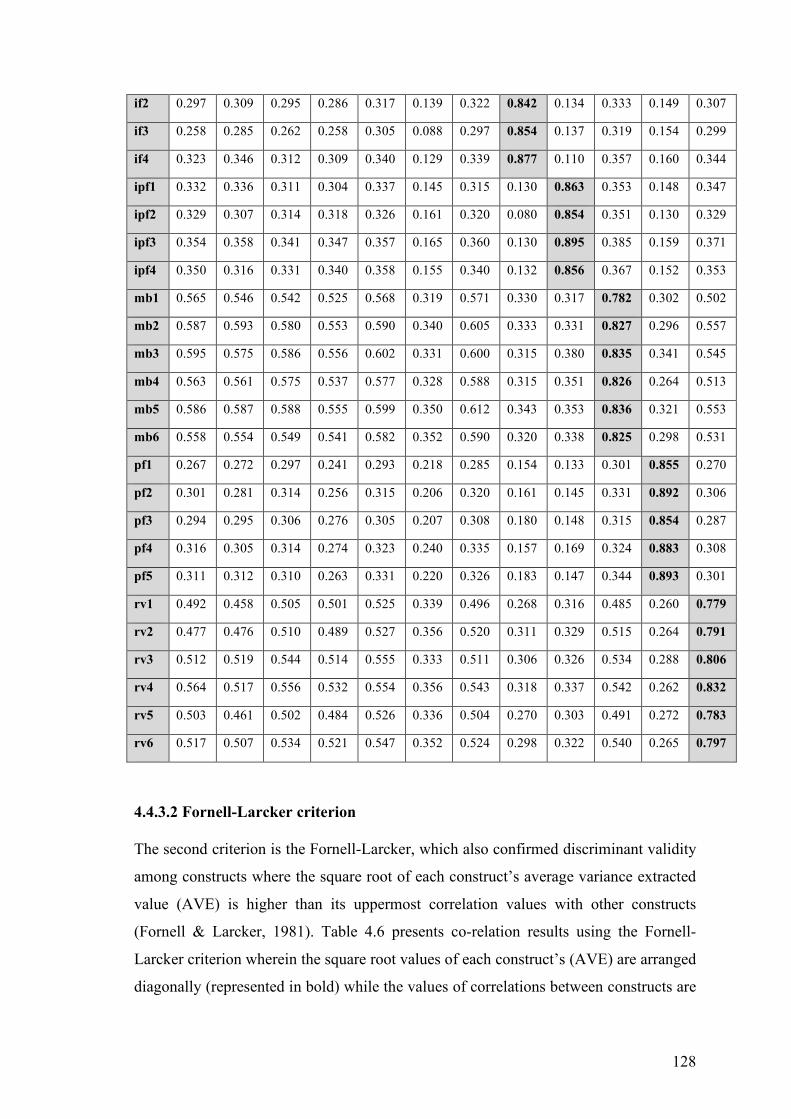
128
if2 0.297 0.309 0.295 0.286 0.317 0.139 0.322 0.842 0.134 0.333 0.149 0.307
if3 0.258 0.285 0.262 0.258 0.305 0.088 0.297 0.854 0.137 0.319 0.154 0.299
if4 0.323 0.346 0.312 0.309 0.340 0.129 0.339 0.877 0.110 0.357 0.160 0.344
ipf1 0.332 0.336 0.311 0.304 0.337 0.145 0.315 0.130 0.863 0.353 0.148 0.347
ipf2 0.329 0.307 0.314 0.318 0.326 0.161 0.320 0.080 0.854 0.351 0.130 0.329
ipf3 0.354 0.358 0.341 0.347 0.357 0.165 0.360 0.130 0.895 0.385 0.159 0.371
ipf4 0.350 0.316 0.331 0.340 0.358 0.155 0.340 0.132 0.856 0.367 0.152 0.353
mb1 0.565 0.546 0.542 0.525 0.568 0.319 0.571 0.330 0.317 0.782 0.302 0.502
mb2 0.587 0.593 0.580 0.553 0.590 0.340 0.605 0.333 0.331 0.827 0.296 0.557
mb3 0.595 0.575 0.586 0.556 0.602 0.331 0.600 0.315 0.380 0.835 0.341 0.545
mb4 0.563 0.561 0.575 0.537 0.577 0.328 0.588 0.315 0.351 0.826 0.264 0.513
mb5 0.586 0.587 0.588 0.555 0.599 0.350 0.612 0.343 0.353 0.836 0.321 0.553
mb6 0.558 0.554 0.549 0.541 0.582 0.352 0.590 0.320 0.338 0.825 0.298 0.531
pf1 0.267 0.272 0.297 0.241 0.293 0.218 0.285 0.154 0.133 0.301 0.855 0.270
pf2 0.301 0.281 0.314 0.256 0.315 0.206 0.320 0.161 0.145 0.331 0.892 0.306
pf3 0.294 0.295 0.306 0.276 0.305 0.207 0.308 0.180 0.148 0.315 0.854 0.287
pf4 0.316 0.305 0.314 0.274 0.323 0.240 0.335 0.157 0.169 0.324 0.883 0.308
pf5 0.311 0.312 0.310 0.263 0.331 0.220 0.326 0.183 0.147 0.344 0.893 0.301
rv1 0.492 0.458 0.505 0.501 0.525 0.339 0.496 0.268 0.316 0.485 0.260 0.779
rv2 0.477 0.476 0.510 0.489 0.527 0.356 0.520 0.311 0.329 0.515 0.264 0.791
rv3 0.512 0.519 0.544 0.514 0.555 0.333 0.511 0.306 0.326 0.534 0.288 0.806
rv4 0.564 0.517 0.556 0.532 0.554 0.356 0.543 0.318 0.337 0.542 0.262 0.832
rv5 0.503 0.461 0.502 0.484 0.526 0.336 0.504 0.270 0.303 0.491 0.272 0.783
rv6 0.517 0.507 0.534 0.521 0.547 0.352 0.524 0.298 0.322 0.540 0.265 0.797
4.4.3.2 Fornell-Larcker criterion
The second criterion is the Fornell-Larcker, which also confirmed discriminant validity
among constructs where the square root of each construct’s average variance extracted
value (AVE) is higher than its uppermost correlation values with other constructs
(Fornell & Larcker, 1981). Table 4.6 presents co-relation results using the Fornell-
Larcker criterion wherein the square root values of each construct’s (AVE) are arranged
diagonally (represented in bold) while the values of correlations between constructs are
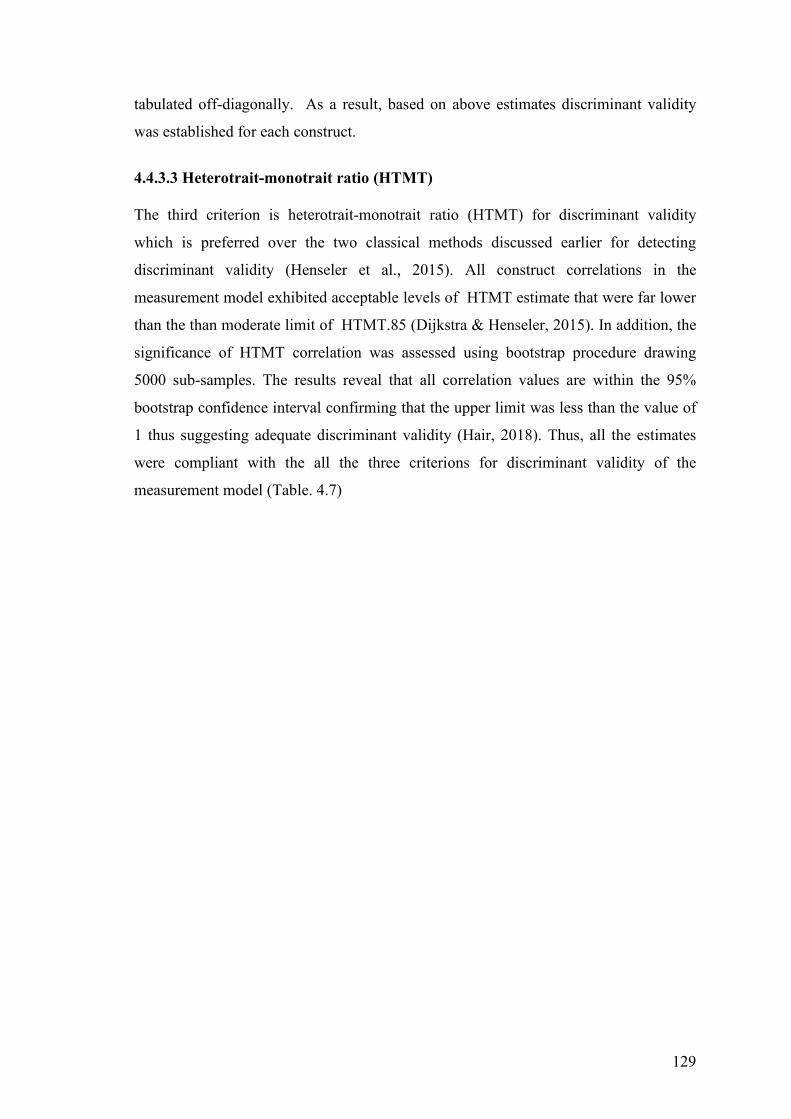
129
tabulated off-diagonally. As a result, based on above estimates discriminant validity
was established for each construct.
4.4.3.3 Heterotrait-monotrait ratio (HTMT)
The third criterion is heterotrait-monotrait ratio (HTMT) for discriminant validity
which is preferred over the two classical methods discussed earlier for detecting
discriminant validity (Henseler et al., 2015). All construct correlations in the
measurement model exhibited acceptable levels of HTMT estimate that were far lower
than the than moderate limit of HTMT.85 (Dijkstra & Henseler, 2015). In addition, the
significance of HTMT correlation was assessed using bootstrap procedure drawing
5000 sub-samples. The results reveal that all correlation values are within the 95%
bootstrap confidence interval confirming that the upper limit was less than the value of
1 thus suggesting adequate discriminant validity (Hair, 2018). Thus, all the estimates
were compliant with the all the three criterions for discriminant validity of the
measurement model (Table. 4.7)
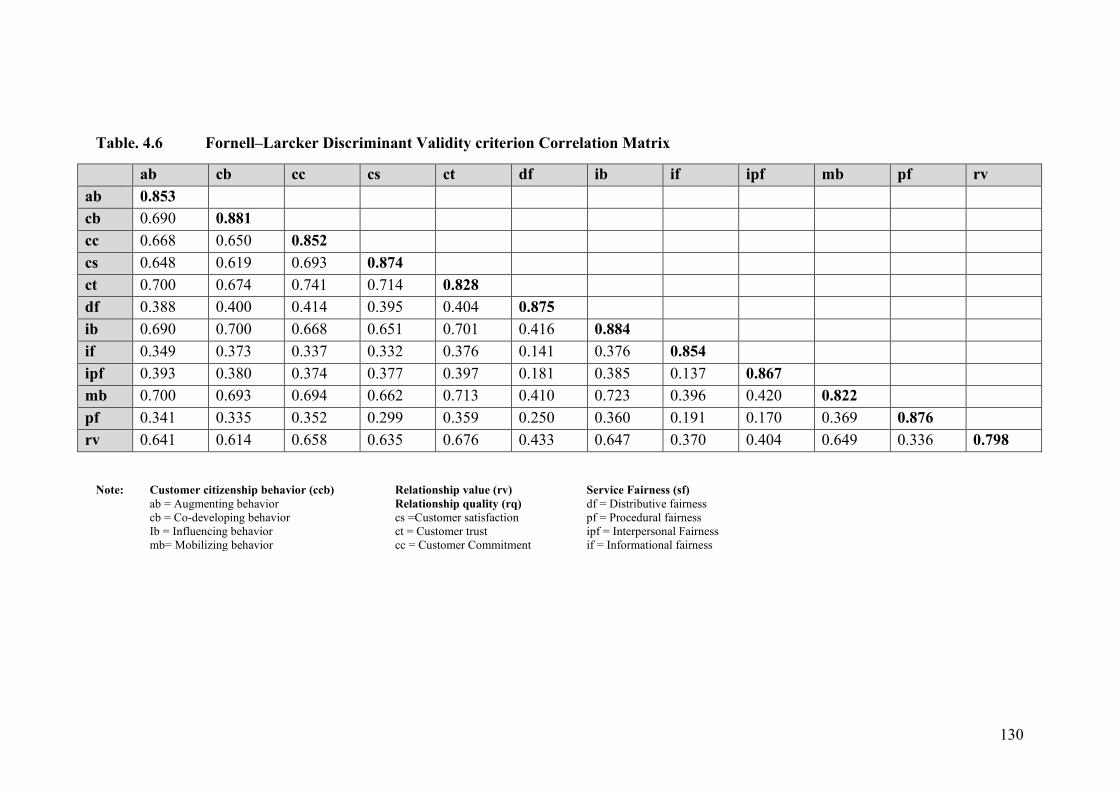
130
Table. 4.6 Fornell–Larcker Discriminant Validity criterion Correlation Matrix
ab cb cc cs ct df ib if ipf mb pf rv ab 0.853 cb 0.690 0.881 cc 0.668 0.650 0.852 cs 0.648 0.619 0.693 0.874 ct 0.700 0.674 0.741 0.714 0.828 df 0.388 0.400 0.414 0.395 0.404 0.875 ib 0.690 0.700 0.668 0.651 0.701 0.416 0.884 if 0.349 0.373 0.337 0.332 0.376 0.141 0.376 0.854 ipf 0.393 0.380 0.374 0.377 0.397 0.181 0.385 0.137 0.867 mb 0.700 0.693 0.694 0.662 0.713 0.410 0.723 0.396 0.420 0.822 pf 0.341 0.335 0.352 0.299 0.359 0.250 0.360 0.191 0.170 0.369 0.876 rv 0.641 0.614 0.658 0.635 0.676 0.433 0.647 0.370 0.404 0.649 0.336 0.798
Note: Customer citizenship behavior (ccb) ab = Augmenting behavior cb = Co-developing behavior Ib = Influencing behavior mb= Mobilizing behavior
Relationship value (rv) Relationship quality (rq)
Service Fairness (sf) df = Distributive fairness pf = Procedural fairness ipf = Interpersonal Fairness if = Informational fairness
cs =Customer satisfaction ct = Customer trust cc = Customer Commitment
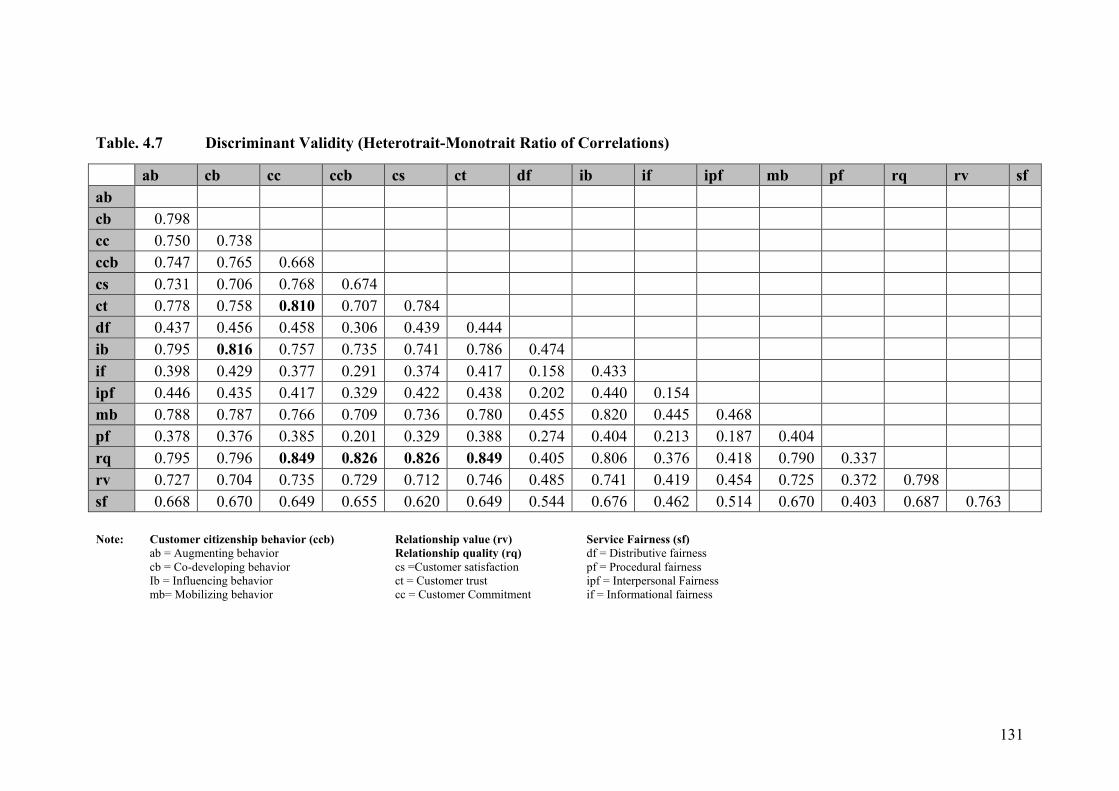
131
Table. 4.7 Discriminant Validity (Heterotrait-Monotrait Ratio of Correlations)
ab cb cc ccb cs ct df ib if ipf mb pf rq rv sf ab cb 0.798 cc 0.750 0.738 ccb 0.747 0.765 0.668 cs 0.731 0.706 0.768 0.674 ct 0.778 0.758 0.810 0.707 0.784 df 0.437 0.456 0.458 0.306 0.439 0.444 ib 0.795 0.816 0.757 0.735 0.741 0.786 0.474 if 0.398 0.429 0.377 0.291 0.374 0.417 0.158 0.433 ipf 0.446 0.435 0.417 0.329 0.422 0.438 0.202 0.440 0.154 mb 0.788 0.787 0.766 0.709 0.736 0.780 0.455 0.820 0.445 0.468 pf 0.378 0.376 0.385 0.201 0.329 0.388 0.274 0.404 0.213 0.187 0.404 rq 0.795 0.796 0.849 0.826 0.826 0.849 0.405 0.806 0.376 0.418 0.790 0.337 rv 0.727 0.704 0.735 0.729 0.712 0.746 0.485 0.741 0.419 0.454 0.725 0.372 0.798 sf 0.668 0.670 0.649 0.655 0.620 0.649 0.544 0.676 0.462 0.514 0.670 0.403 0.687 0.763 Note: Customer citizenship behavior (ccb)
ab = Augmenting behavior cb = Co-developing behavior Ib = Influencing behavior mb= Mobilizing behavior
Relationship value (rv) Relationship quality (rq)
Service Fairness (sf) df = Distributive fairness pf = Procedural fairness ipf = Interpersonal Fairness if = Informational fairness
cs =Customer satisfaction ct = Customer trust cc = Customer Commitment
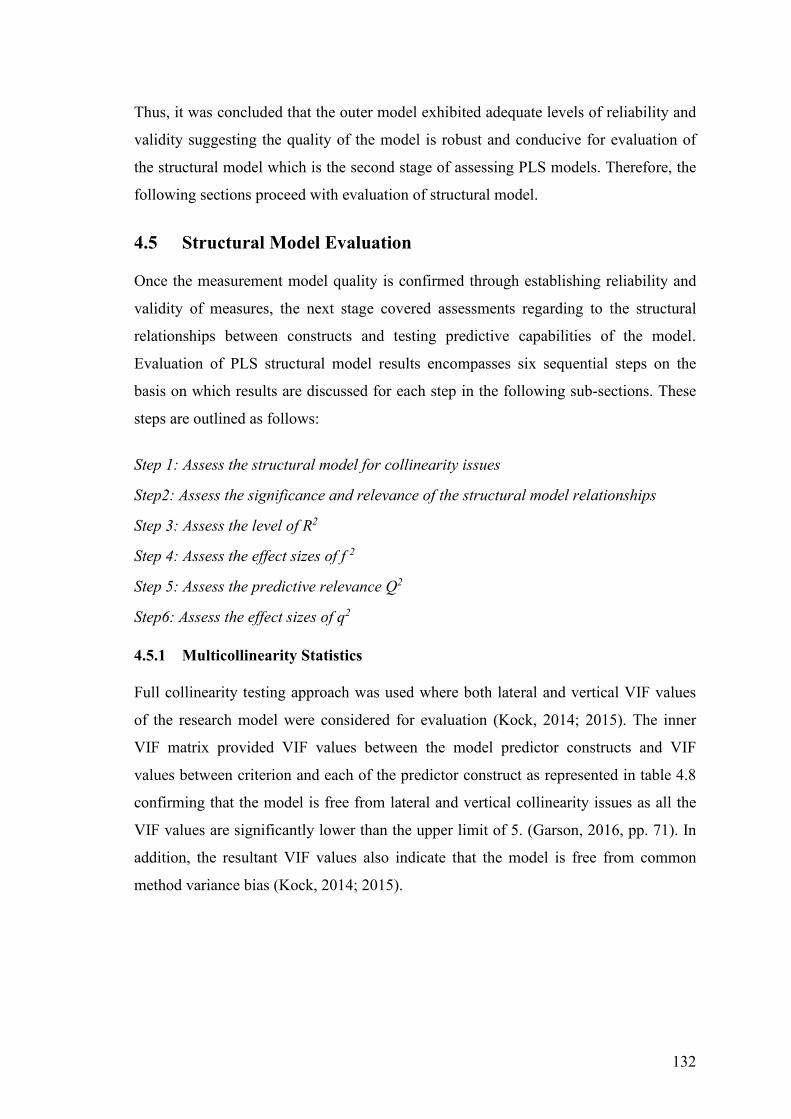
132
Thus, it was concluded that the outer model exhibited adequate levels of reliability and
validity suggesting the quality of the model is robust and conducive for evaluation of
the structural model which is the second stage of assessing PLS models. Therefore, the
following sections proceed with evaluation of structural model.
4.5 Structural Model Evaluation
Once the measurement model quality is confirmed through establishing reliability and
validity of measures, the next stage covered assessments regarding to the structural
relationships between constructs and testing predictive capabilities of the model.
Evaluation of PLS structural model results encompasses six sequential steps on the
basis on which results are discussed for each step in the following sub-sections. These
steps are outlined as follows:
Step 1: Assess the structural model for collinearity issues
Step2: Assess the significance and relevance of the structural model relationships
Step 3: Assess the level of R2
Step 4: Assess the effect sizes of f 2
Step 5: Assess the predictive relevance Q2
Step6: Assess the effect sizes of q2
4.5.1 Multicollinearity Statistics
Full collinearity testing approach was used where both lateral and vertical VIF values
of the research model were considered for evaluation (Kock, 2014; 2015). The inner
VIF matrix provided VIF values between the model predictor constructs and VIF
values between criterion and each of the predictor construct as represented in table 4.8
confirming that the model is free from lateral and vertical collinearity issues as all the
VIF values are significantly lower than the upper limit of 5. (Garson, 2016, pp. 71). In
addition, the resultant VIF values also indicate that the model is free from common
method variance bias (Kock, 2014; 2015).
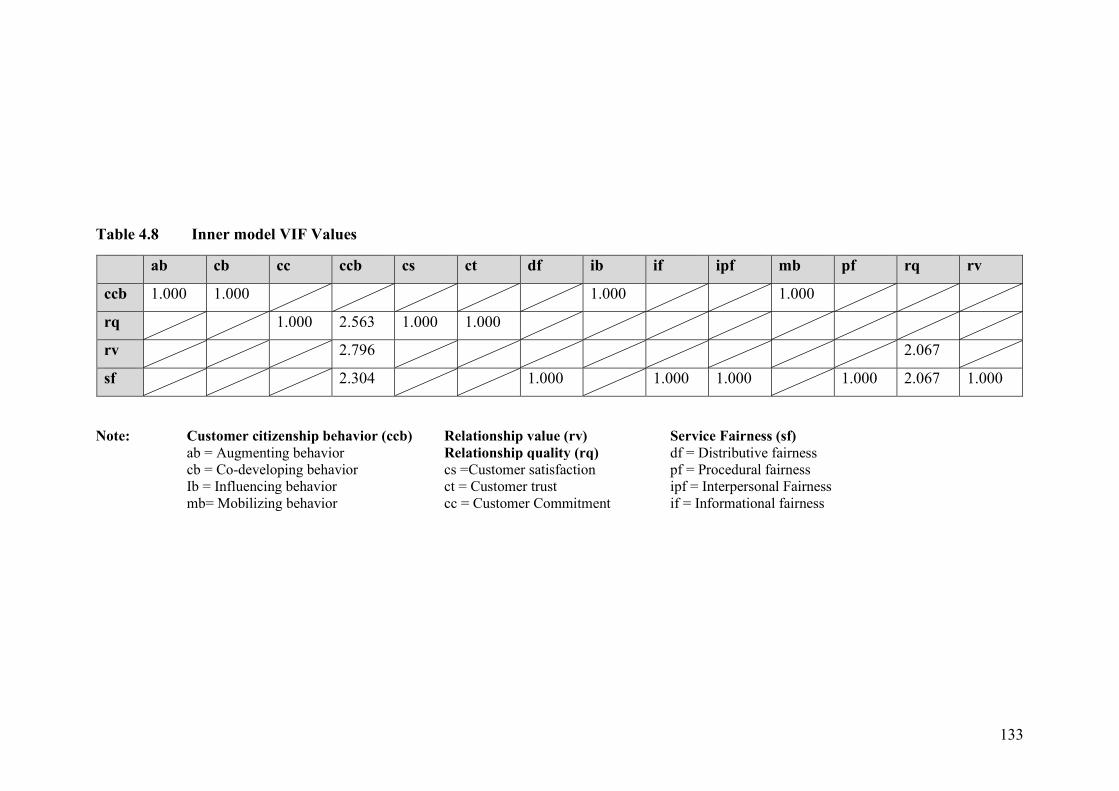
133
Table 4.8 Inner model VIF Values
ab cb cc ccb cs ct df ib if ipf mb pf rq rv
ccb 1.000 1.000 1.000 1.000
rq 1.000 2.563 1.000 1.000
rv 2.796 2.067
sf 2.304 1.000 1.000 1.000 1.000 2.067 1.000
Note: Customer citizenship behavior (ccb) ab = Augmenting behavior cb = Co-developing behavior Ib = Influencing behavior mb= Mobilizing behavior
Relationship value (rv) Relationship quality (rq)
Service Fairness (sf) df = Distributive fairness pf = Procedural fairness ipf = Interpersonal Fairness if = Informational fairness
cs =Customer satisfaction ct = Customer trust cc = Customer Commitment
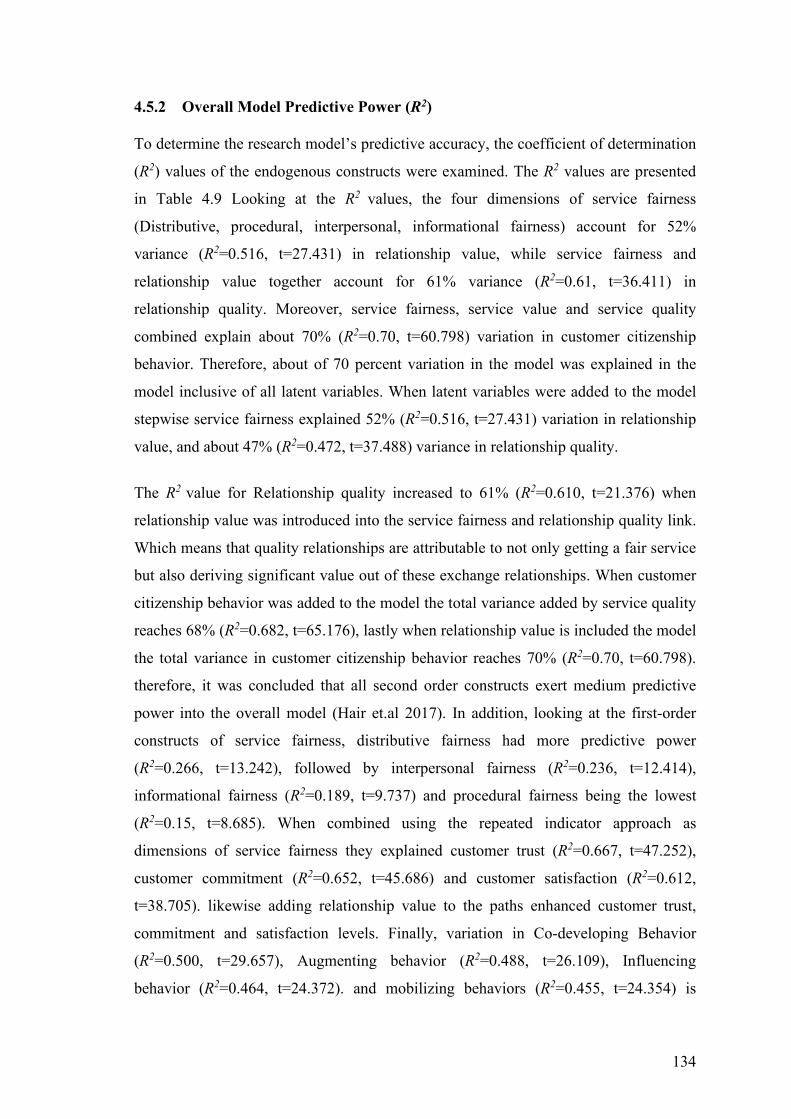
134
4.5.2 Overall Model Predictive Power (R2)
To determine the research model’s predictive accuracy, the coefficient of determination
(R2) values of the endogenous constructs were examined. The R2 values are presented
in Table 4.9 Looking at the R2 values, the four dimensions of service fairness
(Distributive, procedural, interpersonal, informational fairness) account for 52%
variance (R2=0.516, t=27.431) in relationship value, while service fairness and
relationship value together account for 61% variance (R2=0.61, t=36.411) in
relationship quality. Moreover, service fairness, service value and service quality
combined explain about 70% (R2=0.70, t=60.798) variation in customer citizenship
behavior. Therefore, about of 70 percent variation in the model was explained in the
model inclusive of all latent variables. When latent variables were added to the model
stepwise service fairness explained 52% (R2=0.516, t=27.431) variation in relationship
value, and about 47% (R2=0.472, t=37.488) variance in relationship quality.
The R2 value for Relationship quality increased to 61% (R2=0.610, t=21.376) when
relationship value was introduced into the service fairness and relationship quality link.
Which means that quality relationships are attributable to not only getting a fair service
but also deriving significant value out of these exchange relationships. When customer
citizenship behavior was added to the model the total variance added by service quality
reaches 68% (R2=0.682, t=65.176), lastly when relationship value is included the model
the total variance in customer citizenship behavior reaches 70% (R2=0.70, t=60.798).
therefore, it was concluded that all second order constructs exert medium predictive
power into the overall model (Hair et.al 2017). In addition, looking at the first-order
constructs of service fairness, distributive fairness had more predictive power
(R2=0.266, t=13.242), followed by interpersonal fairness (R2=0.236, t=12.414),
informational fairness (R2=0.189, t=9.737) and procedural fairness being the lowest
(R2=0.15, t=8.685). When combined using the repeated indicator approach as
dimensions of service fairness they explained customer trust (R2=0.667, t=47.252),
customer commitment (R2=0.652, t=45.686) and customer satisfaction (R2=0.612,
t=38.705). likewise adding relationship value to the paths enhanced customer trust,
commitment and satisfaction levels. Finally, variation in Co-developing Behavior
(R2=0.500, t=29.657), Augmenting behavior (R2=0.488, t=26.109), Influencing
behavior (R2=0.464, t=24.372). and mobilizing behaviors (R2=0.455, t=24.354) is
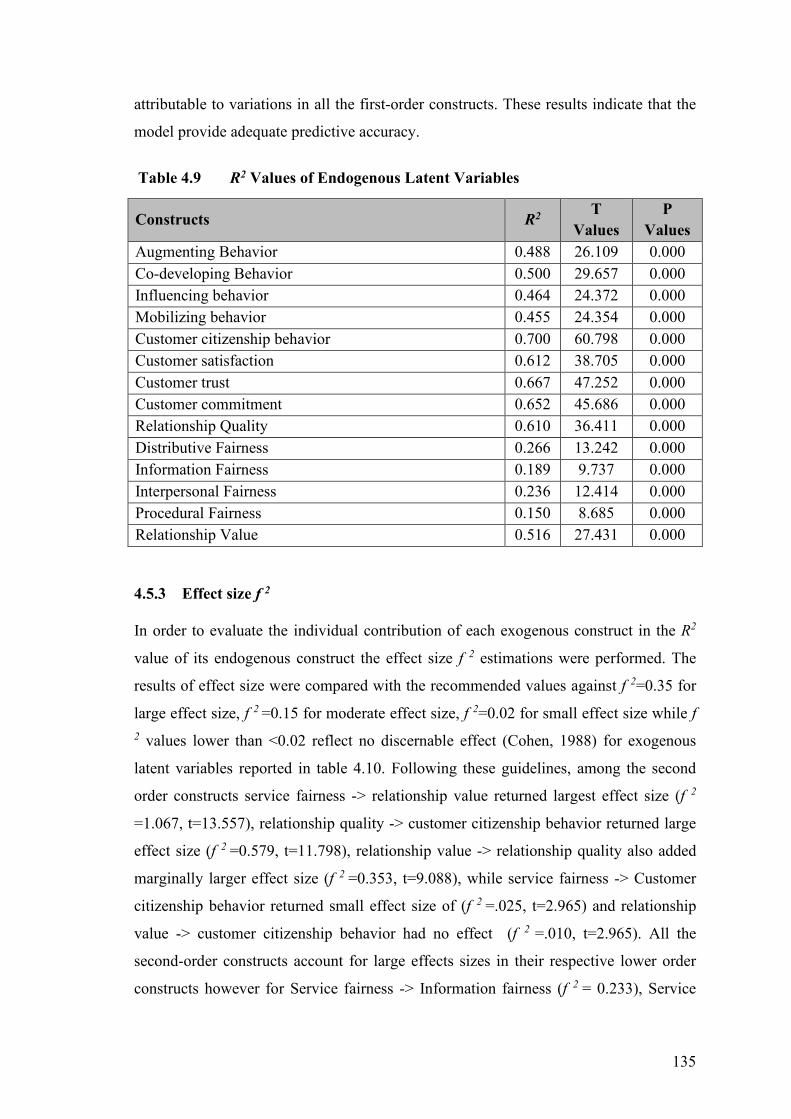
135
attributable to variations in all the first-order constructs. These results indicate that the
model provide adequate predictive accuracy.
Table 4.9 R2 Values of Endogenous Latent Variables
Constructs R2 T Values
P Values
Augmenting Behavior 0.488 26.109 0.000 Co-developing Behavior 0.500 29.657 0.000 Influencing behavior 0.464 24.372 0.000 Mobilizing behavior 0.455 24.354 0.000 Customer citizenship behavior 0.700 60.798 0.000 Customer satisfaction 0.612 38.705 0.000 Customer trust 0.667 47.252 0.000 Customer commitment 0.652 45.686 0.000 Relationship Quality 0.610 36.411 0.000 Distributive Fairness 0.266 13.242 0.000 Information Fairness 0.189 9.737 0.000 Interpersonal Fairness 0.236 12.414 0.000 Procedural Fairness 0.150 8.685 0.000 Relationship Value 0.516 27.431 0.000
4.5.3 Effect size f 2
In order to evaluate the individual contribution of each exogenous construct in the R2
value of its endogenous construct the effect size f 2 estimations were performed. The
results of effect size were compared with the recommended values against f 2=0.35 for
large effect size, f 2 =0.15 for moderate effect size, f 2=0.02 for small effect size while f 2 values lower than <0.02 reflect no discernable effect (Cohen, 1988) for exogenous
latent variables reported in table 4.10. Following these guidelines, among the second
order constructs service fairness -> relationship value returned largest effect size (f 2
=1.067, t=13.557), relationship quality -> customer citizenship behavior returned large
effect size (f 2 =0.579, t=11.798), relationship value -> relationship quality also added
marginally larger effect size (f 2 =0.353, t=9.088), while service fairness -> Customer
citizenship behavior returned small effect size of (f 2 =.025, t=2.965) and relationship
value -> customer citizenship behavior had no effect (f 2 =.010, t=2.965). All the
second-order constructs account for large effects sizes in their respective lower order
constructs however for Service fairness -> Information fairness (f 2 = 0.233), Service
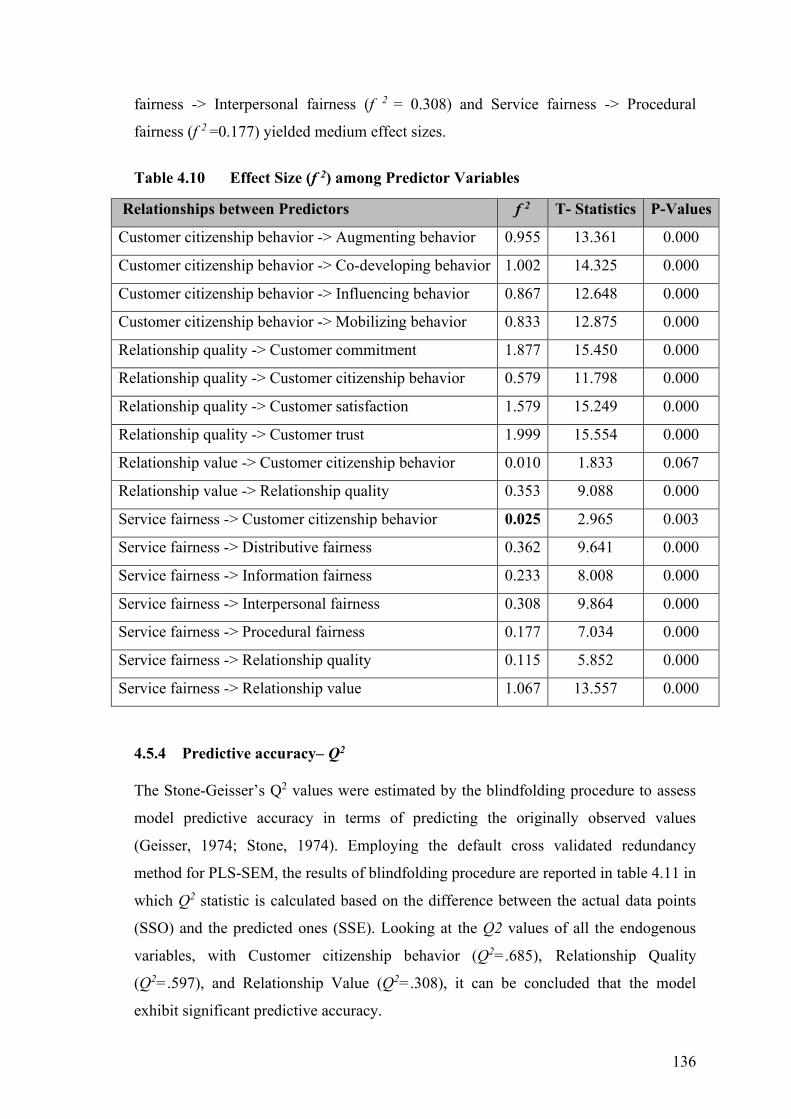
136
fairness -> Interpersonal fairness (f 2 = 0.308) and Service fairness -> Procedural
fairness (f 2 =0.177) yielded medium effect sizes.
Table 4.10 Effect Size (f 2) among Predictor Variables
Relationships between Predictors f 2 T- Statistics P-Values
Customer citizenship behavior -> Augmenting behavior 0.955 13.361 0.000
Customer citizenship behavior -> Co-developing behavior 1.002 14.325 0.000
Customer citizenship behavior -> Influencing behavior 0.867 12.648 0.000
Customer citizenship behavior -> Mobilizing behavior 0.833 12.875 0.000
Relationship quality -> Customer commitment 1.877 15.450 0.000
Relationship quality -> Customer citizenship behavior 0.579 11.798 0.000
Relationship quality -> Customer satisfaction 1.579 15.249 0.000
Relationship quality -> Customer trust 1.999 15.554 0.000
Relationship value -> Customer citizenship behavior 0.010 1.833 0.067
Relationship value -> Relationship quality 0.353 9.088 0.000
Service fairness -> Customer citizenship behavior 0.025 2.965 0.003
Service fairness -> Distributive fairness 0.362 9.641 0.000
Service fairness -> Information fairness 0.233 8.008 0.000
Service fairness -> Interpersonal fairness 0.308 9.864 0.000
Service fairness -> Procedural fairness 0.177 7.034 0.000
Service fairness -> Relationship quality 0.115 5.852 0.000
Service fairness -> Relationship value 1.067 13.557 0.000
4.5.4 Predictive accuracy– Q2
The Stone-Geisser’s Q2 values were estimated by the blindfolding procedure to assess
model predictive accuracy in terms of predicting the originally observed values
(Geisser, 1974; Stone, 1974). Employing the default cross validated redundancy
method for PLS-SEM, the results of blindfolding procedure are reported in table 4.11 in
which Q2 statistic is calculated based on the difference between the actual data points
(SSO) and the predicted ones (SSE). Looking at the Q2 values of all the endogenous
variables, with Customer citizenship behavior (Q2=.685), Relationship Quality
(Q2=.597), and Relationship Value (Q2=.308), it can be concluded that the model
exhibit significant predictive accuracy.
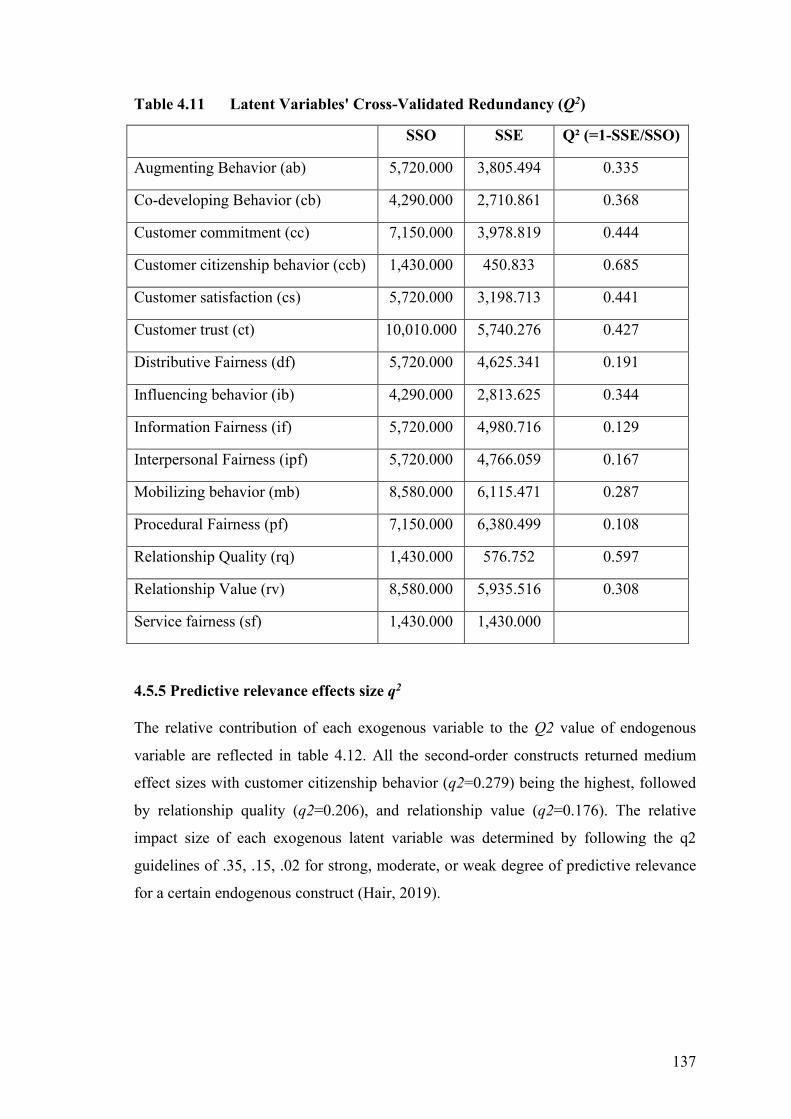
137
Table 4.11 Latent Variables' Cross-Validated Redundancy (Q2)
SSO SSE Q² (=1-SSE/SSO)
Augmenting Behavior (ab) 5,720.000 3,805.494 0.335
Co-developing Behavior (cb) 4,290.000 2,710.861 0.368
Customer commitment (cc) 7,150.000 3,978.819 0.444
Customer citizenship behavior (ccb) 1,430.000 450.833 0.685
Customer satisfaction (cs) 5,720.000 3,198.713 0.441
Customer trust (ct) 10,010.000 5,740.276 0.427
Distributive Fairness (df) 5,720.000 4,625.341 0.191
Influencing behavior (ib) 4,290.000 2,813.625 0.344
Information Fairness (if) 5,720.000 4,980.716 0.129
Interpersonal Fairness (ipf) 5,720.000 4,766.059 0.167
Mobilizing behavior (mb) 8,580.000 6,115.471 0.287
Procedural Fairness (pf) 7,150.000 6,380.499 0.108
Relationship Quality (rq) 1,430.000 576.752 0.597
Relationship Value (rv) 8,580.000 5,935.516 0.308
Service fairness (sf) 1,430.000 1,430.000
4.5.5 Predictive relevance effects size q2
The relative contribution of each exogenous variable to the Q2 value of endogenous
variable are reflected in table 4.12. All the second-order constructs returned medium
effect sizes with customer citizenship behavior (q2=0.279) being the highest, followed
by relationship quality (q2=0.206), and relationship value (q2=0.176). The relative
impact size of each exogenous latent variable was determined by following the q2
guidelines of .35, .15, .02 for strong, moderate, or weak degree of predictive relevance
for a certain endogenous construct (Hair, 2019).
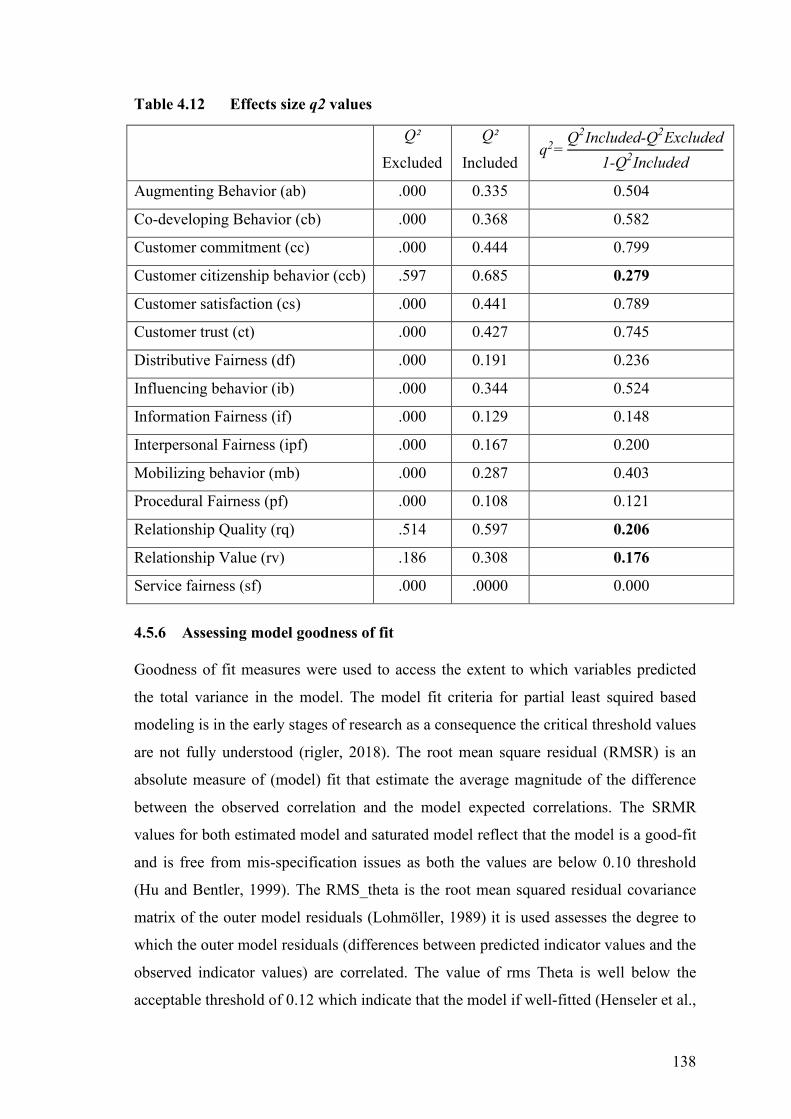
138
Table 4.12 Effects size q2 values
Q²
Excluded
Q²
Included q2=
Q2Included-Q2Excluded1-Q2Included
Augmenting Behavior (ab) .000 0.335 0.504
Co-developing Behavior (cb) .000 0.368 0.582
Customer commitment (cc) .000 0.444 0.799
Customer citizenship behavior (ccb) .597 0.685 0.279
Customer satisfaction (cs) .000 0.441 0.789
Customer trust (ct) .000 0.427 0.745
Distributive Fairness (df) .000 0.191 0.236
Influencing behavior (ib) .000 0.344 0.524
Information Fairness (if) .000 0.129 0.148
Interpersonal Fairness (ipf) .000 0.167 0.200
Mobilizing behavior (mb) .000 0.287 0.403
Procedural Fairness (pf) .000 0.108 0.121
Relationship Quality (rq) .514 0.597 0.206
Relationship Value (rv) .186 0.308 0.176
Service fairness (sf) .000 .0000 0.000
4.5.6 Assessing model goodness of fit
Goodness of fit measures were used to access the extent to which variables predicted
the total variance in the model. The model fit criteria for partial least squired based
modeling is in the early stages of research as a consequence the critical threshold values
are not fully understood (rigler, 2018). The root mean square residual (RMSR) is an
absolute measure of (model) fit that estimate the average magnitude of the difference
between the observed correlation and the model expected correlations. The SRMR
values for both estimated model and saturated model reflect that the model is a good-fit
and is free from mis-specification issues as both the values are below 0.10 threshold
(Hu and Bentler, 1999). The RMS_theta is the root mean squared residual covariance
matrix of the outer model residuals (Lohmöller, 1989) it is used assesses the degree to
which the outer model residuals (differences between predicted indicator values and the
observed indicator values) are correlated. The value of rms Theta is well below the
acceptable threshold of 0.12 which indicate that the model if well-fitted (Henseler et al.,
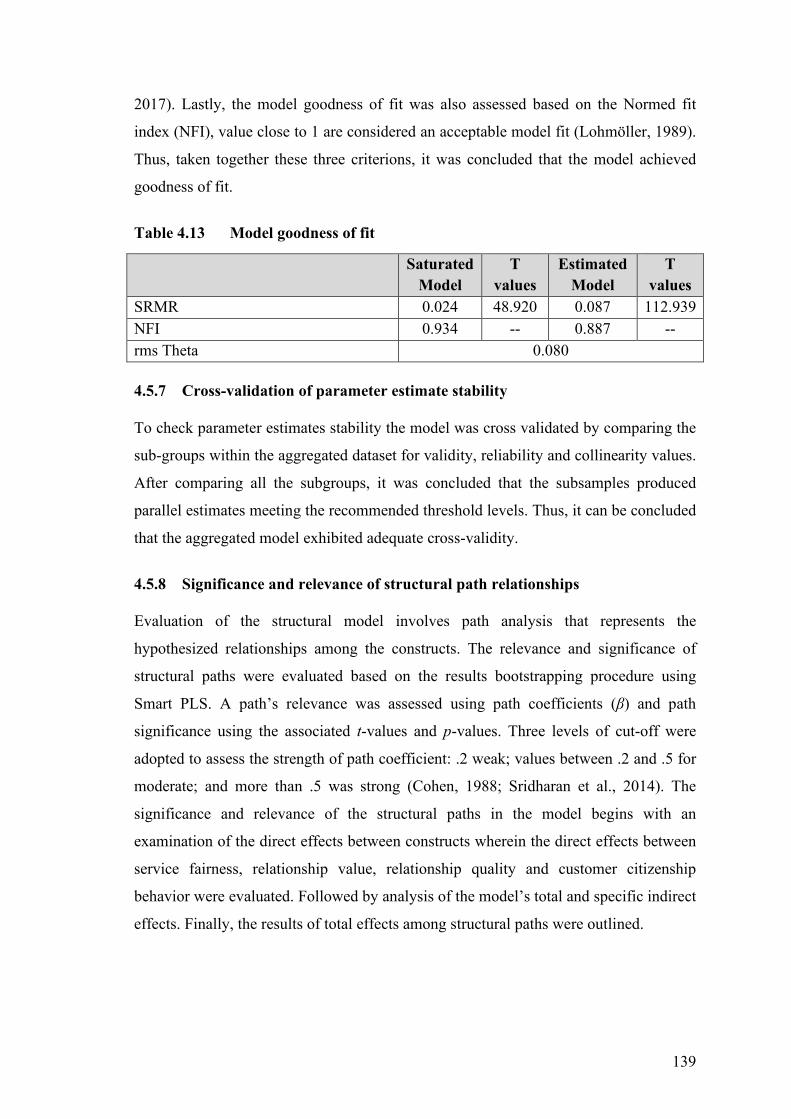
139
2017). Lastly, the model goodness of fit was also assessed based on the Normed fit
index (NFI), value close to 1 are considered an acceptable model fit (Lohmöller, 1989).
Thus, taken together these three criterions, it was concluded that the model achieved
goodness of fit.
Table 4.13 Model goodness of fit
Saturated Model
T values
Estimated Model
T values
SRMR 0.024 48.920 0.087 112.939 NFI 0.934 -- 0.887 -- rms Theta 0.080
4.5.7 Cross-validation of parameter estimate stability
To check parameter estimates stability the model was cross validated by comparing the
sub-groups within the aggregated dataset for validity, reliability and collinearity values.
After comparing all the subgroups, it was concluded that the subsamples produced
parallel estimates meeting the recommended threshold levels. Thus, it can be concluded
that the aggregated model exhibited adequate cross-validity.
4.5.8 Significance and relevance of structural path relationships
Evaluation of the structural model involves path analysis that represents the
hypothesized relationships among the constructs. The relevance and significance of
structural paths were evaluated based on the results bootstrapping procedure using
Smart PLS. A path’s relevance was assessed using path coefficients (β) and path
significance using the associated t-values and p-values. Three levels of cut-off were
adopted to assess the strength of path coefficient: .2 weak; values between .2 and .5 for
moderate; and more than .5 was strong (Cohen, 1988; Sridharan et al., 2014). The
significance and relevance of the structural paths in the model begins with an
examination of the direct effects between constructs wherein the direct effects between
service fairness, relationship value, relationship quality and customer citizenship
behavior were evaluated. Followed by analysis of the model’s total and specific indirect
effects. Finally, the results of total effects among structural paths were outlined.
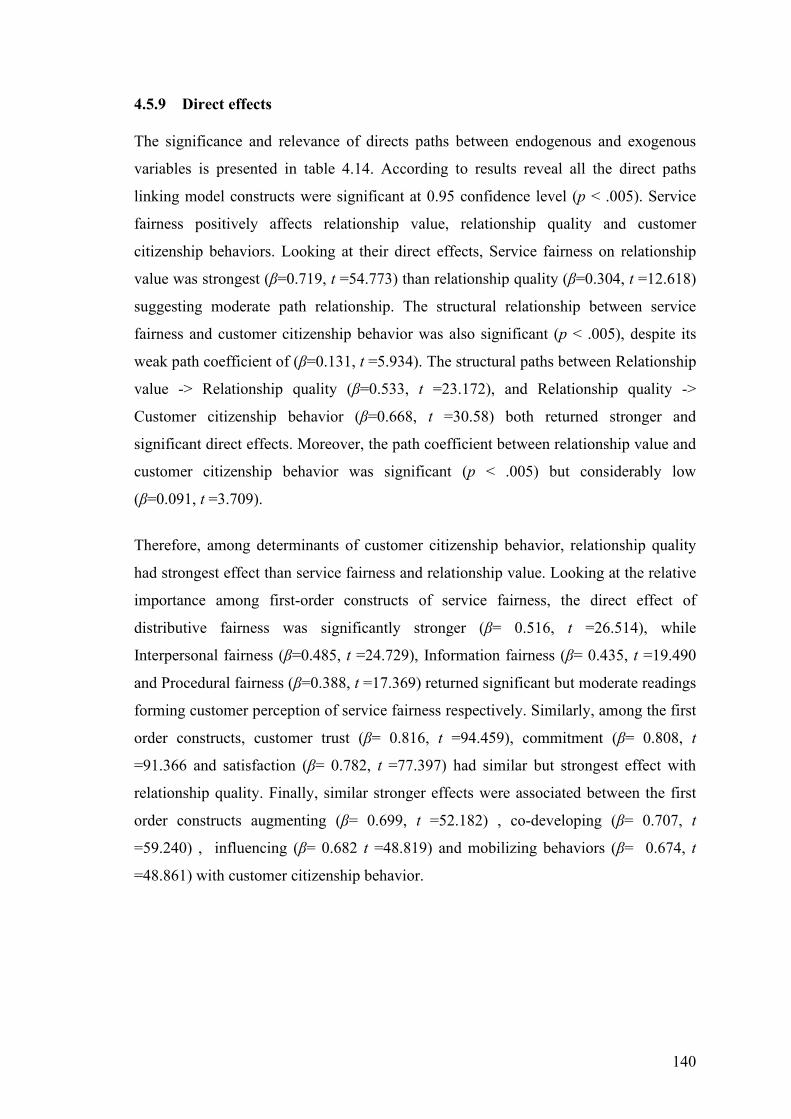
140
4.5.9 Direct effects
The significance and relevance of directs paths between endogenous and exogenous
variables is presented in table 4.14. According to results reveal all the direct paths
linking model constructs were significant at 0.95 confidence level (p < .005). Service
fairness positively affects relationship value, relationship quality and customer
citizenship behaviors. Looking at their direct effects, Service fairness on relationship
value was strongest (β=0.719, t =54.773) than relationship quality (β=0.304, t =12.618)
suggesting moderate path relationship. The structural relationship between service
fairness and customer citizenship behavior was also significant (p < .005), despite its
weak path coefficient of (β=0.131, t =5.934). The structural paths between Relationship
value -> Relationship quality (β=0.533, t =23.172), and Relationship quality ->
Customer citizenship behavior (β=0.668, t =30.58) both returned stronger and
significant direct effects. Moreover, the path coefficient between relationship value and
customer citizenship behavior was significant (p < .005) but considerably low
(β=0.091, t =3.709).
Therefore, among determinants of customer citizenship behavior, relationship quality
had strongest effect than service fairness and relationship value. Looking at the relative
importance among first-order constructs of service fairness, the direct effect of
distributive fairness was significantly stronger (β= 0.516, t =26.514), while
Interpersonal fairness (β=0.485, t =24.729), Information fairness (β= 0.435, t =19.490
and Procedural fairness (β=0.388, t =17.369) returned significant but moderate readings
forming customer perception of service fairness respectively. Similarly, among the first
order constructs, customer trust (β= 0.816, t =94.459), commitment (β= 0.808, t
=91.366 and satisfaction (β= 0.782, t =77.397) had similar but strongest effect with
relationship quality. Finally, similar stronger effects were associated between the first
order constructs augmenting (β= 0.699, t =52.182) , co-developing (β= 0.707, t
=59.240) , influencing (β= 0.682 t =48.819) and mobilizing behaviors (β= 0.674, t
=48.861) with customer citizenship behavior.
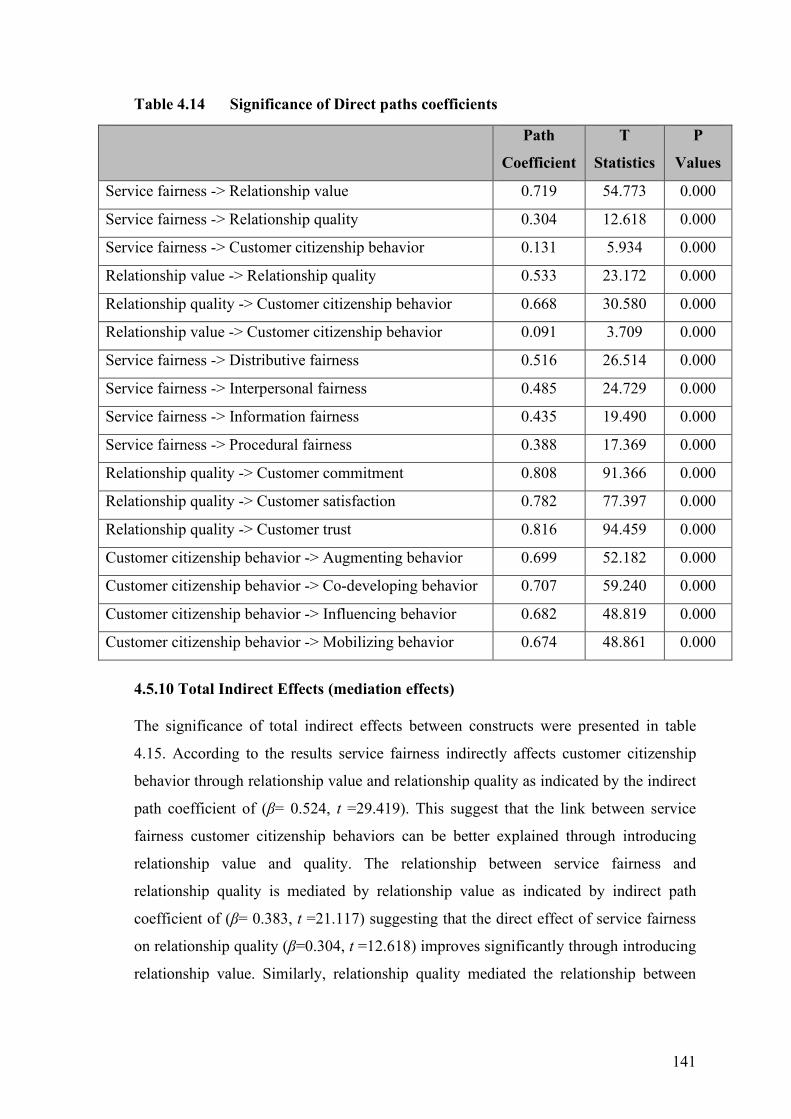
141
Table 4.14 Significance of Direct paths coefficients
Path
Coefficient
T
Statistics
P
Values
Service fairness -> Relationship value 0.719 54.773 0.000
Service fairness -> Relationship quality 0.304 12.618 0.000
Service fairness -> Customer citizenship behavior 0.131 5.934 0.000
Relationship value -> Relationship quality 0.533 23.172 0.000
Relationship quality -> Customer citizenship behavior 0.668 30.580 0.000
Relationship value -> Customer citizenship behavior 0.091 3.709 0.000
Service fairness -> Distributive fairness 0.516 26.514 0.000
Service fairness -> Interpersonal fairness 0.485 24.729 0.000
Service fairness -> Information fairness 0.435 19.490 0.000
Service fairness -> Procedural fairness 0.388 17.369 0.000
Relationship quality -> Customer commitment 0.808 91.366 0.000
Relationship quality -> Customer satisfaction 0.782 77.397 0.000
Relationship quality -> Customer trust 0.816 94.459 0.000
Customer citizenship behavior -> Augmenting behavior 0.699 52.182 0.000
Customer citizenship behavior -> Co-developing behavior 0.707 59.240 0.000
Customer citizenship behavior -> Influencing behavior 0.682 48.819 0.000
Customer citizenship behavior -> Mobilizing behavior 0.674 48.861 0.000
4.5.10 Total Indirect Effects (mediation effects)
The significance of total indirect effects between constructs were presented in table
4.15. According to the results service fairness indirectly affects customer citizenship
behavior through relationship value and relationship quality as indicated by the indirect
path coefficient of (β= 0.524, t =29.419). This suggest that the link between service
fairness customer citizenship behaviors can be better explained through introducing
relationship value and quality. The relationship between service fairness and
relationship quality is mediated by relationship value as indicated by indirect path
coefficient of (β= 0.383, t =21.117) suggesting that the direct effect of service fairness
on relationship quality (β=0.304, t =12.618) improves significantly through introducing
relationship value. Similarly, relationship quality mediated the relationship between
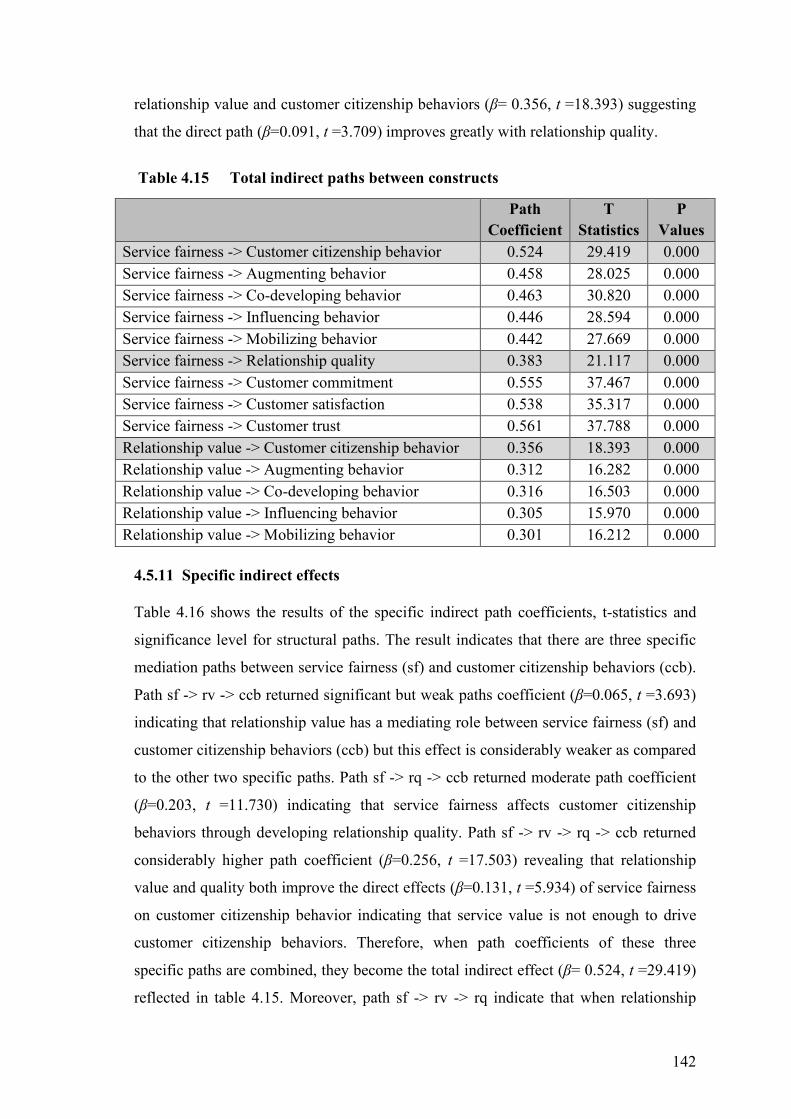
142
relationship value and customer citizenship behaviors (β= 0.356, t =18.393) suggesting
that the direct path (β=0.091, t =3.709) improves greatly with relationship quality.
Table 4.15 Total indirect paths between constructs
Path Coefficient
T Statistics
P Values
Service fairness -> Customer citizenship behavior 0.524 29.419 0.000 Service fairness -> Augmenting behavior 0.458 28.025 0.000 Service fairness -> Co-developing behavior 0.463 30.820 0.000 Service fairness -> Influencing behavior 0.446 28.594 0.000 Service fairness -> Mobilizing behavior 0.442 27.669 0.000 Service fairness -> Relationship quality 0.383 21.117 0.000 Service fairness -> Customer commitment 0.555 37.467 0.000 Service fairness -> Customer satisfaction 0.538 35.317 0.000 Service fairness -> Customer trust 0.561 37.788 0.000 Relationship value -> Customer citizenship behavior 0.356 18.393 0.000 Relationship value -> Augmenting behavior 0.312 16.282 0.000 Relationship value -> Co-developing behavior 0.316 16.503 0.000 Relationship value -> Influencing behavior 0.305 15.970 0.000 Relationship value -> Mobilizing behavior 0.301 16.212 0.000
4.5.11 Specific indirect effects
Table 4.16 shows the results of the specific indirect path coefficients, t-statistics and
significance level for structural paths. The result indicates that there are three specific
mediation paths between service fairness (sf) and customer citizenship behaviors (ccb).
Path sf -> rv -> ccb returned significant but weak paths coefficient (β=0.065, t =3.693)
indicating that relationship value has a mediating role between service fairness (sf) and
customer citizenship behaviors (ccb) but this effect is considerably weaker as compared
to the other two specific paths. Path sf -> rq -> ccb returned moderate path coefficient
(β=0.203, t =11.730) indicating that service fairness affects customer citizenship
behaviors through developing relationship quality. Path sf -> rv -> rq -> ccb returned
considerably higher path coefficient (β=0.256, t =17.503) revealing that relationship
value and quality both improve the direct effects (β=0.131, t =5.934) of service fairness
on customer citizenship behavior indicating that service value is not enough to drive
customer citizenship behaviors. Therefore, when path coefficients of these three
specific paths are combined, they become the total indirect effect (β= 0.524, t =29.419)
reflected in table 4.15. Moreover, path sf -> rv -> rq indicate that when relationship
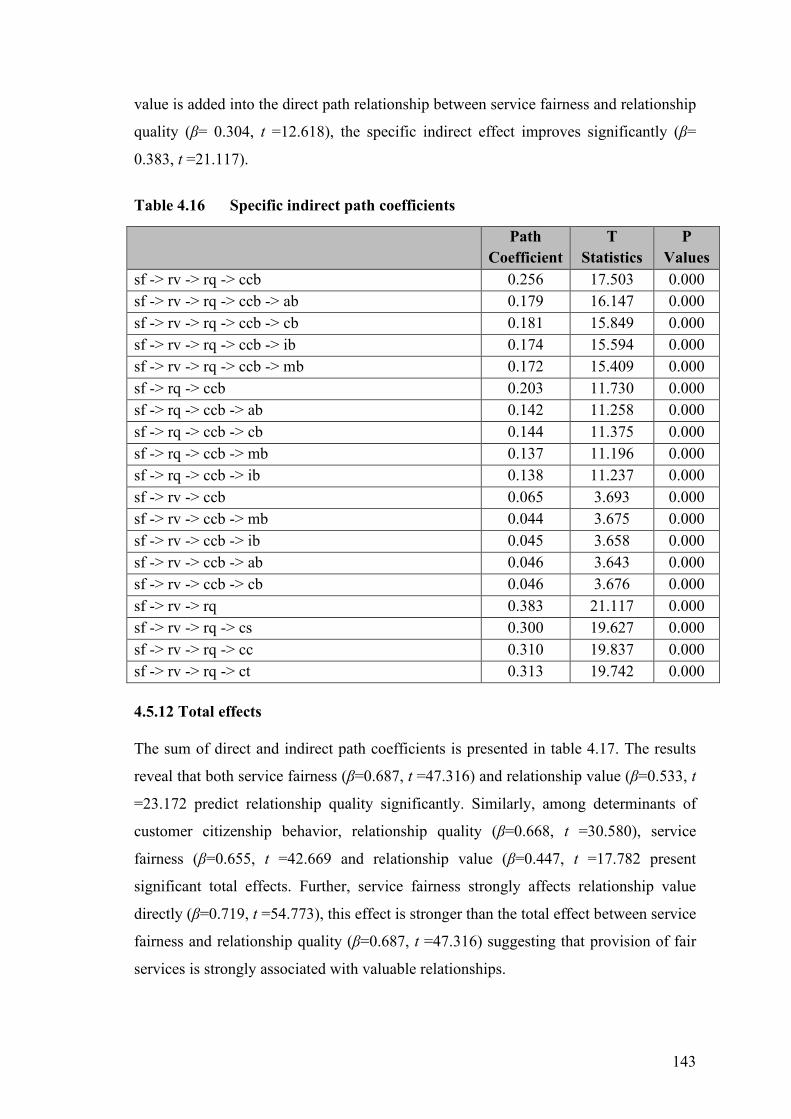
143
value is added into the direct path relationship between service fairness and relationship
quality (β= 0.304, t =12.618), the specific indirect effect improves significantly (β=
0.383, t =21.117).
Table 4.16 Specific indirect path coefficients
Path Coefficient
T Statistics
P Values
sf -> rv -> rq -> ccb 0.256 17.503 0.000 sf -> rv -> rq -> ccb -> ab 0.179 16.147 0.000 sf -> rv -> rq -> ccb -> cb 0.181 15.849 0.000 sf -> rv -> rq -> ccb -> ib 0.174 15.594 0.000 sf -> rv -> rq -> ccb -> mb 0.172 15.409 0.000 sf -> rq -> ccb 0.203 11.730 0.000 sf -> rq -> ccb -> ab 0.142 11.258 0.000 sf -> rq -> ccb -> cb 0.144 11.375 0.000 sf -> rq -> ccb -> mb 0.137 11.196 0.000 sf -> rq -> ccb -> ib 0.138 11.237 0.000 sf -> rv -> ccb 0.065 3.693 0.000 sf -> rv -> ccb -> mb 0.044 3.675 0.000 sf -> rv -> ccb -> ib 0.045 3.658 0.000 sf -> rv -> ccb -> ab 0.046 3.643 0.000 sf -> rv -> ccb -> cb 0.046 3.676 0.000 sf -> rv -> rq 0.383 21.117 0.000 sf -> rv -> rq -> cs 0.300 19.627 0.000 sf -> rv -> rq -> cc 0.310 19.837 0.000 sf -> rv -> rq -> ct 0.313 19.742 0.000
4.5.12 Total effects
The sum of direct and indirect path coefficients is presented in table 4.17. The results
reveal that both service fairness (β=0.687, t =47.316) and relationship value (β=0.533, t
=23.172 predict relationship quality significantly. Similarly, among determinants of
customer citizenship behavior, relationship quality (β=0.668, t =30.580), service
fairness (β=0.655, t =42.669 and relationship value (β=0.447, t =17.782 present
significant total effects. Further, service fairness strongly affects relationship value
directly (β=0.719, t =54.773), this effect is stronger than the total effect between service
fairness and relationship quality (β=0.687, t =47.316) suggesting that provision of fair
services is strongly associated with valuable relationships.
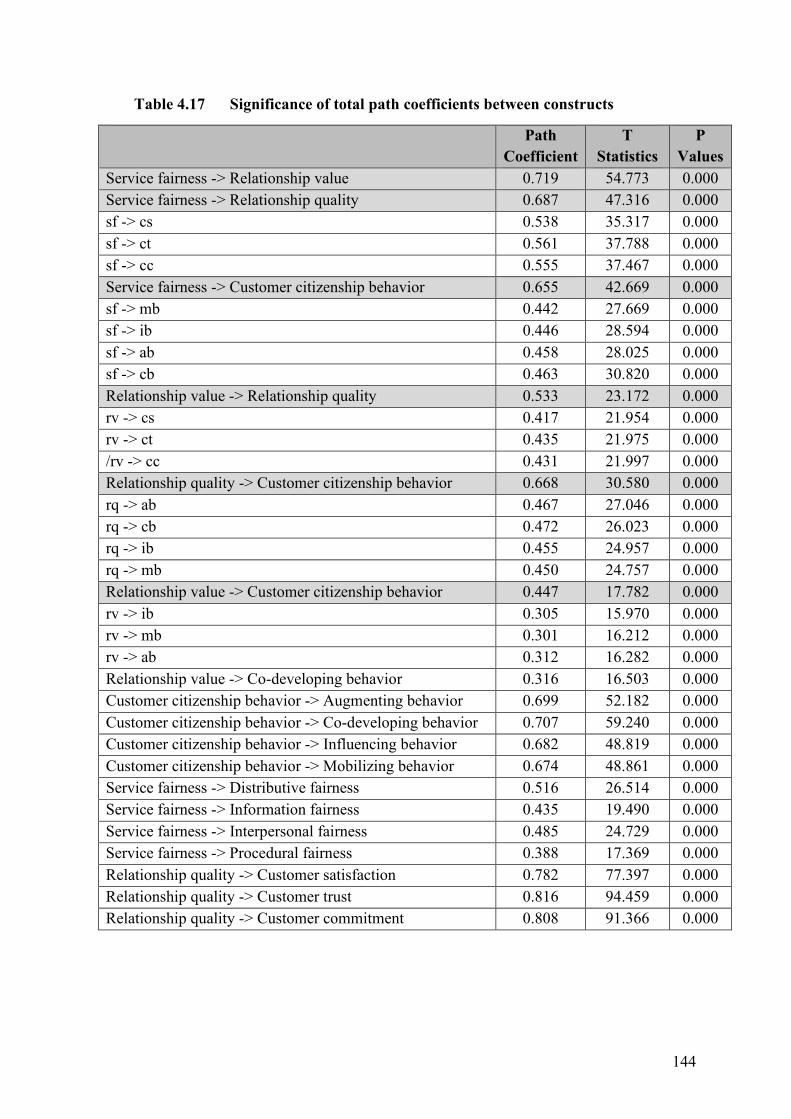
144
Table 4.17 Significance of total path coefficients between constructs
Path Coefficient
T Statistics
P Values
Service fairness -> Relationship value 0.719 54.773 0.000 Service fairness -> Relationship quality 0.687 47.316 0.000 sf -> cs 0.538 35.317 0.000 sf -> ct 0.561 37.788 0.000 sf -> cc 0.555 37.467 0.000 Service fairness -> Customer citizenship behavior 0.655 42.669 0.000 sf -> mb 0.442 27.669 0.000 sf -> ib 0.446 28.594 0.000 sf -> ab 0.458 28.025 0.000 sf -> cb 0.463 30.820 0.000 Relationship value -> Relationship quality 0.533 23.172 0.000 rv -> cs 0.417 21.954 0.000 rv -> ct 0.435 21.975 0.000 /rv -> cc 0.431 21.997 0.000 Relationship quality -> Customer citizenship behavior 0.668 30.580 0.000 rq -> ab 0.467 27.046 0.000 rq -> cb 0.472 26.023 0.000 rq -> ib 0.455 24.957 0.000 rq -> mb 0.450 24.757 0.000 Relationship value -> Customer citizenship behavior 0.447 17.782 0.000 rv -> ib 0.305 15.970 0.000 rv -> mb 0.301 16.212 0.000 rv -> ab 0.312 16.282 0.000 Relationship value -> Co-developing behavior 0.316 16.503 0.000 Customer citizenship behavior -> Augmenting behavior 0.699 52.182 0.000 Customer citizenship behavior -> Co-developing behavior 0.707 59.240 0.000 Customer citizenship behavior -> Influencing behavior 0.682 48.819 0.000 Customer citizenship behavior -> Mobilizing behavior 0.674 48.861 0.000 Service fairness -> Distributive fairness 0.516 26.514 0.000 Service fairness -> Information fairness 0.435 19.490 0.000 Service fairness -> Interpersonal fairness 0.485 24.729 0.000 Service fairness -> Procedural fairness 0.388 17.369 0.000 Relationship quality -> Customer satisfaction 0.782 77.397 0.000 Relationship quality -> Customer trust 0.816 94.459 0.000 Relationship quality -> Customer commitment 0.808 91.366 0.000
145
4.5.13 Variance accounted for (VAF) by mediating variables
Variance accounted for (VAF) values were used to assess the relative magnitude of
mediating variables in explaining the direct relationship between constructs. As shown
in table 4.18 the direct effect of service fairness on customer citizenship behavior is
only 20%, while the total indirect effect (VAF=80%) is accounted by relationship value
and quality combined (VAF=40%), relationship quality (VAF=30%) and relationship
value (VAF=10%). This indicated that relationship value and quality are equally
important to enhance service-fairness and customer citizenship behavior relationship.
Moreover, more than half (VAF=56%) of variance was attributed by relationship value
between path directly linking service fairness and relationship quality which resulted in
partial mediation. This means that quality of relationship improves when services are
provided fairly, through provision of valuable exchange relationships. Furthermore,
relationship quality accounted for (VAF=80%) between relationship value and
customer citizenship behavior indicating full mediation effects. This means that
customers in engage in citizenship behavior more strongly through provision of
valuable resources and maintaining quality during exchange relationships.
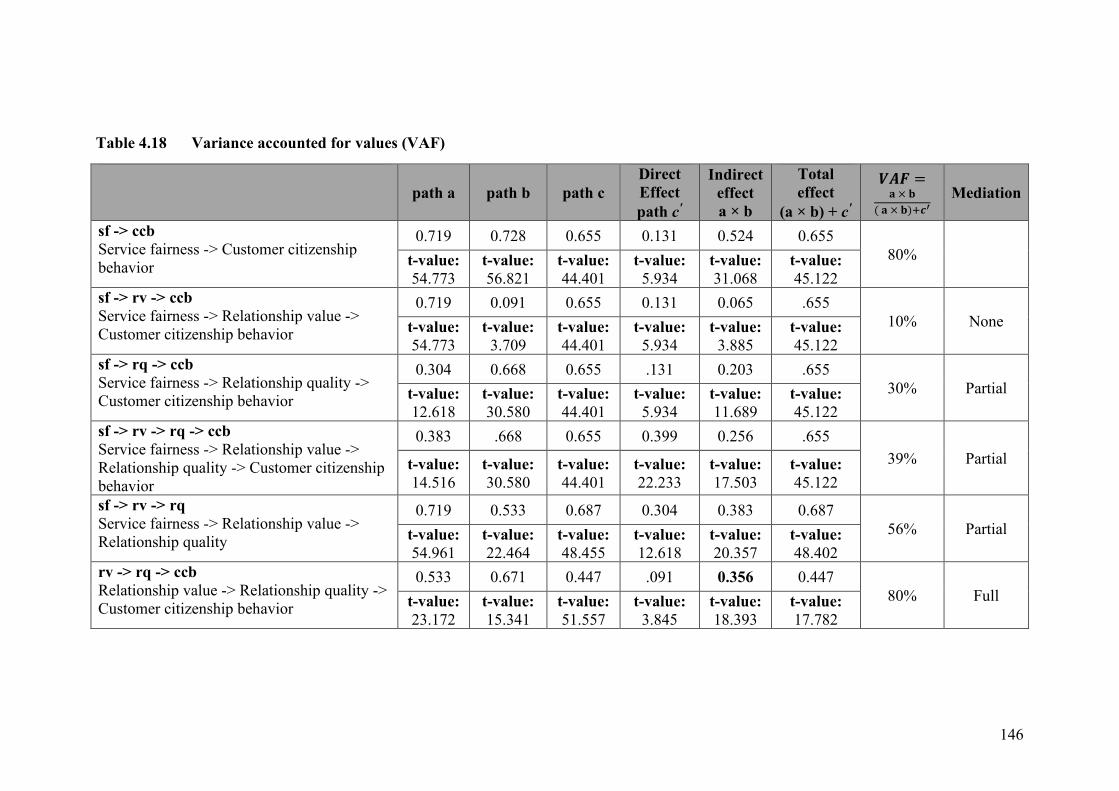
146
Table 4.18 Variance accounted for values (VAF)
path a path b path c
Direct Effect path c'
Indirect effect a × b
Total effect
(a × b) + c'
𝑽𝑽𝑽𝑽𝑽𝑽 = 𝐚𝐚 × 𝐛𝐛
( 𝐚𝐚 × 𝐛𝐛)+𝒄𝒄′ Mediation
sf -> ccb Service fairness -> Customer citizenship behavior
0.719 0.728 0.655 0.131 0.524 0.655 80% t-value:
54.773 t-value: 56.821
t-value: 44.401
t-value: 5.934
t-value: 31.068
t-value: 45.122
sf -> rv -> ccb Service fairness -> Relationship value -> Customer citizenship behavior
0.719 0.091 0.655 0.131 0.065 .655 10% None t-value:
54.773 t-value:
3.709 t-value: 44.401
t-value: 5.934
t-value: 3.885
t-value: 45.122
sf -> rq -> ccb Service fairness -> Relationship quality -> Customer citizenship behavior
0.304 0.668 0.655 .131 0.203 .655 30% Partial t-value:
12.618 t-value: 30.580
t-value: 44.401
t-value: 5.934
t-value: 11.689
t-value: 45.122
sf -> rv -> rq -> ccb Service fairness -> Relationship value -> Relationship quality -> Customer citizenship behavior
0.383 .668 0.655 0.399 0.256 .655 39% Partial t-value:
14.516 t-value: 30.580
t-value: 44.401
t-value: 22.233
t-value: 17.503
t-value: 45.122
sf -> rv -> rq Service fairness -> Relationship value -> Relationship quality
0.719 0.533 0.687 0.304 0.383 0.687 56% Partial t-value:
54.961 t-value: 22.464
t-value: 48.455
t-value: 12.618
t-value: 20.357
t-value: 48.402
rv -> rq -> ccb Relationship value -> Relationship quality -> Customer citizenship behavior
0.533 0.671 0.447 .091 0.356 0.447 80% Full t-value:
23.172 t-value: 15.341
t-value: 51.557
t-value: 3.845
t-value: 18.393
t-value: 17.782
147
4.6 Hypotheses Validation summary
Based on extensive literature review and in accordance with the objectives, research
questions the following hypothesis was posed in the study:
Hypothesis 1 Service fairness is significantly related to relationship quality
Hypothesis 2 Service fairness is significantly related to relationship value
Hypothesis 3 Relationship value is significantly related to relationship quality
Hypothesis 4 Service fairness is significantly related to customer engagement behaviors
Hypothesis 5 Relationship quality is significantly related to customer engagement behavior
Hypothesis 6 Relationship quality is significantly related to customer engagement behavior
Hypothesis 7 Relationship quality mediate the link between service fairness and customer citizenship behavior
Hypothesis 8 Relationship value mediate the link between service fairness and customer citizenship behavior
Hypothesis 9 Relationship value and quality mediate the link between service fairness and customer citizenship behavior
Hypothesis 10 Relationship quality mediate the link between relationship value and customer engagement behaviors
The above stated hypotheses were verified based on the results compiled in (table 4.19;
figure 4.6). Each hypothesis was tested based on corresponding significance and
relevance of the results.
4.6.1 Service fairness and relationship quality
Service fairness had a positive and significant effect on relationship quality (β=0.304,
t=12.618) explaining R2=47% variance in relationship quality, supporting H1. This path
relationship revealed a marginally medium effect size (f 2 =1.067) with moderate
predictive relevance (q2 = .908). in addition, when relationship value is included as
mediator between service fairness and relationship quality it explains (VAF=56%)
variation in the total path (c=0.687, t= 48.402), the model predictive performance
148
increases from R2=47% to R2= 61% while the total path decreases to path (c'=0.304,
t=12.618) therefore, H1 was accepted.
4.6.2 Service fairness and relationship value
Service fairness had a positive and significant effect on relationship value (β= 0.719.,
t= 54.773) explaining R2=51% variance in relationship value confirming H2. This path
relationship reflected a large effect size of (f 2 =1.067) with strong predictive relevance
(q2 = .332). Therefore, H2 was accepted.
4.6.3 Relationship value and relationship quality
Relationship value had a significant and positive influence on relationship quality
(β=0.533, t=23.172) resulting in the acceptance of H3. The path relationship reflected
large effect size (f 2 =0.353) having strong predictive relevance (q2 = .332). therefore,
H3 was accepted.
4.6.4 Service fairness and customer citizenship behavior
Service fairness had a significant and positive effects on customer’s citizenship
behavior (β=0.131, t=5.934) explaining 42% of variance in customer citizenship
behavior which resulted in acceptance of H4. However, this path relationship indicated
only a small effect size (f 2 =0.025) and is regarded to be a weak predictive relevance
(q2 = .0222). based on significance and relevance results H4 is accepted.
4.6.5 Relationship quality and customer citizenship behavior
Relationship quality had a positive and significant effect on customer citizenship
behavior (β=0.668, t=30.580) in support of H5. This path relationship reflected largest
effect size (f 2 =0.579) having strong predictive relevance (q2 = .543). therefore, H5 was
accepted.
4.6.6 Relationship value and customer citizenship behavior
Relationship value had a positive and significant effect on customer citizenship
behavior (β=0.091, t=3.709) nevertheless, the path relationship indicated only a small
effect size (f 2 =0.10) and is regarded to demonstrate a weak predictive relevance (q2 =
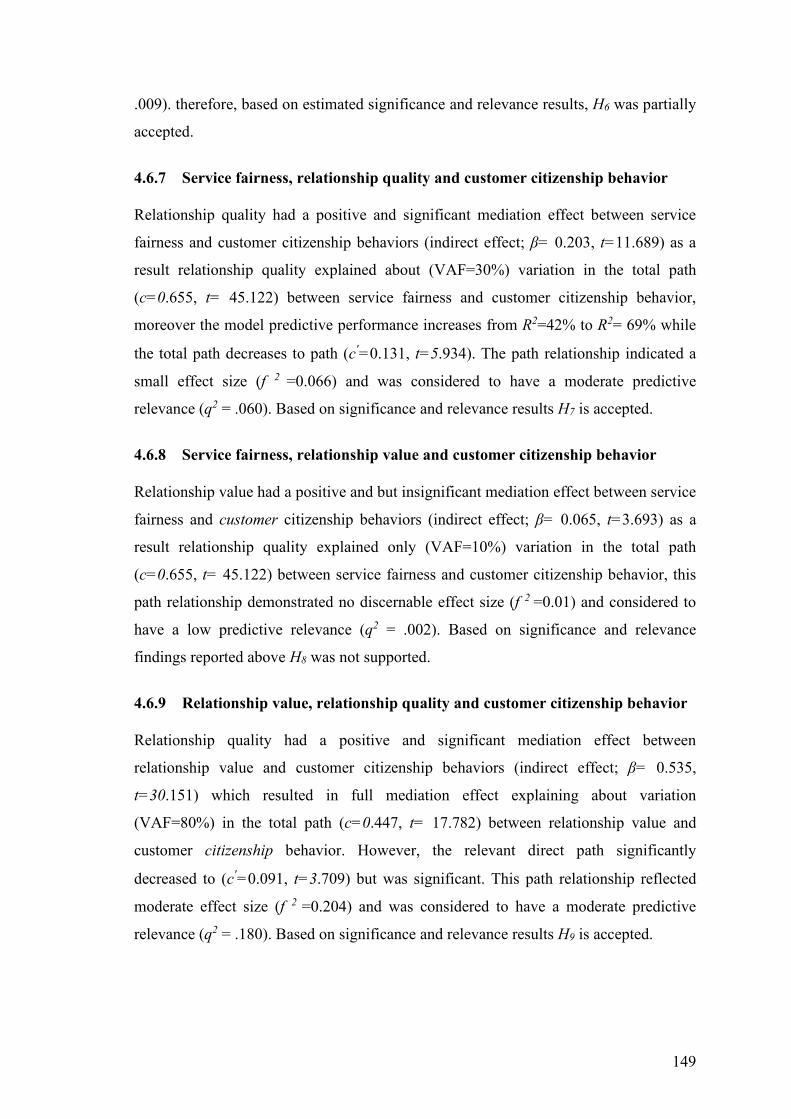
149
.009). therefore, based on estimated significance and relevance results, H6 was partially
accepted.
4.6.7 Service fairness, relationship quality and customer citizenship behavior
Relationship quality had a positive and significant mediation effect between service
fairness and customer citizenship behaviors (indirect effect; β= 0.203, t=11.689) as a
result relationship quality explained about (VAF=30%) variation in the total path
(c=0.655, t= 45.122) between service fairness and customer citizenship behavior,
moreover the model predictive performance increases from R2=42% to R2= 69% while
the total path decreases to path (c'=0.131, t=5.934). The path relationship indicated a
small effect size (f 2 =0.066) and was considered to have a moderate predictive
relevance (q2 = .060). Based on significance and relevance results H7 is accepted.
4.6.8 Service fairness, relationship value and customer citizenship behavior
Relationship value had a positive and but insignificant mediation effect between service
fairness and customer citizenship behaviors (indirect effect; β= 0.065, t=3.693) as a
result relationship quality explained only (VAF=10%) variation in the total path
(c=0.655, t= 45.122) between service fairness and customer citizenship behavior, this
path relationship demonstrated no discernable effect size (f 2 =0.01) and considered to
have a low predictive relevance (q2 = .002). Based on significance and relevance
findings reported above H8 was not supported.
4.6.9 Relationship value, relationship quality and customer citizenship behavior
Relationship quality had a positive and significant mediation effect between
relationship value and customer citizenship behaviors (indirect effect; β= 0.535,
t=30.151) which resulted in full mediation effect explaining about variation
(VAF=80%) in the total path (c=0.447, t= 17.782) between relationship value and
customer citizenship behavior. However, the relevant direct path significantly
decreased to (c'=0.091, t=3.709) but was significant. This path relationship reflected
moderate effect size (f 2 =0.204) and was considered to have a moderate predictive
relevance (q2 = .180). Based on significance and relevance results H9 is accepted.
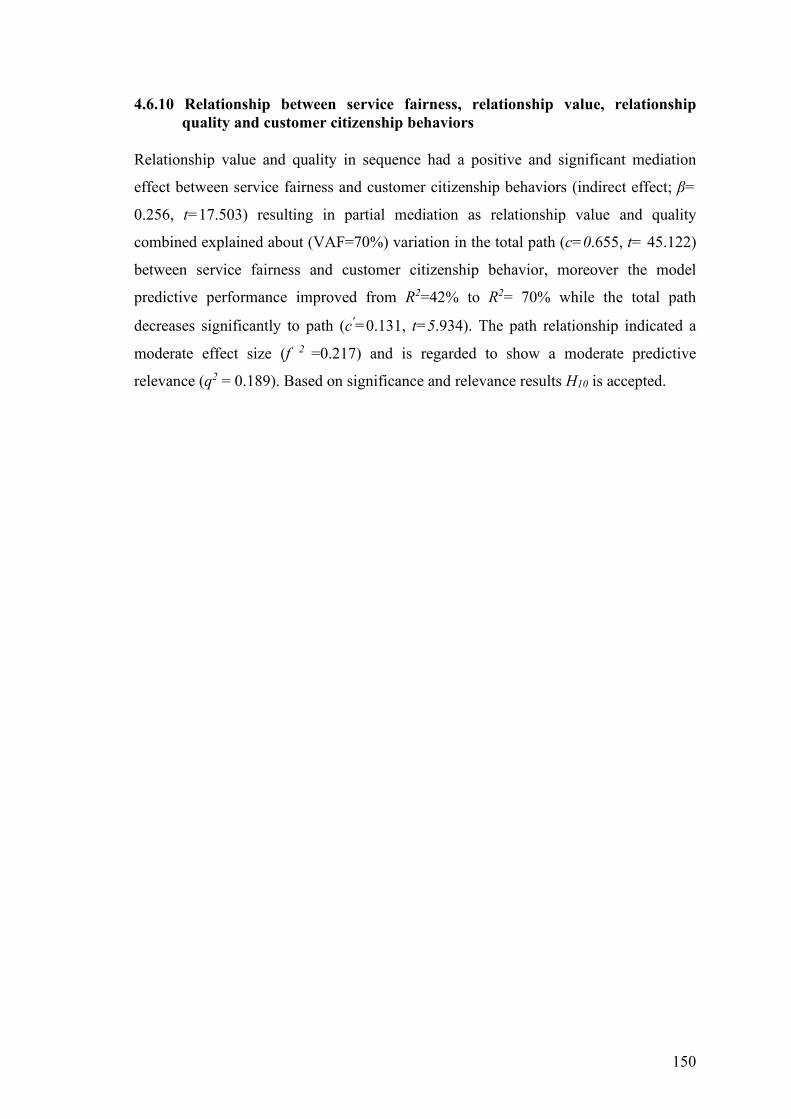
150
4.6.10 Relationship between service fairness, relationship value, relationship quality and customer citizenship behaviors
Relationship value and quality in sequence had a positive and significant mediation
effect between service fairness and customer citizenship behaviors (indirect effect; β=
0.256, t=17.503) resulting in partial mediation as relationship value and quality
combined explained about (VAF=70%) variation in the total path (c=0.655, t= 45.122)
between service fairness and customer citizenship behavior, moreover the model
predictive performance improved from R2=42% to R2= 70% while the total path
decreases significantly to path (c'=0.131, t=5.934). The path relationship indicated a
moderate effect size (f 2 =0.217) and is regarded to show a moderate predictive
relevance (q2 = 0.189). Based on significance and relevance results H10 is accepted.
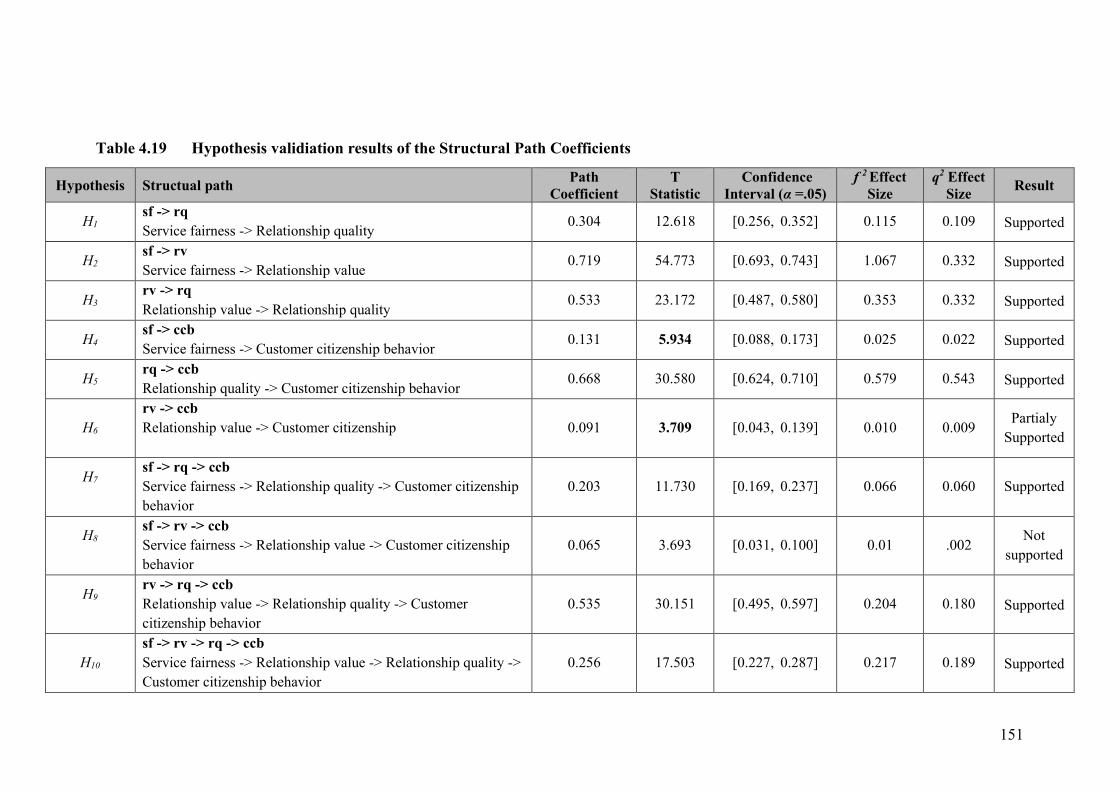
151
Table 4.19 Hypothesis validiation results of the Structural Path Coefficients
Hypothesis Structual path Path Coefficient
T Statistic
Confidence Interval (α =.05)
f 2 Effect Size
q2 Effect Size Result
H1 sf -> rq Service fairness -> Relationship quality 0.304 12.618 [0.256, 0.352] 0.115 0.109 Supported
H2 sf -> rv Service fairness -> Relationship value
0.719 54.773 [0.693, 0.743] 1.067 0.332 Supported
H3 rv -> rq Relationship value -> Relationship quality
0.533 23.172 [0.487, 0.580] 0.353 0.332 Supported
H4 sf -> ccb Service fairness -> Customer citizenship behavior 0.131 5.934 [0.088, 0.173] 0.025 0.022 Supported
H5 rq -> ccb Relationship quality -> Customer citizenship behavior
0.668 30.580 [0.624, 0.710] 0.579 0.543 Supported
H6
rv -> ccb Relationship value -> Customer citizenship
0.091 3.709 [0.043, 0.139] 0.010 0.009 Partialy Supported
H7
sf -> rq -> ccb Service fairness -> Relationship quality -> Customer citizenship behavior
0.203 11.730 [0.169, 0.237] 0.066 0.060 Supported
H8
sf -> rv -> ccb Service fairness -> Relationship value -> Customer citizenship behavior
0.065 3.693 [0.031, 0.100] 0.01 .002 Not
supported
H9
rv -> rq -> ccb Relationship value -> Relationship quality -> Customer citizenship behavior
0.535 30.151 [0.495, 0.597] 0.204 0.180 Supported
H10 sf -> rv -> rq -> ccb Service fairness -> Relationship value -> Relationship quality -> Customer citizenship behavior
0.256 17.503 [0.227, 0.287] 0.217 0.189 Supported
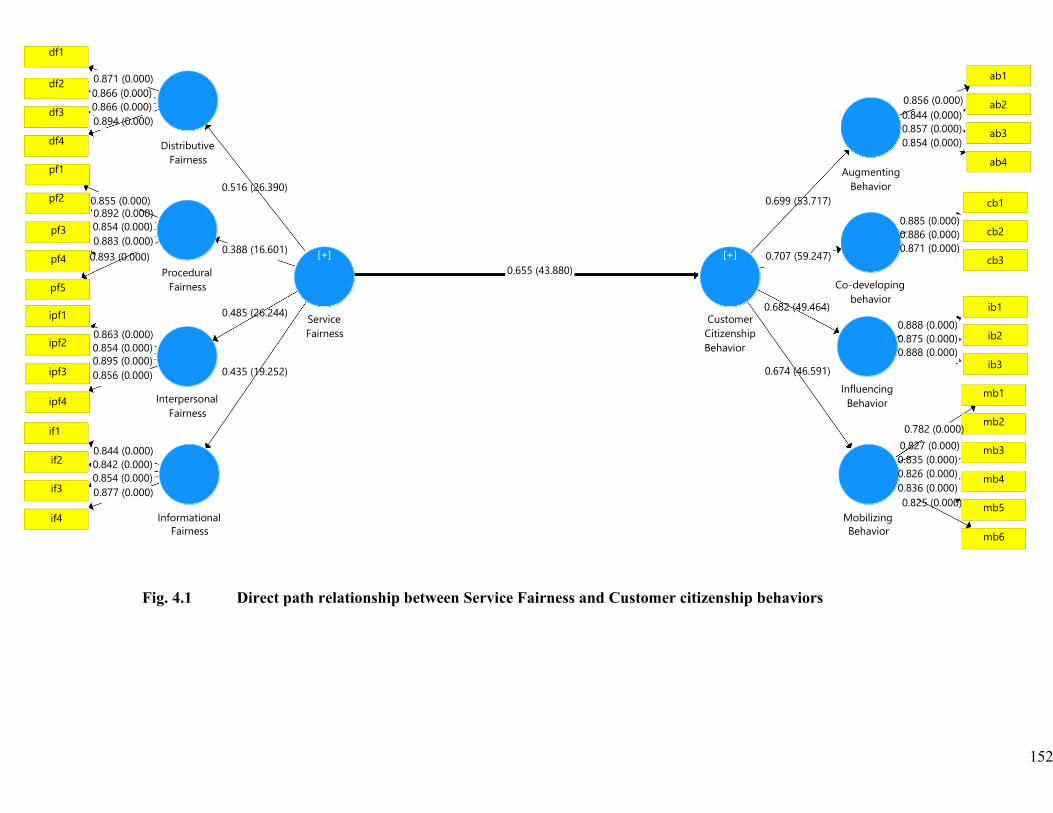
152
ib3
df1
df2
df3
df4
pf1
pf2
0.871 (0.000) 0.866 (0.000) 0.866 (0.000) 0.894 (0.000)
0.855 (0.000)
Distributive
Fairness
0.516 (26.390)
0.699 (53.717)
Augmenting Behavior
0.856 (0.000) 0.844 (0.000) 0.857 (0.000) 0.854 (0.000)
ab1
ab2
ab3
ab4
pf3
pf4
pf5
ipf1
ipf2
ipf3
ipf4
if1
if2
if3
0.892 (0.000) 0.854 (0.000) 0.883 (0.000)
0.893 (0.000)
0.863 (0.000) 0.854 (0.000) 0.895 (0.000) 0.856 (0.000)
0.844 (0.000) 0.842 (0.000) 0.854 (0.000) 0.877 (0.000)
Procedural
Fairness Interpersonal
Fairness
0.388 (16.601) 0.485 (26.244) 0.435 (19.252)
[+]
Service Fairness
0.655 (43.880)
[+]
Customer Citizenship Behavior
0.707 (59.247) 0.682 (49.464)
0.674 (46.591)
0.885 (0.000) 0.886 (0.000) 0.871 (0.000)
Co-developing
behavior
0.888 (0.000) 0.875 (0.000) 0.888 (0.000)
Influencing
Behavior
0.782 (0.000) 0.827 (0.000) 0.835 (0.000) 0.826 (0.000) 0.836 (0.000) 0.825 (0.000)
mb1
mb2
mb3
mb4
mb5 if4 Informational
Fairness Mobilizing Behavior
mb6
ib2
ib1
cb3
cb2
cb1
Fig. 4.1 Direct path relationship between Service Fairness and Customer citizenship behaviors
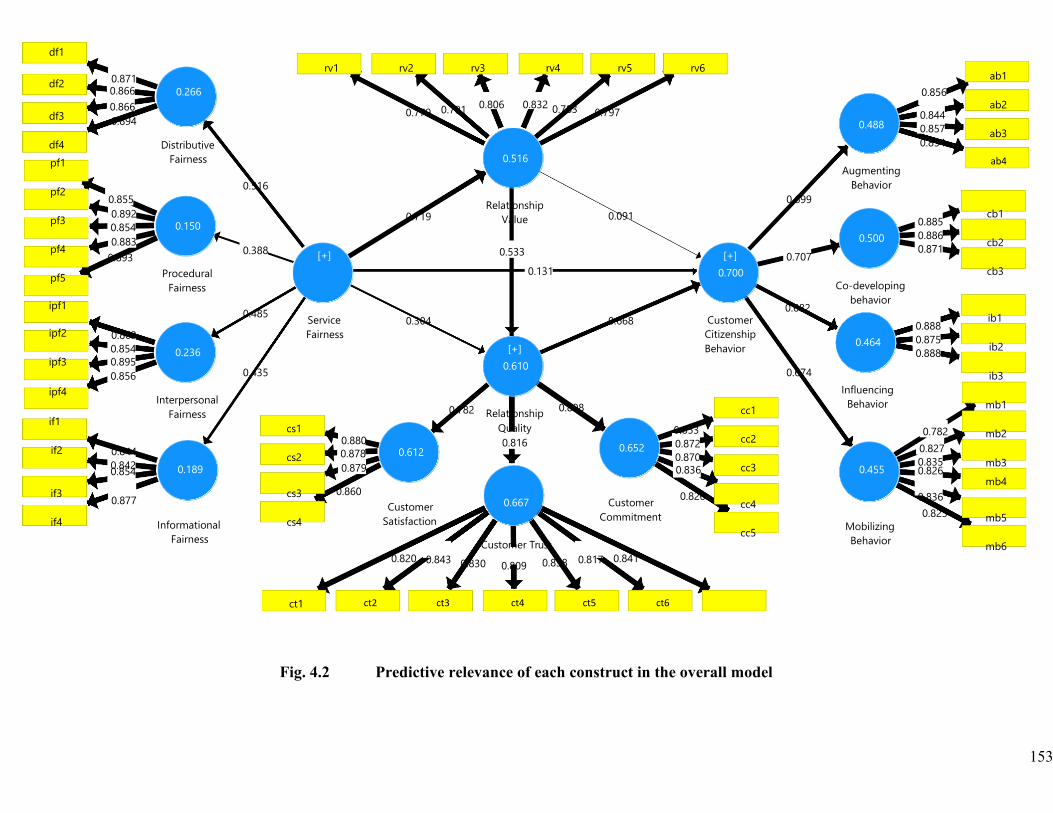
153
df1
df2
0.871 0.866
0.266
rv1
rv2
rv3
rv4 rv5
rv6
0.856
ab1
df3
df4
0.866 0.894
Distributive
0.779 0.791 0.806 0.832 0.783 0.797
0.488 0.844 0.857 0.854
ab2
ab3
pf1
pf2
pf3
pf4
pf5
ipf1
ipf2
ipf3
ipf4
if1
if2
0.855 0.892 0.854 0.883
0.893
0.863 0.854 0.895 0.856
0.844 0.842 0.854
Fairness
0.150
Procedural Fairness
0.236
Interpersonal Fairness
0.189
0.516
0.388
0.485
0.435
cs1
cs2
[+]
Service Fairness
0.880 0.878 0.879
0.719
0.304
0.612
0.782
0.516
Relationship Value
0.533
0.131
[+] 0.610
Relationship Quality 0.816
0.808
0.091
0.668
0.652
0.853 0.872 0.870 0.836
[+] 0.700
Customer Citizenship Behavior
cc1
cc2
cc3
0.699
0.707
0.682
0.674
Augmenting Behavior
0.500
Co-developing behavior
0.464
Influencing Behavior
0.455
0.885 0.886 0.871
0.888 0.875 0.888
0.782 0.827 0.835 0.826
ab4
cb1
cb2
cb3
ib1
ib2
ib3
mb1
mb2
mb3
mb4 if3
if4
0.877
Informational Fairness
cs3
cs4
0.860 Customer
Satisfaction 0.667
Customer Trust
Customer Commitment
0.826 cc4
cc5
Mobilizing Behavior
0.836 0.825 mb5
mb6 0.820 0.843 0.830 0.809 0.838 0.817 0.841
ct1 ct2 ct3 ct4 ct5 ct6
Fig. 4.2 Predictive relevance of each construct in the overall model
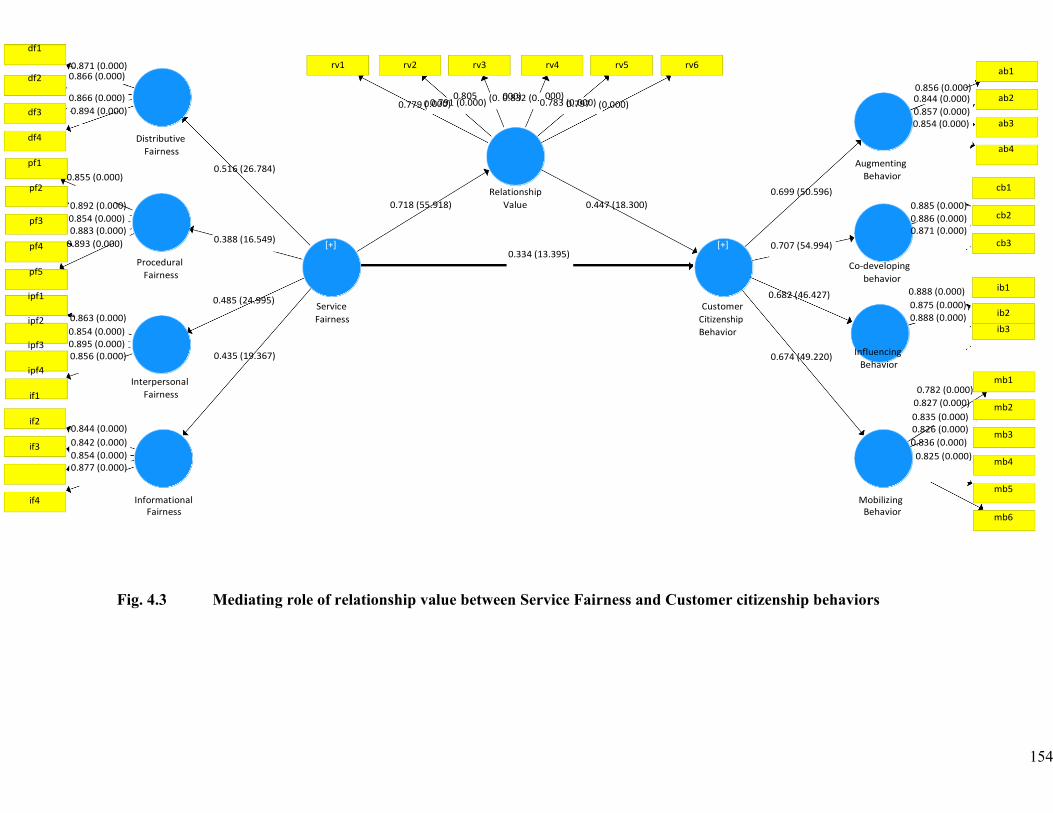
154
000) 000) 0.797 0.000)
0.805
ib3
df1
df2
0.871 (0.000) 0.866 (0.000)
rv1
rv2
rv3
rv4 rv5
rv6
0.856 (0.000)
ab1
df3
df4
pf1
pf2
0.866 (0.000) 0.894 (0.000)
0.855 (0.000)
Distributive
Fairness
0.516 (26.784)
0.779 ( 0.791 (0.000) (0. 0.832 (0.0.783 (0.000) (0.000)
Relationship
0.699 (50.596)
Augmenting Behavior
0.844 (0.000) 0.857 (0.000) 0.854 (0.000)
ab2
ab3
ab4
pf3
pf4
pf5
ipf1
ipf2
ipf3
ipf4
if1
if2
if3
0.892 (0.000) 0.854 (0.000) 0.883 (0.000)
0.893 (0.000)
0.863 (0.000) 0.854 (0.000) 0.895 (0.000) 0.856 (0.000)
0.844 (0.000) 0.842 (0.000) 0.854 (0.000) 0.877 (0.000)
Procedural
Fairness
Interpersonal
Fairness
0.388 (16.549)
0.485 (24.995)
0.435 (19.367)
[+]
Service Fairness
0.718 (55.918) Value
0.334 (13.395)
0.447 (18.300)
[+]
Customer Citizenship Behavior
0.707 (54.994)
0.682 (46.427)
0.674 (49.220)
0.885 (0.000) 0.886 (0.000) 0.871 (0.000)
Co-developing
behavior 0.888 (0.000) 0.875 (0.000) 0.888 (0.000)
Influencing
Behavior
0.782 (0.000) 0.827 (0.000) 0.835 (0.000) 0.826 (0.000) 0.836 (0.000)
0.825 (0.000)
mb1
mb2
mb3
mb4
mb5 if4 Informational
Fairness Mobilizing
Behavior
mb6
ib2
ib1
cb3
cb2
cb1
Fig. 4.3 Mediating role of relationship value between Service Fairness and Customer citizenship behaviors
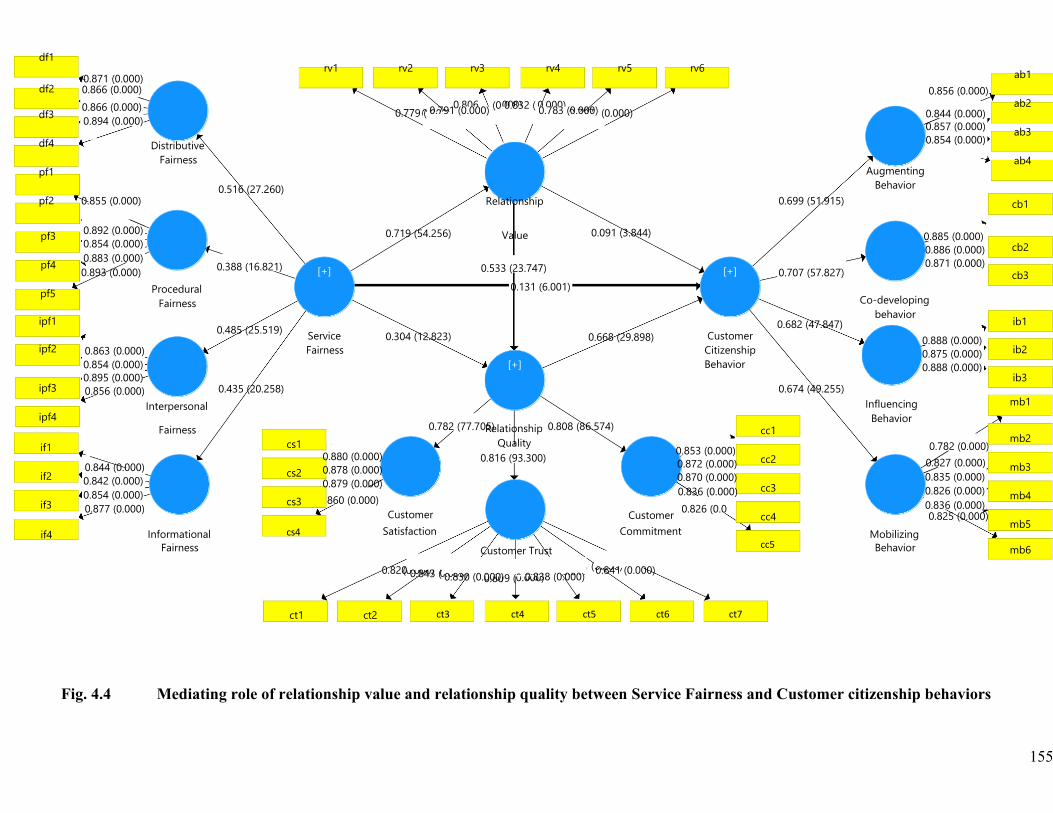
155
.000) 0.000) 0.797
0.000)
0.806
(0.000) 0.000) 0.80 (0.000) 0.000) 0.817
00) 0.
ipf3
df1
df2
0.871 (0.000) 0.866 (0.000)
rv1
rv2
rv3
rv4 rv5
rv6
0.856 (0.000)
ab1
df3
df4
pf1
pf2
0.866 (0.000) 0.894 (0.000)
0.855 (0.000)
Distributive
Fairness
0.516 (27.260)
0.779 ( 0.791 (0.000) (0 0.832 ( 0.783 (0.000) (0.000)
Relationship
0.699 (51.915)
Augmenting
Behavior
0.844 (0.000) 0.857 (0.000) 0.854 (0.000)
ab2
ab3
ab4
pf3
pf4
pf5
ipf1
ipf2
0.892 (0.000) 0.854 (0.000) 0.883 (0.000) 0.893 (0.000)
0.863 (0.000) 0.854 (0.000) 0.895 (0.000) 0.856 (0.000)
Procedural
Fairness Interpersonal
0.388 (16.821) 0.485 (25.519)
0.435 (20.258)
[+]
Service Fairness
0.719 (54.256)
0.304 (12.823)
Value
0.533 (23.747) 0.131 (6.001)
[+]
0.091 (3.844)
0.668 (29.898)
[+]
Customer Citizenship Behavior
0.707 (57.827)
0.682 (47.847)
0.674 (49.255)
0.885 (0.000) 0.886 (0.000) 0.871 (0.000)
Co-developing
behavior
0.888 (0.000) 0.875 (0.000) 0.888 (0.000)
Influencing
mb1
if1
if2
if3
0.844 (0.000) 0.842 (0.000) 0.854 (0.000) 0.877 (0.000)
Fairness cs1
cs2
cs3
0.880 (0.000) 0.878 (0.000) 0.879 (0.000) 860 (0.000)
0.782 (77.70R5e) lationship 0.808 (86.574) Quality
0.816 (93.300)
Customer
Customer
0.853 (0.000) 0.872 (0.000) 0.870 (0.000) 0.836 (0.000) 0.826 (0.0
cc1
cc2
cc3
cc4
Behavior 0.782 (0.000)
0.827 (0.000) 0.835 (0.000) 0.826 (0.000) 0.836 (0.000) 0.825 (0.000)
mb2
mb3
mb4
mb5 if4 Informational
Fairness cs4 Satisfaction
Customer Trust
Commitment cc5
Mobilizing Behavior
mb6
0.820 0.843 ( 0.830 (0.000)9 ( 0.838 (0.000) 0.841 (0.000)
ct1 ct2 ct3 ct4 ct5 ct6 ct7
cb1
cb2
cb3
ib1
ib2
ib3
ipf4
Fig. 4.4 Mediating role of relationship value and relationship quality between Service Fairness and Customer citizenship behaviors
156
4.7 Multigroup Analysis
4.7.1 Introduction
Multi-group analysis (MGA) was used to assess whether there are significant
differences between group-specific estimates (i.e. path coefficients, outer-loadings
model fit idiocies, variance accounted for VAF) among pre-defined consumer groups
(Sarstedt, Henseler, & Ringle, 2019). As the aggregate banking consumer’s dataset
(n=1430) was composed of six consumer groups namely; (n=240 consumers from
public, n=280 from private, n=220 from specialized, n=240 from foreign, n=200 from
micro-finance and n=250 from Islamic banks) were therefore generated in SMART
PLS 3.2.7 for Multigroup comparison. Multigroup analysis evaluation utilized the
default PLS settings, using a complete bootstrapping run with 5,000 sub-samples, using
non-parametric permutations procedure. Before proceeding with multigroup analysis
the model invariance was tested using three step permutation testing procedure.
4.7.2 Data analysis
The analysis of began by evaluating significant differences between factor loadings
among each of the consumer group in order to confirm measurement invariance of
composite models (MICOM). Table 4.20 indicate that all the items loadings (λ) were
significant (p=.05) and exceeded the minimum value > 0.7 on their respective
constructs reflecting adequate measurement structure. Moreover, there was no
significant difference found between factors loading among consumers groups.
Measurement invariance bias was also tested in subsequent sections.
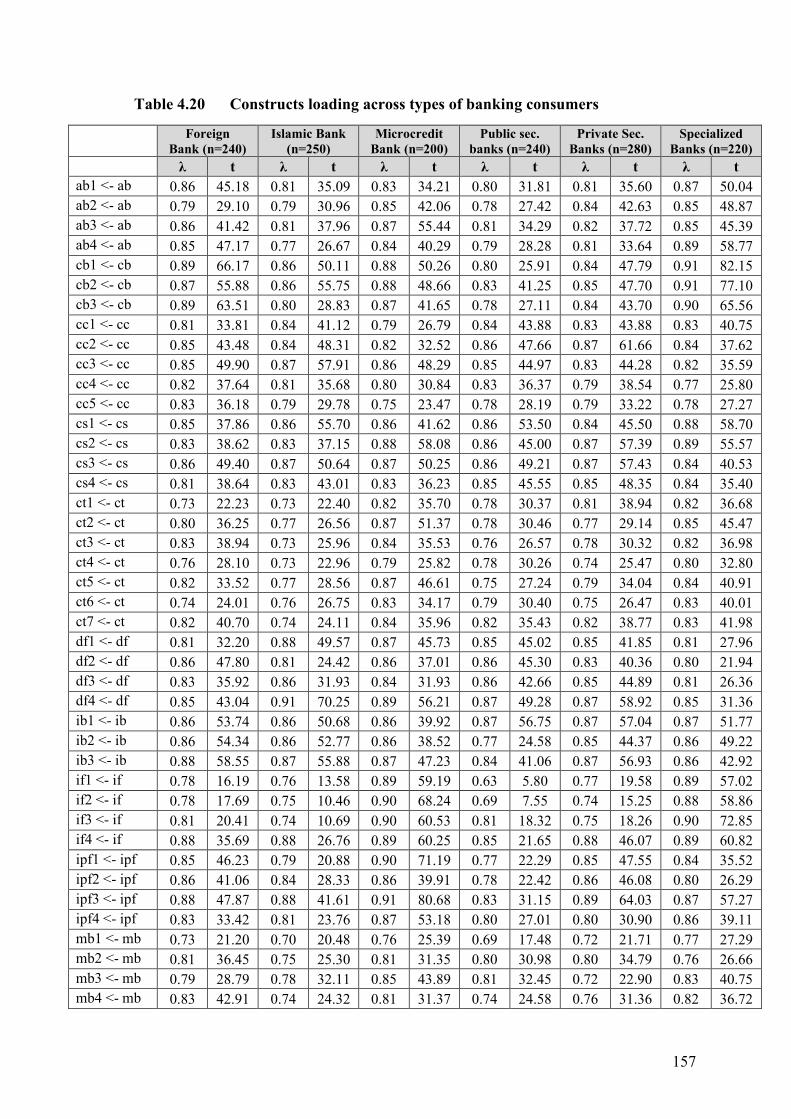
157
Table 4.20 Constructs loading across types of banking consumers
Foreign Bank (n=240)
Islamic Bank (n=250)
Microcredit Bank (n=200)
Public sec. banks (n=240)
Private Sec. Banks (n=280)
Specialized Banks (n=220)
λ t λ t λ t λ t λ t λ t ab1 <- ab 0.86 45.18 0.81 35.09 0.83 34.21 0.80 31.81 0.81 35.60 0.87 50.04 ab2 <- ab 0.79 29.10 0.79 30.96 0.85 42.06 0.78 27.42 0.84 42.63 0.85 48.87 ab3 <- ab 0.86 41.42 0.81 37.96 0.87 55.44 0.81 34.29 0.82 37.72 0.85 45.39 ab4 <- ab 0.85 47.17 0.77 26.67 0.84 40.29 0.79 28.28 0.81 33.64 0.89 58.77 cb1 <- cb 0.89 66.17 0.86 50.11 0.88 50.26 0.80 25.91 0.84 47.79 0.91 82.15 cb2 <- cb 0.87 55.88 0.86 55.75 0.88 48.66 0.83 41.25 0.85 47.70 0.91 77.10 cb3 <- cb 0.89 63.51 0.80 28.83 0.87 41.65 0.78 27.11 0.84 43.70 0.90 65.56 cc1 <- cc 0.81 33.81 0.84 41.12 0.79 26.79 0.84 43.88 0.83 43.88 0.83 40.75 cc2 <- cc 0.85 43.48 0.84 48.31 0.82 32.52 0.86 47.66 0.87 61.66 0.84 37.62 cc3 <- cc 0.85 49.90 0.87 57.91 0.86 48.29 0.85 44.97 0.83 44.28 0.82 35.59 cc4 <- cc 0.82 37.64 0.81 35.68 0.80 30.84 0.83 36.37 0.79 38.54 0.77 25.80 cc5 <- cc 0.83 36.18 0.79 29.78 0.75 23.47 0.78 28.19 0.79 33.22 0.78 27.27 cs1 <- cs 0.85 37.86 0.86 55.70 0.86 41.62 0.86 53.50 0.84 45.50 0.88 58.70 cs2 <- cs 0.83 38.62 0.83 37.15 0.88 58.08 0.86 45.00 0.87 57.39 0.89 55.57 cs3 <- cs 0.86 49.40 0.87 50.64 0.87 50.25 0.86 49.21 0.87 57.43 0.84 40.53 cs4 <- cs 0.81 38.64 0.83 43.01 0.83 36.23 0.85 45.55 0.85 48.35 0.84 35.40 ct1 <- ct 0.73 22.23 0.73 22.40 0.82 35.70 0.78 30.37 0.81 38.94 0.82 36.68 ct2 <- ct 0.80 36.25 0.77 26.56 0.87 51.37 0.78 30.46 0.77 29.14 0.85 45.47 ct3 <- ct 0.83 38.94 0.73 25.96 0.84 35.53 0.76 26.57 0.78 30.32 0.82 36.98 ct4 <- ct 0.76 28.10 0.73 22.96 0.79 25.82 0.78 30.26 0.74 25.47 0.80 32.80 ct5 <- ct 0.82 33.52 0.77 28.56 0.87 46.61 0.75 27.24 0.79 34.04 0.84 40.91 ct6 <- ct 0.74 24.01 0.76 26.75 0.83 34.17 0.79 30.40 0.75 26.47 0.83 40.01 ct7 <- ct 0.82 40.70 0.74 24.11 0.84 35.96 0.82 35.43 0.82 38.77 0.83 41.98 df1 <- df 0.81 32.20 0.88 49.57 0.87 45.73 0.85 45.02 0.85 41.85 0.81 27.96 df2 <- df 0.86 47.80 0.81 24.42 0.86 37.01 0.86 45.30 0.83 40.36 0.80 21.94 df3 <- df 0.83 35.92 0.86 31.93 0.84 31.93 0.86 42.66 0.85 44.89 0.81 26.36 df4 <- df 0.85 43.04 0.91 70.25 0.89 56.21 0.87 49.28 0.87 58.92 0.85 31.36 ib1 <- ib 0.86 53.74 0.86 50.68 0.86 39.92 0.87 56.75 0.87 57.04 0.87 51.77 ib2 <- ib 0.86 54.34 0.86 52.77 0.86 38.52 0.77 24.58 0.85 44.37 0.86 49.22 ib3 <- ib 0.88 58.55 0.87 55.88 0.87 47.23 0.84 41.06 0.87 56.93 0.86 42.92 if1 <- if 0.78 16.19 0.76 13.58 0.89 59.19 0.63 5.80 0.77 19.58 0.89 57.02 if2 <- if 0.78 17.69 0.75 10.46 0.90 68.24 0.69 7.55 0.74 15.25 0.88 58.86 if3 <- if 0.81 20.41 0.74 10.69 0.90 60.53 0.81 18.32 0.75 18.26 0.90 72.85 if4 <- if 0.88 35.69 0.88 26.76 0.89 60.25 0.85 21.65 0.88 46.07 0.89 60.82 ipf1 <- ipf 0.85 46.23 0.79 20.88 0.90 71.19 0.77 22.29 0.85 47.55 0.84 35.52 ipf2 <- ipf 0.86 41.06 0.84 28.33 0.86 39.91 0.78 22.42 0.86 46.08 0.80 26.29 ipf3 <- ipf 0.88 47.87 0.88 41.61 0.91 80.68 0.83 31.15 0.89 64.03 0.87 57.27 ipf4 <- ipf 0.83 33.42 0.81 23.76 0.87 53.18 0.80 27.01 0.80 30.90 0.86 39.11 mb1 <- mb 0.73 21.20 0.70 20.48 0.76 25.39 0.69 17.48 0.72 21.71 0.77 27.29 mb2 <- mb 0.81 36.45 0.75 25.30 0.81 31.35 0.80 30.98 0.80 34.79 0.76 26.66 mb3 <- mb 0.79 28.79 0.78 32.11 0.85 43.89 0.81 32.45 0.72 22.90 0.83 40.75 mb4 <- mb 0.83 42.91 0.74 24.32 0.81 31.37 0.74 24.58 0.76 31.36 0.82 36.72
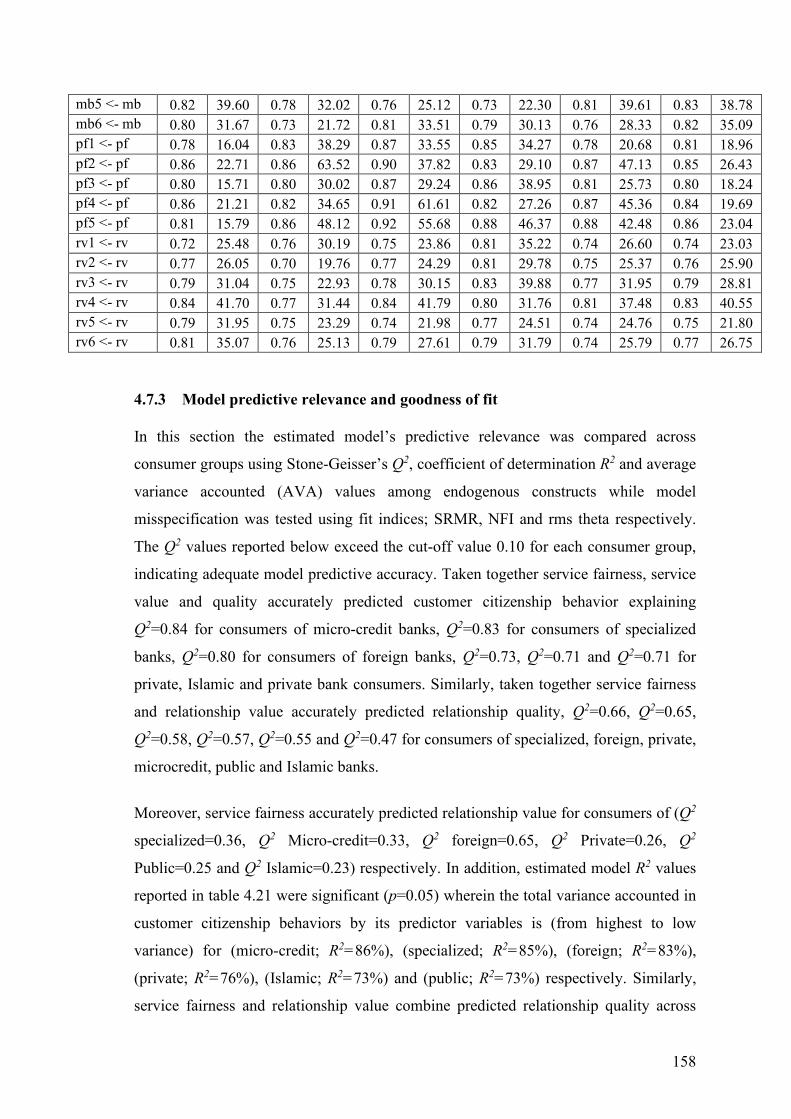
158
mb5 <- mb 0.82 39.60 0.78 32.02 0.76 25.12 0.73 22.30 0.81 39.61 0.83 38.78 mb6 <- mb 0.80 31.67 0.73 21.72 0.81 33.51 0.79 30.13 0.76 28.33 0.82 35.09 pf1 <- pf 0.78 16.04 0.83 38.29 0.87 33.55 0.85 34.27 0.78 20.68 0.81 18.96 pf2 <- pf 0.86 22.71 0.86 63.52 0.90 37.82 0.83 29.10 0.87 47.13 0.85 26.43 pf3 <- pf 0.80 15.71 0.80 30.02 0.87 29.24 0.86 38.95 0.81 25.73 0.80 18.24 pf4 <- pf 0.86 21.21 0.82 34.65 0.91 61.61 0.82 27.26 0.87 45.36 0.84 19.69 pf5 <- pf 0.81 15.79 0.86 48.12 0.92 55.68 0.88 46.37 0.88 42.48 0.86 23.04 rv1 <- rv 0.72 25.48 0.76 30.19 0.75 23.86 0.81 35.22 0.74 26.60 0.74 23.03 rv2 <- rv 0.77 26.05 0.70 19.76 0.77 24.29 0.81 29.78 0.75 25.37 0.76 25.90 rv3 <- rv 0.79 31.04 0.75 22.93 0.78 30.15 0.83 39.88 0.77 31.95 0.79 28.81 rv4 <- rv 0.84 41.70 0.77 31.44 0.84 41.79 0.80 31.76 0.81 37.48 0.83 40.55 rv5 <- rv 0.79 31.95 0.75 23.29 0.74 21.98 0.77 24.51 0.74 24.76 0.75 21.80 rv6 <- rv 0.81 35.07 0.76 25.13 0.79 27.61 0.79 31.79 0.74 25.79 0.77 26.75
4.7.3 Model predictive relevance and goodness of fit
In this section the estimated model’s predictive relevance was compared across
consumer groups using Stone-Geisser’s Q2, coefficient of determination R2 and average
variance accounted (AVA) values among endogenous constructs while model
misspecification was tested using fit indices; SRMR, NFI and rms theta respectively.
The Q2 values reported below exceed the cut-off value 0.10 for each consumer group,
indicating adequate model predictive accuracy. Taken together service fairness, service
value and quality accurately predicted customer citizenship behavior explaining
Q2=0.84 for consumers of micro-credit banks, Q2=0.83 for consumers of specialized
banks, Q2=0.80 for consumers of foreign banks, Q2=0.73, Q2=0.71 and Q2=0.71 for
private, Islamic and private bank consumers. Similarly, taken together service fairness
and relationship value accurately predicted relationship quality, Q2=0.66, Q2=0.65,
Q2=0.58, Q2=0.57, Q2=0.55 and Q2=0.47 for consumers of specialized, foreign, private,
microcredit, public and Islamic banks.
Moreover, service fairness accurately predicted relationship value for consumers of (Q2
specialized=0.36, Q2 Micro-credit=0.33, Q2 foreign=0.65, Q2 Private=0.26, Q2
Public=0.25 and Q2 Islamic=0.23) respectively. In addition, estimated model R2 values
reported in table 4.21 were significant (p=0.05) wherein the total variance accounted in
customer citizenship behaviors by its predictor variables is (from highest to low
variance) for (micro-credit; R2=86%), (specialized; R2=85%), (foreign; R2=83%),
(private; R2=76%), (Islamic; R2=73%) and (public; R2=73%) respectively. Similarly,
service fairness and relationship value combine predicted relationship quality across
159
consumer groups as (specialized; R2=68%), (foreign; R2=66%), (private; R2=60%),
(micro-credit; R2=59%), (public; R2=56%) and (Islamic; R2=49%) respectively. The
total variance explained in relationship value by service fairness across consumer
groups as (specialized; R2=65%), (micro-credit; R2=58%), (foreign; R2=53%), (private;
R2=46%), (Islamic; R2=44%) and (public; R2=42%) and respectively.
Based on endogenous R2 readings the average variance accounted (AVA) for all
second-order was computed as sum of R2/number of latent variables. As a result, the
average variance accounted (AVA) for each consumer group exceeded the minimum
cut-off value 0.10 (Falk & Miller, 1992). Showing highest values for (specialized;
AVA=72%) followed by (micro-credit; AVA=68%), (foreign, AVA=78%). Overall these
readings reflected that the model has good predictive relevance. Model fit indices for
each of the data group indicated the each of the estimated structural model fitted the
data well as the SRMR values for estimated (inner) model were below conservative
threshold level of 0.08 while the a rms Theta values for (outer) model for each group
exceeded the cut-off value of 0.09. In addition, the NFI values were also above
threshold of 0.7 indicating good model fitting. therefore, model misspecification was
not a problem in each the six groups.
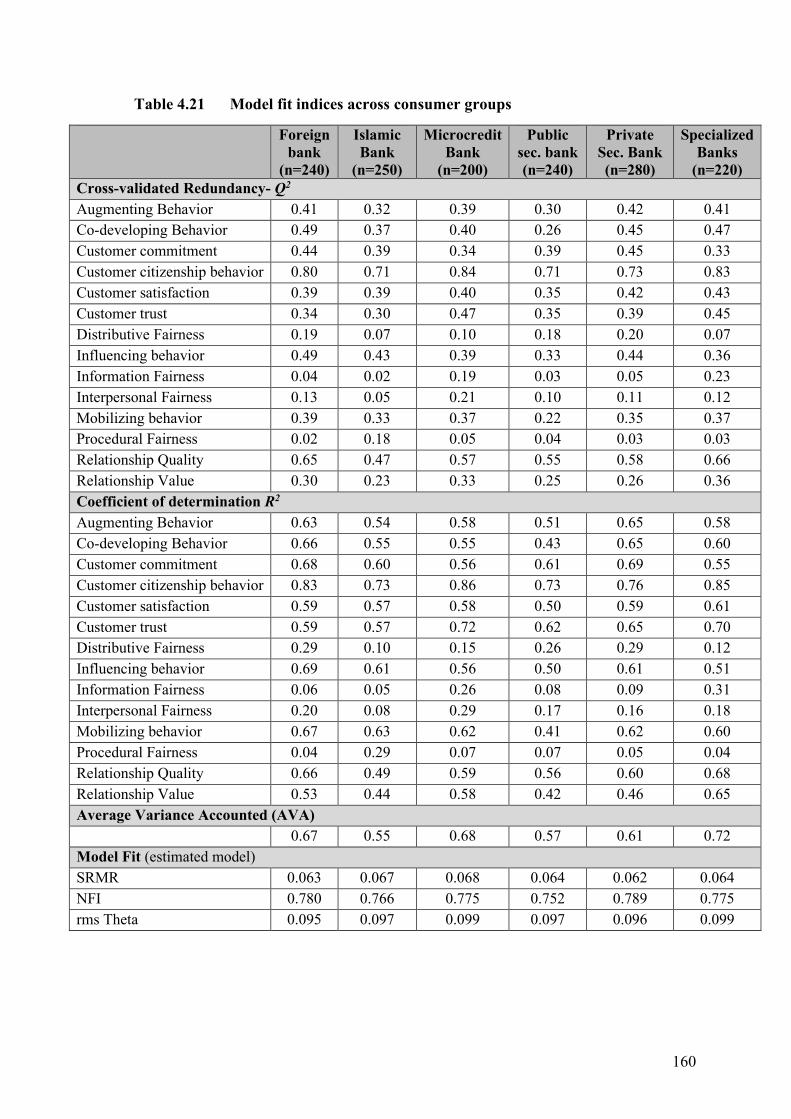
160
Table 4.21 Model fit indices across consumer groups
Foreign bank
(n=240)
Islamic Bank
(n=250)
Microcredit Bank
(n=200)
Public sec. bank (n=240)
Private Sec. Bank (n=280)
Specialized Banks
(n=220) Cross-validated Redundancy- Q2 Augmenting Behavior 0.41 0.32 0.39 0.30 0.42 0.41 Co-developing Behavior 0.49 0.37 0.40 0.26 0.45 0.47 Customer commitment 0.44 0.39 0.34 0.39 0.45 0.33 Customer citizenship behavior 0.80 0.71 0.84 0.71 0.73 0.83 Customer satisfaction 0.39 0.39 0.40 0.35 0.42 0.43 Customer trust 0.34 0.30 0.47 0.35 0.39 0.45 Distributive Fairness 0.19 0.07 0.10 0.18 0.20 0.07 Influencing behavior 0.49 0.43 0.39 0.33 0.44 0.36 Information Fairness 0.04 0.02 0.19 0.03 0.05 0.23 Interpersonal Fairness 0.13 0.05 0.21 0.10 0.11 0.12 Mobilizing behavior 0.39 0.33 0.37 0.22 0.35 0.37 Procedural Fairness 0.02 0.18 0.05 0.04 0.03 0.03 Relationship Quality 0.65 0.47 0.57 0.55 0.58 0.66 Relationship Value 0.30 0.23 0.33 0.25 0.26 0.36 Coefficient of determination R2 Augmenting Behavior 0.63 0.54 0.58 0.51 0.65 0.58 Co-developing Behavior 0.66 0.55 0.55 0.43 0.65 0.60 Customer commitment 0.68 0.60 0.56 0.61 0.69 0.55 Customer citizenship behavior 0.83 0.73 0.86 0.73 0.76 0.85 Customer satisfaction 0.59 0.57 0.58 0.50 0.59 0.61 Customer trust 0.59 0.57 0.72 0.62 0.65 0.70 Distributive Fairness 0.29 0.10 0.15 0.26 0.29 0.12 Influencing behavior 0.69 0.61 0.56 0.50 0.61 0.51 Information Fairness 0.06 0.05 0.26 0.08 0.09 0.31 Interpersonal Fairness 0.20 0.08 0.29 0.17 0.16 0.18 Mobilizing behavior 0.67 0.63 0.62 0.41 0.62 0.60 Procedural Fairness 0.04 0.29 0.07 0.07 0.05 0.04 Relationship Quality 0.66 0.49 0.59 0.56 0.60 0.68 Relationship Value 0.53 0.44 0.58 0.42 0.46 0.65 Average Variance Accounted (AVA) 0.67 0.55 0.68 0.57 0.61 0.72 Model Fit (estimated model) SRMR 0.063 0.067 0.068 0.064 0.062 0.064 NFI 0.780 0.766 0.775 0.752 0.789 0.775 rms Theta 0.095 0.097 0.099 0.097 0.096 0.099
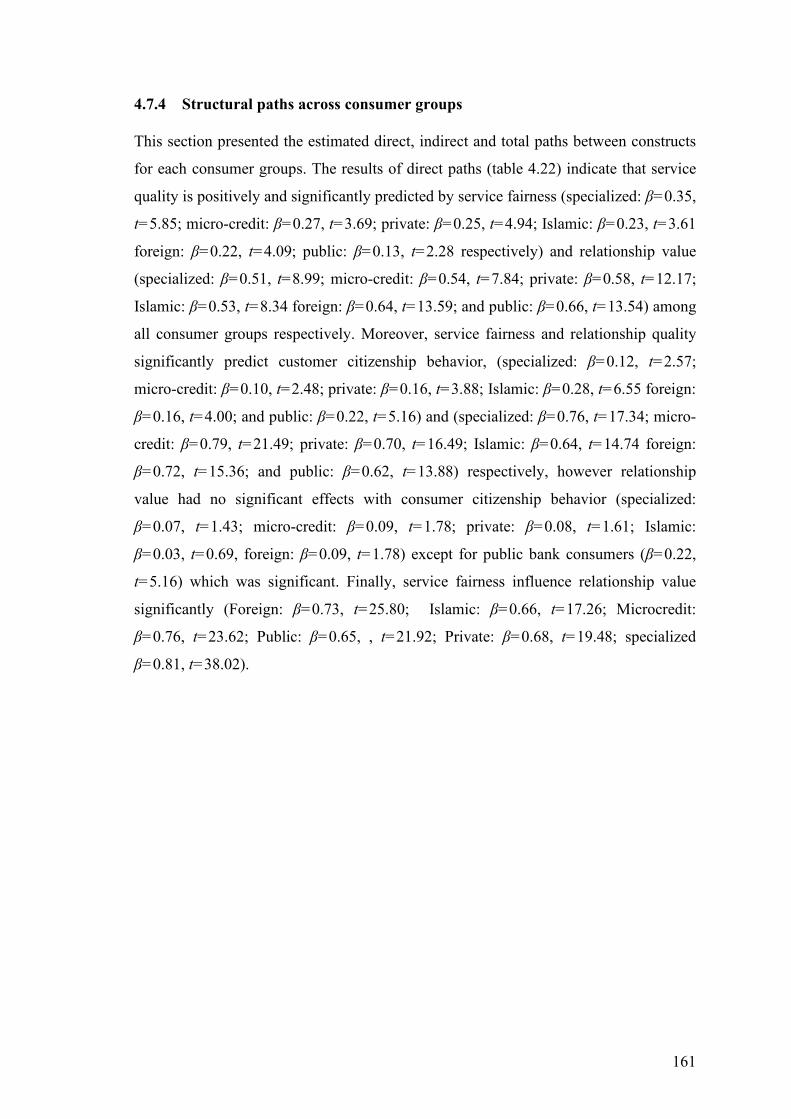
161
4.7.4 Structural paths across consumer groups
This section presented the estimated direct, indirect and total paths between constructs
for each consumer groups. The results of direct paths (table 4.22) indicate that service
quality is positively and significantly predicted by service fairness (specialized: β=0.35,
t=5.85; micro-credit: β=0.27, t=3.69; private: β=0.25, t=4.94; Islamic: β=0.23, t=3.61
foreign: β=0.22, t=4.09; public: β=0.13, t=2.28 respectively) and relationship value
(specialized: β=0.51, t=8.99; micro-credit: β=0.54, t=7.84; private: β=0.58, t=12.17;
Islamic: β=0.53, t=8.34 foreign: β=0.64, t=13.59; and public: β=0.66, t=13.54) among
all consumer groups respectively. Moreover, service fairness and relationship quality
significantly predict customer citizenship behavior, (specialized: β=0.12, t=2.57;
micro-credit: β=0.10, t=2.48; private: β=0.16, t=3.88; Islamic: β=0.28, t=6.55 foreign:
β=0.16, t=4.00; and public: β=0.22, t=5.16) and (specialized: β=0.76, t=17.34; micro-
credit: β=0.79, t=21.49; private: β=0.70, t=16.49; Islamic: β=0.64, t=14.74 foreign:
β=0.72, t=15.36; and public: β=0.62, t=13.88) respectively, however relationship
value had no significant effects with consumer citizenship behavior (specialized:
β=0.07, t=1.43; micro-credit: β=0.09, t=1.78; private: β=0.08, t=1.61; Islamic:
β=0.03, t=0.69, foreign: β=0.09, t=1.78) except for public bank consumers (β=0.22,
t=5.16) which was significant. Finally, service fairness influence relationship value
significantly (Foreign: β=0.73, t=25.80; Islamic: β=0.66, t=17.26; Microcredit:
β=0.76, t=23.62; Public: β=0.65, , t=21.92; Private: β=0.68, t=19.48; specialized
β=0.81, t=38.02).
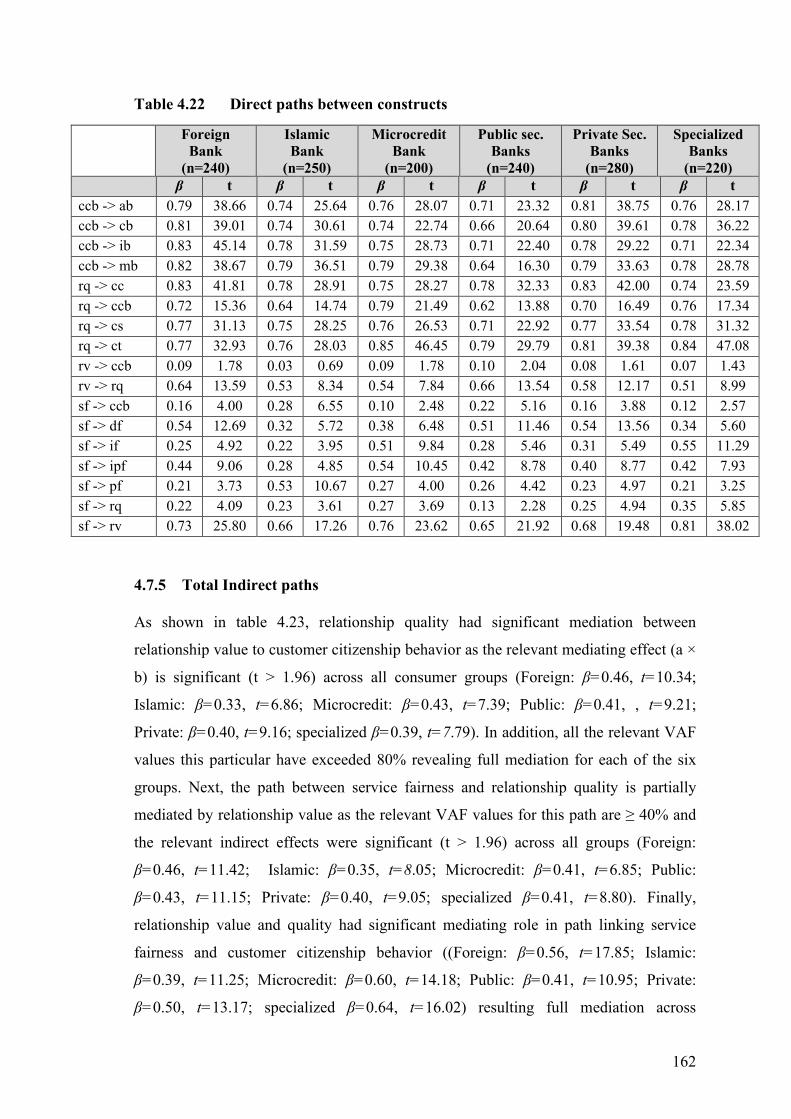
162
Table 4.22 Direct paths between constructs
Foreign Bank
(n=240)
Islamic Bank
(n=250)
Microcredit Bank
(n=200)
Public sec. Banks
(n=240)
Private Sec. Banks
(n=280)
Specialized Banks
(n=220) β t β t β t β t β t β t ccb -> ab 0.79 38.66 0.74 25.64 0.76 28.07 0.71 23.32 0.81 38.75 0.76 28.17 ccb -> cb 0.81 39.01 0.74 30.61 0.74 22.74 0.66 20.64 0.80 39.61 0.78 36.22 ccb -> ib 0.83 45.14 0.78 31.59 0.75 28.73 0.71 22.40 0.78 29.22 0.71 22.34 ccb -> mb 0.82 38.67 0.79 36.51 0.79 29.38 0.64 16.30 0.79 33.63 0.78 28.78 rq -> cc 0.83 41.81 0.78 28.91 0.75 28.27 0.78 32.33 0.83 42.00 0.74 23.59 rq -> ccb 0.72 15.36 0.64 14.74 0.79 21.49 0.62 13.88 0.70 16.49 0.76 17.34 rq -> cs 0.77 31.13 0.75 28.25 0.76 26.53 0.71 22.92 0.77 33.54 0.78 31.32 rq -> ct 0.77 32.93 0.76 28.03 0.85 46.45 0.79 29.79 0.81 39.38 0.84 47.08 rv -> ccb 0.09 1.78 0.03 0.69 0.09 1.78 0.10 2.04 0.08 1.61 0.07 1.43 rv -> rq 0.64 13.59 0.53 8.34 0.54 7.84 0.66 13.54 0.58 12.17 0.51 8.99 sf -> ccb 0.16 4.00 0.28 6.55 0.10 2.48 0.22 5.16 0.16 3.88 0.12 2.57 sf -> df 0.54 12.69 0.32 5.72 0.38 6.48 0.51 11.46 0.54 13.56 0.34 5.60 sf -> if 0.25 4.92 0.22 3.95 0.51 9.84 0.28 5.46 0.31 5.49 0.55 11.29 sf -> ipf 0.44 9.06 0.28 4.85 0.54 10.45 0.42 8.78 0.40 8.77 0.42 7.93 sf -> pf 0.21 3.73 0.53 10.67 0.27 4.00 0.26 4.42 0.23 4.97 0.21 3.25 sf -> rq 0.22 4.09 0.23 3.61 0.27 3.69 0.13 2.28 0.25 4.94 0.35 5.85 sf -> rv 0.73 25.80 0.66 17.26 0.76 23.62 0.65 21.92 0.68 19.48 0.81 38.02
4.7.5 Total Indirect paths
As shown in table 4.23, relationship quality had significant mediation between
relationship value to customer citizenship behavior as the relevant mediating effect (a ×
b) is significant (t > 1.96) across all consumer groups (Foreign: β=0.46, t=10.34;
Islamic: β=0.33, t=6.86; Microcredit: β=0.43, t=7.39; Public: β=0.41, , t=9.21;
Private: β=0.40, t=9.16; specialized β=0.39, t=7.79). In addition, all the relevant VAF
values this particular have exceeded 80% revealing full mediation for each of the six
groups. Next, the path between service fairness and relationship quality is partially
mediated by relationship value as the relevant VAF values for this path are ≥ 40% and
the relevant indirect effects were significant (t > 1.96) across all groups (Foreign:
β=0.46, t=11.42; Islamic: β=0.35, t=8.05; Microcredit: β=0.41, t=6.85; Public:
β=0.43, t=11.15; Private: β=0.40, t=9.05; specialized β=0.41, t=8.80). Finally,
relationship value and quality had significant mediating role in path linking service
fairness and customer citizenship behavior ((Foreign: β=0.56, t=17.85; Islamic:
β=0.39, t=11.25; Microcredit: β=0.60, t=14.18; Public: β=0.41, t=10.95; Private:
β=0.50, t=13.17; specialized β=0.64, t=16.02) resulting full mediation across
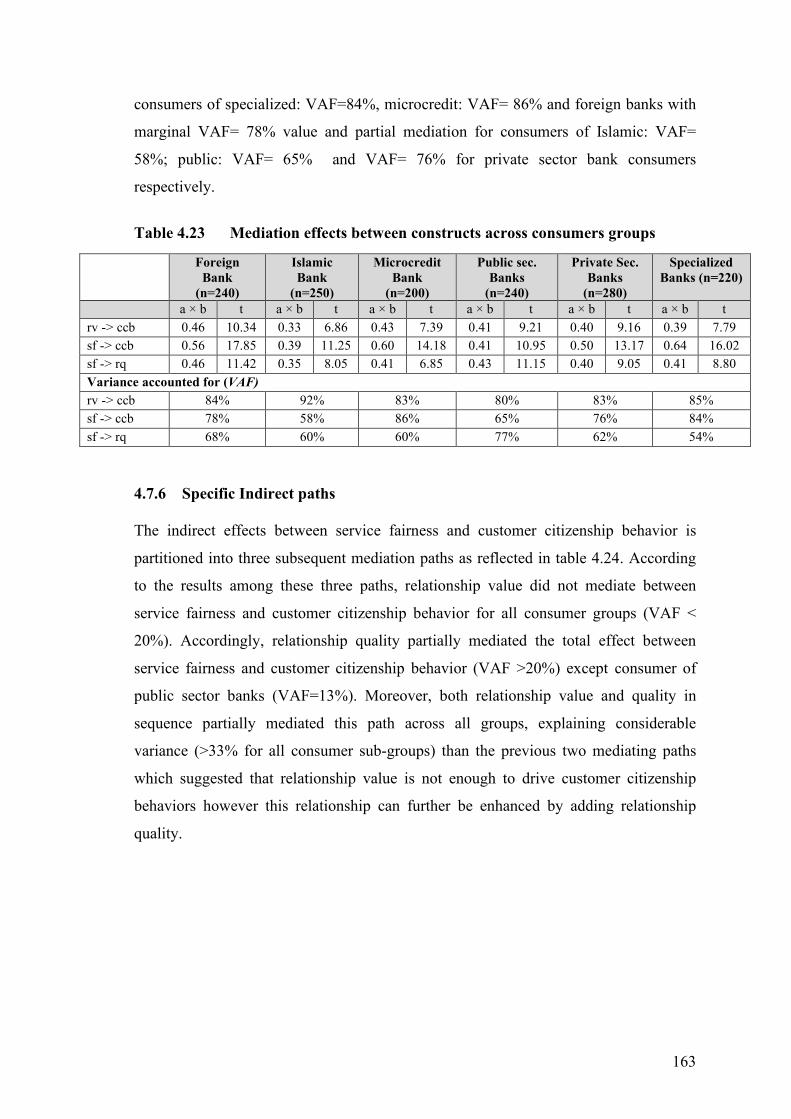
163
consumers of specialized: VAF=84%, microcredit: VAF= 86% and foreign banks with
marginal VAF= 78% value and partial mediation for consumers of Islamic: VAF=
58%; public: VAF= 65% and VAF= 76% for private sector bank consumers
respectively.
Table 4.23 Mediation effects between constructs across consumers groups
Foreign Bank
(n=240)
Islamic Bank
(n=250)
Microcredit Bank
(n=200)
Public sec. Banks
(n=240)
Private Sec. Banks
(n=280)
Specialized Banks (n=220)
a × b t a × b t a × b t a × b t a × b t a × b t rv -> ccb 0.46 10.34 0.33 6.86 0.43 7.39 0.41 9.21 0.40 9.16 0.39 7.79 sf -> ccb 0.56 17.85 0.39 11.25 0.60 14.18 0.41 10.95 0.50 13.17 0.64 16.02 sf -> rq 0.46 11.42 0.35 8.05 0.41 6.85 0.43 11.15 0.40 9.05 0.41 8.80 Variance accounted for (VAF) rv -> ccb 84% 92% 83% 80% 83% 85% sf -> ccb 78% 58% 86% 65% 76% 84% sf -> rq 68% 60% 60% 77% 62% 54%
4.7.6 Specific Indirect paths
The indirect effects between service fairness and customer citizenship behavior is
partitioned into three subsequent mediation paths as reflected in table 4.24. According
to the results among these three paths, relationship value did not mediate between
service fairness and customer citizenship behavior for all consumer groups (VAF <
20%). Accordingly, relationship quality partially mediated the total effect between
service fairness and customer citizenship behavior (VAF >20%) except consumer of
public sector banks (VAF=13%). Moreover, both relationship value and quality in
sequence partially mediated this path across all groups, explaining considerable
variance (>33% for all consumer sub-groups) than the previous two mediating paths
which suggested that relationship value is not enough to drive customer citizenship
behaviors however this relationship can further be enhanced by adding relationship
quality.
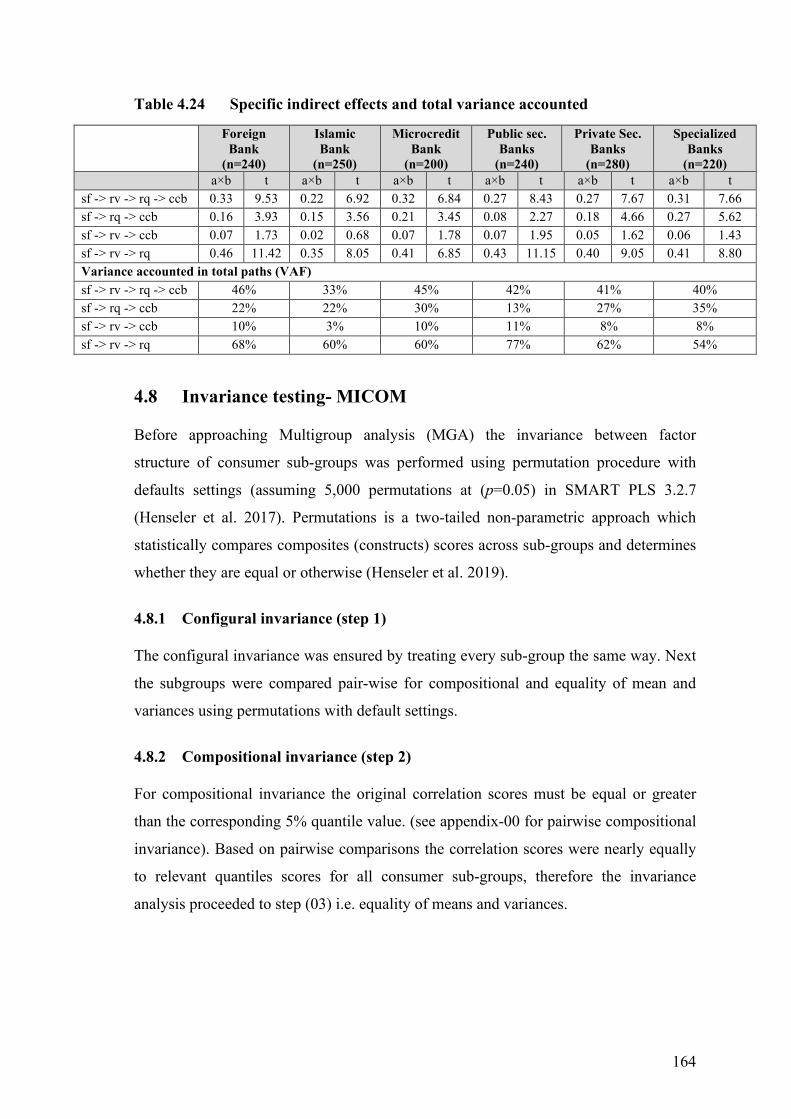
164
Table 4.24 Specific indirect effects and total variance accounted
Foreign Bank
(n=240)
Islamic Bank
(n=250)
Microcredit Bank
(n=200)
Public sec. Banks
(n=240)
Private Sec. Banks
(n=280)
Specialized Banks
(n=220) a×b t a×b t a×b t a×b t a×b t a×b t sf -> rv -> rq -> ccb 0.33 9.53 0.22 6.92 0.32 6.84 0.27 8.43 0.27 7.67 0.31 7.66 sf -> rq -> ccb 0.16 3.93 0.15 3.56 0.21 3.45 0.08 2.27 0.18 4.66 0.27 5.62 sf -> rv -> ccb 0.07 1.73 0.02 0.68 0.07 1.78 0.07 1.95 0.05 1.62 0.06 1.43 sf -> rv -> rq 0.46 11.42 0.35 8.05 0.41 6.85 0.43 11.15 0.40 9.05 0.41 8.80 Variance accounted in total paths (VAF) sf -> rv -> rq -> ccb 46% 33% 45% 42% 41% 40% sf -> rq -> ccb 22% 22% 30% 13% 27% 35% sf -> rv -> ccb 10% 3% 10% 11% 8% 8% sf -> rv -> rq 68% 60% 60% 77% 62% 54%
4.8 Invariance testing- MICOM
Before approaching Multigroup analysis (MGA) the invariance between factor
structure of consumer sub-groups was performed using permutation procedure with
defaults settings (assuming 5,000 permutations at (p=0.05) in SMART PLS 3.2.7
(Henseler et al. 2017). Permutations is a two-tailed non-parametric approach which
statistically compares composites (constructs) scores across sub-groups and determines
whether they are equal or otherwise (Henseler et al. 2019).
4.8.1 Configural invariance (step 1)
The configural invariance was ensured by treating every sub-group the same way. Next
the subgroups were compared pair-wise for compositional and equality of mean and
variances using permutations with default settings.
4.8.2 Compositional invariance (step 2)
For compositional invariance the original correlation scores must be equal or greater
than the corresponding 5% quantile value. (see appendix-00 for pairwise compositional
invariance). Based on pairwise comparisons the correlation scores were nearly equally
to relevant quantiles scores for all consumer sub-groups, therefore the invariance
analysis proceeded to step (03) i.e. equality of means and variances.
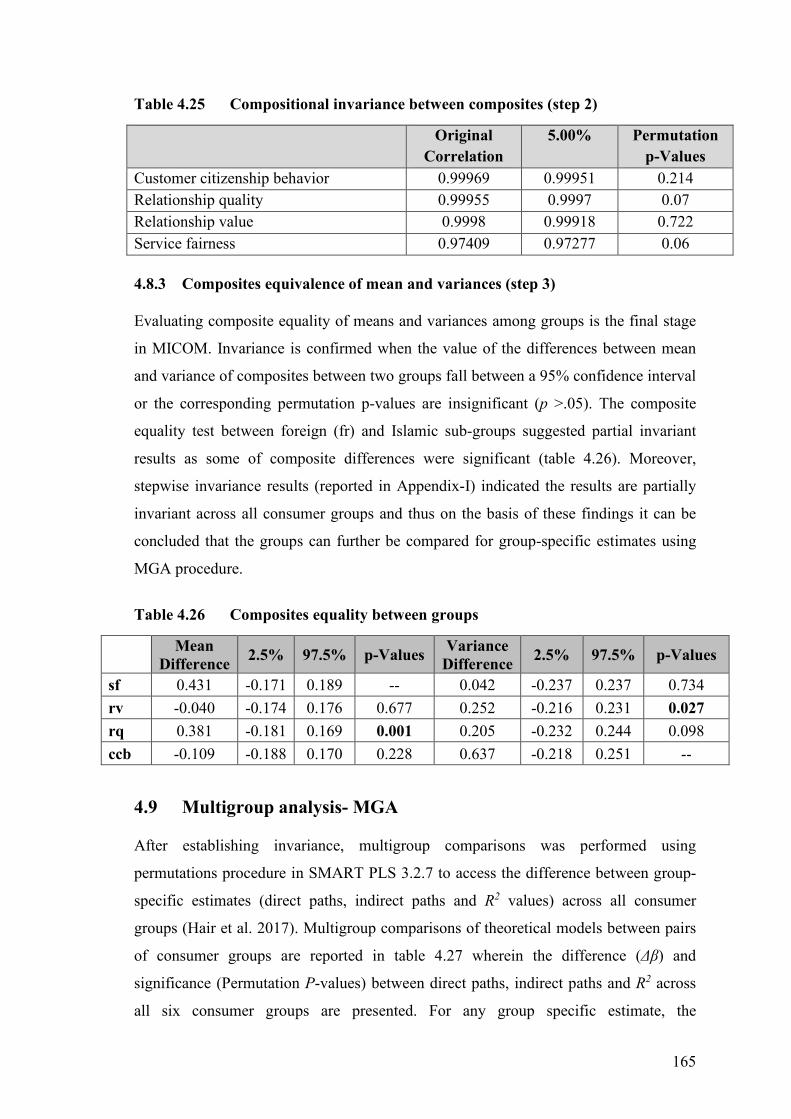
165
Table 4.25 Compositional invariance between composites (step 2)
Original Correlation
5.00% Permutation p-Values
Customer citizenship behavior 0.99969 0.99951 0.214 Relationship quality 0.99955 0.9997 0.07 Relationship value 0.9998 0.99918 0.722 Service fairness 0.97409 0.97277 0.06
4.8.3 Composites equivalence of mean and variances (step 3)
Evaluating composite equality of means and variances among groups is the final stage
in MICOM. Invariance is confirmed when the value of the differences between mean
and variance of composites between two groups fall between a 95% confidence interval
or the corresponding permutation p-values are insignificant (p >.05). The composite
equality test between foreign (fr) and Islamic sub-groups suggested partial invariant
results as some of composite differences were significant (table 4.26). Moreover,
stepwise invariance results (reported in Appendix-I) indicated the results are partially
invariant across all consumer groups and thus on the basis of these findings it can be
concluded that the groups can further be compared for group-specific estimates using
MGA procedure.
Table 4.26 Composites equality between groups
Mean Difference 2.5% 97.5% p-Values Variance
Difference 2.5% 97.5% p-Values
sf 0.431 -0.171 0.189 -- 0.042 -0.237 0.237 0.734 rv -0.040 -0.174 0.176 0.677 0.252 -0.216 0.231 0.027 rq 0.381 -0.181 0.169 0.001 0.205 -0.232 0.244 0.098 ccb -0.109 -0.188 0.170 0.228 0.637 -0.218 0.251 --
4.9 Multigroup analysis- MGA
After establishing invariance, multigroup comparisons was performed using
permutations procedure in SMART PLS 3.2.7 to access the difference between group-
specific estimates (direct paths, indirect paths and R2 values) across all consumer
groups (Hair et al. 2017). Multigroup comparisons of theoretical models between pairs
of consumer groups are reported in table 4.27 wherein the difference (Δβ) and
significance (Permutation P-values) between direct paths, indirect paths and R2 across
all six consumer groups are presented. For any group specific estimate, the
166
corresponding (p-value > 0.10) indicate significant difference between two-groups
(Henseler et al. 2016).
4.9.1 Foreign vs Islamic bank consumers
Direct path differences
Significant difference was returned for paths between service fairness and customer
citizenship behavior (β=0.16 vs β=0.28, Δβ=0.12, p=.07) and between relationship
quality and value (β=0.64 vs β=0.53, Δβ=0.11, p=.08). Moreover, for foreign bank
consumers distributive fairness (β=.54) was most important than Interpersonal fairness
(β=.44), followed by informational fairness (β= .25) and procedural fairness (β=.21).
However, among consumers of Islamic banks procedural fairness (β=.53) was most
important followed by distributive fairness (β=.32) while interpersonal fairness (β=.28)
and informational fairness (β=.22) were least important.
Indirect effect differences
As shown in table 4.27, the indirect path difference between the two consumer groups
was significant. Specifically, the total indirect effect between service fairness and
customer citizenship behavior was significantly higher for consumers of foreign banks
than Islamic banks (β=0.56 vs β=0.39; Δβ=0.17, p=.00), the total indirect effect
between service fairness and relationship quality was also significantly higher for
consumers of foreign banks than Islamic banks (β=0.46 vs β=0.35; Δβ=0.1, p=.05), this
was also true for the indirect path between relationship value and customer citizenship
behavior (β=0.46 vs β=0.33; Δβ=0.12, p=.05),
Difference between R2 values
The significant difference returned between R2 values of endogenous variables ccb
(R2=0.83 vs R2=0.73; ΔR2=0.10, p=.00) and relationship quality (R2=0.66 vs R2=0.49;
ΔR2=0.17, p=.00) was due to significant difference between indirect mediation effects
between the two groups. Thus, from results reported above it can be concluded that
consumers of foreign banks perceive strong relationship and derive significant value
from their relationship with theirs banks based on their perception of service fairness as
compared to consumers of Islamic bank.
167
4.9.2 Foreign vs micro credit bank consumers
Direct path differences
Although there were no significant differences between paths linking service fairness,
relationship value, quality and customer citizenship behaviors. However, for consumers
of microcredit banks among first-order constructs of service fairness; interpersonal
(β=.53), informational fairness (β=.50) were considered most important followed by
distributive fairness (β=.38) and procedural fairness (β=.27). Moreover, the combined
effect of these constructs in form of service fairness predicted significant trust levels
(β=.85), followed by satisfaction (β=.76) and commitment (β=.75). This suggest that
consumers of microcredit banks trust their bank when they are communicated and
provided information fairly on the other hand consumers of foreign banks exhibit
higher levels of commitment (β=.82) because of higher levels of distributive fairness
(β=.54) and fair interpersonal treatment (β=.44).
Indirect effect differences
There was no significant difference between the indirect path coefficients between
consumers of foreign and Islamic banks as the relevant p-values for each indirect path
difference was (p >.10).
Difference between R2 values
The difference between predictive relevance of both the groups remains insignificant (p
>.10) as shown in table 4.27. Therefore, it can be concluded that consumers of foreign
banks are committed and actively perform citizenship behaviors based on their
perceptions of the bank’s ability to deliver fair end user services and interpersonal skills
of their service personnel. While consumers of micro-credit banks are able trust their
bank based on the level of information and interpersonal communication they receive
during face-to face transactions.
4.9.3 Foreign vs public sector bank consumers
Direct path differences
The path difference between service fairness and relationship quality was significant
(β=0.22 vs β=0.13, Δβ=0.10, p=.10). Moreover, significant path difference between
168
service fairness and relationship value (β=0.73 vs β=0.65, Δβ=0.08, p=.09) was also
significant. These significant differences resulted in higher commitment (β=0.82 vs
β=0.78) levels and more active citizenship behaviors (fig 4.6) among consumers of
foreign banks. Moreover, looking the first order constructs of service fairness, same
pattern was observed between the two consumer groups highlighting the importance of
distributive, interpersonal fairness however for consumers of public sector bank,
procedural fairness (β=0.27) had more importance than information fairness (β=0.25).
Indirect path differences
Significant difference was observed in the indirect path between service fairness and
customer citizenship behavior (β=0.56 vs β=0.41; Δβ=0.14, p=.01), this was because
consumers of foreign banking reported deriving higher value (β=0.73 vs β=0.65) based
on fairness in their relationship than consumers of public sector banks.
Difference between R2 values
The significant differences returned between R2 values of endogenous variables
customer citizenship behaviors (R2=0.83 vs R2=0.73; ΔR2=0.10, p=.01), relationship
quality (R2=0.66 vs R2=0.56; ΔR2=0.10, p=.08) and relationship value (R2=0.53 vs
R2=0.42; ΔR2=0.11, p=.08), were due to significant difference between direct effects
between the two groups. Thus, from results reported above it can be concluded that
consumers of foreign banks perceive strong relationship and derive significant value
from their relationship with theirs banks based on their perception of service fairness as
compared to consumers of Islamic banks.
4.9.4 Foreign vs private sector bank consumers
Direct path differences
There were no significant path differences found between the groups. More specifically
the first order constructs of services exhibited the same level of importance and had
similar subsequent impact on satisfaction, trust and commitment levels across both the
groups.
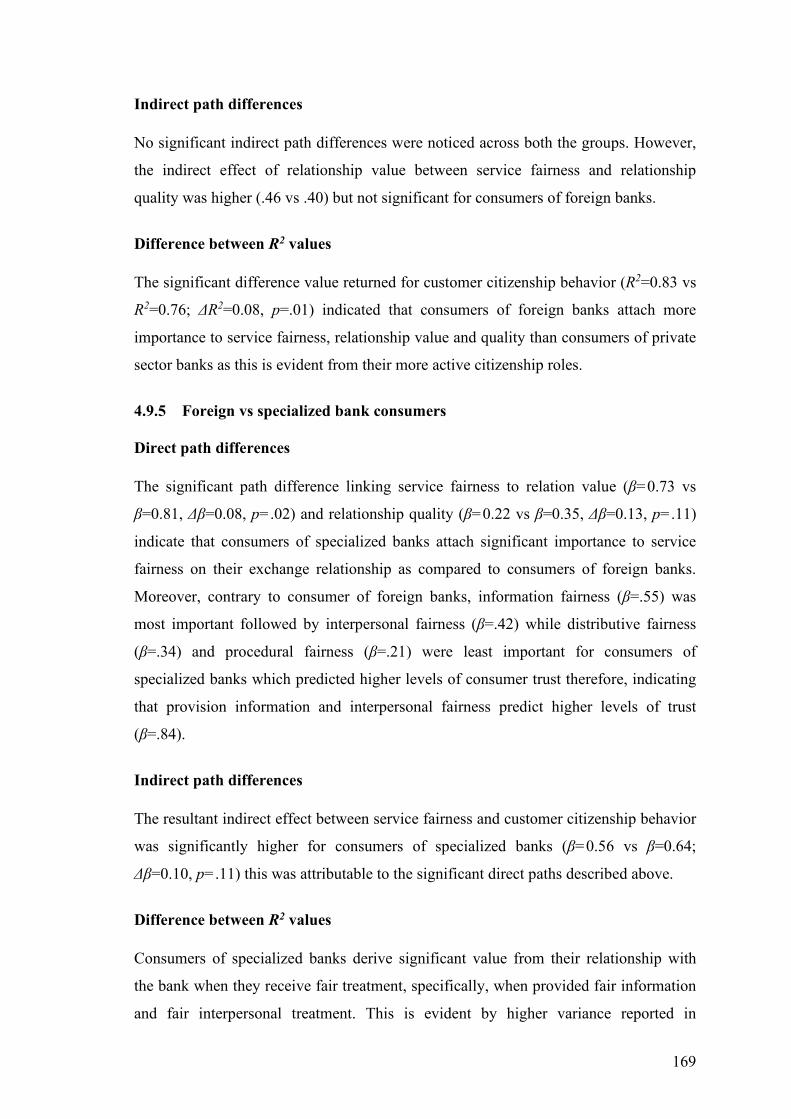
169
Indirect path differences
No significant indirect path differences were noticed across both the groups. However,
the indirect effect of relationship value between service fairness and relationship
quality was higher (.46 vs .40) but not significant for consumers of foreign banks.
Difference between R2 values
The significant difference value returned for customer citizenship behavior (R2=0.83 vs
R2=0.76; ΔR2=0.08, p=.01) indicated that consumers of foreign banks attach more
importance to service fairness, relationship value and quality than consumers of private
sector banks as this is evident from their more active citizenship roles.
4.9.5 Foreign vs specialized bank consumers
Direct path differences
The significant path difference linking service fairness to relation value (β=0.73 vs
β=0.81, Δβ=0.08, p=.02) and relationship quality (β=0.22 vs β=0.35, Δβ=0.13, p=.11)
indicate that consumers of specialized banks attach significant importance to service
fairness on their exchange relationship as compared to consumers of foreign banks.
Moreover, contrary to consumer of foreign banks, information fairness (β=.55) was
most important followed by interpersonal fairness (β=.42) while distributive fairness
(β=.34) and procedural fairness (β=.21) were least important for consumers of
specialized banks which predicted higher levels of consumer trust therefore, indicating
that provision information and interpersonal fairness predict higher levels of trust
(β=.84).
Indirect path differences
The resultant indirect effect between service fairness and customer citizenship behavior
was significantly higher for consumers of specialized banks (β=0.56 vs β=0.64;
Δβ=0.10, p=.11) this was attributable to the significant direct paths described above.
Difference between R2 values
Consumers of specialized banks derive significant value from their relationship with
the bank when they receive fair treatment, specifically, when provided fair information
and fair interpersonal treatment. This is evident by higher variance reported in
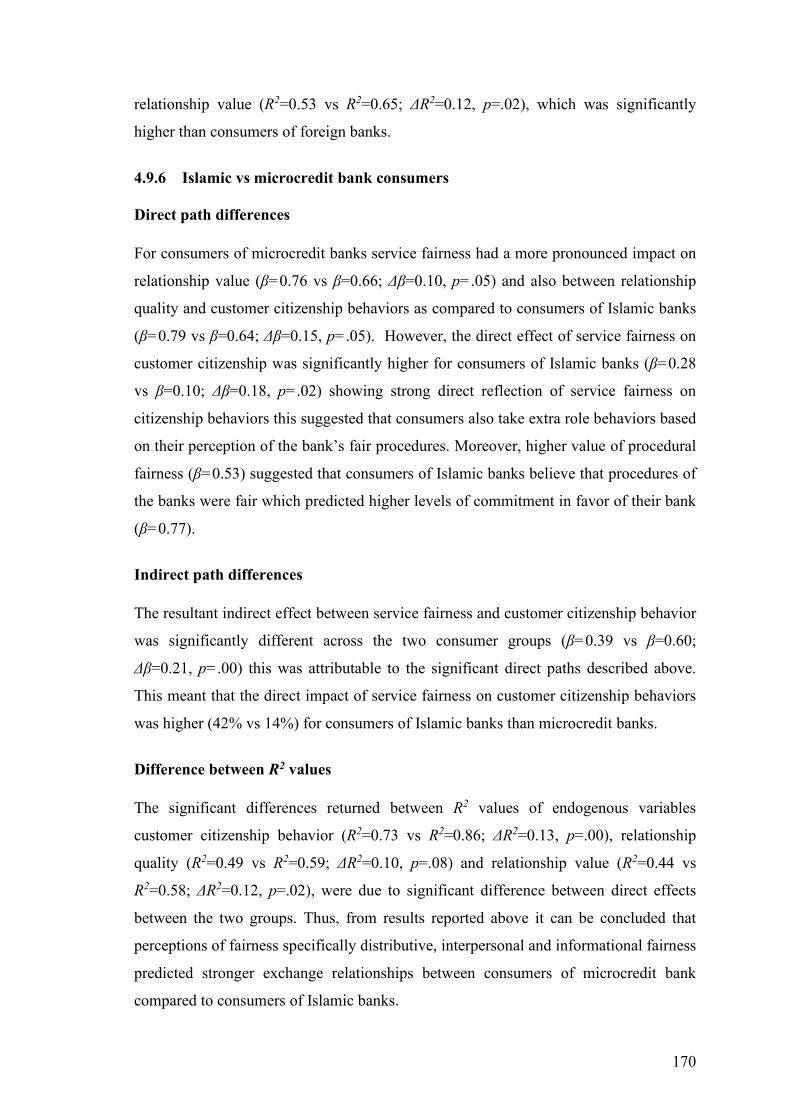
170
relationship value (R2=0.53 vs R2=0.65; ΔR2=0.12, p=.02), which was significantly
higher than consumers of foreign banks.
4.9.6 Islamic vs microcredit bank consumers
Direct path differences
For consumers of microcredit banks service fairness had a more pronounced impact on
relationship value (β=0.76 vs β=0.66; Δβ=0.10, p=.05) and also between relationship
quality and customer citizenship behaviors as compared to consumers of Islamic banks
(β=0.79 vs β=0.64; Δβ=0.15, p=.05). However, the direct effect of service fairness on
customer citizenship was significantly higher for consumers of Islamic banks (β=0.28
vs β=0.10; Δβ=0.18, p=.02) showing strong direct reflection of service fairness on
citizenship behaviors this suggested that consumers also take extra role behaviors based
on their perception of the bank’s fair procedures. Moreover, higher value of procedural
fairness (β=0.53) suggested that consumers of Islamic banks believe that procedures of
the banks were fair which predicted higher levels of commitment in favor of their bank
(β=0.77).
Indirect path differences
The resultant indirect effect between service fairness and customer citizenship behavior
was significantly different across the two consumer groups (β=0.39 vs β=0.60;
Δβ=0.21, p=.00) this was attributable to the significant direct paths described above.
This meant that the direct impact of service fairness on customer citizenship behaviors
was higher (42% vs 14%) for consumers of Islamic banks than microcredit banks.
Difference between R2 values
The significant differences returned between R2 values of endogenous variables
customer citizenship behavior (R2=0.73 vs R2=0.86; ΔR2=0.13, p=.00), relationship
quality (R2=0.49 vs R2=0.59; ΔR2=0.10, p=.08) and relationship value (R2=0.44 vs
R2=0.58; ΔR2=0.12, p=.02), were due to significant difference between direct effects
between the two groups. Thus, from results reported above it can be concluded that
perceptions of fairness specifically distributive, interpersonal and informational fairness
predicted stronger exchange relationships between consumers of microcredit bank
compared to consumers of Islamic banks.
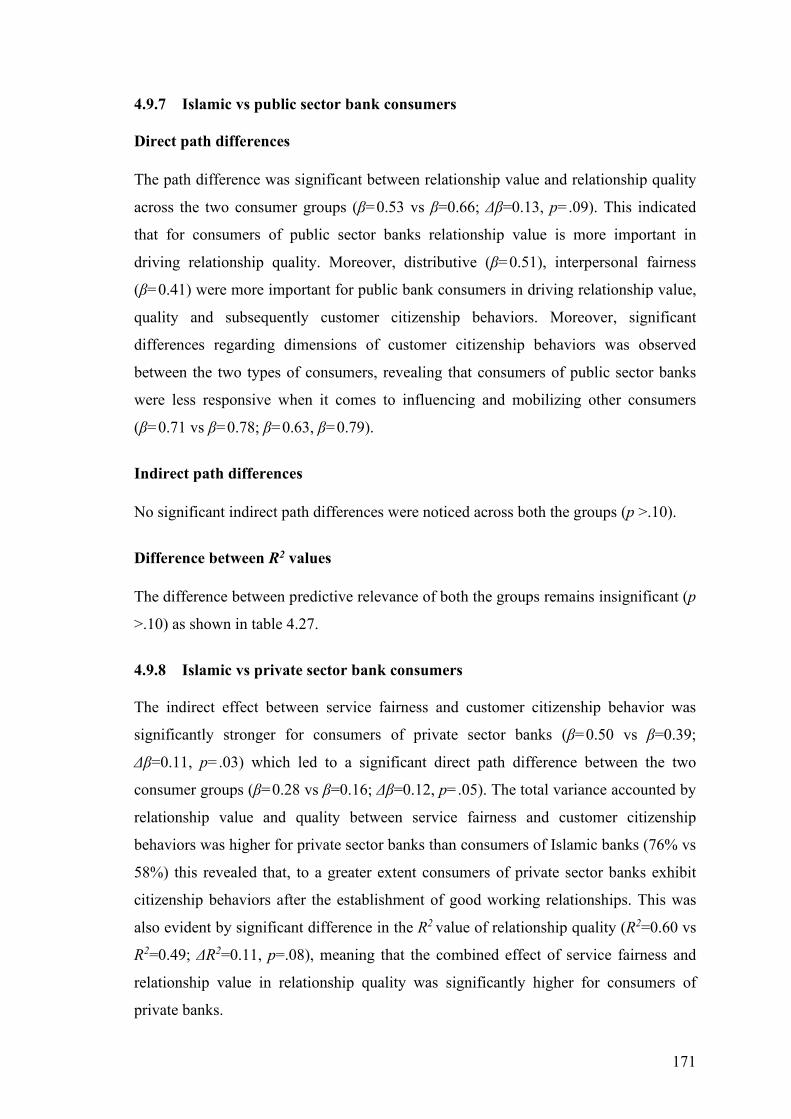
171
4.9.7 Islamic vs public sector bank consumers
Direct path differences
The path difference was significant between relationship value and relationship quality
across the two consumer groups (β=0.53 vs β=0.66; Δβ=0.13, p=.09). This indicated
that for consumers of public sector banks relationship value is more important in
driving relationship quality. Moreover, distributive (β=0.51), interpersonal fairness
(β=0.41) were more important for public bank consumers in driving relationship value,
quality and subsequently customer citizenship behaviors. Moreover, significant
differences regarding dimensions of customer citizenship behaviors was observed
between the two types of consumers, revealing that consumers of public sector banks
were less responsive when it comes to influencing and mobilizing other consumers
(β=0.71 vs β=0.78; β=0.63, β=0.79).
Indirect path differences
No significant indirect path differences were noticed across both the groups (p >.10).
Difference between R2 values
The difference between predictive relevance of both the groups remains insignificant (p
>.10) as shown in table 4.27.
4.9.8 Islamic vs private sector bank consumers
The indirect effect between service fairness and customer citizenship behavior was
significantly stronger for consumers of private sector banks (β=0.50 vs β=0.39;
Δβ=0.11, p=.03) which led to a significant direct path difference between the two
consumer groups (β=0.28 vs β=0.16; Δβ=0.12, p=.05). The total variance accounted by
relationship value and quality between service fairness and customer citizenship
behaviors was higher for private sector banks than consumers of Islamic banks (76% vs
58%) this revealed that, to a greater extent consumers of private sector banks exhibit
citizenship behaviors after the establishment of good working relationships. This was
also evident by significant difference in the R2 value of relationship quality (R2=0.60 vs
R2=0.49; ΔR2=0.11, p=.08), meaning that the combined effect of service fairness and
relationship value in relationship quality was significantly higher for consumers of
private banks.
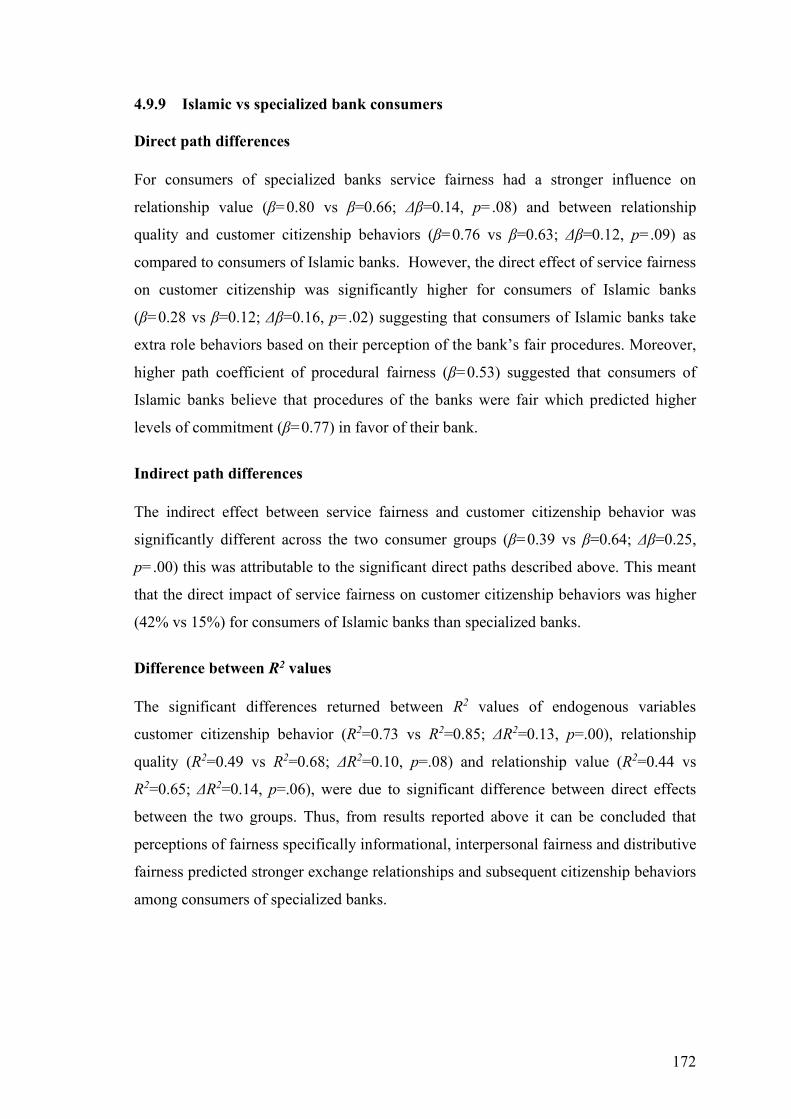
172
4.9.9 Islamic vs specialized bank consumers
Direct path differences
For consumers of specialized banks service fairness had a stronger influence on
relationship value (β=0.80 vs β=0.66; Δβ=0.14, p=.08) and between relationship
quality and customer citizenship behaviors (β=0.76 vs β=0.63; Δβ=0.12, p=.09) as
compared to consumers of Islamic banks. However, the direct effect of service fairness
on customer citizenship was significantly higher for consumers of Islamic banks
(β=0.28 vs β=0.12; Δβ=0.16, p=.02) suggesting that consumers of Islamic banks take
extra role behaviors based on their perception of the bank’s fair procedures. Moreover,
higher path coefficient of procedural fairness (β=0.53) suggested that consumers of
Islamic banks believe that procedures of the banks were fair which predicted higher
levels of commitment (β=0.77) in favor of their bank.
Indirect path differences
The indirect effect between service fairness and customer citizenship behavior was
significantly different across the two consumer groups (β=0.39 vs β=0.64; Δβ=0.25,
p=.00) this was attributable to the significant direct paths described above. This meant
that the direct impact of service fairness on customer citizenship behaviors was higher
(42% vs 15%) for consumers of Islamic banks than specialized banks.
Difference between R2 values
The significant differences returned between R2 values of endogenous variables
customer citizenship behavior (R2=0.73 vs R2=0.85; ΔR2=0.13, p=.00), relationship
quality (R2=0.49 vs R2=0.68; ΔR2=0.10, p=.08) and relationship value (R2=0.44 vs
R2=0.65; ΔR2=0.14, p=.06), were due to significant difference between direct effects
between the two groups. Thus, from results reported above it can be concluded that
perceptions of fairness specifically informational, interpersonal fairness and distributive
fairness predicted stronger exchange relationships and subsequent citizenship behaviors
among consumers of specialized banks.
173
4.9.10 Microcredit vs public sector bank consumers
Direct path differences
Service fairness predicted relationship quality (β=0.27 vs β=0.13; Δβ=0.14, p=.10) and
value (β=0.76 vs β=0.65; Δβ=0.11, p=.01) more strongly than consumers of public
sector banks. Moreover, among predictors of customer citizenship behaviors,
relationship quality had stronger affect for consumer of microcredit banks (β=0.79 vs
β=0.62; Δβ=0.16, p=.06).
Indirect path differences
The mediated effect of service value and quality between service fairness and customer
citizenship behavior was stronger for microcredit bank consumers (β=0.60 vs β=0.41;
Δβ=0.19, p=.00) which accounted (86% vs 65%) variance in the total effect.
Difference between R2 values
Due to significant difference between direct effects between the two groups. Significant
differences were returned between R2 values customer citizenship behaviors (R2=0.86
vs R2=0.73; ΔR2=0.13, p=.00) and relationship value (R2=0.58 vs R2=0.42; ΔR2=0.16,
p=.01).
Thus, from results reported above it can be concluded that perceptions of fairness
specifically informational, interpersonal fairness and distributive fairness predicted
stronger exchange relationships and subsequent citizenship behaviors among
consumers of micro-credit banks.
4.9.11 Microcredit vs private sector bank consumers
Direct effects differences
Service fairness strongly predicted relationship value for consumers of microcredit
banks (β=0.76 vs β=0.68; Δβ=0.08, p=.06) specifically interpersonal (β=0.53) and
informational fairness (β=0.50) were the strongest predictors of relationship value. This
indicated that when consumers of microcredit banks are provided fair information and
treated with respect, they see higher value in their exchange relationship with the bank.
174
Indirect effect differences
There was no significant indirect path difference between the two consumer groups.
(table.4.27)
Difference between R2 values
There were significant differences between the variance explained R2 in customer
citizenship behavior (R2=0.86 vs R2=0.76; ΔR2=0.11, p=.00) and relationship value
(R2=0.58 vs R2=0.46; ΔR2=0.11, p=.07) among the two consumer groups. This
significant difference was attributable to the high predictive power of service fairness in
relationship value among consumer of microcredit banks discussed above.
4.9.12 Microcredit vs Specialized bank consumers
There were no significant differences between path coefficients among the two
consumer groups indicated by the results of structural paths in the mode. In both the
groups interactional and informational fairness significantly predicted relationship
value which resulted in higher trust, satisfaction and commitment levels ultimately
leading to citizenship behaviors among both the consumer types.
4.9.13 Pubic vs Private sector bank consumers
There were no significant differences between path coefficients among the two
consumer groups. As the first order of factors of service fairness both the groups
returned similar readings however consumers of private banks indicated more
commitment (β=0.83 vs β=0.78) to their banks in response of the level of fairness and
value they receive from their relationship with the banks. Moreover, it was concluded
based on the significant difference between dimensions of citizenship behaviors that
consumers of private banks were more actively engaged in citizenship behaviors than
consumer of public sector banks.
4.9.14 Public vs Specialized bank consumers
Direct path differences
There were significant differences among predictors of relationship quality, service
fairness (β=0.13 vs β=0.35; Δβ=0.22, p=.01) and relationship value (β=0.66 vs β=0.51;
Δβ=0.15, p=.07) between the two groups, moreover significant differences were also
175
found between the path linking service fairness to relationship value (β=0.56 vs
β=0.81; Δβ=0.23, p=.00).
Indirect path differences
Significant difference was observed in the indirect path between service fairness and
customer citizenship behavior (β=0.41 vs β=0.64; Δβ=0.23, p=.00), this was because
specialized banking consumers reported deriving higher value (β=0.73 vs β=0.65)
based on their perceptions of fairness from their relationship than consumers of public
sector banks.
Difference between R2 values
The significant differences returned between R2 values of endogenous variables
customer citizenship behavior (R2=0.73 vs R2=0.85; ΔR2=0.12, p=.00), relationship
quality (R2=0.56 vs R2=0.68; ΔR2=0.12, p=.02) and relationship value (R2=0.42 vs
R2=0.65; ΔR2=0.23, p=.00), were due to significant difference between direct effects
between the two groups. Thus, from results reported above it can be concluded that
consumers of specialized banks perceive strong relationship and derive significant
value from their relationship with theirs banks based on their perception of service
fairness as compared to consumers of public sector banks.
4.9.15 Private sector vs Specialized bank consumers
The result indicated that service fairness predicts stronger variance in relationship value
(β=0.68 vs β=0.81; Δβ=0.12, p=.00) for consumers of specialized banks however, the
combined effect of service fairness and relationship value predicted stronger
commitment levels (β=0.83 vs β=0.74) in consumers of private sector banks than
consumers of specialized banks. Moreover, the significant differences among the
endogenous variables R2 values in customer citizenship behavior (R2=0.76 vs R2=0.85;
ΔR2=0.09, p=.01), and relationship value (R2=0.46 vs R2=0.65; ΔR2=0.18, p=.00), are
attributable to the stronger effect of service fairness in relationship value highlighting
the importance of service fairness for valuable exchange relationships among
consumers of specialized banks.
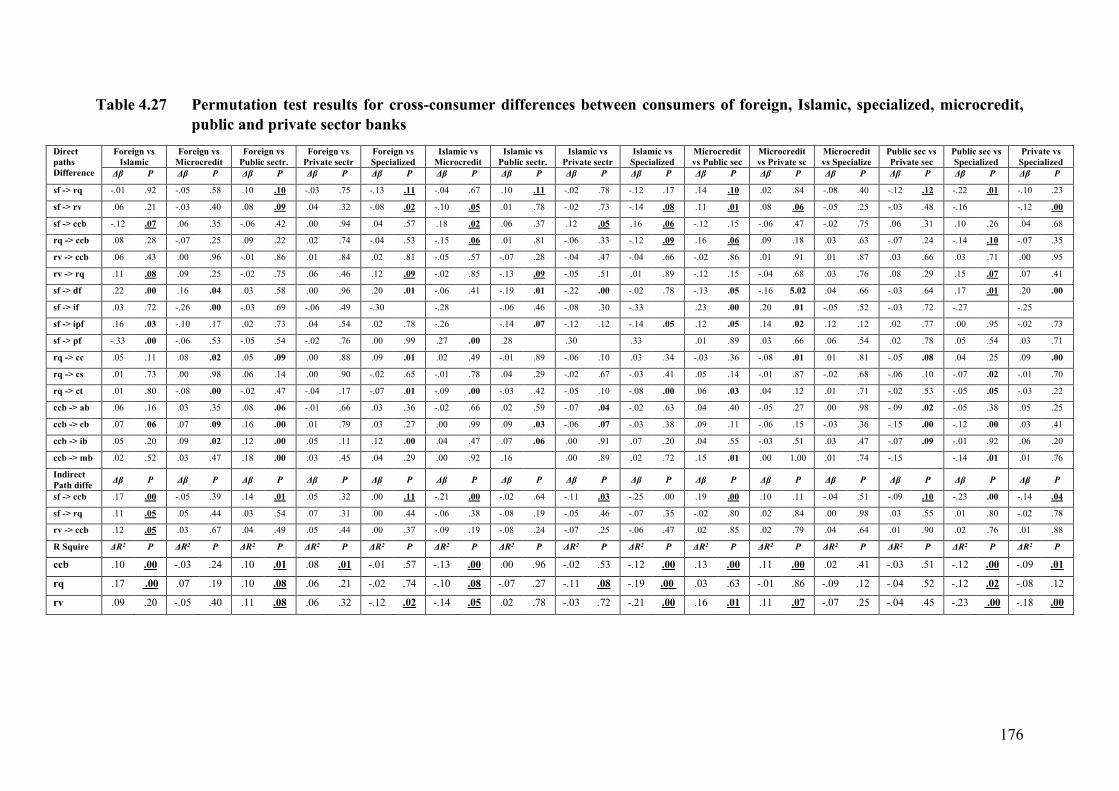
176
Table 4.27 Permutation test results for cross-consumer differences between consumers of foreign, Islamic, specialized, microcredit, public and private sector banks
Direct paths Difference
Foreign vs Islamic
Foreign vs Microcredit
Foreign vs Public sectr.
Foreign vs Private sectr
Foreign vs Specialized
Islamic vs Microcredit
Islamic vs Public sectr.
Islamic vs Private sectr
Islamic vs Specialized
Microcredit vs Public sec
Microcredit vs Private sc
Microcredit vs Specialize
Public sec vs Private sec
Public sec vs Specialized
Private vs Specialized
Δβ P Δβ P Δβ P Δβ P Δβ P Δβ P Δβ P Δβ P Δβ P Δβ P Δβ P Δβ P Δβ P Δβ P Δβ P
sf -> rq -.01 .92 -.05 .58 .10 .10 -.03 .75 -.13 .11 -.04 .67 .10 .11 -.02 .78 -.12 .17 .14 .10 .02 .84 -.08 .40 -.12 .12 -.22 .01 -.10 .23
sf -> rv .06 .21 -.03 .40 .08 .09 .04 .32 -.08 .02 -.10 .05 .01 .78 -.02 .73 -.14 .08 .11 .01 .08 .06 -.05 .25 -.03 .48 -.16 -.12 .00
sf -> ccb -.12 .07 .06 .35 -.06 .42 .00 .94 .04 .57 .18 .02 .06 .37 .12 .05 .16 .06 -.12 .15 -.06 .47 -.02 .75 .06 .31 .10 .26 .04 .68
rq -> ccb .08 .28 -.07 .25 .09 .22 .02 .74 -.04 .53 -.15 .06 .01 .81 -.06 .33 -.12 .09 .16 .06 .09 .18 .03 .63 -.07 .24 -.14 .10 -.07 .35
rv -> ccb .06 .43 .00 .96 -.01 .86 .01 .84 .02 .81 -.05 .57 -.07 .28 -.04 .47 -.04 .66 -.02 .86 .01 .91 .01 .87 .03 .66 .03 .71 .00 .95
rv -> rq .11 .08 .09 .25 -.02 .75 .06 .46 .12 .09 -.02 .85 -.13 .09 -.05 .51 .01 .89 -.12 .15 -.04 .68 .03 .76 .08 .29 .15 .07 .07 .41
sf -> df .22 .00 .16 .04 .03 .58 .00 .96 .20 .01 -.06 .41 -.19 .01 -.22 .00 -.02 .78 -.13 .05 -.16 5.02 .04 .66 -.03 .64 .17 .01 .20 .00
sf -> if .03 .72 -.26 .00 -.03 .69 -.06 .49 -.30 -.28 -.06 .46 -.08 .30 -.33 .23 .00 .20 .01 -.05 .52 -.03 .72 -.27 -.25
sf -> ipf .16 .03 -.10 .17 .02 .73 .04 .54 .02 .78 -.26 -.14 .07 -.12 .12 -.14 .05 .12 .05 .14 .02 .12 .12 .02 .77 .00 .95 -.02 .73
sf -> pf -.33 .00 -.06 .53 -.05 .54 -.02 .76 .00 .99 .27 .00 .28 .30 .33 .01 .89 .03 .66 .06 .54 .02 .78 .05 .54 .03 .71
rq -> cc .05 .11 .08 .02 .05 .09 .00 .88 .09 .01 .02 .49 -.01 .89 -.06 .10 .03 .34 -.03 .36 -.08 .01 .01 .81 -.05 .08 .04 .25 .09 .00
rq -> cs .01 .73 .00 .98 .06 .14 .00 .90 -.02 .65 -.01 .78 .04 .29 -.02 .67 -.03 .41 .05 .14 -.01 .87 -.02 .68 -.06 .10 -.07 .02 -.01 .70
rq -> ct .01 .80 -.08 .00 -.02 .47 -.04 .17 -.07 .01 -.09 .00 -.03 .42 -.05 .10 -.08 .00 .06 .03 .04 .12 .01 .71 -.02 .53 -.05 .05 -.03 .22
ccb -> ab .06 .16 .03 .35 .08 .06 -.01 .66 .03 .36 -.02 .66 .02 .59 -.07 .04 -.02 .63 .04 .40 -.05 .27 .00 .98 -.09 .02 -.05 .38 .05 .25
ccb -> cb .07 .06 .07 .09 .16 .00 .01 .79 .03 .27 .00 .99 .09 .03 -.06 .07 -.03 .38 .09 .11 -.06 .15 -.03 .36 -.15 .00 -.12 .00 .03 .41
ccb -> ib .05 .20 .09 .02 .12 .00 .05 .11 .12 .00 .04 .47 .07 .06 .00 .91 .07 .20 .04 .55 -.03 .51 .03 .47 -.07 .09 -.01 .92 .06 .20
ccb -> mb .02 .52 .03 .47 .18 .00 .03 .45 .04 .29 .00 .92 .16 .00 .89 .02 .72 .15 .01 .00 1.00 .01 .74 -.15 -.14 .01 .01 .76
Indirect Path diffe Δβ P Δβ P Δβ P Δβ P Δβ P Δβ P Δβ P Δβ P Δβ P Δβ P Δβ P Δβ P Δβ P Δβ P Δβ P
sf -> ccb .17 .00 -.05 .39 .14 .01 .05 .32 .00 .11 -.21 .00 -.02 .64 -.11 .03 -.25 .00 .19 .00 .10 .11 -.04 .51 -.09 .10 -.23 .00 -.14 .04
sf -> rq .11 .05 .05 .44 .03 .54 .07 .31 .00 .44 -.06 .38 -.08 .19 -.05 .46 -.07 .35 -.02 .80 .02 .84 .00 .98 .03 .55 .01 .80 -.02 .78
rv -> ccb .12 .05 .03 .67 .04 .49 .05 .44 .00 .37 -.09 .19 -.08 .24 -.07 .25 -.06 .47 .02 .85 .02 .79 .04 .64 .01 .90 .02 .76 .01 .88
R Squire ΔR2 P ΔR2 P ΔR2 P ΔR2 P ΔR2 P ΔR2 P ΔR2 P ΔR2 P ΔR2 P ΔR2 P ΔR2 P ΔR2 P ΔR2 P ΔR2 P ΔR2 P
ccb .10 .00 -.03 .24 .10 .01 .08 .01 -.01 .57 -.13 .00 .00 .96 -.02 .53 -.12 .00 .13 .00 .11 .00 .02 .41 -.03 .51 -.12 .00 -.09 .01
rq .17 .00 .07 .19 .10 .08 .06 .21 -.02 .74 -.10 .08 -.07 .27 -.11 .08 -.19 .00 .03 .63 -.01 .86 -.09 .12 -.04 .52 -.12 .02 -.08 .12
rv .09 .20 -.05 .40 .11 .08 .06 .32 -.12 .02 -.14 .05 .02 .78 -.03 .72 -.21 .00 .16 .01 .11 .07 -.07 .25 -.04 .45 -.23 .00 -.18 .00
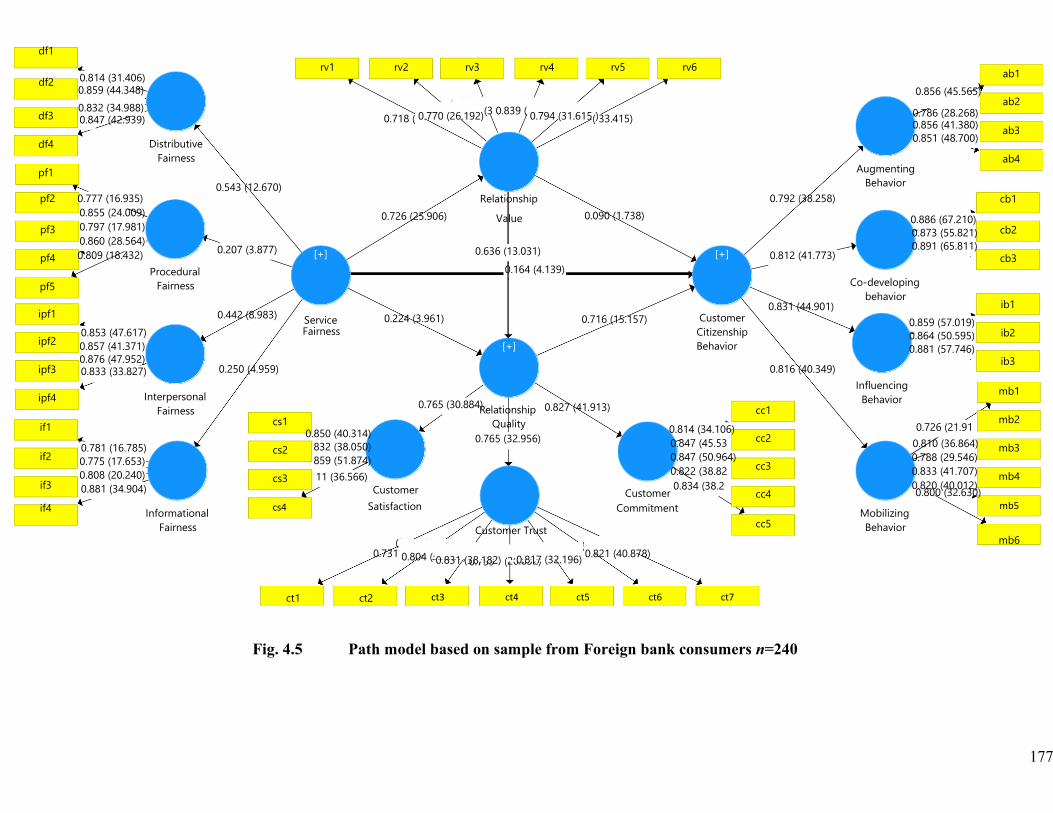
177
1.780) 42.547) 0.806
25.171) 0.788
(21.990) 33.037) 0.759
(24.491) 26.832) 0.739
0)
04)
5)
7)
0. 0.
0.8
df1
df2
0.814 (31.406) 0.859 (44.348)
rv1
rv2
rv3
rv4 rv5
rv6
0.856 (45.565)
ab1
ab2 df3
df4
pf1
pf2
0.832 (34.988) 0.847 (42.939)
0.777 (16.935)
Distributive Fairness
0.543 (12.670)
0.718 ( 0.770 (26.192)(3 0.839 ( 0.794 (31.615()33.415)
Relationship
0.792 (38.258)
0.786 (28.268) 0.856 (41.380) 0.851 (48.700)
Augmenting
Behavior
ab3
ab4
cb1
pf3
pf4
pf5
ipf1
ipf2
ipf3
0.855 (24.009) 0.797 (17.981) 0.860 (28.564) 0.809 (18.432)
0.853 (47.617) 0.857 (41.371) 0.876 (47.952) 0.833 (33.827)
Procedural
Fairness
0.207 (3.877)
[+]
0.726 (25.906) Value
0.636 (13.031) 0.164 (4.139)
0.090 (1.738)
[+]
0.812 (41.773)
0.831 (44.901)
0.886 (67.210) 0.873 (55.821) 0.891 (65.811)
Co-developing
behavior
0.859 (57.019) 0.864 (50.595) 0.881 (57.746)
cb2
cb3
ipf4
if1
if2
if3
Interpersonal Fairness
0.781 (16.785) 0.775 (17.653) 0.808 (20.240) 0.881 (34.904)
cs1
cs2
cs3
0.850 (40.314) 832 (38.050) 859 (51.874) 11 (36.566)
0.765 (30.884R) elationship
Quality 0.765 (32.956)
Customer
0.827 (41.913)
0.814 (34.106) 0.847 (45.53 0.847 (50.964) 0.822 (38.82
Customer 0.834 (38.2
cc1
cc2
cc3
cc4
Influencing Behavior
0.726 (21.91
0.810 (36.864) 0.788 (29.546) 0.833 (41.707) 0.820 (40.012) 0.800 (32.630)
mb1
mb2
mb3
mb4
if4 Informational Fairness
cs4 Satisfaction Customer Trust
Commitment cc5
Mobilizing Behavior
mb5
mb6
0.731 0.804 ( 0.831 (38.182) ( 0.817 (32.196) 0.821 (40.878)
ct1 ct2 ct3 ct4 ct5 ct6 ct7
ib3
ib2
ib1 0.442 (8.983) Service
Fairness 0.224 (3.961)
[+]
0.716 (15.157) Customer Citizenship Behavior
0.250 (4.959) 0.816 (40.349)
Fig. 4.5 Path model based on sample from Foreign bank consumers n=240
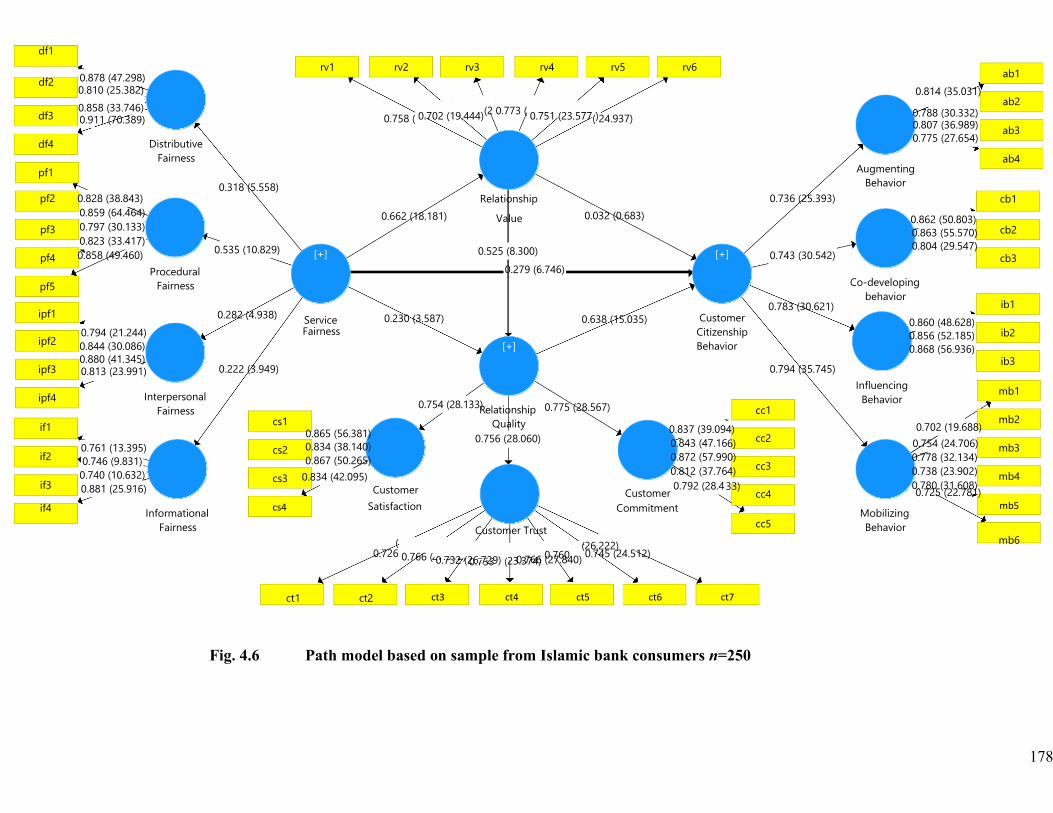
178
4.227) 32.102) 0.763
30.994) 0.747
(23.131) 27.512) 0.733
(26.222) 23.374) 0.760
8)
33)
6)
4)
0. 0.
0.8
df1
df2
0.878 (47.298) 0.810 (25.382)
rv1
rv2
rv3
rv4 rv5
rv6
0.814 (35.031)
ab1
ab2 df3
df4
pf1
pf2
0.858 (33.746) 0.911 (70.389)
0.828 (38.843)
Distributive Fairness
0.318 (5.558)
0.758 ( 0.702 (19.444)(2 0.773 ( 0.751 (23.577()24.937)
Relationship
0.736 (25.393)
0.788 (30.332) 0.807 (36.989) 0.775 (27.654)
Augmenting
Behavior
ab3
ab4
cb1
pf3
pf4
pf5
ipf1
ipf2
ipf3
0.859 (64.464) 0.797 (30.133) 0.823 (33.417) 0.858 (49.460)
0.794 (21.244) 0.844 (30.086) 0.880 (41.345) 0.813 (23.991)
Procedural
Fairness
0.535 (10.829)
[+]
0.662 (18.181) Value
0.525 (8.300) 0.279 (6.746)
0.032 (0.683)
[+]
0.743 (30.542)
0.783 (30.621)
0.862 (50.803) 0.863 (55.570) 0.804 (29.547)
Co-developing
behavior
0.860 (48.628) 0.856 (52.185) 0.868 (56.936)
cb2
cb3
ipf4
if1
if2
if3
Interpersonal Fairness
0.761 (13.395) 0.746 (9.831) 0.740 (10.632) 0.881 (25.916)
cs1
cs2
cs3
0.865 (56.381) 834 (38.140) 867 (50.265) 34 (42.095)
0.754 (28.133R) elationship
Quality 0.756 (28.060)
Customer
0.775 (28.567)
0.837 (39.094) 0.843 (47.16 0.872 (57.990) 0.812 (37.76
Customer 0.792 (28.4
cc1
cc2
cc3
cc4
Influencing Behavior
0.702 (19.68
0.754 (24.706) 0.778 (32.134) 0.738 (23.902) 0.780 (31.608) 0.725 (22.781)
mb1
mb2
mb3
mb4
if4 Informational Fairness
cs4 Satisfaction Customer Trust
Commitment cc5
Mobilizing Behavior
mb5
mb6
0.726 0.766 ( 0.732 (26.729) ( 0.766 (27.840) 0.745 (24.512)
ct1 ct2 ct3 ct4 ct5 ct6 ct7
ib3
ib2
ib1
Fig. 4.6 Path model based on sample from Islamic bank consumers n=250
0.282 (4.938) Service Fairness
0.230 (3.587)
[+]
0.638 (15.035) Customer Citizenship Behavior
0.222 (3.949) 0.794 (35.745)
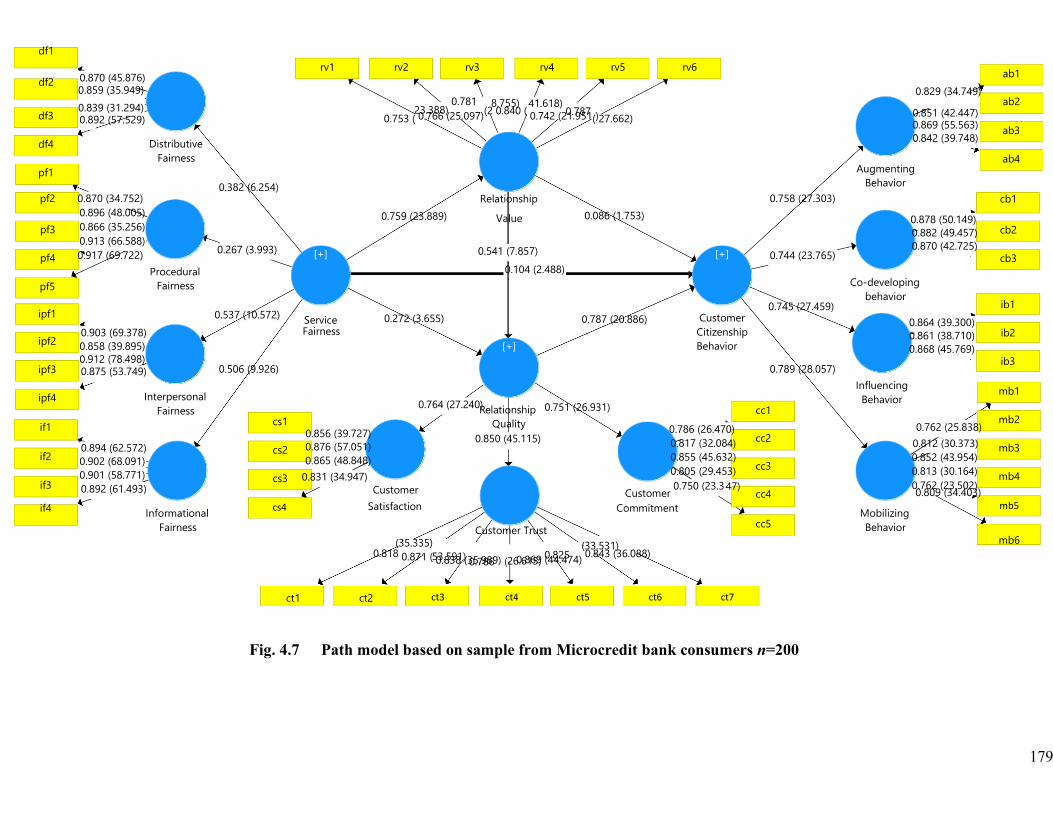
179
8.755) 41.618) 0.787
23.388) 0.781
(35.335) 53.591) 0.786
(33.531) 26.615) 0.825
8)
47)
4)
3)
0. 0.
0.8
df1
df2
0.870 (45.876) 0.859 (35.949)
rv1
rv2
rv3
rv4 rv5
rv6
0.829 (34.749)
ab1
ab2 df3
df4
pf1
pf2
0.839 (31.294) 0.892 (57.529)
0.870 (34.752)
Distributive Fairness
0.382 (6.254)
0.753 ( 0.766 (25.097)(2 0.840 ( 0.742 (21.951()27.662)
Relationship
0.758 (27.303)
0.851 (42.447) 0.869 (55.563) 0.842 (39.748)
Augmenting
Behavior
ab3
ab4
cb1
pf3
pf4
pf5
ipf1
ipf2
ipf3
0.896 (48.005) 0.866 (35.256) 0.913 (66.588) 0.917 (69.722)
0.903 (69.378) 0.858 (39.895) 0.912 (78.498) 0.875 (53.749)
Procedural
Fairness
0.267 (3.993)
[+]
0.759 (23.889) Value
0.541 (7.857) 0.104 (2.488)
0.086 (1.753)
[+]
0.744 (23.765)
0.745 (27.459)
0.878 (50.149) 0.882 (49.457) 0.870 (42.725)
Co-developing
behavior
0.864 (39.300) 0.861 (38.710) 0.868 (45.769)
cb2
cb3
ipf4
if1
if2
if3
Interpersonal Fairness
0.894 (62.572) 0.902 (68.091) 0.901 (58.771) 0.892 (61.493)
cs1
cs2
cs3
0.856 (39.727) 876 (57.051) 865 (48.848) 31 (34.947)
0.764 (27.240R) elationship
Quality 0.850 (45.115)
Customer
0.751 (26.931)
0.786 (26.470) 0.817 (32.08 0.855 (45.632) 0.805 (29.45
Customer 0.750 (23.3
cc1
cc2
cc3
cc4
Influencing Behavior
0.762 (25.83
0.812 (30.373) 0.852 (43.954) 0.813 (30.164) 0.762 (23.502) 0.809 (34.403)
mb1
mb2
mb3
mb4
if4 Informational Fairness
cs4 Satisfaction Customer Trust
Commitment cc5
Mobilizing Behavior
mb5
mb6
0.818 0.871 ( 0.838 (35.989) ( 0.869 (44.474) 0.843 (36.088)
ct1 ct2 ct3 ct4 ct5 ct6 ct7
Fig. 4.7 Path model based on sample from Microcredit bank consumers n=200
ib3
ib2
ib1 0.537 (10.572) Service
Fairness 0.272 (3.655)
[+]
0.787 (20.886) Customer Citizenship Behavior
0.506 (9.926) 0.789 (28.057)

180
9.091) 31.226) 0.789
34.389) 0.828
(29.783) 30.625) 0.777
(30.397) 29.185) 0.786
4)
85)
8)
0)
0. 0.
0.8
df1
df2
0.845 (46.269) 0.858 (46.413)
rv1
rv2
rv3
rv4 rv5
rv6
0.805 (31.824)
ab1
ab2 df3
df4
pf1
pf2
0.860 (44.079) 0.871 (47.749)
0.846 (33.131)
Distributive Fairness
0.511 (11.665)
0.809 ( 0.805 (30.125)(3 0.798 ( 0.768 (25.096()31.356)
Relationship
0.714 (23.194)
0.785 (27.442) 0.809 (33.873) 0.785 (29.025)
Augmenting
Behavior
ab3
ab4
cb1
pf3
pf4
pf5
ipf1
ipf2
ipf3
0.832 (27.169) 0.860 (37.942) 0.816 (26.527) 0.884 (45.766)
0.772 (22.282) 0.778 (21.879) 0.828 (32.738) 0.801 (28.328)
Procedural
Fairness
0.255 (4.407)
[+]
0.648 (22.039) Value
0.660 (13.304) 0.223 (5.037)
0.105 (1.979)
[+]
0.657 (20.326)
0.710 (22.470)
0.798 (25.856) 0.834 (40.365) 0.784 (27.859)
Co-developing
behavior
0.873 (60.445) 0.772 (23.350) 0.839 (39.385)
cb2
cb3
ipf4
if1
if2
0.633 (6.190) 0.689 (8.097)
Interpersonal Fairness
cs1
cs2
0.864 (51.649) 861 (43.520) 856 (48.088)
0.710 (22.443R) elationship
Quality 0.788 (29.665)
0.780 (33.808)
0.839 (44.476) 0.863 (48.84 0.848 (43.842) 0.825 (38.09
cc1
cc2
cc3
Influencing Behavior
0.694 (18.20
0.797 (32.462) 0.810 (33.058) 0.744 (25.509)
mb1
mb2
mb3
if3 0.809 (18.493) 0.846 (21.141)
cs3 51 (45.429) Customer
Customer 0.777 (27.7 cc4 0.730 (22.167) 0.787 (31.419)
mb4
if4 Informational
Fairness
cs4 Satisfaction Customer Trust
Commitment cc5
Mobilizing Behavior
mb5
mb6
0.783 0.782 ( 0.762 (26.660) ( 0.749 (27.056) 0.820 (36.275)
ct1 ct2 ct3 ct4 ct5 ct6 ct7
Fig. 4.8 Path model based on sample from Public sector bank consumers n=240
ib3
ib2
ib1 0.418 (8.912) Service
Fairness 0.128 (2.173)
[+]
0.623 (13.656) Customer Citizenship Behavior
0.279 (5.571) 0.637 (16.716)
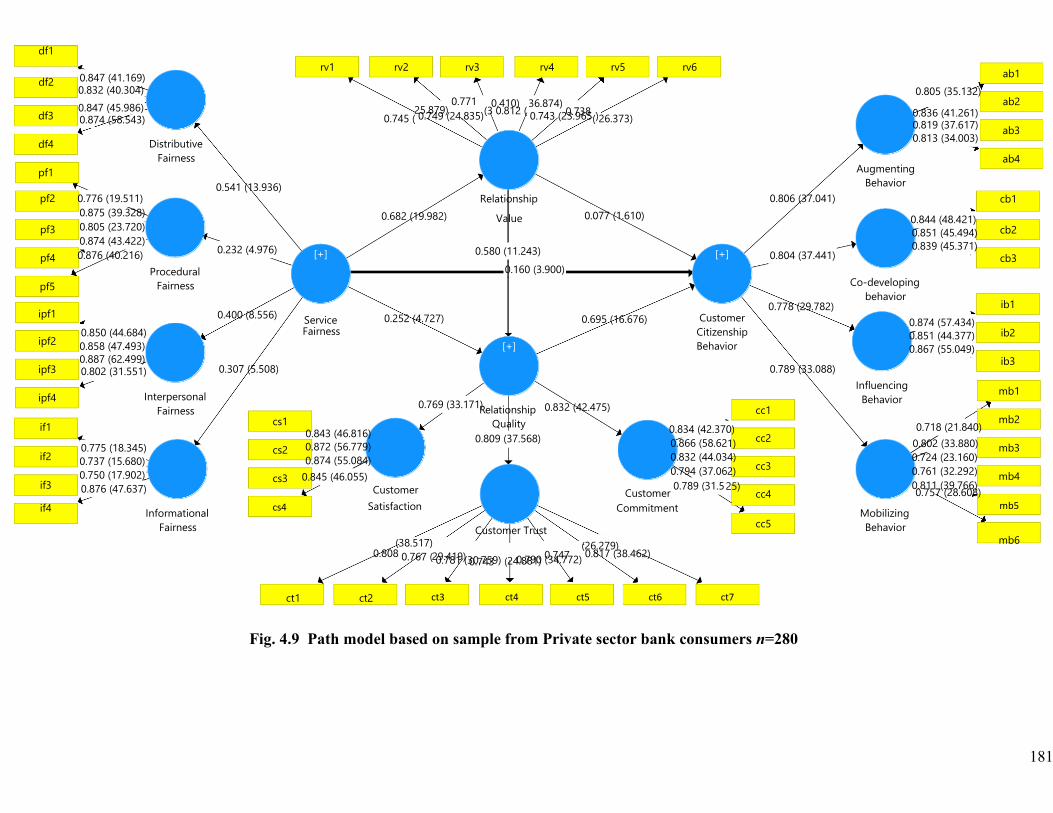
181
0.410) 36.874) 0.738
25.879) 0.771
(38.517) 29.419) 0.743
(26.279) 24.881) 0.747
0)
25)
1)
2)
0. 0.
0.8
df1
df2
0.847 (41.169) 0.832 (40.304)
rv1
rv2
rv3
rv4 rv5
rv6
0.805 (35.132)
ab1
ab2 df3
df4
pf1
pf2
0.847 (45.986) 0.874 (58.543)
0.776 (19.511)
Distributive Fairness
0.541 (13.936)
0.745 ( 0.749 (24.835)(3 0.812 ( 0.743 (23.965()26.373)
Relationship
0.806 (37.041)
0.836 (41.261) 0.819 (37.617) 0.813 (34.003)
Augmenting
Behavior
ab3
ab4
cb1
pf3
pf4
pf5
ipf1
ipf2
ipf3
0.875 (39.328) 0.805 (23.720) 0.874 (43.422) 0.876 (40.216)
0.850 (44.684) 0.858 (47.493) 0.887 (62.499) 0.802 (31.551)
Procedural
Fairness
0.232 (4.976)
[+]
0.682 (19.982) Value
0.580 (11.243) 0.160 (3.900)
0.077 (1.610)
[+]
0.804 (37.441)
0.778 (29.782)
0.844 (48.421) 0.851 (45.494) 0.839 (45.371)
Co-developing
behavior
0.874 (57.434) 0.851 (44.377) 0.867 (55.049)
cb2
cb3
ipf4
if1
if2
if3
Interpersonal Fairness
0.775 (18.345) 0.737 (15.680) 0.750 (17.902) 0.876 (47.637)
cs1
cs2
cs3
0.843 (46.816) 872 (56.779) 874 (55.084) 45 (46.055)
0.769 (33.171R) elationship
Quality 0.809 (37.568)
Customer
0.832 (42.475)
0.834 (42.370) 0.866 (58.62 0.832 (44.034) 0.794 (37.06
Customer 0.789 (31.5
cc1
cc2
cc3
cc4
Influencing Behavior
0.718 (21.84
0.802 (33.880) 0.724 (23.160) 0.761 (32.292) 0.811 (39.766) 0.757 (28.608)
mb1
mb2
mb3
mb4
if4 Informational Fairness
cs4 Satisfaction Customer Trust
Commitment cc5
Mobilizing Behavior
mb5
mb6
0.808 0.767 ( 0.781 (30.759) ( 0.790 (34.772) 0.817 (38.462)
ct1 ct2 ct3 ct4 ct5 ct6 ct7
Fig. 4.9 Path model based on sample from Private sector bank consumers n=280
ib3
ib2
ib1 0.400 (8.556) Service
Fairness 0.252 (4.727)
[+]
0.695 (16.676) Customer Citizenship Behavior
0.307 (5.508) 0.789 (33.088)
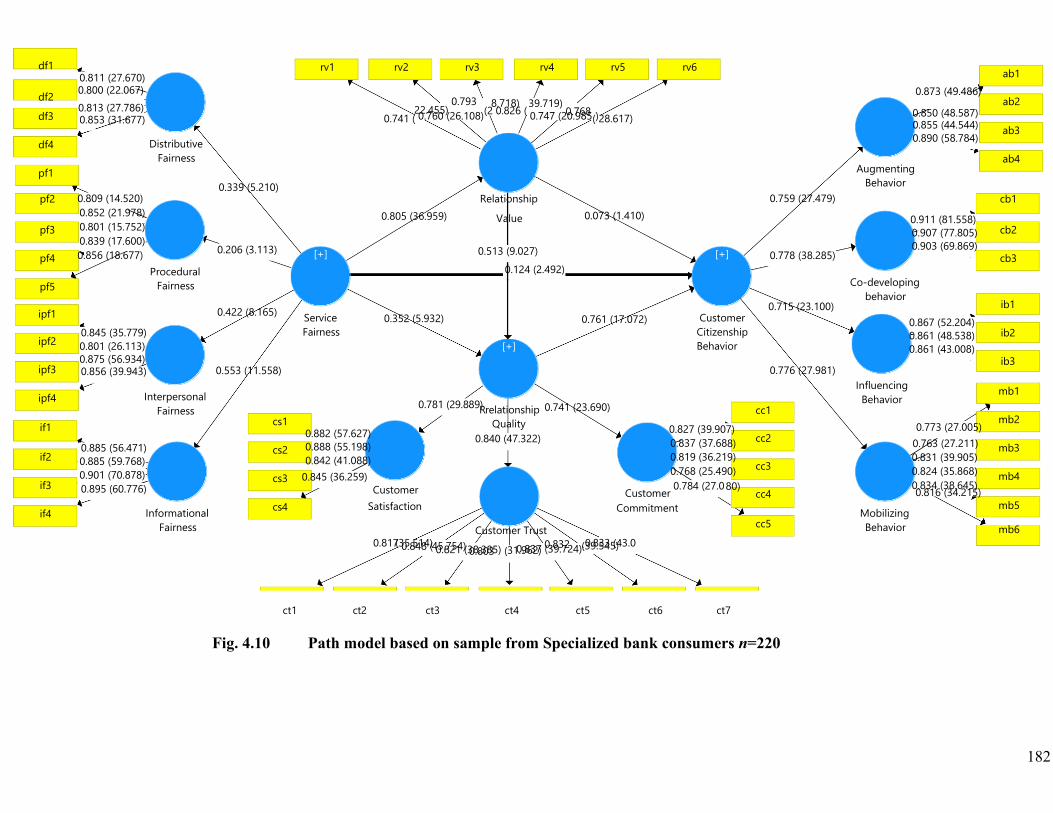
182
8.718) 39.719) 0.768
22.455) 0.793
(35.514) 45.754) 0.803 (39.545) 31.962) 0.832
5)
80)
8)
0)
0. 0.
0.8
df1
df2
0.811 (27.670) 0.800 (22.067)
rv1
rv2
rv3
rv4 rv5
rv6
0.873 (49.486)
ab1
ab2 df3
df4
pf1
pf2
0.813 (27.786) 0.853 (31.677)
0.809 (14.520)
Distributive Fairness
0.339 (5.210)
0.741 ( 0.760 (26.108)(2 0.826 ( 0.747 (20.985()28.617)
Relationship
0.759 (27.479)
0.850 (48.587) 0.855 (44.544) 0.890 (58.784)
Augmenting
Behavior
ab3
ab4
cb1
pf3
pf4
pf5
ipf1
ipf2
ipf3
0.852 (21.978) 0.801 (15.752) 0.839 (17.600) 0.856 (18.677)
0.845 (35.779) 0.801 (26.113) 0.875 (56.934) 0.856 (39.943)
Procedural
Fairness
0.206 (3.113)
0.422 (8.165)
0.553 (11.558)
[+]
Service Fairness
0.805 (36.959)
0.352 (5.932)
Value
0.513 (9.027) 0.124 (2.492)
[+]
0.073 (1.410)
0.761 (17.072)
[+]
Customer Citizenship Behavior
0.778 (38.285)
0.715 (23.100)
0.776 (27.981)
0.911 (81.558) 0.907 (77.805) 0.903 (69.869)
Co-developing
behavior
0.867 (52.204) 0.861 (48.538) 0.861 (43.008)
cb2
cb3
ipf4
if1
if2
if3
Interpersonal Fairness
0.885 (56.471) 0.885 (59.768) 0.901 (70.878) 0.895 (60.776)
cs1
cs2
cs3
0.882 (57.627) 888 (55.198) 842 (41.088) 45 (36.259)
0.781 (29.889R) relationship
Quality 0.840 (47.322)
Customer
0.741 (23.690)
0.827 (39.907) 0.837 (37.68 0.819 (36.219) 0.768 (25.49
Customer 0.784 (27.0
cc1
cc2
cc3
cc4
Influencing Behavior
0.773 (27.00
0.763 (27.211) 0.831 (39.905) 0.824 (35.868) 0.834 (38.645) 0.816 (34.215)
mb1
mb2
mb3
mb4
if4 Informational Fairness
cs4 Satisfaction Customer Trust
Commitment cc5
Mobilizing Behavior
mb5
mb6 0.817 0.848 ( 0.821 (38.385) ( 0.837 (39.724) 0.833 (43.0
Fig. 4.10 Path model based on sample from Specialized bank consumers n=220
ib3
ib2
ib1
ct1 ct2 ct3 ct4 ct5 ct6 ct7
183
4.10 Summary of key findings
4.10.1 The impact of service fairness on relationship value
According to results of the study service fairness strongly influenced relationship value
as it has highest explanatory power in predicting relationship value therefore it was
observed that consumer derive significant value from their relationship with service
providers over time based on their assessment of the benefits received from a fairness
standpoint. Past research also suggests that firm that deliver fair services has the ability
to deliver superior value to its consumers (Omar et al., 2011; Ruiz-Molina et al., 2015)
in other words, when dealing with a reliable firm consumer will accumulate higher
value over time as result of significant risk and cost reduction related to purchase (Zhu
& Chen, 2012).
This study also confirmed that consumers get maximum utility when their efforts,
sacrifices and investments are fairly rewarded. In other words, the emotional
gratification caused by fair distribution of financial benefits allow consumer to
experience higher level of value when dealing with credible banking institutions
(Dedeoglu et al., 2018). For example, the client receives significant value when service
are delivered as promised and procedures of the bank are transparent and consistently
applied (Chang & Hsiao, 2008). Likewise, clients derive higher value when they
receive favorable financial outcomes and provided with comprehensive after sales
service. In addition, clients attribute maximum value to a relationship when service
employee are concerned and willing to help. Thus, customers derive significant value
from an exchange relationship with their service provider when they experience higher
levels of fair treatment.
4.10.2 The role of relationship value in relationship quality
The results of present research also indicate that various components in the relationship
quality are significantly determined by relationship value. In other words, the higher the
overall assessment of the utility in the relationship the greater the overall satisfaction,
commitment and degree of trust in the service provider. This results also in agreement
with (Balaji, 2014; Barry & Terry, 2008; Itani et al., 2019; Ruiz-Molina et al., 2015),
that a consumer’s decision to either remain or withdraw from future business with a
184
firm is based on whether the benefits received outweighs the costs of exchange
outcomes and become reluctant to form relationships with their service provider when
they evaluate that their investments outweigh the return during ongoing exchanges with
the service provider (Saleem et al., 2018). Thus, relationship value is formed during
successive transactions with the service provider over time which directly determine
their level of satisfaction, commitment and trust in the firm (Omar et al., 2011). This
provides support for the argument that when customers believe that their consumption
experience has a high level of utility they tend maintain and enhance their relationship
with service providers. This finding is consistent with prior researches in service
marketing domain who stressed on the key role of value in fostering successful long-
term relational bonds (Hutchinson et al., 2009; Kwortnik & Han, 2011; Zhu & Chen,
2012). Therefore, banking institution should focus on creating and maintaining long-
term relationships between with clients through rewarding their inputs (e.g. efforts,
sacrifices, expectations, costs).
4.10.3 The role of service fairness in relationship marketing
Service fairness was also found to have a direct influence on relationship quality
however the indirect effect of service fairness on relationship quality via relationship
value was much stronger. The mediation result indicate that relationship value partially
explained how service fairness foster long-term customer-firm relationships. This
implies that delivery of favorable services by the service providers ultimately lead to
even strong relationships when they have the ability to provide superior value upon
continuous exchanges. This underlines the significance of service fairness excellence in
generating outstanding value conducive for creating and maintaining long term
relationships with consumers (Giovanis et al., 2015).
Therefore, service fairness is a key driver for building and maintaining relationship
between consumers and their bank. These results are consistent with (Saleem et al.,
2018) who found that perception of fair treatment lead to accumulation of higher value
resulting from quality relationship within the hospitality sector, similar findings were
also reported by (Saleem Ahmad, Akhter, Ziaullah, & Feng, 2015; Muzzamil Wasim,
Naz Akhter, Ziaullah, Bright Atsu, & Feng, 2015; Ziaullah, Yi, & Akhter, 2017) within
the logistics sector showing that service fairness develops trust and commitment which
important to sustain supply chain process integration and improves relationship
185
performance among partners. Hence, judgements regarding of a firm’s relationship
building efforts and activities can be greatly complemented by emphasizing on service
fairness (e.g. the favorability of outcomes, procedures, information and interpersonal
treatment) (Choi & Lotz, 2018; Nikbin et al., 2016). Thus, when consumers feel that
the firm cares about their financial welfare, they positively evaluate the value of an
exchange relationship and tend maintain more meaningful relationship with their
service providers (Shaikh Rafiqul Islam & Selvan a/l Perumal, 2018).
4.10.4 The role of relationship marketing in customer citizenship behaviors
Customer perception of relationship value play a mediating role between relationship
quality and customer citizenship behaviors. The result reported that relationship quality
fully mediated the effect of relationship value on customer citizenship behaviors. This
confirm that relationship value is crucial for developing and maintaining firm–customer
relationships, such strong relationships with the service provider in turn determines
customer citizenship behaviors that help the service firm (Wu et al., 2017). The results
of the study are consistent with (Saleem et al., 2018) and (Itani et al., 2019) who
confirmed that strong relational bonds with customers lead to higher perceptions of
value that result in extra role behaviors. Moreover, relationship value had a significant
but weak predictive effect on CCB indicating that relationship value alone is
insufficient to engage customers in citizenship behavior however this relationship
significantly improves through including relationship quality therefore components of
relationship quality (satisfaction, commitment and trust) built over continuous streams
of transactions act as critical bridge that explains why customer engage in CCB on
behalf of the firm (Ryu & Lee, 2017).
The direct and indirect effects between relationship quality and customer citizenship
behavior indicate that customers tend to contribute a variety of citizenship resources
namely- helping the service providers and other customer, spread positive word of
mouth and service recommendations, report service related problems and their
solutions based on how strongly they are bonded in their relationship with the service
provider (Balaji, 2014; Itani et al., 2019; van Tonder & Petzer, 2018). Moreover,
customers having relational bonds with the firm tend to offer more personal resources
to help the firm (Cheng et al., 2016). According research findings, relationship value
and quality combined had almost equal and strongest effect on all four dimensions of
186
customer citizenship behavior. This implies that when consumers form meaningful
relationship with service providers, they proactively convey service-related issue and
suggest ways to serve them better. Likewise, clients feeling a strong sense of
relationship also share this positive experience to others and let others know how to
derive maximum benefits from an offer. Moreover, clients also persuade significant
others to use the service of the bank and spread positive word of mouth about the
service and the bank itself (Itani et al., 2019).
4.10.5 The impact of service fairness on customer citizenship behavior
The result revealed that service fairness also had direct influence on customer
citizenship behavior, however this relationship is better explained by a firm’s
relationship marketing efforts. According to results, the indirect effect through
relationship value and quality was much stronger than the direct effect. This implies
that although fair treatment is fundamental in reinforcing long-term relationships and
for consumers to exhibit citizenship behaviors but it is also a significant condition that
may encourage consumers to perform positive extra role behavioral outcomes. For
example, clients may share their positive service experience others based how fair they
were treating by the banking institution (Roy, Shekhar, et al., 2018). Therefore, banks
should provide assurance that their services can achieve a sustainable level of
favorableness that meets what the service provider has committed (Cheng et al., 2017).
4.10.6 The relative importance of each dimension of service fairness in relationship building
This research supports the multidimensionality of service fairness and the relative
influence of different fairness perceptions on the formation of valuable and sustainable
relationship with consumers that ultimately lead to citizenship behaviors including
augmenting, codeveloping, influencing and mobilizing behaviors. The study observed
the existence of a positive effect of the customer’s assessment of all four dimensions of
service fairness on relationship value which confirmed that in process building valuable
relationships, service fairness plays a fundamental role. Similarly, all four dimensions
of fair service add to the determination of relationship quality a higher order construct
comprising trust, commitment and satisfaction (Giovanis et al., 2015). Particularly,
with regard to the process of building valuable and sustainable relationship, distributive,
interactional and information fairness had the strongest effect as compared to
187
procedural fairness (Zhu & Chen, 2012). This implies that consumers seem to derive
more value, develop confidence and show more dedication when they are provided
accurate, fast and reliable financial services. In addition, consumers ascribed high
importance to the quality of interpersonal treatment (e.g., empathy, courtesy, and
respect) and the way informational support is provided them (e.g. clear, comprehensive
and accessible) in determining their relationships with service providers (Nikbin et al.,
2016; Saleem et al., 2018). Therefore, to enhance a client’s confidence and
commitment, banks not only should provide unbiased and relevant information that is
valuable for clients but contact personnel should also handle clients with utmost care,
respect and concern (Giovanis et al., 2015; Shaikh Rafiqul Islam & Selvan a/l Perumal,
2018). Furthermore, the results show that when clients feel a strong sense of
relationship based on value, trust, commitment and satisfaction they are prompted to
exhibit citizenship behaviors.
4.10.7 The importance of service fairness for relationship building and driving customer citizenship behaviors
According to the results of the study perception of fairness affect the value and quality
of relationship with a service provider and further induced customer to perform
citizenship behaviors in favor of the firm. This confirmed the argument that a
consumer’s tendency to perform citizenship behaviors depend to a large extent on their
evaluation of both economic and non-economic benefits received based favorable
service outcomes (Balaji, 2014; Itani et al., 2019; Ruiz-Molina et al., 2015). The results
revealed that both value and quality of the relationship partially mediated the effects of
service fairness on customer citizenship behaviors however, with the absence of
relationship quality the indirect path becomes insignificant this indicate that provision
of superior value to the customer is a necessary condition but insufficient to induce
consumers to exhibit citizenship behaviors thus these results provided further evidence
that fairness perceptions have indirect but critical influence on extra-role citizenship
behaviors through the establishment of mutually beneficial long-term relationships. The
present study aimed to provide evidence of the effect of components of service fairness
(distributive, interpersonal, information and procedural fairness as determinants of
relationship value and quality and their influence on customer citizenship behaviors as
little attention has been paid to the study of service fairness and its influence on value
generation in the scope of inter-firm relationships in the banking sector.
188
Chapter 5
CONCLUSION AND RECOMMENDATIONS
5.1 Chapter overview
Combining perspectives from equity theory (Adams, 1965), relationship marketing
(Verhoef, 2003) and service dominant logic (Vargo & Lusch, 2008), this study tested a
conceptual model that investigated the impact of service fairness conducive for
developing and maintaining enduring relationships and the consequences reflected in
customer citizenship behaviors in the banking sector of Pakistan. The current study
extended the existing relationship marketing literature by examining the usefulness of
service fairness concepts in driving important relationship variables and customer
citizenship behaviors in a network of extant relationships validated in earlier studies.
The findings support the model’s structure and indicated that all four dimensions of
service fairness determine relationship value and quality, which in turn lead customers
to perform citizenship behaviors. More specifically, the study confirmed that perception
of service fairness significantly influences customer’s valuation of exchange outcomes
resulting in sustainable relationships that induces customers to exhibit extra role
behaviors. Findings in this current study validate the idea that consumers commonly
evaluate fairness in exchange relationships when dealing with service providers.
Having discussed the results of the study, this chapter highlights the key conclusions
drawn from the findings which are presented in section 5.2, followed by presenting the
recommendations for theory and practice. In the section (5.3) theoretical contributions
made by the study into the existing literature in area relationship marketing are
discussed. Section 5.4 provides recommendations to bank management and mangers to
incorporating service fairness strategies into their relationship marketing activities to
achieve competitive advantage, while suggestions are also provided to practitioners and
policy makers on the importance role of service fairness and to effectively plan
strategies for banking sector. Lastly section 5.5 outlines the limitations of the research
and recommendations for further studies in the area of relationship marketing.
189
5.2 Conclusion
Today banking sector in Pakistan is constantly faced with an ever-increasing
competitive business environment. Inevitably banks are offering sophisticated delivery
systems and more value-added services than rivals as a consequence to which users of
financial services now have a greater variety and choices of products and services
available them. In unison banks have also come under enormous pressure to deal with
the growing demands and expectations of their clients as well as due to the shift in
customer-centric regulatory paradigm towards protection of financial consumers,
posing major challenge for bank to retain existing customers. These recent changes in
banking industry have already perpetuated a dynamic environment resulting in the
emergence of customer-centric strategies that foster long-term bank-customer
relationships. Therefore, in order for banks to attract and maintain their customers from
competition, they must turn to meet the economic and emotional needs of their valued
customers by investing in the increasingly interactive and experiential nature of
consumer relationships.
Service fairness is critical to building and sustaining exchange relationships with
customers that can be utilized as important strategic lever by service providers to
differentiate its self from competitors. It refers to whether the service provider has
fulfilled the obligation to provide the outcome and benefits associated with the service
promised which serves a fundamental basis for sustaining and enhancing long-term
customer-firm relationships. Past research has shown that customers determine their
trust and commitment to remain in a relationship with a firm fundamentally on how
fairly they are treated. Service fairness is potentially a new frontier in building
customer trust, commitment and building valuable relationships in the area of service
marketing. Customer perception of service fairness has strong practical significance
from relationship marketing perspective because customer judge their relationship with
their service providers based on how fairly they are treated by the service firm.
Therefore, taking into account the competitive nature of banking sector in Pakistan,
despite service excellence banks also need focus on providing fairness excellence to
enhance strong relationships and engage with their clients so as to achieve sustainable
competitive advantage.
190
Past research argue that customer expect justice in an exchange relationship and gauge
their relationship based the extent to which expected benefits and results are provided
as promised. Moreover, research also indicate that consumers react to service fairness
more strongly than service quality reveling that proving service quality to consumers is
necessary condition, however it not enough to establish sustainable relationships with
customers (Carr, 2007; Giovanis et al., 2015). Considering the fact that banking
institutions provide virtually identical products and services with little to no variation in
service quality, the real differentiation however may come from a consumer assessment
of the degree of overall fair treatment they receive from their relationship over time.
Moreover, It is indisputable that albeit Pakistan is an emerging market, commercial
banking is well established, highly regulated and competitive. There is a growing need
for banking institutions to better understand how they can achieve sustainable
relationships and engage with their consumers. Meanwhile, banks are dedicated and are
also required to deliver clients with services that conform or surpass consumer’s
expectations and also be needed to act favorably and reasonably towards their
customers in a consistent and ethical manner, however service fairness issues and
whether it lead strong relationship building from a customer perspective is yet to be
investigated from a developing country like Pakistan as there is no empirical studies
that investigated the important role of service fairness in relationship building process
particularly from within the banking sector.
In this regard, understanding the consequences of a consumer’s service evaluations in
terms of fairness are of significant relevance to banking establishments which were
explored in this research. It was therefore proposed that successful customer
relationship management can be attributed to a customer’s positive evaluation of a
service provider fair behavior which may guide customer engagement in favor of the
firm. This study was conducted with the main objective of gaining more understanding
about the important role of favorable treatment received during ongoing service
transactions in building relationship between banks and its consumers, and whether
such consequent relationships lead to customer engagement behaviors.
The overall objective of this study was to explore the impact of service fairness and the
relative importance its sub-dimensions (distributive, procedural, interactional and
informational fairness) in building and sustaining long-term exchange relationships and
191
its subsequent role in fostering customer engagement. For this purpose, data was
collected from n=1430 consumers of banking services who had an active bank account.
These users responded to the research questions through an extensive self-administered
questionnaire survey. In line with research design the current study adopted stratified
purposive sampling method to gather data from the sampling frame. The sampling
frame consisted of all banking consumers which were first grouped (stratified) based on
the type of banking consumers (i.e. Public, Private, Specialized, Foreign, Micro-finance
and Islamic banking) afterwards responses were collected from cases using
convenience sampling through on-site face-face contacts. Parallel with the objectives
and subject to time and resource constraints data collection was limited to consumers of
banks branches operating in five (05) Provincial capital cities of Pakistan. The
respondent answers were analyzed through quantitative methods, using SMART PLS
3.2.7 statistical software (Joseph F. Hair, Hult, Ringle, & Sarstedt, 2017), both group-
specific and pooled sample data was analyzed using the software’s inbuild PLS-SEM
algorithm.
The results of the study indicate that, with regard to the process of building valuable
and sustainable relationships among banking consumers, distributive, interactional and
information fairness had the greatest influence followed by procedural fairness. This
implies that consumers seem to derive more value, develop confidence and show more
dedication to a banking service provider when they are provided accurate, fast and
reliable financial services. Second, consumers ascribed high importance to the quality
of interpersonal treatment (e.g., empathy, courtesy, and respect). Thirdly, the manner in
which informational support is provided them (e.g. clear, comprehensive and accessible)
determine their relationship with service provider (Nikbin et al., 2016; Saleem et al.,
2018). Thus, it can be inferred that judgments about a firm’s relational activities and
efforts can be augmented by capitalizing on offering service fairness excellence during
in all-inclusive service delivery (e.g. the favorability of outcomes, procedures,
information and interpersonal treatment). Therefore, in order to increase client’s
confidence and commitment, banks not only should provide unbiased and relevant
information that is valuable for clients but contact personnel should also handle clients
with utmost care, respect and concern.
192
According to the results of the study perception of fairness affect the value and quality
of relationship with a service provider and further induced customer to perform
citizenship behaviors in favor of the firm. The results show that service fairness also
had direct influence on customer citizenship behavior, however this relationship is
better explained by a firm’s relationship marketing efforts. This confirmed the
argument that a consumer’s tendency to perform citizenship behaviors depend to a
large extent on their evaluation of both economic and non-economic benefits received
based favorable service outcomes (Balaji, 2014; Itani et al., 2019; Ruiz-Molina et al.,
2015). The results revealed that both value and quality of the relationship partially
mediated the effects of service fairness on customer citizenship behaviors however,
with the absence of relationship quality the indirect path becomes insignificant this
indicate that delivering superior value to the customer is essential but not sufficient
condition to induce customers to exhibit citizenship behaviors thus these results
provided further evidence that fairness perceptions have indirect but critical influence
on extra-role citizenship behaviors through the establishment of mutually beneficial
long-term relationships over time. These results unfolded that service fairness is a key
driver for building and maintaining relationship between consumers and their bank.
Therefore, banks should provide assurance that their services can achieve a sustainable
level of favorableness that meets what the service provider has committed (Cheng et al.,
2017).
Service fairness was also found to have a direct influence on relationship quality
however the indirect influence of service fairness on relationship quality via
relationship value was much stronger. The mediation result indicate that relationship
value partially explained how service fairness foster long-term customer-firm
relationships. This implies that delivery of favorable services by the service providers
ultimately lead to even strong relationships when they have the ability to provide
superior value upon continuous exchanges. This underlies the importance of service
fairness in building a relationship based on superior value conducive for sustaining and
strengthening relationships with the customers (Giovanis et al., 2015).
The findings indicate that service fairness strongly influenced relationship value
therefore it was observed consumers get maximum utility when their efforts, sacrifices
and investments are fairly rewarded. Moreover, the findings also show that relationship
193
value significantly determined various components of relationship quality. This
suggested that a consumer’s decision to either remain or withdraw from future business
with a firm is built on whether the benefits received outweighs the costs of exchange
outcomes and become reluctant to form relationships with a service provider when their
investments outweigh the return during ongoing exchanges (Saleem et al., 2018). Thus,
when consumers feel that the firm cares about their financial welfare, they positively
evaluate the value of an exchange relationship and tend maintain more meaningful
relationship with their service providers. Therefore, banking institution should focus on
creating and maintaining long-term relationships between with clients through
rewarding their inputs (e.g. efforts, sacrifices, expectations, costs).
Last but not least, the findings showed that perception of relationship value had an
indirect influence on customer engagement behaviors via perceived relationship quality
which indicated that relationship value alone is insufficient to engage customers in
citizenship behavior, therefore dimensions of relationship quality (satisfaction,
commitment and trust) built over continuous streams of transactions act as critical
bridge that explains why customer engage in CCB on behalf of the firm. This implies
that when consumers form meaningful relationship with service providers, they
proactively convey service-related issue and suggest ways to serve their needs, they
share their positive experience to others and let others know how to derive maximum
benefits from an offer on the basis of their strong relationship. Moreover, clients also
persuade significant others to use the service of the bank and spread positive word of
mouth about the service and the bank itself (Itani et al., 2019). This uncovers that
assuring on delivering fairness excellence needed for sustainable relationships, banking
establishments need to direct their relationship marketing efforts to encourage customer
discretionary behaviors.
Building on perspectives from equity theory (Adams, 1965), social exchange theory
(Blau, 1964) relationship marketing and service dominant logic (Vargo & Lusch, 2008),
This research provided verifiable evidence, that customer determine the value and
quality of the their relationship with a service provider based on how fairly they are
treated and in turn perform citizenship behaviors in the scope of customer-firm
relationships in the banking context of Pakistan. This research provided useful insights
to managers, practitioners and policy makers to consider the important role of fairness
194
excellence in all-inclusive service delivery situations. This research presents managers
deeper insight on how customers assess service delivery from a fairness perspective,
highlighting the importance of customer sensitivity towards fair treatment and enabling
them to formulate more effective strategies based on fairness issues. These implications
will result in improved service fairness excellence and will contribute towards
achieving sustainable relationships with customers.
5.3 Theoretical implications
During recent years there has been a great deal of researches that examined the impact
of fairness on buyer-seller exchange relationships however much of the fairness
research has focused simply on how fairness affects certain relationship quality
dimensions such as trust, satisfaction, and commitment (Choi & Lotz, 2018; Roy et al.,
2018, 2015). Service fairness is known to affect key aspects of the investments or
sacrifices made in exchange for benefits received by the consumer during exchange
relationships from their service provider during successive transactions over time (H.-G.
Chen, Liu, Sheu, & Yang, 2012; Hutchinson et al., 2009; Omar et al., 2011; Zhu &
Chen, 2012), therefore, service fairness not only influences relationship quality
(Giovanis et al., 2015) but also relationship value which in turn lead to greater level of
confidence, satisfaction and commitment with a service provider (Balaji, 2014; Itani et
al., 2019; Saleem et al., 2018). Therefore, this study brought to light that the knowledge
pertaining to the critical role of service fairness strategies in building valuable,
enduring relationships with customers. According social exchange theory (Blau, 1964)
fair treatment by the service provider results in socio-emotional gains which obligate
consumers to build quality relationships as a result customer respond to higher degrees
of fairness with higher degrees of value, trust and commitment (Dyne et., 1994; Blau,
1964).
This study adds to the extent knowledge on relationship marketing theory (Verhoef,
2003) since no research has viewed the full spectrum of buyer-seller relationship
building process through the lens of service fairness (Greenberg, 1990). This research
studied the fundamental role of service fairness for relationship building process from
relationship marketing perspective, according to the study results, relationship value
and quality of exchange relationship between buyer and seller is greatly influenced by
service fairness during and post service delivery process. This confirmed the argument
195
that consumers continue and develop their relationship with service providers in
expectation for receiving equitable benefits in return for subjective costs incurred that
lowers their efforts in repeated service encounters, and do so by furthering their
relationship to maintain this status (Greenberg, 1990).
Moreover, this study contributes in the social exchange (Blau, 1964) relationship
marketing literature (Verhoef, 2003) on how service fairness encourage customer to
engage in citizenship behaviors in favor of the firm through developing successful
long-term mutually beneficial relationship. According to social exchange theory
(Murdvee & Blau, 1964), consumers who experience higher degrees fairness believe
that the service provider cares about their welfare, as a result consumer tend to provide
valuable resources as a parallel exchange for fair treatment by showing their support to
service providers (Blau, 1964). Although marketing literature has suggested that
relationship marketing is the leading predictor of customer loyalty (Giovanis et al.,
2015) and citizenship behaviors (Itani et al., 2019), little is known about the important
role of service fairness in a firm’s relationship marketing efforts that ultimately lead to
customer engagement in citizenship behaviors (Roy, Shekhar, et al., 2018).
The current research contributed within equity theory (Adams, 1965) and examined
service fairness conceptualized as higher order construct comprising distributive,
interpersonal, informational and procedural fairness as a major determinant of
relationship marketing in the financial sector (Zhu & Chen, 2012). Besides
investigating the direct relationship between fair service and customer citizenship
behaviors this study identified two critical relationship marketing constructs that in
sequence mediated the effects of service fairness on CCB. Until recently, no research
has contemplated an integrated framework that tested the direct and indirect effects of
service fairness in explaining when customers perform citizenship behaviors on behalf
of certain service firm in the banking sector from a relationship marketing perspective
(Vivek et al., 2012).
Another contribution of this reach is that it validated the generalizability of the model’s
constructs of service fairness (Carr, 2007), relationship value (Hogan, 2001) quality
(Ng et al., 2011), and customer citizenship behaviors (Jaakkola & Alexander, 2014) and
their relationships within the context of a developing country. So far research on
196
customer evaluation of fairness in fostering long-term relationship with customers and
its subsequent impact on customer citizenship behaviors has not been generalized and
applied to various service delivery situations, particularly within banking sector from
Pakistan (Kamran & Uusitalo, 2019). This research confirms that banking consumers
do react to fairness when interacting with their banking service providers and that they
also evaluate service favorableness (Nikbin et al., 2016). Domestic studies have
recently started to appreciate and confirm the importance of customer evaluations from
the standpoint of fairness and its critical role in relationship building within the
hospitality sector (Saleem et al., 2018). Moreover, (Shaikh Rafiqul Islam & Selvan a/l
Perumal, 2018) also established that service fairness fosters relationship commitment
through improved feeling of wellbeing among consumers of Microfinance banks. In
addition, building on psychological contract theory, (Mehmood et al., 2018) confirmed
that firms that break its promises and fail to deliver the expected service to its
customers adversely affect consumer trust and satisfaction which lead them to spread
negative word of mouth. Past research have predominantly focused on a firm fair
efforts during service recovery to restore service failure and examined customer
attitudes and behaviors as a consequence post recovery performance (J. L. M. Lee et al.,
2018; Muhammad et al., 2018; Um & Kim, 2018; Waqas et al., 2014). However,
regardless of customer’s reactions to fairness in a firm’s post recovery efforts after
service failures occurs, this research provided evidence that consumers to a great extent
evaluate favorableness of exchange outcomes in the all-inclusive service delivery
situations (with or without service failures) (Giovanis et al., 2015; Nikbin et al., 2016;
Roy, Shekhar, et al., 2018; Saleem et al., 2018; LuJun Su et al., 2017).
This study adds to the emerging theory of customer engagement and value co-creation
theory (Vargo & Lusch, 2008) by validating the generalizability of relatively new
constructs of customer citizenship behaviors in banking context. More specifically, the
current study verified that the CCB construct is a higher order construct composed of
four dimensions namely- augmenting, co-developing, influencing and mobilizing
behaviors (Jaakkola & Alexander, 2014). The CFA results provided evidence that CCB
scale is contextually relevant from a developing country perspective. Moreover, despite
growing interest on how consumers engage in voluntary behaviors (Bove et al., 2009;
Yi & Gong, 2008), few studies have explored the antecedents of customer citizenship
behavior in the context of relationship marketing (Balaji, 2014). Therefore, this study
197
improved the knowledge pertaining to the drivers of customer citizenship behaviors in
banking sector. This validated the basic theoretical underpinning of this study that in a
favorable social exchange relationship customer can be expected to perform
discretionary actions that are valuable to service providers because of consumers
commitment towards their maintain their relationship ((Xanthopoulou, Bakker,
Demerouti, & Schaufeli, 2009). For example, if customer feel that their relationship is
rewarding and sustainable, they are more likely to assist other consumers or service
provider and/ or recommend the service provider and its services to others.
Moreover, this research used multigroup analysis (Sarstedt, Henseler, & Ringle, 2011)
to access group specific differences among six consumer segments in the banking
sector, in addition to group specific differences this study also confirmed the robustness
the research model structure across six different sources of data.
5.4 Managerial implications
5.4.1 Introduction
The findings of this study uncovered how each specific type of service fairness namely,
distributive fairness (equal, equitable, expectable distribution of financial resources),
interpersonal fairness (honest, courteous and faithful treatment by contact personnel),
informational fairness (comprehensive, credible and accessible to all the clients) and
procedural (transparent, comprehensible and consistently applied) fairness provides an
opportunity to bank managers who should develop and implement relationship
marketing strategy with the overall goal to extend better exchange relationships with
their clients and encourage them to participate in citizenship behaviors. The results
indicate that strong relationships based on trust, commitment and satisfaction are more
likely build up when consumers experience the exchange outcomes to be valuable. This
valuation of the relationship is directly influenced by the rewards received against the
sacrifices rendered during successive on-going transactions over time by the client.
Bank management must implement service fairness strategies aimed at building and
maintaining relationships with their clients through delivering a constant level of utility.
Therefore, before implementing these strategies, managerial action is required to
improve management’s comprehension regarding determinants and consequence of
198
relationship marketing to achieve competitive advantage within the banking sector. The
results of this study have several managerial implications:
This research elucidated on the importance of client’s evaluation of service fairness
during service delivery as a key determinant in relationship building process from a
relationship marketing perspective. This research offers bank managers practical
insights to consider the relative importance and management of each category of fair
treatment that is instrumental in developing long term mutually beneficial relationships
with clients that eventually affect customer citizenship behaviors.
5.4.2 Distributive fairness
The results indicate that perception of distributive fairness in delivery of financial
services appeared to be the most important dimension of fairness in relationship
building process. therefore, banks should strive to acknowledge the gravity of
developing effectual strategies for the equitable distribution of service resources in
accordance to what the bank has committed to deliver. Specifically, the provision of
service deliverables should be according the efforts (investments) made by individual
clients, while generally every client should get virtually the same service as promised.
Moreover, management should plan effective strategies to project faithful image of
their bank through ensuring financial security and safety against the instrumental and
emotional investments made by their clients. Likewise, service offers of the banks
should not be overstated and must be based in facts as anticipated by the clients. In this
regard, managerial action is required to provide favorable service outcomes for the
clients according to what the clients had expected. Focusing on various aspects of
distributive fairness will convey to customers that bank is concerned about their welfare
which may lower the purchase risks associated with service delivery and contribute to
substantial cost savings and benefits, such cost and benefit evaluations determine a
client overall value/utility from their relationship with the service provide compared to
other providers. Therefore, managers should strive to maximize the value of their
financial exchange outcomes through fair distribution of service resource by devoting
equal attention, faithful efforts and safeguard their inputs.
199
5.4.3 Interpersonal fairness
The result indicated that consumers give considerable weight to interpersonal treatment
on their valuation of relationship with the service provider when they interact employee
of the banks. Considering the complexity and intangibility inherent in the production of
financial services clients to a great extent rely on how service staff treat them during
the enactment of service delivery. Since most bank establishments rely on customer
contact and the service performance of their employee, therefore, management should
plan and implement effective strategies to improve customer perception of
interpersonal fairness. For example, managers should make sure that clients get
unbiased, friendly and honest treatment from contact employees during service
encounters. Moreover, staff should be trained to treat clients with interest and concern,
they must be flexible to respond to their unusual requests, and would be willing to help
them courteously when they seek assistance. Likewise, the customer service staff must
able to provide care and be sensitive to the needs of the client. Service staff need to be
adaptable to failure situations, e.g. when a service malfunction occurs, they should
extend personal apology and be able to offer redressals for the client grievances. Since
consumers accredit significant value to their relationship with their service provider
fundamentally on the interpersonal treatment they get, therefore managers need to
ensure that such material and methods are effectively implemented during service
encounters that help client form positive evaluation about the service.
5.4.4 Information Fairness
This research demonstrate that users of financial services give considerable importance
to informational fairness during delivery of financial services during relationship
building process. This entails that clients attribute significant value to financial
exchange relationship when they are provided with comprehensive information about
financial products and services according to their needs and concerns. At the same time,
managers should plan and develop policies with respect to informational fairness by
issuing full exposure about procedures in the enactment of financial services. Mangers
should ensure transparency and fair communication of information with clients. For
example, banks may provide full disclosure of information to clients on why their loan
application was rejected and provide remediable guidance regarding proper
documentation. Banks could launch discussion forums for clients on their website or on
200
social media platforms and provide consist support through provision on time sufficient
information regarding their queries related to services. Moreover, all consumers should
be allowed equal and complete access to information before and after a financial
service is delivered. All of these coordinated efforts will help bank managers to
maximize value for their clients, which will eventually motivate them form quality
relationships based on commitment, trust and satisfaction with the service provider.
5.4.5 Procedural Fairness
Procedural fairness appeared to be a significant predictor of relationship value and
quality, although compared to other dimensions of service fairness procedural fairness
was ranked among the lowest in terms of importance by consumers. However, mangers
should not ignore the importance of bias free procedures that also add considerable
value to their relationships with clients. Bank managers need to be attentive to
executing policies that facilitate client’s evaluation of procedural fairness through
making sure that policies and procedures represent all groups. Service delivery of
financial service should be based on consistent, accurate, and equitable standard
operating procedures for all clients.
Moreover, the operations of the banks should be flexible to accommodate client
uncommon requests. Service staff should be knowledgeable to provide clear
information to their clients and serve them with convenience and concern. For example,
service staff should be trained to provide clients with clear and understandable
explanations to reduce their uncertainty regarding a particular banking process. In
addition, to expedite service delivery process, automated systems should be introduced
to produce consistent results (e.g. queuing system) likewise staff need to be trained and
provided material and method to provide timely and error-free responses to all its
clients. These implications should help bank managers to ensure a constant delivery of
favorable outcomes, procedures, interactions and consistent information in various
service delivery situations aimed at maximizing the value of the relationship with their
clients which will eventually result in sustainable relationships based on commitment,
trust and satisfaction with their clients.
201
5.4.6 Training of contact personnel
Management should design and develop customer service training programs that assist
in professional development of their staff by providing them training to enrich their
comprehension regarding various sources of service fairness aimed at delivering more
benefits and reduced uncertainties associated with exchange relationships for their
clients. These training programs should assist service employee to develop appropriate
traits, skills and competencies needed for exceptionally fair service delivery. For
example, bank managers may coach their staff on how to serve clients impartially,
ensuring equal distribution of service resources according to client’s expectations,
motivate them to be willing to assist client’s and educate them to serve clients with a
fair-minded approach. Moreover, customer service strategies must be designed to
encompass different aspects of service fairness showing concern for a client’s overall
welfare. Particularly, the service staff in direct contact with clients must be trained to be
susceptive of client need for fair treatment. The support staff must be trained to be
flexible to recover situations were a service failure has occurred for instance, being
polite and courteous to users while handling the situation. In addition, service
employees must expand their tendencies to be friendly, honest and willing to help
customers. Such training efforts may enhance a customer perception that the bank
actually cares about their customers which will lead them to expect positive financial
gains and significantly reduce sacrifices associated with service consumption which
may allow the bank to extend the relationship based on satisfaction trust and continuing
commitment with their clients. Such quality relationship may extend the
interdependence and length of relationship between banks and their clients, enable the
bank to improve its credibility and strengthen its truthful image and good market
standing for achieving service fairness excellence in financial sector.
5.4.7 Recruitment and selection appropriate individuals
Management should devise policy to recruit individuals who will help in promoting an
equitable climate inside and to clients of the branch. Recruitment and selection
processes should be designed to accommodate those individuals who possess the
aptitude necessary for fair service delivery. For example, managers should give due
consideration to people that possess traits like flexibility and who can work under
pressure, or has the ability to handle or overturn unfair situations. furthermore,
202
management should give preference to those individuals who are polite, respectful,
responsible and who are resilient in resolving client’s concerns.
5.4.8 Positioning the bank and its services based on fairness
Banks should develop a faithful image and position its self in the minds of current and
prospective clients. The positioning processes should underscore that outcomes,
procedures, interpersonal treatment are in line with the expectations of their clients.
Moreover, bank should provide assurance that they are genuinely concerned about their
client’s wellbeing. In addition, the service offering of the banks should be founded on
facts focused towards inspiring client’s lifelong value and not short-term profit making.
Promotional planning of the bank should reflect all four categories of fair treatment
conveying utmost care and respect for consumer’s investments.
5.4.9 Implications for practitioners
This research provides practitioners with an improved understanding regarding each
category of service fairness and its relevance in designing relationship marketing
strategies to encourage customer engagement. Practitioners should pay attention to
devising sound policies for the enhancement of a truthful image of the banking sector
that deliver considerable value which is helpful to enhance relationship quality with
clients. Several implications for practitioners can be highlighted including designing
training programs to promote interpersonal skills, among contact employees,
practitioners should place careful consideration to distributive, procedural and
informational fairness while designing financial services. For example, every client
should get virtually the same amount of service and attention, the placement of
financial offers should be equally accessible and all information regarding the service
must be readily available to all consumers, moreover clients should be provided
continuous after sales support. Service pricing should be reasonable and justified across
all consumers segments. Finally, the promotional strategies of the bank should not be
overstated and be simple and comprehensible. Social media platforms should also get
key attention to develop and implement promotional strategies aimed at caring the
clients need for fair treatment in each of the four categories. For example, social
platforms of the bank should be actively engaged to inform clients about latest service
offers and provide relentless support before and after a service has occurred.
203
Practitioner may also want to position service fairness strategies when designing
training, recruiting and integrated marketing communication strategies for banking
sector. Practitioners should assist in developing online and offline platforms for quick
resolution of service-related issues moreover supportive mechanism should also be
readily available to encourage clients to report their grievance to the banks. In summary
practitioners should highlight the importance of implementing service fairness
strategies that may help banking sector to enhance the value and quality of relationships
and elicit citizenship behaviors.
5.4.10 Implications for policy with regard to consumer protection
Although state bank of Pakistan has stipulated guidelines for general conduct of
banking professionals with reference to consumer protection, however these
recommendations provides at best an incomplete picture of what determines a better
working relationship between banking institutions and their clients. This research offers
a comprehensive perspective on the importance of specific service fairness elements
namely- outcome, procedural, interpersonal and information fairness as key drivers in
relationship building process between banks and their clients. Policy makers may
develop detailed guidelines based on each of the stated fairness issues involved in
banking conduct inside banks in order to enforce these consumer protection measures.
For example, detailed guidelines may be outlined regarding consumer’s access to
particular information regarding a decision or service, regulatory guidelines may be
framed regarding fair pricing including premiums, surcharges or fees etc. Similarly,
detailed policy may be communicated about accuracy, consistency and transparency of
procedures in banking activities.
Moreover, guidelines may be prescribed for equitable distribution of financial resources
and particulars for interpersonal treatment with client’s may clearly be outlined to
improve credibility of banking professionals. Such guidelines may be supplemented
into the regulatory framework of banking establishments to maintain a constant utility
level for clients, increase their satisfaction, and to improve their level confidence in
banking conduct. In addition, such guidelines may serve to improve service failures
rates and may help banks to forge enduring relationship with their valued clients. In
summary policy makers should highlight the importance of ensuring that clients receive
204
fair and honest treatment from their bank through creating a win-win condition for both
the parties.
5.4.11 Monitor and track perceptions about fairness
Banks should keep track of their relationship marketing efforts through regularly
collecting feedback using multifaceted service fairness surveys that measure and track
their clients service fairness performance in terms in terms of outcomes, procedures,
interpersonal treatment and distribution of information. For example, which aspect of
fair treatment drives maximum value and satisfaction in a particular segment of clients
or what is the level of comment and trust among client whose loan applications were
declined etc. may have important implication for decision making. Moreover, such
information may help bank manager track relevant performance of their customer
service staff and if necessary, upgrade their performance though provision of updated
information and support systems, while such data may also help manager in effective
and efficient decision making such as product planning and market development. In
addition, monitoring and supervision of actual and expected performance overtime, in
terms of service fairness and its subsequent impact on relationship outcomes will
promote enhanced levels of customer service. Management should also transform this
information in helping them to encourage client engagement behaviors. For example,
responses of clients who enjoy significant relationship outcomes may be interviewed to
generate required information about their willingness to provide a variety valuable
resources such as positive word of mouth and helpful suggestions etc.
5.4.12 Encouraging customer citizenship behaviors
This study provided managers a nuanced understanding regarding the importance of
each type valuable resources that clients can contribute to help a firm. In addition, this
study also improved manger’s comprehension that through mutually beneficial
sustained relationship based on service fairness excellence enable banking institutions
to induce beneficial behaviors from their customers. For example, clients that are
committed and trust the credibility of the bank may act as potential advertising sources
that may help the bank spread positive word of mouth and may also recommend the
bank services to others. Likewise, clients that derive significant value based on their
fairness treatment may influence friends and relatives to use services of the bank.
205
Similarly, clients, that enjoy a healthy relationship and receive favorable benefits in
exchange may provide constructive suggestions to help further improve the service and
teach others user how to use the service properly. Moreover, given the increasing
power of social media, banks can engage clients in a variety of co-creation activities
such as reporting service related issues, sharing innovative ideas to improve service,
letting bank know how to serve clients better, and sharing their overall positive
experience with other etc.
5.4.13 Differential competitive advantage through achieving excellence in fair service delivery
In addition to intensified competition among banking institutions, the needs and
expectations of consumers of banking services have also become unprecedented,
therefore besides service excellence banks need focus on providing excellence in
service fairness to create strong relationships with their clients as endured relationship
can lead to customer citizenship behaviors such as spreading positive word of mouth
helping firm and customers through service recommendations, letting the bank know
about potential service related issues all of which enhance brand reputation and market
standing of the banking institution (Ziaullah, Feng, & Akhter, 2017). Therefore, bank
management should be devoted to building and improving overall relationship quality
through provision of equitable treatment that deliver a constant utility.
Furthermore, given the fact that banking institutions provide virtually identical products
and services with little to no variation in service quality, the real differentiation
however may come from a consumer assessment of the degree of overall fair treatment
they receive from their relationship over time. Moreover, service fairness serves as a
potential switching cost and serve as barrier for discontinuation of the relationship with
customers which therefore is a potential source of competitive advantage. Therefore,
banks should place emphasis on create valuable relationships through making extended
efforts to enhance their welfare focusing on providing equitable, reliable, transparent
and consistent delivery of financial resources.
5.5 Limitations and direction for future research
Besides useful implications, the findings of the current research cannot be interpreted
without addressing the study’s limitations. The research also provides potential future
206
research directions that may stimulates further research into the area of relationship
marketing.
First, the generalizability of the results is limited to different segments within banking
sector, additional research is encouraged to examine the model across different service
sectors to test the same causal relationships. For example, future studies may compare
the same model across different types service sectors using multigroup analysis, having
low to high degrees of contact or between firms having varying degree of service
complexity (Choi & Lotz, 2018). This would provide a comparative view on
relationship building process based on a customer’s ability to evaluate service fairness
in terms of service complexity or frequency of contact.
Second, it would be interesting to check the comparative influence of service fairness
coupled with other related variables that may have an important role in the process of
relationship building. For example, future researches may explore the role of fair image
(favorable image of the firm and its service) or further studies may explore the relative
influence of a firm’s service fairness efforts along with total quality management
efforts in relationship building process in the domain of relationship marketing. In
addition, future studies may also explore the role of fairness in building a firm and its
brand reputation through building strong relationship with its customers (Ziaullah, Feng,
et al., 2017).
Third, the results of study were obtained by adapting multidimensional scales of service
fairness form previous studies where each dimension is limited to four items. Further
studies may focus on designing more robust measurements specifically for banking
settings by establishing comprehensive coverage for each dimension of service fairness
in a developing country context.
Fourth, the current research tested the influence of service fairness in determining
important relationship outcomes and consequence thereof reflected in form of voluntary
role behaviors in overall service provision situation. Future studies should focus
exclusively on how service fairness affect relational outcomes within the banking
sector, in situations where a service failure has occurred (Balaji et al., 2017). Further
according to the authors knowledge no such investigations are available in the domain
of service fairness from Pakistan.
207
Fifth, future studies should also focus on including more relevant measures in the
domain of relationship marketing such as relationship strength, relationship investments
etc. these constructs may also serve as important mechanisms explaining the strengths
of service fairness on eliciting important consumers outcomes (Balaji, 2014).
Sixth, the sampling frame was limited to capital cities of Pakistan, the scope this study
could be extended by including more cities e.g. most populous cities to increase the
generalizability of the study results and to give a richer understanding about the
constructs in question.
Seven, this research employed cross-sectional survey design to collect data and used
mono-method to examine the model. Given the dynamic nature of consumer
evaluations in all conclusive service delivery situations, longitudinal designs are
required to present a more comprehensive assessment regarding the interrelationships
among study variables over time. Furthermore, to provide further support to the
hypothesized model future research should consider employing multi-method approach
to confirm such relationships.
208
REFERENCES
Adams, J. S. (1965). Inequity In Social Exchange. Advances in Experimental Social Psychology, 2, 267–299.
Adams, J. S., & Freedman, S. (1976). Equity Theory Revisited: Comments and Annotated Bibliography. Advances in Experimental Social Psychology, 9, 43–90.
Ahluwalia, R., Burnkrant, R. E., Unnava, H. R., Rohini Ahluwalia, Robert E. Burnkrant, & Unnava, H. R. (2000). Consumer Response to Negative Publicity: The Moderating Role of Commitment. Journal of Marketing Research, 37(2), 203–214.
Ahmad, S., Akhter, S. N., Ziaullah, M., & Feng, Y. (2015). An Investigation of Justice in Supply Chain Trust and Relationship Commitment - An Empirical Study of Pakistan. Journal of Competitiveness, 7(1), 71–87.
Ahmad, S., & Burki, A. A. (2016). Banking deregulation and allocative efficiency in Pakistan. Applied Economics, 48(13), 1182–1196.
Al-alak, B. A. (2014). Impact of marketing activities on relationship quality in the Malaysian banking sector. Journal of Retailing and Consumer Services, 21(3), 347–356.
Alessandri, G., Consiglio, C., Luthans, F., & Borgogni, L. (2018). Testing a dynamic model of the impact of psychological capital on work engagement and job performance. Career Development International, 23(1), 33–47.
Alexander, S., & Ruderman, M. (1987). The role of procedural and distributive justice in organizational behavior. Social Justice Research, 1(2), 177–198.
Alexander, S., Sinclair, R. R., & Tetrick, L. E. (1995). The role of organizational justice in defining and maintaining the employment relationship. In Changing employment relations: Behavioral and social perspectives. (pp. 61–89). Washington: American Psychological Association.
Ali, M., & Raza, S. A. (2017). Service quality perception and customer satisfaction in Islamic banks of Pakistan: the modified SERVQUAL model. Total Quality Management & Business Excellence, 28(5–6), 559–577.
Allen, N. J., & Meyer, J. P. (1996). Affective, Continuance, and Normative Commitment to the Organization: An Examination of Construct Validity. Journal of Vocational Behavior, 49(3), 252–276.
Ambrose, M. L., & Schminke, M. (2003). Organization structure as a moderator of the relationship between procedural justice, interactional justice, perceived organizational support, and supervisory trust. Journal of Applied Psychology, 88(2), 295–305.
209
Anaza, N. A. (2014). Personality Antecedents of Customer Citizenship Behaviors in Online Shopping Situations. Psychology & Marketing, 31(4), 251–263.
Anderson, E. W., Fornell, C., & Lehmann, D. R. (2006). Customer Satisfaction, Market Share, and Profitability: Findings from Sweden. Journal of Marketing, 58(3), 53.
Anderson, E., & Weitz, B. (1989). Determinants of Continuity in Conventional Industrial Channel Dyads. Marketing Science, 8(4), 310–323.
Anderson, J. C., & Narus, J. A. (2006). A Model of Distributor Firm and Manufacturer Firm Working Partnerships. Journal of Marketing, 54(1), 42.
Anderson, J. C., Narus, J. A., & van Rossum, W. (2006). Customer value propositions in business markets. Harvard Business Review, 84(3), 90–99, 149.
Anderson, R. E. B., Babin, B. J. B., Black, W. C. B., & Hair, J. F. B. (2014). Multivariate data analysis. Harlow: Pearson Education Limited.
Anjum, M. N., Xiuchun, B., Abbas, J., & Shuguang, Z. (2017). Analyzing predictors of customer satisfaction and assessment of retail banking problems in Pakistan. Cogent Business & Management, 4(1).
Antonaki, X.-E., & Trivellas, P. (2014). Psychological Contract Breach and Organizational Commitment in the Greek Banking Sector: The Mediation Effect of Job Satisfaction. Procedia - Social and Behavioral Sciences, 148, 354–361.
Arnold, M. J., & Reynolds, K. E. (2003). Hedonic shopping motivations. Journal of Retailing, 79(2), 77–95.
Astrachan, C. B., Patel, V. K., & Wanzenried, G. (2014). A comparative study of CB-SEM and PLS-SEM for theory development in family firm research. Journal of Family Business Strategy, 5(1), 116–128.
Avkiran, N. K., & Ringle, C. M. (2018). Partial least squares structural equation modeling : recent advances in banking and finance. Cham: Springer International Publishing; Springer.
Babin, B. J., Carr, J. C., Griffin, M., & Zikmund, W. G. (2012). Business research methods. Mason Ohio: Australia.
Back, K.-J., & Parks, S. C. (2003). A Brand Loyalty Model Involving Cognitive, Affective, and Conative Brand Loyalty and Customer Satisfaction. Journal of Hospitality & Tourism Research, 27(4), 419–435.
Bagozzi, R. P. (1974). Marketing as an Organized Behavioral System of Exchange. Journal of Marketing, 38(4), 77–81.
Bagozzi, R. P. (1975). Marketing as Exchange. Journal of Marketing, 39(4), 32–39.
210
Bagozzi, R. P. (1995). Reflections on Relationship Marketing in Consumer Markets. Journal of the Academy of Marketing Science, 23(4), 272–277.
Balaji, M. S. (2014). Managing customer citizenship behavior: a relationship perspective. Journal of Strategic Marketing, 22(3), 222–239.
Balaji, M. S., Roy, S. K., & Quazi, A. (2017). Customers’ emotion regulation strategies in service failure encounters. European Journal of Marketing, 51(5/6), 960–982.
Ballantyne, D., & Varey, R. J. (2006). Creating value-in-use through marketing interaction: the exchange logic of relating, communicating and knowing. Marketing Theory, 6(3), 335–348.
Banking Muhtasib Pakistan. (2017). Annual report. Retrieved from http://www.bankingmohtasib.gov.pk/annual_reports.php
Baron, R., & Kenny, D. (1986). The moderator-mediator variable distinction in social psychological research: Conceptual, strategic, and statistical considerations. Journal of Personality and Social Psychology (Vol. 51).
Barry, J., & Terry, T. S. (2008). Empirical study of relationship value in industrial services. Journal of Business & Industrial Marketing, 23(4), 228–241.
Bartikowski, B., & Walsh, G. (2011). Investigating mediators between corporate reputation and customer citizenship behaviors. Journal of Business Research, 64(1), 39–44.
Bateman, T. S., & Organ, D. W. (1983). Job Satisfaction and the Good Soldier: The Relationship Between Affect and Employee “Citizenship.” Academy of Management Journal, 26(4), 587–595.
Bettencourt, L. A. (1997). Customer voluntary performance: Customers as partners in service delivery. Journal of Retailing, 73(3), 383–406.
Bies, R. J., & Shapiro, D. L. (1987). Interactional fairness judgments: The influence of causal accounts. Social Justice Research, 1(2), 199–218.
Bies, R. J., & Shapiro, D. L. (1988). Voice and Justification: Their Influence on Procedural Fairness Judgments. Academy of Management Journal, 31(3), 676–685.
Blancero, D., & Ellram, L. (1997). Strategic supplier partnering: a psychological contract perspective. International Journal of Physical Distribution & Logistics Management, 27(9/10), 616–629.
Blau, P. M. (1964). Justice in Social Exchange. Sociological Inquiry, 34(2), 193–206.
Blodgett, J. G., Hill, D. J., & Tax, S. S. (1997). The effects of distributive, procedural, and interactional justice on postcomplaint behavior. Journal of Retailing, 73(2), 185–210.
211
Bollen, K. A., & Diamantopoulos, A. (2017a). In defense of causal-formative indicators: A minority report. Psychological Methods, 22(3), 581–596.
Bollen, K. A., & Diamantopoulos, A. (2017b). Notes on measurement theory for causal-formative indicators: A reply to Hardin. Psychological Methods, 22(3), 605–608.
Bolton, G. E., Ockenfels, A., Bolton, G., & Ockenfels, A. (2004). The Behavioral Tradeoff between Efficiency and Equity when a Majority Rules.
Bove, L. L., Pervan, S. J., Beatty, S. E., & Shiu, E. (2009). Service worker role in encouraging customer organizational citizenship behaviors. Journal of Business Research, 62(7), 698–705.
Bowen, D. E., Gilliland, S. W., & Folger, R. (1999). HRM and service fairness: How being fair with employees spills over to customers. Organizational Dynamics, 27(3), 7–23.
Brandimarte, P. (2011). Quantitative methods : an introduction for business management. Wiley.
Braun, C., Batt, V., Bruhn, M., & Hadwich, K. (2016). Differentiating customer engaging behavior by targeted benefits – an empirical study. Journal of Consumer Marketing, 33(7), 528–538.
Brislin, R. W. (1970). Back-Translation for Cross-Cultural Research. Journal of Cross-Cultural Psychology, 1(3), 185–216.
Brislin, R. W. (1986). The wording and translation of research instruments. In Field methods in cross-cultural research. (pp. 137–164). Thousand Oaks, CA, US: Sage Publications, Inc.
Brockner, J., & Wiesenfeld, B. M. (1996). An integrative framework for explaining reactions to decisions: Interactive effects of outcomes and procedures. Psychological Bulletin, 120(2), 189–208.
Bryman, A. (2012). Social research methods (4th ed.). Oxford ;;New York: Oxford University Press.
Bryman, A., & Bell, E. (2015). Business research methods (4th ed.). Oxford: Oxford University Press.
Byrne, B. M. (2016). Structural Equation Modeling With AMOS. Routledge.
Carlson, J., Rahman, M. M., Taylor, A., & Voola, R. (2019). Feel the VIBE: Examining value-in-the-brand-page-experience and its impact on satisfaction and customer engagement behaviours in mobile social media. Journal of Retailing and Consumer Services, 46, 149–162.
Carlson, J., Rahman, M., Voola, R., & De Vries, N. (2018). Customer engagement
212
behaviours in social media: capturing innovation opportunities. Journal of Services Marketing, 32(1), 83–94.
Carmeli, A., Gilat, G., & Weisberg, J. (2006). Perceived External Prestige, Organizational Identification and Affective Commitment: A Stakeholder Approach. Corporate Reputation Review, 9(2), 92–104.
Carr, C. L. (2007). The FAIRSERV model: Consumer reactions to services based on a multidimensional evaluation of service fairness. Decision Sciences, 38(1), 107–130.
Carrasco, L. (2003). The American Community Survey ( ACS ) en Español : Using Cognitive Interviews to Test the Functional Equivalence of Questionnaire Translations, 14–19.
Cepeda Carrión, G., Henseler, J., Ringle, C. M., & Roldán, J. L. (2016). Prediction-oriented modeling in business research by means of PLS path modeling: Introduction to a JBR special section. Journal of Business Research, 69(10), 4545–4551.
Chang, H.-S., & Hsiao, H.-L. (2008). Examining the casual relationship among service recovery, perceived justice, perceived risk, and customer value in the hotel industry. The Service Industries Journal, 28(4), 513–528.
Chao, C.-M., & Cheng, B.-W. (2017). Does service recovery affect satisfaction and loyalty? An empirical study of medical device suppliers. Total Quality Management & Business Excellence, 1–17.
Chathoth, P., Altinay, L., Harrington, R. J., Okumus, F., & Chan, E. S. W. (2013). Co-production versus co-creation: A process based continuum in the hotel service context. International Journal of Hospitality Management, 32, 11–20.
Cheah, J.-H., Sarstedt, M., Ringle, C. M., Ramayah, T., & Ting, H. (2018). Convergent validity assessment of formatively measured constructs in PLS-SEM. International Journal of Contemporary Hospitality Management, 30(11), 3192–3210.
Chen, C.-F., & Myagmarsuren, O. (2011). Brand equity, relationship quality, relationship value, and customer loyalty: Evidence from the telecommunications services. Total Quality Management & Business Excellence, 22(9), 957–974.
Chen, H.-G., Liu, J. Y.-C., Sheu, T.-S., & Yang, M.-H. (2012). The impact of financial services quality and fairness on customer satisfaction. Managing Service Quality (Vol. 22).
Cheng, J.-C., Chen, C.-Y., Yen, C.-H., & Teng, H.-Y. (2017). Building customer satisfaction with tour leaders: the roles of customer trust, justice perception, and cooperation in group package tours. Asia Pacific Journal of Tourism Research, 22(4), 395–407.
213
Cheng, J.-C., Luo, S.-J., Yen, C.-H., & Yang, Y.-F. (2016). Brand attachment and customer citizenship behaviors. The Service Industries Journal, 36(7–8), 263–277.
Cheung, G. W., & Wang, C. (2017). Current Approaches for Assessing Convergent and Discriminant Validity with SEM: Issues and Solutions. Academy of Management Proceedings, 2017(1), 12706.
Choi, L., & Lotz, S. L. (2017). Exploring antecedents of customer citizenship behaviors in services. The Service Industries Journal, 0(0), 1–22.
Choi, L., & Lotz, S. L. (2018). Exploring antecedents of customer citizenship behaviors in services. The Service Industries Journal, 38(9–10), 607–628.
Chou, E.-Y., Lin, C.-Y., & Huang, H.-C. (2016). Fairness and devotion go far: Integrating online justice and value co-creation in virtual communities. International Journal of Information Management, 36(1), 60–72.
Clark, M. N., Adjei, M. T., & Yancey, D. N. (2009). The Impact of Service Fairness Perceptions on Relationship Quality. Services Marketing Quarterly, 30(3), 287–302.
Collie, T. (Tess), Bradley, G., & Sparks, B. A. (2002). Fair process revisited: Differential effects of interactional and procedural justice in the presence of social comparison information. Journal of Experimental Social Psychology, 38(6), 545–555.
Collis, J., & Hussey, R. (2014). Business research: A practical guide for undergraduate and postgraduate students.
Colquitt, J. A. (2001). On the dimensionality of organizational justice: a construct validation of a measure. The Journal of Applied Psychology, 86(3), 386–400.
Conway, N., & Briner, R. B. (2005). Understanding psychological contracts at work : a critical evaluation of theory and research. Oxford University Press.
Coyle-Shapiro, J., & Kessler, I. (2000). Consequences Of The Psychological Contract For The Employment Relationship: A Large Scale Survey. Journal of Management Studies, 37(7), 903–930.
Creswell, J. W. (2003). Research design : qualitative, quantitative, and mixed methods approaches. Sage Publications.
Cronin, J. J., & Taylor, S. A. (1994). Servperf versus Servqual: Reconciling Performance-Based and Perceptions-Minus-Expectations Measurement of Service Quality. Journal of Marketing, 58(1), 125–131.
Cropanzano, R. S., Ambrose, M. L., & Bies, R. J. (2015). Interactional Justice. In The Oxford Handbook of Justice in the Workplace. Oxford University Press.
214
Crosby, L. A., Evans, K. R., & Cowles, D. (1990). Relationship Quality in Services Selling: An Interpersonal Influence Perspective. Journal of Marketing, 54(3), 68.
Crotty, M. (1998). The foundations of social research : meaning and perspective in the research process. Sage Publications.
Cullinane, N., & Dundon, T. (2006). The psychological contract: A critical review. International Journal of Management Reviews, 8(2), 113–129.
Dang, A., & Arndt, A. D. (2017). How personal costs influence customer citizenship behaviors. Journal of Retailing and Consumer Services, 39, 173–181.
De Cremer, D., & Blader, S. L. (2006). Why do people care about procedural fairness? The importance of belongingness in responding and attending to procedures. European Journal of Social Psychology, 36(2), 211–228.
De Wulf, K., Odekerken-Schröder, G., & Iacobucci, D. (2001). Investments in Consumer Relationships: A Cross-Country and Cross-Industry Exploration. Journal of Marketing, 65(4), 33–50.
Dedeoglu, B. B., Bilgihan, A., Ye, B. H., Buonincontri, P., & Okumus, F. (2018). The impact of servicescape on hedonic value and behavioral intentions: The importance of previous experience. International Journal of Hospitality Management, 72, 10–20.
Deng, Z., Lu, Y., Wei, K. K., & Zhang, J. (2010). Understanding customer satisfaction and loyalty: An empirical study of mobile instant messages in China. International Journal of Information Management, 30(4), 289–300.
Denzin, N. K., & Lincoln, Y. S. (2005). Introduction: The Discipline and Practice of Qualitative Research. In The Sage handbook of qualitative research, 3rd ed. (pp. 1–32). Thousand Oaks, CA: Sage Publications Ltd.
Denzin, N. K., & Lincoln, Y. S. (2011). The SAGE handbook of qualitative research. Sage.
Deutsch, M. (1975). Equity, Equality, and Need: What Determines Which Value Will Be Used as the Basis of Distributive Justice? Journal of Social Issues, 31(3), 137–149.
Diamantopoulos, A., & Siguaw, J. A. (2009). Introducing LISREL : a guide for the uninitiated. London: Sage Publ.
Dinulescu, C. C., Visinescu, L. L., & Prybutok, V. R. (2019). Proactive management of customer relationship quality: an empirical investigation of mobile phone companies. Journal of Decision Systems, 00(00), 1–25.
Doney, P. M., & Cannon, J. P. (1997). An Examination of the Nature of Trust in Buyer-Seller Relationships. Journal of Marketing, 61(2), 35.
215
Dörnyei, Z., Taguchi, T., & Taguchi, T. (2009). Questionnaires in Second Language Research. Routledge.
Dwyer, F. R., Schurr, P. H., & Oh, S. (1987). Developing Buyer-Seller Relationships. Journal of Marketing, 51(2), 11.
Easterby-Smith, M., Thorpe, R., Jackson, P. (Paul R., & Jaspersen, L. J. (2018). Management & business research (6th edition.).
Esposito Vinzi, V. (2010). Handbook of partial least squares : concepts, methods and applications. Berlin: Springer.
F. Hair Jr, J., Sarstedt, M., Hopkins, L., & G. Kuppelwieser, V. (2014). Partial least squares structural equation modeling (PLS-SEM). European Business Review, 26(2), 106–121.
Fazal E. Hasan, S., Mortimer, G., Lings, I. N., & Neale, L. (2017). Examining the antecedents and consequences of gratitude. Journal of Services Marketing, 31(1), 34–47.
Fazal e Hasan, S., Lings, I., Neale, L., & Mortimer, G. (2014). The role of customer gratitude in making relationship marketing investments successful. Journal of Retailing and Consumer Services, 21(5), 788–796.
Filieri, R. (2013). Consumer co‐creation and new product development: a case study in the food industry. Marketing Intelligence & Planning, 31(1), 40–53.
Finch, D., O’Reilly, N., & Abeza, G. (2018). The Independent Sales Contractor and Relationship Quality: An Exploratory Study of Relational Attitudes and Behavioral-Intention. Journal of Relationship Marketing, 17(2), 152–169.
Fontenot, R. J., & Wilson, E. J. (1997). Relational exchange: A review of selected models for a prediction matrix of relationship activities. Journal of Business Research, 39(1), 5–12.
Fornell, C. (1992). A National Customer Satisfaction Barometer: The Swedish Experience. Journal of Marketing, 56(1), 6.
Fornell, C., & Larcker, D. F. (1981). Structural Equation Models with Unobservable Variables and Measurement Error: Algebra and Statistics. Journal of Marketing Research, 18(3), 382–388.
Forsyth, B. H., Kudela, M. S., Levin, K., Lawrence, D., & Willis, G. B. (2006). Improving Questionnaire Translations and Translation Processes. In Proceedings of the Q2006 European Conference on Quality in Survey Statistics (p. 11).
Fournier, Dobscha, S., & Mick, D. (1998). Preventing the premature death of relationship marketing. Harvard Business Review, 76(1).
216
Freese, C., & Schalk, R. (1996). Implications of differences in psychological contracts for human resource management. European Journal of Work and Organizational Psychology, 5(4), 501–509.
Fullerton, G. (2005). The service quality–loyalty relationship in retail services: does commitment matter? Journal of Retailing and Consumer Services, 12(2), 99–111.
Ganesan, S. (1994). Determinants of Long-Term Orientation in Buyer-Seller Relationships. Journal of Marketing, 58(2), 1.
Garson, D. (2016). Partial Least Squares:Regression and Structural Equation Models.
Getz, D. (1994). Residents’ attitudes towards tourism: A longitudinal study in Spey Valley, Scotland. Tourism Management, 15(4), 247–258.
Gil-Saura, I., Frasquet-Deltoro, M., & Cervera-Taulet, A. (2009). The value of B2B relationships. Industrial Management & Data Systems, 109(5), 593–609.
Giovanis, A., Athanasopoulou, P., & Tsoukatos, E. (2015). The role of service fairness in the service quality – relationship quality – customer loyalty chain. Journal of Service Theory and Practice, 25(6), 744–776.
Goodwin, C., & Ross, I. (1992). Consumer responses to service failures: Influence of procedural and interactional fairness perceptions. Journal of Business Research, 25(2), 149–163.
Goodwin, & Ross, I. (1989). Salient dimensions of perceived fairness in resolution of service complaints. Journal of Consumer Satisfaction, Dissatisfaction and Complaining Behavior, 2(14).
Greenberg, J. (1987). A Taxonomy of Organizational Justice Theories. Academy of Management Review, 12(1), 9–22.
Greenberg, J. (1988). Equity and workplace status: A field experiment. Journal of Applied Psychology, 73(4), 606–613.
Greenberg, J. (1990). Organizational Justice: Yesterday, Today, and Tomorrow. Journal of Management, 16(2), 399–432.
Greenberg, J. (1993). The social side of fairness: Interpersonal and informational classes of organizational justice. Justice in the Workplace: Approaching Fairness in Human Resource Management, (4), 79–103.
Grönroos, C. (1994). Quo Vadis, marketing? Toward a relationship marketing paradigm. Journal of Marketing Management, 10(5), 347–360.
Grönroos, C., & Ravald, A. (2011). Service as business logic: implications for value creation and marketing. Journal of Service Management, 22(1), 5–22.
217
Grönroos, C., & Voima, P. (2013). Critical service logic: making sense of value creation and co-creation. Journal of the Academy of Marketing Science, 41(2), 133–150.
Groth, M. (2005). Customers as Good Soldiers: Examining Citizenship Behaviors in Internet Service Deliveries. Journal of Management, 31(1), 7–27.
Groth, M., Mertens, D. P., & Murphy, R. O. (2004). Customers as good soldiers: Extending organizational citizenship behavior research to the customer domain. Handbook of Organizational Citizenship Behavior, 31(1), 415–433.
Grunert, J.-H., Khalifa, R., & Gmelin, E. (2004). [Computer-aided segmentation, form analysis and classification of 2975 breast microcalcifications using 7-fold microfocus magnification mammography]. RoFo : Fortschritte Auf Dem Gebiete Der Rontgenstrahlen Und Der Nuklearmedizin, 176(12), 1759–1765.
Guba, E. G., & Lincoln, Y. S. (1994). Competing paradigms in qualitative research. In Handbook of qualitative research. (pp. 105–117). Thousand Oaks, CA, US: Sage Publications, Inc.
Guest, D. E. (1998). Is the psychological contract worth taking seriously? Journal of Organizational Behavior, 19(S1), 649–664.
Guidelines of Business Conduct for State Bank of Pakistan Karachi. (2016).
Gummerus, J., von Koskull, C., & Kowalkowski, C. (2017). Guest editorial: relationship marketing – past, present and future. Journal of Services Marketing, 31(1), 1–5.
Gundlach, G. T., Achrol, R. S., & Mentzer, J. T. (1995). The Structure of Commitment in Exchange. Journal of Marketing, 59(1), 78–92.
Guo, L., Gruen, T. W., & Tang, C. (2017). Seeing relationships through the lens of psychological contracts: the structure of consumer service relationships. Journal of the Academy of Marketing Science, 45(3), 357–376.
Guo, L., Xiao, J. J., & Tang, C. (2009). Understanding the psychological process underlying customer satisfaction and retention in a relational service. Journal of Business Research, 62(11), 1152–1159.
Hair, J. F., Black, W. C., Babin, B. J., & Anderson, R. E. (2019). Multivariate data analysis (Eighth ediiton.).
Hair, J. F., Hult, G. T. M., Ringle, C. M., & Sarstedt, M. (2017). A primer on partial least squares structural equation modeling (PLS-SEM). Los Angeles : SAGE,.
Hair, J. F., Risher, J. J., Sarstedt, M., & Ringle, C. M. (2018). When to use and how to report the results of PLS-SEM. European Business Review, 00–00.
218
Hair, J. F., Sarstedt, M., Ringle, C. M., & Mena, J. A. (2012). An assessment of the use of partial least squares structural equation modeling in marketing research. Journal of the Academy of Marketing Science, 40(3), 414–433.
Hair Jr., J. F., Matthews, L. M., Matthews, R. L., & Sarstedt, M. (2017). PLS-SEM or CB-SEM: updated guidelines on which method to use. International Journal of Multivariate Data Analysis, 1(2), 107.
Han, H., & Ryu, K. (2009). The Roles of the Physical Environment, Price Perception, and Customer Satisfaction in Determining Customer Loyalty in the Restaurant Industry. Journal of Hospitality & Tourism Research, 33(4), 487–510.
Hansen, H., Samuelsen, B. M., & Silseth, P. R. (2008). Customer perceived value in B-t-B service relationships: Investigating the importance of corporate reputation. Industrial Marketing Management, 37(2), 206–217.
Harrison-Walker, L. J. (2001). The Measurement of Word-of-Mouth Communication and an Investigation of Service Quality and Customer Commitment As Potential Antecedents. Journal of Service Research, 4(1), 60–75.
Hayes, A. F., & Preacher, K. J. (2014). Statistical mediation analysis with a multicategorical independent variable. British Journal of Mathematical and Statistical Psychology, 67(3), 451–470.
Hellier, P. K., Geursen, G. M., Carr, R. A., & Rickard, J. A. (2003). Customer repurchase intention. European Journal of Marketing, 37(11/12), 1762–1800.
Hennig-Thurau, T., Gwinner, K. P., & Gremler, D. D. (2002). Understanding Relationship Marketing Outcomes. Journal of Service Research, 4(3), 230–247.
Henseler, J. (2014). Common beliefs and reality about PLS : comments on Rönkkö and Evermann (2013). Sage Publ.
Henseler, J., & Chin, W. W. (2010). A Comparison of Approaches for the Analysis of Interaction Effects Between Latent Variables Using Partial Least Squares Path Modeling. Structural Equation Modeling: A Multidisciplinary Journal, 17(1), 82–109.
Henseler, J., Hubona, G., & Ray, P. A. (2017). Partial Least Squares Path Modeling: Updated Guidelines. In Partial Least Squares Path Modeling (pp. 19–39). Cham: Springer International Publishing.
Henseler, J., Ringle, C. M., & Sarstedt, M. (2016). Testing measurement invariance of composites using partial least squares. International Marketing Review, 33(3), 405–431.
Henseler, J., & Sarstedt, M. (2013). Goodness-of-fit indices for partial least squares path modeling. Computational Statistics, 28(2), 565–580.
Hill, N., & Brierley, J. (2017). How to Measure Customer Satisfaction. Routledge.
219
Hoffmeyer-Zlotnik, J. H. P., & Warner, U. (2014). Harmonising demographic and socio-economic variables for cross-national comparative survey research. Harmonising Demographic and Socio-Economic Variables for Cross-National Comparative Survey Research (Vol. 9789400772). Springer.
Hogan, J. E. (2001a). Expected Relationship Value: A Construct, a Methodology for Measurement, and a Modeling Technique. Industrial Marketing Management, 30(4), 339–351.
Hogan, J. E. (2001b). Expected Relationship Value, 351, 339–351.
Holbrook, M. B., & Hirschman, E. C. (1982). The Experiential Aspects of Consumption: Consumer Fantasies, Feelings, and Fun. Journal of Consumer Research, 9(2), 132.
Hu, L., & Bentler, P. M. (1999). Cutoff criteria for fit indexes in covariance structure analysis: Conventional criteria versus new alternatives. Structural Equation Modeling: A Multidisciplinary Journal, 6(1), 1–55.
Hui, C., Lee, C., & Rousseau, D. M. (2004). Psychological Contract and Organizational Citizenship Behavior in China: Investigating Generalizability and Instrumentality. Journal of Applied Psychology, 89(2), 311–321.
Hutchinson, J., Lai, F., & Wang, Y. (2009). Understanding the relationships of quality, value, equity, satisfaction, and behavioral intentions among golf travelers. Tourism Management, 30(2), 298–308.
Hwang, E., Baloglu, S., & Tanford, S. (2019). Building loyalty through reward programs: The influence of perceptions of fairness and brand attachment. International Journal of Hospitality Management, 76(May 2017), 19–28.
Itani, O. S., Kassar, A. N., & Loureiro, S. M. C. (2019). Value get, value give: The relationships among perceived value, relationship quality, customer engagement, and value consciousness. International Journal of Hospitality Management, 80(January), 78–90.
Jaakkola, E., & Alexander, M. (2014). The Role of Customer Engagement Behavior in Value Co-Creation: A Service System Perspective. Journal of Service Research, 17(3), 247–261.
Jalilvand, M. R., Salimipour, S., Elyasi, M., & Mohammadi, M. (2017). Factors influencing word of mouth behaviour in the restaurant industry. Marketing Intelligence & Planning, 35(1), 81–110.
Jin, N. (Paul), Line, N. D., & Goh, B. (2013). Experiential Value, Relationship Quality, and Customer Loyalty in Full-Service Restaurants: The Moderating Role of Gender. Journal of Hospitality Marketing & Management, 22(7), 679–700.
Jones, T., Fox, G. L., Taylor, S. F., & Fabrigar, L. R. (2010). Service customer commitment and response. Journal of Services Marketing, 24(1), 16–28.
220
Jung, N. Y., & Seock, Y.-K. (2017). Effect of service recovery on customers’ perceived justice, satisfaction, and word-of-mouth intentions on online shopping websites. Journal of Retailing and Consumer Services, 37, 23–30.
Kamran, S., & Uusitalo, O. (2019). Banks’ unfairness and the vulnerability of low-income unbanked consumers. Service Industries Journal, 39(1), 65–85.
Kashyap, V., & Sivadas, E. (2012). An exploratory examination of shared values in channel relationships. Journal of Business Research, 65(5), 586–593.
Kaura, V., Durga Prasad, C. S., & Sharma, S. (2015). Service quality, service convenience, price and fairness, customer loyalty, and the mediating role of customer satisfaction. International Journal of Bank Marketing, 33(4), 404–422.
Kim, K.-S. (2018). The effects of interpersonal attraction on service justice. Journal of Services Marketing, 32(6), 728–738.
Kim, T., Yoo, J. J. E., & Lee, G. (2012). Post-recovery customer relationships and customer partnerships in a restaurant setting. International Journal of Contemporary Hospitality Management, 24(3), 381–401.
Klanac, N. G. (2013). An integrated approach to customer value: A comprehensive-practical approach. Jbm - Journal of Business Market Management, 6(1), 22–37.
Kline, R. B. (2016). Principles and practice of structural equation modeling (4th ed.). New York: The Guilford Press.
Kock, N. (2014). Advanced Mediating Effects Tests, Multi-Group Analyses, and Measurement Model Assessments in PLS-Based SEM. International Journal of E-Collaboration, 10(1), 1–13.
Kock, N. (2015). Common Method Bias in PLS-SEM. International Journal of E-Collaboration, 11(4), 1–10.
Kock, N. (2017). Common Method Bias: A Full Collinearity Assessment Method for PLS-SEM. In Partial Least Squares Path Modeling (pp. 245–257). Cham: Springer International Publishing.
Kock, N., & Lynn, G. (2012, September 26). Lateral Collinearity and Misleading Results in Variance-Based SEM: An Illustration and Recommendations.
Konovsky, M. A. (2000). Understanding procedural justice and its impact on business organizations. Journal of Management, 26(3), 489–511.
Kotter, J. P. (1973). The Psychological Contract: Managing the Joining-up Process. California Management Review, 15(3), 91–99.
Krejcie, R. V, & Morgan, D. A. (1970). Determining Sample Size for Research Activities. Educational and Psychological Measurement, (30), 607–610.
221
Kumar, N., Scheer, L. K., & Steenkamp, J.-B. E. M. (1995). The Effects of Perceived Interdependence on Dealer Attitudes. Journal of Marketing Research, 32(3), 348.
Kwong-Kay Wong, K. (2013). Partial least squares structural equation modelling (PLS-SEM) techniques using SmartPLS. Marketing Bulletin (Vol. 24).
Kwortnik, R. J., & Han, X. (2011). The Influence of Guest Perceptions of Service Fairness on Lodging Loyalty in China. Cornell Hospitality Quarterly, 52(3), 321–332.
Lai, I. K. W. (2014). The Role of Service Quality, Perceived Value, and Relationship Quality in Enhancing Customer Loyalty in the Travel Agency Sector. Journal of Travel & Tourism Marketing, 31(3), 417–442.
Lance Frazier, M., Johnson, P. D., Gavin, M., Gooty, J., & Bradley Snow, D. (2010). Organizational Justice, Trustworthiness, and Trust: A Multifoci Examination. Group & Organization Management, 35(1), 39–76.
Lee, J. L. M., Siu, N. Y. M., & Zhang, T. J. F. (2018). The Mediating Role of Postrecovery Satisfaction in the Relationship between Justice Perceptions and Customer Attitudes. Services Marketing Quarterly, 39(1), 22–34.
Lee, N., & Lings, I. (2008). Doing business research : a guide to theory and practice. SAGE.
Leeflang, P. S. H., & Wittink, D. R. (2000). Building models for marketing decisions:: Past, present and future. International Journal of Research in Marketing, 17(2–3), 105–126.
Lengnick-Hall, C. A. (1996). Customer Contributions to Quality: A Different View of the Customer-Oriented Firm. Academy of Management Review, 21(3), 791–824.
Lengnick‐Hall, C. A., Claycomb, V. (Cindy), & Inks, L. W. (2000). From recipient to contributor: examining customer roles and experienced outcomes. European Journal of Marketing, 34(3/4), 359–383.
Leonidou, L. C. (2004). Industrial manufacturer–customer relationships: The discriminating role of the buying situation. Industrial Marketing Management, 33(8), 731–742.
Leventhal, G. S. (1976). The Distribution of Rewards and Resources in Groups and Organizations. Advances in Experimental Social Psychology, 9, 91–131.
Lind, E. A. (Edgar A., & Tyler, T. R. (1988). The social psychology of procedural justice. Plenum Press.
222
Lindgreen, A., Palmer, R., Vanhamme, J., & Wouters, J. (2006). A relationship-management assessment tool: Questioning, identifying, and prioritizing critical aspects of customer relationships. Industrial Marketing Management, 35(1), 57–71.
Little, E., & Marandi, E. (2003). Relationship marketing management. Thomson Learning.
Littlejohn, A., & Pegler, C. (2007). Preparing for blended e-learning. Routledge.
Llewellyn, N. (2001). The Role of Psychological Contracts within Internal Service Networks. The Service Industries Journal, 21(1), 211–226.
Lohmöller, J.-B. (2013). Latent variable path modeling with partial least squares. [Place of publication not identified]: Springer-Verlag Berlin An.
Lowry, P. B., & Gaskin, J. (2014). Partial Least Squares (PLS) Structural Equation Modeling (SEM) for Building and Testing Behavioral Causal Theory: When to Choose It and How to Use It. IEEE Transactions on Professional Communication, 57(2), 123–146.
Lucero, M. A., & Allen, R. E. (1994). Employee benefits: A growing source of psychological contract violations. Human Resource Management, 33(3), 425–446.
Lusch, R. F., & Brown, J. R. (1996). Interdependency, Contracting, and Relational Behavior in Marketing Channels. Journal of Marketing, 60(4), 19–38.
Lusch, R. F., & Vargo, S. L. (2006). Service-dominant logic: reactions, reflections and refinements. Marketing Theory, 6(3), 281–288.
Ma, Y., Deng, J., Hao, J., & Wu, Y. (2012). Scale Development of Customer Psychological Contract (pp. 179–183). Springer, Berlin, Heidelberg.
Macneil, I. R. (1980). Economic Analysis of Contractual Relations: Its Shortfalls and the Need for a Rich Classificatory Apparatus. Northwestern University Law Review , 75.
Malhotra, N. K. (2010). Marketing research : an applied orientation. Pearson.
Malhotra, N. K., Birks, D. F., & Wills, P. (2012). Marketing research : an applied approach.
Martin, C. L., & Bennett, N. (1996). The Role of Justice Judgments in Explaining the Relationship between Job Satisfaction and Organizational Commitment. Group & Organization Management, 21(1), 84–104.
Matos, C. A. de, Fernandes, D. V. der H., Leis, R. P., & Trez, G. (2011). A Cross-Cultural Investigation of Customer Reactions to Service Failure and Recovery. Journal of International Consumer Marketing, 23(3–4), 211–228.
223
Mattila, A. S. (2004). The impact of service failures on customer loyalty. International Journal of Service Industry Management, 15(2), 134–149.
Maxham, J. G., Netemeyer, R. G., James G. Maxham, & Netemeyer, R. G. (2002). A Longitudinal Study of Complaining Customers’ Evaluations of Multiple Service Failures and Recovery Efforts. Journal of Marketing, 66(4), 57–71.
Maxwell, S., Lee, S., Anselstetter, S., Comer, L. B., & Maxwell, N. (2009). Gender differences in the response to unfair prices: a cross‐country analysis. Journal of Consumer Marketing, 26(7), 508–515.
Mayer, R. C., & Schoorman, F. D. (1992). Predicting Participation and Production Outcomes Through a Two-Dimensional Model of Organizational Commitment. Academy of Management Journal, 35(3), 671–684.
Meckler, M., Drake, B. H., & Levinson, H. (2003). Putting Psychology Back into Psychological Contracts. Journal of Management Inquiry, 12(3), 217–228.
Mehmood, S., Rashid, Y., & Zaheer, S. (2018). Negative Word of Mouth and Online Shopping : Examining the Role of Psychological Contract Violation , Trust and Satisfaction. Pakistan Journal of Commerce and Social Sciences, 12(3), 886–908.
Meyer, J. P., Allen, N. J., & Smith, C. A. (1993). Commitment to organizations and occupations: Extension and test of a three-component conceptualization. Journal of Applied Psychology, 78(4), 538–551.
Meyer, J. P., Stanley, D. J., Herscovitch, L., & Topolnytsky, L. (2002). Affective, Continuance, and Normative Commitment to the Organization: A Meta-analysis of Antecedents, Correlates, and Consequences. Journal of Vocational Behavior, 61(1), 20–52.
Mikulić, J., & Ryan, C. (2018). Reflective versus formative confusion in SEM based tourism research: A critical comment. Tourism Management, 68, 465–469.
Mills, P. K., & Morris, J. H. (1986). Clients as “Partial” Employees of Service Organizations: Role Development in Client Participation. Academy of Management Review, 11(4), 726–735.
Millward, L. J., & Hopkins, L. J. (1998). Psychological Contracts, Organizational and Job Commitment. Journal of Applied Social Psychology, 28(16), 1530–1556.
Moliner, M. A., Sánchez, J., Rodríguez, R. M., & Callarisa, L. (2007). Perceived relationship quality and post‐purchase perceived value. European Journal of Marketing, 41(11/12), 1392–1422.
Moorman, C., Deshpandé, R., & Zaltman, G. (1993). Factors Affecting Trust in Market Research Relationships. Journal of Marketing, 57(1), 81–101.
224
Morgan, R. M., & Hunt, S. D. (1994). The Commitment-Trust Theory of Relationship Marketing. Journal of Marketing, 58(3), 20–38.
Muhammad, R., Yaqub, S., & Halim, F. (2018). Revisiting Customer Loyalty in Telecom Sector : Insights from Oliver Four-Stage Loyalty Model , EDM and Principles of Reciprocity. Journal of Marketing Management and Consumer Behavior, 2(2), 16–30.
Muzzamil Wasim, S., Naz Akhter, S., Ziaullah, M., Bright Atsu, A., & Feng, Y. (2015). Exploring the Relationship between Justice and Supply Chain Process Integration through Linkage of Trust-An Empirical Study of Pakistan. Research in Business and Management, 2(1), 89.
Nadiri, H. (2016). Diagnosing the impact of retail bank customers’ perceived justice on
their service recovery satisfaction and post-purchase behaviours: An empirical study in financial centre of middle east. Economic Research-Ekonomska Istrazivanja , 29(1), 193–216.
Namasivayam, K. (2003). The consumer as “transient employee.” International Journal of Service Industry Management, 14(4), 420–435.
Nezu, A. M., & Nezu, C. M. (2008). Evidence-based outcome research : a practical guide to conducting randomized controlled trials for psychosocial interventions. Oxford : Oxford University Press.
Ng, S., David, M. E., & Dagger, T. S. (2011). Generating positive word‐of‐mouth in the service experience. Managing Service Quality: An International Journal, 21(2), 133–151.
Nguyen, B., & Klaus, P. “Phil.” (2013). Retail fairness: Exploring consumer perceptions of fairness towards retailers’ marketing tactics. Journal of Retailing and Consumer Services, 20(3), 311–324.
Nikbin, D., Hyun, S. S., Iranmanesh, M., & Foroughi, B. (2014). Effects of Perceived Justice for Coaches on Athletes’ Trust, Commitment, and Perceived Performance: A Study of Futsal and Volleyball Players. International Journal of Sports Science & Coaching, 9(4), 561–578. https://doi.org/10.1260/1747-9541.9.4.561
Nikbin, D., Marimuthu, M., & Hyun, S. S. (2016). Influence of perceived service fairness on relationship quality and switching intention: an empirical study of restaurant experiences. Current Issues in Tourism, 19(10), 1005–1026.
Nunnally, J. C. 1924-1982, & Bernstein, I. H. (2010). Psychometric theory. New Delhi: Tata McGraw-Hill Ed.
O’Reilly, C. A., & Chatman, J. (1986). Organizational commitment and psychological attachment: The effects of compliance, identification, and internalization on prosocial behavior. Journal of Applied Psychology, 71(3), 492–499.
225
Oliver, R. L. (1980). A Cognitive Model of the Antecedents and Consequences of Satisfaction Decisions. Journal of Marketing Research, 17(4), 460–469.
Oliver, R. L., Rust, R. T., & Varki, S. (1997). Customer delight: Foundations, findings, and managerial insight. Journal of Retailing, 73(3), 311–336.
Omar, N. A., Alam, S. S., Aziz, N. A., & Nazri, M. A. (2011). Retail loyalty programs in malaysia: the relationship of equity, value, satisfaction, trust, and loyalty among cardholders / mažmeninės prekybos lojalumo programos malaizijoje: nuosavas kapitalas, vertė, pasitenkinimas, pasitikėjimas ir lojalumas. Journal of Business Economics and Management, 12(2), 332–352.
Osborne, J. W. (2007). Best Practices in Quantitative Methods. Los Angeles : SAGE Publications. Retrieved from https://www.worldcat.org/title/best-practices-in-quantitative-methods/oclc/935273806&referer=brief_results
Osterhus, T. L. (1997). Pro-Social Consumer Influence Strategies: When and how do they Work? Journal of Marketing, 61(4), 16–29.
Palmatier, R. W., Dant, R. P., Grewal, D., & Evans, K. R. (2006). Factors Influencing the Effectiveness of Relationship Marketing: A Meta-Analysis. SSRN Electronic Journal. https://doi.org/10.2139/ssrn.904647
Pansari, A., & Kumar, V. (2017). Customer engagement: the construct, antecedents, and consequences. Journal of the Academy of Marketing Science, 45(3), 294–311.
Papista, E., & Dimitriadis, S. (2019). Consumer – green brand relationships: revisiting benefits, relationship quality and outcomes. Journal of Product & Brand Management, JPBM-09-2016-1316.
Parasuraman, A., Berry, L. L., & Zeithaml, A. V. (1991). Understanding Customer Expectations of Service. Sloan Management Review, 32(3), 39–49.
Parasuraman, A., Zeithaml, V. A., & Berry, L. L. (1985). A Conceptual Model of Service Quality and Its Implications for Future Research. Journal of Marketing, 49(4), 41–50.
Paul, J., Mittal, A., & Srivastav, G. (2016). Impact of service quality on customer satisfaction in private and public sector banks. International Journal of Bank Marketing, 34(5), 606–622.
Payne, A. F., Storbacka, K., & Frow, P. (2008). Managing the co-creation of value. Journal of the Academy of Marketing Science, 36(1), 83–96.
Petzer, D. J., De Meyer-Heydenrych, C. F., & Svensson, G. (2017). Perceived justice, service satisfaction and behavior intentions following service recovery efforts in a South African retail banking context. International Journal of Bank Marketing, 35(2), 241–253.
226
Pizam, A., & Milman, A. (1993). Predicting satisfaction among first time visitors to a destination by using the expectancy disconfirmation theory. International Journal of Hospitality Management, 12(2), 197–209.
Podsakoff, P. M., Mackenzie, S. B., Lee, J., & Podsakoff, N. P. (2003). Common Method Biases in Behavioral Research : A Critical Review of the Literature and Recommended Remedies, 88(5), 879–903.
Raja, U., Johns, G., & Ntalianis, F. (2004). The Impact of Personality on Psychological Contracts. Academy of Management Journal, 47(3), 350–367.
Reinartz, W., Haenlein, M., & Henseler, J. (2009). An empirical comparison of the efficacy of covariance-based and variance-based SEM. International Journal of Research in Marketing, 26(4), 332–344.
Rigdon, E. E., Sarstedt, M., & Ringle, C. M. (2017). On Comparing Results from CB-SEM and PLS-SEM: Five Perspectives and Five Recommendations. Marketing ZFP, 39(3), 4–16.
Ringle, C. M., Sarstedt, M., Mitchell, R., & Gudergan, S. P. (2018). Partial least squares structural equation modeling in HRM research. The International Journal of Human Resource Management, 1–27.
Ringle, C. M., Sarstedt, M., & Straub, D. (2012). A Critical Look at the Use of PLS-SEM in MIS Quarterly.
Ringle, C., Sarstedt, M., Mitchell, R., & Gudergan, S. (2018). Partial least squares structural equation modeling in HRM research. The International Journal of Human Resource Management.
Rintamäki, T., Kanto, A., Kuusela, H., & Spence, M. T. (2006). Decomposing the value of department store shopping into utilitarian, hedonic and social dimensions. International Journal of Retail & Distribution Management, 34(1), 6–24.
Robinson, S. L., & Morrison, E. W. (1995). Psychological contracts and organizational citizenship behavior: The effect of unfulfilled obligations on civic virtue behavior. Journal of Organizational Behavior, 16(3), 289–298.
Robinson, S. L., & Rousseau, D. M. (1994). Violating the psychological contract: Not the exception but the norm. Journal of Organizational Behavior, 15(3), 245–259.
Robinson, S. L., & Wolfe Morrison, E. (2000). The development of psychological contract breach and violation: a longitudinal study. Journal of Organizational Behavior, 21(5), 525–546.
Romero, J. (2017). Customer Engagement Behaviors in Hospitality: Customer-Based Antecedents. Journal of Hospitality Marketing & Management, 26(6), 565–584.
227
Rousseau, D. M. (1989). Psychological and implied contracts in organizations. Employee Responsibilities and Rights Journal, 2(2), 121–139.
Rousseau, D. M. (1995). Psychological Contracts in Organizations: Understanding Written and Unwritten Agreements. 2455 Teller Road, Thousand Oaks California 91320 United States: SAGE Publications, Inc.
Rousseau, D. M., & Tijoriwala, S. A. (1998). Assessing psychological contracts: issues, alternatives and measures. Journal of Organizational Behavior, 19(S1), 679–695.
Roy, S. K., Balaji, M. S., Soutar, G., Lassar, W. M., & Roy, R. (2018). Customer engagement behavior in individualistic and collectivistic markets. Journal of Business Research, 86, 281–290.
Roy, S. K., Devlin, J. F., & Sekhon, H. (2015). The impact of fairness on trustworthiness and trust in banking. Journal of Marketing Management, 31(9–10), 996–1017.
Roy, S. K., Eshghi, A., & Sarkar, A. (2013). Antecedents and consequences of brand love. Journal of Brand Management, 20(4), 325–332.
Roy, S. K., Shekhar, V., Lassar, W. M., & Chen, T. (2018). Customer engagement behaviors: The role of service convenience, fairness and quality. Journal of Retailing and Consumer Services, 44(July), 293–304.
Ruel, E. E., Wagner, W. E. (William E., & Gillespie, B. J. (2016). The practice of survey research : theory and applications. Los Angeles; London ;;New Delhi ;;Washington DC; Boston: SAGE.
Ruiz-Molina, M.-E., Gil-Saura, I., & Moliner-Velázquez, B. (2015). Relational Benefits, Value, and Satisfaction in the Relationships Between Service Companies. Journal of Relationship Marketing, 14(1), 1–15.
Ryu, K., & Han, H. (2010). Influence of the Quality of Food, Service, and Physical Environment on Customer Satisfaction and Behavioral Intention in Quick-Casual Restaurants: Moderating Role of Perceived Price. Journal of Hospitality & Tourism Research, 34(3), 310–329.
Ryu, K., & Lee, J.-S. (2017). Examination of Restaurant Quality, Relationship Benefits, and Customer Reciprocity From the Perspective of Relationship Marketing Investments. Journal of Hospitality & Tourism Research, 41(1), 66–92.
S. Davcik, N. (2014). The use and misuse of structural equation modeling in management research. Journal of Advances in Management Research, 11(1), 47–81.
Saleem, M. A., Yaseen, A., & Wasaya, A. (2018). Drivers of customer loyalty and word of mouth intentions: moderating role of interactional justice. Journal of Hospitality Marketing and Management, 27(8), 877–904.
228
Saleem, M. A., Zahra, S., Ahmad, R., & Ismail, H. (2016). Predictors of customer loyalty in the Pakistani banking industry: a moderated-mediation study. International Journal of Bank Marketing, 34(3), 411–430.
Saleem, M. A., Zahra, S., & Yaseen, A. (2017). Impact of service quality and trust on repurchase intentions – the case of Pakistan airline industry. Asia Pacific Journal of Marketing and Logistics, 29(5), 1136–1159.
Saleh, M. A., Quazi, A., Keating, B., & Gaur, S. S. (2017). Quality and image of banking services: a comparative study of conventional and Islamic banks. International Journal of Bank Marketing, 35(6), 878–902.
Sarstedt, M., Diamantopoulos, A., & Salzberger, T. (2016). Should we use single items? Better not. Journal of Business Research, 69(8), 3199–3203.
Sarstedt, M., Ringle, C. M., Cheah, J.-H., Ting, H., Moisescu, O. I., & Radomir, L. (2019). Structural model robustness checks in PLS-SEM. Tourism Economics, 135481661882392.
Sarstedt, M., Schwaiger, M., & Taylor, C. R. (2011). Measurement and research methods in international marketing. Bingley, U.K. : Emerald. Retrieved from https://www.worldcat.org/title/measurement-and-research-methods-in-international-marketing/oclc/763157185&referer=brief_results
Saunders, M. N. K., & Lewis, P. (2018). Doing Research in Business and Management (Second edition.). Retrieved from https://www.worldcat.org/title/doing-research-in-business-and-management-an-essential-guide-to-planning-your-project/oclc/ 1019802656&referer=brief_results
Schneider, B., & Bowen, D. (1999). Understanding Customer Delight and Outrage. Sloan Management Review, 4(1), 35–46.
Schreiber, J. B., Nora, A., Stage, F. K., Barlow, E. A., & King, J. (2006). Reporting Structural Equation Modeling and Confirmatory Factor Analysis Results: A Review. The Journal of Educational Research, 99(6), 323–338.
Schurr, P. H., & Ozanne, J. L. (1985). Influences on Exchange Processes: Buyers’ Preconceptions of a Seller’s Trustworthiness and Bargaining Toughness. Journal of Consumer Research, 11(4), 939.
Seiders, K., & Berry, L. L. (1998). Service fairness: What it is and why it matters. Academy of Management Perspectives, 12(2), 8–20.
Shaikh Rafiqul Islam, & Selvan a/l Perumal. (2018). Fairness and Relationship Commitment link in Developing Economy Context: Critical Evaluation with PLS-SEM Analysis Technique. Transylvanian Review, 1(1).
Shani, D., & Chalasani, S. (1992). Exploiting Niches Using Relationship Marketing. Journal of Consumer Marketing, 9(3), 33–42.
229
Sheppard, B. H., Lewicki, R. J., & Minton, J. W. (1992). Organizational justice : the search for fairness in the workplace. Lexington Books.
Sheth, J. N., & Parvatiyar, A. (1995). The evolution of relationship marketing. International Business Review, 4(4), 397–418.
Shi, G., Bu, H., Ping, Y., Tingchi Liu, M., & Wang, Y. (2016). Customer relationship investment and relationship strength: evidence from insurance industry in China. Journal of Services Marketing, 30(2), 201–211.
Shmueli, G., Ray, S., Velasquez Estrada, J. M., & Chatla, S. B. (2016). The elephant in the room: Predictive performance of PLS models. Journal of Business Research, 69(10), 4552–4564.
Smith, A. K., Bolton, R. N., & Wagner, J. (1999). A Model of Customer Satisfaction with Service Encounters Involving Failure and Recovery. Journal of Marketing Research, 36(3), 356–372.
So, K. K. F., King, C., Sparks, B. A., & Wang, Y. (2016). The Role of Customer Engagement in Building Consumer Loyalty to Tourism Brands. Journal of Travel Research, 55(1), 64–78.
Soedarmono, W., Machrouh, F., & Tarazi, A. (2013). Bank competition, crisis and risk taking: Evidence from emerging markets in Asia. Journal of International Financial Markets, Institutions and Money, 23, 196–221.
State Bank of Pakistan. (2007). Statistics on scheduled banks in Pakistan. In Statistics & Data Warehouse Department.
State Bank of Pakistan. (2017). Statistics on scheduled banks in Pakistan, (June).
Steensma, H., & Milligen, F. van. (2005). Bases of Power, Procedural Justice and Outcomes of Mergers: the Push and Pull Factors of Influence Tactics. Journal of Collective Negotiations (Formerly Journal of Collective Negotiations in the Public Sector), 30(2), 113–134.
Storbacka, K., Strandvik, T., & Grönroos, C. (1994). Managing Customer Relationships for Profit: The Dynamics of Relationship Quality. International Journal of Service Industry Management, 5(5), 21–38.
Su, L., & Hsu, M. K. (2013). Service Fairness, Consumption Emotions, Satisfaction, and Behavioral Intentions: The Experience of Chinese Heritage Tourists. Journal of Travel & Tourism Marketing, 30(8), 786–805.
Su, L., Hsu, M. K., & Swanson, S. (2017). The Effect of Tourist Relationship Perception on Destination Loyalty at a World Heritage Site in China. Journal of Hospitality & Tourism Research, 41(2), 180–210.
230
Su, L., Huang, S. (Sam), & Chen, X. (2015). Effects of Service Fairness and Service Quality on Tourists’ Behavioral Intentions and Subjective Well-Being. Journal of Travel & Tourism Marketing, 32(3), 290–307.
Su, L., Swanson, S. R., & Chen, X. (2016). The Impact of Perceived Service Fairness and Quality on the Behavioral Intentions of Chinese Hotel Guests: the Mediating Role of Consumption Emotions. Journal of Travel & Tourism Marketing, 33(sup1), 88–102.
Sullivan, J., & Peterson, R. B. (1982). Factors Associated with Trust in Japanese-American Joint Ventures. Management International Review. Springer.
Taneja, S., Srivastava, R., & Ravichandran, N. (2015). Consequences of Performance Appraisal Justice Perception: A Study of Indian Banks. IUP Journal of Organizational Behavior, 14(3), 33.
Tat Keh, H., & Wei Teo, C. (2001). Retail customers as partial employees in service provision: a conceptual framework. International Journal of Retail & Distribution Management, 29(8), 370–378.
Tax, S. S., Brown, S. W., & Chandrashekaran, M. (1998). Customer Evaluations of Service Complaint Experiences: Implications for Relationship Marketing. Journal of Marketing, 62(2), 60–76.
Temme, D., & Diamantopoulos, A. (2016). Higher-order models with reflective indicators. Journal of Modelling in Management, 11(1), 180–188.
Trochim, W. M. K., Donnelly, J. P., & Arora, K. (2016). Research methods : the essential knowledge base. Boston MA: Cengage Learning.
Tyler, T. R., & Blader, S. L. (2003). The Group Engagement Model: Procedural Justice, Social Identity, and Cooperative Behavior. Personality and Social Psychology Review, 7(4), 349–361.
Tyler, T. R., Orwin, R., & Schurer, L. (1982). Defensive Denial and High Cost Prosocial Behavior. Basic and Applied Social Psychology, 3(4), 267–281.
Ulaga, W., & Chacour, S. (2001). Measuring Customer-Perceived Value in Business Markets: A Prerequisite for Marketing Strategy Development and Implementation. Industrial Marketing Management, 30(6), 525–540.
Ulaga, W., & Eggert, A. (2006). Relationship value and relationship quality. European Journal of Marketing, 40(3/4), 311–327.
Ulrich, D., & Barney, J. B. (1984). Perspectives in Organizations: Resource Dependence, Efficiency, and Population. Academy of Management Review, 9(3), 471–481.
231
Um, K. H., & Kim, S. M. (2018). Application of Fairness Theory to Medical Tourists’ Dissatisfaction and Complaint Behaviors: The Moderating Role of Patient Participation in Medical Tourism. Journal of Social Service Research, 8376, 1–18.
van Doorn, J., Lemon, K. N., Mittal, V., Nass, S., Pick, D., Pirner, P., & Verhoef, P. C. (2010). Customer Engagement Behavior: Theoretical Foundations and Research Directions. Journal of Service Research, 13(3), 253–266.
Van Dyne, L., Graham, J. W., & Dienesch, R. M. (1994). Organizational Citizenship Behavior: Construct Redefinition, Measurement, and Validation. Academy of Management Journal, 37(4), 765–802.
van Tonder, E., & Petzer, D. J. (2018). The interrelationships between relationship marketing constructs and customer engagement dimensions. The Service Industries Journal, 38(13–14), 948–973.
Vargo, S. L., & Lusch, R. F. (2004). Evolving to a New Dominant Logic for Marketing. Journal of Marketing, 68(1), 1–17.
Vargo, S. L., & Lusch, R. F. (2008). Service-dominant logic: continuing the evolution. Journal of the Academy of Marketing Science, 36(1), 1–10.
Vargo, S. L., Maglio, P. P., & Akaka, M. A. (2008). On value and value co-creation: A service systems and service logic perspective. European Management Journal, 26(3), 145–152.
Verhoef, P. C. (2003). Understanding the Effect of Customer Relationship Management Efforts on Customer Retention and Customer Share Development. Journal of Marketing, 67(4), 30–45.
Verleye, K., Gemmel, P., & Rangarajan, D. (2014). Managing Engagement Behaviors in a Network of Customers and Stakeholders. Journal of Service Research, 17(1), 68–84.
Vivek, S. D., Beatty, S. E., & Morgan, R. M. (2012). Customer Engagement: Exploring Customer Relationships Beyond Purchase. Journal of Marketing Theory and Practice, 20(2), 122–146.
Wanous, J. P. (1977). Organizational entry: Newcomers moving from outside to inside. Psychological Bulletin, 84(4), 601–618.
Waqas, M., Ali, H., & Khan, M. A. (2014). An investigation of effects of justice recovery dimensions on students’ satisfaction with service recovery in higher education environment. International Review on Public and Nonprofit Marketing, 11(3), 263–284.
Webster, F. E. (1992). The Changing Role of Marketing in the Corporation. Journal of Marketing, 56(4), 1–17.
232
Wei, W., Hua, N., Fu, X., & Guchait, P. (2017). The impacts of hotels’ error management culture on customer engagement behaviors (CEBs). International Journal of Contemporary Hospitality Management, 29(12), 3119–3137.
Westbrook, R. A., & Oliver, R. L. (1981). Developing Better Measures of Consumer Satisfaction: Some Preliminary Results. ACR North American Advances, NA-08. Retrieved from http://www.acrwebsite.org/search/view-conference-proceedings. aspx?Id=9791
Wilson, D. T. (1995). An Integrated Model of Buyer-Seller Relationships. Journal of the Academy of Marketing Science, 23(4), 335–345.
Wilson, J. (2010). Essentials of Business Research : a Guide to Doing Your Research Project. Sage Publications. Retrieved from https://books.google.com.pk/books/ about/Essentials_of_Business_Research.html?id=BnFymS0cjLsC&redir_esc=y
Wong, K. K. (2016). TECHNICAL NOTE : Mediation analysis , categorical moderation analysis , and higher-order constructs modeling in Partial Least Squares Structural Equation Modeling ( PLS-SEM ): A B2B Example using SmartPLS, (May).
Woodruff, R. B. (1997). Customer value: The next source for competitive advantage. Journal of the Academy of Marketing Science, 25(2), 139–153.
Wu, S.-H., Huang, S. C.-T., Tsai, C.-Y. D., & Lin, P.-Y. (2017). Customer citizenship behavior on social networking sites. Internet Research, 27(2), 428–448.
Xia, L., Monroe, K. B., Cox, J. L., Lan Xia, Kent B. Monroe, & Cox, J. L. (2004). The Price is Unfair! A Conceptual Framework of Price Fairness Perceptions. Journal of Marketing, 68(4), 1–15.
Xu, X., Liu, W., & Gursoy, D. (2018). The Impacts of Service Failure and Recovery Efforts on Airline Customers’ Emotions and Satisfaction. Journal of Travel Research, 004728751878928.
Xue, M., & Harker, P. T. (2002). Customer Efficiency. Journal of Service Research, 4(4), 253–267.
Ye, Q., Li, H., Wang, Z., & Law, R. (2014). The Influence of Hotel Price on Perceived Service Quality and Value in E-Tourism. Journal of Hospitality & Tourism Research, 38(1), 23–39.
Yeoman, R., & Mueller Santos, M. (2016). Fairness and Organizational Performance: Insights for Supply Chain Management. SSRN Electronic Journal.
Yi, Y., & Gong, T. (2008). The effects of customer justice perception and affect on customer citizenship behavior and customer dysfunctional behavior. Industrial Marketing Management, 37(7), 767–783.
233
Yi, Y., & Gong, T. (2013). Customer value co-creation behavior: Scale development and validation. Journal of Business Research, 66(9), 1279–1284.
Yi, Y., & Nassen, K. (2015). Multiple Comparison and Cross-Validation in Evaluating Structural Equation Models (pp. 407–411). Springer, Cham.
Yoong, L. C., Lian, S. B., & Subramaniam, M. (2017). Relationship Value and Relationship Quality: An Exploration of Its Antecedents on Customer Loyalty. Asian Social Science, 13(12), 51.
Youssef, Y. M. A., Johnston, W. J., AbdelHamid, T. A., Dakrory, M. I., & Seddick, M. G. S. (2018). A customer engagement framework for a B2B context. Journal of Business & Industrial Marketing, 33(1), 145–152.
Zameer, H., Tara, A., Kausar, U., & Mohsin, A. (2015). Impact of service quality, corporate image and customer satisfaction towards customers’ perceived value in the banking sector in Pakistan. International Journal of Bank Marketing, 33(4), 442–456.
Zeithaml, V. A. (1988). Consumer Perceptions of Price, Quality, and Value: A Means-End Model and Synthesis of Evidence. Journal of Marketing, 52(3), 2–22.
Zhu, Y., & Chen, H. (2012). Service fairness and customer satisfaction in internet banking. Internet Research, 22(4), 482–498.
Ziaullah, M., Feng, Y., & Akhter, S. N. (2017). How does justice matter in online retailers’ reputation and purchase intentions: an empirical study of China. Behaviour and Information Technology, 36(1), 85–94.
Ziaullah, M., Yi, F., & Akhter, S. N. (2017). The synergistic and complementary effects of supply chain justice and integration practices on supply chain performance: A conceptual framework and research propositions. South African Journal of Economic and Management Sciences, 18(4), 519–533.
Zoghbi-Manrique-de-Lara, P., Suárez-Acosta, M. A., & Guerra-Báez, R. M. (2017). Customer citizenship as a reaction to hotel’s fair treatment of staff: Service satisfaction as a mediator. Tourism and Hospitality Research, 17(2), 190–203.
234
Appendix- A
Covering letter for participants of final survey
Dear Participant,
Thank you for agreeing to participate in the survey. This survey is part of my doctoral
degree requirements in management sciences at Iqra National University Peshawar in
which I am conducting a study on how consumer judgments about service fairness
formed during service delivery process translate into consumer voluntary performance
through sustained service relationships, looking particularly at banking sector. This
survey seeks to discover insights about service fairness, customer-bank relationships
and customer voluntary performance from a consumer’s perspective. The results of this
study will be used to offer direction to banking executives which will allow them to
develop better service strategies and build a mutually beneficial service relationship
with customers in terms of service fairness. Therefore, your opinions, perceptions, and
experiences with this bank will contribute to advancing knowledge within the area of
consumer protection and relationship marketing.
Your honest opinion will have a profound impact on the results of this study as there no
right or wrong answers nor good or bad ones. In addition, your personal information
and opinions in response to this survey will be treated as anonymous and will be used
purely for academic research purposes only. Therefore, it highly desirable that your
answer represent true reflection of your experience with this bank.
Thank you in advance for your time and participation. Your opinions are greatly
appreciated and valuable to my research.
Sincerely,
Waseem Khan
PhD Scholar,
Iqra National University Peshawar
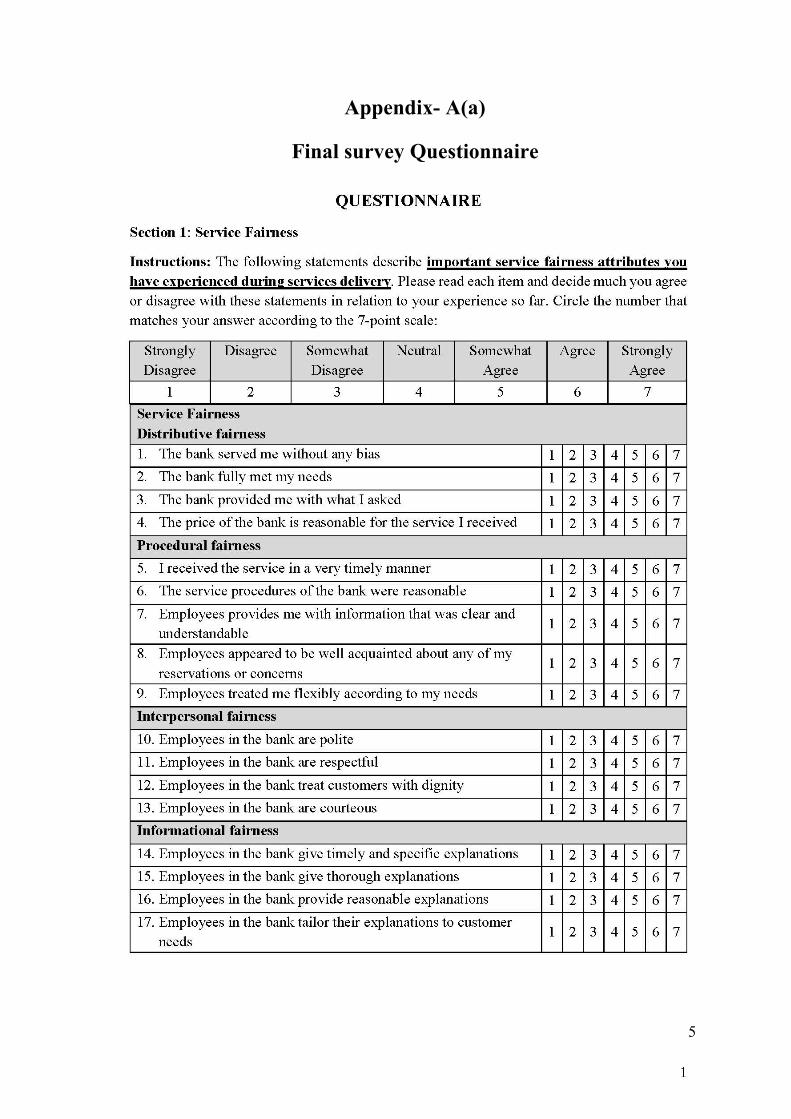
235
Appendix- A(a)
Final survey Questionnaire
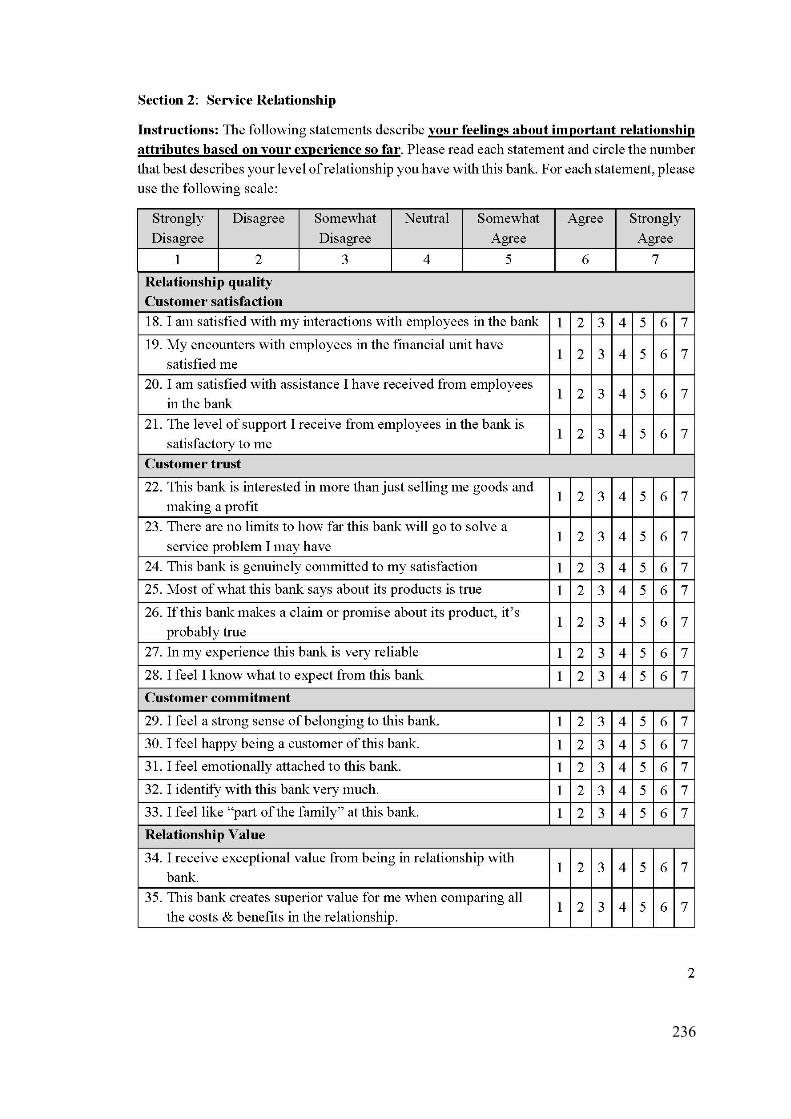
236
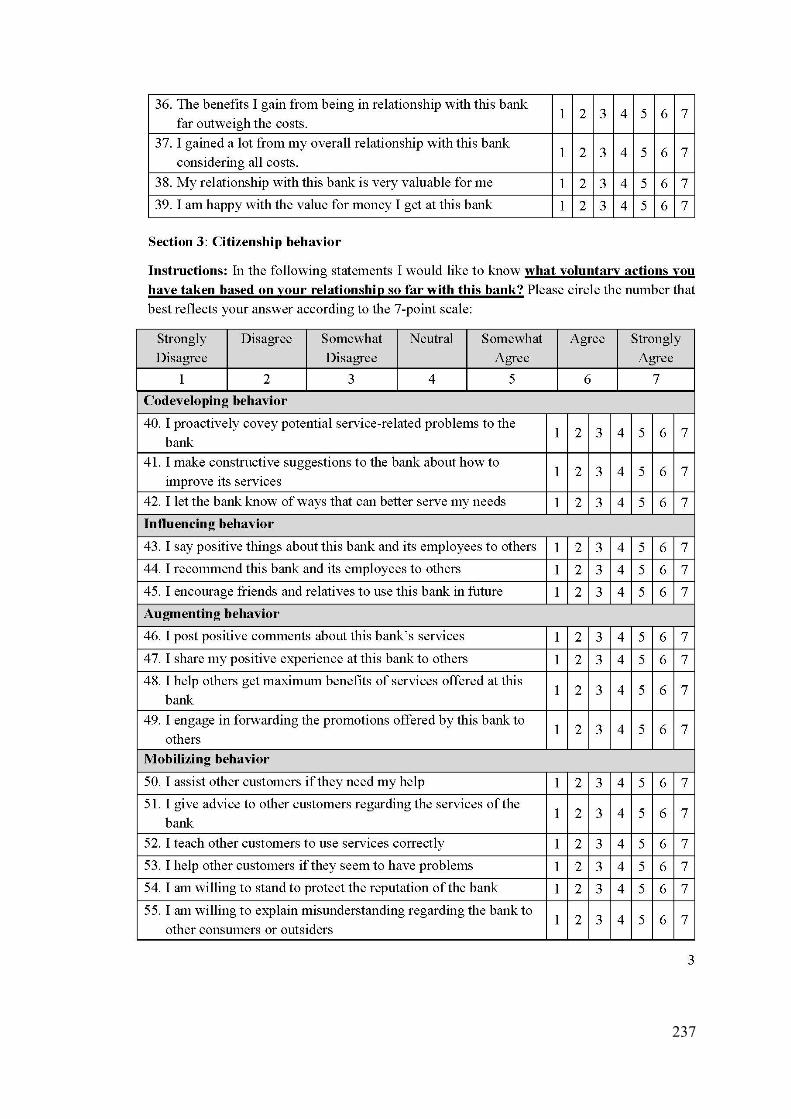
237
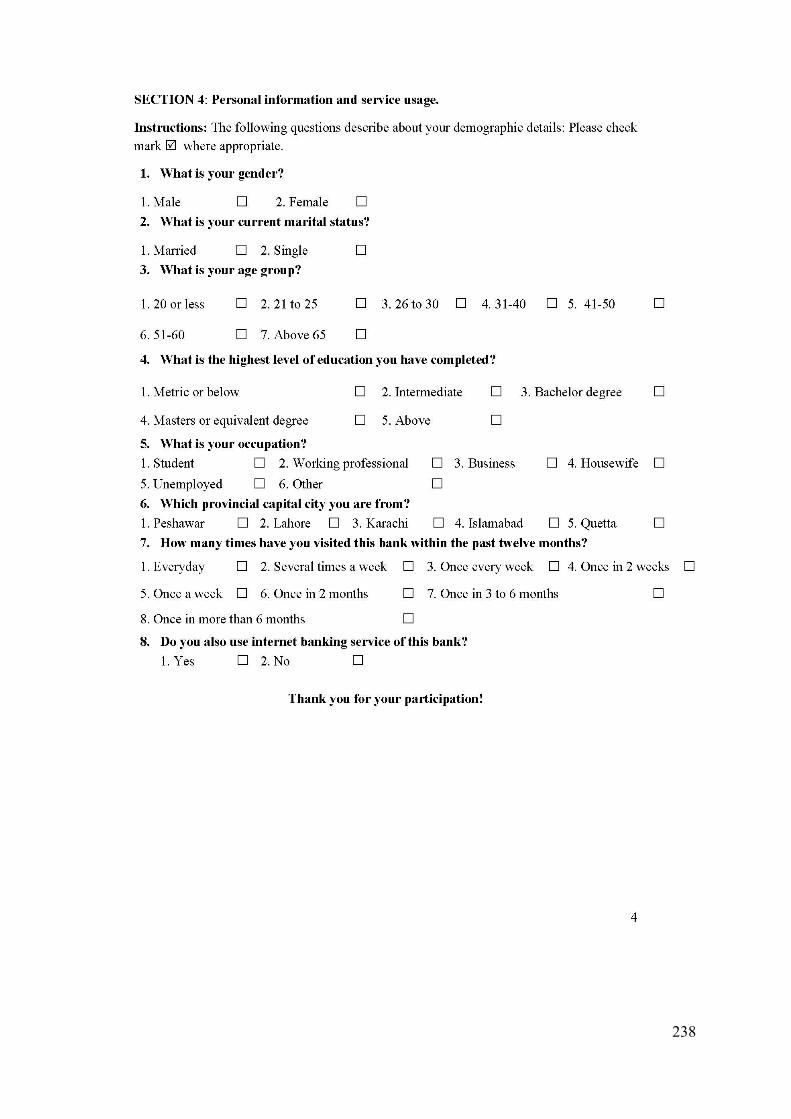
238

239
Appendix-B
Translated version of Questionnaire کاء م �ش مح�ت
اسالم عل�کم!
ی اقراۂ ن�شنل یونیورسیٹ �شاور � �و� منی آپ � ق�میت وقت دی�ن کا بہت شک��ہ، یہ �و� م�ی
ن کا بینکنگ ا مطالعہ صارفنی وری �� جس منی م�ی مینجمنٹ سائن�ن منی ئپ ایچ ڈی ڈ�ری � حصول ک�ل�ئ �ن
ار تعلقات اور بینک خدمات � دوران عدل و انصاف � انداز� اور اس � نتی�ب منی بینک � ساتھ استو
۔ اس مطالعہ کا مقصد عدل و انصاف پر مبین خدمات، صارف اور بینک � ک�ل�ئ رضا�ارانہ افعال پر مبین ��
) � تناظر � در�افت کرنا ن ن � صوابد�دی افعال � متعلق تاثر ات ان� (صارفنی درم�ان روابط اور صارفنی
۔ بینک � اع� اف�ان اس مطال� � نتائج � ر�نمائئ حاصل کر� مف�د �وس تداب�ی بنا سک�ت مقصود ہنی
ن � ساتھ باہ� مف�د اور بہ�ت تعلقات استوار ہنی جس منی عدل و انصاف کو ملحوظ رکھ�ت ہو� وە صارفنی
ن � کر سک�ت ہنی ۔اسل�ی اس بینک � ساتھ منسل� آپ � خ�االت، را�ئ اور تج��ات � اظہار � 'صارفنی
۔ �و� منی کوئئ ' اور 'تعلقات عامہ' � وا�ستہ شعبوں منی مفاد � تحفظگ
علم کو فروغ دی�ن منی مدد م� �
جواب غلط صحیح، اچھا �ا برا تصور نہنی ہو گا البتہ آپ � مخلصانہ را�ئ اس مطال� � نتائج کو �ب حد
متاثر کر سکیت ہنی ۔
اور �ف و اس �و� � مد منی آپ � ذائت معلومات اور اس � عالوە، گ
را�ئ صغہ راز منی رک� جائیں�
وری �� کہ آپ � را� اس بینک ۔ لہذا، یہ انتہائئ �نگ
�ف تعل�� ر��چ مقاصد ک�ل�ئ استعمال � جائیں�
� ساتھ آپ � � حق��ت تجر�ب کا عکاس ہو۔
کت � ل�ئ پہ� �� مشکور ہوں. آپ � را�ئ اس مطال� کی�ئ اتہا ۂی گراں قدر اور قابل آپ � وقت اور �ش
۔ تع��ف ��
آپ کا مخلص،
وس�م خان
ئپ ایچ ڈی سکالر؛
اقراۂ ن�شنل یونیوسیٹ �شاور
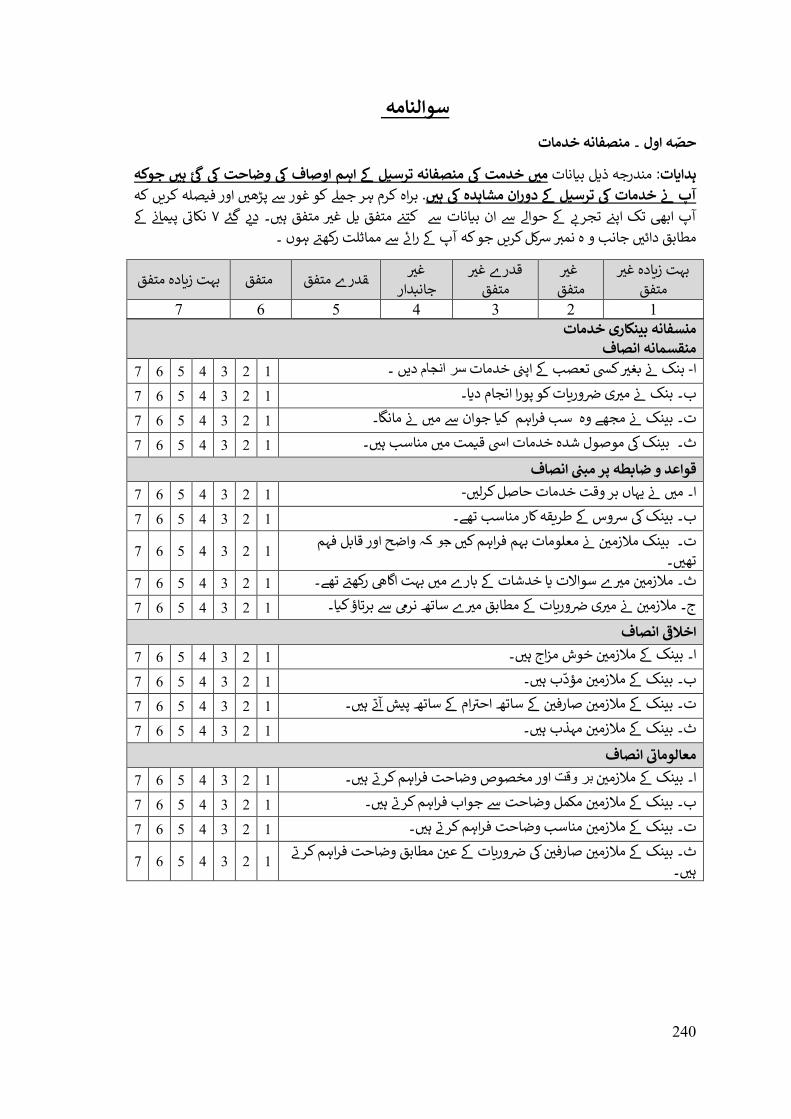
240
سوالنامہ خدمات منصفانہ۔ حّصہ اول
ئ وضاحت � اوصافاہم ترس�ل � منصفانہ خدمت � مںی انات�ب ل�: مندرجہ ذات�ہدا گ کہ جو ںی ہ� �
کہ ں�ک� صلہ�اور ف نی پڑھ جم� کو غور �براە کرم ہر . ہںی � مشاہدە� دوران ل�ترس آپ �ن خدمات �� ما�ن � پ نکائت ۷ د�ی گ�ئ ۔نی ہ �ل غ�ی متفق متفقکت�ن � انات�ان ب حوا� �تک اپ�ن تجر�ب � آپ اب�
ہوں ۔ � مماثلت رکھ�ت را�ئ آپ � ہجو ک ں�نم�ب �کل ک� ە و مطابق دائنی جانب
غ�ی ادە�بہت ز متفق
غ�ی متفق
غ�ی قدر� متفق
غ�ی متفق ادە�بہت ز متفق متفق قدر� جانبدار
1 2 3 4 5 6 7 منسفانہ بینکاری خدمات
منقسمانہ انصاف دیں ۔ سر انجام بنک �ن بغ�ی ک� تعصب � اپین خدمات -ا 1 2 3 4 5 6 7
ور�ات کو پورا انجام د�ا۔ 1 2 3 4 5 6 7 ی �ن ب۔ بنک �ن م�ی
ت۔ بینک �ن مجھ� وە سب فراہم ک�ا جوان � منی �ن مانگا۔ 1 2 3 4 5 6 7
۔ 1 2 3 4 5 6 7 ث۔ بینک � موصول شدە خدمات ا� ق�مت منی مناسب ہنی
انصافقواعد و ضابطہ پر مبین
-ا۔ منی �ن یہاں بر وقت خدمات حاصل کرلنی 1 2 3 4 5 6 7
ب۔ بینک � �وس � ط��قہ کار مناسب تھ�۔ 1 2 3 4 5 6 7
ن �ن معلومات بہم فراہم کنی 1 2 3 4 5 6 7 واضح اور قابل فہم جو کہت۔ بینک مالزمنی۔ تھنی
� سواالت �ا خدشات � بار� منی بہت ا�ا� رکھ�ت تھ�۔ ث۔ 1 2 3 4 5 6 7 ن م�ی مالزمنی
� ساتھ نر� � برتاؤ ک�ا۔ 1 2 3 4 5 6 7 ور�ات � مطابق م�ی ی �ن ن �ن م�ی ج۔ مالزمنی
اخال�ق انصاف
۔ 1 2 3 4 5 6 7 ن خوش مزاج ہنی ا۔ بینک � مالزمنی
۔ 1 2 3 4 5 6 7 ن مؤّدب ہنی ب۔ بینک � مالزمنی
۔ 1 2 3 4 5 6 7 ام � ساتھ پ�ش آ�ت ہنی ن � ساتھ اح�ت ن صارفنی ت۔ بینک � مالزمنی
ن 1 2 3 4 5 6 7 ۔ ث۔ بینک � مالزمنی مہذب ہنی
معالومایق انصافن 1 2 3 4 5 6 7 ۔ بر وقتا۔ بینک � مالزمنی اور مخصوص وضاحت فراہم کر�ت ہنی
ن مکمل وضاحت � 1 2 3 4 5 6 7 ۔ ب۔ بینک � مالزمنی جواب فراہم کر�ت ہنی
۔ 1 2 3 4 5 6 7 ن مناسب وضاحت فراہم کر�ت ہنی ت۔ بینک � مالزمنی
ور�ات 1 2 3 4 5 6 7 ن � �ن ن صارفنی ن مطابق وضاحت فراہم کر�ت ث۔ بینک � مالزمنی � عنی۔ ہنی
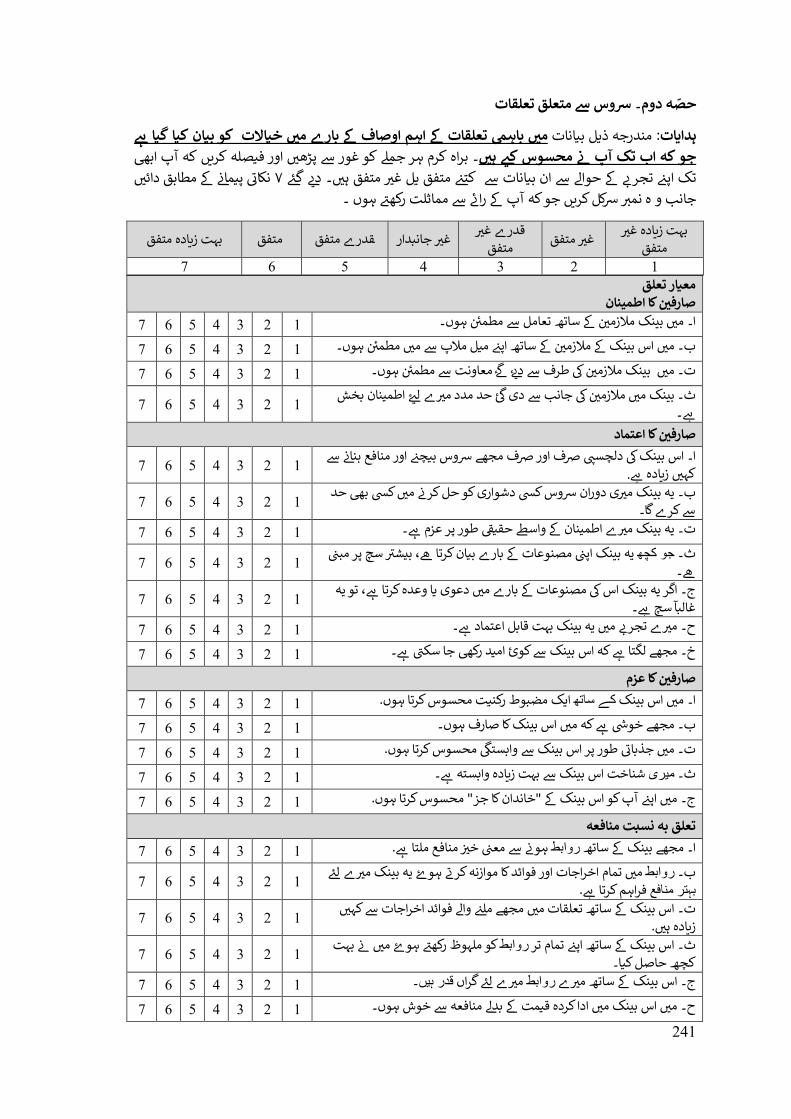
241
�وس � متعلق تعلقات۔ حّصہ دوم
�� خ�االت کو ب�ان ک�ا گ�ا � بار� مںی اوصافاہم باہ� تعلقات � مںی انات�ب ل�: مندرجہ ذات�ہدا کہ آپ اب� ں�ک� صلہ�اور ف نی پڑھ جم� کو غور �براە کرم ہر ۔ جو کہ اب تک آپ �ن محسوس ک�ی ہںی
مطابق دائنی � ما�ن � پ نکائت ۷ د�ی گ�ئ ۔نی ہ �ل غ�ی متفق متفق کت�ن � انات�ان ب حوا� �تک اپ�ن تجر�ب � ہوں ۔ � مماثلت رکھ�ت را�ئ آپ � ہجو ک ں�نم�ب �کل ک� ە و جانب
غ�ی ادە�بہت ز غ�ی قدر� غ�ی متفق متفق
متفق ادە�بہت ز متفق متفق قدر� غ�ی جانبدار متفق
1 2 3 4 5 6 7 مع�ار تعلق
ن کا اطمینان صارفںین � ساتھ 1 2 3 4 5 6 7 ن ہوں۔ ا۔ منی بینک مالزمنی تعامل � مطمنئ
ن ہوں۔ 1 2 3 4 5 6 7 ن � ساتھ اپ�ن م�ل مالپ � منی مطمنئ ب۔ منی اس بینک � مالزمنی
ن ہوں۔ 1 2 3 4 5 6 7 ئ معاونت � مطمنئگ
ئ � ن � طرف � د�ی ت۔ منی بینک مالزمنی
ئ 1 2 3 4 5 6 7 � ل�ی ئ حد مدد م�ی گن � جانب � دی � اطمینان بخش ث۔ بینک منی مالزمنی
۔ �� ن کا اعتماد صارفںی
ا۔ اس بینک � دلچسیپ �ف اور �ف مجھ� �وس ب�چ�ن اور منافع بنا�ن � 1 2 3 4 5 6 7 .کہنی ز�ادە ��
ی دوران �وس ک� دشواری کو حل کر�ن منی ک� ب� حد 1 2 3 4 5 6 7 ب۔ یہ بینک م�ی � کر� گا۔
7 6 5 4 3 2 1 � ۔ ت۔ یہ بینک م�ی اطمینان � واس� حق��ت طور پر عزم ��
یہ بینک اپین مصنوعات � بار� ب�ان کرتا �، ب�ش�ت سچ پر مبین جو کچھث۔ 1 2 3 4 5 6 7 �۔
، تو یہ 1 2 3 4 5 6 7 ج۔ ا�ر یہ بینک اس � مصنوعات � بار� منی دعوی �ا وعدە کرتا ��۔ غالبآ سچ ��
7 6 5 4 3 2 1 � ۔ ح۔ م�ی تجر�ب منی یہ بینک بہت قابل اعتماد ��
۔ 1 2 3 4 5 6 7 خ۔ مجھ� لگتا �� کہ اس بینک � کوئ ام�د رک� جا سکیت ��
ن کا عزم صارفںی
ا�ک مضبوط رکن�ت محسوس کرتا ہوں. کے ساتھا۔ منی اس بینک 1 2 3 4 5 6 7
ہوں۔ ب۔ مجھ� خو�ش �� کہ منی اس بینک کا صارف 1 2 3 4 5 6 7
محسوس کرتا ہوں. 1 2 3 4 5 6 7گ
ت۔ منی جذبائت طور پر اس بینک � وا�ست�
۔ میریث۔ 1 2 3 4 5 6 7 شناخت اس بینک � بہت ز�ادە وا�ستہ ��
ج۔ منی اپ�ن آپ کو اس بینک � "خاندان کا جز" محسوس کرتا ہوں. 1 2 3 4 5 6 7
تعلق بہ �سبت منافعہ
. روابطا۔ مجھ� بینک � ساتھ 1 2 3 4 5 6 7 ن منافع ملتا �� ہو�ن � معین خ�ی
� ل�ئ روابط ب۔ 1 2 3 4 5 6 7 منی تمام اخراجات اور فوائد کا موازنہ کر�ت ہو� یہ بینک م�ی. بہتر منافع فراہم کرتا ��
کہنی ت۔ اس بینک � ساتھ تعلقات منی مجھ� مل�ن وا� فوائد اخراجات � 1 2 3 4 5 6 7 . ز�ادە ہنی
کو ملہوظ رکھ�ت ہو� منی �ن بہت روابطث۔ اس بینک � ساتھ اپ�ن تمام تر 1 2 3 4 5 6 7 کچھ حاصل ک�ا۔
7 6 5 4 3 2 1 � � ل�ئ گراں روابطج۔ اس بینک � ساتھ م�ی ۔ قدر ہیںم�ی
ہوں۔ ح۔ منی اس بینک منی ادا کردە ق�مت � بد� منافعہ � خوش 1 2 3 4 5 6 7
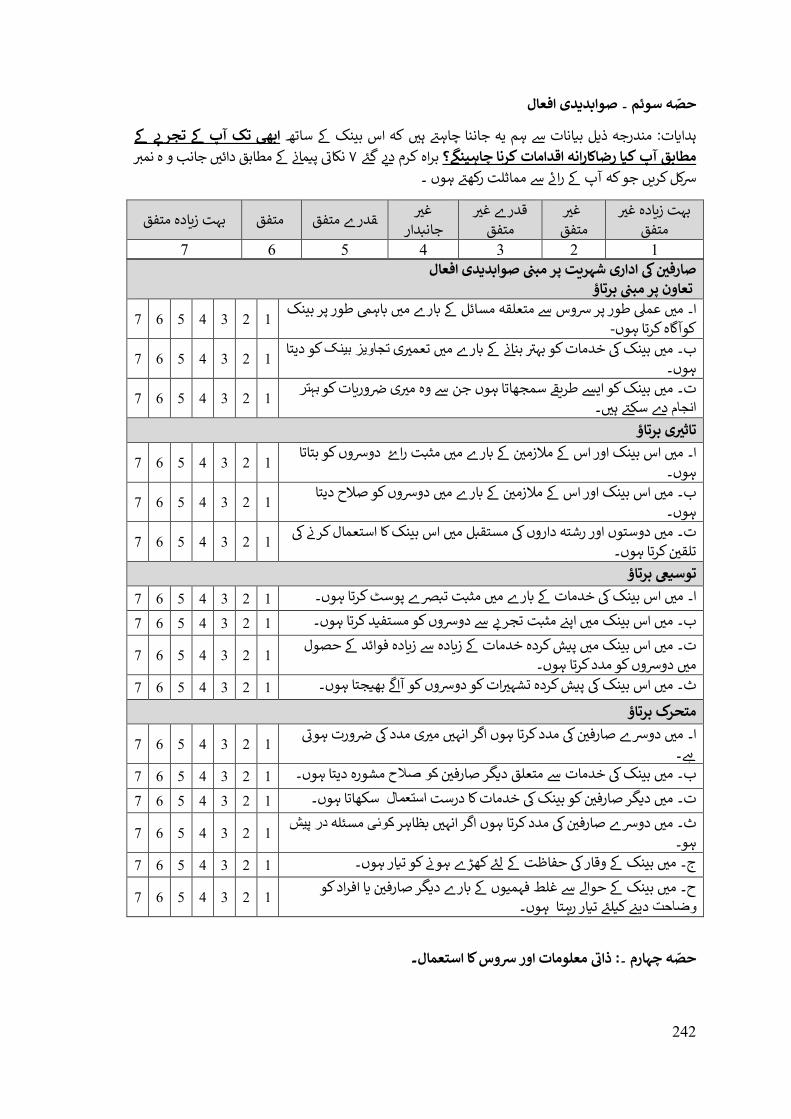
242
صوابد�دی افعال۔ حّصہ سوئم
تک آپ � تجر�ب � اب�� ساتھ نکی کہ اس بہنی جاننا چاہ�ت � ہم یہ انات �ب ل�: مندرجہ ذ ات�ہدا؟رضا�ارانہ اقدامات کرنا ا �مطابق آپ ک
گنم�ب ە و � مطابق دائنی جانب ما�ن � پ نکائت ۷ د�ی گ�ئ براە کرم چاہیں�
ہوں ۔ � مماثلت رکھ�ت را�ئ آپ � ہجو ک ں��کل ک�
غ�ی ادە�بہت ز متفق
غ�ی متفق
غ�ی قدر� متفق
غ�ی متفق ادە�بہت ز متفق متفق قدر� جانبدار
1 2 3 4 5 6 7 ن � اداری شہ��ت پر مبین افعال صوابد�دی صارفںی
تعاون پر مبین برتاؤ
بار� منی باہ� طور پر بینک ا۔ منی عم� طور پر �وس � متعلقہ مسائل � 1 2 3 4 5 6 7 -کوآ�اە کرتا ہوں
ی 1 2 3 4 5 6 7 کو دیتا تجاویز بینکب۔ منی بینک � خدمات کو بہ�ت بنا�ن � بار� منی تعم�ی ہوں۔
ور�ات کو 1 2 3 4 5 6 7 ی �ن بہتر ت۔ منی بینک کو ا�� ط���ت سمجھاتا ہوں جن � وە م�ی۔ انجام دے سک�ت ہنی
ی برتاؤ تاث�ی
ن � بار� منی مثبت را� دو�وں کو بتاتا 1 2 3 4 5 6 7 ا۔ منی اس بینک اور اس � مالزمنی ہوں۔
ن � بار� منی 1 2 3 4 5 6 7 دو�وں کو صالح دیتا ب۔ منی اس بینک اور اس � مالزمنی ہوں۔
ت۔ منی دوستوں اور رشتہ داروں � مستقبل منی اس بینک کا استعمال کر�ن � 1 2 3 4 5 6 7ن کرتا ہوں۔ تلقنی
توس�� برتاؤ ا۔ منی اس بینک � خدمات � بار� منی مثبت تب�� پوسٹ کرتا ہوں۔ 1 2 3 4 5 6 7
اپ�ن مثبت تجر�ب � دو�وں کو مستف�د کرتا ہوں۔ ب۔ منی اس بینک منی 1 2 3 4 5 6 7
ت۔ منی اس بینک منی پ�ش کردە خدمات � ز�ادە � ز�ادە فوائد � حصول 1 2 3 4 5 6 7 منی دو�وں کو مدد کرتا ہوں۔
بھ�جتا ہوں۔ 1 2 3 4 5 6 7گ
ات کو دو�وں کو آا� ث۔ منی اس بینک � پ�ش کردە �شہ�ی
متحرک برتاؤ
ورت ہوئت 1 2 3 4 5 6 7 ی مدد � �ن ن � مدد کرتا ہوں ا�ر انہنی م�ی ا۔ منی دو�� صارفنی۔ ��
ن 1 2 3 4 5 6 7 مشورە دیتا ہوں۔ کو صالحب۔ منی بینک � خدمات � متعلق د�گر صارفنی
ن کو بینک � خدمات کا درست 1 2 3 4 5 6 7 سکھاتا ہوں۔ استعمالت۔ منی د�گر صارفنی
ن � مدد کرتا ہوں ا�ر انہنی بظاہر 1 2 3 4 5 6 7 در پیشمسئلہ کوئیث۔ منی دو�� صارفنی ہو۔
ج۔ منی بینک � وقار � حفاظت � ل�ئ کھڑ� ہو�ن کو ت�ار ہوں۔ 1 2 3 4 5 6 7
ن �ا افراد کو 1 2 3 4 5 6 7 ح۔ منی بینک � حوا� � غلط فہمیوں � بار� د�گر صارفنی ہوں۔ ر�تا دی�ن ک�ل�ئ ت�ار وضاحت
۔ : ذایق معلومات اور �وس کا استعمال۔ حّصہ چہارم
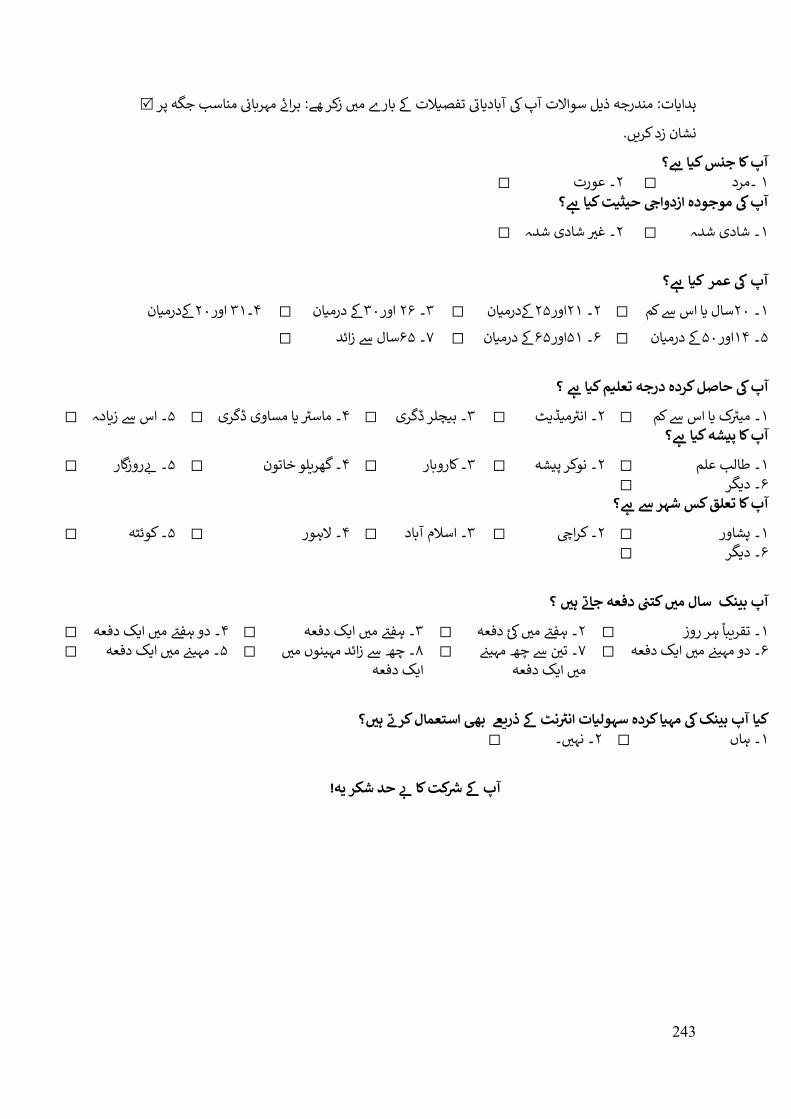
243
ھ�: برا�ئ مہ��ائن مناسب جگہ پر ہدا�ات: مندرجہ ذ�ل سواالت آپ � آباد�ائت تفص�الت � بار� منی زکر
�شان زد ک��ں.
؟ جنس ک�ا �� ا آپ ک ☐ عورت ۔ ۲ ☐ مرد ۔ ۱
؟آپ � موجودە ازدوا�ب حیث�ت ک�ا ��
☐ غ�ی شادی شدہ ۔ ۲ ☐ ہ شادی شد۔ ۱
؟�� ک�ا عمر � آپ
�درم�ان۲۰اور ۳۱۔۴ ☐ � درم�ان۳۰اور ۲۶۔ ۳ ☐ �درم�ان ۲۵اور۲۱۔ ۲ ☐ سال �ا اس � کم ۲۰۔ ۱
☐ سال � زائد ۶۵۔ ۷ ☐ � درم�ان ۶۵اور۵۱۔ ۶ ☐ � درم�ان۵۰اور۱۴۔ ۵
ک�ا �� ؟ درجہ تعل�مآپ � حاصل کردە
ک �ا اس � کم ۔ ۱ م�ڈ�ٹ ۔ ۲ ☐ می�ٹ ☐ اس � ز�ادہ ۔ ۵ ☐ ڈ�ری �ا مساویماس�ٹ ۔۴ ☐ ب�چلر ڈ�ری ۔ ۳ ☐ ان�ٹ؟ پ�شہآپ کا ک�ا ��
روزگار ۔ ۵ ☐ خاتونگھ��لو ۔ ۴ ☐ کارو�ار ۔ ۳ ☐ نوکر پ�شہ۔ ۲ ☐ طالب علم ۔ ۱ ☐ �ب ☐ د�گر ۔ ۶
؟ شہر � آپ کا تعلق کس ��
☐ کوئڻہ ۔ ۵ ☐ الہور ۔ ۴ ☐ اسالم آباد ۔ ۳ ☐ کرا�پ ۔ ۲ ☐ �شاور ۔ ۱ ☐ د�گر ۔ ۶
کتین دفعہ جا�ق ہںی ؟ سال مںی آپ بینک
۔ ۱� ☐ دو ہف�ت منی ا�ک دفعہ ۔ ۴ ☐ ہف�ت منی ا�ک دفعہ۔ ۳ ☐ ہف�ت منی �ئ دفعہ ۔ ۲ ☐ ز ہر رو تق��با
ن � چھ مہی�ن ۔ ۷ ☐ دفعہدو مہی�ن منی ا�ک ۔ ۶ تنی منی ا�ک دفعہ
مہینوں منی زائد چھ � ۔ ۸ ☐ ا�ک دفعہ
☐ مہی�ن منی ا�ک دفعہ۔ ۵ ☐
نٹ � مہ�ا کردە ک�ا آپ بینک � ؟ ذر�� سہول�ات ان�ٹ ب� استعمال کر�ق ہںی۔ ۔ ۲ ☐ ہاں۔ ۱ ☐ نہنی
کت کا � آپ ! ہشکر ی �ب حد �ش
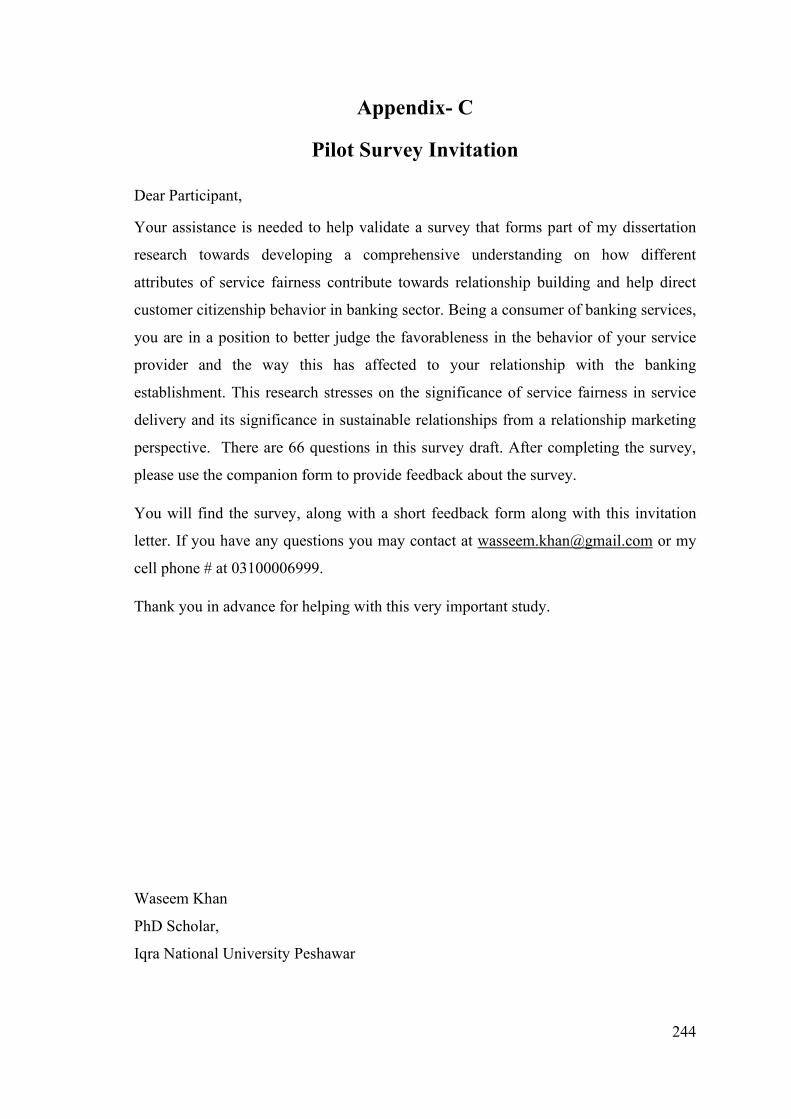
244
Appendix- C
Pilot Survey Invitation
Dear Participant,
Your assistance is needed to help validate a survey that forms part of my dissertation
research towards developing a comprehensive understanding on how different
attributes of service fairness contribute towards relationship building and help direct
customer citizenship behavior in banking sector. Being a consumer of banking services,
you are in a position to better judge the favorableness in the behavior of your service
provider and the way this has affected to your relationship with the banking
establishment. This research stresses on the significance of service fairness in service
delivery and its significance in sustainable relationships from a relationship marketing
perspective. There are 66 questions in this survey draft. After completing the survey,
please use the companion form to provide feedback about the survey.
You will find the survey, along with a short feedback form along with this invitation
letter. If you have any questions you may contact at [email protected] or my
cell phone # at 03100006999.
Thank you in advance for helping with this very important study.
Waseem Khan
PhD Scholar,
Iqra National University Peshawar

245
Appendix- C (a)
دعوت برا� ابتدایئ �و�
کاء السالم عل�کم م �ش !مح�ت
۔ ) � توثیق � ل�ی آپ � مدد درکار �� � ئپ ایچ ڈی � مقا� کا حصہ �� مجھ� اپین ابتدائئ تحقیق (جو کہ م�ی
فراہ� اور اس � نتی�ب منی استوار ہو�ن وا� تعلقات اور مقا� کا مقصد عدل انصاف پر مبین �وس �
ن � ۔ بینکنگ خدمات کا صارف ہو�ن � باعث، آپ بینک � صارفنی معاون اقدامات � ا�ک جامع تفہ�م ��
رو�ی منی عدل و انصاف و اس پر مبین خدمات � فراہ� اور اس � نتی�ب منی آپ � اور بینک � استوار
۔ اس تحقیق کا مقصد خدمات � فراہ� منی عدل و انصاف کا تعلقات � مع �ار کا بہ�ت اندازە لگا سک�ت ہنی
۔ اس بن�ادی تحق��ت �و� منی کل نفاذ اور اس � نتی�ب منی بن�ن وا� تعلقات اہم�ت کو اجا�ر کرنا ��
۔ براە مہ��ائن �و� مکمل کر�ن � بعد اس �و� � بار� منی اپین ق�میت را�ئ � چھ�اسڻھ سواالت ہنی
آ�اە ک��ں۔
برا�ئ مہ��ائن �و� مکمل کر�ن � بعد آخر منی منسل� فارم پر �و� � کوائف � بار� منی اپین ق�میت را�ئ
ئ � ب� آ�اە ک��ں۔ آپ اس ابتدائئ �و� � بار� منی اپ�ن سواالت � م��ائل نم�ب �ل�ی -مجھ� م�ی
ی ای م�ل: 0310006999 پر مجھ � براہراست رابطہ کر سک�ت [email protected] �ا م�ی
۔ ہنی
اس اہم مطالعہ منی معاونت � ل�ئ آپ کا �ب حد شک��ہ.
وس�م خان
ئپ ایچ ڈی سکالر اقراء ن�شنل یونیورسیٹ �شاور
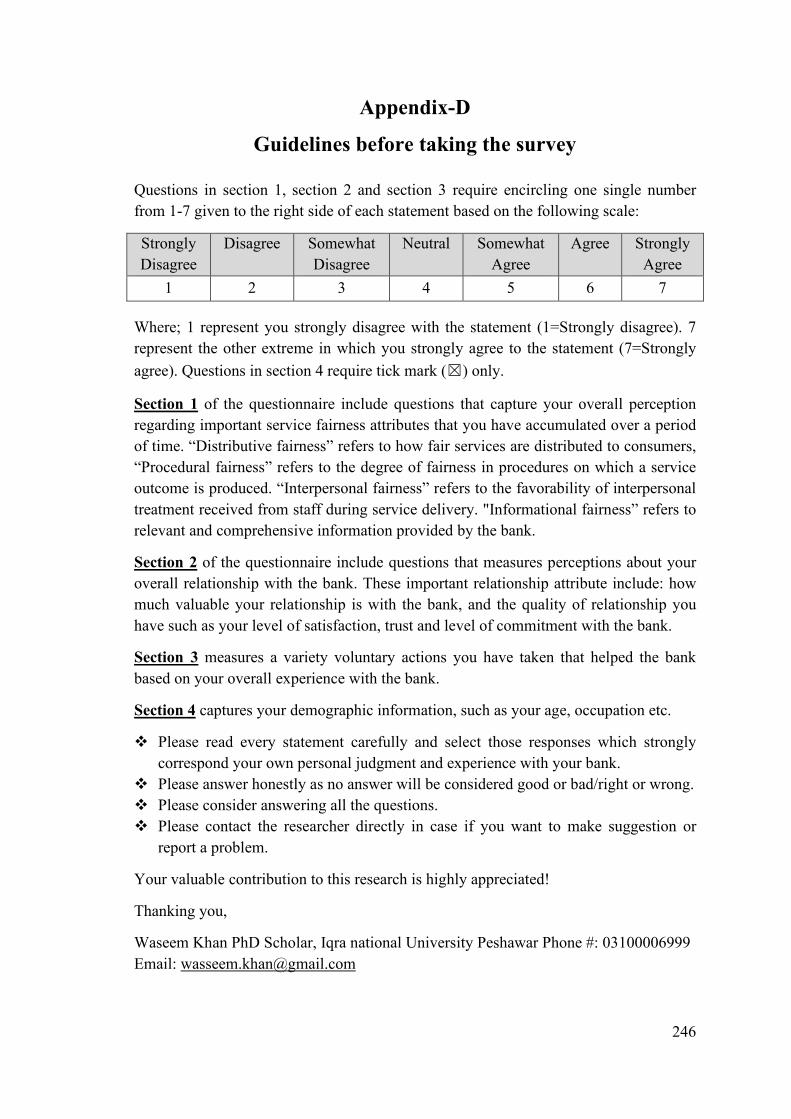
246
Appendix-D
Guidelines before taking the survey
Questions in section 1, section 2 and section 3 require encircling one single number from 1-7 given to the right side of each statement based on the following scale:
Strongly Agree
Agree Somewhat Agree
Neutral Somewhat Disagree
Disagree Strongly Disagree
7 6 5 4 3 2 1
Where; 1 represent you strongly disagree with the statement (1=Strongly disagree). 7 represent the other extreme in which you strongly agree to the statement (7=Strongly agree). Questions in section 4 require tick mark (☒) only.
Section 1 of the questionnaire include questions that capture your overall perception regarding important service fairness attributes that you have accumulated over a period of time. “Distributive fairness” refers to how fair services are distributed to consumers, “Procedural fairness” refers to the degree of fairness in procedures on which a service outcome is produced. “Interpersonal fairness” refers to the favorability of interpersonal treatment received from staff during service delivery. "Informational fairness” refers to relevant and comprehensive information provided by the bank.
Section 2 of the questionnaire include questions that measures perceptions about your overall relationship with the bank. These important relationship attribute include: how much valuable your relationship is with the bank, and the quality of relationship you have such as your level of satisfaction, trust and level of commitment with the bank.
Section 3 measures a variety voluntary actions you have taken that helped the bank based on your overall experience with the bank.
Section 4 captures your demographic information, such as your age, occupation etc.
Please read every statement carefully and select those responses which strongly correspond your own personal judgment and experience with your bank.
Please answer honestly as no answer will be considered good or bad/right or wrong. Please consider answering all the questions. Please contact the researcher directly in case if you want to make suggestion or
report a problem.
Your valuable contribution to this research is highly appreciated!
Thanking you,
Waseem Khan PhD Scholar, Iqra national University Peshawar Phone #: 03100006999 Email: [email protected]

247
Appendix- D (a) یاتہدا یےسروے کو پر کرنے کے ل
۔ حصہ اول، دوم اور سوم کو پر کر�ن ک�ل�ئ ہر ا�ک ب�ان � دائنی جانب ا�ک � ن ح� ہنی اس سوالنا� � تنی
ک� ب� ا�ک ہند� پر د�ی گ�ئ پ�ما�ن � مطابق دائرە لگائنی ۔ � کر سات تک منی �
بہت ز�ادە غ�ی متفق
غ�ی متفق
قدر� غ�ی متفق
غ�ی جانبدار
بہت ز�ادە متفق متفق قدر� متفق
1 2 3 4 5 6 7 ۔ جبکہ حصہ چہارم منی آپ کو �ف ا�ک جواب کو �شان � منتخب کرنا ��
برا�ئ مہ��ائن ہر ا�ک سوال کو غور � سمجھنی اور اپ�ن تجر�ب � مطابق اپین را�ئ � آ�اە ک��ں۔ •
لہذا آپ ہمنی اپ�ن مخلصانہ •گ
آپ � دی�ئ گ�ئ جوابات اچھ� �ا بر�، غلط �ا صحیح تصور نہنی ہون�
را�ئ � آ�اە ک��ں۔
برا�ئ مہ��ائن تمام سواالت � جوابات دی�ن � کوشش ک��ں۔ •
حصہ اول منی آپ منصفانہ اورعدل وانصاف پر مبین خدمات � فراہ� � بار� منی اپین را�ئ کا •
اظہار ک��ں۔
حصہ دوم منی آپ بینک � ساتھ استوار تعلقات اور اس � پائ�داری � بار� منی اپین را�ئ کا اظہار •
ک��ں۔
ر� منی اپین را�ئ کا اظہار ک��ں۔حصہ سوم منی آپ بینک � ل�ئ رضا�ارانہ اور مف�د اقدامات � با •
حصہ چہارم منی آپ اپ�ن ذائت معلومات � بار� منی آ�اە ک��ں۔ •
۔ آپ �و� منی ک� قسم � دشواری �ا اپین ق�میت آراء � محقق کو براە راست آ�اە کر سک�ت ہنی
اس تحقیق منی آپ � ق�میت معاونت کا �ب حد شک��ہ۔
شکر گزار
وس�م خان
، �شاور ئپ ایچ ڈی سکالر اقراء ن�شنل یونیورسیٹ
: 0310006999م��ائل نم�ب
[email protected] ای م�ل:
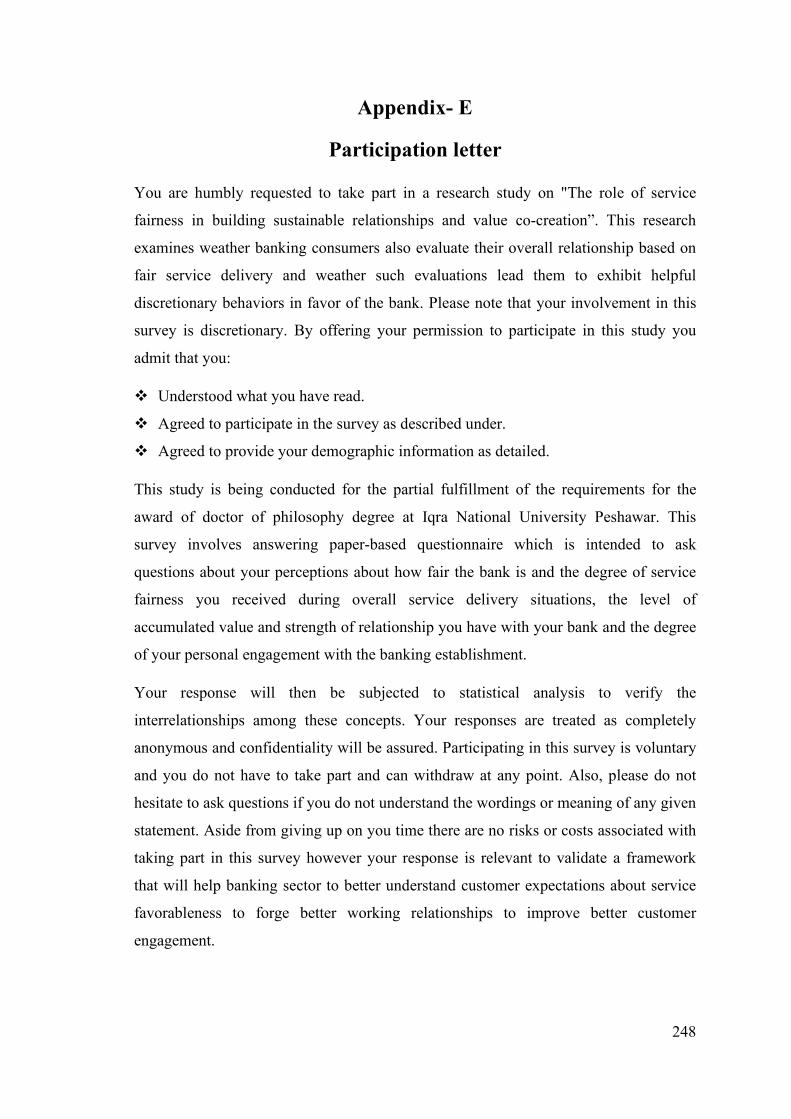
248
Appendix- E
Participation letter
You are humbly requested to take part in a research study on "The role of service
fairness in building sustainable relationships and value co-creation”. This research
examines weather banking consumers also evaluate their overall relationship based on
fair service delivery and weather such evaluations lead them to exhibit helpful
discretionary behaviors in favor of the bank. Please note that your involvement in this
survey is discretionary. By offering your permission to participate in this study you
admit that you:
Understood what you have read.
Agreed to participate in the survey as described under.
Agreed to provide your demographic information as detailed.
This study is being conducted for the partial fulfillment of the requirements for the
award of doctor of philosophy degree at Iqra National University Peshawar. This
survey involves answering paper-based questionnaire which is intended to ask
questions about your perceptions about how fair the bank is and the degree of service
fairness you received during overall service delivery situations, the level of
accumulated value and strength of relationship you have with your bank and the degree
of your personal engagement with the banking establishment.
Your response will then be subjected to statistical analysis to verify the
interrelationships among these concepts. Your responses are treated as completely
anonymous and confidentiality will be assured. Participating in this survey is voluntary
and you do not have to take part and can withdraw at any point. Also, please do not
hesitate to ask questions if you do not understand the wordings or meaning of any given
statement. Aside from giving up on you time there are no risks or costs associated with
taking part in this survey however your response is relevant to validate a framework
that will help banking sector to better understand customer expectations about service
favorableness to forge better working relationships to improve better customer
engagement.
249
Participant’s compliance sheet
I _________________________express my willingness to participate in this survey, in
offering my permission I submit that:
I am aware about the purpose of the survey,
I am happy to answer questions that have been asked by the researcher
I understand that taking part in this survey is completely discretionary
I am aware that I can discontinue from participating in the survey at any time.
I am aware that any particulars asked about me during survey will be dealt with
confidentiality and will be utilized for educational purposes only.
I am aware that any identifiable information about me will not be published in any
sort.

250
Appendix- E (a)
کاء ا طالعایق ب�ان برا�ئ �ش
� تحق��ت مقالہ جس کا عنوان عدل و انصاف پر مبین خدمات � فراہ� کا “آپ � درخواست �� کہ م�ین � ن � ساتھ پائ�دار تعلقات � ق�ام اور اس کا صارفںی کت کر " افعال مںی کردار معاونرضا�ارانہ صارفںی �ش
ن کرنا �� کہ بینک � عدل و انصاف پر مبین خدمات � � تعاون ک��ں۔ اس تعل�� تحقیق کا مقصد یہ متعنیئ فراہ� ؟ اور ک�ا اس � نتی�ب منی اور اس رو�ی �ن تعلقات استوار کر�ن منی ک�ا کردار �� ن � ساتھ بہ�ت کا صارفنی
؟ برا�ئ مہ��ائن نوٹ کرلنی کہ اس ن � رضا�ارانہ افعال پر کوئئ اثر �� �ا نہنی بن�ن وا� پائ�دار تعلقات کا صارفنی۔�و� م کت اخت�اری �� کت اور اپین را�ئ دی�ت وقت آپ درج ذ�ل نقاط پر نی آپ � �ش ر��چ اسڻڈی منی �ش
۔ آمادە ہنی
۔ • آپ مکمل طور پر اس اسڻڈی کا مقصد سمجھ�ت ہنی۔ ی آپ اس اسڻڈ • کت ک�ل�ئ را�ن ہنی ج�سا کہ ذ�ل منی ب�ان ک�ا گ�ا �� منی �ش۔ • اپین ذائت معلومات دی�ن � ل�ئ آمادە ہنی
، �شاور � مینجمنٹ سائن�ن منی ئپ ایچ ڈی ڈ�ری � حصول �ل�ئ � ی ہ ر��چ اقراء ن�شنل یونیورسیٹ۔ اس �و� منی آپ کو ا�ک سوال نامہ د�ا جا�ئ گا جس منی اپ�ن آپ اپین را�ئ � مطابق دی�ئ گ�ئ جار� ��
۔ اس سوالنا� م گ
نی آپ اپ�ن مشاہدات � تحت سواالت کا جواب پن اور کاغذ � مدد � فراہم کر سکنی �بینک � عدل انصاف پر مبین خدمات � فراہ� اور اس � وجہ � اب� تک آپ � اس بینک � ساتھ ۔ آپ � جوابات کا استوار تعلقات اور بینک � ل�ئ آپ � م�وف�ات پر مبین سواالت پوچھ� گ�ئ ہنی
ا جا�ئ گا۔ آپ � جوابات کو مکمل طور پر ص�غہِء راز شمار�ات � ذر�� ان نظ��ات � درم�ان روابط کو د�کھکت مکمل طور پر اخت�اری �� آپ ک� ب� وقت اس �و� کو منی رکھا جا�ئ گا۔ آپ � �و� منی �ش۔ ا�ر آپ کو ک� ب� لفظ �ا نق� � سمجھ نہنی آر� ہو تو برا�ئ مہ��ائن کوئئ ب� منس�خ کر سک�ت ہنی
ا ۔سوال پوچھ�ن � نا ک�ت اپنا ق�میت وقت دی�ن � عالوە آپ کا اس �و� منی اور ک� قسم کا کوئئ نقصان ئنی�ا ما� خرچہ نہنی �� تاہم یہ تحقیق آپ � ق�میت را�ئ کو برو�ئ کار ال�ت ہو�ئ بینک � آپ کو آپ � توقع �
ن مطابق اطمینان بخش �و�ن فراہم کر�ن منی مدد دے سکیت �۔ عنی
فارم رضا�ارانہ را�ئ
کت � ل�ی را�ن ہواور رضا�ارانہ طور پر یہ کہتا ہوں ____________________ اس ٓ�و� منی �ش منی کہ:
منی اس ر��چ سڻڈی کا مقصد سمجھتا ہوں۔ •۔ •
گ مجھ � پوچھ� گ�ئ سواالت کا جواب دی�ن منی مجھ� خو�ش محسوس ہو�
۔ • کت محض اخت�اری �� منی جانتا ہوں کہ سڻڈی منی �شکت منس�خ کر سکتا ہوں۔ منی • جانتا ہوں کہ منی ک� ب� وقت اپین �شمنی جانتا ہوں � �و� � دوران ک� ب� ذائت سوال کو مکمل ص�غہِءراز منی رکھا جا�ئ گا اور •
�ف اور �ف تعل�� مقاصد � ل�ئ استعمال ہو گا۔ � نام �ا ذات � متعلق ک� قسم � ب� معلومات کو شائع • نہنی ک�ا جا�ئ گا۔ اور م�ی
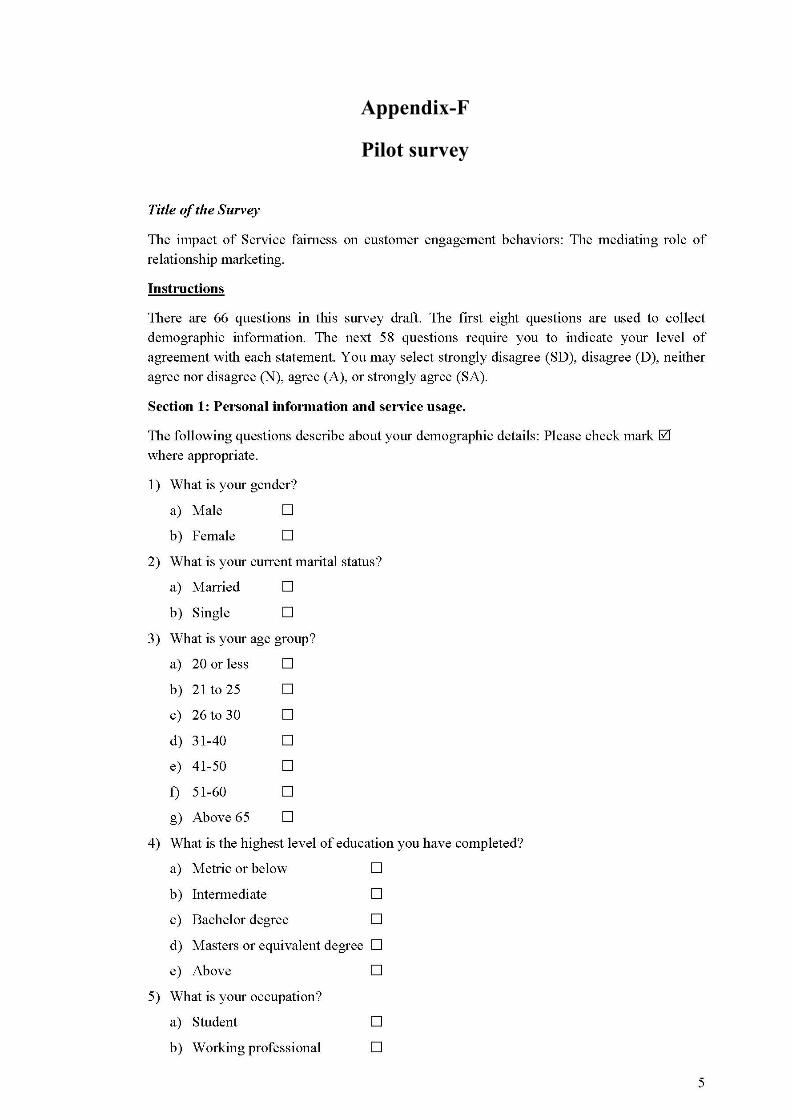
251
Appendix-F
Pilot survey
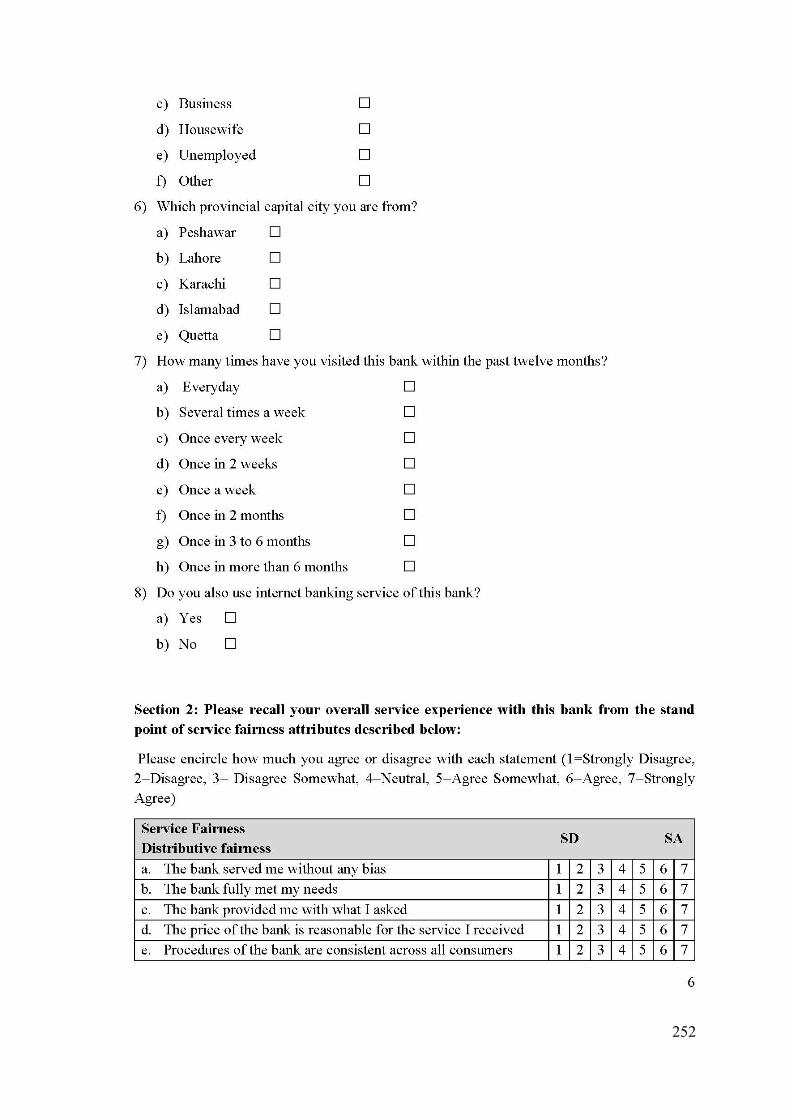
252
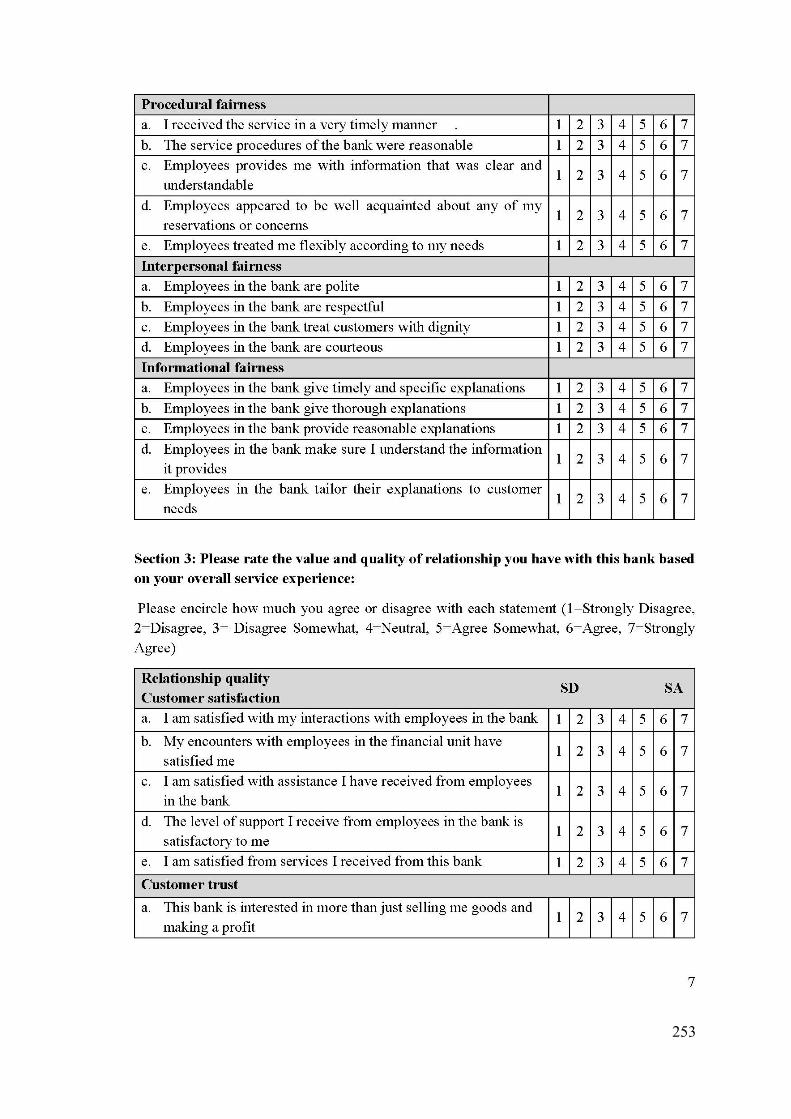
253
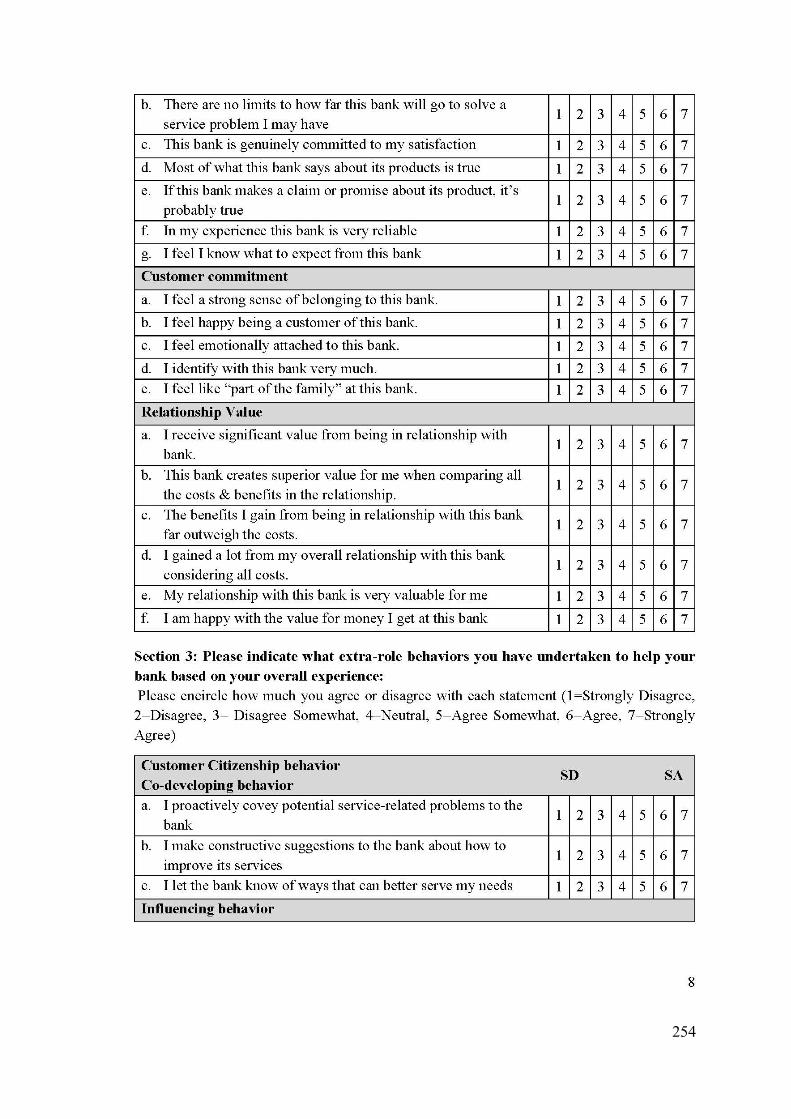
254
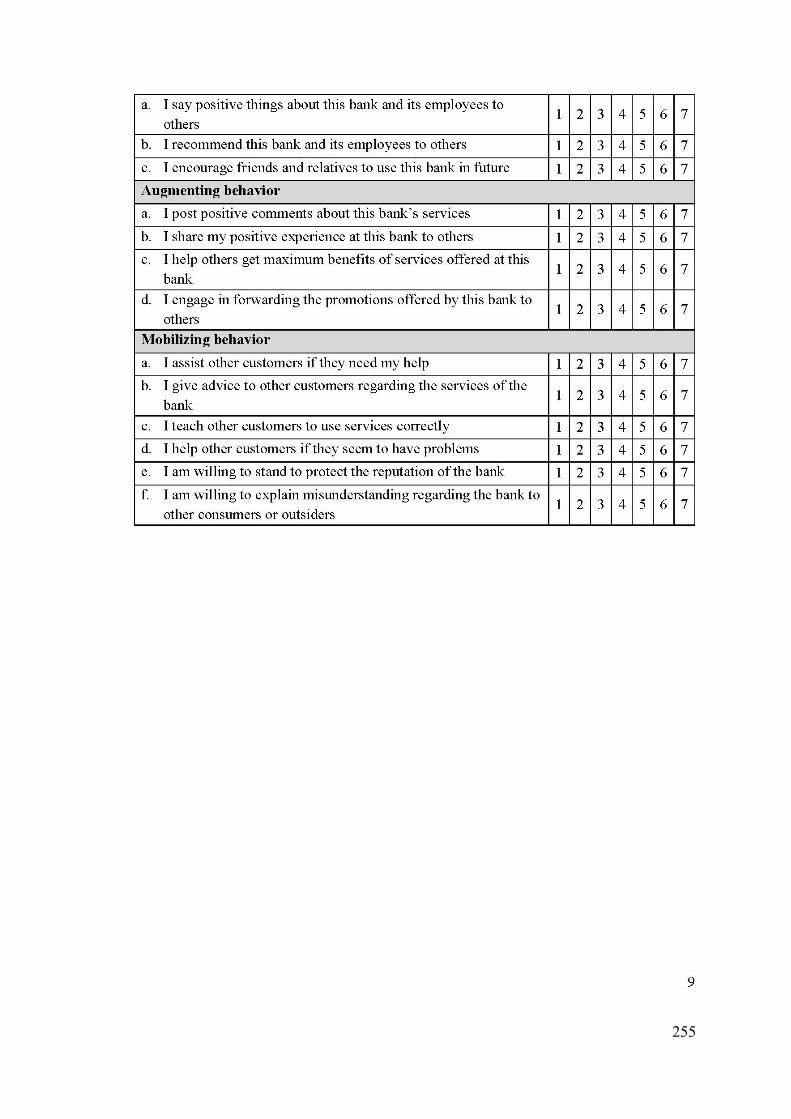
255
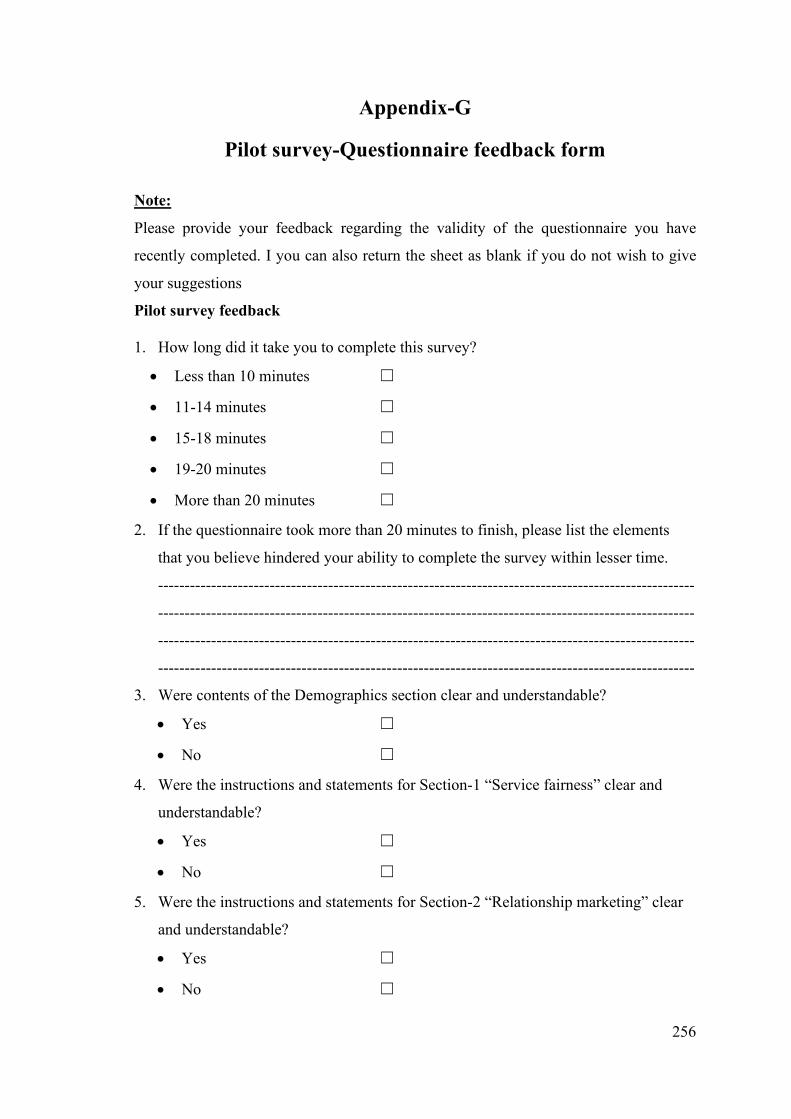
256
Appendix-G
Pilot survey-Questionnaire feedback form
Note:
Please provide your feedback regarding the validity of the questionnaire you have
recently completed. I you can also return the sheet as blank if you do not wish to give
your suggestions
Pilot survey feedback 1. How long did it take you to complete this survey?
• Less than 10 minutes ☐
• 11-14 minutes ☐
• 15-18 minutes ☐
• 19-20 minutes ☐
• More than 20 minutes ☐
2. If the questionnaire took more than 20 minutes to finish, please list the elements
that you believe hindered your ability to complete the survey within lesser time.
-----------------------------------------------------------------------------------------------------
-----------------------------------------------------------------------------------------------------
-----------------------------------------------------------------------------------------------------
-----------------------------------------------------------------------------------------------------
3. Were contents of the Demographics section clear and understandable?
• Yes ☐
• No ☐
4. Were the instructions and statements for Section-1 “Service fairness” clear and
understandable?
• Yes ☐
• No ☐
5. Were the instructions and statements for Section-2 “Relationship marketing” clear
and understandable?
• Yes ☐
• No ☐
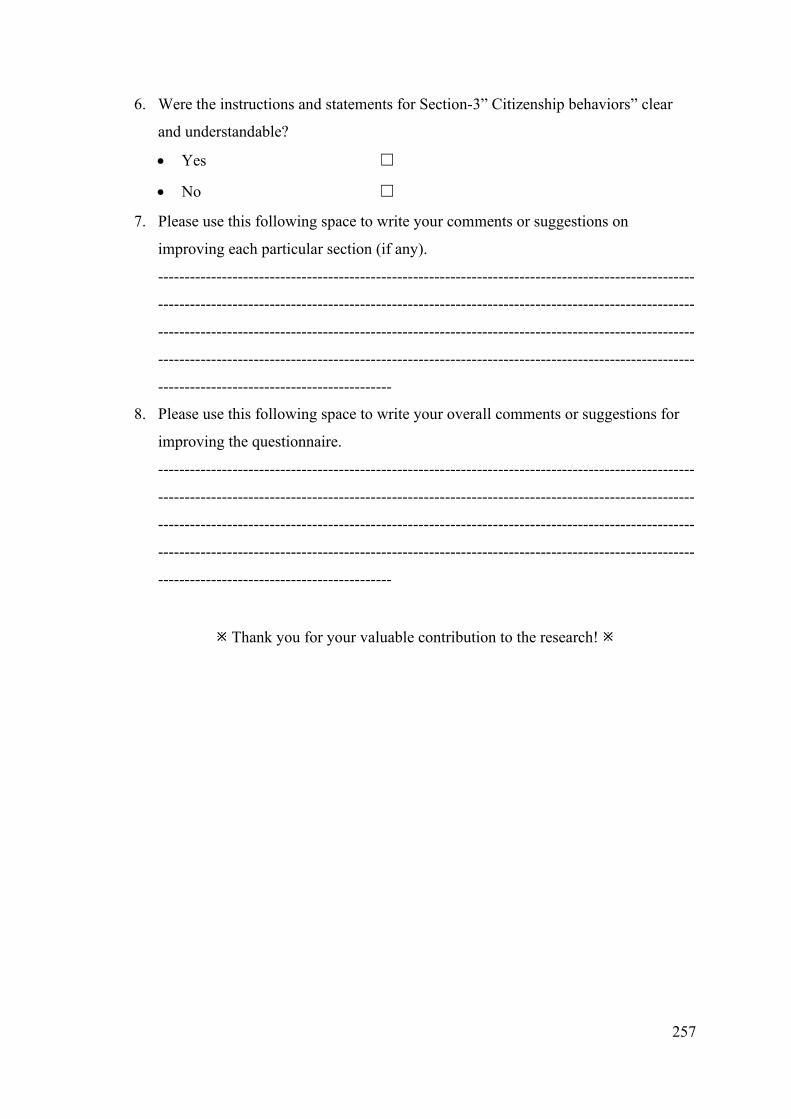
257
6. Were the instructions and statements for Section-3” Citizenship behaviors” clear
and understandable?
• Yes ☐
• No ☐
7. Please use this following space to write your comments or suggestions on
improving each particular section (if any).
-----------------------------------------------------------------------------------------------------
-----------------------------------------------------------------------------------------------------
-----------------------------------------------------------------------------------------------------
-----------------------------------------------------------------------------------------------------
--------------------------------------------
8. Please use this following space to write your overall comments or suggestions for
improving the questionnaire.
-----------------------------------------------------------------------------------------------------
-----------------------------------------------------------------------------------------------------
-----------------------------------------------------------------------------------------------------
-----------------------------------------------------------------------------------------------------
--------------------------------------------
Thank you for your valuable contribution to the research!
258
Appendix- H
Results of Pilot Study (n=120)
Section 1. Introduction
Since late 1980s, the financial sector in Pakistan has underwent major structural
changes due to financial liberalization and deregulations. This transformation has led to
greater competition that has favored the efficiency and competitiveness of banking
sector (Zameer et al., 2015). Numerous transformations over the past decade have laid
the ground work for new competitors to enter into the indigenous financial industry
(Ali & Raza, 2017). As a result, a greater variety and choices of products and services
for customers are available and the banking industry is offering sophisticated delivery
systems and more value-added services than rivals (Anjum et al., 2017; Paul et al.,
2016). In similar vein, banks have also come under enormous pressure to manage the
growing demands and expectations of their clients as well as due to the shift in
customer-centric regulatory paradigm towards protection of financial consumers,
posing major challenge for bank to retain existing customers, given that competition is
currently fierce and that new clients are inconvenient to obtain at a mature stage in their
life cycles (Zameer et al., 2015), banks are require to make significant efforts into
generating new revenue sources (Saleh et al., 2017). These considerations converge to
imply the need for more specific customer driven strategies aimed at building and
maintaining sustainable bank-client relationships (Dinulescu et al., 2019).
1.1 Problem statement
Since financial services involve high credence attributes therefore provision of fair
service by the banks is very important to sustain long-term relationships with the
customers (Roy et al., 2015). Moreover, past research has also indicated that consumers
react to service fairness more strongly than service quality reveling that proving service
quality to consumers is necessary condition, however it not enough to establish
sustainable relationships with customers (Carr, 2007; Giovanis et al., 2015).
Considering the fact that banking institutions provide virtually identical products and
services with little to no variation in service quality, the real differentiation however
may come from a consumer assessment of the degree of overall fair treatment they
receive from their relationship over time (Roy, Shekhar, et al., 2018). Furthermore,
taking into account the competitive nature of banking sector in Pakistan, despite service
259
excellence banks also need focus on providing fairness excellence to enhance strong
relationships with their clients to achieve sustainable competitive advantage (Kamran &
Uusitalo, 2019). In this regard, understanding the consequences of a consumer’s service
evaluations in terms of fairness are of significant relevance to banking establishments
which are explored in this research.
1.2 Study objectives
The overall objective of this research is to investigate the role of service fairness in
building and sustaining durable exchange relationship with customers and driving
customer citizenship behaviors within banking sector. The specific objectives of pilot
study include:
• To assess the reliability and validity of the survey instrument
• To confirm the factor structure of measurement model
• To confirm path relationships among constructs.
• To establish the model predictive capabilities.
1.3 Literature review
The main purpose of this study is to investigate the role of service fairness in fostering
favorable customer outcomes through developing long-term relationships. The current
research draws on equity theory (Adams, 1965), social exchange theory (Blau, 1964),
psychological contract (Rousseau, 1989), service dominant logic (Vargo & Lusch, 2008)
and prior related researches to test the current study model in banking sector of
Pakistan. According to equity theory a customer experiences regarding fairness in
service delivery situations lead to positive emotions that motivate consumers to
increase their confidence in the service firm and affirm exchange relationships (Cheng
et al., 2017). Service providers that fail to provide assurance regarding fair service
delivery often cannot attract potential customer confidence required to form better
serviceable relationships with customers (Nikbin et al., 2016). Firms that reward
customers proportional to what they have invested attract their deep commitment and
satisfaction need to establish long term relationships (Giovanis et al., 2015). Perception
of service fairness is based on psychological contract between the consumer and the
organization (Schneider & Bowen, 1999). According to (Llewellyn, 2001) a
psychological contract represents an implicit agreement between exchange partners that
is guided by shared judgments and expectation based on conditions and contents of the
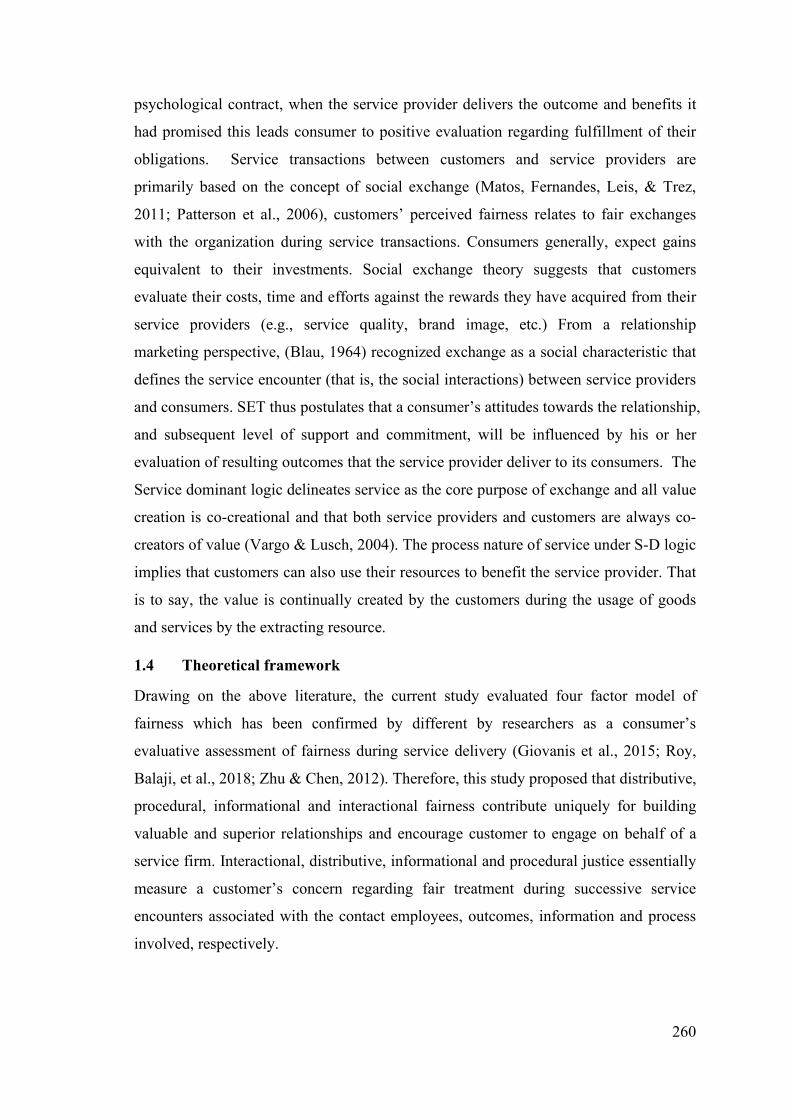
260
psychological contract, when the service provider delivers the outcome and benefits it
had promised this leads consumer to positive evaluation regarding fulfillment of their
obligations. Service transactions between customers and service providers are
primarily based on the concept of social exchange (Matos, Fernandes, Leis, & Trez,
2011; Patterson et al., 2006), customers’ perceived fairness relates to fair exchanges
with the organization during service transactions. Consumers generally, expect gains
equivalent to their investments. Social exchange theory suggests that customers
evaluate their costs, time and efforts against the rewards they have acquired from their
service providers (e.g., service quality, brand image, etc.) From a relationship
marketing perspective, (Blau, 1964) recognized exchange as a social characteristic that
defines the service encounter (that is, the social interactions) between service providers
and consumers. SET thus postulates that a consumer’s attitudes towards the relationship,
and subsequent level of support and commitment, will be influenced by his or her
evaluation of resulting outcomes that the service provider deliver to its consumers. The
Service dominant logic delineates service as the core purpose of exchange and all value
creation is co-creational and that both service providers and customers are always co-
creators of value (Vargo & Lusch, 2004). The process nature of service under S-D logic
implies that customers can also use their resources to benefit the service provider. That
is to say, the value is continually created by the customers during the usage of goods
and services by the extracting resource.
1.4 Theoretical framework
Drawing on the above literature, the current study evaluated four factor model of
fairness which has been confirmed by different by researchers as a consumer’s
evaluative assessment of fairness during service delivery (Giovanis et al., 2015; Roy,
Balaji, et al., 2018; Zhu & Chen, 2012). Therefore, this study proposed that distributive,
procedural, informational and interactional fairness contribute uniquely for building
valuable and superior relationships and encourage customer to engage on behalf of a
service firm. Interactional, distributive, informational and procedural justice essentially
measure a customer’s concern regarding fair treatment during successive service
encounters associated with the contact employees, outcomes, information and process
involved, respectively.
261
1.5 Research model
The study research model hypothesized that value and quality of a relationship are
critical links through which service fairness relate to customer engagement behaviors.
In other words, the more customers rate their service provider as fair in terms of
distribution, procedures, interactions and information in successive transactions during
service delivery the more they want to stay in relationship and feel obliged to favor
service providers by contributing voluntary behaviors.
Fig. 1. Theoretical framework
Section 2. Methodology
This section delineated on the specific material and methods used to collect data.
Following a positivist paradigm this study explored the aforementioned relationship
between study variables. To ensure that the research design fits the research questions
and accord positivist research paradigm, a theoretical framework was developed based
on extensive literature review from existing theories and relevant theoretical concepts
were subjected to measurement based on pre-valid scales adapted from relevant
researches. Using a cross-sectional, quantitative survey design as its methodological
approach, this study chose to collect and analyze data quantitatively using survey
method. The stated hypotheses were accepted or rejected based on statistical analysis
using quantitative data collected and inferences were drawn based on results.
H3 Service fairness
Relationship Quality
Relationship value
Customer Engagement Behaviors
Interpersonal fairness
Procedural fairness
Distributive fairness
Trust Commitment
Satisfaction
Mobilizing Behavior
Co-developing Behavior
Augmenting Behavior
Influencing Behavior Informational
fairness
H7
H1
H2
H4
H5
H6 H8
262
2.1 Operationalization of theoretical concepts
The survey instrument was developed based on well-validates multi-item measures
from previous studies based on extensive literature review, as a result, the model
structural paths that show the hypothesized relationship between constructs were
drawn. The measures in the initial survey instrument were adopted from (Carr, 2007;
Hogan, 2001b; Jaakkola & Alexander, 2014; Ng et al., 2011). To test the validity of the
adopted measures the draft survey instrument was subjected to pre-testing to establish
empirical evidence. After validity was established the relationship between
hypothesized constructs was tested. Moreover, adhering to the guidelines for mean
approximation in hierarchical structural equation models, service fairness was
approximated as second-order construct comprising first order constructs (distributive
fairness, procedural fairness, interactional fairness and information fairness),
Relationship quality was approximated as second-order construct comprising first order
constructs (customer trust, customer satisfaction, and customer commitment) and
customer citizenship behavior approximated as (augmenting, co-developing,
influencing, mobilizing behaviors as its first order constructs) each constructs had more
than three items proposed on a 7-point Likert scale ranging from Strongly Agree (SA)
to strongly disagree (SD). Furthermore, to suit the context of the study, slight wording
modification were made to the measures.
2.2 Data collection procedure
To test the validity of draft survey instrument, a paper-based questionnaire was
distributed among users of banking services in Peshawar using convenience sampling
technique. The survey participants received a survey participation statement,
guidelines, consent and a feedback forms along with the draft questionnaire during the
on-site self-administered survey. After data collection, a total 120 useable
questionnaires were chosen for data analysis. According to (Hair Jr. et al., 2017) a
sample of >30 respondents is appropriate to validate factor structure for PLS based
structural models.
2.3 Data analysis
The data collected was then subjected to statistical analysis using SMART PLS v.3.2.7
and SPSS v.25. Pilot survey data was analyzed using Structural equation modeling
(SEM) technique. SEM is a second-generation multivariate analysis technique used in
263
the analysis of relationships between variables (Joseph F. Hair et al., 2019, 2017). This
study used the SMART PLS software’s inbuild PLS-SEM algorithm. PLS-SEM is
favored where the purpose is theory extension and prediction rather than theory testing
and confirmation. PLS-SEM is most suited in situations where sample sizes are small
and theoretical models are complex. Moreover, most of the recent marketing literature
and relevant theoretical concepts have been tested using the same technique study
(Giovanis et al., 2015; Roy, Balaji, et al., 2018).
2.3.1 Pilot Survey validation
PLS-SEM assessment is generally guided a two-step approach that requires separate
assessments of the measurement model (outer) and the structural model (inner). A pilot
survey instrument is validated only when the measurement model is confirmed. To
confirm the factor structure of measures used in the draft survey instrument, reliability,
discriminant and convergent validity estimates were used to validate the measurement
model.
2.3.2 Path model validation
After the measurement model is confirmed, the predictive capabilities of the model is
confirmed using assessment of the structural model. This study used various estimates
such as co-efficient of determination (R2), Predictive relevance (Q2), effect size and
significance of path coefficients to determine the model abilities to predict exogenous
variable as proposed by (Hair, et al., 2017).
Section 3. Results and discussion
This section delineated on the results and discussion of pilot survey. Initially the data
was subjected to screening for missing values and unusual patterns of responses as a
result only 120 cases were decoded into SPSS data editor, questionnaires with minor
missing values were addressed using mean replacement method.
3.1 Demographic profile of respondents (draft survey)
Description of the pilot survey respondents is shown in table 1. Mostly the respondents
were male (78%) and were mostly married (80%). Likewise, participants were mostly
between the age of 31 to 50. Mostly users of banking services had either Bachelors
(34%) or Master’s degree (27%). Similarly, the sample comprised of mostly working
professionals (55%) and business owners (33%). Majority of the respondents had at
least visited or used the service within the past year with the highest frequency being
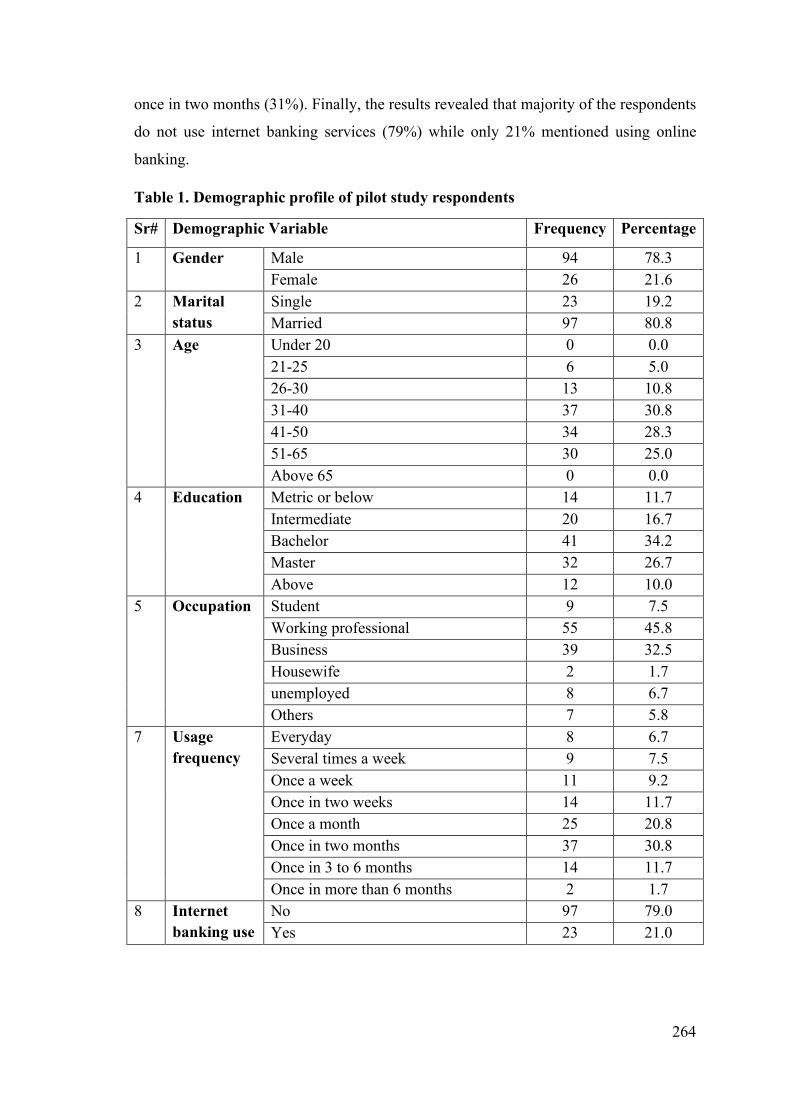
264
once in two months (31%). Finally, the results revealed that majority of the respondents
do not use internet banking services (79%) while only 21% mentioned using online
banking.
Table 1. Demographic profile of pilot study respondents
Sr# Demographic Variable Frequency Percentage
1 Gender Male 94 78.3 Female 26 21.6
2 Marital status
Single 23 19.2 Married 97 80.8
3 Age Under 20 0 0.0 21-25 6 5.0 26-30 13 10.8 31-40 37 30.8 41-50 34 28.3 51-65 30 25.0 Above 65 0 0.0
4 Education Metric or below 14 11.7 Intermediate 20 16.7 Bachelor 41 34.2 Master 32 26.7 Above 12 10.0
5 Occupation Student 9 7.5 Working professional 55 45.8 Business 39 32.5 Housewife 2 1.7 unemployed 8 6.7 Others 7 5.8
7 Usage frequency
Everyday 8 6.7 Several times a week 9 7.5 Once a week 11 9.2 Once in two weeks 14 11.7 Once a month 25 20.8 Once in two months 37 30.8 Once in 3 to 6 months 14 11.7 Once in more than 6 months 2 1.7
8 Internet banking use
No 97 79.0 Yes 23 21.0
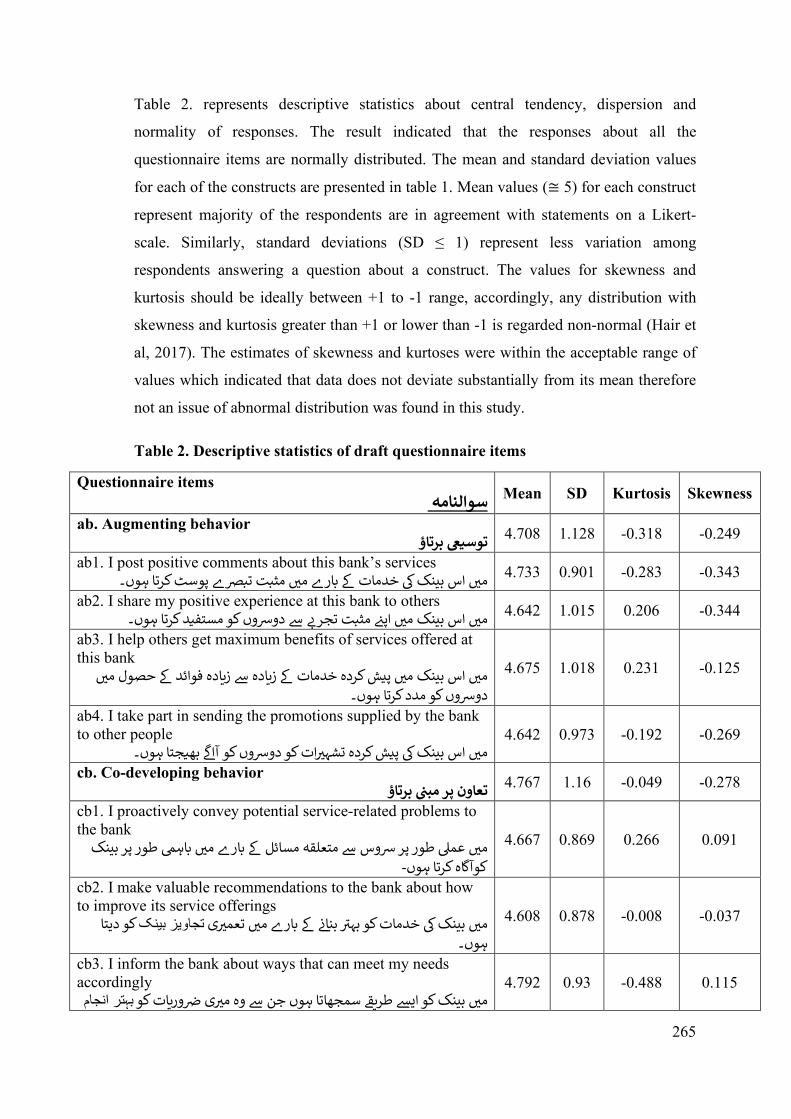
265
Table 2. represents descriptive statistics about central tendency, dispersion and
normality of responses. The result indicated that the responses about all the
questionnaire items are normally distributed. The mean and standard deviation values
for each of the constructs are presented in table 1. Mean values (≅ 5) for each construct
represent majority of the respondents are in agreement with statements on a Likert-
scale. Similarly, standard deviations (SD ≤ 1) represent less variation among
respondents answering a question about a construct. The values for skewness and
kurtosis should be ideally between +1 to -1 range, accordingly, any distribution with
skewness and kurtosis greater than +1 or lower than -1 is regarded non-normal (Hair et
al, 2017). The estimates of skewness and kurtoses were within the acceptable range of
values which indicated that data does not deviate substantially from its mean therefore
not an issue of abnormal distribution was found in this study.
Table 2. Descriptive statistics of draft questionnaire items
Questionnaire items سوالنامہ
Mean SD Kurtosis Skewness
ab. Augmenting behavior 0.249- 0.318- 1.128 4.708 توس�� برتاؤ
ab1. I post positive comments about this bank’s services 0.343- 0.283- 0.901 4.733 پوسٹ کرتا ہوں۔منی اس بینک � خدمات � بار� منی مثبت تب��
ab2. I share my positive experience at this bank to others 0.344- 0.206 1.015 4.642 منی اس بینک منی اپ�ن مثبت تجر�ب � دو�وں کو مستف�د کرتا ہوں۔
ab3. I help others get maximum benefits of services offered at this bank
منی اس بینک منی پ�ش کردە خدمات � ز�ادە � ز�ادە فوائد � حصول منی دو�وں کو مدد کرتا ہوں۔
4.675 1.018 0.231 -0.125
ab4. I take part in sending the promotions supplied by the bank to other people
ات کو دو�وں کو بھ�جتا ہوں۔منی اس بینک � پ�ش کردە �شہ�یگ
آا�4.642 0.973 -0.192 -0.269
cb. Co-developing behavior 0.278- 0.049- 1.16 4.767 تعاون پر مبین برتاؤ
cb1. I proactively convey potential service-related problems to the bank
بینک منی عم� طور پر �وس � متعلقہ مسائل � بار� منی باہ� طور پر -کوآ�اە کرتا ہوں
4.667 0.869 0.266 0.091
cb2. I make valuable recommendations to the bank about how to improve its service offerings
ی کو دیتا تجاویز بینکمنی بینک � خدمات کو بہ�ت بنا�ن � بار� منی تعم�ی ہوں۔
4.608 0.878 -0.008 -0.037
cb3. I inform the bank about ways that can meet my needs accordingly
ور�ات کو ی �ن بہتر انجاممنی بینک کو ا�� ط���ت سمجھاتا ہوں جن � وە م�ی4.792 0.93 -0.488 0.115
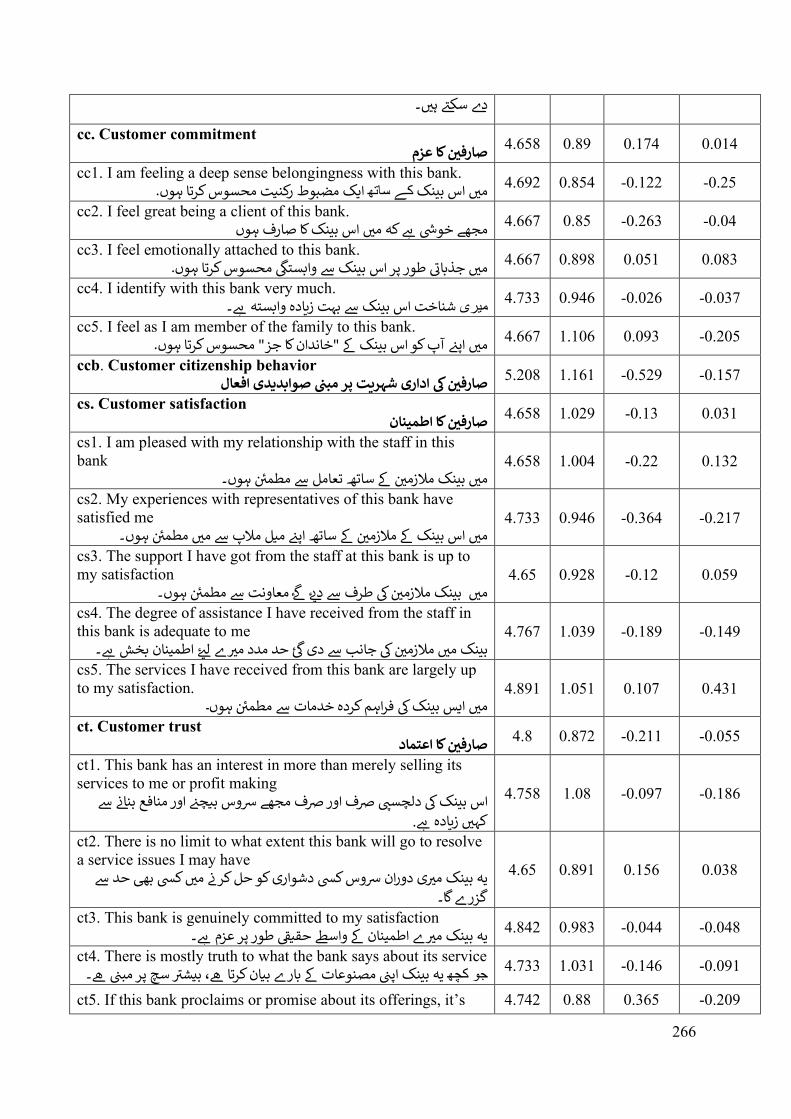
266
۔ دے سک�ت ہنی
cc. Customer commitment ن کا عزم 0.014 0.174 0.89 4.658 صارفںی
cc1. I am feeling a deep sense belongingness with this bank. 0.25- 0.122- 0.854 4.692 ا�ک مضبوط رکن�ت محسوس کرتا ہوں. کے ساتھمنی اس بینک
cc2. I feel great being a client of this bank. 0.04- 0.263- 0.85 4.667 مجھ� خو�ش �� کہ منی اس بینک کا صارف ہوں
cc3. I feel emotionally attached to this bank. محسوس کرتا ہوں.
گ 0.083 0.051 0.898 4.667 منی جذبائت طور پر اس بینک � وا�ست�
cc4. I identify with this bank very much. ۔ میری 0.037- 0.026- 0.946 4.733 شناخت اس بینک � بہت ز�ادە وا�ستہ ��
cc5. I feel as I am member of the family to this bank. 0.205- 0.093 1.106 4.667 منی اپ�ن آپ کو اس بینک � "خاندان کا جز" محسوس کرتا ہوں.
ccb. Customer citizenship behavior ن � اداری شہ��ت پر مبین 0.157- 0.529- 1.161 5.208 افعال صوابد�دی صارفںی
cs. Customer satisfaction ن کا اطمینان 0.031 0.13- 1.029 4.658 صارفںی
cs1. I am pleased with my relationship with the staff in this bank
ن ہوں۔ ن � ساتھ تعامل � مطمنئ منی بینک مالزمنی4.658 1.004 -0.22 0.132
cs2. My experiences with representatives of this bank have satisfied me
ن ہوں۔ ن � ساتھ اپ�ن م�ل مالپ � منی مطمنئ منی اس بینک � مالزمنی4.733 0.946 -0.364 -0.217
cs3. The support I have got from the staff at this bank is up to my satisfaction
ن ہوں۔ ئ معاونت � مطمنئگ
ئ � ن � طرف � د�ی منی بینک مالزمنی4.65 0.928 -0.12 0.059
cs4. The degree of assistance I have received from the staff in this bank is adequate to me
ئ اطمینان � ل�ی ئ حد مدد م�ی گن � جانب � دی � ۔ بینک منی مالزمنی بخش ��
4.767 1.039 -0.189 -0.149
cs5. The services I have received from this bank are largely up to my satisfaction.
ن ہوں � ینکب �سا نی م ۔ فراہم کردە خدمات � مطمنئ4.891 1.051 0.107 0.431
ct. Customer trust ن کا اعتماد 0.055- 0.211- 0.872 4.8 صارفںی
ct1. This bank has an interest in more than merely selling its services to me or profit making
اس بینک � دلچسیپ �ف اور �ف مجھ� �وس ب�چ�ن اور منافع بنا�ن � .کہنی ز�ادە ��
4.758 1.08 -0.097 -0.186
ct2. There is no limit to what extent this bank will go to resolve a service issues I may have
ی دوران �وس ک� دشواری کو حل کر�ن منی ک� ب� حد � یہ بینک م�ی گا۔ گزر�
4.65 0.891 0.156 0.038
ct3. This bank is genuinely committed to my satisfaction � اطمینان � واس� حق��ت طور پر ۔ یہ بینک م�ی 0.048- 0.044- 0.983 4.842 عزم ��
ct4. There is mostly truth to what the bank says about its service 0.091- 0.146- 1.031 4.733 یہ بینک اپین مصنوعات � بار� ب�ان کرتا �، ب�ش�ت سچ پر مبین �۔ جو کچھ
ct5. If this bank proclaims or promise about its offerings, it’s 4.742 0.88 0.365 -0.209
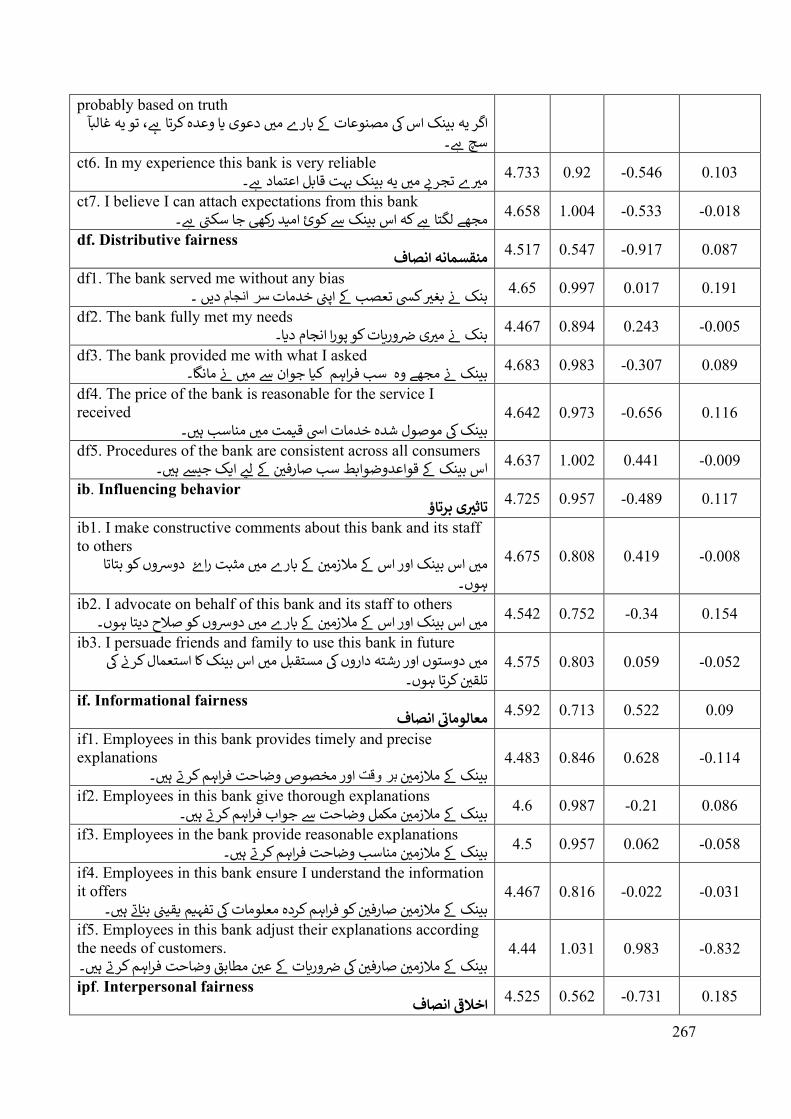
267
probably based on truth ، تو یہ غالبآ ا�ر یہ بینک اس � مصنوعات � بار� منی دعوی �ا وعدە کرتا ��
۔ سچ ��ct6. In my experience this bank is very reliable
� تجر�ب منی یہ بینک بہت قابل اعتماد �� 0.103 0.546- 0.92 4.733 ۔ م�ی
ct7. I believe I can attach expectations from this bank ۔ 0.018- 0.533- 1.004 4.658 مجھ� لگتا �� کہ اس بینک � کوئ ام�د رک� جا سکیت ��
df. Distributive fairness 0.087 0.917- 0.547 4.517 منقسمانہ انصاف
df1. The bank served me without any bias 0.191 0.017 0.997 4.65 دیں ۔ سر انجام بنک �ن بغ�ی ک� تعصب � اپین خدمات
df2. The bank fully met my needs ور�ات کو پورا انجام د�ا۔ ی �ن 0.005- 0.243 0.894 4.467 بنک �ن م�ی
df3. The bank provided me with what I asked 0.089 0.307- 0.983 4.683 فراہم ک�ا جوان � منی �ن مانگا۔ بینک �ن مجھ� وە سب
df4. The price of the bank is reasonable for the service I received
۔ بینک � موصول شدە خدمات ا� ق�مت منی مناسب ہنی4.642 0.973 -0.656 0.116
df5. Procedures of the bank are consistent across all consumers ن � قواعدوضوابط سب صارف ینکس با 0.009- 0.441 1.002 4.637 ۔ نی ہ ی�ج �ک ا �ی � ل نی
ib. Influencing behavior ی برتاؤ 0.117 0.489- 0.957 4.725 تاث�ی
ib1. I make constructive comments about this bank and its staff to others
ن � بار� منی مثبت را� دو�وں کو بتاتا منی اس بینک اور اس � مالزمنی ہوں۔
4.675 0.808 0.419 -0.008
ib2. I advocate on behalf of this bank and its staff to others ن � بار� منی دو�وں کو صالح دیتا ہوں 0.154 0.34- 0.752 4.542 ۔منی اس بینک اور اس � مالزمنی
ib3. I persuade friends and family to use this bank in future منی دوستوں اور رشتہ داروں � مستقبل منی اس بینک کا استعمال کر�ن �
ن کرتا ہوں۔ تلقنی4.575 0.803 0.059 -0.052
if. Informational fairness 0.09 0.522 0.713 4.592 معالومایق انصاف
if1. Employees in this bank provides timely and precise explanations
ن ۔ بر وقتبینک � مالزمنی اور مخصوص وضاحت فراہم کر�ت ہنی4.483 0.846 0.628 -0.114
if2. Employees in this bank give thorough explanations ۔ ن مکمل وضاحت � جواب فراہم کر�ت ہنی 0.086 0.21- 0.987 4.6 بینک � مالزمنی
if3. Employees in the bank provide reasonable explanations ۔ ن مناسب وضاحت فراہم کر�ت ہنی 0.058- 0.062 0.957 4.5 بینک � مالزمنی
if4. Employees in this bank ensure I understand the information it offers
ن � مالزم ینکب ن صارف نی ۔ نی بنا�ت ہ �قیین �متفہ کو فراہم کردە معلومات � نی4.467 0.816 -0.022 -0.031
if5. Employees in this bank adjust their explanations according the needs of customers.
ور�ات ن � �ن ن صارفنی ن مطابق وضاحت فراہم کر�ت ہنی � بینک � مالزمنی ۔ عنی4.44 1.031 0.983 -0.832
ipf. Interpersonal fairness 0.185 0.731- 0.562 4.525 اخال�ق انصاف
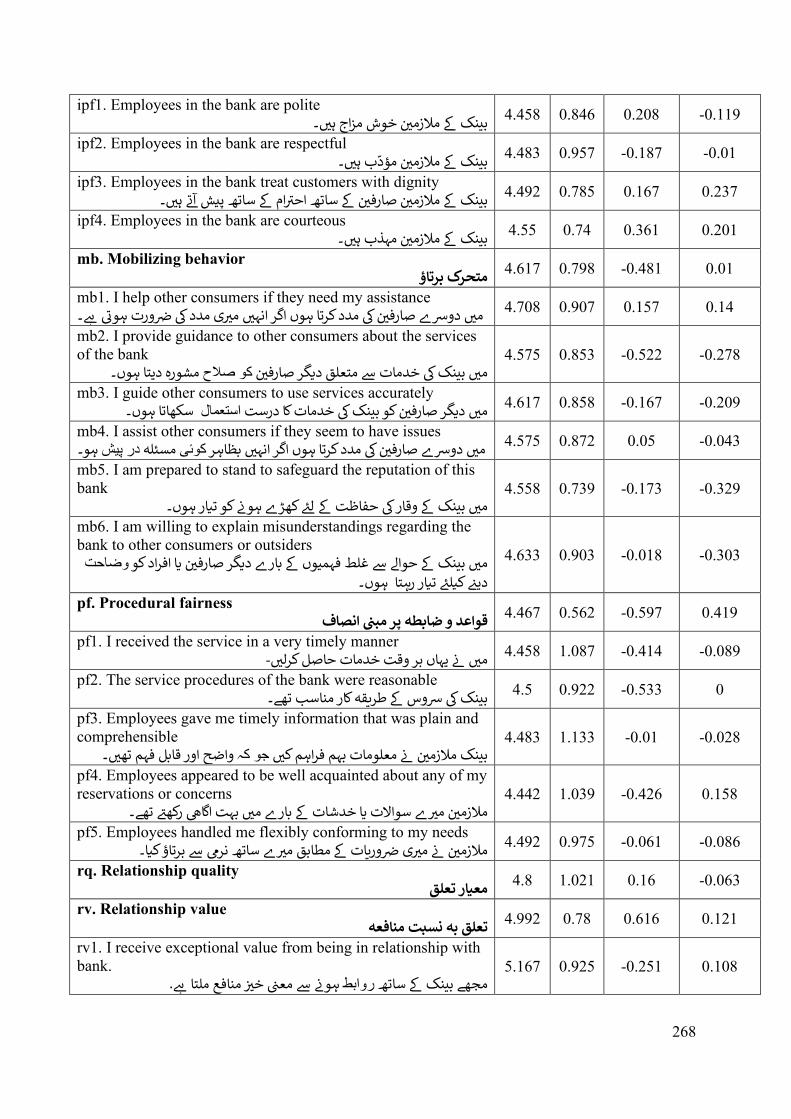
268
ipf1. Employees in the bank are polite ۔ ن خوش مزاج ہنی 0.119- 0.208 0.846 4.458 بینک � مالزمنی
ipf2. Employees in the bank are respectful ۔ ن مؤّدب ہنی 0.01- 0.187- 0.957 4.483 بینک � مالزمنی
ipf3. Employees in the bank treat customers with dignity ۔ ام � ساتھ پ�ش آ�ت ہنی ن � ساتھ اح�ت ن صارفنی 0.237 0.167 0.785 4.492 بینک � مالزمنی
ipf4. Employees in the bank are courteous ن ۔ بینک � مالزمنی 0.201 0.361 0.74 4.55 مہذب ہنی
mb. Mobilizing behavior 0.01 0.481- 0.798 4.617 متحرک برتاؤ
mb1. I help other consumers if they need my assistance ۔ ورت ہوئت �� ی مدد � �ن ن � مدد کرتا ہوں ا�ر انہنی م�ی 0.14 0.157 0.907 4.708 منی دو�� صارفنی
mb2. I provide guidance to other consumers about the services of the bank
ن مشورە دیتا ہوں۔ کو صالحمنی بینک � خدمات � متعلق د�گر صارفنی4.575 0.853 -0.522 -0.278
mb3. I guide other consumers to use services accurately ن کو بینک � خدمات کا درست 0.209- 0.167- 0.858 4.617 سکھاتا ہوں۔ استعمالمنی د�گر صارفنی
mb4. I assist other consumers if they seem to have issues ن � مدد کرتا ہوں ا�ر انہنی بظاہر ہو۔ در پیشمسئلہ کوئیمنی دو�� صارفنی 4.575 0.872 0.05 -0.043
mb5. I am prepared to stand to safeguard the reputation of this bank
منی بینک � وقار � حفاظت � ل�ئ کھڑ� ہو�ن کو ت�ار ہوں۔4.558 0.739 -0.173 -0.329
mb6. I am willing to explain misunderstandings regarding the bank to other consumers or outsiders
ن �ا افراد کو منی بینک � حوا وضاحت� � غلط فہمیوں � بار� د�گر صارفنی ہوں۔ ر�تا دی�ن ک�ل�ئ ت�ار
4.633 0.903 -0.018 -0.303
pf. Procedural fairness 0.419 0.597- 0.562 4.467 انصافقواعد و ضابطہ پر مبین
pf1. I received the service in a very timely manner 0.089- 0.414- 1.087 4.458 -منی �ن یہاں بر وقت خدمات حاصل کرلنی
pf2. The service procedures of the bank were reasonable 0 0.533- 0.922 4.5 بینک � �وس � ط��قہ کار مناسب تھ�۔
pf3. Employees gave me timely information that was plain and comprehensible
ن �ن معلومات بہم فراہم کنی ۔ جو کہبینک مالزمنی واضح اور قابل فہم تھنی4.483 1.133 -0.01 -0.028
pf4. Employees appeared to be well acquainted about any of my reservations or concerns
� ن م�ی سواالت �ا خدشات � بار� منی بہت ا�ا� رکھ�ت تھ�۔ مالزمنی4.442 1.039 -0.426 0.158
pf5. Employees handled me flexibly conforming to my needs � ساتھ نر� � برتاؤ ک�ا۔ ور�ات � مطابق م�ی ی �ن ن �ن م�ی 0.086- 0.061- 0.975 4.492 مالزمنی
rq. Relationship quality 0.063- 0.16 1.021 4.8 مع�ار تعلق
rv. Relationship value 0.121 0.616 0.78 4.992 تعلق بہ �سبت منافعہ
rv1. I receive exceptional value from being in relationship with bank.
. روابطمجھ� بینک � ساتھ ن منافع ملتا �� ہو�ن � معین خ�ی5.167 0.925 -0.251 0.108
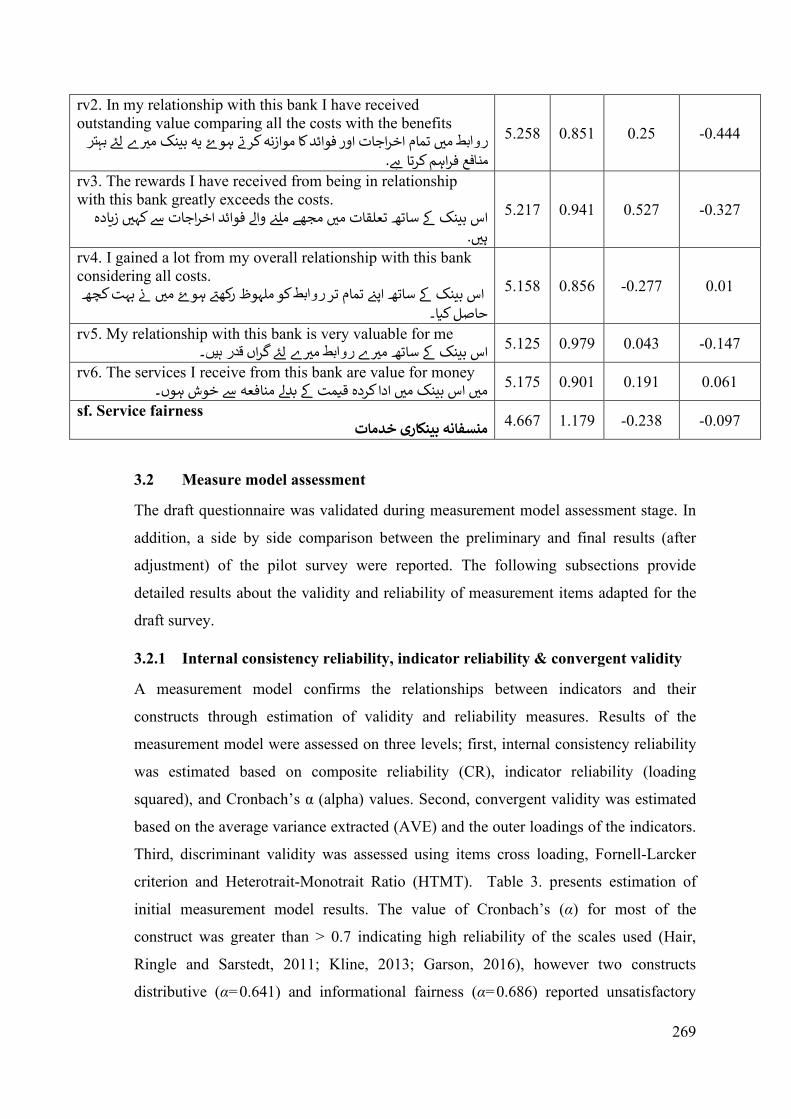
269
rv2. In my relationship with this bank I have received outstanding value comparing all the costs with the benefits
� ل�ئ روابط بہتر منی تمام اخراجات اور فوائد کا موازنہ کر�ت ہو� یہ بینک م�ی. ف منافع راہم کرتا ��
5.258 0.851 0.25 -0.444
rv3. The rewards I have received from being in relationship with this bank greatly exceeds the costs.
اس بینک � ساتھ تعلقات منی مجھ� مل�ن وا� فوائد اخراجات � کہنی ز�ادە . ہنی
5.217 0.941 0.527 -0.327
rv4. I gained a lot from my overall relationship with this bank considering all costs.
کو ملہوظ رکھ�ت ہو� منی �ن بہت کچھ روابطاس بینک � ساتھ اپ�ن تمام تر حاصل ک�ا۔
5.158 0.856 -0.277 0.01
rv5. My relationship with this bank is very valuable for me � � ل�ئ گراں روابطاس بینک � ساتھ م�ی 0.147- 0.043 0.979 5.125 ۔قدر ہیںم�ی
rv6. The services I receive from this bank are value for money 0.061 0.191 0.901 5.175 منی اس بینک منی ادا کردە ق�مت � بد� منافعہ � خوش ہوں۔
sf. Service fairness 0.097- 0.238- 1.179 4.667 منسفانہ بینکاری خدمات
3.2 Measure model assessment
The draft questionnaire was validated during measurement model assessment stage. In
addition, a side by side comparison between the preliminary and final results (after
adjustment) of the pilot survey were reported. The following subsections provide
detailed results about the validity and reliability of measurement items adapted for the
draft survey.
3.2.1 Internal consistency reliability, indicator reliability & convergent validity
A measurement model confirms the relationships between indicators and their
constructs through estimation of validity and reliability measures. Results of the
measurement model were assessed on three levels; first, internal consistency reliability
was estimated based on composite reliability (CR), indicator reliability (loading
squared), and Cronbach’s α (alpha) values. Second, convergent validity was estimated
based on the average variance extracted (AVE) and the outer loadings of the indicators.
Third, discriminant validity was assessed using items cross loading, Fornell-Larcker
criterion and Heterotrait-Monotrait Ratio (HTMT). Table 3. presents estimation of
initial measurement model results. The value of Cronbach’s (α) for most of the
construct was greater than > 0.7 indicating high reliability of the scales used (Hair,
Ringle and Sarstedt, 2011; Kline, 2013; Garson, 2016), however two constructs
distributive (α=0.641) and informational fairness (α=0.686) reported unsatisfactory
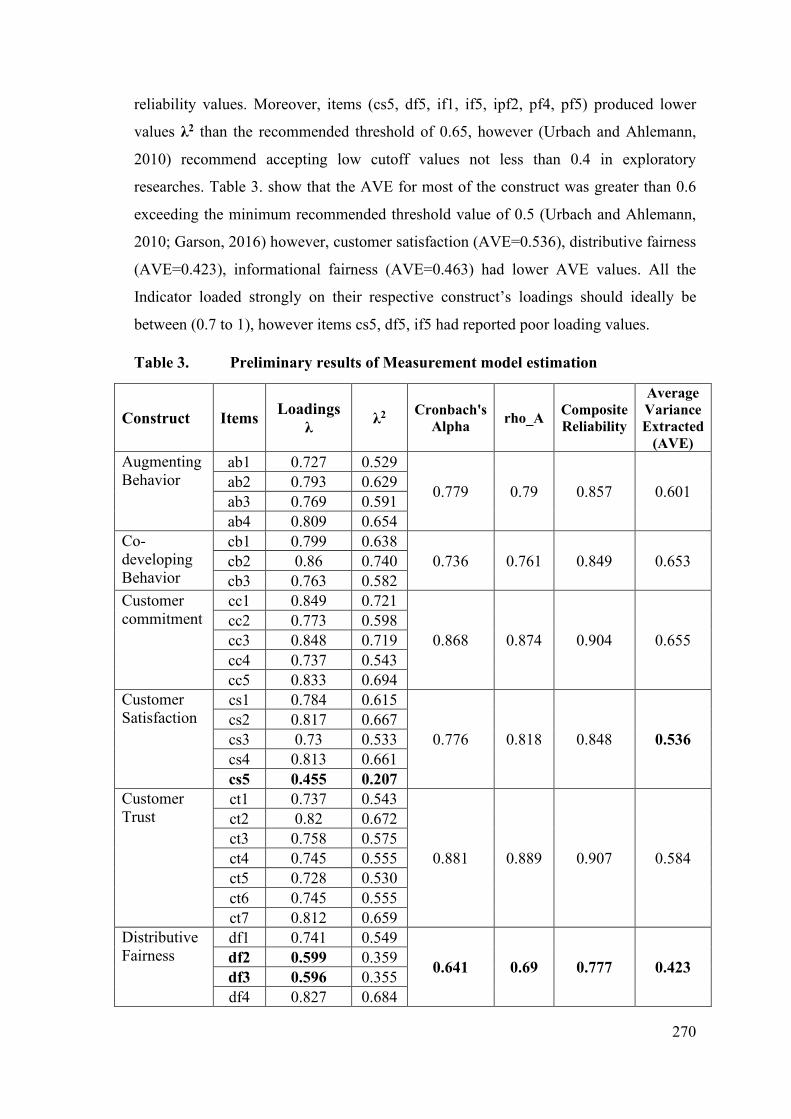
270
reliability values. Moreover, items (cs5, df5, if1, if5, ipf2, pf4, pf5) produced lower
values λ2 than the recommended threshold of 0.65, however (Urbach and Ahlemann,
2010) recommend accepting low cutoff values not less than 0.4 in exploratory
researches. Table 3. show that the AVE for most of the construct was greater than 0.6
exceeding the minimum recommended threshold value of 0.5 (Urbach and Ahlemann,
2010; Garson, 2016) however, customer satisfaction (AVE=0.536), distributive fairness
(AVE=0.423), informational fairness (AVE=0.463) had lower AVE values. All the
Indicator loaded strongly on their respective construct’s loadings should ideally be
between (0.7 to 1), however items cs5, df5, if5 had reported poor loading values.
Table 3. Preliminary results of Measurement model estimation
Construct Items Loadings λ λ2 Cronbach's
Alpha rho_A Composite Reliability
Average Variance Extracted
(AVE) Augmenting Behavior
ab1 0.727 0.529
0.779 0.79 0.857 0.601 ab2 0.793 0.629 ab3 0.769 0.591 ab4 0.809 0.654
Co-developing Behavior
cb1 0.799 0.638 0.736 0.761 0.849 0.653 cb2 0.86 0.740
cb3 0.763 0.582 Customer commitment
cc1 0.849 0.721
0.868 0.874 0.904 0.655 cc2 0.773 0.598 cc3 0.848 0.719 cc4 0.737 0.543 cc5 0.833 0.694
Customer Satisfaction
cs1 0.784 0.615
0.776 0.818 0.848 0.536 cs2 0.817 0.667 cs3 0.73 0.533 cs4 0.813 0.661 cs5 0.455 0.207
Customer Trust
ct1 0.737 0.543
0.881 0.889 0.907 0.584
ct2 0.82 0.672 ct3 0.758 0.575 ct4 0.745 0.555 ct5 0.728 0.530 ct6 0.745 0.555 ct7 0.812 0.659
Distributive Fairness
df1 0.741 0.549
0.641 0.69 0.777 0.423 df2 0.599 0.359 df3 0.596 0.355 df4 0.827 0.684
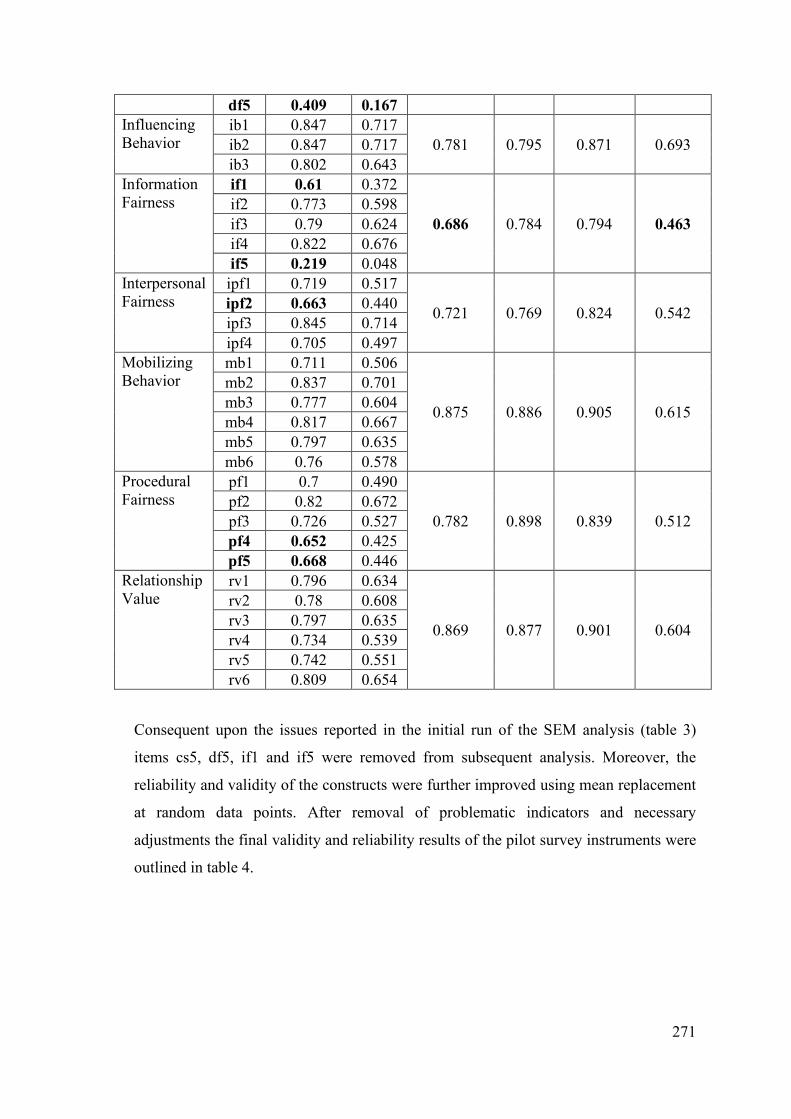
271
Consequent upon the issues reported in the initial run of the SEM analysis (table 3)
items cs5, df5, if1 and if5 were removed from subsequent analysis. Moreover, the
reliability and validity of the constructs were further improved using mean replacement
at random data points. After removal of problematic indicators and necessary
adjustments the final validity and reliability results of the pilot survey instruments were
outlined in table 4.
df5 0.409 0.167 Influencing Behavior
ib1 0.847 0.717 0.781 0.795 0.871 0.693 ib2 0.847 0.717
ib3 0.802 0.643 Information Fairness
if1 0.61 0.372
0.686 0.784 0.794 0.463 if2 0.773 0.598 if3 0.79 0.624 if4 0.822 0.676 if5 0.219 0.048
Interpersonal Fairness
ipf1 0.719 0.517
0.721 0.769 0.824 0.542 ipf2 0.663 0.440 ipf3 0.845 0.714 ipf4 0.705 0.497
Mobilizing Behavior
mb1 0.711 0.506
0.875 0.886 0.905 0.615
mb2 0.837 0.701 mb3 0.777 0.604 mb4 0.817 0.667 mb5 0.797 0.635 mb6 0.76 0.578
Procedural Fairness
pf1 0.7 0.490
0.782 0.898 0.839 0.512 pf2 0.82 0.672 pf3 0.726 0.527 pf4 0.652 0.425 pf5 0.668 0.446
Relationship Value
rv1 0.796 0.634
0.869 0.877 0.901 0.604
rv2 0.78 0.608 rv3 0.797 0.635 rv4 0.734 0.539 rv5 0.742 0.551 rv6 0.809 0.654
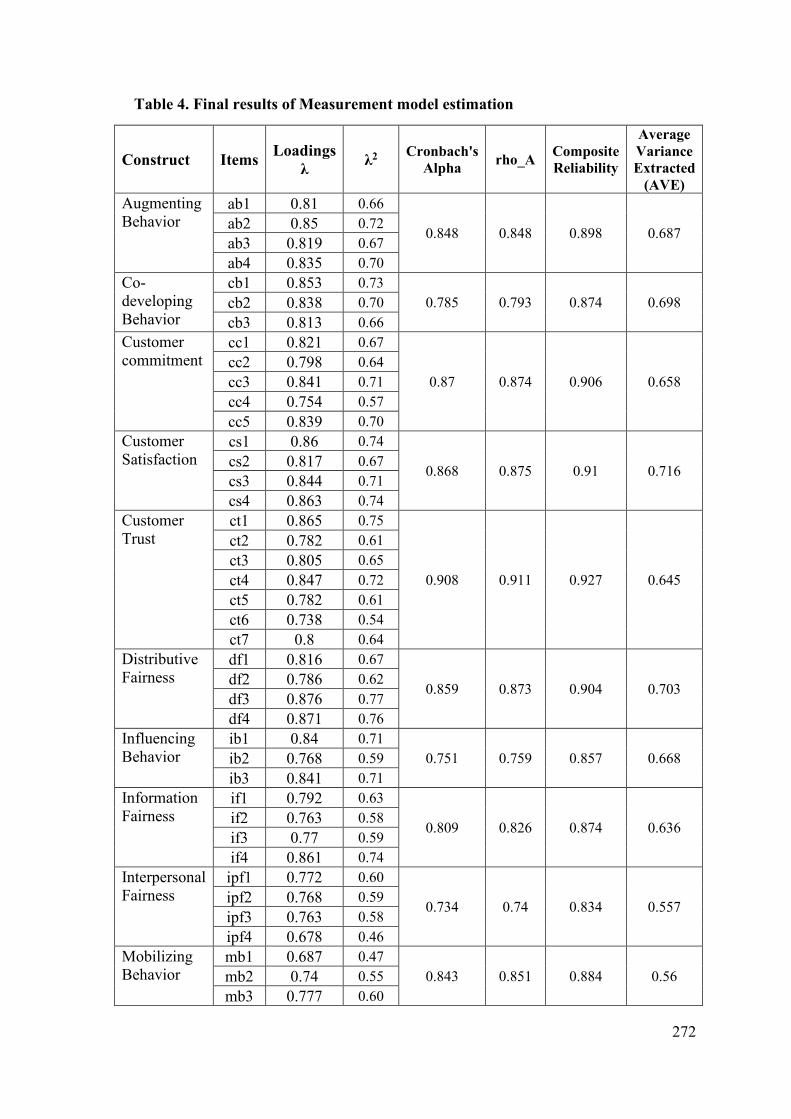
272
Table 4. Final results of Measurement model estimation
Construct Items Loadings λ λ2 Cronbach's
Alpha rho_A Composite Reliability
Average Variance Extracted
(AVE) Augmenting Behavior
ab1 0.81 0.66
0.848 0.848 0.898 0.687 ab2 0.85 0.72 ab3 0.819 0.67 ab4 0.835 0.70
Co-developing Behavior
cb1 0.853 0.73 0.785 0.793 0.874 0.698 cb2 0.838 0.70
cb3 0.813 0.66 Customer commitment
cc1 0.821 0.67
0.87 0.874 0.906 0.658 cc2 0.798 0.64 cc3 0.841 0.71 cc4 0.754 0.57 cc5 0.839 0.70
Customer Satisfaction
cs1 0.86 0.74
0.868 0.875 0.91 0.716 cs2 0.817 0.67 cs3 0.844 0.71 cs4 0.863 0.74
Customer Trust
ct1 0.865 0.75
0.908 0.911 0.927 0.645
ct2 0.782 0.61 ct3 0.805 0.65 ct4 0.847 0.72 ct5 0.782 0.61 ct6 0.738 0.54 ct7 0.8 0.64
Distributive Fairness
df1 0.816 0.67
0.859 0.873 0.904 0.703 df2 0.786 0.62 df3 0.876 0.77 df4 0.871 0.76
Influencing Behavior
ib1 0.84 0.71 0.751 0.759 0.857 0.668 ib2 0.768 0.59
ib3 0.841 0.71 Information Fairness
if1 0.792 0.63
0.809 0.826 0.874 0.636 if2 0.763 0.58 if3 0.77 0.59 if4 0.861 0.74
Interpersonal Fairness
ipf1 0.772 0.60
0.734 0.74 0.834 0.557 ipf2 0.768 0.59 ipf3 0.763 0.58 ipf4 0.678 0.46
Mobilizing Behavior
mb1 0.687 0.47 0.843 0.851 0.884 0.56 mb2 0.74 0.55
mb3 0.777 0.60
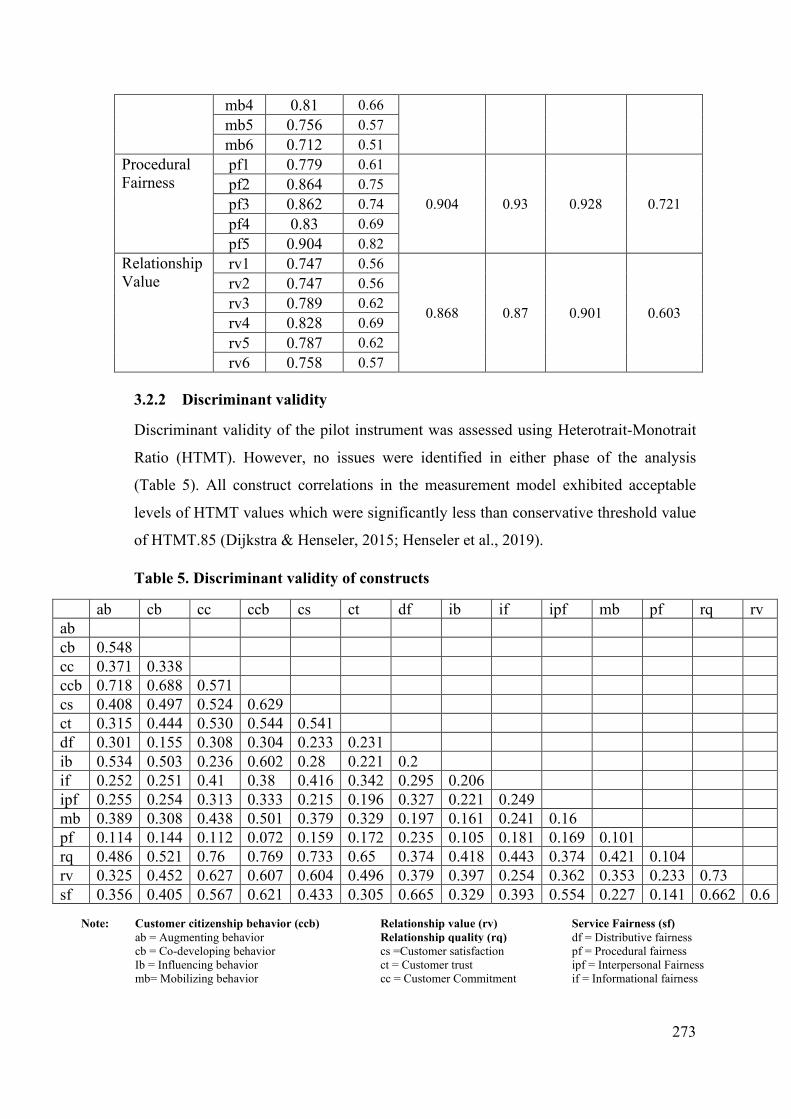
273
3.2.2 Discriminant validity
Discriminant validity of the pilot instrument was assessed using Heterotrait-Monotrait
Ratio (HTMT). However, no issues were identified in either phase of the analysis
(Table 5). All construct correlations in the measurement model exhibited acceptable
levels of HTMT values which were significantly less than conservative threshold value
of HTMT.85 (Dijkstra & Henseler, 2015; Henseler et al., 2019).
Table 5. Discriminant validity of constructs
ab cb cc ccb cs ct df ib if ipf mb pf rq rv ab
cb 0.548
cc 0.371 0.338
ccb 0.718 0.688 0.571
cs 0.408 0.497 0.524 0.629
ct 0.315 0.444 0.530 0.544 0.541
df 0.301 0.155 0.308 0.304 0.233 0.231
ib 0.534 0.503 0.236 0.602 0.28 0.221 0.2
if 0.252 0.251 0.41 0.38 0.416 0.342 0.295 0.206
ipf 0.255 0.254 0.313 0.333 0.215 0.196 0.327 0.221 0.249
mb 0.389 0.308 0.438 0.501 0.379 0.329 0.197 0.161 0.241 0.16
pf 0.114 0.144 0.112 0.072 0.159 0.172 0.235 0.105 0.181 0.169 0.101
rq 0.486 0.521 0.76 0.769 0.733 0.65 0.374 0.418 0.443 0.374 0.421 0.104
rv 0.325 0.452 0.627 0.607 0.604 0.496 0.379 0.397 0.254 0.362 0.353 0.233 0.73
sf 0.356 0.405 0.567 0.621 0.433 0.305 0.665 0.329 0.393 0.554 0.227 0.141 0.662 0.6
Note: Customer citizenship behavior (ccb) ab = Augmenting behavior cb = Co-developing behavior Ib = Influencing behavior mb= Mobilizing behavior
Relationship value (rv) Relationship quality (rq)
Service Fairness (sf) df = Distributive fairness pf = Procedural fairness ipf = Interpersonal Fairness if = Informational fairness
cs =Customer satisfaction ct = Customer trust cc = Customer Commitment
mb4 0.81 0.66 mb5 0.756 0.57 mb6 0.712 0.51
Procedural Fairness
pf1 0.779 0.61
0.904 0.93 0.928 0.721 pf2 0.864 0.75 pf3 0.862 0.74 pf4 0.83 0.69 pf5 0.904 0.82
Relationship Value
rv1 0.747 0.56
0.868 0.87 0.901 0.603
rv2 0.747 0.56 rv3 0.789 0.62 rv4 0.828 0.69 rv5 0.787 0.62 rv6 0.758 0.57
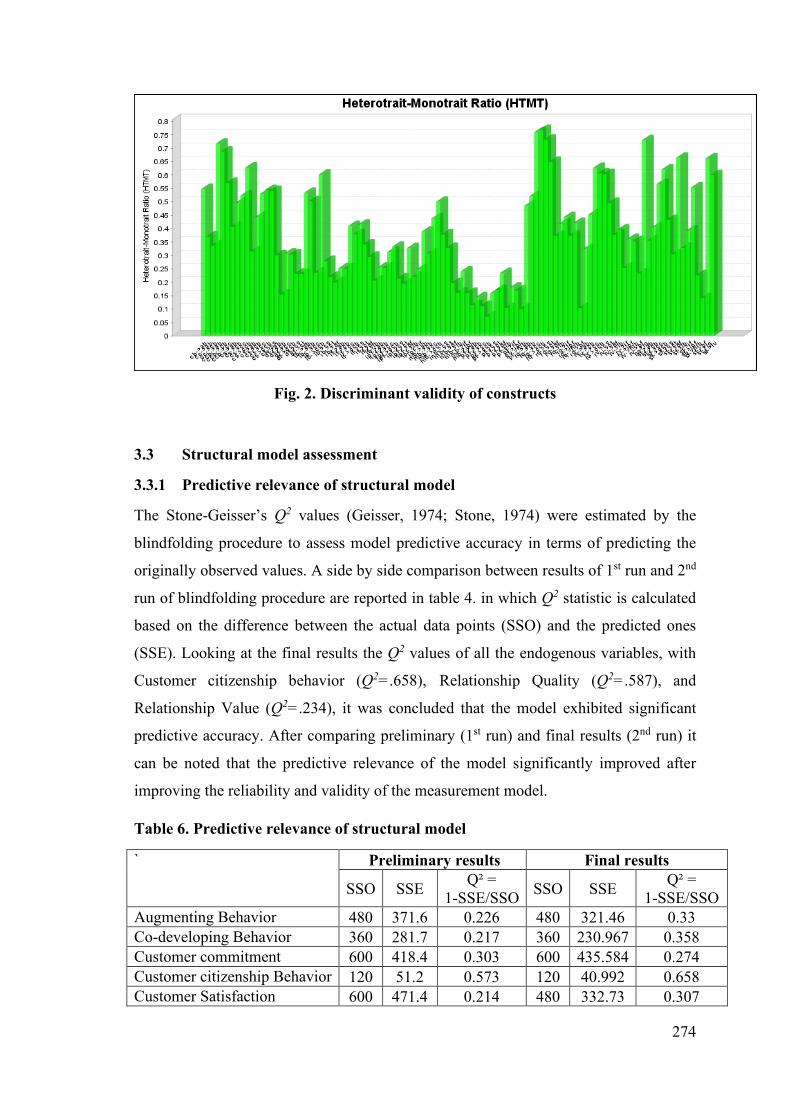
274
Fig. 2. Discriminant validity of constructs
3.3 Structural model assessment
3.3.1 Predictive relevance of structural model
The Stone-Geisser’s Q2 values (Geisser, 1974; Stone, 1974) were estimated by the
blindfolding procedure to assess model predictive accuracy in terms of predicting the
originally observed values. A side by side comparison between results of 1st run and 2nd
run of blindfolding procedure are reported in table 4. in which Q2 statistic is calculated
based on the difference between the actual data points (SSO) and the predicted ones
(SSE). Looking at the final results the Q2 values of all the endogenous variables, with
Customer citizenship behavior (Q2=.658), Relationship Quality (Q2=.587), and
Relationship Value (Q2=.234), it was concluded that the model exhibited significant
predictive accuracy. After comparing preliminary (1st run) and final results (2nd run) it
can be noted that the predictive relevance of the model significantly improved after
improving the reliability and validity of the measurement model.
Table 6. Predictive relevance of structural model
` Preliminary results Final results
SSO SSE Q² = 1-SSE/SSO SSO SSE Q² =
1-SSE/SSO Augmenting Behavior 480 371.6 0.226 480 321.46 0.33 Co-developing Behavior 360 281.7 0.217 360 230.967 0.358 Customer commitment 600 418.4 0.303 600 435.584 0.274 Customer citizenship Behavior 120 51.2 0.573 120 40.992 0.658 Customer Satisfaction 600 471.4 0.214 480 332.73 0.307
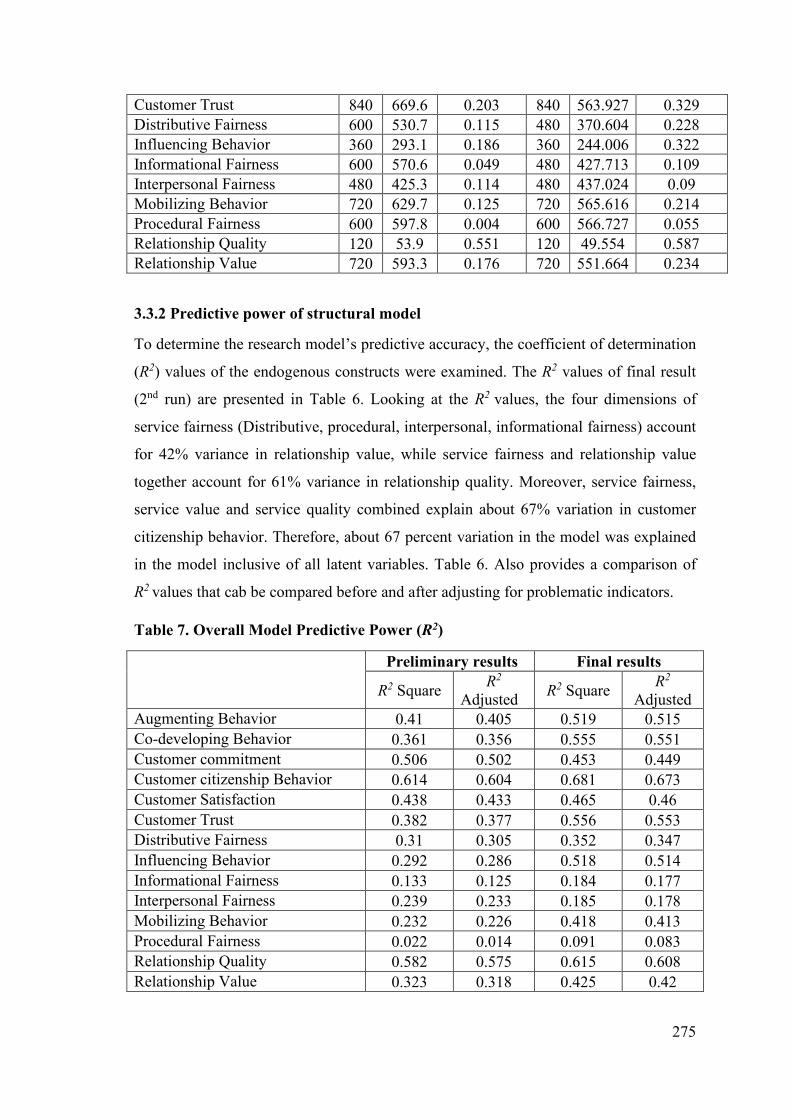
275
Customer Trust 840 669.6 0.203 840 563.927 0.329 Distributive Fairness 600 530.7 0.115 480 370.604 0.228 Influencing Behavior 360 293.1 0.186 360 244.006 0.322 Informational Fairness 600 570.6 0.049 480 427.713 0.109 Interpersonal Fairness 480 425.3 0.114 480 437.024 0.09 Mobilizing Behavior 720 629.7 0.125 720 565.616 0.214 Procedural Fairness 600 597.8 0.004 600 566.727 0.055 Relationship Quality 120 53.9 0.551 120 49.554 0.587 Relationship Value 720 593.3 0.176 720 551.664 0.234
3.3.2 Predictive power of structural model
To determine the research model’s predictive accuracy, the coefficient of determination
(R2) values of the endogenous constructs were examined. The R2 values of final result
(2nd run) are presented in Table 6. Looking at the R2 values, the four dimensions of
service fairness (Distributive, procedural, interpersonal, informational fairness) account
for 42% variance in relationship value, while service fairness and relationship value
together account for 61% variance in relationship quality. Moreover, service fairness,
service value and service quality combined explain about 67% variation in customer
citizenship behavior. Therefore, about 67 percent variation in the model was explained
in the model inclusive of all latent variables. Table 6. Also provides a comparison of
R2 values that cab be compared before and after adjusting for problematic indicators.
Table 7. Overall Model Predictive Power (R2)
Preliminary results Final results
R2 Square R2 Adjusted R2 Square R2
Adjusted Augmenting Behavior 0.41 0.405 0.519 0.515 Co-developing Behavior 0.361 0.356 0.555 0.551 Customer commitment 0.506 0.502 0.453 0.449 Customer citizenship Behavior 0.614 0.604 0.681 0.673 Customer Satisfaction 0.438 0.433 0.465 0.46 Customer Trust 0.382 0.377 0.556 0.553 Distributive Fairness 0.31 0.305 0.352 0.347 Influencing Behavior 0.292 0.286 0.518 0.514 Informational Fairness 0.133 0.125 0.184 0.177 Interpersonal Fairness 0.239 0.233 0.185 0.178 Mobilizing Behavior 0.232 0.226 0.418 0.413 Procedural Fairness 0.022 0.014 0.091 0.083 Relationship Quality 0.582 0.575 0.615 0.608 Relationship Value 0.323 0.318 0.425 0.42
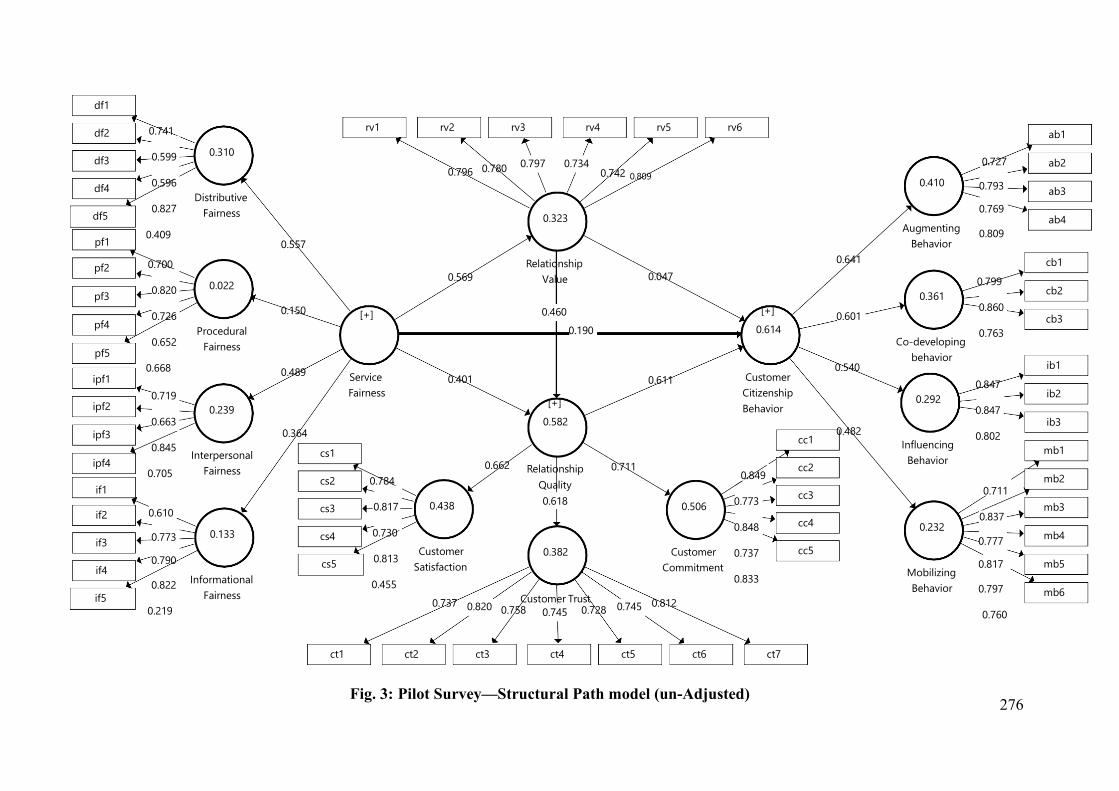
276
0.796 0.797 0.734 0.742 0.809 0.780
0.190
0.401
0.569 0.047
0.611
0.460
0.482
0.711
0.837
0.777 0.817
0.797
0.760
0.540 0.847
0.847
0.802
0.641
0.727 0.793 0.769
0.809
0.601
0.799
0.860
0.763
0.758 0.728 0.737 0.820 0.745 0.745 0.812
0.711 0.849
0.773
0.848
0.737
0.833
0.662 0.784
0.817
0.730
0.813
0.455
0.489 0.719
0.663
0.845
0.705
0.364
0.610 0.773 0.790
0.822
0.219
0.150
0.700
0.820
0.726
0.652
0.668
0.557
0.741
0.599
0.596
0.827
0.409
rv3 rv6 rv1 rv4 rv5 rv2
[+]
Service Fairness
[+]
0.614
Customer Citizenship Behavior
0.323
Relationship Value
[+]
0.582
Relationship Quality 0.618
0.232
Mobilizing Behavior
mb4
mb5
mb6
mb2
mb3
mb1
0.292
Influencing Behavior
ib1
ib3
ib2
0.410
Augmenting Behavior
ab1
ab3
ab4
ab2
0.361
Co-developing behavior
cb3
cb1
cb2
0.382
Customer Trust
ct3 ct5 ct1 ct2 ct4 ct6 ct7
0.506
Customer Commitment
cc3
cc4
cc5
cc2
cc1
0.438
Customer Satisfaction cs5
cs3
cs4
cs1
cs2
0.239
Interpersonal Fairness
ipf2
ipf3
0.133
Informational Fairness if5
if2
if3
ipf4
if1
if4
0.022
Procedural Fairness pf5
ipf1
pf4
pf2
pf3
0.310
Distributive Fairness df5
pf1
df1
df2
df4
df3
Fig. 3: Pilot Survey—Structural Path model (un-Adjusted)
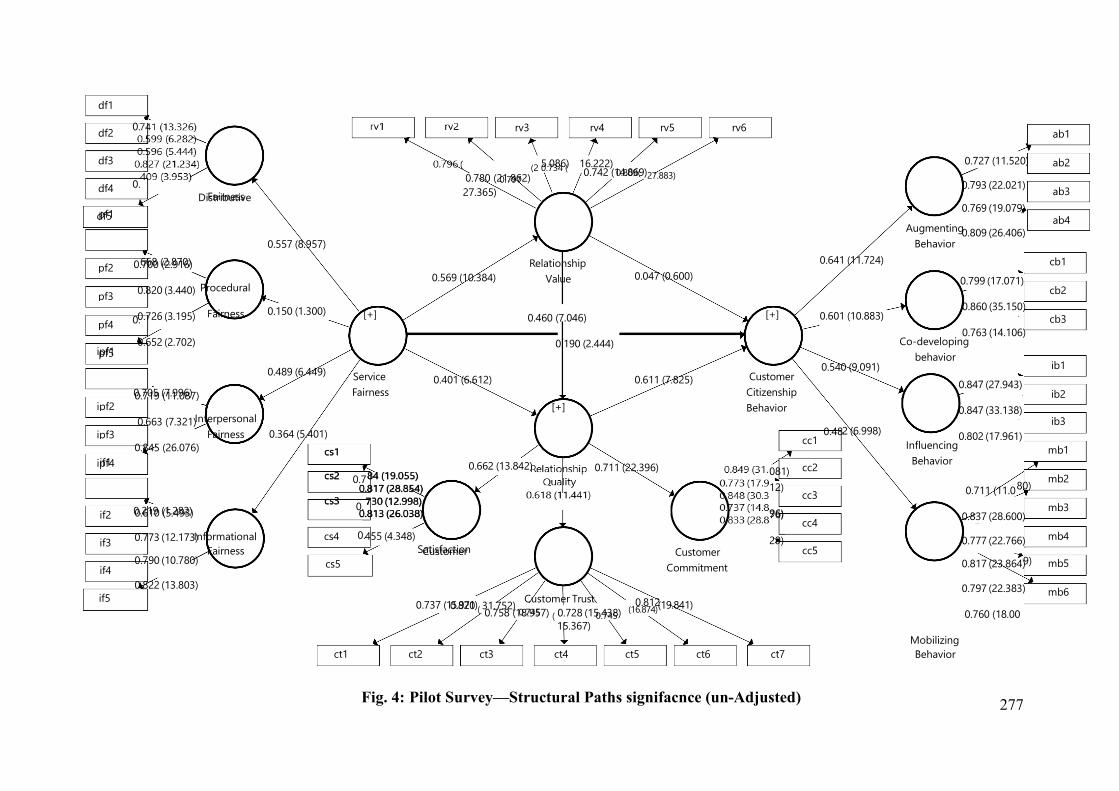
277
5.086)
27.365) 0.797
16.222) 0.809 (
0.742 (14.869)27.883) 0.780 (21.862)
(2 0.734 (
0.401 (6.612)
0.569 (10.384) 0.047 (0.600)
0.611 (7.825)
0.460 (7.046)
0.190 (2.444)
0.48 2 (6.998)
80)
9)
0.540 (9.091) 0.847 (27.943)
0.847 (33.138)
0.802 (17.961)
0.641 (11.724)
0.727 (11.520) 0.793 (22.021) 0.769 (19.079)
0.809 (26.406)
0.601 (10.883)
0.799 (17.071)
0.860 (35.150)
0.763 (14.106)
0.711 (22.396) 081)
76)
29)
12)
96)
0.812 (16.874)(19.841)
15.367) 0.745
0.820 31.752) 0.745 0.737 (15.971)( 0.758 (18.957) ( 0.728 (15.438)
0.662 (13.842) 0.7
0.
0.557 (8.957)
0.
0.150 (1.300) 0.
0.489 (6.449)
0.364 (5.401)
0.
0. 455 (4.348)
rv3 rv6 rv4 rv5
[+]
Service Fairness
[+]
Customer Citizenship Behavior
Relationship Value
[+]
0.711 (11.0
0.837 (28.600)
0.777 (22.766) 0.817 (23.864)
0.797 (22.383)
0.760 (18.00
Mobilizing Behavior
mb1
mb3
mb2
mb6
mb5
mb4
Influencing Behavior
ib2
ib3
ib1
Augmenting Behavior
ab2
ab4
ab3
ab1
Co-developing behavior
cb2
cb1
cb3
Customer Commitment
cc1
cc2
cc5 Satisfaction
Fairness
668 (2.870)
Procedural
Fairness
0.705 (7.996)
Interpersonal Fairness
ipf1
0.219 (1.282)
Informational Fairness
if1
pf1
cc4
cc3
Customer Trust
ct7 ct6 ct4 ct2 ct1 ct5 ct3
Customer cs4
Distributive
df3
df4
df2
df1
0.700 (2.916)
0.820 (3.440)
0.726 (3.195)
0.652 (2.702)
pf3
pf2
pf4
0.719 (11.087)
0.663 (7.321)
0.845 (26.076) ipf3
ipf2
pf5
0.610 (5.493) 0.773 (12.173) 0.790 (10.780)
0.822 (13.803) if4
ipf4
if3
if2
df5
if5
cs5
Fig. 4: Pilot Survey—Structural Paths signifacnce (un-Adjusted)
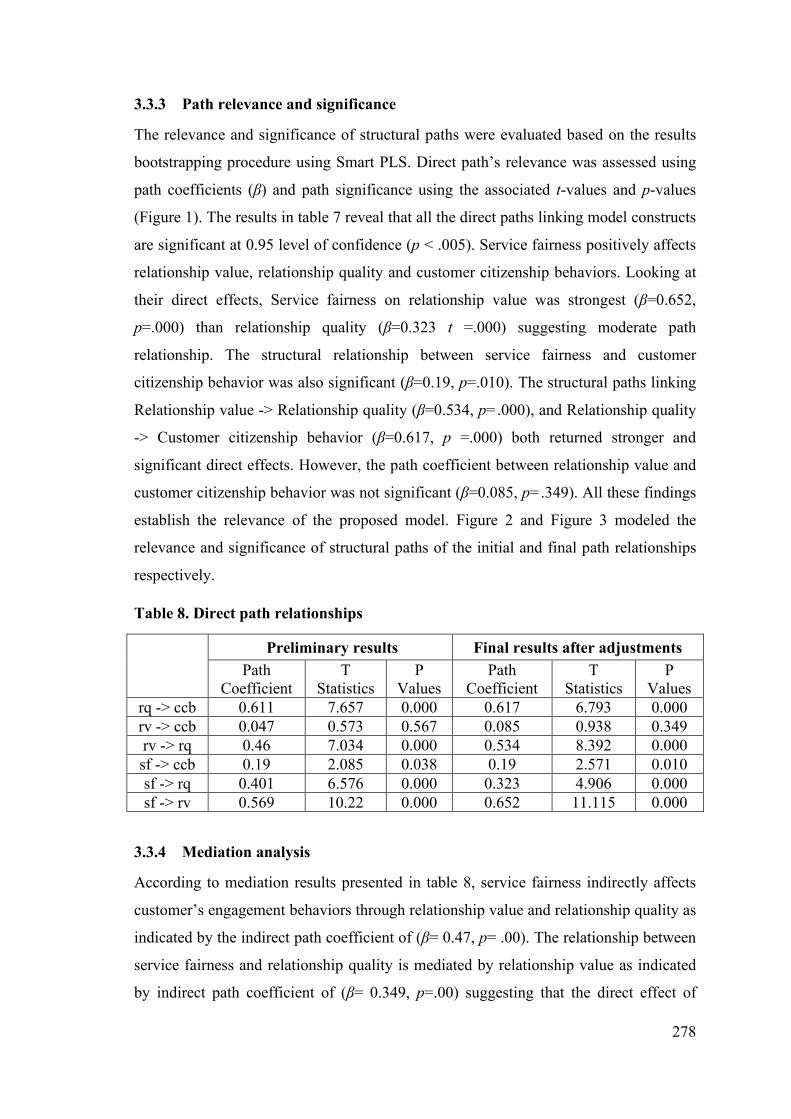
278
3.3.3 Path relevance and significance
The relevance and significance of structural paths were evaluated based on the results
bootstrapping procedure using Smart PLS. Direct path’s relevance was assessed using
path coefficients (β) and path significance using the associated t-values and p-values
(Figure 1). The results in table 7 reveal that all the direct paths linking model constructs
are significant at 0.95 level of confidence (p < .005). Service fairness positively affects
relationship value, relationship quality and customer citizenship behaviors. Looking at
their direct effects, Service fairness on relationship value was strongest (β=0.652,
p=.000) than relationship quality (β=0.323 t =.000) suggesting moderate path
relationship. The structural relationship between service fairness and customer
citizenship behavior was also significant (β=0.19, p=.010). The structural paths linking
Relationship value -> Relationship quality (β=0.534, p=.000), and Relationship quality
-> Customer citizenship behavior (β=0.617, p =.000) both returned stronger and
significant direct effects. However, the path coefficient between relationship value and
customer citizenship behavior was not significant (β=0.085, p=.349). All these findings
establish the relevance of the proposed model. Figure 2 and Figure 3 modeled the
relevance and significance of structural paths of the initial and final path relationships
respectively.
Table 8. Direct path relationships
Preliminary results Final results after adjustments
Path Coefficient
T Statistics
P Values
Path Coefficient
T Statistics
P Values
rq -> ccb 0.611 7.657 0.000 0.617 6.793 0.000 rv -> ccb 0.047 0.573 0.567 0.085 0.938 0.349 rv -> rq 0.46 7.034 0.000 0.534 8.392 0.000 sf -> ccb 0.19 2.085 0.038 0.19 2.571 0.010 sf -> rq 0.401 6.576 0.000 0.323 4.906 0.000 sf -> rv 0.569 10.22 0.000 0.652 11.115 0.000
3.3.4 Mediation analysis
According to mediation results presented in table 8, service fairness indirectly affects
customer’s engagement behaviors through relationship value and relationship quality as
indicated by the indirect path coefficient of (β= 0.47, p= .00). The relationship between
service fairness and relationship quality is mediated by relationship value as indicated
by indirect path coefficient of (β= 0.349, p=.00) suggesting that the direct effect of
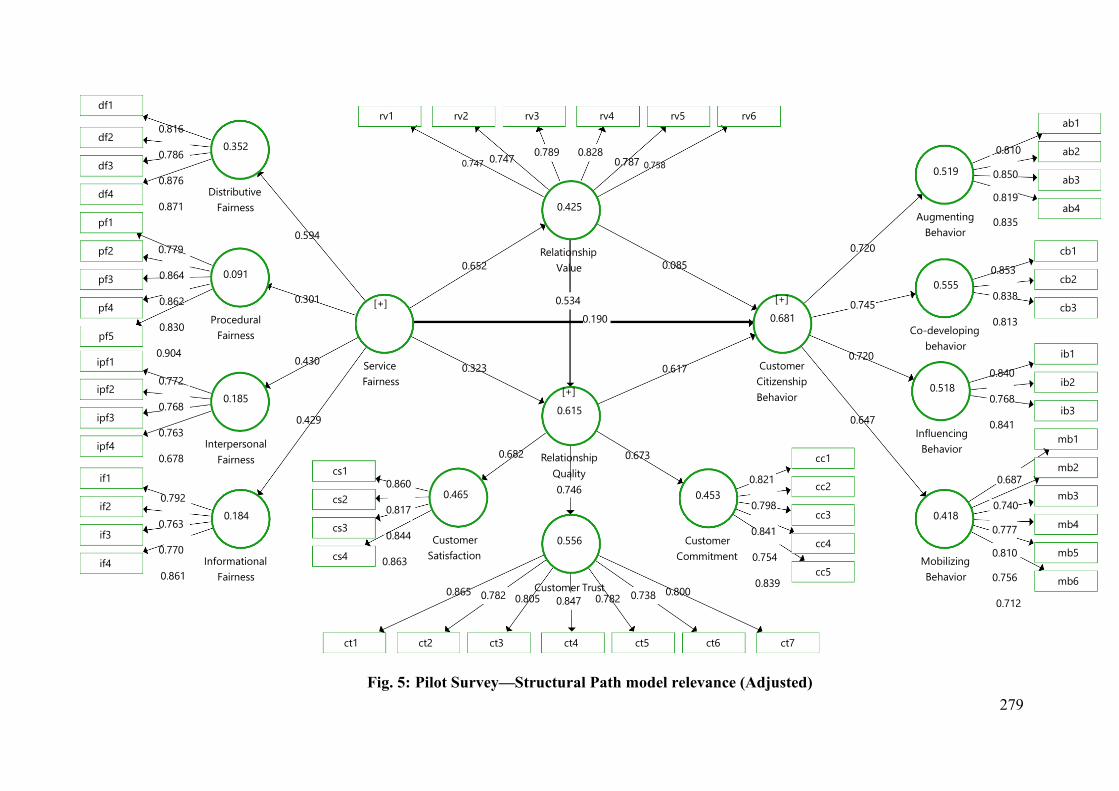
279
0.789 0.828 0.787 0.758 0.747 0.747
0.190
0.323
0.652 0.085
0.617
0.534
0.647
0.687
0.740
0.777 0.810
0.756
0.712
0.720 0.840
0.768
0.841
0.720
0.810 0.850 0.819
0.835
0.745
0.853
0.838
0.813
0.805 0.782 0.865 0.782 0.847 0.738 0.800
0.673 0.821
0.798
0.841
0.754
0.839
0.682
0.860
0.817
0.844
0.863
0.430 0.772
0.768
0.763
0.678
0.429
0.792
0.763
0.770
0.861
0.301
0.779
0.864
0.862
0.830
0.904
0.594
0.816
0.786
0.876
0.871
rv3 rv6 rv1 rv4 rv5 rv2
[+]
Service Fairness
[+]
0.681
Customer Citizenship Behavior
0.425
Relationship Value
[+]
0.615
Relationship Quality 0.746
0.418
Mobilizing Behavior
mb4
mb5
mb6
mb2
mb3
mb1
0.518
Influencing Behavior
ib1
ib3
ib2
0.519
Augmenting Behavior
ab1
ab3
ab4
ab2
0.555
Co-developing behavior
cb3
cb1
cb2
0.556
Customer Trust
ct3 ct5 ct1 ct2 ct4 ct6 ct7
0.453
Customer Commitment
cc3
cc4
cc5
cc2
cc1
0.465
Customer Satisfaction
cs3
cs4
cs1
cs2
0.185
Interpersonal Fairness
ipf4
ipf2
ipf3
0.184
Informational Fairness
if2
if3
if1
if4
0.091
Procedural Fairness pf5
ipf1
pf1
pf4
pf2
pf3
0.352
Distributive Fairness
df1
df2
df4
df3
Fig. 5: Pilot Survey—Structural Path model relevance (Adjusted)
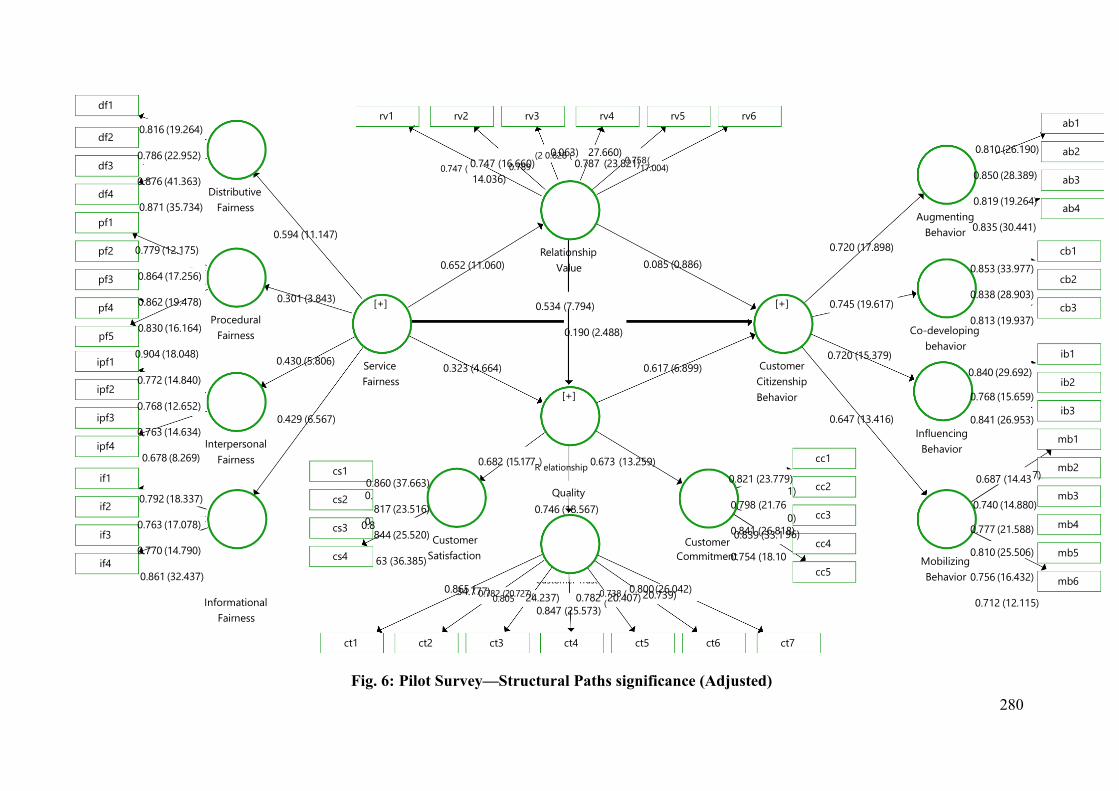
280
0.063)
14.036) 0.789
27.660) 0.758 (
0.747 ( 0.747 (16.660)
(2 0.828 ( 0.787 (23.821)17.004)
0.323 (4.664)
0.652 (11.060) 0.085 (0.886)
0.617 (6.899)
0.534 (7.794)
0.190 (2.488)
0.647 (13.416)
0.687 (14.43
0.740 (14.880)
0.777 (21.588) 0.810 (25.506)
0.756 (16.432)
0.712 (12.115)
7)
0.720 (15.379)
0.720 (17.898)
0.810 (26.190)
0.850 (28.389)
0.819 (19.264)
0.835 (30.441)
0.745 (19.617)
0.853 (33.977)
0.838 (28.903)
0.813 (19.937)
24.237) 0.782 20.407) 34.777) 0.805
20.739)
0) 0.839 (33.1 96)
1) 0.821 (23.779)
0.798 (21.76
0.841 (26.818)
0.754 (18.10
0.8
0.
0.
0.860 (37.663)
817 (23.516)
844 (25.520)
63 (36.385)
0.430 (5.806) 0.772 (14.840)
0.768 (12.652)
0.763 (14.634)
0.678 (8.269)
0.429 (6.567)
0.301 (3.843)
0.779 (12.175)
0.864 (17.256)
0.862 (19.478)
0.830 (16.164)
0.904 (18.048)
0.594 (11.147)
0.816 (19.264)
0.786 (22.952)
0.876 (41.363)
0.871 (35.734)
rv3 rv6 rv1 rv4 rv5 rv2
[+]
Service Fairness
[+]
Customer Citizenship Behavior
Relationship Value
[+]
0.682 (15.177R) elationship 0.673 (13.259)
Quality 0.746 (18.567)
Mobilizing Behavior
mb4
mb5
mb6
mb2
mb3
mb1 Influencing Behavior
ib1
ib3
ib2
Augmenting Behavior
ab1
ab3
ab4
ab2
Co-developing behavior
0.840 (29.692)
0.768 (15.659) 0.841 (26.953)
cb3
cb1
cb2
0.865 ( 0.782 (20.727)( Customer Trust
0.738 ( 0.800 (26.042) 0.847 (25.573)
(
ct3 ct5 ct1 ct2 ct4 ct6 ct7
Customer Commitment
cc3
cc4
cc5
cc2
cc1
Customer Satisfaction
cs3
cs4
cs1
cs2
Interpersonal Fairness
ipf4
ipf2
ipf3
0.792 (18.337)
0.763 (17.078)
0.770 (14.790)
0.861 (32.437)
Informational Fairness
if2
if3
if1
if4
Procedural Fairness pf5
ipf1
pf1
pf4
pf2
pf3
Distributive Fairness
df1
df2
df4
df3
Fig. 6: Pilot Survey—Structural Paths significance (Adjusted)
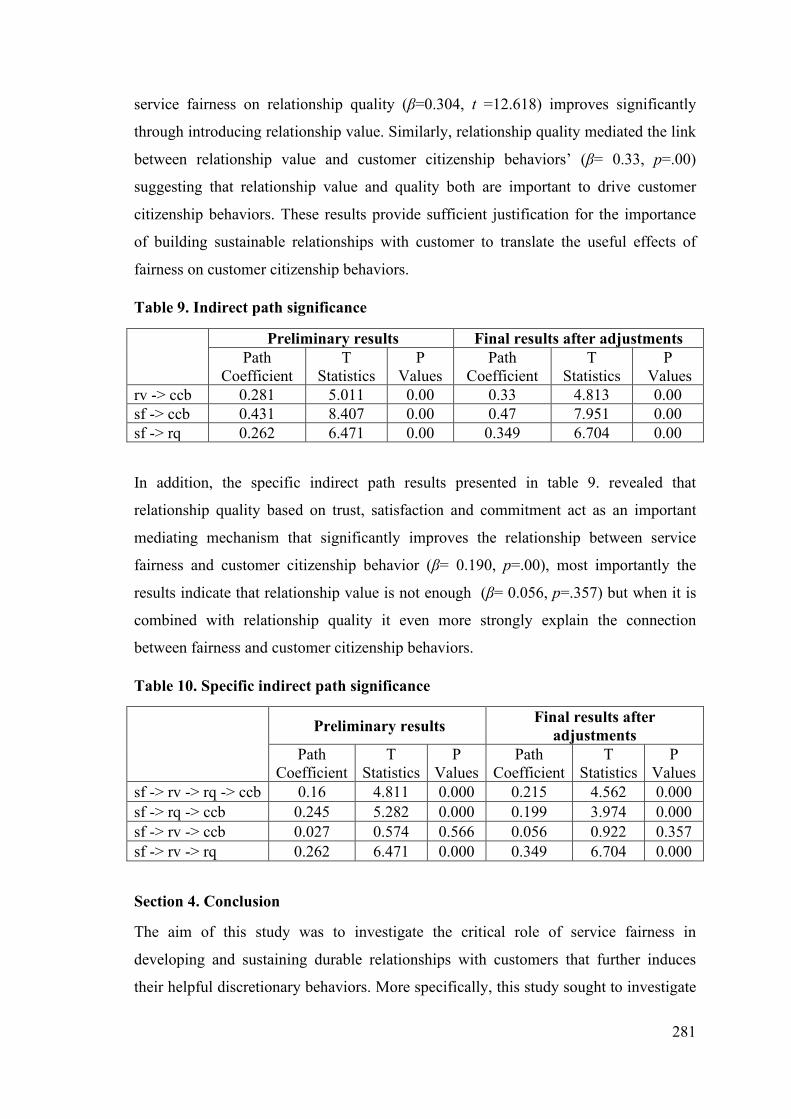
281
service fairness on relationship quality (β=0.304, t =12.618) improves significantly
through introducing relationship value. Similarly, relationship quality mediated the link
between relationship value and customer citizenship behaviors’ (β= 0.33, p=.00)
suggesting that relationship value and quality both are important to drive customer
citizenship behaviors. These results provide sufficient justification for the importance
of building sustainable relationships with customer to translate the useful effects of
fairness on customer citizenship behaviors.
Table 9. Indirect path significance
Preliminary results Final results after adjustments
Path Coefficient
T Statistics
P Values
Path Coefficient
T Statistics
P Values
rv -> ccb 0.281 5.011 0.00 0.33 4.813 0.00 sf -> ccb 0.431 8.407 0.00 0.47 7.951 0.00 sf -> rq 0.262 6.471 0.00 0.349 6.704 0.00
In addition, the specific indirect path results presented in table 9. revealed that
relationship quality based on trust, satisfaction and commitment act as an important
mediating mechanism that significantly improves the relationship between service
fairness and customer citizenship behavior (β= 0.190, p=.00), most importantly the
results indicate that relationship value is not enough (β= 0.056, p=.357) but when it is
combined with relationship quality it even more strongly explain the connection
between fairness and customer citizenship behaviors.
Table 10. Specific indirect path significance
Preliminary results Final results after
adjustments Path
Coefficient T
Statistics P
Values Path
Coefficient T
Statistics P
Values sf -> rv -> rq -> ccb 0.16 4.811 0.000 0.215 4.562 0.000 sf -> rq -> ccb 0.245 5.282 0.000 0.199 3.974 0.000 sf -> rv -> ccb 0.027 0.574 0.566 0.056 0.922 0.357 sf -> rv -> rq 0.262 6.471 0.000 0.349 6.704 0.000
Section 4. Conclusion
The aim of this study was to investigate the critical role of service fairness in
developing and sustaining durable relationships with customers that further induces
their helpful discretionary behaviors. More specifically, this study sought to investigate
282
whether consumer– bank relationships act as mediating mechanism through which
service fairness fosters customer voluntary behaviors within the banking sector. For this
purpose, pre-validated scales were tested for reliability, validity and structural
relevance. The face and content validity of the questionnaire items were rigorously
tested and then subjected to measurement and structural assessments using partial least
squired based structure equation modeling PLS-SEM using Smart PLS 3.2.7 statistical
software. As a result, the validity of both the structural and measurement model was
achieved which therefore confirmed the suitability of the pilot survey instrument for
larger samples. The results of pilot survey further confirmed that service fairness,
relationship value, relationship quality and customer citizenship behaviors are
theoretical concepts and can confidently be operationalized within the banking sector of
Pakistan. further the structural model results indicated that all these constructs are
strongly co-related where in specifically, service fairness directly affects a customer
citizenship behavior however service fairness and sustained relationship together work
as a stronger driving force that foster customer citizenship behaviors.

283
Table 5.1. Descriptive statistics on consumers of Foreign Banks (n=240) Sr# Demographic Variable Frequency Percentage
1 Gender Male 229 95.4 Female 11 4.6
2 Marital status
Single 86 35.8 Married 154 64.2
3 Age Under 20 4 1.7 21-25 33 13.8 26-30 81 33.8 31-40 66 27.5 41-50 30 12.5 51-65 20 8.3 Above 65 6 2.5
4 Education Metric or below 13 5.4 Intermediate 25 10.4 Bachelor 104 43.3 Master 78 32.5 Above 20 8.3
5 Occupation Student 29 12.1 Working professional 91 37.9 Business 84 35.0 Housewife 4 1.7 unemployed 21 8.8 Others 11 4.6
6 City Peshawar 37 15.4 Lahore 72 30.0 Karachi 95 39.6 Islamabad 24 10.0 Quetta 12 5.0
7 Usage frequency
Everyday 31 12.9 Several times a week 35 14.6 Once a week 55 22.9 Once in two weeks 40 16.7 Once a month 37 15.4 Once in two months 10 4.2 Once in 3 to 6 months 18 7.5 Once in more than 6 months 14 5.8
8 Internet banking use
No 186 77.5 Yes 54 22.5
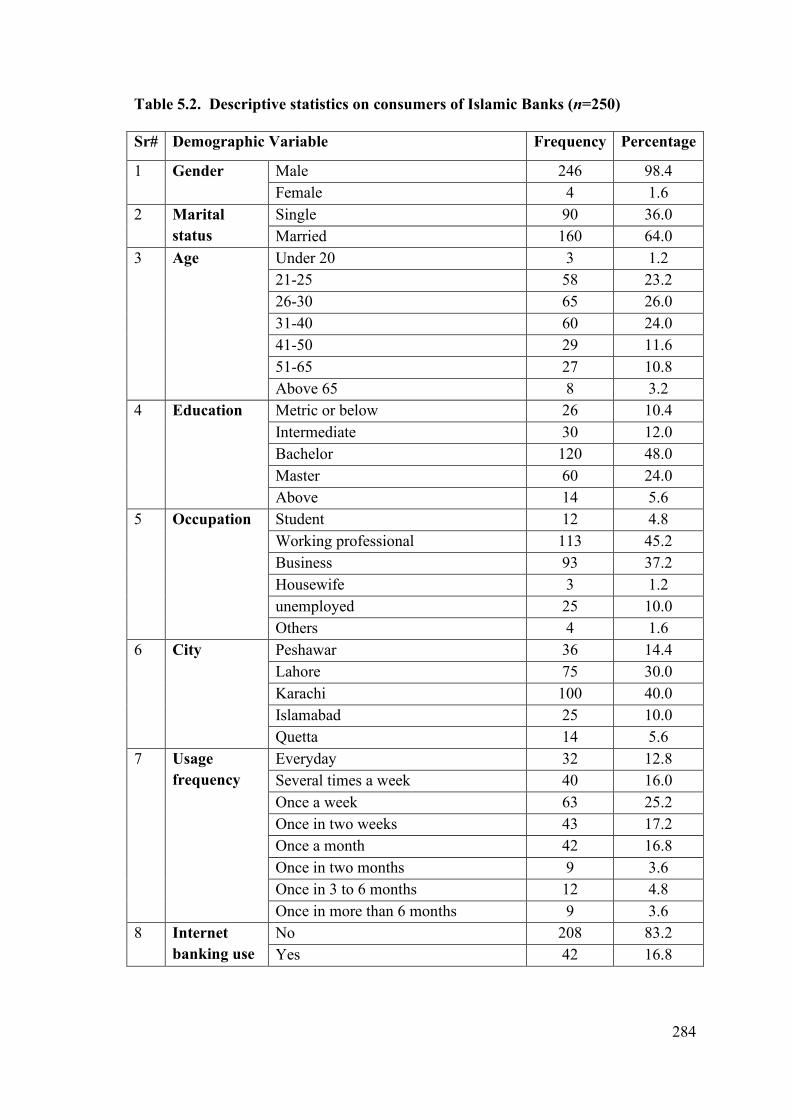
284
Table 5.2. Descriptive statistics on consumers of Islamic Banks (n=250) Sr# Demographic Variable Frequency Percentage
1 Gender Male 246 98.4 Female 4 1.6
2 Marital status
Single 90 36.0 Married 160 64.0
3 Age Under 20 3 1.2 21-25 58 23.2 26-30 65 26.0 31-40 60 24.0 41-50 29 11.6 51-65 27 10.8 Above 65 8 3.2
4 Education Metric or below 26 10.4 Intermediate 30 12.0 Bachelor 120 48.0 Master 60 24.0 Above 14 5.6
5 Occupation Student 12 4.8 Working professional 113 45.2 Business 93 37.2 Housewife 3 1.2 unemployed 25 10.0 Others 4 1.6
6 City Peshawar 36 14.4 Lahore 75 30.0 Karachi 100 40.0 Islamabad 25 10.0 Quetta 14 5.6
7 Usage frequency
Everyday 32 12.8 Several times a week 40 16.0 Once a week 63 25.2 Once in two weeks 43 17.2 Once a month 42 16.8 Once in two months 9 3.6 Once in 3 to 6 months 12 4.8 Once in more than 6 months 9 3.6
8 Internet banking use
No 208 83.2 Yes 42 16.8
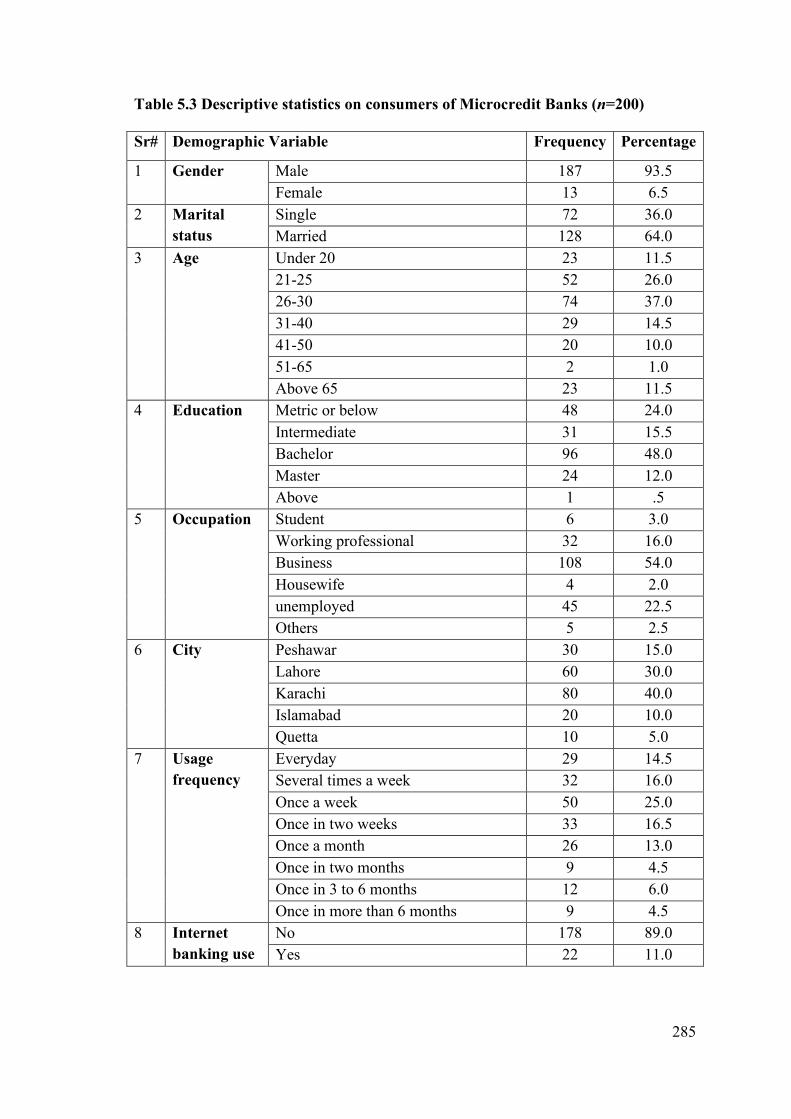
285
Table 5.3 Descriptive statistics on consumers of Microcredit Banks (n=200) Sr# Demographic Variable Frequency Percentage
1 Gender Male 187 93.5 Female 13 6.5
2 Marital status
Single 72 36.0 Married 128 64.0
3 Age Under 20 23 11.5 21-25 52 26.0 26-30 74 37.0 31-40 29 14.5 41-50 20 10.0 51-65 2 1.0 Above 65 23 11.5
4 Education Metric or below 48 24.0 Intermediate 31 15.5 Bachelor 96 48.0 Master 24 12.0 Above 1 .5
5 Occupation Student 6 3.0 Working professional 32 16.0 Business 108 54.0 Housewife 4 2.0 unemployed 45 22.5 Others 5 2.5
6 City Peshawar 30 15.0 Lahore 60 30.0 Karachi 80 40.0 Islamabad 20 10.0 Quetta 10 5.0
7 Usage frequency
Everyday 29 14.5 Several times a week 32 16.0 Once a week 50 25.0 Once in two weeks 33 16.5 Once a month 26 13.0 Once in two months 9 4.5 Once in 3 to 6 months 12 6.0 Once in more than 6 months 9 4.5
8 Internet banking use
No 178 89.0 Yes 22 11.0
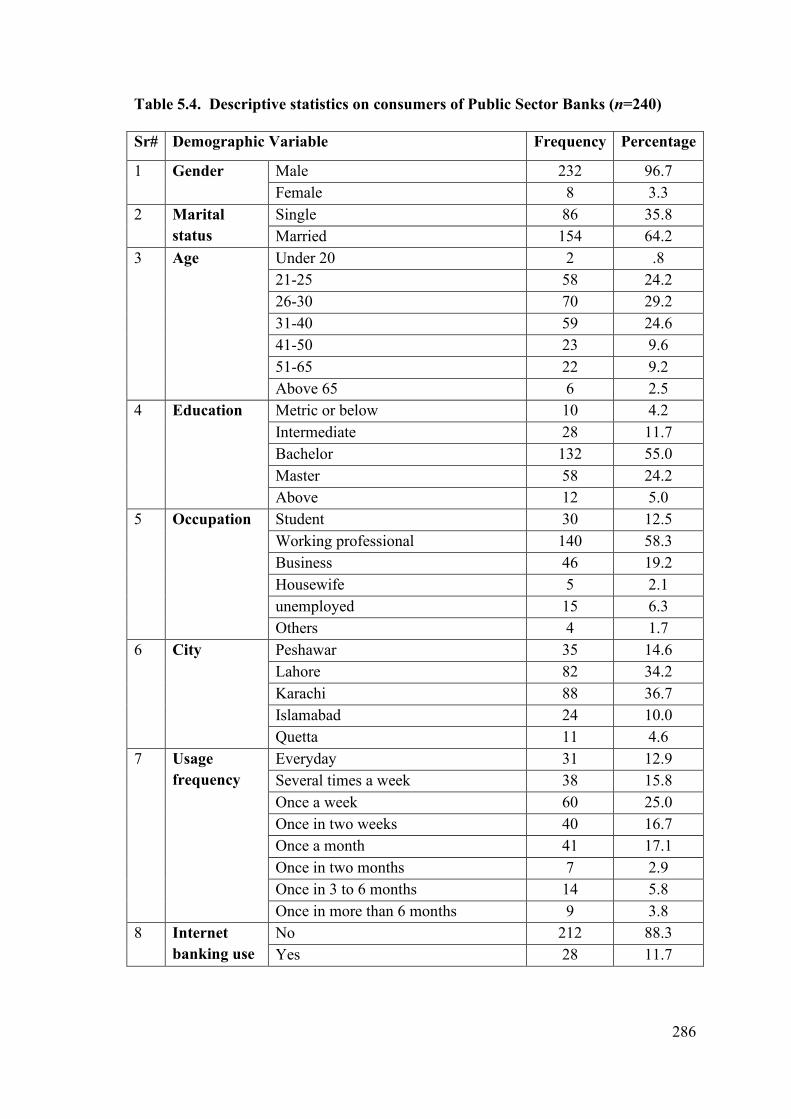
286
Table 5.4. Descriptive statistics on consumers of Public Sector Banks (n=240) Sr# Demographic Variable Frequency Percentage
1 Gender Male 232 96.7 Female 8 3.3
2 Marital status
Single 86 35.8 Married 154 64.2
3 Age Under 20 2 .8 21-25 58 24.2 26-30 70 29.2 31-40 59 24.6 41-50 23 9.6 51-65 22 9.2 Above 65 6 2.5
4 Education Metric or below 10 4.2 Intermediate 28 11.7 Bachelor 132 55.0 Master 58 24.2 Above 12 5.0
5 Occupation Student 30 12.5 Working professional 140 58.3 Business 46 19.2 Housewife 5 2.1 unemployed 15 6.3 Others 4 1.7
6 City Peshawar 35 14.6 Lahore 82 34.2 Karachi 88 36.7 Islamabad 24 10.0 Quetta 11 4.6
7 Usage frequency
Everyday 31 12.9 Several times a week 38 15.8 Once a week 60 25.0 Once in two weeks 40 16.7 Once a month 41 17.1 Once in two months 7 2.9 Once in 3 to 6 months 14 5.8 Once in more than 6 months 9 3.8
8 Internet banking use
No 212 88.3 Yes 28 11.7
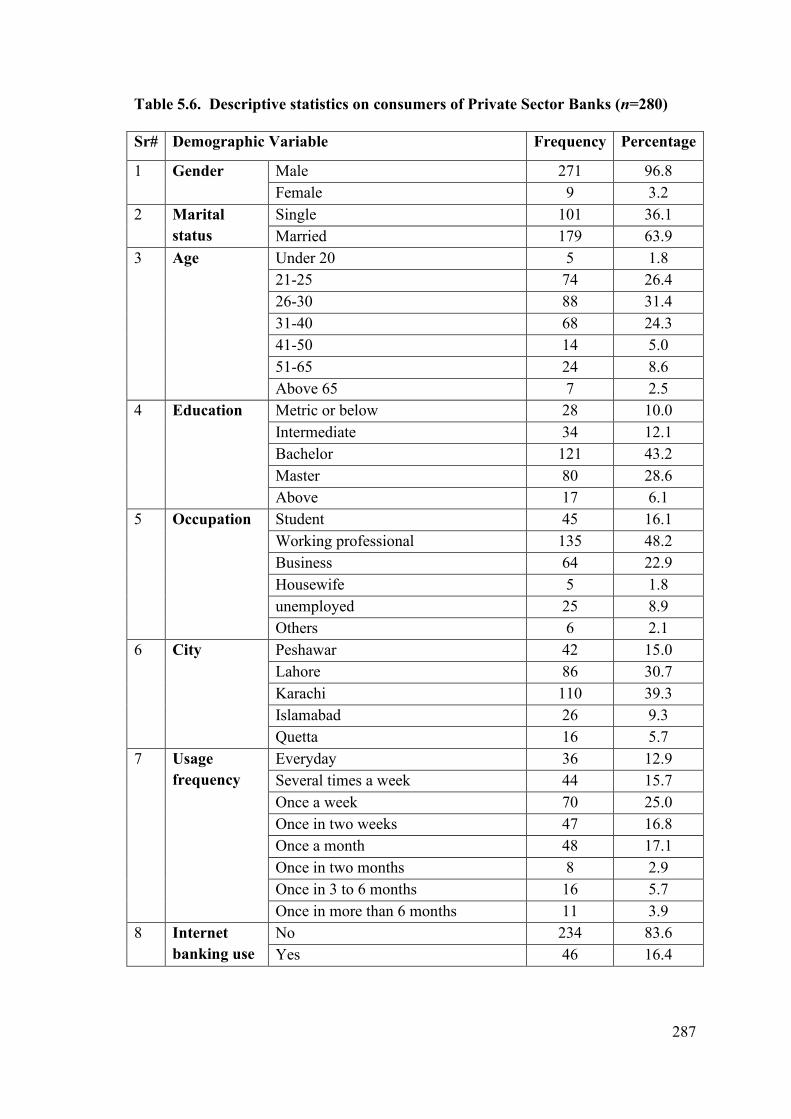
287
Table 5.6. Descriptive statistics on consumers of Private Sector Banks (n=280) Sr# Demographic Variable Frequency Percentage
1 Gender Male 271 96.8 Female 9 3.2
2 Marital status
Single 101 36.1 Married 179 63.9
3 Age Under 20 5 1.8 21-25 74 26.4 26-30 88 31.4 31-40 68 24.3 41-50 14 5.0 51-65 24 8.6 Above 65 7 2.5
4 Education Metric or below 28 10.0 Intermediate 34 12.1 Bachelor 121 43.2 Master 80 28.6 Above 17 6.1
5 Occupation Student 45 16.1 Working professional 135 48.2 Business 64 22.9 Housewife 5 1.8 unemployed 25 8.9 Others 6 2.1
6 City Peshawar 42 15.0 Lahore 86 30.7 Karachi 110 39.3 Islamabad 26 9.3 Quetta 16 5.7
7 Usage frequency
Everyday 36 12.9 Several times a week 44 15.7 Once a week 70 25.0 Once in two weeks 47 16.8 Once a month 48 17.1 Once in two months 8 2.9 Once in 3 to 6 months 16 5.7 Once in more than 6 months 11 3.9
8 Internet banking use
No 234 83.6 Yes 46 16.4
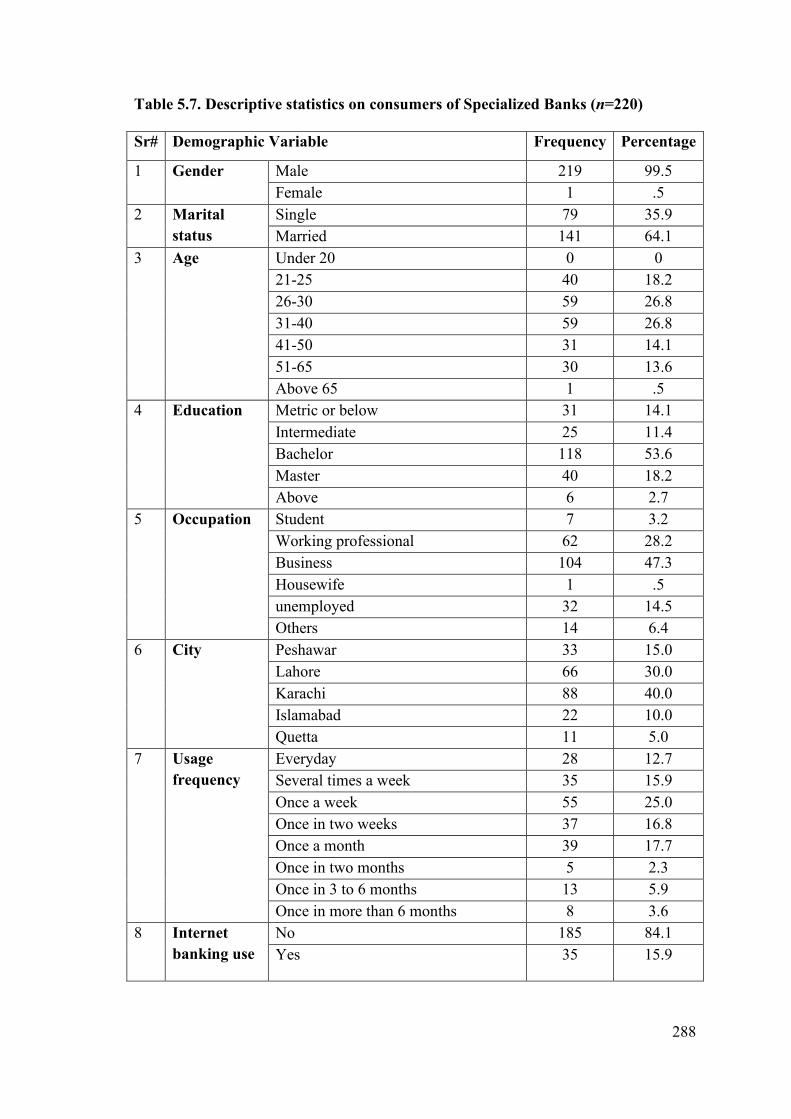
288
Table 5.7. Descriptive statistics on consumers of Specialized Banks (n=220) Sr# Demographic Variable Frequency Percentage
1 Gender Male 219 99.5 Female 1 .5
2 Marital status
Single 79 35.9 Married 141 64.1
3 Age Under 20 0 0 21-25 40 18.2 26-30 59 26.8 31-40 59 26.8 41-50 31 14.1 51-65 30 13.6 Above 65 1 .5
4 Education Metric or below 31 14.1 Intermediate 25 11.4 Bachelor 118 53.6 Master 40 18.2 Above 6 2.7
5 Occupation Student 7 3.2 Working professional 62 28.2 Business 104 47.3 Housewife 1 .5 unemployed 32 14.5 Others 14 6.4
6 City Peshawar 33 15.0 Lahore 66 30.0 Karachi 88 40.0 Islamabad 22 10.0 Quetta 11 5.0
7 Usage frequency
Everyday 28 12.7 Several times a week 35 15.9 Once a week 55 25.0 Once in two weeks 37 16.8 Once a month 39 17.7 Once in two months 5 2.3 Once in 3 to 6 months 13 5.9 Once in more than 6 months 8 3.6
8
Internet banking use
No 185 84.1 Yes 35 15.9

Scanned with CamScanner

Scanned with CamScanner
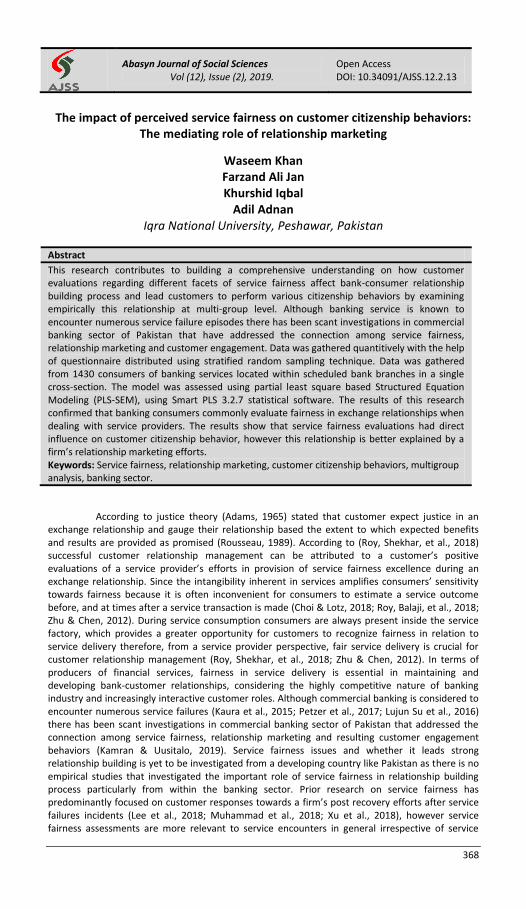
368
Abasyn Journal of Social Sciences Vol (12), Issue (2), 2019.
Open Access DOI: 10.34091/AJSS.12.2.13
The impact of perceived service fairness on customer citizenship behaviors: The mediating role of relationship marketing
Waseem Khan Farzand Ali Jan Khurshid Iqbal
Adil Adnan Iqra National University, Peshawar, Pakistan
Abstract
This research contributes to building a comprehensive understanding on how customer evaluations regarding different facets of service fairness affect bank-consumer relationship building process and lead customers to perform various citizenship behaviors by examining empirically this relationship at multi-group level. Although banking service is known to encounter numerous service failure episodes there has been scant investigations in commercial banking sector of Pakistan that have addressed the connection among service fairness, relationship marketing and customer engagement. Data was gathered quantitively with the help of questionnaire distributed using stratified random sampling technique. Data was gathered from 1430 consumers of banking services located within scheduled bank branches in a single cross-section. The model was assessed using partial least square based Structured Equation Modeling (PLS-SEM), using Smart PLS 3.2.7 statistical software. The results of this research confirmed that banking consumers commonly evaluate fairness in exchange relationships when dealing with service providers. The results show that service fairness evaluations had direct influence on customer citizenship behavior, however this relationship is better explained by a firm’s relationship marketing efforts. Keywords: Service fairness, relationship marketing, customer citizenship behaviors, multigroup analysis, banking sector.
According to justice theory (Adams, 1965) stated that customer expect justice in an exchange relationship and gauge their relationship based the extent to which expected benefits and results are provided as promised (Rousseau, 1989). According to (Roy, Shekhar, et al., 2018) successful customer relationship management can be attributed to a customer’s positive evaluations of a service provider’s efforts in provision of service fairness excellence during an exchange relationship. Since the intangibility inherent in services amplifies consumers’ sensitivity towards fairness because it is often inconvenient for consumers to estimate a service outcome before, and at times after a service transaction is made (Choi & Lotz, 2018; Roy, Balaji, et al., 2018; Zhu & Chen, 2012). During service consumption consumers are always present inside the service factory, which provides a greater opportunity for customers to recognize fairness in relation to service delivery therefore, from a service provider perspective, fair service delivery is crucial for customer relationship management (Roy, Shekhar, et al., 2018; Zhu & Chen, 2012). In terms of producers of financial services, fairness in service delivery is essential in maintaining and developing bank-customer relationships, considering the highly competitive nature of banking industry and increasingly interactive customer roles. Although commercial banking is considered to encounter numerous service failures (Kaura et al., 2015; Petzer et al., 2017; Lujun Su et al., 2016) there has been scant investigations in commercial banking sector of Pakistan that addressed the connection among service fairness, relationship marketing and resulting customer engagement behaviors (Kamran & Uusitalo, 2019). Service fairness issues and whether it leads strong relationship building is yet to be investigated from a developing country like Pakistan as there is no empirical studies that investigated the important role of service fairness in relationship building process particularly from within the banking sector. Prior research on service fairness has predominantly focused on customer responses towards a firm’s post recovery efforts after service failures incidents (Lee et al., 2018; Muhammad et al., 2018; Xu et al., 2018), however service fairness assessments are more relevant to service encounters in general irrespective of service

Scanned with CamScanner
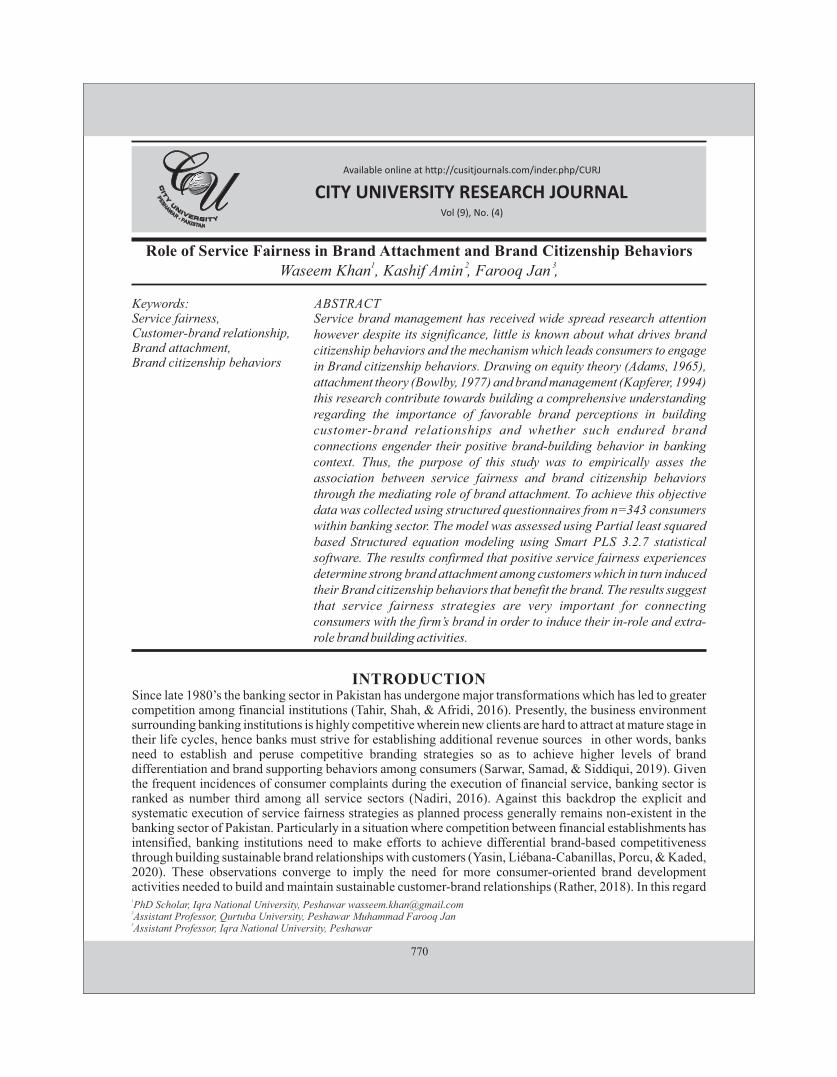
1
PhD Scholar, Iqra National University, Peshawar [email protected]
Assistant Professor, Qurtuba University, Peshawar Muhammad Farooq Jan3
Assistant Professor, Iqra National University, Peshawar
CITY UNIVERSITY RESEARCH JOURNAL Vol (9), No. (4)
Available online at h�p://cusitjournals.com/inder.php/CURJ
770
Role of Service Fairness in Brand Attachment and Brand Citizenship Behaviors1 2 3
Waseem Khan , Kashif Amin , Farooq Jan ,
Service brand management has received wide spread research attention however despite its significance, little is known about what drives brand citizenship behaviors and the mechanism which leads consumers to engage in Brand citizenship behaviors. Drawing on equity theory (Adams, 1965), attachment theory (Bowlby, 1977) and brand management (Kapferer, 1994) this research contribute towards building a comprehensive understanding regarding the importance of favorable brand perceptions in building customer-brand relationships and whether such endured brand connections engender their positive brand-building behavior in banking context. Thus, the purpose of this study was to empirically asses the association between service fairness and brand citizenship behaviors through the mediating role of brand attachment. To achieve this objective data was collected using structured questionnaires from n=343 consumers within banking sector. The model was assessed using Partial least squared based Structured equation modeling using Smart PLS 3.2.7 statistical software. The results confirmed that positive service fairness experiences determine strong brand attachment among customers which in turn induced their Brand citizenship behaviors that benefit the brand. The results suggest that service fairness strategies are very important for connecting consumers with the firm’s brand in order to induce their in-role and extra-role brand building activities.
Keywords: Service fairness, Customer-brand relationship, Brand attachment, Brand citizenship behaviors
INTRODUCTION Since late 1980’s the banking sector in Pakistan has undergone major transformations which has led to greater competition among financial institutions (Tahir, Shah, & Afridi, 2016). Presently, the business environment surrounding banking institutions is highly competitive wherein new clients are hard to attract at mature stage in their life cycles, hence banks must strive for establishing additional revenue sources in other words, banks need to establish and peruse competitive branding strategies so as to achieve higher levels of brand differentiation and brand supporting behaviors among consumers (Sarwar, Samad, & Siddiqui, 2019). Given the frequent incidences of consumer complaints during the execution of financial service, banking sector is ranked as number third among all service sectors (Nadiri, 2016). Against this backdrop the explicit and systematic execution of service fairness strategies as planned process generally remains non-existent in the banking sector of Pakistan. Particularly in a situation where competition between financial establishments has intensified, banking institutions need to make efforts to achieve differential brand-based competitiveness through building sustainable brand relationships with customers (Yasin, Liébana-Cabanillas, Porcu, & Kaded, 2020). These observations converge to imply the need for more consumer-oriented brand development activities needed to build and maintain sustainable customer-brand relationships (Rather, 2018). In this regard
ABSTRACT