the mechanics of jumping versus steady hopping in yellow-footed rock wallabies
TRANSCRIPT
2741
In an uneven and unpredictable world, many terrestrialanimals that utilize energy-saving mechanisms while movingat steady speed are confronted with the need to generatesubstantial mechanical power to accelerate or jump in order toavoid an obstacle, negotiate uneven terrain, or evade apredator. During steady locomotion over level ground, animalsemploy various mechanisms to minimize the energy requiredto maintain a constant speed. At faster speeds this is oftencharacterized by a bouncing gait, such as running, trotting orhopping, in which animals may use compliant structures tostore and return elastic strain energy during the stance phaseof a stride (Cavagna, 1977; Heglund, 1982). Excellentexamples of this are large macropod marsupials (kangaroosand wallabies), which are able to store and recover as much as35% of the mechanical energy of a single hop in their ankle
extensor tendons alone (Alexander and Vernon, 1975; Ker etal., 1986; Biewener and Baudinette, 1995).
However, a spring system can only return the energy thathas been previously stored in it. Additional mechanical powerneeded to accelerate or decelerate during non-steadylocomotion must be supplied by the contractile elements of themuscles. It has also been suggested that musculoskeletaldesigns favoring elastic energy storage may be constrained intheir ability to generate large amounts of power (Biewener,1998; Biewener and Roberts, 2000; Daley and Biewener,2003), although there is evidence of distal muscle–tendon unitsthat contribute substantial shortening work for incline running(Gabaldon et al., 2004; Roberts et al., 1997). While much workhas contributed to understanding the mechanics of energy-saving mechanisms during steady-speed locomotion, only
The Journal of Experimental Biology 208, 2741-2751Published by The Company of Biologists 2005doi:10.1242/jeb.01702
The goal of our study was to explore the mechanicalpower requirements associated with jumping in yellow-footed rock wallabies and to determine how theserequirements are achieved relative to steady-speedhopping mechanics. Whole body power output and limbmechanics were measured in yellow-footed rock wallabiesduring steady-speed hopping and moving jumps up to alanding ledge 1.0·m high (~3 times the animals’ hipheight). High-speed video recordings and ground reactionforce measurements from a runway-mounted forceplatform were used to calculate whole body power outputand to construct a limb stiffness model to determine wholelimb mechanics. The combined mass of the hind limbextensor muscles was used to estimate muscle mass-specific power output. Previous work suggested that amusculoskeletal design that favors elastic energy recovery,like that found in tammar wallabies and kangaroos, mayimpose constraints on mechanical power generation. Yetrock wallabies regularly make large jumps whilemaneuvering through their environment. As jumpingoften requires high power, we hypothesized that yellow-footed rock wallabies would be able to generate
substantial amounts of mechanical power. This wasconfirmed, as we found net extensor muscle power outputsaveraged 155·W·kg–1 during steady hopping and495·W·kg–1 during jumping. The highest net powermeasured reached nearly 640·W·kg–1. As these valuesexceed the maximum power-producing capability ofvertebrate skeletal muscle, we suggest that back, trunkand tail musculature likely play a substantial role incontributing power during jumping. Inclusion of thismusculature yields a maximum power output estimate of452·W·kg–1 muscle.
Similar to human high-jumpers, rock wallabies use amoderate approach speed and relatively shallow leg angleof attack (45–55°) during jumps. Additionally, initial legstiffness increases nearly twofold from steady hopping tojumping, facilitating the transfer of horizontal kineticenergy into vertical kinetic energy. Time of contact ismaintained during jumping by a substantial extension ofthe leg, which keeps the foot in contact with the ground.
Key words: locomotion, jumping, hopping, muscle power, rockwallaby, Petrogale xanthopus.
Summary
Introduction
The mechanics of jumping versus steady hopping in yellow-footed rock wallabies
C. P. McGowan1,*, R. V. Baudinette2,†, J. R. Usherwood3 and A. A. Biewener1
1Concord Field Station, Department of Organismic and Evolutionary Biology, Harvard University, Cambridge,MA 02138, USA, 2Department of Environmental Biology, University of Adelaide, Adelaide, SA 5003, Australia and
3Structure and Motion Laboratory, The Royal Veterinary College, Hawkshead Lane, North Mymms, Hatfield,AL9 7TA, UK
*Author for correspondence (e-mail: [email protected])†Deceased
Accepted 18 May 2005
THE JOURNAL OF EXPERIMENTAL BIOLOGY
2742
recently have a few studies addressed the mechanics ofgenerating power to meet the non-steady demands that animalsoften encounter moving in their environment (Dutto et al.,2004; McGowan et al., 2005; Roberts and Scales, 2002, 2004).
The aim of this study was to explore the differences inwhole-body mechanics associated with steady-speed hoppingvs moving jumps in yellow-footed rock wallabies Petrogalexanthopus L. by means of force plate and high-speed videoanalysis. Rock wallabies provide an excellent model forinvestigating these differences due to the diversity of habitatsthat they naturally utilize. Rock wallabies forage in openground, presumably benefiting from elastic energy storagewhile hopping at steady speeds, but make their homes in steepcliff environments in which they are required to make jumpsof up to several times their body length. Previous work onmacropods has shown that the ability to store elastic energy intheir ankle extensor tendons contributes greatly towards aunique locomotor economy (Alexander and Vernon, 1975;Biewener and Baudinette, 1995) and that this may be a generalfeature of this clade (Bennett and Taylor, 1995). Recent studiesof tammar wallabies Macropus eugenii L. showed that theirability to store and recover elastic energy is not compromisedwhen hopping on an incline (Biewener et al., 2004), and thatthey are capable of producing relatively high muscle poweroutputs during level accelerations (McGowan et al., 2005).However, unlike rock wallabies, tammar wallabies are notknown habitually to make large jumps.
Because jumping involves high power output, it has oftenbeen used to explore the limits of mechanical power producedby muscles (Aerts, 1998; Bennet-Clark, 1977; Marsh and John-Alder, 1994; Peplowski and Marsh, 1997; Roberts and Marsh,2003). In vertebrates, mean muscle power outputs as high as1100·W·kg–1 muscle have been estimated for jumping ingalagoes (Aerts, 1998; Hall-Craggs, 1965) and 800·W·kg–1
muscle for jumping in Cuban tree frogs (Peplowski and Marsh,1997). As these values exceed the maximum power producingcapability of vertebrate skeletal muscle (~250–400·W·kg–1;Weis-Fogh and Alexander, 1977; Lutz and Rome, 1994; Marshand John-Alder, 1994), it is likely that these animals use energystorage mechanisms to amplify their power output. Roberts andMarsh (2003) have shown that this is likely to be the case forbullfrogs. The mechanisms presented in the above studies alllikely rely on an animal’s ability to store strain energy in elasticelements prior to moving, and then release this energy rapidlywhen the animal accelerates (Aerts, 1998; Marsh 1999;Roberts and Marsh, 2003). Further modeling studies haveshown that the presence of an elastic element in series with amuscle and an inertial load can amplify power output by asmuch as twofold (Alexander, 2002; Galantis and Woledge,2003).
To date, relatively few studies (Alexander, 1974; Depenaand Chung, 1988; Seyfarth et al., 1999; Stefanyshyn and Nigg,1998) have explored jumping from a moving start, and little isknown about the power outputs achieved during such activity.Therefore, a goal of this study was to measure the whole bodymechanical power output during moving jumps of yellow-
footed rock wallabies. From this, muscle power output wascalculated based on the assumption that the majority of thewhole body power was provided by the hind limb extensormuscles.
In addition to looking at whole body and muscle powergeneration, we sought to examine several kinematic and kineticparameters associated with jumping compared with steadyhopping. Differences in hopping speed, time of contact, legextension, leg angle and initial leg stiffness were analyzed toevaluate how wallabies approached and executed a jumpcompared with steady-speed hopping. We expected that thewallabies would use similar approach speeds, as the conditionof our study was a jump for height and not distance (Alexander,1990). However, we anticipated that the rock wallabies wouldhave a longer period of ground contact, increasing the timeavailable to accelerate their body. We expected that net legextension during stance would also be greater in jumping toachieve the vertical acceleration required to reach the platformheight. Both leg contact angle and leg stiffness have beenshown to play an important role in converting an individual’sforward horizontal kinetic energy into vertical kinetic energyin human long-jumps and high-jumps (Alexander, 1990;Seyfarth et al., 1999). Thus, we predicted that the wallabieswould contact the ground with a shallower leg angle and havea higher initial leg stiffness during jumping.
Materials and methodsAnimals
Four adult yellow-footed rock wallabies Petrogalexanthopus L. (one male and three female, ranging from 5.10to 5.50·kg body mass) were obtained from a captive breedingcolony at the Adelaide Zoo in Adelaide, South Australia. Thethreatened status of these animals made them difficult to obtainand limited experimentation to non-invasive techniques only.All procedures, care and use of the animals for the study wereapproved by the University of Adelaide Animal EthicsCommittee. Throughout the experiments, the animals werehoused at the Waite Institute campus of Adelaide Universityin a system of large outdoor paddocks. Runways forconducting steady hopping and jumping experiments wereconstructed within the confines of one of these paddocks.
Runways and experimental protocol
To record steady-speed hopping, a 20·m�0.75·m runwaywas constructed from 1·m high light-gauge field fence strungfrom fence posts placed in the ground over a relatively level(~5% grade) stretch of the grassy outdoor paddock. The fenceshad to be extended to 3·m high with shade cloth to keep theanimals from jumping out of the runway, which was closed atboth ends to contain the animals. A 0.60·m�0.40·m force platewas set flush with the ground at approximately the midpoint ofthe runway. The force plate was positioned on a 5·cm thickconcrete slab buried in the ground and a wooden frame thesame depth as the force plate was used to keep the surroundingsoil from contacting the plate. The wallabies were placed in
C. P. McGowan and others
THE JOURNAL OF EXPERIMENTAL BIOLOGY
2743Jumping vs steady hopping mechanics in rock wallabies
the runway area and encouraged to hop from end to end. Onlytrials in which the animals were moving up the slight gradewere recorded. Approximately 15–20 trials were collectedfrom each animal; however, only a small subset of these wasconsidered suitable for analysis. For trials to be included, thewallaby had to hop at a relatively steady forward velocity(<10% change in velocity while the animal was in contact withthe force plate, as determined by integration of the horizontalground reaction force and the initial horizontal velocity), bothfeet had to strike the plate simultaneously, and all joint markershad to be visible for video analysis. A total of 18 trials, with aminimum of four trials from each animal, fit these criteria foranalysis.
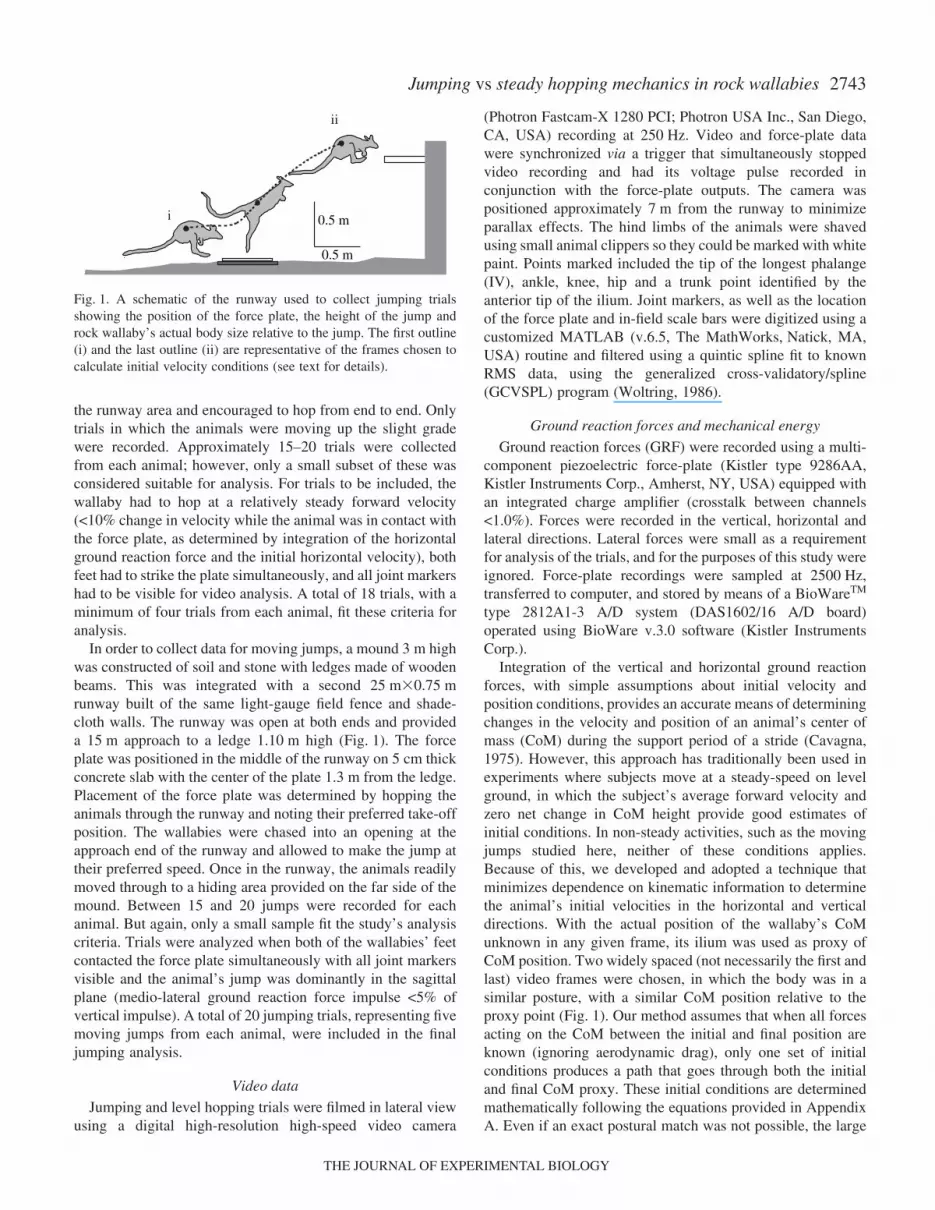
In order to collect data for moving jumps, a mound 3·m highwas constructed of soil and stone with ledges made of woodenbeams. This was integrated with a second 25·m�0.75·mrunway built of the same light-gauge field fence and shade-cloth walls. The runway was open at both ends and provideda 15·m approach to a ledge 1.10·m high (Fig.·1). The forceplate was positioned in the middle of the runway on 5·cm thickconcrete slab with the center of the plate 1.3·m from the ledge.Placement of the force plate was determined by hopping theanimals through the runway and noting their preferred take-offposition. The wallabies were chased into an opening at theapproach end of the runway and allowed to make the jump attheir preferred speed. Once in the runway, the animals readilymoved through to a hiding area provided on the far side of themound. Between 15 and 20 jumps were recorded for eachanimal. But again, only a small sample fit the study’s analysiscriteria. Trials were analyzed when both of the wallabies’ feetcontacted the force plate simultaneously with all joint markersvisible and the animal’s jump was dominantly in the sagittalplane (medio-lateral ground reaction force impulse <5% ofvertical impulse). A total of 20 jumping trials, representing fivemoving jumps from each animal, were included in the finaljumping analysis.
Video data
Jumping and level hopping trials were filmed in lateral viewusing a digital high-resolution high-speed video camera
(Photron Fastcam-X 1280 PCI; Photron USA Inc., San Diego,CA, USA) recording at 250·Hz. Video and force-plate datawere synchronized via a trigger that simultaneously stoppedvideo recording and had its voltage pulse recorded inconjunction with the force-plate outputs. The camera waspositioned approximately 7·m from the runway to minimizeparallax effects. The hind limbs of the animals were shavedusing small animal clippers so they could be marked with whitepaint. Points marked included the tip of the longest phalange(IV), ankle, knee, hip and a trunk point identified by theanterior tip of the ilium. Joint markers, as well as the locationof the force plate and in-field scale bars were digitized using acustomized MATLAB (v.6.5, The MathWorks, Natick, MA,USA) routine and filtered using a quintic spline fit to knownRMS data, using the generalized cross-validatory/spline(GCVSPL) program (Woltring, 1986).
Ground reaction forces and mechanical energy
Ground reaction forces (GRF) were recorded using a multi-component piezoelectric force-plate (Kistler type 9286AA,Kistler Instruments Corp., Amherst, NY, USA) equipped withan integrated charge amplifier (crosstalk between channels<1.0%). Forces were recorded in the vertical, horizontal andlateral directions. Lateral forces were small as a requirementfor analysis of the trials, and for the purposes of this study wereignored. Force-plate recordings were sampled at 2500·Hz,transferred to computer, and stored by means of a BioWareTM
type 2812A1-3 A/D system (DAS1602/16 A/D board)operated using BioWare v.3.0 software (Kistler InstrumentsCorp.).
Integration of the vertical and horizontal ground reactionforces, with simple assumptions about initial velocity andposition conditions, provides an accurate means of determiningchanges in the velocity and position of an animal’s center ofmass (CoM) during the support period of a stride (Cavagna,1975). However, this approach has traditionally been used inexperiments where subjects move at a steady-speed on levelground, in which the subject’s average forward velocity andzero net change in CoM height provide good estimates ofinitial conditions. In non-steady activities, such as the movingjumps studied here, neither of these conditions applies.Because of this, we developed and adopted a technique thatminimizes dependence on kinematic information to determinethe animal’s initial velocities in the horizontal and verticaldirections. With the actual position of the wallaby’s CoMunknown in any given frame, its ilium was used as proxy ofCoM position. Two widely spaced (not necessarily the first andlast) video frames were chosen, in which the body was in asimilar posture, with a similar CoM position relative to theproxy point (Fig.·1). Our method assumes that when all forcesacting on the CoM between the initial and final position areknown (ignoring aerodynamic drag), only one set of initialconditions produces a path that goes through both the initialand final CoM proxy. These initial conditions are determinedmathematically following the equations provided in AppendixA. Even if an exact postural match was not possible, the large
0.5 m
0.5 m
i
ii
Fig.·1. A schematic of the runway used to collect jumping trialsshowing the position of the force plate, the height of the jump androck wallaby’s actual body size relative to the jump. The first outline(i) and the last outline (ii) are representative of the frames chosen tocalculate initial velocity conditions (see text for details).
THE JOURNAL OF EXPERIMENTAL BIOLOGY
2744
interval between initial and final frames ensured thatinformation derived from movements of the whole bodyoverwhelmed the relatively small errors due to movements ofthe CoM within the body. At most, the actual CoM of theanimal can shift an estimated 5·cm, relative to the proxy point,while during the span between the two selected video frames,the wallabies traveled approximately 1.1·m vertically and1.5·m horizontally.
Using this approach to provide integration constants, GRFdata were integrated to determine velocities of the CoM, whichwere used to calculate kinetic energy in both the horizontal andvertical directions. Vertical CoM velocity was integrated todetermine CoM position, which was used to calculategravitational potential energy (see Appendix A). Theseenergies were summed to give the total mechanical energy ofthe wallaby’s CoM.
Mechanical power was obtained by differentiating theanimal’s total energy with respect to time. It was assumed thatthe majority of power produced during steady hopping andjumping was produced by the extensor musculature in bothhind legs, thus mechanical power was converted to musclemass-specific power by dividing through by the total mass ofthe hind limb extensor muscles. In order to estimate the hindlimb extensor muscle mass for the animals used in thisstudy, dissections of five similarly sized cadavers (mass:5.93±1.78·kg, mean ± S.D.) obtained from the Adelaide Zoowere conducted and total extensor muscle mass was calculatedas a percentage of body mass.
Leg stiffness
To explore differences in initial leg stiffness between steadyhopping and jumping trials, both legs were modeled as a singlespring in series with a linear actuator and the body wasconsidered to be a point mass located at the ilium point, whichwas a proxy for the position of the CoM. The presence of anactuator can have a significant influence on the apparentstiffness of the leg. Therefore, our model assumed that theactuator remained a fixed length until maximal compressionand produced only positive work when the leg was extendingin the later part of stance. All of the negative energy associatedwith leg compression was assumed to be stored in the springelement and recovered elastically. The length of the leg wasmeasured as a line from the ilium point to the tip of the toe,spanning the hip, knee, ankle and metatarsalphalangeal joints.The ilium point was chosen instead of the hip point becausethe hip likely plays a large role in controlling CoM position,and thus affects limb stiffness. The initial length of the leg (L0)was determined at foot touch-down. Changes in leg length(∆L(t)) were measured throughout stance, and leg stiffness wasdetermined at the time of maximum leg compression (∆L(t)max)by the ratio:
kleg′ = FR(t) / ∆L(t)max ,
where kleg′ is leg stiffness and FR(t) is the resultant GRF at thetime of maximum leg compression. This differs from previousmass-spring models developed for steady locomotion (Farley
et al., 1993; McMahon and Cheng, 1990), which assume thatthe GRF curve and changes in leg length are relativelysymmetrical during stance and calculate leg stiffness as theratio of peak resultant GRF to maximum leg compression. Inrock wallabies these events do not coincide and there is netextension of the limb in both steady speed and jumping. Forthe purpose of this study, we were interested in the leg’s abilityto resist compression and redirect the CoM, therefore we choseto calculate initial leg stiffness at the point of maximum legcompression as described above.
Kinematics
The leg model was also used to measure limb angles, relativeto the horizontal, at foot touch-down and take-off. Thehorizontal velocity of the wallabies, as they approached theforce plate, was determined by the same technique used toderive the integration constants (see above and Appendix A).The magnitude and orientation of the velocity vector of theCoM at take-off were also determined from the integratedvertical and fore–aft horizontal ground reaction forces. Timeof contact was measured from the force plate when the verticalforce was greater than 1.5·N (>3% body weight).
Statistics
A repeated-measures analysis of variance (ANOVA) wasused to determine statistical significance between steady-speedand jumping trials. Mean variables were determined for eachanimal by averaging across the trials that each performed.These were in turn used to calculate mean values for steadyspeed and jumping. No significant effect of individual on thevariables measured was determined by ANOVA. All variablescomparing level hopping and jumping are reported as means ±S.E.M. Body mass and percent hind limb muscle mass arereported as mean ± S.D., as these address individual variation.
ResultsThe average forward velocity of the wallabies approaching
the jump did not differ from the speed that they used whenmoving through the steady-speed course (4.14±0.18·ms–1 and4.22±0.12·ms–1, respectively; mean ± S.E.M.). The averagechange in horizontal velocity during stance was 4.3±0.7% insteady trials and –16.0±1.1% during jumps, indicating largedecelerations in jumping trials. The time of contact wasconsistent in all trials and was not significantly differentbetween conditions, averaging 116±4·ms in steady hoppingand 120±5·ms during jumps. The magnitude of the velocityvector of the CoM at take-off in steady hopping was4.70±0.16·m·s–1 and 5.23±0.14·m·s–1 during jumping trials.While this difference was small, it was significant (P=0.047).The angle of the velocity vector at take-off was much steeperin jumping trials (48.8±0.8°) than in steady trials (20.7±1.3°,P<0.0001).
Ground reaction forces
The ground reaction forces (GRF) produced by the rock
C. P. McGowan and others
THE JOURNAL OF EXPERIMENTAL BIOLOGY
2745Jumping vs steady hopping mechanics in rock wallabies
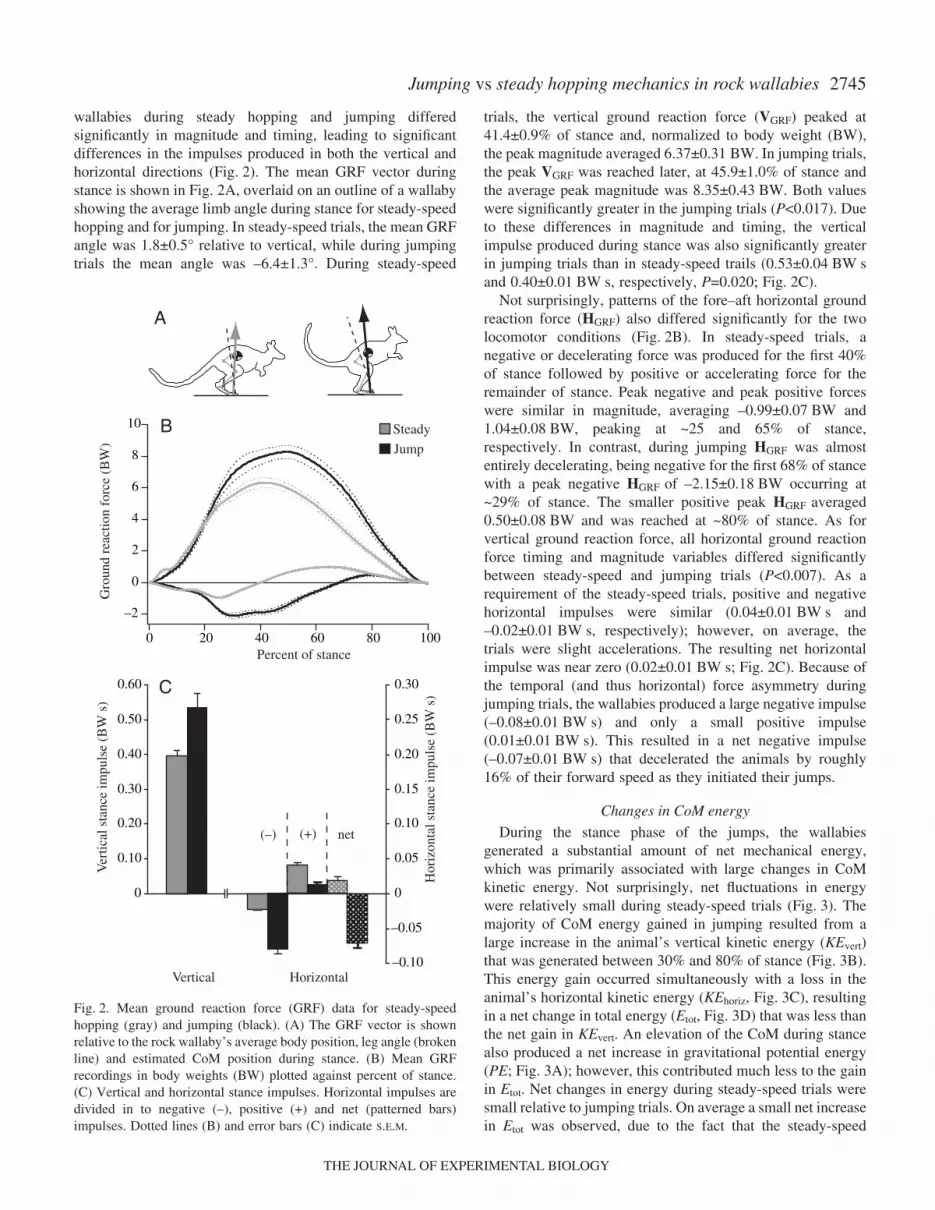
wallabies during steady hopping and jumping differedsignificantly in magnitude and timing, leading to significantdifferences in the impulses produced in both the vertical andhorizontal directions (Fig.·2). The mean GRF vector duringstance is shown in Fig.·2A, overlaid on an outline of a wallabyshowing the average limb angle during stance for steady-speedhopping and for jumping. In steady-speed trials, the mean GRFangle was 1.8±0.5° relative to vertical, while during jumpingtrials the mean angle was –6.4±1.3°. During steady-speed
trials, the vertical ground reaction force (VGRF) peaked at41.4±0.9% of stance and, normalized to body weight (BW),the peak magnitude averaged 6.37±0.31·BW. In jumping trials,the peak VGRF was reached later, at 45.9±1.0% of stance andthe average peak magnitude was 8.35±0.43·BW. Both valueswere significantly greater in the jumping trials (P<0.017). Dueto these differences in magnitude and timing, the verticalimpulse produced during stance was also significantly greaterin jumping trials than in steady-speed trails (0.53±0.04·BW·sand 0.40±0.01·BW·s, respectively, P=0.020; Fig.·2C).
Not surprisingly, patterns of the fore–aft horizontal groundreaction force (HGRF) also differed significantly for the twolocomotor conditions (Fig.·2B). In steady-speed trials, anegative or decelerating force was produced for the first 40%of stance followed by positive or accelerating force for theremainder of stance. Peak negative and peak positive forceswere similar in magnitude, averaging –0.99±0.07·BW and1.04±0.08·BW, peaking at ~25 and 65% of stance,respectively. In contrast, during jumping HGRF was almostentirely decelerating, being negative for the first 68% of stancewith a peak negative HGRF of –2.15±0.18·BW occurring at~29% of stance. The smaller positive peak HGRF averaged0.50±0.08·BW and was reached at ~80% of stance. As forvertical ground reaction force, all horizontal ground reactionforce timing and magnitude variables differed significantlybetween steady-speed and jumping trials (P<0.007). As arequirement of the steady-speed trials, positive and negativehorizontal impulses were similar (0.04±0.01·BW·s and–0.02±0.01·BW·s, respectively); however, on average, thetrials were slight accelerations. The resulting net horizontalimpulse was near zero (0.02±0.01·BW·s; Fig.·2C). Because ofthe temporal (and thus horizontal) force asymmetry duringjumping trials, the wallabies produced a large negative impulse(–0.08±0.01·BW·s) and only a small positive impulse(0.01±0.01·BW·s). This resulted in a net negative impulse(–0.07±0.01·BW·s) that decelerated the animals by roughly16% of their forward speed as they initiated their jumps.
Changes in CoM energy
During the stance phase of the jumps, the wallabiesgenerated a substantial amount of net mechanical energy,which was primarily associated with large changes in CoMkinetic energy. Not surprisingly, net fluctuations in energywere relatively small during steady-speed trials (Fig.·3). Themajority of CoM energy gained in jumping resulted from alarge increase in the animal’s vertical kinetic energy (KEvert)that was generated between 30% and 80% of stance (Fig.·3B).This energy gain occurred simultaneously with a loss in theanimal’s horizontal kinetic energy (KEhoriz, Fig.·3C), resultingin a net change in total energy (Etot, Fig.·3D) that was less thanthe net gain in KEvert. An elevation of the CoM during stancealso produced a net increase in gravitational potential energy(PE; Fig.·3A); however, this contributed much less to the gainin Etot. Net changes in energy during steady-speed trials weresmall relative to jumping trials. On average a small net increasein Etot was observed, due to the fact that the steady-speed
Fig.·2. Mean ground reaction force (GRF) data for steady-speedhopping (gray) and jumping (black). (A) The GRF vector is shownrelative to the rock wallaby’s average body position, leg angle (brokenline) and estimated CoM position during stance. (B) Mean GRFrecordings in body weights (BW) plotted against percent of stance.(C) Vertical and horizontal stance impulses. Horizontal impulses aredivided in to negative (–), positive (+) and net (patterned bars)impulses. Dotted lines (B) and error bars (C) indicate S.E.M.
0
0.10
0.20
0.30
0.40
0.50
0.60
–0.05
0
0.05
0.10
0.15
0.20
0.25
0.30
–0.10
Hor
izon
tal s
tanc
e im
puls
e (B
W s
)
Ver
tical
sta
nce
impu
lse
(BW
s)
Vertical Horizontal
(–) (+) net
10
8
6
4
2
0
–2
100806040200
Gro
und
reac
tion
forc
e (B
W)
Percent of stance
A
C
Steady
Jump
B
THE JOURNAL OF EXPERIMENTAL BIOLOGY
2746
runway was on an approx. 5% gradient and the animalsaccelerated slightly when hopping on the force plate. Small netincreases in PE, KEvert and KEhoriz contributed equally to thesmall gain in Etot (Fig.·3D).
Mechanical power and work
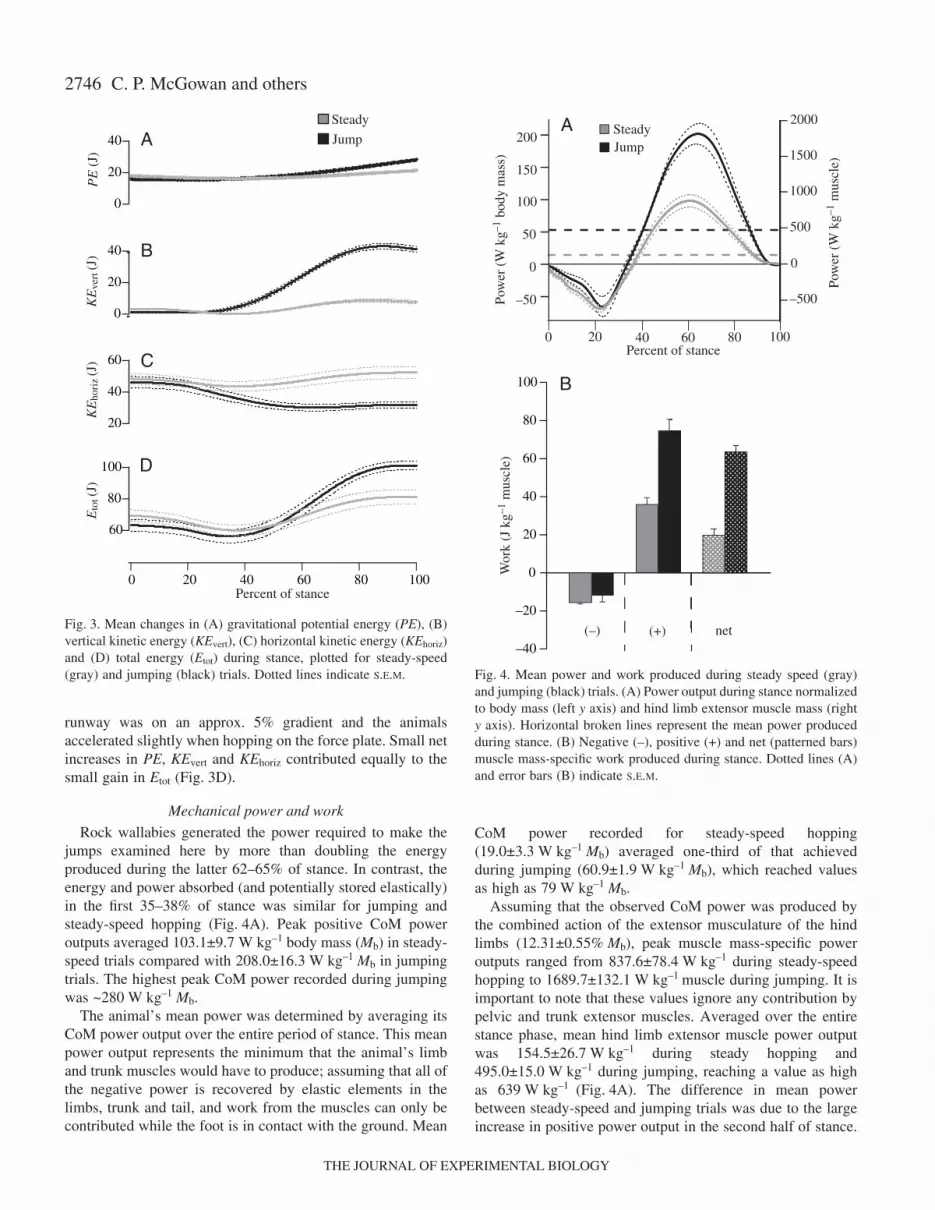
Rock wallabies generated the power required to make thejumps examined here by more than doubling the energyproduced during the latter 62–65% of stance. In contrast, theenergy and power absorbed (and potentially stored elastically)in the first 35–38% of stance was similar for jumping andsteady-speed hopping (Fig.·4A). Peak positive CoM poweroutputs averaged 103.1±9.7·W·kg–1·body·mass (Mb) in steady-speed trials compared with 208.0±16.3·W·kg–1·Mb in jumpingtrials. The highest peak CoM power recorded during jumpingwas ~280·W·kg–1·Mb.
The animal’s mean power was determined by averaging itsCoM power output over the entire period of stance. This meanpower output represents the minimum that the animal’s limband trunk muscles would have to produce; assuming that all ofthe negative power is recovered by elastic elements in thelimbs, trunk and tail, and work from the muscles can only becontributed while the foot is in contact with the ground. Mean
CoM power recorded for steady-speed hopping(19.0±3.3·W·kg–1·Mb) averaged one-third of that achievedduring jumping (60.9±1.9·W·kg–1·Mb), which reached valuesas high as 79·W·kg–1·Mb.
Assuming that the observed CoM power was produced bythe combined action of the extensor musculature of the hindlimbs (12.31±0.55%·Mb), peak muscle mass-specific poweroutputs ranged from 837.6±78.4·W·kg–1 during steady-speedhopping to 1689.7±132.1·W·kg–1 muscle during jumping. It isimportant to note that these values ignore any contribution bypelvic and trunk extensor muscles. Averaged over the entirestance phase, mean hind limb extensor muscle power outputwas 154.5±26.7·W·kg–1 during steady hopping and495.0±15.0·W·kg–1 during jumping, reaching a value as highas 639·W·kg–1 (Fig.·4A). The difference in mean powerbetween steady-speed and jumping trials was due to the largeincrease in positive power output in the second half of stance.
C. P. McGowan and others
40
20
0
40
20
0
60
40
20
100
80
60
100806040200
PE
(J)
KE
vert
(J)
KE
hori
z (J
)E
tot (
J)
Percent of stance
Steady
JumpA
B
C
D
Fig.·3. Mean changes in (A) gravitational potential energy (PE), (B)vertical kinetic energy (KEvert), (C) horizontal kinetic energy (KEhoriz)and (D) total energy (Etot) during stance, plotted for steady-speed(gray) and jumping (black) trials. Dotted lines indicate S.E.M.
SteadyJump
–40
–20
0
20
40
60
80
100
Wor
k (J
kg–1
mus
cle)
(–) (+) net
0 20 40 60 80 100
0
1000
1500
2000
–500
500
Pow
er (
W k
g–1 m
uscl
e)
200
150
100
50
0
–50Pow
er (
W k
g–1 b
ody
mas
s)
A
B
Percent of stance
Fig.·4. Mean power and work produced during steady speed (gray)and jumping (black) trials. (A) Power output during stance normalizedto body mass (left y axis) and hind limb extensor muscle mass (righty axis). Horizontal broken lines represent the mean power producedduring stance. (B) Negative (–), positive (+) and net (patterned bars)muscle mass-specific work produced during stance. Dotted lines (A)and error bars (B) indicate S.E.M.
THE JOURNAL OF EXPERIMENTAL BIOLOGY
2747Jumping vs steady hopping mechanics in rock wallabies
Whereas mean muscle mass-specific power averaged over thepositive portion of the power curve more than doubledfrom 488.2±50.3·W·kg–1 during steady hopping to1030±83.5·W·kg–1 during jumping, average negative powerdid not differ significantly between conditions (steadyhopping: –218.9±9.0·W·kg–1 vs jumping –169.3±47.9·W·kg–1;P=0.348).
Consistent with differences in power production, net workby the muscles was threefold less during steady-speedhopping (19.6±3.1·J·kg–1) muscle compared with jumping(62.7±3.1·J·kg–1; Fig.·4B). The net positive work done duringsteady-speed hopping again reflects minor accelerations andthe runway being on a slight gradient. The close matchbetween differences in muscle work and differences inaverage power reflects the fact that the time of limb contacton the ground did not differ between conditions.Consequently, differences in net muscle work were, again,predominately due to differences in positive work rather thannegative work, which was nearly the same for both conditions(P=0.282).
Limb kinematics and stiffness
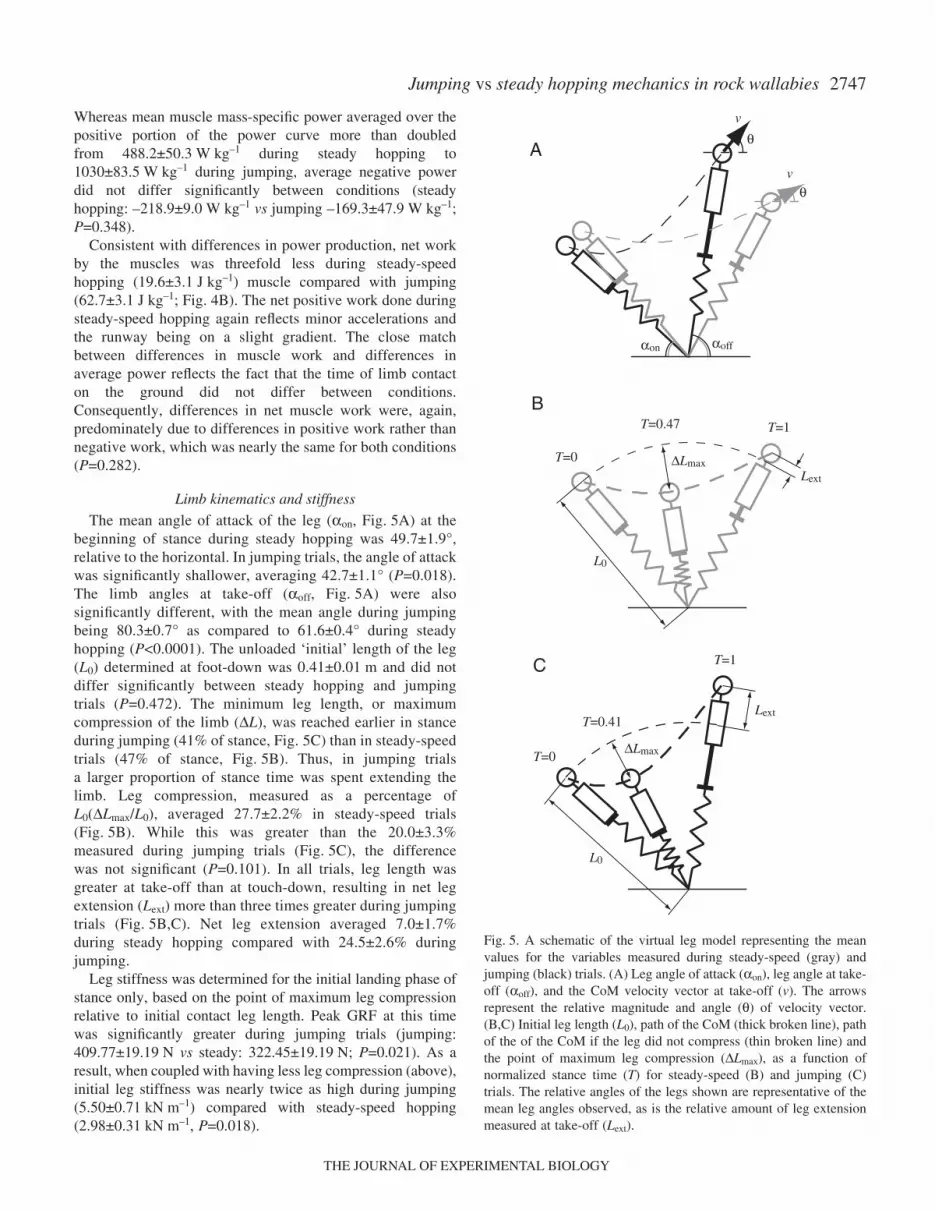
The mean angle of attack of the leg (αon, Fig.·5A) at thebeginning of stance during steady hopping was 49.7±1.9°,relative to the horizontal. In jumping trials, the angle of attackwas significantly shallower, averaging 42.7±1.1° (P=0.018).The limb angles at take-off (αoff, Fig.·5A) were alsosignificantly different, with the mean angle during jumpingbeing 80.3±0.7° as compared to 61.6±0.4° during steadyhopping (P<0.0001). The unloaded ‘initial’ length of the leg(L0) determined at foot-down was 0.41±0.01·m and did notdiffer significantly between steady hopping and jumpingtrials (P=0.472). The minimum leg length, or maximumcompression of the limb (∆L), was reached earlier in stanceduring jumping (41% of stance, Fig.·5C) than in steady-speedtrials (47% of stance, Fig.·5B). Thus, in jumping trialsa larger proportion of stance time was spent extending thelimb. Leg compression, measured as a percentage ofL0(∆Lmax/L0), averaged 27.7±2.2% in steady-speed trials(Fig.·5B). While this was greater than the 20.0±3.3%measured during jumping trials (Fig.·5C), the differencewas not significant (P=0.101). In all trials, leg length wasgreater at take-off than at touch-down, resulting in net legextension (Lext) more than three times greater during jumpingtrials (Fig.·5B,C). Net leg extension averaged 7.0±1.7%during steady hopping compared with 24.5±2.6% duringjumping.
Leg stiffness was determined for the initial landing phase ofstance only, based on the point of maximum leg compressionrelative to initial contact leg length. Peak GRF at this timewas significantly greater during jumping trials (jumping:409.77±19.19·N vs steady: 322.45±19.19·N; P=0.021). As aresult, when coupled with having less leg compression (above),initial leg stiffness was nearly twice as high during jumping(5.50±0.71·kN·m–1) compared with steady-speed hopping(2.98±0.31·kN·m–1, P=0.018).
θ
αon αoff
θ
v
v
T=0
T=1
T=0.41
L0
Lext
∆Lmax
T=0
T=1T=0.47
L0
Lext
∆Lmax
A
B
C
Fig.·5. A schematic of the virtual leg model representing the meanvalues for the variables measured during steady-speed (gray) andjumping (black) trials. (A) Leg angle of attack (αon), leg angle at take-off (αoff), and the CoM velocity vector at take-off (v). The arrowsrepresent the relative magnitude and angle (θ) of velocity vector.(B,C) Initial leg length (L0), path of the CoM (thick broken line), pathof the of the CoM if the leg did not compress (thin broken line) andthe point of maximum leg compression (∆Lmax), as a function ofnormalized stance time (T) for steady-speed (B) and jumping (C)trials. The relative angles of the legs shown are representative of themean leg angles observed, as is the relative amount of leg extensionmeasured at take-off (Lext).
THE JOURNAL OF EXPERIMENTAL BIOLOGY
2748
DiscussionThe goal of our study was to explore the mechanical power
requirements associated with jumping in yellow-footed rockwallabies and to determine how these requirements are achievedrelative to steady-speed hopping mechanics. Jumping canrequire extremely high muscle power output. Although amusculoskeletal design favoring elastic energy savings, like thatfound in wallabies and kangaroos, may limit an animal’s abilityto produce high power (Biewener and Bertram, 1991; Biewener,1998; Biewener and Roberts, 2000; Daley and Biewener, 2003),rock wallabies regularly make large jumps while maneuveringin their natural environment. Our analysis of moving jumps,which appear well within their performance range, shows thatrock wallabies achieve substantial whole body and muscle mass-specific power output, averaging 208·W·kg–1 and 495·W·kg–1,respectively. Our analysis indicates that in addition to the legs,muscles of the back, pelvis and tail are likely important incontributing mechanical power for jumping. Additionally, it ispossible that elastic elements in the legs may act to amplify thepower output of the muscles (Alexander, 2002; Anderson andPandy, 1993; Wilson et al., 2003; Galantis and Woledge, 2003;Roberts and Marsh, 2003; and see discussion below). However,this possibility is difficult to examine and could not be tested inthe current study.
Whether or not the ability of rock wallabies to generateconsiderable mechanical power during relatively pedestrianjumps reflects a more limited capacity for elastic energystorage during steady hopping requires further study.Nevertheless, because steady movement is unlikely to be afrequent occurrence in their natural environment, it isreasonable to expect that selection for elastic savings may notbe strong in these and other rock wallaby species. It isnoteworthy that similarly sized tammar wallabies, which canstore significant energy in their leg tendons (Biewener andBaudinette, 1995) and reduce their metabolic cost of steadyhopping (Baudinette et al., 1992), were unwilling to make the1·m high jumps in this study. Our casual observation is thattammar wallabies hop around rather than over barriers, whichrock wallabies readily negotiate.
Mechanical power output during moving jumps
The height and distance of the jumps in this study wereapproximately equal (~1·m); however, the horizontal distancetraveled during the jumps was only slightly greater than thattraveled during the aerial phase of a steady-speed hop(~0.75·m). Therefore, we characterized this jump as one forheight rather than distance. Consistent with our predictions fora jump to gain height, rock wallabies use similar approachspeeds when jumping as they do during steady hopping.However, in contrast to our expectation, rock wallabies do notincrease their time of contact to increase the ground impulseduring moving jumps. Thus, the nearly threefold greater network performed during jumping (Fig.·4B) has to be producedin the same period of time as in steady-speed hopping. Thisleads to extremely high power outputs in jumping.
The whole body and muscle mass-specific power outputs
measured during jumping are comparable to those found inprevious studies of standing jumps in vertebrates. Net hind limbextensor muscle power averaged nearly 500·W·kg–1 and reachedvalues as high as 639·W·kg–1. While this is not as high as1100·W·kg–1 reported for galagoes Galago senegalensis (Aerts,1998) or 800·W·kg–1 measured in Cuban tree frogs Osteopilusseptentrionalis (Peplowski and Marsh, 1997), the jumps made bythe rock wallabies reported here almost certainly did not representtheir maximal effort. Even so, these values likely exceed themaximum power producing capability of vertebrate skeletalmuscle (250–400·W·kg–1; Weis-Fogh and Alexander, 1977; Lutzand Rome, 1994; Marsh and John-Alder, 1994). In galagoes andfrogs, it has been shown that these exceptionally high poweroutputs are achieved through a mechanical power amplifier.
In a jump from rest, animals are able to load elastic elementsin the limbs prior to leg extension, allowing muscle work to bestored as elastic energy, which can be recovered rapidly justprior to take-off, amplifying the mechanical power producedby the muscles. Although the rock wallabies were moving priorto the jump, muscle power may still be amplified by thepresence of elastic elements in series with their muscles. Inaddition to releasing energy much faster than muscles can dowork, energy release from tendon recoil is nearly independentof speed (Ker, 1981). In contrast, the force and work that amuscle can produce declines at faster shortening velocities.Thus, even when an animal is moving its leg muscles maycontract throughout most of stance, doing work to stretch thetendons. The tendons then recoil rapidly at the end of stanceas their tension drops, returning the energy in a very briefperiod of time. Modeling studies have shown that the presenceof an inertial load in series with a muscle tendon unit can resultin power outputs of up to twice what muscles alone canproduce (Alexander, 2002; Galantis and Woledge, 2003).Given the anatomy of the rock wallabies’ hind limbs, webelieve that some power amplification likely occurs; however,our current data do not allow us to test this hypothesis.
Another likely explanation for the exceptionally high musclepower outputs estimated during rock wallaby jumping is thatthe hind limb extensor muscles are not the only musclesrecruited to produce power. A recent study measuring powergeneration in accelerating tammar wallabies (McGowan et al.,2005) showed that in the largest accelerations the legs onlysupply 60–65% of the work done on the animal’s CoM, withthe remainder likely produced by movements of the trunk andtail. Therefore, a more accurate estimate of muscle poweroutput in the present study should include muscles of the back,trunk and tail, in addition to hind limb extensors. While thesemeasurements were not made on all of the cadavers used inthis study, masses of the major back and tail muscles weretaken for a single specimen. Together, these musclesconstituted 5.1% of the animal’s total body mass. Assumingthat this is consistent in all animals, and given the hind limbextensor muscle mass constitutes 12.3% Mb, it is likely that atleast 17% of the animal’s body mass comprises muscles thatcould play a role in producing power during a jump. Thiswould indicate that the muscles achieved a mass-specific
C. P. McGowan and others
THE JOURNAL OF EXPERIMENTAL BIOLOGY
2749Jumping vs steady hopping mechanics in rock wallabies
power output of 452·W·kg–1 muscle. While this value it stillhigh, it is more likely within the range that vertebrate skeletalmuscle can produce. Even so, it is unlikely that all of thesemuscles are fully active throughout stance. Consequently, webelieve 452·W·kg–1 represents a minimum estimate for themuscle mass-specific power output achieved by the rockwallabies for what we believe were fairly pedestrian jumps.
Leg stiffness
In studies of human long-jumping, it has been shown thatleg stiffness plays an important role in jump performance. Astiff leg and relatively steep angle of attack allows the jumperto generate a high vertical impact (Seyfarth et al., 1999),accelerating the body upward while much of the horizontalkinetic energy is translated into horizontal distance for thejump. And, while the jump in our study was for height ratherthan distance, we predicted that increased leg stiffness wouldplay a role in jumping. Consistent with this prediction, the legsare nearly twice as stiff during jumping as they are in steady-speed hopping (5.5·kN·m–1 vs 3.0·kN·m–1). This increase instiffness allows the leg to act to some degree as a strut, toredirect a portion of the animal’s horizontal kinetic energy(KEhoriz) into vertical kinetic energy (KEvert).
The majority of the energy for the jumps comes from thesubstantial gain in KEvert between 30% and 75% of stance(Fig.·3B). This gain in KEvert occurs simultaneously with adecrease of KEhoriz (Fig.·3C). This KE transfer reduces theamount of energy that must be supplied by the muscles by~25%. However, because the increase in KEvert is greater thanthe decrease KEhoriz, the muscles must supply this differencein energy to accelerate the body upward. Because the time oflimb contact is unchanged from steady-speed hopping, themajority of the increase in muscle power is achieved throughextension of the limb (Lext), which the leg model shows isincreased threefold (Fig.·5B,C).
The angle of attack of the leg used by the wallabies duringjumping is only slightly shallower, relative to the ground, thanin steady hopping, and within the range shown to producemaximum height in human high-jumping (~45–55°;Alexander, 1990; Dapena and Chung, 1988). It has beensuggested that a shallower leg angle allows the foot to be onthe ground longer while the body travels a longer distance(Alexander, 1990). A shallow leg angle is also associated witha greater negative horizontal GRF. In rock wallabies it is clearthat a greater negative horizontal GRF is present duringjumping (Fig, 2B,C); however, as noted above, the time ofcontact is unaffected. In fact, due to a much steeper angle attake off during jumps (Fig.·2A), the excursion angle of the legis smaller than during steady-speed trails. Time of contact ismaintained during jumping by increasing extension of the leg,which keeps the foot in contact with the ground.
Conclusions
For the jumps recorded in this study, estimates of musclemass-specific power output (450·W·kg–1·muscle) suggest thatall of the musculature of the legs, back and tail are recruited to
produce jumps and that power output is near the maximumexpected for vertebrate skeletal muscle. Even so, the movingjumps examined in this study appeared routine for the animals.In over 70 jumping trials recorded, the wallabies only failed tomake the jump twice. This suggests that jumps of greater height(and distance), of which we believe the animals are capable,would be associated with longer contact times. Otherwise, themuscles and elastic tissues would have to deliver more power.However, this remains to be tested. Although moving jumpsmay not allow as much power amplification via preloading ofelastic elements in the limb compared with standing jumps, itis likely that rapid energy release from the tendons and otherelastic elements significantly contributes to increased poweroutput of rock wallaby jumping. This study does not specificallyaddress the sources of power during jumping and further workis required to determine which muscle groups play the greatestrole. Approach speed and limb angles suggest that themechanics of the jump being made in this study is similar tohuman high-jumping. However, like human long-jumping,initial leg stiffness also appears to play a significant role andlikely facilitates transfer of the animal’s horizontal kineticenergy into vertical kinetic energy. Additional research is alsorequired to determine which joints and muscle–tendon unitschange stiffness and how changes in individual joint stiffnessand actuation affect overall leg stiffness.
In conclusion, our study shows that rock wallabies arecapable of achieving very high mechanical power outputsduring moving jumps. Whether this comes at the expense oftendon and aponeurosis strain energy savings by rock wallabiesduring steady level hopping will require a more detailed kineticanalysis of their level hopping mechanics.
Appendix AClassical calculation of CoM mechanics from force platform
measurements
Measured instantaneous forces f provide both horizontaland vertical instantaneous accelerations a given the total bodymass m:
where g is the vertical acceleration due to gravity (–9.81·m·s–2)and subscripts horiz and vert indicate horizontal and verticalcomponents, respectively, throughout. These expressions can beintegrated once to provide instantaneous velocities v at time t:
(A3)vhoriz = Vinit,horiz +⌠⎮⌡t
ahoriz dt ;
(A4)vvert = Vinit,vert +⌠⎮⌡t
avert dt ,
(A1)fhoriz
mahoriz = ;
(A2)fvert
mavert = g + ,
THE JOURNAL OF EXPERIMENTAL BIOLOGY
2750
with initial velocity conditions Vinit acting as integrationconstants. This can be integrated again to provideinstantaneous horizontal and vertical positions s:
given initial positions for integration constants Sinit.Instantaneous kinetic and potential energies ke and pe can thusbe derived from Eq.·A3, A4 and A6:
ke = Gm(v2horiz + v2
vert) (A7)
pe = mgsvert . (A8)
Initial velocity conditions
The horizontal and vertical initial velocity conditions(Vinit,horiz and Vinit,vert) required are critical: a small error in Vinit
results in a progressive error of instantaneous position overtime, and subsequently whole-body energies are highlysensitive to Vinit. These initial velocity conditions must bederived from kinematic observations – force platformmeasurements alone are not sufficient. While, for steadylocomotion, average velocities are often close enough to initialvelocities that they may be used as initial velocities, allowingsimple methods of determining the integration constants (suchas triggering photocells), this is clearly not the case forunsteady locomotion.
Using the kinematic information from two video frameswidely spaced in time and in which the animal’s posture issimilar (see Materials and methods), the following equationscan be employed to determine the initial velocities of the CoM.
Initial (subscript init) and final (subscript end) positionsseparated by a time T relate, by a combination of Eq.·A1–A6,by
in the horizontal direction, and
in the vertical direction (and so including the gravitationalacceleration term). This means that initial velocity conditionscan be determined that require the calculated path to gothrough the initial and final positions:
(A11)
Vhoriz,init =
⌠⎮⌡
⌠⎮⌡T
dtShoriz,end – Shoriz,init +⎛⎜⎝
⎞⎟⎠
fhoriz
m
1
T
⎡⎢⎣
⎤⎥⎦
⎧⎨⎩
⎫⎬⎭
(A10)Svert,end = Svert,init + Vvert,init T +⌠⎮⌡
⌠⎮⌡T
dt+⎛⎜⎝
⎞⎟⎠
fvert
m
gT2
2
(A9)Shoriz,end = Shoriz,init + Vhoriz,init T +⌠⎮⌡
⌠⎮⌡T
dt⎛⎜⎝
⎞⎟⎠
fhoriz
m
(A5)shoriz = Sinit,horiz +⌠⎮⌡t
vhoriz dt ;
(A6)svert = Sinit,vert +⌠⎮⌡t
vvert dt ,
for the horizontal direction, which is an explicit form of thatdescribed in a force platform study on dogs (Lee et al., 1999),and
for the vertical direction.
The authors wish to thank Jayne Skinner for her efforts incaring for the animals used in the study and for her excellentassistance in conducting experiments. We would also like tothank the Adelaide Zoo for their detonation of the animalsused in this study as well as the cadavers. We are grateful tothe members of our lab groups for insightful comments onthis and earlier versions of this manuscript. This work wassupported by the Putnam Expedition Grant, the Barbour Fundfor Museum Collections at Harvard University and theOrganismic and Evolutionary Biology Student ResearchGrant, Harvard University (to C.P.M.).
ReferencesAerts, P. (1998). Vertical jumping in Galago senegalensis: the quest for an
obligate mechanical power amplifier. Phil. Trans. R. Soc. Lond. B 353,1607-1620.
Alexander, R. McN. (1974). The mechanics of jumping by a dog (Canisfamiliaris). J. Zool. Lond. 173, 549-573.
Alexander, R. McN. (1990). Optimum take-off techniques for high and longjumps. Phil. Trans. R. Soc. Lond. B 329, 3-10.
Alexander, R. McN. (2002). Tendon elasticity and muscle function. Comp.Biochem. Physiol. 133A, 1001-1011.
Alexander, R. McN. and Vernon, A. (1975). Mechanics of hopping bykangaroos (Macropodidae). J. Zool. Lond. 177, 265-303.
Anderson, F. C. and Pandy, M. G. (1993). Storage and utilization of elasticstrain energy during jumping. J. Biomech. 26, 1413-1427.
Baudinette, R. V., Snyder, G. K. and Frappell, P. B. (1992). Energetic costof locomotion in the tammar wallaby. Am. J. Physiol. 262, R771-R778.
Bennet-Clark, H. C. (1977). Scale effects in jumping animals. In Scale Effectsin Animal Locomotion (ed. T. J. Pedley), pp. 185-201. New York: AcademicPress.
Bennett, M. B. and Taylor, G. C. (1995). Scaling of elastic strain energy inkangaroos and the benefits of being big. Nature 378, 56-59.
Biewener, A. A. (1998). Muscle function in-vivo: A comparison of musclesused for elastic energy savings versus muscles used to generate mechanicalpower. Am. Zool. 38, 703-717.
Biewener, A. A. and Baudinette, R. V. (1995). In vivo muscle force andelastic energy storage during steady-speed hopping of tammar wallabies(Macropus eugenii). J. Exp. Biol. 198, 1829-1841.
Biewener, A. A. and Bertram, J. E. A. (1991). Efficiency and optimizationin the design of skeletal support systems. In Efficiency and Economy inAnimal Physiology (ed. R. W. Blake), pp. 65-82. Cambridge, UK:Cambridge University Press.
Biewener, A. A. and Roberts, T. J. (2000). Muscle and tendon contributionsto force, work and elastic energy savings: a comparative perspective. Exerc.Sport. Sci. Rev. 28, 99-107.
Biewener, A. A., McGowan, C. P., Card, G. M. and Baudinette, R. V.(2004). Dynamics of leg muscle function in tammar wallabies (M. eugenii)during level versus incline hopping. J. Exp. Biol. 207, 211-223.
Cavagna, G. A. (1975). Force plates as ergometers. J. Appl. Physiol. 39, 174-179.
Cavagna, G. A., Heglund, N. C. and Taylor, C. R. (1977). Mechanical workin terrestrial locomotion: two basic mechanisms for minimizing energyexpenditure. Am. J. Physiol. 233, R243-R261.
(A12)
Vvert,init =
⌠⎮⌡
⌠⎮⌡T
dtSvert,end – Svert,init +⎛⎜⎝
⎞⎟⎠
⎛⎜⎝
⎞⎟⎠
fvert
m
1
T
⎡⎢⎣
⎤⎥⎦
⎧⎨⎩
⎫⎬⎭
+gT2
2
C. P. McGowan and others
THE JOURNAL OF EXPERIMENTAL BIOLOGY
2751Jumping vs steady hopping mechanics in rock wallabies
Daley, M. A. and Biewener, A. A. (2003). Muscle force–length dynamicsduring level versus incline locomotion: a comparison of in vivo performanceof two guinea fowl ankle extensors. J. Exp. Biol. 206, 2941-2957.
Dapena, J. and Chung, C. S. (1988). Vertical and radial motions of the bodyduring the take-off phase of high jumping. Med. Sci. Sports Exerc. 20, 290-302.
Dutto, D. J., Hoyt, D. F., Clayton, H. M., Cogger, E. A. and Wickler, S. J.(2004). Moments and power generated by the horse (Equus caballus) hindlimb during jumping. J. Exp. Biol. 207, 667-674.
Farley, C. T., Glasheen, J. and McMahon, T. A. (1993). Running springs:speed and animal size. J. Exp. Biol. 185, 71-86.
Gabaldon, A. M., Nelson, F. E. and Roberts, T. J. (2004). Mechanicalfunction of two ankle extensors in wild turkeys: shifts from energyproduction to energy absorption during incline versus decline running. J.Exp. Biol. 207, 2277-2288.
Galantis, A. and Woledge, R. C. (2003). The theoretical limits to poweroutput of a muscle-tendon complex with inertial and gravitational loads.Proc. R. Soc. Lond. B 270, 1493-1498.
Hall-Craggs, E. C. B. (1965). An analysis of the jump of the lesser galago(Galago senegalensis). J. Zool. Lond. 147, 20-29.
Heglund, N. C., Fedak, M. A., Taylor, C. R. and Cavagna, G. A. (1982).Energetics and mechanics of terrestrial locomotion. IV. Total mechanicalenergy changes as a function of speed and body size in birds and mammals.J. Exp. Biol. 97, 57-66.
Ker, R. F. (1981). Dynamic tensile properties of the plantaris tendon of sheep(Ovis aries). J. Exp. Biol. 93, 283-302.
Ker, R. F., Dimery, N. J. and Alexander, R. M. (1986). The role of tendonelasticity in hopping in a wallaby (Macropus rufogriseus). J. Zool. 208, 417-428.
Lee, D. V., Bertram, J. E. A. and Todhunter, R. J. (1999). Acceleration andbalance in trotting dogs. J. Exp. Biol. 202, 3565-3573.
Lutz, G. L. and Rome, L. C. (1994). Built for jumping: the design of the frogmuscular system. Science 263, 370-372.
Marsh, R. L. (1999). How muscles deal with real-world loads: the influenceof length trajectory on muscle performance. J. Exp. Biol. 202, 3377-3385.
Marsh, R. L. and John-Alder, J. B. (1994). Jumping performance of hylidfrogs measured with high-speed cine film. J. Exp. Biol. 188, 131-141.
McGowan, C. P., Baudinette, R. V. and Biewener, A. A. (2005). Joint workand power associated with acceleration and deceleration in tammarwallabies (Macropus eugenii). J. Exp. Biol. 208, 41-53.
McMahon, T. A. and Cheng, G. C. (1990). The mechanics of running: howdoes stiffness couple with speed. J. Biomech. 23, 65-78.
Peplowski, M. M. and Marsh, R. L. (1997). Work and power output in thehindlimb muscles of Cuban tree frogs Osteopilus septentrionalis duringjumping. J. Exp. Biol. 200, 2861-2870.
Roberts, T. J. and Marsh, R. L. (2003). Probing the limits to muscle-poweredaccelerations: lessons from jumping bullfrogs. J. Exp. Biol. 206, 2567-2590.
Roberts, T. J. and Scales, J. A. (2002). Mechanical power output duringaccelerations in wild turkeys. J. Exp. Biol. 205, 1485-1494.
Roberts, T. J. and Scales, J. A. (2004). Adjusting muscle function todemand: joint work during acceleration in wild turkeys. J. Exp. Biol. 207,4165-4174.
Roberts, T. J., Marsh, R. L., Weyand, P. G. and Taylor, C. R. (1997).Muscular force in running turkeys: the economy of minimizing work.Science 275, 1113-1115.
Seyfarth, A., Friedrichs, A., Wank, V. and Blickhan, R. (1999). Dynamicsof the long jump. J. Biomech. 32, 1259-1267.
Seyfarth, A., Blickhan, R. and Van Leeuwen, J. L. (2000). Optimum take-off techniques and muscle design for long jump. J. Exp. Biol. 203, 741-750.
Stefanyshyn, D. J. and Nigg, B. M. (1998). Contribution of the lowerextremity joints to mechanical energyg in running vertical jumps andrunning long jumps. J. Sports Sci. 16, 177-186.
Weis-Fogh, T. and Alexander, R. McN. (1977). The sustained power outputfrom striated muscle. In Scale Effects in Animal Locomotion (ed. T. J.Pedley), pp. 511-525. New York: Academic Press.
Wilson, A. M., Watson, J. C. and Lichtwark, G. A. (2003). A catapult actionfor rapid limb protraction. Nature 421, 35-36.
Woltring, H. J. (1986). A FORTRAN package for generalized, cross-validatory spline smoothing and differentiation. Adv. Eng. Software 8, 104-113.
THE JOURNAL OF EXPERIMENTAL BIOLOGY